GAP INC
10-Ks and 10-Qs
|
|
|
|
|
|
|
|
|
|
|
|
|
|
|
|
|
|
|
|
|
|
|
|
|
|
|
|
|
|
|
|
|
|
|
|
|
|
|
|
|
|
|
|
|
|
|
|
|
|
|
|
|
|
|
|
|
|
|
UNITED STATES
SECURITIES AND EXCHANGE COMMISSION
Washington, D.C. 20549
FORM 10-K
(Mark One)
|
þ
|
Annual report pursuant to Section 13 or 15(d) of the Securities Exchange Act of 1934
|
|
For the fiscal year ended February 2, 2019
|
|
|
¨
|
Transition report pursuant to Section 13 or 15(d) of the Securities Exchange Act of 1934
|
|
For the transition period from
to
|
|
Commission File Number 1-7562
THE GAP, INC.
(Exact name of registrant as specified in its charter)
|
Delaware
|
94-1697231
|
|
(State of Incorporation)
|
(I.R.S. Employer Identification No.)
|
|
Two Folsom Street, San Francisco, California
|
94105
|
|
(Address of principal executive offices)
|
(Zip code)
|
Registrant’s telephone number, including area code:
(415) 427-0100
Securities registered pursuant to Section 12(b) of the Act:
|
Common Stock, $0.05 par value
|
The New York Stock Exchange
|
|
(Title of class)
|
(Name of exchange where registered)
|
Securities registered pursuant to Section 12(g) of the Act:
None
Indicate by check mark if the registrant is a well-known seasoned issuer, as defined in Rule 405 of the Securities Act. Yes
þ
No
¨
Indicate by check mark if the registrant is not required to file reports pursuant to Section 13 or Section 15(d) of the Act. Yes
¨
No
þ
Indicate by check mark whether the registrant (1) has filed all reports required to be filed by Section 13 or 15(d) of the Securities Exchange Act of 1934 during the preceding 12 months (or for such shorter period that the registrant was required to file such reports), and (2) has been subject to such filing requirements for the past 90 days.
Yes
þ
No
¨
Indicate by check mark whether the registrant has submitted electronically and posted on its corporate Web site, if any, every Interactive Data File required to be submitted and posted pursuant to Rule 405 of Regulation S-T during the preceding 12 months (or for such shorter period that the registrant was required to submit and post such files). Yes
þ
No
¨
Indicate by check mark if disclosure of delinquent filers pursuant to Item 405 of Regulation S-K is not contained herein, and will not be contained, to the best of registrant’s knowledge, in definitive proxy or information statements incorporated by reference in Part III of this Form 10-K or any amendment to this Form 10-K.
¨
Indicate by check mark whether the registrant is a large accelerated filer, an accelerated filer, a non-accelerated filer, a smaller reporting company, or an emerging growth company. See the definitions of “large accelerated filer,” “accelerated filer,” “smaller reporting company,” and "emerging growth company" in Rule 12b-2 of the Exchange Act:
|
Large accelerated filer
|
þ
|
Accelerated filer
|
¨
|
Non-accelerated filer
|
¨
|
Smaller reporting company
|
¨
|
Emerging growth company
|
¨
|
If an emerging growth company, indicate by check mark if the registrant has elected not to use the extended transition period for complying with any new or revised financial accounting standards provided pursuant to Section 13(a) of the Exchange Act.
¨
Indicate by check mark whether the registrant is a shell company (as defined in Rule 12b-2 of the Act). Yes
¨
No
þ
The aggregate market value of the voting and non-voting common equity held by non-affiliates of the registrant as of
August 3, 2018
was approximately
$7 billion
based upon the last price reported for such date in the NYSE-Composite transactions.
The number of shares of the registrant’s common stock outstanding as of
March 13, 2019
was
378,598,205
.
Documents Incorporated by Reference
Portions of the registrant’s Proxy Statement for the Annual Meeting of Shareholders to be held on
May 21, 2019
(hereinafter referred to as the “
2019
Proxy Statement”) are incorporated into Part III.
Special Note on Forward-Looking Statements
This Annual Report on Form 10-K contains forward-looking statements within the “safe harbor” provisions of the Private Securities Litigation Reform Act of 1995. All statements other than those that are purely historical are forward-looking statements. Words such as “expect,” “anticipate,” “believe,” “estimate,” “intend,” “plan,” “project,” and similar expressions also identify forward-looking statements. Forward-looking statements include, but are not limited to, statements regarding the following:
|
•
|
structure and timing of completion of the planned separation transaction;
|
|
•
|
process of completing the separation transaction, including estimated costs;
|
|
•
|
anticipated strategic, financial, operational or other benefits of the separation transaction, including future financial performance of the independent companies following the proposed separation transaction;
|
|
•
|
plans to restructure the Gap brand specialty fleet, including anticipated store closures and timing, impact to annualized sales, associated costs, and effect on annualized savings;
|
|
•
|
investing in digital and customer capabilities, as well as store experience, to support growth;
|
|
•
|
deploying a data driven decision making model;
|
|
•
|
increasing productivity by leveraging our scale and streamlining operations and processes;
|
|
•
|
continuing to integrate social and environmental sustainability into business practices;
|
|
•
|
attracting and retaining great talent in our businesses and functions;
|
|
•
|
continuing our investment in customer experience to drive higher customer engagement and loyalty;
|
|
•
|
net store closings in fiscal 2019;
|
|
•
|
impact of foreign currency exchange rate fluctuations in fiscal 2019;
|
|
•
|
current cash balances and cash flows being sufficient to support our business operations, including expansion costs related to a building and a buildout of our Ohio distribution center;
|
|
•
|
ability to supplement near-term liquidity, if necessary, with our $500 million revolving credit facility or other available market instruments;
|
|
•
|
the impact of the seasonality of our operations;
|
|
•
|
dividend payments in fiscal 2019;
|
|
•
|
the impact if actuals differ substantially from estimates and assumptions used in accounting calculations and policies;
|
|
•
|
recognition of revenue deferrals as revenue;
|
|
•
|
the impact of recent accounting pronouncements;
|
|
•
|
unrealized gains and losses from designated cash flow hedges;
|
|
•
|
recognition of unrecognized share-based compensation expense;
|
|
•
|
total gross unrecognized tax benefits;
|
|
•
|
the impact of losses due to indemnification obligations;
|
|
•
|
the outcome of proceedings, lawsuits, disputes, and claims; and
|
|
•
|
the impact of changes in internal control over financial reporting.
|
Because these forward-looking statements involve risks and uncertainties, there are important factors that could cause our actual results to differ materially from those in the forward-looking statements. These factors include, without limitation, the following:
|
•
|
the risks associated with our plan to separate into two independent publicly-traded companies, including that the separation may not be completed in accordance with the expected plans or anticipated timeframe, or at all;
|
|
•
|
the risk that our plan to separate into two publicly-traded companies may not achieve some or all of the anticipated benefits;
|
|
•
|
the risk that we or our franchisees will be unsuccessful in gauging apparel trends and changing consumer preferences;
|
|
•
|
the highly competitive nature of our business in the United States and internationally;
|
|
•
|
the risk that failure to maintain, enhance and protect our brand image could have an adverse effect on our results of operations;
|
|
•
|
the risk that the failure to attract and retain key personnel, or effectively manage succession, could have an adverse impact on our results of operations;
|
|
•
|
the risk that our investments in customer, digital, and omni-channel shopping initiatives may not deliver the results we anticipate;
|
|
•
|
the risk that if we are unable to manage our inventory effectively, our gross margins will be adversely affected;
|
|
•
|
the risk that we are subject to data or other security breaches that may result in increased costs, violations of law, significant legal and financial exposure, and a loss of confidence in our security measures, which could have an adverse effect on our results of operations and our reputation;
|
|
•
|
the risk that a failure of, or updates or changes to, our information technology (“IT”) systems may disrupt our operations;
|
|
•
|
the risks to our business, including our costs and supply chain, associated with global sourcing and manufacturing;
|
|
•
|
the risk that changes in global economic conditions or consumer spending patterns could adversely impact our results of operations;
|
|
•
|
the risks to our efforts to expand internationally, including our ability to operate in regions where we have less experience;
|
|
•
|
the risks to our reputation or operations associated with importing merchandise from foreign countries, including failure of our vendors to adhere to our Code of Vendor Conduct;
|
|
•
|
the risk that our franchisees’ operation of franchise stores is not directly within our control and could impair the value of our brands;
|
|
•
|
the risk that we or our franchisees will be unsuccessful in identifying, negotiating, and securing new store locations and renewing, modifying, or terminating leases for existing store locations effectively;
|
|
•
|
the risk that foreign currency exchange rate fluctuations could adversely impact our financial results;
|
|
•
|
the risk that comparable sales and margins will experience fluctuations;
|
|
•
|
the risk that changes in our credit profile or deterioration in market conditions may limit our access to the capital markets and adversely impact our financial results or our business initiatives;
|
|
•
|
the risk that trade matters could increase the cost or reduce the supply of apparel available to us and adversely affect our business, financial condition, and results of operations;
|
|
•
|
the risk that changes in the regulatory or administrative landscape could adversely affect our financial condition and results of operations;
|
|
•
|
the risk that natural disasters, public health crises, political crises, negative global climate patterns, or other catastrophic events could adversely affect our operations and financial results, or those of our franchisees or vendors;
|
|
•
|
the risk that reductions in income and cash flow from our credit card arrangement related to our private label and co-branded credit cards could adversely affect our operating results and cash flows;
|
|
•
|
the risk that the adoption of new accounting pronouncements will impact future results;
|
|
•
|
the risk that we do not repurchase some or all of the shares we anticipate purchasing pursuant to our repurchase program; and
|
|
•
|
the risk that we will not be successful in defending various proceedings, lawsuits, disputes, and claims.
|
Additional information regarding factors that could cause results to differ can be found in this Annual Report on Form 10-K and our other filings with the U.S. Securities and Exchange Commission (“SEC”).
Future economic and industry trends that could potentially impact net sales and profitability are difficult to predict. These forward-looking statements are based on information as of
March 19, 2019
, and we assume no obligation to publicly update or revise our forward-looking statements even if experience or future changes make it clear that any projected results expressed or implied therein will not be realized.
THE GAP, INC.
2018
ANNUAL REPORT ON FORM 10-K
TABLE OF CONTENTS
|
|
|
Page
|
|
PART I
|
||
|
Item 1.
|
||
|
Item 1A.
|
||
|
Item 1B.
|
||
|
Item 2.
|
||
|
Item 3.
|
||
|
Item 4.
|
||
|
PART II
|
||
|
Item 5.
|
||
|
Item 6.
|
||
|
Item 7.
|
||
|
Item 7A.
|
||
|
Item 8.
|
||
|
Item 9.
|
||
|
Item 9A.
|
||
|
Item 9B.
|
||
|
PART III
|
||
|
Item 10.
|
||
|
Item 11.
|
||
|
Item 12.
|
||
|
Item 13.
|
||
|
Item 14.
|
||
|
PART IV
|
||
|
Item 15.
|
||
|
Item 16.
|
||
Part I
Item 1. Business.
General
The Gap, Inc. (Gap Inc., the “Company,” “we,” and “our”) was incorporated in the State of California in July 1969 and was reincorporated under the laws of the State of Delaware in May 1988.
Gap Inc. is a leading global apparel retail company. We offer apparel, accessories, and personal care products for men, women, and children under the Old Navy, Gap, Banana Republic, Athleta, Intermix, and Hill City brands. Our portfolio of distinct brands across multiple channels and geographies, combined with our size and scale which allows for strategic and advantageous partnerships with our third-party vendors and suppliers throughout the organization, gives us a competitive advantage in the global retail marketplace.
Gap Inc. is an omni-channel retailer, with sales to customers both in stores and online, through Company-operated and franchise stores, websites, and third-party arrangements. Gap Inc. has Company-operated stores in the United States, Canada, the United Kingdom, France, Ireland, Japan, Italy, China, Hong Kong, Taiwan, and Mexico. We also have franchise agreements with unaffiliated franchisees to operate Old Navy, Gap, and Banana Republic stores throughout Asia, Europe, Latin America, the Middle East, and Africa. Under these agreements, third parties operate stores that sell apparel and related products under our brand names. Most of the products sold under our brand names are designed by us and manufactured by independent sources. We also sell products that are designed and manufactured by branded third parties, primarily at our Intermix brand.
Gap Inc. uses omni-channel capabilities to bridge the digital world and physical stores, creating world-class shopping experiences regardless of where or how our customers shop. The Company's suite of omni-channel services, including order-in-store, reserve-in-store, find-in-store, and ship-from-store, as well as mobile shopping experiences, are uniquely tailored across its portfolio of brands.
Old Navy.
Old Navy is a global apparel and accessories brand that makes current American essentials accessible to everyone. The brand celebrates the democracy of style through on-trend, playfully optimistic, affordable and high-quality product. Old Navy is committed to creating incredible shopping experiences regardless of where, when and how customers choose to shop, including a fun store experience, a dynamic online channel and convenient omni-channel capabilities such as buy online, pick-up in store. Old Navy opened its first store in 1994 in the United States and since has expanded to more than 1,100 stores around the world, including Company-operated stores in Canada, China, and Mexico, as well as franchise stores. In 2018, Great Place to Work and FORTUNE magazine honored Old Navy as one of the “Best Workplaces in Retail” and “Best Workplaces for Diversity” for the third year in a row. In addition, through its cause platform ONward!, Old Navy supports the Boys & Girls Clubs of America to help turn learners into leaders.
Gap.
Gap is one of the world's most iconic apparel and accessories brands anchored in optimistic, casual, American style. Founded in San Francisco in 1969, the brand's collections continue to build the foundation of modern wardrobes—all things denim, tees, button-downs, and khakis, along with must-have trends.
Gap is designed to build the foundation of modern wardrobes through every stage of life with apparel and accessories for adult men and women under the Gap name, in addition to GapKids, babyGap, GapMaternity, GapBody, and GapFit collections. Beginning in 1987 with the opening of the first store outside North America in London, Gap continues to connect with customers around the world through specialty stores, online, and franchise stores. In addition, we bring the brand to value-conscious customers, with exclusively designed collections for Gap Outlet and Gap Factory stores and online.
Banana Republic.
Acquired with two stores in 1983 as a travel and adventure outfitter, Banana Republic is now a global apparel and accessories brand focused on delivering modern, versatile classics designed for a life with no boundaries. Curious, connected and out in the world, Banana Republic provides a wardrobe of favorites—clothing, eyewear, jewelry, shoes, handbags, and fragrances—all made for a life in motion with the finest materials and fabric innovations. Customers can purchase Banana Republic products globally in our specialty stores, online, and franchise stores.
1
Athleta.
Athleta is a premium fitness and lifestyle brand creating versatile performance apparel to inspire a community of active, confident women and girls. Established in 1998 and acquired by Gap, Inc. in 2008, Athleta integrates technical features and innovative design across its women's collection to carry her through a life in motion, from yoga, training and sports, to everyday activities and travel. In 2016, the Company launched Athleta Girl, mirroring its signature performance in styles for the next generation. Customers can purchase Athleta products in the United States through its stores and catalogs, or globally online.
Athleta has been certified as a benefit corporation ("B Corp"), furthering our commitment to using our business as a force for good to drive social and environmental impact. We met rigorous standards across social and environmental performance, accountability, and transparency. Additionally, we amended Athleta's legal charter to become a Delaware public benefit corporation, further demonstrating its commitment to people and the planet. With this accreditation, Gap Inc. has become one of the largest publicly-traded retail companies with a B Corp certified subsidiary apparel brand. We plan to leverage the learnings from Athleta as a case study for Gap Inc., providing a benchmark and roadmap of potential opportunities for greater social and environmental impact across the enterprise.
Intermix.
Intermix curates must-have styles from the most coveted emerging and established designers. Known for styling on-trend pieces in unexpected ways, Intermix delivers a unique point of view and an individualized approach to shopping and personal style. Customers can shop in stores in the United States and Canada, and online.
Hill City.
Hill City is a high-performance men’s apparel brand offering technical clothing that transitions seamlessly through the day, from working out to work to weekend. Launched in 2018, the product line fuses a clean aesthetic with hidden technical innovation that is felt, rather than seen, allowing men to focus on more versatile pieces. Incubated alongside the Athleta business, Hill City also has been designated a B Corp certified brand by integrating sustainability throughout many of its products, using high-quality renewable, recycled fibers to create performance fabrics.
The range of merchandise displayed in each store varies depending on the selling season and the size and location of the store. Stores are generally open seven days per week (where permitted by law) and most holidays.
We ended
fiscal 2018
with 3,194 Company-operated stores and 472 franchise store locations. For more information on the number of stores by brand and region, see the table included in
Item 7, Management's Discussion and Analysis of Financial Condition and Results of Operations
, of this Form 10-K.
Old Navy, Gap, Banana Republic, and Athleta each have a private label credit card program and a co-branded credit card program through which frequent customers receive benefits. Private label and co-branded credit cards are provided by a third-party financing company, with associated revenue sharing arrangements reflected in Gap Inc. operations. We have a multi-tender loyalty rewards program, BRIGHT, active across each of these brands. We also issue and redeem gift cards through our brands.
Certain financial information about international operations is set forth under the heading "Segment Information" in
Note 16
of Notes to Consolidated Financial Statements included in
Item 8, Financial Statements and Supplementary Data
, of this Form 10-K.
Merchandise Vendors
We purchase private label and non-private label merchandise from about 700 vendors. Our vendors have factories in about 40 countries. Our two largest vendors each accounted for about 6 percent of the dollar amount of our total
fiscal 2018
purchases. Of our merchandise purchased during
fiscal 2018
, substantially all purchases, by dollar value, were from factories outside the United States. Approximately 28 percent of our
fiscal 2018
purchases, by dollar value, were from factories in Vietnam. Approximately 21 percent of our
fiscal 2018
purchases, by dollar value, were from factories in China. Product cost increases or events causing disruption of imports from Vietnam, China, or other foreign countries, including the imposition of additional import restrictions or taxes, or vendors potentially failing due to political, financial, or regulatory issues, could have an adverse effect on our operations. Substantially all of our foreign purchases of merchandise are negotiated and paid for in U.S. dollars. Also see the sections entitled “Risk Factors—Our business is subject to risks associated with global sourcing and manufacturing," "Risk Factors—Risks associated with importing merchandise from foreign countries, including failure of our vendors to adhere to our Code of Vendor Conduct, could harm our business,” and “Risk Factors—Trade matters may disrupt our supply chain” in
Item 1A, Risk Factors
, of this Form 10-K.
2
Seasonal Business
Our business follows a seasonal pattern, with sales peaking during the end-of-year holiday period.
Brand Building
Our ability to develop and evolve our existing brands is a key to our success. We believe our distinct brands are among our most important assets. With the exception of Intermix, virtually all aspects of brand development, from product design and distribution to marketing, merchandising and shopping environments, are controlled by Gap Inc. employees. With respect to Intermix, we control all aspects of brand development except for product design related to third-party products. We continue to invest in our business and enhance the customer experience through significant investments in our supply chain and digital capabilities, investments in marketing, enhancement of our omni-shopping experience, remodeling of existing stores, and international expansion.
Trademarks and Service Marks
Old Navy, Gap, GapKids, babyGap, GapMaternity, GapBody, GapFit, Banana Republic, Athleta, Intermix, and Hill City trademarks and service marks, and certain other trademarks and service marks, have been registered, or are the subject of pending trademark applications, with the United States Patent and Trademark Office and with the registries of many foreign countries and/or are protected by common law.
Franchising
We have franchise agreements with unaffiliated franchisees to operate Old Navy, Gap, and Banana Republic stores in a number of countries throughout Asia, Europe, Latin America, the Middle East, and Africa. Under these agreements, third parties operate, or will operate, stores that sell apparel and related products under our brand names. For additional information on risks related to our franchise business, see the sections entitled “Risk Factors—Our efforts to expand internationally may not be successful” and “Risk Factors—Our franchise business is subject to certain risks not directly within our control that could impair the value of our brands” in
Item 1A, Risk Factors
, of this Form 10-K.
Inventory
The nature of the retail business requires us to carry a significant amount of inventory, especially prior to the peak holiday selling season when we, along with other retailers, generally build up inventory levels. We maintain a large part of our inventory in distribution centers. We review our inventory levels in order to identify slow-moving merchandise and broken assortments (items no longer in stock in a sufficient range of sizes or colors) and we primarily use promotions and markdowns to clear merchandise. Also see the sections entitled “Risk Factors—We must successfully gauge apparel trends and changing consumer preferences to succeed,” "Risk Factors—If we are unable to manage our inventory effectively, our gross margins could be adversely affected," and "Risk Factors—Our results could be adversely affected by natural disasters, public health crises, political crises, negative global climate patterns, or other catastrophic events" in
Item 1A, Risk Factors
, of this Form 10-K.
Competitors
The global apparel retail industry is highly competitive. We compete with local, national, and global apparel retailers. Also see the section entitled “Risk Factors—Our business is highly competitive” in
Item 1A, Risk Factors
, of this Form 10-K.
Employees
As of
February 2, 2019
, we had a workforce of approximately 135,000 employees, which includes a combination of part-time and full-time employees. We also hire seasonal employees, primarily during the peak holiday selling season.
To remain competitive in the retail apparel industry, we must attract, develop, and retain skilled employees in our design, merchandising, supply chain, marketing, and other functions, as well as in our stores and distribution centers. Competition for such personnel is intense. Our success is dependent to a significant degree on the continued contributions of key employees. Also see the section entitled “Risk Factors—The failure to attract and retain key personnel, or effectively manage succession, could have an adverse impact on our results of operations” in
Item 1A, Risk Factors
, of this Form 10-K.
3
Available Information
We make available on our website, www.gapinc.com, under “Investors,” free of charge, our annual reports on Form 10-K, quarterly reports on Form 10-Q, current reports on Form 8-K, and amendments to those reports as soon as reasonably practicable after we electronically file or furnish them to the SEC.
Our Board of Directors Committee Charters (Audit and Finance, Compensation and Management Development, and Governance and Sustainability Committees) and Corporate Governance Guidelines are also available on our website under “Investors, Governance.” Our Code of Business Conduct can be found on our website under “Investors, Corporate Compliance, Code of Business Conduct Overview.” Any amendments and waivers to the Code will also be available on the website.
Information about our sustainability efforts is available online at www.gapincsustainability.com, which provides information on our policies, social impact and environmental programs, as well as our sustainability strategy and data. Also available at www.gapincsustainability.com is a Sustainability Accounting Standards Board (SASB) table, which provides comparable data for our industry.
Executive Officers of the Registrant
The following are our executive officers:
Name, Age, Position, and Principal Occupation:
Arthur Peck
, 63, Director, and President and Chief Executive Officer, Gap Inc. since February 2015; President, Growth, Innovation, and Digital division from 2012 to January 2015; President, Gap North America from 2011 to 2012; Executive Vice President of Strategy and Operations from 2005 to 2011; President, Gap Inc. Outlet from 2008 to 2011.
Mark Breitbard
, 51, President and Chief Executive Officer, Banana Republic since May 2017; Chief Executive Officer, The Gymboree Corporation from January 2013 to April 2017; President, Gap North America from 2012 to January 2013; Executive Vice President, Gap North America Merchandising from 2011 to 2012; Executive Vice President, GapKids and babyGap from 2010 to 2011.
Shawn Curran
, 55, Executive Vice President, Global Supply Chain and Product Operations since October 2017; Executive Vice President, Global Supply Chain - Logistics and Product Operations from April 2016 to October 2017; Executive Vice President, Global Supply Chain from August 2015 to April 2016; Senior Vice President, Logistics from 2012 to August 2015.
Sebastian DiGrande
, 52, Executive Vice President, Strategy and Chief Customer Officer since May 2016; Senior Partner and Managing Director, the Boston Consulting Group from 1996 to April 2016.
Neil Fiske
, 57, President and Chief Executive Officer, Gap since June 2018; Chief Executive Officer, Billabong International from 2013 to June 2018; Retail and Restaurant Industry Partner, Onex Corporation from 2012 to 2013; Chief Executive Officer and President, Eddie Bauer from 2007 to 2012.
Julie Gruber
, 53, Executive Vice President, Global General Counsel, Corporate Secretary, and Chief Compliance Officer since February 2016; Senior Vice President and General Counsel from March 2015 to February 2016; Vice President and Deputy General Counsel from 2007 to March 2015; Associate General Counsel from 2003 to 2007.
Brent Hyder
, 54, Executive Vice President and Chief People Officer since February 2018; Executive Vice President, Global Talent and Sustainability from May 2017 to February 2018; Executive Vice President and Chief Operating Officer, Gap from June 2016 to May 2017; Senior Vice President, Human Resources, Gap from September 2014 to June 2016; Vice President and General Manager, Gap Japan from February 2013 to September 2014; Vice President, Human Resources from May 2007 to February 2013.
Teri List-Stoll
, 56, Executive Vice President and Chief Financial Officer since January 2017; Executive Vice President and Chief Financial Officer, Dick’s Sporting Goods, Inc. from August 2015 to September 2016; Executive Vice President and Chief Financial Officer, Kraft Foods Group, Inc. from September 2013 to May 2015; Senior Vice President and Treasurer, Procter & Gamble Co. from 2008 to August 2013.
4
Sonia Syngal
, 49, President and Chief Executive Officer, Old Navy since April 2016; Executive Vice President, Global Supply Chain and Product Operations from February 2015 to April 2016; Executive Vice President, Global Supply Chain from November 2013 to January 2015; Senior Vice President
,
Old Navy International from February 2013 to November 2013; Senior Vice President and Managing Director, Europe from 2011 to February 2013; Senior Vice President and General Manager
,
International Outlets from 2010 to 2011; Vice President of Global Production, Supply Chain
-
Outlet from 2006 to 2010.
5
Item 1A. Risk Factors.
Our past performance may not be a reliable indicator of future performance because actual future results and trends may differ materially depending on a variety of factors, including but not limited to the risks and uncertainties discussed below. In addition, historical trends should not be used to anticipate results or trends in future periods.
Our plan to separate into two independent publicly-traded companies is subject to various risks and uncertainties and may not be completed in accordance with the expected plans or anticipated timeline, or at all, and will involve significant time and expense, which could disrupt or adversely affect our businesses.
On February 28, 2019, we announced our intention to separate into two independent publicly-traded companies: Old Navy and a yet-to-be-named company (“NewCo”), which will consist of the Gap brand, Athleta, Banana Republic, Intermix and Hill City. We expect to effect the separation through a spin-off that is intended to generally be tax-free to the Company’s shareholders for U.S. federal income tax purposes. The transaction is currently targeted to be completed in 2020 and is subject to certain conditions, including final approval by our Board of Directors, receipt of a tax opinion from counsel, and the filing and effectiveness of a registration statement with the U.S. Securities and Exchange Commission. The failure to satisfy all of the required conditions could delay the completion of the separation for a significant period of time or prevent it from occurring at all, and there can be no assurances regarding the ultimate timing or terms of the separation or that the separation will be completed. In addition, the separation is complex in nature, and unanticipated developments or changes, including changes in law, the macroeconomic environment, market conditions, the retail industry or political conditions may affect our ability to complete the transaction as currently expected, within the anticipated time frame or at all. Any changes to the transaction or delay in completing the transaction could cause us not to realize some or all of the expected benefits, or realize them on a different timeline than expected. In addition, although we intend for the separation to generally be tax-free to the Company’s shareholders for U.S. federal income tax purposes, there can be no assurance that the transaction will so qualify. If the separation were ultimately determined to be taxable, the Company, the Company’s shareholders and/or the new independent companies could incur income tax liabilities and/or indemnity obligations that could be significant.
We expect that the process of completing the separation will be time-consuming and involve significant costs and expenses, which may be significantly higher than what we currently anticipate and may not yield a benefit if the separation is not completed. Executing the separation will require significant time and attention from our senior management and employees, which could disrupt our ongoing business and adversely affect the financial results and results of operations. We may also experience increased difficulties in attracting, retaining and motivating employees and/or attracting and retaining customers during the pendency of the separation and following its completion, which could harm our businesses.
Any of these factors could have a material adverse effect on our business, financial condition, results of operations, cash flows and/or the price of our common stock.
The separation may not achieve some or all of the anticipated benefits.
We may not realize some or all of the anticipated strategic, financial, operational or other benefits from the separation, and there is no assurance that following the separation, each separate company will be successful. As independent publicly-traded companies, Old Navy and NewCo will be smaller, less diversified companies and may be more vulnerable to changing conditions in the retail industry or changes in market conditions, which could materially adversely affect their respective businesses, financial conditions, results of operations. For example, Old Navy will no longer be part of a company that also includes a number of other specialty brands, and the NewCo businesses will no longer be part of a company that also operates Old Navy as a fast-growing brand that is a category leader in family apparel. These factors could have a material adverse effect on the business, financial condition, results of operations, cash flows and/or the price of the common stock of Old Navy and/or NewCo.
6
In addition, investors holding our common stock prior to the separation may hold our common stock because of a decision to invest in a company that operates both our Old Navy and specialty brands. If the separation transaction is completed, shares of common stock in each independent company held by those investors will represent an investment in a company with a different profile than that of Gap, and, as a result, some investors may sell our common stock prior to the separation or sell the common stock of one or both independent companies resulting from the separation. Further, there can be no assurance that the combined value of the common stock of the two publicly traded companies resulting from the separation will be equal to or greater than what the value of our common stock would have been had the separation not occurred.
We must successfully gauge apparel trends and changing consumer preferences to succeed.
Our success is largely dependent upon our ability to gauge the tastes of our customers and to provide merchandise that satisfies customer demand in a timely manner. However, lead times for many of our design and purchasing decisions may make it more difficult for us to respond rapidly to new or changing apparel trends or consumer acceptance of our products. The global apparel retail business fluctuates according to changes in consumer preferences, dictated in part by apparel trends and season. To the extent we misjudge the market for our merchandise or the products suitable for local markets or fail to execute trends and deliver product to market as timely as our competitors, our sales will be adversely affected, and the markdowns required to move the resulting excess inventory will adversely affect our operating results.
Our business is highly competitive.
The global apparel retail industry is highly competitive. We and our franchisees compete with local, national, and global department stores, specialty and discount store chains, independent retail stores, and online businesses that market similar lines of merchandise. We face a variety of competitive challenges in an increasingly complex and fast-paced environment, including:
|
•
|
anticipating and quickly responding to changing apparel trends and customer demands;
|
|
•
|
attracting customer traffic both in stores and online;
|
|
•
|
competitively pricing our products and achieving customer perception of value;
|
|
•
|
maintaining favorable brand recognition and effectively marketing our products to customers in several diverse market segments and geographic locations;
|
|
•
|
anticipating and responding to changing customer shopping preferences and practices, including the increasing shift to digital brand engagement, social media communication, and online shopping;
|
|
•
|
developing innovative, high-quality products in sizes, colors, and styles that appeal to customers of varying age groups and tastes;
|
|
•
|
purchasing and stocking merchandise to match seasonal weather patterns, and our ability to react to shifts in weather that impact consumer demand;
|
|
•
|
sourcing and allocating merchandise efficiently; and
|
|
•
|
improving the effectiveness and efficiency of our processes in order to deliver cost savings to fund growth.
|
If we or our franchisees are not able to compete successfully in the United States or internationally, our results of operations would be adversely affected.
We must maintain our reputation and brand image.
Our brands have wide recognition, and our success has been due in large part to our ability to maintain, enhance and protect our brand image and reputation and our customers’ connection to our brands. Our continued success depends in part on our ability to adapt to a rapidly changing media environment, including our increasing reliance on social media and online dissemination of advertising campaigns. Even if we react appropriately to negative posts or comments about us and/or our brands on social media and online, our customers’ perception of our brand image and our reputation could be negatively impacted. In addition, customer sentiment could be shaped by our sustainability policies and related design, sourcing and operations decisions. Failure to maintain, enhance and protect our brand image could have a material adverse effect on our results of operations.
7
The failure to attract and retain key personnel, or effectively manage succession, could have an adverse impact on our results of operations.
Our ability to anticipate and effectively respond to changing apparel trends depends in part on our ability to attract and retain key personnel in our design, merchandising, sourcing, marketing, and other functions. In addition, several of our strategic initiatives, including our technology initiatives and supply chain initiatives, require that we hire and/or develop employees with appropriate experience. Competition for talent is intense, and we cannot be sure that we will be able to attract and retain a sufficient number of qualified personnel in future periods. If we are unable to retain, attract, and motivate talented employees with the appropriate skill sets, or if changes to our organizational structure, operating results, or business model adversely affect morale or retention, we may not achieve our objectives and our results of operations could be adversely impacted. In addition, the loss of one or more of our key personnel or the inability to effectively identify a suitable successor to a key role could have a material adverse effect on our business. In fiscal 2018, there were changes to our management team, including our new President and Chief Executive Officer of Gap brand. The effectiveness of new leaders in these roles, and any further transition as a result of these changes, could have a significant impact on our results of operations.
Our investments in customer, digital, and omni-channel shopping initiatives may not deliver the results we anticipate.
One of our strategic priorities is to further develop an omni-channel shopping experience for our customers through the integration of our store and digital shopping channels. Our omni-channel initiatives include cross-channel logistics optimization and exploring additional ways to develop an omni-channel shopping experience, including further digital integration and customer personalization. These initiatives involve significant investments in IT systems and significant operational changes. In addition, our competitors are also investing in omni-channel initiatives, some of which may be more successful than our initiatives
.
If the implementation of our customer, digital, and omni-channel initiatives is not successful, or we do not realize the return on our investments in these initiatives that we anticipate, our operating results would be adversely affected.
If we are unable to manage our inventory effectively, our gross margins could be adversely affected.
Fluctuations in the global apparel retail markets impact the levels of inventory owned by apparel retailers. The nature of the global apparel retail business requires us to carry a significant amount of inventory, especially prior to the peak holiday selling season when we build up our inventory levels.
Merchandise usually must be ordered well in advance of the season and frequently before apparel trends are confirmed by customer purchases. We must enter into contracts for the purchase and manufacture of merchandise well in advance of the applicable selling season. As a result, we are vulnerable to demand and pricing shifts and to suboptimal selection and timing of merchandise purchases. In the past, we have not always predicted our customers’ preferences and acceptance levels of our trend items with accuracy. If sales do not meet expectations, too much inventory may cause excessive markdowns and, therefore, lower-than-planned margins.
We have key strategic initiatives designed to optimize our inventory levels and increase the efficiency and responsiveness of our supply chain, including vendor fabric platforming, product demand testing, and in-season rapid response to demand. These initiatives involve significant systems and operational changes, and we have limited experience operating in this manner. If we are unable to implement these initiatives successfully, we may not realize the return on our investments that we anticipate, and our operating results could be adversely affected.
8
We are subject to data and security risks, which could have an adverse effect on our results of operations and consumer confidence in our security measures.
As part of our normal operations, we receive and maintain confidential, proprietary, and personally identifiable information, including credit card information, and information about our customers, our employees, job applicants, and other third parties. Our business employs systems and websites that allow for the secure storage and transmission of this information. However, despite our safeguards and security processes and protections, security breaches could expose us to a risk of loss or misuse of this information, litigation, and potential liability. The retail industry, in particular, has been the target of many recent cyber-attacks. We may not have the resources to anticipate or prevent rapidly evolving types of cyber-attacks. Attacks may be targeted at us, our vendors or customers, or others who have entrusted us with information. In addition, even if we take appropriate measures to safeguard our information security and privacy environment from security breaches, we could still expose our customers and our business to risk. Actual or anticipated attacks may disrupt or impair our technology capabilities, and may cause us to incur increasing costs, including costs to deploy additional personnel and protection technologies, train employees, and engage third-party experts and consultants. Advances in computer capabilities, new technological discoveries, or other developments may result in the technology used by us to protect transaction or other data being breached or compromised. Measures we implement to protect against cyber attacks may also have the potential to impact our customers’ shopping experience or decrease activity on our websites by making them more difficult to use. Data and security breaches can also occur as a result of non-technical issues, including intentional or inadvertent breach by our employees or by persons with whom we have commercial relationships that result in the unauthorized release of personal or confidential information. In addition, the global regulatory environment surrounding information security, cybersecurity, and privacy is increasingly demanding, with new laws, such as the European Union's General Data Protection Regulation (GDPR) and the California Consumer Privacy Act, which give customers the right to control how their personal information is collected, used and retained. Violating these rights, or failing to secure personal information could result in a violation of applicable privacy and other laws, significant legal and financial exposure, and a loss of consumer confidence in our security measures, which could have an adverse effect on our results of operations and our reputation.
Failures of, or updates or changes to, our IT systems may disrupt operations.
We maintain a complex network of legacy systems. We require continual maintenance, upgrades and changes, some of which are significant. Upgrades involve replacing existing systems with successor systems, making changes to existing systems, or cost-effectively acquiring new systems with new functionality. We are aware of inherent risks associated with maintaining and replacing these systems, including accurately capturing data and addressing system disruptions and believe we are taking appropriate action to mitigate the risks through testing, training, and staging implementation, as well as ensuring appropriate commercial contracts are in place with third-party vendors supplying or supporting our IT initiatives. However, there can be no assurances that we will successfully maintain or launch these systems as planned or that they will be implemented without disruptions to our operations. IT system disruptions or failures, if not anticipated and appropriately mitigated, or failure to successfully implement new or upgraded systems, could have a material adverse effect on our results of operations.
9
Our business is subject to risks associated with global sourcing and manufacturing.
Independent third parties manufacture all of our products for us. As a result, we are directly impacted by increases in the cost of those products
.
If we experience significant increases in demand or need to replace an existing vendor, there can be no assurance that additional manufacturing capacity will be available when required on terms that are acceptable to us or that any vendor would allocate sufficient capacity to us in order to meet our requirements. In addition, for any new manufacturing source, we may encounter delays in production and added costs as a result of the time it takes to train our vendors in our methods, products, quality control standards, and environmental, labor, health, and safety standards. Moreover, in the event of a significant disruption in the supply of the fabrics or raw materials used by our vendors in the manufacture of our products, our vendors might not be able to locate alternative suppliers of materials of comparable quality at an acceptable price. Any delays, interruption, or increased costs in the manufacture of our products could result in lower sales and net income. In addition, certain countries represent a larger portion of our global sourcing. For example, approximately 28 percent and 21 percent of our merchandise, by dollar value, is purchased from factories in Vietnam and China, respectively. Accordingly, any delays in production and added costs in Vietnam or China could have a more significant impact on our results of operations.
Because independent vendors manufacture virtually all of our products outside of our principal sales markets, third parties must transport our products over large geographic distances. Delays in the shipment or delivery of our products due to the availability of transportation, work stoppages, port strikes, infrastructure congestion, or other factors, and costs and delays associated with transitioning between vendors, could adversely impact our financial performance. Operating or manufacturing delays, transportation delays, or unexpected demand for our products may require us to use faster, but more expensive, transportation methods such as aircraft, which could adversely affect our gross margins. In addition, the cost of fuel is a significant component of transportation costs, so increases in the price of petroleum products can adversely affect our gross margins.
Global economic conditions and any related impact on consumer spending patterns could adversely impact our results of operations.
The Company’s performance is subject to global economic conditions, as well as their impact on levels of consumer spending worldwide. Some of the factors that may influence consumer spending include high levels of unemployment, higher consumer debt levels, reductions in net worth based on market declines and uncertainty, home foreclosures and reductions in home values, fluctuating interest and foreign currency rates and credit availability, government austerity measures, fluctuating fuel and other energy costs, fluctuating commodity prices, and general uncertainty regarding the overall future economic environment. Consumer purchases of discretionary items, including our merchandise, generally decline during periods when disposable income is adversely affected or there is economic uncertainty.
Adverse economic changes in any of the regions in which we and our franchisees sell our products could reduce consumer confidence, and thereby could negatively affect earnings and have a material adverse effect on our results of operations. In challenging and uncertain economic environments, we cannot predict whether or when such circumstances may improve or worsen, or what impact, if any, such circumstances could have on our business, results of operations, cash flows, and financial position.
10
Our efforts to expand internationally may not be successful.
Our current strategies include pursuing selective international expansion in a number of countries around the world through a number of channels. This includes our franchisees opening additional stores internationally. We have limited experience operating or franchising in some of these locations. In many of these locations, we face major, established competitors. In addition, in many of these locations, the real estate, employment and labor, transportation and logistics, regulatory, and other operating requirements differ dramatically from those in the places where we have more experience. Consumer tastes and trends may differ in many of these locations and, as a result, the sales of our products may not be successful or result in the margins we anticipate. If our international expansion plans are unsuccessful or do not deliver an appropriate return on our investments, our operations and financial results could be materially, adversely affected.
Risks associated with importing merchandise from foreign countries, including failure of our vendors to adhere to our Code of Vendor Conduct, could harm our business.
We purchase nearly all merchandise from third-party vendors in many different countries, and we require those vendors to adhere to a Code of Vendor Conduct, which includes environmental, labor, health, and safety standards. From time to time, contractors or their subcontractors may not be in compliance with these standards or applicable local laws. Although we have implemented policies and procedures to facilitate our compliance with laws and regulations relating to doing business in foreign markets and importing merchandise into various countries, there can be no assurance that suppliers and other third parties with whom we do business will not violate such laws and regulations or our policies. Significant or continuing noncompliance with such standards and laws by one or more vendors could have a negative impact on our reputation, could subject us to liability, and could have an adverse effect on our results of operations.
Our franchise business is subject to certain risks not directly within our control that could impair the value of our brands.
We enter into franchise agreements with unaffiliated franchisees to operate stores and, in limited circumstances, websites, in many countries around the world. Under these agreements, third parties operate, or will operate, stores and websites that sell apparel and related products under our brand names. The effect of these arrangements on our business and results of operations is uncertain and will depend upon various factors, including the demand for our products in new markets internationally and our ability to successfully identify appropriate third parties to act as franchisees, distributors, or in a similar capacity. In addition, certain aspects of these arrangements are not directly within our control, such as franchisee financial stability and the ability of these third parties to meet their projections regarding store locations, store openings, and sales. Other risks that may affect these third parties include general economic conditions in specific countries or markets, foreign exchange rates, changes in diplomatic and trade relationships, restrictions on the transfer of funds, and political instability. Moreover, while the agreements we have entered into and plan to enter into in the future provide us with certain termination rights, the value of our brands could be impaired to the extent that these third parties do not operate their stores in a manner consistent with our requirements regarding our brand identities and customer experience standards. Failure to protect the value of our brands, or any other harmful acts or omissions by a franchisee, could have an adverse effect on our results of operations and our reputation.
11
The market for prime real estate is competitive.
Our ability to effectively obtain real estate - to open new stores, distribution centers, and corporate offices nationally and internationally - depends on the availability of real estate that meets our criteria for traffic, square footage, co-tenancies, lease economics, demographics, and other factors. We also must be able to effectively renew our existing store leases. In addition, we may seek to downsize, consolidate, reposition, relocate, or close some of our real estate locations, which in most cases requires a modification of an existing store lease. Failure to secure adequate new locations, successfully modify or exit existing locations, or failure to effectively manage the profitability of our existing fleet of stores, could have a material adverse effect on our results of operations.
Additionally, the economic environment may at times make it difficult to determine the fair market rent of real estate properties within the United States and internationally. This could impact the quality of our decisions to exercise lease options at previously negotiated rents and the quality of our decisions to renew expiring leases at negotiated rents. Any adverse effect on the quality of these decisions could impact our ability to retain real estate locations adequate to meet our targets or efficiently manage the profitability of our existing fleet of stores and could have a material adverse effect on our financial condition or results of operations.
Our business is exposed to the risks of foreign currency exchange rate fluctuations and our hedging strategies may not be effective in mitigating those risks.
We are exposed to foreign currency exchange rate risk with respect to our sales, operating expenses, profits, assets, and liabilities generated or incurred in foreign currencies as well as inventory purchases in U.S. dollars for our foreign subsidiaries. Although we use financial instruments to hedge certain foreign currency risks, these measures may not succeed in fully offsetting the negative impact of foreign currency rate movements and generally only delay the impact of adverse foreign currency rate movements on our business and financial results.
We experience fluctuations in our comparable sales and margins.
Our success depends in part on our ability to improve sales, in particular at our largest brands. A variety of factors affect comparable sales or margins, including but not limited to apparel trends, competition, current economic conditions, the timing of new merchandise releases and promotional events, changes in our merchandise mix, the success of marketing programs, foreign currency fluctuations, industry traffic trends, and weather conditions. These factors may cause our comparable sales results and margins to differ materially from prior periods and from expectations. Our comparable sales, including the associated comparable online sales, have fluctuated significantly in the past on an annual and quarterly basis. Over the past fiscal year, our reported quarterly comparable sales have ranged from a high of positive 2 percent in the second quarter of
fiscal 2018
to a low of negative 1 percent in the fourth quarter of
fiscal 2018
. Over the past five years, our reported gross margins have ranged from a high of 38.3 percent in fiscal 2017 and fiscal 2014 to a low of 36.2 percent in fiscal 2015. In addition, over the past five years, our reported operating margins have ranged from a high of 12.7 percent in fiscal 2014 to a low of 7.7 percent in fiscal 2016.
Our ability to deliver strong comparable sales results and margins depends in large part on accurately forecasting demand and apparel trends, selecting effective marketing techniques, providing an appropriate mix of merchandise for our broad and diverse customer base, managing inventory effectively, using effective pricing strategies, and optimizing store performance. Failure to meet the expectations of investors, securities analysts, or credit rating agencies in one or more future periods could reduce the market price of our common stock, cause our credit ratings to decline, and impact liquidity.
12
Changes in our credit profile or deterioration in market conditions may limit our access to the capital markets and adversely impact our financial position or our business initiatives.
In April 2011, we issued $
1.25 billion
aggregate principal amount of
5.95
percent notes due
April 2021
. As a result, we have additional costs that include interest payable semi-annually on the notes.
Our cash flows from operations are the primary source of funds for these debt service payments. In this regard, we have generated annual cash flow from operating activities in excess of $1 billion per year for well over a decade and ended
fiscal 2018
with
$1.1 billion
of cash and cash equivalents on our balance sheet. We are also able to supplement near-term liquidity, if necessary, with our $
500 million
revolving credit facility. We continue to target a cash balance between $1.0 billion to $1.2 billion, which provides not only for our working capital needs, but also a reserve for unexpected business downturns. However, if our cash flows from operating activities decline significantly, we may be required to reprioritize our business initiatives to ensure that we can continue to service or refinance our debt with favorable rates and terms. In addition, any future reduction in our long-term senior unsecured credit ratings could result in reduced access to the credit and capital markets and higher interest costs and potentially increased lease or hedging costs.
In May 2016, Fitch Ratings and Standard & Poor's Rating Services downgraded their respective credit ratings of us from BBB- negative outlook to BB+ stable outlook. These downgrades, and any future reduction in our long-term senior unsecured credit ratings, could result in reduced access to the credit and capital markets, more restrictive covenants in future financial documents and higher interest costs, and potentially increased lease or hedging costs.
For further information on our debt and credit facilities, see Item 8, Financial Statements and Supplementary Data,
Notes 4 and 5
of Notes to Consolidated Financial Statements of this Form 10-K.
Trade matters may disrupt our supply chain.
Trade restrictions, including increased tariffs or quotas, embargoes, safeguards, and customs restrictions against apparel items, as well as U.S. or foreign labor strikes, work stoppages, or boycotts, could increase the cost or reduce the supply of apparel available to us and adversely affect our business, financial condition, and results of operations. We cannot predict whether any of the countries in which our merchandise currently is manufactured or may be manufactured in the future will be subject to additional trade restrictions imposed by the United States or other foreign governments, including the likelihood, type, or effect of any such restrictions. For example, the current political landscape has introduced greater uncertainty with respect to future tax and trade regulations. In addition, we face the possibility of anti-dumping or countervailing duties lawsuits from U.S. domestic producers. We are unable to determine the impact of the changes to the quota system or the impact that potential tariff lawsuits could have on our global sourcing operations. Our sourcing operations may be adversely affected by trade limits or political and financial instability, resulting in the disruption of trade from exporting countries, significant fluctuation in the value of the U.S. dollar against foreign currencies, restrictions on the transfer of funds, and/or other trade disruptions. Changes in tax policy or trade regulations, such as the imposition of new tariffs on imported products, could have a material adverse effect on our business and results of operations.
Changes in the regulatory or administrative landscape could adversely affect our financial condition and results of operations.
Laws and regulations at the local, state, federal, and international levels frequently change, and the ultimate cost of compliance cannot be precisely estimated. In addition, we cannot predict the impact that may result from changes in the regulatory or administrative landscape.
Any changes in laws or regulations, the imposition of additional laws or regulations, or the enactment of any new or more stringent legislation that impacts employment and labor, trade, product safety, transportation and logistics, health care, tax, privacy, operations, or environmental issues, among others, could have an adverse impact on our financial condition and results of operations.
13
Our results could be adversely affected by natural disasters, public health crises, political crises, negative global climate patterns, or other catastrophic events.
Natural disasters, such as hurricanes, tornadoes, floods, earthquakes, and other adverse weather conditions; unforeseen public health crises, such as pandemics and epidemics; political crises, such as terrorist attacks, war, labor unrest, and other political instability; negative global climate patterns, especially in water stressed regions; or other catastrophic events, such as fires or other disasters occurring at our distribution centers or our vendors' manufacturing facilities, whether occurring in the United States or internationally, could disrupt our operations, including the operations of our franchisees, or the operations of one or more of our vendors. In particular, these types of events could impact our supply chain from or to the impacted region and could impact our ability or the ability of our franchisees or other third parties to operate our stores or websites. In addition, these types of events could negatively impact consumer spending in the impacted regions or, depending upon the severity, globally. Disasters occurring at our vendors
’
manufacturing facilities could impact our reputation and our customers
’
perception of our brands. To the extent any of these events occur, our operations and financial results could be adversely affected.
Reductions in income and cash flow from our credit card arrangement related to our private label and co-branded credit cards could adversely affect our operating results and cash flows.
A third-party, Synchrony Financial (“Synchrony”), owns and services our private label credit card and co-branded programs. Our agreement with Synchrony provides for certain payments to be made by Synchrony to us, including a share of revenues from the performance of the credit card portfolios. The income and cash flow that we receive from Synchrony is dependent upon a number of factors, including the level of sales on private label and co-branded accounts, the level of balances carried on the accounts, payment rates on the accounts, finance charge rates and other fees on the accounts, the level of credit losses for the accounts, Synchrony’s ability to extend credit to our customers as well as the cost of customer rewards programs. All of these factors can vary based on changes in federal and state credit card, banking, and commercial protection laws. The factors affecting the income and cash flow that the Company receives from Synchrony can also vary based on a variety of economic, legal, social, and other factors that we cannot control. If the income and cash flow that we receive from our consumer credit card program agreement with Synchrony decreases significantly, our operating results and cash flows could be adversely affected
.
We are subject to various proceedings, lawsuits, disputes, and claims from time to time, which could adversely affect our business, financial condition, and results of operations.
As a multinational company, we are subject to various proceedings, lawsuits, disputes, and claims (“Actions”) arising in the ordinary course of our business. Many of these Actions raise complex factual and legal issues and are subject to uncertainties. Actions filed against us from time to time include commercial, intellectual property, customer, employment, and data privacy claims, including class action lawsuits. The plaintiffs in some Actions seek unspecified damages or injunctive relief, or both. Actions are in various procedural stages and some are covered in part by insurance. We cannot predict with assurance the outcome of Actions brought against us. Accordingly, developments, settlements, or resolutions may occur and impact income in the quarter of such development, settlement, or resolution. An unfavorable outcome could have an adverse impact on our business, financial condition and results of operations.
Item 1B. Unresolved Staff Comments.
None.
Item 2. Properties.
We have Company-operated stores in the United States, Canada, the United Kingdom, France, Ireland, Japan, Italy, China, Hong Kong, Taiwan, and Mexico. As of
February 2, 2019
, we had
3,194
Company-operated stores, which aggregated to approximately
36.7 million
square feet. Almost all of these stores are leased, typically with one or more renewal options after our initial term. Terms vary by type and location of store.
14
We own approximately 1.1 million square feet of corporate office space located in San Francisco, San Bruno, Pleasanton, and Rocklin, California, of which approximately 184,000 square feet is leased to and occupied by others. We lease approximately 0.9 million square feet of corporate office space located in San Francisco, Rocklin, and Petaluma, California; New York and Brooklyn, New York; Albuquerque, New Mexico; and Toronto, Ontario, Canada. Of the 0.9 million square feet of leased corporate office space, approximately 40,000 square feet is subleased to and occupied by others. We also lease regional offices in North America and in various international locations. We own approximately 8.9 million square feet of distribution space located in Fresno, California; Fishkill, New York; Groveport, Ohio; Gallatin, Tennessee; Brampton, Ontario, Canada; and Rugby, England. Of the 8.9 million square feet of owned distribution space, approximately 117,000 square feet is leased to and occupied by others. We lease approximately 1.2 million square feet of distribution space located in Shanghai, China, Phoenix, Arizona; and Erlanger and Hebron, Kentucky. Third-party logistics companies provide logistics services to us through distribution warehouses in Chiba, Japan; and Shanghai and Hong Kong, China.
Item 3. Legal Proceedings.
We do not believe that the outcome of any current Action would have a material effect on our Consolidated Financial Statements.
Item 4. Mine Safety Disclosures.
Not applicable.
15
Part II
Item 5. Market for Registrant’s Common Equity, Related Stockholder Matters and Issuer Purchases of Equity Securities.
The principal market on which our stock is traded is the New York Stock Exchange under the symbol "GPS". Our website is www.gapinc.com. The number of holders of record of our stock as of
March 13, 2019
was 6,133. The table below sets forth the dividends declared and paid for each of the fiscal quarters in
fiscal 2018
and
2017
.
|
|
Dividends Declared
and Paid
|
|||||||
|
|
Fiscal Year
|
|||||||
|
|
2018
|
2017
|
||||||
|
1st Quarter
|
$
|
0.2425
|
|
$
|
0.23
|
|
||
|
2nd Quarter
|
0.2425
|
|
0.23
|
|
||||
|
3rd Quarter
|
0.2425
|
|
0.23
|
|
||||
|
4th Quarter
|
0.2425
|
|
0.23
|
|
||||
|
$
|
0.97
|
|
$
|
0.92
|
|
|||
16
Stock Performance Graph
The graph below compares the percentage changes in our cumulative total stockholder return on our common stock for the five-year period ended
February 2, 2019
, with (i) the S&P 500 Index and (ii) the cumulative total return of the Dow Jones U.S. Retail Apparel Index. The total stockholder return for our common stock assumes quarterly reinvestment of dividends.
TOTAL RETURN TO STOCKHOLDERS
(Assumes $100 investment on 2/1/2014)
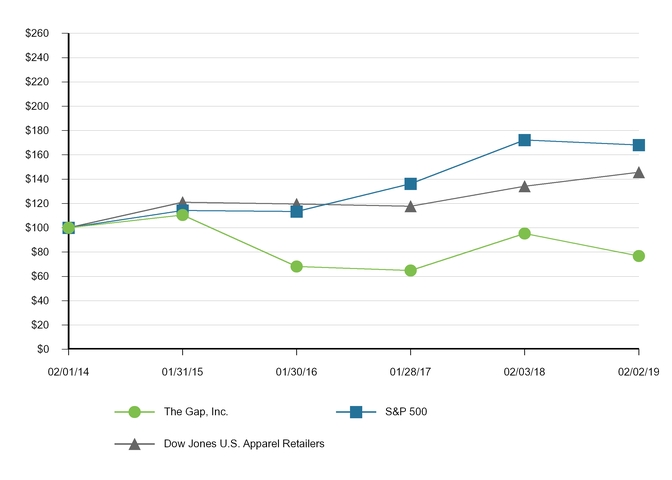
Total Return Analysis
|
2/1/2014
|
1/31/2015
|
1/20/2016
|
1/28/2017
|
2/3/2018
|
2/2/2019
|
|||||||||||||||||||
|
The Gap, Inc.
|
$
|
100.00
|
|
$
|
110.49
|
|
$
|
68.20
|
|
$
|
64.78
|
|
$
|
95.32
|
|
$
|
76.83
|
|
||||||
|
S&P 500
|
$
|
100.00
|
|
$
|
114.22
|
|
$
|
113.46
|
|
$
|
136.20
|
|
$
|
172.17
|
|
$
|
168.19
|
|
||||||
|
Dow Jones U.S. Apparel Retailers
|
$
|
100.00
|
|
$
|
121.10
|
|
$
|
119.54
|
|
$
|
117.82
|
|
$
|
134.11
|
|
$
|
145.75
|
|
||||||
Source: Research Data Group, Inc. (415) 643-6000 (www.researchdatagroup.com)
17
Purchases of Equity Securities by the Issuer and Affiliated Purchasers
The following table presents information with respect to purchases of common stock of the Company made during the fourteen weeks ended
February 2, 2019
by The Gap, Inc. or any affiliated purchaser, as defined in Exchange Act Rule 10b-18(a)(3):
|
Total Number
of Shares
Purchased (1)
|
Average
Price Paid
Per Share
Including
Commissions
|
Total Number
of Shares
Purchased as
Part of Publicly
Announced
Plans or
Programs
|
Maximum Number
(or approximate
dollar amount) of
Shares that May
Yet be Purchased
Under the Plans or
Programs (2)
|
|||||||||
|
Month #1 (November 4 - December 1)
|
537,024
|
|
$
|
26.61
|
|
537,024
|
|
$371 million
|
||||
|
Month #2 (December 2 - January 5)
|
1,931,440
|
|
$
|
26.28
|
|
1,931,440
|
|
$320 million
|
||||
|
Month #3 (January 6 - February 2)
|
1,298,418
|
|
$
|
25.46
|
|
1,298,418
|
|
$287 million
|
||||
|
Total
|
3,766,882
|
|
$
|
26.04
|
|
3,766,882
|
|
|||||
__________
|
(1)
|
Excludes shares withheld to settle employee statutory tax withholding related to the vesting of stock units.
|
|
(2)
|
On February 25, 2016, we announced that the Board of Directors approved a $1 billion share repurchase authorization (the "February 2016 repurchase program"), which had no expiration date. On February 26, 2019, we announced that the Board of Directors approved a $1 billion share repurchase authorization (the "February 2019 repurchase program"), which supersedes the February 2016 repurchase program and has no expiration date.
|
18
Item 6. Selected Financial Data.
The following selected financial data are derived from the Consolidated Financial Statements of the Company. We have also included certain non-financial data to enhance your understanding of our business. The data set forth below should be read in conjunction with “Management’s Discussion and Analysis of Financial Condition and Results of Operations” in Item 7 and the Company’s Consolidated Financial Statements and related notes in Item 8 of this Form 10-K.
|
|
Fiscal Year (number of weeks)
|
|||||||||||||||||||
|
|
2018 (52) (b)
|
2017 (53) (c)
|
2016 (52)
|
2015 (52)
|
2014 (52)
|
|||||||||||||||
|
Operating Results ($ in millions)
|
||||||||||||||||||||
|
Net sales
|
$
|
16,580
|
|
$
|
15,855
|
|
$
|
15,516
|
|
$
|
15,797
|
|
$
|
16,435
|
|
|||||
|
Gross margin
|
38.1
|
%
|
38.3
|
%
|
36.3
|
%
|
36.2
|
%
|
38.3
|
%
|
||||||||||
|
Operating margin
|
8.2
|
%
|
9.3
|
%
|
7.7
|
%
|
9.6
|
%
|
12.7
|
%
|
||||||||||
|
Effective Tax Rate
|
24.1
|
%
|
40.4
|
%
|
39.9
|
%
|
37.5
|
%
|
37.3
|
%
|
||||||||||
|
Net income
|
$
|
1,003
|
|
$
|
848
|
|
$
|
676
|
|
$
|
920
|
|
$
|
1,262
|
|
|||||
|
Cash dividends paid
|
$
|
373
|
|
$
|
361
|
|
$
|
367
|
|
$
|
377
|
|
$
|
383
|
|
|||||
|
Per Share Data (number of shares in millions)
|
||||||||||||||||||||
|
Basic earnings per share
|
$
|
2.61
|
|
$
|
2.16
|
|
$
|
1.69
|
|
$
|
2.24
|
|
$
|
2.90
|
|
|||||
|
Diluted earnings per share
|
$
|
2.59
|
|
$
|
2.14
|
|
$
|
1.69
|
|
$
|
2.23
|
|
$
|
2.87
|
|
|||||
|
Weighted-average number of shares—basic
|
385
|
|
393
|
|
399
|
|
411
|
|
435
|
|
||||||||||
|
Weighted-average number of shares—diluted
|
388
|
|
396
|
|
400
|
|
413
|
|
440
|
|
||||||||||
|
Cash dividends declared and paid per share
|
$
|
0.97
|
|
$
|
0.92
|
|
$
|
0.92
|
|
$
|
0.92
|
|
$
|
0.88
|
|
|||||
|
Balance Sheet Information ($ in millions)
|
||||||||||||||||||||
|
Merchandise inventory
|
$
|
2,131
|
|
$
|
1,997
|
|
$
|
1,830
|
|
$
|
1,873
|
|
$
|
1,889
|
|
|||||
|
Total assets
|
$
|
8,049
|
|
$
|
7,989
|
|
$
|
7,610
|
|
$
|
7,473
|
|
$
|
7,690
|
|
|||||
|
Working capital (a)
|
$
|
2,077
|
|
$
|
2,107
|
|
$
|
1,862
|
|
$
|
1,450
|
|
$
|
2,083
|
|
|||||
|
Total long-term debt, less current maturities
|
$
|
1,249
|
|
$
|
1,249
|
|
$
|
1,248
|
|
$
|
1,310
|
|
$
|
1,332
|
|
|||||
|
Stockholders’ equity
|
$
|
3,553
|
|
$
|
3,144
|
|
$
|
2,904
|
|
$
|
2,545
|
|
$
|
2,983
|
|
|||||
|
Other Data ($ and square footage in millions)
|
||||||||||||||||||||
|
Cash used for purchases of property and equipment
|
$
|
705
|
|
$
|
731
|
|
$
|
524
|
|
$
|
726
|
|
$
|
714
|
|
|||||
|
Percentage increase (decrease) in comparable sales
|
—
|
%
|
3
|
%
|
(2
|
)%
|
(4
|
)%
|
—
|
%
|
||||||||||
|
Number of Company-operated store locations open at year-end
|
3,194
|
|
3,165
|
|
3,200
|
|
3,275
|
|
3,280
|
|
||||||||||
|
Number of franchise store locations open at year-end
|
472
|
|
429
|
|
459
|
|
446
|
|
429
|
|
||||||||||
|
Number of total store locations open at year-end
|
3,666
|
|
3,594
|
|
3,659
|
|
3,721
|
|
3,709
|
|
||||||||||
|
Square footage of Company-operated store space at year-end
|
36.7
|
|
36.4
|
|
36.7
|
|
37.9
|
|
38.1
|
|
||||||||||
|
Percentage increase (decrease) in square footage of Company-operated store space at year-end
|
0.8
|
%
|
(0.8
|
)%
|
(3.2
|
)%
|
(0.5
|
)%
|
2.4
|
%
|
||||||||||
|
Number of employees at year-end
|
135,000
|
|
135,000
|
|
135,000
|
|
141,000
|
|
141,000
|
|
||||||||||
19
__________
|
(a)
|
In fiscal year 2015, we adopted the Financial Accounting Standards Board, Accounting Standard Update No. 2015-17, Income Taxes. The adoption reduced the current portion of deferred tax assets as a result of classifying all net deferred tax assets as noncurrent as of January 30, 2016 on a prospective basis.
|
|
(b)
|
Net sales for fiscal 2018 reflect the adoption of the new revenue recognition standard. Prior period amounts have not been restated and continue to be reported under accounting standards in effect for those periods. In fiscal year 2018, the effective tax rate reflects the benefits of the enactment of the Tax Cuts and Jobs Act on December 22, 2018.
|
|
(c)
|
In fiscal year 2017, the Company recognized a net provisional tax impact of approximately $34 million, which represents the provisional tax impact of federal tax reform of $57 million, net of a related $23 million benefit related to legal entity structuring that was also impacted by tax reform. Fiscal 2017 results also include incremental sales attributable to the 53rd week.
|
20
Item 7. Management’s Discussion and Analysis of Financial Condition and Results of Operations.
Overview
We are a global retailer offering apparel, accessories, and personal care products for men, women, and children under the Old Navy, Gap, Banana Republic, Athleta, Intermix, and Hill City brands. We have Company-operated stores in the United States, Canada, the United Kingdom, France, Ireland, Japan, Italy, China, Hong Kong, Taiwan, and Mexico. We have franchise agreements with unaffiliated franchisees to operate Old Navy, Gap, and Banana Republic stores throughout Asia, Europe, Latin America, the Middle East, and Africa. Under these agreements, third parties operate, or will operate, stores that sell apparel and related products under our brand names. Our products are also available to customers online through Company-owned websites and through the use of third parties that provide logistics and fulfillment services. In addition to operating in the specialty, outlet, online, and franchise channels, we also use our omni-channel capabilities to bridge the digital world and physical stores to further enhance our shopping experience for our customers. Our omni-channel services, including order-in-store, reserve-in-store, find-in-store, and ship-from-store, as well as enhanced mobile experiences, are tailored uniquely across our portfolio of brands. Most of the products sold under our brand names are designed by us and manufactured by independent sources. We also sell products that are designed and manufactured by branded third parties, primarily at our Intermix brand.
We identify our operating segments according to how our business activities are managed and evaluated. As of February 2, 2019, our operating segments included Old Navy Global, Gap Global, Banana Republic Global, Athleta, and Intermix. We have determined that each of our operating segments share similar economic and other qualitative characteristics, and therefore the results of our operating segments are aggregated into one reportable segment.
On February 28, 2019, the Company announced plans to restructure the specialty fleet and revitalize the Gap brand, including closing about 230 Gap specialty stores during fiscal 2019 and fiscal 2020. The Company believes these actions will drive a healthier specialty fleet and will serve as a more appropriate foundation for brand revitalization.
During the two-year period, the Company estimates pre-tax costs associated with these closure actions to be about $250 million to $300 million, with the majority expected to be cash expenditures for lease-related costs. The remaining charges are expected to primarily include employee-related costs and the net impact of write-offs related to long-term assets and liabilities. The Company estimates an annualized sales loss of approximately $625 million as a result of these store closures, with resulting annualized pre-tax savings of about $90 million.
On February 28, 2019, the Company also announced that its Board of Directors approved a plan to separate the Company into two independent publicly-traded companies: Old Navy and a yet-to-be-named company (“NewCo”), which will consist of Gap brand, Athleta, Banana Republic, Intermix, and Hill City. The separation is intended to enable both companies to capitalize on their respective opportunities and act decisively in an evolving retail environment by creating distinct financial profiles, tailored operating priorities and unique capital allocation strategies. Both companies will be positioned to create value for customers, shareholders and employees with enhanced focus and flexibility, aligned investments and incentives to meet the unique strategic goals, and optimized cost structures to deliver growth. The transaction is targeted to be completed in 2020 and is subject to certain conditions, including final approval by the Company’s Board of Directors, receipt of a tax opinion from counsel, and the filing and effectiveness of a registration statement with the U.S. Securities and Exchange Commission.
21
During the first quarter of fiscal 2018, the Company adopted the new revenue recognition standard, Accounting Standards Codification ("ASC") 606, using the modified retrospective transition method and recorded an increase to opening retained earnings of $36 million, net of tax. The comparative information has not been restated and continues to be reported under the accounting standards in effect for those periods. The adoption of this standard had a significant impact on the presentation of certain line items within the Consolidated Statements of Income, but did not have a material impact to operating income, net income or earnings per share for fiscal year 2018. The presentation changes primarily consist of $443 million for the fiscal year ended February 2, 2019 for revenue sharing associated with our credit card programs and breakage revenue for gift cards and credit vouchers, which now is recorded as net sales and previously was recorded as a reduction to operating expenses in our Consolidated Statements of Income; and $176 million for the fiscal year ended February 2, 2019, for reimbursements of loyalty program discounts associated with our credit card programs, which now is recorded as net sales and previously was recorded as a reduction to cost of goods sold and occupancy expenses in our Consolidated Statements of Income. See Note 1 of Notes to Consolidated Financial Statements for additional disclosures about the adoption of the new revenue standard.
On August 29, 2016, a fire occurred in one of the buildings at a Company-owned distribution center campus in Fishkill, New York ("the Fishkill fire"). In January 2018, we agreed upon a final settlement with our insurers and all insurance proceeds were received as of February 3, 2018.
Fiscal 2018 and 2016 consisted of 52 weeks versus 53 weeks in fiscal 2017. Net sales and operating results, as well as other metrics derived from the Consolidated Statement of Income, include the impact of the additional week; however, the comparable sales calculation excludes the 53rd week.
Financial results for
fiscal 2018
are as follows:
|
•
|
Net sales for
fiscal 2018
increased 5 percent to
$16.6 billion
compared with
$15.9 billion
for
fiscal 2017
.
|
|
•
|
Comparable sales for
fiscal 2018
were flat.
|
|
•
|
Gross profit for
fiscal 2018
was
$6.3 billion
compared with
$6.1 billion
for
fiscal 2017
. Gross margin for
fiscal 2018
was
38.1 percent
compared with
38.3 percent
for
fiscal 2017
.
|
|
•
|
Operating margin for
fiscal 2018
was
8.2 percent
compared with
9.3 percent
for
fiscal 2017
.
|
|
•
|
Effective tax rate for
fiscal 2018
was
24.1 percent
compared with
40.4 percent
for
fiscal 2017
.
|
|
•
|
Net income for
fiscal 2018
was
$1,003 million
compared with
$848 million
for
fiscal 2017
, and diluted earnings per share was
$2.59
for
fiscal 2018
compared with
$2.14
for
fiscal 2017
. Diluted earnings per share for fiscal 2017 included about a $0.10 benefit from the gain from insurance proceeds related to the Fishkill fire and an unfavorable net provisional tax impact of federal tax reform of about $0.09.
|
|
•
|
During
fiscal 2018
, we paid dividends of $373 million compared with $361 million during
fiscal 2017
.
|
|
•
|
During
fiscal 2018
, share repurchases were $398 million compared with $315 million for
fiscal 2017
.
|
Our business priorities in
fiscal 2019
are as follows:
|
•
|
offering product that is consistently brand-appropriate and on-trend with high customer acceptance, with a focus on expanding our advantage in core businesses and loyalty categories; and leading customer-focused product innovation;
|
|
•
|
preparing for successful separation;
|
|
•
|
restructuring the Gap brand specialty fleet globally to create a healthier, more profitable base from which to grow;
|
|
•
|
investing in digital and customer capabilities as well as store experience to create a unique and differentiated converged retail experience that attracts new customers, retains existing customers, and builds loyalty;
|
|
•
|
increasing productivity by leveraging our scale and streamlining operations and processes throughout the organization;
|
|
•
|
attracting and retaining strong talent in our businesses and functions; and
|
22
|
•
|
continuing to integrate social and environmental sustainability into business practices to support long term growth.
|
In fiscal 2019, while we work through the plan for separation, we are focused on investing strategically in the business while maintaining operating expense discipline and driving efficiency through our productivity initiative. One of our primary objectives is to continue transforming our product to market process, with the development of a more efficient operating model. Furthermore, we expect to continue our investment in customer experience, both in stores and online, to drive higher customer engagement and loyalty across all of our brands and channels, resulting in market share gains. Finally, we will continue to invest in strengthening brand awareness, customer acquisition, and digital capabilities. Underpinning these strategies is a focus on utilizing data, analytics, and technology to respond faster while making decisions that will fuel market share gains and lead to a more nimble organization.
Results of Operations
Net Sales
See Item 8, Financial Statements and Supplementary Data,
Note 16
of Notes to Consolidated Financial Statements for net sales by brand and region.
Comparable Sales ("Comp Sales")
Fiscal 2018 consisted of 52 weeks versus 53 weeks in fiscal 2017. Due to the 53rd week in fiscal 2017, in order to maintain consistency, comparable ("Comp") sales for the fifty-two weeks ended February 2, 2019, are compared to the fifty-two weeks ended February 3, 2018.
The percentage change in Comp Sales by global brand and for total Company, as compared with the preceding year, is as follows:
|
|
Fiscal Year
|
||||||||
|
|
2018
|
2017
|
2016
|
||||||
|
Old Navy Global
|
3
|
%
|
6
|
%
|
1
|
%
|
|||
|
Gap Global
|
(5
|
)%
|
(1
|
)%
|
(3
|
)%
|
|||
|
Banana Republic Global
|
1
|
%
|
(2
|
)%
|
(7
|
)%
|
|||
|
The Gap, Inc.
|
—
|
%
|
3
|
%
|
(2
|
)%
|
|||
Comp Sales include merchandise sales in Company-operated stores and merchandise sales through online channels in those countries where we have existing comparable store sales. The calculation of The Gap, Inc. Comp Sales includes the results of Athleta and Intermix but excludes the results of our franchise business.
A store is included in the Comp Sales calculations when it has been open and operated by the Company for at least one year and the selling square footage has not changed by 15 percent or more within the past year. A store is included in the Comp Sales calculations on the first day it has comparable prior year sales. Stores in which the selling square footage has changed by 15 percent or more as a result of a remodel, expansion, or reduction are excluded from the Comp Sales calculations until the first day they have comparable prior year sales.
A store is considered non-comparable (“Non-comp”) when it has been open and operated by the Company for less than one year or has changed its selling square footage by 15 percent or more within the past year.
A store is considered “Closed” if it is temporarily closed for three or more full consecutive days or it is permanently closed. When a temporarily closed store reopens, the store will be placed in the Comp/Non-comp status it was in prior to its closure. If a store was in Closed status for three or more days in the prior year, the store will be in Non-comp status for the same days the following year.
Current year foreign exchange rates are applied to both current year and prior year Comp Sales to achieve a consistent basis for comparison.
23
Store Count and Square Footage Information
Net sales per average square foot is as follows:
|
|
Fiscal Year
|
|||||||||||
|
|
2018 (2)
|
2017 (3)
|
2016
|
|||||||||
|
Net sales per average square foot (1)
|
$
|
341
|
|
$
|
340
|
|
$
|
334
|
|
|||
__________
|
(1)
|
Excludes net sales associated with our online and franchise businesses. Online sales includes both sales through our online channels as well as ship-from-store sales.
|
|
(2)
|
Reflects the adoption of ASC 606. Prior period amounts have not been restated and continue to be reported under accounting standards in effect for those periods.
|
|
(3)
|
Fiscal 2017 includes incremental sales attributable to the 53rd week.
|
Store count, openings, closings, and square footage for our stores are as follows:
|
|
February 3, 2018
|
Fiscal 2018
|
February 2, 2019
|
||||||||||||
|
|
Number of
Store Locations
|
Number of
Stores Opened
|
Number of
Stores Closed
|
Number of
Store Locations
|
Square Footage
(in millions)
|
||||||||||
|
Old Navy North America
|
1,066
|
|
79
|
|
6
|
|
1,139
|
|
18.6
|
|
|||||
|
Old Navy Asia
|
14
|
|
1
|
|
—
|
|
15
|
|
0.2
|
|
|||||
|
Gap North America
|
810
|
|
14
|
|
66
|
|
758
|
|
7.9
|
|
|||||
|
Gap Asia
|
313
|
|
34
|
|
15
|
|
332
|
|
3.1
|
|
|||||
|
Gap Europe
|
155
|
|
9
|
|
12
|
|
152
|
|
1.2
|
|
|||||
|
Banana Republic North America
|
576
|
|
9
|
|
29
|
|
556
|
|
4.7
|
|
|||||
|
Banana Republic Asia
|
45
|
|
3
|
|
3
|
|
45
|
|
0.2
|
|
|||||
|
Athleta North America
|
148
|
|
14
|
|
1
|
|
161
|
|
0.7
|
|
|||||
|
Intermix North America
|
38
|
|
—
|
|
2
|
|
36
|
|
0.1
|
|
|||||
|
Company-operated stores total
|
3,165
|
|
163
|
|
134
|
|
3,194
|
|
36.7
|
|
|||||
|
Franchise
|
429
|
|
90
|
|
47
|
|
472
|
|
N/A
|
|
|||||
|
Total
|
3,594
|
|
253
|
|
181
|
|
3,666
|
|
36.7
|
|
|||||
|
Increase over prior year
|
2.0
|
%
|
0.8
|
%
|
|||||||||||
|
|
January 28, 2017
|
Fiscal 2017
|
February 3, 2018
|
||||||||||||
|
|
Number of
Store Locations
|
Number of
Stores Opened
|
Number of
Stores Closed
|
Number of
Store Locations
|
Square Footage
(in millions)
|
||||||||||
|
Old Navy North America
|
1,043
|
|
32
|
|
9
|
|
1,066
|
|
17.7
|
|
|||||
|
Old Navy Asia
|
13
|
|
1
|
|
—
|
|
14
|
|
0.2
|
|
|||||
|
Gap North America
|
844
|
|
8
|
|
42
|
|
810
|
|
8.4
|
|
|||||
|
Gap Asia
|
311
|
|
52
|
|
50
|
|
313
|
|
3.0
|
|
|||||
|
Gap Europe
|
164
|
|
3
|
|
12
|
|
155
|
|
1.3
|
|
|||||
|
Banana Republic North America
|
601
|
|
5
|
|
30
|
|
576
|
|
4.9
|
|
|||||
|
Banana Republic Asia
|
48
|
|
1
|
|
4
|
|
45
|
|
0.2
|
|
|||||
|
Banana Republic Europe
|
1
|
|
—
|
|
1
|
|
—
|
|
—
|
|
|||||
|
Athleta North America
|
132
|
|
16
|
|
—
|
|
148
|
|
0.6
|
|
|||||
|
Intermix North America
|
43
|
|
—
|
|
5
|
|
38
|
|
0.1
|
|
|||||
|
Company-operated stores total
|
3,200
|
|
118
|
|
153
|
|
3,165
|
|
36.4
|
|
|||||
|
Franchise
|
459
|
|
34
|
|
64
|
|
429
|
|
N/A
|
|
|||||
|
Total
|
3,659
|
|
152
|
|
217
|
|
3,594
|
|
36.4
|
|
|||||
|
Decrease over prior year
|
(1.8
|
)%
|
(0.8
|
)%
|
|||||||||||
Gap and Banana Republic outlet and factory stores are reflected respectively within each brand.
24
In
fiscal 2019
, we expect to open about 140 and close about 190 Company-operated store locations. Openings will be primarily focused on Old Navy and Athleta
.
Closures are primarily driven by the specialty fleet restructuring.
Net Sales Discussion
Our net sales for
fiscal 2018
increased
$725 million
, or
5 percent
, compared with
fiscal 2017
, primarily driven by the impact of significant presentation changes of $619 million resulting from the adoption of the new revenue recognition standard, and an increase in net sales for Old Navy Global and Athleta; partially offset by a decrease in net sales for Gap Global. The translation of net sales in foreign currencies to U.S. dollars had a favorable impact of about $17 million for fiscal 2018 and is calculated by translating net sales for
fiscal 2017
at exchange rates applicable during
fiscal 2018
.
Our net sales for
fiscal 2017
increased $339 million, or 2 percent, compared with
fiscal 2016
primarily
due to an increase in net sales at Old Navy Global and Athleta, partially offset by a decrease in net sales at Gap Global and Banana Republic Global. The translation of net sales in foreign currencies to U.S. dollars had an unfavorable impact of about $11 million for fiscal 2017 and is calculated by translating net sales for
fiscal 2016
at exchange rates applicable during
fiscal 2017
. Fiscal 2017 includes incremental sales attributable to the 53rd week.
Cost of Goods Sold and Occupancy Expenses
|
($ in millions)
|
Fiscal Year
|
|||||||||||
|
2018
|
2017
|
2016
|
||||||||||
|
Cost of goods sold and occupancy expenses
|
$
|
10,258
|
|
$
|
9,789
|
|
$
|
9,876
|
|
|||
|
Gross profit
|
$
|
6,322
|
|
$
|
6,066
|
|
$
|
5,640
|
|
|||
|
Cost of goods sold and occupancy expenses as a percentage of net sales
|
61.9
|
%
|
61.7
|
%
|
63.7
|
%
|
||||||
|
Gross margin
|
38.1
|
%
|
38.3
|
%
|
36.3
|
%
|
||||||
Cost of goods sold and occupancy expenses increased 0.2 percentage points as a percentage of net sales in
fiscal 2018
compared with
fiscal 2017
, which includes $176 million of presentation changes resulting from the adoption of the new revenue recognition standard.
|
•
|
Cost of goods sold increased 0.7 percentage points as a percentage of net sales in
fiscal 2018
compared with
fiscal 2017
, primarily driven by lower product margin at Gap Global and higher online shipping costs. This was partially offset by a favorable impact from presentation changes resulting from the adoption of the new revenue recognition standard.
|
|
•
|
Occupancy expenses decreased 0.5 percentage points as a percentage of net sales in
fiscal 2018
compared with
fiscal 2017
, primarily driven by presentation changes resulting from the adoption of the new revenue recognition standard.
|
Cost of goods sold and occupancy expenses decreased 2.0 percentage points as a percentage of net sales in
fiscal 2017
compared with
fiscal 2016
.
|
•
|
Cost of goods sold decreased 1.3 percentage points as a percentage of net sales in fiscal 2017 compared with fiscal 2016, primarily driven by higher margins achieved as a result of improved average selling price per unit at all global brands; partially offset by higher average unit cost at all global brands. This was offset by a negative foreign exchange impact for our foreign subsidiaries as our merchandise purchases are primarily in U.S. dollars.
|
|
•
|
Occupancy expenses decreased 0.7 percentage points as a percentage of net sales in fiscal 2017 compared with fiscal 2016, primarily driven by an increase in online sales, international store closures, and higher sales from the impact of the 53rd week; partially offset by real estate expenses for the Times Square New York location for Gap and Old Navy.
|
In fiscal 2019, we do not expect significant year-over-year impacts on gross margins due to fluctuations in foreign currencies.
25
Operating Expenses and Operating Margin
|
($ in millions)
|
Fiscal Year
|
|||||||||||
|
2018
|
2017
|
2016
|
||||||||||
|
Operating expenses
|
$
|
4,960
|
|
$
|
4,587
|
|
$
|
4,449
|
|
|||
|
Operating expenses as a percentage of net sales
|
29.9
|
%
|
28.9
|
%
|
28.7
|
%
|
||||||
|
Operating margin
|
8.2
|
%
|
9.3
|
%
|
7.7
|
%
|
||||||
Operating expenses increased
$373 million
or
1.0
percentage points as a percentage of net sales in
fiscal 2018
compared with
fiscal 2017
primarily due to the following:
|
•
|
an increase of $443 million related to the presentation changes resulting from the adoption of new revenue recognition standard; and
|
|
•
|
a gain from insurance proceeds of $64 million during fiscal 2017 related to the fire that occurred at the Fishkill, New York Company-owned distribution center; partially offset by
|
|
•
|
a decrease in expenses related to payroll and benefits, primarily driven by a decrease in bonus expense.
|
Operating expenses increased $138 million
or
0.2 percentage points as a percentage of net sales in fiscal 2017 compared with fiscal 2016 primarily due to the following:
|
•
|
an increase in variable costs, such as payroll-related costs, due to the growth in Old Navy Global and Athleta brands, increase in bonus expense, and the 53rd week impact;
|
|
•
|
an increase in advertising; and
|
|
•
|
an increase in overhead costs related to productivity work including investments in customer and digital initiatives as well as severance expenses and the impacts of store closures; partially offset by
|
|
•
|
a gain from insurance proceeds of $64 million related to the Fishkill fire recorded in the second quarter of fiscal year 2017;
|
|
•
|
a decrease of $197 million of restructuring costs incurred in fiscal year 2016; and
|
|
•
|
a decrease of $71 million related to a goodwill impairment charges for Intermix in fiscal year 2016.
|
Interest Expense
|
($ in millions)
|
Fiscal Year
|
|||||||||||
|
2018
|
2017
|
2016
|
||||||||||
|
Interest expense
|
$
|
73
|
|
$
|
74
|
|
$
|
75
|
|
|||
Interest expense for fiscal 2018, 2017 and 2016 is primarily comprised of interest on our
$1.25 billion
long-term debt.
Income Taxes
|
($ in millions)
|
Fiscal Year
|
|||||||||||
|
2018
|
2017
|
2016
|
||||||||||
|
Income taxes
|
$
|
319
|
|
$
|
576
|
|
$
|
448
|
|
|||
|
Effective tax rate
|
24.1
|
%
|
40.4
|
%
|
39.9
|
%
|
||||||
The decrease in the effective tax rate for
fiscal 2018
compared with
fiscal 2017
was primarily due to the reduction in the U.S. federal statutory tax rate from 35% to 21%, enacted as part of the Tax Cuts and Jobs Act of 2017 (the “TCJA”), and measurement period adjustments to reduce our fiscal 2017 estimated net charge for the effects of the TCJA, offset by increases in unrecognized tax benefits recorded in connection with examinations by taxing authorities.
26
During
fiscal 2017
, we calculated and recorded a $57 million net charge for our best estimate of the impact of the TCJA one-time transition tax on the deemed repatriation of foreign income and the impact of TCJA on deferred tax assets and liabilities.
During
fiscal 2018
, we recorded a $33 million measurement period adjustment to reduce our
fiscal 2017
provisional estimated net charge related to the transition tax and recorded certain other immaterial measurement period adjustments to reduce our
fiscal 2017
provisional estimated impact of the remeasurement of our deferred tax assets and liabilities to reflect the TCJA rate reduction. We have evaluated the TCJA and interpreted additional guidance issued by the U.S. Treasury Department and Internal Revenue Service (“IRS”) during fiscal 2018 and our accounting for the impact of the TCJA is complete as of
February 2, 2019
.
The increase in the effective tax rate for
fiscal 2017
compared with fiscal 2016 was primarily due to the impact of the TCJA, partially offset by the recognition of certain tax benefits associated with legal structure changes.
Liquidity and Capital Resources
Our largest source of cash flows is cash collections from the sale of our merchandise. Our primary uses of cash include merchandise inventory purchases, occupancy costs, personnel-related expenses, purchases of property and equipment, and payment of taxes. In addition, we may have dividend payments, debt repayments, and share repurchases.
We consider the following to be measures of our liquidity and capital resources:
|
($ in millions)
|
February 2,
2019 |
February 3,
2018 |
January 28,
2017 |
|||||||||
|
Cash and cash equivalents
|
$
|
1,081
|
|
$
|
1,783
|
|
$
|
1,783
|
|
|||
|
Short-term investments
|
$
|
288
|
|
$
|
—
|
|
$
|
—
|
|
|||
|
Debt
|
$
|
1,249
|
|
$
|
1,249
|
|
$
|
1,313
|
|
|||
|
Working capital
|
$
|
2,077
|
|
$
|
2,107
|
|
$
|
1,862
|
|
|||
|
Current ratio
|
1.96:1
|
|
1.86:1
|
|
1.76:1
|
|
||||||
As of
February 2, 2019
, the majority of our cash, cash equivalents, and short-term investments were held in the United States and is generally accessible without any limitations. In addition, as of
February 2, 2019
,
there was restricted cash of
$320 million
held by a third party in connection with the purchase of a building recorded in other long-term assets on the Consolidated Balance Sheet.
In April 2011, the Company entered into a $1.25 billion aggregate principal amount of 5.95 percent notes (the "Notes"), which are due April 2021.
In October 2015, the Company entered into a $400 million unsecured term loan (the "Term Loan"), which was fully repaid in January 2017.
In January 2014, the Company entered into a
15 billion
Japanese yen,
four
-year, unsecured term loan ("Japan Term Loan"), which was fully repaid in June 2017.
We believe that current cash balances and cash flows from our operations will be sufficient to support our business operations, including the purchase of a building and expansion costs related to the buildout of our Ohio distribution center, for the next 12 months and beyond.
We are also able to supplement near-term liquidity, if necessary, with our
$500 million
revolving credit facility or other available market instruments.
27
Cash Flows from Operating Activities
Net cash provided by operating activities during
fiscal 2018
was flat compared with
fiscal 2017
, which was comprised of the following significant changes:
Net income
|
•
|
an increase of $155 million in net income.
|
Changes in operating assets and liabilities
|
•
|
an increase of $165 million related to income taxes payable, net of prepaid and other tax-related items, driven primarily by the timing of payments; offset by
|
|
•
|
a decrease of $230 million related to accrued expenses and other current liabilities, driven primarily by a decrease in bonus accrual for fiscal 2018 compared with an increase for fiscal 2017; and
|
|
•
|
a decrease of $51 million related to other current assets and long-term assets driven in part by the receipt of insurance claims receivable related to the Fishkill fire during fiscal 2017.
|
Net cash provided by operating activities during fiscal 2017 decreased $339 million compared with fiscal 2016, primarily due to the following:
Net income
|
•
|
an increase of $172 million in net income.
|
Non-cash items
|
•
|
a decrease of $79 million in store asset impairment charges in fiscal 2017 compared with fiscal 2016 in part due to restructuring activities in fiscal 2016; and
|
|
•
|
a decrease of $71 million due to a goodwill impairment charge related to Intermix during fiscal 2016.
|
Changes in operating assets and liabilities
|
•
|
a decrease of $236 million related to accounts payable primarily due to timing of payments;
|
|
•
|
a decrease of $188 million related to merchandise inventory primarily due to the volume and timing of receipts; and
|
|
•
|
a decrease of $71 million related to income taxes payable, net of prepaid and other tax-related items, primarily due to the timing of tax payments, partially offset by an increase in estimated current expense in fiscal 2017 compared with fiscal 2016; partially offset by
|
|
•
|
an increase of $115 million related to the recognition of deferred tax expense in fiscal 2017 compared with deferred tax benefit in fiscal 2016 primarily due to the deferred tax impact of federal tax reform and favorable current year temporary differences.
|
We fund inventory expenditures during normal and peak periods through cash flows from operating activities and available cash. Our business follows a seasonal pattern, with sales peaking during the end-of-year holiday period. The seasonality of our operations may lead to significant fluctuations in certain asset and liability accounts between fiscal year-end and subsequent interim periods.
Cash Flows from Investing Activities
Net cash used for investing activities during
fiscal 2018
increased $335 million compared with
fiscal 2017
, primarily due to the following:
|
•
|
$287 million of net purchases of available-for-sale securities during fiscal 2018; and
|
|
•
|
$66 million of insurance proceeds allocated to the loss on property and equipment during fiscal 2017.
|
In
fiscal 2018
, cash used for purchases of property and equipment was $
705 million
related to information technology and supply chain to support our omni and digital strategies, and store investments.
Net cash used for investing activities during fiscal 2017 increased $139 million compared with fiscal 2016, primarily due to:
|
•
|
$207 million increase for purchases of property and equipment in fiscal 2017 compared with fiscal 2016 primarily related to the rebuilding of the Company's Fishkill, New York distribution center campus; partially offset by
|
|
•
|
$66 million related to insurance proceeds allocated to loss on property and equipment in fiscal 2017 primarily related to the Fishkill fire compared with no insurance proceeds allocated to loss on property and equipment in fiscal 2016.
|
28
In
fiscal 2017
, cash used for purchases of property and equipment was $
731 million
primarily related to investments in stores, information technology, and supply chain, including costs associated with the rebuilding of the Company's Fishkill, New York distribution center campus.
Cash Flows from Financing Activities
Net cash used for financing activities during
fiscal 2018
increased $18 million compared with
fiscal 2017
, primarily due to the following:
|
•
|
$83 million higher repurchases of common stock during fiscal 2018; offset by
|
|
•
|
$67 million cash outflow related to the final repayment of the Japan term loan during fiscal 2017.
|
Net cash used for financing activities during fiscal 2017 decreased $46 million compared with fiscal 2016, primarily due to the following:
|
•
|
$67 million related to the final repayment of the Japan term loan in full in June 2017 compared with a $421 million payment of debt in fiscal 2016; partially offset by
|
|
•
|
$315 million of cash used for repurchases of common stock in fiscal 2017 compared with no repurchases of common stock in fiscal 2016.
|
Free Cash Flow
Free cash flow is a non-GAAP financial measure. We believe free cash flow is an important metric because it represents a measure of how much cash a company has available for discretionary and non-discretionary items after the deduction of capital expenditures, net of insurance proceeds to loss on property and equipment, as we require regular capital expenditures to build and maintain stores and purchase new equipment to improve our business. We use this metric internally, as we believe our sustained ability to generate free cash flow is an important driver of value creation. However, this non-GAAP financial measure is not intended to supersede or replace our GAAP result. Free cash flow for fiscal 2017 is adjusted for insurance proceeds allocated to loss on property and equipment, as our cash used for purchases of property and equipment for fiscal 2017 includes certain capital expenditures related to the rebuilding of the Company-owned distribution center which was impacted by the Fishkill fire.
The following table reconciles free cash flow, a non-GAAP financial measure, from net cash provided by operating activities, a GAAP financial measure.
|
|
Fiscal Year
|
|||||||||||
|
($ in millions)
|
2018
|
2017
|
2016
|
|||||||||
|
Net cash provided by operating activities
|
$
|
1,381
|
|
$
|
1,380
|
|
$
|
1,719
|
|
|||
|
Less: Purchases of property and equipment
|
(705
|
)
|
(731
|
)
|
(524
|
)
|
||||||
|
Add: Insurance proceeds related to loss on property and equipment
|
—
|
|
66
|
|
—
|
|
||||||
|
Free cash flow
|
$
|
676
|
|
$
|
715
|
|
$
|
1,195
|
|
|||
Debt and Credit Facilities
Certain financial information about the Company's debt and credit facilities is set forth under the headings "Debt" and "Credit Facilities" in
Notes 4 and 5
, respectively, of Notes to Consolidated Financial Statements included in Item 8, Financial Statements and Supplementary Data, of this Form 10-K.
Dividend Policy
In determining whether and at what level to declare a dividend, we consider a number of factors including sustainability, operating performance, liquidity, and market conditions.
We paid an annual dividend of $0.97 per share in
fiscal 2018
and $0.92 per share in
fiscal 2017
. We plan to pay an annual dividend of $0.97 per share in
fiscal 2019
.
Share Repurchases
Certain financial information about the Company's share repurchases is set forth under the heading "Share Repurchases" in
Note 8
of Notes to Consolidated Financial Statements included in Item 8, Financial Statements and Supplementary Data, of this Form 10-K.
29
Contractual Cash Obligations
We are party to many contractual obligations involving commitments to make payments to third parties. The following table provides summary information concerning our future contractual obligations as of
February 2, 2019
. These obligations impact our short-term and long-term liquidity and capital resource needs. Certain of these contractual obligations are reflected on the Consolidated Balance Sheet as of
February 2, 2019
, while others are disclosed as future obligations.
|
|
Payments Due by Period
|
|||||||||||||||||||
|
($ in millions)
|
Less than 1
Year
|
1-3 Years
|
3-5 Years
|
More Than 5
Years
|
Total
|
|||||||||||||||
|
Debt (1)
|
$
|
—
|
|
$
|
1,250
|
|
$
|
—
|
|
$
|
—
|
|
$
|
1,250
|
|
|||||
|
Interest payments on debt
|
74
|
|
112
|
|
—
|
|
—
|
|
186
|
|
||||||||||
|
Operating leases (2)
|
1,156
|
|
1,990
|
|
1,269
|
|
1,520
|
|
5,935
|
|
||||||||||
|
Purchase obligations and commitments (3)
|
4,298
|
|
65
|
|
20
|
|
67
|
|
4,450
|
|
||||||||||
|
Total contractual cash obligations
|
$
|
5,528
|
|
$
|
3,417
|
|
$
|
1,289
|
|
$
|
1,587
|
|
$
|
11,821
|
|
|||||
__________
|
(1)
|
Represents principal maturities, excluding interest. See
Note 4
of Notes to Consolidated Financial Statements for discussion on debt.
|
|
(2)
|
Excludes maintenance, insurance, taxes, and contingent rent obligations. See
Note 11
of Notes to Consolidated Financial Statements for discussion of our operating leases.
|
|
(3)
|
Represents estimated open purchase orders to purchase inventory as well as commitments for products and services used in the normal course of business. In addition, includes consideration related to the purchase of a building expected to be completed within one year.
|
There is $156 million of long-term liabilities recorded in lease incentives and other long-term liabilities on the Consolidated Balance Sheet as of
February 2, 2019
that is excluded from the table above as the amount relates to uncertain tax positions and deferred compensation, and we are not able to reasonably estimate the timing of the payments or the amount by which the liability will increase or decrease over time.
Commercial Commitments
We have commercial commitments, not reflected in the table above, that were incurred in the normal course of business to support our operations, including standby letters of credit of
$13 million
, surety bonds of
$45 million
, and bank guarantees of
$25 million
outstanding (of which
$16 million
was issued under the unsecured revolving credit facilities for our operations in foreign locations) as of
February 2, 2019
.
Other Cash Obligations Not Reflected on the Consolidated Balance Sheet (Off-Balance Sheet Arrangements)
The majority of our contractual obligations relate to operating leases for our stores. Future minimum operating lease payments represent commitments under non-cancelable operating leases and are disclosed in the table above with additional information provided under the heading "Leases" in
Note 11
of Notes to Consolidated Financial Statements included in Item 8, Financial Statements and Supplementary Data, of this Form 10-K.
Critical Accounting Policies and Estimates
The preparation of financial statements in accordance with accounting principles generally accepted in the United States of America ("U.S. GAAP") requires management to adopt accounting policies and make significant judgments and estimates to develop amounts reflected and disclosed in the financial statements. In many cases, there are alternative policies or estimation techniques that could be used. We maintain a thorough process to review the application of our accounting policies and to evaluate the appropriateness of the many estimates that are required to prepare the financial statements of a large, global corporation. However, even under optimal circumstances, estimates routinely require adjustment based on changing circumstances and the receipt of new or better information.
30
Our significant accounting policies can be found under the heading "Organization and Summary of Significant Accounting Policies" in
Note 1
of Notes to Consolidated Financial Statements included in Item 8, Financial Statements and Supplementary Data, of this Form 10-K. The policies and estimates discussed below include the financial statement elements that are either judgmental or involve the selection or application of alternative accounting policies and are material to our financial statements. Management has discussed the development and selection of these critical accounting policies and estimates with the Audit and Finance Committee of our Board of Directors, which has reviewed our disclosure relating to critical accounting policies and estimates in this annual report on Form 10-K.
Merchandise Inventory
We value inventory at the lower of cost or net realizable value (“LCNRV”), with cost determined using the weighted-average cost method. We review our inventory levels in order to identify slow-moving merchandise and broken assortments (items no longer in stock in a sufficient range of sizes or colors), and we primarily use promotions and markdowns to clear merchandise. We record an adjustment to inventory when future estimated selling price is less than cost. Our LCNRV adjustment calculation requires management to make assumptions to estimate the selling price and amount of slow-moving merchandise and broken assortments subject to markdowns, which is dependent upon factors such as historical trends with similar merchandise, inventory aging, forecasted consumer demand, and the promotional environment. In addition, we estimate and accrue shortage for the period between the last physical count and the balance sheet date. Our shortage estimate can be affected by changes in merchandise mix and changes in actual shortage trends. Historically, actual shortage has not differed materially from our estimates.
We do not believe there is a reasonable likelihood that there will be a material change in the future estimates or assumptions we use to calculate our LCNRV or inventory shortage adjustments. However, if estimates regarding consumer demand are inaccurate or actual physical inventory shortage differs significantly from our estimate, our operating results could be affected. We have not made any material changes in the accounting methodology used to calculate our LCNRV or inventory shortage adjustments in the past three fiscal years.
Impairment of Long-Lived Assets, Goodwill, and Intangible Assets
We review the carrying amount of long-lived assets for impairment whenever events or changes in circumstances indicate that the carrying amount of an asset or asset group may not be recoverable. Events that result in an impairment review include a significant decrease in the operating performance of the long-lived asset, or the decision to close a store, corporate facility, or distribution center. Long-lived assets are considered impaired if the carrying amount exceeds the estimated undiscounted future cash flows of the asset or asset group. For impaired assets, we recognize a loss equal to the difference between the carrying amount of the asset or asset group and its estimated fair value. The estimated fair value of the asset or asset group is based on estimated discounted future cash flows of the asset or asset group using a discount rate commensurate with the related risk. The asset group is defined as the lowest level for which identifiable cash flows are available and largely independent of the cash flows of other groups of assets. The asset group for our retail stores is reviewed for impairment primarily at the store level. Our estimate of future cash flows requires management to make assumptions and to apply judgment, including forecasting future sales and expenses and estimating useful lives of the assets. These estimates can be affected by factors such as future store results, real estate demand, store closure plans, and economic conditions that can be difficult to predict. We have not made any material changes in the methodology to assess and calculate impairment of long-lived assets in the past three fiscal years. We recorded a charge for the impairment of long-lived assets of
$14 million
,
$28 million
, and
$107 million
for
fiscal 2018
,
2017
, and
2016
, respectively, related to store assets, which is recorded in operating expenses on the Consolidated Statements of Income.
We also review the carrying amount of goodwill and other indefinite-lived intangible assets for impairment annually in the fourth quarter of the fiscal year and whenever events or changes in circumstances indicate that it is more likely than not that the carrying amount may not be recoverable. Events that result in an impairment review include significant changes in the business climate, declines in our operating results, or an expectation that the carrying amount may not be recoverable.
31
We adopted ASU No. 2017-04, Intangibles—Goodwill and Other: Simplifying the Test for Goodwill Impairment in the first quarter of fiscal 2017. The amendments simplify the subsequent measurement of goodwill impairment by eliminating the requirement to calculate the implied fair value of goodwill to measure a goodwill impairment charge. Under the ASU, the impairment test is simply the comparison of the fair value of a reporting unit with its carrying amount, with the impairment charge being the deficit in fair value but not exceeding the total amount of goodwill allocated to that reporting unit. The simplified one-step impairment test applies to all reporting units (including those with zero or negative carrying amounts).
In connection with the acquisitions of Athleta in September 2008 and Intermix in December 2012, we recorded $99 million and
$81 million
of goodwill, respectively. Goodwill is reviewed for impairment using the applicable reporting unit, which is an operating segment or a business unit one level below that operating segment for which discrete financial information is prepared and regularly reviewed by segment management. We have deemed Athleta and Intermix to be the reporting units at which goodwill is tested for Athleta and Intermix, respectively.
We assess whether events or circumstances indicate that goodwill is impaired every quarter, and evaluate goodwill impairment annually in the fourth quarter of the fiscal year. During the fourth quarter of
fiscal 2018
, we completed our annual impairment test of goodwill, and we did not recognize any impairment charges.
We did not recognize any impairment charges for goodwill in fiscal 2017.
In fiscal 2016, the Company performed the goodwill impairment test under the previous Accounting Standards Codification No. 350, Intangibles - Goodwill and Other, as the annual impairment test was performed prior to January 1, 2017. At the end of each of the first three quarters of fiscal 2016, given the information available at the time of those assessments, we determined that there were no events or circumstances that indicated any impairment for goodwill related to Intermix. During the fourth quarter of fiscal 2016, management updated the fiscal 2017 budget and financial projections beyond fiscal 2017 for Intermix. There were several factors that caused the financial projections and estimates to significantly decrease from the previous estimates, which included: poor fourth quarter of fiscal 2016 holiday performance at Intermix stores, the decision to reduce expected future store openings, the approval of additional store closures in fiscal 2017, and the budgeting of additional headcount required to support increased focus on the online business. These factors arising during the fourth quarter of fiscal 2016 had a significant and negative impact on the estimated fair value of the Intermix reporting unit, and we determined that the Intermix reporting unit’s carrying value exceeded its fair value as of the date of our annual impairment review. As such, we performed the second step of the goodwill impairment test which resulted in an impairment charge of
$71 million
for goodwill related to Intermix in fiscal 2016. This impairment charge reduced the
$81 million
of purchase price allocated to goodwill in connection with the acquisition of Intermix in December 2012 to
$10 million
as of January 28, 2017.
As of
February 2, 2019
, the aggregate carrying value of trade names was $92 million, which consisted of
$54 million
and
$38 million
related to Athleta and Intermix, respectively. A trade name is considered impaired if the carrying amount exceeds its estimated fair value. If a trade name is considered impaired, we recognize a loss equal to the difference between the carrying amount and the estimated fair value of the trade name. The fair value of the trade names is determined using the relief from royalty method. During the fourth quarter of
fiscal 2018
, we completed our annual impairment review of the trade names, and we did not recognize any impairment charges.
These analyses require management to make assumptions and to apply judgment, including forecasting future sales and expenses, and selecting appropriate discount rates and royalty rates, which can be affected by economic conditions and other factors that can be difficult to predict.
If actual store and online results and brand performance, real estate market conditions, and economic conditions including interest rates are not consistent with our estimates and assumptions used in our calculations, we may be exposed to additional impairment losses that could be material.
32
Revenue Recognition and Deferred Revenue
The Company’s revenues include merchandise sales at stores, online, and through franchise agreements. We also receive revenue sharing from our credit card agreement for private label and co-branded credit cards, and breakage revenue related to our gift cards, credit vouchers, and outstanding loyalty points, which are realized based upon historical redemption patterns. For online sales and catalog sales, the Company has elected to treat shipping and handling as fulfillment activities and not a separate performance obligation. Accordingly, we recognize revenue for our single performance obligation related to online sales and catalog sales at the time control of the merchandise passes to the customer, which is generally at the time of shipment. We also record an allowance for estimated returns based on our historical return patterns and various other assumptions that management believes to be reasonable, which is presented on a gross basis on our Consolidated Balance Sheet. Revenues are presented net of any taxes collected from customers and remitted to governmental authorities.
In addition, we defer revenue when cash payments are received in advance of performance for unsatisfied obligations related to our gift cards, credit vouchers, outstanding loyalty points, and reimbursements of loyalty program discounts associated with our credit card agreement. For fiscal 2018, the opening balance of deferred revenue for these obligations was
$232 million
, of which
$200 million
was recognized as revenue during the period. The closing balance of deferred revenue related to gift cards, credit vouchers, outstanding loyalty points, and reimbursements of loyalty program discounts was
$227 million
as of
February 2, 2019
.
See Note 1 of Notes to Consolidated Financial Statements included in Item 8, Financial Statements and Supplementary Data, of this Form 10-K for recent accounting pronouncements related to revenue recognition.
Income Taxes
We record a valuation allowance against our deferred tax assets when it is more likely than not that some portion or all of such deferred tax assets will not be realized. In determining the need for a valuation allowance, management is required to make assumptions and to apply judgment, including forecasting future income, taxable income, and the geographic mix of income or losses in the jurisdictions in which we operate. Our effective tax rate in a given financial statement period may also be materially impacted by changes in the geographic mix and level of income or losses, changes in the expected outcome of audits, changes in the deferred tax valuation allowance, guidance related to the enactment of U.S. Tax Cuts and Jobs Act of 2017 (“TCJA”) that is issued by the U.S. Treasury Department and Internal Revenue Service (“IRS”) or new tax legislation.
At any point in time, many tax years are subject to or in the process of being audited by various taxing authorities. To the extent our estimates of settlements change or the final tax outcome of these matters is different from the amounts recorded, such differences will impact the income tax provision in the period in which such determinations are made. Our income tax expense includes changes in our estimated liability for exposures associated with our various tax filing positions. Determining the income tax expense for these potential assessments requires management to make assumptions that are subject to factors such as proposed assessments by tax authorities, changes in facts and circumstances, issuance of new regulations, and resolution of tax audits.
We believe the judgments and estimates discussed above are reasonable. However, if actual results are not consistent with our estimates or assumptions, we may be exposed to losses or gains that could be material.
See Note 12 of Notes to Consolidated Financial Statements included in Item 8, Financial Statements and Supplementary Data, of this Form 10-K for additional information on the impact of the U.S. Tax Cuts and Jobs Act enacted on December 22, 2017 on income taxes.
Recent Accounting Pronouncements
See "Organization and Summary of Significant Accounting Policies" in
Note 1
of Notes to Consolidated Financial Statements included in Item 8, Financial Statements and Supplementary Data, of this Form 10-K for recent accounting pronouncements, including the expected dates of adoption and estimated effects on our Consolidated Financial Statements.
33
Item 7A. Quantitative and Qualitative Disclosures About Market Risk.
Derivative Financial Instruments
Certain financial information about the Company's derivative financial instruments is set forth under the heading "Derivative Financial Instruments" in
Note 7
of Notes to Consolidated Financial Statements included in Item 8, Financial Statements and Supplementary Data, of this Form 10-K.
We have performed a sensitivity analysis as of
February 2, 2019
based on a model that measures the impact of a hypothetical 10 percent adverse change in foreign currency exchange rates to U.S. dollars (with all other variables held constant) on our underlying estimated major foreign currency exposures, net of derivative financial instruments. The foreign currency exchange rates used in the model were based on the spot rates in effect as of
February 2, 2019
. The sensitivity analysis indicated that a hypothetical 10 percent adverse movement in foreign currency exchange rates would have an unfavorable impact on the underlying cash flow, net of our foreign exchange derivative financial instruments, of $27 million as of
February 2, 2019
.
Debt
Certain financial information about the Company's debt is set forth under the heading "Debt" in
Note 4
of Notes to Consolidated Financial Statements included in Item 8, Financial Statements and Supplementary Data, of this Form 10-K.
Our $1.25 billion aggregate principal amount of 5.95 percent notes due April 2021 has a fixed interest rate and is exposed to interest rate risk that is limited to changes in fair value. Changes in interest rates do not impact our cash flows.
Cash Equivalents and Short-Term Investments
Certain financial information about the Company's cash equivalents and short-term investments is set forth under the heading "Fair Value Measurements" in
Note 6
of Notes to Consolidated Financial Statements included in Item 8, Financial Statements and Supplementary Data, of this Form 10-K.
We have highly liquid fixed and variable income investments classified as cash and cash equivalents and short-term investments. All highly liquid investments with original maturities of three months or less at the time of purchase are classified as cash and cash equivalents. Our cash equivalents are placed primarily in time deposits, money market funds, and commercial paper. We generally value these investments at their original purchase prices plus interest that has accrued at the stated rate. We also have highly liquid investments with original maturities of greater than three months and less than two years that are classified as short-term investments. These securities are recorded at fair value using market prices.
Changes in interest rates impact the fair value of our investments that are considered available-for-sale. As of
February 2, 2019
, the Company held $
288 million
of available-for-sale debt securities with original maturity dates greater than three months and less than two years within short-term investments on the Consolidated Balance Sheet. In addition, as of
February 2, 2019
, the Company held $16 million of available-for-sale debt securities with original maturities of less than three months at the time of purchase within cash and cash equivalents. Unrealized gains or losses on available-for-sale debt securities included in accumulated other comprehensive income were immaterial as of
February 2, 2019
.
Changes in interest rates also impact the interest income derived from our cash equivalents and short-term investments. In
fiscal 2018
, we earned interest income of
$33 million
.
34
Item 8. Financial Statements and Supplementary Data.
THE GAP, INC.
INDEX TO CONSOLIDATED FINANCIAL STATEMENTS
|
|
Page
|
35
Report of Independent Registered Public Accounting Firm
To the Shareholders and the Board of Directors of The Gap, Inc.
Opinions on the Financial Statements and Internal Control over Financial Reporting
We have audited the accompanying consolidated balance sheets of The Gap, Inc. and subsidiaries (the “Company”) as of
February 2, 2019
and
February 3, 2018
, the related consolidated statements of income, comprehensive income, stockholders’ equity, and cash flows, for each of the fiscal years ended
February 2, 2019
,
February 3, 2018
and
January 28, 2017
, and the related notes (collectively referred to as the “financial statements”). We also have audited the Company's internal control over financial reporting as of
February 2, 2019
, based on criteria established in
Internal Control - Integrated Framework (2013)
issued by the Committee of Sponsoring Organizations of the Treadway Commission (COSO).
In our opinion, the financial statements referred to above present fairly, in all material respects, the financial position of the Company as of
February 2, 2019
and
February 3, 2018
, and the results of its operations and its cash flows for each of the fiscal years ended
February 2, 2019
,
February 3, 2018
and
January 28, 2017
, in conformity with accounting principles generally accepted in the United States of America. Also, in our opinion, the Company maintained, in all material respects, effective internal control over financial reporting as of
February 2, 2019
, based on Internal Control - Integrated Framework (2013) issued by COSO.
Basis for Opinions
The Company’s management is responsible for these financial statements, for maintaining effective internal control over financial reporting, and for its assessment of the effectiveness of internal control over financial reporting, included in the accompanying Management's Report on Internal Control over Financial Reporting. Our responsibility is to express an opinion on these financial statements and an opinion on the Company's internal control over financial reporting based on our audits. We are a public accounting firm registered with the Public Company Accounting Oversight Board (United States) (PCAOB) and are required to be independent with respect to the Company in accordance with the U.S. federal securities laws and the applicable rules and regulations of the Securities and Exchange Commission and the PCAOB.
We conducted our audits in accordance with the standards of the PCAOB. Those standards require that we plan and perform the audits to obtain reasonable assurance about whether the financial statements are free of material misstatement, whether due to error or fraud, and whether effective internal control over financial reporting was maintained in all material respects.
Our audits of the financial statements included performing procedures to assess the risks of material misstatement of the financial statements, whether due to error or fraud, and performing procedures to respond to those risks. Such procedures included examining, on a test basis, evidence regarding the amounts and disclosures in the financial statements. Our audits also included evaluating the accounting principles used and significant estimates made by management, as well as evaluating the overall presentation of the financial statements. Our audit of internal control over financial reporting included obtaining an understanding of internal control over financial reporting, assessing the risk that a material weakness exists, and testing and evaluating the design and operating effectiveness of internal control based on the assessed risk. Our audits also included performing such other procedures as we considered necessary in the circumstances. We believe that our audits provide a reasonable basis for our opinions.
36
Definition and Limitations of Internal Control over Financial Reporting
A company's internal control over financial reporting is a process designed to provide reasonable assurance regarding the reliability of financial reporting and the preparation of financial statements for external purposes in accordance with generally accepted accounting principles. A company's internal control over financial reporting includes those policies and procedures that (1) pertain to the maintenance of records that, in reasonable detail, accurately and fairly reflect the transactions and dispositions of the assets of the company; (2) provide reasonable assurance that transactions are recorded as necessary to permit preparation of financial statements in accordance with generally accepted accounting principles, and that receipts and expenditures of the company are being made only in accordance with authorizations of management and directors of the company; and (3) provide reasonable assurance regarding prevention or timely detection of unauthorized acquisition, use, or disposition of the company's assets that could have a material effect on the financial statements.
Because of its inherent limitations, internal control over financial reporting may not prevent or detect misstatements. Also, projections of any evaluation of effectiveness to future periods are subject to the risk that the controls may become inadequate because of changes in conditions, or that the degree of compliance with the policies or procedures may deteriorate.
/s/ Deloitte & Touche LLP
San Francisco, California
March 19, 2019
We have served as the Company’s auditor since at least 1976, in connection with its initial public offering; however, an earlier year could not be reliably determined.
37
THE GAP, INC.
CONSOLIDATED BALANCE SHEETS
|
($ and shares in millions except par value)
|
February 2,
2019 |
February 3,
2018 |
||||||
|
ASSETS
|
||||||||
|
Current assets:
|
||||||||
|
Cash and cash equivalents
|
$
|
1,081
|
|
$
|
1,783
|
|
||
|
Short-term investments
|
288
|
|
—
|
|
||||
|
Merchandise inventory
|
2,131
|
|
1,997
|
|
||||
|
Other current assets
|
751
|
|
788
|
|
||||
|
Total current assets
|
4,251
|
|
4,568
|
|
||||
|
Property and equipment, net of accumulated depreciation of $5,755 and $5,962
|
2,912
|
|
2,805
|
|
||||
|
Other long-term assets
|
886
|
|
616
|
|
||||
|
Total assets
|
$
|
8,049
|
|
$
|
7,989
|
|
||
|
LIABILITIES AND STOCKHOLDERS' EQUITY
|
||||||||
|
Current liabilities:
|
||||||||
|
Accounts payable
|
$
|
1,126
|
|
$
|
1,181
|
|
||
|
Accrued expenses and other current liabilities
|
1,024
|
|
1,270
|
|
||||
|
Income taxes payable
|
24
|
|
10
|
|
||||
|
Total current liabilities
|
2,174
|
|
2,461
|
|
||||
|
Long-term liabilities:
|
||||||||
|
Long-term debt
|
1,249
|
|
1,249
|
|
||||
|
Lease incentives and other long-term liabilities
|
1,073
|
|
1,135
|
|
||||
|
Total long-term liabilities
|
2,322
|
|
2,384
|
|
||||
|
Commitments and contingencies (see Notes 11 and 15)
|
||||||||
|
Stockholders' equity:
|
||||||||
|
Common stock $0.05 par value
|
||||||||
|
Authorized 2,300 shares for all periods presented; Issued and Outstanding 378 and 389 shares
|
19
|
|
19
|
|
||||
|
Additional paid-in capital
|
—
|
|
|
8
|
|
|||
|
Retained earnings
|
3,481
|
|
3,081
|
|
||||
|
Accumulated other comprehensive income
|
53
|
|
36
|
|
||||
|
Total stockholders' equity
|
3,553
|
|
3,144
|
|
||||
|
Total liabilities and stockholders' equity
|
$
|
8,049
|
|
$
|
7,989
|
|
||
See Accompanying Notes to Consolidated Financial Statements
38
THE GAP, INC.
CONSOLIDATED STATEMENTS OF INCOME
|
|
Fiscal Year
|
|||||||||||
|
($ and shares in millions except per share amounts)
|
2018
|
2017
|
2016
|
|||||||||
|
Net sales
|
$
|
16,580
|
|
$
|
15,855
|
|
$
|
15,516
|
|
|||
|
Cost of goods sold and occupancy expenses
|
10,258
|
|
9,789
|
|
9,876
|
|
||||||
|
Gross profit
|
6,322
|
|
6,066
|
|
5,640
|
|
||||||
|
Operating expenses
|
4,960
|
|
4,587
|
|
4,449
|
|
||||||
|
Operating income
|
1,362
|
|
1,479
|
|
1,191
|
|
||||||
|
Interest expense
|
73
|
|
74
|
|
75
|
|
||||||
|
Interest income
|
(33
|
)
|
(19
|
)
|
(8
|
)
|
||||||
|
Income before income taxes
|
1,322
|
|
1,424
|
|
1,124
|
|
||||||
|
Income taxes
|
319
|
|
576
|
|
448
|
|
||||||
|
Net income
|
$
|
1,003
|
|
$
|
848
|
|
$
|
676
|
|
|||
|
Weighted-average number of shares—basic
|
385
|
|
393
|
|
399
|
|
||||||
|
Weighted-average number of shares—diluted
|
388
|
|
396
|
|
400
|
|
||||||
|
Earnings per share—basic
|
$
|
2.61
|
|
$
|
2.16
|
|
$
|
1.69
|
|
|||
|
Earnings per share—diluted
|
$
|
2.59
|
|
$
|
2.14
|
|
$
|
1.69
|
|
|||
|
Cash dividends declared and paid per share
|
$
|
0.97
|
|
$
|
0.92
|
|
$
|
0.92
|
|
|||
See Accompanying Notes to Consolidated Financial Statements
39
THE GAP, INC.
CONSOLIDATED STATEMENTS OF COMPREHENSIVE INCOME
|
Fiscal Year
|
||||||||||||
|
($ in millions)
|
2018
|
2017
|
2016
|
|||||||||
|
Net income
|
$
|
1,003
|
|
$
|
848
|
|
$
|
676
|
|
|||
|
Other comprehensive income (loss), net of tax:
|
||||||||||||
|
Foreign currency translation
|
(17
|
)
|
35
|
|
7
|
|
||||||
|
Change in fair value of derivative financial instruments, net of tax benefit of $(4), $(9), and $(2)
|
54
|
|
(51
|
)
|
(26
|
)
|
||||||
|
Reclassification adjustments on derivative financial instruments, net of (tax) tax benefit of $6, $3, and $(11)
|
(20
|
)
|
(2
|
)
|
(12
|
)
|
||||||
|
Other comprehensive income (loss), net of tax
|
17
|
|
(18
|
)
|
(31
|
)
|
||||||
|
Comprehensive income
|
$
|
1,020
|
|
$
|
830
|
|
$
|
645
|
|
|||
See Accompanying Notes to Consolidated Financial Statements
40
THE GAP, INC.
CONSOLIDATED STATEMENTS OF STOCKHOLDERS’ EQUITY
|
|
Common Stock
|
Additional
Paid-in Capital |
Retained
Earnings |
Accumulated
Other Comprehensive Income |
|
||||||||||||||||||
|
($ and shares in millions except per share amounts)
|
Shares
|
Amount
|
Total
|
||||||||||||||||||||
|
Balance as of January 30, 2016
|
397
|
|
$
|
20
|
|
$
|
—
|
|
$
|
2,440
|
|
$
|
85
|
|
$
|
2,545
|
|
||||||
|
Net income
|
676
|
|
676
|
|
|||||||||||||||||||
|
Other comprehensive loss, net of tax
|
(31
|
)
|
(31
|
)
|
|||||||||||||||||||
|
Issuance of common stock related to stock options and employee stock purchase plans
|
1
|
|
—
|
|
29
|
|
29
|
|
|||||||||||||||
|
Issuance of common stock and withholding tax payments related to vesting of stock units
|
1
|
|
—
|
|
(19
|
)
|
(19
|
)
|
|||||||||||||||
|
Tax benefit from exercise of stock options and vesting of stock units
|
|
|
|
|
(4
|
)
|
|
|
(4
|
)
|
|||||||||||||
|
Share-based compensation, net of estimated forfeitures
|
75
|
|
75
|
|
|||||||||||||||||||
|
Common stock dividends ($0.92 per share)
|
|
|
(367
|
)
|
(367
|
)
|
|||||||||||||||||
|
Balance as of January 28, 2017
|
399
|
|
20
|
|
81
|
|
2,749
|
|
54
|
|
2,904
|
|
|||||||||||
|
Cumulative effect of a change in accounting principle related to share-based compensation
|
(5
|
)
|
3
|
|
(2
|
)
|
|||||||||||||||||
|
Net income
|
848
|
|
848
|
|
|||||||||||||||||||
|
Other comprehensive loss, net of tax
|
|
|
(18
|
)
|
(18
|
)
|
|||||||||||||||||
|
Repurchases and retirement of common stock
|
(13
|
)
|
(1
|
)
|
(156
|
)
|
(158
|
)
|
(315
|
)
|
|||||||||||||
|
Issuance of common stock related to stock options and employee stock purchase plans
|
2
|
|
—
|
|
30
|
|
30
|
|
|||||||||||||||
|
Issuance of common stock and withholding tax payments related to vesting of stock units
|
1
|
|
—
|
|
(18
|
)
|
(18
|
)
|
|||||||||||||||
|
Share-based compensation, net of forfeitures
|
76
|
|
76
|
|
|||||||||||||||||||
|
Common stock dividends ($0.92 per share)
|
(361
|
)
|
(361
|
)
|
|||||||||||||||||||
|
Balance as of February 3, 2018
|
389
|
|
19
|
|
8
|
|
3,081
|
|
36
|
|
3,144
|
|
|||||||||||
|
Cumulative effect of a change in accounting principle related to revenue recognition
|
|
|
|
|
—
|
|
36
|
|
|
|
36
|
|
|||||||||||
|
Net income
|
1,003
|
|
1,003
|
|
|||||||||||||||||||
|
Other comprehensive loss, net of tax
|
17
|
|
17
|
|
|||||||||||||||||||
|
Repurchases and retirement of common stock
|
(14
|
)
|
—
|
|
(132
|
)
|
(266
|
)
|
(398
|
)
|
|||||||||||||
|
Issuance of common stock related to stock options and employee stock purchase plans
|
2
|
|
—
|
|
46
|
|
46
|
|
|||||||||||||||
|
Issuance of common stock and withholding tax payments related to vesting of stock units
|
1
|
|
—
|
|
(23
|
)
|
(23
|
)
|
|||||||||||||||
|
Share-based compensation, net of forfeitures
|
101
|
|
101
|
|
|||||||||||||||||||
|
Common stock dividends ($0.97 per share)
|
(373
|
)
|
(373
|
)
|
|||||||||||||||||||
|
Balance as of February 2, 2019
|
378
|
|
$
|
19
|
|
$
|
—
|
|
$
|
3,481
|
|
$
|
53
|
|
$
|
3,553
|
|
||||||
See Accompanying Notes to Consolidated Financial Statements
41
THE GAP, INC.
CONSOLIDATED STATEMENTS OF CASH FLOWS
|
|
Fiscal Year
|
|||||||||||
|
($ in millions)
|
2018
|
2017
|
2016
|
|||||||||
|
Cash flows from operating activities:
|
||||||||||||
|
Net income
|
$
|
1,003
|
|
$
|
848
|
|
$
|
676
|
|
|||
|
Adjustments to reconcile net income to net cash provided by operating activities:
|
||||||||||||
|
Depreciation and amortization
|
578
|
|
559
|
|
593
|
|
||||||
|
Amortization of lease incentives
|
(61
|
)
|
(60
|
)
|
(62
|
)
|
||||||
|
Share-based compensation
|
91
|
|
87
|
|
76
|
|
||||||
|
Tax benefit from exercise of stock options and vesting of stock units
|
—
|
|
—
|
|
(4
|
)
|
||||||
|
Excess tax benefit from exercise of stock options and vesting of stock units
|
—
|
|
—
|
|
(1
|
)
|
||||||
|
Store asset impairment charges
|
14
|
|
28
|
|
107
|
|
||||||
|
Goodwill impairment charge
|
—
|
|
—
|
|
71
|
|
||||||
|
Non-cash and other items
|
(6
|
)
|
19
|
|
(4
|
)
|
||||||
|
Deferred income taxes
|
65
|
|
61
|
|
(54
|
)
|
||||||
|
Changes in operating assets and liabilities:
|
||||||||||||
|
Merchandise inventory
|
(154
|
)
|
(142
|
)
|
46
|
|
||||||
|
Other current assets and other long-term assets
|
(18
|
)
|
33
|
|
54
|
|
||||||
|
Accounts payable
|
(78
|
)
|
(90
|
)
|
146
|
|
||||||
|
Accrued expenses and other current liabilities
|
(196
|
)
|
34
|
|
76
|
|
||||||
|
Income taxes payable, net of prepaid and other tax-related items
|
113
|
|
(52
|
)
|
19
|
|
||||||
|
Lease incentives and other long-term liabilities
|
30
|
|
55
|
|
(20
|
)
|
||||||
|
Net cash provided by operating activities
|
1,381
|
|
1,380
|
|
1,719
|
|
||||||
|
Cash flows from investing activities:
|
||||||||||||
|
Purchases of property and equipment
|
(705
|
)
|
(731
|
)
|
(524
|
)
|
||||||
|
Purchases of short-term investments
|
(464
|
)
|
—
|
|
—
|
|
||||||
|
Sales and maturities of short-term investments
|
177
|
|
—
|
|
—
|
|
||||||
|
Insurance proceeds related to loss on property and equipment
|
—
|
|
66
|
|
—
|
|
||||||
|
Other
|
(9
|
)
|
(1
|
)
|
(5
|
)
|
||||||
|
Net cash used for investing activities
|
(1,001
|
)
|
(666
|
)
|
(529
|
)
|
||||||
|
Cash flows from financing activities:
|
||||||||||||
|
Payments of debt
|
—
|
|
(67
|
)
|
(421
|
)
|
||||||
|
Proceeds from issuances under share-based compensation plans
|
46
|
|
30
|
|
29
|
|
||||||
|
Withholding tax payments related to vesting of stock units
|
(23
|
)
|
(18
|
)
|
(19
|
)
|
||||||
|
Repurchases of common stock
|
(398
|
)
|
(315
|
)
|
—
|
|
||||||
|
Excess tax benefit from exercise of stock options and vesting of stock units
|
—
|
|
—
|
|
1
|
|
||||||
|
Cash dividends paid
|
(373
|
)
|
(361
|
)
|
(367
|
)
|
||||||
|
Other
|
(1
|
)
|
—
|
|
—
|
|
||||||
|
Net cash used for financing activities
|
(749
|
)
|
(731
|
)
|
(777
|
)
|
||||||
|
Effect of foreign exchange rate fluctuations on cash, cash equivalents, and restricted cash
|
(10
|
)
|
19
|
|
—
|
|
||||||
|
Net increase (decrease) in cash, cash equivalents, and restricted cash
|
(379
|
)
|
2
|
|
413
|
|
||||||
|
Cash, cash equivalents, and restricted cash at beginning of period
|
1,799
|
|
1,797
|
|
1,384
|
|
||||||
|
Cash, cash equivalents, and restricted cash at end of period
|
$
|
1,420
|
|
$
|
1,799
|
|
$
|
1,797
|
|
|||
|
Non-cash investing activities:
|
||||||||||||
|
Purchases of property and equipment not yet paid at end of period
|
$
|
93
|
|
$
|
77
|
|
$
|
56
|
|
|||
|
Supplemental disclosure of cash flow information:
|
||||||||||||
|
Cash paid for interest during the period
|
$
|
76
|
|
$
|
76
|
|
$
|
82
|
|
|||
|
Cash paid for income taxes during the period, net of refunds
|
$
|
143
|
|
$
|
570
|
|
$
|
488
|
|
|||
See Accompanying Notes to Consolidated Financial Statements
42
Notes to Consolidated Financial Statements
For the Fiscal Years Ended
February 2, 2019
,
February 3, 2018
, and
January 28, 2017
Note 1
. Organization and Summary of Significant Accounting Policies
Organization
The Gap, Inc., a Delaware corporation, is a global omni-channel retailer offering apparel, accessories, and personal care products for men, women, and children under the Old Navy, Gap, Banana Republic, Athleta, Intermix, and Hill City brands. We have Company-operated stores in the United States, Canada, the United Kingdom, France, Ireland, Japan, Italy, China, Hong Kong, Taiwan, and Mexico. We also have franchise agreements with unaffiliated franchisees to operate Old Navy, Gap, and Banana Republic stores in approximately 34 other countries around the world. In addition, our products are available to customers online through Company-owned websites and through the use of third parties that provide logistics and fulfillment services.
Principles of Consolidation
The Consolidated Financial Statements include the accounts of The Gap, Inc. and its subsidiaries. All intercompany transactions and balances have been eliminated.
Fiscal Year and Presentation
Our fiscal year is a 52-week or 53-week period ending on the Saturday closest to January 31. The fiscal years ended
February 2, 2019
(
fiscal 2018
) and
January 28, 2017
(
fiscal 2016
) consisted of 52 weeks. The fiscal year ended
February 3, 2018
(
fiscal 2017
) consisted of 53 weeks.
Use of Estimates
The preparation of financial statements in conformity with U.S. GAAP requires management to make estimates and assumptions that affect the reported amounts of assets and liabilities and disclosure of contingent assets and liabilities at the date of the financial statements and the reported amounts of revenue and expenses during the reporting period. Actual results could differ from those estimates.
Cash, Cash Equivalents and Short-Term Investments
Cash includes funds deposited in banks and amounts in transit from banks for customer credit card and debit card transactions that process in less than seven days.
All highly liquid investments with original maturities of three months or less at the time of purchase are classified as cash equivalents. Our cash equivalents are placed primarily in time deposits and money market funds. With the exception of our available-for-sale investments noted below, we value these investments at their original purchase prices plus interest that has accrued at the stated rate. Income related to these securities is recorded in interest income on the Consolidated Statements of Income.
Highly liquid investments with original maturities of greater than three months and less than two years are classified as short-term investments. These investments are classified as available-for-sale and are recorded at fair value using market prices.
Changes in the fair value of available-for-sale investments impact net income only when such securities are sold or an other-than-temporary impairment is recognized. Income related to these investments is recorded in interest income on the Consolidated Statements of Income.
Merchandise Inventory
We value inventory at the lower of cost or net realizable value, with cost determined using the weighted-average cost method. We record an adjustment when future estimated selling price is less than cost. We review our inventory levels in order to identify slow-moving merchandise and broken assortments (items no longer in stock in a sufficient range of sizes or colors) and use promotions and markdowns to clear merchandise. In addition, we estimate and accrue shortage for the period between the last physical count and the balance sheet date.
43
Derivative Financial Instruments
Derivative financial instruments are recorded at fair value on the Consolidated Balance Sheets as other current assets, other long-term assets, accrued expenses and other current liabilities, or lease incentives and other long-term liabilities.
For derivative financial instruments that are designated and qualify as cash flow hedges, the effective portion of the gain or loss on the derivative financial instruments is reported as a component of other comprehensive income (“OCI”) and is recognized in income in the period in which the underlying transaction impacts the income statement. For derivative financial instruments that are designated and qualify as net investment hedges, the effective portion of the gain or loss on the derivative financial instruments is reported as a component of OCI and is reclassified into income in the period or periods during which the hedged subsidiary is either sold or liquidated (or substantially liquidated). Gains and losses on the derivative financial instruments representing either hedge ineffectiveness or hedge components excluded from the assessment of effectiveness, if any, are recognized in current income. For derivative financial instruments not designated as hedging instruments, the gain or loss on the derivative financial instruments is recorded in operating expenses on the Consolidated Statements of Income. Cash flows from derivative financial instruments are classified as cash flows from operating activities on the Consolidated Statements of Cash Flows.
Property and Equipment
Depreciation is computed using the straight-line method over the estimated useful lives of the related assets. Estimated useful lives are as follows:
|
Category
|
|
Term
|
|
Leasehold improvements
|
|
Shorter of remaining lease term or economic life, up to 15 years
|
|
Furniture and equipment
|
|
Up to 10 years
|
|
Software
|
|
3 to 7 years
|
|
Buildings and building improvements
|
|
Up to 39 years
|
When assets are sold or retired, the cost and related accumulated depreciation are removed from the accounts, with any resulting gain or loss recorded in operating expenses on the Consolidated Statements of Income. Costs of maintenance and repairs are expensed as incurred.
Asset Retirement Obligations
An asset retirement obligation represents a legal obligation associated with the retirement of a tangible long-lived asset that is incurred upon the acquisition, construction, development, or normal operation of that long-lived asset. The Company’s asset retirement obligations are primarily associated with leasehold improvements that we are contractually obligated to remove at the end of a lease to comply with the lease agreement. We recognize asset retirement obligations at the inception of a lease with such conditions if a reasonable estimate of fair value can be made. Asset retirement obligations are recorded in accrued expenses and other current liabilities and lease incentives and other long-term liabilities on the Consolidated Balance Sheets and are subsequently adjusted for changes in estimated asset retirement obligations. The associated estimated asset retirement costs are capitalized as part of the carrying amount of the long-lived asset and depreciated over its useful life.
44
Revenue Recognition
The Company’s revenues include merchandise sales at stores, online, and through franchise agreements. We also receive revenue sharing from our credit card agreement for private label and co-branded credit cards, and breakage revenue related to our gift cards, credit vouchers, and outstanding loyalty points, which are realized based upon historical redemption patterns. For online sales and catalog sales, the Company has elected to treat shipping and handling as fulfillment activities and not a separate performance obligation. Accordingly, we recognize revenue for our single performance obligation related to online sales and catalog sales at the time control of the merchandise passes to the customer, which is generally at the time of shipment. We also record an allowance for estimated returns based on our historical return patterns and various other assumptions that management believes to be reasonable, which is presented on a gross basis on our Consolidated Balance Sheet. Revenues are presented net of any taxes collected from customers and remitted to governmental authorities.
We have credit card agreements with third parties to provide our customers with private label credit cards and co-branded credit cards (collectively, the “Credit Card programs"). Each private label credit card bears the logo of Old Navy, Gap, Banana Republic, or Athleta and can be used at any of our U.S. or Canadian store locations and online. The co-branded credit card is a VISA credit card bearing the logo of Old Navy, Gap, Banana Republic, or Athleta and can be used everywhere VISA credit cards are accepted. The Credit Card programs offer incentives to cardholders in the form of reward certificates upon the cumulative purchase of an established amount.
Synchrony Financial ("Synchrony"), a third-party financing company, is the sole owner of the accounts and underwrites the credit issued under the Credit Card programs. Our agreement with Synchrony provides for certain payments to be made to us, including a share of revenue from the performance of the credit card portfolios and reimbursements of loyalty program discounts. We have identified separate performance obligations related to our credit card agreement that includes both providing a license and an obligation to redeem loyalty points issued under the loyalty rewards program. Our obligation to provide a license is satisfied when the subsequent sale or usage occurs and our obligation to redeem loyalty points is deferred until those loyalty points are redeemed.
Prior to fiscal 2018, income received related to our Credit Card programs was recorded within operating expenses and cost of goods sold and occupancy expenses. With the adoption of ASC 606, income related to our Credit Card programs is now classified within net sales on our Consolidated Statement of Income.
We also have franchise agreements with unaffiliated franchisees to operate Gap, Banana Republic, and Old Navy stores in a number of countries throughout Asia, Europe, Latin America, the Middle East, and Africa. Under these agreements, third parties operate, or will operate, stores that sell apparel and related products under our brand names. We have identified separate performance obligations related to our franchise agreements that include both providing our franchise partners with a license and an obligation to supply franchise partners with our merchandise. Our obligation to provide a license is satisfied when the subsequent sale or usage occurs and our obligation to supply franchise partners with our merchandise is satisfied when control transfers.
Classification of Expenses
Cost of goods sold and occupancy expenses include the following:
|
•
|
the cost of merchandise;
|
|
•
|
inventory shortage and valuation adjustments;
|
|
•
|
freight charges;
|
|
•
|
online shipping and packaging costs;
|
|
•
|
costs associated with our sourcing operations, including payroll, benefits, and other administrative expenses;
|
|
•
|
gains and losses associated with foreign currency derivative contracts related to hedging of merchandise purchases and intercompany revenue transactions; and
|
|
•
|
rent, occupancy, depreciation, and amortization related to our store operations, distribution centers, and certain corporate functions.
|
45
Operating expenses include the following:
|
•
|
payroll, benefits, and other administrative expenses for our store operations and field management;
|
|
•
|
payroll, benefits, and other administrative expenses for our distribution centers;
|
|
•
|
payroll, benefits, and other administrative expenses for our corporate functions, including product design and development;
|
|
•
|
marketing;
|
|
•
|
information technology maintenance costs and expenses;
|
|
•
|
rent, occupancy, depreciation, and amortization for our corporate facilities;
|
|
•
|
research and development expenses;
|
|
•
|
third party credit card processing fees; and
|
|
•
|
other expenses (income).
|
Payroll, benefits, and other administrative expenses for our distribution centers recorded in operating expenses were
$316 million
,
$297 million
, and
$254 million
in
fiscal 2018
,
2017
, and
2016
, respectively. Research and development costs described in Accounting Standards Codification No. 730 are expensed as incurred. These costs include expenditures for new or innovative products and technological improvements for existing products and process innovation, which primarily consist of payroll and related benefits attributable to time spent on research and development activities. Research and development expenses recorded in operating expenses under ASC 730 were $
50 million
, $
51 million
, and $
46 million
in
fiscal 2018
,
2017
, and
2016
, respectively.
The classification of expenses varies across the apparel retail industry. Accordingly, our cost of goods sold and occupancy expenses and operating expenses may not be comparable to those of other companies.
Rent Expense
Minimum rent expense is recognized over the term of the lease, starting when possession of the property is taken from the landlord, which normally includes a construction period prior to the store opening. When a lease contains a predetermined fixed escalation of the minimum rent, we recognize the related rent expense on a straight-line basis and record the difference between the recognized rent expense and the amounts payable under the lease as a short-term or long-term deferred rent liability. We also receive tenant allowances upon entering into certain leases, which are recorded as a short-term or long-term tenant allowance liability and amortized using the straight-line method as a reduction to rent expense over the term of the lease. Costs related to common area maintenance, insurance, real estate taxes, and other occupancy costs the Company is obligated to pay are excluded from minimum rent expense.
Certain leases provide for contingent rents that are not measurable at inception. These contingent rents are primarily based on a percentage of sales that are in excess of a predetermined level and/or rent increase based on a change in the consumer price index or fair market value. These amounts are excluded from minimum rent and are included in the determination of rent expense when it is probable that the expense has been incurred and the amount can be reasonably estimated.
46
Impairment of Long-Lived Assets
We review the carrying amount of long-lived assets for impairment whenever events or changes in circumstances indicate that the carrying amount of an asset may not be recoverable. Events that result in an impairment review include a significant decrease in the operating performance of the long-lived asset, or the decision to close a store, corporate facility, or distribution center. Long-lived assets are considered impaired if the carrying amount exceeds the estimated undiscounted future cash flows of the asset or asset group. For impaired assets, we recognize a loss equal to the difference between the carrying amount of the asset or asset group and its estimated fair value, which is recorded in operating expenses on the Consolidated Statements of Income. The estimated fair value of the asset or asset group is based on discounted future cash flows of the asset or asset group using a discount rate commensurate with the related risk. The asset group is defined as the lowest level for which identifiable cash flows are available and largely independent of the cash flows of other groups of assets, which for our retail stores is primarily at the store level.
Goodwill and Intangible Assets
We review the carrying amount of goodwill and other indefinite-lived intangible assets for impairment annually in the fourth quarter of the fiscal year and whenever events or changes in circumstances indicate that the carrying amount may not be recoverable. Events that result in an impairment review include significant changes in the business climate, declines in our operating results, or an expectation that the carrying amount may not be recoverable. We assess potential impairment by considering present economic conditions as well as future expectations.
We adopted ASU No. 2017-04, Intangibles - Goodwill and Other: Simplifying the Test for Goodwill Impairment in the first quarter of fiscal 2017. The amendments simplify the subsequent measurement of goodwill impairment by eliminating the requirement to calculate the implied fair value of goodwill to measure a goodwill impairment charge. Under the ASU, the impairment test is simply the comparison of the fair value of a reporting unit with its carrying amount, with the impairment charge being the deficit in fair value but not exceeding the total amount of goodwill allocated to that reporting unit. The simplified one-step impairment test applies to all reporting units (including those with zero or negative carrying amounts).
In fiscal 2016, the Company performed the goodwill impairment test under the previous Accounting Standards Codification No. 350 Intangibles - Goodwill and Other as the annual impairment test was performed prior to January 1, 2017. Under the previous guidance, we reviewed goodwill for impairment by first assessing qualitative factors to determine whether it was more likely than not that the fair value of the reporting unit was less than its carrying amount, including goodwill, as a basis for determining whether it was necessary to perform the two-step goodwill impairment test. If it was determined that it was more likely than not that the fair value of the reporting unit was less than its carrying amount, the two-step test was performed to identify potential goodwill impairment. If it was determined that it was not more likely than not that the fair value of the reporting unit was less than its carrying amount, it was unnecessary to perform the two-step goodwill impairment test. Based on certain circumstances, we elected to bypass the qualitative assessment and proceeded directly to performing the first step of the two-step goodwill impairment test. The first step of the two-step goodwill impairment test compared the fair value of the reporting unit to its carrying amount, including goodwill. The second step included hypothetically valuing all of the assets and liabilities of the reporting unit as if the reporting unit had been acquired in a business combination. Then, the implied fair value of the reporting unit’s goodwill was compared to the carrying amount of that goodwill. If the carrying amount of the reporting unit’s goodwill exceeded the implied fair value of the goodwill, we recognized an impairment loss in an amount equal to the excess, not to exceed the carrying amount.
A reporting unit is an operating segment or a business unit one level below that operating segment, for which discrete financial information is prepared and regularly reviewed by segment management. The Company's reporting units that have goodwill are Athleta and Intermix.
47
A trade name is considered impaired if the carrying amount exceeds its estimated fair value. If a trade name is considered impaired, we recognize a loss equal to the difference between the carrying amount and the estimated fair value of the trade name. The fair value of a trade name is determined using the relief from royalty method, which requires management to make assumptions and to apply judgment, including forecasting future sales and expenses, and selecting appropriate discount rates and royalty rates.
Goodwill and other indefinite-lived intangible assets, including the trade names, are recorded in other long-term assets on the Consolidated Balance Sheets.
Pre-Opening Costs
Pre-opening and start-up activity costs, which include rent and occupancy, supplies, advertising, and payroll expenses incurred prior to the opening of a new store or other facility, are expensed in the period in which they occur.
Advertising
Costs associated with the production of advertising, such as writing, copy, printing, and other costs, are expensed as incurred. Costs associated with communicating advertising that has been produced, such as television and magazine costs, are expensed when the advertising event takes place. Advertising expense was
$650 million
,
$673 million
, and
$601 million
in
fiscal 2018
,
2017
, and
2016
, respectively, and is recorded in operating expenses on the Consolidated Statements of Income.
Share-Based Compensation
Share-based compensation expense for stock options and other stock awards is determined based on the grant-date fair value. We use the Black-Scholes-Merton option-pricing model to determine the fair value of stock options, which requires the input of subjective assumptions regarding the expected term, expected volatility, dividend yield, and risk-free interest rate. For units granted whereby one share of common stock is issued for each unit as the unit vests (“Stock Units”), the fair value is determined based on the Company’s stock price on the date of grant less future expected dividends during the vesting period. For stock options and Stock Units, we recognize share-based compensation cost over the vesting period. With the adoption of ASU No. 2016-09 in fiscal 2017, we account for forfeitures as they occur. Share-based compensation expense is recorded primarily in operating expenses on the Consolidated Statements of Income over the period during which the employee is required to provide service in exchange for stock options and Stock Units.
Deferred Revenue
We defer revenue when cash payments are received in advance of performance for unsatisfied obligations related to our gift cards, credit vouchers, outstanding loyalty points, and reimbursements of loyalty program discounts associated with our credit card agreement. For fiscal 2018, the opening balance of deferred revenue for these obligations was
$232 million
, of which
$200 million
was recognized as revenue during the period. The closing balance of deferred revenue related to gift cards, credit vouchers, outstanding loyalty points, and reimbursements of loyalty program discounts was
$227 million
as of
February 2, 2019
. We expect that the majority of our revenue deferrals as of
February 2, 2019
will be recognized as revenue in the next 12 months as our performance obligations are satisfied. As of
February 2, 2019
, there were
no
material contract liabilities related to our franchise agreements.
Earnings per Share
Basic earnings per share is computed as net income divided by basic weighted-average number of common shares outstanding for the period. Diluted earnings per share is computed as net income divided by diluted weighted-average number of common shares outstanding for the period including common stock equivalents. Common stock equivalents consist of shares subject to share-based awards with exercise prices less than the average market price of our common stock for the period, to the extent their inclusion would be dilutive. Stock options and other stock awards that contain performance conditions are not included in the calculation of common stock equivalents until such performance conditions have been achieved.
48
Foreign Currency
Our international subsidiaries primarily use local currencies as their functional currency and translate their assets and liabilities at the current rate of exchange in effect at the balance sheet date. Revenue and expenses from their operations are translated using rates that approximate those in effect during the period in which the transactions occur. The resulting gains and losses from translation are recorded on the Consolidated Statements of Comprehensive Income and in accumulated OCI on the Consolidated Statements of Stockholders’ Equity. Transaction gains and losses resulting from intercompany balances of a long-term investment nature are also classified as accumulated OCI. Transaction gains and losses that arise from exchange rate fluctuations on transactions denominated in a currency other than the local functional currency are recorded in operating expenses on the Consolidated Statements of Income.
The aggregate transaction gains and losses recorded in operating expenses in the Consolidated Statements of Income are as follows:
|
|
Fiscal Year
|
|||||||||||
|
($ in millions)
|
2018
|
2017
|
2016
|
|||||||||
|
Foreign currency transaction gain (loss)
|
$
|
(32
|
)
|
$
|
31
|
|
$
|
(18
|
)
|
|||
|
Realized and unrealized gain (loss) from certain derivative financial instruments
|
34
|
|
(30
|
)
|
10
|
|
||||||
|
Net foreign exchange gain (loss)
|
$
|
2
|
|
$
|
1
|
|
$
|
(8
|
)
|
|||
Income Taxes
Deferred income taxes are recorded for temporary differences between the tax basis of assets and liabilities and their reported amounts on the Consolidated Financial Statements. A valuation allowance is established against deferred tax assets when it is more likely than not that some portion or all of the deferred tax assets will not be realized.
Our income tax expense includes changes in our estimated liability for exposures associated with our various tax filing positions. At any point in time, many tax years are subject to or in the process of being audited by various taxing authorities. To the extent our estimates of settlements change or the final tax outcome of these matters is different from the amounts recorded, such differences will impact the income tax provision in the period in which such determinations are made.
The Company recognizes interest related to unrecognized tax benefits in interest expense and penalties related to unrecognized tax benefits in operating expenses on the Consolidated Statements of Income.
The Company has made an accounting policy election to treat taxes due on the global intangible low-taxed income (“GILTI”) of foreign subsidiaries as a current period expense.
See
Note 12
of Notes to Consolidated Financial Statements included in
Item 8
of this Form 10-K for additional information on the impact of the U.S. Tax Cuts and Jobs Act of 2017 on income taxes.
Recent Accounting Pronouncements
Except as noted below, the Company has considered all recent accounting pronouncements and has concluded that there are no recent accounting pronouncements that may have a material impact on its Consolidated Financial Statements, based on current information.
Accounting Pronouncements Recently Adopted
Revenue from Contracts with Customers
In May 2014, the Financial Accounting Standards Board (“FASB”) issued accounting standards update (“ASU”) No. 2014-09, Revenue from Contracts with Customers, to clarify the principles of recognizing revenue and create common revenue recognition guidance between U.S. GAAP and International Financial Reporting Standards.
49
On February 4, 2018, we adopted ASU No. 2014-09 and related amendments (collectively “ASC 606”) using the modified retrospective transition method and recorded an increase to opening retained earnings of
$36 million
, net of tax, related primarily to breakage revenue for gift cards and credit vouchers, outstanding loyalty points, and reimbursements of loyalty program discounts. The comparative information has not been restated and continues to be reported under the accounting standards in effect for those periods.
For fiscal 2018, the impact of applying ASC 606 primarily resulted in an increase in net sales driven by a reclassification of
$443 million
for revenue sharing associated with our credit card programs and breakage revenue for gift cards and credit vouchers, which were previously recorded as a reduction to operating expenses on our Consolidated Statements of Income. Net sales for fiscal 2018 also increased by
$176 million
due to the reclassification of reimbursements of loyalty program discounts associated with our Credit Card programs, which were previously recorded as a reduction to cost of goods sold and occupancy expenses in our Consolidated Statements of Income. There were no other material impacts to the Consolidated Statements of Income resulting from the application of ASC 606 during fiscal 2018.
See Note 2 of Notes to Consolidated Financial Statements for information regarding the impact of applying ASC 606 for sales return allowance.
In addition, see
Note 16
of Notes to Consolidated Financial Statements for disaggregation of revenue by brand and by region.
Statement of Cash Flows: Restricted Cash
In November 2016, the FASB issued ASU 2016-18, Statement of Cash Flows: Restricted Cash, which amended the presentation of restricted cash within the statement of cash flows. The new guidance requires that restricted cash be added to cash and cash equivalents on the statement of cash flows. On February 4, 2018, we adopted ASU 2016-18 on a retrospective basis. The retrospective adoption increased our beginning and ending cash and cash equivalent balances within our Consolidated Statements of Cash Flows to include restricted cash balances. The adoption had no other material impacts to our Consolidated Statements of Cash Flows and had no impact on our results of operations or financial position.
Any cash that is legally restricted from use is classified as restricted cash. If the purpose of restricted cash is related to acquiring a long-term asset, liquidating a long-term liability, or is otherwise unavailable for a period longer than one year from the balance sheet date, the restricted cash is included within other long-term assets on our Consolidated Balance Sheets. Otherwise, restricted cash is included within other current assets on our Consolidated Balance Sheets.
As of February 2, 2019, restricted cash primarily includes consideration held by a third party in connection with the purchase of a building, as well as consideration that serves as collateral for our insurance obligations. The following table provides a reconciliation of cash, cash equivalents, and restricted cash reported within our Consolidated Balance Sheets to the total shown on our Consolidated Statements of Cash Flows:
|
($ in millions)
|
2018
|
2017
|
2016
|
||||||||
|
Cash and cash equivalents
|
$
|
1,081
|
|
$
|
1,783
|
|
$
|
1,783
|
|
||
|
Restricted cash included in other current assets
|
1
|
|
1
|
|
1
|
|
|||||
|
Restricted cash included in other long-term assets (a)
|
338
|
|
15
|
|
13
|
|
|||||
|
Total cash, cash equivalents, and restricted cash shown in the Consolidated Statement of Cash Flows
|
$
|
1,420
|
|
$
|
1,799
|
|
$
|
1,797
|
|
||
__________
50
|
(a)
|
Includes
$320 million
of consideration held by a third party in connection with the purchase of a building expected to be completed in fiscal 2019.
|
Recognition and Measurement of Financial Assets and Financial Liabilities
In January 2016, the FASB issued ASU 2016-01, Recognition and Measurement of Financial Assets and Financial Liabilities, that updates certain aspects of recognition, measurement, presentation, and disclosure of financial instruments. We adopted this ASU on February 4, 2018 with no material impact to our Consolidated Financial Statements.
Accounting Pronouncements Not Yet Adopted
ASU No. 2016-02, Leases
In February 2016, the FASB issued ASU No. 2016-02, Leases. Under the new guidance, lessees will be required to recognize a lease liability and a right-of-use asset for all leases at the commencement date based on the total minimum lease commitment amount including options to extend lease terms that are reasonably assured of being exercised. We will adopt ASU No. 2016-02 and related amendments (collectively "ASC 842") on February 3, 2019. The standard may be adopted by a modified retrospective method or by an optional transition method, which allows for the prospective application of the standard. We will adopt the standard using the optional transition method with a cumulative adjustment to retained earnings. In addition, we have elected to apply certain practical expedients which permit us not to reassess whether existing contracts are or contain leases, to not reassess the lease classification of any existing leases, and to not reassess initial direct costs for any existing leases. We also intend to elect the practical expedient of not separating non-lease components from lease components for new and modified leases.
We expect the adoption of ASC 842 will result in the recording of a right-of-use asset and an operating lease liability of approximately
$5.8 billion
and
$6.6 billion
, respectively, as of February 3, 2019. Most store leases have a five-year base period and include options that allow us to extend the lease term beyond the initial base period, subject to terms agreed upon at lease inception. At the beginning of the period of adoption, we will recognize a cumulative-effect adjustment in retained earnings due in part to impairment of certain right-of-use assets at the effective date. We do not expect that the adoption of ASC 842 will result in a material impact to our Consolidated Statements of Cash Flows and we are currently assessing the impact to our Consolidated Statements of Income. The implementation of the new standard will also result in changes to our accounting systems and related internal controls over financial reporting.
See
Note 11
, Leases, of the Notes to the Consolidated Financial Statements for the aggregate minimum noncancelable annual lease payments under leases in effect on
February 2, 2019
.
ASU No. 2017-12, Derivatives and Hedging: Targeted Improvements to Accounting for Hedging Activities
In August 2017, the FASB issued ASU No. 2017-12, Derivatives and Hedging: Targeted Improvements to Accounting for Hedging Activities. The amendments are intended to better align an entity’s risk management activities and financial reporting for hedging relationships through changes to the designation and measurement guidance for qualifying hedging relationships and the presentation of hedge results. We will adopt ASU 2017-12 on a prospective basis on February 3, 2019. We do not expect that the adoption will result in material impacts to our Consolidated Financial Statements.
51
ASU No. 2018-15, Customer's Accounting for Implementation Costs Incurred in a Cloud Computing Arrangement That Is a Service Contract
In August 2018, the FASB issued ASU No. 2018-15, Customer’s Accounting for Implementation Costs Incurred in a Cloud Computing Arrangement That Is a Service Contract. The ASU is intended to align the requirements for capitalization of implementation costs incurred in a cloud computing arrangement that is a service contract with the existing guidance for internal-use software. This guidance is effective beginning in fiscal 2020. The guidance provides flexibility in adoption, allowing for either retrospective adjustment or prospective adjustment for all implementation costs incurred after the date of adoption. The Company is currently evaluating the impact this guidance may have on the Consolidated Financial Statements and related disclosures.
Note 2
. Additional Financial Statement Information
Cash and Cash Equivalents
Cash and cash equivalents consist of the following:
|
($ in millions)
|
February 2,
2019 |
February 3,
2018 |
||||||
|
Cash (1)
|
$
|
708
|
|
$
|
1,256
|
|
||
|
Bank certificates of deposit and time deposits
|
341
|
|
490
|
|
||||
|
Money market funds
|
26
|
|
37
|
|
||||
|
Domestic commercial paper
|
6
|
|
—
|
|
||||
|
Cash and cash equivalents
|
$
|
1,081
|
|
$
|
1,783
|
|
||
|
(1)
|
Cash includes
$68 million
and
$72 million
of amounts in transit from banks for customer credit card and debit card transactions as of
February 2, 2019
and
February 3, 2018
, respectively.
|
Short-Term Investments
Short-term investments consist of the following:
|
($ in millions)
|
February 2,
2019 |
February 3,
2018 |
||||||
|
U.S. agency securities
|
$
|
22
|
|
$
|
—
|
|
||
|
Corporate securities
|
141
|
|
—
|
|
||||
|
U.S. treasury securities
|
125
|
|
—
|
|
||||
|
Short-term investments
|
$
|
288
|
|
$
|
—
|
|
||
Other Current Assets
Other current assets consist of the following:
|
($ in millions)
|
February 2,
2019 |
February 3,
2018 |
||||||
|
Accounts receivable
|
$
|
359
|
|
$
|
282
|
|
||
|
Prepaid income taxes
|
102
|
|
237
|
|
||||
|
Prepaid minimum rent and occupancy expenses
|
157
|
|
158
|
|
||||
|
Derivative financial instruments
|
20
|
|
14
|
|
||||
|
Other
|
113
|
|
97
|
|
||||
|
Other current assets
|
$
|
751
|
|
$
|
788
|
|
||
52
Property and Equipment
Property and equipment are stated at cost less accumulated depreciation and consist of the following:
|
($ in millions)
|
February 2,
2019 |
February 3,
2018 |
||||||
|
Leasehold improvements
|
$
|
3,104
|
|
$
|
3,140
|
|
||
|
Furniture and equipment
|
2,732
|
|
2,623
|
|
||||
|
Software
|
1,525
|
|
1,703
|
|
||||
|
Land, buildings, and building improvements
|
1,123
|
|
1,037
|
|
||||
|
Construction-in-progress
|
183
|
|
264
|
|
||||
|
Property and equipment, at cost
|
8,667
|
|
8,767
|
|
||||
|
Less: Accumulated depreciation
|
(5,755
|
)
|
(5,962
|
)
|
||||
|
Property and equipment, net of accumulated depreciation
|
$
|
2,912
|
|
$
|
2,805
|
|
||
Depreciation expense for property and equipment was
$575 million
,
$556 million
, and
$590 million
for
fiscal 2018
,
2017
, and
2016
, respectively.
Interest of
$10 million
,
$9 million
, and
$9 million
related to assets under construction was capitalized in
fiscal 2018
,
2017
, and
2016
, respectively.
We recorded a charge for the impairment of long-lived assets of
$14 million
,
$28 million
, and
$107 million
for
fiscal 2018
,
2017
, and
2016
, respectively, related to store assets which is recorded in operating expenses on the Consolidated Statements of Income.
Other Long-Term Assets
Other long-term assets consist of the following:
|
($ in millions)
|
February 2,
2019 |
February 3,
2018 |
||||||
|
Long-term income tax-related assets
|
$
|
151
|
|
$
|
233
|
|
||
|
Goodwill
|
109
|
|
109
|
|
||||
|
Trade names
|
92
|
|
95
|
|
||||
|
Restricted Cash (1)
|
338
|
|
15
|
|
||||
|
Other
|
196
|
|
164
|
|
||||
|
Other long-term assets
|
$
|
886
|
|
$
|
616
|
|
||
__________
|
(1)
|
Includes
$320 million
of consideration held by a third party in connection with the purchase of a building expected to be completed in fiscal 2019.
|
No
goodwill impairment charges were recorded in
fiscal 2018
or
2017
. In fiscal 2016, we recorded a charge for the impairment of goodwill related to the Intermix reporting unit of
$71 million
, which was recorded in operating expenses on the Consolidated Statement of Income. See
Note 3
of Notes to Consolidated Financial Statements for additional disclosures on goodwill and other intangible assets.
No other individual items accounted for greater than five percent of total assets as of
February 2, 2019
or
February 3, 2018
.
53
Accrued Expenses and Other Current Liabilities
Accrued expenses and other current liabilities consist of the following:
|
($ in millions)
|
February 2,
2019 |
February 3,
2018 |
||||||
|
Accrued compensation and benefits
|
$
|
254
|
|
$
|
462
|
|
||
|
Unredeemed gift cards and credit vouchers, net of breakage
|
—
|
|
247
|
|
||||
|
Deferred revenue (1)
|
227
|
|
—
|
|
||||
|
Short-term deferred rent and tenant allowances
|
101
|
|
103
|
|
||||
|
Accrued advertising
|
41
|
|
43
|
|
||||
|
Other
|
401
|
|
415
|
|
||||
|
Accrued expenses and other current liabilities
|
$
|
1,024
|
|
$
|
1,270
|
|
||
__________
|
(1)
|
Due to the adoption of ASC 606, unsatisfied obligations related to our gift cards, credit vouchers, outstanding loyalty points, and reimbursements of loyalty program discounts associated with our credit card agreement are now presented as deferred revenue. Prior period amounts have not been restated and continue to be reported under accounting standards in effect for those periods.
|
No other individual items accounted for greater than five percent of total current liabilities as of
February 2, 2019
or
February 3, 2018
.
Lease Incentives and Other Long-Term Liabilities
Lease incentives and other long-term liabilities consist of the following:
|
($ in millions)
|
February 2,
2019 |
February 3,
2018 |
||||||
|
Long-term deferred rent and tenant allowances
|
$
|
736
|
|
$
|
749
|
|
||
|
Long-term income tax-related liabilities
|
118
|
|
152
|
|
||||
|
Long-term asset retirement obligations
|
52
|
|
52
|
|
||||
|
Other
|
167
|
|
182
|
|
||||
|
Lease incentives and other long-term liabilities
|
$
|
1,073
|
|
$
|
1,135
|
|
||
The net activity related to asset retirement obligations includes adjustments to the asset retirement obligation balance and fluctuations in foreign currency exchange rates.
Sales Return Allowance
With the adoption of ASC 606, we now recognize allowances for estimated sales returns on a gross basis rather than a net basis on our Consolidated Balance Sheet. As of
February 2, 2019
, we recorded a right of return asset for merchandise we expect to receive back from customers of
$38 million
, which is recorded within other current assets on our Consolidated Balance Sheet, and a liability for refunds payable of
$78 million
, which is recorded within accrued expenses and other current liabilities on our Consolidated Balance Sheet. As of
February 2, 2019
, the net amount under the previous guidance would have been
$39 million
recorded as accrued expenses and other current liabilities on our Consolidated Balance Sheet. Accordingly, the impact of the change in accounting standard on our Consolidated Balance Sheet is an increase of
$38 million
to other current assets and an increase of
$39 million
to accrued expenses and other current liabilities.
For fiscal 2017 and fiscal 2016, the opening balances of the sales return allowance recorded in accrued expenses and other current liabilities on the Consolidated Balance Sheets were
$30 million
and
$27 million
, respectively. Additions to the allowance were
$955 million
and
$861 million
in fiscal 2017 and fiscal 2016, respectively, and deductions from the allowance were
$952 million
and
$858 million
in fiscal 2017 and fiscal 2016, respectively. The closing balances of the sales return allowance recorded in accrued expenses and other current liabilities on the Consolidated Balance Sheets were
$33 million
and
$30 million
, for fiscal 2017 and fiscal 2016, respectively.
54
Note 3
. Goodwill and Trade Names
The following goodwill and trade names are included in other long-term assets on the Consolidated Balance Sheets:
|
($ in millions)
|
February 2,
2019 |
February 3,
2018 |
||||||
|
Goodwill (1)
|
$
|
109
|
|
$
|
109
|
|
||
|
Trade names (2)
|
$
|
92
|
|
$
|
95
|
|
||
__________
|
(1)
|
Includes
$99 million
and
$10 million
related to Athleta and Intermix, respectively.
|
|
(2)
|
Includes
$54 million
and
$38 million
related to Athleta and Intermix, respectively.
|
Goodwill
We assess whether events or circumstances indicate that goodwill is impaired every quarter, and evaluate goodwill impairment annually in the fourth quarter of the fiscal year. During the fourth quarter of
fiscal 2018
and fiscal 2017, we completed our annual impairment test of goodwill and we did not recognize any impairment charges.
During the fourth quarter of fiscal 2016, we recognized an impairment charge of
$71 million
for goodwill related to the Intermix reporting unit. This impairment charge was recorded in operating expenses in the Consolidated Statement of Income and reduced the
$81 million
of purchase price allocated to goodwill in connection with the acquisition of Intermix in December 2012 to
$10 million
as of January 28, 2017.
Trade Names
During the fourth quarter of
fiscal 2018
, 2017, and 2016, we completed our annual impairment test of trade names and we did not recognize any impairment charges.
Note 4
. Debt
As of
February 2, 2019
and
February 3, 2018
, the amount recorded in long-term debt on the Consolidated Balance Sheets for our
$1.25 billion
aggregate principal amount of
5.95 percent
notes (the "Notes") due
April 2021
was
$1.25 billion
and is equal to the aggregate principal amount of the Notes, net of the unamortized discount. As of
February 2, 2019
and
February 3, 2018
, the estimated fair value of the Notes was
$1.30 billion
and
$1.33 billion
, respectively, and was based on the quoted market price of the Notes (level 1 inputs) as of the last business day of the respective fiscal year. Interest is payable
semi-annually
on April 12 and October 12 of each year, and we have an option to call the Notes in whole or in part at any time, subject to a make-whole premium. The Notes agreement is unsecured and does not contain any financial covenants.
Our
15 billion
Japanese yen,
four
-year, unsecured term loan due
January 2018
, was paid in full in June 2017. Repayments of
2.5 billion
Japanese yen were payable on January 15 of each year, and a final repayment of
7.5 billion
Japanese yen, which was due on
January 15, 2018
. Interest was payable at least
quarterly
based on an interest rate equal to the Tokyo Interbank Offered Rate plus a fixed margin.
Note 5
. Credit Facilities
We have a
$500 million
,
five
-year, unsecured revolving credit facility (the "Facility"), which was scheduled to expire in
May 2020
. On May 31, 2018, we entered into an agreement to extend the term of the Facility to
May 2023
. The Facility is available for general corporate purposes including working capital, trade letters of credit, and standby letters of credit. The Facility fees fluctuate based on our long-term senior unsecured credit ratings and our leverage ratio. If we were to draw on the Facility, interest would be a base rate (typically LIBOR) plus a margin based on our long-term senior unsecured credit ratings and our leverage ratio on the unpaid principal amount. To maintain availability of funds under the Facility, we pay a facility fee on the full facility amount, regardless of usage. As of
February 2, 2019
, there were
no
borrowings and
no
material outstanding standby letters of credit under the Facility.
55
We maintain multiple agreements with third parties that make unsecured revolving credit facilities available for our operations in foreign locations (the “Foreign Facilities”). These Foreign Facilities are uncommitted and are generally available for borrowings, overdraft borrowings, and the issuance of bank guarantees. The total capacity of the Foreign Facilities was
$57 million
as of
February 2, 2019
. As of
February 2, 2019
, there were
no
borrowings under the Foreign Facilities. There were
$16 million
in bank guarantees issued and outstanding primarily related to store leases under the Foreign Facilities as of
February 2, 2019
.
We have bilateral unsecured standby letter of credit agreements that are uncommitted and do not have expiration dates. As of
February 2, 2019
, we had
$13 million
in standby letters of credit issued under these agreements.
The Facility contains financial and other covenants including, but not limited to, limitations on liens and subsidiary debt, as well as the maintenance of two financial ratios—a minimum annual fixed charge coverage ratio of
2.00
and a maximum annual leverage ratio of
2.25
. As of
February 2, 2019
, we were in compliance with all such covenants. Violation of these covenants could result in a default under the Facility, which would permit the participating banks to terminate our ability to access the Facility for letters of credit and advances and require the immediate repayment of any outstanding advances.
Note 6
. Fair Value Measurements
The Company measures certain financial assets and liabilities at fair value on a recurring basis, including derivatives and available-for-sale debt securities. The Company categorizes financial assets and liabilities recorded at fair value based upon a three-level hierarchy that considers the related valuation techniques.
There were
no
material purchases, sales, issuances, or settlements related to recurring level 3 measurements during
fiscal 2018
or
2017
. There were
no
transfers of financial assets or liabilities into or out of level 1, level 2, and level 3 during
fiscal 2018
or
2017
.
Financial Assets and Liabilities
Financial assets and liabilities measured at fair value on a recurring basis and cash equivalents held at amortized cost are as follows:
|
|
|
Fair Value Measurements at Reporting Date Using
|
||||||||||||||
|
($ in millions)
|
February 2, 2019
|
Quoted Prices in
Active Markets for
Identical Assets
(Level 1)
|
Significant Other
Observable Inputs
(Level 2)
|
Significant
Unobservable
Inputs
(Level 3)
|
||||||||||||
|
Assets:
|
||||||||||||||||
|
Cash equivalents
|
$
|
373
|
|
$
|
26
|
|
$
|
347
|
|
$
|
—
|
|
||||
|
Short-term investments
|
288
|
|
125
|
|
163
|
|
—
|
|
||||||||
|
Derivative financial instruments
|
20
|
|
—
|
|
20
|
|
—
|
|
||||||||
|
Deferred compensation plan assets
|
48
|
|
48
|
|
—
|
|
—
|
|
||||||||
|
Other assets
|
2
|
|
—
|
|
—
|
|
2
|
|
||||||||
|
Total
|
$
|
731
|
|
$
|
199
|
|
$
|
530
|
|
$
|
2
|
|
||||
|
Liabilities:
|
||||||||||||||||
|
Derivative financial instruments
|
$
|
11
|
|
$
|
—
|
|
$
|
11
|
|
$
|
—
|
|
||||
56
|
|
|
Fair Value Measurements at Reporting Date Using
|
||||||||||||||
|
($ in millions)
|
February 3, 2018
|
Quoted Prices in
Active Markets for
Identical Assets
(Level 1)
|
Significant Other
Observable Inputs
(Level 2)
|
Significant
Unobservable
Inputs
(Level 3)
|
||||||||||||
|
Assets:
|
||||||||||||||||
|
Cash equivalents
|
$
|
527
|
|
$
|
37
|
|
$
|
490
|
|
$
|
—
|
|
||||
|
Derivative financial instruments
|
14
|
|
—
|
|
14
|
|
—
|
|
||||||||
|
Deferred compensation plan assets
|
47
|
|
47
|
|
—
|
|
—
|
|
||||||||
|
Total
|
$
|
588
|
|
$
|
84
|
|
$
|
504
|
|
$
|
—
|
|
||||
|
Liabilities:
|
||||||||||||||||
|
Derivative financial instruments
|
$
|
43
|
|
$
|
—
|
|
$
|
43
|
|
$
|
—
|
|
||||
We have highly liquid investments classified as cash equivalents, which are placed primarily in time deposits, money market funds, and commercial paper. With the exception of our available-for-sale investments noted below, we value these investments at their original purchase prices plus interest that has accrued at the stated rate.
Our available-for-sale securities are comprised of investments in debt securities. These securities are recorded at fair value using market prices. As of
February 2, 2019
, the Company held $
288 million
of available-for-sale debt securities with maturity dates greater than three months and less than two years within short-term investments on the Consolidated Balance Sheet. In addition, as of
February 2, 2019
, the Company held $
16 million
of available-for-sale debt securities with maturities of less than three months at the time of purchase within cash and cash equivalents on the Consolidated Balance Sheet. Unrealized gains or losses on available-for-sale debt securities included in accumulated other comprehensive income were immaterial for the fiscal year ended
February 2, 2019
.
The Company regularly reviews its available-for-sale securities for other-than-temporary impairment. The Company did not consider any of its securities to be other-than-temporarily impaired and, accordingly, did not recognize any impairment loss for the fiscal year ended
February 2, 2019
.
Derivative financial instruments primarily include foreign exchange forward contracts. The currencies hedged against changes in the U.S. dollar are Canadian dollars, Japanese yen, British pounds, Euro, Chinese yuan, Mexican pesos, and Taiwan dollars. The fair value of the Company’s derivative financial instruments is determined using pricing models based on current market rates. Derivative financial instruments in an asset position are recorded in other current assets or other long-term assets on the Consolidated Balance Sheets. Derivative financial instruments in a liability position are recorded in accrued expenses and other current liabilities or lease incentives and other long-term liabilities on the Consolidated Balance Sheets.
We maintain the Gap, Inc., Deferred Compensation Plan (“DCP”), which allows eligible employees and non-employee directors to defer base compensation up to a maximum percentage. Plan investments are directed by participants and are recorded at market value and designated for the DCP. The fair value of the Company’s DCP assets is determined based on quoted market prices, and the assets are recorded in other long-term assets on the Consolidated Balance Sheets.
Nonfinancial Assets
We recorded a charge for the impairment of long-lived assets of
$14 million
,
$28 million
, and
$107 million
in
fiscal 2018
,
2017
, and
2016
, respectively, related to store assets which is recorded in operating expenses on the Consolidated Statements of Income. The impairment charge reduced the then carrying amount of the applicable long-lived assets of
$15 million
,
$30 million
, and
$125 million
to their fair value of
$1 million
,
$2 million
, and
$18 million
during
fiscal 2018
,
2017
, and
2016
, respectively. The fair value of the long-lived assets was determined using level 3 inputs and the valuation techniques discussed in
Note 1
of Notes to Consolidated Financial Statements.
57
During fiscal 2016, the Company announced measures that resulted in the closure of its fleet of 53 Old Navy stores in Japan and select Banana Republic stores, primarily internationally. In fiscal 2016, we recorded a charge for the impairment of long-lived assets of
$54 million
related to the announced store closures, and an additional
$53 million
for long-lived assets that were unrelated to the announced measures.
There were
no
impairment charges recorded for other indefinite-lived intangible assets for fiscal
2018
,
2017
, or
2016
.
There were
no
impairment charges recorded for goodwill for fiscal
2018
or
2017
. In fiscal 2016, we recorded an impairment charge of
$71 million
for goodwill related to Intermix. The fair value of the Intermix reporting unit was determined using level 3 inputs and valuation techniques discussed in
Note 3
of Notes to Consolidated Financial Statements.
Note 7
. Derivative Financial Instruments
We operate in foreign countries, which exposes us to market risk associated with foreign currency exchange rate fluctuations. We use derivative financial instruments to manage our exposure to foreign currency exchange rate risk and do not enter into derivative financial contracts for trading purposes. Consistent with our risk management guidelines, we hedge a portion of our transactions related to merchandise purchases for foreign operations and certain intercompany transactions using foreign exchange forward contracts. These contracts are entered into with large, reputable financial institutions that are monitored for counterparty risk. The currencies hedged against changes in the U.S. dollar are Canadian dollars, Japanese yen, British pounds, Euro, Chinese yuan, Mexican pesos, and Taiwan dollars.
Cash Flow Hedges
We designate the following foreign exchange forward contracts as cash flow hedges: (1) forward contracts used to hedge forecasted merchandise purchases and related costs denominated in U.S. dollars made by our international subsidiaries whose functional currencies are their local currencies; (2) forward contracts used to hedge forecasted intercompany royalty payments denominated in foreign currencies received by entities whose functional currencies are U.S. dollars; and (3) forward contracts used to hedge forecasted intercompany revenue transactions related to merchandise sold from our regional purchasing entity, whose functional currency is the U.S. dollar, to certain international subsidiaries in their local currencies. The foreign exchange forward contracts entered into to hedge forecasted merchandise purchases and related costs, intercompany royalty payments, and intercompany revenue transactions generally have terms of up to 24 months.
Net Investment Hedges
We may also use foreign exchange forward contracts to hedge the net assets of international subsidiaries to offset the foreign currency translation and economic exposures related to our investment in these subsidiaries.
Other Derivatives Not Designated as Hedging Instruments
We use foreign exchange forward contracts to hedge our market risk exposure associated with foreign currency exchange rate fluctuations for certain intercompany balances denominated in currencies other than the functional currency of the entity with the intercompany balance. The gain or loss on the derivative financial instruments that represent economic hedges, as well as the remeasurement of the underlying intercompany balances, is recorded in operating expenses on the Consolidated Statements of Income in the same period and generally offset.
58
Outstanding Notional Amounts
As of
February 2, 2019
and
February 3, 2018
, we had foreign exchange forward contracts outstanding in the following notional amounts:
|
($ in millions)
|
February 2,
2019 |
February 3,
2018 |
|||||
|
Derivatives designated as cash flow hedges
|
$
|
774
|
|
$
|
745
|
|
|
|
Derivatives not designated as hedging instruments
|
660
|
|
577
|
|
|||
|
Total
|
$
|
1,434
|
|
$
|
1,322
|
|
|
Quantitative Disclosures about Derivative Financial Instruments
The fair values of foreign exchange forward contracts are as follows:
|
($ in millions)
|
February 2,
2019 |
February 3,
2018 |
|||||
|
Derivatives designated as cash flow hedges:
|
|||||||
|
Other current assets
|
$
|
15
|
|
$
|
11
|
|
|
|
Other long-term assets
|
—
|
|
—
|
|
|||
|
Accrued expenses and other current liabilities
|
3
|
|
32
|
|
|||
|
Lease incentives and other long-term liabilities
|
—
|
|
—
|
|
|||
|
Derivatives not designated as hedging instruments:
|
|||||||
|
Other current assets
|
$
|
5
|
|
$
|
3
|
|
|
|
Other long-term assets
|
—
|
|
—
|
|
|||
|
Accrued expenses and other current liabilities
|
8
|
|
11
|
|
|||
|
Lease incentives and other long-term liabilities
|
—
|
|
—
|
|
|||
|
Total derivatives in an asset position
|
$
|
20
|
|
$
|
14
|
|
|
|
Total derivatives in a liability position
|
$
|
11
|
|
$
|
43
|
|
|
All of the unrealized gains and losses from designated cash flow hedges as of
February 2, 2019
will be recognized in income within the next 12 months at the then-current values, which may differ from the fair values as of
February 2, 2019
shown above.
Our foreign exchange forward contracts are subject to master netting arrangements with each of our counterparties and such arrangements are enforceable in the event of default or early termination of the contract. We do not elect to offset the fair values of our derivative financial instruments on the Consolidated Balance Sheets and as such the fair values shown above represent gross amounts. The amounts subject to enforceable master netting arrangements are
$4 million
and
$1 million
as of
February 2, 2019
and
February 3, 2018
, respectively. If we did elect to offset, the net amounts of our derivative financial instruments in an asset position would be
$16 million
and
$13 million
and the net amounts of the derivative financial instruments in a liability position would be
$7 million
and
$42 million
as of
February 2, 2019
and
February 3, 2018
, respectively.
See
Note 6
of Notes to Consolidated Financial Statements for disclosures on the fair value measurements of our derivative financial instruments.
59
The effective portion of gains and losses on foreign exchange forward contracts in cash flow hedging and net investment hedging relationships recorded in OCI and on the Consolidated Statements of Income, on a pre-tax basis, are as follows
:
|
Fiscal Year
|
|||||||||||
|
($ in millions)
|
2018
|
2017
|
2016
|
||||||||
|
Derivatives in cash flow hedging relationships:
|
|||||||||||
|
Gain (loss) recognized in other comprehensive income
|
$
|
50
|
|
$
|
(60
|
)
|
$
|
(28
|
)
|
||
|
Gain reclassified into cost of goods sold and occupancy expenses
|
13
|
|
—
|
|
31
|
|
|||||
|
Gain (loss) reclassified into operating expenses
|
1
|
|
(1
|
)
|
(8
|
)
|
|||||
|
Derivatives in net investment hedging relationships:
|
|||||||||||
|
Loss recognized in other comprehensive income
|
$
|
—
|
|
$
|
(1
|
)
|
$
|
(2
|
)
|
||
For
fiscal 2018
,
2017
, and
2016
, there were
no
amounts of gain or loss reclassified from accumulated OCI into income for derivative financial instruments in net investment hedging relationships, as we did not sell or liquidate (or substantially liquidate) any of our hedged subsidiaries during the periods.
Gains and losses on foreign exchange forward contracts not designated as hedging instruments recorded on the Consolidated Statements of Income, on a pre-tax basis are as follows:
|
Fiscal Year
|
|||||||||||
|
($ in millions)
|
2018
|
2017
|
2016
|
||||||||
|
Gain (loss) recognized in operating expenses
|
$
|
33
|
|
$
|
(29
|
)
|
$
|
18
|
|
||
Note 8
. Common Stock
Common and Preferred Stock
The Company is authorized to issue
2.3 billion
shares of common stock and
60 million
shares of Class B common stock, which is convertible into shares of common stock on a share-for-share basis. Transfer of the Class B shares is restricted. In addition, the holders of the Class B common stock have
six
votes per share on most matters and are entitled to a lower cash dividend.
No
Class B shares have been issued as of
February 2, 2019
.
The Company is authorized to issue
30 million
shares of one or more series of preferred stock, which has a par value of
$0.05
per share, and to establish at the time of issuance the issue price, dividend rate, redemption price, liquidation value, conversion features, and such other terms and conditions of each series (including voting rights) as the Board of Directors deems appropriate, without further action on the part of the stockholders.
No
preferred shares have been issued as of
February 2, 2019
.
Share Repurchases
Share repurchase activity is as follows:
|
|
Fiscal Year
|
|||||||||||
|
($ and shares in millions except average per share cost)
|
2018
|
2017
|
2016
|
|||||||||
|
Number of shares repurchased (1)
|
14
|
|
13
|
|
—
|
|
||||||
|
Total cost
|
$
|
398
|
|
$
|
315
|
|
$
|
—
|
|
|||
|
Average per share cost including commissions
|
$
|
28.93
|
|
$
|
24.43
|
|
$
|
—
|
|
|||
__________
|
(1)
|
Excludes shares withheld to settle employee statutory tax withholding related to the vesting of stock units.
|
In February 2016, the Board of Directors approved a
$1.0 billion
share repurchase authorization. The February 2016 repurchase program had
$287 million
remaining as of
February 2, 2019
.
60
In February 2019, the Board of Directors approved a new
$1.0 billion
share repurchase authorization which supersedes and replaces the February 2016 repurchase program.
All of the share repurchases were paid for as of
February 2, 2019
,
February 3, 2018
, and
January 28, 2017
. All common stock repurchased is immediately retired.
Note 9
. Accumulated Other Comprehensive Income
Changes in accumulated other comprehensive income by component, net of tax, are as follows:
|
($ in millions)
|
Foreign Currency Translation
|
Cash Flow Hedges
|
Total
|
||||||||
|
Balance at February 3, 2018
|
$
|
64
|
|
$
|
(28
|
)
|
$
|
36
|
|
||
|
Foreign currency translation
|
(20
|
)
|
—
|
|
(20
|
)
|
|||||
|
Change in fair value of derivative financial instruments
|
—
|
|
54
|
|
54
|
|
|||||
|
Amounts reclassified from accumulated OCI
|
3
|
|
(20
|
)
|
(17
|
)
|
|||||
|
Other comprehensive income (loss), net
|
(17
|
)
|
34
|
|
17
|
|
|||||
|
Balance at February 2, 2019
|
$
|
47
|
|
$
|
6
|
|
$
|
53
|
|
||
|
($ in millions)
|
Foreign Currency Translation
|
Cash Flow Hedges
|
Total
|
||||||||
|
Balance at January 28, 2017
|
$
|
29
|
|
$
|
25
|
|
$
|
54
|
|
||
|
Foreign currency translation
|
35
|
|
—
|
|
35
|
|
|||||
|
Change in fair value of derivative financial instruments
|
—
|
|
(51
|
)
|
(51
|
)
|
|||||
|
Amounts reclassified from accumulated OCI
|
—
|
|
(2
|
)
|
(2
|
)
|
|||||
|
Other comprehensive income (loss), net
|
35
|
|
(53
|
)
|
(18
|
)
|
|||||
|
Balance at February 3, 2018
|
$
|
64
|
|
$
|
(28
|
)
|
$
|
36
|
|
||
|
($ in millions)
|
Foreign Currency Translation
|
Cash Flow Hedges
|
Total
|
||||||||
|
Balance at January 30, 2016
|
$
|
22
|
|
$
|
63
|
|
$
|
85
|
|
||
|
Foreign currency translation
|
7
|
|
—
|
|
7
|
|
|||||
|
Change in fair value of derivative financial instruments
|
—
|
|
(26
|
)
|
(26
|
)
|
|||||
|
Amounts reclassified from accumulated OCI
|
—
|
|
(12
|
)
|
(12
|
)
|
|||||
|
Other comprehensive income (loss), net
|
7
|
|
(38
|
)
|
(31
|
)
|
|||||
|
Balance at January 28, 2017
|
$
|
29
|
|
$
|
25
|
|
$
|
54
|
|
||
See
Note 7
of Notes to Consolidated Financial Statements for additional disclosures about reclassifications out of accumulated other comprehensive income and their corresponding effects on the respective line items on the Consolidated Statements of Income.
61
Note 10
. Share-Based Compensation
Share-based compensation expense is as follows:
|
|
Fiscal Year
|
|||||||||||
|
($ in millions)
|
2018
|
2017
|
2016
|
|||||||||
|
Stock units
|
$
|
71
|
|
$
|
69
|
|
$
|
61
|
|
|||
|
Stock options
|
16
|
|
14
|
|
11
|
|
||||||
|
Employee stock purchase plan
|
4
|
|
4
|
|
4
|
|
||||||
|
Share-based compensation expense
|
91
|
|
87
|
|
76
|
|
||||||
|
Less: Income tax benefit
|
(22
|
)
|
(35
|
)
|
(30
|
)
|
||||||
|
Share-based compensation expense, net of tax
|
$
|
69
|
|
$
|
52
|
|
$
|
46
|
|
|||
No material share-based compensation expense was capitalized in
fiscal 2018
,
2017
, or
2016
.
There were no material modifications made to our outstanding stock options and other stock awards in
fiscal 2018
,
2017
, or
2016
.
Beginning in the first quarter of fiscal 2017, we account for forfeitures as they occur, rather than estimate expected forfeitures, when recognizing share-based compensation expense. The cumulative-effect adjustment of this change was recognized as a
$3 million
increase, net of tax, to retained earnings as of the beginning of fiscal 2017.
General Description of Stock Option and Other Stock Award Plans
The 2016 Long-Term Incentive Plan (the "2016 Plan") was amended and restated as of February 22, 2017 and further amended and restated in February 2019, subject to shareholder approval. Under the 2016 Plan, nonqualified stock options and other stock awards are granted to officers, directors, eligible employees, and consultants at exercise prices or initial values equal to the fair market value of the Company’s common stock at the date of grant or as determined by the Compensation and Management Development Committee of the Board of Directors.
As of
February 2, 2019
, there were
216,586,781
shares that have been authorized for issuance under the 2016 Plan.
Stock Units
Under the 2016 Plan, Stock Units are granted to employees and members of the Board of Directors. Vesting generally occurs over a period of
three
to
four
years of continued service by the employee in equal annual installments. Vesting is immediate in the case of members of the Board of Directors.
In some cases, Stock Unit vesting is also subject to the attainment of pre-determined performance metrics ("Performance Shares"). At the end of each reporting period, we evaluate the probability that the Performance Shares will vest. We record share-based compensation expense on an accelerated basis over a period of
two
to
three
years once granted, based on the grant-date fair value and the probability that the pre-determined performance metrics will be achieved.
A summary of Stock Unit activity under the 2016 Plan for
fiscal 2018
is as follows:
|
Shares
|
Weighted-Average
Grant-Date
Fair Value Per Share
|
||||||
|
Balance as of February 3, 2018
|
6,263,501
|
|
$
|
25.21
|
|
||
|
Granted
|
5,639,143
|
|
$
|
29.33
|
|
||
|
Vested
|
(2,070,317
|
)
|
$
|
28.04
|
|
||
|
Forfeited
|
(1,747,068
|
)
|
$
|
26.98
|
|
||
|
Balance as of February 2, 2019
|
8,085,259
|
|
$
|
29.97
|
|
||
62
A summary of additional information about Stock Units is as follows:
|
|
Fiscal Year
|
|||||||||||
|
|
2018
|
2017
|
2016
|
|||||||||
|
Weighted-average fair value per share of Stock Units granted
|
$
|
29.33
|
|
$
|
21.81
|
|
$
|
26.47
|
|
|||
|
Fair value of Stock Units vested (in millions)
|
$
|
58
|
|
$
|
64
|
|
$
|
59
|
|
|||
The aggregate intrinsic value of unvested Stock Units as of
February 2, 2019
was
$202 million
.
As of
February 2, 2019
, there was
$128 million
(before any related tax benefit) of unrecognized share-based compensation expense related to unvested Stock Units, which is expected to be recognized over a weighted-average period of
2.1
years. Total unrecognized share-based compensation expense may be adjusted for future forfeitures as they occur.
Stock Units Granted Based on Performance Metrics
Under the 2016 Plan, some Stock Units are granted to employees only after the achievement of pre-determined performance metrics.
At the end of each reporting period, we evaluate the probability that Stock Units will be granted. We record share-based compensation expense based on the probability that the performance metrics will be achieved, with an offsetting increase to current liabilities. We revalue the liability at the end of each reporting period and record an adjustment to share-based compensation expense as required based on the probability that the performance metrics will be achieved. A Stock Unit is granted upon certification of the performance metrics. At that time, the associated liability is reclassified to stockholders’ equity.
Out of
5,639,143
Stock Units granted in
fiscal 2018
,
1,840,119
Stock Units were granted based on satisfaction of performance metrics.
The liability related to potential Stock Units to be granted based on performance metrics, which is recorded in accrued expenses and other current liabilities on the Consolidated Balance Sheets, was
$2 million
and
$12 million
as of
February 2, 2019
and
February 3, 2018
, respectively.
Stock Options
We have stock options outstanding under the 2016 Plan. Stock options generally expire the earlier of
10 years
from the grant date, three months after employee termination, or one year after the date of an employee’s retirement or death. Vesting generally occurs over a period of
four
years of continued service by the employee, with
25
percent vesting on each of the four anniversary dates.
The fair value of stock options issued during
fiscal 2018
,
2017
, and
2016
was estimated on the date of grant using the following assumptions:
|
|
Fiscal Year
|
||||||||
|
|
2018
|
2017
|
2016
|
||||||
|
Expected term (in years)
|
3.9
|
|
3.9
|
|
3.7
|
|
|||
|
Expected volatility
|
36.3
|
%
|
38.2
|
%
|
33.5
|
%
|
|||
|
Dividend yield
|
3.1
|
%
|
3.8
|
%
|
3.5
|
%
|
|||
|
Risk-free interest rate
|
2.5
|
%
|
1.7
|
%
|
1.2
|
%
|
|||
63
A summary of stock option activity under the 2016 Plan for
fiscal 2018
is as follows:
|
Shares
|
Weighted-
Average
Exercise Price Per Share
|
||||||
|
Balance as of February 3, 2018
|
9,142,206
|
|
$
|
28.67
|
|
||
|
Granted
|
3,585,976
|
|
$
|
32.00
|
|
||
|
Exercised
|
(794,430
|
)
|
$
|
25.91
|
|
||
|
Forfeited/Expired
|
(1,248,330
|
)
|
$
|
30.32
|
|
||
|
Balance as of February 2, 2019
|
10,685,422
|
|
$
|
29.80
|
|
||
A summary of additional information about stock options is as follows:
|
|
Fiscal Year
|
|||||||||||
|
|
2018
|
2017
|
2016
|
|||||||||
|
Weighted-average fair value per share of stock options granted
|
$
|
7.75
|
|
$
|
5.47
|
|
$
|
5.60
|
|
|||
|
Aggregate intrinsic value of stock options exercised (in millions)
|
$
|
5
|
|
$
|
1
|
|
$
|
1
|
|
|||
|
Fair value of stock options vested (in millions)
|
$
|
14
|
|
$
|
12
|
|
$
|
9
|
|
|||
Information about stock options outstanding and exercisable as of
February 2, 2019
is as follows:
|
Intrinsic Value as of February 2, 2019 (in millions)
|
Number of
Shares as of
February 2, 2019
|
Weighted-
Average
Remaining
Contractual
Life (in years)
|
Weighted-
Average
Exercise Price Per Share
|
||||||||||
|
Options Outstanding
|
$
|
7
|
|
10,685,422
|
|
7.5
|
$
|
29.80
|
|
||||
|
Options Exercisable
|
$
|
3
|
|
3,727,628
|
|
5.9
|
$
|
31.46
|
|
||||
Employee Stock Purchase Plan
Under our Employee Stock Purchase Plan (“ESPP”), eligible U.S. and Canadian employees are able to purchase our common stock at
85 percent
of the closing price on the New York Stock Exchange on the last day of the three-month purchase periods. Accordingly, compensation expense is recognized for an amount equal to the
15
percent discount. Employees pay for their stock purchases through payroll deductions at a rate equal to any whole percentage from
1
percent to
15
percent. There were
1,008,100
,
1,113,640
, and
1,260,361
shares issued under the ESPP in
fiscal 2018
,
2017
, and
2016
, respectively. As of
February 2, 2019
, there were
7,136,090
shares reserved for future issuances under the ESPP.
Note 11
. Leases
We lease most of our store premises and some of our corporate facilities and distribution centers. These operating leases expire at various dates through
2038
. Most store leases have a five-year base period and include options that allow us to extend the lease term beyond the initial base period, subject to terms agreed upon at lease inception. Some leases also include early termination options, which can be exercised under specific conditions.
64
The aggregate minimum non-cancelable annual lease payments under leases in effect on
February 2, 2019
are as follows:
|
($ in millions)
|
|
|||
|
Fiscal Year
|
|
|||
|
2019
|
$
|
1,156
|
|
|
|
2020
|
1,098
|
|
||
|
2021
|
892
|
|
||
|
2022
|
730
|
|
||
|
2023
|
539
|
|
||
|
Thereafter
|
1,520
|
|
||
|
Total minimum lease commitments
|
$
|
5,935
|
|
|
The total minimum lease commitment amount above does not include minimum sublease rent income of
$12 million
receivable in the future under non-cancelable sublease agreements. In addition, the total minimum lease commitment amount above excludes options to extend lease terms that are reasonably assured of being exercised.
Rent expense related to our store premises, corporate facilities, and distribution centers under operating leases is as follows:
|
|
Fiscal Year
|
|||||||||||
|
($ in millions)
|
2018
|
2017
|
2016
|
|||||||||
|
Minimum rent expense
|
$
|
1,211
|
|
$
|
1,208
|
|
$
|
1,208
|
|
|||
|
Contingent rent expense
|
95
|
|
98
|
|
107
|
|
||||||
|
Less: Sublease income
|
(6
|
)
|
(6
|
)
|
(4
|
)
|
||||||
|
Total
|
$
|
1,300
|
|
$
|
1,300
|
|
$
|
1,311
|
|
|||
Note 12
. Income Taxes
For financial reporting purposes, components of income (loss) before income taxes are as follows:
|
|
Fiscal Year
|
|||||||||||
|
($ in millions)
|
2018
|
2017
|
2016
|
|||||||||
|
United States
|
$
|
1,183
|
|
$
|
1,301
|
|
$
|
1,191
|
|
|||
|
Foreign
|
139
|
|
123
|
|
(67
|
)
|
||||||
|
Income before income taxes
|
$
|
1,322
|
|
$
|
1,424
|
|
$
|
1,124
|
|
|||
65
The provision for income taxes consists of the following:
|
|
Fiscal Year
|
|||||||||||
|
($ in millions)
|
2018
|
2017
|
2016
|
|||||||||
|
Current:
|
||||||||||||
|
Federal
|
$
|
164
|
|
$
|
415
|
|
$
|
405
|
|
|||
|
State
|
41
|
|
51
|
|
47
|
|
||||||
|
Foreign
|
49
|
|
49
|
|
50
|
|
||||||
|
Total current
|
254
|
|
515
|
|
502
|
|
||||||
|
Deferred:
|
||||||||||||
|
Federal
|
55
|
|
55
|
|
(41
|
)
|
||||||
|
State
|
11
|
|
(5
|
)
|
(5
|
)
|
||||||
|
Foreign
|
(1
|
)
|
11
|
|
(8
|
)
|
||||||
|
Total deferred
|
65
|
|
61
|
|
(54
|
)
|
||||||
|
Total provision
|
$
|
319
|
|
$
|
576
|
|
$
|
448
|
|
|||
The difference between the effective tax rate and the U.S. federal statutory tax rate is as follows:
|
|
Fiscal Year
|
||||||||
|
|
2018
|
2017
|
2016
|
||||||
|
Federal statutory tax rate
|
21.0
|
%
|
33.7
|
%
|
35.0
|
%
|
|||
|
State and local income taxes, net of federal benefit
|
4.0
|
|
4.0
|
|
3.7
|
|
|||
|
Tax impact of foreign operations
|
0.1
|
|
(1.1
|
)
|
4.5
|
|
|||
|
Impact of TCJA of 2017
|
(3.2
|
)
|
4.0
|
|
—
|
|
|||
|
Excess foreign tax credits
|
0.5
|
|
(0.7
|
)
|
(5.0
|
)
|
|||
|
Non-deductible goodwill impairment charge
|
—
|
|
—
|
|
2.2
|
|
|||
|
Other
|
1.7
|
|
0.5
|
|
(0.5
|
)
|
|||
|
Effective tax rate
|
24.1
|
%
|
40.4
|
%
|
39.9
|
%
|
|||
On December 22, 2017, the TCJA was enacted into law, which significantly changed existing U.S. tax law and included numerous provisions that affect our business, such as imposing a one-time transition tax on deemed repatriation of deferred foreign income, reducing the U.S. federal statutory tax rate, and adopting a territorial tax system.
The TCJA includes a provision to tax GILTI of foreign subsidiaries, a base erosion anti-abuse tax (“BEAT”) measure that taxes certain payments between a U.S. corporation and its subsidiaries, and favorable tax treatment for certain foreign derived intangible income (“FDII”), effective for us beginning fiscal 2018. The Company has made an accounting policy election to treat taxes due on the GILTI inclusion as a current period expense.
During
fiscal 2018
, we recorded a
$33 million
measurement period adjustment to reduce our
fiscal 2017
provisional estimated net charge related to the transition tax and recorded certain other immaterial measurement period adjustments to reduce our
fiscal 2017
provisional estimated impact of the remeasurement of our deferred tax assets and liabilities to reflect the TCJA rate reduction
.
As of
February 2, 2019
, we have finalized our accounting for the tax effects of the TCJA. While our accounting for the recorded impact of the TCJA is deemed to be complete, these amounts are based on prevailing regulations and currently available information, and any additional guidance issued by the U.S. Treasury Department and Internal Revenue Service (“IRS”) could impact the aforementioned amounts in future periods.
66
During
fiscal 2017
, we recorded a net
$57 million
charge related to the estimated effects of the TCJA primarily due to the impact of the one-time transition tax on the deemed repatriation of foreign income and the impact of the TCJA on deferred tax assets and liabilities. In addition, our estimate of the transition tax was also impacted by a change in the structure of certain legal entities in
fiscal 2017
, which resulted in an overall net tax benefit of approximately
$23 million
.
For
fiscal 2016
, the tax impact of foreign operations includes the effects of restructuring costs incurred in certain foreign subsidiaries for which the Company was not able to recognize any tax benefit. In connection with a review of the Company’s legal entity structure, we realigned certain entities in
fiscal 2016
, which resulted in an overall net tax benefit of approximately
$57 million
. This benefit is primarily due to the recognition of foreign tax credits which exceeded the taxes due upon the realignment.
Deferred tax assets (liabilities) consist of the following:
|
($ in millions)
|
February 2,
2019 |
February 3,
2018 |
||||||
|
Gross deferred tax assets:
|
||||||||
|
Deferred rent
|
$
|
124
|
|
$
|
125
|
|
||
|
Accrued payroll and related benefits
|
51
|
|
55
|
|
||||
|
Accruals
|
106
|
|
100
|
|
||||
|
Inventory capitalization and other adjustments
|
42
|
|
23
|
|
||||
|
Deferred income
|
29
|
|
32
|
|
||||
|
Unrealized net loss on cash flow hedges
|
—
|
|
4
|
|
||||
|
Federal, state, and foreign net operating losses
|
70
|
|
64
|
|
||||
|
Other
|
40
|
|
36
|
|
||||
|
Total gross deferred tax assets
|
462
|
|
439
|
|
||||
|
Valuation allowance
|
(156
|
)
|
(151
|
)
|
||||
|
Total deferred tax assets, net of valuation allowance
|
306
|
|
288
|
|
||||
|
Deferred tax liabilities:
|
||||||||
|
Depreciation and amortization
|
(180
|
)
|
(79
|
)
|
||||
|
Unremitted earnings of certain foreign subsidiaries
|
(2
|
)
|
(4
|
)
|
||||
|
Unrealized net gain on cash flow hedges
|
(3
|
)
|
—
|
|
||||
|
Other
|
(6
|
)
|
(8
|
)
|
||||
|
Total deferred tax liabilities
|
(191
|
)
|
(91
|
)
|
||||
|
Net deferred tax assets
|
$
|
115
|
|
$
|
197
|
|
||
As of
February 2, 2019
, we had approximately
$40 million
of state and
$314 million
of foreign loss carryovers in multiple taxing jurisdictions that could be utilized to reduce the tax liabilities of future years. The tax-effected loss carryovers were approximately
$4 million
for state and
$67 million
for foreign as of
February 2, 2019
. We provided a valuation allowance of approximately
$56 million
against the deferred tax assets related to the foreign loss carryovers. We also provided a valuation allowance of approximately
$93 million
related to other foreign deferred tax assets and
$7 million
related to other federal deferred tax assets. The state losses expire between fiscal
2022
and fiscal
2038
. Approximately
$48 million
of the foreign losses expire between fiscal
2019
and fiscal
2038
, and
$266 million
of the foreign losses do not expire.
67
The activity related to our unrecognized tax benefits is as follows:
|
|
Fiscal Year
|
|||||||||||
|
($ in millions)
|
2018
|
2017
|
2016
|
|||||||||
|
Balance at beginning of fiscal year
|
$
|
118
|
|
$
|
44
|
|
$
|
47
|
|
|||
|
Increases related to current year tax positions
|
11
|
|
48
|
|
4
|
|
||||||
|
Prior year tax positions:
|
||||||||||||
|
Increases
|
29
|
|
28
|
|
3
|
|
||||||
|
Decreases
|
(6
|
)
|
(2
|
)
|
(5
|
)
|
||||||
|
Lapse of Statute of Limitations
|
—
|
|
(1
|
)
|
—
|
|
||||||
|
Cash settlements
|
(15
|
)
|
—
|
|
(5
|
)
|
||||||
|
Foreign currency translation
|
(1
|
)
|
1
|
|
—
|
|
||||||
|
Balance at end of fiscal year
|
$
|
136
|
|
$
|
118
|
|
$
|
44
|
|
|||
Of the
$136 million
,
$118 million
, and
$44 million
of total unrecognized tax benefits as of
February 2, 2019
,
February 3, 2018
, and
January 28, 2017
, respectively, approximately
$125 million
,
$106 million
, and
$34 million
, respectively, represents the amount of unrecognized tax benefits that, if recognized, would favorably affect the effective income tax rate in future periods.
During
fiscal 2018
and 2017, interest expense of
$5 million
and
$4 million
, respectively, was recognized on the Consolidated Statements of Income relating to income tax liabilities. During fiscal 2016, there were
no
material amounts for interest expense relating to income tax liabilities.
As of
February 2, 2019
and
February 3, 2018
, the Company had total accrued interest related to income tax liabilities of
$10 million
and
$7 million
, respectively. There were
no
accrued penalties related to income tax liabilities as of
February 2, 2019
or
February 3, 2018
.
The Company conducts business globally, and as a result, files income tax returns in the U.S. federal jurisdiction and various state and foreign jurisdictions. In the normal course of business, we are subject to examination by taxing authorities throughout the world, including such major jurisdictions as the United States, Canada, France, the United Kingdom, China, Hong Kong, Japan, and India. We are no longer subject to U.S. federal income tax examinations for fiscal years before
2009
, and with few exceptions, we also are no longer subject to U.S. state, local, or non-U.S. income tax examinations for fiscal years before
2008
.
The Company engages in continual discussions with taxing authorities regarding tax matters in the various U.S. and foreign jurisdictions in the normal course of business. As of
February 2, 2019
, we have not identified any gross unrecognized tax benefits where it is reasonably possible we will recognize a significant increase or decrease within the next 12 months.
Note 13
. Employee Benefit Plans
We have two qualified defined contribution retirement plans, the GapShare 401(k) Plan and the GapShare Puerto Rico Plan (the “Plans”), which are available to employees who meet the eligibility requirements. The Plans permit eligible employees to make contributions up to the maximum limits allowable under the applicable Internal Revenue Codes. Under the Plans, we match, in cash, all or a portion of employees’ contributions under a predetermined formula. Our contributions vest immediately. Our matching contributions to the Plans were
$45 million
,
$45 million
, and
$44 million
in
fiscal 2018
,
2017
, and
2016
, respectively.
68
We maintain the Gap, Inc. DCP, which allows eligible employees and non-employee directors to defer base compensation up to a maximum percentage. Plan investments are directed by participants and are recorded at market value and designated for the DCP. The fair value of the Company’s DCP assets is determined based on quoted market prices. As of
February 2, 2019
and
February 3, 2018
, the assets related to the DCP were
$48 million
and
$47 million
, respectively, and were recorded in other long-term assets on the Consolidated Balance Sheets. As of
February 2, 2019
and
February 3, 2018
, the corresponding liabilities related to the DCP were
$48 million
and
$47 million
, respectively, and were recorded in lease incentives and other long-term liabilities on the Consolidated Balance Sheets. We match all or a portion of employees’ contributions under a predetermined formula. Plan investments are elected by the participants, and investment returns are not guaranteed by the Company. Our matching contributions to the DCP in
fiscal 2018
,
2017
, and
2016
were not material.
Note 14
. Earnings per Share
Weighted-average number of shares used for earnings per share is as follows:
|
|
Fiscal Year
|
||||||||
|
(shares in millions)
|
2018
|
2017
|
2016
|
||||||
|
Weighted-average number of shares—basic
|
385
|
|
393
|
|
399
|
|
|||
|
Common stock equivalents
|
3
|
|
3
|
|
1
|
|
|||
|
Weighted-average number of shares—diluted
|
388
|
|
396
|
|
400
|
|
|||
The above computations of weighted-average number of shares—diluted exclude
7 million
,
9 million
, and
7 million
shares related to stock options and other stock awards for
fiscal 2018
,
2017
, and
2016
, respectively, as their inclusion would have an anti-dilutive effect on earnings per share.
Note 15
. Commitments and Contingencies
We are a party to a variety of contractual agreements under which we may be obligated to indemnify the other party for certain matters. These contracts primarily relate to our commercial contracts, operating leases, trademarks, intellectual property, financial agreements, and various other agreements. Under these contracts, we may provide certain routine indemnifications relating to representations and warranties (e.g., ownership of assets, environmental or tax indemnifications), or personal injury matters. The terms of these indemnifications range in duration and may not be explicitly defined. Generally, the maximum obligation under such indemnifications is not explicitly stated, and as a result, the overall amount of these obligations cannot be reasonably estimated. Historically, we have not made significant payments for these indemnifications. We believe that if we were to incur a loss in any of these matters, the loss would not have a material effect on our Consolidated Financial Statements taken as a whole.
As a multinational company, we are subject to various Actions arising in the ordinary course of our business. Many of these Actions raise complex factual and legal issues and are subject to uncertainties. As of
February 2, 2019
, Actions filed against us included commercial, intellectual property, customer, employment, and data privacy claims, including class action lawsuits. The plaintiffs in some Actions seek unspecified damages or injunctive relief, or both. Actions are in various procedural stages and some are covered in part by insurance. As of
February 2, 2019
and
February 3, 2018
, we recorded a liability for an estimated loss if the outcome of an Action is expected to result in a loss that is considered probable and reasonably estimable. The liability recorded as of
February 2, 2019
and
February 3, 2018
was not material for any individual Action or in total. Subsequent to
February 2, 2019
and through the filing date of
March 19, 2019
, no information has become available that indicates a change is required that would be material to our Consolidated Financial Statements taken as a whole.
We cannot predict with assurance the outcome of Actions brought against us. Accordingly, developments, settlements, or resolutions may occur and impact income in the quarter of such development, settlement, or resolution. However, we do not believe that the outcome of any current Action would have a material effect on our Consolidated Financial Statements taken as a whole.
69
Fire at the Fishkill Distribution Center
On August 29, 2016, a fire occurred in one of the buildings at a Company-owned distribution center campus in Fishkill, New York impacting primarily products held for Gap and Banana Republic. Total insurance proceeds for fiscal 2016 were
$174 million
. In fiscal 2016, the Company recorded a gain of
$73 million
in operating expenses on the Consolidated Statement of Income related to insurance proceeds received in excess over the loss on inventory. The insurance receivable balance was
$32 million
as of
January 28, 2017
, and was recorded in other current assets on the Consolidated Balance Sheet
In January 2018, the Company agreed upon a final settlement with its insurers. Total insurance proceeds for fiscal 2017 were
$193 million
, all of which were received by
February 3, 2018
. A gain of
$64 million
was recognized in
fiscal 2017
, primarily related to property and equipment. The remaining settlement was recorded as a reduction to the insurance receivable balance in other current assets on the Consolidated Balance Sheet or cost of goods sold and occupancy expenses or operating expenses on the Consolidated Statement of Income, primarily offsetting fire-related costs incurred during
fiscal 2017
.
During
fiscal 2017
, we allocated
$66 million
of insurance proceeds to the loss on property and equipment, and the amount has been reported as insurance proceeds allocated to loss on property and equipment, a component of cash flows from investing activities, on the Consolidated Statement of Cash Flows.
70
Note 16
. Segment Information
We identify our operating segments according to how our business activities are managed and evaluated. As of
February 2, 2019
, our operating segments included: Old Navy Global, Gap Global, Banana Republic Global, Athleta, and Intermix. Each operating segment has a brand president who is responsible for various geographies and channels. Each of our brands serves customers through its store and online channels, allowing us to execute on our omni-channel strategy where customers can shop seamlessly across all of our brands in retail stores and online through desktop or mobile devices. We have determined that each of our operating segments share similar economic and other qualitative characteristics, and therefore the results of our operating segments are aggregated into
one
reportable segment as of
February 2, 2019
. We continually monitor and review our segment reporting structure in accordance with authoritative guidance to determine whether any changes have occurred that would impact our reportable segments.
Net sales by brand and region are as follows:
|
($ in millions)
|
Old Navy Global
|
Gap Global
|
Banana
Republic Global |
Other (3)
|
Total
|
Percentage
of Net Sales |
|||||||||||||||||
|
Fiscal 2018 (1)
|
|||||||||||||||||||||||
|
U.S. (2)
|
$
|
7,134
|
|
$
|
2,990
|
|
$
|
2,095
|
|
$
|
1,121
|
|
$
|
13,340
|
|
81
|
%
|
||||||
|
Canada
|
584
|
|
379
|
|
227
|
|
3
|
|
1,193
|
|
7
|
|
|||||||||||
|
Europe
|
—
|
|
589
|
|
14
|
|
—
|
|
603
|
|
4
|
|
|||||||||||
|
Asia
|
50
|
|
1,089
|
|
94
|
|
—
|
|
1,233
|
|
7
|
|
|||||||||||
|
Other regions
|
72
|
|
113
|
|
26
|
|
—
|
|
211
|
|
1
|
|
|||||||||||
|
Total
|
$
|
7,840
|
|
$
|
5,160
|
|
$
|
2,456
|
|
$
|
1,124
|
|
$
|
16,580
|
|
100
|
%
|
||||||
|
($ in millions)
|
Old Navy Global
|
Gap Global
|
Banana
Republic Global |
Other (3)
|
Total
|
Percentage
of Net Sales |
|||||||||||||||||
|
Fiscal 2017 (1)
|
|||||||||||||||||||||||
|
U.S. (2)
|
$
|
6,570
|
|
$
|
3,065
|
|
$
|
2,017
|
|
$
|
916
|
|
$
|
12,568
|
|
80
|
%
|
||||||
|
Canada
|
547
|
|
398
|
|
225
|
|
3
|
|
1,173
|
|
7
|
|
|||||||||||
|
Europe
|
—
|
|
626
|
|
15
|
|
—
|
|
641
|
|
4
|
|
|||||||||||
|
Asia
|
50
|
|
1,117
|
|
96
|
|
—
|
|
1,263
|
|
8
|
|
|||||||||||
|
Other regions
|
71
|
|
112
|
|
27
|
|
—
|
|
210
|
|
1
|
|
|||||||||||
|
Total
|
$
|
7,238
|
|
$
|
5,318
|
|
$
|
2,380
|
|
$
|
919
|
|
$
|
15,855
|
|
100
|
%
|
||||||
|
($ in millions)
|
Old Navy Global
|
Gap Global
|
Banana
Republic Global |
Other (3)
|
Total
|
Percentage
of Net Sales |
|||||||||||||||||
|
Fiscal 2016 (1)
|
|||||||||||||||||||||||
|
U.S. (2)
|
$
|
6,051
|
|
$
|
3,113
|
|
$
|
2,052
|
|
$
|
773
|
|
$
|
11,989
|
|
77
|
%
|
||||||
|
Canada
|
490
|
|
368
|
|
223
|
|
3
|
|
1,084
|
|
7
|
|
|||||||||||
|
Europe
|
—
|
|
630
|
|
59
|
|
—
|
|
689
|
|
5
|
|
|||||||||||
|
Asia
|
220
|
|
1,215
|
|
109
|
|
—
|
|
1,544
|
|
10
|
|
|||||||||||
|
Other regions
|
53
|
|
129
|
|
28
|
|
—
|
|
210
|
|
1
|
|
|||||||||||
|
Total
|
$
|
6,814
|
|
$
|
5,455
|
|
$
|
2,471
|
|
$
|
776
|
|
$
|
15,516
|
|
100
|
%
|
||||||
__________
|
(1)
|
Net sales reflect the adoption of the new revenue recognition standard in fiscal 2018 and the favorable impact of the calendar shift due to the 53rd week in fiscal 2017. Prior period amounts have not been restated and continue to be reported under accounting standards in effect for those periods.
|
|
(2)
|
U.S. includes the United States, Puerto Rico, and Guam.
|
|
(3)
|
Primarily consists of net sales for the Athleta and Intermix brands. Beginning in the third quarter of fiscal 2018, the Hill City brand is also included.
|
Net sales by region are allocated based on the location of the store where the customer paid for and received the merchandise or the distribution center or store from which the products were shipped.
71
Long-lived assets, excluding long-term derivative financial instruments in an asset position and long-term deferred tax assets, by geographic location are as follows:
|
($ in millions)
|
February 2,
2019 |
February 3,
2018 |
||||||
|
U.S. (1)
|
$
|
3,097
|
|
$
|
2,600
|
|
||
|
Other regions
|
586
|
|
624
|
|
||||
|
Total long-lived assets
|
$
|
3,683
|
|
$
|
3,224
|
|
||
__________
|
(1)
|
U.S. includes the United States, Puerto Rico, and Guam.
|
Note 17
. Quarterly Information (Unaudited)
Selected quarterly and annual operating results are as follows:
|
|
13 Weeks Ended
|
13 Weeks Ended
|
13 Weeks Ended
|
13 Weeks Ended
|
52 Weeks Ended
|
|||||||||||||||
|
($ in millions except per share amounts)
|
May 5,
2018 |
August 4,
2018 |
November 3,
2018 |
February 2,
2019 |
February 2, 2019
(fiscal 2018) |
|||||||||||||||
|
Net sales (4)
|
$
|
3,783
|
|
$
|
4,085
|
|
$
|
4,089
|
|
$
|
4,623
|
|
$
|
16,580
|
|
|||||
|
Gross profit
|
$
|
1,427
|
|
$
|
1,627
|
|
$
|
1,623
|
|
$
|
1,645
|
|
$
|
6,322
|
|
|||||
|
Net income
|
$
|
164
|
|
$
|
297
|
|
$
|
266
|
|
$
|
276
|
|
$
|
1,003
|
|
|||||
|
Earnings per share—basic (1)
|
$
|
0.42
|
|
$
|
0.77
|
|
$
|
0.69
|
|
$
|
0.72
|
|
$
|
2.61
|
|
|||||
|
Earnings per share—diluted (1)
|
$
|
0.42
|
|
$
|
0.76
|
|
$
|
0.69
|
|
$
|
0.72
|
|
$
|
2.59
|
|
|||||
|
|
13 Weeks Ended
|
13 Weeks Ended (2)
|
13 Weeks Ended
|
14 Weeks Ended (3)
|
53 Weeks Ended (2) (3)
|
|||||||||||||||
|
($ in millions except per share amounts)
|
April 29,
2017 |
July 29,
2017 |
October 28,
2017 |
February 3,
2018 |
February 3, 2018
(fiscal 2017) |
|||||||||||||||
|
Net sales (4)
|
$
|
3,440
|
|
$
|
3,799
|
|
$
|
3,838
|
|
$
|
4,778
|
|
$
|
15,855
|
|
|||||
|
Gross profit
|
$
|
1,303
|
|
$
|
1,479
|
|
$
|
1,525
|
|
$
|
1,759
|
|
$
|
6,066
|
|
|||||
|
Net income
|
$
|
143
|
|
$
|
271
|
|
$
|
229
|
|
$
|
205
|
|
$
|
848
|
|
|||||
|
Earnings per share—basic (1)
|
$
|
0.36
|
|
$
|
0.69
|
|
$
|
0.59
|
|
$
|
0.53
|
|
$
|
2.16
|
|
|||||
|
Earnings per share—diluted (1)
|
$
|
0.36
|
|
$
|
0.68
|
|
$
|
0.58
|
|
$
|
0.52
|
|
$
|
2.14
|
|
|||||
__________
|
(1)
|
Earnings per share ("EPS") was computed individually for each of the periods presented; therefore, the sum of the EPS for the quarters may not equal the total for the year.
|
|
(2)
|
During the second quarter of fiscal 2017, the Company recorded a
$64 million
gain from insurance proceeds related to the Fishkill fire. The impact of the gain from insurance proceeds to diluted EPS was
$0.10
.
|
|
(3)
|
During the fourth quarter of fiscal 2017, the company recognized a net provisional tax impact of approximately
$34 million
, which represents the provisional tax impact of federal tax reform of
$57 million
, net of a related
$23 million
benefit related to legal entity structuring that was also impacted by tax reform. The impact of the net provisional tax impact of federal tax reform was about
$0.09
to diluted EPS for the fourth quarter and full year of fiscal 2017.
|
|
(4)
|
Net sales reflect the adoption of the new revenue recognition standard in fiscal 2018 and the favorable impact of the calendar shift due to the 53rd week in fiscal 2017. Prior period amounts have not been restated and continue to be reported under accounting standards in effect for those periods.
|
72
Note 18
. Subsequent Events
Intent to Separate Business
On
February 28, 2019
, the Company announced that its Board of Directors approved a plan to separate the Company into two independent publicly-traded companies: Old Navy and NewCo, which will consist of Gap, Athleta, Banana Republic, Intermix, and Hill City. The transaction is targeted to be completed in
2020
, and is subject to certain conditions, including final approval by the Company’s Board of Directors, receipt of a tax opinion from counsel, and the filing and effectiveness of a registration statement with the U.S. Securities and Exchange Commission.
Restructuring Plans
On
February 28, 2019
, the Company also announced plans to restructure the specialty fleet and revitalize the Gap brand, including closing about
230
Gap specialty stores during
fiscal 2019
and
fiscal 2020
. The Company believes these actions will drive a healthier specialty fleet and will serve as a more appropriate foundation for brand revitalization.
Acquisition
On
March 4, 2019
, the Company acquired Janie and Jack, a leader in premium children’s fashion, from Gymboree Group, Inc. The purchase price was approximately
$35 million
with an additional agreement to purchase the Janie and Jack inventory at cost plus additional fees and expenses.
Item 9. Changes in and Disagreements With Accountants on Accounting and Financial Disclosure.
None.
Item 9A. Controls and Procedures.
Evaluation of Disclosure Controls and Procedures
We carried out an evaluation, under the supervision and with the participation of management, including the Chief Executive Officer and Chief Financial Officer, of the effectiveness of the design and operation of our disclosure controls and procedures (as defined in Exchange Act Rule 13a-15(e)) as of the end of the period covered by this Annual Report on Form 10-K. Based upon that evaluation, the Chief Executive Officer and Chief Financial Officer concluded that the Company’s disclosure controls and procedures are effective.
Management’s Report on Internal Control over Financial Reporting
Our management is responsible for establishing and maintaining an adequate system of internal control over financial reporting, as defined in Exchange Act Rule 13a-15(f). Management conducted an assessment of our internal control over financial reporting based on the framework established by the Committee of Sponsoring Organizations of the Treadway Commission in
Internal Control—Integrated Framework
(released in 2013). Based on the assessment, management concluded that as of
February 2, 2019
, our internal control over financial reporting is effective. The Company’s internal control over financial reporting as of
February 2, 2019
has been audited by Deloitte & Touche LLP, an independent registered public accounting firm, as stated in their report which is included in Item 8 of this Form 10-K.
Changes in Internal Control over Financial Reporting
There was no change in the Company’s internal control over financial reporting that occurred during the Company’s
fourth
quarter of
fiscal 2018
that has materially affected, or is reasonably likely to materially affect, the Company’s internal control over financial reporting.
73
Item 9B. Other Information.
Not applicable.
Part III
Item 10. Directors, Executive Officers and Corporate Governance.
The information required by this item is incorporated herein by reference to the sections entitled “Nominees for Election as Directors,” “Corporate Governance—Audit and Finance Committee,” and “Section 16(a) Beneficial Ownership Reporting Compliance” in the
2019
Proxy Statement. See also
Part I, Item 1
in the section entitled “Executive Officers of the Registrant.”
The Company has adopted a code of ethics, our Code of Business Conduct, which applies to all employees including our principal executive officer, principal financial officer, controller, and persons performing similar functions. Our Code of Business Conduct is available on our website, www.gapinc.com, under “Investors, Corporate Compliance, Code of Business Conduct Overview.” Any amendments and waivers to the Code will also be available on the website.
Item 11. Executive Compensation.
The information required by this item is incorporated herein by reference to the sections entitled “Compensation of Directors,” “Corporate Governance—Compensation and Management Development Committee,” and “Executive Compensation and Related Information” in the
2019
Proxy Statement.
Item 12. Security Ownership of Certain Beneficial Owners and Management and Related Stockholder Matters.
The information required by this item is incorporated herein by reference to the sections entitled “Executive Compensation and Related Information—Equity Compensation Plan Information” and “Beneficial Ownership of Shares” in the
2019
Proxy Statement.
Item 13. Certain Relationships and Related Transactions, and Director Independence.
The information required by this item is incorporated herein by reference to the sections entitled “Policies and Procedures with Respect to Related Party Transactions” and “Nominees for Election as Directors—Director Independence” in the
2019
Proxy Statement.
Item 14. Principal Accounting Fees and Services.
The information required by this item is incorporated herein by reference to the section entitled “Principal Accounting Firm Fees” in the
2019
Proxy Statement.
74
Part IV
Item 15. Exhibits, Financial Statement Schedules.
|
1.
|
Financial Statements: See “Index to Consolidated Financial Statements” in Part II, Item 8 of this Form 10-K.
|
|
2.
|
Financial Statement Schedules: Schedules are included in the Consolidated Financial Statements or notes of this Form 10-K or are not required.
|
|
3.
|
Exhibits: The exhibits listed in the below Exhibit Index are filed or incorporated by reference as part of this Form 10-K.
|
Exhibit Index
|
3.1
|
|
Registrant’s Amended and Restated Certificate of Incorporation, filed as Exhibit 3.1 to Registrant’s Annual Report on Form 10-K for the year ended January 30, 1993, Commission File No. 1-7562. (P)
|
|
3.2
|
|
Certificate of Amendment of Amended and Restated Certificate of Incorporation, filed as Exhibit 3.2 to Registrant’s Annual Report on Form 10-K for year ended January 29, 2000, Commission File No. 1-7562. (P)
|
|
|
Amended and Restated Bylaws of the Company (effective August 16, 2018), filed as Exhibit 3(ii) to Registrant’s Form 8-K on August 16, 2018, Commission File No. 1-7562.
|
|
|
|
Indenture, dated as of April 12, 2011, by and between Registrant and Wells Fargo Bank, National Association, as Trustee, filed as Exhibit 4.1 to Registrant’s Form 8-K on April 12, 2011, Commission File No. 1-7562.
|
|
|
|
First Supplemental Indenture, dated as of April 12, 2011, relating to the issuance of $1,250,000,000 aggregate principal amount of Registrant’s 5.95% Notes due 2021, filed as Exhibit 4.2 to Registrant’s Form 8-K on April 12, 2011, Commission File No. 1-7562.
|
|
|
|
Form of Registrant’s 5.95% Notes due 2021, included as Exhibit A to First Supplemental Indenture, filed as Exhibit 4.2 to Registrant’s Form 8-K on April 12, 2011, Commission File No. 1-7562.
|
|
|
Second Amended and Restated Revolving Credit Agreement dated May 31, 2018, filed as Exhibit 10.1 to Registrant's Form 10-Q for the quarter ended August 4, 2018, Commission File No. 1-7562.
|
||
|
Second Amended and Restated Master Services Agreement between Registrant and IBM, dated as of March 29, 2013, filed as Exhibit 10.1 to Registrant’s Form 10-Q for the quarter ended May 4, 2013, Commission File No. 1-7562. (1)
|
||
|
|
Amended and Restated Consumer Credit Card Program Agreement by and among Registrant, Gap (Puerto Rico), Inc., GPS Consumer Direct, Inc., Gap (Apparel), LLC, Gap (ITM) Inc., GE Capital Retail Bank and GE Capital Retail Finance Corporation, dated as of February 28, 2014, filed as Exhibit 10.1 to Amendment No. 1 to Registrant’s Form 10-Q for the quarter ended May 3, 2014, Commission File No. 1-7562. (1)
|
|
75
|
|
First Amendment to Amended and Restated Consumer Credit Card Program Agreement by and among Registrant, Gap (Puerto Rico), Inc., GPS Consumer Direct, Inc., Gap (Apparel), LLC, Gap (ITM) Inc., Synchrony Bank (f/k/a GE Capital Retail Bank) and Synchrony Financial, dated as of January 31, 2015, filed as Exhibit 10.12 to Registrant's Form 10-K for the year ended January 31, 2015, Commission File No. 1-7562.
|
|
|
|
Second Amendment to Amended and Restated Consumer Credit Card Program Agreement by and among Registrant, Gap (Puerto Rico), Inc., GPS Consumer Direct, Inc., Gap (Apparel), LLC, Gap (ITM) Inc., Synchrony Bank (f/k/a GE Capital Retail Bank) and Synchrony Financial, dated as of May 8, 2015, filed as Exhibit 10.1 to Registrant's Form 10-Q for the quarter ended August 1, 2015, Commission File No. 1-7562. (1)
|
|
|
Third Amendment to Amended and Restated Consumer Credit Card Program Agreement by and among Registrant, Gap (Puerto Rico), Inc., GPS Consumer Direct, Inc., Gap (Apparel), LLC, Gap (ITM) Inc., Synchrony Bank (f/k/a GE Capital Retail Bank) and Synchrony Financial, dated as of December 15, 2015, filed as Exhibit 10.16 to Registrant's Form 10-K for the year ended January 30, 2016, Commission File No. 1-7562. (1)
|
||
|
Fourth Amendment to Amended and Restated Consumer Credit Card Program Agreement by and among Registrant, Gap (Puerto Rico), Inc., GPS Consumer Direct, Inc., Gap (Apparel), LLC, Gap (ITM) Inc., SynchronyBank (f/k/a GE Capital Retail Bank) and Synchrony Financial, dated as of April 29, 2016, filed as Exhibit 10.1 to Registrant's Form 10-Q for the quarter ended April 30, 2016, Commission File No. 1-7562. (1)
|
||
|
Fifth Amendment to Amended and Restated Consumer Credit Card Program Agreement by and among Registrant, Gap (Puerto Rico), Inc., GPS Consumer Direct, Inc., Gap (Apparel), LLC, Gap (ITM) Inc., Synchrony Bank (f/k/a GE Capital Retail Bank) and Synchrony Financial, dated as of April 7, 2017, filed as Exhibit 10.1 to Registrant's Form 10-Q for the quarter ended April 29, 2017, Commission File No. 1-7562. (1)
|
||
|
Sixth Amendment to Amended and Restated Consumer Credit Card Program Agreement by and among Registrant, Gap (Puerto Rico), Inc., GPS Consumer Direct, Inc., Gap (Apparel), LLC, Gap (ITM) Inc., Synchrony Bank (f/k/a GE Capital Retail Bank) and Synchrony Financial, dated as of May 22, 2018, filed as Exhibit 10.2 to Registrant's Form 10-Q for the quarter ended August 4, 2018, Commission File No. 1-7562. (1)
|
||
|
EXECUTIVE COMPENSATION PLANS AND ARRANGEMENTS
|
||
|
|
Executive Management Incentive Compensation Award Plan, filed as Appendix A to Registrant’s definitive proxy statement for its annual meeting of stockholders held on May 19, 2015, Commission File No. 1-7562.
|
|
|
10.11
|
|
The Gap, Inc. Executive Deferred Compensation Plan, filed as Exhibit 10.3 to Registrant’s Form 10-Q for the quarter ended October 31, 1998, Commission File No.1-7562. (P)
|
|
|
Amendment to Executive Deferred Compensation Plan - Freezing of Plan Effective December 31, 2005, filed as Exhibit 10.1 to Registrant’s Form 8-K on November 8, 2005, Commission File No. 1-7562.
|
|
|
|
Amendment to Executive Deferred Compensation Plan - Merging of Plan into the Supplemental Deferred Compensation Plan, filed as Exhibit 10.29 to Registrant’s Form 10-K for the year ended January 31, 2009, Commission File No. 1-7562.
|
|
76
|
|
Amendment to Executive Deferred Compensation Plan - Suspension of Pending Merger into Supplemental Deferred Compensation Plan, filed as Exhibit 10.30 to Registrant’s Form 10-K for the year ended January 31, 2009, Commission File No. 1-7562.
|
|
|
|
Amendment to Executive Deferred Compensation Plan - Merging of Plan into the Deferred Compensation Plan, filed as Exhibit 10.1 to Registrant’s Form 10-Q for the quarter ended October 31, 2009, Commission File No. 1-7562.
|
|
|
Deferred Compensation Plan, amended and restated effective September 1, 2011, filed as Exhibit 10.1 to Registrant's Form 10-Q for the quarter ended October 29, 2011, Commission File No. 1-7562.
|
||
|
Deferred Compensation Plan, amended and restated effective November 17, 2015, filed as Exhibit 10.24 to Registrant's Form 10-K for the year ended January 30, 2016, Commission File No. 1-7562.
|
||
|
Deferred Compensation Plan, amended and restated effective March 24, 2016, filed as Exhibit 10.2 to Registrant's Form 10-Q for the quarter ended April 30, 2016, Commission File No. 1-7562.
|
||
|
|
Supplemental Deferred Compensation Plan, filed as Exhibit 4.1 to the Company’s Registration Statement on Form S-8, dated November 29, 2005, Commission File No. 333-129986.
|
|
|
|
First Amendment to Supplemental Deferred Compensation Plan, filed as Exhibit 10.32 to Registrant’s Form 10-K for the year ended January 31, 2009, Commission File No. 1-7562.
|
|
|
|
Second Amendment to Supplemental Deferred Compensation Plan - Merging of Executive Deferred Compensation Plan into the Plan and Name Change to Deferred Compensation Plan, filed as Exhibit 10.33 to Registrant’s Form 10-K for the year ended January 31, 2009, Commission File No. 1-7562.
|
|
|
|
Third Amendment to Supplemental Deferred Compensation Plan - Suspension of Pending Merging of Executive Deferred Compensation Plan into the Plan and Name Change to Deferred Compensation Plan, filed as Exhibit 10.34 to Registrant’s Form 10-K for the year ended January 31, 2009, Commission File No. 1-7562.
|
|
|
|
Fourth Amendment to Supplemental Deferred Compensation Plan - Merging of Executive Deferred Compensation Plan into the Plan and Name Change to Deferred Compensation Plan, filed as Exhibit 10.2 to Registrant’s Form 10-Q for the quarter ended October 31, 2009, Commission File No. 1-7562.
|
|
|
|
2006 Long-Term Incentive Plan, filed as Appendix B to Registrant’s definitive proxy statement for its annual meeting of stockholders held on May 9, 2006, Commission File No. 1-7562.
|
|
|
2006 Long-Term Incentive Plan, as amended and restated effective August 20, 2008, filed as Exhibit 10.1 to Registrant’s Form 10-Q for the quarter ended November 1, 2008, Commission File No. 1-7562.
|
||
|
|
Amendment No. 1 to Registrant’s 2006 Long-Term Incentive Plan, filed as Exhibit 10.62 to Registrant’s Form 10-K for the year ended February 3, 2007, Commission File No. 1-7562.
|
|
|
|
2011 Long-Term Incentive Plan, filed as Appendix A to Registrant’s definitive proxy statement for its annual meeting of stockholders held on May 17, 2011, Commission File No. 1-7562.
|
|
|
Amended and Restated 2011 Long-Term Incentive Plan (effective February 26, 2014), filed as Exhibit 10.1 to Registrant’s Form 8-K on March 6, 2014, Commission File No. 1-7562.
|
||
77
|
2016 Long-Term Incentive Plan, filed as Appendix A to Registrant's definitive proxy statement for its annual meeting of stockholders held on May 17, 2016, Commission File No. 1-7562.
|
||
|
Amended and Restated 2016 Long-Term Incentive Plan (effective February 22, 2017), filed as Exhibit 10.30 to Registrant's Form 10-K for the year ended February 3, 2018, Commission File No. 1-7562.
|
||
|
Form of Non-Qualified Stock Option Agreement for Executives under the 2006 Long-Term Incentive Plan, filed as Exhibit 10.1 to Registrant’s Form 8-K on March 23, 2006, Commission File No. 1-7562.
|
||
|
Form of Non-Qualified Stock Option Agreement under the 2011 Long-Term Incentive Plan, filed as Exhibit 10.8 to Registrant’s Form 10-Q for the quarter ended April 30, 2011, Commission File No. 1-7562.
|
||
|
|
Form of Non-Qualified Stock Option Agreement under the 2011 Long-Term Incentive Plan, filed as Exhibit 10.9 to Registrant’s Form 10-Q for the quarter ended July 28, 2012, Commission File No. 1-7562.
|
|
|
|
Form of Non-Qualified Stock Option Agreement under the 2011 Long-Term Incentive Plan, filed as Exhibit 10.72 to Registrant's Form 10-K for the year ended February 2, 2013, Commission File No. 1-7562.
|
|
|
|
Form of Non-Qualified Stock Option Agreement under the 2011 Long-Term Incentive Plan, filed as Exhibit 10.2 to Registrant's Form 8-K on March 6, 2014, Commission File No. 1-7562.
|
|
|
Form of Non-Qualified Stock Option Agreement under the 2011 Long-Term Incentive Plan, filed as Exhibit 10.1 to Registrant's Form 8-K on March 6, 2015, Commission File No. 1-7562.
|
||
|
Form of Non-Qualified Stock Option Agreement under the 2011 Long-Term Incentive Plan, filed as Exhibit 10.60 to Registrant's Form 10-K for the year ended January 30, 2016, Commission File No. 1-7562.
|
||
|
Form of Non-Qualified Stock Option Agreement under the 2016 Long-Term Incentive Plan, filed as Exhibit 10.1 to Registrant's Form 8-K on March 9, 2017, Commission File No. 1-7562.
|
||
|
Form of Non-Qualified Stock Option Agreement under the 2016 Long-Term Incentive Plan, filed as Exhibit 10.1 to Registrant's Form 8-K on March 16, 2018, Commission File No. 1-7562.
|
||
|
|
Form of Non-Qualified Stock Option Agreement under the 2016 Long-Term Incentive Plan, filed as Exhibit 10.1 to Registrant's Form 8-K on March 15, 2019, Commission File No. 1-7562.
|
|
|
Form of Stock Award Agreement for Executives under the 2006 Long-Term Incentive Plan, filed as Exhibit 10.2 to Registrant’s Form 8-K on March 23, 2006, Commission File No. 1-7562.
|
||
|
|
Form of Performance Share Agreement under the 2011 Long-Term Incentive Plan, filed as Exhibit 10.9 to Registrant's Form 10-Q for the quarter ended April 30, 2011, Commission File No. 1-7562.
|
|
|
Form of Performance Share Agreement under the 2011 Long-Term Incentive Plan, filed as Exhibit 10.8 to Registrant’s Form 10-Q for the quarter ended July 28, 2012, Commission File No. 1-7562.
|
||
|
Form of Performance Share Agreement under the 2006 Long-Term Incentive Plan, filed as Exhibit 10.5 to Registrant's Form 10-Q for the quarter ended May 1, 2010, Commission File No. 1-7562.
|
||
78
|
|
Form of Performance Share Agreement under the 2006 Long-Term Incentive Plan, filed as Exhibit 10.1 to Registrant's Form 8-K for the quarter ended March 11, 2011, Commission File No. 1-7562.
|
|
|
|
Form of Performance Share Agreement under the 2011 Long-Term Incentive Plan., filed as Exhibit 10.85 to Registrant's Form 10-K for the year ended February 2, 2013, Commission File No. 1-7562.
|
|
|
Form of Performance Share Agreement under the 2011 Long-Term Incentive Plan, filed as Exhibit 10.4 to Registrant's form 8-K on March 6, 2014, Commission File No. 1.7562.
|
||
|
Form of Performance Share Agreement under the 2011 Long-Term Incentive Plan, filed as Exhibit 10.3 to Registrant's form 8-K on March 6, 2015, Commission File No. 1.7562.
|
||
|
Form of Performance Share Agreement under the 2011 Long-Term Incentive Plan, filed as Exhibit 10.69 to Registrant's Form 10-K for the year ended January 30, 2016, Commission File No. 1-7562.
|
||
|
Form of Performance Share Agreement under the 2016 Long-Term Incentive Plan, filed as Exhibit 10.3 to Registrant's Form 8-K on March 9, 2017, Commission File No. 1-7562.
|
||
|
Form of Performance Share Agreement under the 2016 Long-Term Incentive Plan, filed as Exhibit 10.3 to Registrant’s Form 8-K on March 16, 2018, Commission File No. 1-7562.
|
||
|
|
Form of Performance Share Agreement under the 2016 Long-Term Incentive Plan, filed as Exhibit 10.3 to Registrant’s Form 8-K on March 15, 2019, Commission File No. 1-7562.
|
|
|
|
Form of Restricted Stock Unit Award Agreement under the 2011 Long-Term Incentive Plan, filed as Exhibit 10.7 to Registrant's Form 10-Q for the quarter ended April 30, 2011, Commission File No. 1-7562.
|
|
|
|
Form of Restricted Stock Unit Award Agreement under the 2011 Long-Term Incentive Plan, filed as Exhibit 10.10 to Registrant’s Form 10-Q for the quarter ended July 28, 2012, Commission File No. 1-7562.
|
|
|
Form of Restricted Stock Unit Award Agreement under the 2011 Long-Term Incentive Plan, filed as Exhibit 10.89 to Registrant's Form 10-K for the year ended February 2, 2013, Commission File No. 1-7562.
|
||
|
Form of Restricted Stock Unit Award Agreement under the 2011 Long-Term Incentive Plan, filed as Exhibit 10.3 to Registrant's Form 8-K on March 6, 2014, Commission File No. 1-7562.
|
||
|
Form of Restricted Stock Unit Award Agreement under the 2011 Long-Term Incentive Plan, filed as Exhibit 10.2 to Registrant's Form 8-K on March 6, 2015, Commission File No. 1-7562.
|
||
|
Form of Restricted Stock Unit Award Agreement under the 2011 Long-Term Incentive Plan, filed as Exhibit 10.75 to Registrant's Form 10-K for the year ended January 30, 2016, Commission File No. 1-7562.
|
||
|
Form of Restricted Stock Unit Award Agreement under the 2016 Long-Term Incentive Plan, filed as Exhibit 10.2 to Registrant's Form 8-K on March 9, 2017, Commission File No. 1-7562.
|
||
|
|
Form of Restricted Stock Unit Award Agreement under the 2016 Long-Term Incentive Plan, filed as Exhibit 10.2 to Registrant’s Form 8-K on March 16, 2018, Commission File No. 1-7562.
|
|
79
|
Form of Restricted Stock Unit Award Agreement under the 2016 Long-Term Incentive Plan, filed as Exhibit 10.2 to Registrant’s Form 8-K on March 15, 2019, Commission File No. 1-7562.
|
||
|
Form of Restricted Stock Unit Award Agreement (Retention Version) under the 2016 Long-Term Incentive Plan, filed as Exhibit 10.4 to Registrant’s Form 8-K on March 16, 2018, Commission File No. 1-7562.
|
||
|
Form of Director Stock Unit Agreement and Stock Unit Deferral Election Form under the 2011 Long-Term Incentive Plan, filed as Exhibit 10.10 to Registrant’s Form 10-Q for the quarter ended April 30, 2011, Commission File No. 1-7562.
|
||
|
Form of Director Stock Unit Agreement and Stock Unit Deferral Election Form under the 2011 Long-Term Incentive Plan, filed as Exhibit 10.5 to Registrant's Form 8-K on March 6, 2014, Commission File No. 1-7562.
|
||
|
Form of Director Stock Unit Agreement and Stock Unit Deferral Election Form under the 2011 Long-Term Incentive Plan, filed as Exhibit 10.4 to Registrant's Form 8-K on March 6, 2015, Commission File No. 1-7562.
|
||
|
Form of Director Stock Unit Agreement and Stock Unit Deferral Election Form under the 2011 Long-Term Incentive Plan, filed as Exhibit 10.79 to Registrant's Form 10-K for the year ended January 30, 2016, Commission File No. 1-7562.
|
||
|
Form of Director Stock Unit Agreement and Stock Unit Deferral Election Form under the 2016 Long-Term Incentive Plan, filed as Exhibit 10.4 to Registrant's Form 8-K on March 9, 2017, Commission File No. 1-7562.
|
||
|
Summary of Revised Timing of Annual Board Member Stock Unit Grants, effective August 20, 2008, filed as Exhibit 10.3 to Registrant’s Form 10-Q for the quarter ended November 1, 2008, Commission File No. 1-7562.
|
||
|
Agreement with Mark Breitbard dated February 27, 2017 and confirmed on March 2, 2017, filed as Exhibit 10.1 to Registrant's Form 10-Q for the quarter ended July 29, 2017, Commission File No. 1-7562.
|
||
|
Agreement for Post-Termination Benefits with Mark Breitbard dated June 2, 2017, filed as Exhibit 10.2 to Registrant's Form 10-Q for the quarter ended April 29, 2017, Commission File No. 1-7562.
|
||
|
Agreement for Post-Termination Benefits with Paul Chapman dated June 2, 2017, filed as Exhibit 10.3 to Registrant's Form 10-Q for the quarter ended April 29, 2017, Commission File No. 1-7562
|
||
|
Agreement with Shawn Curran dated September 29, 2017 and confirmed on October 5, 2017, filed as Exhibit 10.1 to Registrant's Form 10-Q for the quarter ended October 28, 2017, Commission File No. 1-7562.
|
||
|
Agreement with Sebastian DiGrande dated April 22, 2016 and confirmed on April 22, 2016, filed as Exhibit 10.1 to Registrant's Form 10-Q for the quarter ended July 30, 2016, Commission File No. 1-7562.
|
||
|
Agreement for Post-Termination Benefits with Sebastian DiGrande dated June 2, 2017, filed as Exhibit 10.4 to Registrant's Form 10-Q for the quarter ended April 29, 2017, Commission File No. 1-7562.
|
||
80
|
Agreement with Neil Fiske dated June 11, 2018, filed as Exhibit 10.3 to Registrant's Form 10-Q for the quarter ended August 4, 2018, Commission File No. 1-7562.
|
||
|
Agreement with Julie Gruber dated February 1, 2016 and confirmed on February 4, 2016, filed as Exhibit 10.3 to Registrant's Form 10-Q for the quarter ended April 30, 2016, Commission File No. 1-7562.
|
||
|
Agreement for Post-Termination Benefits with Julie Gruber dated June 2, 2017, filed as Exhibit 10.5 to Registrant's Form 10-Q for the quarter ended April 29, 2017, Commission File No. 1-7562.
|
||
|
Agreement with Brent Hyder dated April 3, 2017 and confirmed on April 19, 2017, filed as Exhibit 10.2 to Registrant's Form 10-Q for the quarter ended July 29, 2017, Commission File No. 1-7562.
|
||
|
Agreement for Post-Termination Benefits with Brent Hyder dated June 2, 2017, filed as Exhibit 10.6 to Registrant's Form 10-Q for the quarter ended April 29, 2017, Commission File No. 1-7562.
|
||
|
Agreement with Jeff Kirwan dated November 17, 2014 and confirmed on November 18, 2014, filed as Exhibit 10.108 to Registrant's Form 10-K for the year ended January 31, 2015, Commission File No. 1-7562.
|
||
|
Agreement with Jeff Kirwan dated May 17, 2017 and confirmed on May 16, 2017, filed as Exhibit 10.3 to Registrant's Form 10-Q for the quarter ended July 29, 2017, Commission File No. 1-7562.
|
||
|
Agreement for Post-Termination Benefits with Jeff Kirwan dated June 2, 2017, filed as Exhibit 10.7 to Registrant's Form 10-Q for the quarter ended April 29, 2017, Commission File No. 1-7562.
|
||
|
Letter Agreement dated November 10, 2016 by and between Teri List-Stoll and the Registrant dated November 10, 2016 and confirmed on November 10, 2016, filed as Exhibit 10.1 to Registrant's Form 8-K on November 15, 2016, Commission File No. 1-7562.
|
||
|
|
Agreement for Post-Termination Benefits with Teri List-Stoll dated June 2, 2017, filed as Exhibit 10.8 to Registrant's Form 10-Q for the quarter ended April 29, 2017, Commission File No. 1-7562.
|
|
|
|
Agreement with Andi Owen dated November 17, 2014 and confirmed on November 18, 2014 filed as Exhibit 10.117 to Registrant's Form 10-K for the year ended January 31, 2015, Commission File No. 1-7562.
|
|
|
Letter Agreement with Art Peck dated October 3, 2014, filed as Exhibit 10.1 to Registrant’s Form 8-K on October 8, 2014, Commission File No. 1-7562.
|
||
|
Agreement for Post-Termination Benefits with Art Peck dated June 2, 2017, filed as Exhibit 10.9 to Registrant's Form 10-Q for the quarter ended April 29, 2017, Commission File No. 1-7562.
|
||
|
Agreement with Art Peck dated June 1, 2018, filed as Exhibit 10.1 to Registrant's Form 8-K on June 4, 2018, Commission File No. 1-7562.
|
||
|
Agreement with Sonia Syngal dated April 11, 2016 and confirmed on April 11, 2016, filed as Exhibit 10.1 to Registrant's Form 8-K on April 13, 2016, Commission File No. 1-7562.
|
||
|
Agreement for Post-Termination Benefits with Sonia Syngal dated June 2, 2017, filed as Exhibit 10.10 to Registrant's Form 10-Q for the quarter ended April 29, 2017, Commission File No. 1-7562.
|
||
81
|
|
Code of Business Conduct, filed as Exhibit 14 to Registrant’s Form 10-K for the year ended January 30, 2010, Commission File No. 1-7562.
|
|
|
|
Subsidiaries of Registrant. (2)
|
|
|
|
Consent of Independent Registered Public Accounting Firm. (2)
|
|
|
|
Rule 13a-14(a)/15d-14(a) Certification of the Chief Executive Officer of The Gap, Inc. (Section 302 of the Sarbanes-Oxley Act of 2002). (2)
|
|
|
|
Rule 13a-14(a)/15d-14(a) Certification of the Chief Financial Officer of The Gap, Inc. (Section 302 of the Sarbanes-Oxley Act of 2002). (2)
|
|
|
|
Certification of the Chief Executive Officer of The Gap, Inc. pursuant to 18 U.S.C. Section 1350, as adopted pursuant to Section 906 of the Sarbanes-Oxley Act of 2002. (3)
|
|
|
|
Certification of the Chief Financial Officer of The Gap, Inc. pursuant to 18 U.S.C. Section 1350, as adopted pursuant to Section 906 of the Sarbanes-Oxley Act of 2002. (3)
|
|
|
101
|
|
The following materials from The Gap, Inc.’s Annual Report on Form 10-K for the year ended February 2, 2019, formatted in XBRL (eXtensible Business Reporting Language): (i) the Consolidated Balance Sheets, (ii) the Consolidated Statements of Income, (iii) the Consolidated Statements of Comprehensive Income, (iv) the Consolidated Statements of Stockholders’ Equity, (v) the Consolidated Statements of Cash Flows, and (vi) Notes to Consolidated Financial Statements. (2)
|
__________
|
(1)
|
Pursuant to a request for confidential treatment, confidential portions of this Exhibit have been redacted and have been filed separately with the Securities and Exchange Commission.
|
|
(2)
|
Filed herewith.
|
|
(3)
|
Furnished herewith.
|
(P) This Exhibit was originally filed in paper format. Accordingly, a hyperlink has not been provided.
82
Item 16. Form 10-K Summary
None.
83
SIGNATURES
Pursuant to the requirements of Section 13 or 15(d) of the Securities Exchange Act of 1934, the registrant has duly caused this report to be signed on its behalf by the undersigned, thereunto duly authorized.
|
|
|
THE GAP, INC.
|
||
|
Date:
|
March 19, 2019
|
|
By
|
/s/ ARTHUR PECK
|
|
|
Arthur Peck
President and Chief Executive Officer
(Principal Executive Officer)
|
|||
|
Date:
|
March 19, 2019
|
|
By
|
/s/ TERI LIST-STOLL
|
|
|
Teri List-Stoll
Executive Vice President and Chief Financial Officer
(Principal Financial and Accounting Officer)
|
|||
Pursuant to the requirements of the Securities Exchange Act of 1934, this report has been signed below by the following persons on behalf of the registrant and in the capacities and on the dates indicated.
84
|
Date:
|
March 19, 2019
|
|
By
|
/s/ AMY BOHUTINSKY
|
|
Amy Bohutinsky, Director
|
||||
|
Date:
|
March 19, 2019
|
|
By
|
/s/ JOHN J. FISHER
|
|
John J. Fisher, Director
|
||||
|
Date:
|
March 19, 2019
|
|
By
|
/s/ ROBERT J. FISHER
|
|
Robert J. Fisher, Director
|
||||
|
Date:
|
March 19, 2019
|
|
By
|
/s/ WILLIAM S. FISHER
|
|
William S. Fisher, Director
|
||||
|
Date:
|
March 19, 2019
|
|
By
|
/s/ TRACY GARDNER
|
|
Tracy Gardner, Director
|
||||
|
Date:
|
March 19, 2019
|
|
By
|
/s/ BRIAN GOLDNER
|
|
Brian Goldner, Director
|
||||
|
Date:
|
March 19, 2019
|
|
By
|
/s/ ISABELLA D. GOREN
|
|
Isabella D. Goren, Director
|
||||
|
Date:
|
March 19, 2019
|
|
By
|
/s/ BOB L. MARTIN
|
|
Bob L. Martin, Director
|
||||
|
Date:
|
March 19, 2019
|
|
By
|
/s/ JORGE P. MONTOYA
|
|
Jorge P. Montoya, Director
|
||||
|
Date:
|
March 19, 2019
|
|
By
|
/s/ CHRIS O'NEILL
|
|
Chris O'Neill, Director
|
||||
|
Date:
|
March 19, 2019
|
|
By
|
/s/ ARTHUR PECK
|
|
Arthur Peck, Director
|
||||
|
Date:
|
March 19, 2019
|
|
By
|
/s/ LEXI REESE
|
|
Lexi Reese, Director
|
||||
|
Date:
|
March 19, 2019
|
|
By
|
/s/ MAYO A. SHATTUCK III
|
|
Mayo A. Shattuck III, Director
|
||||
85
TABLE OF CONTENTS
Part I, Item 1Item 11. Executive CompensationItem 12. Security Ownership Of Certain Beneficial Owners and Management and Related Stockholder MattersItem 13. Certain Relationships and Related Transactions, and Director IndependenceItem 14. Principal Accounting Fees and ServicesPart IVItem 15. Exhibits, Financial Statement SchedulesItem 16. Form 10-k Summary