W R GRACE & CO
10-Ks and 10-Qs
|
|
|
|
|
|
|
|
|
|
|
|
|
|
|
|
|
|
|
|
UNITED STATES
SECURITIES AND EXCHANGE COMMISSION
Washington, D.C. 20549
____________________________________________________________________________
FORM 10-K
ý
ANNUAL REPORT PURSUANT TO SECTION 13 OR 15(d) OF THE SECURITIES EXCHANGE ACT OF 1934
|
For the fiscal year ended December 31, 2013
|
or
o
TRANSITION REPORT PURSUANT TO SECTION 13 OR 15(d) OF THE SECURITIES EXCHANGE ACT OF 1934
|
For the transition period from _____ to _____
|
Commission file number 1-13953
W. R. GRACE & CO.
|
Delaware
|
|
65-0773649
|
|
(State or other jurisdiction of incorporation or organization)
|
(I.R.S. Employer Identification Number)
|
|
7500 Grace Drive, Columbia, Maryland 21044-4098
(Address of principal executive offices) (Zip code)
(410) 531-4000
(Registrant's telephone number, including area code)
|
Securities registered pursuant to Section 12(b) of the Exchange Act:
|
||
|
Title of each class
|
|
Name of each exchange on which registered
|
|
Common Stock, $.01 par value
|
|
New York Stock Exchange, Inc.
|
|
Preferred Stock Purchase Rights
|
|
|
Securities registered pursuant to Section 12(g) of the Act:
None
Indicate by check mark if the registrant is a well-known seasoned issuer, as defined in Rule 405 of the Securities Act. Yes
ý
No
o
Indicate by check mark if the registrant is not required to file reports pursuant to Section 13 or 15(d) of the Act. Yes
o
No
ý
Indicate by check mark whether the registrant (1) has filed all reports required to be filed by Section 13 or 15(d) of the Securities Exchange Act of 1934 during the preceding 12 months (or for such shorter period that the registrant was required to file such reports) and (2) has been subject to such filing requirements for the past 90 days. Yes
ý
No
o
Indicate by check mark whether the registrant has submitted electronically and posted on its corporate Web site, if any, every Interactive Data File required to be submitted and posted pursuant to Rule 405 of Regulation S-T (§232.405 of this chapter) during the preceding 12 months (or for such shorter period that the registrant was required to submit and post such files). Yes
ý
No
o
Indicate by check mark if disclosure of delinquent filers pursuant to Item 405 of Regulations S-K is not contained herein and will not be contained, to the best of registrant's knowledge, in definitive proxy or information statements incorporated by reference in Part III of this Form 10-K or any amendment to this Form 10-K.
ý
Indicate by check mark whether the registrant is a large accelerated filer, an accelerated filer, a non-accelerated filer, or a smaller reporting company. See the definitions of "large accelerated filer," "accelerated filer," and "smaller reporting company" in Rule 12b-2 of the Exchange Act.
|
Large accelerated filer
ý
|
|
Accelerated filer
o
|
|
Non-accelerated filer
o
(Do not check if a smaller reporting company)
|
Smaller reporting company
o
|
|
Indicate by check mark whether the registrant is a shell company (as defined in Rule 12b-2 of the Act). Yes
o
No
ý
The aggregate market value of W. R. Grace & Co. voting and non-voting common equity held by non-affiliates as of
June 30, 2013
(the last business day of the registrant's most recently completed second fiscal quarter) based on the closing sale price of
$84.04
as reported on the New York Stock Exchange was
$6,435,601,758
.
Indicate by check mark whether the registrant has filed all documents and reports required to be filed by Section 12, 13 or 15(d) of the Securities Exchange Act of 1934 subsequent to the distribution of securities under a plan confirmed by a court. Yes
ý
No
o
At January 31, 2014,
77,063,385
shares of W. R. Grace & Co. Common Stock, $.01 par value, were outstanding.
DOCUMENTS INCORPORATED BYREFERENCE
None.
TABLE OF CONTENTS
|
PART I
|
|
|
|
PART II
|
|
|
|
PART III
|
|
|
|
PART IV
|
|
|
Grace®, Grace® logo and, except as otherwise indicated, the other trademarks, service marks or trade names used in the text of this report are trademarks, service marks or trade names of operating units of W. R. Grace & Co. or its affiliates and/or subsidiaries. RESPONSIBLE CARE
®
is a trademark, registered in the United States and/or other countries, of the American Chemistry Council. UNIPOL
®
is a trademark, registered in the United States and/or other countries, of The Dow Chemical Company or an affiliated company of Dow. W. R. Grace & Co.-Conn. and/or its affiliates are licensed to use the UNIPOL
®
and UNIPOL UNIPPAC
®
trademarks in the area of polypropylene.
Unless the context otherwise indicates, in this document the terms "Grace," "we," "us," "our" or "the Company" mean W. R. Grace & Co. and/or its consolidated subsidiaries and affiliates. Unless otherwise indicated, the contents of websites mentioned in this report are not incorporated by reference or otherwise made a part of this Report.
BUSINESS OVERVIEW
W. R. Grace & Co. is engaged in the production and sale of specialty chemicals and specialty materials on a global basis through three operating segments: Grace Catalysts Technologies, which includes catalysts and related products and technologies used in refining, petrochemical and other chemical manufacturing applications; Grace Materials Technologies, which includes packaging technologies and engineered materials used in consumer, industrial, and pharmaceutical applications; and Grace Construction Products, which includes specialty construction chemicals and specialty building materials used in commercial, infrastructure and residential construction. We entered the specialty chemicals industry in 1954, when we acquired both the Dewey and Almy Chemical Company and the Davison Chemical Company. Grace is the successor to a company that began in 1854 and originally became a public company in 1953.
In 2001, Grace and 61 of its United States subsidiaries and affiliates filed voluntary petitions for reorganization under Chapter 11 of the United States Bankruptcy Code in the United States Bankruptcy Court for the District of Delaware. On February 3, 2014, the joint plan of reorganization filed by Grace and certain other parties became effective, concluding Grace’s status as a debtor under Chapter 11.
On December 2, 2013, we completed the acquisition of the assets of the polypropylene licensing and catalysts business of The Dow Chemical Company for a cash purchase price of $500 million, subject to customary working capital and post-closing adjustments.
Our principal executive offices are located at 7500 Grace Drive, Columbia, Maryland 21044, telephone (410) 531-4000. As of
December 31, 2013
, we had approximately
6,700
global employees.
Grace Catalysts Technologies
produces and sells catalysts and related products and technologies used in refining, petrochemical and other chemical manufacturing applications including:
|
•
|
Fluid catalytic cracking catalysts
, also called FCC catalysts, that help to "crack" the hydrocarbon chain in distilled crude oil to produce transportation fuels, such as gasoline and diesel fuels, and other petroleum-based products; and FCC additives used to reduce sulfur in gasoline, maximize propylene production from refinery FCC units, and reduce emissions of sulfur oxides, nitrogen oxides and carbon monoxide from refinery FCC units;
|
|
•
|
Hydroprocessing catalysts
, most of which are marketed through our Advanced Refining Technologies LLC, or ART, joint venture with Chevron Products Company in which we hold a 50% economic interest, that are used in process reactors to upgrade heavy oils into lighter, more useful products by removing impurities such as nitrogen, sulfur and heavy metals, allowing less expensive feedstocks to be used in the petroleum refining process (ART is not consolidated in our financial statements, so ART's sales are excluded from our sales);
|
|
•
|
Polyolefin catalysts and catalyst supports
, for the production of polypropylene and polyethylene thermoplastic resins, which can be customized to enhance the performance of a wide range of industrial and consumer end-use applications including high pressure pipe, geomembranes, food packaging, automotive parts, medical devices, and textiles; and chemical catalysts used in a variety of industrial, environmental and consumer applications; and
|
|
•
|
Gas-phase polypropylene process technology
which provides our licensees with a reliable capability to manufacture polypropylene products for a broad array of end-use applications.
|
Grace Materials Technologies
produces and sells specialty materials, coatings and sealants and related products used in coatings, consumer, industrial, pharmaceutical, and packaging applications including:
|
•
|
Silica-based engineered materials
, including silica-based and silica-alumina-based materials, used in:
|
|
•
|
Coatings and print media applications, including functional additives that provide matting effects and corrosion protection for industrial and consumer coatings and media and paper products to enhance quality in ink jet coatings;
|
1
|
•
|
Consumer applications, as a free-flow agent, carrier or processing aid in food and personal care products; as a toothpaste abrasive and thickener; and for the processing and stabilization of edible oils and beverages;
|
|
•
|
Industrial applications, such as tires and rubber, precision investment casting, refractory, insulating glass windows, biofuels, and drying applications, fulfilling various functions such as reinforcement, high temperature binding and moisture scavenging;
|
|
•
|
Pharmaceutical, life science and related applications including silica-based separation media, excipients and pharmaceutical intermediates; complementary purification products, chromatography consumables, and instruments; and CO
2
adsorbents used in anesthesiology and mine safety applications; and
|
|
•
|
Packaging materials
, including can and closure sealants used to seal and enhance the shelf life of can and bottle contents; coatings for cans and closures that prevent metal corrosion, protect package contents from the influence of metal and ensure proper adhesion of sealing compounds; and scavenging technologies designed to reduce off-taste and extend the shelf-life of packaged products.
|
Grace Construction Products
produces and sells specialty construction chemicals and specialty building materials, including:
|
•
|
Construction chemicals
including concrete admixtures and fibers used to modify the rheology, improve the durability and enhance various other properties of concrete, mortar, masonry and other cementitious construction materials; and additives used in cement processing to improve energy efficiency in manufacturing, enhance the characteristics of finished cement and improve ease of use; and
|
|
•
|
Building materials
used in both new construction and renovation/repair projects. The products protect buildings and civil engineering structures from water, vapor and air penetration. The portfolio includes waterproofing membranes for commercial and residential buildings, specialty grouts for use in waterproofing and soil stabilization applications, air and vapor barriers, and other products to solve the specialized needs of preventative and repair applications.
|
Global Scope
We operate our business on a global scale with approximately
71%
of our
2013
sales outside the United States. We conduct business in over 40 countries and in more than 50 currencies. We manage our operating segments on a global basis, to serve global markets. Currency fluctuations affect our reported results of operations, cash flows, and financial position.
Strategy Overview
Our strategy is to increase enterprise value by profitably growing our specialty chemicals and specialty materials businesses in the global marketplace and achieving high levels of efficiency and cash flow. To meet these objectives, we plan to:
|
•
|
invest in research and development activities, with the goal of introducing new high-performance, technically differentiated products and services and enhancing manufacturing processes and operations;
|
|
•
|
expand sales and manufacturing into emerging regions, including China, India, other economies in Asia, Eastern Europe, the Middle East and Latin America;
|
|
•
|
pursue selected acquisitions and alliances that complement our current product offerings or provide opportunities for faster penetration of desirable market or geographic segments; and
|
|
•
|
continue our commitment to process and productivity improvements and cost-management, such as rigorous controls on working capital and capital spending, integration of functional support services worldwide, and programs for improving operations and supply chain management.
|
CHAPTER 11 CASES
On April 2, 2001, Grace, along with 61 of our United States subsidiaries and affiliates, filed voluntary petitions for reorganization under Chapter 11 of the United States Bankruptcy Code (the "Bankruptcy Code") in the United States Bankruptcy Court for the District of Delaware (the “Bankruptcy Court”). The cases were jointly administered
2
under case number 01-01139. Our non-U.S. subsidiaries and certain of our U.S. subsidiaries were not included in the bankruptcy filing.
On February 3, 2014 (the “Effective Date”), the joint plan of reorganization (the “Joint Plan”) filed by Grace and certain other parties became effective, concluding Grace’s status as a debtor under Chapter 11.
Under the Joint Plan, two asbestos trusts have been established and funded under Section 524(g) of the Bankruptcy Code. The order of the Bankruptcy Court confirming the Joint Plan contains a channeling injunction which provides that all pending and future asbestos-related personal injury claims and demands are to be channeled for resolution to an asbestos personal injury trust, the PI Trust, and all pending and future asbestos-related property damage claims and demands (PD Claims), including property damage claims related to Grace’s former attic insulation product, ZAI, are to be channeled to a separate asbestos property damage trust, the PD Trust. The PD Trust has two accounts (the two accounts have separate trustees and their assets may not be commingled), the PD Account, in respect of non-ZAI PD Claims, and the ZAI PD Account, in respect of ZAI PD Claims.
The trusts are the sole recourse for holders of asbestos-related claims; the channeling injunctions prohibit them from asserting such claims directly against Grace.
Under the Joint Plan, Grace is obligated to make future payments to the PI Trust, the PD Trust in respect of PD Claims, and the PD Trust in respect of ZAI PD Claims.
The amounts that Grace is obligated to pay to the PI Trust are fixed, and include only deferred payments of $110 million per year for 5 years beginning in 2019, and $100 million per year for 10 years beginning in 2024. Grace has recorded a liability for these deferred payments.
The amounts that Grace is obligated to pay to the PD Trust in respect of non-ZAI PD Claims are not fixed. Grace is obligated to make payments to the PD Trust every six months in the amount of any non-ZAI PD Claims allowed by the Bankruptcy Court during the preceding six months plus interest (if applicable) and the amount of PD Trust expenses. Grace has accrued for those unresolved non-ZAI PD Claims that it believes are probable and estimable. Grace has not accrued for other unresolved or unasserted non-ZAI PD Claims as it does not believe that payment on any such claims is probable.
The amounts that Grace is obligated to pay to the PD Trust in respect of ZAI PD Claims include a fixed amount and a capped contingent amount. Grace is obligated to make a fixed payment of $30 million to the ZAI PD Account on the third anniversary of the Effective Date, i.e., February 3, 2017. Grace is also obligated to make up to 10 contingent payments of $8 million per year to the ZAI PD Account during the 20-year period beginning on the fifth anniversary of the Effective Date, with each such payment due only if the assets of the ZAI PD Account fall below $10 million during the preceding year. Grace has recorded a liability for the fixed deferred payment but has not recorded a liability for the contingent payments as it does not currently believe these payments are probable.
These obligations to the asbestos trusts are secured by Grace's obligation to issue 77,372,257 shares of Grace common stock to the asbestos trusts in the event of default.
See disclosure in this Report in Item 8 (Financial Statements and Supplementary Data) in the Financial Supplement under Note 2 (Chapter 11 and Joint Plan of Reorganization) to the Consolidated Financial Statements for a detailed description of the Chapter 11 cases and the Joint Plan.
PRODUCTS AND MARKETS
Specialty Chemicals and Materials Industry Overview
Specialty chemicals and specialty materials are high value-added products used as catalysts, intermediates, components, protectants or additives in a wide variety of products and applications. They are generally produced in relatively small volumes (compared with commodity chemicals) and must satisfy well-defined performance requirements and specifications. Specialty chemicals and specialty materials are often critical components of end products, catalysts for the production of end products and components used in end products. Consequently, they are tailored to meet customer needs, which generally results in a close relationship between the producer and the customer.
We focus our business on the following, which we believe are important competitive factors in the specialty chemicals and specialty materials industry:
3
|
•
|
value-added products, technologies and services, sold at competitive prices;
|
|
•
|
customer service, including rapid response to changing customer needs;
|
|
•
|
technological leadership (resulting from investment in research and development and technical customer service); and
|
|
•
|
reliability of product and supply.
|
We believe that our focus on these competitive factors enables us to deliver increased value to customers and competitive operating margins notwithstanding the increased customer service and research and development costs that this focus entails.
Grace Catalysts Technologies Operating Segment
Catalysts Technologies principally applies alumina, zeolite and inorganic support technologies in the design and manufacture of products to create significant value for our diverse customer base. Our customers include major oil refiners and plastics and chemicals manufacturers. We believe that our technological expertise provides a competitive advantage, allowing us to quickly design products that help our customers create value in their markets.
The following table sets forth Catalysts Technologies sales of similar products as a percentage of Grace total revenue.
|
2013
|
2012
|
2011
|
||||||||||||||||||
|
(In millions)
|
Sales
|
% of Grace Revenue
|
Sales
|
% of Grace Revenue
|
Sales
|
% of Grace Revenue
|
||||||||||||||
|
Refining Catalysts
|
$
|
832.4
|
|
27.2
|
%
|
$
|
986.8
|
|
31.3
|
%
|
$
|
1,077.5
|
|
33.5
|
%
|
|||||
|
Polyolefin and Chemical Catalysts
|
291.6
|
|
9.5
|
%
|
281.3
|
|
8.9
|
%
|
269.8
|
|
8.4
|
%
|
||||||||
|
Total Catalysts Technologies Revenue
|
$
|
1,124.0
|
|
36.7
|
%
|
$
|
1,268.1
|
|
40.2
|
%
|
$
|
1,347.3
|
|
41.9
|
%
|
|||||
The following table sets forth Catalysts Technologies sales by region as a percentage of Catalysts Technologies total revenue.
|
2013
|
2012
|
2011
|
||||||||||||||||||
|
(In millions)
|
Sales
|
% of Catalysts Technologies Revenue
|
Sales
|
% of Catalysts Technologies Revenue
|
Sales
|
% of Catalysts Technologies Revenue
|
||||||||||||||
|
North America
|
$
|
359.8
|
|
32.0
|
%
|
$
|
382.1
|
|
30.1
|
%
|
$
|
462.4
|
|
34.3
|
%
|
|||||
|
Europe Middle East Africa
|
459.2
|
|
40.9
|
%
|
543.5
|
|
42.8
|
%
|
600.2
|
|
44.5
|
%
|
||||||||
|
Asia Pacific
|
223.0
|
|
19.8
|
%
|
256.9
|
|
20.3
|
%
|
216.4
|
|
16.1
|
%
|
||||||||
|
Latin America
|
82.0
|
|
7.3
|
%
|
85.6
|
|
6.8
|
%
|
68.3
|
|
5.1
|
%
|
||||||||
|
Total Catalysts Technologies Revenue
|
$
|
1,124.0
|
|
100.0
|
%
|
$
|
1,268.1
|
|
100.0
|
%
|
$
|
1,347.3
|
|
100.0
|
%
|
|||||
Grace Catalysts Technologies—Refining Catalysts
FCC Catalysts
We are a global leader in developing and manufacturing fluid catalytic cracking, or FCC, catalysts and additives that enable petroleum refiners to increase profits by improving product yields, value and quality. Our FCC products also enable refiners to reduce emissions from their FCC units and reduce sulfur content in the gasoline that they produce.
Oil refining is a highly specialized discipline, and FCC catalysts must be tailored to meet local variations in crude oil and a refinery's product mix. We work regularly with our customers to identify the most appropriate catalyst formulations for their changing needs. We are dependent on the economics of the petroleum industry, specifically, the impacts of demand for transportation fuels and petrochemical products and crude oil supply, which affect the extent to which our customers utilize the available capacity of their refinery FCC units. In general, as a refinery utilizes more of its capacity, it needs a greater amount of FCC catalyst. In recent years global economic growth,
4
especially in emerging regions, has increased the demand for transportation fuels, and our FCC catalysts and additives. Other factors may reduce the demand for petroleum-based transportation fuels such as weak economic conditions and high retail gasoline and diesel fuel prices. In addition, government policy that encourages the use of non-petroleum-based fuels, discourages the use of diesel fuel or encourages greater vehicular fuel economy may negatively affect demand for our FCC catalysts and additives.
Refinery feedstocks vary in quality from light to heavy, sweet to sour crude oil. Sweet crude feedstocks are typically more expensive than heavy crude and yield a greater proportion of high-value petroleum products. They also yield a lower proportion of residual oil, or "resid," which is generally the lowest-value feedstock contained in crude oil. Although heavy crude feedstocks with high resid content are typically less expensive than higher quality feedstocks, the processing of high-resid feedstocks is more difficult because of their relatively high metals, nitrogen and sulfur contamination and higher boiling points. We have designed our MIDAS
®
catalyst, IMPACT
®
catalyst, NEKTOR™ catalyst, and GENESIS
®
catalyst product portfolios to enable our customers to increase the efficiency and yield of high-resid feedstock refining.
During 2010, the People's Republic of China reduced its quotas on exports of the rare earths that we use in the manufacture of FCC catalysts, causing significant increases in global prices of rare earths in 2010 and early 2011. In response to these price increases, we developed our RESIDULTRA™ low-rare earth FCC catalyst and our REPLACER® product line of no-rare earth FCC catalysts to mitigate the higher cost of rare earths without sacrificing performance. Starting in the third quarter of 2011, global prices of rare earths declined rapidly and significantly. Since then, we have added rare earth to some of our FCC catalyst formulations because it improves the performance and value of the catalyst.
Many U.S. petroleum refiners have entered into consent decrees with the U.S. Environmental Protection Agency (EPA) under which the refiners have agreed to reduce emissions of nitrogen oxides and sulfur oxides. The European Union has also imposed requirements on refineries with respect to nitrogen oxides and sulfur oxides emissions. FCC units are generally the largest emitters of these pollutants in a refinery. Our additives are designed to assist refineries in meeting their obligations to reduce these pollutants. Our Super DESOX
®
additive reduces sulfur oxides emissions from commercial FCC units. During 2011, we also launched our two low rare earth versions of Super DESOX
®
additive. Our DENOX
®
additives are designed to achieve reductions in nitrogen oxides emissions comparable to those obtained from capital intensive alternatives available to a refinery, while our non-platinum-based combustion promoters XNOX
®
and CP
®
P enable refiners to control carbon monoxide emissions without increasing NOx.
Global economic growth, especially in emerging regions, has increased the demand for plastics. As a result, our refinery customers have sought increased profits from petrochemicals by increasing the yield of propylene from their FCC units. Our ZSM-5-based technology, including our OLEFINSMAX
®
and OLEFINSULTRA
®
additive products, is designed to maximize the propylene output of FCC units.
In recent years, many countries and regions, including the U.S., European Union, Russia, India and China have imposed or increased the regulatory limitations on the sulfur content of gasoline and diesel fuel. We have developed a portfolio of products designed to assist refiners in meeting their gasoline sulfur reduction targets including our D-PRISM
®
and GSR
®
additives and our SURCA
®
catalyst family.
Competition in FCC catalysts and additives is based on technology, product performance, customer service and price. Our principal global FCC catalyst competitors are Albemarle Corp. and BASF which, with Johnson Matthey, are also principal global competitors in FCC additives. We also have multiple regional competitors for FCC catalysts and additives.
Hydroprocessing Catalysts
We market hydroprocessing catalysts, primarily through ART, our joint venture with Chevron. We established ART to combine our technology with that of Chevron and to develop, market and sell hydroprocessing catalysts to customers in the petroleum refining industry worldwide.
As discussed above, our business is dependent on the economics of the petroleum industry. Refineries increasingly use feedstocks that have high resid content. We are a leading supplier of hydroprocessing catalysts designed for processing these feedstocks. We offer products for fixed-bed resid hydrotreating, on-stream catalyst replacement and ebullating-bed resid hydrocracking processes.
5
We also offer a full line of catalysts, customized for individual refiners, used in distillate hydrotreating to produce ultra-low sulfur content gasoline and diesel fuel, including our SMART CATALYST SYSTEM
®
and APART
®
catalyst system. As discussed above, regulatory limitations on the sulfur content of gasoline and diesel fuel are becoming more common. These products are designed to help refiners to reduce the sulfur content of their products.
In early 2013, ART announced that it had obtained rights to sell hydrocracking and lubes hydroprocessing catalysts to licensees of Chevron Lummus Global and other petroleum refiners for unit refills. This arrangement is intended to streamline hydroprocessing catalyst supply and improve technical service for refining customers by establishing ART as the single point of contact for all their hydroprocessing catalyst needs.
Competition in the hydroprocessing catalyst industry is based on technology, product performance, customer service and price. Criterion, Albemarle, Haldor Topsoe, UOP and Axens are our leading global competitors in hydroprocessing catalysts. We also have multiple regional competitors.
Grace Catalysts Technologies—Polyolefin Catalysts, Catalyst Supports and Polypropylene Process Technology
We are a leading provider of catalyst systems and catalyst supports to the polyolefins industry for a variety of polyethylene and polypropylene process technologies. These types of catalysts are used for the manufacture of polyethylene and polypropylene thermoplastic resins used in products such as plastic film, high-performance plastic pipe, automobile parts, household appliances and household containers. We use a combination of proprietary catalyst and support technology, as well as technology licensed from third parties, to provide unique catalyst-based solutions to industry, and to provide a broad technology portfolio for enhancing collaboration opportunities with technology leaders.
Our MAGNAPORE
®
polymerization catalyst is used to produce high performance polyethylene in the slurry loop process for pipe and film applications. Our POLYTRAK
®
polymerization catalyst is designed to achieve improved polypropylene performance, particularly for impact resistant applications such as automobile bumpers and household appliances.
Our DAVICAT
®
standard and customized catalysts offer a wide range of chemical and physical properties based on our material science technology for supported catalysts, polystyrene, herbicide, neutriceuticals and on purpose olefins. Our RANEY
®
nickel, cobalt and copper hydrogenation and dehydrogenation catalysts are used for the synthesis of organic compounds for the fibers, polyurethanes, engineered plastics, pharmaceuticals, sweeteners and petroleum industries.
Our non-phthalate CONSISTA
®
and traditional SHAC
®
catalysts along with CONSISTA
®
and ADT donors have been designed for the UNIPOL
®
gas-phase polypropylene process technology but are also adaptable to a variety of other polypropylene gas-phase and slurry-phase polymerization processes.
The polyolefin catalyst and supports industry is technology-intensive and suppliers must provide products formulated to meet customer specifications. There are many manufacturers of polyolefin catalysts and supports including PQ/INEOS, Albemarle, LyondellBasell, Univation and BASF, and most sell their products worldwide.
We are also a leading licensor of gas-phase polypropylene process technology to polypropylene manufacturers. Our UNIPOL
®
technology, acquired in 2013, is designed to have fewer moving parts and require less equipment than other competing technologies in order to reduce operating costs. This technology provides our licensees with a reliable capability to manufacture products for a broad array of end-use applications. The polypropylene process licensing industry is technology-intensive and licensors must adapt the technology and the related licenses to meet individual customer needs. The major competing polypropylene process licensor is LyondellBasell.
Grace Catalysts Technologies—Manufacturing, Marketing and Raw Materials
Our Catalysts Technologies products are manufactured by a network of globally coordinated plants. Our integrated planning organization is responsible for the effective utilization of our manufacturing capabilities.
We use a global organization of technical professionals with extensive experience in refining processes, catalyst development, and catalyst applications to market our refining catalysts and additives. These professionals work to tailor our technology to the needs of each specific customer. We generally negotiate prices for our refining catalysts because our formulations are specific to the needs of each customer and each customer receives individual attention and technical service. We sell a significant portion of our hydroprocessing catalysts through multiple-year supply agreements with our geographically diverse customer base.
6
We use a global direct sales force for our polyolefin catalysts, supports and technologies and chemical catalysts that seeks to maintain close working relationships with our customers. These relationships enable us to cooperate with major polymer and chemical producers to develop catalyst technologies that complement their process or application developments. We have geographically distributed our sales and technical service professionals to make them responsive to the needs of our geographically diverse customers. We typically operate under long-term contracts with our customers.
Seasonality does not have a significant overall effect on our Catalysts Technologies operating segment. However, sales of FCC catalysts tend to be lower in the first calendar quarter prior to the shift in production by refineries from home heating oil for the winter season to gasoline production for the summer season. FCC catalysts and ebullating-bed hydroprocessing catalysts are consumed at a relatively steady rate and are replaced regularly. Fixed-bed hydroprocessing catalysts are consumed over a period of years and are replaced in bulk in an irregular pattern. Since our customers periodically shut down their refining processes to replace fixed-bed hydroprocessing catalysts in bulk, our hydroprocessing catalyst sales to any customer can vary substantially over the course of a year and between years based on that customer's catalyst replacement schedule.
The principal raw materials for Catalysts Technologies products include rare earths, molybdenum, caustic soda, aluminum, sodium aluminate, nickel, alumina, kaolin and cobalt. Multiple suppliers are generally available for each of these materials; however, some of our raw materials may be provided by single sources of supply. We seek to mitigate the risk of using single source suppliers by identifying and qualifying alternative suppliers or, for unique materials, by using alternative formulations from other suppliers or by passing price increases on to customers. In some instances, we produce our own raw materials and intermediates.
Prices for many of our raw materials, including metals and petroleum-based specialty and commodity materials such as resins and solvents, have been volatile in recent years. In response to increases in raw material costs, we generally take actions to mitigate the effect of higher costs including increasing prices, developing alternative formulations for our products and increasing productivity. In particular, during 2010, the People's Republic of China reduced its quotas on exports of the rare earths that we use in the manufacture of FCC catalysts, which significantly increased global prices. In response, in late 2010, we implemented rare earth surcharges on certain FCC catalysts that subsequently were removed in mid-2013 when the prices of these materials returned to stable levels. Rare earth surcharges increased sales by approximately $15 million, $110 million and $280 million in years 2013, 2012 and 2011, respectively. We also have taken other actions to reduce the impact of higher raw material costs on us and our customers.
As in many chemical businesses, we consume significant quantities of natural gas in the production of Catalysts Technologies products. World events and other economic factors have caused volatility in the price of natural gas. Increases or decreases in the cost of natural gas and raw materials can have a significant impact on our operating margins.
Grace Materials Technologies Operating Segment
Materials Technologies principally applies specialty silica, zeolite and resin technologies in the design and manufacture of products to create significant value for our diverse customer base. Our customers include coatings manufacturers, consumer product manufacturers, plastics manufacturers, producers of rigid food and beverage packaging, and pharmaceutical companies. We believe that our technological expertise provides a competitive advantage, allowing us to quickly design products that help our customers create value in their markets.
The following table sets forth Materials Technologies sales of similar products as a percentage of Grace total revenue.
|
2013
|
2012
|
2011
|
||||||||||||||||||
|
(In millions)
|
Sales
|
% of Grace Revenue
|
Sales
|
% of Grace Revenue
|
Sales
|
% of Grace Revenue
|
||||||||||||||
|
Engineered Materials
|
$
|
494.4
|
|
16.2
|
%
|
$
|
478.3
|
|
15.1
|
%
|
$
|
500.5
|
|
15.6
|
%
|
|||||
|
Packaging Products
|
384.1
|
|
12.5
|
%
|
384.3
|
|
12.2
|
%
|
372.1
|
|
11.6
|
%
|
||||||||
|
Total Materials Technologies Revenue
|
$
|
878.5
|
|
28.7
|
%
|
$
|
862.6
|
|
27.3
|
%
|
$
|
872.6
|
|
27.2
|
%
|
|||||
7
The following table sets forth Materials Technologies sales by region as a percentage of Materials Technologies total revenue.
|
2013
|
2012
|
2011
|
||||||||||||||||||
|
(In millions)
|
Sales
|
% of Materials Technologies Revenue
|
Sales
|
% of Materials Technologies Revenue
|
Sales
|
% of Materials Technologies Revenue
|
||||||||||||||
|
North America
|
$
|
176.7
|
|
20.1
|
%
|
$
|
174.0
|
|
20.2
|
%
|
$
|
173.1
|
|
19.8
|
%
|
|||||
|
Europe Middle East Africa
|
367.8
|
|
41.9
|
%
|
362.4
|
|
41.9
|
%
|
378.6
|
|
43.4
|
%
|
||||||||
|
Asia Pacific
|
197.4
|
|
22.5
|
%
|
185.9
|
|
21.6
|
%
|
184.1
|
|
21.1
|
%
|
||||||||
|
Latin America
|
136.6
|
|
15.5
|
%
|
140.3
|
|
16.3
|
%
|
136.8
|
|
15.7
|
%
|
||||||||
|
Total Materials Technologies Revenue
|
$
|
878.5
|
|
100.0
|
%
|
|
$
|
862.6
|
|
100.0
|
%
|
$
|
872.6
|
|
100.0
|
%
|
||||
Grace Materials Technologies—Silica-based Materials
We provide enabling technologies that are silica- and silica-alumina-based functional additives and process aids, such as silica gel, colloidal silica, zeolitic adsorbents, precipitated silica and silica-aluminas, for a wide variety of applications. Our product portfolio includes:
|
Application
|
Use
|
Key Brands
|
||
|
Coatings and Print Media
|
Matting agents, anticorrosion pigments, TiO
2
extenders and moisture scavengers for paints and lacquers
|
SYLOID
®
, SHIELDEX
®
, SYLOSIV
®
, SYLOWHITE™
|
||
|
Additives and formulations for matte, semi-glossy and glossy ink receptive coatings on high performance ink jet papers, photo paper, and commercial wide-format print media
|
SYLOJET
®
, DURAFILL
®
, LUDOX
®
|
|||
|
Paper retention aids, functional fillers, paper frictionizers
|
DURAFILL
®
, LUDOX
®
|
|||
|
Consumer
|
Toothpaste abrasives and thickening agents, free-flow agents, anticaking agents, tabletting aids, cosmetic additives and flavor carriers
|
SYLOID
®
FP, SYLODENT
®
, SYLOID
®
, SYLOBLANC
®
, ELFADENT
®
, SYLOSIV
®
|
||
|
Edible oil refining agents, beer stabilizers and clarification aids for beer, juices and other beverages
|
DARACLAR
®
, TRISYL
®
|
|||
|
Industrial
|
Reinforcing agents for rubber and tires
|
PERKASIL
®
|
||
|
Inorganic binders and surface smoothening aids for precision investment casting and refractory applications
|
LUDOX
®
|
|||
|
Adsorbents for dual pane windows and industrial applications, desiccant granules, beads, powders and bags and polyurethane moisture scavengers
|
PHONOSORB
®
, SYLOBEAD
®
, SYLOSIV
®
, CRYOSIV
®
, SAFETYSORB
®
|
|||
|
Chemical metal polishing aids and formulations for chemical mechanical planarization/electronics applications
|
LUDOX
®
, POLIEDGE
®
|
|||
|
Polymer additives for producers and processors of plastic products that prevent layers of polymer film from sticking together, improve dispersal of pigments and ease removal from molds
|
SYLOBLOC
®
|
|||
|
Process adsorbents used in petrochemical and natural gas processes for such applications as ethylene-cracked-gas-drying, natural gas drying and sulfur removal
|
SYLOBEAD
®
|
|||
|
Discovery Sciences
|
Flash chromatography systems and consumables
|
REVELERIS
®
, REVEALX™, GRACERESOLV™
|
||
|
Preparative scale purification products including media, column hardware, and equipment
|
DAVISIL
®
, VYDAC
®
, MODCOL
®
, SPRING
®
, MULTIPACKER
®
|
|||
|
Pharmaceutical excipients and intermediates
|
SYLOID
®
FP
|
|||
|
Analytical scale high performance liquid chromatography (HPLC) columns and detectors
|
VISIONHT
®
, VYDAC
®
, ALLTECH
®
, ALLTIMA
®
|
|||
|
CO
2
adsorbents for anesthesiology and re-breathing applications
|
SODASORB
®
|
|||
|
Fine chemical intermediates
|
SYNTHETECH
®
|
|||
8
Our silica-based engineered materials are integrated into our customers' manufacturing processes and, when combined with our technical support, increase the efficiency and performance of their products. By working closely with our customers, we help them to respond quickly to the changing needs of brand owners and consumers. We focus on high-growth segments and seek to develop and introduce new products that add additional value to the current and future needs of our customers. For example, our customers have incorporated our products into higher resolution print media, less abrasive high cleaning toothpastes and technologies that are friendly to the environment such as water-based and VOC-compliant coatings, green tires with lower roll resistance and non-toxic anticorrosion protection. Our discovery sciences products are used in a wide range of applications, including drug discovery and purification for the healthcare, pharmaceutical and biotechnology industries, environmental analysis, forensics, petrochemical analysis and the manufacture of food, cosmetics, vitamins and biofuels. We also market chromatography consumables and analytical and preparative columns packed with our specialty media. We can modify the base silica and surface chemistry for analytical, preparative and process-scale customers in order to enhance our product performance for their unique applications.
Our silica-based engineered materials sales are global. There are many manufacturers of engineered materials that market their products on a global basis including Evonik, PQ/INEOS, and UOP. Competition is generally based on product performance, technical service and reliability, price, and additional value-added features to address the needs of our customers, end-users and brand owners. Our discovery sciences products compete on the basis of product quality, distinct technology and customer support. Competition for these products is highly fragmented with a large number of companies that sell their products on a global and regional basis, although a number of companies, such as Waters Corporation, Agilent Technologies and Thermo-Fisher, have a substantial global position and a relatively large installed customer base.
Grace Materials Technologies—Packaging Products
We are a global leader in can and closure sealants that, along with our specialized can and closure coatings, we supply to the packaging industry. Our product portfolio includes:
|
Products
|
Key Brands
|
|
|
Can sealants for rigid containers that ensure a hermetic seal between the lid and the body of beverage, food, aerosol and other cans
|
DAREX
®
|
|
|
Sealants for metal and plastic bottle closures that are used on pry-off and twist-off metal crowns, as well as roll-on pilfer-proof and plastic closures to seal and enhance the shelf life of food and beverages in glass and plastic bottles and jars
|
DAREX
®
, DARAFORM
®
, DARASEAL
®
, DARABLEND
®
, SINCERA
®
, CELOX
®
|
|
|
Coatings for metal packaging that are used in the manufacture of cans and closures to protect the metal against corrosion, protect the contents against the influences of metal, ensure proper adhesion of sealing compounds to metal surfaces, and provide base coats for inks and for decorative purposes
|
DAREX
®
, APPERTA
®
, SISTIAGA
®
|
|
Our packaging products are designed to address major industry trends such as lighter weight packaging, lower energy consumption, personal convenience, and highly individualized packaging. Our growth is driven by innovation of higher performing products, continuous development of new applications, increasing demand for sustainability and rising disposable income in emerging regions. We seek to capitalize upon our technical customer service, global infrastructure and expertise in global regulatory compliance (including food law compliance) to enhance our growth, especially in emerging regions. We also seek to develop and introduce new products that add additional value to the current and future needs of our customers, such as our introduction of products with oxygen scavenging functionality.
Our packaging products sales are global. There are many manufacturers of packaging products that market their products on a global basis including Altana, Akzo Nobel, PPG and Valspar. Competition is generally based on product performance, technical service and reliability, price and additional value-added features to address the needs of our customers, end-users and brand owners.
Grace Materials Technologies—Manufacturing, Marketing and Raw Materials
Our Materials Technologies
products are manufactured by a network of globally integrated plants that are positioned to service our customers regionally. Our packaging products are manufactured in both large facilities to permit economies of scale and a network of smaller operations that enable customization to local market conditions. Our integrated planning organization is responsible for the effective utilization of our manufacturing capabilities.
9
We use country-based direct sales forces that are dedicated to each product line and backed by application-specific technical customer service teams to market our Materials Technologies products. Our sales force seeks to develop long-term relationships with our customers and focuses on consultative sales, technical support and key account growth programs. To ensure full geographic coverage, our direct sales organization is further supplemented by a network of agents and distributors.
Seasonality does not have a significant overall effect on our Materials Technologies
operating segment; however, our packaging products and some of our construction-related products such as insulated glass desiccants are affected by seasonal and weather-related factors including the consumption of beverages, the size and quality of food crops and the level of construction activity. These impacts are mitigated by the global scope of our business.
The principal raw materials for Materials Technologies
products include sodium silicate, solvents, resins, latexes (including certain food-grade raw materials) and rubber. Multiple suppliers are generally available for each of these materials; however, some of our raw materials may be provided by single sources of supply. We seek to mitigate the risk of using single source suppliers by identifying and qualifying alternative suppliers or, for unique materials, by using alternative formulations from other suppliers or by passing price increases on to customers. In some instances, we produce our own raw materials and intermediates.
Prices for many of our raw materials, including specialty and commodity materials such as latex, rubbers, pigments, resins and solvents, have been volatile in recent years. In response to increases in raw material costs, we generally take actions to mitigate the effect of higher costs including increasing prices, developing alternative formulations for our products and increasing productivity.
As in many chemical businesses, we consume significant quantities of natural gas in the production of Materials Technologies products. World events and other economic factors have caused volatility in the price of natural gas. Increases or decreases in the cost of natural gas and raw materials can have a significant impact on our operating margins.
Since we manufacture a substantial portion of our packaging products in emerging regions using raw materials from suppliers in the U.S., Europe and other advanced economies, changes in the values of the currencies of these emerging regions versus the U.S. dollar and the euro may adversely affect our raw material costs and the prices we may charge for our products.
Grace Construction Products Operating Segment
Construction Products produces and sells specialty construction chemicals and specialty building materials. We are a supplier to the nonresidential (commercial and infrastructure) construction industry, and to a lesser extent, the residential construction and repair and restoration industries.
The following table sets forth Construction Products sales of similar products as a percentage of Grace total revenue.
|
2013
|
2012
|
2011
|
||||||||||||||||||
|
(In millions)
|
Sales
|
% of Grace Revenue
|
Sales
|
% of Grace Revenue
|
Sales
|
% of Grace Revenue
|
||||||||||||||
|
Specialty Construction Chemicals
|
$
|
688.0
|
|
22.5
|
%
|
$
|
680.7
|
|
21.6
|
%
|
$
|
656.6
|
|
20.5
|
%
|
|||||
|
Specialty Building Materials
|
370.2
|
|
12.1
|
%
|
344.1
|
|
10.9
|
%
|
335.4
|
|
10.4
|
%
|
||||||||
|
Total Construction Products Revenue
|
$
|
1,058.2
|
|
34.6
|
%
|
$
|
1,024.8
|
|
32.5
|
%
|
$
|
992.0
|
|
30.9
|
%
|
|||||
10
The following table sets forth Construction Products sales by region as a percentage of Construction Products total revenue.
|
2013
|
2012
|
2011
|
||||||||||||||||||
|
(In millions)
|
Sales
|
% of Construction Products Revenue
|
Sales
|
% of Construction Products Revenue
|
Sales
|
% of Construction Products Revenue
|
||||||||||||||
|
North America
|
$
|
423.2
|
|
39.9
|
%
|
$
|
411.5
|
|
40.2
|
%
|
$
|
406.3
|
|
41.0
|
%
|
|||||
|
Europe Middle East Africa
|
260.9
|
|
24.7
|
%
|
269.7
|
|
26.3
|
%
|
281.6
|
|
28.4
|
%
|
||||||||
|
Asia Pacific
|
233.7
|
|
22.1
|
%
|
217.5
|
|
21.2
|
%
|
198.8
|
|
20.0
|
%
|
||||||||
|
Latin America
|
140.4
|
|
13.3
|
%
|
126.1
|
|
12.3
|
%
|
105.3
|
|
10.6
|
%
|
||||||||
|
Total Construction Products Revenue
|
$
|
1,058.2
|
|
100.0
|
%
|
$
|
1,024.8
|
|
100.0
|
%
|
$
|
992.0
|
|
100.0
|
%
|
|||||
Grace Construction Products—Specialty Construction Chemicals
We supply concrete admixtures and fibers used to modify the rheology, improve the durability and enhance various other properties of concrete, mortar, masonry and other cementitious construction materials; and additives used in cement processing to improve energy efficiency in manufacturing, enhance the characteristics of finished cement and improve ease of use, including the following products:
|
Products
|
Uses
|
Customers
|
Key Brands
|
|||
|
Concrete admixtures
|
Concrete admixtures and polymeric fibers used to reduce the production and in-place costs of concrete, increase the performance of concrete and improve the life cycle cost of the structure
|
Ready-mix and precast concrete producers, engineers and specifiers
|
ADVA
®
, STRUX
®
,
MIRA
®
,
POLARSET
®
, ECLIPSE
®
|
|||
|
Additives for cement processing
|
Cement additives added to the grinding stage of the cement manufacturing process to improve the energy efficiency of the plant and enhance the performance of the finished cement. Chromium reducing additives help cement manufacturers in Europe meet environmental regulations
|
Cement manufacturers
|
CBA
®
, SYNCHRO
®
, HEA2
®
, TDA
®
|
|||
|
Products for architectural concrete
|
Products for architectural concrete include surface retarders, coatings, pigments and release agents used by concrete producers and contractors to enhance the surface appearance and aesthetics of concrete
|
Precast concrete producers and architects
|
PIERI
®
|
|||
|
Admixtures for masonry concrete
|
Products for masonry concrete used by block and paver producers for process efficiency and to improve the appearance, durability and water resistance of finished concrete masonry units
|
Masonry block manufacturers
|
DRY-BLOCK
®
, OPTEC
®
, QUANTEC
®
|
|||
|
Process control solutions for ready mix concrete
|
Electro-mechanical devices, sensors and other technologies that assist concrete producers in controlling product quality and production costs
|
Ready mix concrete manufacturers
|
VERIFI
®
|
|||
Grace Construction Products—Specialty Building Materials
We supply building materials used in both new construction and renovation/repair projects. The products protect buildings and civil engineering structures from water, vapor and air penetration. The portfolio includes waterproofing membranes for commercial and residential buildings, specialty grouts for use in waterproofing and soil stabilization applications, air and vapor barriers, and other products to solve the specialized needs of preventative and repair applications including the following:
11
|
Products
|
Uses
|
Customers
|
Key Brands
|
|||
|
Structural waterproofing, vapor and air barrier systems
|
Structural waterproofing and air barrier systems to prevent water, vapor and/or air infiltration in commercial structures, including self-adhered sheet and liquid membranes, joint sealing materials, drainage composites and waterstops.
|
Architects and structural engineers; specialty waterproofing and general contractors; specialty waterproofing distributors
|
BITUTHENE
®
, PROCOR
®
, PREPRUFE
®
, ADPRUFE
®
, HYDRODUCT
®
, PERM-A-BARRIER
®
, ADCOR
®
ES, SILCOR
®
|
|||
|
Residential building materials
|
Specialty roofing membranes and flexible flashings for windows, doors, decks and detail areas, including fully adhered roofing underlayments, synthetic underlayments and self-adhered flashing.
|
Roofing contractors, home builders and remodelers; specialty roofing distributors, lumberyards and home centers; homeowners; architects and specifiers
|
ICE & WATER SHIELD
®
, TRI-FLEX
®
, VYCOR
®
|
|||
|
Remedial waterproofing
|
Products for repair and remediation in waterproofing applications and soil stabilization
|
Contractors, municipalities and other owners of large infrastructure facilities
|
DENEEF® HYDRO ACTIVE® Cut, DENEEF® AC-400, DENEEF® SWELLSEAL® WA, DENEEF® MC-500™
|
|||
|
Fire protection
|
Fire protection products spray-applied to the structural steel frame, encasing and insulating the steel and protecting the building in the event of fire.
|
Local contractors and specialty subcontractors and applicators; building materials distributors; industrial manufacturers; architects and structural engineers
|
MONOKOTE
®
|
|||
Grace Construction Products—Manufacturing, Marketing and Raw Materials
In view of our diversity of customers and customer requirements, and because specialty construction chemicals and specialty building materials require intensive sales and customer service efforts, we maintain a direct sales and technical support team with sales personnel based in approximately 40 countries worldwide. This sales and support team sells products under global contracts, under U.S. or regional contracts, and on a job-by-job basis. We also use distributors in both U.S. and non-U.S. markets. We compete globally with several large construction materials suppliers, and regionally and locally with numerous smaller competitors. Competition for our construction products is based on product performance, technical support and service, brand name recognition in the construction industry and price. Our major global specialty construction chemicals competitors are BASF and Sika.
In recent years, the cement and concrete industry has experienced some consolidation, thereby increasing the importance of serving well our global customers. For some customer groups, such as producers and contractors, operational efficiency and total applied cost are key factors in making purchasing decisions, while for others, such as architects and engineers, product performance and design versatility are more important.
We seek to improve our products, adapt them for new applications and add new products through our growth and innovation processes that focus on understanding the needs of our customers, key performance indicators and research and development.
In addition to new product introductions and product enhancements, we look for growth opportunities in emerging regions where increasing construction activity, improvement in building codes, and sophistication of construction practices can accelerate demand for our construction products. We continue to expand our commercial and manufacturing capabilities in these geographic areas.
The key raw materials used in our specialty construction products are obtained from a variety of suppliers, including basic chemical and petrochemical producers. The majority of our raw materials are organic chemicals derived from olefins. We also make significant purchases of inorganic materials such as gypsum, as well as specialty materials including specialty films, papers and fibers. In most instances, these materials are available from multiple sources. Global supply and demand factors, changes in currency exchange rates, and petroleum prices have significantly impacted the price and availability of key raw materials in recent years.
Since we manufacture a substantial portion of our construction products in emerging regions using raw materials from suppliers in the U.S., Europe and other advanced economies, changes in the values of the currencies of these emerging regions versus the U.S. dollar and the euro may adversely affect our raw material costs and the prices we may charge for our products.
12
The construction business is cyclical in response to economic conditions and construction demand. The construction business is also seasonal and dependent on favorable weather conditions, with a decrease in construction activity during the winter months. Demand for our specialty construction products is primarily driven by global non-residential construction activity and U.S. residential construction activity. We seek to increase profitability and minimize the impact of cyclical downturns in regional economies by introducing technically advanced high-performance products and expanding geographically. Although these strategies have been successful in reducing the impact of cyclicality, the decline in U.S. and European construction activity since 2007 has had a negative impact on our sales.
FINANCIAL INFORMATION ABOUT INDUSTRY SEGMENTS AND GEOGRAPHIC AREAS
Disclosure of financial information about industry segments and geographic areas for
2013
,
2012
and
2011
is provided in this Report in Item 8 (Financial Statements and Supplementary Data) in the Financial Supplement under Note 20 (Operating Segment Information) to the Consolidated Financial Statements, which disclosure is incorporated herein by reference. Disclosure of risks attendant to our foreign operations is provided in this Report in Item 1A (Risk Factors).
BACKLOG OF ORDERS
While at any given time there may be some backlog of orders, this backlog is not material in respect to our total annual sales, nor are the changes, from time to time, significant.
INTELLECTUAL PROPERTY; RESEARCH ACTIVITIES
Competition in the specialty chemicals and specialty materials industry is often based on technological superiority and innovation. Our ability to maintain our margins and effectively compete with other suppliers depends on our ability to introduce new products based on innovative technology, as well as our ability to obtain patent or other intellectual property protection. Our research and development programs emphasize development of new products and processes, improvement of existing products and processes and application of existing products and processes to new industries and uses. We conduct research in all regions, with North America and Europe accounting for the most activity.
We routinely file and obtain patents in a number of countries around the world that are significant to our businesses in order to protect our investments in innovation, research, and product development. Numerous patents and patent applications protect our products, formulations, manufacturing processes, equipment, and improvements. We also benefit from the use of trade secret information, including know-how and other proprietary information relating to many of our products and processing technologies. There can be no assurance, however, that our patents, patent applications and precautions to protect trade secrets and know-how will provide sufficient protection for our intellectual property. In addition, other companies may independently develop technology that could replicate, and thus diminish the advantage provided by, our trade secrets. Other companies may also develop alternative technology or design-arounds that could circumvent our patents or may acquire patent rights applicable to our business which might interpose some limitation on expansion of the business in the future.
Research and development expenses were approximately
$65 million
in
2013
and
2012
and
$69 million
in
2011
. These amounts include depreciation and amortization expenses related to research and development and expenses incurred in funding external research projects. The amount of research and development expenses relating to government- and customer-sponsored projects (rather than projects that we sponsor) was not material during these periods. Grace also conducts research and development activities with our ART joint venture, which is not included in the amounts above.
ENVIRONMENT, HEALTH AND SAFETY MATTERS
We are subject, along with other manufacturers of specialty chemicals, to stringent regulations under numerous U.S. federal, state and local and foreign environment, health and safety laws and regulations relating to the generation, storage, handling, discharge, disposition and stewardship of hazardous wastes and other materials. Environmental laws require that certain responsible parties, as defined in the relevant statute, fund remediation actions regardless of legality of original disposal or ownership of a disposal site. We are involved in remediation actions to address hazardous wastes or other materials as required by U.S. federal, state and local and foreign laws.
We have expended substantial funds to comply with environmental laws and regulations and expect to continue to do so in the future. The following table sets forth our expenditures in the past three years, and our
13
estimated expenditures in
2014
and
2015
, for (i) the operation and maintenance of manufacturing facilities and the disposal of wastes; (ii) capital expenditures for environmental control facilities; and (iii) site remediation:
|
Year
(In millions)
|
Operation of
Facilities and
Waste Disposal
|
Capital
Expenditures
|
Site
Remediation
|
||||||||||
|
2011
|
$
|
58
|
|
$
|
6
|
|
$
|
12
|
|
||||
|
2012
|
61
|
|
9
|
|
13
|
|
|||||||
|
2013
|
59
|
|
17
|
|
14
|
|
|||||||
|
2014
|
59
|
|
19
|
|
18
|
|
*
|
||||||
|
2015
|
60
|
|
10
|
|
7
|
|
*
|
||||||
|
*
|
Amounts are based on site remediation matters for which sufficient information is available to estimate remediation costs. We do not have sufficient information to estimate all of Grace's possible future remediation costs. As we receive new information, our estimate of remediation costs may change materially.
|
Additional information about our environmental remediation activities is provided in this Report in Item 8 (Financial Statements and Supplementary Data) in the Financial Supplement under Note 13 (Commitments and Contingent Liabilities) to the Consolidated Financial Statements.
We continuously seek to improve our environmental, health and safety performance. To the extent applicable, we extend the basic elements of the American Chemistry Council's RESPONSIBLE CARE
®
program to all our locations worldwide, embracing specific performance objectives in the key areas of management systems, product stewardship, employee health and safety, community awareness and emergency response, distribution, process safety and pollution prevention. We have implemented key elements of the RESPONSIBLE CARE
®
Security Code for our operations and systems. We have completed a review of our existing security (including cyber-security) vulnerability and have taken actions to enhance our security systems and protect our assets. We have undertaken certain activities to comply with the Department of Homeland Security (DHS) Chemical Facility Anti-Terrorism Standards, including identifying facilities subject to the standards, conducting security vulnerability assessments and developing site security plans, as necessary.
EMPLOYEE RELATIONS
As of
December 31, 2013
, we employed approximately
6,700
persons, of whom approximately
2,700
were employed in the United States. Of our total employees, approximately
4,700
were salaried and
2,000
were hourly.
Approximately
750
of our manufacturing employees in the United States are represented for collective bargaining purposes by nine different local collective bargaining groups. We have operated without a labor work stoppage for more than 10 years.
We have works councils representing the majority of our European sites serving approximately
1,400
employees.
AVAILABILITY OF REPORTS AND OTHER DOCUMENTS
We maintain an Internet website at
www.grace.com
. Our annual reports on Form 10-K, quarterly reports on Form 10-Q, current reports on Form 8-K, and amendments to those reports, filed or furnished pursuant to Section 13(a) or 15(d) of the Securities Exchange Act of 1934, as amended, are available, free of charge, on our website as soon as reasonably practicable after such reports are electronically filed with, or furnished to, the Securities and Exchange Commission, or SEC. These reports may be accessed through our website's investor information page.
In addition, the charters for the Audit, Compensation, Nominating and Governance, and Corporate Responsibility Committees of our Board of Directors, our corporate governance guidelines and code of ethics are available, free of charge, on our website at
www.grace.com/About/Leadership/Governance/
. Printed copies of the charters, governance guidelines and code of ethics may be obtained free of charge by contacting Grace Shareholder Services at 410-531-4167.
The information on our website is not, and shall not be deemed to be, a part of this report or incorporated into any other filings we make with the SEC.
14
Our Chief Executive Officer and Chief Financial Officer have submitted certifications to the SEC pursuant to the Sarbanes Oxley Act of 2002 as exhibits to this Report.
EXECUTIVE OFFICERS
See Part III, Item 10 of this Report for information about our Executive Officers.
This Report, including the Financial Supplement, contains, and our other public communications may contain, forward-looking statements; that is, information related to future, not past, events. Such statements generally include the words "believes," "plans," "intends," "targets," "will," "expects," "suggests," "anticipates," "outlook," "continues" or similar expressions. Forward-looking statements include, without limitation, all statements regarding: our Chapter 11 case; expected financial positions; results of operations; cash flows; financing plans; business strategy; budgets; capital and other expenditures; competitive positions; growth opportunities for existing products; benefits from new technology and cost reduction initiatives; plans and objectives; and markets for securities. For these statements, we claim the protection of the safe harbor for forward-looking statements contained in the Private Securities Litigation Reform Act of 1995. Like other businesses, we are subject to risks and uncertainties that could cause our actual results to differ materially from our projections or that could cause other forward-looking statements to prove incorrect. Factors that could cause actual events to materially differ from those contained in the forward-looking statements include those factors set forth below and elsewhere in this Annual Report on Form 10-K. Our reported results should not be considered as an indication of our future performance. Readers are cautioned not to place undue reliance on our projections and forward-looking statements, which speak only as of the date thereof. We undertake no obligation to publicly release any revisions to the projections and forward-looking statements contained in this document, or to update them to reflect events or circumstances occurring after the date of this document. In addition to general economic, business and market conditions, we are subject to other risks and uncertainties, including, without limitation, the following:
The length and depth of product and industry business cycles in our segments may result in periods of reduced sales, earnings and cash flows, and portions of our business are subject to seasonality and weather-related effects.
Our operating segments are sensitive to the cyclical nature of the industries they serve. Our construction business is cyclical in response to economic conditions and construction demand and is also seasonal and dependent on favorable weather conditions, with a decrease in construction activity during the winter months. Sales of our FCC catalysts tend to be lower in the first calendar quarter prior to the shift in production by refineries from home heating oil for the winter season to gasoline production for the summer season. Our packaging products are affected by seasonal and weather-related factors including the consumption of beverages and the size and quality of food crops.
The global scope of our operations subjects us to the risks of doing business in foreign countries, which could adversely affect our business, financial condition and results of operations.
We operate our business on a global scale with approximately
71%
of our 2013 sales outside the United States. We conduct business in over 40 countries and in more than 50 currencies. We currently have many production facilities, research and development facilities and administrative and sales offices located outside North America, including facilities and offices located in Europe, the Middle East, Africa, Asia and Latin America. We expect non-U.S. sales to continue to represent a substantial majority of our revenue. Accordingly, our business is subject to risks related to the differing legal, political, social and regulatory requirements and economic conditions of many jurisdictions. Risks inherent in non-U.S. operations include the following:
|
•
|
commercial agreements may be more difficult to enforce and receivables more difficult to collect;
|
|
•
|
intellectual property rights may be more difficult to enforce;
|
|
•
|
increased shipping costs, disruptions in shipping or reduced availability of freight transportation;
|
|
•
|
we may have difficulty transferring our profits or capital from foreign operations to other countries where such funds could be more profitably deployed;
|
|
•
|
we may experience unexpected adverse changes in export duties, quotas and tariffs and difficulties in obtaining export licenses;
|
|
•
|
some foreign countries have adopted, and others may impose, additional withholding taxes or adopt other restrictions on foreign trade or investment, including currency exchange and capital controls;
|
15
|
•
|
foreign governments may nationalize private enterprises;
|
|
•
|
our business and profitability in a particular country could be affected by political or economic repercussions on a domestic, country specific or global level from terrorist activities and the response to such activities;
|
|
•
|
we may be affected by unexpected adverse changes in foreign laws or regulatory requirements; and
|
|
•
|
unanticipated events, such as geopolitical changes, could adversely affect these operations.
|
Our success as a global business will depend, in part, upon our ability to succeed in differing legal, regulatory, economic, social and political conditions by developing, implementing and maintaining policies and strategies that are effective in each location where we do business.
We are exposed to currency exchange rate changes that impact our profitability.
We are exposed to currency exchange rate risk through our U.S. and non-U.S. operations. Changes in currency exchange rates may materially affect our operating results. For example, changes in currency exchange rates may affect the relative prices at which we and our competitors sell products in the same region and the cost of materials used in our operations. A substantial portion of our net sales and assets are denominated in currencies other than the U.S. dollar. When the U.S. dollar strengthens against other currencies, at a constant level of business, our reported sales, earnings, assets and liabilities are reduced because the non-U.S. currencies translate into fewer U.S. dollars.
We incur a currency transaction risk whenever one of our operating subsidiaries enters into either a purchase or a sales transaction using a currency different from the operating subsidiary's functional currency. Given the volatility of exchange rates, we may not be able to manage our currency transaction risks effectively, or volatility in currency exchange rates may expose our financial condition or results of operations to a significant additional risk.
Prices for certain raw materials and energy are volatile; we may not be able to pass through increases in costs for raw materials and energy or maintain our current pricing levels, which may hurt our profitability.
We use petroleum-based materials, metals, natural gas and other materials in the manufacture of our products. Prices for these materials are volatile and can have a significant effect on our pricing, sales, manufacturing and supply chain strategies as we seek to maximize our profitability. In 2012 and 2011, our Grace Catalysts Technologies sales were affected by significant increases in the prices of the rare earths used in the manufacture of our FCC catalysts. In response, we implemented surcharges on our FCC catalysts. In the 2011 third quarter, rare earth prices reached a peak and have since declined significantly. As a result, the amount of our surcharges has decreased with a corresponding decrease in sales. In 2013 and 2012, respectively, the negative effect of lower rare earth surcharges on sales was approximately $97 million and $170 million compared with the respective prior year. Our ability to successfully adjust strategies in response to volatile raw material and energy prices is a significant factor in maintaining or improving our profitability. If we are unable to successfully adjust our strategies in response to volatile prices, such volatility could have a negative effect on our sales and earnings in future periods.
A substantial portion of our raw materials are commodities whose prices fluctuate as market supply and demand fundamentals change.
We attempt to manage exposure to price volatility of major commodities through:
|
•
|
long-term supply contracts;
|
|
•
|
contracts with customers that permit adjustments for changes in prices of commodity-based materials and energy;
|
|
•
|
forward buying programs that layer in our expected requirements systematically over time; and
|
|
•
|
limited use of financial instruments.
|
Although we regularly assess our exposure to raw material price volatility, we cannot always predict the prospects of volatility and we cannot always cover the risk in a cost effective manner.
We have a policy of maintaining, when available, multiple sources of supply for raw materials. However, certain of our raw materials may be provided by single sources of supply. We may not be able to obtain sufficient raw materials due to unforeseen developments that would cause an interruption in supply. Even if we have multiple sources of supply for raw materials, these sources may not make up for the loss of a major supplier.
16
If we are not able to continue our technological innovation and successful introduction of new products, our customers may turn to other suppliers to meet their requirements.
The specialty chemicals industry and the end-use markets into which we sell our products experience ongoing technological change and product improvements. A key element of our business strategy is to invest in research and development activities with the goal of introducing new high-performance, technically differentiated products. We may not be successful in developing new technology and products that successfully compete with products introduced by our competitors, and our customers may not accept, or may have lower demand for, our new products. If we fail to keep pace with evolving technological innovations or fail to improve our products in response to our customers’ needs, then our business, financial condition and results of operations could be adversely affected as a result of reduced sales of our products.
We spend large amounts of money for environmental compliance in connection with our current and former operations.
As a manufacturer of specialty chemicals and specialty materials, we are subject to stringent regulations under numerous U.S. federal, state, local and foreign environmental, health and safety laws and regulations relating to the generation, storage, handling, discharge, disposition and stewardship of hazardous wastes and other materials. We have expended substantial funds to comply with such laws and regulations and have established a policy to minimize our emissions to the environment. Nevertheless, legislative, regulatory and economic uncertainties (including existing and potential laws and regulations pertaining to climate change) make it difficult for us to project future spending for these purposes and if there is an acceleration in new regulatory requirements, we may be required to expend substantial additional funds to remain in compliance.
We are subject to environmental clean-up costs, fines, penalties and damage claims that have been and continue to be costly.
Grace is subject to lawsuits and regulatory actions, in connection with current and former operations (including divested businesses), for breaches of environmental laws that seek clean-up or other remedies. Grace is also subject to lawsuits and investigations by public and private parties under various environmental laws in connection with our current and former operations in various states, including with respect to off-site disposal at facilities where Grace has been identified as a potentially responsible party under the Comprehensive Environmental Response, Compensation and Liability Act of 1980, as amended, commonly referred to as CERCLA. We are also subject to similar risks outside of the U.S.
Grace operated a vermiculite mine in Libby, Montana, until 1990. Some of the vermiculite ore that was mined at the Libby mine contained natural occurrences of asbestos. Grace is cooperating with EPA to investigate the Libby vermiculite mine and the surrounding bodies of water and forest lands and determine a final remedy. During 2010, EPA began reinvestigating up to 105 facilities where vermiculite concentrate from the Libby mine was processed. We are cooperating with EPA on this reinvestigation. EPA has requested that we conduct additional remediation at eight of these facilities. It is probable that EPA will request additional remediation at other facilities. We do not have sufficient information to identify either the sites that might require additional remediation or estimate the cost of any additional remediation. We will evaluate our estimated remediation liability for other sites as we receive additional information from EPA.
We have established accounting accruals for all environmental matters for which a loss is considered to be probable and sufficient information is available to reasonably estimate the loss. We do not have sufficient information to accrue for all of Grace's environmental risks. These accruals do not include the cost to remediate the Libby vermiculite mine or costs related to any additional EPA claims, whether resulting from EPA's reinvestigation of vermiculite facilities or otherwise, which may be material but are not currently estimable. Due to these vermiculite-related matters, it is probable that Grace's ultimate liability for environmental matters will exceed Grace's current estimates by material amounts.
We require liquidity to service our debt and to fund operations, capital expenditures, research and development efforts, acquisitions and other corporate expenses.
Our ability to fund operations, capital expenditures, research and development efforts, acquisitions and other corporate expenses, including repayment of our debt, depends on our ability to generate cash through future operating performance, which is subject to economic, financial, competitive, legislative, regulatory and other factors. Many of these factors are beyond our control. We cannot be certain that our businesses will generate sufficient cash or that future borrowings will be available to us in amounts sufficient to fund all of our requirements. If we are unable
17
to generate sufficient cash to fund all of our requirements, we may need to pursue one or more alternatives, such as to:
|
•
|
reduce or delay planned capital expenditures, research and development spending or acquisitions;
|
|
•
|
obtain additional financing or restructure or refinance all or a portion of our debt on or before maturity;
|
|
•
|
sell assets or businesses; and
|
|
•
|
sell additional equity.
|
Any reduction or delay in planned capital expenditures, research and development spending or acquisitions or sale of assets or businesses may materially and adversely affect our future revenue prospects. In addition, we cannot be certain that we will be able to raise additional equity capital, restructure or refinance any of our debt or obtain additional financing on commercially reasonable terms or at all.
Our indebtedness may adversely affect our business, financial condition and operating results.
Our indebtedness may have material adverse effects on our business, including to:
|
•
|
require us to dedicate a substantial portion of our cash to payments on our debt, thereby reducing the availability of cash to fund working capital, capital expenditures and other general operating requirements;
|
|
•
|
restrict us from making strategic acquisitions or taking advantage of favorable business opportunities;
|
|
•
|
limit our flexibility to plan for, or react to, changes in our business and the industries in which we operate, which may adversely affect our operating results and ability to meet our debt service obligations with respect to our outstanding debt; and
|
|
•
|
increase our vulnerability to adverse general economic and industry conditions, including recessions.
|
If we incur additional debt, the risks related to our indebtedness may intensify.
We have unfunded and underfunded pension plan liabilities. We will require future operating cash flow to fund these liabilities. We have no assurance that we will generate sufficient cash to satisfy these obligations.
We maintain U.S. and non-U.S. defined benefit pension plans covering current and former employees who meet or met age and service requirements. Our net pension liability and cost is materially affected by the discount rate used to measure pension obligations, the longevity and actuarial profile of our workforce, the level of plan assets available to fund those obligations and the actual and expected long-term rate of return on plan assets. Significant changes in investment performance or a change in the portfolio mix of invested assets can result in corresponding increases and decreases in the valuation of plan assets or in a change in the expected rate of return on plan assets. Assets available to fund the pension benefit obligation of the U.S. advance-funded pension plans at December 31, 2013, were approximately $1,145 million, or approximately $52 million less than the measured pension benefit obligation on a U.S. GAAP basis. In addition, any changes in the discount rate could result in a significant increase or decrease in the valuation of pension obligations, affecting the reported funded status of our pension plans as well as the net periodic pension cost in the following years. Similarly, changes in the expected return on plan assets can result in significant changes in the net periodic pension cost in the following years.
Our obligation to make payments to the PD Trust in respect of asbestos PD Claims (other than ZAI PD Claims) is not capped
and we may be obligated to make additional payments.
Under the Joint Plan, an asbestos property damage trust has been established and funded under Section 524(g) of the Bankruptcy Code. The order of the Bankruptcy Court confirming the Joint Plan contains a channeling injunction which provides that all pending and future asbestos-related property damage claims and demands, PD Claims, can only be brought against the PD Trust. The PD Trust contains two accounts. One of these accounts, the PD Account, is funded solely in respect of PD Claims other than those PD Claims related to our former ZAI attic insulation product. Unresolved and future non-ZAI PD Claims are to be litigated pursuant to procedures to be approved by the Bankruptcy Court and, to the extent such PD claims are determined to be allowed claims, are to be paid in cash by the PD Trust. We are obligated to make a payment to the PD Trust every six months in the amount of any non-ZAI PD Claims allowed during the preceding six months plus interest (if any) and, except for the first six months, the amount of PD Trust expenses for the preceding six months (the "PD Obligation"). The aggregate amount we are required to pay under the PD Obligation is not capped so we may have to make additional payments to the PD Account in respect of the PD Obligation. We are also obligated to make up to 10 contingent deferred payments to the PD Trust of $8 million during the 20-year period beginning on the fifth anniversary of the effective date, i.e. February 3, 2019, in respect of ZAI PD Claims in the event the ZAI PD Account's assets fall below $10 million in the preceding year. We have accrued liabilities for probable PD Claims expected to be resolved after
18
emergence from bankruptcy, but have not accrued any liability for the contingent ZAI PD payments as we do not believe they are probable.
Our ability to use tax deductions to reduce future tax payments may be limited if there is a change in ownership of Grace or if Grace does not generate sufficient U.S. taxable income.
Our ability to use future tax deductions, including net operating losses and deductions for the payments required by the Joint Plan (including the deferred payments), may be limited by Section 382 of the Internal Revenue Code of 1986, as amended, if we undergo an ownership change as a result of future changes in the ownership of outstanding Grace common stock. In addition, our ability to use future tax deductions is dependent on our ability to generate sufficient future taxable income in the U.S. Our certificate of incorporation provides that under certain circumstances, our Board of Directors would have the authority to impose restrictions on the transfer of Grace common stock with respect to certain 5% shareholders in order to preserve these future tax deductions.
We intend to pursue acquisitions, joint ventures and other transactions that complement or expand our businesses. We may not be able to complete proposed transactions and even if completed, the transactions may involve a number of risks that may materially and adversely affect our business, financial condition and results of operations.
We have recently completed a number of acquisitions that we believe will contribute to our future success. We intend to continue to pursue opportunities to buy other businesses or technologies that could complement, enhance or expand our current businesses or product lines or that might otherwise offer us growth opportunities. We may have difficulty identifying appropriate opportunities or, if we do identify opportunities, we may not be successful in completing transactions for a number of reasons. Any transactions that we are able to identify and complete may involve a number of risks, including:
|
•
|
the diversion of management's attention from our existing businesses to integrate the operations and personnel of the acquired or combined business or joint venture;
|
|
•
|
possible adverse effects on our operating results during the integration process;
|
|
•
|
failure of the acquired business to achieve expected operational objectives; and
|
|
•
|
our possible inability to achieve the intended objectives of the transaction.
|
In addition, we may not be able to successfully or profitably integrate, operate, maintain and manage our newly acquired operations or their employees. We may not be able to maintain uniform standards, controls, procedures and policies, which may lead to operational inefficiencies.
We work with dangerous materials that can injure our employees, damage our facilities and disrupt our operations.
Some of our operations involve the handling of hazardous materials that may pose the risk of fire, explosion, or the release of hazardous substances. Such events could result from terrorist attacks, natural disasters, or operational failures, and might cause injury or loss of life to our employees and others, environmental contamination, and property damage. These events might cause a temporary shutdown of an affected plant, or portion thereof, and we could be subject to penalties or claims as a result. A disruption of our operations caused by these or other events could have a material adverse effect on our results of operations.
Some of our employees are unionized, represented by workers' councils or employed subject to local laws that are less favorable to employers than the laws in the United States.
As of
December 31, 2013
, we had approximately
6,700
global employees. Approximately
750
of our approximately
2,700
U.S. employees are unionized. In addition, a large number of our employees are employed in countries in which employment laws provide greater bargaining or other rights to employees than the laws in the United States. Such employment rights require us to work collaboratively with the legal representatives of the employees to effect any changes to labor arrangements. For example, most of our employees in Europe are represented by workers' councils that have co-determination rights on any changes in conditions of employment, including salaries and benefits and staff changes, and may impede efforts to restructure our workforce. A strike, work stoppage or slowdown by our employees or significant dispute with our employees, whether or not related to these negotiations, could result in a significant disruption of our operations or higher ongoing labor costs.
19
We may be subject to claims of infringement of the intellectual property rights of others, which could hurt our business.
From time to time, we face infringement claims from our competitors or others alleging that our processes or products infringe on their proprietary technologies. Any claims that our products or processes infringe the intellectual property rights of others, regardless of the merit or resolution of the claims, could cause us to incur significant costs in responding to, defending and resolving the claims, and may divert the efforts and attention of our management and technical personnel from our business. If we are found to be infringing on the proprietary technology of others, we may be liable for damages, and we may be required to change our processes, redesign our products, pay others to use the technology or stop using the technology or producing the infringing product. Even if we ultimately prevail, the existence of the lawsuit could prompt our customers to switch to products that are not the subject of infringement suits.
We do not pay cash dividends on our common stock.
We have not paid a dividend on our common stock since 1997. Our Board of Directors has made no determination as to whether or when we will begin paying cash dividends. Until we begin paying dividends on our common stock, investors will have to rely on stock appreciation for a return on their investment.
None.
We operate manufacturing plants and other facilities (including office, warehouse, labs and other service facilities) throughout the world. Some of these plants and facilities are shared by our operating segments. We consider our major operating properties to be in good operating condition and suitable for their current use. We believe that, after taking planned expansion into account, the productive capacity of our plants and other facilities is generally adequate for current operations. The table below summarizes our facilities by operating segment and region:
|
Number of Facilities*
|
||||||||||||||
|
North America
|
Europe Middle East Africa
|
Asia Pacific
|
Latin America
|
Total
|
||||||||||
|
Catalysts Technologies
|
9
|
|
3
|
|
1
|
|
—
|
|
13
|
|
||||
|
Materials Technologies
|
7
|
|
10
|
|
8
|
|
4
|
|
29
|
|
||||
|
Construction Products
|
17
|
|
14
|
|
24
|
|
10
|
|
65
|
|
||||
______________________________________________________________________________
* Shared facilities are counted in all applicable operating segments. The total number of facilities included in the above table, without regard to sharing amongst operating segments, is 94.
Our largest Catalysts Technologies facilities are located in Baltimore, Maryland; Lake Charles, Louisiana; and Worms, Germany.
Our largest Materials Technologies facilities are located in Baltimore, Maryland, and Worms, Germany.
Our largest Construction Products facilities are located in Cambridge, Massachusetts, and Mount Pleasant, Tennessee. Because this operating segment's products generally have short shelf lives and must be delivered to numerous job sites, Construction Products requires a greater number of facilities to service our customers than Catalysts Technologies and Materials Technologies. Also, these facilities are generally smaller and less capital intensive than our Catalysts Technologies and Materials Technologies facilities. For information on our net properties and equipment by region and country, see disclosure set forth in Item 8 (Financial Statements and Supplementary Data) in the Financial Supplement under Note 20 (Operating Segment Information) to our Consolidated Financial Statements, which disclosure is incorporated herein by reference.
Our corporate headquarters is in Columbia, Maryland, and we also lease and operate a shared services facility in Manila, Philippines.
20
We own all of our major manufacturing plants. As for the remainder of our facilities, we either own, lease or hold them under a land lease arrangement. By number of facilities on a regional basis: in North America, we primarily own our facilities; in Europe, Middle East and Africa, we have a relatively even distribution between owned and leased facilities; and in Asia Pacific and Latin America, we lease the majority of our facilities.
In connection with our credit agreement, we have agreed to execute security agreements with respect to certain of our larger United States facilities in the following locations: Chicago, Illinois; Lake Charles, Louisiana; Baltimore and Columbia, Maryland; Albany, Oregon; and Mount Pleasant, Tennessee. For a description of our credit agreement see Item 8 (Financial Statements and Supplementary Data) in the Financial Supplement under Note 8 (Debt) to the Consolidated Financial Statements.
CHAPTER 11 PROCEEDINGS
Disclosure provided in this Report in Item 1 (Business) under the caption "Chapter 11 Cases" and in Item 8 (Financial Statements and Supplementary Data) in the Financial Supplement under Note 1 (Basis of Presentation and Summary of Significant Accounting and Financial Reporting Policies under the caption "Chapter 11 Proceedings") and Note 2 (Chapter 11 and Joint Plan of Reorganization) to the Consolidated Financial Statements is incorporated herein by reference.
ASBESTOS LITIGATION
Disclosure provided in this Report in Item 8 (Financial Statements and Supplementary Data) in the Financial Supplement under Note 2 (Chapter 11 and Joint Plan of Reorganization) to the Consolidated Financial Statements is incorporated herein by reference.
ENVIRONMENTAL INVESTIGATIONS AND CLAIMS
Disclosure provided in this Report in Item 1 (Business) under the caption "Environment, Health and Safety Matters" and Item 8 (Financial Statements and Supplementary Data) in the Financial Supplement under Note 13 (Commitments and Contingent Liabilities under the caption "Environmental Remediation") to the Consolidated Financial Statements is incorporated herein by reference.
SETTLEMENT RELATED TO FORMER PACKAGING AND MEDICAL CARE BUSINESSES
In September 2000, Grace was named in a purported class action suit filed in California Superior Court for the County of San Francisco alleging that the 1996 reorganization involving a predecessor of Grace and Fresenius Medical Care Holdings, Inc. and the 1998 reorganization involving a predecessor of Grace and Sealed Air Corporation were fraudulent transfers (
Abner, et al., v. W. R. Grace & Co., et al
.). The suit is alleged to have been brought on behalf of all individuals who then had lawsuits on file asserting personal injury or wrongful death claims against any of the defendants. After
Abner
, and prior to the Chapter 11 filing, two other similar class actions were filed. These lawsuits had been stayed as a result of Grace's Chapter 11 filing. The Bankruptcy Court authorized the Official Committee of Asbestos Personal Injury Claimants and the Official Committee of Asbestos Property Damage Claimants to proceed with claims against Sealed Air and Fresenius on behalf of Grace's bankruptcy estate. In November 2002, Sealed Air and Fresenius each announced that they had reached agreements in principle with these committees to settle asbestos, successor liability and fraudulent transfer claims related to such transactions. On the Effective Date, under the terms of the Joint Plan and the Fresenius settlement and the Sealed Air settlement, Fresenius and Cryovac, Inc., a wholly-owned subsidiary of Sealed Air, made payments to the asbestos trusts as described in this Report in Item 8 (Financial Statements and Supplementary Data) in the Financial Supplement under Note 2 (Chapter 11 and Joint Plan of Reorganization) to the Consolidated Financial Statements which description is incorporated herein by reference. Under the terms of the Joint Plan and the settlement agreements, the class action lawsuits have been dismissed with prejudice.
TAX CLAIMS
Disclosure provided in this Report in Item 8 (Financial Statements and Supplementary Data) in the Financial Supplement under Note 10 (Income Taxes) to the Consolidated Financial Statements is incorporated herein by reference.
21
OTHER CLAIMS RECEIVED PRIOR TO THE CHAPTER 11 CLAIMS BAR DATE
Disclosure provided in this Report in Item 8 (Financial Statements and Supplementary Data) in the Financial Supplement under Note 2 (Chapter 11 and Joint Plan of Reorganization) to the Consolidated Financial Statements is incorporated herein by reference.
Information concerning mine safety violations or other regulatory matters required by Section 1503(a) of the Dodd-Frank Wall Street Reform and Consumer Protection Act and Item 104 of Regulation S-K (17 CFR 229.104) is included in Exhibit 95 to this Report.
22
Except as provided below, the disclosure required by this Item appears in this Report in: Item 6 (Selected Financial Data); under the heading "Selected Financial Data" opposite the caption "Other Statistics—Common shareholders of record" in the Financial Supplement; Item 8 (Financial Statements and Supplementary Data) in the Financial Supplement in Note 17 (Shareholders' Equity) and Note 23 (Quarterly Summary and Statistical Information (Unaudited) opposite the caption "Market price of common stock") to the Consolidated Financial Statements; and Item 12 (Security Ownership of Certain Beneficial Owners and Management and Related Stockholder Matters) under the caption "Equity Compensation Plan Information", and such disclosure is incorporated herein by reference.
SHAREHOLDER RIGHTS AGREEMENT
On March 31, 1998, we paid a dividend of one Preferred Stock Purchase Right on each share of Grace common stock. Subject to our prior redemption for $.01 per right, rights will become exercisable on the earlier of:
|
•
|
10 days after an acquiring person, comprised of an individual or group, has acquired beneficial ownership of 20% or more of the outstanding Grace common stock or
|
|
•
|
10 business days (or a later date fixed by the Board of Directors) after an acquiring person commences (or announces the intention to commence) a tender offer or exchange offer for beneficial ownership of 20% or more of the outstanding Grace common stock.
|
Until these events occur, the rights will automatically trade with the Grace common stock, and separate certificates for the rights will not be distributed. The rights do not have voting or dividend rights.
Generally, each right not owned by an acquiring person:
|
•
|
will initially entitle the holder to buy from Grace one hundredth of a share of the Grace Junior Participating Preferred Stock, at an exercise price of $100, subject to adjustment;
|
|
•
|
will entitle such holder to receive upon exercise, in lieu of shares of Grace junior preferred stock, that number of shares of Grace common stock having a market value of two times the exercise price of the right; and
|
|
•
|
may be exchanged by Grace for one share of Grace common stock or one hundredth of a share of Grace junior preferred stock, subject to adjustment.
|
Generally, if there is an acquiring person and we are acquired, each right not owned by an acquiring person will entitle the holder to buy a number of shares of common stock of the acquiring company having a market value equal to twice the exercise price of the right.
Each share of Grace junior preferred stock will be entitled to a minimum preferential quarterly dividend payment of $1.00 per share but will be entitled to an aggregate dividend equal to 100 times the dividend declared per share of Grace common stock whenever such dividend is declared. In the event of liquidation, holders of Grace junior preferred stock will be entitled to a minimum preferential liquidation payment of $100 per share but will be entitled to an aggregate payment equal to 100 times the payment made per share of Grace common stock. Each share of Grace junior preferred stock will have 100 votes, voting together with the Grace common stock. Finally, in the event of any business combination, each share of Grace junior preferred stock will be entitled to receive an amount equal to 100 times the amount received per share of Grace common stock. These rights are protected by customary antidilution provisions.
The terms of the rights may be amended by the Board of Directors without the consent of the holders of the rights. The rights expire on March 30, 2018.
This summary of the rights does not purport to be complete and is qualified in its entirety by reference to the Rights Agreement, which has been filed with the SEC.
23
DIVIDENDS ON GRACE COMMON STOCK
We have not paid a dividend on our common stock since 1997. Our Board of Directors has made no determination as to whether or when we will begin paying cash dividends. Although our Credit Agreement (as described in Item 8 (Financial Statements a
nd Supplementary Data) in the Financial Supplement under Note 8 (Debt) to the Consolidated Financial Statements and filed as an exhibit to this Report), our deferred payment agreements with the asbestos trusts (
as described in Item 8 (Financial Statements a
nd Supplementary Data) in the Financial Supplement under Note 2 (Chapter 11 and Joint Plan of Reorganization) to the Consolidated Financial Statements and filed as exhibits to this Report) and our guarantee agreements with the asbestos trusts (filed as exhibits to this Report) contain certain
restrictions on the payment of dividends on, and redemptions of, equity interests and other restricted payments, we believe that such restrictions do not currently materially limit our ability to pay dividends and we do not believe that such restrictions are likely to limit materially our future payment of dividends.
Share Repurchase Program
On February 4, 2014, we announced that the Board of Directors has authorized a share repurchase program of up to $500 million expected to be completed over the next 12 to 24 months at the discretion of management. Repurchases under the program may be made through one or more open market transactions at prevailing market prices; unsolicited or solicited privately negotiated transactions; accelerated share repurchase programs; or through any combination of the foregoing, or in such other manner as determined by management. The timing of the repurchases and the actual amount repurchased will depend on a variety of factors, including the market price of Grace’s shares and general market and economic conditions. Repurchased shares will be held in treasury. There is no guarantee as to the number of shares that will be repurchased and the share repurchase program may be extended, suspended or discontinued at any time without notice.
STOCK TRANSFER RESTRICTIONS
Under the terms of our Certificate of Incorporation, as approved by the Bankruptcy Court as part of the confirmation of the Joint Plan, in order to preserve significant tax benefits which are subject to elimination or limitation, the Board of Directors has the authority to impose restrictions on the transfer of Grace common stock with respect to certain 5% shareholders. Imposing such restrictions requires at least a 25% ownership shift to occur (as determined under Internal Revenue Code regulations) and at least a two-thirds vote of all of the directors. These restrictions would generally not limit the ability of a person that holds less than 5% of Grace common stock after emergence to either buy or sell stock on the open market.
This summary does not purport to be complete and is qualified in its entirety by reference to the Certificate of Incorporation, which has been filed with the SEC as Exhibit 3.1 to this Report.
The disclosure required by this Item appears in the Financial Supplement under the heading "Selected Financial Data" which disclosure is incorporated herein by reference.
The disclosure required by this Item appears in the Financial Supplement under the heading "Management's Discussion and Analysis of Financial Condition and Results of Operations" which disclosure is incorporated herein by reference.
Market Risk
Our global operations, raw materials and energy requirements, and debt obligations expose us to various market risks. We use derivative financial instruments to mitigate certain of these risks. The following is a discussion of our primary market risk exposures, how those exposures are managed, and certain quantitative data pertaining to our market risk-sensitive instruments.
24
Currency Exchange Rate Risk
Because we do business in over 40 countries, our results of operations are exposed to changes in currency exchange rates. We seek to minimize exposure to these changes by matching revenue streams in volatile currencies with expenditures in the same currencies, but it is not always possible to do so. From time to time, we use financial instruments such as currency forward contracts, options, or combinations of the two to reduce the risk of certain specific transactions. However, we do not have a policy of hedging all exposures, because management does not believe that such a level of hedging would be cost-effective. We do not hedge translation exposures that are not expected to affect cash flows in the near-term. Significant uses of derivatives to mitigate the effects of changes in currency exchange rates are as follows:
In November 2007, we executed intercompany loans in the aggregate amount of €250 million between our principal U.S. operating subsidiary and a newly established German subsidiary as part of a legal restructuring. In conjunction with the loans, our U.S. subsidiary entered into a series of currency forward contracts in order to fix the dollar/euro exchange rate that will apply to convert the euro principal payments to dollars. The total amount outstanding under the intercompany loans was
€194.5 million
as of
December 31, 2013
(approximately $268.2 million). Currency fluctuations on these loans and the related forward contracts are recorded as components of operating results. The intercompany loans were repaid, and the related forward contracts were settled, when we emerged from bankruptcy.
The following tables provide information about our significant currency forward exchange agreements as of
December 31, 2013
and
2012
, specifically, the notional, or contract, amounts (in millions of U.S. dollars), and weighted average exchange rates (U.S. dollars to euros) by expected (contractual) maturity dates. These notional amounts generally are used to calculate the contractual payments to be exchanged under the contract. The fair values represent the fair value of the derivative contracts, and are presented as other assets or other liabilities and allocated between current and non-current, as appropriate, in the Consolidated Balance Sheets.
|
|
Euro Forward Contracts—December 31, 2013 Expected Maturity Date
|
||||||
|
Currency Forward Exchange Agreements
|
2014
|
Fair Value
|
|||||
|
Contract amount
|
$
|
261.3
|
|
$
|
(6.9
|
)
|
|
|
Average contractual exchange rate
|
1.34
|
|
N/A
|
|
|||
|
|
Euro Forward Contracts—December 31, 2012 Expected Maturity Date
|
||||||
|
Currency Forward Exchange Agreements
|
2013
|
Fair Value
|
|||||
|
Contract amount
|
$
|
252.5
|
|
$
|
(4.9
|
)
|
|
|
Average contractual exchange rate
|
1.30
|
|
N/A
|
|
|||
Commodity Price Risk
We operate in markets where the prices of raw materials and energy are commonly affected by cyclical movements of the economy and other economic factors. The principal raw materials used in our products include rare earths, molybdenum, sodium silicate, olefins, resins, caustic, aluminum, sodium aluminate, rubber, alumina, nickel, cobalt carbonate, kaolin, gypsum and latices. Natural gas is the largest single energy source that we purchase. These commodities are generally available to be purchased from more than one supplier. In order to minimize the risk of increasing prices on certain raw materials and energy, we use a centralized supply chain organization for procurement in order to improve purchasing activities. We have a risk management committee to review proposals to hedge purchases of raw materials and energy.
We have implemented a risk management program under which our goal is to hedge natural gas and aluminum supply in a way that provides protection against price volatility of the natural gas and aluminum markets. In order to mitigate volatile natural gas prices, we have entered into both fixed price swaps and options contracts to hedge a portion of our U.S. natural gas requirements. Additionally, in order to mitigate volatile aluminum prices, we have entered into fixed price swaps to hedge a portion of our U.S. aluminum requirements.
The following tables provide information about our commodity derivatives. For natural gas commodity derivatives, contract volumes, or notional amounts, are presented in millions of MMBtu (million British thermal units), weighted average contract prices are presented in U.S. dollars per million MMBtu, and the total contract amount and fair value are presented in millions of U.S. dollars. For aluminum commodity derivatives, contract
25
volumes, or notional amounts, are presented in millions of pounds, weighted average contract prices are presented in U.S. dollars per pound, and the total contract amount and fair value are presented in millions of U.S. dollars. The fair values of the commodity derivative contracts represent the excess of the variable price (market price) over the fixed price (pay price) multiplied by the nominal contract volumes. All commodity derivative instruments mature within 12 months.
|
|
Commodity Derivatives—December 31, 2013
|
|||||||||||||
|
Type of Contract
|
Contract Volumes
|
Weighted Average Price
|
Total Contract Amount
|
Fair Value
|
||||||||||
|
Natural gas swaps
|
0.3
|
|
$
|
4.44
|
|
$
|
1.2
|
|
$
|
—
|
|
|||
|
Aluminum swaps
|
1.4
|
|
$
|
0.89
|
|
$
|
1.2
|
|
$
|
(0.1
|
)
|
|||
|
|
Commodity Derivatives—December 31, 2012
|
|||||||||||||
|
Type of Contract
|
Contract Volumes
|
Weighted Average Price
|
Total Contract Amount
|
Fair Value
|
||||||||||
|
Natural gas swaps
|
2.8
|
|
$
|
3.60
|
|
$
|
10.2
|
|
$
|
(0.3
|
)
|
|||
|
Aluminum swaps
|
3.0
|
|
$
|
0.96
|
|
$
|
2.8
|
|
$
|
0.1
|
|
|||
The fair value of commodity derivative contracts is presented as other assets or other liabilities and allocated between current and non-current, as appropriate, in the Consolidated Balance Sheets.
The following tables provide information about our natural gas option contracts. Contract volumes, or notional amounts, are presented in millions of MMBtu (million British thermal units), both strike prices and futures trading prices are presented in U.S. dollars per million MMBtu, and the fair value is presented in millions of U.S. dollars. The fair values of the natural gas option contracts represent the excess of the futures trading price (market price) over the strike price multiplied by the nominal contract volumes. All natural gas option contracts mature within 18 months.
|
|
Natural Gas Option Contracts—December 31, 2013
|
|||||||||||
|
Type of Contract
|
Contract Volumes
|
Strike Price
|
Futures Trading Price
|
Fair Value
|
||||||||
|
Natural gas options
|
7.1
|
|
$
|
5.00
|
|
$ 4.01 - 4.41
|
$
|
—
|
|
|||
The fair value of the natural gas option contracts is presented as other assets or other liabilities and allocated between current and non-current, as appropriate, in the Consolidated Balance Sheets. The premium paid for the call options is presented at amortized cost in other assets and allocated between current and non-current, as appropriate, in the Consolidated Balance Sheets. As of December 31, 2013, the unamortized call option premium was $0.8 million.
We have also entered into forward contracts for natural gas and aluminum that qualify for the normal purchases and normal sales exception from Accounting Standards Codification ("ASC") 815 "Derivatives and Hedging" as they do not contain net settlement provisions and result in physical delivery of natural gas and aluminum from suppliers. Therefore, the fair values of these contracts are not recorded in our Consolidated Balance Sheets.
Interest Rate Risk
Interest rate fluctuations directly affect interest expense on our variable-rate debt.
As of
December 31, 2013
, we did not use derivative instruments to mitigate interest rate risk. However, in connection with our emergence financing, we entered into an interest rate swap beginning on February 3, 2015, and maturing on February 3, 2020, fixing $250 million of term debt at 4.643%.
See Item 8 (Financial Statements and Supplementary Data) in the Financial Supplement under Note 9 to the Consolidated Financial Statements for additional disclosure around market risk, which disclosure is incorporated herein by reference.
26
The disclosure required by this Item appears in the Financial Supplement which disclosure is incorporated herein by reference.
None.
Except as provided below, the disclosure required by this Item appears in the Financial Supplement under the heading "Management's Report on Financial Information and Internal Controls" which disclosure is incorporated herein by reference.
There was no change in Grace's internal control over financial reporting during the quarter ended
December 31, 2013
, that has materially affected, or is reasonably likely to materially affect, Grace's internal control over financial reporting.
None.
27
Our directors and executive officers as of
December 31, 2013
, are listed below. Our Certificate of Incorporation provides for the division of the Board of Directors into three classes, each to serve for a three-year term or until their respective successors are elected. Executive officers are elected to serve until the next annual meeting of the Board of Directors or until their respective successors are elected.
|
Name and Age*
|
Office
|
First
Elected
|
Current Term Ends at Annual Meeting in:
|
||||
|
H. Furlong Baldwin (82)
|
Class III Director
|
01/16/02
|
2017
|
|
|||
|
Ronald C. Cambre (75)
|
Class II Director
|
09/01/98
|
2016
|
|
|||
|
Alfred E. Festa (54)
|
Class III Director
Chairman of the Board
Chief Executive Officer
|
09/08/04
01/01/08
06/01/05
|
2017
|
|
|||
|
Marye Anne Fox (66)
|
Class I Director
|
05/10/96
|
2015
|
|
|||
|
Janice K. Henry (62)
|
Class I Director
|
01/18/12
|
2015
|
|
|||
|
Jeffry N. Quinn (55)
|
Class II Director
|
11/07/12
|
2016
|
|
|||
|
Christopher J. Steffen (72)
|
Class III Director
Lead Independent Director
|
11/01/06
06/28/12
|
2017
|
|
|||
|
Mark E. Tomkins (58)
|
Class I Director
|
09/06/06
|
2015
|
|
|||
|
Hudson La Force III (49)
|
Senior Vice President & Chief Financial Officer
|
04/01/08
|
—
|
|
|||
|
Gregory E. Poling (58)
|
President and Chief Operating Officer
|
11/03/11
|
—
|
|
|||
|
Mark A. Shelnitz (55)
|
Vice President, General Counsel & Secretary
|
04/27/05
|
—
|
|
|||
|
Pamela K. Wagoner (50)
|
Vice President & Chief Human Resources Officer
|
07/13/09
|
—
|
|
|||
|
Keith N. Cole (55)
|
Vice President, Government Relations and Environment, Health and Safety
|
02/10/14
|
—
|
|
|||
_______________________________________________________________________________
* Mr. John F. Akers resigned from the Board of Directors and all committees effective January 17, 2014.
Mr. Baldwin
served as a director of Mercantile Bankshares Corporation from 1970 to 2003, as Chairman of the Board from 1984 to 2003 and as President and Chief Executive Officer from 1976 to 2001. Mr. Baldwin served as Chairman of NASDAQ OMX Group, Inc. until 2012 and served as a director of Platinum Underwriters Holdings, Ltd. and Allegheny Energy Inc. until 2011. Mr. Baldwin brings to the Board the management and governance knowledge he developed as a banking chief executive and public company board member and his extensive experience in banking and finance including significant knowledge of the business development, acquisitions, capital raising, operations and financial issues facing large corporations.
Mr. Cambre
is retired Chairman of the Board and Chief Executive Officer of Newmont Mining Corporation. He joined Newmont as Vice Chairman and CEO in 1993 and retired as CEO in 2000 and as Chairman in 2001. Mr. Cambre served as Chairman of the Board of McDermott International, Inc. and as a director of Cliffs Natural Resources Inc. until 2011. Mr. Cambre brings to the Board his extensive background in leadership and management at the most senior level in major corporations, his deep understanding of international business and global energy issues and his governance and oversight experience developed as a director of multiple public companies.
Mr. Festa
joined Grace in 2003 and was elected Chief Executive Officer in 2005 and Chairman in 2008. He served as President from 2003 to 2011 and Chief Operating Officer from 2003 to 2005. Prior to joining Grace, Mr. Festa was a partner of Morganthaler Private Equity Partners, a venture capital and buyout firm, from 2002 to 2003. From 2000 to 2002, he was with ICG Commerce, Inc., a private company providing on-line procurement services, where he last served as President and Chief Executive Officer. Prior to that, he served as Vice President and General Manager of AlliedSignal's (now Honeywell) performance fibers business. Mr. Festa is a director of NVR, Inc., a publicly held home builder. Mr. Festa brings to the Board his substantial leadership, sales and
28
marketing, international business and venture capital experience. As CEO, Mr. Festa brings to the Board his intimate knowledge of all aspects of Grace's operations and strategy.
Dr. Fox
served as Chancellor of the University of California San Diego (UCSD) and Distinguished Professor of Chemistry at that institution from 2004 until her retirement in 2012. She currently serves as Chancellor Emeritus and Distinguished Professor of Chemistry and Biotechnology at UCSD. She was previously Chancellor of North Carolina State University and Distinguished University Professor of Chemistry. Dr. Fox has served as the Co-Chair of the National Academy of Sciences' Government-University-Industry Research Roundtable and she served on President Bush's Council of Advisors on Science and Technology. She has served as the Vice Chair of the National Science Board. Dr. Fox is a director of Bridgepoint Education, Inc. and Red Hat, Inc. and served as a director of Pharmaceutical Product Development, Inc. until 2008 and Boston Scientific Corporation until 2010. With her chemistry background, strong financial and operational experience leading large and successful educational institutions and service as an outside director to public and private boards, Dr. Fox brings to the Board a full understanding of Grace's products and research and development efforts, substantial experience in overseeing corporate management and finance and high-level knowledge of operations and strategic planning for large institutions.
Ms. Henry
served as Senior Vice President and Treasurer until 2006 and Chief Financial Officer until 2005 of Martin Marietta Materials, Inc.; after her retirement in 2006, she provided consulting services to Martin Marietta Materials, Inc. until 2009. Ms. Henry is also a director of Cliffs Natural Resources Inc. Ms. Henry served as a director of North American Galvanizing and Coatings, Inc. until its acquisition in 2010 by AZZ Incorporated and as a director and chair of the audit committee of Inco Limited until its acquisition in 2006 by CVRD. Ms. Henry brings to the Board her substantial experience in financial and accounting leadership, including acquisitions and capital structuring, gained as an officer of a chemicals and materials manufacturer. She also has significant governance and oversight experience from her service on public and private corporate boards.
Mr. Quinn
is Chairman and Chief Executive Officer of The Quinn Group LLC, a diversified holding company with investments in the industrial, active lifestyle, and entertainment sectors, and Quinpario Partners LLC, an investment and operating firm in the performance materials and specialty chemical sectors, each of which he formed in July 2012. Since May 2013, Mr. Quinn has served as President, Chief Executive Officer and Chairman of the Board of Quinpario Acquisition Corp., a blank check company formed in 2013. Mr. Quinn served as President and Chief Executive Officer from 2004 and Chairman from 2006 of Solutia Inc., a global leader in specialty chemicals until its sale in July 2012 to Eastman Chemical Company. Mr. Quinn joined Solutia as an executive officer in January 2003, serving as Senior Vice President, General Counsel, Secretary and, from June 2003, Chief Restructuring Officer. Solutia filed for Chapter 11 bankruptcy protection in December 2003 and emerged from bankruptcy protection in February 2008. Prior to that, Mr. Quinn served as Executive Vice President of Premcor, Inc. and Senior Vice President, General Counsel and Secretary of Arch Coal Inc. Mr. Quinn is also a director of Tronox Limited and Ferro Corporation. Mr. Quinn brings to the board his extensive senior level executive leadership experience in diverse industries and his broad experience in a wide range of functional areas, including strategic planning, mergers and acquisitions, human resources, and legal and governmental affairs. He also has extensive experience in board processes and governance.
Mr. Steffen
most recently served as Vice Chairman of Citicorp and its principal subsidiary, Citibank N.A., until 1996. He is currently a private investor. Mr. Steffen is a director of Viasystems Group, Inc. and Platinum Underwriters Holdings, Ltd. and until 2012, served as a director of Accelrys, Inc. Mr. Steffen has served as Senior Vice President and Chief Financial Officer of Eastman Kodak and Executive Vice President and Chief Financial and Administrative Officer and director of Honeywell. As Lead Independent Director, Mr. Steffen presides at all executive sessions of the Board. With his background as a financial and operational leader with companies with global operations in various industries, Mr. Steffen brings to the Board his extensive international business expertise and knowledge of financial matters and financial reporting. Mr. Steffen also has substantial governance and oversight experience developed as a director of multiple public companies.
Mr. Tomkins
most recently served as Senior Vice President and Chief Financial Officer of Innovene, a petrochemical and oil refining company controlled by BP that is now part of the INEOS Group, from 2005 until 2006. He served as Chief Financial Officer of Vulcan Materials Company from 2001 to 2005 and CFO of Great Lakes Chemical (now Chemtura) from 1998 to 2001. Prior to joining Great Lakes Chemical, Mr. Tomkins held various mid- and upper-level financial positions with AlliedSignal (now Honeywell) and Monsanto Company. Mr. Tomkins is a certified public accountant. Mr. Tomkins is a director of Elevance Renewable Sciences Inc., a privately held renewable polymer and energy company and, until 2012, he served as a director of CVR Energy, Inc. He is currently a private investor. With his background as a Chief Financial Officer of multiple public companies,
29
Mr. Tomkins brings to the Board his intimate knowledge of the global chemicals and petroleum industry and his experience overseeing finance and business development in major corporations. Mr. Tomkins also has substantial governance and oversight experience developed as a director of multiple public companies.
Messrs. Poling, La Force and Shelnitz
have been actively engaged in Grace's business for the past five years.
Ms. Wagoner
joined Grace in 2009 as Vice President and Chief Human Resources Officer. From 2003 until she joined Grace, she was Senior Vice President, Human Resources at Host Hotels & Resorts, Inc.
Mr. Cole
joined Grace in 2014 as Vice President, Government Relations and EHS. From 2002, until he joined Grace, he held leadership positions in government relations and public policy for General Motors Corporation.
Audit Committee
We have a standing Audit Committee established in accordance with the provisions of the Securities Exchange Act of 1934, as amended. The Committee members are H. Furlong Baldwin, Ronald C. Cambre, Marye Anne Fox, Janice K. Henry, Jeffry N. Quinn, Christopher J. Steffen and Mark E. Tomkins, each of whom meets the independence standards of the SEC and New York Stock Exchange. Mr. Tomkins serves as Chair of the Audit Committee. The Board of Directors has determined that all Audit Committee members are audit committee financial experts as defined by SEC regulations. A complete description of the responsibilities of the Audit Committee is set forth in the Grace Audit Committee Charter which is available on the Internet at
www.grace.com/About/Leadership/Governance/
.
Other Committees
We have standing Nominating and Governance, Compensation and Corporate Responsibility Committees. The members of each of these committees are H. Furlong Baldwin, Ronald C. Cambre, Marye Anne Fox, Janice K. Henry, Jeffry N. Quinn, Christopher J. Steffen and Mark E. Tomkins, each of whom meets the independence standards of the New York Stock Exchange. Mr. Steffen serves as Chair of the Nominating and Governance Committee, Mr. Quinn serves as Chair of the Compensation Committee and Dr. Fox serves as Chair of the Corporate Responsibility Committee. A complete description of the responsibilities of the Board committees is set forth in their respective committee charters which are available on the Internet at
www.grace.com/About/Leadership/Governance/
.
Section 16(a) Beneficial Ownership Reporting Compliance
Under Section 16 of the Securities Exchange Act of 1934, as amended, our directors, certain of our officers, and beneficial owners of more than 10% of the outstanding Grace common stock are required to file reports with the SEC concerning their ownership of and transactions in Grace common stock or other Grace securities; these persons are also required to furnish us with copies of these reports. Based upon the reports and related information furnished to us, we believe that all such filing requirements were complied with in a timely manner during and with respect to 2013.
Code of Ethics for Principal Officers
The Board of Directors and the Audit Committee have adopted Business Ethics and Conflicts of Interest policies, which apply to all of our directors, officers, and employees, including our principal officers. These policies are accessible through our Internet website,
www.grace.com/About/Leadership/Governance/
, and are available in hard copy, free of charge, by contacting Grace Shareholder Services at 410-531-4167. We granted no waivers to these policies during 2013. We intend to promptly post on our website any amendments or waivers to these policies affecting any principal executive officer, principal financial officer, principal accounting officer or controller, or persons performing similar functions.
Compensation Discussion and Analysis
Executive Summary
The Committee looks to reward strong business performance with pay that will continue to attract, retain and motivate a qualified management team. We believe that this pay for performance link is an attractive component of our compensation and one that we strengthened in 2013.
30
Compensation Changes for 2013
|
•
|
Performance Based Units
-
We revised our long-term incentive program, which was made up entirely of stock options in 2012, such that 50% of the award value is made up of shares of Grace common stock that are subject to both time-based and performance-based vesting criteria and 50% of the award value is made up of stock options. This change was made to provide a stronger link between Grace performance and executive pay.
|
|
•
|
Stock Ownership Guidelines
-We implemented guidelines that Grace directors and certain Grace executives maintain an ownership position in Grace common stock that is a multiple of their cash retainer for Grace directors or pay for officers.
|
|
•
|
Director Compensation
-We revised our director compensation program to better align pay with shareholder interests by eliminating meeting fees and including a recurring annual grant of Grace common stock as a portion of the annual retainer that was previously paid entirely in cash.
|
The principal components of pay under our executive compensation program are annual base salary, annual cash incentive awards and long-term incentive awards, which consisted of both stock options and performance based units, or PBUs, in 2013. We use this mix of fixed and variable pay components with different payout forms (cash, stock and stock options) to reward annual and sustained performance. These components afford the Committee the necessary flexibility to recognize management.
The measures used by the Grace Compensation Committee to assess our performance for purposes of determining annual cash incentive awards for executive officers are based on our annual operating plan goals and are directly tied to the pay outcomes of our executive officers. For the 2013 Annual Incentive Compensation Plan (AICP), we used the following metrics to quantify performance:
|
•
|
Adjusted Earnings Before Interest and Taxes (Adjusted EBIT)
(weighted 75%) This metric is the primary performance measure for the AICP and has been over the past several years.
|
|
•
|
Working Capital Days
(weighted 25%) This metric measures the change in the average Working Capital Days for the three months ending December 31, 2013, from the average Working Capital Days for the prior year quarter. Working Capital Days is the sum of the average days that accounts receivable from sales are outstanding before collection and the average days inventory is held before sale less the average days accounts payable are outstanding before payment. This metric is designed to assess operational excellence and improvements in working capital management as Grace continues to integrate its operations on a global basis.
|
Based on our 2013 business model and operational and growth initiatives, we believe these measures best reflect our ability to grow our businesses profitably and maximize operational efficiency and cash flow. They also allow us to provide meaningful incentives that are competitive in our industry, encouraging our executives to drive sustained results and long-term shareholder value.
CEO Pay At-A-Glance
Mr. Festa's Total Direct Compensation (TDC) for 2013 was $
5,049,669
, a decrease of
(24.2)
% compared with the prior year. The chart below shows the components of pay awarded compared with the prior year. For more details about the structure of Mr. Festa's compensation, see "Summary Compensation Table."
31
|
Compensation Element
|
2013
($)
|
2012
($)
|
Percentage Increase (Decrease)
in Compensation Element (%) |
||||||
|
Base Salary
|
975,000
|
975,000
|
|
—
|
|
||||
|
Annual Cash Incentive
|
243,750
|
848,250
|
|
(71.3
|
)
|
||||
|
Long-term Cash Incentive
|
—
|
|
1,499,985
|
|
—
|
|
|||
|
Fair Market Value of Option Grant
|
1,761,324
|
2,381,400
|
|
(26.0
|
)
|
||||
|
Fair Market Value of PBU Grant
|
1,849,992
|
—
|
|
—
|
|
||||
|
Increase in Pension Value
|
57,000
|
798,000
|
|
(92.9
|
)
|
||||
|
Other Compensation
|
162,603
|
162,811
|
|
(0.1
|
)
|
||||
|
Total
|
5,049,669
|
6,665,446
|
|
(24.2
|
)
|
||||
Overview
The Board of Directors has designated the five officers named in the Summary Compensation Table as executive officers. The executive officers include our Chief Executive Officer (CEO), Chief Operating Officer (COO), Chief Financial Officer (CFO) and vice presidents in charge of principal functions or who have policy-making authority. The Board of Directors has delegated authority for approving and administering the compensation plans for executive officers and other members of senior management to the Compensation Committee. The Board has appointed all of the independent members of the Board to serve as members of the Compensation Committee.
A complete description of the responsibilities of the Compensation Committee, referred to as the committee in this Compensation Discussion and Analysis, is set forth in our Compensation Committee Charter, which is available on the Internet at
www.grace.com/About/Leadership/Governance/
. The committee and the Board review the charter annually and revise it as necessary.
The committee is responsible for reviewing and approving the compensation of all executive officers, including:
|
•
|
base salary;
|
|
•
|
annual incentive compensation;
|
|
•
|
long-term incentive compensation;
|
|
•
|
employment agreements;
|
|
•
|
severance arrangements;
|
|
•
|
change-in-control agreements; and
|
|
•
|
any special or supplemental benefits not generally available to salaried employees.
|
The committee also reviews and approves all corporate goals and objectives used in determining the incentive compensation of each executive officer.
The committee receives advice and legal and administrative assistance from our human resources department, legal services group and the Board's outside counsel in meeting its responsibilities. The committee also has authority to retain other outside advisors. During 2013, the committee retained the services of Towers Watson, a human resources consulting firm, after reviewing its independence from management, and we expect the committee to continue working with Towers Watson during 2014. During 2012, the committee instructed Towers Watson to compile competitive compensation data and, based upon such data, to recommend ranges of annual and long-term compensation that are consistent with the committee's compensation philosophy and objectives as discussed below. In its independence review, the committee noted no conflicts of interest related to the work of Towers Watson
.
Specific services provided by Towers Watson to the committee during 2013 included:
|
•
|
participation in selected committee meetings;
|
|
•
|
preparation of market compensation data for executives and outside directors;
|
|
•
|
input on current market trends and practices; and
|
|
•
|
assessment of the competitiveness of our executive compensation.
|
In addition to services provided to the committee in respect of executive and director compensation, Towers Watson provided additional services to Grace in an amount that was less than $120,000 during 2013. The committee expects Towers Watson and our executive officers, including our CEO, our General Counsel and our
32
Chief Human Resources Officer, and their respective subordinates, to meet, exchange information and otherwise cooperate in the performance of their respective duties outside committee meetings.
Compensation Elements
The following table outlines the major elements of compensation in 2013 for the executive officers named in the Summary Compensation Table, referred to generally as the named executive officers:
|
Compensation Element
|
Definition
|
Rationale
|
||
|
Base Salary
|
Fixed cash compensation paid twice monthly
|
Payment for completion of day-to-day responsibilities
|
||
|
Annual Incentive Compensation Plan
|
Variable cash compensation earned by annual personal performance and achievement of pre-established annual corporate financial performance goals
|
Builds accountability for achieving annual financial and business results and personal performance goals
|
||
|
Long-Term Incentive Compensation Plan (Stock Options)
|
Equity compensation with staggered vesting that increases in value with increases in share price; value is equivalent to 50% of executive officer's long-term incentive
|
Aligns long-term interests of executive officers and shareholders
Encourages executive retention |
||
|
Long-Term Incentive Compensation Plan (Performance-Based Units)
|
Equity compensation subject to both time-based and performance-based vesting criteria; value is equivalent to 50% of executive officer's long-term incentive
|
Builds accountability for sustained financial results and accurate planning
Aligns long-term interests of executive officers and shareholders
Encourages executive retention
|
||
|
U. S. Defined Contribution Retirement Plans
|
Savings and Investment Plan (401(k))—Standard tax-qualified defined contribution retirement benefit subject to limitations on compensation and benefits under the Internal Revenue Code
|
Provides U.S. employees with opportunity to save for retirement on tax-advantaged basis with matched contributions from Grace
|
||
|
Savings and Investment Plan Replacement Payment Plan
(nonqualified)
|
Highly-paid U.S. employees made eligible for the same level of Grace match as all other participants in the Savings and Investment Plan notwithstanding Internal Revenue Code limitations
|
|||
|
U. S. Defined Benefit Retirement Plans
|
Pension Plan—Standard tax-qualified pension plan subject to limitations on compensation and benefits under the Internal Revenue Code
|
Provides U.S. employees with retirement income
|
||
|
Supplemental Executive Retirement Plan(nonqualified)
|
Highly-paid U.S. employees made eligible for the same benefit formula as all other participants in the Pension Plan notwithstanding Internal Revenue Code limitations
|
|||
Executive Compensation Philosophy and Objectives
The key objective of the Grace executive compensation program is to reward our executives for our financial performance and to enable us to compete effectively with other firms in attracting, motivating and retaining executives. The committee intends the incentive compensation portion of the program to align closely the financial interests of our executives with those of our shareholders. Because senior executives have a substantial ability to influence business success, the committee believes that the portion of compensation that is at-risk based on corporate performance should increase as the level of responsibility of the executive increases. The committee also expects the executive compensation program to be consistent with a culture of ethical conduct, personal integrity and compliance with our policies and applicable law. We require executives to set an example for our employees and our other business associates in emphasizing the Grace Core Values in their daily business conduct. The Grace Core Values consist of a commitment to teamwork, performance, integrity, speed and innovation, which, with our overall commitment to safety, are the foundation of our corporate culture.
Our executive compensation program is designed to reward executives for the achievement of corporate, operating segment and functional goals and objectives, taking into account both individual performance and contributions to our overall success. The individual performance evaluation is based on the input received from, and the recommendation provided by, the CEO. This assessment is based on the officer
’
s leadership, technical skill, management, operational performance and potential to contribute to Grace
’
s overall success. The CEO proposes compensation levels for the other executive officers and, although not a member of the committee, the CEO attends committee meetings and participates in committee deliberations regarding compensation levels for the other executive officers. In addition, since the number of executive officers is small, the committee is able to spend considerable time with each executive officer outside committee meetings and is able to develop a more intimate familiarity. The CEO is excused from deliberations regarding his own compensation and from the "executive
33
session" portion of each meeting when the committee meets alone or alone with its outside advisors. The CEO is also excused when the committee meets separately with internal advisors from our human resources group.
Periodically the committee consults with Towers Watson for an assessment of the competitiveness of our executive officer compensation relative to certain benchmark companies in the chemicals, materials and specialty chemicals industry that the committee deems our peer group for compensation purposes, and relative to certain broad industry data. The committee selected the benchmark companies as our compensation peer group based upon their size and global scope, the quality of their executive talent, the likelihood that we compete with them for executive talent and the availability of public information regarding their compensation practices. The committee periodically reviews the composition of our compensation peer group to ensure that it remains relevant. For 2013 compensation, the peer group consisted of:
|
Albemarle Corp.
|
Olin Corp.
|
|
|
Axiall Corp.
|
OM Group Inc.
|
|
|
Cabot Corp.
|
PolyOne Corp.
|
|
|
Celanese Corp.
|
Rockwood Holdings Inc.
|
|
|
Cytec Industries Inc.
|
RPM International Inc.
|
|
|
Eastman Chemical Co.
|
A. Schulman Inc.
|
|
|
Ferro Corp.
|
Sigma-Aldrich Corp.
|
|
|
FMC Corp.
|
Valspar Corp.
|
|
|
International Flavors & Fragrances Inc.
|
Westlake Chemcial Corp.
|
|
The broad industry data that the committee generally reviews is included in studies produced by Towers Watson, Mercer and AonHewitt (all of whom are also nationally recognized compensation and benefits consulting firms) for any given compensation year. The committee used the chemicals and non-durable goods sections of these surveys. These data are used as a secondary reference for executive officer compensation, largely as a check on the peer group compensation levels, as well as to determine if there are any identifiable non-industry trends in compensation.
Once the committee has completed an evaluation of an executive officer's overall performance, the committee reviews the executive officer's existing compensation. This information, presented in the form of a "tally sheet," reflects all compensation payable or potentially payable to the executive officer under our compensation plans. For each executive officer, the committee compares the tally sheet to the peer group information provided by Towers Watson and the broad industry data to provide context to its compensation decisions. The committee then makes the compensation determination based on its individual evaluation of each executive officer.
In setting an executive officer's compensation level the committee does not target a specific percentile at which pay levels should be set, as the members believe the market for executive talent includes a wide range of practices. Instead, the committee reviews the distribution of peer group pay practices and broad industry data and determines the appropriate positioning of each executive officer's pay based on factors including, but not limited to, the roles and responsibilities of the executive officer, the executive officer's performance, experience, the depth of the market data available and internal equity with other Grace salaried employees. In the case of incentive compensation, if performance objectives are exceeded, the committee believes that incentive compensation should be at or above targeted levels and when performance objectives are not achieved, incentive compensation should be below targeted levels. Grace executives are generally eligible for periodic compensation reviews.
In order to ensure that the long-term financial interests of our directors and senior executives are fully aligned with the long-term interests of our shareholders, in 2013 the Board implemented stock ownership guidelines. The guidelines are as follows:
|
Category of Executive
|
Ownership Guideline
|
|
|
Directors (other than CEO)
|
5 times cash portion of annual retainer
|
|
|
Chief Executive Officer
|
5 times base salary
|
|
|
Members of the Grace Leadership Team
|
3 times base salary
|
|
|
Presidents of Operating Segments
|
2 times base salary
|
|
|
Certain Key Vice Presidents
|
1 times base salary
|
|
34
Current directors and executives subject to the stock ownership guidelines generally have five years to comply with the relevant guideline.
As a result of the Chapter
11 filing, we have not held an annual meeting of shareholders and, accordingly, have not obtained a say-on-pay advisory vote of the shareholders under Section
14A of the Securities Exchange Act of 1934, as amended. At such time as we hold say-on-pay advisory votes, we expect the committee will consider the results of such votes in making future compensation decisions for the named executive officers.
Chief Executive Officer
The committee's process for determining the compensation of the CEO is similar to the process it applies to other executive officers. The committee reviews and approves corporate goals and objectives used in determining the compensation of the CEO. The committee evaluates the CEO's performance in light of those goals and objectives and has sole authority to determine the CEO's compensation based on this evaluation. The terms of the CEO's employment agreement are discussed below in this Compensation Discussion and Analysis and under the Summary Compensation Table and Potential Payments Upon Termination or Change-In-Control Table. The CEO plays no part in the committee's deliberations or approval of his own compensation.
The committee believes the CEO's compensation should be higher than the compensation of other executive officers because the CEO is uniquely positioned to influence all aspects of our operations and performance and the resulting return to our shareholders. In addition, the committee believes there exists a robust competition for effective CEO talent among companies of our size and, in this environment, a competitive compensation package is essential for retention. The committee's view is consistent with the practices of the compensation peer group companies and the broad industry data that it has reviewed.
Compensation Elements
Base Salary
In 2013, based on its review of competitive compensation information described above, the committee increased base salaries for certain named executive officers as set forth in the following table:
|
Named Executive Officer
|
Base Annual Salary Rate as of 12/31/2013
($)
|
Base Annual Salary Rate as of 12/31/2012
($)
|
Percentage Increase
in Base Annual Salary Rate
(%)
|
|||
|
A. E. Festa
|
975,000
|
975,000
|
—
|
|||
|
H. La Force III
|
470,000
|
430,000
|
9.3
|
|||
|
G. E. Poling
|
600,000
|
550,000
|
9.1
|
|||
|
M. A. Shelnitz
|
390,000
|
375,000
|
4.0
|
|||
|
P. K. Wagoner
|
335,000
|
325,000
|
3.1
|
|||
Annual Incentive Compensation
The Annual Incentive Compensation Plan, or AICP, is a cash-based pay-for-performance incentive plan. Its purpose is to motivate and reward upper- and middle-level employees, including executive officers, for their contributions to our performance. The amount of an individual incentive award payment under the AICP is based upon:
|
•
|
the individual's AICP target amount;
|
|
•
|
the funding of the AICP incentive pool based on our performance; and
|
|
•
|
the individual's personal performance.
|
The Board of Directors established our 2013 AICP targets on February 26, 2013, after considering its objectives for the company and the general economic environment in which we expected to be operating during the year. As in 2012, the Board of Directors focused on the dual objectives of growing earnings commensurate with the business opportunities we have and the investments we have made, and improving our working capital performance.
The committee established objective annual incentive targets based on the performance targets in our 2013 operating plans. The committee evaluated the difficulty of achieving the performance targets in light of uncertainties
35
in the general economy and the chemicals industry and ongoing economic weakness in Europe, and concluded that achievement of such targets would constitute good to outstanding Grace financial performance.
While emphasizing both earnings and working capital performance in setting our annual incentive compensation plan goals, the committee gave substantially more weight to earnings performance than working capital performance because the committee believed that for 2013, earnings performance remained the most important indicator of Grace's business performance.
For earnings, the committee continued with the Adjusted EBIT measure for earnings (as such term is described in this Report in Item
7 (Management's Discussion and Analysis of Financial Condition and Results of Operations) in the Financial Supplement) used in 2012.
For working capital, the committee used the "Working Capital Days" metric that it established in 2012. This metric measures the change in the average Working Capital Days for the three months ending December 31, 2013, from the average Working Capital Days for the prior year quarter. Generally, the lower the number of Working Capital Days, the more efficient the business is in its operations, generating cash and freeing up capital for other corporate purposes.
These metrics ensure the continuing alignment of the economic interests of our executives with our annual operating plans and the interests of our shareholders. The AICP targets for our named executive officers are as follows:
|
Named Executive Officer
|
AICP Target as Percent of
Base Salary Paid
During 2013
|
AICP Target as Percent of
Base Salary Paid
During 2012
|
||||
|
A. E. Festa
|
100
|
%
|
100
|
%
|
||
|
H. La Force III
|
80
|
%
|
80
|
%
|
||
|
G. E. Poling
|
90
|
%
|
90
|
%
|
||
|
M. A. Shelnitz
|
70
|
%
|
70
|
%
|
||
|
P. K. Wagoner
|
70
|
%
|
70
|
%
|
||
Actual awards for executive officers may range from $0 to an amount equal to 200% of the target amount, based on the factors described above.
The target AICP incentive pool is the sum of the target awards of all participants in the AICP. For 2013, 75% of the available AICP incentive pool was established based on our performance in respect of Adjusted EBIT and 25% on performance in respect of Working Capital Days, which aligns the funded amount of our AICP incentive pool with our actual performance. We refer to the relevant targets as the Adjusted EBIT Target and the Working Capital Days Target, respectively.
2013 AICP Performance Targets
|
Adjusted EBIT
(75% of Available Incentive Pool)
(in $ millions)*
|
Working Capital Days
(25% of Available Incentive Pool)
(in days)
|
Portion of Incentive
Pool funded in
respect of Target
|
||
|
Less than $492
|
More than 64.2
|
—%
|
||
|
$492
|
64.2
|
25%
|
||
|
$615
|
53.5
|
100%
|
||
|
$738 or More
|
42.8 or Less
|
200%
|
||
|
*
|
Adjusted to reflect Grace
’
s adoption of mark-to-market pension accounting in the 2013 fourth quarter as described in this Report in Item 8 (Financial Statements and Supplementary Data) in the Financial Supplement under Note 1 (Basis of Presentation and Summary of Significant Accounting and Financial Reporting Policies) to the Consolidated Financial Statements.
|
In setting the actual amount of the AICP incentive pool, the committee has discretion to adjust the performance objectives, adjust the calculation of each performance measure or adjust the size of the AICP incentive pool irrespective of the achievement of performance objectives. The committee believes that AICP participants generally
36
should not benefit from or be penalized by items not considered when the performance targets are set that result in large unexpected variances from annual operating plan assumptions.
For 2013, the committee made no changes in the calculation of Working Capital Days for use in the AICP calculation. Actual 2013 Working Capital Days (representing 25% of Available Incentive Pool) were 53.6 days, the target level.
For 2013, the committee made no changes in the calculation of Adjusted EBIT for use in the AICP calculation. The committee did adjust the Adjusted EBIT performance targets to reflect Grace
’
s adoption of mark-to-market pension accounting in the 2013 fourth quarter as shown in the table above. Actual 2013 Adjusted EBIT (representing 75% of Available Incentive Pool) was $550.8 million. On the recommendation of management, reflecting the fact that 2013 Adjusted EBIT was less than 2012 Adjusted EBIT of $558.2 million, the committee exercised its discretion and did not fund the AICP incentive pool for the named executive officers in respect of the Adjusted EBIT target. The total AICP incentive pool for the named executive officers was established at 25% of the aggregate target amounts for the named executive officers.
Actual 2013 AICP payments to the named executive officers are as set forth below:
|
Name
|
Actual AICP Payment
($)
|
|
|
A. E. Festa
|
243,750
|
|
|
H. La Force III
|
94,000
|
|
|
G. E. Poling
|
135,000
|
|
|
M. A. Shelnitz
|
68,250
|
|
|
P. K. Wagoner
|
58,625
|
|
Long-Term Incentive Compensation
Our Long-Term Incentive Plans, or LTIPs, are designed to motivate and reward our key employees, including our named executive officers, for their contributions to our performance over a multi-year period and align their financial interests with those of our shareholders by making a significant portion of their total compensation variable and dependent upon our sustained financial performance. The target value of the LTIP award for each LTIP participant, with the exception of the CEO, was determined by the committee based on the recommendation of the CEO. The target value of the CEO
’
s LTIP award was determined by the committee. These target award values were determined by reviewing current market compensation data (as discussed earlier in this report), historical long-term incentive target values, the total number of available options and shares to be granted and internal pay equity considerations. Aggregate LTIP awards under the 2013 LTIP were approved by the Bankruptcy Court.
Fifty percent of the target award value of the 2013 LTIP is awarded in options to purchase Grace common stock and 50% is awarded in performance based units, or PBUs. The committee generally grants LTIP awards during the first year of the performance period.
Stock Options
Stock options represent 50% of the value of our LTIP awards. The value of stock options is directly related to the increase in value of our stock, so stock options provide direct alignment between the interests of our executives and shareholders. In determining the value of stock option awards, the committee used an analysis of stock option value based on an adjusted Black-Scholes option pricing model and reviewed this analysis with Towers Watson. The committee approved the stock option grants included in the 2013 LTIP on May 2, 2013, after approval of the 2013 LTIP by the Bankruptcy Court on April 16, 2013. The exercise price of the options was $76.655, which was the average of the high and low trading prices of Grace common stock on the New York Stock Exchange on May 2, 2013. The term of the options is five years and they vest over three years in equal annual installments commencing the year after the date of grant.
Performance Based Units
Performance based units, or PBUs, represent 50% of the value of our LTIP awards. The value of PBUs is directly related to the achievement of specified business performance objectives and the increase in value of our stock, so PBUs also provide direct alignment between the interests of our executives and shareholders. Specifically, the amount of an individual payout under a PBU is based upon:
37
|
•
|
the individual’s PBU target share amount;
|
|
•
|
the growth in our LTIP Adjusted EBIT over the three-year performance period; and
|
|
•
|
the value of Grace common stock on the payout date.
|
Payouts to executives who are subject to our stock ownership guidelines are payable in shares of Grace common stock. Payouts to other participants are payable in cash.
LTIP Adjusted EBIT
Adjusted EBIT was selected as the performance measure for the PBUs as the committee believed that it was the best measure given our our focus on long-term operational excellence and quality of earnings. In determining cumulative LTIP Adjusted EBIT growth, Adjusted EBIT for the final year of the performance period may be adjusted in the discretion of the committee to eliminate the effect of changes in accounting, like our adoption of mark-to-market pension accounting, or significant changes in our business, like a significant acquisition or divestment. In order to earn the target payout, our cumulative annual LTIP Adjusted EBIT growth from the 2012 baseline performance to 2015 actual performance must be 30%, to earn the maximum of 200% of the target payout, growth must be 45% and no payout is earned if growth is 15% or less as reflected in the following table:
|
3-Year Cumulative LTIP Adjusted EBIT Growth
(%)
|
2015 LTIP Adjusted EBIT
(in millions)
|
Number of PBU Shares Paid Out
(# Shares)
|
|
Greater than 45%
|
Greater than $750.2
|
200% of PBU Award
|
|
45%
|
$750.2
|
200% of PBU Award
|
|
30%
|
$672.6
|
100% of PBU Award
|
|
15%
|
$595.0
|
50% of PBU Award
|
|
Less than 15%
|
Less than $595.0
|
—
|
Pension Plan/Supplemental Executive Retirement Plan
As described below under "Pension Benefits," payments under our tax-qualified pension plan are calculated using annual compensation, including base salary and AICP awards, and years of credited Grace service. For 2013, federal income tax law limits to $255,000 the annual compensation on which benefits under the tax-qualified pension plan may be based. As a result, the committee has implemented a Supplemental Executive Retirement Plan, generally referred to as a SERP, that currently applies to approximately 85 upper level employees, including the executive officers, whose annual compensation exceeds that amount. Under this plan, each such employee will receive the full pension to which that employee would be entitled in the absence of the limitations described above and other limitations imposed under federal income tax law. The SERP is unfunded and is not qualified for tax purposes.
Savings and Investment Plan/Replacement Payment Plan
We generally offer a tax-qualified 401(k)-type Savings and Investment Plan, or S&I Plan, to employees under which they may save a portion of their annual compensation in investment accounts on a pre- or post-tax basis. We currently match 100% of employee savings under the S&I Plan up to 6% of the employee's base salary and annual incentive compensation. The committee believes that a 401(k)-type plan with a meaningful company match is an effective recruiting and retention tool for our employees, including our executive officers. For 2013, federal income tax law limits qualifying annual compensation for 401(k) plan purposes to $255,000. As a result, the committee has implemented an S&I Plan Replacement Payment Plan that currently applies to approximately 60 of our employees, including our executive officers, whose annual compensation exceeds that amount. Under this plan, each such employee will receive the full matching payments to which that employee would be entitled in the absence of the limitations described above and other limitations imposed under federal income tax law.
Executive Personal Benefits
The committee believes that executives generally should not be treated differently than the general employee population when it comes to personal benefits and therefore, the committee has limited executive personal benefits. Executive officers are eligible to participate in an executive physical examination program that offers executives an annual comprehensive physical examination within a compressed time period. Mr.
Festa has access to corporate
38
aircraft for reasonable personal travel, though he is responsible for paying income taxes on the value of such travel as determined by the Internal Revenue Service.
Change-In-Control Severance Agreements
As described below under "Termination and Change-in-Control Arrangements
-
Change-In-Control Severance Agreements," we have entered into change-in-control severance agreements with each of the named executive officers. The provisions in these agreements are based on competitive practice and are designed to ensure that the executive officers' interests remain aligned with the interests of our shareholders if a potential change in control occurs. Payments under these agreements are triggered by the involuntary termination of the executive officer's employment without cause (including constructive termination caused by a material reduction in his or her authority or responsibility or by certain other circumstances) following a "change in control." A change in control situation often undermines an executive officer's job security, and it is to our benefit and our shareholders' benefit to encourage our executive officers to seek out beneficial transactions and to remain employed through the closing of any transaction, even though their future employment at Grace may be uncertain. The change-in-control severance agreements are designed to reinforce and encourage the continued attention and dedication of the executive officers to their assigned duties without distraction in the face of potentially adverse circumstances arising from the possibility of a change in control of Grace. Certain terms of these agreements are described below under the Potential Payments Upon Termination or Change-In-Control Table.
Severance Arrangements
As described below under "Termination and Change-in-Control Arrangements
-
Other Executive Officer Severance Arrangements," we have entered into severance arrangements with each of the named executive officers. Payments under these arrangements are triggered by involuntary termination of employment under most circumstances. Our severance arrangements are designed to encourage and reinforce the continued attention and dedication of our executive officers to their assigned duties without undue concern regarding their job security. In the case of Mr. La Force and Ms. Wagoner, the severance arrangements are contained in agreements that were negotiated on an arms-length basis prior to the time they joined Grace. The payments required by these agreements were designed to encourage Mr.
La Force and Ms. Wagoner to join and remain with Grace in lieu of other employment opportunities available to them. Certain terms of these arrangements are described below under the Potential Payments Upon Termination or Change-In-Control Table.
Executive Salary Protection Plan
As described below under "Termination and Change-in-Control Arrangements
-
Executive Salary Protection Plan," our Executive Salary Protection Plan provides payments to our named executive officers, or their respective beneficiaries, in the event of their disability or death prior to age 70 while employed by Grace. The plan is designed to encourage the continued attention and dedication of our executive officers to their assigned duties without undue concern regarding their ability to earn a living and support their families in the event of death or disability. Certain terms of this plan are described below under the Potential Payments Upon Termination or Change-In-Control Table.
Chapter 11 Emergence Bonus
On February 3, 2014, the Joint Plan became effective, concluding our status as a debtor under Chapter 11. The Joint Plan as confirmed by the Bankruptcy Court provides $6 million for the payment of special cash bonuses to our executives, including the executive officers named in the Summary Compensation Table. On February 25, 2014, the Committee determined to pay emergence bonuses to the Named Executive Officers in the following amounts:
|
Name
|
Emergence Bonus
($)
|
|
|
A. E. Festa
|
1,500,000
|
|
|
H. La Force III
|
750,000
|
|
|
G. E. Poling
|
750,000
|
|
|
M. A. Shelnitz
|
1,000,000
|
|
|
P. K. Wagoner
|
250,000
|
|
These emergence bonuses were paid in recognition by the Committee of the outstanding performance and leadership of our executive team in managing the Chapter 11 process to a successful conclusion. Grace expects that the emergence bonuses will be paid in March 2014.
39
Deductibility of Executive Compensation
Under the Omnibus Budget Reconciliation Act of 1993, provisions were added to the Internal Revenue Code of 1986, as amended, under Section
162(m) that limit the tax deduction for compensation expense in excess of $1
million paid to certain executive officers unless such compensation is "performance-based" and satisfies certain other conditions. The committee believes that compensation payable to executive officers should generally meet the conditions required for full deductibility under Section
162(m). Tax deductibility is one criterion the committee considers when establishing compensation plans. The AICP and LTIPs are structured with the intention that the compensation payable thereunder will generally qualify as deductible "performance-based" compensation. While the committee believes that it is important to preserve the ability to structure compensation plans to meet a variety of corporate objectives even if the compensation is not deductible, due to the committee's focus on performance-based compensation plans, the committee expects that, despite its power to exercise positive discretion in establishing payments under the AICP, the vast majority of compensation paid to the named executive officers will be tax deductible.
Compensation Committee Report
We, the undersigned members of the Compensation Committee of the Board of Directors of Grace, have reviewed Grace's Compensation Discussion and Analysis for 2013 and have discussed it with Grace management. Based on our review and this discussion, we recommend to the Board that the Compensation Discussion and Analysis be included in Grace's Annual Report on Form
10-K.
COMPENSATION COMMITTEE
Jeffry N. Quinn, Chair
H. Furlong Baldwin
Ronald C. Cambre
Marye Anne Fox
Janice K. Henry
Christopher J. Steffen
Mark E. Tomkins
40
Summary Compensation Table
The following table sets forth the compensation we paid for the periods indicated to our Chief Executive Officer, our Chief Financial Officer and each of our other three most highly compensated executive officers who were executive officers as of December 31, 2013, determined by reference to the total compensation earned by such individuals for 2013 (reduced by the amount set forth in the table below under the caption "Change in Pension Value and Nonqualified Deferred Compensation Earnings").
|
Name and
Principal Position
|
Year
|
Salary
($)
|
Bonus
($)
|
Stock
Awards(a)
($)
|
Option
Awards(a)
($)
|
Non-Equity
Incentive Plan
Compensation
($)
|
Change in
Pension
Value and
Nonqualified
Deferred
Compensation
Earnings(c)
($)
|
All
Other
Compensation(d)
($)
|
Total
($)
|
||||||||||
|
AICP(b)
|
LTIP(b)
|
||||||||||||||||||
|
A. E. Festa
|
2013
|
975,000
|
-—-
|
1,849,992
|
1,761,324
|
243,750
|
-—-
|
57,000
|
162,603
|
5,049,669
|
|||||||||
|
Chairman & Chief
|
2012
|
975,000
|
-—-
|
-—-
|
2,381,400
|
848,250
|
1,499,985
|
798,000
|
162,811
|
6,665,446
|
|||||||||
|
Executive Officer
|
2011
|
968,500
|
-—-
|
-—-
|
4,087,685
|
1,350,000
|
2,156,005
|
646,000
|
157,805
|
9,365,995
|
|||||||||
|
H. La Force III
|
2013
|
453,333
|
-—-
|
399,986
|
380,834
|
94,000
|
-—-
|
64,000
|
46,572
|
1,438,725
|
|||||||||
|
Senior Vice President & Chief
|
2012
|
430,000
|
-—-
|
-—-
|
587,990
|
299,280
|
309,997
|
170,000
|
53,275
|
1,850,542
|
|||||||||
|
Financial Officer
|
2011
|
430,000
|
-—-
|
-—-
|
773,333
|
435,000
|
352,001
|
119,000
|
50,700
|
2,160,034
|
|||||||||
|
G. E. Poling
|
2013
|
579,167
|
-—-
|
749,993
|
714,046
|
135,000
|
-—-
|
(41,000)
|
62,004
|
2,199,210
|
|||||||||
|
President & Chief
|
2012
|
550,000
|
-—-
|
-—-
|
1,190,700
|
430,650
|
382,496
|
1,222,000
|
70,375
|
3,846,221
|
|||||||||
|
Operating Officer
|
2011
|
466,667
|
-—-
|
-—-
|
1,073,933
|
600,000
|
482,502
|
1,017,000
|
61,900
|
3,702,002
|
|||||||||
|
M. A. Shelnitz
|
2013
|
383,750
|
-—-
|
275,038
|
261,820
|
68,250
|
-—-
|
(114,000)
|
38,143
|
913,001
|
|||||||||
|
Vice President,
|
2012
|
375,000
|
-—-
|
-—-
|
396,900
|
228,375
|
239,998
|
571,000
|
41,875
|
1,853,148
|
|||||||||
|
General Counsel &
|
2011
|
375,000
|
-—-
|
-—-
|
541,333
|
300,000
|
280,001
|
522,000
|
39,000
|
2,057,334
|
|||||||||
|
Secretary
|
|||||||||||||||||||
|
P. K. Wagoner
|
2013
|
330,833
|
-—-
|
224,982
|
214,218
|
58,625
|
-—-
|
48,000
|
33,141
|
909,799
|
|||||||||
|
Vice President &
|
|
||||||||||||||||||
|
Chief Human
|
|
||||||||||||||||||
|
Resources Officer
|
|||||||||||||||||||
_______________________________________________________________________________
|
(a)
|
Amounts reflect the aggregate grant date fair value of performance-based unit awards (in the “Stock Awards” column) and option awards (in the “Option Awards” column), in each case computed in accordance with FASB ASC Topic 718, "Compensation-Stock Compensation." In the case of performance-based units, the amounts shown in the Stock Awards column are based on the probable outcome of performance conditions, consistent with the estimate of aggregate compensation cost to be recognized over the service period determined as of the grant date under FASB ASC Topic 718, excluding the effect of estimated forfeitures. The values of the performance-based unit awards at the grant date if the highest level of performance conditions were to be achieved would be as follows: Mr. Festa - $3,699,984; Mr. La Force - $799,972; Mr. Poling - $1,499,985; Mr. Shelnitz - $550,076; and Ms. Wagoner - $449,965. The assumptions used to calculate the compensation expense reported for 2013 are described in this Report in Item 8 (Financial Statements and Supplementary Data) in the Financial Supplement under Note 18 (Stock Incentive Plans) to the Consolidated Financial Statements and are incorporated herein by reference.
|
|
(b)
|
The 2013 amount consists of payments that we expect to make in March 2014 pursuant to the 2013 Annual Incentive Compensation Plan (AICP). Since the 2010-2012 LTIP, for which a final payment was made in March 2013, we have not awarded cash LTIPs.
|
|
(c)
|
The 2013 amount consists of the aggregate change in the actuarial present value of the individual's accumulated benefit under the Grace Pension Plan and Grace Supplemental Executive Retirement Plan (SERP) from December 31, 2012, to December 31, 2013, assuming a 4.76% discount rate and retirement at age 62 with benefits payable on a straight life annuity basis and other assumptions used for financial reporting purposes under generally accepted accounting principles as described in this Report in Item 8 (Financial Statements and Supplementary Data) in the Financial Supplement under Note 11 (Pension Plans and Other Postretirement Benefits Plans) to the Consolidated Financial Statements as follows:
|
|
Name
|
Change in Pension Plan Value
($)
|
Change In SERP Value
($)
|
Total Change in Pension Value
($)
|
||||||
|
A. E. Festa
|
11,000
|
|
46,000
|
|
57,000
|
|
|||
|
H. La Force III
|
12,000
|
|
52,000
|
|
64,000
|
|
|||
|
G. E. Poling
|
(5,000
|
)
|
(36,000
|
)
|
(41,000
|
)
|
|||
|
M. A. Shelnitz
|
(22,000
|
)
|
(92,000
|
)
|
(114,000
|
)
|
|||
|
P. K. Wagoner
|
22,000
|
|
26,000
|
|
48,000
|
|
|||
41
|
(d)
|
The 2013 amount consists of the following:
|
|
Name
|
Personal Benefits*
($)
|
S&I Plan Matching Payments
($)
|
S&I Plan Replacement Payments
($)
|
Liability Insurance
($)
|
Total
($)
|
|||||
|
A. E. Festa
|
51,793
|
**
|
15,300
|
94,095
|
1,415
|
162,603
|
||||
|
H. La Force III
|
n/a
|
15,300
|
29,857
|
1,415
|
46,572
|
|||||
|
G. E. Poling
|
n/a
|
15,300
|
45,289
|
1,415
|
62,004
|
|||||
|
M. A. Shelnitz
|
n/a
|
15,300
|
21,428
|
1,415
|
38,143
|
|||||
|
P. K. Wagoner
|
n/a
|
15,300
|
16,426
|
1,415
|
33,141
|
|||||
_______________________________________________________________________________
|
*
|
Consists of our aggregate incremental cost of providing personal benefits if the aggregate amount of personal benefits provided to the individual equaled or exceeded $10,000.
|
|
**
|
Consists of personal use of Grace-provided aircraft, calculated based on personal-use flight hours as a percentage of total flight hours charged to Grace, (
$49,673
) and participation in the executive physical examination program (
$2,120
).
|
Grants of Plan-Based Awards in 2013
The following table provides information regarding grants under our Annual Incentive Compensation Plan, or AICP, and Long Term Incentive Plan, or LTIP, to the executive officers named in the Summary Compensation Table during 2013.
|
Name
|
Plan
|
Grant
Date
|
Estimated Possible Payouts
Under Non-Equity
Incentive Plan Awards(a)
|
Estimated Future Payouts Under Equity Incentive Plan Award(s)
|
All Other
Option
Awards:
Number of
Securities
Underlying
Options
(#)(d)
|
Exercise
or Base
Price of
Option
Awards
($/Sh)(e)
|
Closing Price on Grant Date
($/Sh)
|
Grant Date
Fair Value
of Stock and Option
Awards
($)(f)
|
||||||||||
|
Threshold
($)(b)
|
Target
($)(b)
|
Maximum
($)(b)
|
Threshold
(#)(c)
|
Target
(#)(c)
|
Maximum (#)(c)
|
|||||||||||||
|
A. E. Festa
|
2013 AICP
|
n/a
|
243,750
|
975,000
|
1,950,000
|
-—-
|
-—-
|
-—-
|
-—-
|
-—-
|
-—-
|
-—-
|
||||||
|
2013 LTIP (Option)
|
5/2/2013
|
-—-
|
-—-
|
-—-
|
-—-
|
-—-
|
-—-
|
90,986
|
76.655
|
77.480
|
1,761,324
|
|||||||
|
2013 LTIP (PBU)
|
5/2/2013
|
-—-
|
-—-
|
-—-
|
12,067
|
24,134
|
48,268
|
-—-
|
-—-
|
-—-
|
1,849,992
|
|||||||
|
H. La Force III
|
2013 AICP
|
n/a
|
94,000
|
376,000
|
752,000
|
-—-
|
-—-
|
-—-
|
-—-
|
-—-
|
-—-
|
-—-
|
||||||
|
2013 LTIP (Option)
|
5/2/2013
|
-—-
|
-—-
|
-—-
|
-—-
|
-—-
|
-—-
|
19,673
|
76.655
|
77.480
|
380,834
|
|||||||
|
2013 LTIP (PBU)
|
5/2/2013
|
-—-
|
-—-
|
-—-
|
2,609
|
5,218
|
10,436
|
-—-
|
-—-
|
-—-
|
399,986
|
|||||||
|
G. E. Poling
|
2013 AICP
|
n/a
|
135,000
|
540,000
|
1,080,000
|
-—-
|
-—-
|
-—-
|
-—-
|
-—-
|
-—-
|
-—-
|
||||||
|
2013 LTIP (Option)
|
5/2/2013
|
-—-
|
-—-
|
-—-
|
-—-
|
-—-
|
-—-
|
36,886
|
76.655
|
77.480
|
714,046
|
|||||||
|
2013 LTIP (PBU)
|
5/2/2013
|
-—-
|
-—-
|
-—-
|
4,892
|
9,784
|
19,568
|
-—-
|
-—-
|
-—-
|
749,993
|
|||||||
|
M. A. Shelnitz
|
2013 AICP
|
n/a
|
68,250
|
273,000
|
546,000
|
-—-
|
-—-
|
-—-
|
-—-
|
-—-
|
-—-
|
-—-
|
||||||
|
2013 LTIP (Option)
|
5/2/2013
|
-—-
|
-—-
|
-—-
|
-—-
|
-—-
|
-—-
|
13,525
|
76.655
|
77.480
|
261,820
|
|||||||
|
2013 LTIP (PBU)
|
5/2/2013
|
-—-
|
-—-
|
-—-
|
1,794
|
3,588
|
7,176
|
-—-
|
-—-
|
-—-
|
275,038
|
|||||||
|
P. K. Wagoner
|
2013 AICP
|
n/a
|
58,625
|
234,500
|
469,000
|
-—-
|
-—-
|
-—-
|
-—-
|
-—-
|
-—-
|
-—-
|
||||||
|
2013 LTIP (Option)
|
5/2/2013
|
-—-
|
-—-
|
-—-
|
-—-
|
-—-
|
-—-
|
11,066
|
76.655
|
77.480
|
214,218
|
|||||||
|
2013 LTIP (PBU)
|
5/2/2013
|
-—-
|
-—-
|
-—-
|
1,468
|
2,935
|
5,870
|
-—-
|
-—-
|
-—-
|
224,982
|
|||||||
_______________________________________________________________________________
|
(a)
|
Actual payments pursuant to the 2013 AICP that we expect to pay in March 2014 have been determined and are reflected in the Summary Compensation Table.
|
|
(b)
|
Amounts are based upon base salary actually paid during 2013.
|
|
(c)
|
The number of performance-based units that are earned, if any, will be based on performance for fiscal years 2013 to 2015 and will be determined after the close of fiscal year 2015.
|
|
(d)
|
Options are exercisable in one-third increments on May 2, 2014, May 1, 2015 and May 2, 2016.
|
|
(e)
|
The exercise price was determined based on the average of the high and low trading prices of Grace common stock on the New York Stock Exchange on the grant date.
|
|
(f)
|
The grant date fair value is generally the amount that Grace would expense in its financial statements over the award's service period, but does not include a reduction for forfeitures.
|
42
2013 Annual Incentive Compensation Plan (AICP)
The AICP is a cash-based pay-for-performance incentive plan. Awards under the AICP are allocated from the incentive pool, the amount of which is determined by the extent to which business performance objectives are achieved. The committee has discretion to establish or increase the size of the incentive pool even if performance objectives are not achieved. Once the incentive pool is established, an executive officer's award payment is determined based on the individual's target award, performance and other factors determined by the committee.
In order to receive an AICP award payment for a specific calendar year, employees generally must be actively employed by Grace through the payout date, which is typically in March of the following year. See "Potential Payments Upon Termination or Change-In-Control—Termination and Change-in-Control Arrangements" for a description of the circumstances under which AICP payments would be made upon termination of an executive's employment with Grace.
Long-Term Incentive Plan (LTIP)
Our long-term incentive plans are multi-year, pay-for-performance incentive plans. Awards under our 2013-2015 LTIP consisted of a performance-based unit award and an award of stock options under our Amended and Restated 2011 Stock Incentive Plan.
Outstanding Equity Awards at Fiscal Year End 2013
The following table provides information regarding outstanding stock options held by the executive officers named in the Summary Compensation Table as of December 31, 2013.
43
|
|
Option Awards
|
Stock Awards
|
|||||||||||||||||
|
Name
|
Number of
Securities
Underlying
Unexercised
Options
(#)
Exercisable
|
Number of
Securities
Underlying
Unexercised
Options
(#)
Unexercisable
|
|
Option
Exercise
Price
($)
|
Option
Expiration
Date
|
Equity incentive plan awards: number of unearned units that have not vested
(#)
|
Equity incentive plan awards: payout value of unearned units that have not vested
(#)
|
||||||||||||
|
A. E. Festa
|
—
|
|
—
|
|
—
|
|
—
|
|
24,134
|
|
2,386,129
|
|
(a)
|
||||||
|
—
|
|
90,986
|
|
(b)
|
76.655
|
5/2/2018
|
|
—
|
|
—
|
|
||||||||
|
54,000
|
|
108,000
|
|
(c)
|
48.450
|
6/28/2017
|
|
—
|
|
—
|
|
||||||||
|
176,193
|
|
88,097
|
|
(d)
|
42.255
|
5/5/2016
|
|
—
|
|
—
|
|
||||||||
|
262,500
|
|
—
|
|
27.745
|
5/5/2015
|
|
—
|
|
—
|
|
|||||||||
|
108,236
|
|
—
|
|
9.785
|
5/7/2014
|
|
—
|
|
—
|
|
|||||||||
|
H. La Force III
|
—
|
|
—
|
|
—
|
|
—
|
|
5,218
|
|
515,904
|
|
(a)
|
||||||
|
—
|
|
19,673
|
|
(b)
|
76.655
|
5/2/2018
|
|
—
|
|
—
|
|
||||||||
|
13,336
|
|
26,664
|
|
(c)
|
48.450
|
6/28/2017
|
|
—
|
|
—
|
|
||||||||
|
33,333
|
|
16,667
|
|
(d)
|
42.255
|
5/5/2016
|
|
—
|
|
—
|
|
||||||||
|
54,250
|
|
—
|
|
27.745
|
5/5/2015
|
|
—
|
|
—
|
|
|||||||||
|
34,744
|
|
—
|
|
9.785
|
5/7/2014
|
|
—
|
|
—
|
|
|||||||||
|
G. E. Poling
|
—
|
|
—
|
|
—
|
|
—
|
|
9,784
|
|
967,344
|
|
(a)
|
||||||
|
—
|
|
36,886
|
|
(b)
|
76.655
|
5/2/2018
|
|
—
|
|
—
|
|
||||||||
|
27,000
|
|
54,000
|
|
(c)
|
48.450
|
6/28/2017
|
|
—
|
|
—
|
|
||||||||
|
6,667
|
|
3,333
|
|
(e)
|
41.250
|
11/3/2016
|
|
—
|
|
—
|
|
||||||||
|
40,001
|
|
19,999
|
|
(d)
|
42.255
|
5/5/2016
|
|
—
|
|
—
|
|
||||||||
|
66,938
|
|
—
|
|
27.745
|
5/5/2015
|
|
—
|
|
—
|
|
|||||||||
|
M. A. Shelnitz
|
—
|
|
—
|
|
—
|
|
—
|
|
3,588
|
|
354,746
|
|
(a)
|
||||||
|
—
|
|
13,525
|
|
(b)
|
76.655
|
5/2/2018
|
|
—
|
|
—
|
|
||||||||
|
9,000
|
|
18,000
|
|
(c)
|
48.450
|
6/28/2017
|
|
—
|
|
—
|
|
||||||||
|
23,333
|
|
11,667
|
|
(d)
|
42.255
|
5/5/2016
|
|
—
|
|
—
|
|
||||||||
|
42,000
|
|
—
|
|
27.745
|
5/5/2015
|
|
—
|
|
—
|
|
|||||||||
|
40,590
|
|
—
|
|
9.785
|
5/7/2014
|
|
—
|
|
—
|
|
|||||||||
|
P. K. Wagoner
|
—
|
|
—
|
|
—
|
|
—
|
|
2,935
|
|
290,183
|
|
(a)
|
||||||
|
—
|
|
11,066
|
|
(b)
|
76.655
|
5/2/2018
|
|
—
|
|
—
|
|
||||||||
|
7,669
|
|
15,331
|
|
(c)
|
48.450
|
6/28/2017
|
|
—
|
|
—
|
|
||||||||
|
20,001
|
|
9,999
|
|
(d)
|
42.255
|
5/5/2016
|
|
—
|
|
—
|
|
||||||||
|
35,000
|
|
—
|
|
27.745
|
5/5/2015
|
|
—
|
|
—
|
|
|||||||||
_______________________________________________________________________________
|
(a)
|
Market value of performance-based units that have not been earned is based on the December 31, 2013 closing market price of Grace common stock of $98.87 per share. The performance-based units will be earned or forfeited based on Grace performance from fiscal year 2013 through fiscal year 2015. Performance for fiscal year 2013 was at a level in excess of one-third of the performance threshold; therefore, the target amounts are shown.
|
|
(b)
|
Options are exercisable in one-third increments on May 2, 2014, May 1, 2015 and May 2, 2016.
|
|
(c)
|
Options are exercisable in one-third increments on June 28, 2013, June 28, 2014 and June 28, 2015.
|
|
(d)
|
Options are exercisable in one-third increments on May 4, 2012, May 3, 2013 and May 5, 2014.
|
|
(e)
|
Options are exercisable in one-third increments on November 2, 2012, November 1, 2013 and November 3, 2014.
|
44
Option Exercises and Stock Vested in 2013
The following table provides information regarding the exercise of options held by the executive officers named in the Summary Compensation Table during 2013.
|
|
Option Awards
|
Stock Awards
|
||||||||
|
Name
|
Number of
Shares
Acquired on
Exercise
(#)
|
Value
Realized on
Exercise
($)
|
Number of
Shares
Acquired on
Vesting
(#)
|
Value
Realized on
Vesting
($)
|
||||||
|
A. E. Festa
|
312,964
|
21,813,410
|
—
|
|
—
|
|
||||
|
H. La Force III
|
61,186
|
3,856,979
|
—
|
|
—
|
|
||||
|
G. E. Poling
|
71,030
|
4,711,402
|
—
|
|
—
|
|
||||
|
M. A. Shelnitz
|
31,710
|
1,802,427
|
—
|
|
—
|
|
||||
|
P. K. Wagoner
|
0
|
0
|
—
|
|
—
|
|
||||
Pension Benefits
The following table provides information regarding benefits under our Retirement Plan for Salaried Employees, or Pension Plan, our Supplemental Executive Retirement Plan, or SERP, and any supplemental pension arrangements under employment agreements for the executive officers named in the Summary Compensation Table.
|
Name
|
Plan Name
|
Number of Years Credited Service
(years)
|
Present Value of Accumulated Benefit*
($)
|
Payments During
Last Fiscal Year
($)
|
|||||||
|
A. E. Festa
|
Pension Plan
|
10.08
|
|
314,000
|
|
—
|
|
||||
|
SERP
|
10.08
|
|
2,658,000
|
|
—
|
|
|||||
|
H. La Force III
|
Pension Plan
|
5.75
|
|
145,000
|
|
—
|
|
||||
|
SERP
|
5.75
|
|
352,000
|
|
—
|
|
|||||
|
G. E. Poling
|
Pension Plan
|
34.42
|
|
1,300,000
|
|
—
|
|
||||
|
SERP
|
34.42
|
|
4,315,000
|
|
—
|
|
|||||
|
M. A. Shelnitz
|
Pension Plan
|
30.17
|
|
1,003,000
|
|
—
|
|
||||
|
SERP
|
30.17
|
|
1,823,000
|
|
—
|
|
|||||
|
P. K. Wagoner
|
Pension Plan
|
4.42
|
|
122,000
|
|
—
|
|
||||
|
SERP
|
4.42
|
|
143,000
|
|
—
|
|
|||||
_______________________________________________________________________________
|
*
|
Amounts comprise the actuarial present value of the executive officer's accumulated benefit under the Pension Plan and SERP as of December 31, 2013, assuming a 4.76% discount rate and retirement at age 62 with benefits payable on a straight life annuity basis and other assumptions used for financial reporting purposes under generally accepted accounting principles as described in this Report in Item 8 (Financial Statements and Supplementary Data) in the Financial Supplement under Note 11 (Pension Plans and Other Postretirement Benefits Plans) to the Consolidated Financial Statements. The Pension Plan and SERP provide for a reduction in pension benefits to employees that elect early retirement ranging from a 17% reduction for retirement at age 55 to no reduction for retirement at age 62.
|
Retirement Plan for Salaried Employees
Full-time salaried employees who are 21 or older and who have one or more years of service are eligible to participate in our Retirement Plan for Salaried Employees, or Pension Plan. Under this basic retirement plan, pension benefits are based upon (a) the employee's average annual compensation for the 60 consecutive months in which his or her compensation is highest during the last 180 months of continuous participation, and (b) the number of years of the employee's credited Grace service. At age 62, a participant is entitled to full benefits under the Pension Plan but a participant may elect reduced payments upon early retirement beginning at age 55. For purposes of the Pension Plan, compensation generally includes base salary and AICP awards; however, for 2013, federal income tax law limits to $255,000 the annual compensation on which benefits under the Pension Plan may be based. The Pension Plan is further described in Item 8 (Financial Statements and Supplementary Data) in the
45
Financial Supplement under Note 11 (Pension Plans and Other Postretirement Benefits Plans) to the Consolidated Financial Statements and in Item 7 (Management's Discussion and Analysis of Financial Condition and Results of Operations under the caption "Financial Condition, Liquidity, and Capital Resources—Employee Benefit Plans—Defined Benefit Pension Plans") in the Financial Supplement.
Supplemental Executive Retirement Plan
We also have an unfunded, nonqualified Supplemental Executive Retirement Plan, or SERP, under which an employee will receive the full pension to which he or she would be entitled in the absence of the limitations described above and other limitations imposed under federal income tax law. In addition, the SERP recognizes deferred base salary, deferred annual incentive compensation awards and, in some cases, periods of employment during which an employee was ineligible to participate in the basic retirement plan. In respect to payments, the SERP generally operates in the same manner as the Pension Plan. Since 2001, we have not permitted deferrals of base salary or incentive compensation. The SERP is further described in Item 8 (Financial Statements and Supplementary Data) in the Financial Supplement under Note 11 (Pension Plans and Other Postretirement Benefits Plans) to the Consolidated Financial Statements and in Item 7 (Management's Discussion and Analysis of Financial Condition and Results of Operations under the caption "Financial Condition, Liquidity, and Capital Resources—Employee Benefit Plans—Defined Benefit Pension Plans") in the Financial Supplement.
Non-Qualified Deferred Compensation Plan
The following table summarizes the compensation deferred by the named executive officer pursuant to the provisions of Grace's incentive compensation plan in 1998, under which certain employees were permitted to voluntarily defer receipt of shares of Grace common stock. Such deferred shares were contributed to a "rabbi trust" held for the benefit of the deferred compensation plan participants. Shares held in the plan are fully vested and may be distributed to the plan beneficiary upon retirement or termination of service with us. Since 1998, executives may no longer defer receipt of shares under the plan, although existing balances remain in place.
Fiscal Year 2013 Non-Qualified Deferred Compensation
|
Name
|
Executive
Contributions
in Fiscal Year
2013
($)
|
Registrant
Contributions
in Fiscal
Year 2013
($)
|
Aggregate
Earnings in Fiscal
Year 2013
($)
|
|
Aggregate
Withdrawals/
Distributions
in Fiscal
Year 2013
($)
|
Aggregate
Balance at
Fiscal Year
2013 End
($)
|
|
|||||||||
|
M. A. Shelnitz
|
—
|
|
—
|
|
298,075
|
|
(a)
|
—
|
|
931,439
|
|
(b)
|
||||
_______________________________________________________________________________
|
(a)
|
Amount represents the increase in value of 9,420.8496 shares of Grace common stock held in the plan based on the closing prices of Grace common stock on December 31, 2012, of $67.23 and December 31, 2013, of $98.87. Amounts reflected are not included in the "Summary Compensation Table" because the earnings are not "above market."
|
|
(b)
|
Amount represents the value of 9,420.8496 shares of Grace common stock held in the plan based on the closing price of Grace common stock on December 31, 2013, of $98.87.
|
Potential Payments Upon Termination or Change-In-Control
The following table sets forth potential payments to executive officers named in the Summary Compensation Table in the event of the listed events, calculated under the assumption that employment terminated on the last day of 2013. The following table does not include payments pursuant to contracts, agreements, plans and arrangements that do not discriminate in scope, terms or operation, in favor of executive officers and that are available generally to all salaried employees. The value of payments to be made following termination of employment pursuant to the Grace Retirement Plan and the Grace SERP are described above under the caption "Pension Benefits." The value of payments to be made following termination of employment pursuant to Mr. Shelnitz's deferred shares arrangement are described above under the caption "Non-Qualified Deferred Compensation Plan."
46
|
Name
|
Involuntary
Termination
Without Cause
($)(a)
|
Change-in-Control
($)(b)
|
Involuntary
Termination
Without Cause
Following
Change-in-
Control
($)(c)(d)
|
Death
($)(c)(e)
|
Disability
($)(c)(f)
|
|||||||||
|
A. E. Festa
|
3,412,500
|
|
12,454,226
|
7,620,376
|
|
1,770,376
|
|
1,102,876
|
|
|||||
|
H. La Force III
|
705,000
|
|
2,725,037
|
3,085,968
|
|
641,968
|
|
344,301
|
|
|||||
|
G. E. Poling
|
1,200,000
|
|
4,866,393
|
4,282,448
|
|
922,448
|
|
442,448
|
|
|||||
|
M. A. Shelnitz
|
780,000
|
|
1,868,545
|
2,380,249
|
|
508,249
|
|
215,749
|
|
|||||
|
P. K. Wagoner
|
502,500
|
|
1,584,914
|
2,039,728
|
|
431,728
|
|
208,385
|
|
|||||
_______________________________________________________________________________
|
(a)
|
Consists: (i) in the case of Mr. Festa, of minimum severance payments pursuant to his employment agreement as described below under "
—
Termination and Change-in-Control Arrangements
—
CEO Severance Arrangements;" and (ii) in the case of the other executive officers, minimum severance payments pursuant to severance agreements as described below under "
—
Termination and Change-in-Control Arrangements
—
Other Executive Officer Severance Arrangements." Amount excludes cash LTIP payments (in amounts set forth below in footnote (c)) and/or AICP payments that executive officers may receive in the discretion of the Compensation Committee as described below under "
—
Termination and Change-in-Control Arrangements."
|
|
(b)
|
Upon change-in-control, stock options immediately become fully vested and exercisable. Amount shown represents the in-the-money value of unvested stock options as of December 31, 2013.
|
|
(c)
|
Includes payments under the 2013-2015 Performance-based Units (PBUs) calculated as described below under "--Termination and Change-in-Control Arrangements--Long Term Incentive Program (PBU Awards)" under the assumption that the 2013 PBUs pay out at the target amount as follows:
|
|
Name
|
2013-2015
PBUs
($)
|
||
|
A. E. Festa
|
795,376
|
|
|
|
H. La Force III
|
171,968
|
|
|
|
G. E. Poling
|
322,448
|
|
|
|
M. A. Shelnitz
|
118,249
|
|
|
|
P. K. Wagoner
|
96,728
|
|
|
|
(d)
|
Includes contractual payments pursuant to each executive's respective Change-in-Control Severance Agreement calculated under the assumption that no excise tax will apply as follows:
|
|
Name
|
Change-in-Control
Severance Payments
($)
|
||
|
A. E. Festa
|
6,825,000
|
|
|
|
H. La Force III
|
2,914,000
|
|
|
|
G. E. Poling
|
3,960,000
|
|
|
|
M. A. Shelnitz
|
2,262,000
|
|
|
|
P. K. Wagoner
|
1,943,000
|
|
|
|
(e)
|
Includes the sum of payments under the Grace Executive Salary Protection Plan (ESPP) during the first year following death. Amount excludes AICP payments executive officers may receive under certain circumstances in the discretion of the Compensation Committee as described below under "
—
Termination and Change-in-Control Arrangements." During subsequent years after death until the specified termination year (reflecting the executive officer's age as of December 31, 2013), the sum of payments each year would be as follows:
|
47
|
Name
|
ESPP Payments
Each Year Following
Year of Death
($)
|
Year of Termination of Payments*
|
|||
|
A. E. Festa
|
487,500
|
|
2024
|
||
|
H. La Force III
|
235,000
|
|
2024
|
||
|
G. E. Poling
|
300,000
|
|
2021
|
||
|
M. A. Shelnitz
|
195,000
|
|
2024
|
||
|
P. K. Wagoner
|
167,500
|
|
2024
|
||
_______________________________________________________________________________
|
*
|
Payments terminate 10 years following death; provided however, if the executive officer is over age 55 at the time of death, the duration of payments is reduced.
|
|
(f)
|
Includes sum of payments under the Grace Executive Salary Protection Plan during the first year following disability, assuming the executive officer remains disabled for at least 12 consecutive months. Amounts reflect the offset of expected payments under Grace's long-term and short-term disability plans that are based, in part, on the duration of the executive officer's employment. Amount excludes AICP payments they may receive under certain circumstances in the discretion of the Compensation Committee as described below under "
—
Termination and Change-in-Control Arrangements
—
Annual Incentive Compensation Plan." During subsequent years after disability until the specified termination year or earlier death or end of disability, the sum of payments each year would be:
|
|
Name*
|
ESPP Payments
Each Year Following
Year of Disability
($)
|
Year of Termination of Payments
|
|||
|
A. E. Festa
|
225,000
|
|
2024
|
||
|
H. La Force III
|
47,000
|
|
2029
|
||
|
M. A. Shelnitz
|
39,000
|
|
2023
|
||
_______________________________________________________________________________
|
*
|
Due to the offset of expected payments under Grace's long-term and short-term disability plans, Grace expects that the other named executive officers would not receive any additional payments under the ESPP after the first year of disability.
|
Termination and Change-in-Control Arrangements
Change-in-Control Severance Agreements.
We have entered into severance agreements with all of our executive officers, which renew automatically unless the Board elects not to renew them. These agreements generally provide that in the event of the involuntary termination of the individual's employment without cause (including constructive termination caused by a material reduction in his or her authority or responsibility or by certain other circumstances) following a "change in control," he or she will generally receive a severance payment equal to three times the sum of his or her annual base salary plus target annual incentive compensation, subject to reduction, pro rata in the case of an executive officer who is within 36 months of normal retirement age (65) or, under certain circumstances, to minimize the effect of certain excise taxes if applicable. For purposes of the severance agreements, "change in control" means the acquisition of 20% or more of the outstanding Grace common stock (but not if such acquisition is the result of the sale of common stock by Grace that has been approved by the Board), the failure of Board-nominated directors to constitute a majority of any class of the Board of Directors, the occurrence of a transaction in which the Grace shareholders immediately preceding such transaction do not own more than 50% of the combined voting power of the entity resulting from such transaction, or the liquidation or dissolution of Grace. The severance amount would be paid in a single lump-sum after termination. The description of the severance agreements in Item 11 of this Report does not purport to be complete and is qualified in its entirety by reference to the form of such agreement, which has been filed with the SEC.
CEO Severance Arrangements.
Under the terms of Mr. Festa's employment agreement, if we terminate Mr. Festa's employment without cause, or he terminates his employment as a result of constructive discharge, he would be entitled to a severance payment equal to two times a dollar amount equal to 175% of his annual base salary at the time of his termination. The severance amount would be paid in installments over a period of 24 months; however, at Mr. Festa's option, as approved by the Compensation Committee, the entire severance amount may be paid in a single lump-sum after termination. The provisions of Mr. Festa's employment agreement pertaining to this severance amount survived the expiration of the agreement on May 31, 2013. Severance
48
payments under Mr. Festa's employment agreement are contingent upon Mr. Festa's execution of an agreement releasing Grace from liabilities related to Mr. Festa's employment by Grace. The description of Mr. Festa's employment agreement in Item 11 of this Report does not purport to be complete and is qualified in its entirety by reference to the agreement, which has been filed with the SEC.
Other Executive Officer Severance Arrangements.
We have entered into severance agreements with Messrs. La Force (included in his employment agreement), Poling and Shelnitz and Ms. Wagoner (included in her employment Agreement). Under the terms of the severance arrangements applicable to these named executive officers, in the event of the involuntary termination of the executive officer's employment under circumstances that would qualify the executive officer for severance pay under the severance plan that generally covers our salaried employees, the executive officer would be entitled to severance pay equal to two times his annual base salary, in the case of Messrs. Poling and Shelnitz, or one and one-half times his or her annual base salary, in the case of Mr. La Force and Ms. Wagoner. The severance amount would be paid in installments in the form of salary continuation, provided that an executive officer could elect to receive the entire severance amount as a single lump sum after termination in conjunction with the termination of certain employee benefit coverage. Severance payments are contingent upon the named executive officer's execution of an agreement releasing Grace from liabilities related to his or her employment by Grace. Other than with respect to the amount of severance, the severance arrangements for these named executive officers are the same. The description of the severance arrangements in Item 11 of this Report does not purport to be complete and is qualified in its entirety by reference to Mr. La Force's employment agreement, Ms. Wagoner's employment agreement, the form of executive severance agreement and the Grace Severance Pay Plan for Salaried Employees, each of which has been filed with the SEC.
Executive Salary Protection Plan.
All executive officers participate in the Executive Salary Protection Plan which provides that, in the event of a participant's disability or death prior to age 70, we will continue to pay all or a portion of base salary to the participant or a beneficiary for a period based on the participant's age at the time of disability or death. Payments under the plan may not exceed 100% of base salary for the first year and 60% thereafter in the case of disability (50% in the case of death). Any payment under the plan as a result of disability would be reduced by the amount of disability income received under Grace's long-term and short-term disability plans that are generally applicable to U.S. salaried employees. The payments would be paid in installments in the form of salary continuation. The description of the plan in Item 11 of this Report does not purport to be complete and is qualified in its entirety by reference to the text of the Executive Salary Protection Plan, as amended, which is filed with the SEC.
Annual Incentive Compensation Plan.
An employee whose employment terminates prior to an AICP payout date will generally not receive an AICP payment. However, in the discretion of the Compensation Committee, an employee whose employment terminates prior to the payout date may receive an AICP award payment if the employee has more than three months' service under the AICP and employment terminates for any of the following reasons: retirement under a Grace retirement plan; death; disability; divestment; or other termination of employment by Grace that is not for cause. If an employee whose employment terminates prior to the end of a year receives an AICP award payment for that year, the amount of the AICP award payment will generally be prorated for the period of the employee's service during the year and paid at the time the award is paid to active Grace employees. The description of the AICP in Item 11 of this Report does not purport to be complete and is qualified in its entirety by reference to the text of the AICP which is filed with the SEC.
Long Term Incentive Plan (Amended and Restated 2011 Stock Incentive Plan--Performance-based Unit (PBU) Awards).
An employee whose employment terminates prior to the payout date will forfeit any unpaid PBU award payment if employment terminates for any of the following reasons:
|
•
|
voluntary termination without the consent of the Compensation Committee;
|
|
•
|
retirement under a Grace retirement plan prior to age 62 without the consent of the Compensation Committee; or
|
|
•
|
termination for cause.
|
An employee whose employment terminates prior to the payout date will receive a PBU award payment if employment terminates for any of the following reasons:
|
•
|
retirement under a Grace retirement plan either at or after age 62;
|
|
•
|
death or disability; or
|
49
|
•
|
involuntary termination after a change in control of Grace ("change in control" means that a person beneficially owns 20% or more of the outstanding Grace common stock (but not if such ownership is the result of the sale of Grace common stock by Grace that has been approved by the Board or pursuant to a plan of reorganization that is confirmed and effective), the failure of Board-nominated directors to constitute a majority of any class of the Board of Directors, the occurrence of a corporate transaction in which the Grace shareholders immediately preceding such transaction do not own more than 50% of the combined voting power of the entity resulting from such transaction, or the liquidation or dissolution of Grace).
|
In the discretion of the Compensation Committee, an employee whose employment terminates for a reason that is not described above (i.e. involuntary termination not for cause or transfer to the buyer of a Grace business unit) prior to the payout date may receive a PBU award payment. If an employee whose employment terminates prior to the end of a PBU performance period receives a PBU award payment for that performance period, the amount of the PBU award payment will be prorated for the period of the employee's service during the performance period and paid at the time the award is paid to active Grace employees. The description of the Amended and Restated 2011 Stock Incentive Plan--Performance-based Unit (PBU) Awards in Item 11 of this Report does not purport to be complete and is qualified in its entirety by reference to the text of the Amended and Restated 2011 Stock Incentive Plan and the Form of Performance-based Unit Grant Agreement which are filed with the SEC.
Long Term Incentive Plan (2000, 2011 and Amended and Restated 2011 Stock Incentive Plans--Stock Option Awards).
Any stock option held by an employee whose employment terminates prior to exercise will terminate:
|
•
|
when employment terminates, if employment terminates voluntarily, without the consent of the Compensation Committee, or for cause;
|
|
•
|
three years after employment terminates, if employment terminates due to death or incapacity;
|
|
•
|
three years after employment terminates, if employment terminates due to retirement under a Grace retirement plan, provided the employee continues to serve Grace until the first installment of the stock option becomes exercisable; or
|
|
•
|
three months (subject to extension by the Compensation Committee for up to three years) after employment terminates, if employment terminates for another reason; provided however, if the holder dies or becomes incapacitated during the three-month period (or such longer period as the Compensation Committee approves) the option shall terminate three years after employment termination.
|
In the event of a Change in Control, any stock options outstanding under the 2000, 2011 and Amended and Restated Stock Incentive Plans, that are not exercisable and vested, shall become fully exercisable and vested to the full extent of the original grant. For purposes of the 2000, 2011 and Amended and Restated 2011 Stock Incentive Plans, "change in control" means:
|
•
|
the acquisition of 20% or more of the outstanding Grace Common Stock (but not if such acquisition is the result of the sale of Grace common stock by Grace that has been approved by the Board);
|
|
•
|
the failure of Board-nominated directors to constitute a majority of any class of the Board of Directors;
|
|
•
|
the occurrence of a transaction in which the Grace shareholders immediately preceding such transaction do not own more than 50% of the combined voting power of the entity resulting from such transaction; or
|
|
•
|
the liquidation or dissolution of Grace.
|
The description of the 2000, 2011 and Amended and Restated 2011 Stock Incentive Plan--Stock Option Awards in Item 11 of this Report does not purport to be complete and is qualified in its entirety by reference to the text of the 2000, 2011 and Amended and Restated 2011 Stock Incentive Plans and the Form of Stock Option Grant Agreement which are filed with the SEC.
Director Compensation for 2013
Under the compensation program for nonemployee directors in effect during 2013, each nonemployee director received an annual retainer that is split between cash (44%) and equity (56%). Under this program, each nonemployee director received: an annual retainer of $80,000 in cash, 50% of which was paid in January and 50% of which was paid in December; and an annual award of approximately $100,000 of Grace common stock which
50
was issued in May. Additional annual cash retainers were paid in December as follows: the Lead Independent Director received $20,000; the Audit Committee Chair received $15,000; and the Chairs of the Compensation and the Nominating and Governance Committees each received $10,000. We reimburse directors for expenses they incur in attending Board and committee meetings and other activities incidental to their service as directors. Our directors, and all Grace employees, are entitled to participate in the Grace Foundation's Matching Grants Program. We also maintain business travel accident insurance coverage for our directors. Mr. Festa's compensation is described above in the Summary Compensation Table and he receives no additional compensation for serving as a member of the Board of Directors.
The following table sets forth amounts that we paid to our nonemployee directors in connection with their services to Grace during 2013.
|
Name
|
Fees
Earned
or Paid
in Cash
($)(b)
|
Stock
Awards
($)
|
Option
Awards
($)
|
Non-Equity
Incentive Plan
Compensation
($)
|
Change in
Pension
Value and
Nonqualified
Deferred
Compensation
Earnings
($)
|
All Other
Compensation
($)(c)
|
|
Total
($)
|
|||||||||||
|
J. F. Akers(a)
|
85,000
|
100,035
|
|
—
|
|
—
|
|
—
|
|
—
|
|
185,035
|
|||||||
|
H. F. Baldwin
|
80,000
|
100,035
|
|
—
|
|
—
|
|
—
|
|
—
|
|
|
180,035
|
||||||
|
R. C. Cambre
|
80,000
|
100,035
|
|
—
|
|
—
|
|
—
|
|
2,000
|
|
(d)
|
182,035
|
||||||
|
M. A. Fox
|
80,000
|
100,035
|
|
—
|
|
—
|
|
—
|
|
—
|
|
|
180,035
|
||||||
|
J. K. Henry
|
80,000
|
100,035
|
|
—
|
|
—
|
|
—
|
|
—
|
|
|
180,035
|
||||||
|
J. N. Quinn
|
85,000
|
100,035
|
|
—
|
|
—
|
|
—
|
|
—
|
|
|
185,035
|
||||||
|
C. J. Steffen
|
110,000
|
100,035
|
|
—
|
|
—
|
|
—
|
|
3,000
|
|
(d)
|
213,035
|
||||||
|
M. E. Tomkins
|
95,000
|
100,035
|
|
—
|
|
—
|
|
—
|
|
—
|
|
|
195,035
|
||||||
_______________________________________________________________________________
|
(a)
|
John F. Akers resigned from the Board of Directors and all committees effective January 17, 2014.
|
|
(b)
|
Amount consists of annual cash retainer in the amount of $80,000 and additional payments to: Mr. Akers and Mr. Quinn for serving as Chair of the Compensation Committee in the amounts of $5,000; Mr. Tomkins for serving as Chair of the Audit Committee in the amount of $15,000; and Mr. Steffen for serving as Chair of the Nominating and Governance Committee and Lead Independent Director in the amount of $30,000.
|
|
(c)
|
Grace paid an aggregate of $1,909 in premiums for business travel accident insurance coverage for all directors during 2013.
|
|
(d)
|
Consists of charitable contributions paid during 2013 to academic institutions at the request of the director pursuant to the Grace Foundation's Matching Grants Program.
|
Compensation Policies and Practices Relating to Risk Management
We do not believe that risks arising from our compensation policies and practices for our employees are reasonably likely to have a material adverse effect on Grace through excessive risk taking incentives or otherwise. Our compensation program, though tailored to our specific needs, is generally similar to compensation programs used by other companies in our industry. We have many years of experience with the various components of our compensation program, including our incentive plans under which payments may vary based on the performance of the business. We believe these plans, backed by our corporate ethics program and the Grace Core Values, have been successful in aligning the interests of our executives and senior employees with the interests of our stakeholders and in encouraging the responsible pursuit of corporate objectives by our employees.
Compensation Committee Interlocks and Insider Participation
During 2013, the Compensation Committee of the Board was composed of Messrs. Akers (Chair until May 2, 2013), Baldwin, Cambre, Quinn (Chair, effective May 2, 2013), Tomkins and Steffen, Dr. Fox and Ms. Henry. None of these persons is a current or former Grace officer or employee, nor did we have any reportable transactions with any of these persons. None of our executive officers serves or in the past has served as a member of the board of directors or compensation committee of any entity that has one or more of its executive officers serving on our Board of Directors or our Compensation Committee.
51
SECURITY OWNERSHIP
The following table sets forth the amount of Grace common stock beneficially owned, directly or indirectly, as of January 31,
2014
, by:
|
•
|
each person that we know is the beneficial owner of more than 5% of the outstanding shares of Grace common stock;
|
|
•
|
each current director;
|
|
•
|
each of the executive officers named in the Summary Compensation Table set forth in Item 11 above; and
|
|
•
|
all directors and all executive officers as a group.
|
|
Name and Address of Beneficial Owner(1)(2)
|
Shares of
Common
Stock
Beneficially
Owned(3)
|
|
Percent(4)
|
|||
|
WRG Asbestos PI Trust(5)
|
10,000,000
|
|
(W)
|
13.0
|
%
|
|
|
1100 North Market Street
Wilmington, Delaware 19890-1625W
|
||||||
|
Trust Advisory Committee
c/o Caplin & Drysdale Chartered
One Thomas Circle, N.W., Suite 1100
Washington, D.C. 20005-5802
Roger Frankel
c/o Frankel Wyron LLP
2101 L Street, N.W., Suite 800 Washington, D.C. 20037 |
||||||
|
Iridian Asset Management LLC(6)
|
4,774,915
|
|
6.2
|
%
|
||
|
David L. Cohen
Harold J. Levy |
||||||
|
276 Post Road West
Westport, CT 06880-4704 |
||||||
|
The Vanguard Group, Inc.(7)
|
4,139,329
|
|
5.4
|
%
|
||
|
100 Vanguard Blvd.
Malvern, PA 19355
|
||||||
|
FMR LLC(8)
|
4,080,235
|
|
5.3
|
%
|
||
|
Edward C. Johnson 3d
|
||||||
|
245 Summer Street
Boston, Massachusetts 02109
|
||||||
|
H. F. Baldwin
|
23,223
|
|
|
|
|
|
|
15,000
|
|
(T)
|
|
|
||
|
38,223
|
|
|
*
|
|
||
|
R. C. Cambre
|
10,000
|
|
|
*
|
|
|
|
A. E. Festa
|
150,517
|
|
|
|
|
|
|
600,929
|
|
(O)
|
|
|
||
|
751,446
|
|
|
1.0
|
%
|
||
|
M. A. Fox
|
56,651
|
|
|
|
|
|
|
8,942
|
|
(T)
|
|
|
||
|
65,593
|
|
|
*
|
|
||
|
J. K. Henry
|
1,305
|
|
|
*
|
|
|
|
J. N. Quinn
|
1,305
|
|
*
|
|
||
52
|
Name and Address of Beneficial Owner(1)(2)
|
Shares of
Common
Stock
Beneficially
Owned(3)
|
|
Percent(4)
|
|||
|
C. J. Steffen
|
11,305
|
|
|
*
|
|
|
|
M. E. Tomkins
|
12,000
|
|
|
*
|
|
|
|
H. La Force III
|
50,000
|
|
|
|
|
|
|
135,663
|
|
(O)
|
|
|
||
|
185,663
|
|
|
*
|
|
||
|
G. E. Poling
|
140,606
|
|
(O)
|
|
|
|
|
18,000
|
|
(T)
|
|
|
||
|
158,606
|
|
|
*
|
|
||
|
M. A. Shelnitz
|
53,500
|
|
|
|
|
|
|
114,923
|
|
(O)
|
|
|
||
|
9,421
|
|
(T)
|
|
|
||
|
177,844
|
|
|
*
|
|
||
|
P. K. Wagoner
|
62,670
|
|
(O)
|
*
|
|
|
|
Directors and executive officers as a group (12 persons)
|
369,806
|
|
|
|||
|
1,054,791
|
|
(O)
|
|
|
||
|
51,363
|
|
(T)
|
|
|
||
|
1,475,960
|
|
|
1.9
|
%
|
||
_______________________________________________________________________________
* Indicates less than 1%
|
(W)
|
Shares covered by warrant exercisable in the event a tender offer, or other proposed transaction that would result in a change in control of the Grace, is announced.
|
|
(O)
|
Shares covered by stock options exercisable on or within 60 days after January 31,
2014
.
|
|
(T)
|
Shares owned by trusts and other entities as to which the person has the power to direct voting and/or investment.
|
|
(1)
|
The address of each of our directors and executive officers is c/o Secretary, W. R. Grace & Co., 7500 Grace Drive, Columbia, MD 21044.
|
|
(2)
|
John F. Akers resigned from the Board of Directors and all committees effective January 17, 2014.
|
|
(3)
|
Except as otherwise indicated, to our knowledge, each individual, along with his or her spouse, has sole voting and investment power over the shares.
|
|
(4)
|
Based on 77,063,385 shares of Grace common stock outstanding on January 31,
2014
.
|
|
(5)
|
The ownership information set forth is based in its entirety on material contained in a Schedule 13D filed with the SEC by the WRG Asbestos PI Trust (the “PI Trust”), the Trust Advisory Committee (the “TAC”) and Roger Frankel, the Asbestos PI Future Claimants’ Representative (the “FCR”) on February 11, 2014. The Trust is the holder of a warrant to acquire 10 million shares of Common Stock at an exercise price of $17.00 per share, expiring February 3, 2015 (the “PI Warrant”). Grace has entered into an agreement to settle the PI Warrant in cash on or prior to February 3, 2015. The settlement is terminable by the PI Trust in the event a tender offer, or other proposed transaction that would result in a change in control of Grace, is announced on or prior to February 3, 2015. In such event, the PI Warrant would be settled in shares of Common Stock. The PI Trust is administered through three trustees, Harry Huge, Lewis Sifford and Dean M. Trafelet. The TAC is a four member advisory committee made up of Russell W. Budd, John D. Cooney, Joseph F. Rice and Perry Weitz. The PI Trust (acting through its trustees) has sole investment power over the shares held by the PI Trust. Under its trust agreement, the PI Trust must obtain the consent of the TAC (acting through its members) and the FCR to vote shares held by the PI Trust solely for purposes of electing members of the Grace Board of Directors. For additional information regarding the PI Warrant and the warrant settlement, see disclosure provided in this Report in Item 8 (Financial Statements and Supplementary Data)
|
53
in the Financial Supplement under Note 2 (Joint Plan of Reorganization) to the Consolidated Financial Statements.
|
(6)
|
The ownership information set forth is based in its entirety on material contained in a Schedule 13G/A filed with the SEC by Iridian Asset Management LLC ("Iridian"), David L. Cohen and Harold J. Levy on February 4, 2014. Iridian is majority owned by Arovid Associates LLC. Arovid is owned and controlled by the following: 12.5% by Mr. Cohen, 12.5% by Mr. Levy, 37.5% by LLMD LLC and 37.5% by ALHERO LLC. LLMD LLC is owned 1% by Mr. Cohen and 99% by a family trust controlled by Mr. Cohen. ALHERO LLC is owned 1% by Mr. Levy and 99% by a family trust controlled by Mr. Levy. Iridian has shared voting and investment power with respect to 4,774,915 shares held in accounts for which it serves as the investment adviser. Messrs. Cohen and Levy may be deemed to possess beneficial ownership of the shares of Common Stock beneficially owned by Iridian by virtue of their indirect controlling ownership of Iridian and having the shared voting and investment power over shares of Common Stock owned by Iridian as joint Chief Investment Officers of Iridian. Messrs. Cohen and Levy disclaim beneficial ownership of such shares.
|
|
(7)
|
The ownership information set forth is based in its entirety on material contained in a Schedule 13G filed with the SEC by The Vanguard Group, Inc. ("VGI") on February 12, 2014. VGI has sole voting power over 47,794 shares and sole and shared investment power over 4,096,435 and 42,894 shares, respectively. Vanguard Fiduciary Trust Company, a wholly-owned subsidiary of VGI, is the beneficial owner of 42,894 shares as a result of serving as investment manager of collective trust accounts. Vanguard Investments Australia, Ltd., a wholly-owned subsidiary of VGI, is the beneficial owner of 4,900 shares as a result of its serving as investment manager of Australian investment offerings.
|
|
(8)
|
The ownership information set forth is based in its entirety on material contained in a Schedule 13G filed with the SEC jointly by FMR LLC ("FMR") and Edward C. Johnson 3d ("Mr. Johnson") on February 14, 2014. FMR and Mr. Johnson have sole voting power with respect to 27,133 shares and sole investment power with respect to 4,080,235 shares. Mr. Johnson is Chairman of FMR and members of Mr. Johnson's family may be deemed a controlling group with respect to FMR due to their ownership of FMR voting shares and their entry into a voting agreement with respect to such shares. Fidelity Management & Research Company ("Fidelity") 245 Summer Street, Boston MA 02210 and Fidelity SelectCo, LLC (“SelectCo”) 1225 17
th
Street, Suite 1100, Denver, Colorado 80202 are each wholly-owned subsidiaries of FMR. Mr. Johnson and FMR, through its control of Fidelity and SelectCo, respectively, each has sole investment power over 2,866,650 shares and 1,181,370 shares owned by various investment companies for which Fidelity and SelectCo, respectively, serves as investment advisor. Strategic Advisors, Inc. ("SAI") 245 Summer Street, Boston MA 02210, is a wholly-owned subsidiary of FMR. Mr. Johnson and FMR, through its control of SAI, each has beneficial ownership of 1,624 shares owned by accounts managed by SAI. Pyramis Global Advisors, LLC ("PGA"), 900 Salem Street, Smithfield, Rhode Island 02917, is a wholly-owned indirect subsidiary of FMR. Mr. Johnson and FMR, through its control of PGA, each has sole investment power over 440 shares owned by accounts or funds advised by PGATC. Pyramis Global Advisors Trust Company ("PGATC"), 900 Salem Street, Smithfield, Rhode Island 02917, is a wholly-owned indirect subsidiary of FMR. Mr. Johnson and FMR, through its control of PGATC, each has sole investment power over 21,981 shares and sole voting power over 17,291 shares owned by institutional accounts managed by PGATC. Mr. Johnson is Chairman of FIL Limited ("FIL"), Pembroke Hall, 42 Crow Lane, Hamilton, Bermuda, and partnerships controlled predominantly by members of Mr. Johnson's family, or trusts for their benefit, own FIL shares representing between 25% and 50% of the total votes which may be cast by all holders of FIL voting stock. FMR and FIL disclaim that they are acting as a "group" for purposes of Section 13(d) under the Securities Exchange Act of 1934. FIL and various foreign-based subsidiaries provide investment advisory and management services to a number of non-U.S. investment companies and certain institutional investors. FIL is the beneficial owner of 8,170 shares.
|
EQUITY COMPENSATION PLAN INFORMATION
The following table sets forth information as of December 31, 2013, with respect to our compensation plans under which shares of Grace common stock are authorized for issuance upon the exercise of options, warrants or other rights. The only such compensation plans in effect are stock incentive plans providing for the issuance of stock options, restricted stock and other equity awards.
54
|
Plan Category
|
Number of securities
to be issued upon
exercise of
outstanding options, warrants and rights
(#)(2)
|
Weighted-average
exercise price of
outstanding options, warrants and rights
($)(2)(3)
|
Number of securities remaining available for future issuance under equity compensation plans (excluding securities to be issued upon exercise of outstanding options, warrants and rights)
(#)(2)
|
||
|
Equity compensation plans approved by security holders (1)
|
2,998,504
|
42.59
|
269,506
|
||
_______________________________________________________________________________
|
(1)
|
The 2000 Stock Incentive Plan was approved by stockholders at an annual meeting of Grace stockholders on May 10, 2000. The 2011 Stock Incentive Plan and the Amended and Restated 2011 Stock Incentive Plan were approved on behalf of Grace stockholders by the Official Committee of Equity Security Holders in the Grace Chapter 11 case and by the U.S. Bankruptcy Court for the District of Delaware on April 8, 2011 and April 16, 2013, respectively.
|
|
(2)
|
Under the 2000 Plan, there are 898,467 shares of Grace common stock to be issued upon the exercise of outstanding options, the weighted-average exercise price of outstanding options is $22.68 and no shares of Grace common stock are available for future issuance (excluding shares to be issued upon exercise of outstanding options). Under the 2011 Plan, there are 1,585,983 shares of Grace common stock to be issued upon the exercise of outstanding options, the weighted-average exercise price of outstanding options is $45.28 and no shares of Grace common stock are available for future issuance (excluding shares to be issued upon exercise of outstanding options). Under the Amended 2011 Plan, there are 399,252 shares of Grace common stock to be issued upon the exercise of outstanding options and 114,802 shares to be issued upon completion of the performance period for stock-settled performance-based unit awards (PBUs) (assuming the maximum number of shares are earned in respect of outstanding PBUs), the weighted-average exercise price of outstanding options is $76.70 and 269,506 shares of Grace common stock are available for future issuance (excluding shares to be issued upon exercise of outstanding options and completion of the performance period for PBUs).
|
|
(3)
|
The calculation of weighted-average exercise price does not take outstanding PBUs into account.
|
BOARD INDEPENDENCE
The Board has determined that all directors, other than Mr. Festa (who is also Chief Executive Officer), but including Mr. Akers (who resigned from the Board and all committees effective January 17, 2014) are independent under New York Stock Exchange rules because none of such directors has any direct or indirect material relationship with Grace or our affiliates, other than through his or her service as a director and as an owner of less than 1% of Grace common stock. In addition to the application of the New York Stock Exchange rules, this determination was based on a number of factors, principal among them were the following:
|
•
|
none of these directors, nor any member of their immediate families is (or at any time during the last three years was) a Grace executive officer or employee and none of these directors is an employee, and no member of their immediate families is an executive officer of any other entity with whom we do any material amount of business;
|
|
•
|
none of these directors or any member of their immediate families has, during the last three years, received more than $50,000 in direct compensation from Grace (other than director and committee fees); and
|
|
•
|
none of these directors serve, or within the last three years served, as an executive officer, director, trustee or fiduciary of any charitable organization to which we made any material charitable donation.
|
Only independent directors serve on our Audit, Nominating and Governance, Compensation and Corporate Responsibility Committees. Mr. Steffen has been appointed Lead Independent Director and, in this capacity, presides at executive sessions of independent directors. Interested parties may communicate with Mr. Steffen by writing him at the following address: Christopher J. Steffen—Lead Independent Director, c/o W. R. Grace & Co., 7500 Grace Drive, Columbia, Maryland 21044.
55
REVIEW, APPROVAL OR RATIFICATION OF TRANSACTIONS WITH RELATED PARTIES
The Board recognizes that transactions involving related persons in which Grace is a participant can present conflicts of interest, or the appearance thereof, so the Board has adopted a written policy as part of the Grace Corporate Governance Guidelines (which are available on our website at
www.grace.com/About/Leadership/Governance/)
with respect to related person transactions. The policy applies to transactions involving related persons that are required to be disclosed pursuant to SEC regulations, which are generally transactions in which:
|
•
|
Grace is a participant;
|
|
•
|
the amount involved exceeds $120,000; and
|
|
•
|
any related person, such as a Grace executive officer, director, director nominee, 5% stockholder or any of their respective family members, has a direct or indirect material interest.
|
Each such related person transaction shall be reviewed, determined to be in, or not inconsistent with, the best interests of Grace and its stockholders and approved or ratified by:
|
•
|
the disinterested members of the Audit Committee, if the disinterested members of the Audit Committee constitute a majority of the members of the Audit Committee; or
|
|
•
|
the disinterested members of the Board.
|
In the event a related person transaction is entered into without prior approval and, after review by the Audit Committee or the Board, as the case may be, the transaction is not ratified, we will make all reasonable efforts to cancel the transaction.
The Audit Committee of the Board of Directors selected PricewaterhouseCoopers LLP, or PwC, to act as our principal independent accountants for
2013
. The following table sets forth the fees that we incurred for the services of PwC for the year ended
December 31, 2012
, and our estimate of the fees that we incurred for the year ended
December 31, 2013
:
|
Fee Description
|
2013*
|
2012
|
||||||
|
Audit Fees
|
$
|
5,200,900
|
|
$
|
4,591,900
|
|
||
|
Audit-Related Fees
|
92,100
|
|
167,600
|
|
||||
|
Tax Fees
|
195,000
|
|
352,500
|
|
||||
|
All Other Fees
|
44,000
|
|
25,900
|
|
||||
|
Total Fees
|
$
|
5,532,000
|
|
$
|
5,137,900
|
|
||
_______________________________________________________________________________
|
*
|
For 2013, amounts are current estimates in respect of services received for which final invoices have not been submitted.
|
Audit Services consisted of the audit of our Consolidated Financial Statements and our internal controls over financial reporting (as required under Section 404 of the Sarbanes-Oxley Act of 2002), the review of our consolidated quarterly financial statements and statutory audits of certain of Grace's non-U.S. subsidiaries and affiliates.
Audit-Related Services primarily consisted of audits of employee benefit plans and review procedures that are not required by statute or regulation and were performed at the request of the Company.
Tax Services consisted of tax advice and compliance for non-U.S. subsidiaries, including preparation of tax returns, and advice and assistance with transfer pricing compliance.
All Other Fees consisted of license fees for access to accounting, tax, and financial reporting literature and non-financial agreed-upon procedures.
The Audit Committee has adopted a preapproval policy that requires the Audit Committee to specifically preapprove the annual engagement of the independent accountants for the audit of our Consolidated Financial Statements and internal controls. The policy also provides for general preapproval of certain audit-related, tax and other services provided by the independent accountants. Any other services must be specifically preapproved by
56
the Audit Committee. However, the Chair of the Audit Committee has the authority to preapprove services requiring immediate engagement between scheduled meetings of the Audit Committee. The Chair must report any such preapproval decisions to the full Audit Committee at its next scheduled meeting. During
2013
and
2012
, no audit-related, tax, or other services were performed by PwC without specific or general approval as described above.
57
Financial Statements and Schedules.
The required information is set forth in the Financial Supplement under the heading "Table of Contents" which is incorporated herein by reference.
Exhibits.
The exhibits to this Report are listed below. Other than exhibits that are filed herewith, all exhibits listed below are incorporated by reference.
In reviewing the agreements included as exhibits to this and other Reports filed by Grace with the Securities and Exchange Commission, please remember they are included to provide you with information regarding their terms and are not intended to provide any other factual or disclosure information about Grace or other parties to the agreements. The agreements generally contain representations and warranties by each of the parties to the applicable agreement. These representations and warranties have been made solely for the benefit of the other parties to the applicable agreement. These representations and warranties:
|
•
|
are not statements of fact, but rather are used to allocate risk to one of the parties if the statements prove to be inaccurate;
|
|
•
|
may have been qualified by disclosures that were made to the other parties in connection with the negotiation of the applicable agreement, which disclosures are not necessarily reflected in the agreement;
|
|
•
|
may apply standards of materiality in a way that is different from what may be viewed as material to you or other investors; and
|
|
•
|
were made only as of the date of the applicable agreement or such other date or dates as may be specified in the agreement and do not reflect more recent developments.
|
Accordingly, these representations and warranties may not describe the actual state of affairs as of the date they were made or at any other time. Additional information about Grace may be found elsewhere in this report and Grace's other public filings, which are available without charge through the Securities and Exchange Commission's website at
http://www.sec.gov
.
|
Exhibit No.
|
Exhibit
|
Location
|
||
|
2.1
|
Joint Plan of Reorganization of W. R. Grace & Co. and its Debtor Subsidiaries.
|
Exhibit 2.01 to Form 8-K (filed 2/07/14) SEC File No.: 001-13953
|
||
|
2.2
|
Order Confirming Joint Plan of Reorganization.
|
Exhibit 2.02 to Form 8-K (filed 2/07/14) SEC File No.: 001-13953
|
||
|
2.3
|
Asbestos Insurance Transfer Agreement dated as of February 3, 2014, by and between W. R. Grace & Co., W. R. Grace & Co.-Conn. and the other insurance contributors identified therein and the Asbestos PI Trust.
|
Exhibit 2.03 to Form 8-K (filed 2/07/14) SEC File No.: 001-13953
|
||
|
2.4
|
Sale and Purchase Agreement dated October 10, 2013 between The Dow Chemical Company and W. R. Grace & Co.-Conn.
|
Filed herewith
|
||
|
3.1
|
Amended and Restated Certificate of Incorporation.
|
Exhibit 3.01 to Form 8-K (filed 2/07/14) SEC File No.: 001-13953
|
||
|
3.2
|
Amended and Restated By-laws.
|
Exhibit 3.02 to Form 8-K (filed 2/07/14) SEC File No.: 001-13953
|
||
|
4.1
|
Amended and Restated Rights Agreement dated as of March 25, 2008 between W. R. Grace & Co. and Mellon Investor Services LLC, as Rights Agent.
|
Exhibit 4.1 to Form 10/A (filed 3/25/08) SEC File No.: 001-13953
|
||
|
4.2
|
Receivables Purchase Agreement dated as of January 23, 2007 between Grace GmbH & Co. KG and Coface Finanz GmbH.
|
Exhibit 4.10 to Form 10-K (filed 3/02/07) SEC File No.: 001-13953
|
||
|
4.3
|
Credit Agreement dated as of February 3, 2014 by and among W. R. Grace & Co., W. R. Grace & Co.-Conn., Grace GmbH & Co. KG, a Federal Republic of Germany limited partnership, each lender from time to time party thereto, and Goldman Sachs Bank USA, as Administrative Agent.
|
Exhibit 4.01 to Form 8-K (filed 2/07/14) SEC File No.: 001-13953
|
||
|
4.4
|
Deferred Payment Agreement (PI) dated as of February 3, 2014 by and between W. R. Grace & Co.-Conn. and the WRG Asbestos PI Trust.
|
Exhibit 4.02 to Form 8-K (filed 2/07/14) SEC File No.: 001-13953
|
||
58
|
Exhibit No.
|
Exhibit
|
Location
|
||
|
4.5
|
Guarantee Agreement (PI) dated as of February 3, 2014 by and between W. R. Grace & Co. and the WRG Asbestos PI Trust.
|
Exhibit 4.03 to Form 8-K (filed 2/07/14) SEC File No.: 001-13953
|
||
|
4.6
|
Deferred Payment Agreement (PD) dated as of February 3, 2014 by and between W. R. Grace & Co.-Conn. and the WRG Asbestos PD Trust.
|
Exhibit 4.04 to Form 8-K (filed 2/07/14) SEC File No.: 001-13953
|
||
|
4.7
|
Guarantee Agreement (PD) dated as of February 3, 2014 by and between W. R. Grace & Co. and the WRG Asbestos PD Trust.
|
Exhibit 4.05 to Form 8-K (filed 2/07/14) SEC File No.: 001-13953
|
||
|
4.8
|
Deferred Payment Agreement (PD-ZAI) dated as of February 3, 2014 by and between W. R. Grace & Co.-Conn. and the WRG Asbestos PD Trust.
|
Exhibit 4.06 to Form 8-K (filed 2/07/14) SEC File No.: 001-13953
|
||
|
4.9
|
Guarantee Agreement (PD-ZAI) dated as of February 3, 2014 by and between W. R. Grace & Co. and the WRG Asbestos PD Trust.
|
Exhibit 4.07 to Form 8-K (filed 2/07/14) SEC File No.: 001-13953
|
||
|
4.10
|
Share Issuance Agreement dated as of February 3, 2014 by and among W. R. Grace & Co., the WRG Asbestos PD Trust and the WRG Asbestos PI Trust.
|
Exhibit 4.08 to Form 8-K (filed 2/07/14) SEC File No.: 001-13953
|
||
|
4.11
|
Warrant Agreement dated as of February 3, 2014 by and among W. R. Grace & Co., the WRG Asbestos PI Trust and Computershare.
|
Exhibit 4.09 to Form 8-K (filed 2/07/14) SEC File No.: 001-13953
|
||
|
4.12
|
[Warrant] Implementation Letter dated as of October 25, 2012 by and between W. R. Grace & Co., the Official Committee of Asbestos Personal Injury Claimants, the Asbestos PI Future Claimants’ Representative and the Official Committee of Equity Security Holders.
|
Exhibit 4.10 to Form 8-K (filed 2/07/14) SEC File No.: 001-13953
|
||
|
4.13
|
[Warrant] Registration Rights Agreement dated as of February 3, 2014 by and between W. R. Grace & Co. and the WRG Asbestos PI Trust.
|
Exhibit 4.11 to Form 8-K (filed 2/07/14) SEC File No.: 001-13953
|
||
|
10.1
|
WRG Asbestos PI Trust Agreement dated as of February 3, 2014 by and between W. R. Grace & Co., the Asbestos PI Future Claimants’ Representative, the Official Committee of Asbestos Personal Injury Claimants, the Asbestos PI Trustees, the Wilmington Trust Company, and the members of the Trust Advisory Committee.
|
Exhibit 10.01 to Form 8-K (filed 2/07/14) SEC File No.: 001-13953
|
||
|
10.2
|
WRG Asbestos Property Damage Settlement Trust Agreement dated as of February 3, 2014 by and between W. R. Grace & Co., the Asbestos PD Future Claimants’ Representative, the Official Committee of Asbestos Property Damage Claimants, the Asbestos PD Trustees, Wilmington Trust Company, and the members of the Zonolite Attic Insulation Trust Advisory Committee.
|
Exhibit 10.02 to Form 8-K (filed 2/07/14) SEC File No.: 001-13953
|
||
|
10.3
|
Settlement Agreement dated December 23, 2013 by and between W. R. Grace & Co. and the other debtors named therein and the holders of Grace's pre-petition credit facilities named therein.
|
Filed herewith
|
||
|
10.4
|
W. R. Grace & Co. 2000 Stock Incentive Plan, as amended.
|
Exhibit 10 to Form 10-Q (filed 8/14/00) SEC File No.: 001-13953*
|
||
|
10.5
|
W. R. Grace & Co. 2011 Stock Incentive Plan.
|
Exhibit 10.1 to Form 8-K (filed 4/13/11) SEC File No.: 001-13953*
|
||
|
10.6
|
W. R. Grace & Co. Amended and Restated 2011 Stock Incentive Plan.
|
Exhibit 10.1 to Form 8-K (filed 5/01/13) SEC File No.: 001-13953*
|
||
|
10.7
|
W. R. Grace & Co. 2014 Stock Incentive Plan.
|
Exhibit 10.03 to Form 8-K (filed 2/07/14) SEC File No.: 001-13953*
|
||
|
10.8
|
Form of Performance-based Unit Agreement.
|
Exhibit 10.2 to Form 10-Q (filed 8/02/13) SEC File No.: 001-13953*
|
||
|
10.9
|
Form of Stock Option Award Agreement.
|
Exhibit 10.2 to Form 8-K (filed 4/13/11)
SEC File No.: 001-13953*
|
||
|
10.10
|
W. R. Grace & Co. Supplemental Executive Retirement Plan, as amended.
|
Exhibit 10.7 to Form 10-K (filed 3/28/02) SEC File No.: 001-13953*
|
||
|
10.11
|
W. R. Grace & Co. Executive Salary Protection Plan, as amended.
|
Exhibit 10.8 to Form 10-K (filed 3/28/02) SEC File No.: 001-13953*
|
||
59
|
Exhibit No.
|
Exhibit
|
Location
|
|||
|
10.12
|
|
Form of Executive Severance Agreement between Grace and certain officers.
|
Exhibit 10.17 to Form 10-K (filed 3/13/03) SEC File No.: 001-13953*
|
||
|
10.13
|
|
Severance Pay Plan for Salaried Employees.
|
Exhibit 10.17 to Form 10-K (filed 3/02/07) SEC File No.: 001-13953*
|
||
|
10.14
|
|
Form of Retention Agreement between Grace and certain officers (includes enhanced severance provision).
|
Exhibit 10.28 to Form 10-K (filed 4/16/01) SEC File No.: 001-13953*
|
||
|
10.15
|
|
Annual Incentive Compensation Program.
|
Exhibit 10.1 to Form 10-Q (filed 5/3/13) SEC File No.: 001-13953*
|
||
|
10.16
|
|
Letter Agreement dated May 27, 2009 between John F. Akers, on behalf of Grace, and Fred Festa (includes enhanced severance provision).
|
Exhibit 10.1 to Form 8-K (filed 5/29/09) SEC File No.: 001-13953*
|
||
|
10.17
|
|
Letter Agreement dated February 28, 2008 between Fred Festa, on behalf of Grace, and Hudson La Force III (includes enhanced severance provision)
|
Exhibit 10.1 to Form 8-K (filed 3/07/08) SEC File No.: 001-13953*
|
||
|
10.18
|
|
Letter Agreement dated June 19, 2009 between Fred Festa, on behalf of Grace, and Pamela Wagoner (includes enhanced severance provision).
|
Filed herewith*
|
||
|
12
|
|
Computation of Ratio of Earnings to Fixed Charges and Combined Fixed Charges and Preferred Stock Dividends.
|
Filed herewith
|
||
|
18.1
|
|
Preferability Letter from PricewaterhouseCoopers LLP
|
Filed herewith
|
||
|
21
|
|
List of Subsidiaries of W. R. Grace & Co.
|
Filed herewith
|
||
|
23
|
|
Consent of Independent Accountants.
|
Filed herewith
|
||
|
24
|
|
Powers of Attorney.
|
Filed herewith
|
||
|
31.(i).1
|
|
Certification of Periodic Report by Chief Executive Officer under Section 302 of the Sarbanes-Oxley Act of 2002
|
Filed herewith
|
||
|
31.(i).2
|
|
Certification of Periodic Report by Chief Financial Officer under Section 302 of the Sarbanes-Oxley Act of 2002
|
Filed herewith
|
||
|
32
|
|
Certification of Periodic Report by Chief Executive Officer and Chief Financial Officer under Section 906 of the Sarbanes-Oxley Act of 2002
|
Filed herewith
|
||
|
95
|
|
Mine Safety Disclosure Exhibit
|
Filed herewith
|
||
|
101.INS
|
|
XBRL Instance Document
|
Filed herewith
|
||
|
101.SCH
|
|
XBRL Taxonomy Extension Schema
|
Filed herewith
|
||
|
101.CAL
|
|
XBRL Taxonomy Extension Calculation Linkbase
|
Filed herewith
|
||
|
101.DEF
|
|
XBRL Taxonomy Extension Definition Linkbase
|
Filed herewith
|
||
|
101.LAB
|
|
XBRL Taxonomy Extension Label Linkbase
|
Filed herewith
|
||
|
101.PRE
|
|
XBRL Taxonomy Extension Presentation Linkbase
|
Filed herewith
|
||
_______________________________________________________________________________
|
*
|
Management contracts and compensatory plans, contracts or arrangements required to be filed as exhibits to this Report.
|
60
SIGNATURES
Pursuant to the requirements of Section 13 or 15(d) of the Securities Exchange Act of 1934, the registrant has duly caused this Report to be signed on its behalf by the undersigned, thereunto duly authorized.
|
W. R. GRACE & CO.
|
||
|
By:
|
/s/ ALFRED E. FESTA
|
|
|
Alfred E. Festa
(Chairman and Chief Executive Officer)
|
||
|
By:
|
/s/ HUDSON LA FORCE III
|
|
|
Hudson La Force III
(Senior Vice President and
Chief Financial Officer)
|
||
|
By:
|
/s/ WILLIAM C. DOCKMAN
|
|
|
William C. Dockman
(Vice President and Controller)
|
||
Dated:
February 27, 2014
Pursuant to the requirements of the Securities Exchange Act of 1934, this Report has been signed below by the following persons on behalf of the registrant and in the capacities indicated on
February 27, 2014
.
|
Signature
|
|
Title
|
||
|
H. F. Baldwin*
|
}
|
|
||
|
R. C. Cambre*
|
}
|
|
||
|
M. A. Fox*
|
}
|
|
||
|
J. K. Henry*
|
}
|
Directors
|
||
|
J. N. Quinn*
|
}
|
|
||
|
C. J. Steffen*
|
}
|
|
||
|
M. E. Tomkins*
|
}
|
|
||
|
/s/ ALFRED E. FESTA
|
Chairman, Chief Executive Officer and Director (Principal Executive Officer)
|
|
|
(Alfred E. Festa)
|
||
|
/s/ HUDSON LA FORCE III
|
Senior Vice President and Chief Financial Officer (Principal Financial Officer)
|
|
|
(Hudson La Force III)
|
||
|
/s/ WILLIAM C. DOCKMAN
|
Vice President and Controller
(Principal Accounting Officer)
|
|
|
(William C. Dockman)
|
||
___________________________________________________________________________________________________________________
|
*
|
By signing his name hereto, Mark A. Shelnitz is signing this document on behalf of each of the persons indicated above pursuant to powers of attorney duly executed by such persons and filed with the Securities and Exchange Commission.
|
|
By:
|
/s/ MARK A. SHELNITZ
|
|
|
Mark A. Shelnitz
(Attorney-in-Fact)
|
||
61
FINANCIAL SUPPLEMENT
W. R. GRACE & CO.
ANNUAL REPORT ON FORM 10-K
FOR THE YEAR ENDED DECEMBER 31, 2013
F-1
TABLE OF CONTENTS
|
|
||
|
|
||
___________________________________________________________
The Financial Statement Schedule should be read in conjunction with the Consolidated Financial Statements and Notes thereto. Financial statements of less than majority-owned persons and other persons accounted for by the equity method have been omitted as provided in Rule 3-09 of the United States Securities and Exchange Commission's (SEC) Regulation S-X. Financial Statement Schedules not included have been omitted because they are not applicable or the required information is shown in the Consolidated Financial Statements or Notes thereto.
F-2
Management's Report on Financial Information and Internal Controls
Responsibility For Financial Information
—We are responsible for the preparation, accuracy, integrity and objectivity of the Consolidated Financial Statements and the other financial information included in this report. Such information has been prepared in conformity with accounting principles generally accepted in the United States of America and accordingly, includes cer
tain amounts that represent management's best estimates and judgments. Actual amounts could differ from those estimates.
Responsibility For Internal Controls
—We and our management are also responsible for establishing and maintaining adequate internal controls over financial reporting. These internal controls consist of policies and procedures that are designed to assess and monitor the effectiveness of the control environment including risk identification, governance structure, delegations of authority, information flow, communications and control activities. A chartered Disclosure Committee oversees Grace's public financial reporting process and key managers are required to confirm their compliance with Grace's policies and internal controls quarterly. While no system of internal controls can ensure elimination of all errors and irregularities, Grace's internal controls, which are reviewed and modified in response to changing conditions, have been designed to provide reasonable assurance that assets are safeguarded, policies and procedures are followed, transactions are properly executed and reported, and appropriate disclosures are made. The concept of reasonable assurance is based on the recognition that there are limitations in all systems of internal control and that the costs of such systems should be balanced with their benefits. The Audit Committee of the Board of Directors, which is composed solely of independent directors, meets regularly with Grace's senior financial management, internal auditors and independent registered public accounting firm to review audit plans and results, as well as the actions taken by management in discharging its responsibilities for accounting, financial reporting and internal controls. The Audit Committee is responsible for the selection and compensation of the independent registered public accounting firm. Grace's financial management, internal auditors and independent registered public accounting firm have direct and confidential access to the Audit Committee at all times.
Report On Internal Control Over Financial Reporting
—We and our management have evaluated Grace's internal control over financial reporting as of
December 31, 2013
. This evaluation was based on criteria for effective internal control over financial reporting set forth in
Internal Control—Integrated Framework (1992)
issued by the Committee of Sponsoring Organizations of the Treadway Commission. Based on this evaluation, we and our management have concluded that Grace's internal control over financial reporting is effective as of
December 31, 2013
. Grace's independent registered public accounting firm that audited our financial statements included in Item 15 has also audited the effectiveness of Grace's internal control over financial reporting as of
December 31, 2013
, as stated in their report, which appears on the following page.
Report On Disclosure Controls And Procedures
—As of
December 31, 2013
, we and our management carried out an evaluation of the effectiveness of the design and operation of Grace's disclosure controls and procedures pursuant to Rule 13a-15 under the Securities Exchange Act of 1934, as amended (the "Exchange Act"). Based upon that evaluation, we concluded that Grace's disclosure controls and procedures are effective in ensuring that information required to be disclosed in Grace's periodic filings and submissions under the Exchange Act is accumulated and communicated to us and our management to allow timely decisions regarding required disclosures, and such information is recorded, processed, summarized and reported
within the time periods specified in the Securities and Exchange Commission's rules and forms.
|
/s/ A. E. FESTA
|
/s/ HUDSON LA FORCE III
|
|
|
A. E. Festa
Chief Executive Officer
|
Hudson La Force III
Senior Vice President and
Chief Financial Officer
|
|
|
February 27, 2014
|
|
|
F-3
Report of Independent Registered Public Accounting Firm
To the Shareholders and Board of Directors of W. R. Grace & Co.:
In our opinion, the accompanying consolidated balance sheets and the related consolidated statements of operations, of comprehensive income, of equity (deficit), and of cash flows present fairly, in all material respects, the financial position of W. R. Grace & Co. and its subsidiaries (the “Company”) at December 31, 2013 and December 31, 2012, and the results of their operations and their cash flows for each of the three years in the period ended December 31, 2013 in conformity with accounting principles generally accepted in the United States of America. Also in our opinion, the Company maintained, in all material respects, effective internal control over financial reporting as of December 31, 2013, based on criteria established in
Internal Control - Integrated Framework (1992)
issued by the Committee of Sponsoring Organizations of the Treadway Commission (COSO). The Company's management is responsible for these financial statements, for maintaining effective internal control over financial reporting and for its assessment of the effectiveness of internal control over financial reporting, included in the accompanying Management's Report on Internal Control over Financial Reporting. Our responsibility is to express opinions on these financial statements and on the Company's internal control over financial reporting based on our integrated audits. We conducted our audits in accordance with the standards of the Public Company Accounting Oversight Board (United States). Those standards require that we plan and perform the audits to obtain reasonable assurance about whether the financial statements are free of material misstatement and whether effective internal control over financial reporting was maintained in all material respects. Our audits of the financial statements included examining, on a test basis, evidence supporting the amounts and disclosures in the financial statements, assessing the accounting principles used and significant estimates made by management, and evaluating the overall financial statement presentation. Our audit of internal control over financial reporting included obtaining an understanding of internal control over financial reporting, assessing the risk that a material weakness exists, and testing and evaluating the design and operating effectiveness of internal control based on the assessed risk. Our audits also included performing such other procedures as we considered necessary in the circumstances. We believe that our audits provide a reasonable basis for our opinions.
As discussed in Note 2 to the consolidated financial statements, the Company emerged from bankruptcy on February 3, 2014. As discussed in Note 1 to the consolidated financial statements, the Company changed the manner in which it accounts for defined benefit pension plans in 2013.
A company’s internal control over financial reporting is a process designed to provide reasonable assurance regarding the reliability of financial reporting and the preparation of financial statements for external purposes in accordance with generally accepted accounting principles. A company’s internal control over financial reporting includes those policies and procedures that (i) pertain to the maintenance of records that, in reasonable detail, accurately and fairly reflect the transactions and dispositions of the assets of the company; (ii) provide reasonable assurance that transactions are recorded as necessary to permit preparation of financial statements in accordance with generally accepted accounting principles, and that receipts and expenditures of the company are being made only in accordance with authorizations of management and directors of the company; and (iii) provide reasonable assurance regarding prevention or timely detection of unauthorized acquisition, use, or disposition of the company’s assets that could have a material effect on the financial statements.
Because of its inherent limitations, internal control over financial reporting may not prevent or detect misstatements. Also, projections of any evaluation of effectiveness to future periods are subject to the risk that controls may become inadequate because of changes in conditions, or that the degree of compliance with the policies or procedures may deteriorate.
/s/ PricewaterhouseCoopers LLP
PricewaterhouseCoopers LLP
McLean, Virginia
February 27, 2014
F-4
Consent of Independent Registered Public Accounting Firm
We hereby consent to the incorporation by reference in the Registration Statements on Forms S‑8 (No. 333-173785, 333-37024 ) of W.R. Grace & Co. of our report
dated February 27, 2014 relating to the financial statements, financial statement schedules, and the effectiveness of internal control over financial reporting, which appears in this Form 10‑K.
/s/ PricewaterhouseCoopers LLP
PricewaterhouseCoopers LLP
McLean, Virginia
February 27, 2014
F-5
W. R. Grace & Co. and Subsidiaries
|
|
Year Ended December 31,
|
||||||||||
|
(In millions, except per share amounts)
|
2013
|
2012
|
2011
|
||||||||
|
Net sales
|
$
|
3,060.7
|
|
$
|
3,155.5
|
|
$
|
3,211.9
|
|
||
|
Cost of goods sold
|
1,918.6
|
|
2,041.1
|
|
2,099.0
|
|
|||||
|
Gross profit
|
1,142.1
|
|
1,114.4
|
|
1,112.9
|
|
|||||
|
Selling, general and administrative expenses
|
505.7
|
|
635.2
|
|
659.9
|
|
|||||
|
Research and development expenses
|
65.2
|
|
64.5
|
|
68.5
|
|
|||||
|
Interest expense and related financing costs
|
43.8
|
|
46.5
|
|
43.3
|
|
|||||
|
Chapter 11 expenses, net of interest income
|
15.3
|
|
16.6
|
|
20.0
|
|
|||||
|
Default interest settlement
|
129.0
|
|
—
|
|
—
|
|
|||||
|
Asbestos and bankruptcy related charges, net
|
21.9
|
|
384.6
|
|
—
|
|
|||||
|
Equity in earnings of unconsolidated affiliate
|
(22.9
|
)
|
(18.5
|
)
|
(15.2
|
)
|
|||||
|
Other expense, net
|
23.5
|
|
6.1
|
|
29.4
|
|
|||||
|
Total costs and expenses
|
781.5
|
|
1,135.0
|
|
805.9
|
|
|||||
|
Income (loss) before income taxes
|
360.6
|
|
(20.6
|
)
|
307.0
|
|
|||||
|
Benefit from (provision for) income taxes
|
(102.9
|
)
|
61.6
|
|
(87.9
|
)
|
|||||
|
Net income
|
257.7
|
|
41.0
|
|
219.1
|
|
|||||
|
Less: Net loss (income) attributable to noncontrolling interests
|
(1.6
|
)
|
(1.0
|
)
|
0.6
|
|
|||||
|
Net income attributable to W. R. Grace & Co. shareholders
|
$
|
256.1
|
|
$
|
40.0
|
|
$
|
219.7
|
|
||
|
Earnings Per Share Attributable to W. R. Grace & Co. Shareholders
|
|
|
|
||||||||
|
Basic earnings per share:
|
|
|
|
||||||||
|
Net income attributable to W. R. Grace & Co. shareholders
|
$
|
3.35
|
|
$
|
0.53
|
|
$
|
2.99
|
|
||
|
Weighted average number of basic shares
|
76.4
|
|
74.9
|
|
73.6
|
|
|||||
|
Diluted earnings per share:
|
|
|
|
||||||||
|
Net income attributable to W. R. Grace & Co. shareholders
|
$
|
3.30
|
|
$
|
0.52
|
|
$
|
2.91
|
|
||
|
Weighted average number of diluted shares
|
77.7
|
|
76.3
|
|
75.5
|
|
|||||
The Notes to Consolidated Financial Statements are an integral part of these statements.
F-6
W. R. Grace & Co. and Subsidiaries
Consolidated Statements of Comprehensive Income
|
|
Year Ended December 31,
|
||||||||||
|
(In millions)
|
2013
|
2012
|
2011
|
||||||||
|
Net income
|
$
|
257.7
|
|
$
|
41.0
|
|
$
|
219.1
|
|
||
|
Other comprehensive income (loss):
|
|
|
|||||||||
|
Defined benefit pension and other postretirement plans, net of income taxes
|
4.6
|
|
2.3
|
|
6.2
|
|
|||||
|
Currency translation adjustments
|
(23.6
|
)
|
5.5
|
|
(11.3
|
)
|
|||||
|
Gain (loss) from hedging activities, net of income taxes
|
(0.2
|
)
|
2.4
|
|
(2.1
|
)
|
|||||
|
Gain on securities available for sale
|
0.1
|
|
—
|
|
—
|
|
|||||
|
Total other comprehensive income (loss) attributable to noncontrolling interests
|
(0.9
|
)
|
0.8
|
|
1.8
|
|
|||||
|
Total other comprehensive income (loss)
|
(20.0
|
)
|
11.0
|
|
(5.4
|
)
|
|||||
|
Comprehensive income
|
237.7
|
|
52.0
|
|
213.7
|
|
|||||
|
Less: comprehensive income attributable to noncontrolling interests
|
(0.7
|
)
|
(1.8
|
)
|
(1.2
|
)
|
|||||
|
Comprehensive income attributable to W. R. Grace & Co. shareholders
|
$
|
237.0
|
|
$
|
50.2
|
|
$
|
212.5
|
|
||
The Notes to Consolidated Financial Statements are an integral part of these statements.
F-7
W. R. Grace & Co. and Subsidiaries
|
|
Year Ended December 31,
|
||||||||||
|
(In millions)
|
2013
|
2012
|
2011
|
||||||||
|
OPERATING ACTIVITIES
|
|
|
|
||||||||
|
Net income
|
$
|
257.7
|
|
$
|
41.0
|
|
$
|
219.1
|
|
||
|
Reconciliation to net cash provided by operating activities:
|
|
|
|
||||||||
|
Depreciation and amortization
|
123.1
|
|
119.0
|
|
120.0
|
|
|||||
|
Equity in earnings of unconsolidated affiliate
|
(22.9
|
)
|
(18.5
|
)
|
(15.2
|
)
|
|||||
|
Chapter 11 expenses, net of interest income
|
15.3
|
|
16.6
|
|
20.0
|
|
|||||
|
Chapter 11 expenses paid
|
(15.0
|
)
|
(15.5
|
)
|
(20.6
|
)
|
|||||
|
Asbestos and bankruptcy-related charges, net
|
21.9
|
|
384.6
|
|
—
|
|
|||||
|
Provision for (benefit from) income taxes
|
102.9
|
|
(61.6
|
)
|
87.9
|
|
|||||
|
Income taxes paid, net of refunds
|
(60.4
|
)
|
(82.6
|
)
|
(44.7
|
)
|
|||||
|
Excess tax benefits from stock-based compensation
|
35.4
|
|
(36.8
|
)
|
—
|
|
|||||
|
Interest accrued on pre-petition liabilities subject to compromise
|
38.1
|
|
40.4
|
|
39.0
|
|
|||||
|
Default interest settlement
|
129.0
|
|
—
|
|
—
|
|
|||||
|
Defined benefit pension (income) expense
|
(23.2
|
)
|
149.6
|
|
139.9
|
|
|||||
|
Payments under defined benefit pension arrangements
|
(68.3
|
)
|
(126.8
|
)
|
(265.1
|
)
|
|||||
|
Expenditures for environmental remediation
|
(14.0
|
)
|
(13.0
|
)
|
(11.8
|
)
|
|||||
|
Changes in assets and liabilities, excluding effect of currency translation and businesses acquired:
|
|
|
|
||||||||
|
Trade accounts receivable
|
13.5
|
|
(3.0
|
)
|
(80.6
|
)
|
|||||
|
Inventories
|
8.6
|
|
53.2
|
|
(67.9
|
)
|
|||||
|
Accounts payable
|
4.2
|
|
(11.7
|
)
|
52.6
|
|
|||||
|
All other items, net
|
(30.0
|
)
|
18.7
|
|
46.8
|
|
|||||
|
Net cash provided by operating activities
|
515.9
|
|
453.6
|
|
219.4
|
|
|||||
|
INVESTING ACTIVITIES
|
|
|
|
||||||||
|
Capital expenditures
|
(156.2
|
)
|
(138.5
|
)
|
(144.0
|
)
|
|||||
|
Businesses acquired, net of cash acquired
|
(526.2
|
)
|
(80.0
|
)
|
(55.8
|
)
|
|||||
|
Transfer to restricted cash and cash equivalents
|
(197.8
|
)
|
(61.1
|
)
|
(38.8
|
)
|
|||||
|
Proceeds from sales of product lines
|
1.8
|
|
—
|
|
10.0
|
|
|||||
|
Other investing activities
|
(2.3
|
)
|
(0.7
|
)
|
7.7
|
|
|||||
|
Net cash used for investing activities
|
(880.7
|
)
|
(280.3
|
)
|
(220.9
|
)
|
|||||
|
FINANCING ACTIVITIES
|
|
|
|
||||||||
|
Borrowings under credit arrangements
|
49.8
|
|
60.7
|
|
40.9
|
|
|||||
|
Repayments under credit arrangements
|
(64.5
|
)
|
(24.8
|
)
|
(19.3
|
)
|
|||||
|
Proceeds from exercise of stock options
|
34.4
|
|
32.2
|
|
12.1
|
|
|||||
|
Excess tax benefits from stock-based compensation
|
(35.4
|
)
|
36.8
|
|
—
|
|
|||||
|
Other financing activities
|
7.3
|
|
5.4
|
|
6.0
|
|
|||||
|
Net cash (used for) provided by financing activities
|
(8.4
|
)
|
110.3
|
|
39.7
|
|
|||||
|
Effect of currency exchange rate changes on cash and cash equivalents
|
1.1
|
|
5.0
|
|
(5.6
|
)
|
|||||
|
(Decrease) increase in cash and cash equivalents
|
(372.1
|
)
|
288.6
|
|
32.6
|
|
|||||
|
Cash and cash equivalents, beginning of period
|
1,336.9
|
|
1,048.3
|
|
1,015.7
|
|
|||||
|
Cash and cash equivalents, end of period
|
$
|
964.8
|
|
$
|
1,336.9
|
|
$
|
1,048.3
|
|
||
The Notes to Consolidated Financial Statements are an integral part of these statements.
F-8
W. R. Grace & Co. and Subsidiaries
|
(In millions, except par value and shares)
|
December 31, 2013
|
December 31, 2012
|
|||||
|
ASSETS
|
|
|
|||||
|
Current Assets
|
|
|
|||||
|
Cash and cash equivalents
|
$
|
964.8
|
|
$
|
1,336.9
|
|
|
|
Restricted cash and cash equivalents
|
395.4
|
|
197.6
|
|
|||
|
Trade accounts receivable, less allowance of $6.0 (2012—$5.2)
|
469.5
|
|
474.8
|
|
|||
|
Accounts receivable—unconsolidated affiliate
|
12.3
|
|
15.6
|
|
|||
|
Inventories
|
295.3
|
|
283.6
|
|
|||
|
Deferred income taxes
|
58.1
|
|
58.3
|
|
|||
|
Other current assets
|
99.0
|
|
78.4
|
|
|||
|
Total Current Assets
|
2,294.4
|
|
2,445.2
|
|
|||
|
Properties and equipment, net of accumulated depreciation and amortization of $1,876.8 (2012—$1,785.1)
|
829.9
|
|
770.5
|
|
|||
|
Goodwill
|
457.5
|
|
196.7
|
|
|||
|
Technology and other intangible assets, net
|
315.5
|
|
82.7
|
|
|||
|
Deferred income taxes
|
845.9
|
|
953.2
|
|
|||
|
Asbestos-related insurance
|
500.0
|
|
500.0
|
|
|||
|
Overfunded defined benefit pension plans
|
16.7
|
|
32.1
|
|
|||
|
Investment in unconsolidated affiliate
|
96.2
|
|
85.5
|
|
|||
|
Other assets
|
40.0
|
|
24.5
|
|
|||
|
Total Assets
|
$
|
5,396.1
|
|
$
|
5,090.4
|
|
|
|
LIABILITIES AND EQUITY
|
|
|
|||||
|
Liabilities Not Subject to Compromise
|
|
|
|||||
|
Current Liabilities
|
|
|
|||||
|
Debt payable within one year
|
$
|
76.6
|
|
$
|
83.4
|
|
|
|
Debt payable—unconsolidated affiliate
|
4.5
|
|
3.6
|
|
|||
|
Accounts payable
|
249.5
|
|
249.4
|
|
|||
|
Accounts payable—unconsolidated affiliate
|
13.0
|
|
2.6
|
|
|||
|
Other current liabilities
|
292.0
|
|
307.3
|
|
|||
|
Total Current Liabilities
|
635.6
|
|
646.3
|
|
|||
|
Debt payable after one year
|
5.3
|
|
13.4
|
|
|||
|
Debt payable—unconsolidated affiliate
|
24.3
|
|
22.4
|
|
|||
|
Deferred income taxes
|
18.2
|
|
27.1
|
|
|||
|
Underfunded and unfunded defined benefit pension plans
|
299.6
|
|
396.5
|
|
|||
|
Other liabilities
|
65.8
|
|
45.0
|
|
|||
|
Total Liabilities Not Subject to Compromise
|
1,048.8
|
|
1,150.7
|
|
|||
|
Liabilities Subject to Compromise—Note 2
|
|
|
|||||
|
Debt plus accrued interest
|
1,137.8
|
|
973.3
|
|
|||
|
Income tax contingencies
|
76.6
|
|
87.6
|
|
|||
|
Asbestos-related contingencies
|
2,092.4
|
|
2,065.0
|
|
|||
|
Environmental contingencies
|
134.5
|
|
140.5
|
|
|||
|
Postretirement benefits
|
176.3
|
|
190.9
|
|
|||
|
Other liabilities and accrued interest
|
158.5
|
|
162.6
|
|
|||
|
Total Liabilities Subject to Compromise
|
3,776.1
|
|
3,619.9
|
|
|||
|
Total Liabilities
|
4,824.9
|
|
4,770.6
|
|
|||
|
Commitments and Contingencies—Note 13
|
|
|
|||||
|
Equity
|
|
|
|||||
|
Common stock issued, par value $0.01; 300,000,000 shares authorized; outstanding: 77,046,143 (2012—75,565,409)
|
0.8
|
|
0.8
|
|
|||
|
Paid-in capital
|
533.4
|
|
536.5
|
|
|||
|
Retained earnings (accumulated deficit)
|
15.8
|
|
(240.3
|
)
|
|||
|
Treasury stock, at cost: shares: 0 (2012—1,414,351)
|
—
|
|
(16.8
|
)
|
|||
|
Accumulated other comprehensive income
|
10.6
|
|
29.7
|
|
|||
|
Total W. R. Grace & Co. Shareholders' Equity
|
560.6
|
|
309.9
|
|
|||
|
Noncontrolling interests
|
10.6
|
|
9.9
|
|
|||
|
Total Equity
|
571.2
|
|
319.8
|
|
|||
|
Total Liabilities and Equity
|
$
|
5,396.1
|
|
$
|
5,090.4
|
|
|
The Notes to Consolidated Financial Statements are an integral part of these statements.
F-9
W. R. Grace & Co. and Subsidiaries
Consolidated Statements of Equity (Deficit)
|
(In millions)
|
Common
Stock and
Paid-in
Capital
|
Retained
Earnings
(Accumulated
Deficit)
|
Treasury
Stock
|
Accumulated
Other
Comprehensive
Income
|
Noncontrolling
Interests
|
Total
Equity
(Deficit)
|
|||||||||||||||||
|
Balance, December 31, 2010
|
$
|
456.6
|
|
$
|
(500.0
|
)
|
$
|
(45.9
|
)
|
$
|
26.7
|
|
$
|
6.9
|
|
$
|
(55.7
|
)
|
|||||
|
Net income (loss)
|
—
|
|
219.7
|
|
—
|
|
—
|
|
(0.6
|
)
|
219.1
|
|
|||||||||||
|
Stock-based compensation
|
14.0
|
|
—
|
|
—
|
|
—
|
|
—
|
|
14.0
|
|
|||||||||||
|
Exercise of stock options
|
3.0
|
|
—
|
|
9.1
|
|
—
|
|
—
|
|
12.1
|
|
|||||||||||
|
Other comprehensive income (loss)
|
—
|
|
—
|
|
—
|
|
(7.2
|
)
|
1.8
|
|
(5.4
|
)
|
|||||||||||
|
Balance, December 31, 2011
|
473.6
|
|
(280.3
|
)
|
(36.8
|
)
|
19.5
|
|
8.1
|
|
184.1
|
|
|||||||||||
|
Net income
|
—
|
|
40.0
|
|
—
|
|
—
|
|
1.0
|
|
41.0
|
|
|||||||||||
|
Stock-based compensation
|
14.7
|
|
—
|
|
—
|
|
—
|
|
—
|
|
14.7
|
|
|||||||||||
|
Exercise of stock options
|
12.2
|
|
—
|
|
20.0
|
|
—
|
|
—
|
|
32.2
|
|
|||||||||||
|
Tax benefit related to stock plans
|
36.8
|
|
—
|
|
—
|
|
—
|
|
—
|
|
36.8
|
|
|||||||||||
|
Other comprehensive income
|
—
|
|
—
|
|
—
|
|
10.2
|
|
0.8
|
|
11.0
|
|
|||||||||||
|
Balance, December 31, 2012
|
537.3
|
|
(240.3
|
)
|
(16.8
|
)
|
29.7
|
|
9.9
|
|
319.8
|
|
|||||||||||
|
Net income
|
—
|
|
256.1
|
|
—
|
|
—
|
|
1.6
|
|
257.7
|
|
|||||||||||
|
Stock-based compensation
|
13.4
|
|
—
|
|
—
|
|
—
|
|
—
|
|
13.4
|
|
|||||||||||
|
Exercise of stock options
|
17.6
|
|
—
|
|
16.8
|
|
—
|
|
—
|
|
34.4
|
|
|||||||||||
|
Tax benefit related to stock plans
|
(35.4
|
)
|
—
|
|
—
|
|
—
|
|
—
|
|
(35.4
|
)
|
|||||||||||
|
Shares issued
|
1.3
|
|
—
|
|
—
|
|
—
|
|
—
|
|
1.3
|
|
|||||||||||
|
Other comprehensive loss
|
—
|
|
—
|
|
—
|
|
(19.1
|
)
|
(0.9
|
)
|
(20.0
|
)
|
|||||||||||
|
Balance, December 31, 2013
|
$
|
534.2
|
|
$
|
15.8
|
|
$
|
—
|
|
$
|
10.6
|
|
$
|
10.6
|
|
$
|
571.2
|
|
|||||
The Notes to Consolidated Financial Statements are an integral part of these statements.
F-10
Notes to Consolidated Financial Statements
1. Basis of Presentation and Summary of Significant Accounting and Financial Reporting Policies
W. R. Grace & Co., through its subsidiaries, is engaged in specialty chemicals and specialty materials businesses on a global basis through
three
operating segments: Grace Catalysts Technologies, which includes catalysts and related products and technologies used in refining, petrochemical and other chemical manufacturing applications; Grace Materials Technologies, which includes packaging technologies and engineered materials used in consumer, industrial, coatings, and pharmaceutical applications; and Grace Construction Products, which includes specialty construction chemicals and specialty building materials used in commercial, infrastructure and residential construction.
W. R. Grace & Co. conducts substantially all of its business through a direct, wholly owned subsidiary, W. R. Grace & Co.-Conn. ("Grace-Conn."). Grace-Conn. owns substantially all of the assets, properties and rights of W. R. Grace & Co. on a consolidated basis, either directly or through subsidiaries.
As used in these notes, the term "Company" refers to W. R. Grace & Co. The term "Grace" refers to the Company and/or one or more of its subsidiaries and, in certain cases, their respective predecessors.
Chapter 11 Proceedings
During 2000 and the first quarter of 2001, Grace experienced several adverse developments in its asbestos-related litigation, including: a significant increase in personal injury claims, higher than expected costs to resolve personal injury and certain property damage claims, and class action lawsuits alleging damages from Zonolite
®
Attic Insulation ("ZAI"), a former Grace attic insulation product.
After a thorough review of these developments, Grace's Board of Directors concluded that a federal court-supervised bankruptcy process provided the best forum available to achieve fairness in resolving these claims and on April 2, 2001 (the "Filing Date"), Grace and
61
of its United States subsidiaries and affiliates filed voluntary petitions for reorganization (the "Filing") under Chapter 11 of the United States Bankruptcy Code in the United States Bankruptcy Court for the District of Delaware (the "Bankruptcy Court").
Under Chapter 11, Grace operated its businesses under court supervision, while using the Chapter 11 process to develop and implement a plan for addressing the asbestos-related claims.
In September 2008, Grace and other parties filed a joint plan of reorganization with the Bankruptcy Court to address all pending and future asbestos-related claims and all other pre-petition claims as outlined therein (as subsequently amended, the "Joint Plan"). Following the confirmation of the Joint Plan in 2011 by the Bankruptcy Court and in 2012 by a U.S. District Court, and the resolution of all appeals, Grace emerged from bankruptcy on February 3, 2014. (See Note 2 for Chapter 11 information.)
Principles of Consolidation
The Consolidated Financial Statements include the accounts of Grace and entities as to which Grace exercises control over operating and financial policies. Grace consolidates the activities of variable interest entities in circumstances where management determines that Grace is the primary beneficiary of the variable interest entity. Intercompany transactions and balances are eliminated in consolidation. Investments in affiliated companies in which Grace can significantly influence operating and financial policies are accounted for under the equity method, unless Grace's investment is deemed to be temporary, in which case the investment is accounted for under the cost method.
Noncontrolling Interests in Consolidated Entities
Grace conducts certain of its business through joint ventures with unaffiliated third parties. For joint ventures in which Grace has a controlling financial interest, Grace consolidates the results of such joint ventures in the Consolidated Financial Statements. Grace recognizes a liability for cumulative amounts due to the third parties based on the financial results of the joint ventures, and deducts the amount of income attributable to noncontrolling interests in the measurement of its consolidated net income.
Operating Segments
Grace reports financial results of each of its operating segments that engage in business activities that generate revenues and expenses, and whose operating results are regularly reviewed by Grace's Chief Executive Officer.
Use of Estimates
The preparation of financial statements in conformity with U.S. generally accepted accounting principles (U.S. GAAP) requires management to make estimates and assumptions that affect the reported amount of assets and liabilities and disclosure of contingent assets and liabilities at the date of the Consolidated Financial Statements, and the reported amounts of revenues and expenses for the periods presented. Actual amounts could differ from those estimates, and the differences could be material. Changes in estimates are
F-11
Notes to Consolidated Financial Statements (Continued)
1. Basis of Presentation and Summary of Significant Accounting and Financial Reporting Policies (Continued)
recorded in the period identified. Grace's accounting measurements that are most affected by management's estimates of future events are:
|
•
|
Contingent liabilities, which depend on an assessment of the probability of loss and an estimate of ultimate resolution cost, such as asbestos-related matters and litigation (see Note 2), income taxes (see Note 10), and environmental remediation (see Note 13);
|
|
•
|
Pension and postretirement liabilities that depend on assumptions regarding participant life spans, future inflation, discount rates and total returns on invested funds (see Note 11);
|
|
•
|
Realization values of net deferred tax assets, which depend on projections of future taxable income; and
|
|
•
|
Recoverability of goodwill, which depends on assumptions used to value reporting units, such as observable market inputs, projections of future cash flows and weighted average cost of capital.
|
Revenue Recognition
Grace recognizes revenue when all of the following criteria are satisfied: risk of loss and title transfer to the customer; the price is fixed and determinable; persuasive evidence of a sales arrangement exists; and collectability is reasonably assured. Risk of loss and title transfers to customers are based on individual contractual terms which generally specify the point of shipment. Terms of delivery are generally included in customer contracts of sale, order confirmation documents and invoices.
Certain customer arrangements include conditions for volume rebates. Grace accrues a rebate allowance and reduces recorded sales for anticipated selling price adjustments at the time of sale. Grace regularly reviews rebate accruals based on actual and anticipated sales patterns.
Cash Equivalents
Cash equivalents consist of liquid instruments and investments with maturities of
three
months or less when purchased. The recorded amounts approximate fair value.
Inventories
Inventories are stated at the lower of cost or market. The method used to determine cost is first-in/first-out, or "FIFO." Market values for raw materials are based on current cost and, for other inventory classifications, net realizable value. Inventories are evaluated regularly for salability, and slow moving and/or obsolete items are adjusted to expected salable value. Inventory values include direct and certain indirect costs of materials and production. Abnormal costs of production are expensed as incurred.
Long Lived Assets
Properties and equipment are stated at cost. Depreciation of properties and equipment is generally computed using the straight-line method over the estimated useful life of the asset. Estimated useful lives range from
20
to
40
years for buildings,
3
to
7
years for information technology equipment,
3
to
10
years for operating machinery and equipment, and
5
to
10
years for furniture and fixtures. Interest is capitalized in connection with major project expenditures. Fully depreciated assets are retained in properties and equipment and related accumulated depreciation accounts until they are removed from service. In the case of disposals, assets and related accumulated depreciation are removed from the accounts and the net amount, less any proceeds from disposal, is charged or credited to earnings. Obligations for costs associated with asset retirements, such as requirements to restore a site to its original condition, are accrued at net present value and amortized along with the related asset.
Other intangible assets with finite lives consist of technology, customer lists, trademarks and other intangibles and are amortized over their estimated useful lives, ranging from
1
to
30
years.
Grace reviews long-lived assets for impairment whenever events or changes in circumstances indicate that the carrying amount of an asset may not be fully recoverable. No impairment charge was required in 2013 or 2012; however, there were impairment charges related to certain restructuring activities in 2011 (see Note 14).
Goodwill
Goodwill arises from certain business combinations. Grace reviews its goodwill for impairment on an annual basis at October 31 and whenever events or changes in circumstances indicate that the carrying amount may not be fully recoverable. Recoverability is assessed at the reporting unit level most directly associated with the business combination that generated the goodwill. For the purpose of measuring impairment under the provisions of ASC 350 "Intangibles—Goodwill and Other", Grace has identified its reporting units at one level below its operating segments. Grace has evaluated its goodwill annually with no impairment charge required in any of the periods presented.
F-12
Notes to Consolidated Financial Statements (Continued)
1. Basis of Presentation and Summary of Significant Accounting and Financial Reporting Policies (Continued)
Financial Instruments
Grace uses commodity forward, swap and/or option contracts and currency forward and/or option contracts to manage exposure to fluctuations in commodity prices and currency exchange rates. Grace does not hold or issue derivative financial instruments for trading purposes. Derivative instruments are recorded in the Consolidated Balance Sheets as either assets or liabilities at their fair value. For derivative instruments designated as fair value hedges, changes in the fair values of the derivative instruments closely offset changes in the fair values of the hedged items in "other expense, net" in the Consolidated Statements of Operations. For derivative instruments designated as cash flow hedges, if the derivative instruments qualify for hedge accounting pursuant to ASC 815, the effective portion of any hedge is reported as "accumulated other comprehensive income" in the Consolidated Balance Sheets until it is cleared to earnings during the same period in which the hedged item affects earnings. The ineffective portion of all hedges, and changes in the fair values of derivative instruments that are not designated as hedges, are recorded in current period earnings. Cash flows from derivative instruments are reported in the same category as the cash flows from the items being hedged.
Income Taxes
Deferred tax assets and liabilities are recognized with respect to the expected future tax consequences of events that have been recorded in the Consolidated Financial Statements. If it is more likely than not that all or a portion of deferred tax assets will not be realized, a valuation allowance is provided against such deferred tax assets. The assessment of realization of deferred tax assets is performed based on the weight of the positive and negative evidence available to indicate whether the asset is recoverable, including tax planning strategies that are prudent and feasible.
Grace records a liability for income tax contingencies when it is more likely than not that a tax position it has taken will not be sustained upon audit. Grace evaluates such likelihood based on relevant facts and tax law. Grace adjusts its recorded liability for income tax matters due to changes in circumstances or new uncertainties, such as amendments to existing tax law. Grace's ultimate tax liability depends upon many factors, including negotiations with taxing authorities in the jurisdictions in which it operates, outcomes of tax litigation, and resolution of disputes arising from federal, state, and foreign tax audits. Due to the varying tax laws in each jurisdiction senior management, with the assistance of local tax advisors as necessary, assesses individual matters in each jurisdiction on a case-by-case basis. Grace researches and evaluates its income tax positions, including why it believes they are compliant with income tax regulations, and these positions are documented internally.
Tax benefits from an uncertain tax position are recognized only if it is more likely than not that the tax position will be sustained upon examination by the taxing authorities based on the technical merits of the position. Tax benefits recognized in the financial statements from such a position are measured based on the largest benefit that has a greater than fifty percent likelihood of being realized upon ultimate settlement.
Stock-Based Compensation
The Company recognizes expenses related to stock-based compensation payment transactions in which it receives employee services in exchange for (a) equity instruments of the Company or (b) liabilities that are based on the fair value of the Company’s equity instruments or that may be settled by the issuance of equity instruments. Stock-based compensation cost for restricted stock units (RSUs) and share settled performance based units (PBUs) are measured based on the high/low average of the Company’s common stock on the date of grant. Cash settled performance based units (CSPBU) are remeasured at the end of each reporting period based on the closing fair market value of the Company’s common stock. Stock-based compensation cost for stock options is estimated at the grant date based on each option’s fair value as calculated by the Black-Scholes-Merton ("BSM") option pricing model. The Company recognizes stock-based compensation cost as expense ratably on a straight-line basis over the requisite service period.
Currency Translation
Assets and liabilities of foreign subsidiaries (other than those located in countries with highly inflationary economies) are translated into U.S. dollars at current exchange rates, while revenues, costs and expenses are translated at average exchange rates during each reporting period. The resulting translation adjustments are included in "accumulated other comprehensive loss" in the Consolidated Balance Sheets. The financial statements of any subsidiaries located in countries with highly inflationary economies are remeasured as if the functional currency were the U.S. dollar; the remeasurement creates translation adjustments that are reflected in net income in the Consolidated Statements of Operations.
On February 8, 2013, the Venezuelan government announced that, effective February 13, 2013, the official exchange rate of the bolivar to U.S. dollar would devalue from
4.3
to
6.3
. As a result of this currency devaluation,
F-13
Notes to Consolidated Financial Statements (Continued)
1. Basis of Presentation and Summary of Significant Accounting and Financial Reporting Policies (Continued)
Grace incurred a charge to net income of
$8.5 million
in the 2013 first quarter. Of this amount,
$1.6 million
is included in segment operating income.
Reclassifications and Revisions
Certain amounts in prior years' Consolidated Financial Statements have been reclassified to conform to the current year presentation. Such reclassifications have not materially affected previously reported amounts in the Consolidated Financial Statements.
Certain pension costs previously reported as a separate line item in the Consolidated Statements of Operations are now reported in "cost of goods sold" and in "selling, general and administrative expenses” based upon the functions of the employees to which the pension costs relate. Grace has revised its accounting such that a portion of the defined benefit pension expense has been and will continue to be capitalized into inventories prior to being reported in "cost of goods sold." See "Change in Accounting Principle Regarding Pension Benefits" for further discussion related to the change in pension accounting.
Certain prior period amounts related to borrowings and repayments under credit arrangements reported as financing activities on the Consolidated Statements of Cash Flows have been revised. These amounts were originally presented on a net basis and are now being presented on a gross basis. Grace concluded that these revisions were not material to the prior-year Consolidated Financial Statements.
Change in Accounting Principle Regarding Pension Benefits
The Company changed its method of accounting for actuarial gains and losses relating to its global defined benefit pension plans to a more preferable method under U.S. generally accepted accounting principles (“GAAP”). The Company’s new method of accounting is referred to as "mark-to-market accounting" and includes immediate recognition of actuarial gains and losses in the period in which they occur. Under the Company's previous accounting method, such amounts were deferred and amortized. In addition, the Company will no longer update the balance sheet funded status of its pension plans each quarter for changes in discount rates and actual returns on assets, but rather will perform such update annually as of the end of each year. Should a significant event occur, the Company's pension obligation and plan assets would be remeasured at an interim period, and the gains or losses on remeasurement would be recognized in that period. This new accounting method was adopted in the 2013 fourth quarter, and retrospectively applied to the Company’s financial results for all periods presented.
Under mark-to-market accounting, the Company’s pension costs consist of two elements: 1) ongoing costs recognized quarterly, which include service and interest costs, expected returns on plan assets, and amortization of prior service costs/credits; and 2) mark-to-market gains and losses recognized annually in the fourth quarter resulting from changes in actuarial assumptions, such as discount rates and the difference between actual and expected returns on plan assets. Grace believes that the mark-to-market accounting method is preferable as it better aligns the economics of the defined benefit pension plans with their accounting measures, eliminates delays in recognizing gains and losses in operating results, and improves transparency in Grace's operating results by immediately recognizing the effects of economic and interest rate trends on plan investments and assumptions in the year these effects actually occur.
As a result of the retrospective application of the new accounting method, accumulated actuarial losses have been reclassified from "accumulated other comprehensive income" to "retained earnings (accumulated deficit)." In addition, in order to better reflect the nature of pension costs in the Company's operating results, the Company retrospectively revised the classification of defined benefit pension expense. Pension costs previously reported as a separate line item in the Consolidated Statements of Operations are now reported in "cost of goods sold" and in "selling, general and administrative expenses" based upon the functions of the employees to which the pension costs relate. Finally, the Company has revised its accounting such that a portion of the defined benefit pension expense has been and will continue to be capitalized into inventories prior to being reported in "cost of goods sold." The Company believes that the change in classification of defined benefit pension costs and the change to inventory capitalization are not material to all prior periods.
The Company continues to manage its defined benefit pension plans at the corporate level. Accordingly, defined benefit pension expense is excluded from segment operating income. Profitability performance measures for the business segments are unchanged from amounts previously reported. Mark-to-market adjustments are excluded from the Company’s non-GAAP Adjusted EBIT measure.
F-14
Notes to Consolidated Financial Statements (Continued)
1. Basis of Presentation and Summary of Significant Accounting and Financial Reporting Policies (Continued)
These changes have been reported through retrospective application of the new policies to all periods presented. The impacts of all adjustments made to the financial statements are summarized below:
Consolidated Statements of Operations
|
Year Ended December 31, 2013
|
|||||||||||
|
(In millions, except per share amounts)
|
Previous Method
|
As Reported
|
Effect of Change
|
||||||||
|
Cost of goods sold
|
$
|
1,925.3
|
|
$
|
1,918.6
|
|
$
|
(6.7
|
)
|
||
|
Gross profit
|
1,135.4
|
|
1,142.1
|
|
6.7
|
|
|||||
|
Selling, general and administrative expenses
|
522.2
|
|
505.7
|
|
(16.5
|
)
|
|||||
|
Defined benefit pension expense
|
73.4
|
|
—
|
|
(73.4
|
)
|
|||||
|
Total costs and expenses
|
871.4
|
|
781.5
|
|
(89.9
|
)
|
|||||
|
Income (loss) before income taxes
|
264.0
|
|
360.6
|
|
96.6
|
|
|||||
|
Provision for income taxes
|
(72.9
|
)
|
(102.9
|
)
|
(30.0
|
)
|
|||||
|
Net income
|
191.1
|
|
257.7
|
|
66.6
|
|
|||||
|
Net income attributable to W. R. Grace & Co. shareholders
|
189.5
|
|
256.1
|
|
66.6
|
|
|||||
|
Basic earnings per share
|
|||||||||||
|
Net income attributable to W. R. Grace & Co. shareholders
|
2.48
|
|
3.35
|
|
0.87
|
|
|||||
|
Diluted earnings per share
|
|||||||||||
|
Net income attributable to W. R. Grace & Co. shareholders
|
2.44
|
|
3.30
|
|
0.86
|
|
|||||
|
Year Ended December 31, 2012
|
|||||||||||
|
(In millions, except per share amounts)
|
Previously Reported
|
Revised
|
Effect of Change
|
||||||||
|
Cost of goods sold
|
$
|
1,989.2
|
|
$
|
2,041.1
|
|
$
|
51.9
|
|
||
|
Gross profit
|
1,166.3
|
|
1,114.4
|
|
(51.9
|
)
|
|||||
|
Selling, general and administrative expenses
|
537.5
|
|
635.2
|
|
97.7
|
|
|||||
|
Defined benefit pension expense
|
71.2
|
|
—
|
|
(71.2
|
)
|
|||||
|
Total costs and expenses
|
1,108.5
|
|
1,135.0
|
|
26.5
|
|
|||||
|
Income (loss) before income taxes
|
57.8
|
|
(20.6
|
)
|
(78.4
|
)
|
|||||
|
Benefit from income taxes
|
37.3
|
|
61.6
|
|
24.3
|
|
|||||
|
Net income
|
95.1
|
|
41.0
|
|
(54.1
|
)
|
|||||
|
Net income attributable to W. R. Grace & Co. shareholders
|
94.1
|
|
40.0
|
|
(54.1
|
)
|
|||||
|
Basic earnings per share
|
|||||||||||
|
Net income attributable to W. R. Grace & Co. shareholders
|
1.26
|
|
0.53
|
|
(0.72
|
)
|
|||||
|
Diluted earnings per share
|
|||||||||||
|
Net income attributable to W. R. Grace & Co. shareholders
|
1.23
|
|
0.52
|
|
(0.71
|
)
|
|||||
F-15
Notes to Consolidated Financial Statements (Continued)
1. Basis of Presentation and Summary of Significant Accounting and Financial Reporting Policies (Continued)
|
|
Year Ended December 31, 2011
|
||||||||||
|
(In millions, except per share amounts)
|
Previously Reported
|
Revised
|
Effect of Change
|
||||||||
|
Cost of goods sold
|
$
|
2,050.6
|
|
$
|
2,099.0
|
|
$
|
48.4
|
|
||
|
Gross profit
|
1,161.3
|
|
1,112.9
|
|
(48.4
|
)
|
|||||
|
Selling, general and administrative expenses
|
568.4
|
|
659.9
|
|
91.5
|
|
|||||
|
Defined benefit pension expense
|
63.4
|
|
—
|
|
(63.4
|
)
|
|||||
|
Total costs and expenses
|
777.8
|
|
805.9
|
|
28.1
|
|
|||||
|
Income before income taxes
|
383.5
|
|
307.0
|
|
(76.5
|
)
|
|||||
|
Benefit from (provision for) income taxes
|
(114.7
|
)
|
(87.9
|
)
|
26.8
|
|
|||||
|
Net income
|
268.8
|
|
219.1
|
|
(49.7
|
)
|
|||||
|
Net income attributable to W. R. Grace & Co. shareholders
|
269.4
|
|
219.7
|
|
(49.7
|
)
|
|||||
|
Basic earnings per share
|
|||||||||||
|
Net income attributable to W. R. Grace & Co. shareholders
|
3.66
|
|
2.99
|
|
(0.68
|
)
|
|||||
|
Diluted earnings per share
|
|||||||||||
|
Net income attributable to W. R. Grace & Co. shareholders
|
3.57
|
|
2.91
|
|
(0.66
|
)
|
|||||
Consolidated Balance Sheets
|
|
December 31, 2013
|
||||||||||
|
(In millions)
|
Previous Method
|
As Reported
|
Effect of Change
|
||||||||
|
Inventories
|
$
|
294.7
|
|
$
|
295.3
|
|
$
|
0.6
|
|
||
|
Total current assets
|
2,293.8
|
|
2,294.4
|
|
0.6
|
|
|||||
|
Deferred income taxes
|
846.1
|
|
845.9
|
|
(0.2
|
)
|
|||||
|
Overfunded defined benefit pension plans
|
16.7
|
|
16.7
|
|
—
|
|
|||||
|
Total assets
|
5,395.7
|
|
5,396.1
|
|
0.4
|
|
|||||
|
Underfunded and unfunded defined benefit pension plans
|
299.6
|
|
299.6
|
|
—
|
|
|||||
|
Total Liabilities Not Subject to Compromise
|
1,048.8
|
|
1,048.8
|
|
—
|
|
|||||
|
Postretirement benefits
|
176.3
|
|
176.3
|
|
—
|
|
|||||
|
Total Liabilities Subject to Compromise
|
3,776.1
|
|
3,776.1
|
|
—
|
|
|||||
|
Total Liabilities
|
4,824.9
|
|
4,824.9
|
|
—
|
|
|||||
|
Accumulated other comprehensive income (loss)
|
(558.7
|
)
|
10.6
|
|
569.3
|
|
|||||
|
Retained earnings
|
584.7
|
|
15.8
|
|
(568.9
|
)
|
|||||
|
Total W. R. Grace & Co. Shareholders' Equity
|
560.2
|
|
560.6
|
|
0.4
|
|
|||||
|
Total Equity
|
570.8
|
|
571.2
|
|
0.4
|
|
|||||
F-16
Notes to Consolidated Financial Statements (Continued)
1. Basis of Presentation and Summary of Significant Accounting and Financial Reporting Policies (Continued)
|
|
December 31, 2012
|
||||||||||
|
(In millions)
|
Previously Reported
|
Revised
|
Effect of Change
|
||||||||
|
Inventories
|
$
|
278.6
|
|
$
|
283.6
|
|
$
|
5.0
|
|
||
|
Total current assets
|
2,440.2
|
|
2,445.2
|
|
5.0
|
|
|||||
|
Deferred income taxes
|
956.3
|
|
953.2
|
|
(3.1
|
)
|
|||||
|
Overfunded defined benefit pension plans
|
33.8
|
|
32.1
|
|
(1.7
|
)
|
|||||
|
Total assets
|
5,090.2
|
|
5,090.4
|
|
0.2
|
|
|||||
|
Underfunded and unfunded defined benefit pension plans
|
400.6
|
|
396.5
|
|
(4.1
|
)
|
|||||
|
Total Liabilities Not Subject to Compromise
|
1,154.8
|
|
1,150.7
|
|
(4.1
|
)
|
|||||
|
Postretirement benefits
|
188.1
|
|
190.9
|
|
2.8
|
|
|||||
|
Total Liabilities Subject to Compromise
|
3,617.1
|
|
3,619.9
|
|
2.8
|
|
|||||
|
Total Liabilities
|
4,771.9
|
|
4,770.6
|
|
(1.3
|
)
|
|||||
|
Accumulated other comprehensive income (loss)
|
(607.3
|
)
|
29.7
|
|
637.0
|
|
|||||
|
Retained earnings
|
395.2
|
|
(240.3
|
)
|
(635.5
|
)
|
|||||
|
Total W. R. Grace & Co. Shareholders' Equity
|
308.4
|
|
309.9
|
|
1.5
|
|
|||||
|
Total Equity
|
318.3
|
|
319.8
|
|
1.5
|
|
|||||
Consolidated Statements of Cash Flows
|
Year Ended December 31, 2013
|
|||||||||||
|
(In millions)
|
Previous Method
|
As Reported
|
Effect of Change
|
||||||||
|
Cash flows from operating activities:
|
|
|
|
|
|
|
|||||
|
Net income
|
$
|
191.1
|
|
$
|
257.7
|
|
$
|
66.6
|
|
||
|
(Benefit from) provision for income taxes
|
72.9
|
|
102.9
|
|
30.0
|
|
|||||
|
Defined benefit pension expense
|
73.4
|
|
(23.2
|
)
|
(96.6
|
)
|
|||||
|
Inventories
|
4.2
|
|
8.6
|
|
4.4
|
|
|||||
|
All other items, net(1)
|
(25.6
|
)
|
(30.0
|
)
|
(4.4
|
)
|
|||||
|
Year Ended December 31, 2012
|
|||||||||||
|
(In millions)
|
Previously Reported
|
Revised
|
Effect of Change
|
||||||||
|
Cash flows from operating activities:
|
|
|
|
|
|
|
|||||
|
Net income
|
$
|
95.1
|
|
$
|
41.0
|
|
$
|
(54.1
|
)
|
||
|
(Benefit from) provision for income taxes
|
(37.3
|
)
|
(61.6
|
)
|
(24.3
|
)
|
|||||
|
Defined benefit pension expense
|
71.2
|
|
149.6
|
|
78.4
|
|
|||||
|
Inventories
|
53.9
|
|
53.2
|
|
(0.7
|
)
|
|||||
|
All other items, net(1)
|
29.2
|
|
29.9
|
|
0.7
|
|
|||||
|
Year Ended December 31, 2011
|
|||||||||||
|
(In millions)
|
Previously Reported
|
Revised
|
Effect of Change
|
||||||||
|
Cash flows from operating activities:
|
|
|
|
|
|
|
|||||
|
Net income
|
$
|
268.8
|
|
$
|
219.1
|
|
$
|
(49.7
|
)
|
||
|
(Benefit from) provision for income taxes
|
114.7
|
|
87.9
|
|
(26.8
|
)
|
|||||
|
Defined benefit pension expense
|
63.4
|
|
139.9
|
|
76.5
|
|
|||||
|
Inventories
|
(66.9
|
)
|
(67.9
|
)
|
(1.0
|
)
|
|||||
|
All other items, net(1)
|
17.4
|
|
18.4
|
|
1.0
|
|
|||||
_______________________________________________________________________________
|
(1)
|
Includes only those items which relate to the change in accounting method to mark-to-market accounting.
|
F-17
Notes to Consolidated Financial Statements (Continued)
1. Basis of Presentation and Summary of Significant Accounting and Financial Reporting Policies (Continued)
Consolidated Statements of Equity (Deficit) and Comprehensive Income
|
December 31, 2013
|
|||||||||||
|
|
Previous Method
|
As Reported
|
Effect of Change
|
||||||||
|
Retained earnings
|
|
|
|
|
|
|
|||||
|
Beginning balance
|
$
|
395.2
|
|
$
|
(240.3
|
)
|
$
|
(635.5
|
)
|
||
|
Net income
|
189.5
|
|
256.1
|
|
66.6
|
|
|||||
|
Ending balance
|
584.7
|
|
15.8
|
|
(568.9
|
)
|
|||||
|
Accumulated other comprehensive income (loss)
|
|||||||||||
|
Beginning balance
|
$
|
(607.3
|
)
|
$
|
29.7
|
|
$
|
637.0
|
|
||
|
Other comprehensive income (loss)
|
48.6
|
|
(19.1
|
)
|
(67.7
|
)
|
|||||
|
Ending balance
|
(558.7
|
)
|
10.6
|
|
569.3
|
|
|||||
|
Total equity
|
$
|
570.8
|
|
$
|
571.2
|
|
$
|
0.4
|
|
||
|
Comprehensive income
|
|||||||||||
|
Net income
|
$
|
191.1
|
|
$
|
257.7
|
|
$
|
66.6
|
|
||
|
Defined benefit pension and other postretirement plans net of income taxes
|
72.3
|
|
4.6
|
|
(67.7
|
)
|
|||||
|
Currency translation adjustments
|
(23.6
|
)
|
(23.6
|
)
|
—
|
|
|||||
|
Total other comprehensive income (loss)
|
47.7
|
|
(20.0
|
)
|
(67.7
|
)
|
|||||
|
Comprehensive income
|
238.8
|
|
237.7
|
|
(1.1
|
)
|
|||||
|
Comprehensive income attributable to W. R. Grace & Co. shareholders
|
238.1
|
|
237.0
|
|
(1.1
|
)
|
|||||
|
December 31, 2012
|
|||||||||||
|
|
Previously Reported
|
Revised
|
Effect of Change
|
||||||||
|
Retained earnings
|
|
|
|
|
|
|
|||||
|
Beginning balance
|
$
|
301.1
|
|
$
|
(280.3
|
)
|
$
|
(581.4
|
)
|
||
|
Net income
|
94.1
|
|
40.0
|
|
(54.1
|
)
|
|||||
|
Ending balance
|
395.2
|
|
(240.3
|
)
|
(635.5
|
)
|
|||||
|
Accumulated other comprehensive income (loss)
|
|||||||||||
|
Beginning balance
|
$
|
(578.5
|
)
|
$
|
19.5
|
|
$
|
598.0
|
|
||
|
Other comprehensive income (loss)
|
(28.8
|
)
|
10.2
|
|
39.0
|
|
|||||
|
Ending balance
|
(607.3
|
)
|
29.7
|
|
637.0
|
|
|||||
|
Total equity
|
$
|
318.3
|
|
$
|
319.8
|
|
$
|
1.5
|
|
||
|
Comprehensive income
|
|||||||||||
|
Net income
|
$
|
95.1
|
|
$
|
41.0
|
|
$
|
(54.1
|
)
|
||
|
Defined benefit pension and other postretirement plans net of income taxes
|
(36.6
|
)
|
2.3
|
|
38.9
|
|
|||||
|
Currency translation adjustments
|
5.4
|
|
5.5
|
|
0.1
|
|
|||||
|
Total other comprehensive income (loss)
|
(28.0
|
)
|
11.0
|
|
39.0
|
|
|||||
|
Comprehensive income
|
67.1
|
|
52.0
|
|
(15.1
|
)
|
|||||
|
Comprehensive income attributable to W. R. Grace & Co. shareholders
|
65.3
|
|
50.2
|
|
(15.1
|
)
|
|||||
F-18
Notes to Consolidated Financial Statements (Continued)
1. Basis of Presentation and Summary of Significant Accounting and Financial Reporting Policies (Continued)
|
December 31, 2011
|
|||||||||||
|
|
Previously Reported
|
Revised
|
Effect of Change
|
||||||||
|
Retained earnings
|
|
|
|
|
|
|
|||||
|
Beginning balance
|
$
|
31.7
|
|
$
|
(500.0
|
)
|
$
|
(531.7
|
)
|
||
|
Net income
|
269.4
|
|
219.7
|
|
(49.7
|
)
|
|||||
|
Ending balance
|
301.1
|
|
(280.3
|
)
|
(581.4
|
)
|
|||||
|
Accumulated other comprehensive income (loss)
|
|||||||||||
|
Beginning balance
|
$
|
(518.1
|
)
|
$
|
26.7
|
|
$
|
544.8
|
|
||
|
Other comprehensive income (loss)
|
(60.4
|
)
|
(7.2
|
)
|
53.2
|
|
|||||
|
Ending balance
|
(578.5
|
)
|
19.5
|
|
598.0
|
|
|||||
|
Total equity
|
$
|
167.5
|
|
$
|
184.1
|
|
$
|
16.6
|
|
||
|
Comprehensive income
|
|
|
|
|
|||||||
|
Net income
|
$
|
268.8
|
|
$
|
219.1
|
|
$
|
(49.7
|
)
|
||
|
Defined benefit pension and other postretirement plans net of income taxes
|
(46.7
|
)
|
6.2
|
|
52.9
|
|
|||||
|
Currency translation adjustments
|
(11.6
|
)
|
(11.3
|
)
|
0.3
|
|
|||||
|
Total other comprehensive income (loss)
|
(58.6
|
)
|
(5.4
|
)
|
53.2
|
|
|||||
|
Comprehensive income
|
210.2
|
|
213.7
|
|
3.5
|
|
|||||
|
Comprehensive income attributable to W. R. Grace & Co. shareholders
|
209.0
|
|
212.5
|
|
3.5
|
|
|||||
Effect of New Accounting Standards
In June 2011, the FASB issued ASU 2011-05 "Presentation of Comprehensive Income". This update is intended to improve the comparability, consistency, and transparency of financial reporting and to increase the prominence of items reported in other comprehensive income. The new disclosure requirements are effective for fiscal years beginning after December 15, 2011, and for interim periods within those fiscal years, with early adoption permitted. In December 2011, the FASB issued ASU 2011-12 "Deferral of the Effective Date for Amendments to the Presentation of Reclassifications of Items Out of Accumulated Other Comprehensive Income in Accounting Standards Update No. 2011-05". This update defers certain paragraphs of ASU 2011-05 pertaining to reclassification adjustments out of accumulated other comprehensive income. This deferral is effective for fiscal years beginning after December 15, 2011, and for interim periods within those fiscal years, with early adoption permitted. Grace continues to report its Consolidated Statement of Other Comprehensive Income as a separate financial statement, immediately following the Consolidated Statement of Operations to comply with the updates that have not been deferred. In February 2013, the FASB issued ASU 2013-02 "Reporting of Amounts Reclassified Out of Accumulated Other Comprehensive Income", which further clarifies these disclosure requirements. This update is effective for fiscal years beginning after December 15, 2012, and for interim periods within those fiscal years, with early adoption permitted. Grace adopted this update in the 2013 first quarter, and it did not have a material effect on the Consolidated Financial Statements.
In December 2011, the FASB issued ASU 2011-11 "Disclosures about Offsetting Assets and Liabilities". This update is intended to improve the comparability of statements of financial position prepared in accordance with U.S. GAAP and IFRS, requiring both gross and net information about offsetting assets and liabilities. The new requirements are effective for fiscal years beginning on or after January 1, 2013, and for interim periods within those fiscal years. In January 2013, the FASB issued ASU 2013-01 "Clarifying the Scope of Disclosures about Offsetting Assets and Liabilities", which clarifies these disclosure requirements. These standards are effective for fiscal years beginning on or after January 1, 2013, and for interim periods within those fiscal years. Grace adopted these standards for the 2013 first quarter, and they did not have a material effect on the Consolidated Financial Statements.
In July 2012, the FASB issued ASU 2012-02 "Testing Indefinite-Lived Intangible Assets for Impairment". This update is intended to simplify how entities test indefinite-lived intangible assets for impairment, by allowing an entity to first assess qualitative factors to determine whether it is necessary to perform a quantitative impairment test. The
F-19
Notes to Consolidated Financial Statements (Continued)
1. Basis of Presentation and Summary of Significant Accounting and Financial Reporting Policies (Continued)
new requirements are effective for fiscal years beginning after September 15, 2012, and for interim periods within those fiscal years, with early adoption permitted. Grace adopted this standard for the 2012 fourth quarter, and it did not have a material effect on the Consolidated Financial Statements.
In July 2013, the FASB issued ASU 2013-11 "Presentation of an Unrecognized Tax Benefit When a Net Operating Loss Carryforward, a Similar Tax Loss, or a Tax Credit Carryforward Exists". This update is intended to improve the consistency surrounding the presentation of an unrecognized tax benefit when a net operating loss carryforward exists, requiring the unrecognized tax benefit to be presented as a reduction to a deferred tax asset for a net operating loss carryforward, a similar tax loss, or a tax credit carryforward. The new requirements are effective for fiscal years beginning after December 15, 2013, and for interim periods within those fiscal years, with early adoption permitted. Grace will adopt this standard for the 2014 first quarter, and does not expect it to have a material effect on the Consolidated Financial Statements.
2. Chapter 11 and Joint Plan of Reorganization
On April
2, 2001, Grace and
61
of its United States subsidiaries and affiliates filed voluntary petitions for reorganization under Chapter
11 of the Bankruptcy Code. The cases were consolidated under case number
01-01139 (the "Chapter
11 Cases"). Grace's non-U.S. subsidiaries and certain of its U.S. subsidiaries were not included in the filing.
In September 2008, Grace and other parties filed the Joint Plan with the Bankruptcy Court to address all pending and future asbestos-related claims and all other pre-petition claims as outlined therein. On January
31, 2011, the Bankruptcy Court issued an order (the "Confirmation Order") confirming the Joint Plan. On January
31, 2012, the United States District Court for the District of Delaware (the "District Court") issued an order affirming the Confirmation Order and confirming the Joint Plan in its entirety. On February 3, 2014 (the "Effective Date"), the U.S. Court of Appeals for the Third Circuit (the "Third Circuit") dismissed the sole remaining appeal challenging the Confirmation Order and the Joint Plan became effective.
Under the Joint Plan,
two
asbestos trusts have been established and funded under Section 524(g) of the Bankruptcy Code. The Confirmation Order contains a channeling injunction which provides that all pending and future asbestos-related personal injury claims and demands ("PI Claims") are to be channeled for resolution to an asbestos personal injury trust (the "PI Trust") and all pending and future asbestos-related property damage claims and demands ("PD Claims"), including PD Claims related to Grace
’
s former attic insulation product ("ZAI PD Claims"), are to be channeled to a separate asbestos property damage trust (the "PD Trust"). Canadian ZAI PD Claims are channeled to a separate Canadian claims fund. The trusts are the sole recourse for holders of asbestos-related claims; the channeling injunctions prohibit holders of asbestos-related claims from asserting such claims directly against Grace.
Under the terms of the Joint Plan, claims under the Chapter
11 Cases are satisfied as follows:
Asbestos-Related Personal Injury Claims
Asbestos personal injury claimants allege adverse health effects from exposure to asbestos-containing products formerly manufactured by Grace. Historically, Grace's cost to resolve such claims was influenced by numerous variables, including the nature of the disease alleged, product identification, proof of exposure to a Grace product, negotiation factors, the solvency of other former producers of asbestos-containing products, cross-claims by co-defendants, the rate at which new claims were filed, the jurisdiction in which the claims were filed, and the defense and disposition costs associated with these claims.
As of the Filing Date,
129,191
PI Claims were pending against Grace. Grace believes that a substantial number of additional PI Claims would have been received between the Filing Date and December 31, 2013, had such PI Claims not been stayed by the Bankruptcy Court.
Under the Joint Plan, all PI Claims are channeled to the PI Trust for resolution. The PI Trust will use specified trust distribution procedures to satisfy allowed PI Claims.
On the Effective Date, the PI Trust was funded with:
|
•
|
$557.7 million
in cash from Grace (includes
$464.1 million
of cash from Grace and
$93.6 million
of cash from insurance proceeds that were held in escrow);
|
F-20
Notes to Consolidated Financial Statements (Continued)
2. Chapter 11 and Joint Plan of Reorganization (Continued)
|
•
|
A warrant to acquire
10 million
shares of Company common stock at an exercise price of
$17.00
per share, expiring one year after the Effective Date (the "PI Warrant") (this obligation is expected to be settled in cash with the PI Trust as discussed below);
|
|
•
|
Rights to all proceeds under all of Grace
’
s insurance policies that are available for payment of PI Claims;
|
|
•
|
$42.1
million in cash from a subsidiary of Fresenius AG, pursuant to the terms of a settlement agreement resolving asbestos-related, successor liability and fraudulent transfer claims against Fresenius; and
|
|
•
|
$856.8
million in cash and
18 million
shares of Sealed Air Corporation common stock paid by Cryovac, Inc., a wholly owned subsidiary of Sealed Air, pursuant to the terms of a settlement agreement resolving asbestos-related, successor liability and fraudulent transfer claims against Cryovac and Sealed Air.
|
Grace is obligated to make deferred payments to the PI Trust of
$110 million
per year for
5
years beginning in 2019, and
$100 million
per year for
10
years beginning in 2024, which obligation is secured by the Company's obligation to issue
77,372,257
shares of Company common stock to the asbestos trusts in the event of default.
The amounts that Grace will be obligated to pay to the PI Trust under the Joint Plan are fixed amounts. Grace is not obligated to make additional payments to the PI Trust beyond the payments described above.
Asbestos-Related Property Damage Claims
The plaintiffs in asbestos property damage lawsuits generally seek to have the defendants pay for the cost of removing, containing or repairing the asbestos-containing materials in commercial and public buildings. Various factors can affect the merit and value of PD Claims, including legal defenses, product identification, the amount and type of product involved, the age, type, size and use of the building, the legal status of the claimant, the jurisdictional history of prior cases, the court in which the case is pending, and the difficulty of asbestos abatement, if necessary.
Several class action lawsuits also were filed on behalf of homeowners alleging damage from ZAI. Based on Grace's investigation of the claims described in these lawsuits, and testing and analysis of this product by Grace and others, Grace believes that ZAI was and continues to be safe for its intended purpose and poses little or no threat to human health. The plaintiffs in the ZAI lawsuits dispute Grace's position on the safety of ZAI. In December 2006 the Bankruptcy Court issued an opinion and order holding that, although ZAI is contaminated with asbestos and can release asbestos fibers when disturbed, there is no unreasonable risk of harm from ZAI.
At Grace's request, in July 2008, the Bankruptcy Court established a claims bar date for U.S. ZAI PD Claims and approved a related notice program that required any person with a U.S. ZAI PD Claim to submit an individual proof of claim no later than October 31, 2008. Approximately
17,960
U.S. ZAI PD Claims were filed prior to the October 31, 2008, claims bar date and, as of December 31, 2013, an additional
1,310
U.S. ZAI PD Claims were filed.
In 2008 and 2009, Grace entered into settlement agreements with representatives of the U.S. ZAI PD claimants and Canadian ZAI PD claimants, respectively. The terms of these settlements have been incorporated into the terms of the Joint Plan and related documents.
All PD Claims have been channeled to the PD Trust for resolution. The PD Trust contains
two
accounts, the PD Account and the ZAI PD Account. U.S. ZAI PD Claims are to be paid from the ZAI PD Account and non-ZAI PD Claims are to be paid from the PD Account. Canadian ZAI PD Claims are to be paid by a separate fund established in Canada. Each account has a separate trustee and the assets of the accounts may not be commingled.
PD Account
On the Effective Date, the PD Account of the PD Trust was funded with
$39.9 million
in cash from Grace and
$111.4 million
in cash from Cryovac and Fresenius to pay allowed non-ZAI PD Claims settled as of the Effective Date, and CDN
$8.6 million
in cash from Grace to fund the Canadian ZAI PD Claims fund.
Following the Effective Date, unresolved non-ZAI PD Claims are to be litigated in the Bankruptcy Court and any future non-ZAI PD Claims are to be litigated in a federal district court, in each case pursuant to procedures to be approved by the Bankruptcy Court. To the extent any such PD Claims are determined to be allowed claims, they are to be paid in cash by the PD Trust. Grace is obligated to make a payment to the PD Trust every six months in the amount of any non-ZAI PD Claims allowed during the preceding six months plus interest (if applicable) and,
F-21
Notes to Consolidated Financial Statements (Continued)
2. Chapter 11 and Joint Plan of Reorganization (Continued)
except for the first six months, the amount of PD Trust expenses for the preceding six months (the "PD Obligation"). The aggregate amount to be paid under the PD Obligation is not capped and Grace may be obligated to make additional payments to the PD Account of the PD Trust in respect of the PD Obligation. Grace has accrued for those unresolved non-ZAI PD Claims that it believes are probable and estimable. Grace has not accrued for other unresolved or unasserted non-ZAI PD Claims as it does not believe that payment on any such claims is probable.
On the Effective Date, the PD Trust contributed CDN
$8.6 million
to a separate Canadian ZAI PD Claims fund through which Canadian ZAI PD Claims are to be resolved. Grace has no continuing or contingent obligations to make additional payments into this fund.
ZAI PD Account
On the Effective Date, the ZAI PD Account of the PD Trust was funded with approximately
$34.4 million
in cash from Cryovac and Fresenius.
Grace is obligated to make a payment of
$30 million
in cash to the ZAI PD Account on the third anniversary of the Effective Date, and Grace is obligated to make up to
10
contingent deferred payments of
$8 million
per year to the ZAI PD Account during the
20
-year period beginning on the fifth anniversary of the Effective Date, with each such payment due only if the assets of the ZAI PD Account fall below
$10 million
during the preceding year. The amounts that Grace will be obligated to pay to the ZAI PD Account under the Joint Plan are capped amounts. Grace is not obligated to make additional payments to the PD Trust in respect of the ZAI PD Account beyond the payments described above. Grace has accrued for the
$30 million
payment due on the third anniversary of the Effective Date, but has not accrued for the
10
additional payments since Grace does not currently believe they are probable.
The PD Trust is to resolve U.S. ZAI PD Claims that qualify for payment under specified trust distribution procedures by paying
55%
of the claimed amount, but in no event is the PD Trust to pay more per claim than
55%
of
$7,500
(as adjusted for inflation each year after the fifth anniversary of the Effective Date).
All payments to the PD Trust required after the Effective Date are secured by the Company's obligation to issue
77,372,257
shares of Company common stock to the asbestos trusts in the event of default. Grace has the right to conduct annual audits of the books, records and claim processing procedures of the PD Trust.
Asbestos-Related Liability
The recorded asbestos-related liability as of
December 31, 2013
and
2012
, was
$2,092.4 million
and
$2,065.0 million
respectively, and is included in "liabilities subject to compromise" in the accompanying Consolidated Balance Sheets. Grace increased its asbestos-related liability by
$27.4 million
in the fourth quarter of 2013 to reflect the updated estimated value of the consideration payable to the PI Trust and the PD Trust (the "Trusts") under the Joint Plan, considering the effective date of February 3, 2014. The asbestos-related liability was settled at the recorded amount on the Effective Date, including payment of cash due at the Effective Date, issuance of the warrant and deferred payment obligations, and transfer of all cash and rights with respect to Grace's insurance policies that provide coverage for asbestos-related claims.
The PI Trust deferred payment obligation of
$110 million
per year for
5
years beginning January 2, 2019, and of
$100 million
per year for
10
years beginning January 2, 2024, was recorded at fair value of
$567 million
on December 31, 2013, to reflect the estimated value on the Effective Date. The value of the deferred payment obligation has been estimated based on (i) interest rates; (ii) the Company's credit standing and the payment period of the deferred payments; (iii) restrictive covenants and terms of the Company's other credit facilities; (iv) assessment of the risk of a default, which if default were to occur would require Grace to issue shares of Company common stock; and (v) the subordination provisions of the deferred payment agreement.
Grace also recorded a deferred payment obligation of
$27.5 million
representing the present value of the
$30 million
payment due to the ZAI PD Account on February 3, 2017.
The warrant to acquire
10 million
shares of the Company's common stock for
$17.00
per share is recorded at estimated value of
$490 million
on the Effective Date based on the current trading range of Company common stock and other valuation factors.
Insurance Rights
The insurance rights transferred by Grace to the PI Trust under the Joint Plan relate to insurance policies that provide coverage for 1962 to 1985 with respect to asbestos-related lawsuits and claims. For the most part, coverage for years 1962 through 1972 has been exhausted, leaving coverage for years 1973 through
F-22
Notes to Consolidated Financial Statements (Continued)
2. Chapter 11 and Joint Plan of Reorganization (Continued)
1985 available for pending and future asbestos claims. Since 1985, insurance coverage for asbestos-related liabilities has not been commercially available to Grace. As discussed above, pursuant to the Joint Plan, proceeds with respect to all of Grace's insurance policies that provide coverage for asbestos-related claims were transferred to the PI Trust at emergence.
Grace has entered into settlement agreements, which were, for the most part, dependent upon the effectiveness of the Joint Plan, with underwriters of a portion of Grace's insurance coverage. Under most of these agreements, the insurers have agreed, subject to certain conditions, to pay to the PI Trust (directly or through an escrow arrangement) an aggregate of
$396.1 million
in respect of coverage under the affected policies. Under the remaining agreements, the insurers have agreed to reimburse the PI Trust for a portion of the claims actually paid by the PI Trust.
The amount of insurance recovered on claims by the PI Trust will depend on the aggregate amount of claims received by the PI Trust, proceeds from unsettled policies, and a number of factors that will be determined at the time claims are paid including: the nature of the claim, the relevant exposure years, the timing of payment, the solvency of insurers and the legal status of policy rights. Grace estimates that the recorded amount of
$500.0 million
is within the reasonable range of possible valuations of these policies at emergence.
PI Warrant Settlement
In October 2012, Grace entered into an agreement with interested parties to settle the PI Warrant in cash during the
one
-year period after the Effective Date. Under the terms of the settlement agreement, Grace will repurchase the PI Warrant for a price equal to the average of the daily closing prices of Company common stock during the period commencing one day after the Effective Date and ending on the day prior to the date the PI Trust elects to sell the PI Warrant back to Grace, multiplied by
10 million
(the number of shares issuable under the PI Warrant), less
$170 million
(the aggregate exercise price of the PI Warrant), provided that if the average of the daily closing prices is less than
$54.50
per share, then the repurchase price would be
$375 million
, and if the average of the daily closing prices exceeds
$66.00
per share, then the repurchase price would be
$490 million
. The settlement agreement is terminable by the PI Trust in the event a tender offer, or other proposed transaction that would result in a change in control of the Company, is announced during the
one
-year period after the Effective Date. In such event, the PI Warrant would be settled in shares of Company common stock.
Other Claims
The Joint Plan also provides that all other allowed pre-petition claims will be paid in full on or within
10 days
after the Effective Date, or when they otherwise become due. All allowed administrative claims are to be paid in cash and all allowed priority claims are to be paid in cash with interest as provided in the Joint Plan. Secured claims are to be paid in cash with interest or by reinstatement. Allowed general unsecured claims are to be paid in cash, including post-petition interest in accordance with the Joint Plan. The Joint Plan further provides that Grace will, subject to certain non-bankruptcy limitations, satisfy all pension, retirement medical, and similar employee-related obligations and pay workers’ compensation claims. Grace paid on or within
10 days
after the Effective Date
$1,361.6 million
in respect of other allowed pre-petition or other claims, including
$1,103.5 million
in respect of Grace's pre-petition credit facilities.
Unresolved Claims
The Bankruptcy Court established a claims bar date of March 31, 2003, for claims of general unsecured creditors, PD Claims (other than ZAI PD Claims) and medical monitoring claims related to asbestos. The bar date did not apply to PI Claims or claims related to ZAI PD Claims.
Unresolved claims are to be addressed through the claims objection process and the dispute resolution procedures approved by the Bankruptcy Court. As of the Effective Date,
62
employee claims and
70
non-employee claims (other than asbestos-related claims) remain unresolved.
Grace believes that its recorded liabilities for unresolved claims represent a reasonable estimate of the ultimate allowable amount for such claims. If it is ultimately determined that any amounts are owed on these claims, they are to be paid in full, with interest as required. While the ultimate outcome of these claims cannot be predicted with certainty, Grace believes that the resolution of these matters will not have a material adverse effect on its consolidated financial position, results of operations, or cash flows.
After the Effective Date, all persons and entities generally are forever barred from asserting against Grace any claims or demands that are based upon any act or omission, transaction, or other activity, event or occurrence that occurred prior to the Effective Date, except as expressly provided in the Joint Plan.
F-23
Notes to Consolidated Financial Statements (Continued)
2. Chapter 11 and Joint Plan of Reorganization (Continued)
Committees and Representatives
As a result of confirmation and effectiveness of the Joint Plan, the
four
official committees appointed in the Chapter 11 Cases have been disbanded. The legal representative for future asbestos personal injury claimants will continue to act in the same capacity with respect to the PI Trust and the legal representative for future asbestos property damage claimants will continue to act in the same capacity with respect to the PD Trust.
Effect on Company Common Stock
Under the Joint Plan holders of Company common stock as of the Effective Date retained their shares, but the interests of shareholders are subject to dilution in the event of default with respect to the deferred payment obligations to the PI Trust or the PD Trust under the Company's security obligation.
As of December 31, 2013, Grace maintained a
$100 million
cash-collateralized letter of credit facility with a commercial bank to support existing and new financial assurances. At emergence, the cash-collateralized letter of credit facility was replaced with a
$400 million
revolving credit facility with a
$150 million
sublimit for letters of credit. See Note 8 for a discussion of Grace's exit financing.
Accounting Impact
The accompanying Consolidated Financial Statements have been prepared in accordance with ASC 852 "Reorganizations". ASC 852 requires that financial statements of debtors-in-possession be prepared on a going concern basis, which contemplates continuity of operations and realization of assets and liquidation of liabilities in the ordinary course of business.
Pursuant to ASC 852, Grace's pre-petition and post-petition liabilities that are subject to compromise are required to be reported separately on the balance sheet at an estimate of the amount that will ultimately be allowed by the Bankruptcy Court. As of
December 31, 2013
, such pre-petition liabilities include fixed obligations (such as debt and contractual commitments), as well as estimates of costs related to contingent liabilities (such as asbestos-related litigation, environmental remediation and other claims). Obligations of Grace subsidiaries not covered by the Filing continue to be classified on the Consolidated Balance Sheets based upon maturity dates or the expected dates of payment. ASC 852 also requires separate reporting of certain expenses, realized gains and losses, and provisions for losses related to the Filing as reorganization items. Grace presents reorganization items as "Chapter 11 expenses, net of interest income," a separate caption in its Consolidated Statements of Operations.
Grace has not recorded the benefit of the assets available to fund asbestos-related and other liabilities under the Fresenius settlement and the Sealed Air settlement as provided by the Joint Plan, as these assets were transferred directly to the PI Trust and the PD Trust on the Effective Date. The estimated fair value available under the Fresenius settlement and the Sealed Air settlement as measured at
December 31, 2013
, was
$1,653 million
composed of
$115 million
in cash from Fresenius and
$1,538 million
in cash and stock from Cryovac.
Grace's Consolidated Balance Sheets separately identify the liabilities that are "subject to compromise" as a result of the Chapter 11 proceedings. In Grace's case, "liabilities subject to compromise" represent both pre-petition and post-petition liabilities as determined under U.S. GAAP. Changes to pre-petition liabilities subsequent to the Filing Date reflect: (1) cash payments under approved court orders; (2) the terms of the Joint Plan, as discussed above, including the accrual of interest on pre-petition debt and other fixed obligations; (3) accruals for employee-related programs; and (4) changes in estimates related to other pre-petition contingent liabilities.
F-24
Notes to Consolidated Financial Statements (Continued)
2. Chapter 11 and Joint Plan of Reorganization (Continued)
Components of liabilities subject to compromise are as follows:
|
(In millions)
|
December 31, 2013
|
December 31, 2012
|
Filing Date
(Unaudited)
|
||||||||
|
Asbestos-related contingencies
|
$
|
2,092.4
|
|
$
|
2,065.0
|
|
$
|
1,002.8
|
|
||
|
Pre-petition bank debt plus accrued interest
|
1,100.0
|
|
937.2
|
|
511.5
|
|
|||||
|
Environmental contingencies
|
134.5
|
|
140.5
|
|
164.8
|
|
|||||
|
Unfunded special pension arrangements
|
129.4
|
|
137.1
|
|
70.8
|
|
|||||
|
Income tax contingencies
|
76.6
|
|
87.6
|
|
242.1
|
|
|||||
|
Postretirement benefits other than pension
|
57.2
|
|
63.9
|
|
185.4
|
|
|||||
|
Drawn letters of credit plus accrued interest
|
37.8
|
|
36.1
|
|
—
|
|
|||||
|
Accounts payable
|
34.3
|
|
31.3
|
|
43.0
|
|
|||||
|
Retained obligations of divested businesses
|
29.9
|
|
29.0
|
|
43.5
|
|
|||||
|
Other accrued liabilities
|
94.3
|
|
102.3
|
|
102.1
|
|
|||||
|
Reclassification to current liabilities(1)
|
(10.3
|
)
|
(10.1
|
)
|
—
|
|
|||||
|
Total Liabilities Subject to Compromise
|
$
|
3,776.1
|
|
$
|
3,619.9
|
|
$
|
2,366.0
|
|
||
_______________________________________________________________________________
|
(1)
|
As of
December 31, 2013
and
2012
, approximately
$10.3 million
and
$10.1 million
, respectively, of certain pension and postretirement benefit obligations subject to compromise have been presented in "other current liabilities" in the Consolidated Balance Sheets in accordance with ASC 715 "Compensation—Retirement Benefits".
|
Note that the unfunded special pension arrangements reflected above exclude non-U.S. pension plans and qualified U.S. pension plans that became underfunded subsequent to the Filing.
Change in Liabilities Subject to Compromise
The following table is a reconciliation of the changes in pre-filing date liability balances for the period from the Filing Date through
December 31, 2013
.
|
(In millions) (Unaudited)
|
Cumulative
Since Filing
|
||
|
Balance, Filing Date April 2, 2001
|
$
|
2,366.0
|
|
|
Cash disbursements and/or reclassifications under Bankruptcy Court orders:
|
|
||
|
Payment of environmental settlement liability
|
(252.0
|
)
|
|
|
Freight and distribution order
|
(5.7
|
)
|
|
|
Trade accounts payable order
|
(9.1
|
)
|
|
|
Resolution of contingencies subject to Chapter 11
|
(130.0
|
)
|
|
|
Other court orders for payments of certain operating expenses
|
(374.9
|
)
|
|
|
Expense (income) items:
|
|
||
|
Interest on pre-petition liabilities
|
682.5
|
|
|
|
Employee-related accruals
|
127.6
|
|
|
|
Provision for asbestos-related contingencies
|
1,137.2
|
|
|
|
Provision for environmental contingencies
|
362.0
|
|
|
|
Release of income tax contingencies
|
(91.5
|
)
|
|
|
Balance sheet reclassifications
|
(36.0
|
)
|
|
|
Balance, end of period
|
$
|
3,776.1
|
|
For the holders of pre-petition bank credit facilities, beginning January 1, 2006, Grace agreed to pay interest on pre-petition bank debt at the prime rate, adjusted for periodic changes, and compounded quarterly. The effective rate for the years ended
December 31, 2013
and
2012
, was
3.25%
. From the Filing Date through December 31, 2005, Grace accrued interest on pre-petition bank debt at a negotiated fixed annual rate of
6.09%
, compounded
F-25
Notes to Consolidated Financial Statements (Continued)
2. Chapter 11 and Joint Plan of Reorganization (Continued)
quarterly. The pre-petition bank debt holders argued that they were entitled to post-petition interest at the default rate specified under the terms of the underlying credit agreements, which they asserted was more than an additional
$210 million
in interest. The Bankruptcy Court and the District Court overruled this assertion and the pre-petition bank debt holders appealed these rulings to the Third Circuit Court of Appeals. On December 23, 2013, Grace and the pre-petition bank debt holders settled this appeal. Under the terms of the settlement, Grace agreed to pay an additional
$129.0 million
of interest above the amount provided for under the Joint Plan as of December 31, 2013, with interest to continue to accrue at
3.25%
through January 31, 2014, and at
5.00%
thereafter. The principal and all accrued interest on the pre-petition bank debt was paid in full on the Effective Date.
For the holders of claims who, but for the Filing, would be entitled under a contract or otherwise to accrue or be paid interest on such claim in a non-default (or non-overdue payment) situation under applicable non-bankruptcy law, Grace accrued interest at the rate provided in the contract between the Grace entity and the claimant or such rate as may otherwise apply under applicable non-bankruptcy law.
For all other holders of allowed general unsecured claims, Grace accrued interest at a rate of
4.19%
per annum, compounded annually, unless otherwise negotiated during the claim settlement process.
Chapter 11 Expenses
|
|
Year Ended December 31,
|
||||||||||
|
(In millions)
|
2013
|
2012
|
2011
|
||||||||
|
Legal and financial advisory fees
|
$
|
17.1
|
|
$
|
17.4
|
|
$
|
20.6
|
|
||
|
Interest (income) expense
|
(1.8
|
)
|
(0.8
|
)
|
(0.6
|
)
|
|||||
|
Chapter 11 expenses, net of interest income
|
$
|
15.3
|
|
$
|
16.6
|
|
$
|
20.0
|
|
||
Pursuant to ASC 852, interest income earned on the Debtors' cash balances must be offset against Chapter 11 expenses.
Condensed Financial Information of the Debtors
W. R. Grace & Co.—Chapter 11 Filing Entities
Debtor-in-Possession Statements of Operations
|
|
Year Ended December 31,
|
||||||||||
|
(In millions) (Unaudited)
|
2013
|
2012
|
2011
|
||||||||
|
Net sales, including intercompany
|
$
|
1,425.4
|
|
$
|
1,512.6
|
|
$
|
1,479.4
|
|
||
|
Cost of goods sold, including intercompany, exclusive of depreciation and amortization shown separately below
|
882.2
|
|
951.3
|
|
919.1
|
|
|||||
|
Selling, general and administrative expenses
|
178.1
|
|
274.9
|
|
334.5
|
|
|||||
|
Depreciation and amortization
|
69.1
|
|
67.3
|
|
68.3
|
|
|||||
|
Chapter 11 expenses, net of interest income
|
15.3
|
|
16.6
|
|
20.0
|
|
|||||
|
Default interest settlement
|
129.0
|
|
—
|
|
—
|
|
|||||
|
Asbestos and bankruptcy-related charges, net
|
21.9
|
|
384.6
|
|
—
|
|
|||||
|
Research and development expenses
|
37.8
|
|
35.9
|
|
39.7
|
|
|||||
|
Interest expense and related financing costs
|
37.7
|
|
41.5
|
|
40.0
|
|
|||||
|
Other income, net
|
(75.7
|
)
|
(93.2
|
)
|
(75.3
|
)
|
|||||
|
1,295.4
|
|
1,678.9
|
|
1,346.3
|
|
||||||
|
Income (loss) before income taxes and equity in net income of non-filing entities
|
130.0
|
|
(166.3
|
)
|
133.1
|
|
|||||
|
Benefit from (provision for) income taxes
|
(53.2
|
)
|
48.4
|
|
(50.8
|
)
|
|||||
|
Income (loss) before equity in net income of non-filing entities
|
76.8
|
|
(117.9
|
)
|
82.3
|
|
|||||
|
Equity in net income of non-filing entities
|
179.3
|
|
157.9
|
|
137.4
|
|
|||||
|
Net income attributable to W. R. Grace & Co. shareholders
|
$
|
256.1
|
|
$
|
40.0
|
|
$
|
219.7
|
|
||
F-26
Notes to Consolidated Financial Statements (Continued)
2. Chapter 11 and Joint Plan of Reorganization (Continued)
In the above table, for 2013, Asbestos and bankruptcy-related charges, net, primarily includes adjustments made to reflect the emergence-date value of the deferred payment obligations and adjustments to record the final allowed claims listing, partially offset by adjustments for interest per the terms of the Joint Plan. For 2012, Asbestos and bankruptcy-related charges, net, includes adjustments made to our asbestos-related liability and to accrue for the Libby Medical Program settlement.
W. R. Grace & Co.—Chapter 11 Filing Entities
Debtor-in-Possession Statements of Cash Flows
|
|
Year Ended December 31,
|
||||||||||
|
(In millions) (Unaudited)
|
2013
|
2012
|
2011
|
||||||||
|
Operating Activities
|
|
|
|
||||||||
|
Net income attributable to W. R. Grace & Co. shareholders
|
$
|
256.1
|
|
$
|
40.0
|
|
$
|
219.7
|
|
||
|
Reconciliation to net cash provided by operating activities:
|
|
|
|
||||||||
|
Depreciation and amortization
|
69.1
|
|
67.3
|
|
68.3
|
|
|||||
|
Asbestos and bankruptcy-related charges, net
|
21.9
|
|
384.6
|
|
—
|
|
|||||
|
Default interest settlement
|
129.0
|
|
—
|
|
—
|
|
|||||
|
Equity in net income of non-filing entities
|
(179.3
|
)
|
(157.9
|
)
|
(137.4
|
)
|
|||||
|
Provision for (benefit from) income taxes
|
53.2
|
|
(48.4
|
)
|
50.8
|
|
|||||
|
Income taxes (paid), net of refunds
|
13.5
|
|
(33.9
|
)
|
(13.2
|
)
|
|||||
|
Tax benefits from stock-based compensation
|
35.4
|
|
(36.8
|
)
|
—
|
|
|||||
|
Defined benefit pension (income) expense
|
(51.8
|
)
|
82.0
|
|
111.6
|
|
|||||
|
Payments under defined benefit pension arrangements
|
(55.6
|
)
|
(114.9
|
)
|
(251.4
|
)
|
|||||
|
Repatriation of cash from foreign entities
|
29.7
|
|
21.6
|
|
30.3
|
|
|||||
|
Changes in assets and liabilities, excluding the effect of foreign currency translation and business acquired:
|
|
|
|
||||||||
|
Trade accounts receivable
|
(6.2
|
)
|
(7.1
|
)
|
(26.2
|
)
|
|||||
|
Inventories
|
(23.0
|
)
|
66.7
|
|
(66.4
|
)
|
|||||
|
Accounts payable
|
21.9
|
|
(15.1
|
)
|
37.5
|
|
|||||
|
All other items, net
|
31.1
|
|
75.9
|
|
13.4
|
|
|||||
|
Net cash provided by operating activities
|
345.0
|
|
324.0
|
|
37.0
|
|
|||||
|
Investing Activities
|
|
|
|
||||||||
|
Capital expenditures
|
(94.1
|
)
|
(82.6
|
)
|
(77.7
|
)
|
|||||
|
Business acquired, net of cash acquired
|
(510.4
|
)
|
—
|
|
—
|
|
|||||
|
Transfer to restricted cash and cash equivalents
|
(222.2
|
)
|
(35.4
|
)
|
(8.4
|
)
|
|||||
|
Other
|
—
|
|
—
|
|
10.0
|
|
|||||
|
Net cash used for investing activities
|
(826.7
|
)
|
(118.0
|
)
|
(76.1
|
)
|
|||||
|
Borrowings under credit arrangements
|
0.3
|
|
—
|
|
—
|
|
|||||
|
Repayments under credit arrangements
|
(0.8
|
)
|
(0.6
|
)
|
—
|
|
|||||
|
Proceeds from exercise of stock options
|
34.4
|
|
32.2
|
|
12.1
|
|
|||||
|
Excess tax benefits from stock-based compensation
|
(35.4
|
)
|
36.8
|
|
—
|
|
|||||
|
Other financing activities
|
4.1
|
|
1.2
|
|
28.4
|
|
|||||
|
Net cash provided by financing activities
|
2.6
|
|
69.6
|
|
40.5
|
|
|||||
|
Net (decrease) increase in cash and cash equivalents
|
(479.1
|
)
|
275.6
|
|
1.4
|
|
|||||
|
Cash and cash equivalents, beginning of period
|
1,064.2
|
|
788.6
|
|
787.2
|
|
|||||
|
Cash and cash equivalents, end of period
|
$
|
585.1
|
|
$
|
1,064.2
|
|
$
|
788.6
|
|
||
F-27
Notes to Consolidated Financial Statements (Continued)
2. Chapter 11 and Joint Plan of Reorganization (Continued)
W. R. Grace & Co.—Chapter 11 Filing Entities
Debtor-in-Possession Balance Sheets
|
|
December 31,
|
||||||
|
(In millions) (Unaudited)
|
2013
|
2012
|
|||||
|
ASSETS
|
|
|
|||||
|
Current Assets
|
|
|
|||||
|
Cash and cash equivalents
|
$
|
585.1
|
|
$
|
1,064.2
|
|
|
|
Restricted cash and cash equivalents
|
340.5
|
|
118.3
|
|
|||
|
Trade accounts receivable, net
|
138.8
|
|
132.6
|
|
|||
|
Accounts receivable—unconsolidated affiliate
|
10.9
|
|
14.1
|
|
|||
|
Receivables from non-filing entities, net
|
173.0
|
|
160.5
|
|
|||
|
Inventories
|
138.9
|
|
115.9
|
|
|||
|
Other current assets
|
69.3
|
|
58.5
|
|
|||
|
Total Current Assets
|
1,456.5
|
|
1,664.1
|
|
|||
|
Properties and equipment, net
|
484.5
|
|
433.5
|
|
|||
|
Goodwill
|
279.9
|
|
26.8
|
|
|||
|
Technology and other intangible assets, net
|
249.1
|
|
9.6
|
|
|||
|
Deferred income taxes
|
817.3
|
|
933.3
|
|
|||
|
Asbestos-related insurance
|
500.0
|
|
500.0
|
|
|||
|
Loans receivable from non-filing entities, net
|
283.8
|
|
282.1
|
|
|||
|
Investment in non-filing entities
|
531.3
|
|
442.3
|
|
|||
|
Investment in unconsolidated affiliate
|
96.2
|
|
85.5
|
|
|||
|
Other assets
|
16.5
|
|
10.8
|
|
|||
|
Total Assets
|
$
|
4,715.1
|
|
$
|
4,388.0
|
|
|
|
LIABILITIES AND EQUITY
|
|
|
|||||
|
Liabilities Not Subject to Compromise
|
|
|
|||||
|
Current liabilities (including $17.5 due to unconsolidated affiliate) (2012—$6.0)
|
$
|
247.4
|
|
$
|
244.7
|
|
|
|
Underfunded defined benefit pension plans
|
52.2
|
|
156.9
|
|
|||
|
Other liabilities (including $24.3 due to unconsolidated affiliate) (2012—$22.4)
|
78.7
|
|
56.5
|
|
|||
|
Total Liabilities Not Subject to Compromise
|
378.3
|
|
458.1
|
|
|||
|
Liabilities Subject to Compromise
|
3,776.1
|
|
3,619.9
|
|
|||
|
Total Liabilities
|
4,154.4
|
|
4,078.0
|
|
|||
|
Total W. R. Grace & Co. Shareholders' Equity
|
560.6
|
|
309.9
|
|
|||
|
Noncontrolling interests in Chapter 11 filing entities
|
0.1
|
|
0.1
|
|
|||
|
Total Equity
|
560.7
|
|
310.0
|
|
|||
|
Total Liabilities and Equity
|
$
|
4,715.1
|
|
$
|
4,388.0
|
|
|
In addition to Grace's financial reporting obligations as prescribed by the SEC, during the Chapter 11 proceeding, Grace was required, under the rules and regulations of the Bankruptcy Code, to periodically file certain statements and schedules with the Bankruptcy Court. This information is available to the public through the Bankruptcy Court. This information was prepared in a format that may not be comparable to information in Grace's quarterly and annual financial statements as filed with the SEC. These statements and schedules are not audited and do not purport to represent the financial position or results of operations of Grace on a consolidated basis.
This summary of the terms of various agreements does not purport to be complete and is qualified in its entirety by reference to the Joint Plan, the Confirmation Order, the Asbestos Trust Agreements, the Asbestos Insurance Transfer Agreement, the Deferred Payment Agreements, the Guarantee Agreements, the Share Issuance Agreement, the Warrant Agreement, the Warrant Implementation Letter, and the Warrant Registration Rights Agreement, which have been filed with the SEC.
F-28
Notes to Consolidated Financial Statements (Continued)
3. Subsequent Event—Chapter 11 Emergence
Grace emerged from bankruptcy on February 3, 2014. Grace paid approximately
$1,900 million
in emergence-related claims and other costs. This included payments to the PI Trust and the PD Trust, pre-petition bank debt, drawn letters of credit, environmental settlements, income tax settlements, amounts due to vendors, and other non-asbestos claims, plus accrued interest for certain of these items as well as other emergence costs. Grace will satisfy all other liabilities previously subject to compromise as they become due and payable after emergence.
Grace funded these payments through a combination of approximately
$1,360 million
of cash on hand and approximately
$900 million
in exit financing. The exit financing consisted of a
$700 million
term loan and a
€150 million
term loan. See Note 8 for a discussion of Grace's exit financing.
Pro forma Information (Unaudited)
The below table presents the pro forma consolidated balance sheet of Grace as of December 31, 2013, reflecting the accounting effects of the Joint Plan as if it became effective on that date. The income tax effects of the pro forma adjustments have been computed at a
37.41%
U.S. Federal and state income tax rate. Grace is not required to adopt fresh-start accounting at emergence since existing shareholders continue to retain a majority interest in the Company on the Effective Date, and Grace is not balance sheet insolvent. Following is a description of the pro forma adjustments:
|
1.
|
Borrowings Under New Credit Agreements
—Reflects
$900 million
of debt borrowed on the Effective Date. Cash proceeds were approximately
$873 million
after approximately
$27 million
of origination fees and other costs of the exit financing, including original issue discount.
|
|
2.
|
Consideration to the Asbestos Trusts
—Reflects the transfer by Grace to the PI Trust and the PD Trust of (i) cash (including restricted cash) of approximately
$512 million
, (ii) the PI Deferred Payment Obligations, (iii) the PD Deferred Payment Obligation, (iv) the warrant, and (v) rights to proceeds from Grace's asbestos-related insurance coverage. See Note 2 for a discussion of this consideration. The related deferred income tax assets are reclassified from temporary differences to NOL carryforward.
|
Grace expects to recognize income tax deductions on the Deferred Payments when cash payments are made. Grace has determined that payments of the U.S. ZAI contingent payments are not probable, and no such payments are included in this pro forma.
|
3.
|
Payment of Remaining Pre-Petition Liabilities and Adjustment for Additional Expenses
—Reflects the payment of pre-petition bank debt, drawn letters of credit, environmental settlements, income tax settlements, amounts due to vendors and other non-asbestos claims, accrued interest for certain of these items, and other emergence costs on the Effective Date. The related deferred income tax assets are reclassified from temporary differences to NOL carryforward. Also reflects approximately
$12 million
of emergence costs, which are assumed fully deductible for tax purposes.
|
|
4.
|
NOLs and Future Tax Deductions
—Reflects U.S. Federal and state income tax deductions attributable to the payment of certain bankruptcy claims. U.S. Federal and state NOL carryforwards are assumed to increase to approximately
$670 million
(tax effected at approximately
$252 million
). In addition, under current U.S. Federal and state income tax law, future deductions are expected in the amount of
$1,580 million
when the deferred payments are made and
$490 million
when the warrant is settled.
|
These future payments are expected to create additional NOL carryforwards in the years paid. It is expected that use of these U.S. Federal tax benefits will be unrestricted and that a valuation allowance will not be established. U.S. state tax benefits associated with these future payments may have some restrictions and a partial valuation allowance may be recorded. The realization of the tax benefits depends on the amount and timing of future U.S. taxable income and the avoidance of limitation events that would apply in the event that Grace undergoes an "ownership change" (as defined by the Internal Revenue Code).
|
5.
|
Reclassification of Liabilities Subject to Compromise
—Reflects certain items that were classified as Liabilities Subject to Compromise as of
December 31, 2013
, and were not paid at emergence, which were reclassified to the appropriate liability accounts at emergence. This includes income tax contingencies, postretirement benefits, and environmental contingencies that will be paid as they come due after emergence.
|
F-29
Notes to Consolidated Financial Statements (Continued)
3. Subsequent Event—Chapter 11 Emergence (Continued)
W. R. Grace and Co. and Subsidiaries
Pro forma Consolidated Balance Sheet (unaudited)
|
Pro forma Adjustments
|
|||||||||||||||||||||||
|
(In millions, except par value and shares)
|
December 31, 2013
Reported
|
Borrowings Under New Credit Agreements
|
Consideration to the Asbestos Trusts
|
Payment of Remaining Pre-Petition Liabilities and Adjustment for Additional Expenses
|
Reclassifications at Emergence
|
December 31, 2013
Pro forma
|
|||||||||||||||||
|
ASSETS
|
|
||||||||||||||||||||||
|
Current Assets
|
|
||||||||||||||||||||||
|
Cash and cash equivalents
|
$
|
964.8
|
|
$
|
873.0
|
|
$
|
(269.6
|
)
|
$
|
(1,370.6
|
)
|
$
|
153.2
|
|
$
|
350.8
|
|
|||||
|
Restricted cash and cash equivalents
|
395.4
|
|
—
|
|
(242.2
|
)
|
—
|
|
(153.2
|
)
|
—
|
|
|||||||||||
|
Trade accounts receivable, less allowance of $6.0
|
469.5
|
|
—
|
|
—
|
|
—
|
|
—
|
|
469.5
|
|
|||||||||||
|
Accounts receivable—unconsolidated affiliate
|
12.3
|
|
—
|
|
—
|
|
—
|
|
—
|
|
12.3
|
|
|||||||||||
|
Inventories
|
295.3
|
|
—
|
|
—
|
|
—
|
|
—
|
|
295.3
|
|
|||||||||||
|
Deferred income taxes
|
58.1
|
|
—
|
|
—
|
|
—
|
|
—
|
|
58.1
|
|
|||||||||||
|
Other current assets
|
99.0
|
|
—
|
|
—
|
|
—
|
|
—
|
|
99.0
|
|
|||||||||||
|
Total Current Assets
|
2,294.4
|
|
873.0
|
|
(511.8
|
)
|
(1,370.6
|
)
|
—
|
|
1,285.0
|
|
|||||||||||
|
Properties and equipment, net of accumulated depreciation and amortization of $1,876.8
|
829.9
|
|
—
|
|
—
|
|
—
|
|
—
|
|
829.9
|
|
|||||||||||
|
Goodwill
|
457.5
|
|
—
|
|
—
|
|
—
|
|
—
|
|
457.5
|
|
|||||||||||
|
Technology and other intangible assets, net
|
315.5
|
|
—
|
|
—
|
|
—
|
|
—
|
|
315.5
|
|
|||||||||||
|
Deferred income taxes:
|
|
|
|||||||||||||||||||||
|
Net operating loss carryforward
|
—
|
|
—
|
|
111.0
|
|
141.2
|
|
—
|
|
252.2
|
|
|||||||||||
|
Temporary differences
|
845.9
|
|
—
|
|
(111.0
|
)
|
(134.1
|
)
|
—
|
|
600.8
|
|
|||||||||||
|
Asbestos-related insurance
|
500.0
|
|
—
|
|
(500.0
|
)
|
—
|
|
—
|
|
—
|
|
|||||||||||
|
Overfunded defined benefit pension plans
|
16.7
|
|
—
|
|
—
|
|
—
|
|
—
|
|
16.7
|
|
|||||||||||
|
Investment in unconsolidated affiliate
|
96.2
|
|
—
|
|
—
|
|
—
|
|
—
|
|
96.2
|
|
|||||||||||
|
Other assets
|
40.0
|
|
27.0
|
|
—
|
|
—
|
|
—
|
|
67.0
|
|
|||||||||||
|
Total Assets
|
$
|
5,396.1
|
|
$
|
900.0
|
|
$
|
(1,011.8
|
)
|
$
|
(1,363.5
|
)
|
$
|
—
|
|
$
|
3,920.8
|
|
|||||
|
LIABILITIES AND EQUITY
|
|||||||||||||||||||||||
|
Liabilities Not Subject to Compromise
|
|||||||||||||||||||||||
|
Current Liabilities
|
|||||||||||||||||||||||
|
Debt payable within one year
|
$
|
76.6
|
|
$
|
9.0
|
|
$
|
—
|
|
$
|
—
|
|
$
|
—
|
|
$
|
85.6
|
|
|||||
|
Debt payable—unconsolidated affiliate
|
4.5
|
|
—
|
|
—
|
|
—
|
|
—
|
|
4.5
|
|
|||||||||||
|
Accounts payable
|
249.5
|
|
—
|
|
—
|
|
—
|
|
—
|
|
249.5
|
|
|||||||||||
|
Accounts payable—unconsolidated affiliate
|
13.0
|
|
—
|
|
—
|
|
—
|
|
—
|
|
13.0
|
|
|||||||||||
|
PI warrant liability
|
—
|
|
—
|
|
490.0
|
|
—
|
|
—
|
|
490.0
|
|
|||||||||||
|
Other current liabilities
|
292.0
|
|
—
|
|
—
|
|
7.2
|
|
38.8
|
|
338.0
|
|
|||||||||||
|
Total Current Liabilities
|
635.6
|
|
9.0
|
|
490.0
|
|
7.2
|
|
38.8
|
|
1,180.6
|
|
|||||||||||
|
Debt payable after one year
|
5.3
|
|
891.0
|
|
—
|
|
—
|
|
—
|
|
896.3
|
|
|||||||||||
|
Debt payable—unconsolidated affiliate
|
24.3
|
|
—
|
|
—
|
|
—
|
|
—
|
|
24.3
|
|
|||||||||||
|
Deferred payment obligations
|
—
|
|
—
|
|
594.5
|
|
—
|
|
—
|
|
594.5
|
|
|||||||||||
|
Deferred income taxes
|
18.2
|
|
—
|
|
—
|
|
—
|
|
—
|
|
18.2
|
|
|||||||||||
|
Income tax contingencies
|
—
|
|
—
|
|
—
|
|
—
|
|
76.6
|
|
76.6
|
|
|||||||||||
|
Underfunded defined benefit pension plans
|
66.2
|
|
—
|
|
—
|
|
—
|
|
—
|
|
66.2
|
|
|||||||||||
|
Unfunded pay-as-you-go defined benefit pension plans
|
233.4
|
|
—
|
|
—
|
|
—
|
|
95.9
|
|
329.3
|
|
|||||||||||
|
Other liabilities
|
65.8
|
|
—
|
|
—
|
|
—
|
|
105.2
|
|
171.0
|
|
|||||||||||
|
Total Liabilities Not Subject to Compromise
|
1,048.8
|
|
900.0
|
|
1,084.5
|
|
7.2
|
|
316.5
|
|
3,357.0
|
|
|||||||||||
|
Liabilities Subject to Compromise
|
|||||||||||||||||||||||
|
Debt plus accrued interest
|
1,137.8
|
|
—
|
|
—
|
|
(1,135.7
|
)
|
(2.1
|
)
|
—
|
|
|||||||||||
|
Income tax contingencies
|
76.6
|
|
—
|
|
—
|
|
—
|
|
(76.6
|
)
|
—
|
|
|||||||||||
|
Asbestos-related contingencies
|
2,092.4
|
|
—
|
|
(2,084.1
|
)
|
—
|
|
(8.3
|
)
|
—
|
|
|||||||||||
|
Environmental contingencies
|
134.5
|
|
—
|
|
—
|
|
(77.5
|
)
|
(57.0
|
)
|
—
|
|
|||||||||||
|
Postretirement benefits
|
176.3
|
|
—
|
|
—
|
|
(27.7
|
)
|
(148.6
|
)
|
—
|
|
|||||||||||
|
Other liabilities and accrued interest
|
158.5
|
|
—
|
|
(12.2
|
)
|
(122.4
|
)
|
(23.9
|
)
|
—
|
|
|||||||||||
|
Total Liabilities Subject to Compromise
|
3,776.1
|
|
—
|
|
(2,096.3
|
)
|
(1,363.3
|
)
|
(316.5
|
)
|
—
|
|
|||||||||||
|
Total Liabilities
|
4,824.9
|
|
900.0
|
|
(1,011.8
|
)
|
(1,356.1
|
)
|
—
|
|
3,357.0
|
|
|||||||||||
|
Equity
|
|||||||||||||||||||||||
|
Common stock issued, par value $0.01; 300,000,000 shares authorized; outstanding: 77,046,143 (2012—75,565,409)
|
0.8
|
|
—
|
|
—
|
|
—
|
|
—
|
|
0.8
|
|
|||||||||||
|
Paid-in capital
|
533.4
|
|
—
|
|
—
|
|
—
|
|
—
|
|
533.4
|
|
|||||||||||
|
Retained earnings
|
15.8
|
|
—
|
|
—
|
|
(7.4
|
)
|
—
|
|
8.4
|
|
|||||||||||
|
Treasury stock, at cost: shares: 0 (2012—1,414,351)
|
—
|
|
—
|
|
—
|
|
—
|
|
—
|
|
—
|
|
|||||||||||
|
Accumulated other comprehensive loss
|
10.6
|
|
—
|
|
—
|
|
—
|
|
—
|
|
10.6
|
|
|||||||||||
|
Total W. R. Grace & Co. Shareholders' Equity
|
560.6
|
|
—
|
|
—
|
|
(7.4
|
)
|
—
|
|
553.2
|
|
|||||||||||
|
Noncontrolling interests
|
10.6
|
|
—
|
|
—
|
|
—
|
|
—
|
|
10.6
|
|
|||||||||||
|
Total Equity
|
571.2
|
|
—
|
|
—
|
|
(7.4
|
)
|
—
|
|
563.8
|
|
|||||||||||
|
Total Liabilities and Equity
|
$
|
5,396.1
|
|
$
|
900.0
|
|
$
|
(1,011.8
|
)
|
$
|
(1,363.5
|
)
|
$
|
—
|
|
$
|
3,920.8
|
|
|||||
F-30
Inventories are stated at the lower of cost or market, and cost is determined using FIFO. Inventories consisted of the following at
December 31, 2013
and
2012
:
|
|
December 31,
|
||||||
|
(In millions)
|
2013
|
2012
|
|||||
|
Raw materials
|
$
|
69.7
|
|
$
|
66.5
|
|
|
|
In process
|
41.8
|
|
46.1
|
|
|||
|
Finished products
|
152.4
|
|
138.8
|
|
|||
|
Other
|
31.4
|
|
32.2
|
|
|||
|
$
|
295.3
|
|
$
|
283.6
|
|
||
5. Properties and Equipment
|
|
December 31,
|
||||||
|
(In millions)
|
2013
|
2012
|
|||||
|
Land
|
$
|
20.0
|
|
$
|
19.9
|
|
|
|
Buildings
|
524.3
|
|
500.3
|
|
|||
|
Information technology and equipment
|
172.0
|
|
146.7
|
|
|||
|
Machinery, equipment and other
|
1,883.2
|
|
1,786.8
|
|
|||
|
Projects under construction
|
107.2
|
|
101.9
|
|
|||
|
Properties and equipment, gross
|
2,706.7
|
|
2,555.6
|
|
|||
|
Accumulated depreciation and amortization
|
(1,876.8
|
)
|
(1,785.1
|
)
|
|||
|
Properties and equipment, net
|
$
|
829.9
|
|
$
|
770.5
|
|
|
Capitalized interest costs amounted to
$1.2 million
,
$0.1 million
, and
$0.1 million
in
2013
,
2012
, and
2011
, respectively. Depreciation and lease amortization expense relating to properties and equipment amounted to
$108.6 million
,
$108.2 million
, and
$110.0 million
in
2013
,
2012
, and
2011
, respectively. Grace's rental expense for operating leases amounted to
$28.4 million
,
$26.1 million
, and
$20.5 million
in
2013
,
2012
, and
2011
, respectively.
At
December 31, 2013
, minimum future non-cancelable payments for operating leases are:
|
|
(In millions)
|
||
|
2014
|
$
|
22.8
|
|
|
2015
|
17.3
|
|
|
|
2016
|
13.4
|
|
|
|
2017
|
7.9
|
|
|
|
2018
|
4.8
|
|
|
|
Thereafter
|
18.7
|
|
|
|
$
|
84.9
|
|
|
The above minimum non-cancelable lease payments are net of anticipated sublease income of
$0.8 million
in
2014
,
$0.7 million
in
2015
,
$0.4 million
in
2016
,
$0.2 million
in
2017
,
$0.1 million
in
2018
and
$0.1 million
thereafter.
F-31
In 2013, Grace completed
two
business combinations for total consideration of
$526.2 million
as follows:
|
•
|
In April 2013, Grace acquired the assets of Chemind Construction Products, a privately held specialty manufacturer and distributor of waterproofing coatings technologies and materials for the design and construction industry.
|
|
•
|
In December 2013, Grace acquired the assets of the UNIPOL
®
Polypropylene Process Technology Licensing and Catalysts business of The Dow Chemical Company. The acquisition is complementary to Grace's specialty catalysts business and significantly enhances the company’s position as a leading supplier of polyolefin catalysts and technologies.
|
The purchase price for the acquisitions was allocated to the tangible and identifiable intangible assets acquired and liabilities assumed based on their estimated fair values at the acquisition date in accordance with ASC 805 "Business Combinations".
|
|
(In millions)
|
||
|
Tangible assets
|
$
|
55.8
|
|
|
Goodwill
|
262.9
|
|
|
|
Intangible assets
|
247.6
|
|
|
|
Liabilities assumed
|
(40.1
|
)
|
|
|
Net assets acquired, net of cash acquired
|
$
|
526.2
|
|
The table below presents the assets acquired and liabilities assumed as part of the acquisition of the UNIPOL
®
licensing and related catalyst business. The excess of the purchase price over the fair value of the tangible net assets and intangible assets acquired was recorded as goodwill. The goodwill recognized is attributable to the expected growth and operating synergies that Grace expects to realize from this acquisition. Goodwill generated from the acquisition will be deductible for tax purposes.
|
|
(In millions)
|
||
|
Trade accounts receivable
|
$
|
10.5
|
|
|
Inventories
|
22.6
|
|
|
|
Properties and equipment
|
18.4
|
|
|
|
Goodwill
|
253.2
|
|
|
|
Intangible assets
|
243.0
|
|
|
|
Current deferred revenue
|
(14.3
|
)
|
|
|
Noncurrent deferred revenue
|
(23.0
|
)
|
|
The table below presents the intangible assets acquired as part of the acquisition of the UNIPOL
®
licensing and related catalyst business and the periods over which they will be amortized.
|
|
Amount
(In millions)
|
Weighted Average Amortization Period
(in years)
|
|||
|
Technology
|
$
|
205.3
|
|
20.9
|
|
|
Trademarks
|
11.9
|
|
30.0
|
||
|
Customer Lists
|
10.6
|
|
20.0
|
||
|
Other
|
15.2
|
|
17.0
|
||
|
Total
|
$
|
243.0
|
|
20.9
|
|
F-32
Notes to Consolidated Financial Statements (Continued)
6. Acquisitions (Continued)
Pro forma information is not presented for the UNIPOL
®
licensing and related catalyst business as the acquisition is not material to the Company. In the month of December, Grace recorded
$5.2 million
in sales related to the acquisition and earnings of
$0.6 million
before
$8.6 million
of acquisition, integration, and transition costs.
7. Goodwill and Other Intangible Assets
The carrying amount of goodwill attributable to each operating segment and the changes in those balances during the year ended
December 31, 2013
, are as follows:
|
(In millions)
|
Grace Catalysts Technologies
|
Grace Materials Technologies
|
Grace
Construction
Products
|
Total
Grace
|
|||||||||||
|
Balance, December 31, 2012
|
$
|
39.5
|
|
$
|
40.5
|
|
$
|
116.7
|
|
$
|
196.7
|
|
|||
|
Goodwill acquired during the year
|
253.2
|
|
—
|
|
9.7
|
|
262.9
|
|
|||||||
|
Foreign currency translation/other adjustments
|
0.7
|
|
0.7
|
|
(3.5
|
)
|
(2.1
|
)
|
|||||||
|
Balance, December 31, 2013
|
$
|
293.4
|
|
$
|
41.2
|
|
$
|
122.9
|
|
$
|
457.5
|
|
|||
Grace's net book value of other intangible assets at
December 31, 2013
and
2012
, was
$315.5 million
and
$82.7 million
, respectively, detailed as follows:
|
|
As of December 31, 2013
|
||||||
|
(In millions)
|
Gross Carrying
Amount
|
Accumulated
Amortization
|
|||||
|
Technology
|
$
|
260.0
|
|
$
|
37.8
|
|
|
|
Customer lists
|
94.9
|
|
43.7
|
|
|||
|
Trademarks
|
36.9
|
|
14.0
|
|
|||
|
Other
|
22.4
|
|
3.2
|
|
|||
|
Total
|
$
|
414.2
|
|
$
|
98.7
|
|
|
|
|
As of December 31, 2012
|
||||||
|
(In millions)
|
Gross Carrying
Amount
|
Accumulated
Amortization
|
|||||
|
Customer lists
|
$
|
81.6
|
|
$
|
37.9
|
|
|
|
Technology
|
54.6
|
|
32.6
|
|
|||
|
Trademarks
|
24.6
|
|
12.2
|
|
|||
|
Other
|
8.8
|
|
4.2
|
|
|||
|
Total
|
$
|
169.6
|
|
$
|
86.9
|
|
|
Total indefinite-lived trademarks, included above, at
December 31, 2013
and
2012
, were
$4.9 million
and
$4.8 million
, respectively. Amortization expense related to intangible assets amounted to
$12.7 million
,
$10.7 million
, and
$10.0 million
in
2013
,
2012
, and
2011
, respectively.
F-33
Notes to Consolidated Financial Statements (Continued)
7. Goodwill and Other Intangible Assets (Continued)
At
December 31, 2013
, estimated future annual amortization expenses for intangible assets are:
|
|
(In millions)
|
||
|
2014
|
$
|
24.0
|
|
|
2015
|
22.4
|
|
|
|
2016
|
18.6
|
|
|
|
2017
|
17.3
|
|
|
|
2018
|
17.0
|
|
|
|
Thereafter
|
211.3
|
|
|
|
Total estimated amortization expenses
|
$
|
310.6
|
|
8. Debt
Components of Debt
|
(In millions)
|
2013
|
2012
|
|||||
|
Debt payable within one year(1)
|
$
|
76.6
|
|
$
|
83.4
|
|
|
|
Debt payable after one year
|
$
|
5.3
|
|
$
|
13.4
|
|
|
|
Debt Subject to Compromise(2)
|
|
|
|||||
|
Bank borrowings(3)
|
$
|
500.0
|
|
$
|
500.0
|
|
|
|
Accrued interest on bank borrowings
|
471.0
|
|
437.2
|
|
|||
|
Default interest settlement(4)
|
129.0
|
|
—
|
|
|||
|
Drawn letters of credit(5)
|
26.7
|
|
26.5
|
|
|||
|
Accrued interest on drawn letters of credit
|
11.1
|
|
9.6
|
|
|||
|
$
|
1,137.8
|
|
$
|
973.3
|
|
||
|
Full-year weighted average interest rates on total debt
|
3.6
|
%
|
3.5
|
%
|
|||
_______________________________________________________________________________
|
(1)
|
Represents borrowings under various lines of credit and other borrowings, primarily by non-U.S. subsidiaries. At
December 31, 2013
, the fair value of Grace's debt payable within one year not subject to compromise approximated the recorded value of
$76.6 million
.
|
|
(2)
|
At
December 31, 2013
, the carrying value of Grace's bank debt subject to compromise plus interest was
$1,137.8 million
. The estimated fair value of the bank debt approximates the carrying value and is estimated using Level 2 inputs. These amounts were paid in full on February 3, 2014.
|
|
(3)
|
Under bank revolving credit agreements in effect prior to the Filing, Grace could borrow up to
$500 million
at interest rates based upon the prevailing prime, federal funds and/or Eurodollar rates. Of that amount,
$250 million
was available under short-term facilities that expired in May 2001, and
$250 million
was available under a long-term facility that expired in May 2003. As a result of the Filing, Grace was not permitted to make payments under the bank revolving credit agreements, and accordingly, the balance as of the Filing Date was reclassified to debt subject to compromise in the Consolidated Balance Sheets.
|
|
(4)
|
On
December 31, 2013
, Grace entered into an agreement to settle the final appeal pending in its Chapter 11 bankruptcy with the holders of the company’s pre-petition bank debt (the “Bank Lenders”). The settlement calls for Grace to pay the Bank Lenders
$129.0 million
, plus interest from
December 31, 2013
, in addition to the distributions provided in the Joint Plan.
|
|
(5)
|
Amounts drawn on letters of credit pursuant to settled but unpaid claims.
|
Fair value is determined based on expected future cash flows (discounted at market interest rates), quotes from financial institutions and other appropriate valuation methodologies.
F-34
On February 3, 2014, Grace entered into a Credit Agreement (the "Credit Agreement") in connection with its exit financing. The Credit Agreement provides for:
|
(a)
|
a
$400 million
revolving credit facility due in 2019, with interest at LIBOR +
175
bps;
|
|
(b)
|
a
$700 million
term loan due in 2021, with interest at LIBOR +
225
bps with a
75
bps floor;
|
|
(c)
|
a
€150 million
term loan due in 2021 with interest at EURIBOR +
250
bps with a
75
bps floor; and
|
|
(d)
|
a
$250 million
delayed draw term loan facility available for
12 months
, with amounts drawn due in 2021, with interest at LIBOR +
225
bps with a
75
bps floor.
|
The term loans will amortize in equal monthly installments in aggregate annual amounts equal to
1.00%
of the original principal amount thereof.
The Credit Agreement contains customary affirmative covenants, including, but not limited to (i) maintenance of legal existence and compliance with laws and regulations; (ii) delivery of consolidated financial statements and other information; (iii) payment of taxes; (iv) delivery of notices of defaults and certain other material events; and (v) maintenance of adequate insurance. The Credit Agreement also contains customary negative covenants, including but not limited to restrictions on (i) dividends on, and redemptions of, equity interests and other restricted payments; (ii) liens; (iii) loans and investments; (iv) the sale, transfer or disposition of assets and businesses; (vi) transactions with affiliates; and (vii) a maximum total leverage ratio.
Events of default under the Credit Agreement include, but are not limited to: (i) failure to pay principal, interest, fees or other amounts under the Credit Agreement when due, taking into account any applicable grace period; (ii) any representation or warranty proving to have been incorrect in any material respect when made; (iii) failure to perform or observe covenants or other terms of the Credit Agreement subject to certain grace periods; (iv) a cross-default and cross-acceleration with certain other material debt; (v) bankruptcy events; (vi) certain defaults under ERISA; and (vii) the invalidity or impairment of security interests.
To secure its obligations under the Credit Agreement, the Company has granted security interests in the shares of its Grace-Conn. and Alltech Associates subsidiaries, substantially all of its U.S. non-real estate assets and property, and certain U.S. real estate.
This summary of the Credit Agreement does not purport to be complete and is qualified in its entirety by reference to the full text of such agreement, a copy of which has been filed with the SEC.
9. Fair Value Measurements and Risk
Certain of Grace's assets and liabilities are reported at fair value on a gross basis. ASC 820 defines fair value as the value that would be received at the measurement date in the principal or "most advantageous" market. Grace uses principal market data, whenever available, to value assets and liabilities that are required to be reported at fair value.
Grace has identified the following financial assets and liabilities that are subject to the fair value analysis required by ASC 820:
Fair Value of Debt and Other Financial Instruments
See Note 8 for a discussion of the fair value of Grace's debt. At
December 31, 2013
, the recorded values of other financial instruments such as cash equivalents and trade receivables and payables approximated their fair values, based on the short-term maturities and floating rate characteristics of these instruments.
Derivatives
From time to time, Grace enters into commodity derivatives such as fixed-rate swaps or options with financial institutions to mitigate the risk of volatility of prices of natural gas or other commodities. Under fixed-rate swaps, Grace locks in a fixed rate with a financial institution for future purchases, purchases its commodity from a supplier at the prevailing market rate, and then settles with the bank for any difference in the rates, thereby "swapping" a variable rate for a fixed rate.
The valuation of Grace's fixed-rate natural gas swaps was determined using a market approach, based on natural gas futures trading prices quoted on the New York Mercantile Exchange. Commodity fixed-rate swaps with
F-35
Notes to Consolidated Financial Statements (Continued)
9. Fair Value Measurements and Risk (Continued)
maturities of not more than
12 months
are used and designated as cash flow hedges of forecasted purchases of natural gas. Current open contracts hedge forecasted transactions until March 2014. The effective portion of the gain or loss on the commodity contracts is recorded in "accumulated other comprehensive income" and reclassified into income in the same period or periods that the underlying commodity purchase affects income. At
December 31, 2013
, the contract volume, or notional amount, of the commodity contracts was
0.3 million
MMBtu (million British thermal units) with a total contract value of
$1.2 million
.
The valuation of Grace's natural gas call options was determined using a market approach, based on the strike price of the options and the natural gas futures trading prices quoted on the New York Mercantile Exchange. Commodity option contracts with maturities of not more than
24 months
are used and designated as cash flow hedges of forecasted purchases of natural gas. Current open option contracts hedge forecasted transactions until June 2015. The effective portion of the gain or loss on the commodity contracts is recorded in "accumulated other comprehensive income" and reclassified into income in the same period or periods that the underlying purchases affect income. At
December 31, 2013
, the contract volume, or notional amount, of the commodity option contracts was
7.1 million
MMBtu and the natural gas futures trading price of option contracts was less than the strike price.
The valuation of Grace's fixed-rate aluminum swaps was determined using a market approach, based on aluminum futures trading prices quoted on the London Metal Exchange. Commodity fixed-rate swaps with maturities of not more than
12 months
are used and designated as cash flow hedges of forecasted purchases of aluminum. Current open contracts hedge forecasted transactions until December 2014. The effective portion of the gain or loss on the commodity contracts is recorded in "accumulated other comprehensive income" and reclassified into income in the same period or periods that the underlying commodity purchase affects income. At
December 31, 2013
, the contract volume, or notional amount, of the commodity contracts was
1.4 million
pounds with a total contract value of
$1.2 million
.
Because Grace does business in over
40
countries and in more than
50
currencies, results are exposed to fluctuations in currency exchange rates. Grace seeks to minimize exposure to these fluctuations by matching sales in volatile currencies with expenditures in the same currencies, but it is not always possible to do so. From time to time Grace will use financial instruments such as currency forward contracts, options, or combinations of the two to reduce the risk of certain specific transactions. However, Grace does not have a policy of hedging all exposures, because management does not believe that such a level of hedging would be cost-effective.
The valuation of Grace's currency exchange rate forward contracts is determined using both a market approach and an income approach. Inputs used to value currency exchange rate forward contracts consist of: (1) spot rates, which are quoted by various financial institutions; (2) forward points, which are primarily affected by changes in interest rates; and (3) discount rates used to present value future cash flows, which are based on the London Interbank Offered Rate (LIBOR) curve or overnight indexed swap rates.
In November 2007, Grace purchased currency forward contracts to mitigate the effect of currency risk with respect to intercompany loans between its principal U.S. subsidiary and a German subsidiary. As of
December 31, 2013
, the total notional amount related to the remaining outstanding currency forward contracts was
€194.5 million
. These derivatives are not designated as hedging instruments under ASC 815. These contracts were settled upon Grace's emergence from bankruptcy.
F-36
Notes to Consolidated Financial Statements (Continued)
9. Fair Value Measurements and Risk (Continued)
The following tables present the fair value hierarchy for financial assets and liabilities measured at fair value on a recurring basis as of
December 31, 2013
and
2012
:
|
|
Fair Value Measurements at December 31, 2013 Using
|
||||||||||||||
|
Items Measured at Fair Value on a Recurring Basis
(In millions)
|
Total
|
Quoted Prices in
Active Markets
for Identical
Assets or
Liabilities
(Level 1)
|
Significant
Other
Observable
Inputs
(Level 2)
|
Significant
Unobservable
Inputs
(Level 3)
|
|||||||||||
|
Assets
|
|
|
|
|
|||||||||||
|
Currency derivatives
|
$
|
2.1
|
|
$
|
—
|
|
$
|
2.1
|
|
$
|
—
|
|
|||
|
Commodity derivatives
|
—
|
|
—
|
|
—
|
|
—
|
|
|||||||
|
Total Assets
|
$
|
2.1
|
|
$
|
—
|
|
$
|
2.1
|
|
$
|
—
|
|
|||
|
Liabilities
|
|
|
|
|
|||||||||||
|
Currency derivatives
|
$
|
6.9
|
|
$
|
—
|
|
$
|
6.9
|
|
$
|
—
|
|
|||
|
Commodity derivatives
|
0.1
|
|
—
|
|
0.1
|
|
—
|
|
|||||||
|
Total Liabilities
|
$
|
7.0
|
|
$
|
—
|
|
$
|
7.0
|
|
$
|
—
|
|
|||
|
|
Fair Value Measurements at December 31, 2012 Using
|
||||||||||||||
|
Items Measured at Fair Value on a Recurring Basis
(In millions)
|
Total
|
Quoted Prices in
Active Markets
for Identical
Assets or
Liabilities
(Level 1)
|
Significant
Other
Observable
Inputs
(Level 2)
|
Significant
Unobservable
Inputs
(Level 3)
|
|||||||||||
|
Assets
|
|
|
|
|
|||||||||||
|
Currency derivatives
|
$
|
1.2
|
|
$
|
—
|
|
$
|
1.2
|
|
$
|
—
|
|
|||
|
Commodity derivatives
|
0.2
|
|
—
|
|
0.2
|
|
—
|
|
|||||||
|
Total Assets
|
$
|
1.4
|
|
$
|
—
|
|
$
|
1.4
|
|
$
|
—
|
|
|||
|
Liabilities
|
|
|
|
|
|||||||||||
|
Currency derivatives
|
$
|
5.1
|
|
$
|
—
|
|
$
|
5.1
|
|
$
|
—
|
|
|||
|
Commodity derivatives
|
0.4
|
|
—
|
|
0.4
|
|
—
|
|
|||||||
|
Total Liabilities
|
$
|
5.5
|
|
$
|
—
|
|
$
|
5.5
|
|
$
|
—
|
|
|||
The following tables present the location and fair values of derivative instruments included in the Consolidated Balance Sheets as of
December 31, 2013
and
2012
:
|
|
Asset Derivatives
|
Liability Derivatives
|
|||||||||
|
Fair Values of Derivative Instruments at December 31, 2013
(In millions)
|
Balance Sheet
Location
|
Fair
Value
|
Balance Sheet
Location
|
Fair
Value
|
|||||||
|
Derivatives designated as hedging instruments under ASC 815:
|
|
|
|
|
|||||||
|
Commodity contracts
|
Other current assets
|
$
|
—
|
|
Other current liabilities
|
$
|
0.1
|
|
|||
|
Currency contracts
|
Other current assets
|
1.0
|
|
Other current liabilities
|
—
|
|
|||||
|
Currency contracts
|
Other assets
|
1.0
|
|
Other liabilities
|
—
|
|
|||||
|
Derivatives not designated as hedging instruments under ASC 815:
|
|
|
|||||||||
|
Currency contracts
|
Other current assets
|
0.1
|
|
Other current liabilities
|
6.9
|
|
|||||
|
Total derivatives
|
|
$
|
2.1
|
|
|
$
|
7.0
|
|
|||
F-37
Notes to Consolidated Financial Statements (Continued)
9. Fair Value Measurements and Risk (Continued)
|
|
Asset Derivatives
|
Liability Derivatives
|
|||||||||
|
Fair Values of Derivative Instruments at December 31, 2012
(In millions)
|
Balance Sheet
Location
|
Fair
Value
|
Balance Sheet
Location
|
Fair
Value
|
|||||||
|
Derivatives designated as hedging instruments under ASC 815:
|
|
|
|
|
|||||||
|
Commodity contracts
|
Other current assets
|
$
|
0.2
|
|
Other current liabilities
|
$
|
0.4
|
|
|||
|
Currency contracts
|
Other current assets
|
1.2
|
|
Other current liabilities
|
0.2
|
|
|||||
|
Derivatives not designated as hedging instruments under ASC 815:
|
|
|
|
|
|||||||
|
Currency contracts
|
Other current assets
|
—
|
|
Other current liabilities
|
4.9
|
|
|||||
|
Total derivatives
|
|
$
|
1.4
|
|
|
$
|
5.5
|
|
|||
The following tables present the location and amount of gains and losses on derivative instruments included in the Consolidated Statements of Operations or, when applicable, gains and losses initially recognized in other comprehensive income (loss) ("OCI") for the years ended
December 31, 2013
,
2012
, and
2011
:
|
The Effect of Derivative Instruments on the Consolidated Statement of Operations for the Year Ended December 31, 2013
(In millions)
|
Amount of Gain
or (Loss)
Recognized in
OCI on Derivatives
(Effective Portion)
|
Location of Gain
or (Loss)
Reclassified from
Accumulated OCI
into Income
(Effective Portion)
|
Amount of Gain
or (Loss)
Reclassified from
Accumulated OCI
into Income
(Effective Portion)
|
||||||
|
Derivatives in ASC 815 cash flow hedging relationships:
|
|
|
|
||||||
|
Currency contracts
|
$
|
2.0
|
|
Other expense
|
$
|
2.4
|
|
||
|
Currency contracts
|
(0.2
|
)
|
Cost of goods sold
|
(0.2
|
)
|
||||
|
Commodity contracts
|
(0.3
|
)
|
Cost of goods sold
|
(0.4
|
)
|
||||
|
Total derivatives
|
$
|
1.5
|
|
|
$
|
1.8
|
|
||
|
Location of Gain
or (Loss)
Recognized in
Income on
Derivatives
|
Amount of Gain
or (Loss)
Recognized in
Income on
Derivatives
|
||||||||
|
Derivatives not designated as hedging instruments under ASC 815:
|
|||||||||
|
Currency contracts
|
Other expense
|
$
|
(10.9
|
)
|
|||||
|
The Effect of Derivative Instruments on the Consolidated Statement of Operations for the Year Ended December 31, 2012
(In millions)
|
Amount of Gain
or (Loss)
Recognized in
OCI on Derivatives
(Effective Portion)
|
Location of Gain
or (Loss)
Reclassified from
Accumulated OCI
into Income
(Effective Portion)
|
Amount of Gain
or (Loss)
Reclassified from
Accumulated OCI
into Income
(Effective Portion)
|
||||||
|
Derivatives in ASC 815 cash flow hedging relationships:
|
|
|
|
||||||
|
Currency contracts
|
$
|
1.4
|
|
Other expense
|
$
|
1.6
|
|
||
|
Currency contracts
|
0.2
|
|
Cost of goods sold
|
(0.1
|
)
|
||||
|
Commodity contracts
|
(2.3
|
)
|
Cost of goods sold
|
(5.9
|
)
|
||||
|
Total derivatives
|
$
|
(0.7
|
)
|
|
$
|
(4.4
|
)
|
||
|
Location of Gain
or (Loss)
Recognized in
Income on
Derivatives
|
Amount of Gain
or (Loss)
Recognized in
Income on
Derivatives
|
||||||||
|
Derivatives not designated as hedging instruments under ASC 815:
|
|||||||||
|
Currency contracts
|
Other expense
|
$
|
(4.4
|
)
|
|||||
F-38
Notes to Consolidated Financial Statements (Continued)
9. Fair Value Measurements and Risk (Continued)
|
The Effect of Derivative Instruments on the Consolidated Statement of Operations for the Year Ended December 31, 2011
(In millions)
|
Amount of Gain
or (Loss)
Recognized in
OCI on Derivatives
(Effective Portion)
|
Location of Gain
or (Loss)
Reclassified from
Accumulated OCI
into Income
(Effective Portion)
|
Amount of Gain
or (Loss)
Reclassified from
Accumulated OCI
into Income
(Effective Portion)
|
||||||
|
Derivatives in ASC 815 cash flow hedging relationships:
|
|
|
|
||||||
|
Currency contracts
|
$
|
(0.2
|
)
|
Cost of goods sold
|
$
|
0.1
|
|
||
|
Commodity contracts
|
(5.7
|
)
|
Cost of goods sold
|
(2.8
|
)
|
||||
|
Total derivatives
|
$
|
(5.9
|
)
|
|
$
|
(2.7
|
)
|
||
|
Location of Gain
or (Loss)
Recognized in
Income on
Derivatives
|
Amount of Gain
or (Loss)
Recognized in
Income on
Derivatives
|
||||||||
|
Derivatives not designated as hedging instruments under ASC 815:
|
|||||||||
|
Currency contracts
|
Other expense
|
$
|
9.0
|
|
|||||
Debt and Interest Rate Swap Agreements
Grace was not a party to any debt or interest rate swaps at
December 31, 2013
and
2012
. However, in connection with emergence financing, Grace entered into an interest rate swap beginning on February 3, 2015, and maturing on February 3, 2020, fixing
$250 million
of term debt at
4.643%
.
Credit Risk
Grace is exposed to credit risk in its trade accounts receivable. Customers in the petroleum refining and construction industries represent the greatest exposure. Grace's credit evaluation policies, relatively short collection terms and history of minimal credit losses mitigate credit risk exposures. Grace does not generally require collateral for its trade accounts receivable, but may require a bank letter of credit in certain instances, particularly when selling to customers in cash restricted countries.
Grace may also be exposed to credit risk in its derivatives contracts. Grace monitors counterparty credit risk and currently does not anticipate nonperformance by its derivatives counterparties. Grace's derivatives contracts are with internationally recognized commercial financial institutions.
F-39
Provision for Income Taxes
The components of income from consolidated operations before income taxes and the related provision for income taxes for
2013
,
2012
, and
2011
are as follows:
Income Taxes—Consolidated Operations
|
(In millions)
|
2013
|
2012
|
2011
|
||||||||
|
Income (loss) before income taxes:
|
|
|
|
||||||||
|
Domestic
|
$
|
141.4
|
|
$
|
(170.3
|
)
|
$
|
107.7
|
|
||
|
Foreign
|
219.2
|
|
149.7
|
|
199.3
|
|
|||||
|
Total
|
$
|
360.6
|
|
$
|
(20.6
|
)
|
$
|
307.0
|
|
||
|
Benefit from (provision for) income taxes:
|
|
|
|
||||||||
|
Federal—current
|
$
|
1.4
|
|
$
|
(51.2
|
)
|
$
|
16.7
|
|
||
|
Federal—deferred
|
(73.1
|
)
|
82.0
|
|
(49.3
|
)
|
|||||
|
State and local—current
|
(0.7
|
)
|
(4.4
|
)
|
(2.3
|
)
|
|||||
|
State and local—deferred
|
38.2
|
|
70.2
|
|
—
|
|
|||||
|
Foreign—current
|
(83.5
|
)
|
(43.1
|
)
|
(52.5
|
)
|
|||||
|
Foreign—deferred
|
14.8
|
|
8.1
|
|
(0.5
|
)
|
|||||
|
Total
|
$
|
(102.9
|
)
|
$
|
61.6
|
|
$
|
(87.9
|
)
|
||
The preceding allocation of income between jurisdictions does not reflect
$25.9 million
,
$22.1 million
, and
$30.1 million
of domestic income resulting from repatriated earnings in
2013
,
2012
, and
2011
, respectively.
The difference between the provision for income taxes at the U.S. federal income tax rate of
35%
and Grace's overall income tax provision is summarized as follows:
Income Tax Provision Analysis
|
(In millions)
|
2013
|
2012
|
2011
|
||||||||
|
Tax benefit (provision) at U.S. federal income tax rate
|
$
|
(126.2
|
)
|
$
|
7.2
|
|
$
|
(107.4
|
)
|
||
|
Change in benefit (provision) resulting from:
|
|
|
|
||||||||
|
Release of state valuation allowance
|
24.4
|
|
44.0
|
|
—
|
|
|||||
|
Effect of tax rates in foreign jurisdictions
|
16.6
|
|
14.9
|
|
17.6
|
|
|||||
|
Benefits from domestic production activities
|
—
|
|
14.0
|
|
0.9
|
|
|||||
|
Nontaxable income/non-deductible expenses
|
(9.7
|
)
|
(8.1
|
)
|
(7.3
|
)
|
|||||
|
U.S. taxes on repatriated foreign earnings
|
3.7
|
|
(2.2
|
)
|
(1.1
|
)
|
|||||
|
State and local income taxes, net of federal income tax
|
(0.7
|
)
|
0.1
|
|
(1.5
|
)
|
|||||
|
Adjustments to uncertain tax positions and other items
|
(11.0
|
)
|
(8.3
|
)
|
10.9
|
|
|||||
|
Benefit from (provision for) income taxes
|
$
|
(102.9
|
)
|
$
|
61.6
|
|
$
|
(87.9
|
)
|
||
F-40
Notes to Consolidated Financial Statements (Continued)
10. Income Taxes (Continued)
Deferred Tax Assets and Liabilities
At
December 31, 2013
and
2012
, the tax attributes giving rise to deferred tax assets and liabilities consisted of the following items:
Deferred Tax Analysis
|
(In millions)
|
2013
|
2012
|
|||||
|
Deferred tax assets:
|
|
|
|||||
|
Liability for asbestos-related litigation
|
$
|
657.1
|
|
$
|
717.5
|
|
|
|
Federal tax credit carryforwards
|
16.9
|
|
2.4
|
|
|||
|
Foreign net operating loss carryforwards
|
18.0
|
|
22.7
|
|
|||
|
Deferred state taxes
|
90.3
|
|
88.4
|
|
|||
|
Liability for environmental remediation
|
47.1
|
|
49.2
|
|
|||
|
Other postretirement benefits
|
18.2
|
|
22.9
|
|
|||
|
Pension liabilities
|
96.7
|
|
133.1
|
|
|||
|
Reserves and allowances
|
60.4
|
|
51.6
|
|
|||
|
Research and development
|
32.6
|
|
34.0
|
|
|||
|
Accrued interest on pre-petition debt
|
66.7
|
|
121.9
|
|
|||
|
Other
|
16.3
|
|
20.8
|
|
|||
|
Total deferred tax assets
|
$
|
1,120.3
|
|
$
|
1,264.5
|
|
|
|
Deferred tax liabilities:
|
|
|
|||||
|
Asbestos-related insurance receivable
|
$
|
(175.0
|
)
|
$
|
(175.0
|
)
|
|
|
Pension assets
|
(3.7
|
)
|
(14.9
|
)
|
|||
|
Properties and equipment
|
(30.3
|
)
|
(35.3
|
)
|
|||
|
Other
|
(7.3
|
)
|
(14.7
|
)
|
|||
|
Total deferred tax liabilities
|
$
|
(216.3
|
)
|
$
|
(239.9
|
)
|
|
|
Valuation allowance:
|
|
|
|||||
|
Deferred state taxes
|
$
|
(13.6
|
)
|
$
|
(40.3
|
)
|
|
|
Federal credits
|
(4.4
|
)
|
—
|
|
|||
|
Foreign net operating loss carryforwards
|
(0.3
|
)
|
(0.5
|
)
|
|||
|
Total valuation allowance
|
(18.3
|
)
|
(40.8
|
)
|
|||
|
Net deferred tax assets
|
$
|
885.7
|
|
$
|
983.8
|
|
|
U.S. Federal deferred tax assets decreased year over year by
$123.8 million
. The
$98.1 million
reduction in net deferred tax assets was primarily the result of Grace's ability to accelerate the deductibility of certain emergence deductions, including the utilization of a qualified settlement fund. This overall reduction was partially offset by an increase in state deferred tax assets, mostly the result of a valuation allowance release.
Grace has recorded a valuation allowance to reduce its net deferred tax assets to the amount that is more likely than not to be realized. Grace has considered forecasted earnings, recent past and future taxable income, the mix of earnings in the jurisdictions in which it operates and prudent and feasible tax planning strategies in determining the need for these valuation allowances. The valuation allowance decreased
$22.5 million
from
December 31, 2012
, to
December 31, 2013
. In the 2013 fourth quarter, Grace determined that it is more likely than not that its deductions generated at emergence will be used before their expiration. Accordingly, Grace recorded a
$24.4 million
release of its valuation allowance on its state deferred tax assets. Further decreases in Grace's deferred tax assets resulted from the utilization and expiration of state net operating losses ("NOLs") in the current year, and the reduction of NOLs resulting from prior-year adjustments to taxable income. These decreases were partially offset by the recording of valuation allowances on deferred tax assets associated with certain U.S. federal foreign tax credits.
F-41
Notes to Consolidated Financial Statements (Continued)
10. Income Taxes (Continued)
The realization of deferred tax assets is dependent on the generation of sufficient taxable income in the appropriate tax jurisdictions. Although realization is not assured, Grace believes it is more likely than not that the remaining deferred tax assets will be realized. If Grace were to determine that it would not be able to realize a portion of its net deferred tax assets in the future, for which there is currently no valuation allowance, an adjustment to the net deferred tax assets would be charged to earnings in the period such determination was made. Conversely, if Grace were to make a determination that it is more likely than not that deferred tax assets, for which there is currently a valuation allowance, would be realized, the related valuation allowance would be reduced and a benefit to earnings would be recorded.
The U.S. Federal tax credit carryforwards at
December 31, 2013
, were
$65.2 million
. Grace has recorded a valuation allowance of
$4.4 million
against the credit carryforwards because they are expected to expire unused by 2018 while Grace continues to be in an NOL position. Grace expects to use
$52.4 million
of the credits that would otherwise expire in the years 2019 through 2028, as well as the remaining
$8.4 million
, which do not expire. In addition, as a result of certain realization requirements, the table of deferred tax assets and liabilities shown above does not include certain deferred tax assets as of December 31, 2013 and 2012, that arose directly from tax deductions related to equity compensation in excess of compensation recognized for financial reporting. Equity will be increased by
$57.7 million
if and when such deferred tax assets are ultimately realized.
U.S. Federal Net Operating Losses
At emergence from bankruptcy, Grace generated approximately
$670 million
in U.S. Federal net operating losses, which were previously recorded as deferred tax assets for temporary differences, that will be available to reduce U.S. Federal taxable income in 2014 and future years. In addition, Grace expects to receive a U.S. Federal income tax deduction of
$490 million
upon settlement of the warrant held by one of the asbestos trusts and
$1,580 million
upon payment of deferred payment obligations.
Grace expects to carryforward most of its NOLs. Under U.S. Federal income tax law, a corporation is generally permitted to carryforward NOLs for a
20
-year period for deduction against future taxable income. Grace believes that it will generate sufficient domestic taxable income to use all available future tax deductions prior to expiration. Grace has generally not paid U.S. Federal income taxes in cash in recent years since available tax deductions and credits have fully offset U.S. taxable income.
Unrepatriated Foreign Earnings
Grace has not provided for U.S. federal, state and foreign deferred income taxes on
$1,126.5 million
of undistributed earnings of foreign subsidiaries. Grace expects that these earnings will be permanently reinvested by such subsidiaries except in certain instances where repatriation attributable to current earnings results in minimal or no U.S. tax consequences. The unrecorded deferred tax liability associated with these earnings is
$149.7 million
. Since 2001, Grace has repatriated cash and promissory notes from foreign subsidiaries to support its Chapter 11 funding requirements. Grace repatriated earnings of
$25.9 million
,
$22.1 million
, and
$30.1 million
from its non-U.S. subsidiaries in
2013
,
2012
, and
2011
, respectively, incurring an insignificant amount of U.S. income tax expense.
Uncertain Tax Positions
The amount of unrecognized tax benefits at
December 31, 2013
, was
$84.4 million
(
$80.3 million
excluding interest and penalties). The amount of unrecognized tax benefits at
December 31, 2012
, was
$88.6 million
(
$83.1 million
excluding interest and penalties). The amount of unrecognized tax benefits at
December 31, 2011
, was
$69.3 million
(
$62.4 million
excluding interest and penalties). A reconciliation of the unrecognized tax benefits, excluding interest and penalties, for the three years ended
December 31, 2013
, follows:
F-42
Notes to Consolidated Financial Statements (Continued)
10. Income Taxes (Continued)
Rollforward of Uncertain Tax Positions
|
(In millions)
|
Unrecognized
Tax Benefits
|
||
|
Balance as of January 1, 2011
|
$
|
79.2
|
|
|
Additions for current year tax positions
|
0.6
|
|
|
|
Additions for prior year tax positions
|
0.5
|
|
|
|
Reductions for prior year tax positions and reclassifications(1)(2)
|
(17.8
|
)
|
|
|
Reductions for expirations of statute of limitations
|
(0.1
|
)
|
|
|
Balance as of December 31, 2011
|
62.4
|
|
|
|
Additions for current year tax positions
|
3.4
|
|
|
|
Additions for prior year tax positions
|
22.0
|
|
|
|
Reductions for prior year tax positions and reclassifications
|
(0.8
|
)
|
|
|
Reductions for expirations of statute of limitations
|
(2.9
|
)
|
|
|
Settlements(3)
|
(1.0
|
)
|
|
|
Balance as of December 31, 2012
|
83.1
|
|
|
|
Additions for current year tax positions
|
6.3
|
|
|
|
Additions for prior year tax positions
|
6.4
|
|
|
|
Reductions for prior year tax positions and reclassifications(4)
|
(9.6
|
)
|
|
|
Reductions for expirations of statute of limitations
|
(5.9
|
)
|
|
|
Balance as of December 31, 2013
|
$
|
80.3
|
|
_______________________________________________________________________________
|
(1)
|
On November 3, 2011, Grace received notice from the Canadian Revenue Agency that they had completed a review of Grace's Canadian transfer pricing for the years 2002, 2003, and 2004. As a result, Grace reversed
$10.6 million
of uncertain tax positions because they were effectively settled pursuant to ASC 740-10-25. A tax matter is effectively settled through examination when the taxing authority has completed an examination; the entity does not intend to appeal or litigate any aspect of a particular tax position for the completed examination; and based on a tax authority's widely understood policy, the entity considers it remote that the taxing authority would subsequently examine or reexamine any of the positions once the examination process is completed.
|
|
(2)
|
In 2011,
$6.7 million
of uncertain tax positions representing pre-petition federal and state settlements were reclassified to income taxes payable.
|
|
(3)
|
In 2012,
$1.0 million
of uncertain tax positions representing withholding taxes due were paid as a result of the completion of Grace's Canadian audit for the years 2002, 2003, and 2004.
|
|
(4)
|
In 2013,
$9.6 million
of uncertain tax positions representing agreed adjustments resulting from the 2007-2009 IRS examination were reclassified to income taxes payable.
|
The balance of unrecognized tax benefits as of
December 31, 2013
,
2012
, and
2011
of
$79.5 million
(net of
$0.8 million
that would be indemnified by a third party),
$82.1 million
(net of
$1.0 million
that would be indemnified by a third party), and
$62.4 million
, respectively, if recognized, would affect the effective tax rate. Grace accrues potential interest and any associated penalties related to uncertain tax positions in "benefit from (provision for) income taxes" in the Consolidated Statements of Operations. The balances of unrecognized tax benefits in the preceding table do not include accrued interest and penalties. The total amount of interest and penalties accrued on uncertain tax positions as of
December 31, 2013
,
2012
, and
2011
was
$4.1 million
,
$5.5 million
and
$6.9 million
, respectively, net of applicable federal income tax benefits.
Grace files U.S. Federal income tax returns as well as income tax returns in various state and foreign jurisdictions. Grace's uncertain tax positions are related to income tax returns for tax years that remain subject to examination by the relevant taxing authorities. The following table summarizes these open tax years by major jurisdiction:
F-43
Notes to Consolidated Financial Statements (Continued)
10. Income Taxes (Continued)
|
Tax Jurisdiction(1)
|
Examination in Progress
|
Examination Not Yet Initiated
|
|
|
United States—Federal
|
2007-2009
|
2010-2012
|
|
|
United States—State
|
2007-2012
|
2010-2012
|
|
|
Germany
|
None
|
2009-2012
|
|
|
Italy
|
None
|
2008-2012
|
|
|
France
|
2010-2011
|
2012
|
|
|
Canada
|
None
|
2006-2012
|
|
_______________________________________________________________________________
|
(1)
|
Includes federal, state, provincial or local jurisdictions, as applicable.
|
Grace notes that there are attributes generated in prior years that are otherwise closed by statute and were carried forward into years that are open to examination. Those attributes may still be subject to adjustment to the extent utilized in open years.
As a multi-national taxpayer, Grace is under continual audit by the various tax authorities on open-year tax positions. Based on the status of current examinations in various taxing jurisdictions and applicable judicial decisions applied to Grace's fact pattern, Grace believes it is reasonably possible that in the next
12 months
the amount of the liability for unrecognized tax benefits could decrease by as much as
$68 million
.
11. Pension Plans and Other Postretirement Benefit Plans
Pension Plans
As discussed in Note 1, the Company elected to change its method of accounting for deferred actuarial gains and losses relating to its global defined benefit pension plans in 2013. The new accounting method, referred to as mark-to-market accounting, was adopted in the 2013 fourth quarter and retrospectively applied to the Company's financial results for all periods presented in this report. See Note 1 under the caption "Change in Accounting Principle Regarding Pension Benefits" for additional information.
The following table presents the funded status of Grace's fully-funded, underfunded, and unfunded pension plans:
|
(In millions)
|
December 31, 2013
|
December 31, 2012
|
|||||
|
Overfunded defined benefit pension plans
|
$
|
16.7
|
|
$
|
32.1
|
|
|
|
Underfunded defined benefit pension plans
|
(66.2
|
)
|
(175.1
|
)
|
|||
|
Unfunded defined benefit pension plans
|
(233.4
|
)
|
(221.4
|
)
|
|||
|
Total underfunded and unfunded defined benefit pension plans
|
(299.6
|
)
|
(396.5
|
)
|
|||
|
Unfunded defined benefit pension plans included in liabilities subject to compromise
|
(123.6
|
)
|
(131.2
|
)
|
|||
|
Pension liabilities included in other current liabilities
|
(15.0
|
)
|
(14.0
|
)
|
|||
|
Net funded status
|
$
|
(421.5
|
)
|
$
|
(509.6
|
)
|
|
Fully-funded plans include several advance-funded plans where the fair value of the plan assets exceeds the projected benefit obligation ("PBO"). This group of plans was overfunded by
$16.7 million
as of
December 31, 2013
, and the overfunded status is reflected as "overfunded defined benefit pension plans" in the Consolidated Balance Sheets. Underfunded plans include a group of advance-funded plans that are underfunded on a PBO basis. Unfunded plans include several plans that are funded on a pay-as-you-go basis, and therefore, the entire PBO is unfunded. The combined balance of the underfunded and unfunded plans was
$438.2 million
as of
December 31, 2013
.
Grace maintains defined benefit pension plans covering current and former employees of certain business units and divested business units who meet age and service requirements. Benefits are generally based on final average salary and years of service. Grace funds its U.S. qualified pension plans ("U.S. qualified pension plans") in accordance with U.S. federal laws and regulations. Non-U.S. pension plans ("non-U.S. pension plans") are funded under a variety of methods, as required under local laws and customs.
F-44
Notes to Consolidated Financial Statements (Continued)
11. Pension Plans and Other Postretirement Benefit Plans (Continued)
Grace also provides, through nonqualified plans, supplemental pension benefits in excess of U.S. qualified pension plan limits imposed by federal tax law. These plans cover officers and higher-level employees and serve to increase the combined pension amount to the level that they otherwise would have received under the U.S. qualified pension plans in the absence of such limits. The nonqualified plans are unfunded and Grace pays the costs of benefits as they are due to the participants.
At the
December 31, 2013
, measurement date for Grace's defined benefit pension plans, the PBO was
$1,873.2 million
as measured under U.S. GAAP compared with
$1,954.9 million
as of
December 31, 2012
. The PBO basis reflects the present value (using a
4.76%
discount rate for U.S. plans and a
4.25%
weighted average discount rate for non-U.S. plans as of
December 31, 2013
) of vested and non-vested benefits earned from employee service to date, based upon current services and estimated future pay increases for active employees.
On an annual basis a full remeasurement of pension assets and pension liabilities is performed based on the Company's estimates and actuarial valuations. These valuations reflect the terms of the plan, and use participant-specific information as well as certain key assumptions provided by management.
Postretirement Benefits Other Than Pensions
Grace provides postretirement health care and life insurance benefits for retired employees of certain U.S. business units and certain divested business units. The postretirement medical plan provides various levels of benefits to employees hired before 1993 who retire from Grace after age
55
with at least
10
years of service. These plans are unfunded and Grace pays a portion of the costs of benefits under these plans as they are incurred. Grace applies ASC 715 to these plans, which requires that the future costs of postretirement health care and life insurance benefits be accrued over the employees' years of service. Actuarial gains and losses are recognized in the Consolidated Balance Sheets as a component of Shareholders’ Equity, with amortization of the net actuarial gains and losses that exceed
10
percent of the accumulated postretirement benefit obligation recognized each quarter in the Consolidated Statements of Operations over the average future service period of active employees.
Retirees and beneficiaries covered by the postretirement medical plan are required to contribute a minimum of
40%
of the calculated premium for that coverage. During 2002, per capita costs under the retiree medical plans exceeded caps on the amount Grace was required to contribute under a 1993 amendment to the plan. As a result, for 2003 and future years, retirees will bear
100%
of any increase in premium costs.
For
2013
measurement purposes, per capita costs, before retiree contributions, were assumed to initially increase at a rate of
8.25%
. The rate of increase is assumed to decrease gradually to
5%
through 2020 and remain at that level thereafter. A one percentage point increase or decrease in assumed health care medical cost trend rates would not materially change Grace's postretirement benefit obligations (impact of less than
$1 million
) and would have a negligible impact on the aggregate of the service and interest cost components of net periodic benefit cost.
Defined Contribution Retirement Plan
Grace sponsors a defined contribution retirement plan for its employees in the United States. This plan is qualified under section 401(k) of the U.S. tax code. Currently, Grace contributes an amount equal to
100%
of employee contributions, up to
6%
of an individual employee's salary or wages. Grace's cost related to this benefit plan was
$13.2 million
,
$12.6 million
, and
$12.3 million
for the years ended
December 31, 2013
,
2012
, and
2011
, respectively.
F-45
Notes to Consolidated Financial Statements (Continued)
11. Pension Plans and Other Postretirement Benefit Plans (Continued)
Analysis of Plan Accounting and Funded Status
The following table summarizes the changes in benefit obligations and fair values of retirement plan assets during
2013
and
2012
:
|
|
Defined Benefit Pension Plans
|
Other Post-
Retirement Plans
|
|||||||||||||||||||||||||||||
|
Change in Financial Status of Retirement Plans
(In millions)
|
U.S.
|
Non-U.S.
|
Total
|
||||||||||||||||||||||||||||
|
2013
|
2012
|
2013
|
2012
|
2013
|
2012
|
2013
|
2012
|
||||||||||||||||||||||||
|
Change in Projected Benefit Obligation (PBO):
|
|
|
|
|
|
|
|
|
|||||||||||||||||||||||
|
Benefit obligation at beginning of year
|
$
|
1,425.6
|
|
$
|
1,282.3
|
|
$
|
529.3
|
|
$
|
452.8
|
|
$
|
1,954.9
|
|
$
|
1,735.1
|
|
$
|
63.9
|
|
$
|
64.6
|
|
|||||||
|
Service cost
|
25.2
|
|
21.5
|
|
11.1
|
|
8.9
|
|
36.3
|
|
30.4
|
|
0.2
|
|
0.2
|
|
|||||||||||||||
|
Interest cost
|
51.9
|
|
55.9
|
|
20.6
|
|
21.4
|
|
72.5
|
|
77.3
|
|
2.2
|
|
2.5
|
|
|||||||||||||||
|
Plan participants' contributions
|
—
|
|
—
|
|
0.6
|
|
0.6
|
|
0.6
|
|
0.6
|
|
—
|
|
—
|
|
|||||||||||||||
|
Amendments
|
—
|
|
—
|
|
—
|
|
—
|
|
—
|
|
—
|
|
(1.7
|
)
|
—
|
|
|||||||||||||||
|
Actuarial (gain) loss
|
(96.7
|
)
|
132.3
|
|
(2.4
|
)
|
58.2
|
|
(99.1
|
)
|
190.5
|
|
(4.3
|
)
|
(2.1
|
)
|
|||||||||||||||
|
Medicare subsidy receipts
|
—
|
|
—
|
|
—
|
|
—
|
|
—
|
|
—
|
|
1.4
|
|
3.3
|
|
|||||||||||||||
|
Benefits paid
|
(79.2
|
)
|
(66.4
|
)
|
(22.1
|
)
|
(23.1
|
)
|
(101.3
|
)
|
(89.5
|
)
|
(4.5
|
)
|
(4.6
|
)
|
|||||||||||||||
|
Currency exchange translation adjustments
|
—
|
|
—
|
|
9.3
|
|
10.5
|
|
9.3
|
|
10.5
|
|
—
|
|
—
|
|
|||||||||||||||
|
Benefit obligation at end of year
|
$
|
1,326.8
|
|
$
|
1,425.6
|
|
$
|
546.4
|
|
$
|
529.3
|
|
$
|
1,873.2
|
|
$
|
1,954.9
|
|
$
|
57.2
|
|
$
|
63.9
|
|
|||||||
|
Change in Plan Assets:
|
|
|
|
|
|
|
|
|
|||||||||||||||||||||||
|
Fair value of plan assets at beginning of year
|
$
|
1,131.7
|
|
$
|
955.3
|
|
$
|
313.6
|
|
$
|
295.1
|
|
$
|
1,445.3
|
|
$
|
1,250.4
|
|
$
|
—
|
|
$
|
—
|
|
|||||||
|
Actual return on plan assets
|
37.1
|
|
127.9
|
|
0.8
|
|
20.8
|
|
37.9
|
|
148.7
|
|
—
|
|
—
|
|
|||||||||||||||
|
Employer contributions
|
55.6
|
|
114.9
|
|
12.7
|
|
11.9
|
|
68.3
|
|
126.8
|
|
3.1
|
|
1.3
|
|
|||||||||||||||
|
Plan participants' contributions
|
—
|
|
—
|
|
0.6
|
|
0.6
|
|
0.6
|
|
0.6
|
|
—
|
|
—
|
|
|||||||||||||||
|
Medicare subsidy receipts
|
—
|
|
—
|
|
—
|
|
—
|
|
—
|
|
—
|
|
1.4
|
|
3.3
|
|
|||||||||||||||
|
Benefits paid
|
(79.2
|
)
|
(66.4
|
)
|
(22.1
|
)
|
(23.1
|
)
|
(101.3
|
)
|
(89.5
|
)
|
(4.5
|
)
|
(4.6
|
)
|
|||||||||||||||
|
Currency exchange translation adjustments
|
—
|
|
—
|
|
0.9
|
|
8.3
|
|
0.9
|
|
8.3
|
|
—
|
|
—
|
|
|||||||||||||||
|
Fair value of plan assets at end of year
|
$
|
1,145.2
|
|
$
|
1,131.7
|
|
$
|
306.5
|
|
$
|
313.6
|
|
$
|
1,451.7
|
|
$
|
1,445.3
|
|
$
|
—
|
|
$
|
—
|
|
|||||||
|
Funded status at end of year (PBO basis)
|
$
|
(181.6
|
)
|
$
|
(293.9
|
)
|
$
|
(239.9
|
)
|
$
|
(215.7
|
)
|
$
|
(421.5
|
)
|
$
|
(509.6
|
)
|
$
|
(57.2
|
)
|
$
|
(63.9
|
)
|
|||||||
|
Amounts recognized in the Consolidated Balance Sheets consist of:
|
|
|
|
|
|
|
|
|
|||||||||||||||||||||||
|
Noncurrent assets
|
$
|
—
|
|
$
|
—
|
|
$
|
16.7
|
|
$
|
32.1
|
|
$
|
16.7
|
|
$
|
32.1
|
|
$
|
—
|
|
$
|
—
|
|
|||||||
|
Current liabilities
|
(5.8
|
)
|
(5.8
|
)
|
(9.2
|
)
|
(8.2
|
)
|
(15.0
|
)
|
(14.0
|
)
|
(4.5
|
)
|
(4.3
|
)
|
|||||||||||||||
|
Noncurrent liabilities
|
(175.8
|
)
|
(288.1
|
)
|
(247.4
|
)
|
(239.6
|
)
|
(423.2
|
)
|
(527.7
|
)
|
(52.7
|
)
|
(59.6
|
)
|
|||||||||||||||
|
Net amount recognized
|
$
|
(181.6
|
)
|
$
|
(293.9
|
)
|
$
|
(239.9
|
)
|
$
|
(215.7
|
)
|
$
|
(421.5
|
)
|
$
|
(509.6
|
)
|
$
|
(57.2
|
)
|
$
|
(63.9
|
)
|
|||||||
|
Amounts recognized in Accumulated Other Comprehensive Income consist of:
|
|
|
|
|
|
|
|
|
|||||||||||||||||||||||
|
Accumulated actuarial gain
|
$
|
—
|
|
$
|
—
|
|
$
|
—
|
|
$
|
—
|
|
$
|
—
|
|
$
|
—
|
|
$
|
(5.0
|
)
|
$
|
(0.3
|
)
|
|||||||
|
Prior service cost (credit)
|
1.5
|
|
2.2
|
|
(0.3
|
)
|
(0.3
|
)
|
1.2
|
|
1.9
|
|
(1.7
|
)
|
—
|
|
|||||||||||||||
|
Net amount recognized
|
$
|
1.5
|
|
$
|
2.2
|
|
$
|
(0.3
|
)
|
$
|
(0.3
|
)
|
$
|
1.2
|
|
$
|
1.9
|
|
$
|
(6.7
|
)
|
$
|
(0.3
|
)
|
|||||||
|
|
Defined Benefit Pension Plans
|
Other Post-
Retirement Plans
|
|||||||||||||||||||
|
Change in Financial Status of Retirement Plans
(In millions)
|
U.S.
|
Non-U.S.
|
Total
|
||||||||||||||||||
|
2013
|
2012
|
2013
|
2012
|
2013
|
2012
|
2013
|
2012
|
||||||||||||||
|
Weighted Average Assumptions Used to Determine Benefit Obligations as of December 31:
|
|
|
|
|
|
|
|
|
|||||||||||||
|
Discount rate
|
4.76
|
%
|
3.75
|
%
|
4.25
|
%
|
4.06
|
%
|
NM
|
NM
|
4.26
|
%
|
3.50
|
%
|
|||||||
|
Rate of compensation increase
|
4.70
|
%
|
4.30
|
%
|
3.41
|
%
|
3.37
|
%
|
NM
|
NM
|
NM
|
|
NM
|
|
|||||||
|
Weighted Average Assumptions Used to Determine Net Periodic Benefit Cost for Years Ended December 31:
|
|
|
|
|
|
|
|
|
|||||||||||||
|
Discount rate
|
3.75
|
%
|
4.50
|
%
|
4.06
|
%
|
4.83
|
%
|
NM
|
NM
|
3.50
|
%
|
4.00
|
%
|
|||||||
|
Expected return on plan assets
|
6.00
|
%
|
6.25
|
%
|
4.66
|
%
|
4.98
|
%
|
NM
|
NM
|
NM
|
|
NM
|
|
|||||||
|
Rate of compensation increase
|
4.30
|
%
|
4.30
|
%
|
3.37
|
%
|
3.40
|
%
|
NM
|
NM
|
NM
|
|
NM
|
|
|||||||
_______________________________________________________________________________
NM—Not meaningful
F-46
Notes to Consolidated Financial Statements (Continued)
11. Pension Plans and Other Postretirement Benefit Plans (Continued)
|
Components of Net Periodic Benefit (Income) Cost and Other Amounts Recognized in Other Comprehensive (Income) Loss
(In millions)
|
2013
|
2012
|
2011
|
||||||||||||||||||||||||||||||||
|
U.S.
|
Non-U.S.
|
Other
|
U.S.
|
Non-U.S.
|
Other
|
U.S.
|
Non-U.S.
|
Other
|
|||||||||||||||||||||||||||
|
Net Periodic Benefit (Income) Cost
|
|
|
|
|
|
|
|
|
|
||||||||||||||||||||||||||
|
Service cost
|
$
|
25.2
|
|
$
|
11.1
|
|
$
|
0.2
|
|
$
|
21.5
|
|
$
|
8.9
|
|
$
|
0.2
|
|
$
|
18.2
|
|
$
|
8.7
|
|
$
|
0.3
|
|
||||||||
|
Interest cost
|
51.9
|
|
20.6
|
|
2.2
|
|
55.9
|
|
21.4
|
|
2.5
|
|
60.3
|
|
22.7
|
|
3.2
|
|
|||||||||||||||||
|
Expected return on plan assets
|
(68.0
|
)
|
(14.0
|
)
|
—
|
|
(63.3
|
)
|
(14.8
|
)
|
—
|
|
(66.1
|
)
|
(16.2
|
)
|
—
|
|
|||||||||||||||||
|
Amortization of prior service cost (credit)
|
0.7
|
|
—
|
|
—
|
|
0.9
|
|
(0.1
|
)
|
—
|
|
1.1
|
|
—
|
|
—
|
|
|||||||||||||||||
|
Annual mark-to-market adjustment
|
(65.8
|
)
|
11.0
|
|
—
|
|
67.7
|
|
52.2
|
|
—
|
|
99.1
|
|
13.1
|
|
—
|
|
|||||||||||||||||
|
Amortization of net deferred actuarial loss
|
—
|
|
—
|
|
0.4
|
|
—
|
|
—
|
|
0.6
|
|
—
|
|
—
|
|
0.6
|
|
|||||||||||||||||
|
Net curtailment and settlement loss
|
—
|
|
(0.1
|
)
|
—
|
|
—
|
|
—
|
|
—
|
|
—
|
|
—
|
|
—
|
|
|||||||||||||||||
|
Net periodic benefit (income) cost
|
$
|
(56.0
|
)
|
$
|
28.6
|
|
$
|
2.8
|
|
$
|
82.7
|
|
$
|
67.6
|
|
$
|
3.3
|
|
$
|
112.6
|
|
$
|
28.3
|
|
$
|
4.1
|
|
||||||||
|
Other Changes in Plan Assets and Benefit Obligations Recognized in Other Comprehensive (Income) Loss
|
|
|
|
|
|
|
|
|
|
||||||||||||||||||||||||||
|
Net deferred actuarial gain
|
$
|
—
|
|
$
|
—
|
|
$
|
(4.3
|
)
|
$
|
—
|
|
$
|
—
|
|
$
|
(2.1
|
)
|
$
|
—
|
|
$
|
—
|
|
$
|
(7.3
|
)
|
||||||||
|
Net prior service credit
|
—
|
|
—
|
|
(1.7
|
)
|
—
|
|
—
|
|
—
|
|
—
|
|
(0.4
|
)
|
—
|
|
|||||||||||||||||
|
Amortization of prior service cost (credit)
|
(0.7
|
)
|
—
|
|
—
|
|
(0.9
|
)
|
0.1
|
|
—
|
|
(1.1
|
)
|
—
|
|
—
|
|
|||||||||||||||||
|
Amortization of net deferred actuarial loss
|
—
|
|
—
|
|
(0.4
|
)
|
—
|
|
—
|
|
(0.6
|
)
|
—
|
|
—
|
|
(0.6
|
)
|
|||||||||||||||||
|
Total recognized in other comprehensive (income) loss
|
(0.7
|
)
|
—
|
|
(6.4
|
)
|
(0.9
|
)
|
0.1
|
|
(2.7
|
)
|
(1.1
|
)
|
(0.4
|
)
|
(7.9
|
)
|
|||||||||||||||||
|
Total recognized in net periodic benefit (income) cost and other comprehensive (income) loss
|
$
|
(56.7
|
)
|
$
|
28.6
|
|
$
|
(3.6
|
)
|
$
|
81.8
|
|
$
|
67.7
|
|
$
|
0.6
|
|
$
|
111.5
|
|
$
|
27.9
|
|
$
|
(3.8
|
)
|
||||||||
The estimated prior service cost for the defined benefit pension plans that will be amortized from accumulated other comprehensive income into net periodic benefit (income) cost over the next fiscal year is
$0.7 million
. The estimated net deferred actuarial gain and prior service credit for the other postretirement plans that will be amortized from accumulated other comprehensive income into net periodic benefit (income) cost over the next fiscal year are
$0.9 million
and
$0.3 million
, respectively.
|
Funded Status of U.S. Pension Plans
(In millions)
|
Fully-Funded U.S. Qualified
Pension Plans(1)
|
Underfunded U.S.
Qualified Pension Plans(1)
|
Unfunded Pay-As-You-Go
U.S. Nonqualified Plans(2)
|
||||||||||||||||||||||||||||||||
|
2013
|
|
2012
|
|
2011
|
|
2013
|
|
2012
|
|
2011
|
|
2013
|
|
2012
|
|
2011
|
|||||||||||||||||||
|
Projected benefit obligation
|
$
|
—
|
|
$
|
—
|
|
$
|
—
|
|
$
|
1,197.4
|
|
$
|
1,288.6
|
|
$
|
1,157.5
|
|
$
|
129.4
|
|
$
|
137.0
|
|
$
|
124.8
|
|
||||||||
|
Fair value of plan assets
|
—
|
|
—
|
|
—
|
|
1,145.2
|
|
1,131.7
|
|
955.3
|
|
—
|
|
—
|
|
—
|
|
|||||||||||||||||
|
Funded status (PBO basis)
|
$
|
—
|
|
$
|
—
|
|
$
|
—
|
|
$
|
(52.2
|
)
|
$
|
(156.9
|
)
|
$
|
(202.2
|
)
|
$
|
(129.4
|
)
|
$
|
(137.0
|
)
|
$
|
(124.8
|
)
|
||||||||
|
Benefits paid
|
$
|
—
|
|
$
|
—
|
|
$
|
—
|
|
$
|
(73.6
|
)
|
$
|
(60.7
|
)
|
$
|
(59.9
|
)
|
$
|
(5.6
|
)
|
$
|
(5.7
|
)
|
$
|
(5.6
|
)
|
||||||||
|
Funded Status of Non-U.S. Pension Plans
(In millions)
|
Fully-Funded Non-U.S.
Pension Plans(1)
|
Underfunded Non-U.S.
Pension Plans(1)
|
Unfunded Pay-As-You-Go
Non-U.S. Pension Plans(2)
|
||||||||||||||||||||||||||||||||
|
2013
|
2012
|
2011
|
2013
|
2012
|
2011
|
2013
|
2012
|
2011
|
|||||||||||||||||||||||||||
|
Projected benefit obligation
|
$
|
247.3
|
|
$
|
237.1
|
|
$
|
213.3
|
|
$
|
56.5
|
|
$
|
62.6
|
|
$
|
53.1
|
|
$
|
242.6
|
|
$
|
229.6
|
|
$
|
186.4
|
|
||||||||
|
Fair value of plan assets
|
264.0
|
|
269.2
|
|
255.8
|
|
42.5
|
|
44.4
|
|
39.3
|
|
—
|
|
—
|
|
—
|
|
|||||||||||||||||
|
Funded status (PBO basis)
|
$
|
16.7
|
|
$
|
32.1
|
|
$
|
42.5
|
|
$
|
(14.0
|
)
|
$
|
(18.2
|
)
|
$
|
(13.8
|
)
|
$
|
(242.6
|
)
|
$
|
(229.6
|
)
|
$
|
(186.4
|
)
|
||||||||
|
Benefits paid
|
$
|
(10.0
|
)
|
$
|
(11.8
|
)
|
$
|
(10.2
|
)
|
$
|
(4.2
|
)
|
$
|
(3.6
|
)
|
$
|
(2.2
|
)
|
$
|
(7.9
|
)
|
$
|
(7.7
|
)
|
$
|
(8.8
|
)
|
||||||||
_______________________________________________________________________________
|
(1)
|
Plans intended to be advance-funded.
|
|
(2)
|
Plans intended to be pay-as-you-go.
|
The accumulated benefit obligation for all defined benefit pension plans was approximately
$1,772 million
and
$1,849 million
as of
December 31, 2013
and
2012
, respectively.
F-47
Notes to Consolidated Financial Statements (Continued)
11. Pension Plans and Other Postretirement Benefit Plans (Continued)
|
Pension Plans with Underfunded or
Unfunded Accumulated Benefit Obligation
(In millions)
|
U.S.
|
Non-U.S.
|
Total
|
||||||||||||||||||||
|
2013
|
2012
|
2013
|
2012
|
2013
|
2012
|
||||||||||||||||||
|
Projected benefit obligation
|
$
|
347.8
|
|
$
|
1,425.6
|
|
$
|
259.2
|
|
$
|
280.3
|
|
$
|
607.0
|
|
$
|
1,705.9
|
|
|||||
|
Accumulated benefit obligation
|
344.1
|
|
1,371.2
|
|
230.7
|
|
242.0
|
|
574.8
|
|
1,613.2
|
|
|||||||||||
|
Fair value of plan assets
|
201.1
|
|
1,131.7
|
|
8.9
|
|
35.5
|
|
210.0
|
|
1,167.2
|
|
|||||||||||
|
Estimated Expected Future Benefit Payments Reflecting Future Service and Medicare Subsidy Receipts for the Fiscal Years Ending
(In millions)
|
Pension Plans
|
Other
Postretirement Plans
|
Total
Payments
Net of
Subsidy
|
||||||||||||||||
|
U.S.(1)
|
Non-U.S.(2)
|
Benefit
Payments
|
Medicare
Subsidy
Receipts
|
||||||||||||||||
|
Benefit
Payments(3)
|
Benefit
Payments
|
||||||||||||||||||
|
2011 (actual)
|
$
|
65.5
|
|
$
|
21.2
|
|
$
|
3.6
|
|
$
|
(1.9
|
)
|
$
|
88.4
|
|
||||
|
2012 (actual)
|
66.4
|
|
23.1
|
|
4.6
|
|
(3.3
|
)
|
90.8
|
|
|||||||||
|
2013 (actual)
|
79.2
|
|
22.1
|
|
4.5
|
|
(1.4
|
)
|
104.4
|
|
|||||||||
|
2014(3)
|
108.6
|
|
23.0
|
|
6.2
|
|
(1.7
|
)
|
136.1
|
|
|||||||||
|
2015
|
82.2
|
|
22.7
|
|
6.0
|
|
(0.5
|
)
|
110.4
|
|
|||||||||
|
2016
|
83.5
|
|
24.4
|
|
5.8
|
|
(0.1
|
)
|
113.6
|
|
|||||||||
|
2017
|
84.9
|
|
25.1
|
|
5.6
|
|
(0.1
|
)
|
115.5
|
|
|||||||||
|
2018
|
86.3
|
|
26.0
|
|
5.3
|
|
(0.1
|
)
|
117.5
|
|
|||||||||
|
2019 - 2023
|
446.5
|
|
146.7
|
|
22.1
|
|
(0.3
|
)
|
615.0
|
|
|||||||||
_______________________________________________________________________________
|
(1)
|
Effective January 1, 2008, lump sum distributions from certain U.S. qualified pension plans were restricted based on the provisions of the Pension Protection Act of 2006 (the "Act"). The Act prohibited the distribution of lump sums to retiring participants while the Company was operating under Chapter 11 of the U.S. Bankruptcy Code and when the plan was less than
100%
funded. After emergence from Chapter 11, the plan is permitted to distribute lump sums to retiring participants under the Act when the plan is at least
80%
funded.
|
|
(2)
|
Non-U.S. estimated benefit payments for
2014
and future periods have been translated at the applicable
December 31, 2013
, exchange rates.
|
|
(3)
|
Includes approximately
$28 million
of benefit payments from nonqualified plans that were previously restricted by the Bankruptcy Court while the Company was in Chapter 11 and are expected to be paid in 2014.
|
Discount Rate Assumption
The assumed discount rate for pension plans reflects the market rates for high-quality corporate bonds currently available and is subject to change based on changes in overall market interest rates. For the U.S. qualified pension plans, the assumed discount rate of
4.76%
as of
December 31, 2013
, was selected by Grace, in consultation with its independent actuaries, based on a yield curve constructed from a portfolio of high quality bonds for which the timing and amount of cash outflows approximate the estimated payouts of the plan.
As of
December 31, 2013
and
2012
, the United Kingdom pension plan and German pension plans combined represented approximately
86%
and
84%
, respectively, of the benefit obligation of the non-U.S. pension plans. The assumed discount rates as of
December 31, 2013
, for the United Kingdom (
4.34%
) and Germany (
3.76%
) were selected by Grace, in consultation with its independent actuaries, based on yield curves constructed from a portfolio of sterling- and euro-denominated high quality bonds for which the timing and amount of cash outflows approximate the estimated payouts of the plans. The assumed discount rates for the remaining non-U.S. pension plans were determined based on the nature of the liabilities, local economic environments and available bond indices.
Investment Guidelines for Advance-Funded Pension Plans
The investment goal for the U.S. qualified pension plans subject to advance funding is to earn a long-term rate of return consistent with the related cash flow profile of the underlying benefit obligation. The plans are pursuing a well-defined risk management strategy designed to reduce investment risks as their funded status improves.
F-48
Notes to Consolidated Financial Statements (Continued)
11. Pension Plans and Other Postretirement Benefit Plans (Continued)
The U.S. qualified pension plans have adopted a diversified set of portfolio management strategies to optimize the risk reward profile of the plans:
|
•
|
Liability hedging portfolio: primarily invested in intermediate-term and long-term investment grade corporate bonds in actively managed strategies.
|
|
•
|
Growth portfolio: invested in a diversified set of assets designed to deliver performance in excess of the underlying liabilities with controls regarding the level of risk.
|
|
•
|
U.S. equity securities: the portfolio contains domestic equities that are passively managed to the S&P 500 and Russell 2000 benchmark and an allocation to an active portfolio benchmarked to the Russell 2000.
|
|
•
|
Non-U.S. equity securities: the portfolio contains non-U.S. equities in an actively managed strategy. Currency futures and forward contracts may be held for the sole purpose of hedging existing currency risk in the portfolio.
|
|
•
|
Other investments: may include (a) high yield bonds: fixed income portfolio of securities below investment grade including up to
30%
of the portfolio in non-U.S. issuers; and (b) global real estate securities: portfolio of diversified REIT and other liquid real estate related securities. These portfolios combine income generation and capital appreciation opportunities from developed markets globally.
|
|
•
|
Liquidity portfolio: invested in short-term assets intended to pay periodic plan benefits and expenses.
|
For
2013
, the expected long-term rate of return on assets for the U.S. qualified pension plans was
6.00%
. Average annual returns over one-, three-, five-, and ten-year periods were approximately
4%
,
8%
,
11%
, and
6%
, respectively.
The expected return on plan assets for the U.S. qualified pension plans for
2013
was selected by Grace, in consultation with its independent actuaries, using an expected return model. The model determines the weighted average return for an investment portfolio based on the target asset allocation and expected future returns for each asset class, which were developed using a building block approach based on observable inflation, available interest rate information, current market characteristics, and historical results.
The target allocation of investment assets at
December 31, 2013
, and the actual allocation at
December 31, 2013
and
2012
, for Grace's U.S. qualified pension plans are as follows:
|
|
Target
Allocation
|
Percentage of Plan Assets
December 31,
|
||||||
|
U.S. Qualified Pension Plans Asset Category
|
2013
|
2013
|
2012
|
|||||
|
U.S. equity securities
|
10
|
%
|
10
|
%
|
16
|
%
|
||
|
Non-U.S. equity securities
|
6
|
%
|
6
|
%
|
7
|
%
|
||
|
Short-term debt securities
|
10
|
%
|
10
|
%
|
6
|
%
|
||
|
Intermediate-term debt securities
|
28
|
%
|
28
|
%
|
31
|
%
|
||
|
Long-term debt securities
|
44
|
%
|
44
|
%
|
35
|
%
|
||
|
Other investments
|
2
|
%
|
2
|
%
|
5
|
%
|
||
|
Total
|
100
|
%
|
100
|
%
|
100
|
%
|
||
F-49
Notes to Consolidated Financial Statements (Continued)
11. Pension Plans and Other Postretirement Benefit Plans (Continued)
The following tables present the fair value hierarchy for the U.S. qualified pension plan assets measured at fair value as of
December 31, 2013
and
2012
.
|
|
Fair Value Measurements at December 31, 2013 Using
|
||||||||||||||
|
Assets Measured at Fair Value—U.S. Qualified Pension Plans
(In millions)
|
Total
|
Quoted Prices in
Active Markets
for Identical
Assets or
Liabilities
(Level 1)
|
Significant
Other
Observable
Inputs
(Level 2)
|
Significant
Unobservable
Inputs
(Level 3)
|
|||||||||||
|
U.S. equity group trust funds
|
$
|
111.5
|
|
$
|
—
|
|
$
|
111.5
|
|
$
|
—
|
|
|||
|
Non-U.S. equity group trust funds
|
67.1
|
|
—
|
|
67.1
|
|
—
|
|
|||||||
|
Corporate bond group trust funds—intermediate-term
|
322.6
|
|
—
|
|
322.6
|
|
—
|
|
|||||||
|
Corporate bond group trust funds—long-term
|
502.3
|
|
—
|
|
502.3
|
|
—
|
|
|||||||
|
Other fixed income group trust funds
|
22.9
|
|
—
|
|
22.9
|
|
—
|
|
|||||||
|
Common/collective trust funds
|
102.3
|
|
—
|
|
102.3
|
|
—
|
|
|||||||
|
Annuity and immediate participation contracts
|
16.5
|
|
—
|
|
16.5
|
|
—
|
|
|||||||
|
Total Assets
|
$
|
1,145.2
|
|
$
|
—
|
|
$
|
1,145.2
|
|
$
|
—
|
|
|||
|
|
Fair Value Measurements at December 31, 2012 Using
|
||||||||||||||
|
Assets Measured at Fair Value—U.S. Qualified Pension Plans
(In millions)
|
Total
|
Quoted Prices in
Active Markets
for Identical
Assets or
Liabilities
(Level 1)
|
Significant
Other
Observable
Inputs
(Level 2)
|
Significant
Unobservable
Inputs
(Level 3)
|
|||||||||||
|
U.S. equity group trust funds
|
$
|
178.8
|
|
$
|
—
|
|
$
|
178.8
|
|
$
|
—
|
|
|||
|
Non-U.S. equity group trust funds
|
79.2
|
|
—
|
|
79.2
|
|
—
|
|
|||||||
|
Corporate bond group trust funds—intermediate-term
|
348.4
|
|
—
|
|
348.4
|
|
—
|
|
|||||||
|
Corporate bond group trust funds—long-term
|
399.4
|
|
—
|
|
399.4
|
|
—
|
|
|||||||
|
Other fixed income group trust funds
|
36.9
|
|
—
|
|
36.9
|
|
—
|
|
|||||||
|
REIT group trust funds
|
15.0
|
|
—
|
|
15.0
|
|
—
|
|
|||||||
|
Common/collective trust funds
|
58.1
|
|
—
|
|
58.1
|
|
—
|
|
|||||||
|
Annuity and immediate participation contracts
|
15.9
|
|
—
|
|
15.9
|
|
—
|
|
|||||||
|
Total Assets
|
$
|
1,131.7
|
|
$
|
—
|
|
$
|
1,131.7
|
|
$
|
—
|
|
|||
Non-U.S. pension plans accounted for approximately
21%
and
22%
of total global pension assets at
December 31, 2013
and
2012
, respectively. Each of these plans, where applicable, follows local requirements and regulations. Some of the local requirements include the establishment of a local pension committee, a formal statement of investment policy and procedures, and routine valuations by plan actuaries.
The target allocation of investment assets for non-U.S. pension plans varies depending on the investment goals of the individual plans. The plan assets of the United Kingdom pension plan represent approximately
83%
and
82%
of the total non-U.S. pension plan assets at
December 31, 2013
and
2012
, respectively. In determining the expected rate of return for the U.K. pension plan, the trustees' strategic investment policy has been considered together with long-term historical returns and investment community forecasts for each asset class. The expected return by sector has been combined with the actual asset allocation to determine the
2013
expected long-term return assumption of
4.25%
.
F-50
Notes to Consolidated Financial Statements (Continued)
11. Pension Plans and Other Postretirement Benefit Plans (Continued)
The target allocation of investment assets at
December 31, 2013
, and the actual allocation at
December 31, 2013
and
2012
, for the U.K. pension plan are as follows:
|
|
Target
Allocation
|
Percentage of Plan Assets
December 31,
|
||||||
|
United Kingdom Pension Plan Asset Category
|
2013
|
2013
|
2012
|
|||||
|
Diversified growth funds
|
12
|
%
|
13
|
%
|
12
|
%
|
||
|
U.K. gilts
|
41
|
%
|
40
|
%
|
41
|
%
|
||
|
U.K. corporate bonds
|
47
|
%
|
47
|
%
|
47
|
%
|
||
|
Total
|
100
|
%
|
100
|
%
|
100
|
%
|
||
The plan assets of the Canadian pension plan represent approximately
9%
and
8%
of the total non-U.S. pension plan assets at
December 31, 2013
and
2012
, respectively. The expected long-term rate of return on assets for the Canadian pension plan was
6.5%
for
2013
.
The target allocation of investment assets at
December 31, 2013
, and the actual allocation at
December 31, 2013
and
2012
, for the Canadian pension plan are as follows:
|
|
Target
Allocation
|
Percentage of Plan Assets
December 31,
|
||||||
|
Canadian Pension Plan Asset Category
|
2013
|
2013
|
2012
|
|||||
|
Equity securities
|
33
|
%
|
34
|
%
|
61
|
%
|
||
|
Bonds
|
49
|
%
|
48
|
%
|
39
|
%
|
||
|
Other investments
|
18
|
%
|
18
|
%
|
—
|
%
|
||
|
Total
|
100
|
%
|
100
|
%
|
100
|
%
|
||
The plan assets of the other country plans represent approximately
8%
and
10%
in the aggregate (with no country representing more than
3%
individually) of total non-U.S. pension plan assets at
December 31, 2013
and
2012
, respectively.
The following tables present the fair value hierarchy for the non-U.S. pension plan assets measured at fair value as of
December 31, 2013
and
2012
.
|
|
Fair Value Measurements at December 31, 2013 Using
|
||||||||||||||
|
Assets Measured at Fair Value—Non-U.S. Pension Plans
(In millions)
|
Total
|
Quoted Prices
in Active
Markets for
Identical
Assets or
Liabilities
(Level 1)
|
Significant
Other
Observable
Inputs
(Level 2)
|
Significant
Unobservable
Inputs
(Level 3)
|
|||||||||||
|
Common/collective trust funds
|
$
|
294.8
|
|
$
|
—
|
|
$
|
294.8
|
|
$
|
—
|
|
|||
|
Government and agency securities
|
2.4
|
|
—
|
|
2.4
|
|
—
|
|
|||||||
|
Corporate bonds
|
1.3
|
|
—
|
|
1.3
|
|
—
|
|
|||||||
|
Insurance contracts and other investments
|
6.3
|
|
—
|
|
6.3
|
|
—
|
|
|||||||
|
Cash
|
1.7
|
|
1.7
|
|
—
|
|
—
|
|
|||||||
|
Total Assets
|
$
|
306.5
|
|
$
|
1.7
|
|
|
$
|
304.8
|
|
$
|
—
|
|
||
F-51
Notes to Consolidated Financial Statements (Continued)
11. Pension Plans and Other Postretirement Benefit Plans (Continued)
|
|
Fair Value Measurements at December 31, 2012 Using
|
||||||||||||||
|
Assets Measured at Fair Value—Non-U.S. Pension Plans
(In millions)
|
Total
|
Quoted Prices
in Active
Markets for
Identical
Assets or
Liabilities
(Level 1)
|
Significant
Other
Observable
Inputs
(Level 2)
|
Significant
Unobservable
Inputs
(Level 3)
|
|||||||||||
|
Common/collective trust funds
|
$
|
301.3
|
|
$
|
—
|
|
$
|
301.3
|
|
$
|
—
|
|
|||
|
Government and agency securities
|
2.4
|
|
—
|
|
2.4
|
|
—
|
|
|||||||
|
Corporate bonds
|
1.2
|
|
—
|
|
1.2
|
|
—
|
|
|||||||
|
Insurance contracts and other investments
|
8.0
|
|
—
|
|
8.0
|
|
—
|
|
|||||||
|
Cash
|
0.7
|
|
0.7
|
|
—
|
|
—
|
|
|||||||
|
Total Assets
|
$
|
313.6
|
|
$
|
0.7
|
|
$
|
312.9
|
|
$
|
—
|
|
|||
Plan Contributions and Funding
Grace intends to satisfy its funding obligations under the U.S. qualified pension plans and to comply with all of the requirements of the Employee Retirement Income Security Act of 1974 ("ERISA"). For ERISA purposes, funded status is calculated on a different basis than under U.S. GAAP. In March 2013, Grace made an accelerated contribution to the trusts that hold assets of the U.S. qualified pension plans of approximately
$50 million
. Based on the U.S. qualified pension plans' status as of
December 31, 2013
, there are no minimum required payments under ERISA for 2014.
Grace intends to fund non-U.S. pension plans based on applicable legal requirements and actuarial and trustee recommendations. Grace expects to contribute approximately
$18 million
to its non-U.S. pension plans and approximately
$6 million
(excluding any Medicare subsidy receipts) to its other postretirement plans in 2014.
Grace plans to pay benefits as they become due under the pay-as-you-go plans and to maintain compliance with federal funding laws for its U.S. qualified pension plans.
12. Other Balance Sheet Accounts
|
(In millions)
|
December 31, 2013
|
December 31, 2012
|
|||||
|
Other Current Liabilities
|
|
|
|||||
|
Accrued compensation
|
$
|
62.4
|
|
$
|
84.5
|
|
|
|
Income tax payable
|
32.0
|
|
44.8
|
|
|||
|
Customer volume rebates
|
33.3
|
|
32.5
|
|
|||
|
Deferred revenue
|
14.3
|
|
—
|
|
|||
|
Pension liabilities
|
15.0
|
|
14.0
|
|
|||
|
Accrued commissions
|
6.9
|
|
12.9
|
|
|||
|
Accrued Chapter 11 reorganization expenses
|
6.9
|
|
6.6
|
|
|||
|
Fair value of currency forward and commodity contracts
|
7.0
|
|
5.5
|
|
|||
|
Restructuring liability
|
4.4
|
|
3.0
|
|
|||
|
Deferred tax liability
|
0.1
|
|
0.6
|
|
|||
|
Other accrued liabilities
|
109.7
|
|
102.9
|
|
|||
|
$
|
292.0
|
|
$
|
307.3
|
|
||
Accrued compensation in the table above includes salaries and wages as well as estimated current amounts due under the annual and long-term incentive programs. Deferred revenue in the above table is related to the UNIPOL
®
polypropylene process licensing business.
F-52
Notes to Consolidated Financial Statements (Continued)
13. Commitments and Contingent Liabilities
Asbestos-Related Liability
See Note 2 for a discussion of Grace's asbestos-related liability and future obligations and contingencies following the effectiveness of the Joint Plan.
Environmental Remediation
Grace is subject to loss contingencies resulting from extensive and evolving federal, state, local and foreign environmental laws and regulations relating to the generation, storage, handling, discharge, disposition and stewardship of hazardous wastes and other materials. Grace accrues for anticipated costs associated with investigative and remediation efforts where an assessment has indicated that a probable liability has been incurred and the cost can be reasonably estimated. These accruals do not take into account any discounting for the time value of money.
Grace's environmental liabilities are reassessed whenever circumstances become better defined or remediation efforts and their costs can be better estimated. These liabilities are evaluated based on currently available information, including the progress of remedial investigation at each site, the current status of discussions with regulatory authorities regarding the method and extent of remediation at each site, existing technology, prior experience in contaminated site remediation and the apportionment of costs among potentially responsible parties.
Estimated Investigation and Remediation Costs
At
December 31, 2013
, Grace's estimated liability for environmental investigation and remediation costs (non-asbestos and asbestos-related) totaled
$135.9 million
, compared with
$141.5 million
at
December 31, 2012
. These amounts are based on funding and/or remediation agreements in place, including the Multi-Site Agreement described below, and Grace's estimate of costs for sites not subject to a formal remediation plan for which sufficient information is available to estimate investigation and remediation costs. These amounts do not include environmental response costs for the Libby vermiculite mine area or vermiculite expansion facilities, which may be material but are not currently estimable. Due to these vermiculite-related matters, it is probable that Grace's actual investigation and remediation costs will exceed Grace's current estimates by material amounts.
Grace recorded pre-tax charges of
$8.2 million
,
$3.6 million
, and
$17.8 million
for environmental matters in
2013
,
2012
, and
2011
, respectively. Net cash expenditures charged against previously established reserves in
2013
,
2012
, and
2011
were
$14.0 million
,
$13.0 million
, and
$11.8 million
, respectively.
Vermiculite-Related Matters
Grace purchased a vermiculite mine in Libby, Montana, in 1963 and operated it until 1990. Vermiculite concentrate from the Libby mine was used in the manufacture of attic insulation and other products. Some of the vermiculite ore that was mined at the Libby mine contained naturally occurring asbestos. EPA has investigated sites, including some owned by Grace, which used, stored or processed vermiculite concentrate from the Libby mine. EPA, Grace, and/or other potentially responsible parties have conducted investigations and/or remedial actions at those sites identified by EPA as requiring remedial action.
During 2010, EPA began reinvestigating certain facilities on a list of
105
facilities where vermiculite concentrate from the Libby mine may have been processed. Grace is cooperating with EPA on this reinvestigation. EPA has requested that Grace perform remediation at
eight
of these facilities. In 2011, Grace performed preliminary evaluations to estimate the cost of remediating these sites based on the revised criteria and recorded an aggregate charge of
$16.0 million
. It is probable that EPA will request additional remediation at other facilities. Grace does not have sufficient information to identify either the sites that might require additional remediation or the cost of any additional remediation. Grace will continue to monitor EPA's reinvestigation of the remaining sites and assess any information received from EPA. A liability will be recorded in the future should Grace determine that an obligation is probable and reasonably estimable.
Grace's total estimated liability for asbestos remediation studies and other estimable matters related to its former vermiculite operations in Libby, as well as the cost of remediation at vermiculite processing sites outside of Libby, at
December 31, 2013
and
2012
, was
$60.4 million
and
$60.8 million
, respectively, excluding interest where applicable. It is probable that Grace's ultimate liability will exceed current estimates by material amounts. Grace's current recorded liability will be adjusted as Grace receives new information and amounts become reasonably estimable.
F-53
Notes to Consolidated Financial Statements (Continued)
13. Commitments and Contingent Liabilities (Continued)
Non-Vermiculite-Related Matters
At
December 31, 2013
and
2012
, Grace's estimated liability for remediation of sites not related to its former vermiculite mining and processing activities was
$75.5 million
and
$80.7 million
, respectively. This liability relates to Grace's current and former operations, including its share of liability for off-site disposal at facilities where it has been identified as a potentially responsible party. Grace's estimated liability is based upon an evaluation of claims for which sufficient information is available, regulatory requirements, and environmental conditions at each site. As Grace receives new information and continues its claims evaluation process, its estimated liability may change materially.
Settlement of Environmental Claims in Chapter 11
EPA filed proofs of claim with respect to potential contamination at
38
sites, including vermiculite-related claims and non-vermiculite-related claims. In June 2008, Grace entered into a settlement agreement (the "Multi-Site Agreement") with the U.S. Government, on behalf of EPA and other federal agencies. Under the Multi-Site Agreement, Grace agreed to pay approximately
$44 million
, which is included in the liabilities described above, to the U.S. Government and other parties in settlement of
35
of these outstanding claims and the U.S. Government has agreed not to take action against Grace under the Comprehensive Environmental Response, Compensation, and Liability Act with respect to these sites. The settlement amount under the Multi-Site Agreement was paid, with interest, following the effective date of the Joint Plan in February 2014. Grace is implementing remediation at
two
of the remaining sites. With respect to the third remaining site, Libby, Montana, EPA's claims have been resolved except for claims related to the Grace-owned Libby vermiculite mine and the surrounding area. EPA is engaged in a remedial investigation of these areas to determine an appropriate cleanup standard. Grace is cooperating with EPA in this investigation.
Purchase Commitments
Grace uses purchase commitments to ensure supply and to minimize the volatility of major components of direct manufacturing costs including natural gas, certain metals, rare earths, asphalt, amines and other materials. Such commitments are for quantities that Grace fully expects to use in its normal operations.
Guarantees and Indemnification Obligations
Grace is a party to many contracts containing guarantees and indemnification obligations. These contracts primarily consist of:
|
•
|
Product warranties with respect to certain products sold to customers in the ordinary course of business. These warranties typically provide that products will conform to specifications. Grace generally does not establish a liability for product warranty based on a percentage of sales or other formula. Grace accrues a warranty liability on a transaction-specific basis depending on the individual facts and circumstances related to each sale. Both the liability and annual expense related to product warranties are immaterial to the Consolidated Financial Statements.
|
|
•
|
Licenses of intellectual property by Grace to third parties in which Grace has agreed to indemnify the licensee against third party infringement claims.
|
|
•
|
Contracts providing for the sale of a former business unit or product line in which Grace has agreed to indemnify the buyer against liabilities arising prior to the closing of the transaction, including environmental liabilities.
|
|
•
|
Guarantees of real property lease obligations of third parties, typically arising out of (a) leases entered into by former subsidiaries of Grace, or (b) the assignment or sublease of a lease by Grace to a third party.
|
Financial Assurances
Financial assurances have been established for a variety of purposes, including insurance and environmental matters, asbestos settlements and appeals, trade-related commitments and other matters. At
December 31, 2013
, Grace had gross financial assurances issued and outstanding of
$258.2 million
, composed of
$108.5 million
of surety bonds issued by various insurance companies and
$149.7 million
of standby letters of credit and other financial assurances issued by various banks;
$80.6 million
of these financial assurances have been issued under the letter of credit facility.
Accounting for Contingencies
Although the outcome of each of the matters discussed above cannot be predicted with certainty, Grace has assessed its risk and has made accounting estimates as required under
F-54
Notes to Consolidated Financial Statements (Continued)
13. Commitments and Contingent Liabilities (Continued)
U.S. GAAP. Claims related to certain of the items discussed above were addressed as part of Grace's Chapter 11 proceedings. Accruals recorded for such contingencies have been included in "liabilities subject to compromise" in the accompanying Consolidated Balance Sheets.
14. Restructuring Expenses and Related Asset Impairments
In
2013
, Grace incurred costs from restructuring actions as a result of changes in the business environment and business structure. Grace incurred
$12.5 million
(
$6.1 million
in Grace Construction Products,
$4.0 million
in Grace Catalysts Technologies,
$0.4 million
in Grace Materials Technologies and
$2.0 million
in Corporate) of restructuring expenses and related asset impairments during
2013
, compared with
$6.9 million
in
2012
(
$2.0 million
in Grace Construction Products,
$0.2 million
in Grace Catalysts Technologies,
$1.0 million
in Grace Materials Technologies and
$3.7 million
in Corporate). Substantially all costs related to the
2012
programs were paid as of
December 31, 2013
, while substantially all costs related to the
2013
restructuring programs are expected to be paid by
December 31, 2014
.
|
Restructuring Expenses and Related Asset Impairments
(In millions)
|
Year Ended December 31,
|
||||||||||
|
2013
|
2012
|
2011
|
|||||||||
|
Severance and other employee-related costs
|
$
|
6.7
|
|
$
|
5.6
|
|
$
|
3.8
|
|
||
|
Asset impairments and other restructuring costs
|
5.8
|
|
1.3
|
|
3.1
|
|
|||||
|
Total restructuring expenses and related asset impairments
|
$
|
12.5
|
|
$
|
6.9
|
|
$
|
6.9
|
|
||
|
Restructuring Liability
(In millions)
|
December 31,
|
||||||||||
|
2013
|
2012
|
2011
|
|||||||||
|
Balance, December 31, 2012
|
$
|
3.0
|
|
$
|
5.9
|
|
$
|
9.6
|
|
||
|
Accruals for severance and other costs
|
7.6
|
|
5.6
|
|
3.8
|
|
|||||
|
Payments
|
(6.4
|
)
|
(8.4
|
)
|
(7.2
|
)
|
|||||
|
Currency translation adjustments and other
|
0.2
|
|
(0.1
|
)
|
(0.3
|
)
|
|||||
|
Balance, December 31, 2013
|
$
|
4.4
|
|
$
|
3.0
|
|
$
|
5.9
|
|
||
15. Other Expense, net
Components of other expense, net are as follows:
|
|
Year Ended December 31,
|
||||||||||
|
(In millions)
|
2013
|
2012
|
2011
|
||||||||
|
Restructuring expenses and related asset impairments
|
$
|
12.5
|
|
$
|
6.9
|
|
$
|
6.9
|
|
||
|
Provision for environmental remediation
|
8.2
|
|
3.6
|
|
17.8
|
|
|||||
|
Translation effects—intercompany loans
|
(11.9
|
)
|
(5.6
|
)
|
11.7
|
|
|||||
|
Value of currency forward contracts—intercompany loans
|
10.9
|
|
3.7
|
|
(9.3
|
)
|
|||||
|
Currency transaction loss in Venezuela
|
8.5
|
|
—
|
|
—
|
|
|||||
|
Other currency transaction effects
|
5.0
|
|
2.2
|
|
3.2
|
|
|||||
|
Interest income of non-Debtor subsidiaries
|
(1.0
|
)
|
(1.0
|
)
|
(1.2
|
)
|
|||||
|
Net (gain) loss on sales of investments and disposals of assets
|
0.5
|
|
0.7
|
|
(3.0
|
)
|
|||||
|
Other miscellaneous (income) expense
|
(9.2
|
)
|
(4.4
|
)
|
3.3
|
|
|||||
|
Total other expense, net
|
$
|
23.5
|
|
$
|
6.1
|
|
$
|
29.4
|
|
||
F-55
Notes to Consolidated Financial Statements (Continued)
16. Other Comprehensive Income (Loss)
The following tables present the pre-tax, tax, and after-tax components of Grace's other comprehensive income (loss) for the years ended
December 31, 2013
,
2012
, and
2011
:
|
Year Ended December 31, 2013
(In millions)
|
Pre-Tax
Amount
|
Tax
Benefit/
(Expense)
|
After-Tax
Amount
|
||||||||
|
Defined benefit pension and other postretirement plans:
|
|
|
|
||||||||
|
Amortization of net prior service cost included in net periodic benefit cost
|
$
|
0.7
|
|
$
|
(0.2
|
)
|
$
|
0.5
|
|
||
|
Amortization of net deferred actuarial loss included in net periodic benefit cost
|
0.4
|
|
(0.1
|
)
|
0.3
|
|
|||||
|
Net prior service credit arising during period
|
1.7
|
|
(0.6
|
)
|
1.1
|
|
|||||
|
Net deferred actuarial gain arising during period
|
4.3
|
|
(1.6
|
)
|
2.7
|
|
|||||
|
Benefit plans, net
|
7.1
|
|
(2.5
|
)
|
4.6
|
|
|||||
|
Currency translation adjustments
|
(23.6
|
)
|
—
|
|
(23.6
|
)
|
|||||
|
Loss from hedging activities
|
(0.3
|
)
|
0.1
|
|
(0.2
|
)
|
|||||
|
Gain on securities available for sale
|
0.1
|
|
—
|
|
0.1
|
|
|||||
|
Other comprehensive loss attributable to W. R. Grace & Co. shareholders
|
$
|
(16.7
|
)
|
$
|
(2.4
|
)
|
$
|
(19.1
|
)
|
||
|
Year Ended December 31, 2012
(In millions)
|
Pre-Tax
Amount
|
Tax
Benefit/
(Expense)
|
After-Tax
Amount
|
||||||||
|
Defined benefit pension and other postretirement plans:
|
|
|
|
||||||||
|
Amortization of net prior service cost included in net periodic benefit cost
|
$
|
0.8
|
|
$
|
(0.3
|
)
|
$
|
0.5
|
|
||
|
Amortization of net deferred actuarial loss included in net periodic benefit cost
|
0.6
|
|
(0.2
|
)
|
0.4
|
|
|||||
|
Net deferred actuarial gain arising during period
|
2.1
|
|
(0.7
|
)
|
1.4
|
|
|||||
|
Benefit plans, net
|
3.5
|
|
(1.2
|
)
|
2.3
|
|
|||||
|
Currency translation adjustments
|
5.5
|
|
—
|
|
5.5
|
|
|||||
|
Gain from hedging activities
|
3.7
|
|
(1.3
|
)
|
2.4
|
|
|||||
|
Other comprehensive income attributable to W. R. Grace & Co. shareholders
|
$
|
12.7
|
|
$
|
(2.5
|
)
|
$
|
10.2
|
|
||
|
Year Ended December 31, 2011
(In millions)
|
Pre-Tax
Amount
|
Tax
Benefit/
(Expense)
|
After-Tax
Amount
|
||||||||
|
Defined benefit pension and other postretirement plans:
|
|
|
|
||||||||
|
Amortization of net prior service cost included in net periodic benefit cost
|
$
|
1.1
|
|
$
|
(0.4
|
)
|
$
|
0.7
|
|
||
|
Amortization of net deferred actuarial loss included in net periodic benefit cost
|
0.6
|
|
(0.2
|
)
|
0.4
|
|
|||||
|
Net prior service credit arising during period
|
0.4
|
|
(0.1
|
)
|
0.3
|
|
|||||
|
Net deferred actuarial gain arising during period
|
7.3
|
|
(2.5
|
)
|
4.8
|
|
|||||
|
Benefit plans, net
|
9.4
|
|
(3.2
|
)
|
6.2
|
|
|||||
|
Currency translation adjustments
|
(11.3
|
)
|
—
|
|
(11.3
|
)
|
|||||
|
Loss from hedging activities
|
(3.2
|
)
|
1.1
|
|
(2.1
|
)
|
|||||
|
Other comprehensive loss attributable to W. R. Grace & Co. shareholders
|
$
|
(5.1
|
)
|
$
|
(2.1
|
)
|
$
|
(7.2
|
)
|
||
F-56
Notes to Consolidated Financial Statements (Continued)
16. Other Comprehensive Income (Loss) (Continued)
The following tables present the changes in accumulated other comprehensive income, net of tax, for the years ended
December 31, 2013
,
2012
, and
2011
:
|
Year Ended December 31, 2013
(In millions)
|
Defined Benefit Pension and Other Postretirement Plans
|
Currency Translation Adjustments
|
Gains and Losses from Hedging Activities
|
Unrealized Loss on Investment
|
Gain on Securities Available for Sale
|
Total
|
|||||||||||||||||
|
Beginning balance
|
$
|
2.0
|
|
$
|
28.8
|
|
$
|
(0.3
|
)
|
$
|
(0.8
|
)
|
$
|
—
|
|
$
|
29.7
|
|
|||||
|
Other comprehensive income (loss) before reclassifications
|
3.8
|
|
(23.6
|
)
|
1.2
|
|
—
|
|
0.1
|
|
(18.5
|
)
|
|||||||||||
|
Amounts reclassified from accumulated other comprehensive income
|
0.8
|
|
—
|
|
(1.4
|
)
|
—
|
|
—
|
|
(0.6
|
)
|
|||||||||||
|
Net current-period other comprehensive income (loss)
|
4.6
|
|
(23.6
|
)
|
(0.2
|
)
|
—
|
|
0.1
|
|
(19.1
|
)
|
|||||||||||
|
Ending balance
|
$
|
6.6
|
|
$
|
5.2
|
|
$
|
(0.5
|
)
|
$
|
(0.8
|
)
|
$
|
0.1
|
|
$
|
10.6
|
|
|||||
|
Year Ended December 31, 2012
(In millions)
|
Defined Benefit Pension and Other Postretirement Plans
|
Currency Translation Adjustments
|
Gains and Losses from Hedging Activities
|
Unrealized Loss on Investment
|
Total
|
||||||||||||||
|
Beginning balance
|
$
|
(0.3
|
)
|
$
|
23.3
|
|
$
|
(2.7
|
)
|
$
|
(0.8
|
)
|
$
|
19.5
|
|
||||
|
Other comprehensive income (loss) before reclassifications
|
1.4
|
|
5.5
|
|
(0.3
|
)
|
—
|
|
6.6
|
|
|||||||||
|
Amounts reclassified from accumulated other comprehensive income
|
0.9
|
|
—
|
|
2.7
|
|
—
|
|
3.6
|
|
|||||||||
|
Net current-period other comprehensive income
|
2.3
|
|
5.5
|
|
2.4
|
|
—
|
|
10.2
|
|
|||||||||
|
Ending balance
|
$
|
2.0
|
|
$
|
28.8
|
|
$
|
(0.3
|
)
|
$
|
(0.8
|
)
|
$
|
29.7
|
|
||||
|
Year Ended December 31, 2011
(In millions)
|
Defined Benefit Pension and Other Postretirement Plans
|
Currency Translation Adjustments
|
Gains and Losses from Hedging Activities
|
Unrealized Loss on Investment
|
Total
|
||||||||||||||
|
Beginning balance
|
$
|
(6.5
|
)
|
$
|
34.6
|
|
$
|
(0.6
|
)
|
$
|
(0.8
|
)
|
$
|
26.7
|
|
||||
|
Other comprehensive income (loss) before reclassifications
|
5.1
|
|
(11.3
|
)
|
(3.9
|
)
|
—
|
|
(10.1
|
)
|
|||||||||
|
Amounts reclassified from accumulated other comprehensive income
|
1.1
|
|
—
|
|
1.8
|
|
—
|
|
2.9
|
|
|||||||||
|
Net current-period other comprehensive income (loss)
|
6.2
|
|
(11.3
|
)
|
(2.1
|
)
|
—
|
|
(7.2
|
)
|
|||||||||
|
Ending balance
|
$
|
(0.3
|
)
|
$
|
23.3
|
|
$
|
(2.7
|
)
|
$
|
(0.8
|
)
|
$
|
19.5
|
|
||||
Accumulated other comprehensive income related to the defined benefit pension and other postretirement plans at
December 31, 2013
,
2012
, and
2011
, respectively, represents the accumulation of net deferred actuarial gains of
$6.3 million
,
$3.3 million
, and
$1.5 million
as well as net prior service credits (costs) of
$0.3 million
,
$(1.3) million
, and
$(1.8) million
. These amounts are net of tax and are amortized as a component of net periodic benefit cost.
Grace is a global enterprise operating in over
40
countries with local currency generally deemed to be the functional currency for accounting purposes. The currency translation amount represents the adjustments
F-57
Notes to Consolidated Financial Statements (Continued)
16. Other Comprehensive Income (Loss) (Continued)
necessary to translate the balance sheets valued in local currencies to the U.S. dollar as of the end of each period presented, and to translate revenues and expenses at average exchange rates for each period presented.
See Note 9 for a discussion of hedging activities.
17. Shareholders' Equity
Under its Certificate of Incorporation, the Company is authorized to issue
300,000,000
shares of common stock,
$0.01
par value. As of
December 31, 2013
, the W. R. Grace & Co. 2011 Stock Incentive Plan had
800,000
shares of unissued stock reserved for issuance in the event of the exercise of stock options under the Plan. Historically all stock options exercised were covered by reissuing treasury stock. During 2013, stock options exercises exceeded the shares available in treasury stock and therefore the Company issued new shares, which were reserved for issuance under the Plans. For the years ended
December 31, 2013
,
2012
, and
2011
,
1,464,294
,
1,679,359
, and
765,693
stock options were exercised for aggregate proceeds of
$34.4 million
,
$32.2 million
, and
$12.1 million
, respectively. Additionally in 2013,
10,440
common shares were issued to members of the Board of Directors and
6,000
restricted common shares were issued to certain key employees.
The following table sets forth information relating to common stock activity for
2013
and
2012
:
|
Balance of Outstanding Shares, December 31, 2011
|
73,886,050
|
|
|
Stock options exercised
|
1,679,359
|
|
|
Balance of Outstanding Shares, December 31, 2012
|
75,565,409
|
|
|
Stock options exercised
|
1,464,294
|
|
|
Shares Issued
|
16,440
|
|
|
Balance of Outstanding Shares, December 31, 2013
|
77,046,143
|
|
18. Stock Incentive Plans
The Company has granted nonstatutory stock options to certain key employees under the Plans. The Plans are administered by the Compensation Committee of the Board of Directors. Stock options are generally non-qualified and are at exercise prices not less than
100%
of the per share fair market value on the date of grant. Stock-based compensation awards granted under the Company's stock incentive plans are generally subject to a vesting period from the date of the grant ranging from
1
-
3
years. Currently outstanding options expire on various dates through November 2018.
F-58
Notes to Consolidated Financial Statements (Continued)
18. Stock Incentive Plans (Continued)
The following table sets forth information relating to such options during
2013
,
2012
, and
2011
:
|
Stock Option Activity
|
Number Of
Shares
|
Average
Exercise
Price
|
Weighted-
Average
Grant Date
Fair Value
|
|||||||
|
Balance, January 1, 2011
|
4,468,341
|
|
$
|
18.48
|
|
|||||
|
Options exercised
|
(765,693
|
)
|
15.76
|
|
||||||
|
Options forfeited
|
(45,369
|
)
|
22.30
|
|
||||||
|
Options terminated
|
(7,011
|
)
|
8.03
|
|
|
|
||||
|
Options granted
|
1,287,152
|
|
42.18
|
|
$
|
15.44
|
|
|||
|
Balance, December 31, 2011
|
4,937,420
|
|
25.08
|
|
||||||
|
Options exercised
|
(1,679,359
|
)
|
19.14
|
|
||||||
|
Options forfeited
|
(51,573
|
)
|
37.67
|
|
||||||
|
Options terminated
|
(10,995
|
)
|
15.74
|
|
||||||
|
Options granted
|
828,991
|
|
49.01
|
|
16.67
|
|
||||
|
Balance, December 31, 2012
|
4,024,484
|
|
32.33
|
|
||||||
|
Options exercised
|
(1,464,294
|
)
|
23.46
|
|
||||||
|
Options forfeited
|
(95,139
|
)
|
52.17
|
|
||||||
|
Options terminated
|
(1,381
|
)
|
42.26
|
|
||||||
|
Options granted
|
421,385
|
|
76.70
|
|
19.26
|
|
||||
|
Balance, December 31, 2013
|
2,885,055
|
|
42.60
|
|
|
|
||||
The following is a summary of non-vested option activity for the year ended
December 31, 2013
:
|
Stock Option Activity
|
Number Of
Shares
|
Weighted-
Average
Grant Date
Fair Value
|
||||
|
Non-vested options outstanding at beginning of year
|
2,067,673
|
|
$
|
14.90
|
|
|
|
Granted
|
421,385
|
|
19.26
|
|
||
|
Vested / exercised
|
(1,101,080
|
)
|
12.83
|
|
||
|
Forfeited
|
(105,053
|
)
|
16.44
|
|
||
|
Non vested options outstanding at end of year
|
1,282,925
|
|
|
|
||
As of
December 31, 2013
, the intrinsic value (the difference between the exercise price and the market price) for options outstanding was
$160.5 million
and for options exercisable was
$105.9 million
. The total intrinsic value of all options exercised during the years ended
December 31, 2013
,
2012
and
2011
was
$83.2 million
,
$65.3 million
and
$21.9 million
, respectively. A summary of our stock options outstanding and exercisable at
December 31, 2013
, follows:
F-59
Notes to Consolidated Financial Statements (Continued)
18. Stock Incentive Plans (Continued)
|
Exercise Price Range
|
Number
Outstanding
|
Number
Exercisable
|
Outstanding Weighted-
Average
Remaining
Contractual
Life (Years)
|
Exercisable
Weighted-
Average
Exercise
Price
|
|||||||
|
$0 - $10
|
253,551
|
|
253,551
|
|
0.35
|
$
|
9.79
|
|
|||
|
$20 - $30
|
644,916
|
|
644,916
|
|
1.34
|
27.75
|
|
||||
|
$30 - $40
|
11,192
|
|
5,794
|
|
2.61
|
37.06
|
|
||||
|
$40 - $50
|
1,550,004
|
|
689,602
|
|
2.84
|
44.07
|
|
||||
|
$60 - $70
|
24,787
|
|
8,267
|
|
3.93
|
66.57
|
|
||||
|
$70 - $80
|
398,380
|
|
—
|
|
4.33
|
—
|
|
||||
|
$80 - $90
|
2,225
|
|
—
|
|
4.49
|
—
|
|
||||
|
2,885,055
|
|
1,602,130
|
|
||||||||
At
December 31, 2013
, the weighted-average remaining contractual term of all options outstanding and exercisable was
2.50
years.
Options Granted
The Company granted approximately
0.4 million
,
0.8 million
, and
1.3 million
nonstatutory stock options in
2013
,
2012
, and
2011
, respectively, under the Plans.
For the years ended
December 31, 2013
,
2012
and
2011
, Grace recognized non-cash stock-based compensation expense of
$12.7 million
,
$14.7 million
and
$14.0 million
, respectively, which is included in selling, general and administrative expense.
Grace values options using the Black-Scholes option-pricing model, which was developed for use in estimating the fair value of traded options. The risk-free rate is based on the U.S. Treasury yield curve published as of the grant date, with maturities approximating the expected term of the options. The expected term of the options is estimated using the simplified method as allowed by ASC 718-20, whereby the average between the vesting period and contractual term is used. The expected volatility was estimated using both actual stock volatility and the volatility of an industry peer group. Grace believes its actual stock volatility in the last several years may not be representative of expected future volatility. The following summarizes the assumptions used for estimating the fair value of stock options granted during
2013
,
2012
and
2011
, respectively.
|
2013
|
2012
|
2011
|
|||
|
Expected volatility
|
32.3% - 34.3%
|
35.8% - 46.4%
|
46.5% -50.7%
|
||
|
Weighted average expected volatility
|
33.3%
|
40.6%
|
48.7%
|
||
|
Expected term
|
3.00 - 4.00 years
|
3.00 - 4.00 years
|
3.00 - 4.00 years
|
||
|
Risk-free rate
|
0.61%
|
0.55%
|
1.43%
|
||
|
Dividend yield
|
—%
|
—%
|
—%
|
||
Total unrecognized stock-based compensation expense at
December 31, 2013
, was
$6.3 million
and the weighted-average period over which this expense will be recognized is
0.7
years.
Performance Based Units
During
2013
the Company granted
111,770
Performance Based Units (PBUs) under the Company's Long-term Incentive Plan (LTIP), of which
5,513
were forfeited. The awards cliff vest on December 31,
2015
, and have a weighted average grant date fair value of $
76.66
. The Company anticipates that approximately
54%
of the PBUs will be settled in common stock and approximately
46%
will be settled in cash, assuming full vesting. PBUs are recorded at fair value at the date of grant. The estimated grant date fair value is based on the expected payout of the award, which may range from
0%
to
200%
of the payout target. The common stock settled portion is considered an equity award with the payout being valued based on the Company’s stock price on the grant date. The cash settled portion of the award is considered a liability award with payout being remeasured each reporting period based on the Company’s current stock price. Both equity and cash awards are remeasured each reporting period based on anticipated attainment of the payout target; therefore these portions of the awards are subject to volatility until the payout is established. During
2013
the Company recognized
$1.7
million in compensation expense for these awards. As of
December 31, 2013
,
$5.3
million of total unrecognized
F-60
Notes to Consolidated Financial Statements (Continued)
18. Stock Incentive Plans (Continued)
compensation expense related to the PBUs is expected to be recognized over the remaining weighted-average service period of
2
years.
19. Earnings Per Share
The following table shows a reconciliation of the numerators and denominators used in calculating basic and diluted earnings per share.
|
(In millions, except per share amounts)
|
2013
|
2012
|
2011
|
||||||||
|
Numerators
|
|
|
|
||||||||
|
Net income attributable to W. R. Grace & Co. shareholders
|
$
|
256.1
|
|
$
|
40.0
|
|
$
|
219.7
|
|
||
|
Denominators
|
|
|
|
||||||||
|
Weighted average common shares—basic calculation
|
76.4
|
|
74.9
|
|
73.6
|
|
|||||
|
Dilutive effect of employee stock options
|
1.3
|
|
1.4
|
|
1.9
|
|
|||||
|
Weighted average common shares—diluted calculation
|
77.7
|
|
76.3
|
|
75.5
|
|
|||||
|
Basic earnings per share
|
$
|
3.35
|
|
$
|
0.53
|
|
$
|
2.99
|
|
||
|
Diluted earnings per share
|
$
|
3.30
|
|
$
|
0.52
|
|
$
|
2.91
|
|
||
There were approximately
0.3 million
,
0.4 million
and
1.3 million
anti-dilutive options outstanding for the years ended
December 31, 2013
,
2012
and
2011
, respectively. The effect of the warrant for
10 million
shares issued under the Joint Plan, as discussed in Note 2, is not included in diluted earnings per share.
20. Operating Segment Information
Grace is a global producer of specialty chemicals and specialty materials. Grace manages its business through
three
operating segments: Grace Catalysts Technologies, Grace Materials Technologies, and Grace Construction Products. Grace Catalysts Technologies includes catalysts and related products and technologies used in refining, petrochemical and other chemical manufacturing applications. Grace's Advanced Refining Technologies (ART) joint venture is managed in this segment. ART is an unconsolidated affiliate, and Grace accounts for ART using the equity method as discussed in Note 21. Grace Materials Technologies includes packaging technologies and engineered materials, coatings and sealants used in consumer, industrial, and pharmaceutical applications. Grace Construction Products includes specialty construction chemicals and specialty building materials used in commercial, infrastructure and residential construction. Intersegment sales are eliminated in consolidation. The table below presents information related to Grace's operating segments. Only those corporate expenses directly related to the operating segments are allocated for reporting purposes. All remaining corporate items are reported separately and labeled as such.
Grace also excludes defined benefit pension expense from the calculation of segment operating income. Grace believes that the exclusion of defined benefit pension expense provides a better indicator of its operating segment performance as defined benefit pension expense is not managed at an operating segment level.
Grace defines Adjusted EBIT (a non-GAAP financial measure) to be net income adjusted for interest income and expense, income taxes, costs related to Chapter 11, asbestos-related costs, restructuring expenses and related asset impairments, pension costs other than service and interest costs, expected returns on plan assets and amortization of prior service costs/credits, certain income and expense items related to divested businesses, product lines and certain other investments, and gains and losses on sales of businesses, product lines and certain other investments. In the 2013 first quarter, Grace also adjusted for the currency transaction loss incurred on our Venezuelan cash balances of
$6.9 million
before taxes.
F-61
Notes to Consolidated Financial Statements (Continued)
20. Operating Segment Information (Continued)
Operating Segment Data
|
(In millions)
|
2013
|
2012
|
2011
|
||||||||
|
Net Sales
|
|
|
|
||||||||
|
Catalysts Technologies
|
$
|
1,124.0
|
|
$
|
1,268.1
|
|
$
|
1,347.3
|
|
||
|
Materials Technologies
|
878.5
|
|
862.6
|
|
872.6
|
|
|||||
|
Construction Products
|
1,058.2
|
|
1,024.8
|
|
992.0
|
|
|||||
|
Total
|
$
|
3,060.7
|
|
$
|
3,155.5
|
|
$
|
3,211.9
|
|
||
|
Adjusted EBIT
|
|
|
|
||||||||
|
Catalysts Technologies segment operating income
|
$
|
327.5
|
|
$
|
393.8
|
|
$
|
388.8
|
|
||
|
Materials Technologies segment operating income
|
181.8
|
|
162.0
|
|
158.7
|
|
|||||
|
Construction Products segment operating income
|
151.7
|
|
125.2
|
|
97.3
|
|
|||||
|
Corporate costs
|
(82.8
|
)
|
(92.4
|
)
|
(102.8
|
)
|
|||||
|
Certain pension costs
|
(27.4
|
)
|
(30.4
|
)
|
(28.7
|
)
|
|||||
|
Total
|
$
|
550.8
|
|
$
|
558.2
|
|
$
|
513.3
|
|
||
|
Depreciation and Amortization
|
|||||||||||
|
Catalysts Technologies
|
$
|
54.2
|
|
$
|
54.0
|
|
$
|
52.5
|
|
||
|
Materials Technologies
|
31.4
|
|
29.5
|
|
30.9
|
|
|||||
|
Construction Products
|
31.8
|
|
32.9
|
|
34.0
|
|
|||||
|
Corporate
|
5.7
|
|
2.6
|
|
2.6
|
|
|||||
|
Total
|
$
|
123.1
|
|
$
|
119.0
|
|
$
|
120.0
|
|
||
|
Capital Expenditures
|
|
|
|||||||||
|
Catalysts Technologies
|
$
|
58.7
|
|
$
|
70.8
|
|
$
|
74.5
|
|
||
|
Materials Technologies
|
33.0
|
|
27.1
|
|
32.3
|
|
|||||
|
Construction Products
|
32.8
|
|
26.5
|
|
19.5
|
|
|||||
|
Corporate
|
31.7
|
|
14.1
|
|
17.7
|
|
|||||
|
Total
|
$
|
156.2
|
|
$
|
138.5
|
|
$
|
144.0
|
|
||
|
Total Assets
|
|||||||||||
|
Catalysts Technologies
|
$
|
1,361.8
|
|
$
|
794.8
|
|
$
|
804.5
|
|
||
|
Materials Technologies
|
508.9
|
|
494.9
|
|
481.1
|
|
|||||
|
Construction Products
|
609.1
|
|
616.0
|
|
545.9
|
|
|||||
|
Corporate
|
2,916.3
|
|
3,184.7
|
|
2,664.1
|
|
|||||
|
Total
|
$
|
5,396.1
|
|
$
|
5,090.4
|
|
$
|
4,495.6
|
|
||
Corporate costs include corporate support function costs and other corporate costs such as non-asbestos environmental remediation, insurance premiums and professional fees.
Grace Adjusted EBIT for the years ended
December 31, 2013
,
2012
and
2011
is reconciled below to income before income taxes presented in the accompanying Consolidated Statements of Operations.
F-62
Notes to Consolidated Financial Statements (Continued)
20. Operating Segment Information (Continued)
Reconciliation of Operating Segment Data to Financial Statements
|
|
Year Ended December 31,
|
||||||||||
|
(In millions)
|
2013
|
2012
|
2011
|
||||||||
|
Grace Adjusted EBIT
|
$
|
550.8
|
|
$
|
558.2
|
|
$
|
513.3
|
|
||
|
Chapter 11-related costs, net
|
(16.4
|
)
|
(15.6
|
)
|
(23.9
|
)
|
|||||
|
Asbestos-related costs
|
(11.9
|
)
|
(7.6
|
)
|
(20.8
|
)
|
|||||
|
Asbestos and bankruptcy-related charges, net
|
(21.9
|
)
|
(384.6
|
)
|
—
|
|
|||||
|
Default interest settlement
|
(129.0
|
)
|
—
|
|
—
|
|
|||||
|
Pension MTM adjustment and other related costs, net
|
50.6
|
|
(119.2
|
)
|
(111.2
|
)
|
|||||
|
Restructuring expenses and related asset impairments
|
(12.5
|
)
|
(6.9
|
)
|
(6.9
|
)
|
|||||
|
Loss on sale of product line
|
(1.0
|
)
|
(0.2
|
)
|
(0.4
|
)
|
|||||
|
Income and expense related to divested businesses
|
—
|
|
(0.2
|
)
|
(0.4
|
)
|
|||||
|
Interest expense and related financing costs
|
(43.8
|
)
|
(46.5
|
)
|
(43.3
|
)
|
|||||
|
Currency transaction loss on cash in Venezuela
|
(6.9
|
)
|
—
|
|
—
|
|
|||||
|
Interest income of non-Debtor subsidiaries
|
1.0
|
|
1.0
|
|
1.2
|
|
|||||
|
Net income (loss) attributable to noncontrolling interests
|
1.6
|
|
1.0
|
|
(0.6
|
)
|
|||||
|
Income (loss) before income taxes
|
$
|
360.6
|
|
$
|
(20.6
|
)
|
$
|
307.0
|
|
||
F-63
Notes to Consolidated Financial Statements (Continued)
20. Operating Segment Information (Continued)
The table below presents information related to the geographic areas in which Grace operates. Sales are attributed to geographic areas based on customer location.
Geographic Area Data
|
(In millions)
|
2013
|
2012
|
2011
|
||||||||
|
Net Sales
|
|
|
|
||||||||
|
United States
|
$
|
886.0
|
|
$
|
878.9
|
|
$
|
945.0
|
|
||
|
Canada and Puerto Rico
|
73.7
|
|
88.7
|
|
96.8
|
|
|||||
|
Total North America
|
959.7
|
|
967.6
|
|
1,041.8
|
|
|||||
|
Europe Middle East Africa
|
1,087.9
|
|
1,175.6
|
|
1,260.4
|
|
|||||
|
Asia Pacific
|
654.1
|
|
660.3
|
|
599.3
|
|
|||||
|
Latin America
|
359.0
|
|
352.0
|
|
310.4
|
|
|||||
|
Total
|
$
|
3,060.7
|
|
$
|
3,155.5
|
|
$
|
3,211.9
|
|
||
|
Properties and Equipment, net
|
|
|
|
||||||||
|
United States
|
$
|
497.8
|
|
$
|
438.4
|
|
$
|
421.1
|
|
||
|
Canada and Puerto Rico
|
19.1
|
|
19.8
|
|
19.5
|
|
|||||
|
Total North America
|
516.9
|
|
458.2
|
|
440.6
|
|
|||||
|
Europe Middle East Africa
|
212.4
|
|
210.3
|
|
202.1
|
|
|||||
|
Asia Pacific
|
70.9
|
|
72.1
|
|
53.8
|
|
|||||
|
Latin America
|
29.7
|
|
29.9
|
|
27.0
|
|
|||||
|
Total
|
$
|
829.9
|
|
$
|
770.5
|
|
$
|
723.5
|
|
||
|
Goodwill, Intangibles and Other Assets
|
|
|
|
||||||||
|
United States
|
$
|
589.7
|
|
$
|
91.5
|
|
$
|
110.3
|
|
||
|
Canada and Puerto Rico
|
8.6
|
|
7.3
|
|
7.3
|
|
|||||
|
Total North America
|
598.3
|
|
98.8
|
|
117.6
|
|
|||||
|
Europe Middle East Africa
|
106.4
|
|
105.2
|
|
108.9
|
|
|||||
|
Asia Pacific
|
52.4
|
|
40.1
|
|
12.4
|
|
|||||
|
Latin America
|
55.9
|
|
59.8
|
|
17.9
|
|
|||||
|
Total
|
$
|
813.0
|
|
$
|
303.9
|
|
$
|
256.8
|
|
||
21. Unconsolidated Affiliate
Grace accounts for its
50%
ownership interest in ART using the equity method of accounting. Grace's investment in ART amounted to
$96.2 million
and
$85.5 million
as of
December 31, 2013
and
2012
, respectively, and the amount included in "equity in earnings of unconsolidated affiliate" in the Consolidated Statements of Operations totaled
$22.9 million
,
$18.5 million
and
$15.2 million
for the years ended
December 31, 2013
,
2012
and
2011
, respectively. ART is a private company and accordingly does not have a quoted market price available. The following summary lists ART's assets, liabilities and results of operations.
F-64
Notes to Consolidated Financial Statements (Continued)
21. Unconsolidated Affiliate (Continued)
|
December 31,
|
|||||||
|
(In millions)
|
2013
|
2012
|
|||||
|
Summary of Balance Sheet information:
|
|||||||
|
Current assets
|
$
|
187.9
|
|
$
|
136.7
|
|
|
|
Noncurrent assets
|
62.5
|
|
65.9
|
|
|||
|
Total assets
|
$
|
250.4
|
|
$
|
202.6
|
|
|
|
Current liabilities
|
$
|
62.6
|
|
$
|
37.8
|
|
|
|
Noncurrent liabilities
|
0.6
|
|
0.1
|
|
|||
|
Total liabilities
|
$
|
63.2
|
|
$
|
37.9
|
|
|
|
Year Ended December 31,
|
|||||||||||
|
(In millions)
|
2013
|
2012
|
2011
|
||||||||
|
Summary of Statement of Operations information:
|
|||||||||||
|
Net sales
|
$
|
377.6
|
|
$
|
325.0
|
|
$
|
339.0
|
|
||
|
Costs and expenses applicable to net sales
|
318.4
|
|
276.0
|
|
296.3
|
|
|||||
|
Income before income taxes
|
46.6
|
|
38.9
|
|
32.8
|
|
|||||
|
Net income
|
45.6
|
|
37.8
|
|
31.2
|
|
|||||
Grace and ART transact business on a regular basis and maintain several agreements in order to support the joint venture. These agreements are treated as related party activities with an unconsolidated affiliate. The table below presents summary financial data related to transactions between Grace and ART.
|
Year Ended December 31,
|
|||||||||||
|
(In millions)
|
2013
|
2012
|
2011
|
||||||||
|
Grace sales of catalysts to ART
|
$
|
232.0
|
|
$
|
206.9
|
|
$
|
171.4
|
|
||
|
Charges for fixed costs, research and development and selling, general and administrative services to ART
|
28.8
|
|
28.5
|
|
27.8
|
|
|||||
Grace and Chevron provide lines of credit in the amount of
$15 million
each at a commitment fee of
0.1%
of the credit amount. These agreements expire on February 28, 2014. No amounts were outstanding at
December 31, 2013
and
2012
.
22. Noncontrolling Interests in Consolidated Affiliates
Grace conducts certain business activities in various countries through joint ventures with unaffiliated third parties. In certain cases, the financial results and financial position of these joint ventures are fully included in Grace's consolidated financial statements with the partner's interest reflected in noncontrolling interests in the Consolidated Statements of Operations and Consolidated Balance Sheets. The following tables present summary financial information for Grace's consolidated affiliates for which there is a noncontrolling interest:
|
Statements of Operations
(In millions)
|
Year Ended December 31,
|
||||||||||
|
2013
|
2012
|
2011
|
|||||||||
|
Sales
|
$
|
101.5
|
|
$
|
108.8
|
|
$
|
86.3
|
|
||
|
Income (loss) before taxes
|
2.7
|
|
0.8
|
|
(0.1
|
)
|
|||||
|
Net income (loss)
|
3.4
|
|
1.1
|
|
(0.9
|
)
|
|||||
|
Noncontrolling interests in net income (loss)
|
1.6
|
|
1.0
|
|
(0.6
|
)
|
|||||
F-65
Notes to Consolidated Financial Statements (Continued)
22. Noncontrolling Interests in Consolidated Affiliates (Continued)
|
Balance Sheets
(In millions)
|
December 31,
|
||||||||||
|
2013
|
2012
|
2011
|
|||||||||
|
Cash
|
$
|
5.1
|
|
$
|
5.7
|
|
$
|
6.7
|
|
||
|
Other current assets
|
33.4
|
|
41.6
|
|
34.7
|
|
|||||
|
Total assets
|
71.1
|
|
73.8
|
|
53.0
|
|
|||||
|
Total liabilities
|
48.9
|
|
46.1
|
|
30.1
|
|
|||||
|
Shareholders' equity
|
22.2
|
|
27.7
|
|
22.9
|
|
|||||
|
Noncontrolling interests in shareholders' equity
|
10.6
|
|
9.9
|
|
8.1
|
|
|||||
23. Quarterly Summary and Statistical Information (Unaudited)
|
(In millions, except per share amounts)
|
March 31(1)
|
June 30(2)
|
September 30(3)
|
December 31
|
|||||||||||
|
2013
|
|
|
|
|
|||||||||||
|
Net sales
|
$
|
709.9
|
|
$
|
802.8
|
|
$
|
771.3
|
|
$
|
776.7
|
|
|||
|
Gross profit
|
259.0
|
|
300.9
|
|
282.4
|
|
299.8
|
|
|||||||
|
Net income
|
59.1
|
|
90.3
|
|
77.0
|
|
29.7
|
|
|||||||
|
Net income per share:(4)
|
|
|
|
|
|||||||||||
|
Basic earnings per share:
|
|
|
|
|
|||||||||||
|
Net income
|
$
|
0.78
|
|
$
|
1.18
|
|
$
|
1.00
|
|
$
|
0.39
|
|
|||
|
Diluted earnings per share:
|
|
|
|
|
|||||||||||
|
Net income
|
0.77
|
|
1.16
|
|
0.99
|
|
0.38
|
|
|||||||
|
Market price of common stock:(5)
|
|
|
|
|
|||||||||||
|
High
|
$
|
79.14
|
|
$
|
85.43
|
|
$
|
89.80
|
|
$
|
101.72
|
|
|||
|
Low
|
68.23
|
|
72.00
|
|
74.46
|
|
85.06
|
|
|||||||
|
Close
|
77.51
|
|
84.04
|
|
87.40
|
|
98.87
|
|
|||||||
_______________________________________________________________________________
|
(1)
|
The retrospective application of the change in method of accounting relating to our global defined benefit pension plans in
fourth quarter 2013
, resulted in first quarter 2013 decrease to Gross profit of
$4.8 million
, and increases to Net income of
$6.2 million
, Basic earnings per share of
$0.08
and Diluted earnings per share of
$0.08
.
|
|
(2)
|
The retrospective application of the change in method of accounting relating to our global defined benefit pension plans in
fourth quarter 2013
, resulted in second quarter 2013 decrease to Gross profit of
$2.4 million
, and increases to Net income of
$7.5 million
, Basic earnings per share of
$0.10
and Diluted earnings per share of
$0.10
.
|
|
(3)
|
The retrospective application of the change in method of accounting relating to our global defined benefit pension plans in
fourth quarter 2013
, resulted in third quarter 2013 decrease to Gross profit of
$2.3 million
, and increases to Net income of
$7.6 million
, Basic earnings per share of
$0.10
and Diluted earnings per share of
$0.10
.
|
|
(4)
|
Per share results for the four quarters may differ from full-year per share results, as a separate computation of the weighted average number of shares outstanding is made for each quarter presented.
|
|
(5)
|
Principal market: New York Stock Exchange.
|
F-66
Notes to Consolidated Financial Statements (Continued)
23. Quarterly Summary and Statistical Information (Unaudited) (Continued)
|
(In millions, except per share amounts)
|
March 31(1)
|
June 30(2)
|
September 30(3)
|
December 31(4)
|
|||||||||||
|
2012
|
|
|
|
|
|||||||||||
|
Net sales
|
$
|
754.4
|
|
$
|
826.7
|
|
$
|
776.6
|
|
$
|
797.8
|
|
|||
|
Gross profit
|
272.5
|
|
301.4
|
|
282.2
|
|
258.3
|
|
|||||||
|
Net income (loss)
|
66.8
|
|
75.4
|
|
82.1
|
|
(184.3
|
)
|
|||||||
|
Net income per share:(5)
|
|
|
|
|
|||||||||||
|
Basic earnings per share:
|
|
|
|
|
|||||||||||
|
Net income (loss)
|
$
|
0.90
|
|
$
|
1.01
|
|
$
|
1.09
|
|
$
|
(2.44
|
)
|
|||
|
Diluted earnings per share:
|
|
|
|
|
|||||||||||
|
Net income (loss)
|
0.87
|
|
0.98
|
|
1.07
|
|
(2.44
|
)
|
|||||||
|
Market price of common stock:(6)
|
|
|
|
|
|||||||||||
|
High
|
$
|
58.89
|
|
$
|
61.08
|
|
$
|
61.58
|
|
$
|
68.86
|
|
|||
|
Low
|
45.39
|
|
47.40
|
|
48.14
|
|
58.40
|
|
|||||||
|
Close
|
57.80
|
|
50.45
|
|
59.08
|
|
67.23
|
|
|||||||
_______________________________________________________________________________
|
(1)
|
The retrospective application of the change in method of accounting relating to our global defined benefit pension plans in
fourth quarter 2013
, resulted in first quarter 2012 decrease to Gross profit of
$4.6 million
, and increases to Net income of
$5.9 million
, Basic earnings per share of
$0.08
and Diluted earnings per share of
$0.08
.
|
|
(2)
|
The retrospective application of the change in method of accounting relating to our global defined benefit pension plans in
fourth quarter 2013
, resulted in second quarter 2012 decrease to Gross profit of
$2.7 million
, and increases to Net income of
$6.1 million
, Basic earnings per share of
$0.08
and Diluted earnings per share of
$0.08
.
|
|
(3)
|
The retrospective application of the change in method of accounting relating to our global defined benefit pension plans in
fourth quarter 2013
, resulted in third quarter 2012 decrease to Gross profit of
$2.6 million
, and increases to Net income of
$6.6 million
, Basic earnings per share of
$0.09
and Diluted earnings per share of
$0.09
.
|
|
(4)
|
The retrospective application of the change in method of accounting relating to our global defined benefit pension plans in
fourth quarter 2013
, resulted in a fourth quarter 2012 decreases to Gross profit of
$42.0 million
,, Net income of
$72.7 million
, Basic earnings per share of
$0.96
and Diluted earnings per share of
$0.96
.
|
|
(5)
|
Per share results for the four quarters may differ from full-year per share results, as a separate computation of the weighted average number of shares outstanding is made for each quarter presented.
|
|
(6)
|
Principal market: New York Stock Exchange.
|
F-67
SELECTED FINANCIAL DATA(1)(2)
|
(In millions, except per share amounts)
|
2013
|
2012
|
2011
|
2010
|
2009
|
||||||||||||||
|
Statement of Operations
|
|
|
|
|
|
||||||||||||||
|
Net sales
|
$
|
3,060.7
|
|
$
|
3,155.5
|
|
$
|
3,211.9
|
|
$
|
2,675.0
|
|
$
|
2,825.0
|
|
||||
|
Income before income taxes(3)
|
360.6
|
|
(20.6
|
)
|
307.0
|
|
220.3
|
|
104.4
|
|
|||||||||
|
Net income
|
257.7
|
|
41.0
|
|
219.1
|
|
194.1
|
|
86.3
|
|
|||||||||
|
Net loss (income) attributable to noncontrolling interests
|
(1.6
|
)
|
(1.0
|
)
|
0.6
|
|
(0.3
|
)
|
(10.0
|
)
|
|||||||||
|
Net income attributable to W. R. Grace & Co. shareholders
|
256.1
|
|
40.0
|
|
219.7
|
|
193.8
|
|
76.3
|
|
|||||||||
|
Financial Position
|
|
|
|
||||||||||||||||
|
Cash and cash equivalents
|
$
|
964.8
|
|
$
|
1,336.9
|
|
$
|
1,048.3
|
|
$
|
1,015.7
|
|
$
|
893.0
|
|
||||
|
Property and equipment, net
|
829.9
|
|
770.5
|
|
723.5
|
|
702.5
|
|
690.1
|
|
|||||||||
|
Total assets
|
5,396.1
|
|
5,090.4
|
|
4,495.6
|
|
4,243.2
|
|
3,942.5
|
|
|||||||||
|
Total liabilities
|
4,824.9
|
|
4,770.6
|
|
4,311.4
|
|
4,298.9
|
|
4,219.7
|
|
|||||||||
|
Liabilities subject to compromise (a subset of total liabilities)
|
3,776.1
|
|
3,619.9
|
|
3,191.5
|
|
3,171.9
|
|
3,146.9
|
|
|||||||||
|
Shareholders' equity (deficit)
|
571.2
|
|
319.8
|
|
184.2
|
|
(55.7
|
)
|
(277.2
|
)
|
|||||||||
|
Cash Flow
|
|
|
|
|
|
||||||||||||||
|
Operating activities
|
$
|
515.9
|
|
$
|
453.6
|
|
$
|
219.4
|
|
$
|
325.9
|
|
$
|
433.4
|
|
||||
|
Investing activities
|
(880.7
|
)
|
(280.3
|
)
|
(220.9
|
)
|
(243.1
|
)
|
26.1
|
|
|||||||||
|
Financing activities
|
(8.4
|
)
|
110.3
|
|
39.7
|
|
41.5
|
|
(41.3
|
)
|
|||||||||
|
Net cash flow
|
(372.1
|
)
|
288.6
|
|
32.6
|
|
122.7
|
|
432.9
|
|
|||||||||
|
Data Per Common Share (Diluted)
|
|
|
|
|
|
||||||||||||||
|
Net income
|
$
|
3.30
|
|
$
|
0.52
|
|
$
|
2.91
|
|
$
|
2.61
|
|
$
|
1.05
|
|
||||
|
Average common diluted shares outstanding
|
77.7
|
|
76.3
|
|
75.5
|
|
74.4
|
|
72.6
|
|
|||||||||
|
Other Statistics
|
|
|
|
|
|
||||||||||||||
|
Capital expenditures
|
$
|
156.2
|
|
$
|
138.5
|
|
$
|
144.0
|
|
$
|
111.1
|
|
$
|
93.8
|
|
||||
|
Common stock price range
|
68.23-101.72
|
|
45.39-68.86
|
|
30.25-52.50
|
|
19.63-36.27
|
|
4.07-26.17
|
|
|||||||||
|
Common shareholders of record
|
7,077
|
|
7,591
|
|
8,063
|
|
8,270
|
|
8,505
|
|
|||||||||
|
Number of employees (approximately)
|
6,700
|
|
6,500
|
|
6,300
|
|
6,000
|
|
5,900
|
|
|||||||||
_______________________________________________________________________________
|
(1)
|
Certain prior-year amounts have been reclassified to conform to the
2013
presentation.
|
|
(2)
|
Amounts have been revised as a result of our fourth quarter change to mark-to-market pension accounting. See Note 1 to the Consolidated Financial Statements for more information.
|
|
(3)
|
Adjustments related to our asbestos-related liability, Chapter 11, and pension mark-to-market accounting are included in and affect the period-to-period comparability of Income before income taxes. See Note 20 to the Consolidated Financial Statements for a detail of these items.
|
F-68
Management's Discussion and Analysis of Financial Condition and Results of Operations
See "Analysis of Operations" for a discussion of our non-GAAP performance measures. Our references to "advanced economies" and "emerging regions" refer to classifications established by the International Monetary Fund.
Results of Operations
2013
Performance Summary
Following is a summary of our financial performance for the year ended
December 31, 2013
, compared with the prior year.
|
•
|
Net sales decreased
3.0%
to
$3,060.7 million
, as improved base pricing and higher sales volumes were offset by lower rare earth surcharges and unfavorable currency translation.
|
|
•
|
Segment Gross Margin increased
10
basis points to
37.1%
.
|
|
•
|
Adjusted EBIT decreased
1.3%
to
$550.8 million
.
|
|
•
|
Grace net income increased to
$256.1 million
or
$3.30
per diluted share primarily due to a favorable mark-to-market pension adjustment in 2013 compared with an unfavorable adjustment in the prior year, and a reduction in the amount of asbestos and bankruptcy-related charges, partially offset by a $129.0 million charge in 2013 related to the default interest settlement.
|
Summary Description of Business
We are engaged in specialty chemicals and specialty materials businesses on a worldwide basis through our three operating segments, Grace Catalysts Technologies, Grace Materials Technologies, and Grace Construction Products. See Item 1 (Business—Business Overview) of this Report for a summary description of our core business.
Analysis of Operations
We have set forth in the table below our key operating statistics with percentage changes for the years ended
December 31, 2013
,
2012
, and
2011
. Please refer to this Analysis of Operations when reviewing this Management's Discussion and Analysis of Financial Condition and Results of Operations.
In 2013 we elected to change our method of accounting for deferred actuarial gains and losses relating to our global defined benefit pension plans. The new accounting method, referred to as mark-to-market accounting, was adopted in the 2013 fourth quarter and retrospectively applied to our financial results for all periods presented in this report. See Note 1 to the Consolidated Financial Statements under the caption "Change in Accounting Principle Regarding Pension Benefits" for additional information.
We define Adjusted EBIT (a non-GAAP financial measure) to be net income adjusted for interest income and expense, income taxes, costs related to Chapter 11, asbestos-related costs, restructuring expenses and related asset impairments, pension costs other than service and interest costs, expected returns on plan assets, and amortization of prior service costs/credits, certain income and expense items related to divested businesses, product lines, and certain other investments and gains and losses on sales of businesses, product lines and certain other investments. In the 2013 first quarter, we also adjusted for the currency transaction loss incurred on our Venezuelan cash balances of $6.9 million before taxes.
We define Adjusted EBITDA (a non-GAAP financial measure) to be Adjusted EBIT adjusted for depreciation and amortization.
We define Adjusted Earnings Per Share (EPS) (a non-GAAP financial measure) to be Diluted EPS adjusted for costs related to Chapter 11, asbestos-related costs, restructuring expenses and related asset impairments, pension costs other than service and interest costs, expected returns on plan assets, and amortization of prior service costs/credits, certain income and expense items related to divested businesses, product lines, and certain other investments, gains and losses on sales of businesses, product lines and certain other investments, and certain discrete tax items. In the 2013 first quarter, we also adjusted for the currency transaction loss incurred on our Venezuelan cash balances of $0.09 per share.
F-69
We define Adjusted EBIT Return On Invested Capital (a non-GAAP financial measure) to be Adjusted EBIT (on a trailing four quarters basis) divided by the sum of net working capital, properties and equipment and certain other assets and liabilities.
We define Segment Gross Margin (a non-GAAP financial measure) to be Gross Margin adjusted for pension-related costs included in cost of goods sold.
We use Adjusted EBIT as a performance measure in significant business decisions and in determining certain incentive compensation. We use Adjusted EBIT as a performance measure because it provides improved period-to-period comparability for decision making and compensation purposes, and because it better measures the ongoing earnings results of our strategic and operating decisions by excluding the earnings effects of our Chapter 11 proceedings, asbestos liabilities, restructuring activities, and divested businesses.
Adjusted EBIT, Adjusted EBITDA, Adjusted EPS, Adjusted EBIT Return On Invested Capital and Segment Gross Margin do not purport to represent income measures as defined under U.S. GAAP, and should not be used as alternatives to such measures as an indicator of our performance. These measures are provided to investors and others to improve the period-to-period comparability and peer-to-peer comparability of our financial results, and to ensure that investors understand the information we use to evaluate the performance of our businesses. We have provided in the following tables a reconciliation of these non-GAAP measures to the most directly comparable financial measure calculated and presented in accordance with U.S. GAAP.
Adjusted EBIT has material limitations as an operating performance measure because it excludes Chapter 11- and asbestos-related costs and may exclude income and expenses from restructuring activities and divested businesses, which historically have been material components of our net income. Adjusted EBITDA also has material limitations as an operating performance measure because it excludes the impact of depreciation and amortization expense. Our business is substantially dependent on the successful deployment of capital, and depreciation and amortization expense is a necessary element of our costs. We compensate for the limitations of these measurements by using these indicators together with net income as measured under U.S. GAAP to present a complete analysis of our results of operations. Adjusted EBIT and Adjusted EBITDA should be evaluated together with net income measured under U.S. GAAP for a complete understanding of our results of operations.
F-70
|
Analysis of Operations
(In millions, except per share amounts)
|
2013
|
2012
|
% Change
|
2011
|
% Change
|
||||||||||||
|
Net sales:
|
|
|
|
|
|
||||||||||||
|
Catalysts Technologies
|
$
|
1,124.0
|
|
$
|
1,268.1
|
|
(11.4
|
)%
|
$
|
1,347.3
|
|
(5.9
|
)%
|
||||
|
Materials Technologies
|
878.5
|
|
862.6
|
|
1.8
|
%
|
872.6
|
|
(1.1
|
)%
|
|||||||
|
Construction Products
|
1,058.2
|
|
1,024.8
|
|
3.3
|
%
|
992.0
|
|
3.3
|
%
|
|||||||
|
Total Grace net sales
|
$
|
3,060.7
|
|
$
|
3,155.5
|
|
(3.0
|
)%
|
$
|
3,211.9
|
|
(1.8
|
)%
|
||||
|
Net sales by region:
|
|
|
|
|
|
||||||||||||
|
North America
|
$
|
959.7
|
|
$
|
967.6
|
|
(0.8
|
)%
|
$
|
1,041.8
|
|
(7.1
|
)%
|
||||
|
Europe Middle East Africa
|
1,087.9
|
|
1,175.6
|
|
(7.5
|
)%
|
1,260.4
|
|
(6.7
|
)%
|
|||||||
|
Asia Pacific
|
654.1
|
|
660.3
|
|
(0.9
|
)%
|
599.3
|
|
10.2
|
%
|
|||||||
|
Latin America
|
359.0
|
|
352.0
|
|
2.0
|
%
|
310.4
|
|
13.4
|
%
|
|||||||
|
Total net sales by region
|
$
|
3,060.7
|
|
$
|
3,155.5
|
|
(3.0
|
)%
|
$
|
3,211.9
|
|
(1.8
|
)%
|
||||
|
Profitability performance measures:
|
|
|
|
|
|
||||||||||||
|
Adjusted EBIT(A):
|
|
|
|
|
|
||||||||||||
|
Catalysts Technologies segment operating income
|
$
|
327.5
|
|
$
|
393.8
|
|
(16.8
|
)%
|
$
|
388.8
|
|
1.3
|
%
|
||||
|
Materials Technologies segment operating income
|
181.8
|
|
162.0
|
|
12.2
|
%
|
158.7
|
|
2.1
|
%
|
|||||||
|
Construction Products segment operating income
|
151.7
|
|
125.2
|
|
21.2
|
%
|
97.3
|
|
28.7
|
%
|
|||||||
|
Corporate costs
|
(82.8
|
)
|
(92.4
|
)
|
10.4
|
%
|
(102.8
|
)
|
10.1
|
%
|
|||||||
|
Certain pension costs(B)
|
(27.4
|
)
|
(30.4
|
)
|
9.9
|
%
|
(28.7
|
)
|
(5.9
|
)%
|
|||||||
|
Adjusted EBIT
|
550.8
|
|
558.2
|
|
(1.3
|
)%
|
513.3
|
|
8.7
|
%
|
|||||||
|
Costs related to Chapter 11
|
(16.4
|
)
|
(15.6
|
)
|
NM
|
|
(23.9
|
)
|
NM
|
|
|||||||
|
Asbestos-related costs, net
|
(11.9
|
)
|
(7.6
|
)
|
NM
|
|
(20.8
|
)
|
NM
|
|
|||||||
|
Asbestos and bankruptcy-related charges, net
|
(21.9
|
)
|
(384.6
|
)
|
NM
|
|
—
|
|
NM
|
|
|||||||
|
Default interest settlement
|
(129.0
|
)
|
—
|
|
NM
|
|
—
|
|
NM
|
|
|||||||
|
Pension MTM adjustment and other related costs, net
|
50.6
|
|
(119.2
|
)
|
NM
|
|
(111.2
|
)
|
NM
|
|
|||||||
|
Restructuring expenses and related asset impairments
|
(12.5
|
)
|
(6.9
|
)
|
NM
|
|
(6.9
|
)
|
NM
|
|
|||||||
|
Loss on sale of product line
|
(1.0
|
)
|
(0.2
|
)
|
NM
|
|
(0.4
|
)
|
50.0
|
%
|
|||||||
|
Income and expense items related to divested businesses
|
—
|
|
(0.2
|
)
|
NM
|
|
(0.4
|
)
|
50.0
|
%
|
|||||||
|
Interest expense and related financing costs
|
(43.8
|
)
|
(46.5
|
)
|
5.8
|
%
|
(43.3
|
)
|
(7.4
|
)%
|
|||||||
|
Currency transaction loss on cash in Venezuela
|
(6.9
|
)
|
—
|
|
NM
|
|
—
|
|
NM
|
|
|||||||
|
Interest income of non-Debtor subsidiaries
|
1.0
|
|
1.0
|
|
—
|
%
|
1.2
|
|
(16.7
|
)%
|
|||||||
|
Benefit from (provision for) income taxes
|
(102.9
|
)
|
61.6
|
|
NM
|
|
(87.9
|
)
|
NM
|
|
|||||||
|
Net income attributable to W. R. Grace & Co. shareholders
|
$
|
256.1
|
|
$
|
40.0
|
|
NM
|
|
$
|
219.7
|
|
(81.8
|
)%
|
||||
|
Diluted EPS (GAAP)
|
$
|
3.30
|
|
$
|
0.52
|
|
NM
|
|
$
|
2.91
|
|
(82.1
|
)%
|
||||
|
Adjusted EPS (non-GAAP)
|
$
|
4.39
|
|
$
|
4.53
|
|
(3.1
|
)%
|
$
|
4.25
|
|
6.6
|
%
|
||||
F-71
|
Analysis of Operations
(In millions)
|
2013
|
2012
|
% Change
|
2011
|
% Change
|
||||||||||||
|
Profitability performance measures:
|
|
|
|
|
|
||||||||||||
|
Gross margin:
|
|
|
|
|
|
||||||||||||
|
Catalysts Technologies
|
40.1
|
%
|
41.0
|
%
|
(0.9) pts
|
|
39.8
|
%
|
1.2 pts
|
|
|||||||
|
Materials Technologies
|
34.6
|
%
|
33.1
|
%
|
1.5 pts
|
|
33.2
|
%
|
(0.1) pts
|
|
|||||||
|
Construction Products
|
36.0
|
%
|
35.2
|
%
|
0.8 pts
|
|
33.8
|
%
|
1.4 pts
|
|
|||||||
|
Segment Gross Margin
|
37.1
|
%
|
37.0
|
%
|
0.1 pts
|
|
36.2
|
%
|
0.8 pts
|
|
|||||||
|
Certain pension costs in cost of goods sold
|
0.2
|
%
|
(1.6
|
)%
|
1.8 pts
|
|
(1.5
|
)%
|
(0.1) pts
|
|
|||||||
|
Total Grace
|
37.3
|
%
|
35.3
|
%
|
2.0 pts
|
|
34.6
|
%
|
0.7 pts
|
|
|||||||
|
Adjusted profitability performance measures:
|
|
|
|
|
|
||||||||||||
|
Adjusted EBIT:
|
|
|
|
|
|
||||||||||||
|
Catalysts Technologies
|
$
|
327.5
|
|
$
|
393.8
|
|
(16.8
|
)%
|
$
|
388.8
|
|
1.3
|
%
|
||||
|
Materials Technologies
|
181.8
|
|
162.0
|
|
12.2
|
%
|
158.7
|
|
2.1
|
%
|
|||||||
|
Construction Products
|
151.7
|
|
125.2
|
|
21.2
|
%
|
97.3
|
|
28.7
|
%
|
|||||||
|
Corporate
|
(110.2
|
)
|
(122.8
|
)
|
10.3
|
%
|
(131.5
|
)
|
6.6
|
%
|
|||||||
|
Total Grace
|
550.8
|
|
558.2
|
|
(1.3
|
)%
|
513.3
|
|
8.7
|
%
|
|||||||
|
Depreciation and amortization:
|
|
|
|
|
|
||||||||||||
|
Catalysts Technologies
|
$
|
54.2
|
|
$
|
54.0
|
|
0.4
|
%
|
$
|
52.5
|
|
2.9
|
%
|
||||
|
Materials Technologies
|
31.4
|
|
29.5
|
|
6.4
|
%
|
30.9
|
|
(4.5
|
)%
|
|||||||
|
Construction Products
|
31.8
|
|
32.9
|
|
(3.3
|
)%
|
34.0
|
|
(3.2
|
)%
|
|||||||
|
Corporate
|
5.7
|
|
2.6
|
|
119.2
|
%
|
2.6
|
|
—
|
%
|
|||||||
|
Total Grace
|
123.1
|
|
119.0
|
|
3.4
|
%
|
120.0
|
|
(0.8
|
)%
|
|||||||
|
Adjusted EBITDA:
|
|
|
|
|
|
||||||||||||
|
Catalysts Technologies
|
$
|
381.7
|
|
$
|
447.8
|
|
(14.8
|
)%
|
$
|
441.3
|
|
1.5
|
%
|
||||
|
Materials Technologies
|
213.2
|
|
191.5
|
|
11.3
|
%
|
189.6
|
|
1.0
|
%
|
|||||||
|
Construction Products
|
183.5
|
|
158.1
|
|
16.1
|
%
|
131.3
|
|
20.4
|
%
|
|||||||
|
Corporate
|
(104.5
|
)
|
(120.2
|
)
|
13.1
|
%
|
(128.9
|
)
|
6.7
|
%
|
|||||||
|
Total Grace
|
673.9
|
|
677.2
|
|
(0.5
|
)%
|
633.3
|
|
6.9
|
%
|
|||||||
|
Operating margin:
|
|
|
|
|
|
||||||||||||
|
Catalysts Technologies
|
29.1
|
%
|
31.1
|
%
|
(2.0) pts
|
|
28.9
|
%
|
2.2 pts
|
|
|||||||
|
Materials Technologies
|
20.7
|
%
|
18.8
|
%
|
1.9 pts
|
|
18.2
|
%
|
0.6 pts
|
|
|||||||
|
Construction Products
|
14.3
|
%
|
12.2
|
%
|
2.1 pts
|
|
9.8
|
%
|
2.4 pts
|
|
|||||||
|
Total Grace
|
18.0
|
%
|
17.7
|
%
|
0.3 pts
|
|
16.0
|
%
|
1.7 pts
|
|
|||||||
|
Adjusted EBITDA margin:
|
|
|
|
|
|
||||||||||||
|
Catalysts Technologies
|
34.0
|
%
|
35.3
|
%
|
(1.3) pts
|
|
32.8
|
%
|
2.5 pts
|
|
|||||||
|
Materials Technologies
|
24.3
|
%
|
22.2
|
%
|
2.1 pts
|
|
21.7
|
%
|
0.5 pts
|
|
|||||||
|
Construction Products
|
17.3
|
%
|
15.4
|
%
|
1.9 pts
|
|
13.2
|
%
|
2.2 pts
|
|
|||||||
|
Total Grace
|
22.0
|
%
|
21.5
|
%
|
0.5 pts
|
|
19.7
|
%
|
1.8 pts
|
|
|||||||
F-72
|
Analysis of Operations
(In millions)
|
2013
|
2012
|
2011
|
||||||||
|
Calculation of Adjusted EBIT Return On Invested Capital (trailing four quarters):
|
|
|
|
||||||||
|
Adjusted EBIT
|
$
|
550.8
|
|
$
|
558.2
|
|
$
|
513.3
|
|
||
|
Invested Capital:
|
|
|
|
||||||||
|
Trade accounts receivable
|
481.8
|
|
490.4
|
|
473.0
|
|
|||||
|
Inventories
|
295.3
|
|
283.6
|
|
333.2
|
|
|||||
|
Accounts payable
|
(262.5
|
)
|
(252.0
|
)
|
(257.6
|
)
|
|||||
|
514.6
|
|
522.0
|
|
548.6
|
|
||||||
|
Other current assets (excluding income taxes)
|
81.2
|
|
62.4
|
|
82.6
|
|
|||||
|
Properties and equipment, net
|
829.9
|
|
770.5
|
|
723.5
|
|
|||||
|
Goodwill
|
457.5
|
|
196.7
|
|
148.2
|
|
|||||
|
Technology and other intangible assets, net
|
315.5
|
|
82.7
|
|
70.6
|
|
|||||
|
Investment in unconsolidated affiliate
|
96.2
|
|
85.5
|
|
70.8
|
|
|||||
|
Other assets
|
40.0
|
|
24.5
|
|
32.7
|
|
|||||
|
Other current liabilities (excluding income taxes, Chapter 11, and restructuring)
|
(248.6
|
)
|
(252.3
|
)
|
(254.0
|
)
|
|||||
|
Other liabilities (including non-asbestos environmental remediation)
|
(77.7
|
)
|
(56.5
|
)
|
(60.9
|
)
|
|||||
|
Total invested capital
|
$
|
2,008.6
|
|
$
|
1,435.5
|
|
$
|
1,362.1
|
|
||
|
Adjusted EBIT Return On Invested Capital
|
27.4
|
%
|
38.9
|
%
|
37.7
|
%
|
|||||
_______________________________________________________________________________
Amounts may not add due to rounding.
|
(A)
|
Grace's segment operating income includes only Grace's share of income of consolidated and unconsolidated joint ventures.
|
|
(B)
|
Certain pension costs include only ongoing costs recognized quarterly, which include service and interest costs, expected returns on plan assets, and amortization of prior service costs/credits. Catalysts Technologies, Materials Technologies, and Construction Products segment operating income and corporate costs do not include any amounts for pension expense. Other pension related costs including annual mark-to-market adjustments and actuarial gains and losses are excluded from Adjusted EBIT. These amounts are not used by management to evaluate the performance of Grace's businesses and significantly affect the peer-to-peer and period-to-period comparability of our financial results. Mark-to-market adjustments and actuarial gains and losses relate primarily to changes in financial market values and actuarial assumptions and are not directly related to the operation of Grace's businesses.
|
NM—Not Meaningful
F-73
Grace Overview
Following is an overview of our financial performance for the years ended
December 31, 2013
,
2012
, and
2011
.
Net Sales and Gross Margin

The following tables identify the year-over-year increase or decrease in sales attributable to changes in sales volume and/or mix, product price, and the impact of currency translation.
|
|
2013 as a Percentage Increase (Decrease) from 2012
|
||||||||||
|
Net Sales Variance Analysis
|
Volume
|
Price
|
Currency
Translation
|
Total
|
|||||||
|
Catalysts Technologies
|
(3.2
|
)%
|
(9.0
|
)%
|
0.8
|
%
|
(11.4
|
)%
|
|||
|
Materials Technologies
|
0.8
|
%
|
2.1
|
%
|
(1.1
|
)%
|
1.8
|
%
|
|||
|
Construction Products
|
3.7
|
%
|
1.9
|
%
|
(2.3
|
)%
|
3.3
|
%
|
|||
|
Net sales
|
0.2
|
%
|
(2.4
|
)%
|
(0.8
|
)%
|
(3.0
|
)%
|
|||
|
By Region:
|
|
|
|
|
|||||||
|
North America
|
3.3
|
%
|
(4.0
|
)%
|
(0.1
|
)%
|
(0.8
|
)%
|
|||
|
Europe Middle East Africa
|
(6.5
|
)%
|
(2.5
|
)%
|
1.5
|
%
|
(7.5
|
)%
|
|||
|
Asia Pacific
|
4.4
|
%
|
(3.5
|
)%
|
(1.8
|
)%
|
(0.9
|
)%
|
|||
|
Latin America
|
6.0
|
%
|
4.0
|
%
|
(8.0
|
)%
|
2.0
|
%
|
|||
Sales for
2013
decreased
3.0%
overall compared with the prior year. The sales decrease was due to lower pricing (
-2.4%
) and unfavorable currency translation (
-0.8%
), partially offset by higher sales volumes (
+0.2%
).
F-74
|
|
2012 as a Percentage Increase (Decrease) from 2011
|
||||||||||
|
Net Sales Variance Analysis
|
Volume
|
Price
|
Currency
Translation
|
Total
|
|||||||
|
Catalysts Technologies
|
2.5
|
%
|
(5.4
|
)%
|
(3.0
|
)%
|
(5.9
|
)%
|
|||
|
Materials Technologies
|
1.7
|
%
|
1.8
|
%
|
(4.6
|
)%
|
(1.1
|
)%
|
|||
|
Construction Products
|
4.6
|
%
|
1.9
|
%
|
(3.2
|
)%
|
3.3
|
%
|
|||
|
Net sales
|
2.9
|
%
|
(1.2
|
)%
|
(3.5
|
)%
|
(1.8
|
)%
|
|||
|
By Region:
|
|
|
|
|
|||||||
|
North America
|
(2.8
|
)%
|
(4.2
|
)%
|
(0.1
|
)%
|
(7.1
|
)%
|
|||
|
Europe Middle East Africa
|
1.1
|
%
|
(1.5
|
)%
|
(6.3
|
)%
|
(6.7
|
)%
|
|||
|
Asia Pacific
|
9.7
|
%
|
2.2
|
%
|
(1.7
|
)%
|
10.2
|
%
|
|||
|
Latin America
|
16.7
|
%
|
3.9
|
%
|
(7.2
|
)%
|
13.4
|
%
|
|||
Sales for
2012
decreased
1.8%
overall compared with the prior year. The sales decrease was due to lower pricing (
-1.2%
), primarily in North America and EMEA, and unfavorable currency translation (
-3.5%
), partially offset by higher sales volumes (
+2.9%
).
Adjusted EBIT

Adjusted EBIT was
$550.8 million
for
2013
, a decrease of
1.3%
compared with the prior year. The decrease was primarily due to
lower segment operating income in Catalysts Technologies and unfavorable currency translation, partially offset by higher segment operating income in Materials Technologies and Construction Products and lower corporate costs.
Segment Gross Margin was
37.1%
for
2013
compared with
37.0%
for the prior year. The increase in Segment Gross Margin was primarily due to lower raw material costs, partially offset by lower pricing related to lower rare earth surcharges.
Adjusted EBIT was
$558.2 million
for
2012
, an increase of
8.7%
compared with the prior year. The increase was primarily due to higher segment operating income in all three operating segments, a reduction in operating expenses resulting from previously announced restructuring activities, reduced incentive compensation accruals and expense controls, partially offset by unfavorable currency translation and higher pension expense. Segment Gross Margin was
37.0%
for
2012
compared with
36.2%
for the prior year. The increase in Segment Gross Margin was primarily due to improved pricing and productivity gains, partially offset by higher raw materials costs and the impact of lower rare earth costs and volumes on capitalized inventory values.
F-75
Grace Net Income

Grace net income was
$256.1 million
for
2013
compared with
$40.0 million
for the prior year. The increase was primarily due to a favorable mark-to-market pension adjustment in 2013 compared with an
unfavorable adjustment in the prior year, and a reduction in the amount of asbestos and bankruptcy related charges, partially offset by a
$129 million charge related to the default interest settlement.
Grace net income was
$40.0 million
for
2012
, a decrease of
81.8%
compared with
$219.7 million
for the prior year. The decrease was primarily due to the $365.0 million adjustment to the recorded asbestos-related liability, partially offset by improved segment operating income.
We recorded charges of $27.4 million and $365.0 million in the 2013 and 2012 fourth quarters, respectively, to adjust our recorded asbestos-related liability. These adjustments to the previously recorded amounts were necessary to reflect the increased estimates of the value of the warrants and deferred payment obligation payable to the PI Trust under the Joint Plan.
We recorded a charge of $16.2 million in the 2011 fourth quarter primarily related to our estimate of the cost of required remediation at seven facilities that formerly processed vermiculite concentrate from the Libby mine. During the 2011 fourth quarter, EPA requested that we conduct additional remediation at these seven facilities (now eight, including an additional site added by EPA during the 2012 fourth quarter) based on revised risk-based criteria developed by EPA. We estimated the cost of remediating these sites to be approximately $16 million. See Note 13 to the Consolidated Financial Statements for additional information regarding our estimated liability for environmental investigation and remediation costs.
F-76
Adjusted EPS
The following table reconciles our Diluted EPS (GAAP) to our Adjusted EPS (non-GAAP):
|
|
2013
|
||||||||||||||
|
(In millions, except per share amounts)
|
Pre-
Tax
|
Tax at
Actual
Rate
|
After-
Tax
|
Per
Share
|
|||||||||||
|
Diluted Earnings Per Share (GAAP)
|
|
|
|
|
|
|
$
|
3.30
|
|
||||||
|
Costs related to Chapter 11
|
$
|
16.4
|
|
$
|
6.0
|
|
$
|
10.4
|
|
0.13
|
|
||||
|
Asbestos-related costs
|
11.9
|
|
4.5
|
|
7.4
|
|
0.10
|
|
|||||||
|
Asbestos and bankruptcy-related charges, net
|
21.9
|
|
8.2
|
|
13.7
|
|
0.18
|
|
|||||||
|
Default interest settlement
|
129.0
|
|
48.3
|
|
80.7
|
|
1.04
|
|
|||||||
|
Pension MTM adjustment and other related costs, net
|
(50.6
|
)
|
(20.0
|
)
|
(30.6
|
)
|
(0.39
|
)
|
|||||||
|
Restructuring expenses and related asset impairments
|
12.5
|
|
3.5
|
|
9.0
|
|
0.12
|
|
|||||||
|
Currency transaction loss on cash in Venezuela
|
6.9
|
|
—
|
|
6.9
|
|
0.09
|
|
|||||||
|
Loss on sale of divested businesses
|
1.0
|
|
0.4
|
|
0.6
|
|
0.01
|
|
|||||||
|
Discrete tax items:
|
|
|
|
||||||||||||
|
Release of valuation allowances
|
24.4
|
|
(24.4
|
)
|
(0.31
|
)
|
|||||||||
|
Discrete tax items, including adjustments to uncertain tax positions
|
|
|
(9.4
|
)
|
9.4
|
|
0.12
|
|
|||||||
|
Adjusted EPS (non-GAAP)
|
|
|
|
|
|
|
$
|
4.39
|
|
||||||
|
|
2012
|
||||||||||||||
|
(In millions, except per share amounts)
|
Pre-
Tax
|
Tax at
Actual
Rate
|
After-
Tax
|
Per
Share
|
|||||||||||
|
Diluted Earnings Per Share (GAAP)
|
|
|
|
|
|
|
$
|
0.52
|
|
||||||
|
Costs related to Chapter 11
|
$
|
15.6
|
|
$
|
3.8
|
|
$
|
11.8
|
|
0.15
|
|
||||
|
Asbestos-related costs
|
7.6
|
|
2.8
|
|
4.8
|
|
0.06
|
|
|||||||
|
Asbestos and bankruptcy-related charges, net
|
384.6
|
|
142.3
|
|
242.3
|
|
3.18
|
|
|||||||
|
Pension MTM adjustment and other related costs, net
|
119.2
|
|
37.9
|
|
81.3
|
|
1.07
|
|
|||||||
|
Restructuring expenses and related asset impairments
|
6.9
|
|
2.0
|
|
4.9
|
|
0.06
|
|
|||||||
|
Loss on sale of divested businesses
|
0.2
|
|
—
|
|
0.2
|
|
—
|
|
|||||||
|
Discrete tax items:
|
|
|
|
|
|||||||||||
|
Release of valuation allowances
|
44.0
|
|
(44.0
|
)
|
(0.58
|
)
|
|||||||||
|
Discrete tax items, including adjustments to uncertain tax positions
|
|
|
(5.3
|
)
|
5.3
|
|
0.07
|
|
|||||||
|
Adjusted EPS (non-GAAP)
|
|
|
|
|
|
|
$
|
4.53
|
|
||||||
|
|
2011
|
|||||||||||||
|
(In millions, except per share amounts)
|
Pre-
Tax
|
Tax at
Actual
Rate
|
After-
Tax
|
Per
Share
|
||||||||||
|
Diluted Earnings Per Share (GAAP)
|
|
|
|
|
|
|
$
|
2.91
|
|
|||||
|
Costs related to Chapter 11
|
23.9
|
|
$
|
6.6
|
|
$
|
17.3
|
|
0.23
|
|
||||
|
Asbestos-related costs
|
20.8
|
|
7.3
|
|
13.5
|
|
0.18
|
|
||||||
|
Pension MTM adjustment and other related costs, net
|
111.2
|
|
38.3
|
|
72.9
|
|
0.97
|
|
||||||
|
Restructuring expenses and related asset impairments
|
6.9
|
|
1.9
|
|
5.0
|
|
0.07
|
|
||||||
|
Loss on sale of divested businesses
|
0.8
|
|
0.3
|
|
0.5
|
|
0.01
|
|
||||||
|
Discrete tax items:
|
|
|
|
|
||||||||||
|
Discrete tax items, including adjustments to uncertain tax positions
|
|
|
9.5
|
|
(9.5
|
)
|
(0.12
|
)
|
||||||
|
Adjusted EPS (non-GAAP)
|
|
|
|
|
|
|
$
|
4.25
|
|
|||||
F-77
Adjusted EBIT Return On Invested Capital

Adjusted EBIT Return On Invested Capital for
2013
was
27.4%
on a trailing four quarters basis, a decrease from
38.9%
on the same basis for
2012
and
37.7%
for
2011
. The decrease was primarily due to lower segment operating income in Catalysts Technologies and higher invested capital related to the acquisition of the UNIPOL
®
polypropylene process licensing and related catalyst business. We manage our operations with the objective of maximizing sales, earnings and cash flow over time. Doing so requires that we successfully balance our growth, profitability and working capital and other investments to support sustainable, long-term financial performance. We use Adjusted EBIT Return On Invested Capital as a performance measure in evaluating operating results, in making operating and investment decisions and in balancing the growth and profitability of our operations. Generally, we favor those businesses and investments that provide the highest return on invested capital.
Operating Segment Overview—Grace Catalysts Technologies
Following is an overview of the financial performance of Catalysts Technologies for the years ended
December 31, 2013
,
2012
, and
2011
.
Net Sales—Grace Catalysts Technologies

Sales were
$1,124.0 million
for
2013
, a decrease of
11.4%
compared with the prior year. The decrease was due to lower pricing (
-9.0%
) and lower sales volumes (
-3.2%
), partially offset by favorable currency translation (
+0.8%
). The decrease in pricing was due to lower rare earth surcharges and lower refinery products base pricing, partially offset by higher pricing in specialty catalysts. The decrease in sales volumes was due to lower sales volumes of FCC catalysts. During the year, FCC catalyst sales volumes decreased 7.9% from the 2013 second quarter to the 2013 third quarter and then increased 5.8% from the 2013 third quarter to the 2013 fourth quarter. The decrease in sales volumes in the 2013 third quarter resulted primarily from customer trials of competitive products following our announcement of an increase in FCC catalyst base pricing in the 2013 first quarter. Sales volumes recovered in the 2014 fourth quarter as customer trials concluded and customers began purchasing new products introduced in the 2013 third and fourth quarters designed specifically for shale oil and heavy resid feedstocks.
F-78
On December 2, 2013, we acquired the UNIPOL
®
polypropylene process licensing and related catalyst business for a cash purchase price of $500 million, before customary working capital and post-closing adjustments. This acquisition is complementary to our specialty catalysts business and enhances our position as a leading supplier of polyolefin catalysts and technologies. Integration activities are on track and we expect to complete integration in the 2014 second quarter.
Sales were
$1,268.1 million
for
2012
, a decrease of
5.9%
compared with the prior year. The decrease was due to lower pricing (
-5.4%
), and unfavorable currency translation (
-3.0%
), partially offset by higher sales volumes (
+2.5%
). Sales of our FCC catalysts increased in the emerging regions, partially offset by refinery closures in North America and Europe, which impacted sales by approximately $48 million, or 4%. In our specialty catalysts business, sales of polypropylene catalysts continued to grow, increasing by double digits compared with 2011 and offsetting decreased sales of polyethylene catalysts due to continued weakness in Europe and slower growth in China.
Segment Operating Income (SOI) and Margin—Grace Catalysts Technologies
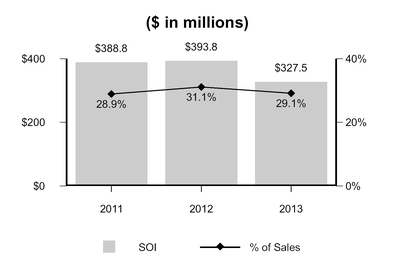
Gross profit was
$450.5 million
for
2013
, a decrease of
13.3%
compared with the prior year. Segment gross margin was
40.1%
compared with
41.0%
for the prior year. The decrease in gross profit and gross margin was primarily due to lower sales of our FCC catalyst products, including the effects of lower rare earth surcharges and lower operating leverage.
Segment operating income was
$327.5 million
for
2013
, a decrease of
16.8%
compared with the prior year. Segment operating margin for
2013
decreased to
29.1%
, a decline of
200
basis points compared with the prior year, primarily due to lower gross margin, partially offset by lower operating expenses and higher earnings from the ART joint venture.
Gross profit was
$519.8 million
for
2012
, a decrease of
3.1%
compared with the prior year. Segment gross margin was
41.0%
compared with
39.8%
for the prior year. The increase in gross margin was primarily due to improved pricing and productivity, partially offset by the impact of lower rare earth costs and volumes on capitalized inventory values and higher raw materials costs, particularly caustic soda and alumina.
Segment operating income was
$393.8 million
for
2012
, an increase of
1.3%
compared with the prior year. Segment operating margin for
2012
increased to
31.1%
, an improvement of
220
basis points compared with the prior year, primarily due to improved gross margin and lower operating expenses.
In 2012 and 2011, Catalysts Technologies sales were affected by significant volatility in the prices of the rare earths used in the manufacture of our FCC catalysts. During 2010, the People's Republic of China reduced its quotas on exports of rare earths causing significant increases in global prices. In response to these price increases, we implemented surcharges on our FCC catalysts and developed new low- and no-rare earth products to mitigate the higher cost of rare earths without sacrificing performance. These new products have higher base prices than the products they replaced, reflecting improvements in their technology and value to our customers. The surcharges and higher base prices significantly increased sales in 2011 compared to 2010. In the 2011 third quarter, rare earth prices peaked and have since declined significantly. As a result, the amount of our surcharges has decreased with a corresponding decrease in sales. In 2013, the negative effect of lower rare earth surcharges on sales was
F-79
approximately $97 million compared with 2012. In 2012, the negative effect of lower rare earth surcharges on sales was approximately $170 million compared with 2011. The higher base prices on the new products increased gross margin and segment operating income in 2011 and 2012.
Operating Segment Overview—Grace Materials Technologies
Following is an overview of the financial performance of Materials Technologies for the years ended
December 31, 2013
,
2012
, and
2011
.
Net Sales—Grace Materials Technologies
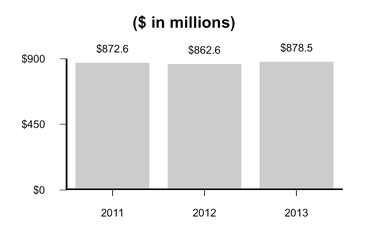
Sales were
$878.5 million
for
2013
, an increase of
1.8%
compared with the prior year. The increase was due to improved pricing (
+2.1%
) and higher sales volumes (
+0.8%
), partially offset by unfavorable currency translation (
-1.1%
). We increased pricing to reflect the value of new, higher performance products and to offset certain currency impacts and higher raw material costs. Sales in emerging regions increased 4.5% primarily due to growth in China and other emerging regions. Sales in mature markets were flat.
Sales were
$862.6 million
for
2012
, a decrease of
1.1%
compared with the prior year. The decrease was due to unfavorable currency translation (
-4.6%
), partially offset by improved pricing (
+1.8%
) and higher sales volumes (
+1.7%
). Sales of packaging products increased compared with the prior year due to improved pricing and increased sales volume. Engineered materials volumes were down compared with the prior year as lower sales volumes in the first half of 2012, from lower demand in Asia and Europe, more than offset second-half volume growth.
F-80
Segment Operating Income (SOI) and Margin—Grace Materials Technologies

Gross profit was
$304.2 million
for
2013
, an increase of
6.5%
compared with the prior year. Segment gross margin was
34.6%
compared with
33.1%
for the prior year. The increase in gross margin was due primarily to improved pricing and lower raw material costs.
Segment operating income was
$181.8 million
for
2013
, an increase of
12.2%
compared with the prior year. Segment operating margin for
2013
increased to
20.7%
, an improvement of
190
basis points compared with the prior year, primarily due to improved gross margin.
Gross profit was
$285.5 million
for
2012
, a decrease of
1.4%
compared with the prior year. Segment gross margin was
33.1%
compared with
33.2%
for the prior year.
Segment operating income was
$162.0 million
for
2012
, an increase of
2.1%
compared with the prior year. Segment operating margin for
2012
increased to
18.8%
, an improvement of
60
basis points compared with the prior year, primarily due to reduced operating expenses, partially offset by lower gross margin.
Operating Segment Overview—Grace Construction Products
Following is an overview of the financial performance of Construction Products for the years ended
December 31, 2013
,
2012
, and
2011
.
Net Sales—Grace Construction Products

Sales were
$1,058.2 million
for
2013
, an increase of
3.3%
compared with the prior year. The increase was due to higher sales volumes (
+3.7%
) and improved pricing (
+1.9%
), partially offset by unfavorable currency translation (
-2.3%
). Sales in emerging regions, which represented 35.4% of sales for
2013
, increased 5.9% due to strong sales
F-81
in Latin America, emerging Asia, and Eastern Europe. Sales in North America increased 2.9% compared with the prior year primarily due to growth in specialty building materials and specialty construction chemicals. Sales in Western Europe declined 1.8% compared with the prior year, primarily due to our decision to focus on higher-margin sales in the region.
Sales were
$1,024.8 million
for
2012
, an increase of
3.3%
compared with the prior year. The increase was due to higher sales volumes (
+4.6%
) and improved pricing (
+1.9%
), partially offset by unfavorable currency translation (
-3.2%
).
Segment Operating Income (SOI) and Margin—Grace Construction Products

Gross profit was
$380.7 million
for
2013
, an increase of
5.5%
compared with the prior year. Segment gross margin was
36.0%
compared with
35.2%
for the prior year. The increase was primarily due to improved pricing and productivity gains.
Segment operating income was
$151.7 million
for
2013
, an increase of
21.2%
compared with the prior year. Segment operating margin for
2013
increased to
14.3%
, an improvement of
210
basis points compared with the prior year. These increases were primarily due to improved gross margin and lower operating expenses.
Gross profit was
$361.0 million
for
2012
, an increase of
7.8%
compared with the prior year. Segment gross margin was
35.2%
compared with
33.8%
for the prior year. The increase was primarily due to improved pricing, better operating leverage from higher sales volumes and a favorable sales mix comparison between acquired and divested businesses.
Segment operating income was
$125.2 million
for
2012
, an increase of
28.7%
compared with the prior year. Segment operating margin for
2012
increased to
12.2%
, an improvement of
240
basis points compared with the prior year. These increases were primarily due to improved gross margin, lower operating expenses and higher sales volumes.
F-82
Corporate Overview

Corporate costs include corporate functional costs and other corporate costs such as non-asbestos environmental remediation, insurance premiums and professional fees.
Corporate costs for
2013
decreased
10.4%
compared with the prior year primarily due to the impact of lower performance-based incentive compensation and other expenses.
Corporate costs for
2012
decreased
10.1%
compared with the prior year primarily due to the impact of lower performance-based incentive compensation and restructuring initiatives announced in the 2012 first quarter.
Defined Benefit Pension Expense
Defined benefit pension expense includes costs under U.S. and non-U.S. defined benefit pension plans that provide benefits to business segment and corporate employees, as well as retirees and former employees of divested businesses where we retained these obligations.
Under mark-to-market accounting, our pension costs consist of two elements: 1) "certain pension costs"—ongoing costs recognized quarterly, which include service and interest costs, expected returns on plan assets, and amortization of prior service costs/credits; and 2) "pension mark-to-market adjustment and other related costs, net"—mark-to-market gains and losses recognized annually in the fourth quarter, or at an interim period should a significant event occur, resulting from changes in actuarial assumptions, such as discount rates and the difference between actual and expected returns on plan assets.
As a result of the retrospective application of the new accounting method, accumulated actuarial losses have been reclassified from "accumulated other comprehensive income" to "retained earnings (accumulated deficit)." In addition, in order to better reflect the nature of pension costs in our operating results, we retrospectively revised the classification of defined benefit pension expense. Pension costs previously reported as a separate line item in the Consolidated Statements of Operations are now reported in "cost of goods sold" and in "selling, general and administrative expenses" based upon the functions of the employees to which the pension costs relate. Finally, we have revised our accounting such that a portion of the defined benefit pension expense has been and will continue to be capitalized into inventories prior to being reported in "cost of goods sold." We believe that the change in classification of defined benefit pension costs and the change to inventory capitalization are not material to all prior periods.
Certain pension costs were
$27.4 million
,
$30.4 million
and
$28.7 million
for 2013, 2012 and 2011, respectively.
The pension mark-to-market adjustment and other related income (expense), net was
$50.6 million
,
$(119.2) million
and
$(111.2) million
for 2013, 2012 and 2011, respectively. The 2013 mark-to-market pension income of
$50.6 million
was primarily due to higher discount rates in 2013 used to value the projected benefit obligations of our plans, partially offset by the impact of adopting new mortality assumptions in the U.S. and lower than expected return on assets in the U.S. The 2012 mark-to-market pension expense of
$119.2 million
was primarily due to lower
F-83
discount rates in the U.S. and Germany, partially offset by higher than expected return on assets in the U.S. The 2011 mark-to-market pension expense of
$111.2 million
was primarily due to lower discount rates in the U.S. and Germany.
Costs Related to Chapter 11
The following table presents costs related to Chapter 11:
|
(In millions)
|
2013
|
2012
|
2011
|
||||||||
|
Chapter 11 expenses, net of interest income
|
$
|
15.3
|
|
$
|
16.6
|
|
$
|
20.0
|
|
||
|
D&O insurance costs related to Chapter 11
|
0.2
|
|
0.3
|
|
0.3
|
|
|||||
|
Translation effects—intercompany loans(A)
|
(11.9
|
)
|
(5.6
|
)
|
11.7
|
|
|||||
|
Value of currency forward contracts—intercompany loans(A)
|
10.9
|
|
3.7
|
|
(9.3
|
)
|
|||||
|
Certain other currency translation costs, net(A)
|
1.9
|
|
0.6
|
|
1.2
|
|
|||||
|
Costs related to Chapter 11
|
$
|
16.4
|
|
$
|
15.6
|
|
$
|
23.9
|
|
||
_______________________________________________________________________________
|
(A)
|
During the bankruptcy, we had significant intercompany loans between our non-U.S. subsidiaries and our U.S. debtor subsidiaries that were not related to our operating activities. In addition, we accumulated significant cash during bankruptcy. Accordingly, income and expense items related to the intercompany loans and the cash balances are categorized as costs related to Chapter 11. These intercompany loans were paid in full when we emerged from bankruptcy, and the excess cash balances were used to fund a significant portion of our emergence from bankruptcy.
|
The increase in costs related to Chapter 11 for
2013
compared with
2012
was primarily due to the effects of currency exchange rate changes on the value of intercompany loans and related currency forward contracts and the value of cash balances held in foreign currencies.
The decrease in costs related to Chapter 11 for
2012
compared with
2011
was primarily due to the effects of currency exchange rate changes on the value of intercompany loans and related currency forward contracts.
We present the net costs of our reorganization under Chapter 11 as "Chapter 11 expenses, net of interest income," a separate caption in our Consolidated Statements of Operations.
Interest Expense
Interest expense was
$43.8 million
for
2013
, a decrease of
5.8%
compared with
2012
. Interest expense was
$46.5 million
for 2012, an increase of
7.4%
compared with 2011.
The average effective interest rates on pre-petition obligations for
2013
,
2012
and
2011
were 3.5%, 3.5%, and 3.5%, respectively. All pre-petition interest was paid in February 2014.
Income Taxes
Income tax expense (benefit) for
2013
,
2012
and
2011
was
$102.9 million
,
$(61.6) million
and
$87.9 million
, respectively, on income (loss) from consolidated operations before income taxes of
$360.6 million
,
$(20.6) million
and
$307.0 million
in
2013
,
2012
and
2011
, respectively.
Our
2013
effective tax rate of approximately 29% was lower than the 35% U.S. statutory rate primarily due to benefits recognized during the year including
$24.4 million
related to the partial release of the valuation allowance on state deferred tax assets,
$16.6 million
due to lower taxes in non-U.S. jurisdictions, and
$3.7 million
related to repatriated foreign earnings, partially offset by
$11.0 million
related to uncertain tax positions and other discrete items, and
$9.7 million
related to non-deductible expenses.
Our
2012
effective tax rate of approximately (299)% was lower than the 35% U.S. statutory rate primarily due to benefits recognized during the year including
$44.0 million
related to the partial release of the valuation allowance on state deferred tax assets,
$14.9 million
due to lower taxes in non-U.S. jurisdictions, and
$14.0 million
related to domestic production incentives, partially offset by expenses of $8.2 million related to uncertain tax positions and other discrete items,
$2.2 million
related to repatriated foreign earnings and
$8.1 million
related to non-deductible expenses.
Our
2011
effective tax rate of approximately 29% was lower than the 35% U.S. statutory rate primarily due to benefits recognized during the year of $9.3 million from the resolution of uncertain tax positions and the expiration
F-84
of the statute of limitations in certain domestic and foreign jurisdictions, and
$17.6 million
due to lower taxes in non-U.S. jurisdictions, partially offset by expenses of
$1.1 million
related to repatriated foreign earnings and
$7.3 million
related to non-deductible expenses.
See Note 10 to the Consolidated Financial Statements for additional information regarding income taxes.
Financial Condition, Liquidity, and Capital Resources
Following is an analysis of our financial condition, liquidity and capital resources at
December 31, 2013
, together with a description of our emergence financing and post-emergence liquidity. For additional information regarding our Chapter 11 cases and our asbestos-related litigation, see Note 2 to the Consolidated Financial Statements. For additional information regarding environmental matters, see Note 13 to the Consolidated Financial Statements.
Funding Emergence from Chapter 11
On February 3, 2014, we emerged from Chapter 11. We paid approximately $1,900 million in claims and other costs. We funded these payments through a combination of approximately $1,360 million in cash on hand and $900 million in exit financing. Total liquidity under the exit financing consists of:
|
(a)
|
a $400 million revolving credit facility due in 2019, with interest at LIBOR +175 bps;
|
|
(b)
|
a $700 million term loan due in 2021, with interest at LIBOR +225 bps with a 75 bps floor;
|
|
(c)
|
a €150 million term loan due in 2021 with interest at EURIBOR +250 bps with a 75 bps floor; and
|
|
(d)
|
a $250 million delayed draw term loan facility available for 12 months, with amounts drawn due in 2021, with interest at LIBOR +225 bps with a 75 bps floor.
|
Approximately $100 million of the revolving credit facility will be used to replace an existing cash-collateralized letter of credit facility in effect during the bankruptcy. After payment of claims at emergence, total liquidity was approximately $910 million, consisting of approximately $360 million in cash on hand, $300 million in revolver availability and the $250 million delayed draw term loan. In addition, we continue to maintain our non-U.S. credit facilities (see below) which total approximately $194 million to support the trade activity and working capital requirements of our foreign subsidiaries. We entered into an interest rate swap beginning on February 3, 2015, and
maturing on February 3, 2020, fixing $250 million of the term loan at 4.643%.
The emergence financing amount includes financing for the acquisition of the UNIPOL® polypropylene process licensing and related catalyst business in December 2013 and the settlement of the default interest claim on our pre-petition bank debt of $129 million.
The revolving credit facility and delayed draw term loan facility, together with cash we expect to generate during 2014, provide the liquidity required to cash settle the warrant issued to the PI Trust, currently expected to cost $490 million, and to settle shares repurchased pursuant to the $500 million share repurchase program authorized by our Board of Directors following emergence.
We believe that these credit facilities, together with cash we expect to generate during 2014 and thereafter, are sufficient to finance our operations and support our business strategy.
Cash Resources and Available Credit Facilities
At
December 31, 2013
, we had available liquidity of $1,036.9 million, consisting of
$964.8 million
in cash and cash equivalents ($600.5 million in the U.S.), and
$72.1 million
of available liquidity under various non-U.S. credit facilities.
At December 31, 2013, we maintained a $100 million cash-collateralized letter of credit facility to support existing and new financial assurances and cash collateral accounts that secure the obligations arising from letters of credit and foreign currency and commodity transactions and derivatives. At
December 31, 2013
, we held $85.0 million in restricted cash and cash equivalents to support this facility. At emergence, we replaced the cash-collateralized letter of credit facility with a $400 million revolving credit facility with a $150 million sublimit for letters of credit.
Our non-U.S. credit facilities are extended to various subsidiaries that use them primarily to issue bank guarantees supporting trade activity and to provide working capital during occasional cash shortfalls. The credit facility in Germany is secured by third-party accounts receivable, with availability determined on the basis of eligible outstanding receivables. We generally renew these credit facilities as they expire.
F-85
The following table summarizes our non-U.S. credit facilities as of
December 31, 2013
:
|
Credit Facilities
(In millions)
|
Maximum
Borrowing
Amount
|
Available
Liquidity
|
Expiration Date
|
||||||
|
Country
|
|
|
|
||||||
|
Germany
|
$
|
69.3
|
|
$
|
12.9
|
|
12/31/2014
|
||
|
Other countries
|
37.6
|
|
19.2
|
|
Various through 2015
|
||||
|
Other countries
—
cash collateralized(A)
|
87.5
|
|
40.0
|
|
6/30/2014
|
||||
|
Total
|
$
|
194.4
|
|
$
|
72.1
|
|
|
||
|
(A)
|
Cash collateral related to these facilities is included in restricted cash in the Consolidated Balance Sheets.
|
Analysis of Cash Flows
The following table summarizes our cash flows for the years ended
December 31, 2013
,
2012
, and
2011
:
|
|
Year Ended December 31,
|
||||||||||
|
(In millions)
|
2013
|
2012
|
2011
|
||||||||
|
Net cash provided by operating activities
|
$
|
515.9
|
|
$
|
453.6
|
|
$
|
219.4
|
|
||
|
Net cash used for investing activities
|
(880.7
|
)
|
(280.3
|
)
|
(220.9
|
)
|
|||||
|
Net cash (used for) provided by financing activities
|
(8.4
|
)
|
110.3
|
|
39.7
|
|
|||||
|
Effect of currency exchange rate changes on cash and cash equivalents
|
1.1
|
|
5.0
|
|
(5.6
|
)
|
|||||
|
(Decrease) increase in cash and cash equivalents
|
(372.1
|
)
|
288.6
|
|
32.6
|
|
|||||
|
Cash and cash equivalents, beginning of period
|
1,336.9
|
|
1,048.3
|
|
1,015.7
|
|
|||||
|
Cash and cash equivalents, end of period
|
$
|
964.8
|
|
$
|
1,336.9
|
|
$
|
1,048.3
|
|
||
Net cash provided by operating activities in
2013
was
$515.9 million
, compared with
$453.6 million
in the prior year. Net cash provided by operating activities benefited from improved working capital performance and lower pension contributions. In addition, in 2013 we reported an operating cash flow benefit of $35.4 million from excess tax benefits from stock-based compensation compared with an operating cash flow use of $36.8 million in 2012. This change results from our decision to accelerate the use of certain other tax attributes for U.S. Federal income tax purposes and to preserve the excess tax benefits from stock-based compensation.
Net cash provided by operating activities in 2012 was $453.6 million, compared with $219.4 million in the prior year. The change in cash provided by operating activities is primarily due to lower pension plan contributions and reduced working capital requirements.
Net cash used for investing activities in
2013
was
$880.7 million
, compared with
$280.3 million
in the prior year. Net cash used for investing activities primarily includes the net cash paid for businesses acquired and capital expenditures. We acquired the UNIPOL
®
polypropylene process licensing and related catalyst business for $510.4 million (including post-closing adjustments) in the 2013 fourth quarter. Our capital expenditures include investments in new capacity, improved productivity and maintenance of our manufacturing and office facilities. We expect to fund our capital expenditures from net cash provided by operating activities.
Net cash used for financing activities in
2013
was
$8.4 million
, compared with net cash provided by financing activities of
$110.3 million
in the prior year. The change in cash provided by financing activities is primarily due to the effect of the tax benefits from stock-based compensation and the net repayments under credit facilities.
Net cash provided by financing activities in 2012 was $110.3 million, compared with $39.7 million in the prior year. The change in cash provided by financing activities is primarily due to the increase in proceeds from the exercise of stock options and tax benefits from stock-based compensation.
Included in net cash provided by operating activities are accelerated defined benefit pension plan contributions of
$50.0 million
,
$83.4 million
and
$180.0 million
, Chapter 11 expenses paid of
$15.0 million
,
$15.5 million
and
$20.6 million
, and expenditures for asbestos-related environmental remediation of
$5.0 million
,
$7.2 million
and
$2.4 million
for
2013
,
2012
and
2011
, respectively. These cash flows totaled
$70.0 million
,
$106.1 million
F-86
and
$203.0 million
for
2013
,
2012
and
2011
, respectively. We do not include these cash flows when evaluating the performance of our businesses.
Debt and Other Contractual Obligations
Total debt outstanding at
December 31, 2013
, was
$1,219.7 million
, including
$482.1 million
of accrued interest on pre-petition debt and the default interest settlement of $129.0 million. As a result of the Chapter 11 filing, we were in default on
$526.7 million
of pre-petition debt, which, together with accrued interest thereon, has been included in "liabilities subject to compromise" as of
December 31, 2013
. The automatic stay provided under the U.S. Bankruptcy Code prevented our lenders from taking any action to collect the principal amounts as well as related accrued interest. However, we continued to accrue and report interest in accordance with the Joint Plan on such debt during the Chapter 11 proceedings.
Set forth below are our contractual obligations as of
December 31, 2013
:
|
|
Payments Due by Period
|
||||||||||||||||||
|
Contractual Obligations(1)
(In millions)
|
Total
|
Less than
1 Year
|
1-3
Years
|
4-5
Years
|
More Than 5 Years
|
||||||||||||||
|
Operating commitments(2)
|
$
|
42.3
|
|
$
|
12.1
|
|
$
|
16.1
|
|
$
|
8.6
|
|
$
|
5.5
|
|
||||
|
Debt
|
81.9
|
|
76.6
|
|
5.3
|
|
—
|
|
—
|
|
|||||||||
|
Capital leases
|
1.7
|
|
0.9
|
|
0.8
|
|
—
|
|
—
|
|
|||||||||
|
Operating leases
|
84.9
|
|
22.8
|
|
30.7
|
|
12.7
|
|
18.7
|
|
|||||||||
|
Pension funding requirements per ERISA(3)
|
17.7
|
|
—
|
|
5.2
|
|
12.5
|
|
—
|
|
|||||||||
|
Pension funding requirements for non-U.S. pension plans(4)
|
75.1
|
|
17.8
|
|
27.6
|
|
29.7
|
|
—
|
|
|||||||||
|
Total Contractual Obligations
|
$
|
303.6
|
|
$
|
130.2
|
|
$
|
85.7
|
|
$
|
63.5
|
|
$
|
24.2
|
|
||||
_______________________________________________________________________________
|
(1)
|
Excludes liabilities subject to compromise, which were paid as described in Note 2 to the Consolidated Financial Statements. Also excludes debt borrowed on February 3, 2014, in conjunction with our exit from bankruptcy, and the interest thereon, as described in Note 8 to the Consolidated Financial Statements.
|
|
(2)
|
Amounts do not include open purchase commitments, which are routine in nature and normally settle within 90 days, or obligations to employees under annual or long-term incentive programs.
|
|
(3)
|
Based on the U.S. qualified pension plans' status as of
December 31, 2013
, minimum funding requirements under ERISA have been estimated for the next five years. Amounts in subsequent years or additional payments have not yet been included.
|
|
(4)
|
Based on the non-U.S. pension plans' status as of
December 31, 2013
, funding requirements have been estimated for the next five years. Amounts in subsequent years have not yet been determined.
|
See Note 13 to the Consolidated Financial Statements for a discussion of Financial Assurances.
Employee Benefit Plans
See Note 11 to the Consolidated Financial Statements for further discussion of Pension Plans and Other Postretirement Benefit Plans.
Defined Contribution Retirement Plan
We sponsor a defined contribution retirement plan for our employees in the United States. This plan is qualified under section 401(k) of the U.S. tax code. Currently, we contribute an amount equal to 100% of employee contributions, up to 6% of an individual employee's salary or wages. Our costs related to this benefit plan were
$13.2 million
,
$12.6 million
and
$12.3 million
for the years ended
December 31, 2013
,
2012
and
2011
, respectively.
Defined Benefit Pension Plans
We sponsor defined benefit pension plans for our employees in the U.S., Canada, the U.K., Germany and a number of other countries, and fund government-sponsored programs in other countries where we operate. Certain of our defined benefit pension plans are advance-funded and others are pay-as-you-go. The advance-funded plans are administered by trustees who direct the management of plan assets and arrange to have obligations paid when due. Our most significant advance-funded plans cover current and former salaried employees in the U.S. and U.K.
F-87
and employees covered by collective bargaining agreements at certain of our U.S. facilities. Our U.S. advance-funded plans are qualified under the U.S. tax code.
The following table presents the funded status of our fully-funded, underfunded, and unfunded pension plans:
|
Funded Status of Pension Plans
|
Fully-Funded
Pension Plans(1)
|
Underfunded
Pension Plans(1)
|
Unfunded
Pension Plans(2)
|
||||||||||||||||||||||||||||||||
|
(In millions)
|
2013
|
2012
|
2011
|
2013
|
2012
|
2011
|
2013
|
2012
|
2011
|
||||||||||||||||||||||||||
|
Projected benefit obligation
|
$
|
247.3
|
|
$
|
237.1
|
|
$
|
213.3
|
|
$
|
1,253.9
|
|
$
|
1,351.2
|
|
$
|
1,210.6
|
|
$
|
372.0
|
|
$
|
366.6
|
|
$
|
311.2
|
|
||||||||
|
Fair value of plan assets
|
264.0
|
|
269.2
|
|
255.8
|
|
1,187.7
|
|
1,176.1
|
|
994.6
|
|
—
|
|
—
|
|
—
|
|
|||||||||||||||||
|
Funded status (PBO basis)
|
$
|
16.7
|
|
$
|
32.1
|
|
$
|
42.5
|
|
$
|
(66.2
|
)
|
$
|
(175.1
|
)
|
$
|
(216.0
|
)
|
$
|
(372.0
|
)
|
$
|
(366.6
|
)
|
$
|
(311.2
|
)
|
||||||||
|
Benefits paid
|
$
|
(10.0
|
)
|
$
|
(11.8
|
)
|
$
|
(10.2
|
)
|
$
|
(77.8
|
)
|
$
|
(64.3
|
)
|
$
|
(62.1
|
)
|
$
|
(13.5
|
)
|
$
|
(13.4
|
)
|
$
|
(14.4
|
)
|
||||||||
_______________________________________________________________________________
|
(1)
|
Plans intended to be advance-funded.
|
|
(2)
|
Plans intended to be pay-as-you-go.
|
Fully-funded plans include several advance-funded plans where the fair value of the plan assets exceeds the projected benefit obligation, or PBO. This group of plans was overfunded by
$16.7 million
as of
December 31, 2013
, and the overfunded status is reflected as "overfunded defined benefit pension plans" in the Consolidated Balance Sheets. Underfunded plans include a group of advance-funded plans that are underfunded on a PBO basis by a total of
$66.2 million
as of
December 31, 2013
. Additionally, we have several plans that are funded on a pay-as-you-go basis, and therefore, the entire PBO of
$372.0 million
at
December 31, 2013
, is unfunded. The combined balance of the underfunded and unfunded plans was
$438.2 million
as of
December 31, 2013
, and is presented as a liability on the Consolidated Balance Sheets as follows:
$15.0 million
in "other current liabilities";
$299.6 million
included in "underfunded and unfunded defined benefit pension plans"; and
$123.6 million
in "liabilities subject to compromise."
At the
December 31, 2013
, measurement date for the U.S. advance-funded plans, the PBO was approximately $
1,197
million as measured under U.S. GAAP. The PBO is measured as the present value (using a
4.76
% discount rate as of
December 31, 2013
) of vested and non-vested benefits earned from employee service to date, based upon current services and estimated future pay increases for active employees. Of the participants in the U.S. advance-funded plans, approximately
84
% are retired or former employees or employees of our former businesses, which shortens the duration of the PBO. Assets available to fund the PBO for the U.S. advance-funded plans at
December 31, 2013
, were approximately
$1,145 million
, or approximately
$52 million
less than the measured obligation.
The following table presents the components of cash contributions for the advance-funded and pay-as-you-go plans:
|
Cash Contributions to Defined Benefit Pension Plans
(In millions)
|
2013
|
2012
|
2011
|
||||||||
|
U.S. advance-funded plans
|
$
|
50.0
|
|
$
|
109.3
|
|
$
|
245.8
|
|
||
|
U.S. pay-as-you-go plans
|
5.6
|
|
5.6
|
|
5.6
|
|
|||||
|
Non-U.S. advance-funded plans
|
4.8
|
|
4.2
|
|
4.8
|
|
|||||
|
Non-U.S. pay-as-you-go plans
|
7.9
|
|
7.7
|
|
8.9
|
|
|||||
|
Total Cash Contributions
|
$
|
68.3
|
|
$
|
126.8
|
|
$
|
265.1
|
|
||
Based on the U.S. advance-funded plans' status as of
December 31, 2013
, there are no minimum required payments under ERISA for 2014.
We intend to fund non-U.S. pension plans based upon applicable legal requirements and actuarial and trustee recommendations. We contributed
$12.7 million
to these plans in
2013
.
Postretirement Benefits Other Than Pensions
We provide certain health care and life insurance benefits for retired employees in the U.S., a large majority of whom are retirees of divested businesses. These plans are unfunded, and we pay the costs of benefits under these plans as they are incurred. Our share of the net cost of benefits under this program was
$4.5 million
in
2013
, compared with
$4.6 million
in
2012
. We received Medicare subsidy payments of
$1.4 million
and
$3.3 million
in
F-88
2013
and
2012
, respectively. Our recorded liability for postretirement benefits of
$57.2 million
at
December 31, 2013
, is stated at net present value discounted at 4.26%.
Tax Matters
At emergence from bankruptcy, Grace generated approximately $670 million in U.S. Federal net operating losses, that were previously recorded as deferred tax assets for temporary differences, that will be available to reduce U.S. Federal taxable income in 2014 and future years. In addition, Grace expects to receive a U.S. Federal income tax deductions of $490 million upon settlement of the warrant held by one of the asbestos trusts and $1,580 million upon settlement of the deferred payment obligations to the asbestos trusts over the 2019 - 2033 period.
See Note 10 to the Consolidated Financial Statements and "Income Taxes" above for further discussion of our tax accounting and tax contingencies.
Other Contingencies
See Note 13 to the Consolidated Financial Statements for a discussion of our other contingent matters.
Inflation
We recognize that inflationary pressures may have an adverse effect on us through higher asset replacement costs and higher raw materials and other operating costs. We try to minimize these impacts through effective control of operating expenses and productivity improvements as well as price increases to customers.
We estimate that the cost of replacing our property and equipment today is greater than its historical cost. Accordingly, our depreciation expense would be greater if the expense were stated on a current cost basis.
Highly Inflationary Economy
Effective January 1, 2010, we began to account for Venezuela as a highly inflationary economy. As a result, the functional currency of our Venezuelan subsidiary became the U.S. dollar; therefore, all translation adjustments are reflected in net income in the Consolidated Statements of Operations. The exchange rate of 4.3 was used to remeasure our financial statements from bolivars to U.S. dollars upon Venezuela's designation as a highly inflationary economy.
On February 8, 2013, the Venezuelan government announced that, effective February 13, 2013, the official exchange rate of the bolivar to the U.S. dollar would devalue from 4.3 to 6.3. As a result of this currency devaluation, we incurred a charge to net income of $8.5 million in the 2013 first quarter. Of this amount, $1.6 million is included in Adjusted EBIT.
On March 18, 2013, the Venezuelan government announced the creation of a new foreign exchange mechanism called the “Complimentary System of Foreign Currency Acquirement” (or SICAD, which stands for Sistema Complimentario de Administración de Divisas). The SICAD operates similar to an auction system and allows entities in specific sectors to bid for U.S. dollars to be used for specified import transactions.
In December 2013, the regulation that created the SICAD mechanism was amended to require the Central Bank of Venezuela to include on its website the weekly average exchange rate implied by transactions settled via the SICAD auction mechanism. For the week of December 30, 2013, the SICAD rate posted on the website of the Central Bank of Venezuela was 11.3 Bolivars per 1.0 U.S. dollar.
We have not been eligible to participate in the SICAD auction process since its creation in March 2013; therefore, we have not exchanged Bolivars for U.S. dollars through this foreign exchange mechanism. If we do become eligible to participate in the SICAD auction process in the future, we may choose to do so.
There have been no changes in the official exchange rate of the Bolivar to the U.S. dollar since February 13, 2013. As of
December 31, 2013
, our bolivar-denominated net monetary asset position was $33.6 million, and Bolivar-denominated sales were approximately 1% of 2013 sales.
Critical Accounting Estimates
The preparation of financial statements in conformity with U.S. GAAP requires that we make estimates and assumptions affecting the assets and liabilities reported at the date of the Consolidated Financial Statements, and the revenues and expenses reported for the periods presented. We believe that our accounting estimates are appropriate and the related balances are reasonable; however, actual amounts could differ from the original
F-89
estimates, requiring adjustments in future periods. Changes in estimates are recorded in the period in which the change is identified. Our accounting policies are described in Note 1 to the Consolidated Financial Statements. Critical accounting estimates are described in this section.
An accounting estimate is considered critical if the estimate requires management to make assumptions and judgments about matters that were highly uncertain at the time the estimate was made, if different estimates reasonably could have been used, or if changes in the estimate are reasonably likely to occur from period to period that could have a material impact on our financial condition or results of operations. As part of our quarterly disclosure controls and procedures, management has discussed the development, selection and disclosure of the critical accounting estimates with the Audit Committee of the Board of Directors.
Contingent Liabilities
We have recorded a liability for the resolution of contingencies related to asbestos lawsuits, environmental remediation, income taxes and litigation. We record a liability if we have determined that a loss is probable and we are able to reasonably estimate the amount of the loss or have another reasonable basis for recording a liability. We have determined that each of the contingencies discussed below involves an accounting judgment that is material to our Consolidated Financial Statements.
Asbestos-related Lawsuits
We were a defendant in property damage and personal injury lawsuits relating to previously sold asbestos-containing products. As discussed in Note 2 to the Consolidated Financial Statements, we emerged from Chapter 11 on February 3, 2014. We have recorded a liability as of December 31, 2013, for our asbestos-related obligations as discussed below.
Our liability for asbestos-related matters has had a material impact on our financial condition and results of operations. The resolution of this obligation under the Joint Plan had a material impact on our liquidity and capital resources.
As discussed in Note 2 to the Consolidated Financial Statements, the Joint Plan established two asbestos trusts under Section 524(g) of the U.S. Bankruptcy Code as follows:
All asbestos-related personal injury claims and demands will be channeled for resolution to the PI Trust. We are not obligated to make additional payments to the PI Trust beyond the payments discussed in Note 2. We have
recorded a liability for these payments.
Following the Effective Date, unresolved and any future non-ZAI PD Claims are to be litigated pursuant to procedures to be approved by the Bankruptcy Court and, to the extent such PD claims are determined to be allowed claims, are to be paid in cash by the PD Trust. We are obligated to make a payment to the PD Trust every six months in the amount of any non-ZAI PD Claims allowed during the preceding six months plus interest (if applicable) and, except for the first six months, the amount of PD Trust expenses for the preceding six months (the "PD Obligation"). The aggregate amount to be paid under the PD Obligation is not capped and we may be obligated to make additional payments to the PD account of the PD Trust in respect of the PD Obligation. We have accrued for PD Claims that we believe are probable and estimable.
We are obligated to make a payment of
$30 million
in cash to the ZAI PD Account on the third anniversary of the Effective Date and we are obligated to make up to
10
contingent deferred payments of
$8 million
per year to the ZAI PD Account during the 20-year period beginning on the fifth anniversary of the Effective Date, with each such payment due only if the assets of the ZAI PD Account fall below
$10 million
during the preceding year. The amounts that we will be obligated to pay to the ZAI PD Account under the Joint Plan are capped amounts. We are not obligated to make additional payments to the PD Trust in respect of the ZAI PD Account beyond the payments described above. We have accrued for the
$30 million
payment due on the third anniversary of the Effective Date, but have not accrued for the
10
additional payments since we do not currently believe they are probable.
The recorded asbestos-related liability as of
December 31, 2013
, and
December 31, 2012
, was
$2,092.4 million
and
$2,065.0 million
respectively, and is included in "liabilities subject to compromise" in the accompanying Consolidated Balance Sheets. We increased the asbestos-related liability by $27.4 million in the 2013 fourth quarter to reflect an updated estimate of the value of the consideration payable to the PI Trust and the PD Trust (the "Trusts") under the Joint Plan, reflecting emergence from bankruptcy during the 2014 first quarter.
The warrant to acquire 10 million shares of the Company's common stock for $17.00 per share was recorded at estimated value of $490 million on the effective date of the Joint Plan.
F-90
The deferred payment obligation of $110 million per year for five years beginning January 2, 2019, and of $100 million per year for ten years beginning January 2, 2024, was recorded at estimated value on the effective date of the Joint Plan. The recorded estimated value of the deferred payment obligation of $567 million is within the reasonable range of possible valuations of this obligation as of emergence. The value of the deferred payment obligation assumes a discount rate of approximately 10% and is affected by (i) interest rates; (ii) the Company's credit standing and the payment period of the deferred payments; (iii) restrictive covenants and terms of the Company's other credit facilities; (iv) assessment of the risk of a default, which if default were to occur would require us to issue shares of Company common stock; and (v) the subordination provisions of the deferred payment agreement.
See Note 3 to the Consolidated Financial Statements for a pro forma balance sheet reflecting the effects of our emergence as if it occurred on December 31, 2013. We also provided pro forma information on February 24, 2012, and February 27, 2013
.
The value of the warrants is expected to be treated as a deductible expense for tax purposes in the year of settlement. The deferred payments are expected to be deductible at the time of each payment. Due to the payment of these and other deductible bankruptcy claims, we anticipate generating significant future tax deductions beginning in 2014. See Note 10 to the Consolidated Financial Statements for a discussion of future tax deductions that we may generate in connection with emergence from Chapter 11.
Environmental Remediation
We are obligated under applicable law to remediate certain properties related to our business or former businesses. At some sites we outsource all or a portion of the remediation to third parties and at others, we perform the required remediation ourselves. Our environmental remediation obligation has a significant impact on our Consolidated Financial Statements. See disclosure in this Report in Item 1 (Business—Environment, Health and Safety Matters) and in Note 13 to the Consolidated Financial Statements for a discussion of our environmental remediation liabilities.
At sites where third parties conduct remediation, we estimate our obligations from information available to us, including actual costs incurred, expected future costs and time to completion. At sites where we conduct remediation, we work with regulatory authorities to define compliance requirements and then estimate the cost required to meet those requirements. We base our estimates on our historical knowledge and engineering assessments specific to conditions at each site, and we update our estimates as necessary.
Our estimates can fluctuate significantly due to the extended duration of some remediation projects. The accuracy of our estimates is dependent on the validity of assumptions regarding such matters as labor rates, indirect costs and capital costs (such as building materials), which are difficult to forecast over extended periods. We cannot estimate the impact on our Consolidated Financial Statements of using other reasonably possible assumptions because we primarily rely on the assumptions and estimates of the applicable regulatory authorities. Future changes in estimates, if required, will more than likely lead to material adjustments to our Consolidated Financial Statements, and we expect the ultimate resolution of these obligations to have a material impact on our liquidity and capital resources.
We operated a vermiculite mine in Libby, Montana, until 1990. Some of the vermiculite ore that was mined at the Libby mine contained naturally occurring asbestos. We are working in cooperation with EPA to investigate the Libby vermiculite mine and the surrounding area. We do not have sufficient information to estimate the cost of any required remediation of the Libby mine. During 2010, EPA began reinvestigating up to 105 facilities where vermiculite concentrate from the Libby mine was processed. We are cooperating with EPA on this reinvestigation. During the 2011 fourth quarter, EPA requested that we conduct additional remediation at seven of these facilities (now eight, including an additional site added by EPA during the 2012 fourth quarter). It is probable that EPA will request additional remediation at other facilities. We do not have sufficient information to identify either the sites that might require additional remediation or estimate the cost of any additional remediation. We will evaluate our estimated remediation liability for other sites as we receive additional information from EPA. Our estimates of our environmental remediation obligations do not include the cost to remediate the Libby vermiculite mine or costs related to any additional EPA claims, whether resulting from EPA's reinvestigation of vermiculite facilities or otherwise, which may be material but are not currently estimable. Due to these vermiculite-related matters, it is probable that our ultimate liability for environmental remediation will exceed our current estimates by material amounts.
F-91
Litigation
We are subject to legal proceedings and claims arising out of the normal course of business.
To estimate the cost to resolve our legal obligations, we review the facts of each matter to determine the merits of the case and the corresponding probability of a loss. If we determine that a loss is probable, we determine if there is sufficient information to make a reasonable estimate of the loss amount. Our estimates regarding the outcome of our legal proceedings and claims involve substantial uncertainties that could cause our actual losses to differ materially from our estimates. In estimating the likely outcome of a legal proceeding, we consider the nature of the specific claim (or unasserted claim), our experience with similar claims, the jurisdiction in which the proceeding is filed, court rulings, the status of any settlement negotiations, the likelihood of resolution through settlement or alternative dispute resolution, the proceeding's current status and other relevant information and events. We adjust our recorded liability for litigation contingencies as necessary to reflect our current evaluation of these and other factors.
Goodwill
We review our goodwill for impairment on an annual basis at October 31 and whenever events or a change in circumstances indicate that the carrying amount may not be fully recoverable. We test our goodwill for impairment at the reporting unit level which is one level below an operating segment. At October 31, 2013, our reporting units were defined as follows. Our Catalysts Technologies operating segment has two reporting units for goodwill impairment testing referred to as Refining Technologies and Specialty Catalysts. Our Materials Technologies operating segment has three reporting units for goodwill impairment testing referred to as Engineered Materials, Packaging Technologies, and Discovery Sciences. Our Construction Products operating segment has three reporting units referred to as GCP Americas, GCP Europe and GCP Asia Pacific.
We performed a quantitative analysis for all of our reporting units as of October 31,
2013
, and concluded that none of our reporting units were impaired.
Effective January 1, 2014, we realigned our Construction Products operating segment reporting units to Specialty Construction Chemicals and Specialty Building Materials, reflecting changes to the businesses’ organization structure. We do not expect this realignment to have an impact on our assessment of goodwill impairment.
Pension and Other Postretirement Benefits Expenses and Liabilities
We sponsor defined benefit pension plans for our employees in the United States and a number of other countries, including Canada, the United Kingdom and Germany, and fund government-sponsored programs in other countries where we operate. See Note 11 to the Consolidated Financial Statements for a detailed discussion of our pension plans and other postretirement benefit plans.
In order to estimate our pension and other postretirement benefits expenses and liabilities we evaluate the range of possible assumptions to be used in the calculation of pension and other postretirement benefits expenses and liabilities. We select the assumptions that we believe to be most indicative of factors such as participant demographics, past experiences and market indices, and provide the assumptions to independent actuaries. These assumptions are updated annually and primarily include factors such as discount rates, health care cost trend rates, expected return on plan assets, mortality rates, retirement rates, and rate of compensation increase. The independent actuaries review our assumptions for reasonableness, and use the assumptions to calculate our estimated liability and future pension expense. We review the actuarial reports for reasonableness and adjust our expenses, assets and liabilities to reflect the amounts calculated in the actuarial reports.
The two key assumptions used in determining our pension benefit obligations and pension expense are the discount rate and expected return on plan assets. Our most significant pension assets and pension liabilities relate to U.S. pension plans.
The assumed discount rate for pension plans reflects the market rates for high-quality corporate bonds currently available and is subject to change based on changes in overall market interest rates. For the U.S. pension plans, the assumed discount rate was selected in consultation with our independent actuaries, based on a yield curve constructed from a portfolio of high quality bonds for which the timing and amount of cash outflows approximate the estimated payouts of the plan.
We selected the expected return on plan assets for the U.S. qualified pension plans for
2013
in consultation with our independent actuaries, using an expected return model. The model determines the weighted average return for an investment portfolio based on the target asset allocation and expected future returns for each asset
F-92
class, which were developed using a building block approach based on observable inflation, available interest rate information, current market characteristics, and historical results.
The following table reflects the sensitivity of 2014 pre-tax e
xpense
(excluding the effects of the annual mark-to-market adjustment)
and our year-end projected benefit obligation, or PBO, to a change in the discount rate and expected rate of return on plan assets assumptions for the U.S. pension plans:
|
Change in Assumption
(In millions)
|
Effect on 2014
Pre-Tax Pension
Expense
|
Effect on December 31, 2013 PBO
|
|||||
|
25 basis point decrease in discount rate
|
$
|
(1
|
)
|
$
|
38
|
|
|
|
25 basis point increase in discount rate
|
1
|
|
(36
|
)
|
|||
|
25 basis point decrease in expected return on plan assets
|
3
|
|
—
|
|
|||
|
25 basis point increase in expected return on plan assets
|
(3
|
)
|
—
|
|
|||
Income Taxes
We are a global enterprise with operations in more than 40 countries. This global reach results in a complexity of tax regulations, which require assessments of applicable tax law and judgments in estimating our ultimate income tax liability. See Note 10 to the Consolidated Financial Statements for a detailed discussion of our estimates used in accounting for income taxes and income tax contingencies.
We recognize the tax benefit from an uncertain tax position only if it is more likely than not that the tax position will be sustained upon examination by the taxing authorities, based on the technical merits of the position. We measure tax benefits in our financial statements from such a position as the largest benefit that has a greater than fifty percent likelihood of being realized upon ultimate settlement. Unrecognized tax benefits are tax benefits claimed in our tax returns that do not meet these recognition and measurement standards.
We record a liability for income tax contingencies when it is more likely than not that a tax position we have taken will not be sustained upon audit. We evaluate such likelihood based on relevant facts and tax law. We adjust our recorded liability for income tax matters due to changes in circumstances or new uncertainties, such as amendments to existing tax law. Our ultimate tax liability depends upon many factors, including negotiations with taxing authorities in the jurisdictions in which we operate, outcomes of tax litigation, and resolution of disputes arising from federal, state, and foreign tax audits. Due to the varying tax laws in each jurisdiction, senior management, with the assistance of local tax advisors as necessary, assesses individual matters in each jurisdiction on a case-by-case basis. We research and evaluate our income tax positions, including why we believe they are compliant with income tax regulations, and these positions are documented internally.
Deferred income taxes result from the differences between the financial and tax basis of our assets and liabilities and are adjusted for changes in tax rates and tax laws when changes are enacted. If it is more likely than not that all or a portion of deferred tax assets will not be realized, a valuation allowance is provided for such deferred tax assets. As of
December 31, 2013
, we have recorded net deferred tax assets before valuation allowances of
$904.0 million
and a valuation allowance on net deferred tax assets of
$18.3 million
, of which
$13.6 million
is related to U.S. state NOLs,
$4.4 million
to U.S. federal credits, and
$0.3 million
to foreign deferred tax assets. The net deferred tax assets were
$885.7 million
.
We considered forecasted earnings, future taxable income and the mix of earnings in the jurisdictions in which we operate, as well as prudent and feasible tax planning strategies in assessing the need for a valuation allowance. In determining a need for a valuation allowance, we have considered both positive and negative evidence, giving more weight to objective evidence, to determine whether enough income would be generated to utilize the future deductions associated with the deferred tax assets. U.S. Federal deferred tax assets associated with certain credit carryforwards have expiration dates through 2018 and are projected to expire before they can be utilized. We have recorded a valuation allowance of $4.4 million on these credits. We concluded that a valuation allowance is not required with respect to the remaining U.S. Federal deferred tax assets of $775.7 million because we believe we will have sufficient U.S. taxable income to realize all future available tax deductions and remaining credits prior to their expiration.
We also considered the need for a valuation allowance on state deferred tax assets. We have considered forecasted earnings, recent past and future taxable income and allowable carryforward periods of net operating
F-93
losses in each state taxing jurisdiction in which we operate. We believe that we will generate sufficient domestic income in most state and local jurisdictions to utilize future deductions.
In the 2013 fourth quarter, we determined that it is more likely than not that, with the exception of certain state NOLs that were generated in prior years, future taxable income will be sufficient to enable us to utilize our remaining state deferred tax assets. Accordingly, we recorded a $24.4 million release in our valuation allowance on our state deferred tax assets. The valuation allowance was also reduced by, to a lesser extent, the utilization and expiration of state net operating losses in the current year and the reduction of net operating losses resulting from prior year adjustments to taxable income. There are certain states where a portion of the NOLs generated in prior years will not be utilized prior to their expiration and for which a valuation allowance in aggregate of $13.6 million remains in place.
The realization of deferred tax assets is dependent on the generation of sufficient taxable income in the appropriate tax jurisdictions. Although realization is not assured, we believe it is more likely than not that the remaining deferred tax assets will be realized. If we were to determine that we would not be able to realize a portion of our net deferred tax assets in the future, for which there is currently no valuation allowance, an adjustment to the net deferred tax assets would be charged to earnings in the period such determination was made. Conversely, if we were to make a determination that it is more likely than not that deferred tax assets, for which there is currently a valuation allowance, would be realized, the related valuation allowance would be reduced and a benefit to earnings would be recorded.
Recent Accounting Pronouncements
See Note 1 of Consolidated Financial Statements for a discussion of recent accounting pronouncements and their effect on us.
F-94
W. R. GRACE & CO. AND SUBSIDIARIES
FINANCIAL STATEMENT SCHEDULE II—VALUATION AND QUALIFYING ACCOUNTS AND RESERVES
(In millions)
For the Year Ended December 31, 2013
|
Description
|
Balance at beginning of period
|
Additions charged to costs and expenses
|
Deductions
|
Other,
net(1)
|
Balance at end of period
|
||||||||||||||
|
Valuation and qualifying accounts deducted from assets:
|
|
|
|
|
|
||||||||||||||
|
Allowances for notes and accounts receivable
|
$
|
6.9
|
|
$
|
2.2
|
|
$
|
(1.6
|
)
|
$
|
0.1
|
|
$
|
7.6
|
|
||||
|
Valuation allowance for deferred tax assets(2)
|
40.8
|
|
4.4
|
|
(24.4
|
)
|
(2.5
|
)
|
18.3
|
|
|||||||||
|
Reserves:
|
|
|
|
|
|
||||||||||||||
|
Reserves for asbestos-related litigation
|
2,065.0
|
|
27.4
|
|
—
|
|
—
|
|
2,092.4
|
|
|||||||||
|
Reserves for environmental remediation
|
140.5
|
|
8.0
|
|
(14.0
|
)
|
—
|
|
134.5
|
|
|||||||||
|
Reserves for retained obligations of divested businesses
|
34.2
|
|
0.8
|
|
—
|
|
—
|
|
35.0
|
|
|||||||||
For the Year Ended December 31, 2012
|
Description
|
Balance at beginning of period
|
Additions charged to costs and expenses
|
Deductions
|
Other,
net(1)
|
Balance at end of period
|
||||||||||||||
|
Valuation and qualifying accounts deducted from assets:
|
|
|
|
|
|
||||||||||||||
|
Allowances for notes and accounts receivable
|
$
|
9.8
|
|
$
|
1.9
|
|
$
|
(4.8
|
)
|
$
|
—
|
|
$
|
6.9
|
|
||||
|
Valuation allowance for deferred tax assets
|
100.8
|
|
—
|
|
(60.0
|
)
|
—
|
|
40.8
|
|
|||||||||
|
Reserves:
|
|
|
|
|
|
||||||||||||||
|
Reserves for asbestos-related litigation
|
1,700.0
|
|
365.0
|
|
—
|
|
—
|
|
2,065.0
|
|
|||||||||
|
Reserves for environmental remediation
|
149.9
|
|
3.6
|
|
(13.0
|
)
|
—
|
|
140.5
|
|
|||||||||
|
Reserves for retained obligations of divested businesses
|
33.7
|
|
0.7
|
|
(0.2
|
)
|
—
|
|
34.2
|
|
|||||||||
For the Year Ended December 31, 2011
|
Description
|
Balance at beginning of period
|
Additions charged to costs and expenses
|
Deductions
|
Other,
net(1)
|
Balance at end of period
|
||||||||||||||
|
Valuation and qualifying accounts deducted from assets:
|
|
|
|
|
|
||||||||||||||
|
Allowances for notes and accounts receivable
|
$
|
8.7
|
|
$
|
2.9
|
|
$
|
(2.0
|
)
|
$
|
0.2
|
|
$
|
9.8
|
|
||||
|
Valuation allowance for deferred tax assets
|
104.6
|
|
—
|
|
(3.8
|
)
|
—
|
|
100.8
|
|
|||||||||
|
Reserves:
|
|
|
|
|
|
||||||||||||||
|
Reserves for asbestos-related litigation
|
1,700.0
|
|
—
|
|
—
|
|
—
|
|
1,700.0
|
|
|||||||||
|
Reserves for environmental remediation
|
144.0
|
|
17.8
|
|
(11.8
|
)
|
(0.1
|
)
|
149.9
|
|
|||||||||
|
Reserves for retained obligations of divested businesses
|
33.9
|
|
0.4
|
|
(0.6
|
)
|
—
|
|
33.7
|
|
|||||||||
_______________________________________________________________________________
|
(1)
|
Various miscellaneous adjustments against reserves and effects of currency translation.
|
|
(2)
|
The valuation allowance decreased
$22.5 million
from
December 31, 2012
, to
December 31, 2013
. In the
2013
fourth quarter, Grace determined that it is more likely than not that its deductions generated at emergence will be used before their expiration. Accordingly, Grace recorded a
$24.4
million release of its valuation allowance on its state deferred tax assets. Further decreases in Grace’s deferred tax assets resulted from the utilization and expiration of state net operating losses ("NOLs") in the current year, and the reduction of NOLs resulting from prior-year adjustments to taxable income. These decreases were partially offset by the recording of valuation allowance on deferred tax assets associated with certain U.S. federal foreign tax credits. The reduction in the valuation allowance during 2012 related in part to a
$44.0 million
release of the valuation allowance as Grace determined that it is more likely than not that a substantial portion of its state net operating losses will be used before their expiration; the remainder of the release related to the utilization and expiration of state net operating losses in the current year, and the reduction of net operating losses resulting from prior-year adjustments made to income by the Internal Revenue Service. The reduction in 2011 primarily related to the utilization and expiration of state net operating losses.
|
F-95
Table of Contents
EXHIBIT 12
W. R. GRACE & CO. AND SUBSIDIARIES
COMPUTATION OF RATIO OF EARNINGS TO FIXED CHARGES AND
COMBINED FIXED CHARGES AND PREFERRED STOCK DIVIDENDS(1)(2)(3)
(In millions, except ratios)
(Unaudited)
|
Year Ended December 31,
|
||||||||||||||||||||
|
2013
|
2012
|
2011
|
2010
|
2009
|
||||||||||||||||
|
Net income attributable to W. R. Grace & Co. shareholders
|
$
|
256.1
|
|
$
|
40.0
|
|
$
|
219.7
|
|
$
|
193.8
|
|
$
|
76.3
|
|
|||||
|
Provision for (benefit from) income taxes
|
102.9
|
|
(61.6
|
)
|
87.9
|
|
26.2
|
|
18.1
|
|
||||||||||
|
Equity in earnings of unconsolidated affiliate
|
(22.9
|
)
|
(18.5
|
)
|
(15.2
|
)
|
(17.8
|
)
|
(1.7
|
)
|
||||||||||
|
Distributed income of earnings of unconsolidated affiliates
|
2.8
|
|
6.3
|
|
10.9
|
|
0.5
|
|
—
|
|
||||||||||
|
Interest expense and related financing costs, including amortization of capitalized interest, less interest capitalized
|
43.9
|
|
46.8
|
|
43.6
|
|
41.7
|
|
38.8
|
|
||||||||||
|
Estimated amount of rental expense deemed to represent the interest factor
|
8.8
|
|
7.5
|
|
6.9
|
|
6.9
|
|
6.7
|
|
||||||||||
|
Income as adjusted
|
$
|
391.6
|
|
20.5
|
|
353.8
|
|
251.3
|
|
138.2
|
|
|||||||||
|
Combined fixed charges and preferred stock dividends:
|
||||||||||||||||||||
|
Interest expense and related financing costs, including capitalized interest
|
$
|
45.0
|
|
46.9
|
|
43.6
|
|
41.3
|
|
38.9
|
|
|||||||||
|
Estimated amount of rental expense deemed to represent the interest factor
|
8.8
|
|
7.5
|
|
6.9
|
|
6.9
|
|
6.7
|
|
||||||||||
|
Fixed charges
|
53.8
|
|
54.4
|
|
50.5
|
|
48.2
|
|
45.6
|
|
||||||||||
|
Combined fixed charges and preferred stock dividends
|
$
|
53.8
|
|
54.4
|
|
50.5
|
|
48.2
|
|
45.6
|
|
|||||||||
|
Ratio of earnings to fixed charges
|
7.28
|
|
—
|
|
7.01
|
|
5.21
|
|
3.03
|
|
||||||||||
|
Ratio of earnings to fixed charges and preferred stock dividends
|
7.28
|
|
—
|
|
7.01
|
|
5.21
|
|
3.03
|
|
||||||||||
_______________________________________________________________________________
|
(1)
|
Grace did not have preferred stock from
2009
through
2013
.
|
|
(2)
|
The
2012
ratio of earnings to fixed charges is below a one-to-one ratio. An additional $
33.9
million in earnings would be needed to attain a one-to-one ratio.
|
|
(3)
|
Amounts have been revised as a result of our fourth quarter change to mark-to-market pension accounting. See Note 1 to the Consolidated Financial Statements for more information.
|
EXHIBIT 31.(i).1
CERTIFICATION OF PERIODIC REPORT UNDER SECTION 302 OF
THE SARBANES-OXLEY ACT OF 2002
I, A. E. Festa, certify that:
|
1.
|
I have reviewed this annual report on Form 10-K of W. R. Grace & Co.;
|
|
2.
|
Based on my knowledge, this report does not contain any untrue statement of a material fact or omit to state a material fact necessary to make the statements made, in light of the circumstances under which such statements were made, not misleading with respect to the period covered by this report;
|
|
3.
|
Based on my knowledge, the financial statements, and other financial information included in this report, fairly present in all material respects the financial condition, results of operations and cash flows of the registrant as of, and for, the periods presented in this report;
|
|
4.
|
The registrant's other certifying officer(s) and I are responsible for establishing and maintaining disclosure controls and procedures (as defined in Exchange Act Rules 13a-15(e) and 15d-15(e)) and internal control over financial reporting (as defined in Exchange Act Rules 13a-15(f) and 15d-15(f)) for the registrant and have:
|
|
(a)
|
designed such disclosure controls and procedures, or caused such disclosure controls and procedures to be designed under our supervision, to ensure that material information relating to the registrant, including its consolidated subsidiaries, is made known to us by others within those entities, particularly during the period in which this report is being prepared;
|
|
(b)
|
designed such internal control over financial reporting, or caused such internal control over financial reporting to be designed under our supervision, to provide reasonable assurance regarding the reliability of financial reporting and the preparation of financial statements for external purposes in accordance with generally accepted accounting principles;
|
|
(c)
|
evaluated the effectiveness of the registrant's disclosure controls and procedures and presented in this report our conclusions about the effectiveness of the disclosure controls and procedures, as of the end of the period covered by this report based on such evaluation; and
|
|
(d)
|
disclosed in this report any change in the registrant's internal control over financial reporting that occurred during the registrant's most recent fiscal quarter (the registrant's fourth fiscal quarter in the case of an annual report) that has materially affected, or is reasonably likely to materially affect, the registrant's internal control over financial reporting; and
|
|
5.
|
The registrant's other certifying officer(s) and I have disclosed, based on our most recent evaluation of internal control over financial reporting, to the registrant's auditors and the audit committee of the registrant's board of directors (or persons performing the equivalent functions):
|
|
(a)
|
all significant deficiencies and material weaknesses in the design or operation of internal control over financial reporting which are reasonably likely to adversely affect the registrant's ability to record, process, summarize and report financial information; and
|
|
(b)
|
any fraud, whether or not material, that involves management or other employees who have a significant role in the registrant's internal control over financial reporting.
|
Date:
February 27, 2014
|
/s/ A. E. FESTA
|
||
|
|
A. E. Festa
Chief Executive Officer
|
|
EXHIBIT 31.(i).2
CERTIFICATION OF PERIODIC REPORT UNDER SECTION 302 OF
THE SARBANES-OXLEY ACT OF 2002
I, Hudson La Force III, certify that:
|
1.
|
I have reviewed this annual report on Form 10-K of W. R. Grace & Co.;
|
|
2.
|
Based on my knowledge, this report does not contain any untrue statement of a material fact or omit to state a material fact necessary to make the statements made, in light of the circumstances under which such statements were made, not misleading with respect to the period covered by this report;
|
|
3.
|
Based on my knowledge, the financial statements, and other financial information included in this report, fairly present in all material respects the financial condition, results of operations and cash flows of the registrant as of, and for, the periods presented in this report;
|
|
4.
|
The registrant's other certifying officer(s) and I are responsible for establishing and maintaining disclosure controls and procedures (as defined in Exchange Act Rules 13a-15(e) and 15d-15(e)) and internal control over financial reporting (as defined in Exchange Act Rules 13a-15(f) and 15d-15(f)) for the registrant and have:
|
|
(a)
|
designed such disclosure controls and procedures, or caused such disclosure controls and procedures to be designed under our supervision, to ensure that material information relating to the registrant, including its consolidated subsidiaries, is made known to us by others within those entities, particularly during the period in which this report is being prepared;
|
|
(b)
|
designed such internal control over financial reporting, or caused such internal control over financial reporting to be designed under our supervision, to provide reasonable assurance regarding the reliability of financial reporting and the preparation of financial statements for external purposes in accordance with generally accepted accounting principles;
|
|
(c)
|
evaluated the effectiveness of the registrant's disclosure controls and procedures and presented in this report our conclusions about the effectiveness of the disclosure controls and procedures, as of the end of the period covered by this report based on such evaluation; and
|
|
(d)
|
disclosed in this report any change in the registrant's internal control over financial reporting that occurred during the registrant's most recent fiscal quarter (the registrant's fourth fiscal quarter in the case of an annual report) that has materially affected, or is reasonably likely to materially affect, the registrant's internal control over financial reporting; and
|
|
5.
|
The registrant's other certifying officer(s) and I have disclosed, based on our most recent evaluation of internal control over financial reporting, to the registrant's auditors and the audit committee of the registrant's board of directors (or persons performing the equivalent functions):
|
|
(a)
|
all significant deficiencies and material weaknesses in the design or operation of internal control over financial reporting which are reasonably likely to adversely affect the registrant's ability to record, process, summarize and report financial information; and
|
|
(b)
|
any fraud, whether or not material, that involves management or other employees who have a significant role in the registrant's internal control over financial reporting.
|
Date:
February 27, 2014
|
/s/ HUDSON LA FORCE III
|
||
|
|
Hudson La Force III
Senior Vice President and Chief Financial Officer
|
|
EXHIBIT 32
CERTIFICATION UNDER SECTION 906 OF THE SARBANES-OXLEY ACT OF 2002
Pursuant to Section 906 of the Sarbanes-Oxley Act of 2002 (18 U.S.C. Section 1350), the undersigned certifies that (1) this Annual Report of W. R. Grace & Co. (the "Company") on Form 10-K for the period ended
December 31, 2013
, as filed with the Securities and Exchange Commission on the date hereof (this "Report"), fully complies with the requirements of Sections 13(a) or 15(d) of the Securities Exchange Act of 1934, as amended, and (2) the information contained in this Report fairly presents, in all material respects, the financial condition and results of operations of the Company.
|
/s/ A. E. FESTA
|
||
|
Chief Executive Officer
|
|
|
|
/s/ HUDSON LA FORCE III
|
||
|
Senior Vice President and Chief Financial Officer
|
|
|
|
Date: 2/27/2014
|
|
|
A signed original of this written statement required by Section 906 has been provided to the Company and will be retained by the Company and furnished to the Securities and Exchange Commission or its staff upon request.
TABLE OF CONTENTS
Part IItem 1. BusinessItem 1A. Risk FactorsItem 1B. Unresolved Staff CommentsItem 2. PropertiesItem 3. Legal ProceedingsItem 4. Mine Safety DisclosuresPart IIItem 5. Market For Registrant's Common Equity, Related Shareholder Matters and Issuer Purchases Of Equity SecuritiesItem 6. Selected Financial DataItem 7. Management's Discussion and Analysis Of Financial Condition and Results Of OperationsItem 7A. Quantitative and Qualitative Disclosures About Market RiskItem 8. Financial Statements and Supplementary DataItem 9. Changes in and Disagreements with Accountants on Accounting and Financial DisclosureItem 9A. Controls and ProceduresItem 9B. Other InformationPart IIIItem 10. Directors, Executive Officers and Corporate GovernanceItem 11. Executive CompensationItem 12. Security Ownership Of Certain Beneficial Owners and Management and Related Stockholder MattersItem 13. Certain Relationships, Related Transactions and Director IndependenceItem 14. Principal Accountant Fees and ServicesPart IVItem 15. Exhibits and Financial Statement Schedules