GREEN BRICK PARTNERS, INC.
10-Ks and 10-Qs
|
|
|
|
|
|
|
|
|
|
|
|
|
|
|
|
|
|
|
|
|
|
|
|
|
|
|
|
|
|
|
|
|
|
|
|
|
|
|
|
|
|
|
|
|
|
|
|
|
|
|
|
|
|
|
|
UNITED STATES
SECURITIES AND EXCHANGE COMMISSION
Washington, D.C. 20549
___________________
FORM 10-K
___________________
|
ý
|
ANNUAL REPORT PURSUANT TO SECTION 13 OR 15(d) OF THE SECURITIES EXCHANGE ACT OF 1934
|
For the fiscal year ended
December 31, 2018
or
|
¨
|
TRANSITION REPORT PURSUANT TO SECTION 13 OR 15(d) OF THE SECURITIES EXCHANGE ACT OF 1934
|
Commission file number: 001-33530
|
Green Brick Partners, Inc.
|
(Exact name of registrant as specified in its charter)
|
Delaware
|
20-5952523
|
|
|
(State or other jurisdiction of incorporation or organization)
|
(I.R.S. Employer Identification No.)
|
|
|
2805 Dallas Pkwy, Ste 400
Plano, Texas 75093
|
(469) 573-6755
|
|
|
(Address of principal executive offices, including Zip Code)
|
(Registrant’s telephone number, including area code)
|
|
Securities registered pursuant to Section 12(b) of the Act:
|
Title of each class
|
|
Name of each exchange on which registered
|
|
Common Stock, par value $0.01 per share
|
|
The Nasdaq Stock Market LLC
|
|
Preferred Stock Purchase Rights
|
|
The Nasdaq Stock Market LLC
|
Securities registered pursuant to Section 12(g) of the Act:
None
Indicate by check mark if the registrant is a well-known seasoned issuer, as defined in Rule 405 of the Securities Act.
Yes
¨
No
ý
Indicate by check mark if the registrant is not required to file reports pursuant to Section 13 or Section 15(d) of the Act.
Yes
¨
No
ý
Indicate by check mark whether the registrant (1) has filed all reports required to be filed by Section 13 or 15(d) of the Securities Exchange Act of 1934 during the preceding 12 months (or for such shorter period that the registrant was required to file such reports), and (2) has been subject to such filing requirements for the past 90 days.
Yes
ý
No
¨
Indicate by check mark whether the registrant has submitted electronically every Interactive Data File required to be submitted pursuant to Rule 405 of Regulation S-T (§232.405 of this chapter) during the preceding 12 months (or for such shorter period that the registrant was required to submit such files).
Yes
ý
No
¨
Indicate by check mark if disclosure of delinquent filers pursuant to Item 405 of Regulation S-K (§229.405 of this chapter) is not contained herein, and will not be contained, to the best of registrant’s knowledge, in definitive proxy or information statements incorporated by reference in Part III of this Form 10-K or any amendment to this Form 10-K.
ý
Indicate by check mark whether the registrant is a large accelerated filer, an accelerated filer, a non-accelerated filer, a smaller reporting company, or an emerging growth company. See definitions of “large accelerated filer,” “accelerated filer,” “smaller reporting company,” and “emerging growth company” in Rule 12b-2 of the Exchange Act.
Large accelerated filer
¨
Accelerated filer
ý
Non-accelerated filer
¨
Smaller reporting company
ý
Emerging growth company
¨
If an emerging growth company, indicate by check mark if the registrant has elected not to use the extended transition period for complying with any new or revised financial accounting standards provided pursuant to Section 13(a) of the Exchange Act.
¨
Indicate by check mark whether the registrant is a shell company (as defined in Rule 12b-2 of the Act).
Yes
¨
No
ý
The aggregate market value of voting stock held by non-affiliates of the Registrant was
$237,001,514
as of
June 30, 2018
(based upon the closing sale price on The Nasdaq Capital Market for such date). For this purpose, all shares held by directors, executive officers and stockholders beneficially owning ten percent or more of the registrant’s common stock have been treated as held by affiliates. This determination of affiliate status is not necessarily a conclusive determination for other purposes.
The number of shares of the Registrant’s common stock outstanding as of
March 1, 2019
was
50,575,266
.
DOCUMENTS INCORPORATED BY REFERENCE
The Registrant’s definitive Proxy Statement for its 2019 Annual Meeting of Stockholders is incorporated by reference into Part III of this Form 10-K.
TABLE OF CONTENTS
|
Item 1.
|
|||
|
Item 1A.
|
|||
|
Item 1B.
|
|||
|
Item 2.
|
|||
|
Item 3.
|
|||
|
Item 4.
|
|||
|
Item 5.
|
|||
|
Item 6.
|
|||
|
Item 7.
|
|||
|
Item 7A.
|
|||
|
Item 8.
|
|||
|
Item 9.
|
|||
|
Item 9A.
|
|||
|
Item 9B.
|
|||
|
Item 10.
|
|||
|
Item 11.
|
|||
|
Item 12.
|
|||
|
Item 13.
|
|||
|
Item 14.
|
|||
|
Item 15.
|
|||
|
Item 16.
|
|||
FORWARD-LOOKING STATEMENTS
This Annual Report on Form 10-K includes statements and information that may constitute forward-looking statements within the meaning of Section 27A of the Securities Act of 1933, as amended, which we refer to as the “Securities Act,” and Section 21E of the Securities Exchange Act of 1934, as amended, which we refer to as the “Exchange Act.” Statements that are “forward-looking statements,” include any projections of earnings, revenue or other financial items, any statements of the plans, strategies or objectives of management for future operations, any statements concerning proposed new projects or other developments, any statements regarding future economic conditions or performance, any statements of management’s beliefs, goals, strategies, intentions and objectives, any statements concerning potential acquisitions, and any statements of assumptions underlying any of the foregoing. Words such as “may,” “will,” “should,” “could,” “would,” “predicts,” “potential,” “continue,” “expects,” “anticipates,” “future,” “outlook,” “strategy,” “positioned,” “intends,” “plans,” “believes,” “projects,” “estimates” and similar expressions, as well as statements in the future tense, identify forward-looking statements.
These statements are necessarily subjective and involve known and unknown risks, uncertainties and other important factors that could cause our actual results, performance or achievements, or industry results, to differ materially from any future results, performance or achievements described in or implied by such statements. Actual results may differ materially from expected results described in our forward-looking statements, including with respect to correct measurement and identification of factors affecting our business or the extent of their likely impact, the accuracy and completeness of the publicly available information with respect to the factors upon which our business strategy is based or the success of our business. In addition, even if results are consistent with the forward-looking statements contained in this Annual Report on Form 10-K, those results may not be indicative of results or developments in subsequent periods. Furthermore, industry forecasts are likely to be inaccurate, especially over long periods of time and in industries particularly sensitive to market conditions such as homebuilding and builder financing.
Forward-looking statements should not be read as a guarantee of future performance or results, and will not necessarily be accurate indications of whether, or the times by which, our performance or results may be achieved. Forward-looking statements are based on information available at the time those statements are made and management’s belief as of that time with respect to future events, and are subject to risks and uncertainties that could cause actual performance or results to differ materially from those expressed in or suggested by the forward-looking statements. Important factors that could cause such differences include, but are not limited to:
|
•
|
cyclicality in the homebuilding industry and adverse changes in general economic conditions;
|
|
•
|
fluctuations and cycles in value of, and demand for, real estate investments;
|
|
•
|
significant inflation or deflation;
|
|
•
|
unavailability of subcontractors;
|
|
•
|
labor and raw material shortages and price fluctuations;
|
|
•
|
failure to recruit, retain and develop highly skilled and competent employees;
|
|
•
|
an inability to acquire undeveloped land, partially-finished developed lots and finished lots suitable for residential homebuilding at reasonable prices;
|
|
•
|
an inability to develop communities successfully or within expected timeframes;
|
|
•
|
an inability to sell properties in response to changing economic, financial and investment conditions;
|
|
•
|
risks related to participating in the homebuilding business through controlled homebuilding subsidiaries;
|
|
•
|
risks relating to buy-sell provisions in the operating agreements governing certain builder subsidiaries;
|
|
•
|
risks related to geographic concentration;
|
|
•
|
risks related to government regulation;
|
|
•
|
interpretation of or changes to tax, labor and environmental laws;
|
|
•
|
timing of receipt of regulatory approvals and of the opening of projects;
|
|
•
|
fluctuations in the market value of land, lots and housing inventories;
|
|
•
|
volatility of mortgage interest rates;
|
|
•
|
unavailability of mortgage financing;
|
|
•
|
the number of foreclosures in our markets;
|
|
•
|
interest rate increases or adverse changes in federal lending programs;
|
|
•
|
increases in unemployment or underemployment;
|
|
•
|
any limitation on, or reduction or elimination of, tax benefits associated with owning a home;
|
|
•
|
the occurrence of severe weather or natural disasters;
|
|
•
|
high cancellation rates;
|
|
•
|
competition in the homebuilding, land development and financial services industries;
|
|
•
|
risks related to future growth through strategic investments, joint ventures, partnerships and/or acquisitions;
|
|
•
|
risks related to holding noncontrolling interests in strategic investments, joint ventures, partnerships and/or acquisitions;
|
|
•
|
inability to obtain suitable bonding for land development or housing projects where required;
|
|
•
|
difficulty in obtaining sufficient capital;
|
|
•
|
risks related to environmental laws and regulations;
|
|
•
|
occurrence of a major health and safety incident;
|
|
•
|
poor relations with the residents of our communities;
|
|
•
|
information technology failures and data security breaches;
|
|
•
|
product liability claims, litigation and warranty claims;
|
|
•
|
seasonality of the homebuilding industry;
|
|
•
|
utility and resource shortages or rate fluctuations;
|
|
•
|
failure of employees or other representatives to comply with applicable regulations and guidelines;
|
|
•
|
future, or adverse resolution of, litigation, arbitration or other claims;
|
|
•
|
uninsured losses or losses in excess of insurance limits;
|
|
•
|
cost and availability of insurance and surety bonds;
|
|
•
|
volatility and uncertainty in the credit markets and broader financial markets;
|
|
•
|
availability, terms and deployment of capital including with respect to acquisitions, joint ventures and other strategic actions;
|
|
•
|
changes in our debt and related service obligations;
|
|
•
|
required accounting changes;
|
|
•
|
inability to maintain effective internal control over financial reporting; and
|
|
•
|
other risks and uncertainties inherent in our business, including those described in Item 1A. “Risk Factors.”
|
Should one or more of the risks or uncertainties described above or in Part I, Item 1A of this Annual Report on Form 10-K occur, or should underlying assumptions prove incorrect, our actual results and plans could differ materially from those expressed in any forward-looking statements. Readers are cautioned not to place undue reliance on any such forward-looking statements, which speak only as of the date they are made. Except as required by law, we disclaim all responsibility to publicly update any information contained in a forward-looking statement.
All forward-looking statements attributable to us or to persons acting on our behalf, including any such forward-looking statements made subsequent to the publication of this Annual Report on Form 10-K, are expressly qualified in their entirety by this cautionary statement.
PART I
ITEM 1. BUSINESS
Green Brick Partners, Inc. (formerly named BioFuel Energy Corp.) and its subsidiaries (together, the “Company”, “Green Brick”, “we”, “us” or “our”) is a diversified homebuilding and land development company incorporated under the laws of the State of Delaware on April 11, 2006.
We acquire and develop land, provide land and construction financing to our controlled builders and participate in the profits of our builders. Our core markets are in the high growth U.S. metropolitan areas of Dallas, Texas and Atlanta, Georgia, as well as the Vero Beach, Florida area. We also own a noncontrolling interest in a builder in Colorado Springs, Colorado. We are engaged in all aspects of the homebuilding process, including land acquisition and development, entitlements, design, construction, title and mortgage services, marketing and sales and the creation of brand images at our residential neighborhoods and master planned communities.
We believe we offer higher quality homes with more distinctive designs and floor plans than those built by our competitors at comparable prices. Our communities are located in premium locations and we seek to enhance homebuyer satisfaction by utilizing high-quality materials, offering a broad range of customization options and building well-crafted homes. We seek to maximize value over the long term and operate our business to mitigate risks in the event of a downturn by controlling costs and quickly reacting to regional and local market trends.
We are a leading lot developer in our markets and believe that our strict operating discipline provides us with a competitive advantage in seeking to maximize returns while minimizing risk. We currently own or control approximately
8,100
home sites in high-growth submarkets throughout the Dallas and Atlanta metropolitan areas and the Vero Beach, Florida market. We are strategically positioned to either build new homes on our lots through our controlled builders or to sell finished lots to third-party homebuilders. We sell finished lots to our controlled builders or option lots from third-party developers for our controlled builders’ homebuilding operations and provide them with construction financing and strategic planning. Our controlled builders provide us with their local knowledge and relationships.
We support the majority of our Dallas and Atlanta builders by financing their purchases of land from us at an unlevered internal rate of return (“IRR”) of typically 20% or more and by providing construction financing at an interest rate of at least 13.8%. Our income is further enhanced by our equity interest in the profits of our builders.
In March 2018, the Company formed a joint venture with a title company in Georgia to provide closing and settlement services to our Atlanta-based builder. The Company, through its Atlanta-based builder, owns a 49% equity interest in Providence Group Title, LLC (“Providence Title”).
In April 2018, the Company acquired an 80% interest in GRBK GHO Homes, LLC (“GRBK GHO”). GRBK GHO operates primarily in the Vero Beach, Florida market and is engaged in land and lot development, as well as all aspects of the homebuilding process. The acquisition allowed the Company to expand its operations into a new geographic market.
In June 2018, the Company formed a joint venture, Green Brick Mortgage, LLC (“Green Brick Mortgage”), with PrimeLending to provide mortgage loan origination services to our builders. The Company owns a 49% equity interest in Green Brick Mortgage, which initiated mortgage loan origination activities in September 2018.
In September 2018, the Company formed Trophy Signature Homes, LLC (“Trophy”), a wholly-owned homebuilding company that allows the Company to expand its business and offer homes at a new price point within the Dallas-Fort Worth Metroplex market. Trophy will begin home sales in the first half of 2019.
1
The following table presents general information about our controlled builders, including the types of homes they build and their price ranges.
|
Builder
|
Year Formed
|
Market
|
Products Offered
|
Price Range
|
||||
|
The Providence Group of Georgia LLC (“TPG”)
|
2011
|
Atlanta
|
Townhomes
|
$320,000 to $880,000
|
||||
|
Single family
|
$340,000 to $840,000
|
|||||||
|
CB JENI Homes DFW LLC (“CB JENI”)
|
2012
|
Dallas
|
Townhomes
|
$240,000 to $430,000
|
||||
|
Single family
|
$320,000 to $620,000
|
|||||||
|
Centre Living Homes LLC (“Centre Living”)
|
2012
|
Dallas
|
Townhomes
|
$350,000 to $800,000
|
||||
|
Southgate Homes DFW LLC (“Southgate”)
|
2013
|
Dallas
|
Luxury homes
|
$550,000 to $750,000
|
||||
|
GRBK GHO Homes LLC (“GRBK GHO”)
|
2018
|
Vero Beach
|
Patio homes
|
$200,000 to $400,000
|
||||
|
Single family
|
$200,000 to $675,000
|
|||||||
|
Trophy Signature Homes LLC (“Trophy”)
|
2018
|
Dallas
|
Single family
|
$210,000 to $500,000
|
||||
Revenues from homebuilding operations accounted for
94%
,
96%
and
96%
of the Company’s total revenues for the years ended
December 31, 2018
,
2017
, and
2016
, respectively. For more information regarding the Company’s segments, refer to Note 11 to the Consolidated Financial Statements located in Part II, Item 8 of this Annual Report on Form 10-K and to “Management’s Discussion and Analysis of Financial Condition and Results of Operations” located in Part II, Item 7 of this Annual Report on Form 10-K.
Our backlog reflects the number and value of homes for which we have entered into sales contracts with customers but not yet delivered. With the exception of a normal cancellation rate, we expect all of the backlog as of
December 31, 2018
to be filled during
2019
. The following table sets forth the information about selling communities and backlog of our controlled builders.
|
Year Ended December 31, 2018
|
December 31, 2018
|
December 31, 2017
|
|||||||||||||||||||||
|
Builder
|
Average Selling Communities
|
Selling Communities
|
Backlog, Units
|
Backlog, in thousands
|
Selling Communities
|
|
Backlog, Units
|
|
Backlog, in thousands
|
||||||||||||||
|
TPG
|
28
|
|
|
27
|
|
|
146
|
|
|
$
|
77,563
|
|
30
|
|
|
140
|
|
|
$
|
70,309
|
|
||
|
CB JENI
|
19
|
|
|
21
|
|
170
|
|
67,988
|
|
16
|
|
|
117
|
|
|
44,067
|
|
||||||
|
Centre Living
|
5
|
|
|
6
|
|
14
|
|
7,493
|
|
4
|
|
|
5
|
|
|
2,239
|
|
||||||
|
Southgate
|
7
|
|
|
8
|
|
55
|
|
37,873
|
|
5
|
|
|
48
|
|
|
34,848
|
|
||||||
|
GRBK GHO
|
7
|
|
|
14
|
|
197
|
|
73,358
|
|
—
|
|
|
—
|
|
|
—
|
|
||||||
|
Total
|
66
|
|
76
|
|
582
|
|
$
|
264,275
|
|
55
|
|
|
310
|
|
|
$
|
151,463
|
|
|||||
For more information on recent business developments and results of operations, refer to “Management’s Discussion and Analysis of Financial Condition and Results of Operations” located in Part II, Item 7 of this Annual Report on Form 10-K.
Business Strategy
We believe we are well-positioned for growth through the disciplined execution of the following elements of our strategy:
Combine Land Acquisition and Development Expertise with Homebuilding Operations to Maximize Profitability
Our ability to identify, acquire and develop land in desirable locations and on favorable terms is critical to our success. We evaluate land opportunities based on how we expect such opportunities will contribute to overall profitability and returns, rather than how they might drive volume on a market basis. We identify attractive properties that are typically located in prime neighborhood locations. We consider the existing and future supply of developable land before working to acquire the best-valued properties. Analysis includes consideration of development costs in addition to land costs. We have found that the prime quality infill locations have limited supply competition that may result in smaller value declines in down markets. We manage and oversee all land development with our in-house staff.
2
We believe our expertise in land development and planning enables us to create desirable communities that meet or exceed our target homebuyer’s expectations, while selling homes at competitive prices. Our strategy of holding land inventory provides us with a multi-year supply of lots for future homebuilding while limiting any excess supply that would otherwise be subject to market cycle risk. We focus on the development of entitled parcels in communities where we can generally sell all lots and homes within 24 to 60 months from the start of sales. This focus allows us to limit exposure to land development and market cycle risk while pursuing favorable returns on our investments. We seek to minimize our exposure to land risk through disciplined management of entitlements, the use of land and lot options and other flexible land acquisition arrangements.
Maximize Benefits of Diversified Homebuilding and Land Development Structure
Our diversified homebuilding and land development structure provides the flexibility to monetize the value of our land assets either by building and selling homes through our controlled builders or developing land and selling finished lots to unaffiliated homebuilders. When evaluating our land assets, we consider the potential contribution of each asset to our overall performance, taking into account the timeframe over which we may monetize the asset. While we currently expect the majority of our land to be utilized by our controlled homebuilders, we believe our land development and homebuilding strategy provides us with increased flexibility to seek to maximize risk-adjusted returns as market conditions warrant.
Increase Long-Term Value by Investing in Infrastructure
In our communities, we typically make enhanced investment in infrastructure, including landscaping and amenity centers, and enforce higher construction standards through our controlled builders. We believe this creates greater long-term value for us and for our controlled builders, homebuyers, shareholders and the communities in which we build.
Drive Revenue by Opening New Communities from Existing Land Supply
We have strategically invested in new land in a number of prime neighborhoods in our core markets. We currently own or control approximately
8,100
home sites in the Dallas, Atlanta and Vero Beach markets. We expect these land purchases to provide us with the opportunity for continued revenue growth and strong gross margin performance. We continue to identify development opportunities that should allow us to profit from lot sales, construction interest and our equity interest in the profits of our controlled builders.
Increase Market Positions in Dallas and Atlanta
We believe that there are significant opportunities to profitably expand in our core Dallas and Atlanta markets. We continually review the allocation of our investments in these markets taking into account demographic trends and the likely impact on our operating results. We use the results of these reviews to reallocate our investments to those areas where we believe we can maximize our profitability and return on capital. We seek to use our local relationships with land sellers, brokers and investors to pursue the purchase of additional land parcels in our core markets. While our primary growth strategy focuses on increasing our market position in our existing markets, we may, on an opportunistic basis, explore expansion into attractive new markets.
Superior Design, Broad Product Range and Enhanced Homebuying Experience
Within each of our markets, we partner our expertise with our builders to design attractive neighborhoods and homes to appeal to a wide variety of potential homebuyers. One of our core operating philosophies is to create a culture which provides a positive, memorable experience for our homebuyers through active engagement in the building process. At higher price points, we provide our homebuyers with customization options to suit their specific needs and tastes. In consultation with nationally and locally recognized architecture firms, interior and exterior consultants and homeowner focus groups, we research and design a diversified range of products for various levels and price points. Our homebuilding projects include townhomes, patio homes, single family homes and luxury custom homes. We believe we can adapt quickly to changing market conditions and optimize performance and returns while strategically reducing portfolio risk because of our diversified product strategy.
Pursue Further Growth Through the Prudent Use of Leverage
As of
December 31, 2018
, our debt to total capitalization ratio was
30%
. It is our intent to prudently employ leverage to continue to invest in our land acquisition, development and homebuilding businesses. We target a debt to total capitalization ratio of approximately
30% to 35%
, which we expect will provide us with significant additional growth capital.
3
Pursue Acquisitions of Additional Homebuilders
We intend to pursue the acquisition of additional homebuilders in our core and new markets. Our preference is to continue to acquire controlling interests in homebuilders with existing management continuing to own a significant ownership stake. We will seek to acquire and then retain management teams which have strong local relationships with land owners and have a positive reputation for building well-crafted homes in their markets. We expect that our ability to provide capital discipline and strategic oversight will complement the local skills, relationships and reputations of our future homebuilder partners.
Marketing and Sales Process
We offer a preferred lender referral program through our mortgage subsidiary to provide lending options to homebuyers in need of financing. We offer homeowners a comprehensive warranty on each home. Homes are generally covered by a ten-year warranty for structural concerns, one year for defects and products used, two years for electrical, plumbing, heating, ventilation, and air conditioning parts and labor.
We sell our homes through our internal sales representatives and also through independent real estate brokers. Our in-house sales force typically works from sales offices located in model homes near or in each community. Sales representatives assist potential buyers by providing them with basic floor plans, price information, development and construction timetables, tours of model homes, and the selection of customization and upgrade options. Sales personnel are trained by us and generally have had prior experience selling new homes in the local market. Our personnel, along with subcontracted marketing and design consultants, carefully design the exterior and interior of each home to appeal to the lifestyles of targeted homebuyers. Additionally, we advertise through the use of model homes, social media, newspapers, billboards, real estate market publications, brochures, and newsletters.
Raw Materials
Typically, all the raw materials and most of the components used in our business are readily available in the United States. Most are standard items carried by major suppliers. However, a rapid increase in the number of homes started could cause shortages in the availability of such materials or in the price of services, thereby leading to delays in the delivery of homes. We continue to monitor the supply markets to achieve the best prices available. See “Risk Factors - Labor and raw material shortages and price fluctuations could delay or increase the cost of land development and home construction, which could materially and adversely affect our business.”
Seasonality
The homebuilding industry experiences seasonal fluctuations in quarterly operating results and capital requirements. We typically experience the highest new home order activity in spring and summer, although this activity is also highly dependent on the number of active selling communities, timing of new community openings and other market factors. Since it typically takes five to nine months to construct a new home, we deliver more homes in the second half of the year as spring and summer home orders are delivered. Because of this seasonality, home starts, construction costs and related cash outflows have historically been highest in the second and third quarters, and the majority of cash receipts from home deliveries occur during the third and fourth quarters. We expect this seasonal pattern to continue over the long-term, although it may be affected by volatility in the homebuilding industry.
Competition
Competition in the homebuilding industry is intense, and there are relatively low barriers to entry. Homebuilders compete for, among other things, homebuyers, desirable land parcels, financing, raw materials and skilled labor. Increased competition could hurt our business, as it could prevent us from acquiring attractive land parcels on which to build homes or make such acquisitions more expensive, hinder our market share expansion, and lead to pricing pressures on our homes that may adversely impact our revenues and margins. If we are unable to successfully compete, our business, liquidity, financial condition and results of operations could be materially and adversely affected. Our competitors may independently develop land and construct housing units that are superior or substantially similar to our products. Furthermore, a number of our primary competitors are significantly larger, have a longer operating history and may have greater resources or lower cost of capital; accordingly, they may be able to compete more effectively in one or more of the markets in which we operate. Many of these competitors also have longstanding relationships with subcontractors and suppliers in the markets in which we operate. We also compete for sales with individual resales of existing homes and with available rental housing.
4
Our Competitive Strengths
Our business is characterized by the following competitive strengths:
Optionality Provided by Our Combined Land Development and Homebuilding Structure
We are strategically positioned to either build and sell new homes on lots through our controlled builders or develop land and sell finished lots to unaffiliated homebuilders. While our business plan has increasingly focused on building new homes on our owned and controlled lots, we proactively monitor market conditions to opportunistically sell a minority of our finished lots to unaffiliated homebuilders if we believe that doing so will maximize our returns or lower our risk.
Experienced Management Team
Our founder and Chief Executive Officer, James R. Brickman, has over 40 years of experience in real estate development and home building. Richard A. Costello, our Chief Financial Officer, joined the Company in 2015 and provides oversight of lending relationships, cash management, and investor relations. Mr. Costello has over 25 years of financial and operational experience in all aspects of real estate management. Jed Dolson, President of Texas Region, joined the Company in 2013 and is responsible for land entitlement and development activities in Dallas, as well as oversight of our Dallas homebuilding operations. Summer Loveland, our Chief Accounting Officer, joined the Company in 2017 and is responsible for the oversight of financial reporting, internal audit, treasury functions, and information technology. We believe that our experienced management team is well positioned to design and execute the development of complex, master planned residential communities.
Focus on Operations in Housing Markets with a Favorable Growth Outlook and Strong Demand Fundamentals
We believe our core markets exhibit attractive residential real estate investment characteristics, such as growing economies, improving levels of employment and population growth relative to national averages, favorable migration patterns, general housing affordability, and desirable lifestyle and weather characteristics.
We believe that increasing demand and supply constraints in our core markets create favorable conditions for our future growth.
Attractive Land Positions in Our Core Markets
We believe that we have strategically well-located land and lot positions within our core markets. We believe we have acquired our land and lot positions at attractive prices, providing us with significant opportunity for a healthy return on our investment.
In Dallas and Atlanta, we seek to acquire land with convenient access to metropolitan areas which have diverse economic and employment bases and demographics that we believe will support long-term growth.
Land Sourcing and Evaluation Capabilities
We believe that the experience and strong reputation of our management team, combined with our long-standing relationships with other market participants, provide us with a competitive advantage in efficiently sourcing, purchasing and entitling land. We are actively involved in every step of the land entitlement, home design and construction processes with our controlled builders. Our management team has developed significant collaborative relationships over decades with land sellers, developers, contractors, lenders, brokers and investors. Our deep and wide-ranging knowledge of our markets and our ability to quickly and efficiently identify, acquire and develop land in desirable locations and on favorable terms are key to our success.
Disciplined Investment Approach
We seek to maximize value over the long-term and operate our business to mitigate risks in the event of a downturn by controlling costs and focusing on regional and local market trends.
Our management team has gained significant operating expertise through varied economic cycles. The perspective gained from these experiences has helped shape our investment approach. We believe that our management team has learned to effectively evaluate housing trends in our markets, and to react quickly and rationally to market changes. Our cycle-tested management approach balances strategic planning with day-to-day decision-making responsibilities, freeing up our controlled
5
builders to concentrate on growing our homebuilding business rather than focusing on obtaining capital to fund their operations. We believe that our strict operating discipline provides us with a competitive advantage in seeking to maximize returns while minimizing risk.
Government Regulation and Environmental Matters
Our developments are subject to numerous local, state, federal and other statutes, ordinances, rules and regulations concerning zoning, development, building design, construction and similar matters that impose restrictive zoning and density requirements, the result of which is to limit the number of homes that can be built within the boundaries of a particular area. Projects that are not entitled may be subjected to periodic delays, changes in use, less intensive development or elimination of development in certain areas due to government regulations. We may also be subject to periodic delays or may be precluded entirely from developing in certain communities due to building moratoriums or “slow-growth” or “no-growth” initiatives that could be implemented in the future. Local governments also have broad discretion regarding the imposition of development and service fees for projects in their jurisdiction. Projects for which we have received land use and development entitlements or approvals may still require a variety of other governmental approvals and permits during the development process and can also be impacted adversely by unforeseen health, safety and welfare issues, which can further delay these projects or prevent their development.
We are also subject to a variety of local, state, federal and other statutes, ordinances, rules and regulations concerning the environment. The particular environmental laws that apply to any given homebuilding site vary according to multiple factors, including the site’s location, its environmental conditions and the present and former uses of the site, as well as adjoining properties. Environmental laws and conditions may result in delays, may cause us to incur substantial compliance and other costs, and can prohibit or severely restrict homebuilding and land development activity in environmentally sensitive regions or areas. In addition, in those cases where an endangered or threatened species is involved, environmental rules and regulations can result in the restriction or elimination of development in identified environmentally sensitive areas. From time to time, the United States Environmental Protection Agency and similar federal or state agencies review homebuilders’ compliance with environmental laws and may levy fines and penalties for failure to comply strictly with applicable environmental laws or impose additional requirements for future compliance as a result of past failures. Any such actions taken may increase our costs. Further, we expect that increasingly stringent requirements will be imposed on homebuilders and land developers in the future. Environmental regulations can also have an adverse impact on the availability and price of certain raw materials such as lumber.
Under various environmental laws, current or former owners of real estate, as well as certain other categories of parties, may be required to investigate and clean up hazardous or toxic substances, and may be held liable to a governmental entity or to third parties for related damages, including bodily injury, and investigation and clean-up costs incurred in connection with the contamination. Please see “Risk Factors” located in Part I, Item 1A in this Annual Report on Form 10-K.
Employees
As of
December 31, 2018
, we had approximately
390
employees, including those of our controlled builders. Although none of our employees are covered by collective bargaining agreements, certain of the subcontractors engaged by us or our affiliates are represented by labor unions or are subject to collective bargaining arrangements. We believe that our relations with our employees and subcontractors are favorable.
Available Information
Our website address is www.greenbrickpartners.com. Our Annual Reports on Form 10-K, Quarterly Reports on Form 10-Q, Current Reports on Form 8-K and amendments to those reports filed or furnished pursuant to Section 13 or 15(d) of the Exchange Act are available free of charge through our website as soon as reasonably practicable after they are electronically filed with, or furnished to, the Securities and Exchange Commission (the “SEC”). Our website and the information contained or incorporated therein are not intended to be incorporated into this Annual Report on Form 10-K.
ITEM 1A. RISK FACTORS
Set forth below are the risks that we believe are material to our investors. Any of these risks could significantly and adversely affect our business, financial condition and results of operations. You should carefully consider the risks described below, together with the other information included in this Annual Report on Form 10-K, including the information contained under the caption “Forward-Looking Statements”.
6
Risks Related to Ownership of Our Common Stock
The price of our common stock may continue to be volatile.
The trading price of our common stock is highly volatile and could be subject to future fluctuations in response to a number of factors beyond our control. In recent years the stock market has experienced significant price and volume fluctuations. These fluctuations may be unrelated to the operating performance of particular companies. These broad market fluctuations may cause declines in the market price of our common stock. The price of our common stock could fluctuate based upon factors that have little or nothing to do with our company or its performance, and those fluctuations could materially reduce our common stock price. If we fail to meet expectations related to future growth, profitability or other market expectations, our stock price may decline significantly, which could have a material adverse impact on investor confidence and our stock price.
Certain large stockholders own a significant percentage of our shares and exert significant influence over us. Their interests may not coincide with ours and they may make decisions with which we may disagree.
Greenlight Capital, Inc. and its affiliates (“Greenlight”) and James R. Brickman own approximately 48% and 4%, respectively, of the voting power of the Company. These large stockholders, acting together, could determine substantially all matters requiring stockholder approval, including the election of directors and approval of significant corporate transactions, such as a sale or other change of control transaction. In addition, this concentration of ownership may delay or prevent a change in control of our company and make some transactions more difficult or impossible without the support of these stockholders. The interests of these stockholders may not always coincide with our interests as a company or the interests of other stockholders. Accordingly, these stockholders could cause us to enter into transactions or agreements that you would not approve or make decisions with which you may disagree.
We do not intend to pay dividends on our common stock for the foreseeable future.
We have not paid any dividends since our inception and do not anticipate paying any cash dividends on our common stock in the foreseeable future. Any payment of future dividends will be at the discretion of our Board of Directors (“BOD”) and will depend upon, among other things, our earnings, financial condition, capital requirements, levels of indebtedness, statutory and contractual restrictions applying to the payment of dividends or contained in our financing instruments and other considerations that the BOD deems relevant. Investors must rely on sales of their common stock after price appreciation, which may never occur, as the only way to realize a return on their investment. Investors seeking cash dividends should not purchase our common stock.
Certain large stockholders’ shares may be sold into the market in the future, which could cause the market price of our common stock to decrease significantly.
We believe that all or a significant portion of our common stock beneficially owned by Greenlight and Mr. Brickman are “restricted securities” within the meaning of the federal securities laws because they were acquired from us on a private, non-registered basis. We have entered into registration rights agreements with each of these parties, however, that give these parties the right to require us to register the resale of their shares under certain circumstances. If these holders sell substantial amounts of these shares, the price of our common stock could decline. In addition, the sale of these shares could impair our ability to raise capital through the sale of additional equity securities.
Risks Related to Our Tax Asset and Organizational Structure
Provisions in our charter documents may delay or prevent our acquisition by a third-party or may reduce the value of a shareholder’s investment.
Some provisions in our Charter and bylaws may be deemed to have an anti-takeover effect and may delay, defer or prevent a tender offer or takeover attempt that a stockholder may deem to be in his or her best interest. For example, our BOD may determine the rights, preferences, privileges and restrictions of unissued series of preferred stock without any vote or action by our stockholders. In addition, stockholders must provide advance notice to nominate directors or to propose business to be considered at a meeting of stockholders and may not take action by written consent. The existence of these provisions could also limit the price that investors may be willing to pay in the future for shares of our common stock.
7
Risks Related to our Business and Industry
The homebuilding industry is cyclical. A severe downturn in the industry could adversely affect our business, results of operations and stockholders’ equity.
The residential homebuilding industry is cyclical and is highly sensitive to changes in general economic conditions such as levels of employment, consumer confidence and income, availability of financing for acquisitions, construction and permanent mortgages, interest rate levels, inflation and demand for housing. The U.S. housing market has been negatively impacted by declining consumer confidence, restrictive mortgage standards and large supplies of foreclosures, resales and new homes, among other factors. When combined with a prolonged economic downturn, high unemployment levels, increases in the rate of inflation and uncertainty in the U.S. economy, these conditions have contributed to decreased demand for housing, declining sales prices and increasing pricing pressure. While national data indicates a slowdown in the overall demand for new homes during the year as interest rates have risen, in the event that demand stalls or declines further, we could experience declines in the market value of our inventory and demand for our lots, homes and construction loans, which could have a material adverse effect on our business, liquidity, financial condition and results of operations.
Our operating performance is subject to risks associated with the real estate industry.
Real estate investments are subject to various risks and fluctuations and cycles in value and demand, many of which are beyond our control. Certain events may decrease cash available for operations, as well as the value of our real estate assets. These events include, but are not limited to:
|
•
|
adverse changes in international, national or local economic and demographic conditions;
|
|
•
|
adverse changes in financial conditions of buyers and sellers of properties, particularly residential homes and land suitable for development of residential homes;
|
|
•
|
competition from other real estate investors with significant capital, including other real estate operating companies and developers and institutional investment funds;
|
|
•
|
fluctuations in interest rates, which could adversely affect the ability of homebuyers to obtain financing on favorable terms or at all;
|
|
•
|
unanticipated increases in expenses, including, without limitation, insurance costs, development costs, real estate assessments and other taxes and costs of compliance with laws, regulations and governmental policies; and
|
|
•
|
changes in enforcement of laws, regulations and governmental policies, including, without limitation, health, safety, environmental, zoning and tax laws.
|
In addition, periods of economic slowdown or recession, rising interest rates or declining demand for real estate, or the public perception that any of these events may occur, could result in a general decline in the purchase of homes or an increased incidence of home order cancellations. If we cannot successfully implement our business strategy, our business, liquidity, financial condition and results of operations will be adversely affected.
Further, acts of war, any outbreak or escalation of hostilities between the United States and any foreign power or acts of terrorism may cause disruption to the U.S. economy, or the local economies of the markets in which we operate, cause shortages of building materials, increase costs associated with obtaining building materials, result in building code changes that could increase costs of construction, affect job growth and consumer confidence or cause economic changes that we cannot anticipate, all of which could reduce demand for our lots, homes and construction loans and adversely impact our business, liquidity, financial condition and results of operations.
Our business and financial results could be adversely affected by significant inflation or deflation.
Inflation can adversely affect our homebuilding operations by increasing costs of land, financing, materials, labor and construction. While we attempt to pass on cost increases to homebuyers through increased prices, in a weak housing market, we may not be able to offset cost increases with higher selling prices. In addition, significant inflation is often accompanied by higher interest rates, which have a negative impact on housing demand. In a highly inflationary environment, depending on industry and other economic conditions, we may be precluded from raising home prices enough to keep up with the rate of inflation, which could reduce our profit margins. Moreover, with inflation, the costs of capital increase and the purchasing power of our cash resources could decline. Current or future efforts by the government to stimulate the economy may increase the risk of significant inflation and its adverse impact on our business or financial results.
8
Alternatively, a significant period of deflation could cause a decrease in overall spending and borrowing levels. This could lead to a further deterioration in economic conditions, including an increase in the rate of unemployment. Deflation could also cause the value of our inventory to decline or reduce the value of existing homes below the related mortgage loan balance, which could potentially increase the supply of existing homes and have a negative impact on our results of operations.
We are dependent on the continued availability and satisfactory performance of subcontractors which, if unavailable, could have a material adverse effect on our business.
We conduct our land development and homebuilding operations primarily as a general contractor. Virtually all land development and construction work is performed by unaffiliated third-party subcontractors. As a consequence, the timing and quality of the development of our land and the construction of our homes depends on the availability and skill of our subcontractors. There may not be sufficient availability of and satisfactory performance by these unaffiliated third-party subcontractors in the markets in which we operate. In addition, inadequate subcontractor resources could have a material adverse effect on our business.
In recent years, we have experienced labor shortages and increased labor costs. These labor shortages have resulted in higher wages for subcontractors, construction workers frequently moving between jobs for higher pay, increased prices and delays in projects.
Labor and raw material shortages and price fluctuations could delay or increase the cost of land development and home construction, which could materially and adversely affect our business.
The residential construction industry experiences labor and raw material shortages from time to time, including shortages in qualified tradespeople and supplies such as insulation, drywall, cement, steel and lumber. These labor and raw material shortages can be more severe during periods of strong demand for housing if any of the regions in which we operate experiences a natural disaster that has a significant impact on existing residential and commercial structures. The cost of labor and raw materials may also be adversely affected during periods of shortage or high inflation. Shortages and price increases could cause delays in, and increase our costs of, land development and home construction, which in turn could have a material adverse effect on our business, liquidity, financial condition and results of operations.
Failure to recruit, retain and develop highly skilled, competent employees may have a material adverse effect on our business and results of operations.
Key employees, including management team members at both the corporate and homebuilder subsidiary levels, are fundamental to our ability to obtain, generate and manage opportunities. If any of the management team members were to cease employment with us, our results of operations could suffer. Our ability to retain our management team or to attract suitable replacements should any members of its management team leave is dependent on the competitive nature of the employment market. The loss of services from key management team members or a limitation in their availability could materially and adversely impact our business, liquidity, financial condition and results of operations. Further, such a loss could be negatively perceived in the capital markets. In addition, we do not maintain key person insurance in respect of any member of our named executive officers.
In addition, key employees working in the land development, homebuilding and construction industries are highly sought after. Experienced employees in the homebuilding, land acquisition and construction industries are fundamental to our ability to generate, obtain and manage opportunities. In particular, local knowledge and relationships are critical to our ability to source attractive land acquisition opportunities. Failure to attract and retain such personnel or to ensure that their experience and knowledge is not lost when they leave the business through retirement, redundancy or otherwise may adversely affect the standards of our service and may have an adverse impact on our business, financial conditions and results of operations.
Our long-term success depends on our ability to acquire undeveloped land, partially-finished developed lots and finished lots suitable for residential homebuilding at reasonable prices, in accordance with our land investment criteria.
The homebuilding industry is highly competitive for suitable land and the risk inherent in purchasing and developing land is directly impacted by changes in consumer demand for housing. The availability of finished and partially-finished developed lots and undeveloped land for purchase that meet our investment criteria depends on a number of factors outside our control, including land availability, competition with other homebuilders and land buyers, inflation in land prices, zoning, allowable housing density, the ability to obtain building permits and other regulatory requirements. Should suitable land or lots become more difficult to locate or obtain, the number of lots we may be able to develop and sell could decrease, the number of homes we may be able to build and sell could be reduced and the cost of land could increase, perhaps substantially, which could adversely impact our results of operations.
9
As competition for suitable land increases, the cost of acquiring both finished and undeveloped lots and the cost of developing owned land could rise and the availability of suitable land at acceptable prices may decline, which could adversely impact our financial results. The availability of suitable land assets could also affect the success of our land acquisition strategy, which may impact our ability to increase the number of active selling communities, to grow our revenues and margins and to achieve or maintain profitability.
If we are unable to develop communities successfully or within expected timeframes, our results of operations could be adversely affected.
Before a community generates any revenue, time and material expenditures are required to acquire and prepare land, entitle and finish lots, obtain development approvals, pay taxes and construct significant portions of project infrastructure, amenities, model homes and sales facilities. It can take several years from the time that we acquire control of a property to the time that we make our first home sale on the site. Delays in the development of communities expose us to the risk of changes in market conditions for homes. A decline in our ability to develop and market our communities successfully and to generate positive cash flow from these operations in a timely manner could have a material adverse effect on our business and results of operations and on our ability to service our debt and to meet our working capital requirements.
Because real estate investments are relatively illiquid, our ability to promptly sell one or more properties for reasonable prices in response to changing economic, financial and investment conditions may be limited and we may be forced to hold non-income producing properties for extended periods of time.
Real estate investments are relatively difficult to sell quickly. As a result, our ability to promptly sell one or more properties in response to changing economic, financial and investment conditions is limited and we may be forced to hold non-income producing assets for an extended period of time. We cannot predict whether we will be able to sell any property for the price or on the terms that we set or whether any price or other terms offered by a prospective purchaser would be acceptable to us. We also cannot predict the length of time needed to find a willing purchaser and to close the sale of a property.
We depend on the success of our controlled builders.
We participate in the homebuilding business through subsidiaries, which we refer to as our “controlled builders.” We are able to exercise control over the operations of each controlled builder. We have entered into arrangements with these controlled builders in order to take advantage of their local knowledge and relationships, acquire attractive land positions and brand images, manage our risk profile and leverage our capital base. Even though the co-investors in our controlled builders are subject to certain non-competition provisions, the viability of our participation in the homebuilding business depends on our ability to maintain good relationships with our controlled builders. Our controlled builders are focused on maximizing the value of their operations and working with a partner that can help them be successful. The effectiveness of our management, the value of our expertise and the rapport we maintain with our controlled builders are important factors for new builders considering doing business with us and may affect our ability to attract homebuyers, subcontractors, employees or others upon whom our business, financial condition and results of operations ultimately depend. Further, our relationships with our controlled builders generate additional business opportunities that support our growth. If we are unable to maintain good relationships with our controlled builders, we may be unable to fully take advantage of existing agreements or expand our relationships with these controlled builders. Additionally, our opportunities for pursuing acquisitions of additional builders may be adversely impacted.
In Dallas and Atlanta, we sell lots to our controlled builders for their homebuilding operations and provide them loans to finance home construction. If our controlled builders fail to successfully execute their business strategies for any reason, they may be unable to purchase lots from us, repay outstanding construction finance loans made by us or borrow from us in the future, any of which could negatively impact our business, financial condition and results of operations.
Our controlled builders’ interests may not be wholly aligned with ours or those of our investors.
Our controlled builders are separate and distinct entities from us. Even though we are able to exercise control over the operations of these entities, the officers of our controlled builders are primarily focused on maximizing the value of the controlled builders’ operations rather than our operations, which could influence their business decisions, including but not limited to decision-making which they believe to be in their best interests. As a result of the foregoing, their business interests may not be fully aligned with ours and those of our investors, which could lead to actions and results that are not in our, or in our investors’, best interests.
10
If we are required to either repurchase or sell a substantial portion of the equity interest in our controlled homebuilding subsidiaries, our capital resources and financial condition could be adversely affected.
The operating agreements governing our controlled builders contain buy-sell provisions that may be triggered in certain circumstances. In the event that a buy-sell event occurs, our builder will have the right to initiate a buy-sell process, which may happen at an inconvenient time for us. In the event the buy-sell provisions are exercised at a time when we lack sufficient capital to purchase the remaining equity interest, we may elect to sell our equity interest in the entity. If we are forced to sell our equity interest, we will no longer benefit from the future operations of the applicable entity. If a buy-sell provision is exercised and we elect to purchase the interest in an entity that we do not already own, we may be obligated to expend significant capital in order to complete such acquisition, which may result in our being unable to pursue other investments or opportunities. If either of these events occurs, our revenue and net income could decline or we may not have sufficient capital necessary to implement our growth strategy.
Our geographic concentration could materially and adversely affect us if the homebuilding industry in our current markets should decline.
In Dallas, we principally operate in the counties of Dallas, Collin and Denton. In Atlanta, we principally operate in the counties of Fulton, Gwinnett, Cobb, Forsyth, Cherokee and Dekalb. In Florida, we principally operate in the counties of Indian River and St. Lucie. To the extent housing demand and population growth slow in our core markets, our favorable growth outlook may not be realized. Furthermore, we may be unable to compete effectively with the resale home market in our core markets. Because our operations are concentrated in these areas, a prolonged economic downturn in one or more of these areas could have a material adverse effect on our business, liquidity, financial condition and results of operations, and a disproportionately greater impact on us than other homebuilders with more diversified operations. Further, slower rates of population growth or population declines in the Dallas, Atlanta or Vero Beach markets, especially as compared to the high population growth rates in prior years, could affect the demand for housing, causing home prices in these markets to decline and adversely affect our business, financial condition and results of operations.
Our developments are subject to government regulation, which could cause us to incur significant liabilities or restrict our business activities.
Our developments are subject to numerous local, state, federal and other statutes, ordinances, rules and regulations concerning zoning, development, building design, construction and similar matters that impose restrictive zoning and density requirements, the result of which is to limit the number and type of homes that can be built within the boundaries of a particular area. Projects that are not yet entitled may be subjected to periodic delays, changes in use, less intensive development or elimination of development in certain specific areas due to government regulations. We may also be subject to periodic delays or may be precluded entirely from developing in certain communities due to building moratoriums or “slow-growth” or “no-growth” initiatives that could be implemented in the future. Local governments also have broad discretion regarding the imposition of development and service fees for projects in their jurisdiction. Projects for which we have received land use and development entitlements or approvals may still require a variety of other governmental approvals and permits during the development process and can also be impacted adversely by unforeseen health, safety and welfare issues, which can further delay these projects or prevent their development. As a result, lot and home sales could decline and costs could increase, which could have a material adverse effect on our business, liquidity, financial condition and results of operations.
If the market value of our land or homes declines, our profits would decrease.
The market value of land, building lots and housing inventories can fluctuate significantly as a result of changing market conditions, and the measures we employ to manage inventory risk may not be adequate to insulate our operations from a severe drop in inventory values. We acquire land for replacement of land inventory and expansion within our current markets, and may in the future acquire land for expansion into new markets. If housing demand decreases below what we anticipated when we acquired our inventory, we may not be able to generate profits consistent with those we have generated in the past and we may not be able to recover our costs when we sell lots and homes. When market conditions are such that land values are not appreciating, option arrangements previously entered into may become less desirable, at which time we may elect to forgo deposits and pre-acquisition costs and terminate such arrangements. In the face of adverse market conditions, we may have substantially higher inventory carrying costs, may have to write down our inventory as a result of impairment and/or may have to sell land or homes at a loss. Any material write-downs of assets, or sales at a loss, could have a material adverse effect on our business, liquidity, financial condition and results of operations.
11
The terms and availability of mortgage financing can affect consumer demand for homes and the ability of homebuyers to complete the purchase of a home. Because most of our homebuyers, and the homebuyers of those third-party entities to whom we sell lots, finance the purchase of their homes, unfavorable terms in, or the unavailability of, mortgage financing could materially and adversely affect us.
Our business depends on the ability of our homebuyers, as well as the ability of those who buy homes from the third-party homebuilding entities to which we sell lots (our “homebuilding customers”), to obtain financing for the purchase of their homes. Many of these homebuyers must sell their existing homes in order to buy a home from us or our homebuilding customers. Periodically, lenders, investors, regulators and other third parties may question the adequacy of lending standards and other credit requirements for various loan programs available to borrowers. This may lead to tightened credit requirements and an increase in indemnity claims for mortgages, as has occurred in the past. Fewer loan products and tighter loan qualifications, in turn, may make it more difficult for a borrower to finance the purchase of a home. If potential buyers of our or our homebuilding customers’ homes, or the buyers of those potential buyers’ existing homes, cannot obtain suitable financing, our business, liquidity, financial condition and results of operations could be materially and adversely affected.
Interest rate increases or changes in federal lending programs or other regulations could lower demand for our lots, homes and construction finance loans, which could materially and adversely affect our business and results of operations.
Rising interest rates, decreased availability of mortgage financing or of certain mortgage programs, higher down payment requirements or increased monthly mortgage costs may lead to reduced demand for our homes, lots and construction loans. Increased interest rates can also hinder our ability to realize our backlog because certain of our home purchase contracts provide homebuyers with a financing contingency. Financing contingencies allow homebuyers to cancel their home purchase contracts in the event that they cannot arrange for adequate financing. As a result, rising interest rates can decrease our home sales and mortgage originations. Any of these factors could have a material adverse effect on our business, liquidity, financial condition and results of operations.
In addition, the federal government has a significant role in supporting mortgage lending through its conservatorship of Federal National Mortgage Association (“Fannie Mae”) and Federal Home Loan Mortgage Corporation (“Freddie Mac”), both of which purchase home mortgages and mortgage-backed securities originated by mortgage lenders, and its insurance of mortgages originated by lenders through the Federal Housing Administration (the “FHA”) and the Veterans Administration (“VA”). The availability and affordability of mortgage loans, including consumer interest rates for such loans, could be adversely affected by a curtailment or cessation of the federal government’s mortgage-related programs or policies. The FHA may continue to impose stricter loan qualification standards, raise minimum down payment requirements, impose higher mortgage insurance premiums and other costs and/or limit the number of mortgages it insures. Due to growing federal budget deficits, the U.S. Treasury may not be able to continue supporting the mortgage-related activities of Fannie Mae, Freddie Mac, the FHA and the VA at present levels, or it may revise significantly the federal government’s participation in and support of the residential mortgage market. Because the availability of Fannie Mae, Freddie Mac, FHA- and VA-backed mortgage financing is an important factor in marketing and selling many of our homes, any limitations, restrictions or changes in the availability of such government-backed financing could reduce our home sales, which could have a material adverse effect on our business, liquidity, financial condition and results of operations.
Changes in the method pursuant to which LIBOR rates are determined and potential phasing out of LIBOR after 2021 may affect our financial results.
The United Kingdom Financial Conduct Authority (the “FCA”), which regulates the London Interbank Offered Rate (“LIBOR”) has recently announced that the FCA intends to stop compelling banks to submit rates for the calculation of LIBOR after 2021 (the “FCA Announcement”). The FCA Announcement indicates that the continuation of LIBOR on the current basis cannot and will not be guaranteed after 2021. Following the implementation of any reforms to LIBOR or the methods pursuant to which LIBOR rates are determined, or other benchmark rates that may be enacted in the United Kingdom or elsewhere, the manner of administration of such benchmarks may change, with the result that such benchmarks may perform differently than in the past, such benchmarks could be eliminated entirely, or there could be other consequences which cannot be predicted. Under our Unsecured Revolving Credit Facility, LIBOR may be used to set the fluctuating interest rate (the “Base Rate”) and the interest rate for any Eurodollar Rate Advance. If LIBOR is phased out, we may be required to renegotiate with our lender to establish a new interest rate (the “LIBOR Successor Rate”). We can give no assurance that we and our lender will be able to agree on a LIBOR Successor Rate. If we and our lender cannot agree on a LIBOR Successor Rate, our ability to draw upon the Unsecured Revolving Credit Facility may be materially impacted.
12
Any increase in unemployment or underemployment may lead to an increase in the number of loan delinquencies and property repossessions, which would have an adverse impact on our business.
People who are not employed, are underemployed, who have left the labor force or are concerned about the loss of their jobs are less likely to purchase new homes, may be forced to try to sell the homes they own and may face difficulties in making required mortgage payments. Therefore, any increase in unemployment or underemployment may lead to an increase in the number of loan delinquencies and property repossessions and have an adverse impact on our business both by reducing demand for our homes, lots and construction loans and by increasing the supply of homes for sale.
Any limitation on, or reduction or elimination of, tax benefits associated with owning a home would have an adverse effect on the demand for our homes, lots and construction loans, which could be material to our business.
On December 22, 2017, the U.S. government enacted comprehensive tax legislation commonly referred to as the Tax Cuts and Jobs Act (the “Tax Act”). The Tax Act made major changes to the Internal Revenue Code that, in part, may affect demand for new homes. Among the possible changes that could make purchasing homes less attractive are (i) limitations on the ability of homebuyers to deduct property taxes, (ii) limitations on the ability of homebuyers to deduct mortgage interest, and (iii) limitations on the ability of homebuyers to deduct state and local income taxes. Due to such changes, the after-tax cost of owning a new home has increased for many of our potential homebuyers and the potential homebuyers of our homebuilding customers.
The occurrence of severe weather or natural disasters could increase our operating expenses and reduce our revenues and cash flows.
The climates and geology of the states in which we operate present increased risks of severe weather and natural disasters. The occurrence of severe weather conditions or natural disasters can delay new home deliveries and lot development, reduce the availability of materials and/or negatively impact the demand for new homes in affected areas.
Further, to the extent that hurricanes, severe storms, earthquakes, tornadoes, droughts, floods, wildfires or other natural disasters or similar events occur, our homes under construction or our lots under development could be damaged or destroyed, which may result in losses exceeding our insurance coverage. Any of these events could increase our operating expenses, impair our cash flows and reduce our revenues.
High cancellation rates may negatively impact our business.
Our backlog reflects the number and value of homes for which we have entered into non-contingent sales contracts with homebuyers but not yet delivered. Although these sales contracts require a cash deposit, a homebuyer may in certain circumstances cancel the contract and receive a complete or partial refund of the deposit as a result of contract provisions. If home prices decline, the national or local homebuilding environment or general economy weakens, our neighboring competitors reduce their sales prices (or increase their sales incentives), interest rates increase or the availability of mortgage financing tightens, homebuyers may have an incentive to cancel their contracts with us, even where they might be entitled to no refund or only a partial refund. Significant cancellations could have a material adverse effect on our business as a result of lost sales revenue and the accumulation of unsold housing inventory.
We may not be able to compete effectively against competitors in the homebuilding, land development and financial services industries.
Competition in the land development and homebuilding industries is intense, and there are relatively low barriers to entry. Land developers and homebuilders compete for, among other things, homebuyers, desirable land parcels, financing, raw materials and skilled labor. Increased competition could hurt our business, as it could prevent us from acquiring attractive land parcels for development and resale or homebuilding (or make such acquisitions more expensive), hinder our market share expansion and lead to pricing pressures that adversely impact our margins and revenues. If we are unable to compete successfully, our business, liquidity, financial condition and results of operations could be materially and adversely affected. Our competitors may independently develop land and construct housing units that are superior or substantially similar to our products. Furthermore, a number of our primary competitors are significantly larger, have a longer operating history and may have greater resources or lower cost of capital than us. Accordingly, competitors may be able to compete more effectively in one or more of the markets in which we operate. Many of these competitors also have longstanding relationships with subcontractors and suppliers in the markets in which we operate. Our homebuilding business also competes for sales with individual resales of existing homes and with available rental housing.
13
Our construction financing business competes with other lenders, including national, regional and local banks and other financial institutions, some of which have greater access to capital or different lending criteria and may be able to offer more attractive financing to potential homebuyers.
Any strategic investments, joint ventures, and/or partnerships that we enter into in which we do not have a controlling interest could be adversely affected by our lack of sole decision-making authority or conflicts of interest or disputes between us and our partners or co-venturers.
We co-invest and in the future may continue to co-invest with third parties through partnerships, joint ventures or other entities, acquiring interests in or sharing responsibility for managing the affairs of such entities, including homebuilding, land acquisition and/or community development. If we do not have a controlling interest in these entities, we would not be in a position to exercise sole decision-making authority regarding their activities, and our investment may be illiquid due to our lack of control. Partners or co-venturers may have different economic, financial and industry positions from us which could influence their business decisions, including but not limited to strategic decision-making which they believe to be in their best interests. As a result of the foregoing, their business interests and strategies may conflict with or not be fully aligned with ours and those of our investors, which could lead to actions and results that are not in our, or in our investors’, best interests. Disputes between us and partners or co-venturers may result in litigation or arbitration that would increase our expenses and prevent our officers and/or directors from focusing their time and effort on our business. In addition, we may in certain circumstances be liable for the actions of our partners or co-venturers.
Our future growth may include additional strategic investments, joint ventures, partnerships and/or acquisitions of companies that may not be as successful as we anticipate and could disrupt our ongoing businesses and adversely affect our operations.
Our investments in our homebuilding subsidiaries have contributed to our historical growth and similar investments may be a component of our growth strategy in the future. We may make additional strategic investments, enter into new joint venture or partnership arrangements or acquire businesses, some of which may be significant. These endeavors may involve significant risks and uncertainties, including distraction of management from current operations, significant start-up costs, insufficient revenues to offset expenses associated with these new investments and inadequate return of capital on these investments, any of which may adversely affect our financial condition and results of operations. Our failure to successfully identify and manage future investments, joint ventures, partnerships or acquisitions could harm our results of operations.
We may be unable to obtain suitable bonding for the development of our housing projects.
We are periodically required to provide bonds to governmental authorities and others to ensure the completion of our projects. Depending on market conditions, surety providers may be reluctant to issue new bonds and may request credit enhancements (such as cash deposits or letters of credit) in order to maintain existing bonds or to issue new bonds. If we are unable to obtain required bonds for our future projects, or if we are required to provide credit enhancements with respect to our current or future bonds, our business, liquidity, financial condition and results of operations could be materially and adversely affected.
Difficulty in obtaining sufficient capital could result in an inability to acquire land for our developments or increased costs and delays in the completion of development projects.
The homebuilding industry is capital-intensive and requires significant up-front expenditures to acquire land parcels and begin development. Land acquisition, development and construction activities may be adversely affected by any shortage or increased cost of financing or the unwillingness of third parties to engage in partnerships, joint ventures or other alternative arrangements.
We currently have access to a senior secured revolving credit facility and a senior unsecured revolving credit facility. We cannot ensure that we will be able to extend the maturity of these credit facilities or arrange another facility on acceptable terms or at all.
Furthermore, in the future, we may seek additional capital in the form of equity or debt financing from a variety of potential sources, including additional bank financings and/or securities offerings. The availability of borrowed funds, especially for land acquisition and construction financing, may be greatly reduced nationally, and the lending community may require increased amounts of equity to be invested in a project by borrowers in connection with both new loans and the extension of existing loans. The credit and capital markets are subject to volatility. If we are required to seek additional financing to fund our operations, volatility in these markets may restrict our flexibility to access such financing. If we are not successful in obtaining sufficient capital to fund our planned capital and other expenditures, we may be unable to acquire land for our housing developments and/or to develop the housing. Any difficulty in obtaining sufficient capital for planned
14
development expenditures could also cause project delays and any such delay could result in cost increases. Any one or more of the foregoing events could have a material adverse effect on our business, liquidity, financial condition and results of operations.
We are subject to environmental laws and regulations, which may increase our costs, limit the areas in which we can build homes and develop land and delay completion of our projects.
We are subject to a variety of local, state, federal and other statutes, ordinances, rules and regulations concerning the environment. The particular environmental laws that apply to any given homebuilding or development site vary according to multiple factors, including the site’s location, its environmental conditions and the present and former uses of the site, as well as adjoining properties. Environmental laws and conditions may result in delays, may cause us to incur substantial compliance and other costs and can prohibit or severely restrict homebuilding and land development activity in environmentally sensitive regions or areas. In addition, in those cases where an endangered or threatened species is involved, environmental rules and regulations can result in the restriction or elimination of development in identified environmentally sensitive areas. From time to time, the United States Environmental Protection Agency and similar federal or state agencies review homebuilders’ compliance with environmental laws and may levy fines and penalties for failure to comply strictly with applicable environmental laws or impose additional requirements for future compliance as a result of past failures. Any such actions taken with respect to our business may increase our costs. Environmental regulations can also have an adverse impact on the availability and price of certain raw materials such as lumber. Further, we expect that increasingly stringent requirements will be imposed on homebuilders and land developers in the future.
Under various environmental laws, current or former owners of real estate may be required to investigate and clean up hazardous or toxic substances, and may be held liable to a governmental entity or to third parties for related damages, including for bodily injury, and for investigation and clean-up costs incurred by such parties in connection with the contamination.
A major health and safety incident relating to our business could be costly in terms of potential liabilities and reputational damage.
Building sites are inherently dangerous, and operating in the land development and homebuilding industries poses certain inherent health and safety risks. Due to health and safety regulatory requirements, health and safety performance is critical to the success of our business. Any failure in health and safety performance may result in penalties for non-compliance with relevant regulatory requirements, and a failure that results in a major or significant health and safety incident is likely to be costly in terms of potential liabilities incurred as a result. Such a failure could generate significant negative publicity and have a corresponding impact on our reputation, our relationships with relevant regulatory agencies or governmental authorities and our ability to attract employees, subcontractors and homebuyers, which in turn could have a material adverse effect on our business, financial condition and results of operations.
Poor relations with the residents of our communities, or with local real estate agents, could negatively impact our home sales, which could cause our revenues or results of operations to decline.
Residents of communities we develop rely on us to resolve issues or disputes that may arise in connection with the operation or development of their communities. Efforts made by us to resolve these issues or disputes could be deemed unsatisfactory by the affected residents and subsequent actions by these residents could adversely affect sales or our reputation. In addition, we could be required to make material expenditures related to the settlement of such issues or disputes or to modify community development plans, which could adversely affect our results of operations.
Most of our potential homebuyers engage local real estate agents who are unaffiliated with us in connection with their search for a new home. If we do not maintain good relations with, and a good reputation among, these real estate agents, the agents may not encourage potential homebuyers to consider, or may actively discourage homebuyers from considering, our communities, which could adversely affect our results of operations.
Information technology failures and data security breaches could harm our business.
We use information technology and other computer resources to carry out operational and marketing activities, as well as to maintain our business records, including information provided by our homebuyers. Many of these resources are provided to us and/or maintained on our behalf by third-party service providers pursuant to agreements that specify certain security and service level standards. Our ability to conduct our business may be impaired if these resources are compromised, degraded, damaged or fail, whether due to a virus or other harmful circumstance, intentional penetration or disruption of our information technology resources by a third-party, natural disaster, hardware or software corruption or failure or error (including a failure of security controls incorporated into or applied to such hardware or software), telecommunications system failure, service provider error or failure, intentional or unintentional personnel actions (including the failure to follow our security protocols) or
15
lost connectivity to networked resources. A significant and extended disruption in the functioning of these resources could damage our reputation and cause us to lose homebuyers, sales and revenue.
Product liability claims and litigation and warranty claims that arise in the ordinary course of business may be costly, which could adversely affect our business.
As a homebuilder, we are subject to construction defect and home warranty claims arising in the ordinary course of business. These claims are common in the homebuilding industry and can be costly. In addition, the costs of insuring against construction defect and product liability claims are high. This coverage may be restricted and become more costly in the future. If the limits or coverages of our current and former insurance programs prove inadequate, or we are not able to obtain adequate, or reasonably priced, insurance against these types of claims in the future, or the amounts currently provided for future warranty or insurance claims are inadequate, we may experience losses that could negatively impact our financial results.
Our business is seasonal in nature, so our quarterly results of operations may fluctuate.
The homebuilding industry experiences seasonal fluctuations in quarterly results of operations and capital requirements. We typically experience the highest new home order activity in spring and summer, although this activity is also highly dependent on the number of active selling communities, timing of new community openings and other market factors. Since it typically takes five to nine months to construct a new home, we deliver more homes in the second half of the year as spring and summer home orders convert to home deliveries. Because of this seasonality, home starts, construction costs and related cash outflows have historically been highest in the second and third quarters, and the majority of cash receipts from home deliveries occurs during the second half of the year. We expect this seasonal pattern to continue over the long-term, although we may also be affected by volatility in the homebuilding industry.
Additionally, weather-related problems may occur, delaying starts or closings or increasing costs and reducing profitability. In addition, delays in opening new communities or new sections of existing communities could have an adverse impact on home sales and revenues. Expenses are not incurred and recognized evenly throughout the year. Because of these factors, our quarterly results of operations may be uneven and may be marked by lower revenues and earnings in some quarters compared with others.
Utility and resource shortages or interest rate fluctuations could have an adverse effect on our operations.
The markets in which we operate may in the future be subject to utility or other resource shortages, including significant changes to the availability of electricity and water. Shortages of natural resources in our markets, particularly of water, may make it more difficult for us to obtain regulatory approval of new developments. We may experience material fluctuations in utility and resource costs across our markets, and we may incur additional costs and may not be able to complete construction on a timely basis if such fluctuations arise. Our lumber inventory is particularly sensitive to these shortages. Furthermore, these shortages and interest rate fluctuations may adversely affect the regional economies in which we operate, which may reduce demand for our homes, lots and construction loans and negatively affect our business and results of operations.
Our business and financial results could be adversely affected by the failure of persons who act on our behalf to comply with applicable regulations and guidelines.
Although we expect all of our employees, officers and directors to comply at all times with all applicable laws, rules and regulations, there may be instances in which subcontractors or others through whom we do business engage in practices that do not comply with applicable regulations or guidelines. Should we learn of practices relating to homes we build, lots we develop or financing we provide that do not comply with applicable regulations or guidelines, we would move actively to stop the non-complying practices as soon as possible and would take disciplinary action with regard to employees who were aware of the practices and did not take steps to address them, including in some instances terminating their employment. However, regardless of the steps we take after we learn of practices that do not comply with applicable regulations or guidelines, we can in some instances be subject to fines or other governmental penalties, and our reputation can be injured, due to the practices having taken place.
We may become subject to litigation, which could materially and adversely affect our business.
In the future, we may become subject to litigation, including claims relating to our operations and otherwise in the ordinary course of business. Some of these claims may result in significant defense costs and potentially significant judgments against us, some of which are not, or cannot be, insured against. We generally intend to vigorously defend ourselves. However, we cannot be certain of the ultimate outcomes of any claims that may arise in the future. Resolution of these types of matters may result in us having to pay significant fines, judgments, or settlements, which, if uninsured, or if the fines, judgments and settlements exceed insured levels, could adversely impact our earnings and cash flows, thereby materially and adversely
16
affecting our business. Certain litigation may affect the availability or cost of our insurance coverage, which could materially and adversely impact our business, expose us to increased risks that would be uninsured, and materially and adversely impact our ability to attract directors or officers.
We may suffer uninsured losses or suffer material losses in excess of insurance limits.
We could suffer physical damage to property or incur liabilities resulting in losses that may not be fully recoverable by insurance. In addition, certain types of risks, such as personal injury claims, may be, or may become in the future, either uninsurable or not economically insurable, or may not be currently or in the future covered by our insurance policies or otherwise be subject to significant deductibles or limits. Should an uninsured loss or a loss in excess of insured limits occur or be subject to deductibles, we could sustain financial loss or lose capital invested in the affected property as well as anticipated future income from that property. In addition, we could be liable to repair damage or meet liabilities caused by risks that are uninsured or subject to deductibles. We may be liable for any debt or other financial obligations related to affected property. Material losses or liabilities in excess of insurance proceeds may occur in the future.
Laws and regulations governing the residential mortgage industry could have an adverse effect on our business and financial results.
In 2018, we established a joint venture, Green Brick Mortgage, to provide mortgage related services to homebuyers. The residential mortgage lending industry remains under intense scrutiny and is heavily regulated at the federal, state and local levels. Although we do not originate mortgages, we are directly or indirectly subject to certain of these regulations. Changes to existing laws or regulations or adoption of new laws or regulations could require our joint venture to incur significant compliance costs. A material failure to comply with any of these laws or regulations could result in the loss or suspension of required licenses or other approvals, the imposition of monetary penalties, and restitution awards or other relief. Any of these outcomes could have an adverse effect on our results of operations.
The ongoing requirements of being a public company may strain our resources and distract our management, which could make it difficult to manage our business.
As a public company with listed equity securities, we are required to comply with various regulatory and reporting requirements, including the reporting requirements of the Exchange Act and the requirements of the Sarbanes-Oxley Act of 2002 (as amended, the “Sarbanes-Oxley Act”). These requirements may place a strain on our systems and resources. The Exchange Act requires that we file annual, quarterly and current reports with respect to our business and financial condition. The Sarbanes-Oxley Act requires that we maintain effective disclosure controls and procedures and internal controls over financial reporting. Complying with these reporting and other regulatory requirements has been and will continue to be time-consuming and may result in increased costs and could have a negative effect on our business, financial condition and results of operations. To maintain and improve the effectiveness of our disclosure controls and procedures, we may need to commit significant resources and hire additional staff and provide additional management oversight. Sustaining our growth may require us to commit additional management, operational and financial resources to identify new professionals to join us and to maintain appropriate operations and financial systems to adequately support expansion. These activities may divert management’s attention from other business concerns, which could have a material adverse effect on our business, financial condition and results of operations.
ITEM 1B. UNRESOLVED STAFF COMMENTS
None.
ITEM 2. PROPERTIES
We lease our principal executive office located at 2805 Dallas Parkway, Suite 400, Plano, Texas, 75093. Our homebuilding and title division offices are located in leased space in the markets where we conduct business. We believe that such properties are suitable and adequate to meet the needs of our businesses.
ITEM 3. LEGAL PROCEEDINGS
We are not involved in any material litigation nor, to our knowledge, is any material litigation threatened against the Company.
17
ITEM 4. MINE SAFETY DISCLOSURES
Not Applicable.
PART II
ITEM 5. MARKET FOR REGISTRANT’S COMMON EQUITY, RELATED STOCKHOLDER MATTERS AND ISSUER PURCHASES OF EQUITY SECURITIES
Market Information
Our common stock trades on The Nasdaq Capital Market are maintained by The Nasdaq Stock Market LLC under the symbol “GRBK”.
Holders of Record
On
March 1, 2019
, there were
30
stockholders of record of our common stock. We believe the number of beneficial owners of our common stock is substantially greater than the number of record holders because a large portion of our outstanding common stock is held of record in broker “street names” for the benefit of individual investors. As of
March 1, 2019
, there were
50,575,266
common shares outstanding.
Dividends
We have not paid any dividends since our inception and do not anticipate declaring or paying any cash dividends on our common stock in the foreseeable future. We currently anticipate that we will retain all of our available cash for general corporate purposes. Payment of future dividends, if any, will be at the discretion of our BOD and will depend on many factors, including general economic and business conditions, our strategic plans, our financial results and condition, legal requirements and other factors as our BOD deems relevant.
Securities authorized for Issuance under Equity Compensation Plans
Information regarding the securities authorized for issuance under our equity compensation plans required by Part II, Item 5, set forth in our Proxy Statement, is incorporated herein by reference.
Performance Graph
The following graph compares the five-year cumulative total return on our common stock, assuming $100 was invested on
December 31, 2013
, with the cumulative total returns of the Russell 2000 Index and the Nasdaq Composite Index for the periods ended December 31.
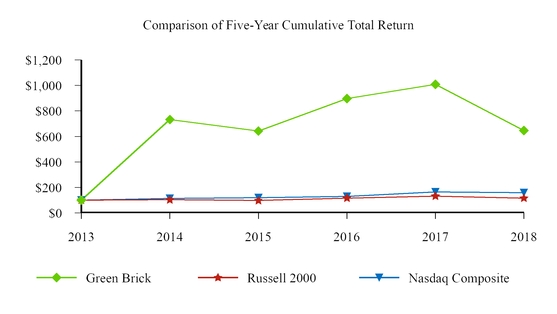
18
|
2013
|
2014
|
2015
|
2016
|
2017
|
2018
|
||||||
|
Green Brick Partners
|
$100.00
|
$732.14
|
$642.86
|
$897.32
|
$1,008.93
|
$646.43
|
|||||
|
Russell 2000 Index
|
$100.00
|
$103.53
|
$97.62
|
$116.63
|
$131.96
|
$115.89
|
|||||
|
Nasdaq Composite Index
|
$100.00
|
$113.40
|
$119.89
|
$128.89
|
$165.29
|
$158.87
|
|||||
The above graph is based on our common stock and index prices calculated as of the last trading day before January 1 of the year-end periods presented. The closing price of our common stock on the Nasdaq Capital Market was
$7.24
per share on
December 31, 2018
and
$11.30
per share on
December 31, 2017
. The performance of our common stock depicted in the graph above represents our past performance as a shell company with no substantial operations from
December 31, 2013
to October 26, 2014, and as a real estate company since October 27, 2014. As a result, the performance of our common stock depicted in the graph above is not indicative of future performance or the historical performance of our current business.
The information in the graph and table above is not “soliciting material,” is not deemed “filed” with the SEC and is not to be incorporated by reference in any of our filings under the Securities Act or the Exchange Act, whether made before or after the date of this Annual Report on Form 10-K, except to the extent that we specifically incorporate such information by reference.
Purchases of equity securities by the issuer
In October 2018, the Company’s BOD
authorized a share repurchase program for the period beginning on October 3, 2018 and ending on October 3, 2020 of the Company’s common stock for an aggregate price not to exceed $30.0 million. The timing, volume and nature of share repurchases are at the discretion of management and dependent on market conditions, corporate and regulatory requirements, available cash and other factors, and may be suspended or discontinued at any time. Authorized repurchases may be made from time to time in the open market, through block trades or in privately negotiated transactions. No assurance can be given that any particular amount of common stock will be repurchased. All or part of the repurchases may be implemented under a trading plan under Rule 10b5-1 or Rule 10b-18 established by the SEC, which would allow repurchases under pre-set terms at times when the Company might otherwise be prevented from doing so under insider trading laws or because of self-imposed blackout periods. This repurchase program may be modified, extended or terminated by the BOD at any time. The Company intends to finance any repurchases with available cash and proceeds from borrowings under lines of credit.
The following table provides information about repurchases of our common stock during the fourth quarter of the year ended
December 31, 2018
:
|
Period
|
|
(a) Total number of shares purchased
|
|
(b) Average price paid per share
|
|
(c) Total number of shares purchased as part of publicly announced plans or programs
|
|
(d) Maximum number (or approximate dollar value) of shares that may yet be purchased under the plans or programs
|
||
|
October 1, 2018 - October 31, 2018
|
|
—
|
|
$—
|
|
—
|
|
$
|
—
|
|
|
November 1, 2018 - November 30, 2018
|
|
—
|
|
—
|
|
—
|
|
—
|
|
|
|
December 1, 2018 - December 31, 2018
|
|
136,756
|
|
7.17
|
|
136,756
|
|
29,019,480
|
|
|
|
Total
|
|
136,756
|
|
$7.17
|
|
136,756
|
|
$
|
29,019,480
|
|
19
ITEM 6. SELECTED FINANCIAL DATA
The following table sets forth selected historical financial information regarding our business and should be read in conjunction with Item 7. “Management’s Discussion and Analysis of Financial Condition and Results of Operations” and our consolidated financial statements and the related notes included in Part II, Item 8 of this Annual Report on Form 10-K.
|
As of December 31,
|
|||||||||||||||||||
|
2018
|
2017
|
2016
|
2015
|
2014
|
|||||||||||||||
|
(in thousands)
|
|||||||||||||||||||
|
Assets
|
|||||||||||||||||||
|
Cash
|
$
|
38,315
|
|
|
$
|
36,684
|
|
|
$
|
35,157
|
|
|
$
|
21,207
|
|
|
$
|
22,976
|
|
|
Inventory
|
668,961
|
|
496,054
|
|
410,662
|
|
348,574
|
|
275,788
|
|
|||||||||
|
Investment in unconsolidated entities
|
20,269
|
|
|
16,878
|
|
|
—
|
|
|
—
|
|
|
—
|
|
|||||
|
Deferred income tax assets, net
|
16,499
|
|
31,211
|
|
67,598
|
|
80,663
|
|
89,197
|
|
|||||||||
|
Other
|
39,982
|
|
30,176
|
|
26,779
|
|
22,630
|
|
11,896
|
|
|||||||||
|
Total assets
|
$
|
784,026
|
|
$
|
611,003
|
|
$
|
540,196
|
|
$
|
473,074
|
|
$
|
399,857
|
|
||||
|
Liabilities and stockholders
’
equity
|
|||||||||||||||||||
|
Borrowings on lines of credit, net
|
$
|
200,386
|
|
$
|
105,773
|
|
$
|
74,212
|
|
$
|
46,698
|
|
$
|
13,593
|
|
||||
|
Notes payable
|
—
|
|
9,926
|
|
10,948
|
|
10,158
|
|
12,151
|
|
|||||||||
|
Term loan facility
|
—
|
|
—
|
|
—
|
|
—
|
|
150,000
|
|
|||||||||
|
Other
|
89,477
|
|
|
62,266
|
|
|
53,551
|
|
|
44,363
|
|
|
42,516
|
|
|||||
|
Total liabilities
|
289,863
|
|
177,965
|
|
138,711
|
|
101,219
|
|
218,260
|
|
|||||||||
|
Redeemable noncontrolling interest in equity of consolidated subsidiary
|
8,531
|
|
|
—
|
|
|
—
|
|
|
—
|
|
|
—
|
|
|||||
|
Total equity
|
485,632
|
|
433,038
|
|
401,485
|
|
371,855
|
|
181,597
|
|
|||||||||
|
Total liabilities and equity
|
$
|
784,026
|
|
$
|
611,003
|
|
$
|
540,196
|
|
$
|
473,074
|
|
$
|
399,857
|
|
||||
20
|
Years Ended December 31,
|
|||||||||||||||||||
|
2018
|
2017
|
2016
|
2015
|
2014
|
|||||||||||||||
|
(in thousands, except per share data)
|
|||||||||||||||||||
|
Residential units revenue
|
$
|
578,893
|
|
$
|
439,520
|
|
$
|
375,821
|
|
$
|
261,923
|
|
$
|
207,518
|
|
||||
|
Land and lots revenue
|
44,754
|
|
18,730
|
|
15,164
|
|
36,878
|
|
45,452
|
|
|||||||||
|
Total revenues
|
623,647
|
|
458,250
|
|
390,985
|
|
298,801
|
|
252,970
|
|
|||||||||
|
Cost of residential units
|
457,151
|
|
345,360
|
|
292,724
|
|
207,663
|
|
158,158
|
|
|||||||||
|
Cost of land and lots
|
36,166
|
|
13,856
|
|
10,499
|
|
27,125
|
|
34,082
|
|
|||||||||
|
Total cost of revenues
|
493,317
|
|
359,216
|
|
303,223
|
|
234,788
|
|
192,240
|
|
|||||||||
|
Total gross profit
|
130,330
|
|
99,034
|
|
87,762
|
|
64,013
|
|
60,730
|
|
|||||||||
|
Selling, general and administrative expense
|
56,830
|
|
39,016
|
|
38,629
|
|
29,976
|
|
22,534
|
|
|||||||||
|
Change in fair value of contingent consideration
|
1,693
|
|
—
|
|
—
|
|
—
|
|
—
|
|
|||||||||
|
Operating profit
|
71,807
|
|
60,018
|
|
49,133
|
|
34,037
|
|
38,196
|
|
|||||||||
|
Interest expense
|
—
|
|
—
|
|
—
|
|
281
|
|
1,393
|
|
|||||||||
|
Equity in income of unconsolidated entities
|
7,259
|
|
2,746
|
|
—
|
|
—
|
|
—
|
|
|||||||||
|
Other income (expense), net
|
2,605
|
|
1,473
|
|
1,421
|
|
960
|
|
(594
|
)
|
|||||||||
|
Income before income taxes
|
81,671
|
|
64,237
|
|
50,554
|
|
34,716
|
|
36,209
|
|
|||||||||
|
Income tax expense (benefit)
|
17,136
|
|
39,031
|
|
15,381
|
|
9,171
|
|
(24,853
|
)
|
|||||||||
|
Net income
|
64,535
|
|
25,206
|
|
35,173
|
|
25,545
|
|
61,062
|
|
|||||||||
|
Less: Net income attributable to noncontrolling interests
|
12,912
|
|
10,236
|
|
11,417
|
|
10,220
|
|
11,036
|
|
|||||||||
|
Net income attributable to Green Brick Partners, Inc.
|
$
|
51,623
|
|
$
|
14,970
|
|
$
|
23,756
|
|
$
|
15,325
|
|
$
|
50,026
|
|
||||
|
Net income attributable to Green Brick Partners, Inc. per common share:
|
|||||||||||||||||||
|
Basic
|
$1.02
|
$0.30
|
$0.49
|
$0.38
|
$3.40
|
||||||||||||||
|
Diluted
|
$1.02
|
$0.30
|
$0.49
|
$0.38
|
$3.40
|
||||||||||||||
|
Weighted average common shares used in the calculation of net income attributable to Green Brick Partners, Inc. per common share:
|
|||||||||||||||||||
|
Basic
|
50,652
|
|
49,597
|
|
48,879
|
|
40,068
|
|
14,712
|
|
|||||||||
|
Diluted
|
50,751
|
|
49,683
|
|
48,886
|
|
40,099
|
|
14,712
|
|
|||||||||
Reclassifications
Certain prior period amounts have been reclassified to conform to the current period presentation.
21
ITEM 7. MANAGEMENT’S DISCUSSION AND ANALYSIS OF FINANCIAL CONDITION AND RESULTS OF OPERATIONS
Overview and Outlook
For business overview and developments during the year ended December 31, 2018, refer to Part I, Item 1 of this Annual Report on Form 10-K.
In the following discussion, “backlog” refers to homes under sales contracts that have not yet closed at the end of the relevant period, “cancellation rate” refers to sales contracts canceled divided by sales contracts executed during the relevant period, “net new home orders” refers to new home sales contracts reduced by the number of sales contracts canceled during the relevant period, and “overall absorption rate” refers to the rate at which net new home orders are contracted per selling community during the relevant period. Sales contracts relating to homes in backlog may be canceled by the prospective purchaser for a number of reasons, such as the prospective purchaser’s inability to obtain suitable mortgage financing. Upon a cancellation, the escrow deposit may be returned to the prospective purchaser. Accordingly, backlog may not be indicative of our future revenue.
The following were our key operating metrics for the year ended
December 31, 2018
as compared to the year ended
December 31, 2017
: home deliveries increased by
30.0%
, home closings revenue increased by
31.7%
, average sales price of homes delivered increased by
0.9%
, backlog units increased by
87.7%
, backlog units sales value increased by
74.5%
, average sales price of homes in backlog decreased by
7.1%
and net new home orders increased by
31.4%
.
From October 2017 to October 2018, homes in the Dallas and Atlanta markets appreciated by 3.9% and 6.0%, respectively (Source: S&P/Case-Shiller 20-City Composite Home Price Index, October 2018). During the year ended
December 31, 2018
, the housing market continued to show strength, which we believe is driven by consumer confidence, interest rates that are at the lower end of the historical spectrum, high affordability metrics, and a reduction in home inventory levels.
We believe that we operate in two of the most desirable housing markets in the nation. Among the 12 largest metropolitan areas in the country, the Dallas area ranked third in the annual rate of job growth from November 2017 to November 2018 (Source: US Bureau of Labor Statistics, November 2018). The Atlanta area ranked fifth in the annual rate of job growth from October 2017 to October 2018 (Source: US Bureau of Labor Statistics, October 2018).
Results of Operations
Year Ended
December 31, 2018
Compared to the Year Ended
December 31, 2017
Residential Units Revenue and New Homes Delivered
The table below represents residential units revenue and new homes delivered for the years ended
December 31, 2018
and
December 31, 2017
, respectively.
|
Years Ended December 31,
|
||||||||||||||
|
2018
|
2017
|
Change
|
%
|
|||||||||||
|
Home closings revenue (dollars in thousands)
|
$
|
571,177
|
|
|
$
|
435,644
|
|
|
$
|
135,533
|
|
|
31.1%
|
|
|
Mechanic’s lien contracts revenue (dollars in thousands)
|
7,716
|
|
3,876
|
|
3,840
|
|
99.1%
|
|||||||
|
Residential units revenue (dollars in thousands)
|
$
|
578,893
|
|
$
|
439,520
|
|
$
|
139,373
|
|
31.7%
|
||||
|
New homes delivered
|
1,287
|
|
990
|
|
297
|
|
30.0%
|
|||||||
|
Average sales price of homes delivered
|
$
|
443,805
|
|
|
$
|
440,044
|
|
|
$
|
3,761
|
|
|
0.9%
|
|
The
$139.4 million
increase in residential units revenue was driven by the increase in the number of homes delivered, the increase in the average sales price of homes delivered, the increase in mechanic’s lien contracts revenue, and the acquisition of GRBK GHO with home closings revenue of
$57.8 million
during the year ended
December 31, 2018
.
The
30.0%
increase in new homes delivered was driven by an increase in the number of selling communities, the acquisition of GRBK GHO, and a
40.2%
increase in the value of backlog of units sold entering the year, from
$108.0 million
as of
December 31, 2016
to
$151.5 million
as of
December 31, 2017
.
22
The slight increase in the average sales price of homes delivered for the year ended
December 31, 2018
is the result of local market appreciation and the mix of homes delivered, partially offset by the impact from the acquisition of GRBK GHO, whose homes are at lower price points than our other controlled builders. The average sales price of homes may increase or decrease depending on the mix of homes delivered and sold during such period and local market conditions. These changes in the average sales price of homes are part of our natural business cycle.
New Home Orders and Backlog
The table below represents new home orders and backlog related to our builder operations segments:
|
Years Ended December 31,
|
||||||||||||||
|
2018
|
2017
|
Change
|
%
|
|||||||||||
|
Net new home orders
|
1,397
|
|
1,063
|
|
334
|
|
31.4%
|
|||||||
|
Number of cancellations
|
245
|
|
188
|
|
57
|
|
30.3%
|
|||||||
|
Cancellation rate
|
14.9
|
%
|
15.0
|
%
|
(0.1
|
)%
|
(0.7)%
|
|||||||
|
Absorption rate per selling community
|
21.2
|
|
19.7
|
|
1.5
|
|
7.6%
|
|||||||
|
Average selling communities
|
66
|
|
54
|
|
12
|
|
22.2%
|
|||||||
|
Selling communities at end of period
|
76
|
|
55
|
|
21
|
|
38.2%
|
|||||||
|
Backlog (dollars in thousands)
|
$
|
264,275
|
|
$
|
151,463
|
|
$
|
112,812
|
|
74.5%
|
||||
|
Backlog (units)
|
582
|
|
310
|
|
272
|
|
87.7%
|
|||||||
|
Average sales price of backlog
|
$
|
454,081
|
|
$
|
488,590
|
|
$
|
(34,509
|
)
|
(7.1)%
|
||||
Our cancellation rate was
14.9%
for the year ended
December 31, 2018
, compared to
15.0%
for the year ended
December 31, 2017
. Management believes a cancellation rate in the range of 15% to 20% is representative of an industry average cancellation rate. On average, our cancellation rate is on the lower end of the industry average, which we believe is due to our target buyer demographics which generally does not include first time homebuyers.
The
$112.8 million
increase in value of backlog was primarily driven by an increase in the number of homes in backlog which was significantly impacted by the acquisition of GRBK GHO with
197
homes in backlog as of
December 31, 2018
. The increase in the number of homes in backlog was partially offset by a decrease of the average sales price of homes in backlog by
$34,509
, of which
$41,808
was the result of change in product mix related to the acquisition of GRBK GHO.
Residential Units Gross Margin
The table below represents the components of residential units gross margin (dollars in thousands):
|
Years Ended December 31,
|
||||||||||||||
|
2018
|
2017
|
|||||||||||||
|
Home closings revenue
|
$
|
571,177
|
|
|
100.0
|
%
|
|
$
|
435,644
|
|
|
100.0
|
%
|
|
|
Cost of homebuilding units
|
451,036
|
|
|
79.0
|
%
|
|
342,065
|
|
|
78.5
|
%
|
|||
|
Homebuilding gross margin
|
$
|
120,141
|
|
|
21.0
|
%
|
|
$
|
93,579
|
|
|
21.5
|
%
|
|
|
|
|
|
|
|
|
|
|
|
|
|
|
|||
|
Mechanic’s lien contracts revenue
|
$
|
7,716
|
|
|
100.0
|
%
|
|
$
|
3,876
|
|
|
100.0
|
%
|
|
|
Cost of mechanic’s lien contracts
|
6,115
|
|
|
79.3
|
%
|
|
3,295
|
|
|
85.0
|
%
|
|||
|
Mechanic’s lien contracts gross margin
|
$
|
1,601
|
|
|
20.7
|
%
|
|
$
|
581
|
|
|
15.0
|
%
|
|
|
|
||||||||||||||
|
Residential units revenue
|
$
|
578,893
|
|
100.0
|
%
|
$
|
439,520
|
|
100.0
|
%
|
||||
|
Cost of residential units
|
457,151
|
|
79.0
|
%
|
345,360
|
|
78.6
|
%
|
||||||
|
Residential units gross margin
|
$
|
121,742
|
|
21.0
|
%
|
$
|
94,160
|
|
21.4
|
%
|
||||
Cost of homebuilding units for the year ended
December 31, 2018
increased by
$109.0 million
, or
31.9%
, primarily due to the
30.0%
increase in the number of homes delivered.
Residential units gross margin for the year ended
December 31, 2018
decreased to
21.0%
, compared to
21.4%
for the year ended
December 31, 2017
. The decrease was driven by an increase in capitalized interest, the sale of inventory acquired in the
23
GRBK GHO business combination which had an increased basis when measured at fair value at the date of acquisition, and a reduction in homes sold on lots developed by the Company.
Land and Lots Revenue
The table below represents lots closed and land and lots revenue:
|
Years Ended December 31,
|
|||||||||||||||
|
2018
|
2017
|
Change
|
%
|
||||||||||||
|
Lots revenue (dollars in thousands)
|
$
|
35,074
|
|
$
|
17,859
|
|
$
|
17,215
|
|
96.4
|
%
|
||||
|
Land revenue (dollars in thousands)
|
9,680
|
|
871
|
|
8,809
|
|
1,011.4
|
%
|
|||||||
|
Land and lots revenue (dollars in thousands)
|
$
|
44,754
|
|
$
|
18,730
|
|
$
|
26,024
|
|
138.9
|
%
|
||||
|
Lots closed
|
239
|
|
143
|
|
96
|
|
67.1
|
%
|
|||||||
|
Average sales price of lots closed
|
$
|
146,753
|
|
$
|
124,888
|
|
$
|
21,865
|
|
17.5
|
%
|
||||
Of the
239
lots closed to third parties during the year ended
December 31, 2018
,
29
were closed by our controlled builders, resulting in revenue of
$4.9 million
which is included in builder operations segments’ revenue.
The
96.4%
increase in lots revenue was driven by a
67.1%
increase in the number of lots closed, as well as by a
17.5%
increase in the average lot sales price.
Four
land parcels were closed during the year ended
December 31, 2018
, resulting in revenue of
$9.7 million
compared to
one
parcel closed during the year ended
December 31, 2017
.
Selling, General and Administrative Expense
The table below represents the components of selling, general and administrative expense (dollars in thousands):
|
Years Ended
December 31,
|
As Percentage of Related Revenue
|
|||||||||||||
|
2018
|
2017
|
2018
|
2017
|
|||||||||||
|
Builder operations
|
$
|
49,165
|
|
$
|
32,247
|
|
8.4
|
%
|
7.3
|
%
|
||||
|
Land development
|
3,147
|
|
1,129
|
|
7.9
|
%
|
6.0
|
%
|
||||||
|
Corporate and other
|
4,518
|
|
5,640
|
|
—
|
%
|
—
|
%
|
||||||
|
Total selling, general and administrative expense
|
$
|
56,830
|
|
$
|
39,016
|
|
9.1
|
%
|
8.5
|
%
|
||||
Builder Operations
Selling, general and administrative expense for the year ended
December 31, 2018
for builder operations was
$49.2 million
, compared to
$32.2 million
for the year ended
December 31, 2017
. The increase was primarily attributable to increases in expenditures to support the growth in home sales, as well as the acquisition of GRBK GHO. Builder operations expenditures include salary expenses and community costs such as advertising and marketing expenses, rent, professional fees, and non-capitalized property taxes. Selling, general and administrative expense as a percentage of related revenue increased primarily because of an increase in technology improvements and increased salaries, in addition to a reclassification of depreciation on model home furnishings.
Land Development
Selling, general and administrative expense for land development for the year ended
December 31, 2018
was
$3.1 million
, compared to
$1.1 million
for the year ended
December 31, 2017
. The increase in expense as a percentage of related revenue was primarily due to an increase in compensation and non-capitalized pursuit costs, as well as an increase of non-capitalized property taxes driven by an increase in finished lots.
Corporate and Other
Selling, general and administrative expense for the corporate and other non-operating segment for the year ended
December 31, 2018
was
$4.5 million
, compared to
$5.6 million
for the year ended
December 31, 2017
. The decrease was primarily due to higher share-based compensation expense during the year ended
December 31, 2017
driven by a higher amount of restricted stock awards (“RSAs”) granted under the 2014 Omnibus Equity Incentive Plan to certain Named Executive Officers.
24
Equity in Income of Unconsolidated Entities
Equity in income of unconsolidated entities increased to
$7.3 million
for the year ended
December 31, 2018
, compared to
$2.7 million
during the year ended
December 31, 2017
, due primarily to our purchase of
49.9%
interest in GB Challenger, LLC (“Challenger”) in August 2017. In addition, the formation of Providence Title in March 2018 had a positive impact on earnings.
Other Income, Net
Other income, net, increased to
$2.6 million
for the year ended
December 31, 2018
, compared to
$1.5 million
for the year ended
December 31, 2017
. The increase was primarily due to an increase in title closing and settlement services provided by Green Brick Title, LLC.
Income Tax Expense
Income tax expense decreased
$21.9 million
, or
56.1%
, to
$17.1 million
for the year ended
December 31, 2018
, from an expense of
$39.0 million
for the year ended
December 31, 2017
. The decrease was primarily due to the impact from a change in the federal statutory tax rate that was partially offset by the impact from an increase in pre-tax income.
As of
December 31, 2018
, the Company had federal net operating loss carryforwards of
$2.0 million
that will expire beginning with the year ending December 31, 2029. Our ability to utilize our net operating loss carryforwards depends on the amount of taxable income we generate in future periods. Based on our historical taxable income results through
December 31, 2018
, as well as forecasted income, management expects that the Company will generate sufficient taxable income to utilize all of the federal net operating loss carryforwards before they expire.
As of
December 31, 2018
, the Company had gross state net operating loss carryforwards in Minnesota of
$13.7 million
which will begin to expire beginning with the year ending
December 31, 2023
. Management believes on a more-likely-than-not basis that the Minnesota net operating loss carryforwards will not be utilized. The Company maintains a gross deferred income tax asset in the amount of
$1.1 million
for the Minnesota state net operating loss carryforwards and a related valuation allowance in the amount of
$1.1 million
.
As of
December 31, 2018
, all Colorado state net operating loss carryforwards were fully utilized and all Nebraska state net operating loss carryforwards expired.
Year Ended
December 31, 2017
Compared to the Year Ended
December 31, 2016
Residential Units Revenue and New Homes Delivered
The table below represents residential units revenue and new homes delivered for the years ended
December 31, 2017
and
December 31, 2016
, respectively.
|
Years Ended December 31,
|
||||||||||||||
|
2017
|
2016
|
Change
|
%
|
|||||||||||
|
Home closings revenue (dollars in thousands)
|
$
|
435,644
|
|
$
|
365,164
|
|
$
|
70,480
|
|
19.3%
|
||||
|
Mechanic’s lien contracts revenue (dollars in thousands)
|
3,876
|
|
10,657
|
|
(6,781
|
)
|
(63.6)%
|
|||||||
|
Residential units revenue (dollars in thousands)
|
$
|
439,520
|
|
$
|
375,821
|
|
$
|
63,699
|
|
16.9%
|
||||
|
New homes delivered
|
990
|
|
844
|
|
146
|
|
17.3%
|
|||||||
|
Average sales price of homes delivered
|
$
|
440,044
|
|
$
|
432,659
|
|
$
|
7,385
|
|
1.7%
|
||||
The
$63.7 million
increase in residential units revenue during the year ended
December 31, 2017
was primarily driven by a
17.3%
increase in homes delivered during the year ended
December 31, 2017
and a
1.7%
increase in average sales price of homes delivered, partially offset by a
63.6%
decrease of mechanic’s lien contracts revenue.
New homes delivered for the year ended
December 31, 2017
for our builder operations segments were
990
, compared to new homes delivered of
844
for the year ended
December 31, 2016
, resulting in an increase of
146
homes, or
17.3%
. The increase in new homes delivered was primarily attributable to a
14.9%
increase in the average selling communities to
54
from
47
.
25
New Home Orders and Backlog
The table below represents new home orders and backlog related to our builder operations segments:
|
Years Ended December 31,
|
||||||||||||||
|
2017
|
2016
|
Change
|
%
|
|||||||||||
|
Net new home orders
|
1,063
|
|
880
|
|
183
|
|
20.8%
|
|||||||
|
Number of cancellations
|
188
|
|
135
|
|
53
|
|
39.3%
|
|||||||
|
Cancellation rate
|
15.0
|
%
|
13.3
|
%
|
1.7
|
%
|
12.8%
|
|||||||
|
Absorption rate per selling community
|
19.7
|
|
18.7
|
|
1.0
|
|
5.3%
|
|||||||
|
Average selling communities
|
54
|
|
47
|
|
7
|
|
14.9%
|
|||||||
|
Selling communities at end of period
|
55
|
|
50
|
|
5
|
|
10.0%
|
|||||||
|
Backlog (dollars in thousands)
|
$
|
151,463
|
|
$
|
108,030
|
|
$
|
43,433
|
|
40.2%
|
||||
|
Backlog (units)
|
310
|
|
237
|
|
73
|
|
30.8%
|
|||||||
|
Average sales price of backlog
|
$
|
488,590
|
|
$
|
455,823
|
|
$
|
32,767
|
|
7.2%
|
||||
Net new home orders for the year ended
December 31, 2017
increased by
183
homes, or
20.8%
, to
1,063
for the year ended
December 31, 2017
from
880
for the year ended
December 31, 2016
. Our overall absorption rate for the year ended
December 31, 2017
was an average of
19.7
per selling community (1.6 monthly), compared to an average of
18.7
per selling community (1.6 monthly) for the year ended
December 31, 2016
.
Our cancellation rate was
15.0%
for the year ended
December 31, 2017
, compared to
13.3%
for the year ended
December 31, 2016
. Management believes a cancellation rate in the range of 15% to 20% is representative of an industry average cancellation rate. On average, our cancellation rate is on the lower end of the industry average, which we believe is due to our target buyer demographics which generally does not include first time homebuyers.
Backlog units increased by
73
homes, or
30.8%
, to
310
as of
December 31, 2017
from
237
as of
December 31, 2016
. The dollar value of backlog units increased
$43.4 million
, or
40.2%
, to
$151.5 million
as of
December 31, 2017
from
$108.0 million
as of
December 31, 2016
. The increase in value of backlog units reflects an increase in the number of homes in backlog and an increase in the average sales price of homes in backlog. Our average sales price of homes in backlog increased
$32,767
, or
7.2%
, to
$488,590
for the year ended
December 31, 2017
, compared to
$455,823
for the year ended
December 31, 2016
. The increase in the average sales price of homes in backlog is the result of changes in product mix related to higher priced single family homes over lower priced townhomes contracted for sale during the period and local market appreciation. The average sales price of homes may fluctuate depending on the mix of homes delivered and sold during a period. The change in the average sales price of homes is part of our natural business cycle and the result of changes in product mix.
Residential Units Gross Margin
The table below represents the components of residential units gross margin (dollars in thousands):
|
Years Ended December 31,
|
||||||||||||||
|
2017
|
%
|
2016
|
%
|
|||||||||||
|
Home closings revenue
|
$
|
435,644
|
|
|
100.0
|
%
|
|
$
|
365,164
|
|
|
100.0
|
%
|
|
|
Cost of homebuilding units
|
342,065
|
|
|
78.5
|
%
|
|
283,454
|
|
|
77.6
|
%
|
|||
|
Homebuilding gross margin
|
$
|
93,579
|
|
|
21.5
|
%
|
|
$
|
81,710
|
|
|
22.4
|
%
|
|
|
|
|
|
|
|
|
|
|
|
|
|
||||
|
Mechanic’s lien contracts revenue
|
$
|
3,876
|
|
|
100.0
|
%
|
|
$
|
10,657
|
|
|
100.0
|
%
|
|
|
Cost of mechanic’s lien contracts
|
3,295
|
|
|
85.0
|
%
|
|
9,270
|
|
|
87.0
|
%
|
|||
|
Mechanic’s lien contracts gross margin
|
$
|
581
|
|
|
15.0
|
%
|
|
$
|
1,387
|
|
|
13.0
|
%
|
|
|
|
|
|
|
|
|
|
|
|
|
|
||||
|
Residential units revenue
|
$
|
439,520
|
|
100.0
|
%
|
$
|
375,821
|
|
100.0
|
%
|
||||
|
Cost of residential units
|
345,360
|
|
78.6
|
%
|
292,724
|
|
77.9
|
%
|
||||||
|
Residential units gross margin
|
$
|
94,160
|
|
21.4
|
%
|
$
|
83,097
|
|
22.1
|
%
|
||||
26
Cost of homebuilding units for the year ended
December 31, 2017
was
$342.1 million
, compared to cost of homebuilding units of
$283.5 million
for the year ended
December 31, 2016
, resulting in an increase of
$58.6 million
, or
20.7%
, primarily due to the
17.3%
increase in the number of homes delivered.
Residential units gross margin for the year ended
December 31, 2017
was
21.4%
, compared to
22.1%
for the year ended
December 31, 2016
. The increase in the dollar amount of homebuilding gross margin is largely due to the opening of new communities during the year ended
December 31, 2017
.
Land and Lots Revenue
The table below represents lots closed and land and lots revenue:
|
Years Ended December 31,
|
|||||||||||||||
|
2017
|
2016
|
Change
|
%
|
||||||||||||
|
Lots revenue (dollars in thousands)
|
$
|
17,859
|
|
|
$
|
15,164
|
|
$
|
2,695
|
|
|
17.8
|
%
|
||
|
Land revenue (dollars in thousands)
|
871
|
|
|
—
|
|
871
|
|
|
—
|
%
|
|||||
|
Land and lots revenue (dollars in thousands)
|
$
|
18,730
|
|
|
$
|
15,164
|
|
$
|
3,566
|
|
|
23.5
|
%
|
||
|
Lots closed
|
143
|
|
|
117
|
|
26
|
|
|
22.2
|
%
|
|||||
|
Average sales price of lots closed
|
$
|
124,888
|
|
|
$
|
129,607
|
|
$
|
(4,719
|
)
|
|
(3.6
|
)%
|
||
Of the
117
lots closed to third parties during the year ended
December 31, 2016
,
1
was closed by a controlled builder, resulting in revenue of
$0.3 million
which is included in builder operations segments’ revenue.
The
17.8%
increase in lots revenue was driven by a
22.2%
increase in the number of lots closed, partially offset by a
3.6%
decrease in the average lot sales price.
One
land parcel was closed during the year ended
December 31, 2017
, resulting in revenue of
$0.9 million
compared to
no
parcel closings during the year ended
December 31, 2016
.
Selling, General and Administrative Expense
The table below represents the components of selling, general and administrative expense (dollars in thousands):
|
Years Ended
December 31,
|
As Percentage of Related Revenue
|
|||||||||||||
|
2017
|
2016
|
2017
|
2016
|
|||||||||||
|
Builder operations
|
$
|
32,247
|
|
|
$
|
29,939
|
|
7.3
|
%
|
|
8.0
|
%
|
||
|
Land development
|
1,129
|
|
|
1,544
|
|
6.0
|
%
|
|
10.4
|
%
|
||||
|
Corporate and other
|
5,640
|
|
|
$
|
7,146
|
|
—
|
%
|
|
—
|
%
|
|||
|
Total selling, general and administrative expense
|
$
|
39,016
|
|
|
$
|
38,629
|
|
8.5
|
%
|
|
9.9
|
%
|
||
Builder Operations
Selling, general and administrative expense for the year ended
December 31, 2017
for builder operations was
$32.2 million
, compared to
$29.9 million
for the year ended
December 31, 2016
. The increase was primarily attributable to an increase in expenditures to support the growth in our builder operations business. Builder operations expenditures include salary expenses and community costs such as non-capitalized property taxes, rent expenses, professional fees, and advertising and marketing expenses. The average selling community count was
54
for the year ended
December 31, 2017
compared to
47
for the year ended
December 31, 2016
. Selling, general and administrative expense as a percentage of related revenue decreased by
8.8%
for the year ended
December 31, 2017
as a result of internal cost efficiencies, as many of our selling, general and administrative expenses did not increase as we increased home sales through organic growth.
Land Development
Selling, general and administrative expense for land development decreased from
$1.5 million
for the year ended
December 31, 2016
to
$1.1 million
for the year ended
December 31, 2017
. The decrease is primarily the result of a decrease in property tax expense due to a decrease in the number of finished lots in inventory as of
December 31, 2017
.
27
Corporate and Other
Selling, general and administrative expense for the corporate and other non-operating segment for the year ended
December 31, 2017
was
$5.6 million
, compared to
$7.1 million
for the year ended
December 31, 2016
. The decrease was primarily driven by increase of expenses subject to capitalization and a decrease in inventory turnover.
Equity in Income of Unconsolidated Entities
Equity in income of unconsolidated entities increased to
$2.7 million
, or 100%, for the year ended
December 31, 2017
, compared to the year ended
December 31, 2016
, due to our purchase of
49.9%
of the membership and ownership interests in Challenger in August 2017.
Other Income, Net
Other income, net, increased slightly to
$1.5 million
for the year ended
December 31, 2017
, compared to
$1.4 million
for the year ended
December 31, 2016
.
Income Tax Expense
Income tax expense increased
$23.7 million
, or
153.8%
, to
$39.0 million
for the year ended
December 31, 2017
, from an expense of
$15.4 million
for the year ended
December 31, 2016
. The increase is due to multiple factors including an increase in pre-tax income, a change in the federal statutory tax rate and a decrease in noncontrolled earnings. We remeasured our deferred tax assets due to the change in federal statutory tax rate according to the Tax Act which resulted in additional tax expense of $19.0 million.
As of
December 31, 2017
, we had federal net operating loss carryforwards of
$67.0 million
, which will begin to expire beginning with the year ending December 31, 2029. Our ability to utilize our net operating loss carryforwards depends on the amount of taxable income we generate in future periods. Based on our historical taxable income results through
December 31, 2017
, as well as forecasted income, management expects that the Company will generate sufficient taxable income to utilize all of the federal net operating loss carryforwards before they expire. The Company also had $20.2 million of gross state net operating loss carryforwards in Minnesota and Nebraska as of
December 31, 2017
with varying periods of expiration which the Company believes on a more-likely-than-not basis will not be utilized. The Company had approximately $0.2 million of gross Colorado state net operating loss carryforwards as of
December 31, 2017
which will begin to expire beginning with the year ending December 31, 2018. Management expects that the Company will generate sufficient Colorado taxable income to utilize all of the Colorado state net operating loss carryforwards before they expire. The Company maintains a gross deferred income tax asset in the amount of
$1.3 million
for the state loss carryforwards and a related valuation allowance in the amount of
$1.3 million
. In the Company’s assessment of the need for a valuation allowance, both positive and negative information was considered, including any available income tax planning.
As of
December 31, 2017
, we had deferred tax assets of
$31.2 million
, which was net of a valuation allowance in the amount of
$1.3 million
relating to Minnesota and Nebraska state net operating loss carryforwards. The deferred tax assets primarily consisted of
$14.1 million
for federal net operating loss carryforwards and
$13.4 million
for basis in partnerships as of
December 31, 2017
. We evaluate the appropriateness of a valuation allowance in future periods based on the consideration of all available evidence, including the generation of taxable income, using the more-likely-than-not standard. A valuation allowance is required to reduce our deferred tax assets if it is determined that it is more-likely-than-not that all or some portion of such assets will not be realized due to the lack of sufficient taxable income. As of
December 31, 2017
, management concluded that it was more-likely-than-not that the net deferred tax assets, except for the Minnesota and Nebraska state net operating loss carryforwards noted above, will be realized.
28
Lots Owned and Controlled
The following table presents the lots we owned or controlled, including lot option contracts, as of
December 31, 2018
and
2017
. Owned lots are those for which we hold title, while controlled lots are those for which we have the contractual right to acquire title but we do not currently own.
|
December 31, 2018
|
December 31, 2017
|
|||||
|
Lots owned
|
||||||
|
Central
|
4,447
|
|
3,196
|
|
||
|
Southeast
|
1,788
|
|
1,299
|
|
||
|
Total lots owned
|
6,235
|
|
4,495
|
|
||
|
Lots controlled
|
||||||
|
Central
|
853
|
|
1,390
|
|
||
|
Southeast
|
990
|
|
334
|
|
||
|
Total lots controlled
|
1,843
|
|
1,724
|
|
||
|
Total lots owned and controlled
(1)
|
8,078
|
|
6,219
|
|
||
|
Percentage of lots owned
|
77.2
|
%
|
72.3
|
%
|
||
|
(1)
|
Total lots excludes lots with homes under construction.
|
The increase in the number of lots owned is primarily related to the development of lots in the Dallas market while the increase in lots controlled is primarily related to increased development activity in the Atlanta market and the acquisition of GRBK GHO, offset by a reduction of the number of optioned lots in the Dallas market.
Liquidity and Capital Resources Overview
As of
December 31, 2018
and
2017
, we had
$38.3 million
and
$36.7 million
of unrestricted cash, respectively. Management believes that we have a prudent cash management strategy, including consideration of cash outlays for land and lot acquisition and development. We intend to generate and redeploy net cash from the sale of inventory to acquire and develop land and lots that represent opportunities to generate desired margins. We may also use cash to make additional investments in business acquisitions, joint ventures, or other strategic activities.
Our principal uses of capital for the year ended
December 31, 2018
were home construction, land purchases, land development, operating expenses, payment of routine liabilities, and the acquisition of GRBK GHO. We used funds generated by operations and available borrowings to meet our short-term working capital requirements. We remain focused on generating positive margins in our builder operations segments and acquiring desirable land positions in order to maintain a strong balance sheet and remain poised for continued growth.
Cash flows for each of our communities depend on the community’s stage in the development cycle and can differ substantially from reported earnings. Early stages of development or expansion require significant cash outlays for land acquisitions, entitlements and other approvals, roads, utilities, general landscaping and other amenities. These costs are a component of our inventory and are not recognized in our statement of income until a home closes. In the later stages of community development, cash inflows may significantly exceed earnings reported for financial statement purposes, as the cash outflow associated with home construction and land development previously occurred.
Our debt to total capitalization and net debt to total capitalization ratios were
30%
and
26%
, respectively, as of
December 31, 2018
. It is our intent to prudently employ leverage to continue to invest in our land acquisition, development and homebuilding businesses. We intend to target a debt to total capitalization ratio of
30% to 35%
, which we expect will provide us with significant additional growth capital.
29
The Company’s key sources of liquidity were funds generated by operations and lines of credit. Borrowings on revolving and unsecured revolving lines of credit outstanding as of
December 31, 2018
and
2017
had maturity dates of
May 1, 2022
and
December 14, 2021
, respectively, and consisted of the following (in thousands):
|
December 31, 2018
|
December 31, 2017
|
||||||
|
Revolving credit facility
|
46,500
|
|
32,000
|
|
|||
|
Unsecured revolving credit facility
|
155,500
|
|
75,000
|
|
|||
|
Debt issuance costs, net of amortization
|
(1,614
|
)
|
(1,227
|
)
|
|||
|
Total borrowings on lines of credit, net
|
$
|
200,386
|
|
$
|
105,773
|
|
|
For more detailed information on the Company’s lines of credit, refer to Note 7 to the Consolidated Financial Statements located in Part II, Item 8 of this Annual Report on Form 10-K.
Cash Flows
The following summarizes our primary sources and uses of cash for the year ended
December 31, 2018
as compared to the year ended
December 31, 2017
:
|
•
|
Operating activities.
Net cash used in operating activities for the year ended
December 31, 2018
was
$39.5 million
, compared to
$18.0 million
during the year ended
December 31, 2017
. The net cash outflows for the year ended
December 31, 2018
were primarily driven by increase in inventory of
$129.3 million
, partially offset by
$83.0 million
of cash generated from business operations, as well as by increases in accrued expenses and customer and builder deposits, and decreases in earnest money deposits.
|
|
•
|
Investing activities.
Net cash used in investing activities for the year ended
December 31, 2018
was
$30.8 million
, compared to
$0.4 million
for the year ended
December 31, 2017
. The cash outflows were primarily due to the acquisition of GRBK GHO, resulting in an initial cash outflow of
$33.2 million
and an additional
$2.0 million
following the final purchase price adjustment, offset by cash acquired.
|
|
•
|
Financing activities.
Net cash provided by financing activities for the year ended
December 31, 2018
was
$71.8 million
, compared to
$19.1 million
during the year ended
December 31, 2017
. The net cash inflows during the year ended
December 31, 2018
were primarily due to borrowings on lines of credit of
$165.0 million
, partially offset by
$70.0 million
of repayments of lines of credit,
$10.7 million
of distributions to noncontrolling interest partners and
$10.2 million
of repayments of notes payable.
|
The following summarizes our primary sources and uses of cash for the year ended
December 31, 2017
as compared to the year ended
December 31, 2016
:
|
•
|
Operating activities.
Net cash used in operating activities for the year ended
December 31, 2017
was
$18.0 million
, compared to
$4.9 million
during the year ended
December 31, 2016
. The net cash outflows for the year ended
December 31, 2017
were primarily driven by increase in inventory of
$95.5 million
, partially offset by
$62.6 million
of cash generated from business operations, as well as by increases in customer and builder deposits, accounts payable and accrued expenses.
|
|
•
|
Investing activities.
Net cash used in investing activities for the year ended
December 31, 2017
of
$0.4 million
remained flat compared to the year ended
December 31, 2016
.
|
|
•
|
Financing activities.
Net cash provided by financing activities for the year ended
December 31, 2017
was
$19.1 million
, compared to
$21.1 million
during the year ended
December 31, 2016
. The net cash inflows during the year ended
December 31, 2017
were primarily due to borrowings on lines of credit of
$88.5 million
, partially offset by
$56.5 million
of repayments of lines of credit,
$10.9 million
of distributions to noncontrolling interest partners and
$1.0 million
of repayments of notes payable.
|
30
Off-Balance Sheet Arrangements and Contractual Obligations
In the ordinary course of business, we enter into land purchase contracts with third-party developers in order to procure lots for the construction of our homes. We are subject to customary obligations associated with such contracts. These purchase contracts typically require a cash deposit, and the purchase of properties under these contracts is generally contingent upon satisfaction of certain requirements, including obtaining applicable property and development entitlements. We also utilize option contracts with lot sellers as a method of acquiring lots in staged takedowns, which are the schedules that dictate when lots must be purchased to help manage the financial and market risk associated with land holdings, and to reduce the use of funds from our corporate financing sources. Lot option contracts generally require us to pay a non-refundable deposit for the right to acquire lots over a specified period of time at pre-determined prices which typically include escalations in lot prices over time. We generally have the right, at our discretion, to terminate our obligations under both purchase contracts and option contracts by forfeiting the cash deposit with no further financial responsibility to the land seller.
Our utilization of lot option contracts is dependent on, among other things, the availability of land sellers willing to enter into these arrangements, the availability of capital to finance the development of optioned lots, general housing market conditions and local market dynamics. Options may be more difficult to procure from land sellers in strong housing markets and are more prevalent in certain geographic regions.
During the ordinary course of business, certain regulatory agencies and municipalities require the Company to post letters of credit or performance bonds related to development projects. As of
December 31, 2018
and
December 31, 2017
, letters of credit outstanding were
$2.2 million
and
$0.2 million
, respectively, and performance bonds outstanding totaled
$5.3 million
and
$3.6 million
, respectively. The Company does not believe that it is likely that any material claims will be made under a letter of credit or performance bond in the foreseeable future.
Contractual Obligations Table
The following table summarizes our contractual obligations as of
December 31, 2018
.
|
Payments Due by Period (in thousands)
|
||||||||||||||||||||
|
Contractual Obligations
|
Total
|
Less Than 1 Year
|
1 - 3 Years
|
3 - 5 Years
|
Years 5 and Beyond
|
|||||||||||||||
|
Debt obligations
(1)
|
$
|
202,000
|
|
$
|
—
|
|
$
|
155,500
|
|
$
|
46,500
|
|
$
|
—
|
|
|||||
|
Operating leases
|
4,822
|
|
1,263
|
|
2,267
|
|
1,292
|
|
—
|
|
||||||||||
|
Purchase obligations
(2)
|
193,230
|
|
114,198
|
|
77,352
|
|
1,680
|
|
—
|
|
||||||||||
|
Total
|
$
|
400,052
|
|
$
|
115,461
|
|
$
|
235,119
|
|
$
|
49,472
|
|
$
|
—
|
|
|||||
|
(1)
|
Represents principal due on our lines of credit.
|
|
(2)
|
Represents the full contractual amount, including escalators, on our commitments to purchase land and lots, for which there may be existing deposits that net against such amount. If we do not purchase the land or lots under contract, we may forfeit our deposit related to the land or lots.
|
Inflation
Homebuilding operations can be adversely impacted by inflation, resulting in higher land prices and increased costs of financing, labor, materials and construction. In addition, inflation can lead to higher mortgage rates, which can significantly affect the affordability of mortgage financing to homebuyers. While we attempt to pass on cost increases to our customers through increased prices, when less than favorable housing market conditions exist, we may be unable to offset cost increases with higher selling prices.
Critical Accounting Policies
The preparation of financial statements in accordance with United States generally accepted accounting principles (“GAAP”) requires management to use judgment and make estimates that affect the reported amounts of assets and liabilities at the date of the financial statements and the reported amounts of revenues, costs and expenses during the reporting period. On an ongoing basis, management evaluates estimates and judgments, including those which impact our critical accounting policies. Management bases estimates and judgments on historical experience and on various other factors that we believe to be reasonable under the circumstances. Actual results may differ from estimates under different assumptions or conditions.
31
Management believes that the following accounting policies are among the most important to the portrayal of our financial condition and results of operations and require the most subjective or complex judgments.
Inventory and Cost of Revenues
Inventory consists of undeveloped land, raw land scheduled for development, land in the process of development, land held for sale, developed lots, homes completed and under construction, and model homes. Inventory is valued at cost unless the carrying value is determined to be not recoverable in which case the affected inventory is written down to fair value. Cost includes any related pre-acquisition costs that are directly identifiable with a specific property so long as those pre-acquisition costs are anticipated to be recoverable at the sale of the property.
Residential lots held for sale and lots held for development include the initial cost of acquiring the land as well as certain costs capitalized related to developing the land into individual residential lots including direct overhead, interest and real estate taxes.
Land development and other project costs, including direct overhead, interest and property taxes incurred during development and home construction, are capitalized. Land development and other common costs that benefit an entire community are allocated to individual lots or homes based on relative sales value. The costs of completed lots are transferred to work in process when home construction begins. Home construction costs and related carrying charges (principally interest and real estate taxes) are allocated to the cost of individual homes.
Inventory costs for completed homes are expensed upon closing and delivery of the homes. Changes to estimated total land development costs subsequent to initial home closings in a community are generally allocated to the unsold homes in the community on a pro-rata basis. The life cycle of a community generally ranges from
two
to
six
years, commencing with the acquisition of land, continuing through the land development phase, construction, and concluding with the sale and delivery of homes. We recognize costs as incurred on our mechanic’s lien contracts.
Impairment of Inventory
In accordance with the Accounting Standards Codification (“ASC”) 360,
Property, Plant, and Equipment
, we evaluate our inventory for indicators of impairment by individual community and development during each reporting period.
For our builder operations segments, during each reporting period, community gross margins are reviewed by management. In the event that homebuilding inventory in an individual community is moving at a slower than anticipated absorption pace or the average sales prices or margins within an individual community are trending downward and are anticipated to continue to trend downward over the life of the community, the Company will further investigate the community and evaluate it for impairment.
For our land development segment, we perform a quarterly review for indicators of impairment for each project which involves projecting future lot closings based on executed contracts and comparing these revenues to projected costs. In determining the allocation of costs to a particular land parcel, we rely on project budgets which are based on a variety of assumptions, including assumptions about development schedules and future costs to be incurred. It is common that actual results differ from budgeted amounts for various reasons, including delays, increases in costs that have not been committed, unforeseen issues encountered during project development that fall outside the scope of existing contracts, or items that ultimately cost more or less than the budgeted amount. We apply procedures to maintain best estimates in our budgets, including assessing and revising project budgets on a periodic basis, obtaining commitments from subcontractors and vendors for future costs to be incurred and utilizing the most recent information available to estimate costs.
Each reporting period, management reviews the real estate assets, including land held for sale, to determine whether the estimated remaining undiscounted future cash flows are more or less than the asset’s carrying value. The estimated cash flows are determined by projecting the remaining revenue from lot closings based on the contractual lot takedowns remaining or historical/projected home sales/delivery absorptions for homebuilding operations and then comparing such projections to the remaining projected expenditures for development or home construction. Remaining projected expenditures are based on the most current pricing/bids received from subcontractors for current phases or homes under development. For future phases of land development, management uses its judgment to project potential cost increases. In determining the estimated cash flows for land held for sale, management considers recent comparisons to market comparable transactions, bona fide letters of intent from outside parties, executed sales contracts, broker quotes, and similar information. When projecting revenue, management does not assume improvement in market conditions.
32
If the estimated undiscounted cash flows are more than the asset’s carrying value, no impairment adjustment is required. However, if the estimated undiscounted cash flows are less than the asset’s carrying value, the asset is deemed impaired and will be written down to fair value less associated costs to sell. These impairment evaluations require us to make estimates and assumptions regarding future conditions, including the timing and amounts of development costs and sales prices of real estate assets, to determine if expected future cash flows will be sufficient to recover the asset’s carrying value.
Fair value is determined based on estimated future cash flows discounted for inherent risks associated with real estate assets. These discounted cash flows are impacted by expected risk based on estimated land development activities, construction and delivery timelines, market risk of price erosion, uncertainty of development or construction cost increases, and other risks specific to the asset or market conditions where the asset is located when the assessment is made. These factors are specific to each community and may vary among communities.
When estimating cash flows of a community, management makes various assumptions, including: (i) expected sales prices and sales incentives to be offered, including the number of homes available, pricing and incentives being offered by us or other builders, and future sales price adjustments based on market and economic trends; (ii) expected sales pace and cancellation rates based on local housing market conditions, competition and historical trends; (iii) costs expended to date and expected to be incurred including, but not limited to, land and land development costs, home construction costs, interest costs, indirect construction and overhead costs, and selling and marketing costs; (iv) alternative product offerings that may be offered that could have an impact on sales pace, sales price and/or building costs; and (v) alternative uses for the property.
Many assumptions are interdependent and a change in one may require a corresponding change to other assumptions. For example, increasing or decreasing sales absorption rates has a direct impact on the estimated per unit sales price of a home, the level of time-sensitive costs (such as indirect construction, overhead and carrying costs), and selling and marketing costs (such as model home maintenance and advertising costs). Due to uncertainties in the estimation process, the volatility in demand for new housing and the long life cycle of many communities, actual results could differ significantly from such estimates.
Income Taxes
The Company accounts for income taxes using the asset and liability method, under which deferred tax assets and liabilities are recognized for the future tax consequences attributable to temporary differences between financial statement carrying amounts of existing assets and liabilities and their respective tax bases, operating losses and tax credit carryforwards. Deferred tax assets and liabilities are measured using enacted tax rates expected to apply to taxable income in years in which temporary differences are expected to be recovered or settled. The effect on deferred tax assets and liabilities of a change in tax rates is recognized in income in the period that includes the enactment date.
The Company regularly reviews historical and anticipated future pre-tax results of operations to determine whether we will be able to realize the benefit of deferred tax assets. A valuation allowance is required to reduce the deferred tax asset when it is more-likely-than-not that all or some portion of the deferred tax asset will not be realized due to the lack of sufficient taxable income. The Company assesses the recoverability of deferred tax assets and the need for a valuation allowance on an ongoing basis. In making this assessment, management considers all available positive and negative evidence and available income tax planning to determine whether it is more-likely-than-not that some portion or all of the deferred tax assets will be realized in future periods. This assessment requires significant judgment and estimates involving current and deferred income taxes, tax attributes relating to the interpretation of various tax laws, historical bases of tax attributes associated with certain assets and limitations surrounding the realization of deferred tax assets.
We establish reserves for uncertain tax positions that reflect our best estimate of deductions and credits that may not be sustained on a more-likely-than-not basis. We recognize interest and penalties related to uncertain tax positions in the income tax expense in the consolidated statements of income. Accrued interest and penalties, if any, are included within accrued expenses on the consolidated balance sheets. In accordance with ASC 740,
Income Taxes
, the Company recognizes the effect of income tax positions only if those positions have a more-likely-than-not chance of being sustained by the Company. Recognized income tax positions are measured at the largest amount that is greater than 50% likely of being realized. Changes in recognition or measurement are reflected in the period in which the change in judgment occurs.
Recent Accounting Pronouncements
See Note 1 to our consolidated financial statements included in Part II, Item 8 of this Annual Report on Form 10-K for recent accounting pronouncements.
33
Related Party Transactions
See Note 16 to our consolidated financial statements included in Part II, Item 8 of this Annual Report on Form 10-K for a description of our transactions with related parties.
ITEM 7A. QUANTITATIVE AND QUALITATIVE DISCLOSURES ABOUT MARKET RISK
Our operations are interest rate sensitive. Because overall housing demand is adversely affected by increases in interest rates, a significant increase in mortgage interest rates may negatively affect the ability of homebuyers to secure adequate financing. Higher interest rates could adversely affect our revenues, gross margins and net income.
Our lines of credit have variable interest rates which are subject to minimum interest rates. An increase in interest rates could cause the cost of those lines to increase. As of
December 31, 2018
, we had
$202.0 million
outstanding on these lines of credit.
The following table presents our debt obligations, principal cash flows by maturity, weighted average interest rates and estimated fair market value of debt for the year ended
December 31, 2018
(amounts in thousands):
|
Year of Maturity
|
Fair Value at December 31, 2018
|
|||||||||||||||||||||||
|
2019
|
2020
|
2021
|
2022
|
Total
|
||||||||||||||||||||
|
Lines of credit
|
$
|
—
|
|
$
|
—
|
|
$
|
155,500
|
|
$
|
46,500
|
|
$
|
202,000
|
|
$
|
202,000
|
|
||||||
|
Weighted average interest rate
|
—
|
%
|
—
|
%
|
4.99
|
%
|
5.25
|
%
|
—
|
%
|
n/a
|
|
||||||||||||
Based upon the amount of lines of credit as of
December 31, 2018
, a 1% increase in interest rates would increase the interest incurred by us by approximately
$2.0 million
per year, which may be capitalized pursuant to our interest capitalization policy.
We do not enter into, or intend to enter into, swaps, forward or option contracts on interest rates or commodities or other types of derivative financial instruments for trading, hedging or speculative purposes.
Many of the statements contained in this section are forward-looking and should be read in conjunction with the disclosures under the heading “Forward-Looking Statements.”
34
ITEM 8. FINANCIAL STATEMENTS AND SUPPLEMENTARY DATA
Report of Independent Registered Public Accounting Firm
To the Stockholders and the Board of Directors of Green Brick Partners, Inc.
Opinion on the Financial Statements
We have audited the accompanying consolidated balance sheets of Green Brick Partners, Inc. and its subsidiaries (the Company) as of
December 31, 2018
and
2017
, the related consolidated statements of income, stockholders' equity and cash flows for each of the three years in the period ended
December 31, 2018
, and the related notes to the consolidated financial statements (collectively, the financial statements). In our opinion, the financial statements present fairly, in all material respects, the financial position of the Company as of
December 31, 2018
and
2017
, and the results of its operations and its cash flows for each of the three years in the period ended
December 31, 2018
, in conformity with accounting principles generally accepted in the United States of America.
We have also audited, in accordance with the standards of the Public Company Accounting Oversight Board (United States) (PCAOB), the Company's internal control over financial reporting as of
December 31, 2018
, based on criteria established in
Internal Control - Integrated Framework
issued by the Committee of Sponsoring Organizations of the Treadway Commission in 2013, and our report dated
March 8, 2019
expressed an unqualified opinion on the effectiveness of the Company's internal control over financial reporting.
Basis for Opinion
These financial statements are the responsibility of the Company’s management. Our responsibility is to express an opinion on the Company’s financial statements based on our audits. We are a public accounting firm registered with the PCAOB and are required to be independent with respect to the Company in accordance with U.S. federal securities laws and the applicable rules and regulations of the Securities and Exchange Commission and the PCAOB.
We conducted our audits in accordance with the standards of the PCAOB. Those standards require that we plan and perform the audits to obtain reasonable assurance about whether the financial statements are free of material misstatement, whether due to error or fraud. Our audits included performing procedures to assess the risks of material misstatement of the financial statements, whether due to error or fraud, and performing procedures that respond to those risks. Such procedures included examining, on a test basis, evidence regarding the amounts and disclosures in the financial statements. Our audits also included evaluating the accounting principles used and significant estimates made by management, as well as evaluating the overall presentation of the financial statements. We believe that our audits provide a reasonable basis for our opinion.
/s/ RSM US LLP
We have served as the Company's auditor since 2016.
Dallas, Texas
March 8, 2019
35
GREEN BRICK PARTNERS, INC.
CONSOLIDATED BALANCE SHEETS
(In thousands, except share data)
|
|
As of December 31,
|
||||||
|
|
2018
|
|
2017
|
||||
|
ASSETS
|
|||||||
|
Cash
|
$
|
38,315
|
|
|
$
|
36,684
|
|
|
Restricted cash
|
3,440
|
|
|
3,605
|
|
||
|
Receivables
|
4,842
|
|
|
1,605
|
|
||
|
Inventory
|
668,961
|
|
|
496,054
|
|
||
|
Investment in unconsolidated entities
|
20,269
|
|
|
16,878
|
|
||
|
Property and equipment, net
|
4,690
|
|
|
804
|
|
||
|
Earnest money deposits
|
16,793
|
|
|
18,393
|
|
||
|
Deferred income tax assets, net
|
16,499
|
|
|
31,211
|
|
||
|
Intangible assets, net
|
856
|
|
|
—
|
|
||
|
Goodwill
|
680
|
|
|
—
|
|
||
|
Other assets
|
8,681
|
|
|
5,769
|
|
||
|
Total assets
|
$
|
784,026
|
|
|
$
|
611,003
|
|
|
LIABILITIES AND EQUITY
|
|||||||
|
Accounts payable
|
$
|
26,091
|
|
|
$
|
22,354
|
|
|
Accrued expenses
|
29,201
|
|
|
18,465
|
|
||
|
Customer and builder deposits
|
31,978
|
|
|
21,447
|
|
||
|
Borrowings on lines of credit, net
|
200,386
|
|
|
105,773
|
|
||
|
Notes payable
|
—
|
|
|
9,926
|
|
||
|
Contingent consideration
|
2,207
|
|
|
—
|
|
||
|
Total liabilities
|
289,863
|
|
|
177,965
|
|
||
|
Commitments and contingencies
|
|
|
|
|
|
||
|
Redeemable noncontrolling interest in equity of consolidated subsidiary
|
8,531
|
|
|
—
|
|
||
|
Equity
|
|
|
|
|
|
||
|
Green Brick Partners, Inc. stockholders’ equity
|
|
|
|
|
|
||
|
Preferred stock, $0.01 par value: 5,000,000 shares authorized; none issued and outstanding
|
—
|
|
|
—
|
|
||
|
Common shares, $0.01 par value: 100,000,000 shares authorized; 50,719,884 and 50,598,901 issued as of December 31, 2018 and 2017, respectively; 50,583,128 and 50,598,901 outstanding as of December 31, 2018 and 2017, respectively
|
507
|
|
|
506
|
|
||
|
Treasury stock at cost, 136,756 shares
|
(981
|
)
|
|
—
|
|
||
|
Additional paid-in capital
|
291,299
|
|
|
289,938
|
|
||
|
Retained earnings
|
177,526
|
|
|
125,903
|
|
||
|
Total Green Brick Partners, Inc. stockholders’ equity
|
468,351
|
|
|
416,347
|
|
||
|
Noncontrolling interests
|
17,281
|
|
|
16,691
|
|
||
|
Total equity
|
485,632
|
|
|
433,038
|
|
||
|
Total liabilities and equity
|
$
|
784,026
|
|
|
$
|
611,003
|
|
The accompanying notes are an integral part of these consolidated financial statements.
36
GREEN BRICK PARTNERS, INC.
CONSOLIDATED STATEMENTS OF INCOME
(In thousands, except per share data)
|
Years Ended December 31,
|
|||||||||||
|
2018
|
2017
|
2016
|
|||||||||
|
Residential units revenue
|
$
|
578,893
|
|
$
|
439,520
|
|
$
|
375,821
|
|
||
|
Land and lots revenue
|
44,754
|
|
18,730
|
|
15,164
|
|
|||||
|
Total revenues
|
623,647
|
|
458,250
|
|
390,985
|
|
|||||
|
Cost of residential units
|
457,151
|
|
345,360
|
|
292,724
|
|
|||||
|
Cost of land and lots
|
36,166
|
|
13,856
|
|
10,499
|
|
|||||
|
Total cost of revenues
|
493,317
|
|
359,216
|
|
303,223
|
|
|||||
|
Total gross profit
|
130,330
|
|
99,034
|
|
87,762
|
|
|||||
|
Selling, general and administrative expense
|
56,830
|
|
39,016
|
|
38,629
|
|
|||||
|
Change in fair value of contingent consideration
|
1,693
|
|
—
|
|
—
|
|
|||||
|
Operating profit
|
71,807
|
|
60,018
|
|
49,133
|
|
|||||
|
Equity in income of unconsolidated entities
|
7,259
|
|
2,746
|
|
—
|
|
|||||
|
Other income, net
|
2,605
|
|
1,473
|
|
1,421
|
|
|||||
|
Income before income taxes
|
81,671
|
|
64,237
|
|
50,554
|
|
|||||
|
Income tax expense
|
17,136
|
|
39,031
|
|
15,381
|
|
|||||
|
Net income
|
64,535
|
|
25,206
|
|
35,173
|
|
|||||
|
Less: Net income attributable to noncontrolling interests
|
12,912
|
|
10,236
|
|
11,417
|
|
|||||
|
Net income attributable to Green Brick Partners, Inc.
|
$
|
51,623
|
|
$
|
14,970
|
|
$
|
23,756
|
|
||
|
Net income attributable to Green Brick Partners, Inc. per common share:
|
|||||||||||
|
Basic
|
$1.02
|
$0.30
|
$0.49
|
||||||||
|
Diluted
|
$1.02
|
$0.30
|
$0.49
|
||||||||
|
Weighted average common shares used in the calculation of net income attributable to Green Brick Partners, Inc. per common share:
|
|||||||||||
|
Basic
|
50,652
|
|
49,597
|
|
48,879
|
|
|||||
|
Diluted
|
50,751
|
|
49,683
|
|
48,886
|
|
|||||
The accompanying notes are an integral part of these consolidated financial statements.
37
GREEN BRICK PARTNERS, INC.
CONSOLIDATED STATEMENTS OF CHANGES IN STOCKHOLDERS’ EQUITY
(In thousands, except share data)
|
Common Stock
|
Treasury Stock
|
Additional Paid-in Capital
|
Retained Earnings
|
Total Green Brick Partners, Inc. Stockholders’ Equity
|
Noncontrolling Interests
|
Total Stockholders’ Equity
|
|||||||||||||||||||||||||
|
Shares
|
Amount
|
Shares
|
Amount
|
||||||||||||||||||||||||||||
|
Balance at December 31, 2015
|
48,833,323
|
|
$
|
488
|
|
—
|
|
$
|
—
|
|
$
|
271,867
|
|
$
|
87,177
|
|
$
|
359,532
|
|
$
|
12,323
|
|
$
|
371,855
|
|
||||||
|
Share-based compensation
|
—
|
|
—
|
|
—
|
|
—
|
|
361
|
|
—
|
|
361
|
|
—
|
|
361
|
|
|||||||||||||
|
Issuance of common stock under 2014 Omnibus Equity Incentive Plan
|
122,586
|
|
2
|
|
—
|
|
—
|
|
647
|
|
—
|
|
649
|
|
—
|
|
649
|
|
|||||||||||||
|
Amortization of deferred share-based compensation
|
—
|
|
—
|
|
—
|
|
—
|
|
274
|
|
—
|
|
274
|
|
—
|
|
274
|
|
|||||||||||||
|
Contributions
|
—
|
|
—
|
|
—
|
|
—
|
|
—
|
|
—
|
|
—
|
|
2,928
|
|
2,928
|
|
|||||||||||||
|
Distributions
|
—
|
|
—
|
|
—
|
|
—
|
|
—
|
|
—
|
|
—
|
|
(9,755
|
)
|
(9,755
|
)
|
|||||||||||||
|
Net income
|
—
|
|
—
|
|
—
|
|
—
|
|
—
|
|
23,756
|
|
23,756
|
|
11,417
|
|
35,173
|
|
|||||||||||||
|
Balance at December 31, 2016
|
48,955,909
|
|
$
|
490
|
|
—
|
|
$
|
—
|
|
$
|
273,149
|
|
$
|
110,933
|
|
$
|
384,572
|
|
$
|
16,913
|
|
$
|
401,485
|
|
||||||
|
Share-based compensation
|
—
|
|
—
|
|
—
|
|
—
|
|
289
|
|
—
|
|
289
|
|
—
|
|
289
|
|
|||||||||||||
|
Issuance of common stock under 2014 Omnibus Equity Incentive Plan
|
229,049
|
|
2
|
|
—
|
|
—
|
|
1,924
|
|
—
|
|
1,926
|
|
—
|
|
1,926
|
|
|||||||||||||
|
Withholdings from vesting of restricted stock awards
|
(63,057
|
)
|
(1
|
)
|
|
—
|
|
—
|
|
(585
|
)
|
|
—
|
|
|
(586
|
)
|
|
—
|
|
|
(586
|
)
|
||||||||
|
Amortization of deferred share-based compensation
|
—
|
|
—
|
|
|
—
|
|
—
|
|
356
|
|
|
—
|
|
|
356
|
|
|
—
|
|
|
356
|
|
||||||||
|
Common stock issued in connection with the investment in Challenger
|
1,477,000
|
|
15
|
|
—
|
|
—
|
|
14,607
|
|
—
|
|
14,622
|
|
—
|
|
14,622
|
|
|||||||||||||
|
Common stock issuable in connection with the investment in Challenger
|
—
|
|
—
|
|
—
|
|
—
|
|
198
|
|
—
|
|
198
|
|
—
|
|
198
|
|
|||||||||||||
|
Contributions
|
—
|
|
—
|
|
—
|
|
—
|
|
—
|
|
—
|
|
—
|
|
438
|
|
438
|
|
|||||||||||||
|
Distributions
|
—
|
|
—
|
|
—
|
|
—
|
|
—
|
|
—
|
|
—
|
|
(10,896
|
)
|
(10,896
|
)
|
|||||||||||||
|
Net income
|
—
|
|
—
|
|
—
|
|
—
|
|
—
|
|
14,970
|
|
14,970
|
|
10,236
|
|
25,206
|
|
|||||||||||||
|
Balance at December 31, 2017
|
50,598,901
|
|
$
|
506
|
|
—
|
|
$
|
—
|
|
$
|
289,938
|
|
$
|
125,903
|
|
$
|
416,347
|
|
$
|
16,691
|
|
$
|
433,038
|
|
||||||
|
Share-based compensation
|
—
|
|
—
|
|
|
—
|
|
—
|
|
288
|
|
|
—
|
|
|
288
|
|
|
—
|
|
|
288
|
|
||||||||
|
Issuance of common stock under 2014 Omnibus Equity Incentive Plan
|
140,211
|
|
1
|
|
|
—
|
|
—
|
|
1,081
|
|
|
—
|
|
|
1,082
|
|
|
—
|
|
|
1,082
|
|
||||||||
|
Withholdings from vesting of restricted stock awards
|
(39,228
|
)
|
—
|
|
|
—
|
|
—
|
|
(412
|
)
|
|
|
|
|
(412
|
)
|
|
|
|
|
(412
|
)
|
||||||||
|
Amortization of deferred share-based compensation
|
—
|
|
—
|
|
|
—
|
|
—
|
|
404
|
|
|
—
|
|
|
404
|
|
|
—
|
|
|
404
|
|
||||||||
|
Common stock issued in connection with the investment in Challenger
|
20,000
|
|
—
|
|
|
—
|
|
—
|
|
—
|
|
|
—
|
|
|
—
|
|
|
—
|
|
|
—
|
|
||||||||
|
Stock repurchases
|
—
|
|
—
|
|
|
(136,756
|
)
|
(981
|
)
|
—
|
|
|
—
|
|
|
(981
|
)
|
|
—
|
|
|
(981
|
)
|
||||||||
|
Contributions
|
—
|
|
—
|
|
|
—
|
|
—
|
|
—
|
|
|
—
|
|
|
—
|
|
|
5
|
|
|
5
|
|
||||||||
|
Distributions
|
—
|
|
—
|
|
|
—
|
|
—
|
|
—
|
|
|
—
|
|
|
—
|
|
|
(10,747
|
)
|
|
(10,747
|
)
|
||||||||
|
Net income
|
—
|
|
—
|
|
|
—
|
|
—
|
|
—
|
|
|
51,623
|
|
|
51,623
|
|
|
11,332
|
|
|
62,955
|
|
||||||||
|
Balance at December 31, 2018
|
50,719,884
|
|
$
|
507
|
|
|
(136,756
|
)
|
$
|
(981
|
)
|
$
|
291,299
|
|
|
$
|
177,526
|
|
|
$
|
468,351
|
|
|
$
|
17,281
|
|
|
$
|
485,632
|
|
|
The accompanying notes are an integral part of these consolidated financial statements.
38
GREEN BRICK PARTNERS, INC.
CONSOLIDATED STATEMENTS OF CASH FLOWS
(In thousands)
|
Years Ended December 31,
|
|||||||||||
|
2018
|
2017
|
2016
|
|||||||||
|
Cash flows from operating activities:
|
|||||||||||
|
Net income
|
$
|
64,535
|
|
$
|
25,206
|
|
$
|
35,173
|
|
||
|
Adjustment to reconcile net income to net cash used in operating activities:
|
|
|
|
|
|
|
|||||
|
Depreciation and amortization expense
|
2,943
|
|
325
|
|
286
|
|
|||||
|
Share-based compensation
|
1,774
|
|
2,571
|
|
1,284
|
|
|||||
|
Change in fair value of contingent consideration
|
1,693
|
|
—
|
|
—
|
|
|||||
|
Deferred income taxes, net
|
14,712
|
|
36,299
|
|
13,147
|
|
|||||
|
Equity in income of unconsolidated entities
|
(7,259
|
)
|
(2,746
|
)
|
—
|
|
|||||
|
Cash distributions of income from unconsolidated entities
|
4,623
|
|
974
|
|
—
|
|
|||||
|
Changes in operating assets and liabilities:
|
|
|
|
|
|
|
|||||
|
(Increase) decrease in receivables
|
(3,029
|
)
|
843
|
|
866
|
|
|||||
|
Increase in inventory
|
(129,291
|
)
|
(95,452
|
)
|
(70,204
|
)
|
|||||
|
Decrease (increase) in earnest money deposits
|
2,119
|
|
(3,097
|
)
|
(383
|
)
|
|||||
|
Increase in other assets
|
(2,741
|
)
|
(1,701
|
)
|
(2,325
|
)
|
|||||
|
(Decrease) increase in accounts payable
|
(483
|
)
|
7,241
|
|
1,583
|
|
|||||
|
Increase in accrued expenses
|
9,470
|
|
4,175
|
|
8,571
|
|
|||||
|
Increase in customer and builder deposits
|
1,458
|
|
7,359
|
|
7,150
|
|
|||||
|
Net cash used in operating activities
|
(39,476
|
)
|
(18,003
|
)
|
(4,852
|
)
|
|||||
|
Cash flows from investing activities:
|
|||||||||||
|
Business combination, net of acquired cash
|
(26,861
|
)
|
—
|
|
—
|
|
|||||
|
Investments in unconsolidated entities
|
(755
|
)
|
(286
|
)
|
—
|
|
|||||
|
Purchase of property and equipment
|
(3,211
|
)
|
(149
|
)
|
(458
|
)
|
|||||
|
Net cash used in investing activities
|
(30,827
|
)
|
(435
|
)
|
(458
|
)
|
|||||
|
Cash flows from financing activities:
|
|||||||||||
|
Borrowings from lines of credit
|
165,000
|
|
88,500
|
|
63,000
|
|
|||||
|
Payment of debt issuance costs
|
(870
|
)
|
(809
|
)
|
(326
|
)
|
|||||
|
Proceeds from notes payable
|
—
|
|
—
|
|
2,660
|
|
|||||
|
Repayments of lines of credit
|
(70,000
|
)
|
(56,500
|
)
|
(35,500
|
)
|
|||||
|
Repayments of notes payable
|
(10,226
|
)
|
(1,022
|
)
|
(1,870
|
)
|
|||||
|
Withholdings of taxes from vesting of restricted stock awards
|
(412
|
)
|
(586
|
)
|
—
|
|
|||||
|
Stock repurchases
|
(981
|
)
|
|
—
|
|
|
—
|
|
|||
|
Contributions from noncontrolling interests
|
5
|
|
438
|
|
2,928
|
|
|||||
|
Distributions to noncontrolling interests
|
(10,747
|
)
|
(10,896
|
)
|
(9,755
|
)
|
|||||
|
Net cash provided by financing activities
|
71,769
|
|
19,125
|
|
21,137
|
|
|||||
|
Net increase in cash and restricted cash
|
1,466
|
|
687
|
|
15,827
|
|
|||||
|
Cash, beginning of period
|
36,684
|
|
35,157
|
|
21,207
|
|
|||||
|
Restricted cash, beginning of period
|
3,605
|
|
4,445
|
|
2,568
|
|
|||||
|
Cash and restricted cash, beginning of period
|
$
|
40,289
|
|
$
|
39,602
|
|
$
|
23,775
|
|
||
|
Cash, end of period
|
38,315
|
|
36,684
|
|
35,157
|
|
|||||
|
Restricted cash, end of period
|
3,440
|
|
3,605
|
|
4,445
|
|
|||||
|
Cash and restricted cash, end of period
|
$
|
41,755
|
|
$
|
40,289
|
|
$
|
39,602
|
|
||
39
|
Supplemental disclosure of cash flow information:
|
|||||||||||
|
Cash paid for interest, net of capitalized interest
|
$
|
—
|
|
$
|
—
|
|
$
|
—
|
|
||
|
Cash paid for income taxes, net of refunds
|
$
|
4,611
|
|
$
|
2,941
|
|
$
|
1,503
|
|
||
|
Supplemental disclosure of noncash investing and financing activities:
|
|||||||||||
|
Decrease in land not owned under option contracts
|
$
|
—
|
|
$
|
—
|
|
$
|
6,921
|
|
||
|
Equity issuance related to investment in unconsolidated entity
|
$
|
—
|
|
$
|
14,622
|
|
$
|
—
|
|
||
The accompanying notes are an integral part of these consolidated financial statements.
40
GREEN BRICK PARTNERS, INC.
NOTES TO CONSOLIDATED FINANCIAL STATEMENTS
1. SUMMARY OF SIGNIFICANT ACCOUNTING POLICIES
Basis of Presentation
The accompanying consolidated financial statements have been prepared in accordance with United States generally accepted accounting principles (“GAAP”) as set forth in the Financial Accounting Standards Board’s (“FASB”) Accounting Standards Codification (“ASC”) and applicable regulations of the Securities and Exchange Commission (“SEC”).
Principles of Consolidation
The accompanying consolidated financial statements include the accounts of Green Brick Partners, Inc., its controlled subsidiaries, and variable interest entities (“VIEs”) in which Green Brick Partners, Inc. or one of its controlled subsidiaries is deemed to be the primary beneficiary (together, the “Company”, “we”, or “Green Brick”).
All intercompany balances and transactions have been eliminated in consolidation.
The Company uses the equity method of accounting for its investments in unconsolidated entities over which it exercises significant influence but does not have a controlling interest. Under the equity method, the Company’s share of the unconsolidated entities’ earnings or losses is included in the consolidated statements of income.
Use of Estimates
The preparation of the consolidated financial statements in conformity with GAAP requires management of the Company to make estimates and assumptions that affect the amounts reported in the consolidated financial statements and accompanying notes, including the reported amounts of assets and liabilities and disclosure of contingent assets and liabilities at the date of the consolidated financial statements and the reported amounts of revenue and expenses during the reporting periods. Actual results could differ from those estimates.
Reclassifications
Certain prior period amounts have been reclassified to conform to the current period presentation.
Cash
The cash balances of the Company are held with multiple financial institutions. At times, cash balances at certain banks and financial institutions may exceed insurable amounts. The Company believes it mitigates this risk by monitoring the financial stability of institutions holding material cash balances. The Company has not experienced any losses in such accounts and believes that the risk of loss is minimal.
Restricted Cash
Restricted cash primarily relates to cash held in escrow for sales of developed lots to third parties and customer deposits from homebuyers.
Receivables
Receivables consist of amounts collectible from manufacturing rebates earned by our homebuilders during the normal course of business, amounts collectible from third-party escrow agents related to closings on land, lots and homes, amounts collectible related to mechanic’s lien contracts, as well as income tax receivables. As of
December 31, 2018
and
2017
, all amounts are considered fully collectible and
no
allowance for doubtful accounts is recorded. Any allowance for doubtful accounts is estimated based on our historical losses, the existing economic conditions, and the financial stability of our customers. Receivables are written off in the period that they are deemed uncollectible.
41
Inventory and Cost of Revenues
Inventory consists of undeveloped land, raw land scheduled for development, land in the process of development, land held for sale, developed lots, homes completed and under construction, and model homes. Inventory is valued at cost unless the carrying value is determined to be not recoverable in which case the affected inventory is written down to fair value. Cost includes any related pre-acquisition costs that are directly identifiable with a specific property so long as those pre-acquisition costs are anticipated to be recoverable at the sale of the property.
Residential lots held for sale and lots held for development include the initial cost of acquiring the land as well as certain costs capitalized related to developing the land into individual residential lots including direct overhead, interest and real estate taxes.
Land development and other project costs, including direct overhead, interest and property taxes incurred during development and home construction, are capitalized. Land development and other common costs that benefit an entire community are allocated to individual lots or homes based on relative sales value. The costs of completed lots are transferred to work in process when home construction begins. Home construction costs and related carrying charges (principally interest and real estate taxes) are allocated to the cost of individual homes.
Inventory costs for completed homes are expensed upon closing and delivery of the homes. Changes to estimated total land development costs subsequent to initial home closings in a community are generally allocated to the unsold homes in the community on a pro-rata basis. The life cycle of a community generally ranges from
two
to
six
years, commencing with the acquisition of land, continuing through the land development phase, construction, and concluding with the sale and delivery of homes. We recognize costs as incurred on our mechanic’s lien contracts.
Impairment of Inventory
In accordance with the ASC 360,
Property, Plant, and Equipment
(“ASC 360”), we evaluate our inventory for indicators of impairment by individual community and development during each reporting period.
For our builder operations segments, during each reporting period, community gross margins are reviewed by management. In the event that homebuilding inventory in an individual community is moving at a slower than anticipated absorption pace or the average sales prices or margins within an individual community are trending downward and are anticipated to continue to trend downward over the life of the community, the Company will further investigate the community and evaluate it for impairment.
For our land development segment, we perform a quarterly review for indicators of impairment for each project which involves projecting future lot closings based on executed contracts and comparing these revenues to projected costs. In determining the allocation of costs to a particular land parcel, we rely on project budgets which are based on a variety of assumptions, including assumptions about development schedules and future costs to be incurred. It is common that actual results differ from budgeted amounts for various reasons, including delays, increases in costs that have not been committed, unforeseen issues encountered during project development that fall outside the scope of existing contracts, or items that ultimately cost more or less than the budgeted amount. We apply procedures to maintain best estimates in our budgets, including assessing and revising project budgets on a periodic basis, obtaining commitments from subcontractors and vendors for future costs to be incurred and utilizing the most recent information available to estimate costs.
Each reporting period, management reviews the real estate assets, including land held for sale, to determine whether the estimated remaining undiscounted future cash flows are more or less than the asset’s carrying value. The estimated cash flows are determined by projecting the remaining revenue from lot closings based on the contractual lot takedowns remaining or historical/projected home sales/delivery absorptions for homebuilding operations and then comparing such projections to the remaining projected expenditures for development or home construction. Remaining projected expenditures are based on the most current pricing/bids received from subcontractors for current phases or homes under development. For future phases of land development, management uses its judgment to project potential cost increases. In determining the estimated cash flows for land held for sale, management considers recent comparisons to market comparable transactions, bona fide letters of intent from outside parties, executed sales contracts, broker quotes, and similar information. When projecting revenue, management does not assume improvement in market conditions.
If the estimated undiscounted cash flows are more than the asset’s carrying value, no impairment adjustment is required. However, if the estimated undiscounted cash flows are less than the asset’s carrying value, the asset is deemed impaired and
42
will be written down to fair value less associated costs to sell. These impairment evaluations require us to make estimates and assumptions regarding future conditions, including the timing and amounts of development costs and sales prices of real estate assets, to determine if expected future cash flows will be sufficient to recover the asset’s carrying value.
Fair value is determined based on estimated future cash flows discounted for inherent risks associated with real estate assets. These discounted cash flows are impacted by expected risk based on estimated land development activities, construction and delivery timelines, market risk of price erosion, uncertainty of development or construction cost increases, and other risks specific to the asset or market conditions where the asset is located when the assessment is made. These factors are specific to each community and may vary among communities.
When estimating cash flows of a community, management makes various assumptions, including: (i) expected sales prices and sales incentives to be offered, including the number of homes available, pricing and incentives being offered by us or other builders, and future sales price adjustments based on market and economic trends; (ii) expected sales pace and cancellation rates based on local housing market conditions, competition and historical trends; (iii) costs expended to date and expected to be incurred including, but not limited to, land and land development costs, home construction costs, interest costs, indirect construction and overhead costs, and selling and marketing costs; (iv) alternative product offerings that may be offered that could have an impact on sales pace, sales price and/or building costs; and (v) alternative uses for the property.
Many assumptions are interdependent and a change in one may require a corresponding change to other assumptions. For example, increasing or decreasing sales absorption rates has a direct impact on the estimated per unit sales price of a home, the level of time-sensitive costs (such as indirect construction, overhead and carrying costs), and selling and marketing costs (such as model home maintenance costs and advertising costs). Due to uncertainties in the estimation process, the volatility in demand for new housing and the long life cycle of many communities, actual results could differ significantly from such estimates.
Capitalization of Interest
The Company capitalizes interest costs incurred to inventory during development and other qualifying activities. Interest capitalized as cost of inventory is charged to cost of revenues as related homes, land and lots are closed. Interest incurred on undeveloped land is directly expensed and included in interest expense in our consolidated statements of income.
Investments in Unconsolidated Entities
In accordance with
ASC 323,
Investments - Equity Method and Joint Ventures
(“ASC 323”)
, the Company
uses the equity method of accounting for its investments in unconsolidated entities over which it exercises significant influence but does not have a controlling interest.
The equity method of accounting requires the investment to be initially recorded at cost and subsequently adjusted for the Company
’
s share of equity in the
unconsolidated entity’s earnings or losses
. The Company evaluates the carrying amount of the investments in unconsolidated entities for impairment in accordance with ASC 323. If the Company determines that a loss in the value of the investment is other than temporary, the Company writes down the investment to its estimated fair value. Any such losses are recorded to e
quity in income of unconsolidated entities
in the Company
’
s consolidated statements of income. Due to uncertainties in the estimation process and the volatility in demand for new housing, actual results could differ significantly from such estimates.
The Company has made an election to classify distributions received from unconsolidated entities using the nature of the distribution approach. Distributions received are classified as cash inflows from operating activities based on the nature of the activities of the investee that generated the distribution.
Variable Interest Entities
The Company accounts for variable interest entities (“VIEs”) in accordance with ASC 810,
Consolidation
(“ASC 810”). In accordance with ASC 810, an entity is a VIE when: (a) the equity investment at risk in the entity is not sufficient to permit the entity to finance its activities without additional subordinated financial support provided by other parties, including the equity holders; (b) the entity’s equity holders as a group either (i) lack the direct or indirect ability to make decisions about the entity, (ii) are not obligated to absorb expected losses of the entity or (iii) do not have the right to receive expected residual returns of the entity; or (c) the entity’s equity holders have voting rights that are not proportionate to their economic interests, and the activities of the entity involve or are conducted on behalf of the equity holder with disproportionately few voting rights. If an entity is deemed to be a VIE pursuant to ASC 810, the enterprise that has both (i) the power to direct the activities of the VIE that most significantly impacts the entity’s economic performance and (ii) the obligation to absorb the expected losses of the
43
entity or right to receive benefits from the entity that could be potentially significant to the VIE is considered the primary beneficiary and must consolidate the VIE. In accordance with ASC 810, the Company performs ongoing reassessments of whether it is the primary beneficiary of a VIE. The financial statements of the VIEs for which the Company is considered to be the primary beneficiary, if any, are consolidated in the Company’s consolidated financial statements. The noncontrolling interests attributable to other beneficiaries of the VIEs are included as noncontrolling interests in the Company’s consolidated financial statements.
Property and Equipment, Net
Property and equipment are stated at cost less accumulated depreciation. Depreciation is computed over the estimated useful lives of the assets using the straight-line method. The estimated useful lives of assets range from
one
to
fifteen
years. Repairs and maintenance are expensed as incurred.
Earnest Money Deposits
In the ordinary course of business, the Company enters into land and lot option contracts in order to procure land for the construction of homes in the future. Pursuant to these option contracts, the Company generally provides a deposit to the seller as consideration for the right to purchase land at different times in the future, usually at predetermined prices. Such contracts enable the Company to defer acquiring portions of properties owned by third parties or unconsolidated entities until the Company has determined whether and when to exercise its option, which reduces the Company’s financial risk associated with long-term land holdings. Option deposits and pre-acquisition costs (such as environmental testing, surveys, engineering, and entitlement costs) are capitalized if the costs are directly identifiable with the land under option and acquisition of the property is probable. Such costs are reflected in earnest money deposits and are reclassified to inventory upon taking title to the land. The Company writes off deposits and pre-acquisition costs if it becomes probable that the Company will not proceed with the project or recover the capitalized costs. Such decisions take into consideration changes in local market conditions, the timing of required land takedowns, the availability and best use of necessary incremental capital, and other factors.
Under ASC 810, a non-refundable deposit paid to an entity is deemed to be a variable interest that will absorb some or all of the entity’s expected losses if they occur and, as such, the Company’s land and lot option contracts are considered variable interests. The Company’s option contract deposits along with any related pre-acquisition costs represent the Company’s maximum exposure to the land seller if the Company elects not to purchase the optioned property. Therefore, whenever the Company enters into an option or purchase contract with an entity and makes a non-refundable deposit, a VIE assessment is performed. However, the Company generally has little control or power to direct the activities that most significantly impact the VIE’s economic performance due to the Company’s lack of an equity interest in them. Additionally, creditors of the VIE typically have no material recourse against the Company, and the Company does not provide financial or other support to these VIEs other than as stipulated in the option contracts. In accordance with ASC 810, the Company performs ongoing reassessments of whether the Company is the primary beneficiary of a VIE.
Sales with Option to Repurchase
In accordance with ASC 360, sales of land followed by entering into land option contracts to repurchase the land from the buyers are considered a financing arrangement rather than a sale. As a result of such transactions, the Company recorded $9.3 million as of December 31, 2016 as land not owned under option contracts with a corresponding liability reflected as obligations related to land not owned under option contracts on the consolidated balance sheets. The Company purchased all of the lots under the option contracts during 2017.
Intangible Assets
Intangible assets, net consists of the estimated fair value of acquired home construction contracts and trade name. A high degree of judgment is made by management regarding assumptions, such as revenue growth rates, profitability, and discount rates, when estimating the value of the intangible assets. The identified home construction contracts intangible asset is amortized to cost of residential units as income on the related contracts is earned, over a period of eleven months. The trade name has a definite life and is amortized over ten years.
Intangible assets are tested for impairment whenever events or circumstances indicate that the carrying amount of an asset may not be recoverable. An impairment loss would be recognized if the carrying amount of the asset exceeds the estimated undiscounted future cash flows expected to result from the use of the asset and its eventual disposition. The impairment loss
44
recorded would be the excess of the asset’s carrying value over its fair value. Fair value would be determined using a discounted cash flow analysis or other valuation technique.
Goodwill
The excess of the purchase price of a business acquisition over the net fair value of assets acquired and liabilities assumed is capitalized as goodwill in accordance with ASC 805,
Business Combinations
(“ASC 805”). Goodwill is assessed for impairment at least annually in the fourth quarter, or more frequently if certain impairment indicators are present. Goodwill impairment exists when a reporting unit’s goodwill carrying value exceeds its implied fair value.
Per ASC 350,
Intangibles - Goodwill and Other
(“ASC 350”), an entity may make a qualitative assessment of whether it is more likely than not that a reporting unit’s fair value is less than its carrying amount before applying a two-step goodwill impairment test. When performing a qualitative assessment, an entity evaluates relevant events and circumstances, including but not limited to, macroeconomic conditions, industry and market conditions, overall financial performance, reporting unit specific events and entity specific events. If, after completing a qualitative assessment, an entity concludes that it is not likely that the fair value of the reporting unit is less than its carrying amount, a two-step impairment test would not be required for that reporting unit.
In the event that the conclusion of the qualitative assessment requires the two-step test, the first step compares the fair value of the reporting unit with its carrying value, including goodwill. If the fair value of the reporting unit is less than its carrying value, an indication of goodwill impairment exists for the reporting unit and the entity must perform step two of the impairment test. Under step two, an impairment loss is recognized for any excess of the carrying amount of the reporting unit’s goodwill over the implied fair value of that goodwill. The implied fair value of goodwill is determined by allocating the fair value of the reporting unit in a manner similar to a purchase price allocation and the residual fair value after this allocation is the implied fair value of the reporting unit goodwill. Fair value of the reporting unit is determined using a discounted cash flow analysis. If the fair value of the reporting unit exceeds its carrying value, step two is not required. An impairment loss is recognized to the extent that the carrying amount of goodwill exceeds its implied fair value.
If the Company is required to perform the two-step test, it would determine fair value using generally accepted valuation techniques, including discounted cash flows and market multiple analyses. The Company’s valuation methodology for assessing impairment would require management to make judgments and assumptions based on historical experience and projections of future operating performance. If these assumptions differ materially from future results, the Company may record impairment charges in the future.
Warranties
The Company accrues an estimate of its exposure to warranty claims based on both current and historical home closings data and warranty costs incurred. The Company offers homeowners a comprehensive third-party warranty on each home. Homes are generally covered by a ten-year warranty for qualified and defined structural defects, one year for defects and products used, and two years for electrical, plumbing, heating, ventilation, and air conditioning parts and labor. Warranty accruals are included within accrued expenses on the consolidated balance sheets. Any legal costs associated with loss contingencies related to warranties are expensed as incurred.
Customer and Builder Deposits
The Company typically requires customers to submit a deposit for home purchases and for builders to submit a deposit in connection with their construction loan agreements. The deposits serve as a guarantee to performance under home purchase and land development contracts. Cash received as customer and builder deposits, if held in escrow, is shown as restricted cash on the consolidated balance sheets.
Debt Issuance Costs
Debt issuance costs represent costs incurred related to the revolving secured and unsecured credit facilities, including amendments thereto, and reduce the carrying amount of debt on the consolidated balance sheets. These costs are subject to capitalization to inventory over the term of the related debt facility using the straight-line method.
45
Redeemable Noncontrolling Interest in Equity of Consolidated Subsidiary
Redeemable noncontrolling interest in equity of consolidated subsidiary represents equity related to a put option held by a minority shareholder of a subsidiary. Based on the put option structure, the minority shareholder’s interest in the controlled subsidiary is classified as a redeemable noncontrolling interest on the consolidated balance sheets. The accretion of the redeemable noncontrolling interest to its estimated redemption value is recorded in additional paid-in capital on the consolidated balance sheets if the estimated redemption value, net of accretion, is greater than the current value of the noncontrolling interest capital account.
Business Combinations
Acquisitions are accounted for in accordance with ASC 805. Following the determination that control of a business and its inputs, processes and outputs were obtained in exchange for consideration, all material assets and liabilities of the business, including contingent consideration, are measured and recognized at fair value as of the date of the acquisition to reflect the purchase price. Depending on the fair value of net assets acquired, the purchase price allocation may or may not result in goodwill.
Contingent consideration is subsequently remeasured to fair value at each reporting date until the contingency is resolved, with any change in fair value recognized in the consolidated statements of income.
Revenue Recognition
Contracts with Customers
The Company derives revenues from two primary sources: the closing and delivery of homes through our builder operations segments and the closing of lots sold to homebuilders through our land development segment. All of our revenue is from contracts with customers.
Contract Liabilities
The Company requires homebuyers to submit a deposit for home purchases and requires third-party builders to submit a deposit in connection with land sale or lot option contracts. The deposits serve as a guarantee for performance under homebuilding and land sale or development contracts. Cash received as customer deposits is reflected as customer and builder deposits on the consolidated balance sheets.
Performance Obligations
The Company’s contracts with homebuyers contain a single performance obligation. The performance obligation is satisfied when homes are completed and legal title has been transferred to the buyer. The Company does not have any variable consideration associated with home sales transactions.
Revenue from mechanic’s lien contracts in which the Company serves as the general contractor for custom homes where the customer, and not the Company, owns the underlying land and improvements is recognized based on the input method, where progress toward completion is measured by relating the actual cost of work performed to date to the estimated total cost of the respective contracts.
Lot option contracts contain multiple performance obligations. The performance obligations are satisfied as lots are closed and legal title has been transferred to the builder. For lot option contracts, individual performance obligations are accounted for separately. The transaction price is allocated to the separate performance obligations on a relative stand-alone selling price basis. Certain lot option contracts require escalations in lot price over the option period. Any escalator is not collectible until the lot closing occurs. While we recognize lot escalators as variable consideration within the transaction price, we do not recognize escalator revenue until a builder closes on a lot subject to an escalator as the escalator relates to general inflation and holding costs.
Occasionally, the Company sells developed and undeveloped land parcels. If the land parcel is developed prior to the sale of the land, the revenue is recognized at closing since we deliver a single performance obligation in the form of a developed parcel. We also recognize revenue at closing on undeveloped land parcel sales as there are no other obligations beyond delivering the undeveloped land.
46
Homebuyers are not obligated to pay for a home until the closing and delivery of the home. The selling price of a home is based on the contract price adjusted for any change orders, which are considered modifications of the contract price.
Homebuilders are not obligated to pay for developed lots prior to control of the lots and any associated improvements being transferred to them. The term of our lot option contracts is generally based upon the number of lots being purchased and an agreed upon lot takedown schedule, which can be in excess of one year. Lots cannot be taken down until development is substantially complete. There is no significant financing component related to our third-party lot sales.
The Company does not sell warranties outside of the customary workmanship warranties provided on homes or developed lots at the time of sale. The warranties offered to homebuyers are short term, with the exception of ten-year warranties on structural concerns for homes. As these are assurance-type warranties, there is no separate performance obligation related to warranties provided to homebuyers or homebuilder.
Significant Judgments and Estimates
There are no significant judgments involved in the recognition of residential units revenue. The performance obligation of delivering a completed home is satisfied upon the sale closing when title transfers to the buyer.
There are no significant judgments involved in the recognition of land and lots revenue. The performance obligation of delivering land and lots is satisfied upon the closing of the sale when title transfers to the homebuilder.
Contract Costs
The Company recognizes an asset for the incremental costs of obtaining a contract with a customer if it expects to recover those costs.
The Company pays sales commissions to employees and/or outside realtors related to individual home sales which are expensed as incurred at the time of closing. Commissions on the sale of land parcels are also expensed as incurred upon closing. Sales commissions on the sale of homes are included in the cost of revenues in the consolidated statements of income.
The Company also pays builder incentives to employees which are based on the time it takes to build individual homes, as well as quality inspection completion and customer satisfaction. The builder incentives do not represent incremental costs that would require capitalization as we would incur these costs whether or not we sold the home. As such, we recognize builder incentives as expense at the time they are paid.
Advertising costs, sales salaries and certain costs associated with model homes, such as signage, do not qualify for capitalization under ASC 340-40,
Other Assets and Deferred Costs - Contracts with Customers
, as they are not incremental costs of obtaining a contract. As such, we expense these costs to selling, general and administrative expense as incurred. Costs incurred related to model home furnishings and sales office construction are capitalized and included in property and equipment, net on the consolidated balance sheets.
Selling, General and Administrative Expense
Selling, general and administrative expense represents salaries, benefits, share-based compensation, property taxes on finished homes, depreciation, amortization, advertising and marketing, rent, and other administrative items, and is recorded in the period incurred.
Advertising Expense
The Company expenses advertising costs as incurred. Advertising costs are included in selling, general and administrative expense in the consolidated statements of income. Advertising expense for the years ended
December 31, 2018
,
2017
and
2016
totaled
$1.5 million
,
$0.8 million
and
$0.7 million
, respectively.
Interest Expense
Interest expense consists primarily of interest costs incurred on our debt that are not capitalized, and amortization of debt issuance costs. We capitalize interest costs incurred to inventory during development and other qualifying activities. Debt
47
issuance costs are capitalized to inventory over the term of the underlying debt using the straight-line method, in accordance with our interest capitalization policy. All interest costs were capitalized during the years ended
December 31, 2018
,
2017
and
2016
.
Net Income Attributable to Green Brick Partners, Inc. per Share
The Company’s restricted stock awards have the right to receive forfeitable dividends on an equal basis with common stock and therefore are not considered participating securities that must be included in the calculation of net income per share using the two-class method. Basic earnings per share is computed by dividing net income by the weighted average number of common shares outstanding during each period, adjusted for non-vested shares of restricted stock awards during each period. Diluted earnings per share is calculated using the treasury stock method and includes the effect of all dilutive securities, including stock options and restricted stock awards.
Cost Recognition
Lot acquisition, materials, direct costs, interest and indirect costs related to the acquisition, development, and construction of lots and homes are capitalized. Direct and indirect costs of developing residential lots are allocated evenly to all applicable lots. Capitalized costs of residential lots are charged to earnings when the related revenue is recognized. Non-capitalizable costs in connection with developed lots and completed homes and other selling and administrative costs are charged to earnings when incurred.
Share-Based Compensation
The Company measures and accounts for share-based awards in accordance with ASC 718,
Compensation - Stock Compensation
. The Company expenses share-based payment awards made to employees and directors, including stock options and restricted stock awards. Share-based compensation expense associated with stock options and restricted stock awards with vesting contingent upon the achievement of service conditions is recognized on a straight-line basis, net of estimated forfeitures, over the requisite service period over which the awards are expected to vest. The Company estimates the value of stock options with vesting contingent upon the achievement of service conditions as of the date the award was granted using the Black-Scholes option pricing model. The Black-Scholes option pricing model requires the use of certain input variables, such as expected volatility, risk-free interest rate and expected award life.
Income Taxes
The Company accounts for income taxes using the asset and liability method, under which deferred tax assets and liabilities are recognized for the future tax consequences attributable to temporary differences between financial statement carrying amounts of existing assets and liabilities and their respective tax bases, operating losses and tax credit carryforwards. Deferred tax assets and liabilities are measured using enacted tax rates expected to apply to taxable income in years in which temporary differences are expected to be recovered or settled. The effect on deferred tax assets and liabilities of a change in tax rates is recognized in income in the period that includes the enactment date.
The Company regularly reviews historical and anticipated future pre-tax results of operations to determine whether we will be able to realize the benefit of deferred tax assets. A valuation allowance is required to reduce the deferred tax asset when it is more-likely-than-not that all or some portion of the deferred tax asset will not be realized due to the lack of sufficient taxable income. The Company assesses the recoverability of deferred tax assets and the need for a valuation allowance on an ongoing basis. In making this assessment, management considers all available positive and negative evidence and available income tax planning to determine whether it is more-likely-than-not that some portion or all of the deferred tax assets will be realized in future periods. This assessment requires significant judgment and estimates involving current and deferred income taxes, tax attributes relating to the interpretation of various tax laws, historical bases of tax attributes associated with certain assets and limitations surrounding the realization of deferred tax assets.
We establish reserves for uncertain tax positions that reflect our best estimate of deductions and credits that may not be sustained on a more-likely-than-not basis. We recognize interest and penalties related to uncertain tax positions in the income tax expense in the consolidated statements of income. Accrued interest and penalties, if any, are included within accrued expenses on the consolidated balance sheets. In accordance with ASC 740,
Income Taxes
, the Company recognizes the effect of income tax positions only if those positions have a more-likely-than-not chance of being sustained by the Company. Recognized income tax positions are measured at the largest amount that is greater than 50% likely of being realized. Changes in recognition or measurement are reflected in the period in which the change in judgment occurs.
48
Fair Value Measurements
The Company has adopted and implemented the provisions of ASC 820-10,
Fair Value Measurements
, with respect to fair value measurements of: all elected financial assets and liabilities and any nonfinancial assets and liabilities that are recognized or disclosed in the consolidated financial statements at fair value on a recurring basis (at least annually). Under ASC 820-10, fair value is defined as an exit price, or the amount that would be received to sell an asset or paid to transfer a liability in an orderly transaction between market participants as of the measurement date. These provisions establish a three-tiered fair value hierarchy that prioritizes inputs to valuation techniques used in fair value calculations. The three levels of input are defined as follows:
|
Level 1 —
|
unadjusted quoted prices for identical assets or liabilities in active markets accessible by the Company;
|
|
Level 2 —
|
inputs that are observable in the marketplace other than those classified as Level 1; and
|
|
Level 3 —
|
inputs that are unobservable in the marketplace and significant to the valuation.
|
Entities are encouraged to maximize the use of observable inputs and minimize the use of unobservable inputs. If a financial instrument uses inputs that fall in different levels of the hierarchy, the instrument will be categorized based upon the lowest level of input that is significant to the fair value calculation.
Our valuation methods may produce a fair value calculation that may not be indicative of net realizable value or reflective of future fair values. Furthermore, while we believe our valuation methods are appropriate and consistent with other market participants, the use of different methodologies or assumptions to determine the fair value of certain financial instruments could result in a different fair value measurement at the reporting date.
Segment Information
In accordance with ASC 280,
Segment Reporting
(“ASC 280”), an operating segment is defined as a component of an enterprise for which discrete financial information is available and reviewed regularly by the chief operating decision maker (“CODM”), or decision-making group, to evaluate performance and make operating decisions.
A reportable segment is an operating segment, either separately defined or aggregated from several operating segments based on similar economic and other characteristics, that exceeds certain quantitative thresholds of ASC 280.
The Company identifies its CODM as four key executives - the Chief Executive Officer, Chief Financial Officer, President of Texas Region and Chief Accounting Officer. In determining the reportable segments, the CODM considers similar economic and other characteristics, including geography, class of customers, product types, and production processes.
Recent Accounting Pronouncements
The Company adopted Accounting Standards Update (“ASU”) 2014-09,
Revenue from Contracts with Customers
(“ASU 2014-09”), on January 1, 2018. ASU 2014-09 was codified into ASC 606,
Revenue from Contracts with Customers
(“ASC 606”). The Company adopted ASC 606 using the modified retrospective method applied to contracts which were not completed as of January 1, 2018, which required the cumulative effect of the initial application of the new standard, if any, to be reflected as an adjustment to the opening balance of retained earnings as of January 1, 2018. The Company’s revenue recognition disclosures expanded significantly under ASC 606, specifically related to the quantitative and qualitative information about performance obligations, information about contract balances, changes in contract assets and liabilities and disaggregation of revenue. The adoption of ASC 606 did not have a material effect on the Company’s consolidated statements of income and there was
no
cumulative effect on the opening balance of retained earnings as of January 1, 2018.
As a result of the adoption of ASU 2014-09, costs related to model home furnishings are no longer capitalizable as inventory; however, such costs are capitalizable as fixed assets. As of
December 31, 2018
,
$2.3 million
of model home furnishings costs were included in property and equipment, net compared to
$1.1 million
included in inventory as of
December 31, 2017
. The related depreciation expense of
$2.0 million
is included in selling, general and administrative expense for the year ended
December 31, 2018
as opposed to
$1.2 million
included in cost of revenues for the year ended December 31, 2017.
49
The adoption of ASU 2014-09 did not require significant changes to the Company's internal controls and procedures over financial reporting and disclosures. However, we have made enhancements to existing internal controls and procedures to ensure continued compliance with the disclosure requirements of the new standard.
In February 2016, the FASB established Topic 842,
Leases
(“Topic 842”), by issuing ASU 2016-02, which requires lessees to recognize leases on the balance sheet and disclose key information about leasing arrangements. Topic 842 was subsequently amended by ASU 2018-01,
Land Easement Practical Expedient for Transition to Topic 842
; ASU 2018-10,
Codification Improvements to Topic 842, Leases
; and ASU 2018-11,
Targeted Improvements
. The new standard establishes a right-of-use model (“ROU”) that requires a lessee to recognize a ROU asset and lease liability on the balance sheet for all leases with a term longer than 12 months. Leases will be classified as finance or operating, with classification affecting the pattern and classification of expense recognition in the statement of income.
The new standard was effective for the Company on January 1, 2019. A modified retrospective transition approach is required, applying the new standard to all leases existing at the date of initial application. An entity may choose to use either (1) its effective date or (2) the beginning of the earliest comparative period presented in the financial statements as its date of initial application. If an entity chooses the second option, the transition requirements for existing leases also apply to leases entered into between the date of initial application and the effective date. The entity must also recast its comparative period financial statements and provide the disclosures required by the new standard for the comparative periods. We adopted the new standard on January 1, 2019 and used the effective date as our date of initial application. Consequently, financial information will not be updated and the disclosures required under the new standard will not be provided for dates and periods before January 1, 2019.
The new standard provides a number of optional practical expedients in transition. We elected the “package of practical expedients”, which permits us not to reassess under the new standard our prior conclusions about lease identification, lease classification and initial direct costs. We did not elect the use-of-hindsight or the practical expedient pertaining to land easements, the latter not being applicable to us. The new standard also provides practical expedients for an entity’s ongoing accounting. We elected the short-term lease recognition exemption for all leases that qualify. This means, for those leases that qualify, we will not recognize ROU assets or lease liabilities, and this includes not recognizing ROU assets or lease liabilities for existing short-term leases of those assets in transition. We also elected the practical expedient to not separate lease and non-lease components for all of our leases.
The adoption of this standard did not have a material effect on our consolidated financial statements and related disclosures. We believe the most significant effects relate to (1) the recognition of new ROU assets and lease liabilities on our consolidated balance sheet for our office operating leases and (2) providing new disclosures about our leasing activities. There was no change in our leasing activities as a result of adoption.
Upon adoption, we recognized additional operating liabilities of approximately
$4.2 million
, with corresponding ROU assets of the same amount based on the present value of the remaining minimum rental payments under current leasing standards for existing operating leases.
In August 2016, the FASB issued ASU 2016-15,
Statement of Cash Flows (Topic 230): Classification of Certain Cash Receipts and Cash Payments
, which reduces the existing diversity in practice in financial reporting across all industries by clarifying certain existing principles including providing additional guidance on what an entity should consider in determining the classification of certain cash receipts and payments. This standard was adopted by the Company as of January 1, 2018. The adoption of this standard did not have a material effect on the Company's consolidated financial statements and related disclosures.
In November 2016, the FASB issued ASU 2016-18, S
tatement of Cash Flows (Topic 230): Restricted Cash (a consensus of the FASB Emerging Issues Task Force)
, which requires restricted cash to be included with cash and cash equivalents when reconciling the beginning and ending amounts on the statement of cash flows. This standard is effective for the Company beginning January 1, 2018, and is to be applied using a retrospective transition method. The Company elected to early adopt this standard during January 2017, and the standard was applied retrospectively for all periods presented. As a result of the adoption of this standard, the Company no longer presents the change in restricted cash in the operating activities section of the consolidated statement of cash flows. Prior period amounts have been reclassified to conform to the current period presentation. Such reclassifications had no impact on previously reported operating results or financial position.
In January 2017, the FASB issued ASU 2017-01,
Business Combinations (Topic 805): Clarifying the Definition of a Business
. The standard provides a more robust framework for determining whether transactions should be accounted for as
50
acquisitions or dispositions of assets or businesses. This standard was effective for the Company beginning January 1, 2018. The adoption of this standard did not have a material effect on the Company’s consolidated financial statements and related disclosures.
In January 2017, the FASB issued ASU 2017-04,
Intangibles-Goodwill and Other (Topic 350): Simplifying the Test for Goodwill Impairment
(“ASU 2017-04”), which removes Step 2 of the goodwill impairment test. A goodwill impairment will now be determined by the amount by which a reporting unit’s carrying value exceeds its fair value, not to exceed the carrying amount of goodwill. ASU 2017-04 is effective for annual reporting periods, and interim periods therein, beginning after December 15, 2019, with early adoption permitted. The Company does not expect the adoption of ASU 2017-04 to have a material impact on the Company’s consolidated financial statements.
In May 2017, the FASB issued ASU 2017-09,
Compensation—Stock Compensation (Topic 718): Scope of Modification Accounting
(“ASU 2017-09”), which amends the scope of modification accounting for share-based payment arrangements. The standard provides guidance on the types of changes to the terms or conditions of share-based payment awards to which an entity would be required to apply modification accounting under ASU 2017-09. Specifically, an entity would not apply modification accounting if the fair value, vesting conditions, and classification of the awards are the same immediately before and after the modification. This standard was effective for the Company beginning January 1, 2018. The adoption of this standard did not have a material effect on the Company's consolidated financial statements and related disclosures.
2. BUSINESS COMBINATION
On April 26, 2018 (the “Acquisition Date”), following a series of transactions, the Company acquired substantially all of the assets and assumed certain liabilities of GHO Homes Corporation and its affiliates (“GHO”) through a newly formed subsidiary, GRBK GHO Homes, LLC (“GRBK GHO”), in which the Company holds an
80%
controlling interest. The owner of GHO contributed
$8.3 million
of net assets to GRBK GHO in an exchange for a
20%
interest in GRBK GHO. The minority partner of GRBK GHO serves as the president of GRBK GHO.
GRBK GHO operates primarily in the Vero Beach, Florida market and is engaged in land and lot development, as well as all aspects of the homebuilding process. The acquisition allowed the Company to expand its operations into a new geographic market.
The Company consolidates the financial statements of GRBK GHO as the Company owns
80%
of the outstanding voting shares of the builder. The noncontrolling interest attributable to the
20%
minority interest owned by our Florida-based partner is included as redeemable noncontrolling interest in equity of consolidated subsidiary in the Company’s consolidated financial statements.
The original consideration of
$42.2 million
consisted of
$33.2 million
in cash paid by the Company to the owner of GHO,
$8.3 million
of assets contributed by the owner of GHO, and an estimated
$0.6 million
of contingent consideration. Following completion of the audit of the balance sheet of GHO as of the Acquisition Date, the purchase price was adjusted by
$2.0 million
that was contributed by the Company in cash, and the value of contributed assets from the minority partner was increased by
$0.5 million
. Contingent consideration was adjusted to
$0.5 million
based on finalization of valuation procedures. Thus, the final total consideration was
$44.6 million
. Total consideration for the Company’s
80%
interest in GRBK GHO was
$35.8 million
.
Under the terms of the purchase agreement, the Company is obligated to pay the contingent consideration to the minority partner if an annual performance target is met over the
three
-year period following the Acquisition Date. The contingent consideration amounts are not contractually limited.
In accordance with ASC 805, all material assets and liabilities, including contingent consideration, were measured and recognized at fair value as of the date of the acquisition to reflect the purchase price.
51
The following is a summary of fair value of assets acquired and liabilities assumed (in thousands):
|
Assets acquired
|
|
|
|
|
Cash
|
$
|
8,399
|
|
|
Inventory
|
45,005
|
|
|
|
Property and equipment
|
1,462
|
|
|
|
Intangible assets - trade name
|
850
|
|
|
|
Intangible assets - home construction contracts
|
290
|
|
|
|
Goodwill
(1)
|
680
|
|
|
|
Other assets
|
898
|
|
|
|
Total assets
|
$
|
57,584
|
|
|
Liabilities assumed
|
|
||
|
Note payable
|
$
|
300
|
|
|
Accrued expenses and other liabilities
|
5,486
|
|
|
|
Customer deposits
|
9,073
|
|
|
|
Total liabilities
|
$
|
14,859
|
|
|
Redeemable noncontrolling interest
|
$
|
6,951
|
|
|
Net assets acquired
(2)
|
$
|
35,774
|
|
|
(1)
|
Goodwill is expected to be fully deductible for tax purposes.
|
|
(2)
|
Contingent consideration of
$0.5 million
is included in the fair value of net assets acquired.
|
The final purchase price allocation reflected above is based upon estimates and assumptions. The Company engaged a valuation firm to assist in the allocation of the purchase price, and valuation procedures related to the acquired assets and assumed liabilities have been completed. The estimated cash flows and ultimate valuation have been significantly affected by estimated discount rates, estimates related to expected average selling prices and sales incentives, expected sales pace and cancellation rates, expected land development and construction timelines, and anticipated land development, construction, and overhead costs and may vary significantly between communities.
The valuation of redeemable noncontrolling interest is based on a market approach, considering the equity contribution made by the
20%
partner, adjusted for control and marketability factors.
Acquired inventory consists of both land under development and work in process inventory, as well as completed homes held for sale. The estimated fair value of real estate inventory was determined on a community-by-community basis, primarily using the income approach which derives a value using a discounted cash flow for income-producing real property. The values of work in process and completed home inventory were estimated based upon the stage of production of each unit and a gross margin that we believe a market participant would require to complete the remaining construction and sales and marketing efforts through the sale of the homes. The stage of production, as of the acquisition date, ranged from recently started lots to fully completed homes. A sales comparison approach was used for land for which significant lot development had not yet begun as of the Acquisition Date. An income approach was also utilized to value mechanic’s lien home construction contracts acquired.
The estimated fair values of the acquired trade name, GHO Homes, and the home construction contracts, were determined using the relief-from-royalty method under the income approach, which involved assumptions related to revenue growth, market awareness and useful life.
The amortization of the acquired intangible assets of
$0.2 million
for the period from April 26, 2018 through
December 31, 2018
was recorded in selling, general and administrative expense in the consolidated statements of income. The accumulated amortization of the acquired intangible assets as of
December 31, 2018
was
$0.2 million
.
52
The estimated amortization expense related to acquired intangible assets for each of the next five years as of
December 31, 2018
is as follows (in thousands):
|
2019
|
$
|
149
|
|
|
2020
|
85
|
|
|
|
2021
|
85
|
|
|
|
2022
|
85
|
|
|
|
2023
|
85
|
|
|
|
Total
|
$
|
489
|
|
The allocation to goodwill represents the excess of the purchase price, including contingent consideration, over the estimated fair value of assets acquired and liabilities assumed. Goodwill results primarily from operational synergies expected from the business combination.
The Company performed its annual goodwill impairment test during the fourth quarter of
2018
by completing a qualitative assessment in accordance with ASC 350. The Company determined that it was not more likely than not that the reporting unit’s estimated fair value was more than its carrying value and, therefore, the two-step goodwill impairment test was unnecessary. The Company did not record any goodwill impairment during the year ended
December 31, 2018
.
GRBK GHO’s results of operations, which include homebuilding revenues of
$57.8 million
and income before tax of
$4.7 million
, are included in the accompanying consolidated statements of income for the period from April 26, 2018 through
December 31, 2018
.
The performance targets specified in the purchase agreement were met for the period from April 26, 2018 through
December 31, 2018
, and contingent consideration of
$1.8 million
was earned by the minority partner. Estimates of the undiscounted contingent consideration payouts for the period from January 1, 2019 through April 26, 2021 range from $0.7 million to $1.7 million.
The supplemental pro forma information for revenue and earnings of the Company as though the business combination had occurred as of January 1, 2016 is impractical to provide due to the fact that consolidated reporting for the specific group of entities acquired had not existed prior to the acquisition.
As of
December 31, 2018
, we had incurred transaction costs of
$0.5 million
related to the business combination, which have been expensed as incurred and are included in selling, general and administrative expense.
3. VARIABLE INTEREST ENTITIES
Consolidated VIEs
The Dallas and Atlanta-based controlled builders in which the Company owns a
50%
equity interest are deemed to be VIEs for which the Company is considered the primary beneficiary. We sell finished lots or option lots from third-party developers to the Dallas and Atlanta-based controlled builders for their homebuilding operations and provide the controlled builders with construction financing and strategic planning. The board of managers of each of the controlled builders has the power to direct the activities that significantly impact the controlled builder’s economic performance. Pursuant to the Company’s agreements with the controlled builders, it has the ability to appoint
two
of the
three
members to the controlled builder’s board of managers. A majority of the board of managers constitutes a quorum to transact business. No action can be approved by the board of managers without the approval from at least
one
individual whom the Company has appointed at the controlled builder.
The Company has the ability to control the activities of each controlled builder that most significantly impact the controlled builder’s economic performance. Such activities include, but are not limited to, involvement in the day to day capital and operating decisions, the ability to determine the budget and plan, the ability to control financing decisions, and the ability to acquire additional land or dispose of land. In addition, the Company has the right to receive the expected residual returns and obligation to absorb the expected losses of each controlled builder through the pro rata profits and losses we are allocated based on our ownership interest. Therefore, the financial statements of the Dallas and Atlanta-based controlled builders are consolidated in the Company’s consolidated financial statements following the variable interest model. The noncontrolling interests attributable to the 50% minority interests owned by the Dallas and Atlanta-based controlled builders are included as noncontrolling interests in the Company’s consolidated financial statements.
53
Our controlled builders’ creditors have no recourse against us. The assets of two of our consolidated controlled builders can only be used to settle obligations of those controlled builders. The assets of our VIEs that can be used only to settle obligations of the VIEs as of
December 31, 2018
totaled
$76.3 million
, of which
$0.7 million
was cash and
$66.6 million
was inventory. The assets of our VIEs that could be used only to settle obligations of the VIEs as of
December 31, 2017
totaled
$56.1 million
, of which
$0.9 million
was cash and
$47.8 million
was inventory.
Unconsolidated VIEs
The Company evaluates all option contracts to purchase land and lots to determine whether they are VIEs and, if so, whether the Company is the primary beneficiary of counterparts of these option contracts. Although the Company does not have legal title to the optioned land or lots, if the Company is deemed to be the primary beneficiary of or makes a significant deposit for optioned land or lots, it may need to consolidate the land or lots under option at the purchase price of the optioned land or lots.
As of
December 31, 2018
and
2017
, the Company’s exposure to loss related to its option contracts with third parties primarily consisted of its non-refundable option deposits. Following VIE evaluation, it was concluded that the Company was not the primary beneficiary in any of the VIEs related to land or lot option contracts as of
December 31, 2018
and
2017
.
4. INVENTORY
A summary of inventory is as follows (in thousands):
|
December 31, 2018
|
December 31, 2017
|
||||||
|
Homes completed or under construction
|
$
|
268,763
|
|
$
|
170,071
|
|
|
|
Land and lots - developed and under development
|
399,809
|
|
322,153
|
|
|||
|
Land held for sale
|
389
|
|
3,830
|
|
|||
|
Total inventory
|
$
|
668,961
|
|
$
|
496,054
|
|
|
A summary of interest costs incurred, capitalized and expensed is as follows (in thousands):
|
Years Ended December 31,
|
|||||||||||
|
2018
|
2017
|
2016
|
|||||||||
|
Interest capitalized at beginning of year
|
$
|
10,474
|
|
$
|
9,417
|
|
$
|
9,085
|
|
||
|
Interest incurred
|
9,003
|
|
4,456
|
|
3,218
|
|
|||||
|
Interest charged to cost of revenues
|
(4,697
|
)
|
(3,399
|
)
|
(2,886
|
)
|
|||||
|
Interest capitalized at end of year
|
$
|
14,780
|
|
$
|
10,474
|
|
$
|
9,417
|
|
||
For the years ended
December 31, 2018
and
2017
, the Company recorded impairment of
$0.1 million
and
$0.1 million
, respectively, related to real estate inventory in our builder operations segments. The recorded impairment is included in cost of residential units in our consolidated statements of income. The Company did not note any indicators of impairment for any projects, and
no
impairment adjustments related to real estate inventory were recorded for the year ended
December 31, 2016
.
5. INVESTMENTS IN UNCONSOLIDATED ENTITIES
Challenger
On
August 15, 2017
, the Company, JBGL Ownership LLC, a Delaware limited liability company and a wholly owned subsidiary of the Company (“JBGL”), and GB Challenger, LLC, a newly formed Texas limited liability company (“Challenger”) entered into a Membership Interest Purchase and Contribution Agreement (the “Challenger Agreement”) with The Challenger Group, Inc., a Wyoming corporation (“TCGI”), and certain of its affiliates (the “Challenger Entities”) and Brian R. Bahr (“Bahr”), resulting in the Company, through its interest in JBGL, and the Challenger Entities owning a
49.9%
and
50.1%
ownership interest, respectively, in Challenger, and Challenger owning all of the membership and ownership interests in the subsidiaries of the Challenger Entities named in the Challenger Agreement. As consideration for such interests, the Company agreed to issue to the Challenger Entities, or their designees,
1,497,000
shares of its common stock, par value
$0.01
per share, in a private placement, with
20,000
shares of its common stock held back pending satisfactory resolution of indemnification claims (“Holdback Shares”). On
March 16, 2018
, the Company issued the Holdback Shares; therefore,
$0.2 million
was recorded in additional paid-in capital on the consolidated balance sheet as of December 31, 2017. The Challenger
54
Entities, at their discretion, may offer to sell and transfer an additional
20.1%
or, in certain circumstances, all of the Challenger Entities’ interest in Challenger (“Additional Membership Interests”) to the Company on or after the
third
anniversary of the Challenger Agreement. The Company is not required to purchase the Additional Membership Interests. The Company incurred
$0.3 million
in related acquisition costs during the year ended
December 31, 2017
which are included in the cost basis of investment in the unconsolidated entity.
The Challenger Entities operate homebuilding operations under the name Challenger Homes. Challenger constructs townhouses, single family homes and luxury patio homes, and is located in Colorado Springs, Colorado. The Company partnered with Challenger in order to expand its business with partners that are complementary to its current builder partner group and to gain a presence in the Colorado Springs market.
The issuance of the common stock by the Company related to the investment in Challenger was exempt from registration pursuant to Section 4(a)(2) of the Securities Act of 1933, as amended, and the safe harbor provided by Rule 506 promulgated thereunder. The Company relied, in part, upon representations from each of the individuals that they are “accredited investors” as such term is defined in Rule 501 of Regulation D.
The Company’s investment in Challenger at
August 15, 2017
of
$15.1 million
was more than its share of the estimated underlying net assets of Challenger, resulting in a preliminary difference in basis of
$5.1 million
, which was attributed to inventory and intangible assets. The Company’s investment in Challenger on
August 15, 2017
was determined as follows (in thousands, except per share data):
|
Consideration transferred at closing
|
|||
|
Green Brick common stock issued
|
1,477
|
|
|
|
Price per share of Green Brick common stock
(1)
|
$
|
9.90
|
|
|
Fair value of common stock consideration
|
$
|
14,622
|
|
|
Acquisition related costs
|
$
|
241
|
|
|
Total fair value of consideration transferred at closing
|
$
|
14,863
|
|
|
Subsequent consideration
|
|||
|
Holdback Shares
|
20
|
|
|
|
Price per share of Green Brick common stock
(1)
|
$
|
9.90
|
|
|
Total fair value of subsequent consideration
|
$
|
198
|
|
|
Total fair value of consideration
|
$
|
15,061
|
|
|
(1)
|
Based upon closing price of the Company’s common stock upon the parties’ execution of the Challenger Agreement.
|
The Company holds
two
of the
five
board of managers (the “Managers”) seats of Challenger. Challenger’s
six
officers, employees of the Challenger Entities, were designated by the Managers for the purpose of managing the day to day operations. The Company does not have a controlling financial interest in Challenger as the Company has less than
50%
of the voting interests in Challenger. The Company’s investment in Challenger is treated as an unconsolidated investment under the equity method of accounting and is included in investments in unconsolidated entities in the Company’s consolidated balance sheets.
The Company’s investment in Challenger is carried at cost, as adjusted for the Company’s share of income or losses and distributions received, as well as for adjustments related to basis differences between the Company’s cost and the Company’s underlying equity in net assets recorded in Challenger’s financial statements as of the date of acquisition.
As of
December 31, 2018
, the carrying value of the investment in Challenger was
$19.5 million
, whereas the underlying
49.9%
equity in net assets of Challenger was
$15.0 million
. The
$4.5 million
difference represents the premium paid for the Company’s equity interest in excess of Challenger’s carrying value. This basis difference primarily relates to the estimated fair value of inventory, as well as the Challenger Homes trade name and capitalized acquisition costs. The amortization of the basis differences related to inventory is recorded as a reduction of equity in income of unconsolidated entities as homes are closed on and delivered to homebuyers. The basis difference related to the trade name is amortized over ten years as a reduction of equity in income of unconsolidated entities.
55
The Company recognized
$7.0 million
and
$2.7 million
related to Challenger in equity in income of unconsolidated entities during the years ended
December 31, 2018
and
2017
, respectively.
Providence Title
In March 2018, the Company formed a joint venture with a title company in Georgia to provide title closing and settlement services to our Atlanta-based builder. The Company, through its controlled builder, The Providence Group of Georgia, L.L.C. (“TPG”), owns a
49%
equity interest in Providence Group Title, LLC (“Providence Title”).
Green Brick Mortgage
In June 2018, the Company formed a joint venture with PrimeLending to provide mortgage loan origination services to our builders. The Company owns a
49%
equity interest in Green Brick Mortgage, LLC (“Green Brick Mortgage”) which initiated mortgage loan origination activities in September 2018.
A summary of the financial information of the unconsolidated entities that are accounted for by the equity method is as follows (in thousands):
|
December 31, 2018
|
|
December 31, 2017
|
|||||
|
Assets:
|
|
|
|
|
|
||
|
Cash
|
$
|
14,584
|
|
|
$
|
3,981
|
|
|
Accounts receivable
|
1,259
|
|
|
1,494
|
|
||
|
Bonds and notes receivable
|
5,864
|
|
|
2,850
|
|
||
|
Loans held for sale, at fair value
|
3,083
|
|
|
—
|
|
||
|
Inventory
|
44,375
|
|
|
57,841
|
|
||
|
Other assets
|
3,132
|
|
|
2,248
|
|
||
|
Total assets
|
$
|
72,297
|
|
|
$
|
68,414
|
|
|
Liabilities:
|
|
|
|
|
|
||
|
Accounts payable
|
$
|
2,173
|
|
|
$
|
5,060
|
|
|
Accrued expenses and other liabilities
|
5,328
|
|
|
2,857
|
|
||
|
Notes payable
|
31,402
|
|
|
36,923
|
|
||
|
Total liabilities
|
$
|
38,903
|
|
|
$
|
44,840
|
|
|
Owners’ equity:
|
|
|
|
|
|
||
|
Green Brick
|
$
|
15,653
|
|
|
$
|
11,763
|
|
|
Others
|
17,741
|
|
|
11,811
|
|
||
|
Total owners’ equity
|
$
|
33,394
|
|
|
$
|
23,574
|
|
|
Total liabilities and owners’ equity
|
$
|
72,297
|
|
|
$
|
68,414
|
|
|
Year Ended December 31, 2018
|
Year Ended December 31, 2017
|
||||||
|
Revenues
|
$
|
166,102
|
|
|
$
|
58,958
|
|
|
Costs and expenses
|
148,222
|
|
|
44,969
|
|
||
|
Net earnings of unconsolidated entities
|
$
|
17,880
|
|
|
$
|
13,989
|
|
|
Company’s share in net earnings of unconsolidated entities
|
$
|
7,259
|
|
|
$
|
2,746
|
|
During
the years ended
December 31, 2018
and
2017
, the Company did not identify indicators of impairment for its investments in unconsolidated entities.
56
6. PROPERTY AND EQUIPMENT
The following is a summary of property and equipment by major classification and related accumulated depreciation as of
December 31, 2018
and
2017
(in thousands):
|
December 31, 2018
|
December 31, 2017
|
||||||
|
Land
|
$
|
763
|
|
|
$
|
—
|
|
|
Building
|
82
|
|
|
—
|
|
||
|
Model home furnishings and capitalized sales office costs
|
5,218
|
|
|
—
|
|
||
|
Office furniture and equipment
|
427
|
|
|
399
|
|
||
|
Leasehold improvements
|
1,692
|
|
|
741
|
|
||
|
Computers and equipment
|
901
|
|
|
903
|
|
||
|
Vehicles and field trailers
|
279
|
|
|
10
|
|
||
|
9,362
|
|
2,053
|
|
||||
|
Less: Accumulated depreciation
|
(4,672
|
)
|
(1,249
|
)
|
|||
|
Total property and equipment, net
|
$
|
4,690
|
|
$
|
804
|
|
|
Depreciation expense for the years ended
December 31, 2018
,
2017
and
2016
totaled
$2.7 million
,
$0.3 million
, and
$0.3 million
, respectively, and is included in selling, general and administrative expense in our consolidated statements of income.
7. DEBT
Lines of Credit
Borrowings on lines of credit outstanding, net of debt issuance costs, as of
December 31, 2018
and
2017
consist of the following (in thousands):
|
December 31, 2018
|
December 31, 2017
|
||||||
|
Revolving credit facility
|
$
|
46,500
|
|
$
|
32,000
|
|
|
|
Unsecured revolving credit facility
|
155,500
|
|
75,000
|
|
|||
|
Debt issuance costs, net of amortization
|
(1,614
|
)
|
(1,227
|
)
|
|||
|
Total borrowings on lines of credit, net
|
$
|
200,386
|
|
$
|
105,773
|
|
|
Revolving Credit Facility
On July 30, 2015, the Company entered into a revolving credit facility (the “Credit Facility”) with Inwood National Bank, which initially provided for up to
$50.0 million
. Amounts outstanding under the Credit Facility are secured by mortgages on real property and security interests in certain personal property (to the extent that such personal property is connected with the use and enjoyment of the real property) that is owned by certain of the Company’s subsidiaries.
The entire unpaid principal balance and any accrued but unpaid interest is due and payable on the maturity date. Following several amendments, as of
December 31, 2018
, the aggregate commitment amount was
$75.0 million
and the maturity date of the Credit Facility was
May 1, 2022
.
As of
December 31, 2018
, letters of credit outstanding totaling
$1.9 million
reduced the aggregate maximum commitment amount to
$73.1 million
.
As of
December 31, 2018
, outstanding borrowings under the amended Credit Facility bear interest payable monthly at a floating rate per annum equal to the rate announced by Bank of America, N.A., from time to time, as its “Prime Rate” (the “Index”) with such adjustments to the interest rate being made on the effective date of any change in the Index, less 0.25%. Notwithstanding the foregoing, the interest may not, at any time, be less than
4%
per annum or more than the lesser amount of
18%
and the highest maximum rate allowed by applicable law. As of
December 31, 2018
, the interest rate on outstanding borrowings under the Credit Facility was
5.25%
per annum.
57
As of
December 31, 2018
, the amended Credit Facility was subject to a borrowing base limitation equal to the sum of
50%
of the total value of land and
65%
of the total value of lots owned by certain of the Company’s subsidiaries, each as determined by an independent appraiser, with the value of land being restricted from being more than
65%
of the borrowing base.
As of
December 31, 2018
, the amended Credit Facility was also subject to a non-usage fee equal to
0.25%
of the average unfunded amount of the commitment amount over a trailing 12 month period.
Under the terms of the amended Credit Facility, the Company is required, among other things, to maintain minimum multiples of tangible net worth in excess of the outstanding Credit Facility balance, minimum interest coverage and maximum leverage. Management is not aware of any violations of these financial covenants under the Credit Facility as of
December 31, 2018
.
Fees and other debt issuance costs of
$0.0 million
,
$0.2 million
and
$0.0 million
were incurred during the years ended
December 31, 2018
,
2017
and
2016
, respectively, associated with the Credit Facility amendments. These costs are deferred and reduce the carrying amount of debt in our consolidated balance sheets. The Company capitalizes these costs to inventory over the term of the Credit Facility using the straight-line method.
Unsecured Revolving Credit Facility
On December 15, 2015, the Company entered into a credit agreement (the “Credit Agreement”) with Citibank, N.A. and Credit Suisse AG, Cayman Islands Branch (“Credit Suisse”) as lenders, and Citibank, N.A. as administrative agent, providing for a senior, unsecured revolving credit facility with initial aggregate lending commitments of up to
$40.0 million
(the “Unsecured Revolving Credit Facility”).
The Unsecured Revolving Credit Facility provides for interest rate options on advances at rates equal to either: (a) in the case of base rate advances, the highest of (i) Citibank’s base rate, (ii) the federal funds rate plus
0.5%
, and (iii) the one-month LIBOR plus
1.0%
, in each case plus
1.5%
; or (b) in the case of Eurodollar rate advances, the reserve adjusted LIBOR plus
2.5%
. Interest on amounts borrowed under the Unsecured Revolving Credit Facility is payable in arrears on a monthly basis. As of
December 31, 2018
, the interest rates on outstanding borrowings under the Unsecured Revolving Credit Facility ranged from
4.89%
to
5.01%
per annum.
The Company pays the lenders a commitment fee on the amount of the unused commitments on a quarterly basis at a rate per annum equal to
0.45%
.
Outstanding borrowings under the Unsecured Revolving Credit Facility are subject to, among other things, a borrowing base. The borrowing base limitation is equal to the sum of:
100%
of unrestricted cash in excess of
$15.0 million
;
85%
of the book value of model homes, construction in progress homes, completed sold and speculative homes (subject to certain limitations on the age and number of speculative homes and model homes);
65%
of the book value of finished lots and land under development; and
50%
of the book value of entitled land (subject to certain limitations on the value of entitled land and land under development as a percentage of the borrowing base).
Following amendments to the Credit Agreement and the addition of Flagstar Bank, FSB (“Flagstar Bank”), JPMorgan Chase Bank, N.A. (“JPMorgan”) and Chemical Financial Corporation (“Chemical”) as lenders, the aggregate lending commitment available under the Unsecured Revolving Credit Facility as of
December 31, 2018
was
$215.0 million
, the maximum aggregate amount of the Unsecured Revolving Credit Facility was
$275.0 million
, and the termination date with respect to commitments under the Unsecured Revolving Credit Facility was
December 14, 2021
.
Fees and other debt issuance costs of
$0.9 million
,
$0.7 million
and
$0.3 million
were incurred during the years ended
December 31, 2018
,
2017
and
2016
, respectively, associated with the amendments, term extensions and increases in lenders’ commitments. These costs are deferred and reduce the carrying amount of debt in our consolidated balance sheets. The Company capitalizes these costs to inventory over the term of the Unsecured Revolving Credit Facility using the straight-line method.
Under the terms of the Unsecured Revolving Credit Facility, the Company is required to maintain compliance with various financial covenants, including a maximum leverage ratio, a minimum interest coverage ratio, and a minimum consolidated tangible net worth. Management is not aware of any violations of these financial covenants under the Unsecured Revolving Credit Facility as of
December 31, 2018
.
58
Notes Payable
Notes payable to unrelated third parties outstanding as of
December 31, 2018
and
2017
consist of the following (in thousands):
|
December 31, 2018
|
December 31, 2017
|
||||||
|
Briar Ridge Investments, LTD
|
$
|
—
|
|
$
|
9,000
|
|
|
|
Graham Mortgage Corporation
|
—
|
|
926
|
|
|||
|
Total notes payable
|
$
|
—
|
|
$
|
9,926
|
|
|
Briar Ridge Investments, LTD
On December 13, 2013, a subsidiary of the Company signed a promissory note for
$9.0 million
maturing on December 13, 2017, bearing interest at
6.0%
collateralized by land purchased in Allen, Texas. In December 2016, the note was extended through December 31, 2018. The note was paid in full on June 5, 2018.
Graham Mortgage Corporation
On November 30, 2016, a subsidiary of the Company signed a promissory note for
$1.2 million
maturing on December 1, 2018, bearing interest at
3.0%
per annum and collateralized by land located in Sunnyvale, Texas. The note was paid in full on December 3, 2018.
The annual principal payments over the next five years under the lines of credit as of
December 31, 2018
are (in thousands):
|
2019
|
$
|
—
|
|
|
2020
|
—
|
|
|
|
2021
|
155,500
|
|
|
|
2022
|
46,500
|
|
|
|
Total
|
$
|
202,000
|
|
8. STOCKHOLDERS’ EQUITY
Common Stock
Pursuant to the Company’s amended and restated certificate of incorporation (“Certificate of Incorporation”), the Company is authorized to issue up to
100,000,000
shares of common stock, par value
$0.01
per share. As of
December 31, 2018
, there were
50,719,884
shares of common stock issued and
50,583,128
outstanding.
On
March 16, 2018
,
20,000
shares of common stock were issued as additional consideration for the investment in Challenger upon resolution of terms for such holdback shares.
Preferred Stock
Pursuant to the Company’s Certificate of Incorporation, the Company is authorized to issue up to
5,000,000
shares of preferred stock, par value
$0.01
per share. The Board of Directors (the “BOD”) has the authority, subject to any limitations imposed by law or Nasdaq rules, without further action by the stockholders, to issue such preferred stock in one or more series and to fix the voting powers (if any), the preferences and relative, participating, optional or other special rights or privileges, if any, of such series and the qualifications, limitations or restrictions thereof. These rights, preferences and privileges may include, but are not limited to, dividend rights, conversion rights, voting rights, terms of redemption, liquidation preferences, sinking fund terms and the number of shares constituting any series or the designation of that series. As of
December 31, 2018
, there were
no
shares of preferred stock issued and outstanding.
Share Repurchase Programs
In March 2016, the Company’s BOD authorized a share repurchase program of up to
1,000,000
shares of its common stock through 2017. The share repurchase program expired in 2017.
No
shares were repurchased during the years ended
December 31, 2017
and
2016
.
59
In October 2018, the Company’s BOD
authorized a share repurchase program for the period beginning on October 3, 2018 and ending on October 3, 2020 of the Company’s common stock for an aggregate price not to exceed $30.0 million. The timing, volume and nature of share repurchases are at the discretion of management and dependent on market conditions, corporate and regulatory requirements, available cash and other factors, and may be suspended or discontinued at any time. Authorized repurchases may be made from time to time in the open market, through block trades or in privately negotiated transactions. No assurance can be given that any particular amount of common stock will be repurchased. All or part of the repurchases may be implemented under a trading plan under Rule 10b5-1 or Rule 10b-18 established by the SEC, which would allow repurchases under pre-set terms at times when the Company might otherwise be prevented from doing so under insider trading laws or because of self-imposed blackout periods. This repurchase program may be modified, extended or terminated by the BOD at any time. The Company intends to finance any repurchases with available cash and proceeds from borrowings under lines of credit.
In December 2018, the Company repurchased
136,756
shares for approximately
$1.0 million
.
On December 31, 2018, the Company’s BOD authorized implementation of share repurchases in accordance with a trading plan under Rule 10b5-1, which allows for repurchases under pre-set terms at times when the Company might otherwise be prevented from doing so under insider trading laws or because of self-imposed blackout periods. The plan’s commencement date is January 2, 2019, and the termination date is March 30, 2019. The plan may be terminated at any time.
Section 382 Transfer Restrictions
If the Company were to experience an ownership change, Section 382 of the Internal Revenue Code imposes an annual limitation which could impact the utilization of our net operating loss carryforwards. To reduce the likelihood of such an ownership change, the BOD implemented certain transfer restrictions, including Article V of the Company’s Certificate of Incorporation, and a Section 382 rights agreement regarding preservation of our net operating loss carryforwards. On March 27, 2014, the BOD declared a dividend of
one
preferred share purchase right, with respect to each outstanding share of common stock of the Company, to purchase from the Company
one one-thousandth
of a share of Series B Junior Participating Preferred Stock, par value
$0.01
per share, of the Company at a price of
$30.00
per
one one-thousandth
of a share of preferred stock, subject to adjustment as provided in the Section 382 rights agreement. The dividend was payable to stockholders of record at the close of business on April 7, 2014. As of
December 31, 2018
, the rights agreement has not been triggered.
Redeemable Noncontrolling Interest in Equity of Consolidated Subsidiary
As part of the GRBK GHO business combination, we entered into a put/call agreement (“Put/Call Agreement”) with respect to the equity interest in the joint venture held by the minority partner. The Put/Call Agreement provides that the 20% ownership interest in GRBK GHO held by the minority partner is subject to put and purchase options starting in April 2021. The exercise price is based on the financial results of GRBK GHO for the three years prior to exercise of the option. If the minority partner does not exercise the put option, we have the option, but not the obligation, to buy the 20% interest in GRBK GHO from our partner.
Based on the nature of the put/call structure, the minority partner’s interest in GRBK GHO is classified as redeemable noncontrolling interest on the consolidated balance sheets.
The following table shows the changes in redeemable noncontrolling interest in equity of consolidated subsidiary during the period April 26, 2018 to
December 31, 2018
(in thousands):
|
Balance at beginning of period
|
$
|
6,346
|
|
|
Purchase accounting adjustment
|
605
|
|
|
|
Adjusted balance at beginning of period
|
6,951
|
|
|
|
Net income
|
1,580
|
|
|
|
Balance at end of period
|
$
|
8,531
|
|
9. SHARE-BASED COMPENSATION
2014 Omnibus Equity Incentive Plan
On October 17, 2014, the Company’s stockholders approved the Green Brick Partners, Inc. 2014 Omnibus Equity Incentive Plan (the “2014 Equity Plan”). The purpose of the 2014 Equity Plan is to provide a means for the Company to attract and retain key personnel and to provide a means whereby current and prospective directors, officers, employees, consultants
60
and advisors can acquire and maintain an equity interest in the Company, or be paid incentive compensation, which may (but need not) be measured by reference to the value of the Company’s common stock, thereby strengthening their commitment to the welfare of the Company and aligning their interests with those of the Company’s stockholders. The 2014 Equity Plan will terminate automatically on the
tenth anniversary
of the date it became effective.
No
awards will be granted under the 2014 Equity Plan after that date, but awards granted prior to that date may extend beyond that date.
Under the 2014 Equity Plan, awards of stock options, including both incentive stock options and nonqualified stock options, stock appreciation rights, restricted stock and restricted stock units, other share-based awards and performance compensation awards, may be granted. The maximum number of shares of the Company’s common stock that is authorized and reserved for issuance under the 2014 Equity Plan is
2,350,956
shares, subject to adjustment for certain corporate events or changes in the Company’s capital structure.
In general, the Company’s employees or those reasonably expected to become the Company’s employees, consultants and directors, are eligible for awards under the 2014 Equity Plan, provided that incentive stock options may be granted only to employees. The Company has
four
executive officers,
six
non-employee directors and approximately
390
other employees (including employees of our controlled builders) who are eligible to receive awards under the 2014 Equity Plan. Written agreements between the Company and each participant evidence the terms of each award granted under the 2014 Equity Plan.
If any award under the 2014 Equity Plan expires or otherwise terminates, in whole or in part, without having been exercised in full, the common stock withheld from issuance under that award will become available for future issuance under the plan. If shares issued under the 2014 Equity Plan are reacquired by the Company pursuant to the terms of any forfeiture provision, those shares will become available for future awards under the plan. Awards that can only be settled in cash will not be treated as shares of common stock granted for purposes of the 2014 Equity Plan. The maximum amount that can be paid to any single participant in any one calendar year pursuant to a cash bonus award under the 2014 Equity Plan is
$2.0 million
. As of
December 31, 2018
,
1,816,768
shares remain available for future grant of awards under the 2014 Equity Plan.
Share-Based Award Activity
During the year ended
December 31, 2018
, the Company granted restricted stock awards (“RSAs”) under the 2014 Equity Plan to Named Executive Officers (“NEOs”) and non-employee members of the BOD. The RSAs granted to NEOs were
100%
vested and non-forfeitable on the grant date. The BOD elected to defer up to
100%
of their annual retainer fee, chairman fees and meeting fees in the form of common stock. The RSAs granted to the BOD will become fully vested on the earlier of (i) the first anniversary of the date of grant of the shares of restricted common stock or (ii) the date of the Company’s 2019 Annual Meeting of Stockholders. The fair value of the RSAs granted to NEOs and non-employee members of the BOD were recorded as share-based compensation expense on the grant date and over the vesting period, respectively. The Company withheld
39,228
shares of common stock, at a total cost of
$0.4 million
, from NEOs to satisfy statutory minimum tax requirements in respect of the RSAs during the year ended
December 31, 2018
.
A summary of share-based awards activity during the years ended
December 31, 2018
,
2017
and
2016
is as follows:
|
Number of Shares (in thousands)
|
Weighted Average Grant Date Fair Value per Share
|
|||||
|
Nonvested, December 31, 2015
|
23
|
|
$
|
8.73
|
|
|
|
Granted
|
123
|
|
$
|
7.60
|
|
|
|
Vested
|
(108
|
)
|
$
|
7.87
|
|
|
|
Forfeited
|
—
|
|
$
|
—
|
|
|
|
Nonvested, December 31, 2016
|
38
|
|
$
|
7.51
|
|
|
|
Granted
|
229
|
|
$
|
10.11
|
|
|
|
Vested
|
(229
|
)
|
$
|
9.66
|
|
|
|
Forfeited
|
—
|
|
$
|
—
|
|
|
|
Nonvested, December 31, 2017
|
38
|
|
$
|
10.25
|
|
|
|
Granted
|
140
|
|
$
|
10.45
|
|
|
|
Vested
|
(144
|
)
|
$
|
10.03
|
|
|
|
Forfeited
|
—
|
|
$
|
—
|
|
|
|
Nonvested, December 31, 2018
|
34
|
|
$
|
12.00
|
|
|
61
Stock Options
Stock options granted to date were
not
granted under the 2014 Equity Plan. The stock options outstanding as of
December 31, 2018
generally vest and become exercisable in
five
substantially equal installments on each of the first
five
anniversaries of the grant date and expire
10
years after the date on which they were granted. Compensation expense related to these options is expensed on a straight-line basis over the
five
year service period. All of the stock options outstanding as of
December 31, 2018
are vested or expected to vest. We utilize the Black-Scholes option pricing model for estimating the grant date fair value of stock options. There were
no
stock options granted during the years ended
December 31, 2018
,
2017
and
2016
.
A summary of stock option activity during the year ended
December 31, 2018
is as follows:
|
Number of Shares (in thousands)
|
Weighted Average Exercise Price per Share
|
Weighted Average Remaining Contractual Term (in years)
|
Aggregate Intrinsic Value (in thousands)
|
|||||||||
|
Options outstanding, December 31, 2017
|
500
|
|
$
|
7.49
|
|
|||||||
|
Granted
|
—
|
|
—
|
|
||||||||
|
Exercised
|
—
|
|
—
|
|
||||||||
|
Forfeited
|
—
|
|
—
|
|
||||||||
|
Options outstanding, December 31, 2018
|
500
|
|
$
|
7.49
|
|
5.82
|
$
|
—
|
|
|||
|
Options exercisable, December 31, 2018
|
400
|
|
$
|
7.49
|
|
5.82
|
$
|
—
|
|
|||
A summary of unvested stock option activity during the year ended
December 31, 2018
is as follows:
|
Number of Shares (in thousands)
|
Weighted Average Per Share Grant Date Fair Value
|
|||||
|
Unvested, December 31, 2017
|
200
|
|
$
|
2.88
|
|
|
|
Granted
|
—
|
|
$
|
—
|
|
|
|
Vested
|
(100
|
)
|
$
|
2.88
|
|
|
|
Forfeited
|
—
|
|
$
|
—
|
|
|
|
Unvested, December 31, 2018
|
100
|
|
$
|
2.88
|
|
|
Share-Based Compensation Expense
Share-based compensation expense was
$1.8 million
,
$2.6 million
and
$1.3 million
for the years ended
December 31, 2018
,
2017
and
2016
, respectively. Recognized tax benefit related to share-based compensation expense was
$0.4 million
,
$0.6 million
and
$0.5 million
for the years ended
December 31, 2018
,
2017
and
2016
, respectively.
As of
December 31, 2018
, the estimated total remaining unamortized share-based compensation expense related to unvested restricted stock awards, net of forfeitures, was
$0.2 million
which is expected to be recognized over a weighted-average period of
0.4
years. As of
December 31, 2018
, the estimated total remaining unamortized share-based compensation expense related to stock options, net of forfeitures, was
$0.2 million
which is expected to be recognized over a weighted-average period of
0.8
years.
62
10. REVENUE RECOGNITION
Disaggregation of Revenue
The following reflects the disaggregation of revenue by primary geographic market, type of customer, product type, and timing of revenue recognition (in thousands):
|
Years Ended December 31,
|
|||||||||||||||||||||||
|
2018
|
2017
|
2016
|
|||||||||||||||||||||
|
Builder Operations
|
Land Development
|
Builder Operations
|
Land Development
|
Builder Operations
|
Land Development
|
||||||||||||||||||
|
Primary Geographic Market
|
|||||||||||||||||||||||
|
Central
|
$
|
281,868
|
|
$
|
40,184
|
|
$
|
224,670
|
|
$
|
17,928
|
|
$
|
206,831
|
|
|
$
|
14,201
|
|
||||
|
Southeast
|
297,025
|
|
4,570
|
|
214,850
|
|
802
|
|
168,990
|
|
|
963
|
|
||||||||||
|
Total revenues
|
$
|
578,893
|
|
$
|
44,754
|
|
$
|
439,520
|
|
$
|
18,730
|
|
$
|
375,821
|
|
|
$
|
15,164
|
|
||||
|
|
|
||||||||||||||||||||||
|
Type of Customer
|
|
|
|
||||||||||||||||||||
|
Homebuyers
|
$
|
578,893
|
|
$
|
—
|
|
$
|
439,520
|
|
$
|
—
|
|
$
|
375,821
|
|
|
$
|
—
|
|
||||
|
Homebuilders
|
—
|
|
44,754
|
|
—
|
|
18,730
|
|
—
|
|
|
15,164
|
|
||||||||||
|
Total revenues
|
$
|
578,893
|
|
$
|
44,754
|
|
$
|
439,520
|
|
$
|
18,730
|
|
$
|
375,821
|
|
|
$
|
15,164
|
|
||||
|
|
|
|
|||||||||||||||||||||
|
Product Type
|
|
|
|
||||||||||||||||||||
|
Residential units
|
$
|
578,893
|
|
$
|
—
|
|
$
|
439,520
|
|
$
|
—
|
|
$
|
375,821
|
|
|
$
|
—
|
|
||||
|
Land and lots
|
—
|
|
44,754
|
|
—
|
|
18,730
|
|
—
|
|
|
15,164
|
|
||||||||||
|
Total revenues
|
$
|
578,893
|
|
$
|
44,754
|
|
$
|
439,520
|
|
$
|
18,730
|
|
$
|
375,821
|
|
|
$
|
15,164
|
|
||||
|
|
|
|
|||||||||||||||||||||
|
Timing of Revenue Recognition
|
|
|
|
||||||||||||||||||||
|
Transferred at a point in time
|
$
|
571,177
|
|
$
|
44,754
|
|
$
|
435,644
|
|
$
|
18,730
|
|
$
|
365,164
|
|
|
$
|
15,164
|
|
||||
|
Transferred over time
|
7,716
|
|
|
—
|
|
|
3,876
|
|
|
—
|
|
|
10,657
|
|
|
—
|
|
||||||
|
Total revenues
|
$
|
578,893
|
|
$
|
44,754
|
|
$
|
439,520
|
|
$
|
18,730
|
|
$
|
375,821
|
|
|
$
|
15,164
|
|
||||
Revenue recognized over time represents revenue from mechanic’s lien contracts.
Contract Balances
Opening and closing contract balances included in customer and builder deposits on the consolidated balance sheets are as follows (in thousands):
|
December 31, 2018
|
December 31, 2017
|
||||||
|
Customer and builder deposits
|
$
|
31,978
|
|
|
$
|
21,447
|
|
The difference between the opening and closing balances of customer and builder deposits results from the timing difference between the customer’s payment of a deposit and the Company’s performance, impacted slightly by terminations of contracts.
The amount of deposits on residential units and land and lots held as of the beginning of the period and recognized as revenue during the years ended
December 31, 2018
and
2017
are as follows (in thousands):
|
2018
|
2017
|
||||||
|
Type of Customer
|
|
|
|
||||
|
Homebuyers
|
$
|
19,342
|
|
|
$
|
9,880
|
|
|
Homebuilders
|
1,806
|
|
|
1,619
|
|
||
|
Total deposits recognized as revenue
|
$
|
21,148
|
|
|
$
|
11,499
|
|
63
As a result of the GRBK GHO business combination, customer deposits from homebuyers in the amount of
$9.1 million
were acquired, of which
$8.2 million
was recognized during the period from April 26, 2018 through
December 31, 2018
.
Performance Obligations
There was
no
revenue recognized during the years ended
December 31, 2018
,
2017
and
2016
from performance obligations satisfied in prior periods.
Transaction Price Allocated to Remaining Performance Obligations
The aggregate amount of transaction price allocated to the remaining performance obligations on our land sale and lot option contracts is
$84.1 million
. The Company will recognize the remaining revenue when the lots are taken down, or upon closing for the sale of a land parcel, which is expected to occur as follows (in thousands):
|
2019
|
$
|
42,618
|
|
|
2020
|
29,126
|
|
|
|
2021
|
12,335
|
|
|
|
Total
|
$
|
84,079
|
|
The timing of lot takedowns is contingent upon a number of factors, including customer needs, the number of lots being purchased, receipt of acceptance of the plat by the municipality, weather-related delays, and agreed-upon lot takedown schedules.
Our contracts with homebuyers have a duration of less than one year. As such, the Company uses the practical expedient as allowed under ASC 606 and has not disclosed the transaction price allocated to remaining performance obligations as of the end of the reporting period.
11. SEGMENT INFORMATION
Prior to the third quarter of 2018, the Company’s operations were organized into
two
reportable segments: builder operations and land development. Builder operations consisted of
three
operating segments: Texas, Georgia and Florida. The operations of the Company’s controlled builders were aggregated into these
three
operating segments based on similar economic characteristics, including geography; housing products; class of homebuyer; regulatory environments; and methods used to construct and sell homes.
During the third quarter of 2018, the Company re-evaluated its reportable segments under ASC 280. The Company has further aggregated the Georgia and Florida operating segments into one reportable segment - Builder operations Southeast. The Texas operating segment was redefined as a second reportable segment - Builder operations Central. Land development is a separate reportable segment.
The Company believes such aggregation is consistent with the objective and basic principles of ASC 280 and provides the most meaningful information about the types of business activities in which the Company engages and the economic environments in which it operates.
Corporate operations are reported as a non-operating segment and include activities which support the Company’s builder operations, land development, title and mortgage operations through centralization of certain administrative functions, such as finance, treasury, information technology and human resources, as well as development of strategic initiatives. Unallocated corporate expenses are reported in the corporate and other segment as these activities do not share a majority of aggregation criteria with either the builder operations or land development segments.
While the operations of Challenger meet the criteria for an operating segment, they do not meet the quantitative thresholds of ASC 280 to be separately reported and disclosed. As such, Challenger’s results are included within the corporate and other segment.
Green Brick Title, LLC (“Green Brick Title”), Providence Title and Green Brick Mortgage operations are not economically similar to either builder operations or land development and do not meet the quantitative thresholds of ASC 280 to be separately reported and disclosed. As such, these entities’ results are included within the corporate and other segment.
64
Segment information for the years ended
December 31, 2017
and
2016
has been restated to conform with the revised segment presentation for the year ended
December 31, 2018
.
Financial information relating to the Company’s reportable segments is as follows. Operational results of each reportable segment are not necessarily indicative of the results that would have been achieved had the reportable segment been an independent, stand-alone entity during the periods presented.
|
Years Ended December 31,
|
|||||||||||
|
(in thousands)
|
2018
|
2017
|
2016
|
||||||||
|
Revenues:
(1)
|
|||||||||||
|
Builder operations
|
|||||||||||
|
Central
|
$
|
282,218
|
|
$
|
224,670
|
|
$
|
206,831
|
|
||
|
Southeast
|
301,595
|
|
214,850
|
|
169,241
|
|
|||||
|
Total builder operations
|
583,813
|
|
439,520
|
|
376,072
|
|
|||||
|
Land development
|
39,834
|
|
18,730
|
|
14,913
|
|
|||||
|
Total revenues
|
$
|
623,647
|
|
$
|
458,250
|
|
$
|
390,985
|
|
||
|
Gross profit (loss):
|
|||||||||||
|
Builder operations
|
|
|
|||||||||
|
Central
|
$
|
61,882
|
|
$
|
53,840
|
|
$
|
51,013
|
|
||
|
Southeast
|
72,187
|
|
49,033
|
|
37,808
|
|
|||||
|
Total builder operations
|
134,069
|
|
102,873
|
|
88,821
|
|
|||||
|
Land development
|
9,334
|
|
5,454
|
|
4,600
|
|
|||||
|
Corporate and other
(2)
|
(13,073
|
)
|
(9,293
|
)
|
(5,659
|
)
|
|||||
|
Total gross profit
|
$
|
130,330
|
|
$
|
99,034
|
|
$
|
87,762
|
|
||
|
Income (loss) before taxes:
|
|
|
|
|
|
|
|||||
|
Builder operations
|
|||||||||||
|
Central
|
$
|
37,535
|
|
$
|
36,224
|
|
$
|
34,939
|
|
||
|
Southeast
|
47,237
|
|
34,636
|
|
24,639
|
|
|||||
|
Total builder operations
|
84,772
|
|
70,860
|
|
59,578
|
|
|||||
|
Land development
|
6,155
|
|
4,320
|
|
3,611
|
|
|||||
|
Corporate and other
(3)
|
(9,256
|
)
|
(10,943
|
)
|
(12,635
|
)
|
|||||
|
Total income before taxes
|
$
|
81,671
|
|
$
|
64,237
|
|
$
|
50,554
|
|
||
|
Inventory:
|
|||||||||||
|
Builder operations
|
|||||||||||
|
Central
|
$
|
160,980
|
|
$
|
111,271
|
|
$
|
76,878
|
|
||
|
Southeast
|
159,616
|
|
99,613
|
|
90,859
|
|
|||||
|
Total builder operations
|
320,596
|
|
210,884
|
|
167,737
|
|
|||||
|
Land development
|
329,105
|
|
272,542
|
|
232,726
|
|
|||||
|
Corporate and other
(4)
|
19,260
|
|
12,628
|
|
9,834
|
|
|||||
|
Total inventory
|
$
|
668,961
|
|
$
|
496,054
|
|
$
|
410,297
|
|
||
|
Goodwill:
(5)
|
|||||||||||
|
Builder operations - Southeast
|
$
|
680
|
|
$
|
—
|
|
$
|
—
|
|
||
65
|
(1)
|
The sum of Builder operations Central and Southeast segments’ revenues does not equal residential units revenue included in the consolidated statements of income in periods when our controlled builders have revenues from land or lot closings, which for the years ended
December 31, 2018
and
2016
were
$4.9 million
and
$0.3 million
, respectively.
|
|
(2)
|
Corporate and other gross profit is comprised of capitalized overhead and capitalized interest adjustments that are not allocated to builder operations and land development segments.
|
|
(3)
|
Corporate and other income (loss) before taxes includes results from Green Brick Title, Challenger, Green Brick Mortgage, and Providence Title.
|
|
(4)
|
Corporate and other inventory consists of capitalized overhead and interest related to work in process and land under development.
|
|
(5)
|
In connection with the GRBK GHO business combination, the Company recorded goodwill of
$0.7 million
.
|
12. INCOME TAXES
On December 22, 2017, the U.S. government enacted comprehensive tax legislation commonly referred to as the Tax Cuts and Jobs Act (the “Tax Act”). The Tax Act made major changes to the Internal Revenue Code. The Company recognized the income tax effects of the Tax Act in its financial statements in accordance with Staff Accounting Bulletin 118 which provides SEC staff guidance for the application of ASC 740,
Income Taxes
. The Company finalized its accounting for the income tax effects of the Tax Act in the fourth quarter of 2018 with no adjustments recorded during the measurement period.
Income Tax Expense
The components of current and deferred income tax expense are as follows (in thousands):
|
Years Ended December 31,
|
|||||||||||
|
2018
|
2017
|
2016
|
|||||||||
|
Current expense (benefit):
|
|||||||||||
|
Federal
|
$
|
(569
|
)
|
$
|
999
|
|
$
|
158
|
|
||
|
State
|
2,993
|
|
1,733
|
|
2,076
|
|
|||||
|
Total current expense
|
2,424
|
|
2,732
|
|
2,234
|
|
|||||
|
Deferred expense (benefit):
|
|||||||||||
|
Federal
|
15,023
|
|
36,569
|
|
13,146
|
|
|||||
|
State
|
(311
|
)
|
(270
|
)
|
1
|
|
|||||
|
Total deferred expense
|
14,712
|
|
36,299
|
|
13,147
|
|
|||||
|
Total income tax expense
|
$
|
17,136
|
|
$
|
39,031
|
|
$
|
15,381
|
|
||
Effective Tax Rate Reconciliation
The tax expense differs from the amount that would be computed by applying the statutory federal income tax rates of 21%, 35% and 35% for the years ended
December 31, 2018
,
2017
and
2016
, respectively, to income before income taxes as a result of the following (amounts in thousands):
|
Years Ended December 31,
|
|||||||||||
|
2018
|
2017
|
2016
|
|||||||||
|
Tax on pre-tax book income (before reduction of noncontrolling interests)
|
$
|
17,151
|
|
$
|
22,483
|
|
$
|
17,693
|
|
||
|
Tax effect of non-controlled earnings
|
(2,743
|
)
|
(3,630
|
)
|
(3,996
|
)
|
|||||
|
State tax expense, net
|
2,258
|
|
1,213
|
|
1,153
|
|
|||||
|
Change in federal statutory tax rate
|
—
|
|
19,017
|
|
—
|
|
|||||
|
Other
|
470
|
|
(52
|
)
|
531
|
|
|||||
|
Total tax expense
|
$
|
17,136
|
|
$
|
39,031
|
|
$
|
15,381
|
|
||
|
Effective tax rate
|
21.0
|
%
|
60.8
|
%
|
30.4
|
%
|
|||||
66
The effective income tax rate for 2017 reflects the impact of compliance with the Tax Act, signed into law on December 22, 2017. The Company remeasured its deferred tax assets due to the change in federal statutory tax rate which resulted in additional tax expense of
$19.0 million
.
Deferred Income Taxes
The primary differences between the financial statement and tax bases of assets and liabilities are as follows (in thousands):
|
December 31, 2018
|
December 31, 2017
|
||||||
|
Deferred tax assets:
|
|||||||
|
Basis in partnerships
|
10,947
|
|
13,377
|
|
|||
|
Accrued expenses
|
2,182
|
|
1,418
|
|
|||
|
Inventory
|
1,521
|
|
944
|
|
|||
|
State net operating loss carryover
|
1,063
|
|
1,353
|
|
|||
|
Federal net operating loss carryover
|
432
|
|
14,078
|
|
|||
|
Alternative minimum tax credit carryover
|
576
|
|
1,145
|
|
|||
|
Change in fair value of contingent consideration
|
385
|
|
—
|
|
|||
|
Stock-based compensation
|
347
|
|
268
|
|
|||
|
Other
|
175
|
|
28
|
|
|||
|
Deferred tax assets, gross
|
17,628
|
|
32,611
|
|
|||
|
Valuation allowance
|
(1,063
|
)
|
(1,346
|
)
|
|||
|
Deferred tax assets, net
|
$
|
16,565
|
|
$
|
31,265
|
|
|
|
Deferred tax liabilities:
|
|
|
|
|
|||
|
Prepaid insurance
|
$
|
(66
|
)
|
$
|
(17
|
)
|
|
|
Other
|
—
|
|
(37
|
)
|
|||
|
Deferred tax liabilities
|
$
|
(66
|
)
|
$
|
(54
|
)
|
|
|
Total deferred income tax assets, net
|
$
|
16,499
|
|
$
|
31,211
|
|
|
Net Operating Losses and Valuation Allowances
As of
December 31, 2018
, the Company had federal net operating loss carryforwards of
$2.0 million
that will expire beginning with the year ending
December 31, 2029
. Our ability to utilize our net operating loss carryforwards depends on the amount of taxable income we generate in future periods. Based on our historical taxable income results through
December 31, 2018
, as well as forecasted income, management expects that the Company will generate sufficient taxable income to utilize all of the federal net operating loss carryforwards before they expire.
As of
December 31, 2018
, the Company had gross state net operating loss carryforwards in Minnesota of
$13.7 million
which will begin to expire beginning with the year ending
December 31, 2023
. Management believes on a more-likely-than-not basis that the Minnesota net operating loss carryforwards will not be utilized. The Company maintains a gross deferred income tax asset in the amount of
$1.1 million
for the Minnesota state net operating loss carryforwards and a related valuation allowance in the amount of
$1.1 million
.
As of
December 31, 2018
, all Colorado state net operating loss carryforwards were fully utilized and all Nebraska state net operating loss carryforwards expired.
67
The rollforward of valuation allowance is as follows (amounts in thousands):
|
Years Ended December 31,
|
|||||||
|
2018
|
2017
|
||||||
|
Valuation allowance at beginning of the year
|
$
|
1,346
|
|
$
|
1,147
|
|
|
|
Release of Colorado net operating loss valuation allowance
|
—
|
|
(8
|
)
|
|||
|
Change in federal benefit tax rate - deferred
|
—
|
|
240
|
|
|||
|
Expiration of state net operating losses
|
(283
|
)
|
(33
|
)
|
|||
|
Valuation allowance at end of the year
|
$
|
1,063
|
|
$
|
1,346
|
|
|
Uncertain Tax Positions
The Company establishes reserves for uncertain tax positions that reflect management’s best estimate of deductions and credits that may not be sustained on a more-likely-than-not basis. In accordance with ASC 740,
Income Taxes
, the Company recognizes the effect of income tax positions only if those positions have a more-likely-than-not chance of being sustained by the Company. Recognized income tax positions are measured at the largest amount that is considered greater than
50%
likely of being realized. Changes in recognition or measurement are reflected in the period in which the change in judgment occurs. There were no uncertain tax positions as of
December 31, 2018
.
A reconciliation of the beginning and ending amount of uncertain tax positions for the year ended
December 31, 2017
is as follows (in thousands):
|
Year Ended December 31, 2017
|
||||
|
Uncertain tax positions at beginning of year
|
$
|
249
|
|
|
|
Change related to Georgia state income taxes
|
(249
|
)
|
||
|
Uncertain tax positions at end of year
|
$
|
—
|
|
|
There were no expenses for interest and penalties related to uncertain tax positions for the years ended
December 31, 2018
and
2017
. Expenses related to such interest and penalties were nil for the year ended
December 31, 2016
. There were no accrued liabilities related to uncertain tax positions as of
December 31, 2018
and
2017
, respectively.
Statutes of Limitations
The U.S. federal statute of limitations remains open for our
2015
and subsequent tax years. Due to the carryover of the federal net operating losses for years 2009 and forward, income tax returns going back to the 2009 tax year are subject to adjustment.
The Colorado and Minnesota statutes of limitations remain open for our
2014
and subsequent tax years. The Nebraska statute of limitations remains open for our
2015
and subsequent tax years.
Additionally, the Company’s subsidiaries file returns in Texas, Georgia and Florida. The Texas statute of limitations remains open for the
2014
and subsequent tax years. Any Texas adjustments relating to returns filed by the subsidiary partnerships would be borne by the subsidiary partnership entities. The Georgia statute of limitations remains open for the
2015
and subsequent tax years. Any Georgia adjustments relating to returns filed by the subsidiary partnerships would be borne by the partner. A Florida corporate tax return will be required starting for the 2018 tax year. The Florida statute of limitations will remain open for three years from the earlier of the date the return is filed or the extended due date of the return. Any Florida adjustments relating to returns filed by the subsidiary partnerships would be borne by the partner.
The Company is not presently under examination by the Internal Revenue Service or state tax authority.
13. EMPLOYEE BENEFITS
We have a qualifying 401(k) defined contribution plan that covers all employees of the Company. Each year, we may make discretionary matching contributions equal to a percentage of the employees’ contributions. The Company contributed
$0.6 million
and
$0.5 million
of matching contributions to the 401(k) plan during the years ended
December 31, 2018
and
2017
. The Company did
not
contribute any matching contributions to the 401(k) plan during the year ended
December 31, 2016
.
68
14. EARNINGS PER SHARE
The Company’s restricted stock awards have the right to receive forfeitable dividends on an equal basis with common stock and therefore are not considered participating securities that must be included in the calculation of net income per share using the two-class method. Basic earnings per share is computed by dividing net income by the weighted average number of common shares outstanding during each period, adjusted for non-vested shares of restricted stock awards during each period. Diluted earnings per share is calculated using the treasury stock method and includes the effect of all dilutive securities, including stock options and restricted stock awards.
The computation of basic and diluted net income attributable to Green Brick Partners, Inc. per share is as follows (in thousands, except per share amounts):
|
Years Ended December 31,
|
|||||||||||
|
2018
|
2017
|
2016
|
|||||||||
|
Net income attributable to Green Brick Partners, Inc.
|
$
|
51,623
|
|
$
|
14,970
|
|
$
|
23,756
|
|
||
|
Weighted-average number of shares outstanding — basic
|
50,652
|
|
49,597
|
|
48,879
|
|
|||||
|
Basic net income attributable to Green Brick Partners, Inc. per share
|
$
|
1.02
|
|
$
|
0.30
|
|
$
|
0.49
|
|
||
|
Weighted-average number of shares outstanding — basic
|
50,652
|
|
49,597
|
|
48,879
|
|
|||||
|
Dilutive effect of stock options and restricted stock awards
|
99
|
|
86
|
|
7
|
|
|||||
|
Weighted average number of shares outstanding — diluted
|
50,751
|
|
49,683
|
|
48,886
|
|
|||||
|
Diluted net income attributable to Green Brick Partners, Inc. per share
|
$
|
1.02
|
|
$
|
0.30
|
|
$
|
0.49
|
|
||
The following shares that could potentially dilute earnings per share in the future are not included in the determination of diluted net income attributable to Green Brick Partners, Inc. per common share (in thousands):
|
Years Ended December 31,
|
||||||||
|
2018
|
2017
|
2016
|
||||||
|
Antidilutive options to purchase common stock and restricted stock awards
|
8
|
|
—
|
|
144
|
|
||
15. FAIR VALUE MEASUREMENTS
Fair Value of Financial Instruments
The Company’s financial instruments, none of which are held for trading purposes, include cash, restricted cash, receivables, earnest money deposits, other assets, accounts payable, accrued expenses, customer and builder deposits, borrowings on lines of credit, and notes payable.
Per the fair value hierarchy, level 1 financial instruments include: cash, restricted cash, receivables, earnest money deposits, other assets, accounts payable, accrued expenses, and customer and builder deposits due to their short-term nature. The Company estimates that, due to the short-term nature of the underlying financial instruments or the proximity of the underlying transaction to the applicable reporting date, the fair value of level 1 financial instruments does not differ materially from the aggregate carrying values recorded in the consolidated financial statements as of
December 31, 2018
and
2017
.
Level 2 financial instruments include borrowings on lines of credit and notes payable. Due to the short-term nature and floating interest rate terms, the carrying amounts of borrowings on lines of credit and notes payable are deemed to approximate fair value.
The fair value of the contingent consideration liability related to the GRBK GHO business combination was estimated using a Monte Carlo simulation model under the option pricing method. As the measurement of the contingent consideration is based primarily on significant inputs not observable in the market, it represents a level 3 measurement.
69
The reconciliation of the beginning and ending balances for level 3 measurements is as follows (in thousands):
|
Carrying Value
|
Estimated Fair Value
|
||||||
|
Contingent consideration liability, balance as of January 1, 2018
|
$
|
—
|
|
$
|
—
|
|
|
|
Estimated contingent consideration liability related to the GRBK GHO business combination
|
628
|
|
628
|
|
|||
|
Purchase price adjustment
|
(114
|
)
|
(114
|
)
|
|||
|
Change in fair value of contingent consideration
|
1,693
|
|
1,693
|
|
|||
|
Contingent consideration liability, balance as of December 31, 2018
|
$
|
2,207
|
|
$
|
2,207
|
|
|
There were no transfers between the levels of the fair value hierarchy for any of our financial instruments as of
December 31, 2018
when compared to
December 31, 2017
.
Fair Value of Nonfinancial Instruments
Nonfinancial assets and liabilities include inventory which is measured at cost unless the carrying value is determined to be not recoverable in which case the affected instrument is written down to fair value. Per the fair value hierarchy, these items are level 3 nonfinancial instruments. During the years ended
December 31, 2018
and
2017
, the Company recorded impairment of
$0.1 million
and
$0.1 million
, respectively, related to those nonfinancial assets in cost of residential units in our builder operations segments. No impairment was recorded for the year ended
December 31, 2016
.
16. RELATED PARTY TRANSACTIONS
During
2018
,
2017
and
2016
, the Company had the following related party transactions through the normal course of business.
The Parc at Cogburn
In September 2015, the Company purchased
11
lots from an entity affiliated with the president of TPG, one of its controlled builders. The lots are part of a
19
-home community, The Parc at Cogburn in Atlanta. The total paid for the lots in 2015 was
$1.8 million
. Under the option contract in place, the Company purchased
$0.3 million
in lots during the year ended December 31, 2016, and
$1.0 million
in lots during the year ended December 31, 2017. The Company purchased all
19
lots as of
December 31, 2017
.
Glens at Sugarloaf
In November 2015, the Company purchased
12
lots from an entity affiliated with the president of TPG. The lots are part of a
92
-unit townhome community, Glens at Sugarloaf in Atlanta.
No
deposits were paid by the Company in contracting for the lots. The total paid for the lots in 2015 was
$1.0 million
. During March 2016, the Company purchased the remaining
80
townhome lots at a price of
$4.8 million
.
Academy Street
In March 2016, the Company purchased undeveloped land for an eventual
83
-lot community, Academy Street in Atlanta. Simultaneously, the Company entered into a partnership agreement with an entity affiliated with the president of TPG to develop the land for sale of the lots to TPG. Contributions and profits are shared
80%
by the Company and
20%
by the affiliated entity.
During the year ended
December 31, 2017
, TPG purchased 62 lots within the community for
$11.2 million
. During the year ended December 31, 2018, TPG purchased the remaining 21 lots within the community for
$2.9 million
.
Total capital contributions as of
December 31, 2018
were
$11.7 million
. Total capital contributions paid during the year ended December 31, 2016 were
$11.2 million
, of which
$9.0 million
was paid by the Company. Total contributions paid during the year ended December 31, 2017 were
$0.5 million
, of which
$0.4 million
was paid by the Company. There were no contributions made to the partnership during the year ended
December 31, 2018
.
Total distributions as of
December 31, 2018
were
$14.8 million
. There were no distributions from the partnership during the year ended December 31, 2016. Total distributions from the partnership during the year ended December 31, 2017 were
70
$11.5 million
, of which
$9.2 million
was paid to the Company. Total distributions from the partnership during the year ended December 31, 2018 were
$3.3 million
, of which
$2.7 million
was paid to the Company.
The Company has consolidated the entity’s results of operations and financial condition into its consolidated financial statements based on its
80%
ownership.
Suwanee Station
In March 2016, the Company purchased undeveloped land for a
73
-unit townhome community, Suwanee Station in Atlanta. Simultaneously, the Company entered into a partnership agreement with an entity affiliated with the president of TPG to develop the land for sale of the lots to TPG. Contributions and profits are shared
50%
by the Company and
50%
by the affiliated entity.
During the years ended
December 31, 2018
,
2017
and
2016
, TPG purchased 8, 27, and 25 lots within the community for
$0.4 million
,
$1.6 million
and
$1.3 million
, respectively. As of December 31, 2018, there were 13 lots remaining to be sold to TPG.
Total capital contributions as of
December 31, 2018
were
$2.5 million
. Total capital contributions paid during the year ended December 31, 2016 were
$1.8 million
, of which
$0.9 million
was paid by the Company. The contributions paid during the year ended
December 31, 2017
were
$0.7 million
, of which
$0.4 million
was paid by the Company. The were no contributions paid during the year ended
December 31, 2018
.
Total distributions as of
December 31, 2018
were
$2.3 million
. There were no distributions from the partnership during the year ended
December 31, 2016
. Total distributions from the partnership during the year ended December 31, 2017 were
$1.5 million
, of which
$0.7 million
was paid to the Company. Total distributions from the partnership during the year ended
December 31, 2018
were
$0.9 million
, of which
$0.4 million
was paid to the Company.
The Company holds
two
of the
three
board seats and is able to exercise control over the operations of GRBK Suwanee Station LLC and therefore has consolidated the entity’s results of operations and financial condition into its consolidated financial statements.
Dunwoody Towneship
In June 2016, the Company purchased
14
lots from an entity affiliated with the president of TPG. The lots are part of a
40
-unit townhome community, Dunwoody Towneship in Atlanta. The total paid for the
14
lots in 2016 was
$1.8 million
. The Company purchased the remaining
26
lots during the year ended
December 31, 2017
for
$3.3 million
.
Corporate Officers
In February 2017, Richard A. Costello paid a
$0.1 million
deposit to Centre Living Homes, LLC (“Centre Living”), one of the Company’s controlled builders, on a townhome. During the fourth quarter of 2017, Mr. Costello closed on the townhome for approximately
$0.5 million
. In accordance with the Company’s employee discount policy, the contract price resulted in a margin of approximately
13%
.
In February 2017, Jed Dolson paid a
$0.1 million
deposit to Centre Living on a townhome. During the fourth quarter of 2017, as allowed for in the Company’s employee discount policy, Mr. Dolson assigned his rights to purchase the townhome to his sister-in-law. The townhome was closed on in the fourth quarter of 2017 for approximately
$0.5 million
. In accordance with the Company’s employee discount policy, the contract price resulted in a margin of approximately
13%
.
Trevor Brickman, the son of Green Brick’s Chief Executive Officer, is the President of Centre Living. Green Brick’s ownership interest in Centre Living is
50%
and Trevor Brickman’s ownership interest is
50%
. Green Brick has
51%
voting control over the operations of Centre Living. As such,
100%
of Centre Living’s operations are included within our consolidated financial statements.
In June 2016, the Company sold
one
developed lot to Trevor Brickman for
$0.4 million
, of which
$0.3 million
was included in the cost of land and lots. In September 2016, Trevor Brickman entered into an agreement with Centre Living to construct a home on the developed lot. In accordance with the Company’s employee discount policy, the contract price resulted in a margin of approximately
13%
. The home was completed in 2017 and the Company incurred
$0.6 million
in costs to construct the home.
71
GRBK GHO
GRBK GHO leases office space from entities affiliated with the president of GRBK GHO. During the period from April 26, 2018 through December 31, 2018, GRBK GHO incurred rent expense of
$0.1 million
under such lease agreements. As of December 31, 2018, there were
no
amounts due to the affiliated entities related to such lease agreements.
GRBK GHO receives title closing services on the purchase of land and third-party lots from an entity affiliated with the president of GRBK GHO. During the period from April 26, 2018 through
December 31, 2018
, GRBK GHO incurred de minimus fees related to such title closing services. As of
December 31, 2018
, no amounts were due to the title company affiliate.
17. COMMITMENTS AND CONTINGENCIES
Letters of Credit and Performance Bonds
During the ordinary course of business, certain regulatory agencies and municipalities require the Company to post letters of credit or performance bonds related to development projects. As of
December 31, 2018
and
2017
, letters of credit outstanding were
$2.2 million
and
$0.2 million
, respectively, and performance bonds outstanding totaled
$5.3 million
and
$3.6 million
, respectively. The Company does not believe that it is likely that any material claims will be made under a letter of credit or performance bond in the foreseeable future.
Warranties
Warranty activity, included in accrued expenses in our consolidated balance sheets, for
2018
,
2017
and
2016
consists of the following (in thousands):
|
2018
|
2017
|
2016
|
|||||||||
|
Beginning balance
|
$
|
2,083
|
|
$
|
1,210
|
|
$
|
474
|
|
||
|
Additions
|
2,579
|
|
1,936
|
|
1,399
|
|
|||||
|
Charges
|
(1,682
|
)
|
(1,063
|
)
|
(663
|
)
|
|||||
|
Ending balance
|
$
|
2,980
|
|
$
|
2,083
|
|
$
|
1,210
|
|
||
Lease Commitments
The Company has leases associated with office space in Georgia, Texas, and Florida, which are classified as operating leases. Rent expense under these leases totaled
$1.2 million
,
$0.9 million
, and
$0.7 million
in
2018
,
2017
and
2016
, respectively, and is included in selling, general and administrative expense in the consolidated statements of income.
The future annual minimum lease payments under operating leases over the next five years as of
December 31, 2018
are (in thousands):
|
2019
|
$
|
1,263
|
|
|
2020
|
1,256
|
|
|
|
2021
|
1,011
|
|
|
|
2022
|
734
|
|
|
|
2023
|
558
|
|
|
|
Total
|
$
|
4,822
|
|
Land and Lot Option Contracts
In the ordinary course of business, the Company enters into land and lot option contracts in order to procure land for the construction of homes in the future. Earnest money deposits act as security for such contracts. Certain of our earnest money deposits are subject to first priority liens on the land that we have contracted to procure. As of
December 31, 2018
and
2017
, there were
1,843
and
1,724
lots under option, respectively, including option contracts for land intended to be developed into lots. The land and lot option contracts in place as of
December 31, 2018
provide for potential land and lots purchase payments in each year through
2022
.
72
If each option contract in place as of
December 31, 2018
was exercised, expected purchase payments, including escalators, would be as follows (in thousands):
|
2019
|
$
|
114,198
|
|
|
2020
|
58,751
|
|
|
|
2021
|
18,601
|
|
|
|
2022
|
1,680
|
|
|
|
Total
|
$
|
193,230
|
|
The amounts of purchased land and lots under option contracts for the years ended
December 31, 2018
,
2017
and
2016
were
$150.4 million
,
$122.3 million
, and
$106.5 million
, respectively.
Deposits and pre-acquisition costs written off related to option contracts abandoned totaled
$0.7 million
,
$0.2 million
and
$0.2 million
for the years ended
December 31, 2018
,
2017
and
2016
, respectively.
Legal Matters
Lawsuits, claims and proceedings may be instituted or asserted against us in the normal course of business. The Company is also subject to local, state and federal laws and regulations related to land development activities, house construction standards, sales practices, title company regulations, employment practices and environmental protection. As a result, the Company may be subject to periodic examinations or inquiry by agencies administering these laws and regulations.
The Company records a reserve for potential legal claims and regulatory matters when they are probable of occurring and a potential loss is reasonably estimable. The Company accrues for these matters based on facts and circumstances specific to each matter and revises these estimates when necessary.
In view of the inherent difficulty of predicting outcomes of legal claims and related contingencies, the Company generally cannot predict their ultimate resolution, related timing or eventual loss. If evaluations indicate loss contingencies that could be material are not probable, but are reasonably possible, the Company will disclose their nature with an estimate of the possible range of losses or a statement that such loss is not reasonably estimable. We believe that the disposition of legal claims and related contingencies will not have a material adverse effect on our results of operations and liquidity or on our financial condition.
73
18. QUARTERLY FINANCIAL DATA (UNAUDITED)
Summarized unaudited quarterly results of operations for the years ended
December 31, 2018
and
2017
are as follows (in thousands, except per share amounts):
|
Year Ended December 31, 2018
|
First Quarter
|
Second Quarter
|
Third Quarter
|
Fourth Quarter
|
||||||||||||
|
Revenues
|
$
|
129,163
|
|
$
|
157,312
|
|
$
|
152,052
|
|
$
|
185,120
|
|
||||
|
Gross profit
|
27,268
|
|
35,070
|
|
31,004
|
|
36,988
|
|
||||||||
|
Net income attributable to Green Brick Partners, Inc.
|
11,203
|
|
14,869
|
|
12,197
|
|
13,354
|
|
||||||||
|
Net income attributable to Green Brick Partners, Inc. per common share:
(2)
|
||||||||||||||||
|
Basic
|
$0.22
|
$0.29
|
$0.24
|
$0.26
|
||||||||||||
|
Diluted
|
$0.22
|
$0.29
|
$0.24
|
$0.26
|
||||||||||||
|
Year Ended December 31, 2017
|
First Quarter
|
Second Quarter
|
Third Quarter
|
Fourth Quarter
|
||||||||||||
|
Revenues
|
$
|
100,734
|
|
$
|
105,750
|
|
$
|
114,342
|
|
$
|
137,424
|
|
||||
|
Gross profit
|
21,500
|
|
23,031
|
|
25,506
|
|
28,997
|
|
||||||||
|
Net income (loss) attributable to Green Brick Partners, Inc.
(1)
|
6,197
|
|
7,689
|
|
9,279
|
|
(8,195
|
)
|
||||||||
|
Net income (loss) attributable to Green Brick Partners, Inc. per common share:
(2)
|
||||||||||||||||
|
Basic
|
$0.13
|
$0.16
|
$0.19
|
$(0.16)
|
||||||||||||
|
Diluted
|
$0.13
|
$0.16
|
$0.19
|
$(0.16)
|
||||||||||||
|
(1)
|
Net loss attributable to Green Brick Partners, Inc. in the fourth quarter is due to the remeasurement of our deferred tax assets as a result of the change in federal statutory tax rate which resulted in additional tax expense of
$19.0 million
.
|
|
(2)
|
Per share amounts for the four quarters do not add to per share amounts for the year due to rounding differences in quarterly amounts and due to the impact of differences between the quarterly and annual weighted average share calculations.
|
ITEM 9. CHANGES IN AND DISAGREEMENTS WITH ACCOUNTANTS ON ACCOUNTING AND FINANCIAL DISCLOSURE
None.
ITEM 9A. CONTROLS AND PROCEDURES
Evaluation of Disclosure Controls and Procedures
The Company has established disclosure controls and procedures that are designed to ensure that information required to be disclosed in reports filed or submitted under the Exchange Act, as amended, is recorded, processed, summarized and reported within the time periods specified in the rules and forms of the SEC and, as such, is accumulated and communicated to the Company’s management, including our Chief Executive Officer (“CEO”) and Chief Financial Officer (“CFO”), as appropriate to allow timely decisions regarding required disclosure. Management, together with our CEO and CFO, evaluated the effectiveness of the Company’s disclosure controls and procedures, as defined in Rule 13a-15(e) of the Exchange Act, as of
December 31, 2018
. Based on our evaluation, the CEO and CFO concluded that our disclosure controls and procedures were effective as of
December 31, 2018
.
Management’s Report on Internal Control over Financial Reporting
The Company’s management is responsible for establishing and maintaining adequate internal control over financial reporting, as such term is defined in Exchange Act Rule 13a-15(f). Internal control over financial reporting is a process designed to provide reasonable assurance regarding the reliability of financial reporting and the preparation of financial statements for external purposes in accordance with GAAP. Because of its inherent limitations, internal control over financial reporting may not prevent or detect misstatements. Also, projections of any evaluation of effectiveness to future periods are subject to the risk that controls may become inadequate because of changes in conditions, or that the degree of compliance with the policies or procedures may deteriorate.
74
The Company’s management has excluded GRBK GHO Homes, LLC from its assessment of internal control over financial reporting as of December 31, 2018 as it was acquired by the Company in a business combination on April 26, 2018. GRBK GHO Homes, LLC is a controlled owned subsidiary whose total assets and net income represented approximately 8.5 percent and 7.2 percent, respectively, of the related consolidated financial statement amounts as of and for the year ended December 31, 2018.
Under the supervision and with the participation of our management, including the CEO and CFO, we conducted an evaluation of the effectiveness of our internal control over financial reporting as of
December 31, 2018
based upon
Internal Control-Integrated Framework
(2013) issued by the Committee of Sponsoring Organizations of the Treadway Commission. Based on this evaluation, our management concluded that our internal control over financial reporting was effective as of
December 31, 2018
.
RSM US LLP, the Company’s independent registered public accounting firm, has audited our consolidated financial statements included in this report and has issued an attestation report on the Company’s internal control over financial reporting, which is included herein.
Changes in Internal Control over Financial Reporting
During the quarter ended
December 31, 2018
, there were no changes in our internal controls that have materially affected or are reasonably likely to have a material effect on our internal control over financial reporting.
75
Report of Independent Registered Public Accounting Firm
To the Stockholders and the Board of Directors of Green Brick Partners, Inc.
Opinion on the Internal Control Over Financial Reporting
We have audited Green Brick Partners, Inc. and subsidiaries' (the Company) internal control over financial reporting as of
December 31, 2018
, based on criteria established in
Internal Control - Integrated Framework
issued by the Committee of Sponsoring Organizations of the Treadway Commission in 2013. In our opinion, the Company maintained, in all material respects, effective internal control over financial reporting as of
December 31, 2018
, based on criteria established in
Internal Control - Integrated Framework
issued by the Committee of Sponsoring Organizations of the Treadway Commission in 2013.
We have also audited, in accordance with the standards of the Public Company Accounting Oversight Board (United States) (PCAOB), the consolidated financial statements of the Company and our report dated
March 8, 2019
expressed an unqualified opinion.
As described in Management’s Report on Internal Control over Financing Reporting, management has excluded GRBK GHO Homes, LLC from its assessment of internal control over financial reporting as of December 31, 2018, because it was acquired by the Company in a purchase business combination in the second quarter of 2018. We have also excluded GRBK GHO Homes, LLC from our audit of internal control over financial reporting. GRBK GHO Homes, LLC is a controlled owned subsidiary whose total assets and net income represent approximately 8.5 percent and 7.2 percent, respectively, of the related consolidated financial statement amounts as of and for the year ended December 31, 2018.
Basis for Opinion
The Company’s management is responsible for maintaining effective internal control over financial reporting and for its assessment of the effectiveness of internal control over financial reporting in the accompanying Management’s Report on Internal Control over Financial Reporting. Our responsibility is to express an opinion on the Company’s internal control over financial reporting based on our audit. We are a public accounting firm registered with the PCAOB and are required to be independent with respect to the Company in accordance with U.S. federal securities laws and the applicable rules and regulations of the Securities and Exchange Commission and the PCAOB.
We conducted our audit in accordance with the standards of the PCAOB. Those standards require that we plan and perform the audit to obtain reasonable assurance about whether effective internal control over financial reporting was maintained in all material respects. Our audit included obtaining an understanding of internal control over financial reporting, assessing the risk that a material weakness exists, and testing and evaluating the design and operating effectiveness of internal control based on the assessed risk. Our audit also included performing such other procedures as we considered necessary in the circumstances. We believe that our audit provides a reasonable basis for our opinion.
Definition and Limitations of Internal Control Over Financial Reporting
A company's internal control over financial reporting is a process designed to provide reasonable assurance regarding the reliability of financial reporting and the preparation of financial statements for external purposes in accordance with generally accepted accounting principles. A company's internal control over financial reporting includes those policies and procedures that (1) pertain to the maintenance of records that, in reasonable detail, accurately and fairly reflect the transactions and dispositions of the assets of the company; (2) provide reasonable assurance that transactions are recorded as necessary to permit preparation of financial statements in accordance with generally accepted accounting principles, and that receipts and expenditures of the company are being made only in accordance with authorizations of management and directors of the company; and (3) provide reasonable assurance regarding prevention or timely detection of unauthorized acquisition, use or disposition of the company's assets that could have a material effect on the financial statements.
Because of its inherent limitations, internal control over financial reporting may not prevent or detect misstatements. Also, projections of any evaluation of effectiveness to future periods are subject to the risk that controls may become inadequate because of changes in conditions, or that the degree of compliance with the policies or procedures may deteriorate.
/s/ RSM US LLP
Dallas, Texas
March 8, 2019
76
ITEM 9B. OTHER INFORMATION
None.
PART III
ITEM 10. DIRECTORS, EXECUTIVE OFFICERS AND CORPORATE GOVERNANCE
Information required by Part III, Item 10, is incorporated herein by reference to the Company’s proxy statement for its 2019 annual meeting of shareholders (“Proxy Statement”) to be filed with the SEC no later than 120 days after the end of the Company’s fiscal year.
ITEM 11. EXECUTIVE COMPENSATION
Information required by Part III, Item 11, is incorporated herein by reference to the Company’s Proxy Statement to be filed with the SEC no later than 120 days after the end of the Company’s fiscal year.
ITEM 12. SECURITY OWNERSHIP OF CERTAIN BENEFICIAL OWNERS AND MANAGEMENT AND RELATED STOCKHOLDER MATTERS
Information required by Part III, Item 12, is incorporated herein by reference to the Company’s Proxy Statement to be filed with the SEC no later than 120 days after the end of the Company’s fiscal year.
ITEM 13. CERTAIN RELATIONSHIPS AND RELATED TRANSACTIONS, AND DIRECTOR INDEPENDENCE
Information required by Part III, Item 13, is incorporated herein by reference to the Company’s Proxy Statement to be filed with the SEC no later than 120 days after the end of the Company’s fiscal year.
ITEM 14. PRINCIPAL ACCOUNTING FEES AND SERVICES
Information required by Part III, Item 14, is incorporated herein by reference to the Company’s Proxy Statement to be filed with the SEC no later than 120 days after the end of the Company’s fiscal year.
77
PART IV
ITEM 15. EXHIBITS AND FINANCIAL STATEMENT SCHEDULES
The following documents are filed as part of this Annual Report on Form 10-K:
(1) Financial Statements
See Part II, Item 8 of this Annual Report on Form 10-K.
(2) Financial Statement Schedules
Financial statements schedules are omitted because they are not required or applicable or the required information is included in the consolidated financial statements or notes thereto.
(3) Exhibits
The following exhibits are filed with this Annual Report on Form 10-K or are incorporated herein by reference:
|
Number
|
Exhibit Description
|
|
|
2.1#
|
||
|
3.1
|
||
|
3.2
|
||
|
4.1
|
||
|
4.2
|
||
|
4.3
|
||
|
4.4
|
||
|
4.5
|
||
|
10.1
|
||
|
10.2
|
||
|
10.3
|
||
78
|
Number
|
Exhibit Description
|
|
|
10.4
|
||
|
10.5
|
||
|
10.6
|
||
|
10.7
|
||
|
10.8
|
||
|
10.9
|
||
|
10.10
|
||
|
10.11
|
||
|
10.12
|
||
|
10.13
|
||
|
10.14†
|
||
|
10.15†
|
||
|
10.16†
|
||
|
10.17†
|
||
|
10.18†
|
||
|
10.19†
|
||
|
10.20
|
||
|
10.21
|
||
79
|
Number
|
Exhibit Description
|
|
|
10.22
|
||
|
10.23
|
||
|
10.24
|
||
|
10.25
|
||
|
10.26
|
||
|
10.27
|
||
|
10.28
|
||
|
10.29
|
||
|
10.30
|
||
|
10.31†
|
||
|
10.32
|
||
|
10.33
|
||
|
10.34
|
||
|
10.35
|
||
|
10.36
|
||
|
10.37
|
||
|
10.38
|
||
|
10.39
|
||
80
|
Number
|
Exhibit Description
|
|
|
10.40
|
||
|
10.41
|
||
|
10.42†
|
||
|
10.43
|
||
|
10.44
|
||
|
10.45
|
||
|
10.46
|
||
|
10.47
|
||
|
10.48
|
||
|
10.49
|
||
|
10.50
|
||
|
10.51
|
||
|
10.52*
|
||
|
10.53†
|
||
|
10.54†
|
||
|
21.1*
|
||
|
23.1*
|
||
|
31.1*
|
||
|
31.2*
|
||
|
32.1*
|
||
|
32.2*
|
||
|
101.INS*
|
XBRL Instance Document.
|
|
|
101.SCH*
|
XBRL Taxonomy Extension Schema Document.
|
|
|
101.CAL*
|
XBRL Taxonomy Extension Calculation Linkbase Document.
|
|
|
101.DEF*
|
XBRL Taxonomy Extension Definition Linkbase Document.
|
|
81
|
Number
|
Exhibit Description
|
|
|
101.LAB*
|
XBRL Taxonomy Extension Label Linkbase Document.
|
|
|
101.PRE*
|
XBRL Taxonomy Extension Presentation Linkbase Document.
|
|
* Filed with this Annual Report on Form 10-K.
† Management Contract or Compensatory Plan.
|
#
|
The Company hereby undertakes to furnish supplementally a copy of any omitted schedule or exhibit to such agreement to the SEC upon request.
|
ITEM 16. 10-K SUMMARY
None.
82
SIGNATURES
Pursuant to the requirements of Section 13 or 15(d) of the Securities Exchange Act of 1934, the registrant has duly caused this report to be signed on its behalf by the undersigned, thereunto duly authorized on
March 8, 2019
.
Green Brick Partners, Inc.
|
/s/ James R. Brickman
|
|
|
By: James R. Brickman
|
|
|
Its: Chief Executive Officer
|
|
Pursuant to the requirements of the Securities Exchange Act of 1934, this report has been signed below by the following persons on behalf of the registrant and in the capacities and on the dates indicated below.
|
Signature
|
Title
|
Date
|
||
|
/s/ James R. Brickman
|
Chief Executive Officer and Director (Principal Executive Officer)
|
March 8, 2019
|
||
|
James R. Brickman
|
||||
|
/s/ Richard A. Costello
|
Chief Financial Officer (Principal Financial Officer and Principal Accounting Officer)
|
March 8, 2019
|
||
|
Richard A. Costello
|
||||
|
/s/ Elizabeth K. Blake
|
Director
|
March 8, 2019
|
||
|
Elizabeth K. Blake
|
||||
|
/s/ Harry Brandler
|
Director
|
March 8, 2019
|
||
|
Harry Brandler
|
||||
|
/s/ David Einhorn
|
Chairman of the Board
|
March 8, 2019
|
||
|
David Einhorn
|
||||
|
/s/ John R. Farris
|
Director
|
March 8, 2019
|
||
|
John R. Farris
|
||||
|
/s/ Kathleen Olsen
|
Director
|
March 8, 2019
|
||
|
Kathleen Olsen
|
||||
|
/s/ Richard S. Press
|
Director
|
March 8, 2019
|
||
|
Richard S. Press
|
||||
83
TABLE OF CONTENTS
Part IItem 1. BusinessItem 1A. Risk FactorsItem 1B. Unresolved Staff CommentsItem 2. PropertiesItem 3. Legal ProceedingsItem 4. Mine Safety DisclosuresPart IIItem 5. Market For Registrant S Common Equity, Related Stockholder Matters and Issuer Purchases Of Equity SecuritiesItem 6. Selected Financial DataItem 7. Management S Discussion and Analysis Of Financial Condition and Results Of OperationsItem 7A. Quantitative and Qualitative Disclosures About Market RiskItem 8. Financial Statements and Supplementary DataItem 9. Changes in and Disagreements with Accountants on Accounting and Financial DisclosureItem 9A. Controls and ProceduresItem 9B. Other InformationPart IIIItem 10. Directors, Executive Officers and Corporate GovernanceItem 11. Executive CompensationItem 12. Security Ownership Of Certain Beneficial Owners and Management and Related Stockholder MattersItem 13. Certain Relationships and Related Transactions, and Director IndependenceItem 14. Principal Accounting Fees and ServicesPart IVItem 15. Exhibits and Financial Statement SchedulesItem 16. 10-k Summary