GARMIN LTD
10-Ks and 10-Qs
|
|
|
|
|
|
|
|
|
|
|
|
|
|
|
|
|
|
|
|
|
|
|
|
|
|
|
|
|
|
|
|
|
|
|
|
|
|
|
|
|
|
|
|
|
|
|
|
|
|
|
|
|
|
|
|
UNITED STATES
SECURITIES AND EXCHANGE COMMISSION
Washington, D.C. 20549
FORM 10-K
|
x
|
ANNUAL REPORT PURSUANT TO SECTION 13 OR 15(d) OF THE SECURITIES EXCHANGE ACT OF 1934
|
For the fiscal year ended December 25, 2010
or
|
¨
|
TRANSITION REPORT PURSUANT TO SECTION 13 OR 15(d) OF THE SECURITIES EXCHANGE ACT OF 1934
|
For the transition period from _____ to _____
Commission file number 0-31983
GARMIN LTD
.
(Exact name of registrant as
specified in its charter)
|
Switzerland
(State or other jurisdiction
of incorporation or organization)
|
98-0229227
(I.R.S. Employer Identification No.)
|
|
Vorstadt 40/42
8200 Schaffhausen
Switzerland
(Address of principal executive offices)
|
N/A
(Zip Code)
|
Registrant’s telephone number, including area code:
+41 52 620 1401
Securities registered pursuant to Section 12(b) of the Act:
|
Registered Shares, CHF 10.00 Per Share Par Value
|
NASDAQ Global Select Market
|
|
(Title of each class)
|
(Name of each exchange on which registered)
|
Securities registered pursuant to Section 12(g) of the Act:
None
Indicate by check mark if the registrant is a well-known seasoned issuer, as defined in Rule 405 of the Securities Act. YES
þ
NO
¨
Indicate by check mark if the registrant is not required to file reports pursuant to Section 13 or Section 15(d) of the Act. YES
¨
NO
þ
Indicate by check mark whether the registrant (1) has filed all reports required to be filed by Section 13 or 15(d) of the Securities Exchange Act of 1934 during the preceding 12 months (or for such shorter period that the registrant was required to file such reports), and (2) has been subject to such filing requirements for the past 90 days. YES
þ
NO
¨
Indicate by check mark whether the registrant has submitted electronically and posted on its corporate website, if any, every Interactive Data File required to be submitted and posted pursuant to Rule 405 of Regulations S-T (§ 232.405 of this chapter) during the preceding 12 months (or for such shorter period that the registrant was required to submit and post such files). YES
þ
No
¨
Indicate by check mark if disclosure of delinquent filers pursuant to Item 405 of Regulation S-K
(§ 229.405 of this chapter)
is not contained herein, and will not be contained, to the best of registrant’s knowledge, in definitive proxy or information statements incorporated by reference in Part III of this Form 10-K or any amendment to this Form 10-K.
þ
Indicate by check mark whether the registrant is a large accelerated filer, an accelerated filer, a non-accelerated filer, or a smaller reporting company. See the definitions of “large accelerated filer”, “accelerated filer” and “smaller reporting company” in Rule 12b-2 of the Exchange Act.
|
Large Accelerated Filer
þ
|
Accelerated Filer
¨
|
|
Non-accelerated Filer
¨
|
Smaller reporting company
¨
|
|
(Do not check if a smaller reporting company)
|
Indicate by check mark whether the registrant is a shell company (as defined in Rule 12b-2 of the Exchange Act).
YES
¨
NO
þ
Aggregate market value of the common shares held by non-affiliates of the registrant as of June 26, 2010 (based on the closing price of the registrant's common shares on the Nasdaq Stock Market for that date) was $3,954,398,819.
Number of shares outstanding of the registrant’s common shares as of February 17, 2011:
Registered Shares, CHF 10.00 par value – 208,077,418
Documents incorporated by reference:
Portions of the following document are incorporated herein by reference into Part III of the Form 10-K as indicated:
|
Document
|
Part of Form 10-K into
which Incorporated
|
|
|
Company's Definitive Proxy Statement for the 2010 Annual Meeting of Shareholders which will be filed no later than 120 days after December 25, 2010.
|
|
Part III
|
Garmin Ltd.
2010 Form 10-K Annual Report
Table of Contents
|
Cautionary Statement With Respect To Forward-Looking Comments
|
3
|
||
|
Part I
|
|||
|
Item 1.
|
Business
|
3
|
|
|
Item 1A.
|
Risk Factors
|
22
|
|
|
Item 1B.
|
Unresolved Staff Comments
|
33
|
|
|
Item 2.
|
Properties
|
33
|
|
|
Item 3.
|
Legal Proceedings
|
34
|
|
|
Item 4.
|
Removed and Reserved
|
||
|
|
Executive Officers of the Registrant
|
36
|
|
|
Part II
|
|||
|
Item 5.
|
Market for Registrant’s Common Equity, Related Stockholder Matters and Issuer Purchases of
|
||
|
Equity Securities
|
38
|
||
|
Item 6.
|
Selected Financial Data
|
39
|
|
|
Item 7.
|
Management's Discussion and Analysis of Financial Condition and Results of
Operations
|
41
|
|
|
Item 7A.
|
Quantitative and Qualitative Disclosures About Market Risk
|
58
|
|
|
Item 8.
|
Financial Statements and Supplementary Data
|
60
|
|
|
Item 9.
|
Changes in and Disagreements with Accountants on Accounting and Financial
Disclosure
|
89
|
|
|
Item 9A.
|
Controls and Procedures
|
89
|
|
|
Item 9B.
|
Other Information
|
91
|
|
|
Part III
|
|||
|
Item 10.
|
Directors, Executive Officers and Corporate Governance
|
92
|
|
|
Item 11.
|
Executive Compensation
|
93
|
|
|
Item 12.
|
Security Ownership of Certain Beneficial Owners and Management and Related Stockholder
|
||
|
Matters
|
93
|
||
|
Item 13.
|
Certain Relationships and Related Transactions, and Director Independence
|
94
|
|
|
Item 14.
|
Principal Accounting Fees and Services
|
94
|
|
|
Part IV
|
|||
|
Item 15.
|
Exhibits, Financial Statement Schedules
|
95
|
|
|
Signatures
|
100
|
||
CAUTIONARY STATEMENT WITH RESPECT TO FORWARD-LOOKING COMMENTS
The discussions set forth in this Annual Report on Form 10-K contain statements concerning potential future events. Such forward-looking statements are based upon assumptions by the Company's management, as of the date of this Annual Report, including assumptions about risks and uncertainties faced by the Company. In addition, management may make forward-looking statements orally or in other writings, including, but not limited to, in press releases, in the annual report to shareholders and in the Company’s other filings with the Securities and Exchange Commission. Readers can identify these forward-looking statements by their use of such verbs as
“expects,” “anticipates,” “believes” or similar verbs or conjugations of such verbs. Forward-looking statements include any discussion of the trends and other factors that drive our business and future results in “Item 7. Management’s Discussion and Analysis of Financial Conditions and Results of Operations.” Readers are cautioned not to place undue reliance on these forward-looking statements, which speak only as of their date. If any of management's assumptions prove incorrect or should unanticipated circumstances arise, the Company's actual results could materially differ from those anticipated by such forward-looking statements. The differences could be caused by a number of factors or combination of factors including, but not limited to, those factors identified under Item 1A “Risk
Factors.” Readers are strongly encouraged to consider those factors when evaluating any forward-looking statements concerning the Company. The Company does not undertake to update any forward-looking statements in this Annual Report to reflect future events or developments.
|
Item 1.
|
Business
|
This discussion of the business of Garmin Ltd. ("Garmin" or the "Company") should be read in conjunction with, and is qualified by reference to, “Management's Discussion and Analysis of Financial Condition and Results of Operations” under Item 7 herein and the information set forth in response to Item 101 of Regulation S-K in such Item 7 is incorporated herein by reference in partial response to this Item 1. Garmin has four business segments: Marine, Automotive/Mobile, Outdoor/Fitness, and Aviation. The segment and geographic information included in Item 8, “Financial Statements and Supplementary Data,” under Note 8 is incorporated herein by reference in partial
response to this Item 1.
Garmin was incorporated in Switzerland on February 9, 2010 as successor to Garmin Ltd., a Cayman Islands company (“Garmin Cayman”). Garmin Cayman was incorporated on July 24, 2000 as a holding company for Garmin Corporation, a Taiwan corporation, in order to facilitate a public offering of Garmin Cayman shares in the United States. On June 27, 2010, Garmin became the ultimate parent holding company of the Garmin group of companies pursuant to a share exchange transaction effected for the purpose of changing the place of incorporation of the ultimate parent holding company of the Garmin group from the Cayman Islands to Switzerland (the “Redomestication”). Pursuant to
the Redomestication, all issued and outstanding Garmin Cayman common shares were transferred to Garmin and each common share, par value U.S. $0.005 per share, of Garmin Cayman was exchanged for one registered share, par value 10 Swiss francs (“CHF”) per share, of Garmin. Garmin owns, directly or indirectly, all of the operating companies in the Garmin group.
Garmin’s annual report on Form 10-K, quarterly reports on Form 10-Q, current reports on Form 8-K, proxy statement and Forms 3, 4 and 5 filed by Garmin’s directors and executive officers and all amendments to those reports will be made available free of charge through the Investor Relations section of Garmin’s Internet website (http://www.garmin.com) as soon as reasonably practicable after such material is electronically filed with, or furnished to, the Securities and Exchange Commission
(the “SEC”). The SEC maintains an Internet site (http://www.sec.gov) that contains reports, proxy and
information statements, and other information regarding issuers that file electronically with the SEC.
The reference to Garmin’s website address does not constitute incorporation by reference of the information contained on this website, and such information should not be considered part of this report on Form 10-K.
3
Company Overview
Garmin is a leading, worldwide provider of navigation, communication and information devices and applications, most of which are enabled by Global Positioning System (“GPS”) technology. Garmin designs, develops, manufactures and markets a diverse family of hand-held, portable and fixed-mount GPS-enabled products and other navigation, communications and information products for the automotive/mobile, outdoor/fitness, marine, and general aviation markets.
Overview of the Global Positioning System
The Global Positioning System is a worldwide navigation system which enables the precise determination of geographic location using established satellite technology. The system consists of a constellation of orbiting satellites. The satellites and their ground control and monitoring stations are maintained and operated by the United States Department of Defense, which maintains an ongoing satellite replenishment program to ensure continuous global system coverage. Access to the system is provided free of charge by the U.S. government.
Prior to May 2000, the U.S. Department of Defense intentionally degraded the accuracy of civilian GPS signals in a process known as Selective Availability (‘‘SA’’) for national security purposes. SA variably degraded GPS position accuracy to a radius of 100 meters. On May 2, 2000, the U.S. Department of Defense discontinued SA. In a presidential policy statement issued in December 2004, the Bush administration indicated that the U.S. does not intend to implement SA again and is committed to preventing hostile use of GPS through regional denial of service, minimizing the impact to peaceful users. With SA removed, a GPS receiver can calculate its position to an accuracy of approximately 10
meters or less, enhancing the utility of GPS for most applications.
The accuracy and utility of GPS can be enhanced through augmentation techniques which compute any remaining errors in the signal and broadcast these corrections to a GPS device. The Federal Aviation Administration (“FAA”) has developed a Wide Area Augmentation System (‘‘WAAS’’) comprising ground reference stations and additional satellites that improve the accuracy of GPS positioning available in the United States and portions of Canada and Mexico to approximately 3 meters. WAAS supports the use of GPS as the primary means of enroute, terminal and approach navigation for aviation in the United States. The increased accuracy offered by WAAS also enhances the utility of
WAAS-enabled GPS receivers for consumer applications. The FAA announced on July 11, 2003 that the WAAS system had achieved initial operating capability and that the system was available for instrument flight use with appropriately certified avionics equipment. Since that time, the FAA has installed additional ground reference stations and has launched additional WAAS satellites.
Japan’s MTSAT-based Satellite Augmentation System (MSAS) achieved initial operating capability for en route, terminal and approach navigation for aviation in September 27, 2007. Garmin is working closely with the European Satellite Services Provider (ESSP) in preparation for the European Geostationary Navigation Overlay Service (EGNOS) aviation Safety of Life (SoL) service declaration which is planned in 2011.
Recent Developments in the Company’s Business
Since the inception of its business, Garmin has delivered over 81 million products, which includes the delivery of over 16 million products during 2010.
Acquisitions
In September 2010 Garmin acquired MetriGear, Inc., the creator of a pedal-based power measurement solution for cyclists that integrates a force and motion sensor platform into the spindles of bicycle pedals to measure a cyclist’s performance.
In October 2010 Garmin acquired Belanor AS, the distributor of Garmin’s automotive, outdoor recreation, fitness and marine products in Norway.
4
Automotive/Mobile Product Introductions
In January 2010 Garmin announced the
zūmo
®
220 and
zūmo
665 touchscreen navigators for motorcycles, ecoRoute™ hd, a device that transforms a compatible Garmin navigation device into a real-time onboard diagnostics computer, and Voice Studio™, a free PC application that lets anyone record their own voice to create custom pre-recorded navigation prompts for use on compatible Garmin navigation
devices.
In April 2010 Garmin announced the nüvi
®
3700 series of portable navigation devices featuring an ultra-thin, pocket-friendly design and large-screen, high-resolution glass displays with capacitive touch panels
In September 2010 Garmin announced the nüvi 2200 and nüvi 2300 series of entry-level portable navigation devices and the nüLink! 1695 five-inch touchscreen portable navigation device that connects drivers with relevant, online information from Garmin’s nüLink! service, including links to online information like Google™ Local Search, traffic, weather, fuel prices, flight status, and other real-time, location-relevant content.
In November 2010 Garmin announced that it would provide an integrated navigation package for the 2011 Suzuki Grand Vitara and SX4 models which would offer connectivity to wireless online information like Google™ local search, traffic, weather, fuel prices, movie listings, flight status, local events, and white page telephone listings
During 2010, Garmin-Asus, a co-branded alliance between Garmin and ASUSTeK
®
Computer Inc. (“ASUS”), introduced the nüvifone™ A10, A50 and M10 location-centric mobile handset models. In October 2010 Garmin and ASUS announced that they would not introduce any new co-branded handset models going forward but would continue to sell and support models that they had already introduced to the market. ASUS announced that it would design and manufacture new models of ASUS-branded mobile phones, some of which would include
preloaded Garmin navigation and Location Based Service (LBS) applications. Garmin announced that it would expand its mobile handset application development and would offer navigation and other applications through certain consumer application stores.
Outdoor/ Fitness Product Introductions
Garmin expanded its line of products for golfers in 2010 with the introduction of the Approach
®
G3 golf-specific handheld and the Approach S1 GPS wristwatch designed specifically for golf.
Garmin also expanded its line of products for cyclists in 2010 with the introduction of the Edge
®
800 cycling computer which combines the most popular aspects of the industry-leading Edge 500 and Edge 705 while adding a touchscreen interface.
Garmin added to its line of products for running enthusiasts in 2010 with the introduction of the Forerunner
®
110, 210 and 410 GPS-enabled sports watches.
In June 2010 Garmin announced the GPSMAP
®
62 series of rugged outdoor handheld devices for hunters, hikers, geocachers and outdoors enthusiasts. Also in June 2010 Garmin announced the DC™ 40 tracking collar, for Garmin’s Astro
®
GPS Dog Tracking System.
In October 2010 Garmin announced chirp™, a wireless beacon designed specifically for geocaching, which can communicate with, and be programmed by, any compatible wireless-enabled Garmin handheld.
In December 2010 Garmin announced the creation of OpenCaching.com, a free online community for creating, sharing and finding geocaches around the world.
Marine Product Introductions
In January 2010 Garmin announced the GPSMAP
®
700 series of seven-inch touchscreen controlled stand-alone marine chartplotters with radar capability and built-in sonar.
5
In February 2010 Garmin announced the AIS 300 receiver that enables monitoring of other nearby Class A and Class B Automatic Identification System (AIS)-enabled vessels that may pose a collision risk.
In April 2010 Garmin announced the GPSMAP
®
78 series of marine-friendly GPS handhelds featuring a new contemporary industrial design with rubber side grips.
In September 2010 Garmin announced the GHP™ 12 sailboat autopilot system for 20- to 70-foot sailboats equipped with linear-actuated steering systems.
In November 2010 Garmin announced the echo™ series of standalone fishfinders with Garmin HD-ID™ target tracking technology. Also in November 2010 Garmin announced the GMR™ 404 xHD and GMR 406 xHD, two new 4 kilowatt open-array marine radars.
Aviation Product Introductions and Certifications
During 2010 Garmin announced two new products for the helicopter market, the G500H all-glass avionics system designed specifically for helicopters and a Helicopter Terrain Awareness and Warning System (HTAWS) for use with Garmin’s GNS 430W/530W navigators.
In July 2010 Garmin announced that it was developing a new stability augmentation system called Garmin’s Electronic Stability and Protection (Garmin ESP) system which would be offered as an option for Garmin’s G1000 and G3000 integrated flight decks and which would assist the pilot in maintaining the aircraft in a safe, flight-stable condition, helping in certain situations to prevent the onset of stalls and spins, steep spirals or other loss-of-control conditions should the pilot become distracted, disoriented or incapacitated during flight. Also in July 2010 Garmin announced the GSR 56 Iridium datalink and GDL 59 data logger and Wi-Fi datalink and announced that the Federal Aviation Administration
(FAA) had granted Supplemental Type Certification (STC) for the G1000 integrated flight deck in the Cessna CitationJet.
In October 2010 Garmin announced that it was developing the G5000™ integrated flight deck for the Part 25 business jet market and Cessna Aircraft Company announced that it was developing a larger version of its Citation X jet which would feature the Garmin G5000 flight deck.
In December 2010 Garmin announced that had received the European Aviation Safety Agency’s (EASA) validation of the U.S. STC (Supplemental Type Certificate) for the installation of the Garmin G1000 avionics suite in the King Air 200 and B200.
Products
Garmin has achieved a leading market position and a history of growth in revenues and profits by offering ergonomically designed, user-friendly products with innovative features and designs covering a broad range of applications and price points. Garmin’s target markets are currently broken down into its four main business segments – automotive/mobile, outdoor/fitness, marine and aviation.
Automotive/Mobile
Garmin offers a broad range of automotive navigation products, as well as a variety of products and applications designed for the mobile GPS market. Garmin believes that its products are known for their value, high performance, ease of use, innovation, and ergonomics. The table below includes a sampling of the primary automotive and mobile products that Garmin currently offers to consumers around the world
.
6
|
nüvi
®
|
|
|
(52 models)
|
The nüvi is Garmin’s popular personal navigation device (PND). All nüvi models combine a full-featured GPS navigator (with built-in maps) with Garmin’s uniquely simple user interface. Different nüvi models and optional add-ons offer a plethora of additional feature sets, including a wide screen display, integrated traffic receiver for traffic data (including some models with lifetime traffic updates), bundled lifetime map updates, spoken street names, voice recognition, speed limit indication, lane assist, 3-D building view, junction view, Bluetooth
®
hands-free
capability, built-in maps of Europe, and the ability to add custom points of interest and a custom GPS voice. Numerous newer nüvi models also offer a feature called ecoRoute™, which is a feature designed to help improve the vehicle’s fuel efficiency by suggesting route calculations based upon less fuel usage and a driving challenge program that helps reinforce fuel-efficient driving practices. Garmin’s newest nüvi models – the 3700 series – offer an award-winning, super-thin design and such other newer features as a multi-touch glass display, nüRoute™ technology, 3-D terrain view, and pedestrian mode. In fiscal years 2010, 2009, and 2008, the nüvi class of products represented approximately 54%, 63%, and 64% of Garmin’s total consolidated revenues.
|
|
zūmo
®
|
|
|
(4 models)
|
Motorcycle-specific navigators with features including a glove-friendly touch screen with high bright sunlight-readable display, motorcycle mount, vibration-tested design, and Bluetooth wireless technology. An SD (secure digital) card slot allows riders to share their favori
te places and rides with fellow zūmo riders. The zūmo 660 features 3-D building view and lane assist and a digital fuel gauge. The zūmo 220 offers a smaller form factor than previous models, while the 665 includes an antenna for XM Satellite Radio
®
, XM NavWeather
®
and XM NavTraffic
®
(subscription is required for XM content).
|
|
StreetPilot
®
app
|
Launched in January 2011, this smartphone application allows Apple iPhone
®
or iPad
®
users to download premium Garmin navigation to their device, allowing for turn-by-turn, voice-prompted directions and other popular Garmin navigation features.
|
|
Garmin Mobile
®
for
|
|
|
BlackBerry
|
Garmin Mobile for BlackBerry is a subscription-based software application that lets compatible BlackBerry devices function as versatile GPS navigators.
|
Outdoor/Fitness
The table below includes a sampling of the outdoor and fitness products that Garmin currently offers to consumers around the world.
|
Forerunner
®
|
|
|
(9 models)
|
Compact, lightweight training assistants for athletes with integrated GPS sensor (except for FR60 fitness watch) that provide time, speed, distance, pace and other data. Some models also offer a heart rate monitoring function. The FR 60 is an entry-level advanced fitness watch that allows runners and walkers to track their workouts and automatically upload their data (via a wireless USB ANT™ Stick) to a personal computer. The Forerunner 405 is a compact-sized, wrist-worn GPS-enabled device that allows runners and joggers to track their speed, distance, heart rate and location, access their training history or challenge a Virtual Partner™ and automatically upload their data
wirelessly to a personal computer. The Forerunner 405CX adds heart-rate based calorie computation and improved comfort to the numerous features available on the Forerunner 405. The Forerunner 310XT model, which was designed specifically for triathletes, is water-resistant to 50m and tracks biking and running data (and optional heart rate data). The Forerunner 410 — the highest end model in the Forerunner family — offers an enhanced touch bezel designed to allow users to quickly scroll and select features on the run.
|
7
|
Edge
®
|
|
|
(6 models)
|
Integrated personal training systems designed for cyclists. The Edge 205 measures speed, distance, time, calories burned, climb and descent, altitude and more. The Edge 305 adds a heart rate monitor and/or wireless speed/pedaling cadence sensor. The Edge 605 and 705 provide mapping capabilities (including street navigation) and a 2.2” color display in addition to tracking vertical profiles, climb and descent, altitude, speed, distance, and time. The Edge 500 is geared toward performance-driven cyclists by offering the ability to track even more performance data in a streamlined form factor. The newest model — the Edge 800 — added a touchscreen interface
to the Edge family of products.
|
|
Dakota
®
|
|
|
(2 models)
|
The Dakota series is Garmin’s entry level series of handheld GPS navigators with built-in mapping. The Dakota 10 is a rugged, palm-sized navigator that offers a touchscreen display, high-sensitivity GPS, and a built-in worldwide basemap. The Dakota 20 adds a barometric altimeter, 3-axis electronic compass, and a microSD™ card slot for optional customized maps. The 20 model also allows a user to share waypoints, tracks, routes and geocaches wirelessly with other compatible Dakota, Foretrex
®
, Oregon
®
and
Colorado
®
users.
|
|
Oregon
®
|
|
|
(4 models)
|
The Oregon series combines a bright 3 inch color touchscreen, rugged design and a variety of hiker-friendly features. The Oregon 450 and Oregon 450t offer a rugged, sunlight-readable, touchscreen along with a built-in basemap with shaded relief, a high-sensitivity receiver, barometric altimeter, 3-axis electronic compass, microSD™ card slot, picture viewer and more. The high-end Oregon 550 and 550t models each come with a built-in 3.2 megapixel autofocus digital camera with 4x digital zoom, and each photo taken by these devices is automatically geotagged with the location of where it was taken, allowing the user to navigate back to that exact spot in the future.
|
|
Rino
®
|
|
|
(5 models)
|
Handheld two-way Family Radio Service (FRS) and General Mobile Radio Service (GMRS) radios that integrate two-way voice communications with GPS navigation. Features include patented “peer-to-peer position reporting” so you can transmit your location to another Rino radio. The Rino 110 offers an FRS/GMRS radio plus basic GPS navigator. The Rino 120 adds an internal basemap and MapSource compatibility for street-level mapping. The Rino 130 has 24 MB of internal memory, built-in electronic compass, barometric sensor, and National Oceanic and Atmospheric Administration (NOAA) weather radio receiver. The Rino 520HCx has a high sensitivity GPS receiver, 5
watts of transmit power, color display, mini-USB interface, and a turn-by turn automatic route calculation for use in automobiles. The Rino 530HCx has all of the features of the Rino 520HCx, plus a seven-channel weather receiver, electronic compass, and barometric altimeter.
|
8
|
GPSMAP
®
62
|
|
|
(3 models)
|
Rugged outdoor handheld devices for hunters, hikers, geocachers and outdoors enthusiasts. The basic GPSMAP 62 includes a built-in worldwide basemap with shaded relief. The GPSMAP 62s adds a 3-axis tilt-compensated electronic compass and wireless connectivity for sharing routes, tracks, waypoints and geocaches between other compatible Garmin handhelds. The GPSMAP 62s also includes a barometric altimeter that tracks changes in pressure to pinpoint the precise altitude. In addition to these features, the GPSMAP 62st includes preloaded 100K topographic maps for the entire United States (or preloaded 50K topographic mapping of Canada for the Canadian version).
|
|
Approach
®
|
|
|
(3 models)
|
The Approach G5 is a waterproof, touchscreen, handheld GPS for golfers that features over 14,000 preloaded golf course maps. Approach G5 uses a high-sensitivity GPS receiver to measure individual shot distances and show the exact yardage to fairways, hazards and greens. A new statistic-tracking feature was made available by download for the G5 in 2010 that allows users to track and analyze their golf statistics. The Approach G3 is a smaller, lighter version of the G5, yet still offers over 14,000 preloaded courses. Neither model requires any ongoing subscription fees. In October 2010, Garmin announced the newest Approach model – the Approach
®
S1. The S1 is a wearable golf watch that displays precise yardages to the front, back and middle of greens and comes preloaded with over 14,000 courses.
|
|
Astro
®
|
High sensitivity GPS-enabled dog tracking system. The Astro is designed to pinpoint up to ten dogs’ positions at one time through all-weather collars and a handheld system. The system also provides a Dog Tracker page and a Covey Counter
tm
to assist the hunter. It is loaded with many of the features of our outdoor devices including: barometric altimeter, electronic compass, microSD slot, area calculator and a waterproof exterior.
|
|
GTU-10 GPS Tracker
|
On January 4, 2011, Garmin announced the GTU™10, which represents a new category of product for Garmin. The GTU10 is a GPS locator that combines a web-based tracking service with GPS technology so the user can keep track of children, pets and property by monitoring the device’s location through either a phone or the internet. The GTU 10 is expected to launch in the first quarter of 2011.
|
Marine
Garmin’s marine products include handhelds, network products and multifunction displays, fixed-mount GPS/chartplotter products, instruments, fishfinders, radar, autopilots, VHF radios, marine networking products, and sounder products. The table below includes a sampling of some of the marine products that Garmin currently offers to consumers.
Marine Chartplotters and Networking Products
|
GPSMAP
®
7000 series
|
|
|
(4 models)
|
The GPSMAP 7000 series of large format multi-function displays introduced Garmin’s G Motion technology, which represents an upgrade in speed, smoothness and clarity over prior plotters. G Motion technology delivers ultra-smooth map panning and zooming with virtually seamless graphical updating in all dimensions. The 7000 series chartplotters also feature a low-level backlight display and a backlit keypad for use in low-light conditions without compromising vision. The GPSMAP 7x15 series offers a huge 15-inch diagonal XGA (1024 x 768 pixel) sunlight readable touchscreen display, and is offered in two models – the GPSMAP 7015 with an enhanced worldwide satellite imagery
basemap; and the GPSMAP 7215, which comes pre-loaded with highly detailed U.S. coastal charts and Explorer Charts for the Bahamas. Mariners can also opt for the same XGA resolution in a 12-inch diagonal screen configuration with the GPSMAP 7012 and GPSMAP 7212 models, which offer a worldwide basemap and coastal charts respectively. All models are compatible with an optional wireless remote and a wireless mouse for additional flexibility and also offer expanded “plug-and-play” access to onboard sensors, with NMEA 2000 and Garmin Marine Network connectivity (the Garmin Marine Network is a system that combines GPS, radar, XM WX Satellite Weather, sonar, and other data).
|
9
|
GPSMAP
®
6000 series
|
|
|
(4 models)
|
Like the 7000 series, the 6000 series models also offer Garmin’s G Motion technology and the features to improve visibility in low-light conditions. The GPSMAP 6x12 series features a traditional soft-key interface with an alphanumeric keypad and a 12-inch diagonal XGA (1024 x 768 pixel) sunlight readable display. Within this family, Garmin offers the GPSMAP 6012 with an enhanced worldwide satellite imagery basemap; and the GPSMAP 6212 with highly detailed U.S. coastal charts and Explorer Charts for the Bahamas preloaded. For a smaller display, the GPSMAP 6x08 series offers an 8-inch VGA (640 x 480) sunlight readable display with a soft-key interface. The models in
the GPSMAP 6000 series are all compatible with an optional wireless remote and also offer expanded “plug-and-play” access to onboard sensors, with NMEA 2000 and Garmin Marine Network connectivity.
|
|
GPSMAP
®
5000 series
|
|
|
(6 models)
|
These touch-screen multifunction displays for the Garmin Marine Network (a system that combines GPS, radar, XM WX Satellite Weather, sonar, and other data) offer ease of use and video-quality resolution and color. The 5212 and 5208 come pre-loaded with detailed U.S. coastal charts, including Explorer Charts, and are compatible with Garmin’s BlueChart
®
g2 Vision™ charts (sold separately) which offer high-resolution satellite imagery, 3-D map perspective, aerial reference photos, and auto guidance. The 5215 and 5015 offer 15-inch diagonal sunlight-readable touchscreen displays.
|
|
GPSMAP
®
4000 series/
|
|
|
4200 series (6 models)
|
These multifunction displays for the Garmin Marine Network offer ease of use and video-quality resolution and color. The 4212 and 4208 come pre-loaded with detailed U.S. coastal charts, including Explorer Charts, and are compatible with Garmin’s BlueChart
®
g2 Vision™ charts (sold separately) which offer high-resolution satellite imagery, 3-D map perspective, aerial reference photos, and auto guidance. The 4210 and 4010 feature 10.4-inch diagonal sunlight- readable displays and Garmin’s newer marine user interface.
|
|
GPSMAP
®
6x0and 7x0 series
|
|
|
(6 models)
|
The 6x0 series chartplotters offer a super-bright WVGA touchscreen display and provide navigational support for both marine mode and automotive mode (when loaded with optional City Navigator
®
NT road maps for North America). The 7x0 models are touchscreen controlled stand-alone marine chartplotters offering radar capability and built-in sonar..
|
|
GPSMAP
®
5x6 and 5x1
|
|
|
series (12 models)
|
Building upon the success of the GPSMAP 400 and 500 series, the new chartplotters in the GPSMAP 5x6 and 5x1 series come standard with an internal high-sensitivity GPS receiver that allows for faster acquisition times and better satellite tracking so that boaters are able to acquire and maintain a GPS fix more easily. In addition, these units boast an improved, high-speed digital design that will increase map drawing and panning speeds. The sounder (“s”) version of each model comes with a powerful dual-frequency transducer that clearly illustrates depth contours, fish targets and structures in either fresh or salt water. Many of the new models in this series are also NMEA 2000
certified and can interface with Garmin’s full lineup of NMEA 2000 marine sensors and autopilots, as well as many other third-party sensors.
|
10
|
GPSMAP
®
4x1
|
|
|
series (6 models)
|
With a 4-inch QVGA sunlight-readable display, the GPSMAP 4x1 series was designed for the boater who wants high performance in a small package. These units feature a high-sensitivity GPS receiver and faster processors, and are offered with the same cartography configuration as the GPSMAP 5x1 series. Likewise, the GPSMAP 4x1s series is also available with a built-in sonar with a 500-watt RMS dual-frequency transducer for offshore use and a 400-watt RMS with a dual beam transducer for inland use. For satellite weather and radio data, the GPSMAP 441 and 421 are also compatible with the GXM 51 receiver.
|
|
GSD 21 and 22
|
These “black-box” sounders interface with Garmin display units and chartplotters and enhance their utility by providing the depth sounder and fish finder functions in a remote mounted package.
|
|
GMS 10
|
The GMS 10 Network Port Expander is the "nerve center" of the Garmin Marine Network. This 100-Mbit switch is designed to support the connection of multiple sensors to the Garmin Marine Network.
|
Other Marine Products
|
GMI 10
|
The GMI 10 is a NMEA 2000 and NMEA 0183 compliant instrument that displays data from multiple remote sensors on one screen. Mariners can use the GMI 10 to display instrument data such as depth, speed through the water, water temperature, fuel flow rate, engine data, fuel level, wind direction and more, depending upon what sensors are connected.
|
|
GPSMAP 78
|
|
|
(3 models)
|
Marine-friendly GPS handhelds featuring a new contemporary industrial design with rubber side grips. The flagship GPSMAP 78sc model adds high-end features such as a 3-axis tilt-compensated electronic compass, wireless data transfer between compatible units and preloaded cartography for the coastal United States.
|
|
VHF Marine Radios
|
|
|
(4 models)
|
This series of marine radios offers differing feature sets for the radio needs of all types of mariners. The VHF 100 is an entry-level, NMEA 0183 compatible VHF marine radio. The VHF 200 is NMEA 2000 compatible. The next step up is the VHF 300, which is designed for 35+ foot boats and is NMEA 2000 and NMEA 0183 compatible and offers multi-station support. Also designed for 35+ foot boats, the VHF 300 AIS is NMEA 2000 and NMEA 0183 compatible, offers multi-station support, and monitors all AIS channels at the same time.
|
|
Marine
|
|
|
Autopilot Systems
|
|
|
(4 models)
|
The newest entry to Garmin’s marine autopilot lineup is the GHP 12, a full-featured marine autopilot designed specifically for sailboats. This second-generation autopilot is designed for 20- to 70-foot sailboats with linear-actuated steering systems. For power boats, the GHP 10 autopilot comes with Garmin’s patented Shadow Drive™ technology, which automatically disengages the autopilot if the helm is turned, allowing the helmsman to maneuver the boat. This autopilot automatically re-engages when a steady course is held by the helmsman. The TR-1 Gold Marine Autopilot offers worry-free remote steering and speed control to operators of small gasoline outboard motor boats up to
20 horsepower. Finally, the GHP 10V Autopilot System for Volvo Penta IPS and Sterndrive Joystick Systems is approved for use with boats that have an integrated Volvo Penta IPS steering and propulsion system and features Garmin’s proven and innovative Shadow Drive™ technology – a patented capability that automatically disengages the autopilot if the helm is turned, allowing for quick and safe manual maneuvers without manually disengaging the autopilot.
|
11
|
Fishfinders
|
|
|
(10 models)
|
Garmin offers 10 different fishfinder options spanning various price points. The latest addition to Garmin’s fishfinder lineup is five different models of Garmin’s new echo™ fishfinder series, a line of standalone fishfinders that all offer an updated look and new Garmin HD-ID™ target tracking technology. The echo™ line ranges in price points from models with grayscale displays to the highest-end echo 550C, which features a video-quality 640x480 pixel 5-inch VGA screen, a powerful 500-watt sonar transmitter, and offers fish arch display and bottom tracking as deep as 1,900 feet. In addition to the echo™ series, Garmin also offers five additional
fishfinder options. All of these models feature Garmin’s Ultrascroll™ technology, which allows boaters to get a faster refresh rate on their sonar display, and dual-beam transducer operation. Three of these models offer color displays. The Fishfinder 400C comes with dual beam or dual frequency transducers for easy adaptability to either freshwater or saltwater fishing. It also offers a new, easy-to-use interface and built in CANet connectivity to enable sonar data to be shared with compatible Garmin chartplotters.
|
|
Radar
|
|
|
(11 models)
|
Garmin offers both radomes and open array radar products with compatibility to any network-compatible Garmin chartplotter so that the chartplotter can double as the radar screen. The GMR™ 18 and 24 models are digital radome products in various sizes and power specifications. The GMR 404 and 406 open array radar scanners provide even greater clarity and a 72 nautical mile range. The GMR 18 HD and GMR 24 HD radomes feature digital signal processing providing sharper radar imagery and improved target separation. The newest generation of open-array digital radar scanners are the GMR™ 1204/1206 xHD, the GMR 604/606 xHD and the GMR 404/406 xHD models, which
transmit with 12, 6 and 4 kilowatts of power respectively. All six of these open-array scanners have a maximum effective range of 72 nautical miles. These new xHD scanners provide up to eight times more sampling data than Garmin’s current open-array offerings.
|
Aviation
Garmin’s aviation product line includes GPS-enabled navigation, VHF communications transmitters/receivers, multi-function displays, electronic flight instrumentation systems (EFIS), automatic flight control systems, traffic advisory systems and traffic collision avoidance systems, instrument landing system (ILS) receivers, surveillance products, audio panels, cockpit datalink systems and more.
12
Garmin’s aviation products have won prestigious awards throughout the industry for their innovative features and ease of use. The GNS 430/530W offers multiple features and capabilities integrated into a single product. This high level of integration minimizes the use of precious space in the cockpit, enhances the quality and safety of flight through the use of modern designs and components and reduces the cost of equipping an aircraft with modern electronics. The GNS 430 was recognized by
Flying
Magazine as the Editor’s Choice Product of the Year for 1998. In 1994, and again in 2000, Garmin earned recognition
from the Aircraft Electronics Association for outstanding contribution to the general aviation electronics industry. The GPSMAP 295 won
Aviation Consumer
Magazine’s Gear of the Year award for best aviation portable product in 2000 and again in 2001.
Flying
Magazine’s editors awarded the GPSMAP 396 with a 2005 Editors’ Choice Award for outstanding achievements. The GPSMAP 496, introduced in 2006, won the “2006 Gear of the Year” award from
Aviation Consumer
magazine.
Flying
Magazine’s editors awarded Garmin a 2007
Flying
Editors’ Choice Award for making the safety and precision of WAAS (Wide Area Augmentation System) available in its GPS navigation systems. Garmin was also selected as “Best GPS Ever” by
Aviation Consumer
magazine for the GPSMAP
®
696 in 2009, and in 2010 the Garmin aera™ series aviation GPS was selected as best portable product. Garmin has been ranked No. 1 among aviation cockpit electronics manufacturers for product support in
Professional Pilot
magazine’s survey of its readers in each of
the last seven survey years.
Aviation International News
also ranked Garmin No. 1 in product support in 2010 and in each of the preceding seven years, as well. Garmin received the Airline Technology Achievement Award from
Air Transport World Magazine
in January 2005 for championing the development of Automatic Dependent Surveillance-Broadcast (ADS-B) technology, an enabling technology for air traffic management.
Garmin’s aviation products are sold in both new aircraft/helicopters and the retrofit market where existing aircraft/helicopters are fitted with the latest electronics from Garmin’s broad product line.
Garmin has also expanded its range of avionics offerings to leading General Aviation aircraft manufacturers such as the Cessna Aircraft Company, Cirrus Aircraft, Hawker Beechcraft Corporation, Diamond Aircraft Industries, Embraer, Piper Aircraft, Inc., DAHER- SOCATA and Quest Aircraft through the installation of the G1000 integrated flight deck as original equipment aboard new aircraft. This system integrates attitude, heading, air data, navigation, communication, engine monitoring, and other aircraft functions into a single cohesive system which interfaces with the flight crew using a set of large, bright TFT displays. The G1000 also includes an integrated autopilot – the
GFC700. Garmin also has expanded its G1000 certifications to the business jet segment, such as Cessna’s Citation Mustang jet and Embraer’s Phenom 100 and Phenom 300. Garmin has also announced its next generation integrated flight deck systems, the G3000 and G5000. Cessna Aircraft Company announced in October 2010 that they have selected Garmin’s G5000 for their flagship business jet, the Citation Ten. Both Honda Aircraft Corporation and Piper Aircraft simultaneously announced that the G3000 has been selected for the HondaJet and PiperJet respectively.
The table below includes a sampling of some of the aviation products currently offered by Garmin:
Handheld and portable aviation products:
|
aera
®
series
|
|
|
(4 models)
|
Garmin’s newest aviation handheld series combines the latest aviation portable with a full-featured automotive GPS, allowing pilots to transition between aviation to automotive mode with one touch. Featuring a crisp 4.3-inch QVGA wide-format display with touchscreen interface, all four aera models come with preloaded automotive maps, a built-in terrain/obstacles aviation database, patented Panel Page instrument display, and other features. When in aviation mode, pilots see colorful icons that use intuitive pictures and labels to indicate their function. The exterior of each aera model (500, 510, 550 and 560) is identical, but the software features of each model are
tailored to those seeking an entry, mid or high-level aviation handheld.
|
|
GPSMAP 695/696
|
The GPSMAP 696 offers a bright 7-inch screen, preloaded detailed electronic charts, preloaded airways and IFR map mode. The GPSMAP 696 has a receiver for XM radio and XM WX Satellite Weather (U.S. customers only) that gives next generation radar (NEXRAD), aviation routine weather reports (METARs), terminal aerodrome forecasts (TAFs), temporary flight restrictions (TFRs), lightning, winds aloft, turbulence forecasts, and several other important weather products (XM subscription required). The GPSMAP 695 has the same features except for XM radio and weather. In July 2010, Garmin announced that the 695/696 would receive new enhanced chart capabilities.
|
13
|
Pilot My-Cast
SM
|
Pilot My-Cast by Garmin is a premium flight planning, flight plan filing, and pre-flight weather application for display on compatible mobile phones. Compared to other aviation weather cell phone applications, Pilot My-Cast is unique because it receives aviation data directly from the National Weather Service, Environment Canada, and Federal Aviation Administration. Pilot My-Cast is available for both the iPhone
®
and iPad
®
.
|
Integrated avionics systems:
|
G5000™
|
Following the announcement of the G3000 one year earlier, in October 2010 Garmin announced the G5000, the first touchscreen-controlled integrated glass avionics suite designed for FAR Part 25 business jets. The G5000 — which is scalable for use in a wide range of two-crew aircraft, from light jets to super-midsize and larger models — is designed specifically for crew-flown turbine aircraft and combines a dual multi-sensor flight management system (FMS), touchscreen vehicle management units, and multi-pane cockpit displays. These widescreen displays with touchscreen controls give pilots more useful information at their fingertips than ever before, such as worldwide weather,
Garmin’s synthetic vision technology (SVT™), aircraft synoptics, electronic flight charts, and more.
|
|
G3000™
|
Announced in October 2009, the G3000, which is designed for use in FAR Part 23 turbine aircraft, is the first touchscreen-controlled integrated flightdeck for light turbine aircraft. It features extra-wide 14.1-inch displays with split-screen MFD viewing functionality and PFD terrain simulation in 3-D perspective with SVT™ Synthetic Vision Technology. In July 2010, Garmin announced a new stability augmentation function for the G3000 (and its predecessor G1000) called Garmin’s Electronic Stability and Protection (Garmin ESP) system. This electronic monitoring and correction technology for G3000 and G1000 integrated flight decks works to assist the pilot in
maintaining the aircraft in a safe, flight-stable condition, helping in certain situations to prevent the onset of stalls and spins, steep spirals or other loss-of-control conditions should the pilot become distracted, disoriented or incapacitated during flight. Garmin ESP will be offered as an option on select G3000 and G1000-equipped aircraft.
|
|
G1000
®
|
The G1000 integrates navigation, communication, attitude, weather, terrain, traffic, surveillance and engine information on large high-resolution color displays. The G1000 offers general aviation airplane manufacturers an easy-to-install solution for flight displays and provides the aircraft owner the benefits of a state-of-the-art avionics system which relies on modern technologies such as solid state components and bright, sunlight-readable TFT displays.
|
|
G600
|
The G600 brings the style and function of an all-glass integrated avionics suite to the retrofit market for FAR Part 23 Class I, II or III aircraft. The G600 incorporates two individual displays – a PFD and MFD – in a customized package specifically designed for easy retrofit installation. The G600 is designed to communicate and integrate with Garmin’s WAAS enabled panel mount products, and provides essential information such as attitude, air data, weather, terrain and traffic. Garmin has received the FAA’s Approved Model List Supplemental Type Certification (AML STC) for the G600, which will simplify certification for over 300 different aircraft
models.
|
|
G500
|
Designed specifically for FAR Part 23 Class I/Class II aircraft (singles and twins under 6,000 lbs.), the G500 is an affordable, dual-screen electronic flight display that works with a pilot’s separate Garmin avionics stack to provide a fully TSO’d “glass cockpit” retrofit option. The G500 does not include all of the same standard functionality as the G600 (for example, the G500 does not offer SVT (Synthetic Vision Technology) or a standard GAD 43 interface adapter.
|
14
|
G500H
|
An all-glass avionics system designed specifically for the VFR Part 27 helicopter market. The G500H contains dual 6.5-inch LCD screens, mounted side-by-side in a single bezel, which puts Primary Flight Display (PFD) and Multi-Function Display (MFD) capabilities right in front the helicopter pilot. The G500H has been optimized for rotorcraft and offers features like helicopter synthetic vision technology (HSVT™), helicopter-specific databases with over 7,000 heliports and nearly 30,000 additional low-altitude obstacles, XM WX Satellite Weather with NEXRAD, and the ability to display video from a forward looking infrared (FLIR) camera or other video sources.
|
|
G900X™
|
An all-glass integrated avionics system specifically designed for kitplane builders of the Lancair and Van’s RV-series aircraft. The G900X is a fully-customizable glass cockpit for installation in experimental/kitbuilt and light sport aircraft. The G900X offers a customizable PFD/MFD combination that features one, two or three all-glass displays; magnetometer; ADAHRS (combined air data and AHRS unit) and engine monitoring.
|
|
GDU 370/375
|
Multifunction displays for the light sport retrofit and experimental aircraft markets.
|
Panel-mount aviation products:
|
400W Series
|
|
|
(3 models)
|
The GNS 430W is the Wide Area Augmentation System (WAAS) successor to Garmin’s popular GNS 430, which was the world’s first ‘‘all-in-one’’ IFR certified GPS navigation receiver/traditional VHF navigation receiver/instrument landing systems receiver and VHF communication transmitter/receiver. Features available in different 400 series models include 4-color map graphics, GPS, communication and navigation capabilities. In 2010, Garmin announced a new Helicopter Terrain Awareness and Warning System (HTAWS) as an option for the GNS 430W/530W series navigators. When added to the GNS 430W/530W, helicopter pilots will receive graphical and
audible alerts of potential terrain and obstacle conflicts along the flight path.
|
|
500W Series
|
|
|
(2 models)
|
These units combine the features of the 400W series along with a larger 5” color display. The 530W Series comes standard with Wide Area Augmentation System (WAAS) capability and may be ordered with or upgraded to Class B Terrain Awareness and Warning System (TAWS-B) capability.
|
|
GTS™ TAS and
|
|
|
TCAS I Systems
|
The GTS 800 series of traffic avoidance products combines active and passive surveillance data to pinpoint specific traffic threats. The systems use Garmin’s patent-pending CLEAR CAS™ technology and correlates automatic dependent surveillance broadcast (ADS-B) with radar targets. The GTS 800 TAS is a lower-cost system, offering 40 watts of transmit power and a range of up to 12 nautical miles. The GTS 820 TAS delivers 250 watts of transmit power and up to 40 nautical miles of interrogation range. The GTS 850 TCAS I satisfies all TCAS I collision avoidance criteria for higher-capability turboprops and jets. It features the same 250 watt performance as the GTS 820, and
also meets the FAA’s TCAS I certification criteria
|
15
|
GI-102A & 106A
|
Course deviation indicators (CDIs). The GI-106A features an instrument landing system receiver to aid in landing.
|
|
GMA 240, 340 & 347
|
The GMA 340 is a feature-rich audio panel with six-place stereo intercom and independent pilot/co-pilot communications capabilities. The GMA 347 has automatic squelch, digital clearance recorder, and a full-duplex telephone interface. The GMA 340 and 347 are both TSO’d. The GMA 240 is a versatile, non-TSO’d audio panel designed for experimental and light sport aircraft.
|
|
GTX™ 330 & 330D
|
FAA-certified Mode S transponders with data link capability, including local air traffic information at FAA radar sites equipped with Traffic Information Service (TIS). These transponders may also be optionally upgraded to provide 1090 MHz Extended Squitter (ES) transmission capabilities, which will increase situational awareness once the Automatic Dependent Surveillance-Broadcast (ADS-B) system is fully implemented.
|
|
GTX 320A,327 & 328
|
FAA-certified transponders which transmit altitude or flight identification to air traffic control radar systems or other aircraft’s air traffic avoidance devices and feature solid-state construction for longer life. The GTX 327 offers a digital display with timing functions. The 328 is designed exclusively for Europe and satisfies the European requirement for a Mode S solution that meets the reduced certification requirements for the VFR Mode S mandate.
|
|
GDL 90
|
The GDL 90 was the first airborne Automatic Dependent Surveillance-Broadcast (ADS-B) product certified by the FAA to TSO C145A standards. The GDL 90 allows pilots in the cockpit and air traffic controllers on the ground to “see” aircraft traffic with much more precision than has ever been possible before without the costly infrastructure of ground based tracking radar. The GDL 90 relies on the infrastructure that is part of the FAA’s Safe Flight 21 program. This program is currently under development with implementation of the ground-based portion of the ADS-B network taking place along the East Coast and other selected areas of the
U.S.A. Additional installations of the ADS-B ground stations are planned. The ground stations can track aircraft movement and eventually are expected to be used to broadcast traffic and weather services. Pilots equipped with the GDL 90 and operating within the ground station coverage area will receive aircraft traffic and real-time weather information free of charge.
|
|
GSR 56
|
The GSR 56 is Garmin’s newest datalink product. It provides pilots with access to on-demand global weather information, text/voice communications and near real-time position tracking through the Iridium satellite network (subscription required). In addition to the many on-demand satellite weather features, the GSR 56 offers a worldwide tracking solution that continuously monitors an aircraft’s status enroute. It can automatically provide GPS-referenced position reports at predetermined intervals so those on the ground can track a plane’s flight status and position.
|
|
GDL 69 and 69A
|
The GDL 69 offers the ability to provide real-time weather information to the aircraft which can be displayed on one of several panel-mounted devices, such as the GNS 430, GNS 530, MX20, and G1000 systems. The GDL 69 and GDL 69A receive real-time weather information broadcast by the XM WX Satellite radio system. In addition, the GDL 69A expands the utility of the system by providing CD quality audio provided by XM Satellite Radio (separate subscriptions for weather data and audio required).
|
|
GMX 200™
|
A large (6.5 inch) sunlight-readable, high-resolution, multi-function display.
|
|
SL 30 and SL 40
|
The SL30 is a compact VHF navigation and communications unit that combines a 760-channel VHF communications radio with 200-channel glideslope and localizer receivers. The SL40 is a 760-channel VHF communications radio only. Both the SL30 and SL40 feature 10 watt communications transmitters.
|
16
|
GWX™ 68
|
The GWX 68 is an all-in-one antenna/receiver/transmitter that brings real-time weather to Garmin’s newest multi-function displays.
|
Sales and Marketing
Garmin’s non-aviation products are sold through a worldwide network of approximately 4,000 independent dealers and distributors in approximately 100 countries who meet our sales and customer service qualifications. No single customer’s purchases represented 10% or more of Garmin’s consolidated revenues in the fiscal year ended December 25, 2010. Marketing support is provided geographically from Garmin’s offices in Olathe, Kansas (North, South and Central America
),
in the U.K. (Eastern Europe, Middle East and Africa), France, Germany, Italy, Spain, Portugal, Austria, Sweden, Denmark, Finland, Belgium, Norway, Netherlands,
Poland, Australia (also covering New Zealand), China and in Taiwan (Asia). Garmin’s distribution strategy is intended to increase Garmin’s global penetration and presence while maintaining high quality standards to ensure end-user satisfaction.
Garmin’s U.S. consumer product sales are handled through its network of dealers and distributors who are serviced by a staff of regional sales managers and in-house sales associates. Some of Garmin’s larger consumer products dealers and distributors include:
|
|
·
|
Best Buy
—one of the largest U.S. and Canadian electronics retailers;
|
|
|
·
|
Amazon.com
—internet retailer;
|
|
|
·
|
Costco
—an international chain of membership warehouses that carry quality, brand name merchandise;
|
|
|
·
|
Halford’s
—a large European retailer specializing in car parts and accessories;
|
|
|
·
|
Petra
—a large distributor who sells to a wide range of dealers;
|
|
|
·
|
Target
— one of the nation’s largest general merchandise retailers;
|
|
|
·
|
Wal-Mart
—the world’s largest mass retailer; and
|
|
|
·
|
Wynit
—a large distributor who sells to a wide range of dealers.
|
Garmin’s Europe, Middle East, Australia/New Zealand and Africa consumer product sales are handled through our in-country subsidiaries or local distributors who resell to dealers. Working closely with Garmin’s in-house sales and marketing staff in the U.K. and U.S., these in-country subsidiaries or independent distributors are responsible for inventory levels and staff training requirements at each retail location. Garmin’s Taiwan-based marketing team handles the Company’s Asia sales and marketing effort.
Garmin’s retrofit avionics and aviation portable products are sold through select aviation distributors around the world and, in the case of aviation portable products, also through catalogs and pilot shops. Garmin’s largest aviation distributors include Aircraft Spruce & Specialty Co., Sportsman’s Market, TGH Aviation, Sarasota Avionics and Elliott Aviation. Avionics distributors have the training, equipment and certified staff required for at-airport installation of Garmin’s avionics equipment.
17
In addition to the traditional distribution channels mentioned, Garmin has many relationships with original equipment manufacturers (OEMs). In the consumer market, Garmin’s products are sold globally to automotive and motorcycle OEMs, either directly or through tier 2 sourcing. These OEMs include Chrysler, Toyota, Suzuki, Volkswagen, Harley-Davidson, Ford, BMW and BMW Motorrad, Honda, Mercedes Benz, Smart Car, Peugeot, Hyundai, Kia, Mazda, Nissan, Volvo, Bombardier, and Polaris. In 2010, Chrysler introduced Garmin navigation on the 2011 Jeep Grand Cherokee and also announced Garmin navigation on their new uConnect Touch system in partnership with Panasonic, which
will launch on select 2011 models.
In addition, Garmin continues to sell products and applications to Kenwood for bundling with Kenwood’s OEM products. Garmin also has relationships with certain rental car companies including Dollar/Thrifty, Enterprise, Avis, Budget, National, Europcar, Alamo, and Hertz (Europe). Garmin has also developed promotional relationships with certain automotive dealerships in certain countries including BMW, Southeast Toyota, Penske, Mazda, Saab and Ford. Garmin’s products are also standard equipment on various models of boats manufactured by Ranger Tugs, Cutwater Boats (a Division of Fluid Motion, LLC), Bayliner Boats (a division of Brunswick Corporation), Bavaria Yacht, Broom Boats Ltd., Chaparral Boats, Inc., Andros Boats,
Inc., Edgewater Boats, LLC, Bennington Marine, LLC, Cigarette Racing Team, LLC, Cobalt Boats, LLC, G3 Boats (a division of Yamaha Motor Corp.), Gulf Craft, Inc., Fairline Boats, Ltd. and Regal Marine Industries, Inc. and are optional equipment on boats manufactured by Tiara Yachts, Inc., Grand Banks Yachts, Ltd., Luhrs Corp., Maritimo Offshore Pty Ltd., Mastercraft Boat Company, LLC, Yellowfin Yachts, LLC, Sea Ray Corporation, Scout Boats, Inc., The Hinckley Company, Hunt Yachts, Inc. and Zodiac Hurricane Technologies, Inc. In the aviation market, Garmin’s avionics are either standard equipment or options on various models of aircraft built by Bell Helicopter Textron, Inc., Cessna Aircraft Company, Cirrus Aircraft, DAHER-SOCATA, Diamond Aircraft Industries, Inc., Embraer SA, Eurocopter, an EADS Company, Hawker Beechcraft Aircraft Company, Piper
Aircraft, Inc., Quest Aircraft Company, and Robinson Helicopter Company.
Competition
The market for navigation, communications and information products is highly competitive. Garmin believes the principal competitive factors impacting the market for its products are design, functionality, quality and reliability, customer service, brand, price, time-to-market and availability. Garmin believes that it generally competes favorably in each of these areas.
Garmin believes that its principal competitors for portable automotive products are TomTom N.V. and MiTAC Digital Corporation (“MiTAC”) (which distributes products under the brand names of Magellan, Mio, and Navman) and Navigon AG. Garmin believes that its principal competitors for outdoor/fitness product lines are Magellan, a subsidiary of MiTAC, Lowrance Electronics, Inc., a subsidiary of Navico (“Lowrance”) and Delorme and that its principal competitors for fitness products are Nike, Inc., Polar Electro Oy, Suunto Oy, Timex Corp. and Bryton Corp. For marine chartplotter products, Garmin believes that its principal competitors are Raymarine Inc.
(“Raymarine”), Furuno Electronic Company (“Furuno”), and Simrad and Lowrance (subsidiaries of Navico). For Garmin’s fishfinder/depth sounder product lines, Garmin believes that its principal competitors are Lowrance, Raymarine, the Humminbird division of Johnson Outdoors, Inc., and Furuno. For Garmin’s general aviation product lines, Garmin considers its principal competitors to be Honeywell, Inc., Avidyne Corporation, L-3 Avionics Systems, Rockwell Collins, Inc., Sagem Avionics, Inc., Universal Avionics Systems Corporation, Chelton Flight Systems, Aspen Avionics, and Free Flight Systems for panel-mount GPS and display units. For Garmin’s Family Radio Service and General Mobile Radio Service product line, Garmin believes that its principal competitors are Motorola, Inc., Cobra Electronics Corporation and Midland Radio
Corporation.
Research and Development
Garmin’s product innovations are driven by its strong emphasis on research and development and the close partnership between Garmin’s engineering and manufacturing teams. Garmin’s products are created by its engineering and development staff, which numbered 2,340 people worldwide as of December 25, 2010. Garmin’s manufacturing staff includes manufacturing process engineers who work closely with Garmin’s design engineers to ensure manufacturability and manufacturing cost control for its products. Garmin’s development staff includes industrial designers, as well as software engineers, electrical engineers, mechanical engineers and cartographic
engineers. Garmin believes the industrial design of its products has played an important role in Garmin’s success. Once a development project is initiated and approved, a multi-disciplinary team is created to design the product and transition it into manufacturing.
18
Below is a table of Garmin’s expenditures on research and development over the last three fiscal years.
|
December 25,
|
December 26,
|
December 27,
|
||||||||||
|
2010
|
2009
|
2008
|
||||||||||
|
($'s in thousands)
|
||||||||||||
|
Research and development
|
$ | 277,261 | $ | 238,378 | $ | 206,109 | ||||||
|
Percent of net sales
|
10.3 | % | 8.1 | % | 5.9 | % | ||||||
Manufacturing and Operations
Garmin believes that one of its core competencies and strengths is its manufacturing capability at its Sijhih, Jhongli and LinKou, Taiwan facilities, its Olathe, Kansas facility, and its Salem, Oregon facility. Garmin believes that its vertically integrated approach has provided it the following benefits with respect to all products other than the legacy nüvifone products, which are manufactured by one or more third parties as part of the Garmin-Asus strategic alliance, a few select marine products (VHF radios and AIS receivers), and our accessory products, all of which are also manufactured by one or more third parties.
Reduced time-to-market.
Utilizing concurrent engineering techniques, Garmin’s products are introduced to production at an early development stage and the feedback provided by manufacturing is incorporated into the design before mass production begins. In this manner, Garmin attempts to reduce the time required to move a product from its design phase to mass production deliveries.
Design and process optimization.
Garmin uses its manufacturing resources to rapidly prototype design concepts, products and processes in order to achieve higher efficiency, improved quality and yields, lower cost and better value for customers. Garmin’s ability to fully explore product design and manufacturing process concepts has enabled it to optimize its designs to minimize size and weight in GPS devices that are functional, waterproof, and rugged.
Logistical agility.
Operating our own manufacturing facilities helps Garmin minimize problems, such as component shortages and long component lead times which are common in the electronics industry. Many products can be re-engineered to bypass component shortages or reduce cost and the new designs can be delivered to market quickly. Garmin reacts rapidly to changes in market demand by striving to maintain a safety stock of long-lead components and by rescheduling components from one product line to another. Operating our own manufacturing facilities also allows Garmin to quickly
adjust the mix of product production, helping to foster faster delivery response to the customer.
Garmin’s design, manufacturing, distribution, and servicing processes in our US, Taiwan, and UK facilities are certified to ISO 9001, an international quality standard developed by the International Organization for Standardization. Garmin’s Taiwan manufacturing facilities have also achieved TS 16949 certification, a quality standard for automotive suppliers. In addition, Garmin’s aviation operations have achieved certification to AS9100, the quality standard for the aviation industry.
Garmin (Europe) Ltd and Garmin Corporation have also achieved certification of their environmental management systems to the ISO14001 standard. This certification recognizes that Garmin’s UK and Taiwan subsidiaries have systems and processes in place to minimize or prevent harmful effects on the environment and to strive continually to improve its environmental performance.
Materials
Although most components essential to Garmin’s business are generally available from multiple sources, certain key components, including, but not limited to, microprocessors, certain liquid crystal displays (“LCDs”), and certain application-specific integrated circuits (“ASICs”) are currently obtained by the Company from single or limited sources, which subjects Garmin to supply and pricing risks. Many of these and other key components that are available from multiple sources, including, but not limited to, NAND flash memory, dynamic random access memory (“DRAM”), GPS chipsets and certain LCDs, are subject at times to industry-wide shortages and
commodity pricing fluctuations.
19
Garmin and other participants in the personal computer, mobile communication, aviation electronics and consumer electronics industries also compete for various components with other industries that have experienced increased demand for their products. In addition, Garmin uses some custom components that are not common to the rest of the personal computer, mobile communication and consumer electronics industries, and new products introduced by the Company often utilize custom components available from only one source until Garmin has evaluated whether there is a need for, and subsequently qualifies, additional suppliers. When a component or product uses new
technologies, initial capacity constraints may exist until the suppliers’ yields have matured or manufacturing capacity has increased. Garmin makes efforts to manage risks in these areas through the use of supply agreements for strategically important components. Nevertheless, if Garmin’s supply of a key single-sourced component for a new or existing product were delayed or constrained, if such components were available only at significantly higher prices, or if a key manufacturing vendor delayed shipments of completed products to Garmin, the Garmin’s financial condition and operating results could be materially adversely affected. Garmin’s business and financial performance could also be adversely affected depending on the time required to obtain sufficient quantities from the original source, or to identify and obtain sufficient
quantities from an alternative source. Continued availability of these components at acceptable prices, or at all, may be affected if those suppliers decided to concentrate on the production of common components instead of components customized to meet the Garmin’s requirements
Seasonality
Our sales are subject to significant seasonal fluctuation. Sales of our consumer products are generally significantly higher in the fourth quarter, due to increased demand for automotive/mobile products during the holiday buying season, and, to a lesser extent, the second quarter, due to increased demand during the spring and summer marine season and the Father’s Day/graduation buying season. Sales of consumer products are also influenced by the timing of the release of new products. Our aviation products do not experience much seasonal variation, but are more influenced by the timing of the release of new products when the
initial demand is typically the strongest.
Backlog
Our sales are generally of a consumer nature and there is a relatively short cycle between order and shipment. Therefore, we believe that backlog information is not material to the understanding of our business. We typically ship most orders within 72 hours of receipt.
Intellectual Property
Our success and ability to compete is dependent in part on our proprietary technology. We rely on a combination of patent, copyright, trademark and trade secret laws, as well as confidentiality agreements, to establish and protect our proprietary rights. In addition, Garmin often relies on licenses of intellectual property for use in its business. For example, Garmin obtains licenses for digital cartography technology for use in our products from various sources.
As of January 21, 2010, Garmin’s worldwide IP portfolio includes over 450 patents and 300 trademark registrations. Garmin was selected as a constituent of the 2010/2011 Ocean Tomo
®
300 Patent Index which recognizes companies with high intellectual property value. We believe that our continued success depends on the intellectual skills of our employees and their ability to continue to innovate. Garmin will continue to file and prosecute patent applications when appropriate to attempt to protect Garmin’s rights in
its proprietary technologies.
20
There is no assurance that our current patents, or patents which we may later acquire, may successfully withstand any challenge, in whole or in part. It is also possible that any patent issued to us may not provide us with any competitive advantages, or that the patents of others will preclude us from manufacturing and marketing certain products. Despite our efforts to protect our proprietary rights, unauthorized parties may attempt to copy aspects of our products or to obtain and use information that we regard as proprietary. Litigation may be necessary in the future to enforce our intellectual property rights, to protect our trade secrets, to determine the validity and scope of the proprietary rights
of others or to defend against claims of infringement or invalidity.
Regulations
The telecommunications industry is highly regulated, and the regulatory environment in which Garmin operates is subject to change. In accordance with Federal Communications Commission (“FCC”) rules and regulations, wireless transceiver and cellular handset products are required to be certified by the FCC and comparable authorities in foreign countries where they are sold. Garmin’s products sold in Europe are required to comply with relevant directives of the European Commission. A delay in receiving required certifications for new products, or enhancements to Garmin’s products, or losing certification for Garmin’s existing products could adversely
affect our business. In addition, aviation products that are intended for installation in “type certificated aircraft” are required to be certified by the FAA, its European counterpart, the European Aviation Safety Agency, and other comparable organizations before they can be used in an aircraft.
Because Garmin Corporation, one of the Company’s principal subsidiaries, is located in Taiwan, foreign exchange control laws and regulations of Taiwan with respect to remittances into and out of Taiwan may have an impact on Garmin’s operations. The Taiwan Foreign Exchange Control Statute, and regulations thereunder, provide that all foreign exchange transactions must be executed by banks designated to handle such business by the Ministry of Finance of Taiwan and by the Central Bank of the Republic of China (Taiwan), also referred to as the CBC. Current regulations favor trade-related foreign exchange transactions. Consequently, foreign currency earned from exports of merchandise
and services may now be retained and used freely by exporters, while all foreign currency needed for the import of merchandise and services may be purchased freely from the designated foreign exchange banks. Aside from trade-related foreign exchange transactions, Taiwan companies and residents may, without foreign exchange approval, remit outside and into Taiwan foreign currencies of up to $50 million and $5 million respectively, or their equivalent, each calendar year. Currency conversions within the limits are processed by the designated banks and do not have to be reviewed and approved by the CBC. The above limits apply to remittances involving a conversion between New Taiwan Dollars and U.S. Dollars or other foreign currencies. The CBC typically approves foreign exchange in excess of the limits if a party applies with the CBC for review
and presents legitimate business reasons justifying the currency conversion. A requirement is also imposed on all enterprises to register all medium and long-term foreign debt with the CBC.
Environmental Matters
Garmin’s operations are subject to various environmental laws, including laws addressing air and water pollution and management of hazardous substances and wastes. Substantial noncompliance with applicable environmental laws could have a material adverse effect on our business. Currently, we do not anticipate material capital expenditures for environmental control facilities.
Environmental regulation of Garmin’s products is increasing. Many of Garmin's products are subject to laws relating to the chemical and material composition of our products and their energy efficiency. Garmin is also subject to laws requiring manufacturers to be financially responsible for collection, recovery and recycling of wastes from certain electronic products. Compliance with current environmental laws does not have a material impact on our business, but the impact of future enactment of environmental laws cannot yet be fully determined and could be substantial.
Garmin has implemented multiple Environmental Management System (“EMS”) policies in accordance with the International Organization for Standardization (ISO) 14001 standard for Environmental Health and Safety Management. Garmin’s EMS policies set forth practices, standards, and procedures to ensure compliance with applicable environmental laws and regulations at Garmin’s Kansas headquarters facility, Garmin’s European headquarters facility, and Garmin’s Taiwan manufacturing facility.
21
Regulatory and “Green Procurement” demands from our customers are also increasing, particularly in the areas of restricted substance use and environmentally-friendly design and manufacture initiatives. The overall impacts of these customer requirements cannot yet be established. Garmin is committed to improving our products and processes to meet our customer needs.
Employees
As of December 25, 2010, Garmin had 8,897 full and part-time employees worldwide, of whom 3,470 were in the United States, 72 were in Canada, 4,419 were in Taiwan, 725 were in Europe, and 211 were in other global locations. Except for some of Garmin’s employees in Brazil and Sweden, none of Garmin’s employees are represented by a labor union and none of Garmin's North American or Taiwan employees are covered by a collective bargaining agreement. Garmin considers its employee relations to be good.
The risks described below are not the only ones facing our company. Additional risks and uncertainties not presently known to us or that we currently believe to be immaterial may also impair our business operations. If any of the following risks occur, our business, financial condition or operating results could be materially adversely affected.
Risks Related to the Company
The demand for personal navigation devices (PNDs) may be eroded by replacement technologies becoming available on mobile handsets and factory-installed systems in new autos.
We have historically experienced substantial growth in the automotive/mobile segment which has resulted in GPS/navigation technologies being incorporated into competing devices such as mobile handsets and new automobiles through factory-installed systems. Mobile handsets are frequently GPS-enabled and many companies are now offering navigation software for mobile devices. The acceptance of this technology by consumers has halted our growth and could further reduce margins. Navigation systems are also becoming more prevalent as optional equipment on new automobiles. Increased
navigation penetration on new automobiles could cause further declines in sales of our portable navigation devices and further reduce margins.
Our financial results are highly dependent on the automotive/mobile segment, which represents approximately 62% of our revenues and is maturing.
We have historically experienced substantial growth in the automotive/mobile segment of our business as the products have become mass-market consumer electronics in both Europe and North America. This market has peaked as penetration rates increase and competing technologies emerge. This has resulted in lower revenues and lower earnings per share.
Economic conditions and uncertainty could adversely affect our revenue and margins.
Our revenue and margins depend significantly on general economic conditions and the demand for products in the markets in which we compete. The current economic weakness and constrained consumer and business spending has resulted in decreased revenue and in the future, could result in decreased revenue and problems with our ability to manage inventory levels and collect customer receivables. In addition, financial difficulties experienced by our retailer and OEM customers have resulted, and could result in the future, in significant bad debt write-offs and additions to reserves in our receivables and could have an adverse affect on our results of operations.
22
Gross margins for our products may fluctuate or erode.
Gross margins on our automotive/mobile products have been declining and are expected to decline in 2011 due to price reductions in the increasingly competitive market for personal navigation devices (PNDs) that are not fully offset by material cost reductions. In addition, our overall gross margin may fluctuate from period to period due to a number of factors, including product mix, competition and unit volumes. In particular, the average selling prices of a specific product tend to decrease over that product’s life. To offset such decreases, we intend to rely primarily on component cost reduction, obtaining yield improvements and corresponding cost reductions in the manufacture of
existing products and on introducing new products that incorporate advanced features and therefore can be sold at higher average selling prices. However, there can be no assurance that we will be able to obtain any such yield improvements or cost reductions or introduce any such new products in the future. To the extent that such cost reductions and new product introductions do not occur in a timely manner or our products do not achieve market acceptance, our business, financial condition and results of operations could be materially adversely affected.
Changes in our United States federal income tax classification or in applicable tax law could result in adverse tax consequences to our shareholders.
We do not believe that we (or any of our non-United States subsidiaries) are currently a ‘‘passive foreign investment company’’ for United States federal income tax purposes. We do not expect to become a passive foreign investment company. However, because the passive foreign investment company determination is made annually based on whether the company’s income or assets meet certain thresholds as determined under United States federal tax principles which are based on facts and circumstances that may be beyond our control, we cannot assure that we will not become a passive foreign investment company in the future. If we are a passive foreign investment company in
any year, then any of our shareholders that is a United States person could be liable to pay tax on their pro rata share of our income plus an interest charge upon some distributions by us or when that shareholder sells our common shares at a gain. Further, if we are classified as a passive foreign investment company in any year in which a United States person is a shareholder, we generally will continue to be treated as a passive foreign investment company with respect to such shareholder in all succeeding years, regardless of whether we continue to satisfy the income or asset tests mentioned above.
We do not believe that we (or any of our non-United States subsidiaries) are currently a Controlled Foreign Corporation (CFC) for United States federal income tax purposes. We do not expect to become a CFC. The CFC determination is made daily based on whether the United States shareholders own more than fifty percent of the voting power or value of the Company. Only United States persons that own ten percent or more of the voting power of the Company’s shares qualify as United States shareholders. If the Company were to be classified as a CFC for an uninterrupted thirty day period in any year, the Company’s shareholders that qualify as United States
shareholders could be liable to pay US income tax at ordinary income tax rates on their pro-rata share of certain categories of the Company’s income for the period in which the Company is classified as a CFC. As the Company cannot control the ownership of the Company’s stock nor can the Company control which shareholders participate in the Company’s stock buyback program, ownership changes could result that create United States shareholders which increase the risk of Garmin being treated as a CFC.
Legislative proposals have been considered in the United States within the past year that could increase the United States tax burden of corporations with international operations and could broaden the circumstances under which foreign corporations could be considered resident in the United States Our tax position could be adversely impacted by changes in United States or foreign tax laws, tax treaties or tax regulations or the interpretation or enforcement thereof by any tax authority. We cannot predict the outcome of any specific legislative proposals.
23
If we are not successful in the continued development, introduction or timely manufacture of new products, demand for our products could decrease.
We expect that a significant portion of our future revenue will continue to be derived from sales of newly introduced products. The market for our products is characterized by rapidly changing technology, evolving industry standards and changes in customer needs. If we fail to introduce new products, or to modify or improve our existing products, in response to changes in technology, industry standards or customer needs, our products could rapidly become less competitive or obsolete. We must continue to make significant investments in research and development in order to continue to develop new products, enhance existing products and achieve market acceptance for such
products. However, there can be no assurance that development stage products will be successfully completed or, if developed, will achieve significant customer acceptance.
If we are unable to successfully develop and introduce competitive new products, and enhance our existing products, our future results of operations would be adversely affected. Our pursuit of necessary technology may require substantial time and expense. We may need to license new technologies to respond to technological change. These licenses may not be available to us on terms that we can accept or may materially change the gross profits that we are able to obtain on our products. We may not succeed in adapting our products to new technologies as they emerge. Development and manufacturing schedules for technology products are difficult to predict, and there can be no
assurance that we will achieve timely initial customer shipments of new products. The timely availability of these products in volume and their acceptance by customers are important to our future success. From time to time we have experienced delays in shipping certain of our new products and any future delays, whether due to product development delays, manufacturing delays, lack of market acceptance, delays in regulatory approval, or otherwise, could have a material adverse effect on our results of operations.
If we are unable to compete effectively with existing or new competitors, our resulting loss of competitive position could result in price reductions, fewer customer orders, reduced margins and loss of market share.
The markets for our products are highly competitive, and we expect competition to increase in the future. Some of our competitors have significantly greater financial, technical and marketing resources than we do. These competitors may be able to respond more rapidly to new or emerging technologies or changes in customer requirements. They may also be able to devote greater resources to the development, promotion and sale of their products. Increased competition could result in price reductions, fewer customer orders, reduced margins and loss of market share. Our failure to compete successfully against current or future competitors could seriously harm our business,
financial condition and results of operations.
We rely on independent dealers and distributors to sell our products, and disruption to these channels would harm our business.
Because we sell a majority of our products to independent dealers and distributors, we are subject to many risks, including risks related to their inventory levels and support for our products. In particular, our dealers and distributors maintain significant levels of our products in their inventories. If dealers and distributors attempt to reduce their levels of inventory or if they do not maintain sufficient levels to meet customer demand, our sales could be negatively impacted.
Many of our dealers and distributors also sell products offered by our competitors. If our competitors offer our dealers and distributors more favorable terms, those dealers and distributors may de-emphasize or decline to carry our products. In the future, we may not be able to retain or attract a sufficient number of qualified dealers and distributors. If we are unable to maintain successful relationships with dealers and distributors or to expand our distribution channels, our business will suffer.
24
Our quarterly operating results are subject to fluctuations and seasonality.
Our operating results are difficult to predict. Our future quarterly operating results may fluctuate significantly. If such operating results decline, the price of our stock would likely decline. As we expand our operations, our operating expenses, particularly our advertising and research and development costs, may increase as a percentage of our sales. If revenues decrease and we are unable to reduce those costs rapidly, our operating results would be negatively affected.
Historically, our revenues have been weaker in the first quarter of each fiscal year and have recently been lower than the preceding fourth quarter. Our devices are highly consumer-oriented, and consumer buying is traditionally lower in these quarters. Sales of certain of our marine and automotive
products tend to be higher in our second fiscal quarter due to increased consumer spending for such products during the recreational marine, fishing, and travel season. Sales of our automotive/mobile products also have been higher in our fourth fiscal quarter due to increased consumer spending patterns on electronic devices
during the holiday season.
In addition, we attempt to time our new product releases to coincide with relatively higher consumer spending in the second and fourth fiscal quarters, which contributes to these seasonal variations.
Our quarterly financial statements will reflect fluctuations in foreign currency translation.
The operation of Garmin’s subsidiaries in international markets results in exposure to movements in currency exchange rates. We have experienced significant foreign currency gains and losses due to the strengthening and weakening of the U.S. dollar. The potential of volatile foreign exchange rate fluctuations in the future could have a significant effect on our results of operations.
The currencies that create a majority of the Company’s exchange rate exposure are the Taiwan Dollar, Euro, and British Pound Sterling. Garmin Corporation, headquartered in Sijhih, Taiwan, uses the local currency as the functional currency. The Company translates all assets and liabilities at year-end exchange rates and income and expense accounts at average rates during the year. In order to minimize the effect of the currency exchange fluctuations on our net assets, we have elected to retain most of our Taiwan subsidiary’s cash and investments in marketable securities denominated in U.S. dollars.
Nonetheless, U.S. GAAP requires the Company at the end of each accounting period to translate into Taiwan Dollars all such U.S. Dollar denominated assets held by our Taiwan subsidiary. This translation is required because the Taiwan Dollar is the functional currency of the subsidiary. This U.S. GAAP-mandated translation will cause us to recognize gain or loss on our financial statements as the Taiwan Dollar/U.S. Dollar exchange rate varies. Such gain or loss will create variations in our earnings per share. Because there is minimal cash impact caused by such exchange rate variations, management will continue to focus on
the Company’s operating performance before the impact of the foreign currency translation.
If we do not correctly anticipate demand for our products, we may not be able to secure sufficient quantities or cost-effective production of our products or we could have costly excess production or inventories.
We have generally been able to increase production to meet this increasing demand. However, the demand for our products depends on many factors and will be difficult to forecast. We expect that it will become more difficult to forecast demand as we introduce and support multiple products, as competition in the market for our products intensifies and as the markets for some of our products mature to the mass market category. Significant unanticipated fluctuations in demand could cause the following problems in our operations:
|
·
|
If demand increases beyond what we forecast, we would have to rapidly increase production. We would depend on suppliers to provide additional volumes of components and those suppliers might not be able to increase production rapidly enough to meet unexpected demand.
|
25
|
·
|
Rapid increases in production levels to meet unanticipated demand could result in higher costs for manufacturing and supply of components and other expenses. These higher costs could lower our profit margins. Further, if production is increased rapidly, manufacturing quality could decline, which may also lower our margins and reduce customer satisfaction.
|
|
·
|
If forecasted demand does not develop, we could have excess production resulting in higher inventories of finished products and components, which would use cash and could lead to write-offs of some or all of the excess inventories. Lower than forecasted demand could also result in excess manufacturing capacity or reduced manufacturing efficiencies at our facilities, which could result in lower margins.
|
We have benefited in the past from Taiwan government tax incentives offered on certain high technology capital investments that may not always be available.
Our effective tax rate is lower than the U.S. federal statutory rate, in part because we have benefited from incentives offered in Taiwan related to our high technology investments in Taiwan. The loss of these tax benefits could have a significant effect on our financial results in the future.
We may experience unique economic and political risks associated with companies that operate in Taiwan.
Relations between Taiwan and the People’s Republic of China, also referred to as the PRC, and other factors affecting the political or economic conditions of Taiwan in the future could materially adversely affect our business, financial condition and results of operations and the market price and the liquidity of our shares. Our principal manufacturing facilities where we manufacture all of our products, except our panel-mounted aviation products, are located in Taiwan.
Taiwan has a unique international political status. The PRC asserts sovereignty over all of China, including Taiwan, certain other islands and all of mainland China. The PRC government does not recognize the legitimacy of the Taiwan government. Although significant economic and cultural relations have been established during recent years between Taiwan and the PRC, the PRC government has indicated that it may use military force to gain control over Taiwan in certain circumstances, such as the declaration of independence by Taiwan. Relations between Taiwan and the PRC have on occasion adversely affected the market value of Taiwanese companies and could negatively affect
our operations in Taiwan in the future.
Our intellectual property rights are important to our operations, and we could suffer loss if they infringe upon other’s rights or are infringed upon by others.
We rely on a combination of patents, copyrights, trademarks and trade secrets, confidentiality provisions and licensing arrangements to establish and protect our proprietary rights. To this end, we hold rights to a number of patents and registered trademarks and regularly file applications to attempt to protect our rights in new technology and trademarks. However, there is no guarantee that our patent applications will become issued patents, or that our trademark applications will become registered trademarks. Moreover, even if approved, our patents or trademarks may thereafter be successfully challenged by others or otherwise become invalidated for a variety of
reasons. Thus, any patents or trademarks we currently have or may later acquire may not provide us a significant competitive advantage.
Third parties may claim that we are infringing their intellectual property rights. Such claims could have a material adverse effect on our business and financial condition. From time to time we receive letters alleging infringement of patents, trademarks or other intellectual property rights. Litigation concerning patents or other intellectual property is costly and time consuming. We may seek licenses from such parties, but they could refuse to grant us a license or demand commercially unreasonable terms. We might not have sufficient resources to pay for the licenses. Such infringement claims could also cause us to incur substantial liabilities
and to suspend or permanently cease the use of critical technologies or processes or the production or sale of major products.
26
We may become subject to significant product liability costs.
If our aviation products malfunction or contain errors or defects, airplane collisions or crashes could occur resulting in property damage, personal injury or death. Malfunctions or errors or defects in our marine navigational products could cause boats to run aground or cause other wreckage, personal injury or death. If our automotive or marine products contain defects or errors in the mapping supplied by third-party map providers or if our users do not heed our warnings about the proper use of these products, collisions or accidents could occur resulting in property damage, personal injury or death. If any of these events occurs, we could be subject to significant liability for
personal injury and property damage and under certain circumstances could be subject to a judgment for punitive damages. We maintain insurance against accident-related risks involving our products. However, there can be no assurance that such insurance would be sufficient to cover the cost of damages to others or that such insurance will continue to be available at commercially reasonable rates. In addition, insurance coverage generally will not cover awards of punitive damages and may not cover the cost of associated legal fees and defense costs, which could result in lower margins. If we are unable to maintain sufficient insurance to cover product liability costs or if our insurance coverage does not cover the award, this could have a materially adverse impact on our business, financial condition and results of operations.
We depend on our suppliers, some of which are the sole source for specific components, and our production would be seriously harmed if these suppliers are not able to meet our demand and alternative sources are not available, or if the costs of components rise.
We are dependent on third party suppliers for various components used in our current products. Some of the components that we procure from third party suppliers include semiconductors and electroluminescent panels, liquid crystal displays, memory chips, batteries and microprocessors. The cost, quality and availability of components are essential to the successful production and sale of our products. Some components we use are from sole source suppliers. Certain application-specific integrated circuits incorporating our proprietary designs are manufactured for us by sole source suppliers. Alternative sources may not be currently available for these sole source
components.
In the past we have experienced shortages of liquid crystal displays and other components. In addition, if there are shortages in supply of components, the costs of such components may rise. If suppliers are unable to meet our demand for components on a timely basis and if we are unable to obtain an alternative source or if the price of the alternative source is prohibitive, or if the costs of components rise, our ability to maintain timely and cost-effective production of our products would be seriously harmed.
We depend on third party licensors for the digital map data contained in our automotive/mobile products, and our business and/or gross margins could be harmed if we become unable to continue licensing such mapping data or if the royalty costs for such data rise.
We license digital mapping data for use in our products from various sources. There are only a limited number of suppliers of mapping data for each geographical region. The two largest digital map suppliers are NAVTEQ Corporation and Tele Atlas N.V. NAVTEQ Corporation is owned by Nokia Oyj and Tele Atlas N.V. is owned by TomTom N.V. Nokia and TomTom are both competitors of Garmin.
Although we do not foresee difficulty in continuing to license data at favorable pricing due to the long term license extension signed between Garmin and NAVTEQ in November 2007 (extending our NAVTEQ license agreement through 2017 with an option to extend through 2021), if we are unable to continue licensing such mapping data and are unable to obtain an alternative source, or if the nature of our relationships with NAVTEQ changes detrimentally, our ability to supply mapping data for use in our products would be seriously harmed.
27
We may pursue strategic acquisitions, investments, strategic partnerships or other ventures, and our business could be materially harmed if we fail to successfully identify, complete and integrate such transactions.
We intend to evaluate acquisition opportunities and opportunities to make investments in complementary businesses, technologies, services or products, or to enter into strategic partnerships with parties who can provide access to those assets, additional product or services offerings, additional distribution or marketing synergies or additional industry expertise. We may not be able to identify suitable acquisition, investment or strategic partnership candidates, or if we do identify suitable candidates in the future, we may not be able to complete those transactions on commercially favorable terms, or at all.
Any past or future acquisitions could also result in difficulties assimilating acquired employees (including cultural differences with foreign acquisitions), operations, and products and diversion of capital and management’s attention away from other business issues and opportunities. Integration of acquired companies may result in problems related to integration of technology and inexperienced management teams. In addition, the key personnel of the acquired company may decide not to work for us. We may not successfully integrate internal controls, compliance under the Sarbanes-Oxley Act of 2002 and other corporate governance matters, operations, personnel or products related to
acquisitions we have made in previous years or may make in the future. If we fail to successfully integrate such transactions, our business could be materially harmed.
We may have additional tax liabilities.
We are subject to income taxes in both the United States and numerous foreign jurisdictions. Significant judgment is required in determining our worldwide provision for income taxes. In the ordinary course of our business, there are many transactions and calculations where the ultimate tax determination is uncertain. We are regularly under audit by tax authorities. Although we believe our tax estimates are reasonable, the final determination of tax audits and any related litigation could be materially different from our historical income tax provisions and accruals. The results of an audit or litigation could have a material effect on our income tax provision, net income or cash flows in the period or periods for
which that determination is made.
Failure to obtain required certifications of our products on a timely basis could harm our business.
We have certain products, especially in our aviation segment, that are subject to governmental and similar certifications before they can be sold. For example, FAA certification is required for all of our aviation products that are intended for installation in type certificated aircraft. To the extent required, certification is an expensive and time-consuming process that requires significant focus and resources. An inability to obtain, or excessive delay in obtaining, such certifications could have an adverse effect on our ability to introduce new products and, for certain aviation OEM products, our customers’ ability to sell airplanes. Therefore, such
inabilities or delays could adversely affect our operating results.
In addition, we cannot assure you that our certified products will not be decertified. Any such decertification could have an adverse effect on our operating results.
Our business may suffer if we are not able to hire and retain sufficient qualified personnel or if we lose our key personnel.
Our future success depends partly on the continued contribution of our key executive, engineering, sales, marketing, manufacturing and administrative personnel. We currently do not have employment agreements with any of our key executive officers. We do not have key man life insurance on any of our key executive officers and do not currently intend to obtain such insurance. The loss of the services of any of our senior level management, or other key employees, could harm our business. Recruiting and retaining the skilled personnel we require to maintain and grow our market position may be difficult. For example, in some recent years there has been a
nationwide shortage of qualified electrical engineers and software engineers who are necessary for us to design and develop new products, and therefore, it has sometimes been challenging to recruit such personnel. If we fail to hire and retain qualified employees, we may not be able to maintain and expand our business.
28
There is uncertainty as to our shareholders’ ability to enforce certain foreign civil liabilities in Switzerland and Taiwan.
We are a Swiss company and a substantial portion of our assets are located outside the United States, particularly in Taiwan. As a result, it may be difficult to effect service of process within the United States upon us. In addition, there is uncertainty as to whether the courts of Switzerland or Taiwan would recognize or enforce judgments of United States courts obtained against us predicated upon the civil liability provisions of the securities laws of the United States or any state thereof, or be competent to hear original actions brought in Switzerland or Taiwan against us predicated upon the securities laws of the United States or any state thereof.
A shut down of U.S. airspace or imposition of restrictions on general aviation would harm our business.
Following the September 11, 2001 terrorist attacks, the FAA ordered all aircraft operating in the U.S. to be grounded for several days. In addition to this shut down of U.S. airspace, the general aviation industry was further impacted by the additional restrictions implemented by the FAA on those flights that fly utilizing Visual Flight Rules (VFR). The FAA restricted VFR flight inside 30 enhanced Class B (a 20-25 mile radius around the 30 largest metropolitan areas in the USA) airspace areas. The Aircraft Owners and Pilots Association (AOPA) estimated that these restrictions affected approximately 41,800 general aviation aircraft
based at 282 airports inside the 30 enhanced Class B airspace areas. The AOPA estimates that approximately 90% of all general aviation flights are conducted VFR, and that only 15% of general aviation pilots are current to fly utilizing Instrument Flight Rules (IFR).
The shutdown of U.S. airspace following September 11, 2001 caused reduced sales of our general aviation products and delays in the shipment of our products manufactured in our Taiwan manufacturing facility to our distribution facility in Olathe, Kansas, thereby adversely affecting our ability to supply new and existing products to our dealers and distributors.
Any future shut down of U.S. airspace or imposition of restrictions on general aviation could have a material adverse effect on our business and financial results.
Many of our products rely on the Global Positioning System.
The Global Positioning System is a satellite-based navigation and positioning system consisting of a constellation of orbiting satellites. The satellites and their ground control and monitoring stations are maintained and operated by the United States Department of Defense. The Department of Defense does not currently charge users for access to the satellite signals. These satellites and their ground support systems are complex electronic systems subject to electronic and mechanical failures and possible sabotage. The satellites were originally designed to have lives of 7.5 years and are subject to damage by the hostile space environment in which they operate. However,
of the current deployment of satellites in place, some have been operating for more than 12 years.
If a significant number of satellites were to become inoperable, unavailable or are not replaced, it would impair the current utility of our Global Positioning System products and would have a material negative effect on our business. In addition, there can be no assurance that the U.S. government will remain committed to the operation and maintenance of Global Positioning System satellites over a long period, or that the policies of the U.S. government that provide for the use of the Global Positioning System without charge and without accuracy degradation will remain unchanged. Because of the increasing commercial applications of the Global Positioning System, other U.S. government
agencies may become involved in the administration or the regulation of the use of Global Positioning System signals. However, in a presidential policy statement issued in December 2004, the Bush administration indicated that the U.S. is committed to supporting and improving the Global Positioning System and will continue providing it free from direct user fees.
Some of our products also use signals from systems that augment GPS, such as the Wide Area Augmentation System (WAAS). WAAS is operated by the FAA. Any curtailment of the operating capability of WAAS could result in decreased user capability for many of our aviation products, thereby impacting our markets.
29
Any of the foregoing factors could affect the willingness of buyers of our products to select Global Positioning System-based products instead of products based on competing technologies.
Any reallocation or repurposing of radio frequency spectrum could cause harmful interference with the reception of Global Positioning System signals. This interference could harm our business.
Our Global Positioning System technology is dependent on the use of the Standard Positioning Service (SPS) provided by the U.S. Government’s Global Positioning System satellites. The Global Positioning System operates in radio frequency bands that are globally allocated for radio navigation satellite services. International allocations of radio frequency are made by the International Telecommunications Union (ITU), a specialized technical agency of the United Nations. These allocations are further governed by radio regulations that have treaty status and which may be subject to modification every two to three years by the World Radio Communication Conference. Each country also
has regulatory authority on how each band is used. In the United States, the Federal Communications Commission (FCC) and the National Telecommunications and Information Administration share responsibility for radio frequency allocations and spectrum usage regulations.
Any ITU or national reallocation of radio frequency spectrum, including frequency band segmentation or sharing of spectrum, or other modifications of the permitted uses of relevant frequency bands, may materially and adversely affect the utility and reliability of our products and have significant negative impacts on our business and our customers. For example, the FCC is currently considering a proposal by a private party, LightSquared, to repurpose spectrum adjacent to the GPS bands for terrestrial broadband wireless operations in metropolitan areas throughout the United States. If the FCC were to permit implementation of LightSquared’s proposal as is, terrestrial broadband wireless operations would
create harmful interference to GPS receivers within range of such operations.
Our business is subject to disruptions and uncertainties caused by war or terrorism.
Acts of war or acts of terrorism, especially any directed at the GPS signals, could have a material adverse impact on our business, operating results, and financial condition. The threat of terrorism and war and heightened security and military response to this threat, or any future acts of terrorism, may cause a redeployment of the satellites used in GPS or interruptions of the system. To the extent that such interruptions have an effect on sales of our products, this could have a material adverse effect on our business, results of operations, and financial condition.
We may be exposed to certain regulatory and financial risks related to climate change.
Climate change is receiving increasing attention worldwide. Some scientists, legislators and others attribute global warming to increased levels of greenhouse gases, including carbon dioxide, which has led to significant legislative and regulatory efforts to limit greenhouse gas emissions.
There are a number of pending legislative and regulatory proposals to address greenhouse gas emissions. For example, in June 2009 the U.S. House of Representatives passed the American Clean Energy and Security Act that would phase-in significant reductions in greenhouse gas emissions if enacted into law. The U.S. Senate is considering one or more different bills, and it is uncertain whether, when and in what form a federal mandatory carbon dioxide emissions reduction program may be adopted. Similarly, certain countries have adopted the Kyoto Protocol. These actions could increase costs associated with our operations, including costs for components used in the manufacture of our products and freight
costs.
Because it is uncertain what laws and regulations will be enacted, we cannot predict the potential impact of such laws and regulations on our future consolidated financial condition, results of operations or cash flows.
30
Risks Relating to Our Shares
The volatility of our stock price could adversely affect investment in our common shares.
The market price of our common shares has been, and may continue to be, highly volatile. During 2010, the price of our common shares ranged from a low of $26.55 to a high of $39.94. A variety of factors could cause the price of our common shares to fluctuate, perhaps substantially, including:
|
|
·
|
announcements and rumors of developments related to our business, our competitors, our suppliers or the markets in which we compete;
|
|
|
·
|
quarterly fluctuations in our actual or anticipated operating results;
|
|
|
·
|
the availability, pricing and timeliness of delivery of components, such as flash memory and liquid crystal displays, used in our products;
|
|
|
·
|
general conditions in the worldwide economy, including fluctuations in interest rates;
|
|
|
·
|
announcements of technological innovations;
|
|
|
·
|
new products or product enhancements by us or our competitors;
|
|
|
·
|
product obsolescence and our ability to manage product transitions;
|
|
|
·
|
developments in patents or other intellectual property rights and litigation;
|
|
|
·
|
developments in our relationships with our customers and suppliers;
|
|
|
·
|
research reports or opinions issued by securities analysts or brokerage houses related to Garmin, our competitors, our suppliers or our customers; and
|
|
|
·
|
any significant acts of terrorism against the United States, Taiwan or significant markets where we sell our products.
|
In addition, in recent years the stock market in general and the markets for shares of technology companies in particular, have experienced extreme price fluctuations which have often been unrelated to the operating performance of affected companies. Any such fluctuations in the future could adversely affect the market price of our common shares.
Our officers and directors exert substantial influence over us.
As of January 14, 2011, members and former members of our Board of Directors and our executive officers, together with members of their families and entities that may be deemed affiliates of or related to such persons or entities, beneficially owned approximately 44.80% of our outstanding common shares. Accordingly, these shareholders may be able to determine the outcome of corporate actions requiring shareholder approval, such as mergers and acquisitions. This level of ownership may have a significant effect in delaying, deferring or preventing a change in control of Garmin and may adversely affect the voting and other rights of other holders of our common shares.
On June 27, 2010 we completed the redomestication of the place of our incorporation from the Cayman Islands to Switzerland (the “Redomestication”). As a result of increased shareholder approval requirements under Swiss law, we have less flexibility than we previously had as a Cayman Islands company with respect to certain aspects of capital management.
Swiss law allows our shareholders acting at a shareholders’ meeting to authorize share capital that can be issued by the board of directors without approval of a shareholders’ meeting, but this authorization is limited to 50% of the existing registered share capital and must be renewed by a shareholders’ meeting every two years. Additionally, subject to specified exceptions, including the exceptions described in our articles of association, Swiss law grants preemptive rights to existing shareholders to subscribe for new issuances of shares and other securities. Swiss law does not provide as much flexibility as Cayman Islands law in the various terms that can attach to different classes of shares
either. For example, while the board of directors of a Cayman Islands company can authorize the issuance of preferred stock without shareholder approval, we will not be able to issue preferred stock without the approval of 66 2/3% of the votes represented and a majority of the par value of the shares represented at a general meeting of our shareholders. Swiss law also reserves for approval by shareholders many corporate actions over which our board of directors previously had authority under Cayman Islands law. For example, dividends must be approved by shareholders at the general meeting of our shareholders.
31
The par value of our shares is higher following the Redomestication. As a result, we have less flexibility than we previously had as a Cayman Islands company with respect to certain aspects of capital management.
The par value of our shares is 10 Swiss francs per share, compared to a par value of $0.005 per share when we were a Cayman Islands company. Under Swiss law, we may not issue shares below par value. In the event we need to raise equity capital at a time when the trading price of our shares is below the par value of the shares, we will be unable to issue shares. In addition, we will not be able to issue options under our benefits plans with an exercise price below the par value, which would limit the flexibility of our compensation arrangements.
We are subject to various Swiss taxes following the Redomestication.
Although we do not expect Swiss taxes to materially affect our worldwide effective corporate tax rate, we are subject to additional corporate taxes in Switzerland following the Redomestication. Switzerland imposes a corporate federal income tax for holding companies at an effective tax rate of 7.83%, although we should be entitled to a “participation relief” that in most cases will effectively eliminate any Swiss taxation on the profits of our subsidiaries paid by them to us as dividends as well as on capital gains related to the sale of participations. We also are subject to a Swiss issuance stamp tax levied on our share issuances, other than in connection with qualifying restructurings, or increases
of our equity at a rate of 1% of the fair market value of the issuance or increase. In addition, we are subject to some other Swiss indirect taxes (e.g., VAT, Swiss issuance stamp tax on certain debt instruments and Swiss securities transfer stamp tax).
We may not be able to make distributions or repurchase shares without subjecting you to Swiss withholding tax.
If we are unable to make distributions, if any, through a reduction of par value or to pay dividends, if any, out of qualifying capital contribution reserves, then any dividends paid by us will generally be subject to a Swiss federal withholding tax at a rate of 35%. The withholding tax must be withheld from the gross distribution and paid to the Swiss Federal Tax Administration. A U.S. holder that qualifies for benefits under the Convention between the United States of America and the Swiss Confederation for the Avoidance of Double Taxation with Respect to Taxes on Income may apply for a refund of the tax withheld in excess of the 15% treaty rate (or in excess of the 5% reduced treaty rate for qualifying
corporate shareholders with at least 10% participation in our voting stock, or for a full refund in case of qualified pension funds). Payment of a capital distribution in the form of a par value reduction is not subject to Swiss withholding tax. However, there can be no assurance that our shareholders will approve a reduction in par value, that we will be able to meet the other legal requirements for a reduction in par value, or that Swiss withholding rules will not be changed in the future. In addition, over the long term, the amount of par value available for us to use for par value reductions will be limited. If we are unable to make a distribution through a reduction in par value or to pay a dividend out of qualifying capital contribution reserves, we may not be able to make distributions without subjecting you to Swiss withholding taxes.
Under Swiss tax law applicable until December 31, 2010, repurchases of shares for the purposes of capital reduction have been treated as a partial liquidation subject to 35% Swiss withholding tax on the difference between the par value and the repurchase price. On January 1, 2011, under Swiss laws the portion of the repurchase price that is attributed to the qualifying capital contribution reserves of the shares repurchased will not be subject to the Swiss withholding tax. We may follow a share repurchase process for future share repurchases, if any, similar to a "second trading line" on the Swiss Stock Exchange in which Swiss institutional investors buy shares on the open market and sell these shares
to us and are generally able to receive a refund of the Swiss withholding tax. However, if we are unable to use this process successfully, we may not be able to repurchase shares for the purposes of capital reduction without subjecting you to Swiss withholding taxes.
32
None.
The following are the principal properties owned or leased by the Company and its subsidiaries:
Garmin International, Inc. and Garmin USA, Inc. occupy a facility of approximately 1,120,000 square feet on 42 acres in Olathe, Kansas, where the majority of product design and development work is conducted, the majority of aviation panel-mount products are manufactured and products are warehoused, distributed, and supported for North, Central and South America. Garmin’s subsidiary, Garmin Realty, LLC also owns an additional 46 acres of land on the Olathe site for future expansion. In connection with the bond financings for the facility in Olathe and the previous expansion of that facility, the City of Olathe holds the legal title to the Olathe facility which is leased to
Garmin’s subsidiaries by the City. Upon the payment in full of the outstanding bonds, the City of Olathe is obligated to transfer title to Garmin’s subsidiaries for the aggregate sum of $200. Garmin International, Inc. has purchased all the outstanding bonds and continues to hold the bonds until maturity in order to benefit from property tax abatement.
Garmin Corporation owns and occupies a 249,326 square foot facility in Sijhih, Taipei County, Taiwan, a 223,469 square foot facility in Jhongli, Tao-Yang County, Taiwan, and an approximately 580,000 square foot facility in LinKou, Tao-Yang County, Taiwan. In these three facilities Garmin Corporation manufactures all of Garmin’s consumer and portable aviation products and warehouses, markets and supports products for the Pacific Rim countries.
Garmin AT, Inc. leases approximately 15 acres of land in Salem, Oregon under a ground lease. This ground lease expires in 2030 but Garmin AT has the option to extend the ground lease until 2050. Garmin AT, Inc. owns and occupies a 115,000 square foot facility for office, development and manufacturing use and a 33,000 square foot aircraft hangar, flight test and certification facility on this land. Garmin AT, Inc. also leases 43,870 square feet of office space in a separate Salem, OR building for Garmin’s newly-opened West Coast customer support call center.
Garmin International, Inc. leases 148,320 square feet of land at New Century Airport in Gardner, Kansas under a ground lease which expires in 2026. Garmin International, Inc. owns and occupies a 47,254 square foot aircraft hangar, flight test and certification facility on this land which is used in development and certification of aviation products.
Garmin International, Inc. leases approximately 15,000 square feet of space at 669 North Michigan Avenue in Chicago, Illinois which is used as a retail store and showroom for Garmin products. This lease expires in November 2016.
Garmin International, Inc. also leases an additional: (i) 18,392 square feet of office space in Kansas City, Missouri for a call center operation; (ii) 48,625 square feet of office space in Olathe, Kansas for a call center operation; (iii) 24,748 square feet of aggregate office space in two buildings in Tempe, Arizona for software development; (iv) 18,500 square feet of office space in Chanhassan, MN for its Digital Cyclone subsidiary; (v) 8,183 square feet of office space in Diamond Bar, California for software development; (vi) 5,952 square feet of office space (and 17,536 square feet of land on which the premises sits) in Wichita, Kansas for aviation development and support; and (vii) 5,700
square feet in Newport, Oregon for the former Nautamatic (now TR-1) marine autopilot operations.
Garmin (Europe) Ltd. owns and occupies a 155,000 square foot building located in Totton, Southampton, England,
used as offices and a distribution facility.
33
Ambato Media, LLC v. Clarion Co., Ltd., Clarion Corporation of America, Delphi Corporation, Fujitsu Limited, Fujitsu Ten Corporation of America, Garmin Ltd., Garmin International, Inc., Victor Company of Japan Ltd., JVC Americas Corporation, JVC Kenwood Holdings, Inc., J&K Car Electronics Corporation, LG Electronics, Inc., LG Electronics USA, Inc., MiTAC International Corporation, MiTAC Digital Corporation, Mio Technology USA Ltd., Navigon, Inc. Nextar Inc., Panasonic Corporation, Panasonic Corporation of North America, Pioneer Corporation, Pioneer Electronics (USA) Inc., Sanyo Electric Co., Ltd., Sanyo North America Corporation, Sanyo Electronic Device (U.S.A.) Corporation,
TomTom N.V., TomTom International B.V., and TomTom, Inc.
On August 14, 2009, Ambato Media, LLC filed suit in the United States District Court for the Eastern District of Texas against Garmin Ltd. and Garmin International, Inc. along with several codefendants alleging infringement of U.S. Patent No. 5,432,542 (“the ’542 patent”). On September 28, 2009, Garmin filed its Answer and Counterclaims asserting the ’542 patent is invalid and not infringed. Although there can be no assurance that an unfavorable outcome of this litigation would not have a material adverse effect on our operating results, liquidity or financial position, Garmin believes that the claims are without merit and intends to
vigorously defend this action.
Pioneer Corporation v. Garmin Deutschland GmbH, Garmin Ltd., Garmin International, Inc., Garmin (Europe Ltd. and Garmin Corporation
On October 9, 2009, Pioneer Corporation filed suit in the District Court in Düsseldorf, Germany against Garmin Deutschland GmbH, Garmin Ltd., Garmin International, Inc., Garmin Corporation and Garmin (Europe) Ltd. alleging infringement of European Patent No. 775 892 (“the ‘892 Patent”) and European Patent No. 508 681 (“the‘681 Patent”). Garmin has filed separate lawsuits in the German Federal Patent Court in Munich seeking declaratory judgments of invalidity of the ‘892 Patent and the ‘681 Patent. On January 11, 2011, the District Court in Düsseldorf issued decisions finding infringement of the ’892 and
’681 Patents. Garmin intends to appeal these decisions. Although there can be no assurance that an unfavorable outcome of this litigation would not have a material adverse effect on our operating results, liquidity or financial position, Garmin believes that the claims are without merit and intends to vigorously defend this action.
In the Matter of Certain Multimedia Display and Navigation Devices and Systems, Components Thereof, and Products Containing the Same.
On November 13, 2009, Pioneer Corporation and Pioneer Electronics (USA) Inc. (collectively, “Pioneer”) filed a complaint with the United States International Trade Commission (the “Commission”) against Garmin International, Inc., Garmin Corporation, and Honeywell International Inc. alleging violation of Section 337 of the Tariff Act of 1930 and infringement of U.S. Patent No. 5,365,448 (“the ’448 patent”), U.S. Patent No. 6,122,592 (“the ’592 patent”), and U.S. Patent No. 5,424,951 (“the ’951 patent”). On January 12, 2010, Garmin filed its Answer asserting the ’448 patent, the
’592 patent, and the ’951 patent are invalid and not infringed. A hearing was held from September 13-21, 2010. The parties completed their post-hearing briefing on October 14, 2010. On December 16, 2010, the Administrative Law Judge issued an Initial Determination concluding there is no violation of Section 337 and finding that the ’448, ’592, and ’951 patents are not infringed. On January 5, 2011 Pioneer filed a petition for review of the claim construction and non-infringement holdings of the Initial Determination. Garmin awaits final confirmation of the Initial Determination by the Commission. Although there can be no assurance that an unfavorable outcome of this litigation would not have a material adverse effect on our operating results, liquidity or financial position, Garmin believes
these claims are without merit and intends to vigorously defend this action.
34
Vehicle IP, LLC v. AT&T Mobility LLC, Cellco Partnership, Garmin International, Inc., Garmin USA, Inc., Networks in Motion, Inc., Telecommunication Systems, Inc., Telenav Inc., United Parcel Service, Inc., and UPS Logistics Technologies, Inc.
On December 31, 2009, Vehicle IP, LLC filed suit in the United States District Court for the District of Delaware against Garmin International, Inc. and Garmin USA, Inc. along with several codefendants alleging infringement of U.S. Patent No. 5,987,377 (“the ’377 patent”). On March 11, 2010, Garmin filed its Answer and Counterclaims asserting the ’377 patent is invalid and not infringed. Although there can be no assurance that an unfavorable outcome of this litigation would not have a material adverse effect on our operating results, liquidity or financial position, Garmin believes these claims are without merit and intends to vigorously
defend this action.
Nazomi Communications, Inc. v. Nokia Corporation, Nokia Inc., Microsoft Corporation, Amazon.com, Inc., Western Digital Corporation, Western Digital Technologies, Inc., Garmin Ltd., Garmin Corporation, Garmin International, Inc., Garmin USA, Inc., Sling Media, Inc., VIZIO, Inc., and Iomega Corporation.
On February 8, 2010, Nazomi Communications, Inc. filed suit in the United States District Court for the Central District of California against Garmin Ltd., Garmin Corporation, Garmin International, Inc., and Garmin USA, Inc. along with several codefendants alleging infringement of U.S. Patent No. 7,080,362 (“the ’362 patent”) and U.S. Patent No. 7,225,436 (“the ’436 patent”). Garmin believes the ’362 patent and the ’436 patent are not infringed. On April 27, 2010, ARM Ltd., the designer of the accused hardware, filed a Motion to Intervene and a Motion to Transfer the case to the Northern District of California. On June
21, 2010, the court granted ARM Ltd.’s motion to intervene. On October 14, 2010, the court granted ARM Ltd.’s renewed motion to transfer. Although there can be no assurance that an unfavorable outcome of this litigation would not have a material adverse effect on our operating results, liquidity or financial position, Garmin believes these claims are without merit and intends to vigorously defend this action.
Visteon Global Technologies, Inc. and Visteon Technologies LLC v. Garmin International, Inc.
On February 10, 2010, Visteon Global Technologies, Inc. and Visteon Technologies LLC filed suit in the United States District Court for the Eastern District of Michigan, Southern Division, against Garmin International, Inc. alleging infringement of U.S. Patent No. 5,544,060 (“the ‘060 patent”), U.S. Patent No. 5,654,892 (“the ‘892 patent”), U.S. Patent No. 5,832, 408 (“the ‘408 patent”), U.S. Patent No 5,987,375 (“the ‘375 patent”) and U.S. Patent No 6,097,316 (“the ‘316 patent”). On May 17, 2010, Garmin filed its Answer asserting that each claim of the ‘060 patent, the
‘892 patent, the ‘408 patent and the ‘375 patent is not infringed and/or invalid. Although there can be no assurance that an unfavorable outcome of this litigation would not have a material adverse effect on our operating results, liquidity or financial position, Garmin believes that the claims in this lawsuit are without merit and intends to vigorously defend this action.
Bandspeed, Inc. v. Acer, Inc., Acer American Corporation, Belkin International, Inc., Belkin,Inc., Casio Computer Co., Ltd., Xasio Hitachi Mobile CommunicationsCo. Ltd., Xasio America, Inc., Dell Inc., Garmin International, Inc., Garmin USA, Inc., GN Netcom A/S, GN U.S. Inc. a/k/a GN Netcom Inc., Hewlett-Packard Company, Hewlett-Packard Development Company, L.P., HTC Corporation, HTC America, Inc., Huawei Technologies Co. Ltd., Kyocera Corporation, Kyocera International, Inc., Kyocera Communications, Inc., Kyocera Wireless Corporation, Lenovo (United States), Inc., LG Electronics, Inc., LG Electronics U.S.A. Inc., LG Electronics Mobilecomm U.S.A. Inc., Motorola, Inc.,
Nokia Corporation, Nokia Inc., Pantech Wireless, Inc. Plantronics, inc., Research in Motion Ltd., Research in Motion Corporation, Samsung Telecommunications America, LLC, TomTom International B.V., TomTom, Inc., Toshiba Corporation, Toshiba America information Systems, Inc., and Toshiba America, Inc.
On June 30, 2010, Bandspeed, Inc. filed suit in the United States District Court for the Eastern District of Texas against 38 companies, including Garmin International, Inc. and Garmin USA, Inc. alleging infringement of U.S. Patent No 7,027,418 (“the ‘418 patent”) and U.S. Patent No 7,670,614 (“the ‘614 patent”). Garmin believes that each claim of the ‘418 patent and the ‘614 patent is not infringed and/or invalid. On October 6, 2010, the defendants filed a Motion to Transfer Venue to the Western District of Texas and the parties await the court’s ruling on this motion. Although there can be no
assurance that an unfavorable outcome of this litigation would not have a material adverse effect on our operating results, liquidity or financial position, Garmin believes the claims in this lawsuit are without merit and intends to vigorously defend this action.
35
Tqranis IP LLC v. Garmin International, Inc., Universal Avionics Systems Corporation, Johnson Outdoors Marine Electronics, Inc., Johnson Outdoors Inc., Raymarine Inc., Raymarine UK Ltd., Navico, Inc., and Navico Holdings A.S.
On November 22, 2010, Taranis IP LLC filed suit in the United States District Court for the Northern District of Illinois against eight companies, including Garmin International, Inc., alleging infringement of U.S. Patent No. 5,995,903 (“the ’903 patent”). Garmin believes that each claim of the ’903 patent is not infringed and/or invalid. Although there can be no assurance that an unfavorable outcome of this litigation would not have a material adverse effect on our operating results, liquidity, or financial position, Garmin believes the claims in this lawsuit are without merit and intends to vigorously defend this
action.
Triangle Software, LLC v. Garmin International, Inc., TomTom Inc., Volkswagen Group of America, Inc. and Westwood One, Inc.
On December 28, 2010, Triangle Software, LLC filed suit in the United States District Court for the Eastern District of Virginia against four companies, including Garmin International, Inc., alleging infringement of U.S. Patent No. 7,557,730 (“the ’730 patent”), U.S. Patent No. 7,221,287 (“the ’287 patent”), U.S. Patent No. 7,375,649 (“the ’649 patent”), U.S. Patent No. 7,508,321 (“the ’321 patent”), and U.S. Patent No. 7,702,452 (“the ’452 patent”). Garmin believes that each claim of the ’730, ’287, ’649, ’321, and ’452 patents is not
infringed and/or invalid. Although there can be no assurance that an unfavorable outcome of this litigation would not have a material adverse effect on our operating results, liquidity, or financial position, Garmin believes the claims in this lawsuit are without merit and intends to vigorously defend this action.
In the Matter of Certain Semiconductor Chips and Products Containing Same
On December 1, 2010, Rambus Inc. filed a complaint with the United States International Trade Commission against 33 companies, including Garmin International, Inc., alleging infringement of U.S. Patent No. 6,470,405 (“the ’405 patent”), U.S. Patent No. 6,591,353 (“the ’353 patent”), U.S. Patent No. 7,287,109 (“the ’109 patent”), U.S. Patent No. 7,602,857 (“the ’857 patent”), U.S. Patent No. 7,602,858 (“the ’858 patent”), and U.S. Patent No. 7,715,494 (“the ’494 patent”). Garmin’s semiconductor chip suppliers are also named in the complaint and Garmin believes these suppliers have
indemnification obligations to defend Garmin in this matter. Garmin is preparing to file its Answer asserting the ’405, ’353, ’109, ’857, ’858, and the ’494 patents are invalid and/or not infringed. Although there can be no assurance that an unfavorable outcome of this litigation would not have a material adverse effect on our operating results, liquidity or financial position, Garmin believes these claims are without merit and intends to vigorously defend this action.
From time to time Garmin is involved in other legal actions arising in the ordinary course of our business. We believe that the ultimate outcome of these actions will not have a material adverse effect on our business, financial condition and results of operations.
Executive Officers of the Registrant
Pursuant to General Instruction G(3) of Form 10-K and instruction 3 to paragraph (b) of Item 401 of Regulation S-K, the following list is included as an unnumbered Item in Part I of this Annual Report on Form 10-K in lieu of being included in the Company’s Definitive Proxy Statement in connection with its annual meeting of shareholders scheduled for June 3, 2011.
Dr. Min H. Kao
, age 62, has served as Chairman of Garmin Ltd. since August 2004 and was previously Co-Chairman of Garmin Ltd. from August 2000 to August 2004. He has served as Chief Executive Officer of Garmin Ltd. since August 2002 and previously served as Co-Chief Executive Officer from August 2000 to August 2002. Dr. Kao has served as a director and officer of various subsidiaries of the Company since August 1990. Dr. Kao holds Ph.D. and MS degrees in Electrical Engineering from the University of Tennessee and a BS degree in Electrical Engineering from National Taiwan University.
36
Clifton A. Pemble
, age 45, has served as a director of Garmin Ltd. since August 2004, and as President and Chief Operating Officer of Garmin Ltd. since October 2007. Mr. Pemble has served as a director and officer of various Garmin subsidiaries since August 2003. Previously, he was Vice President, Engineering of Garmin International, Inc. from 2005 to October 2007, Director of Engineering of Garmin International, Inc. from 2003 to 2005, and Software Engineering Manager of Garmin International, Inc. from 1995 to 2002 and a Software Engineer with Garmin International, Inc. from 1989 to 1995. Mr. Pemble holds BA degrees in Mathematics and Computer
Science from MidAmerica Nazarene University.
Kevin S. Rauckman
, age 48, has served as Chief Financial Officer and Treasurer of Garmin Ltd. since August 2000. He previously served as Director of Finance and Treasurer of Garmin International, Inc. since January 1999 and has served as a director and officer of various subsidiaries of the Company since April 2001. Mr. Rauckman holds BS and MBA degrees in Business from the University of Kansas.
Andrew R. Etkind
, age 55, has served as Vice President, General Counsel and Secretary of Garmin Ltd. since June 2008. He was previously General Counsel and Secretary of Garmin Ltd. from August 2000 to June 2008. He has been Vice President and General Counsel of Garmin International, Inc. since July 2007, General Counsel since February 1998, and Secretary since October 1998. Mr. Etkind has served as a director and officer of various Garmin subsidiaries since December 2001. Mr. Etkind holds BA, MA and LLM degrees from Cambridge University, England and a JD degree from the University of Michigan Law School.
Brian J. Pokorny,
age 47, has been Vice President, Operations of Garmin International, Inc. since 2005. Previously, he was Director of Operations of Garmin International, Inc. from 1997 to 2005 and Production Planning Manager of Garmin International, Inc. from 1995 to 1997. Mr. Pokorny holds a BS degree in Business Management and a MBA from the University of Nebraska - Lincoln and holds the professional certification of CPIM (Certified in Production and Inventory Management).
Danny J. Bartel
, age 61, has been Vice President, Worldwide Sales of Garmin International, Inc. since 2006. Previously, he was Technical/Survey Sales Manager of Garmin International, Inc. from 1992 to 1993, Director, Europe, Middle East and Africa of Garmin (Europe) Ltd. from 1994 to 1999, and Director of Consumer Electronic Sales of Garmin International, Inc. from 1999 to 2006. He has been a director of Garmin (Europe) Ltd. since July 2004. Mr. Bartel holds a BS in Electrical Engineering from South Dakota State University and a BA in Management from Central Michigan University.
Gary V. Kelley
, age 64,
has been Vice President, Marketing of Garmin International, Inc. since 2005. Previously, he was Director of Marketing of Garmin International, Inc. from 1992 to 2005. He has also been Director of Marketing of Garmin USA, Inc. since January 2002. Mr. Kelley was a director of Garmin (Europe) Ltd. from 1993 to 2004. Mr. Kelley holds a BBA degree from Baker University. He also holds a commercial pilot license with instrument and flight instructor ratings.
All executive officers are elected by and serve at the discretion of the Company’s Board of Directors. None of the executive officers has an employment agreement with the Company. There are no arrangements or understandings between the executive officers and any other person pursuant to which he or she was or is to be selected as an officer. There is no family relationship among any of the executive officers. Dr. Min H. Kao is the brother of Ruey-Jeng Kao, who is a supervisor of Garmin Corporation, Garmin’s Taiwan subsidiary, who serves as an ex-officio member of Garmin Corporation’s Board of Directors.
37
Garmin’s common shares have traded on the Nasdaq National Market under the symbol “GRMN” since its initial public offering on December 8, 2000 (the “IPO”). As of February 17, 2011, there were 284 shareholders of record.
The range of high and low closing sales prices of Garmin’s common shares as reported on the Nasdaq Stock Market for each fiscal quarter of fiscal years 2010 and 2009 was as follows:
|
Year Ended
|
||||||||||||||||
|
December 25, 2010
|
December 26, 2009
|
|||||||||||||||
|
High
|
Low
|
High
|
Low
|
|||||||||||||
|
First Quarter
|
$ | 39.94 | $ | 30.70 | $ | 23.48 | $ | 15.17 | ||||||||
|
Second Quarter
|
$ | 39.14 | $ | 31.22 | $ | 25.99 | $ | 19.74 | ||||||||
|
Third Quarter
|
$ | 31.60 | $ | 26.55 | $ | 37.23 | $ | 22.67 | ||||||||
|
Fourth Quarter
|
$ | 34.00 | $ | 28.52 | $ | 39.58 | $ | 26.84 | ||||||||
The Board of Directors declared a cash dividend of $1.50 per common share to shareholders of record on April 15, 2010 which was paid on April 30, 2010. The Board of Directors declared a cash dividend of $0.75 per common share to shareholders of record on December 1, 2009 which was paid on December 15, 2009. Garmin currently expects to pay a cash dividend in 2011. The decision whether to pay a dividend and the amount of the dividend will be voted on by the Company’s shareholders as required by Swiss law. The Board of Directors will make a recommendation closer to the payment date based on the Company’s cash balance, cash
requirements and cash flow generation.
The Board of Directors approved a share repurchase program on February 12, 2010, authorizing the Company to repurchase up to $300 million of the Company’s shares as market and business conditions warrant. This share repurchase authorization expires on December 31, 2011. No shares were repurchased under the plan during the fourth quarter of 2010.
We refer you to Item 12 of this report under the caption “Equity Compensation Plan Information” for certain equity plan information required to be disclosed by Item 201(d) of Regulation S-K.
Stock Performance Graph
|
|
This performance graph shall not be deemed ‘‘filed’’ with the SEC or subject to Section 18 of the Securities Exchange Act of 1934, nor shall it be deemed incorporated by reference in any of our filings under the Securities Act of 1933, as amended.
|
The following graph illustrates the cumulative total shareholder return (rounded to the nearest whole dollar) of Garmin common shares during the period from December 31, 2005 through December 31, 2010, and compares it to the cumulative total return on the NASDAQ Composite Index and the NASDAQ 100 Index. Garmin is one of the constituent companies of the NASDAQ 100 Index. The comparison assumes a $100 investment on December 31, 2005, in Garmin common shares and in each of the foregoing indexes and assumes reinvestment of dividends.
38
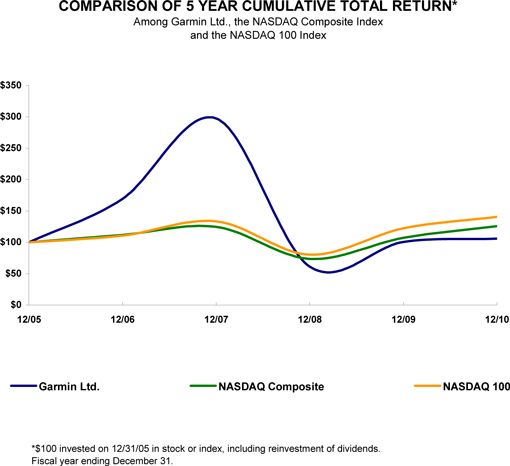
| 12/05 | 12/06 | 12/07 | 12/08 | 12/09 | 12/10 | |||||||||||||||||||
|
Garmin Ltd.
|
100.00 | 169.45 | 297.51 | 61.39 | 100.69 | 105.83 | ||||||||||||||||||
|
NASDAQ Composite
|
100.00 | 111.74 | 124.67 | 73.77 | 107.12 | 125.93 | ||||||||||||||||||
|
NASDAQ 100
|
100.00 | 110.76 | 133.59 | 80.41 | 122.45 | 140.69 |
The stock price performance included in this graph is not necessarily indicative of future stock price performance.
The following table sets forth selected consolidated financial data of the Company. The selected consolidated balance sheet data as of December 25, 2010 and December 26, 2009 and the selected consolidated statement of income data for the years ended December 25, 2010, December 26, 2009, and December 27, 2008 were derived from the Company’s audited consolidated financial statements and the related notes thereto which are included in Item 8 of this annual report on Form 10-K. The selected consolidated balance sheet data as of December 27, 2008, December 29, 2007, and December 30, 2006 and the selected consolidated statement of income data for the years ended December 29, 2007
and December 30, 2006 were derived from the Company’s audited consolidated financial statements, not included herein.
The information set forth below is not necessarily indicative of the results of future operations and should be read together with "Management's Discussion and Analysis of Financial Condition and Results of Operations" and the consolidated financial statements and notes to those statements included in Items 7 and 8 in Part II of this Form 10-K.
39
|
Years ended (1)
|
||||||||||||||||||||
|
Dec. 25, 2010
|
Dec. 26, 2009
|
Dec. 27, 2008
|
Dec. 29, 2007
|
Dec. 30, 2006
|
||||||||||||||||
|
(in thousands, except per share data)
|
||||||||||||||||||||
|
Consolidated Statements of
|
||||||||||||||||||||
|
Income Data:
|
||||||||||||||||||||
|
Net sales
|
$ | 2,689,911 | $ | 2,946,440 | $ | 3,494,077 | $ | 3,180,319 | $ | 1,774,000 | ||||||||||
|
Cost of goods sold
|
1,343,537 | 1,502,329 | 1,940,562 | 1,717,064 | 891,614 | |||||||||||||||
|
Gross profit
|
1,346,374 | 1,444,111 | 1,553,515 | 1,463,255 | 882,386 | |||||||||||||||
|
Operating expenses:
|
||||||||||||||||||||
|
Advertising expense
|
144,613 | 155,521 | 208,177 | 206,948 | 114,749 | |||||||||||||||
|
Selling, general and
administrative
|
287,824 | 264,202 | 277,212 | 189,550 | 99,764 | |||||||||||||||
|
Research and development
|
277,261 | 238,378 | 206,109 | 159,406 | 113,314 | |||||||||||||||
|
Total operating expenses
|
709,698 | 658,101 | 691,498 | 555,904 | 327,827 | |||||||||||||||
|
Operating income
|
636,676 | 786,010 | 862,017 | 907,351 | 554,559 | |||||||||||||||
|
Other income/(expense), net (2), (3), (4)
|
(59,404 | ) | 22,641 | 52,349 | 70,922 | 39,995 | ||||||||||||||
|
Income before income taxes
|
577,272 | 808,651 | 914,366 | 978,273 | 594,554 | |||||||||||||||
|
Income tax provision/(benefit) (5)
|
(7,331 | ) | 104,701 | 181,518 | 123,262 | 80,431 | ||||||||||||||
|
Net income
|
$ | 584,603 | $ | 703,950 | $ | 732,848 | $ | 855,011 | $ | 514,123 | ||||||||||
|
Net income per share: (6)
|
||||||||||||||||||||
|
Basic
|
$ | 2.97 | $ | 3.51 | $ | 3.51 | $ | 3.95 | $ | 2.38 | ||||||||||
|
Diluted
|
$ | 2.95 | $ | 3.50 | $ | 3.48 | $ | 3.89 | $ | 2.35 | ||||||||||
|
Weighted average common
shares outstanding: (6)
|
||||||||||||||||||||
|
Basic
|
196,979 | 200,395 | 208,993 | 216,524 | 216,340 | |||||||||||||||
|
Diluted
|
198,009 | 201,161 | 210,680 | 219,875 | 218,845 | |||||||||||||||
|
Cash dividends per share (6)
|
$ | 1.50 | $ | 0.75 | $ | 0.75 | $ | 0.75 | $ | 0.50 | ||||||||||
|
Balance Sheet Data (at end of
Period):
|
||||||||||||||||||||
|
Cash and cash equivalents
|
$ | 1,260,936 | $ | 1,091,581 | $ | 696,335 | $ | 707,689 | $ | 337,321 | ||||||||||
|
Marketable securities
|
801,819 | 766,047 | 274,895 | 424,505 | 480,876 | |||||||||||||||
|
Total assets
|
3,988,688 | 3,828,082 | 2,934,421 | 3,291,460 | 1,897,020 | |||||||||||||||
|
Total debt
|
- | - | - | - | 248 | |||||||||||||||
|
Total stockholders' equity
|
3,049,562 | 2,836,447 | 2,225,854 | 2,350,614 | 1,557,899 | |||||||||||||||
|
(1)
|
Our fiscal year-end is the last Saturday of the calendar year and does not always fall on December 31. All years presented contain 52 weeks.
|
|
(2)
|
Other income/(expense), net mainly consists of gain and/or loss on sale of equity securities, interest income, interest expense, and foreign currency gain (loss)
|
|
(3)
|
Includes $23.0 million and $0.6 million for foreign currency gains in 2007 and 2006 respectively,
and $88.4 million, $6.0 million and $35.3 million for foreign currency losses in 2010, 2009 and 2008 respectively.
|
|
(4)
|
Includes a $72.4 million gain on sale of equity securities primarily related to the sale of our equity interest in Tele Atlas N.V. and related foreign currency exchange effects in 2008.
|
|
(5)
|
Includes a $98.7 million one-time income tax reserve release of uncertain tax position reserves from 2006 to 2008 related to our settlement with the IRS in the US, partially offset by the amount of the settlement for the 2007 tax year in the US and Taiwan surtax expense due to the release of reserves.
|
|
(6)
|
All prior period common stock and applicable share and per share amounts have been retroactively adjusted to reflect a 2-for-1 split of the Company's common stock effective August 15, 2006.
|
40
The following discussion and analysis of our financial condition and results of operations focuses on and is intended to clarify the results of our operations, certain changes in our financial position, liquidity, capital structure and business developments for the periods covered by the consolidated financial statements included in this Form 10-K. This discussion should be read in conjunction with, and is qualified by reference to, the other related information including, but not limited to, the audited consolidated financial statements (including the notes thereto), the description of our business, all as set forth in this Form 10-K, as well as the risk factors discussed above in Item 1A.
As previously noted, the discussion set forth below, as well as other portions of this Form 10-K, contain statements concerning potential future events. Readers can identify these forward-looking statements by their use of such verbs as “expects,” “anticipates,” “believes” or similar verbs or conjugations of such verbs. If any of our assumptions on which the statements are based prove incorrect or should unanticipated circumstances arise, our actual results could materially differ from those anticipated by such forward-looking statements. The differences could be caused by a number of factors or combination of factors including, but not limited
to, those discussed above in Item 1A. Readers are strongly encouraged to consider those factors when evaluating any such forward-looking statement. We do not undertake to update any forward-looking statements in this Form 10-K.
Garmin’s fiscal year is a 52-53 week period ending on the last Saturday of the calendar year. Fiscal years 2010, 2009, and 2008 contained 52 weeks. Unless otherwise stated, all years and dates refer to the Company’s fiscal year and fiscal periods. Unless the context otherwise requires, references in this document to "we," "us," "our" and similar terms refer to Garmin Ltd. and its subsidiaries.
Unless otherwise indicated, dollar amounts set forth in the tables are in thousands, except per share data.
Overview
We are a leading worldwide provider of navigation, communications and information devices, most of which are enabled by Global Positioning System, or GPS, technology. We operate in four business segments, which serve the marine, outdoor/fitness, automotive/mobile, and aviation markets. Our segments offer products through our network of subsidiary distributors and independent dealers and distributors. However, the nature of products and types of customers for the four segments can vary significantly. As such, the segments are managed separately. Our portable GPS receivers and accessories for marine,
recreation/fitness and automotive/mobile segments are sold primarily to retail outlets. Our aviation products are portable and panel-mount avionics for Visual Flight Rules and Instrument Flight Rules navigation and are sold primarily to retail outlets and certain aircraft manufacturers.
Since our first products were delivered in 1991, we have generated positive income from operations each year and have funded our growth from these profits. Our sales have increased at a compounded annual growth rate of 11% since 2006 and our net income has increased at a compounded annual growth rate of 3% since 2006. The vast majority of this growth has been organic; only a very small amount of new revenue occurred as a result of the acquisition of Dynastream Innovations Inc. in 2006, Digital Cyclone, Inc. and the assets of Nautamatic Marine Systems, Inc. in 2007, eleven European distributors between 2007 and 2010, and MetriGear, Inc. in
2010. These acquisitions had no significant impact on net income for those years.
Since our principal locations are in the United States, Taiwan and the U.K., we experience some foreign currency fluctuations in our operating results. The table below provides a listing of our functional currency by subsidiary excluding the European subsidiaries that utilize the Euro.
41
|
Garmin (Europe) Ltd
|
US Dollar
|
|
Garmin Corporation
|
Taiwan Dollar
|
|
Garmin International
|
US Dollar
|
|
Garmin Norge
|
Norwegian Kroner
|
|
Dynastream Innovations
|
Canadian Dollar
|
|
Garmin Danmark
|
Danish Krone
|
|
Garmin Sweden
|
Swedish Brona
|
|
Garmin Australasia
|
Australian Dollar
|
|
Garmin Polska
|
Polish Zloty
|
|
Garmin Japan
|
Japanese Yen
|
|
Garmin China
|
Chinese Renminbi
|
Approximately 77% of sales by our European subsidiaries are now denominated in British Pounds Sterling or the Euro. We experienced ($88.4) million, ($6.0) million, and ($35.3) million in foreign currency losses during fiscal years 2010, 2009, and 2008, respectively. The 2008 foreign currency loss includes a realized gain of $21.5 million due to the strengthening of the Euro between the date we purchased shares in Tele Atlas N.V. in October 2007 and the tender of shares in February, March, and June 2008. To date, we have not entered into hedging transactions related to any currency, and we do not currently plan to utilize hedging transactions in the future.
Critical Accounting Policies and Estimates
General
Garmin’s discussion and analysis of its financial condition and results of operations are based upon Garmin’s consolidated financial statements, which have been prepared in accordance with accounting principles generally accepted in the United States. The presentation of these financial statements requires Garmin to make estimates and judgments that affect the reported amounts of assets, liabilities, revenues and expenses, and related disclosure of contingent assets and liabilities. On an on-going basis, Garmin evaluates its estimates, including those related to customer sales programs and incentives, product returns, bad debts,
inventories, investments, intangible assets, income taxes, warranty obligations, and contingencies and litigation. Garmin bases its estimates on historical experience and on various other assumptions that are believed to be reasonable under the circumstances, the results of which form the basis for making judgments about the carrying value of assets and liabilities that are not readily apparent from other sources. Actual results may differ from these estimates under different assumptions or conditions.
Revenue Recognition
Garmin recognizes revenue when persuasive evidence of an arrangement exists, delivery has occurred, the sales price is fixed or determinable, and collection is probable. For the large majority of Garmin’s sales, these criteria are met once product has shipped and title and risk of loss have transferred to the customer. The Company recognizes revenue from the sale of hardware products and software bundled with hardware that is essential to the functionality of the hardware in accordance with general revenue recognition accounting guidance. The Company recognizes revenue in accordance with industry specific software accounting guidance for standalone sales of software products and sales of
software bundled with hardware not essential to the functionality of the hardware. The Company generally does not offer specified or unspecified upgrade rights to its customers in connection with software sales.
Garmin introduced nüMaps Lifetime™ in January 2009, which is a single fee program that, subject to the program’s terms and conditions, enables customers to download the latest map and point of interest information every quarter for the useful life of their PND. The revenue and associated cost of royalties for sales of nüMaps Lifetime™ products are deferred at the time of sale and recognized ratably on a straight-line basis over the currently estimated 36-month life of the products.
42
For multiple-element arrangements that include tangible products that contain software essential to the tangible product’s functionality and undelivered software elements that relate to the tangible product’s essential software, the Company allocates revenue to all deliverables based on their relative selling prices. In such circumstances, the accounting principles establish a hierarchy to determine the selling price to be used for allocating revenue to deliverables as follows: (i) vendor-specific objective evidence of fair value (“VSOE”), (ii) third-party evidence of selling price (“TPE”), and (iii) best estimate
of the selling price (“ESP”). VSOE generally exists only when the Company sells the deliverable separately and is the price actually charged by the Company for that deliverable. In addition to the products listed below, the Company has offered certain other products that involve multiple-element arrangements that are immaterial.
In 2010, Garmin began offering PNDs with lifetime map updates (LMU) bundled in the original purchase price. Similar to nüMaps Lifetime™ which was introduced in January 2009, this enables customers to download the latest map and point of interest information every quarter for the useful life of their PND. The Company has identified two deliverables contained in arrangements involving the sale of PNDs including LMU. The first deliverable is the hardware and software essential to the functionality of the hardware device delivered at the time of sale, and the second deliverable is the LMU. The Company has allocated revenue between these two deliverables using the relative selling
price method determined primarily using VSOE. Amounts allocated to the delivered hardware and the related essential software are recognized at the time of sale provided the other conditions for revenue recognition have been met. Amounts allocated to the LMU are deferred and recognized on a straight-line basis over the estimated 36-month life of the products.
In addition, Garmin offers PNDs with premium traffic bundled in the original purchase price in the European market. The Company has identified two deliverables contained in arrangements involving the sale of PNDs including premium traffic. The first deliverable is the hardware and software essential to the functionality of the hardware device delivered at the time of sale, and the second deliverable is the premium traffic service. The Company has allocated revenue between these two deliverables using the relative selling price method determined using VSOE. Amounts allocated to the delivered hardware and the related essential software are recognized at the time of sale provided the other
conditions for revenue recognition have been met. Amounts allocated to the premium traffic service are deferred and recognized on a straight-line basis over the estimated 36-month life of the products.
In 2009, Garmin introduced the nüvi 1690, a premium PND with a built-in wireless module that lets customers access Garmin’s nüLink!™ service, which provides direct links to certain online information. The Company has identified two deliverables contained in arrangements involving the sale of the nüvi 1690. The first deliverable is the hardware and software essential to the functionality of the hardware device delivered at the time of sale, and the second deliverable is the nüLink service. The Company has allocated revenue between these two deliverables using the relative selling price method determined using VSOE. Amounts allocated to the delivered hardware and
the related essential software are recognized at the time of sale provided the other conditions for revenue recognition have been met. Amounts allocated to the nüLink services are deferred and recognized on a straight-line basis over the 24-month life of the service.
Garmin records estimated reductions to revenue for customer sales programs returns and incentive offerings including rebates, price protection (product discounts offered to retailers to assist in clearing older products from their inventories in advance of new product releases), promotions and other volume-based incentives. The reductions to revenue are based on estimates and judgments using historical experience and expectation of future conditions. Changes in these estimates could negatively affect Garmin’s operating results. These incentives are reviewed periodically and, with the exceptions of price protection and certain other promotions, are accrued
for on a percentage of sales basis. If market conditions were to decline, Garmin may take actions to increase customer incentive offerings possibly resulting in an incremental reduction of revenue at the time the incentive is offered.
43
Garmin records reductions to revenue for expected future product returns based on Garmin’s historical experience.
Trade Accounts Receivable
We sell our products to retailers, wholesalers, and other customers and extend credit based on our evaluation of the customer’s financial condition. Potential losses on receivables are dependent on each individual customer’s financial condition. We carry our trade accounts receivable at net realizable value. Typically, our accounts receivable are collected within 80 days and do not bear interest. We monitor our exposure to losses on receivables and maintain allowances for potential losses or adjustments. We determine these allowances by (1) evaluating the aging of our receivables; and (2) reviewing our high-risk customers. Past due receivable balances are written off when our internal collection
efforts have been unsuccessful in collecting the amount due.
Warranties
Garmin’s products are generally covered by a warranty for periods ranging from one to three years. Garmin accrues a warranty reserve for estimated costs to provide warranty services. Garmin’s estimate of costs to service its warranty obligations is based on historical experience and expectation of future conditions. To the extent Garmin experiences increased warranty claim activity or increased costs associated with servicing those claims, its warranty accrual will increase, resulting in decreased gross profit.
Inventory
Garmin writes down its inventory for estimated obsolescence or unmarketable inventory equal to the difference between the cost of inventory and the estimated market value based upon assumptions about future demand and market conditions. If actual market conditions are less favorable than those projected by management, additional inventory write-downs may be required.
Investments
Investments are classified as available for sale and recorded at fair value, and unrealized investment gains and losses are reflected in stockholders’ equity. Investment income is recorded when earned, and capital gains and losses are recognized when investments are sold. Fair value of investments in auction rate securities are determined using third party estimates which followed an income approach valuation methodology. Investments are reviewed periodically to determine if they have suffered an impairment of value that is considered other than temporary. If investments are determined to be impaired, a capital loss is recognized at the date of
determination.
Testing for impairment of investments requires significant management judgment. The identification of potentially impaired investments, the determination of their fair value and the assessment of whether any decline in value is other than temporary are the key judgment elements. The discovery of new information and the passage of time can significantly change these judgments. Revisions of impairment judgments are made when new information becomes known, and any resulting impairment adjustments are made at that time. The economic environment and volatility of securities markets increase the difficulty of determining fair value and assessing
investment impairment.
Income Taxes
Garmin provides deferred tax assets and liabilities based on the difference between the tax basis of assets and liabilities and their carrying amount for financial reporting purposes as measured by the enacted tax rates and laws that will be in effect when the differences are expected to reverse. It is Garmin’s policy to record a valuation allowance to reduce its deferred tax assets to an amount that it believes is more likely than not to be realized. While Garmin has considered future taxable income and ongoing prudent and feasible tax planning strategies in assessing the need for the valuation allowance, in the event Garmin
were to determine that it would not be able to realize all or part of its net deferred tax assets in the future, an adjustment to the deferred tax assets would be charged to income in the period such determination is made. Likewise, should Garmin determine that it would be able to realize its deferred tax assets in the future in excess of its net recorded amount, an adjustment to the deferred tax assets would increase income in the period such determination is made.
44
In addition, the calculation of our tax liabilities involves dealing with uncertainties in the application of complex tax regulations. We recognize liabilities for tax audit issues in the U.S. and other tax jurisdictions based on our estimate of whether, and the extent to which, additional taxes will be due. If payment of these amounts ultimately proves to be unnecessary, the reversal of the liabilities would result in tax benefits being recognized in the period when we determine the liabilities are no longer necessary. If our estimate of tax liabilities proves to be less than the ultimate assessment, a further charge to expense
would result.
Stock Based Compensation
Garmin awards stock options, stock appreciation rights (“SARs”), restricted stock units (“RSUs”) and/or performance shares each year as part of Garmin’s compensation package for employees. Employees with certain levels of responsibility within Garmin are eligible for stock options, SAR grants, RSU grants and/or performance shares but the granting of options, SARs, RSUs and/or performance shares is at the discretion of the Compensation Committee of the Board of Directors and is not a contractual obligation.
Stock-based compensation cost is measured at the grant date based on the fair value of the award and is recognized as expense over the requisite service period. Determining the fair value of stock-based awards at the grant date requires judgment, including estimating expected dividends. In addition, judgment is also required in estimating the amount of stock-based awards that are expected to be forfeited. If actual results differ significantly from these estimates, stock-based compensation expense could be impacted.
Stock compensation plans are discussed in detail in Note 9 of the Notes to
Consolidated Financial Statements.
Accounting Terms and Characteristics
Net Sales
Our net sales are primarily generated through sales to our global dealer and distributor network and to original equipment manufacturers. Refer to the Revenue Recognition discussion above. Our sales are largely of a consumer nature; therefore backlog levels are not necessarily indicative of our future sales results. We aim to achieve a quick turnaround on orders we receive, and we typically ship most orders within 72 hours.
Net sales are subject to seasonal fluctuation. Typically, sales of our consumer products are highest in the second quarter, due to increased demand during the spring and summer season, and in the fourth quarter, due to increased demand during the holiday buying season. Our aviation products do not experience much seasonal variation, but are more influenced by the timing of the release of new products when the initial demand is typically the strongest.
Cost of Sales/Gross Profit
Raw material costs are our most significant component of cost of goods sold. In 2010, gross margin for our automotive/mobile segment declined 160 basis points as the average selling price declines outpaced raw material price declines. In addition, the deferral of high margin revenue and the related costs increased significantly as the product mix shifted toward products bundled with lifetime maps. See Note 2 for further information. This was partially offset by a positive refinement in the warranty reserve. In 2009, gross margin for our automotive/mobile segment increased 350 basis points as benefits from raw
material price declines and operating efficiencies exceeded the average selling price decline. In 2008, gross margin for our automotive/mobile segment declined 310 basis points as the average selling price continued to decline and we experienced further shift in product mix to lower-margin product groups. These impacts were somewhat offset by raw material price declines, most significantly flash memory. Gross margins for the aviation, marine, and outdoor/fitness segments are more stable. Our long-term gross margin targets are 65%, 55% and 55%, respectively, for these segments.
45
Our existing practice of performing the design and manufacture of our products in-house has enabled us to utilize alternative lower cost components from different suppliers and, where possible, to redesign our products to permit us to use these lower cost components. We believe that because of our practice of performing the design, manufacture and marketing of our products in-house, our Sijhih, Jhongli, and Lin-Kou manufacturing plants in Taiwan, our Olathe, Kansas, and Salem, Oregon manufacturing plants have experienced relatively low costs of manufacturing. In general, products manufactured in Taiwan have been our highest volume products. Our manufacturing labor costs
historically have been lower in Taiwan than in Olathe and Salem.
Sales price variability has had and can be expected to have an effect on our gross profit. In the past, prices of our devices sold into the automotive/mobile market have declined due to market pressures and introduction of new products sold at lower price points. The average selling prices of our aviation, outdoor/fitness, and marine products have been stable due to product mix and the introduction of more advanced products sold at higher prices. The effect of the sales price differences inherent within the mix of GPS-enabled products sold could have a significant impact on our gross profit.
Advertising Expense
Our advertising expenses consist of costs for both media advertising and cooperative advertising with our retail partners. As revenues grew in 2008, advertising expense also increased. In 2009-2010, we reduced our advertising expense as revenues declined and the public became more aware of GPS technology. The reduction did not have a negative impact on our market share. We expect advertising costs to decrease in 2011 as revenues decline.
Selling, General and Administrative Expenses
Our selling, general and administrative expenses consist primarily of:
|
|
·
|
salaries for sales and marketing personnel;
|
|
|
·
|
salaries and related costs for executives and administrative personnel;
|
|
|
·
|
marketing, and other brand building costs;
|
|
|
·
|
accounting and legal costs;
|
|
|
·
|
information systems and infrastructure costs;
|
|
|
·
|
travel and related costs; and
|
|
|
·
|
occupancy and other overhead costs.
|
Selling, general and administrative expenses increased in 2010 due to legal costs, fees associated with the Swiss redomestication, and growth in product support and information technology to support our growing installed base of users. Due to the economic pressure on our consumer-oriented business, we decreased selling, general and administrative expenses in 2009. As revenues grew in 2008, selling, general and administrative expenses increased. We expect selling, general and administrative costs, excluding advertising, to be stable or decline slightly in 2011 as revenues decline.
46
Research and Development
The majority of our research and development costs represent salaries for our engineers, costs for high technology components and costs of test equipment used in product and prototype development. Approximately 87% of the research and development of our products is performed in North America. The remainder of our research and development activities is performed primarily by our Taiwan engineering group.
We are committed to increasing the level of innovative design and development of new products as we strive for expanded ability to serve our existing consumer and aviation markets as well as new markets for GPS-enabled devices. We expect our research and development budget in absolute terms to be stable in 2011.
Customers
Our top ten customers have contributed between 34% and 36% of net sales since 2008. We have experienced average sales days in our customer accounts receivable of between 70 and 78 days since 2008. We have experienced an increase in the level of customer accounts receivable days due to changes in product mix, longer payment terms, and macroeconomic conditions. We expect to reduce the level of customer accounts receivable days as we negotiate shorter payment terms with our customers.
Income Taxes
We have experienced a relatively low effective corporate tax rate due to the proportion of our revenue generated by entities in tax jurisdictions with low statutory rates. In particular, the profit entitlement afforded our Swiss-based companies based on their intellectual property rights ownership of our consumer products along with substantial tax incentives offered by the Taiwanese government on certain high-technology capital investments have continued to reduce our tax rate. As a result, our consolidated effective tax rate was approximately (1.3%) during
2010.
The negative rate was due to the impact of one-time items booked in 2010. The one-time items of ($98.7) million include the release of uncertain tax position reserves from 2006 to 2008 related to our settlement with the IRS in the US, partially offset by the amount of the settlement for the 2007 tax year in the US and Taiwan surtax expense due to the release of reserves. Without one-time items, we would have reported an effective tax rate of 15.8% for 2010 compared to 12.9% for 2009.
This increase resulted from an unfavorable mix of taxable income among the tax jurisdictions in which the Company operates. We have taken advantage of the tax benefit in Taiwan since our inception and we expect to continue to benefit from lower effective tax rates at least through
2015.
Management believes that due to lower operating margins predicted for fiscal 2011, there may be slightly less revenue recognized by entities in lower tax rate jurisdictions. Therefore, the effective tax rate for fiscal 2011 is expected to be higher than fiscal 2010. The actual effective tax rate will be dependent upon the operating margins, production volume, additional capital investments made during fiscal 2011, and the composition of our earnings.
Results of Operations
The following table sets forth our results of operations as a percentage of net sales during the periods shown:
47
|
Fiscal
Years
Ended
|
||||||||||||
|
Dec. 25,
|
Dec. 26,
|
Dec. 27,
|
||||||||||
|
2010
|
2009
|
2008
|
||||||||||
|
Net sales
|
100 | % | 100 | % | 100 | % | ||||||
|
Cost of goods sold
|
50 | % | 51 | % | 55 | % | ||||||
|
Gross profit
|
50 | % | 49 | % | 45 | % | ||||||
|
Operating expenses:
|
||||||||||||
|
Advertising
|
5 | % | 5 | % | 6 | % | ||||||
|
Selling, general and administrative
|
11 | % | 9 | % | 8 | % | ||||||
|
Research and development
|
10 | % | 8 | % | 6 | % | ||||||
|
Total operating expenses
|
26 | % | 22 | % | 20 | % | ||||||
|
Operating income
|
24 | % | 27 | % | 25 | % | ||||||
|
Other income / (expense) , net
|
-2 | % | 0 | % | 1 | % | ||||||
|
Income before income taxes
|
22 | % | 27 | % | 26 | % | ||||||
|
Provision for income taxes
|
0 | % | 3 | % | 5 | % | ||||||
|
Net income
|
22 | % | 24 | % | 21 | % | ||||||
The following table sets forth our results of operations through income before income taxes for each of our four segments during the period shown. For each line item in the table the total of the segments’ amounts equals the amount in the consolidated statements of income data included in Item 6.
48
|
Outdoor/
|
Automotive/
|
|||||||||||||||
|
|
Fitness
|
Marine
|
Mobile
|
Aviation
|
||||||||||||
|
Fiscal year ended December 25, 2010
|
||||||||||||||||
|
Net sales
|
$ | 559,592 | $ | 198,860 | $ | 1,668,939 | $ | 262,520 | ||||||||
|
Cost of goods sold
|
195,136 | 74,212 | 995,986 | 78,203 | ||||||||||||
|
Gross profit
|
364,456 | 124,648 | 672,953 | 184,317 | ||||||||||||
|
Advertising
|
24,485 | 9,834 | 106,950 | 3,344 | ||||||||||||
|
Selling, general and administrative expenses
|
58,313 | 23,497 | 188,799 | 17,215 | ||||||||||||
|
Research and development
|
30,633 | 23,854 | 131,290 | 91,484 | ||||||||||||
|
Total expenses
|
113,431 | 57,185 | 427,039 | 112,043 | ||||||||||||
|
Operating income
|
251,025 | 67,463 | 245,914 | 72,274 | ||||||||||||
|
Other income / (expense), net
|
(13,553 | ) | (5,032 | ) | (40,027 | ) | (792 | ) | ||||||||
|
Income before income taxes
|
$ | 237,472 | $ | 62,431 | $ | 205,887 | $ | 71,482 | ||||||||
|
Outdoor/
|
Automotive/
|
|||||||||||||||
|
Fitness
|
Marine
|
Mobile
|
Aviation
|
|||||||||||||
|
Fiscal year ended December 26, 2009
|
||||||||||||||||
|
Net sales
|
$ | 468,924 | $ | 177,644 | $ | 2,054,127 | $ | 245,745 | ||||||||
|
Cost of goods sold
|
162,082 | 72,429 | 1,192,227 | 75,591 | ||||||||||||
|
Gross profit
|
306,842 | 105,215 | 861,900 | 170,154 | ||||||||||||
|
Advertising
|
23,262 | 9,682 | 118,713 | 3,864 | ||||||||||||
|
Selling, general and administrative expenses
|
47,799 | 18,177 | 172,473 | 25,753 | ||||||||||||
|
Research and development
|
23,776 | 21,448 | 110,907 | 82,247 | ||||||||||||
|
Total expenses
|
94,837 | 49,307 | 402,093 | 111,864 | ||||||||||||
|
Operating income
|
212,005 | 55,908 | 459,807 | 58,290 | ||||||||||||
|
Other income / (expense), net
|
(5,963 | ) | 1,522 | 28,777 | (1,695 | ) | ||||||||||
|
Income before income taxes
|
$ | 206,042 | $ | 57,430 | $ | 488,584 | $ | 56,595 | ||||||||
|
Outdoor/
|
Automotive/
|
|||||||||||||||
|
|
Fitness
|
Marine
|
Mobile
|
Aviation
|
||||||||||||
| Fiscal year ended December 27, 2008 | ||||||||||||||||
|
Net sales
|
$ | 427,783 | $ | 204,477 | $ | 2,538,411 | $ | 323,406 | ||||||||
|
Cost of goods sold
|
181,037 | 93,052 | 1,560,816 | 105,657 | ||||||||||||
|
Gross profit
|
246,746 | 111,425 | 977,595 | 217,749 | ||||||||||||
|
Advertising
|
27,932 | 14,532 | 160,926 | 4,787 | ||||||||||||
|
Selling, general and administrative expenses
|
32,800 | 17,536 | 206,954 | 19,922 | ||||||||||||
|
Research and development
|
25,419 | 19,374 | 85,610 | 75,706 | ||||||||||||
|
Total expenses
|
86,151 | 51,442 | 453,490 | 100,415 | ||||||||||||
|
Operating income
|
160,595 | 59,983 | 524,105 | 117,334 | ||||||||||||
|
Other income / (expense), net
|
5,391 | 3,921 | 41,634 | 1,403 | ||||||||||||
|
Income before income taxes
|
$ | 165,986 | $ | 63,904 | $ | 565,739 | $ | 118,737 | ||||||||
49
Comparison of 52-Weeks Ended December 25, 2010 and December 26, 2009
Net Sales
|
52-weeks ended December 25, 2010
|
52-weeks ended December 26, 2009
|
Year over Year
|
||||||||||||||||||||||
|
Net Sales
|
% of Revenues
|
Net Sales
|
% of Revenues
|
$ Change
|
% Change
|
|||||||||||||||||||
|
Outdoor/Fitness
|
$ | 559,592 | 21 | % | $ | 468,924 | 16 | % | $ | 90,668 | 19 | % | ||||||||||||
|
Marine
|
198,860 | 7 | % | 177,644 | 6 | % | 21,216 | 12 | % | |||||||||||||||
|
Automotive/Mobile
|
1,668,939 | 62 | % | 2,054,127 | 70 | % | (385,188 | ) | -19 | % | ||||||||||||||
|
Aviation
|
262,520 | 10 | % | 245,745 | 8 | % | 16,775 | 7 | % | |||||||||||||||
|
Total
|
$ | 2,689,911 | 100 | % | $ | 2,946,440 | 100 | % | $ | (256,529 | ) | -9 | % | |||||||||||
Net sales decreased 9% in 2010 when compared to the year-ago period. The decrease occurred in automotive/mobile and was partially offset by revenue growth in outdoor/fitness, marine and aviation. The outdoor/fitness segment experienced the greatest increase at 19%. Automotive/mobile revenue remains the largest portion of our revenue mix, but declined from 70% in 2009 to 62% in 2010.
Total unit sales decreased 4% to 16.0 million units in 2010 from 16.6 million units in 2009. The declining unit sales volume in 2010 was attributable to a decline in automotive/mobile units due to increased saturation in the segment and competing technologies partially offset by increasing volumes in the outdoor/fitness, marine and aviation segments.
Automotive/mobile segment revenue declined 19% in 2010, as the average selling price and volumes declined 11% and 9%, respectively. Outdoor/fitness segment revenue increased 19% on the strength of recent product introductions that expand the addressable market and ongoing global penetration. Marine revenues increased 12% due to product introductions, slight industry recovery and market share gains. Aviation revenues increased 7% as the Company delivered into additional cockpits and the retrofit business began to recover.
The Company anticipates ongoing revenue declines in 2011 driven by the automotive/mobile segment with partially offsetting growth in the outdoor/fitness, aviation and marine segments. In general, management believes that continuous innovation and the introduction of new products are essential for future revenue growth.
Cost of Goods Sold
|
52-weeks
ended
December
25,
2010
|
52-weeks
ended
December
26,
2009
|
Year
over
Year
|
||||||||||||||||||||||
|
Cost
of
Goods
|
%
of
Revenues
|
Cost
of
Goods
|
%
of
Revenues
|
$
Change
|
%
Change
|
|||||||||||||||||||
|
Outdoor/Fitness
|
$ | 195,136 | 35 | % | $ | 162,082 | 35 | % | $ | 33,054 | 20 | % | ||||||||||||
|
Marine
|
$ | 74,212 | 37 | % | $ | 72,429 | 41 | % | 1,783 | 2 | % | |||||||||||||
|
Automotive/Mobile
|
$ | 995,986 | 60 | % | $ | 1,192,227 | 58 | % | (196,241 | ) | -16 | % | ||||||||||||
|
Aviation
|
$ | 78,203 | 30 | % | $ | 75,591 | 31 | % | 2,612 | 3 | % | |||||||||||||
|
Total
|
$ | 1,343,537 | 50 | % | $ | 1,502,329 | 51 | % | $ | (158,792 | ) | -11 | % | |||||||||||
Cost of goods sold decreased 11% in 2010 when compared to the year-ago period which was generally consistent with the change in revenue. The absolute dollar decrease occurred in automotive/mobile and was partially offset by cost of goods increases in outdoor/fitness, marine and aviation. Cost of goods sold in 2010 was positively impacted by 160 basis points due to a $42.8 million warranty adjustment related to refinement in the estimated warranty reserve. This adjustment impacted all segments with automotive/mobile, outdoor/fitness and marine having the largest benefits. Cost per unit declined in all segments driving stable to improving margins in outdoor/fitness, marine and
aviation.
Management believes that cost of goods sold as a percentage of sales will be stable in 2011 given current component pricing.
50
Gross Profit
|
52-weeks ended December 25, 2010
|
52-weeks ended December 26, 2009
|
Year over Year
|
||||||||||||||||||||||
|
Gross Profit
|
% of Revenues
|
Gross Profit
|
% of Revenues
|
$ Change
|
% Change
|
|||||||||||||||||||
|
Outdoor/Fitness
|
$ | 364,456 | 65 | % | $ | 306,842 | 65 | % | $ | 57,614 | 19 | % | ||||||||||||
|
Marine
|
124,648 | 63 | % | 105,215 | 59 | % | 19,433 | 18 | % | |||||||||||||||
|
Automotive/Mobile
|
672,953 | 40 | % | 861,900 | 42 | % | (188,947 | ) | -22 | % | ||||||||||||||
|
Aviation
|
184,317 | 70 | % | 170,154 | 69 | % | 14,163 | 8 | % | |||||||||||||||
|
Total
|
$ | 1,346,374 | 50 | % | $ | 1,444,111 | 49 | % | $ | (97,737 | ) | -7 | % | |||||||||||
Gross profit dollars in 2010 decreased 7% while gross profit margin percentage increased 110 basis points compared to 2009. Gross profit margins were stable to increasing in all segments excluding the automotive/mobile segment when compared to 2009.
The automotive/mobile segment gross profit margin percentage decrease of 160 basis points was driven by an 11% decrease in average selling price which was only partially offset by a decline in per unit costs including the warranty benefit. Gross profit dollars of the automotive/mobile segment declined to 50% of total gross profit dollars from 60% in 2009. Gross profit dollars for marine increased 18% compared to 2009 due to product mix shifting toward higher margin units. Gross profit dollars for outdoor/fitness increased by 19% to $364.5 million due to strong revenue growth in the segment.
Management believes that total company gross margins will be stable in 2011 as growth occurs in segments with higher margin profiles offsetting continued margin pressure in the automotive/mobile segment due to price declines.
Advertising Expenses
|
52-weeks ended December 25, 2010
|
52-weeks ended December 26, 2009
|
|||||||||||||||||||||||
|
Advertising
|
Advertising
|
Year over Year
|
||||||||||||||||||||||
|
Expense
|
% of Revenues
|
Expense
|
% of Revenues
|
$ Change
|
% Change
|
|||||||||||||||||||
|
Outdoor/Fitness
|
$ | 24,485 | 4 | % | $ | 23,262 | 5 | % | $ | 1,223 | 5 | % | ||||||||||||
|
Marine
|
9,834 | 5 | % | 9,682 | 5 | % | 152 | 2 | % | |||||||||||||||
|
Automotive/Mobile
|
106,950 | 6 | % | 118,713 | 6 | % | (11,763 | ) | -10 | % | ||||||||||||||
|
Aviation
|
3,344 | 1 | % | 3,864 | 2 | % | (520 | ) | -13 | % | ||||||||||||||
|
Total
|
$ | 144,613 | 5 | % | $ | 155,521 | 5 | % | $ | (10,908 | ) | -7 | % | |||||||||||
Advertising expense decreased 7% in absolute dollars and was flat as a percentage of revenues when compared to 2009. As a percent of revenues, advertising expenses were 5% in both 2010 and 2009. The absolute dollar decrease occurred primarily in the automotive/mobile segment due to reduced cooperative advertising paid to our retail partners partially offset by mobile handset specific advertising. Further offsetting the decline was increased advertising for outdoor/fitness where we continue to invest for growth.
Management expects to maintain advertising as a percentage of sales constant in 2011.
Selling, General and Administrative Expenses
|
52-weeks ended December 25, 2010
|
52-weeks ended December 26, 2009
|
|||||||||||||||||||||||
|
Selling, General &
|
Selling, General &
|
Year over Year
|
||||||||||||||||||||||
|
Admin. Expenses
|
% of Revenues
|
Admin. Expenses
|
% of Revenues
|
$ Change
|
% Change
|
|||||||||||||||||||
|
Outdoor/Fitness
|
$ | 58,313 | 10 | % | $ | 47,799 | 10 | % | $ | 10,514 | 22 | % | ||||||||||||
|
Marine
|
23,497 | 12 | % | 18,177 | 10 | % | 5,320 | 29 | % | |||||||||||||||
|
Automotive/Mobile
|
188,799 | 11 | % | 172,473 | 8 | % | 16,326 | 9 | % | |||||||||||||||
|
Aviation
|
17,215 | 7 | % | 25,753 | 10 | % | (8,538 | ) | -33 | % | ||||||||||||||
|
Total
|
$ | 287,824 | 11 | % | $ | 264,202 | 9 | % | $ | 23,622 | 9 | % | ||||||||||||
51
Selling, general and administrative expense increased in both absolute dollars and as a percentage of revenues compared to 2009. As a percent of revenues, selling, general and administrative expenses increased from 9% of revenues in 2009 to 11% of revenues in 2010. The expense increase was primarily driven by legal costs, fees associated with the Swiss redomestication, and growth in product support and information technology to support our growing installed base of users. Aviation costs declined year-over-year due to a 2009 bad debt accrual driven by cash collection risks associated with several of our customers that did not reoccur in 2010.
Management expects selling, general and administrative expenses to decline in absolute dollars but to increase as a percentage of sales in 2011 as revenue declines outpace cost reductions.
Research and Development Expense
|
52-weeks
ended
December
25,
2010
|
52-weeks
ended
December
26,
2009
|
|||||||||||||||||||||||
|
Research &
|
Research &
|
Year
over
Year
|
||||||||||||||||||||||
|
Development
|
%
of
Revenues
|
Development
|
%
of
Revenues
|
$
Change
|
%
Change
|
|||||||||||||||||||
|
Outdoor/Fitness
|
$ | 30,633 | 5 | % | $ | 23,776 | 5 | % | $ | 6,857 | 29 | % | ||||||||||||
|
Marine
|
23,854 | 12 | % | 21,448 | 12 | % | 2,406 | 11 | % | |||||||||||||||
|
Automotive/Mobile
|
131,290 | 8 | % | 110,907 | 5 | % | 20,383 | 18 | % | |||||||||||||||
|
Aviation
|
91,484 | 35 | % | 82,247 | 33 | % | 9,237 | 11 | % | |||||||||||||||
|
Total
|
$ | 277,261 | 10 | % | $ | 238,378 | 8 | % | $ | 38,883 | 16 | % | ||||||||||||
Research and development expense increased 16% due to ongoing development activities for new products including the mobile handset initiative which has now been cancelled, and the addition of over 350 new engineering personnel to our staff during the period. In absolute dollars, research and development costs increased $38.9 million primarily in the auto/mobile segment, when compared with the year-ago period and increased 220 basis points as a percent of revenue.
Management believes that one of the key strategic initiatives for future growth and success of Garmin is continuous innovation, development, and introduction of new products. Management expects that its research and development expenses will be stable during fiscal 2011 on an absolute dollar basis in order to deliver innovative new products and technologies.
Operating Income
|
52-weeks ended December 25, 2010
|
52-weeks ended December 26, 2009
|
Year over Year
|
||||||||||||||||||||||
|
Operating Income
|
% of Revenues
|
Operating Income
|
% of Revenues
|
$ Change
|
% Change
|
|||||||||||||||||||
|
Outdoor/Fitness
|
$ | 251,025 | 45 | % | $ | 212,005 | 45 | % | $ | 39,020 | 18 | % | ||||||||||||
|
Marine
|
67,463 | 34 | % | 55,908 | 31 | % | 11,555 | 21 | % | |||||||||||||||
|
Automotive/Mobile
|
245,914 | 15 | % | 459,807 | 22 | % | (213,893 | ) | -47 | % | ||||||||||||||
|
Aviation
|
72,274 | 28 | % | 58,290 | 24 | % | 13,984 | 24 | % | |||||||||||||||
|
Total
|
$ | 636,676 | 24 | % | $ | 786,010 | 27 | % | $ | (149,334 | ) | -19 | % | |||||||||||
Operating income decreased 300 basis points as a percent of revenue and 19% in absolute dollars when compared to the year-ago period as gross margin percentage improvements and reduced advertising expense were more than offset by declining revenues and increased selling, general and administrative and research and development expenses.
The automotive/mobile operating margin declined from 22% in 2009 to 15% in 2010 due to a 160 basis point decline in gross margins and selling, general and administrative and research and development expense increases during a period of declining revenues. The aviation operating margin increased from 24% in 2009 to 28% in 2010 as gross margins improved 100 basis points
52
Other Income (Expense)
|
52-weeks ended
|
52-weeks ended
|
|||||||
|
December 25, 2010
|
December 26, 2009
|
|||||||
|
Interest Income
|
$ | 24,979 | $ | 23,519 | ||||
|
Interest Expense
|
(1,246 | ) | - | |||||
|
Foreign Currency Exchange
|
(88,377 | ) | (6,040 | ) | ||||
|
Gain/(Loss) on sale of marketable securities
|
(2,382 | ) | 2,741 | |||||
|
Other
|
7,622 | 2,421 | ||||||
|
Total
|
$ | (59,404 | ) | $ | 22,641 | |||
Other income (expense) principally consists of interest income and foreign currency exchange gains and losses. Other income (expense) was lower in fiscal 2010 relative to fiscal 2009, with the majority of this difference caused by a large foreign currency loss in 2010. Interest income for fiscal 2010 increased due to increasing cash and marketable securities balances during the year partially offset by decreasing interest rates.
Foreign currency gains and losses for the Company are primarily tied to movements by the Taiwan Dollar, the Euro, and the British Pound Sterling. Due to the relative size of entities using other currencies, movements are not expected to have a material impact on the Company’s financial statements. The Euro is the functional currency of all subsidiaries excluding those shown below. As subsidiaries have grown, currency moves generated material gains and losses. Additionally, Euro-based inter-company transactions in Garmin Ltd. can also generate currency gains and losses.
The $88.4 million currency loss in 2010 was due to the strengthening of the U.S. Dollar compared to the Euro and the British Pound Sterling, as well as the weakening of the U.S. Dollar compared to the Taiwan Dollar. During 2010, the U.S. Dollar strengthened 8.8% and 3.3% compared to the Euro and the British Pound Sterling, respectively, resulting in a loss of $51.0 million. A loss of $38.7 million resulted due to the U.S. Dollar weakening 5.9% against the Taiwan Dollar. The movements of the Taiwan Dollar and Euro/British Pound Sterling have offsetting impacts due to the use of the Taiwan Dollar for manufacturing costs and cash held in non-functional currency while the Euro and
British Pound Sterling transactions relate to revenue. The remaining net currency gain of $1.3 million related to other currencies and timing of transactions.
The $6.0 million currency loss in 2009 was due to the weakening of the U.S. Dollar compared to the Euro, the British Pound Sterling and the Taiwan Dollar. During 2009, the U.S. Dollar weakened 2.4% and 8.3% compared to the Euro and the British Pound Sterling, respectively, resulting in a gain of $5.8 million. A loss of $16.1 million resulted due to the U.S. Dollar weakening 2.3% against the Taiwan Dollar. The remaining net currency gain of $4.3 million related to other currencies and timing of transactions.
Income Tax Provision
Our earnings before taxes fell 29% when compared to 2009 and our income tax expense decreased by $112.0 million, to ($7.3) million, for fiscal year 2010 from $104.7 million for fiscal year 2009. The significant decline in income tax expense was due to the impact of one-time items booked in 2010. The one-time items of ($98.7) million include release of uncertain tax position reserves from 2006 to 2008 related to our settlement with the IRS in the US, partially offset by the amount of the settlement for the 2007 tax year in the US and Taiwan surtax expense due to the release of reserves. Without one-time items, we would have reported an effective tax rate of 15.8% for 2010 compared to 12.9%
for 2009. The increase in the adjusted effective tax rate as compared to 2009 is largely due to an unfavorable mix of income among taxing jurisdictions.
Net Income
As a result of the various factors noted above, net income decreased 17% to $584.6 million for fiscal year 2010 compared to $704.0 million for fiscal year 2009.
53
Comparison of 52-Weeks Ended December 26, 2009 and December 27, 2008
Net Sales
|
52-weeks ended December 26, 2009
|
52-weeks ended December 27, 2008
|
Year over Year
|
||||||||||||||||||||||
|
Net Sales
|
% of Revenues
|
Net Sales
|
% of Revenues
|
$ Change
|
% Change
|
|||||||||||||||||||
|
Outdoor/Fitness
|
$ | 468,924 | 16 | % | $ | 427,783 | 12 | % | $ | 41,141 | 10 | % | ||||||||||||
|
Marine
|
177,644 | 6 | % | 204,477 | 6 | % | (26,833 | ) | -13 | % | ||||||||||||||
|
Automotive/Mobile
|
2,054,127 | 70 | % | 2,538,411 | 73 | % | (484,284 | ) | -19 | % | ||||||||||||||
|
Aviation
|
245,745 | 8 | % | 323,406 | 9 | % | (77,661 | ) | -24 | % | ||||||||||||||
|
Total
|
$ | 2,946,440 | 100 | % | $ | 3,494,077 | 100 | % | $ | (547,637 | ) | -16 | % | |||||||||||
Net sales decreased 16% in 2009 when compared to the year-ago period. The decrease occurred across all segments, except outdoor/fitness, with the greatest decreases in the automotive/mobile and aviation segments. Automotive/mobile revenue was the largest portion of our revenue mix, but declined from 73% in 2008 to 70% in 2009.
Total unit sales decreased 2% to 16.6 million in 2009 from 16.9 million in 2008. The lower unit sales volume was attributable to declining volumes across all segments, excluding outdoor/fitness, with the greatest percentage declines occurring in aviation and marine. The lower volumes were driven primarily by the macroeconomic conditions and reduced inventory levels with many of our retail partners.
Automotive/mobile segment revenue declined 19% in 2009 as the average selling price declined 18% and volumes declined 2%. Average selling price declines continue to be attributable to the competitive environment in which our automotive/mobile products compete. The aviation and marine segments declined 24% and 13%, respectively in 2009, as both industries experienced significant slowdowns associated with the macroeconomic conditions. Outdoor/fitness segment revenue increased 10% due to new product introductions, including the Dakota™ series, the Forerunner® 405CX, the Forerunner® 310XT and Edge® 500, and increasing global penetration of the fitness
category. All segments showed improving trends in the second half of 2009 as the macroeconomic conditions improved.
Cost of Goods Sold
|
52-weeks ended December 26, 2009
|
52-weeks ended December 27, 2008
|
Year over Year
|
||||||||||||||||||||||
|
Cost of Goods
|
% of Revenues
|
Cost of Goods
|
% of Revenues
|
$ Change
|
% Change
|
|||||||||||||||||||
|
Outdoor/Fitness
|
$ | 162,082 | 35 | % | $ | 181,037 | 42 | % | $ | (18,955 | ) | -10 | % | |||||||||||
|
Marine
|
$ | 72,429 | 41 | % | $ | 93,052 | 46 | % | (20,623 | ) | -22 | % | ||||||||||||
|
Automotive/Mobile
|
$ | 1,192,227 | 58 | % | $ | 1,560,816 | 61 | % | (368,589 | ) | -24 | % | ||||||||||||
|
Aviation
|
75,591 | 31 | % | $ | 105,657 | 33 | % | (30,066 | ) | -28 | % | |||||||||||||
|
Total
|
$ | 1,502,329 | 51 | % | $ | 1,940,562 | 56 | % | $ | (438,233 | ) | -23 | % | |||||||||||
Cost of goods sold decreased 23% in 2009 when compared to 2008 due primarily to the 16% decline in revenue. In addition, cost per unit declined in all segments driving cost of goods sold as a percentage of revenue lower due to material cost reductions. This savings was partially offset by inventory reserves associated with the mobile handset initiatives.
Gross Profit
|
52-weeks ended December 26, 2009
|
52-weeks ended December 27, 2008
|
Year over Year
|
||||||||||||||||||||||
|
Gross Profit
|
% of Revenues
|
Gross Profit
|
% of Revenues
|
$ Change
|
% Change
|
|||||||||||||||||||
|
Outdoor/Fitness
|
$ | 306,842 | 65 | % | $ | 246,746 | 58 | % | $ | 60,096 | 24 | % | ||||||||||||
|
Marine
|
105,215 | 59 | % | 111,425 | 54 | % | (6,210 | ) | -6 | % | ||||||||||||||
|
Automotive/Mobile
|
861,900 | 42 | % | 977,595 | 39 | % | (115,695 | ) | -12 | % | ||||||||||||||
|
Aviation
|
170,154 | 69 | % | 217,749 | 67 | % | (47,595 | ) | -22 | % | ||||||||||||||
|
Total
|
$ | 1,444,111 | 49 | % | $ | 1,553,515 | 44 | % | $ | (109,404 | ) | -7 | % | |||||||||||
54
The decrease in gross profit dollars was primarily attributable to the automotive/mobile and aviation segments where the effects of revenue declines were partially offset by the improved gross margins earned. Gross profit margin percentage for the Company overall increased 450 basis points as margins expanded in all segments.
The automotive/mobile segment gross profit margin percentage increase of 350 basis points was driven by material costs reductions partially offset by inventory reserves associated with the mobile handset initiative and price declines. Outdoor/fitness gross margin increased principally due to a newer suite of higher margin products. Gross profit margin percentage for marine and aviation increased compared to 2008 due to increased average selling price and decreases in per unit costs driven by product mix and material cost reductions.
Advertising Expenses
|
52-weeks ended December 26, 2009
|
52-weeks ended December 27, 2008
|
|||||||||||||||||||||||
|
Advertising
|
Advertising
|
Year over Year
|
||||||||||||||||||||||
|
Expense
|
% of Revenues
|
Expense
|
% of Revenues
|
$ Change
|
% Change
|
|||||||||||||||||||
|
Outdoor/Fitness
|
$ | 23,262 | 5 | % | $ | 27,932 | 7 | % | $ | (4,670 | ) | -17 | % | |||||||||||
|
Marine
|
9,682 | 5 | % | 14,532 | 7 | % | (4,850 | ) | -33 | % | ||||||||||||||
|
Automotive/Mobile
|
118,713 | 6 | % | 160,926 | 6 | % | (42,213 | ) | -26 | % | ||||||||||||||
|
Aviation
|
3,864 | 2 | % | 4,787 | 1 | % | (923 | ) | -19 | % | ||||||||||||||
|
Total
|
$ | 155,521 | 5 | % | $ | 208,177 | 6 | % | $ | (52,656 | ) | -25 | % | |||||||||||
Advertising expense decreased both as a percentage of sales and in absolute dollars when compared to 2008. As a percent of sales, advertising expenses declined to 5% in 2009 compared to 6.0% in 2008. The decrease was a result of actions taken by the company to reduce costs as the macroeconomic conditions impacted sales across our segments and around the world combined with lower cooperative advertising which is tied to net sales levels.
Selling, General and Administrative Expenses
|
52-weeks
ended
December
26,
2009
|
52-weeks
ended
December
27,
2008
|
|||||||||||||||||||||||
|
Selling, General &
|
Selling, General &
|
Year
over
Year
|
||||||||||||||||||||||
|
Admin.
Expenses
|
%
of
Revenues
|
Admin.
Expenses
|
%
of
Revenues
|
$
Change
|
%
Change
|
|||||||||||||||||||
|
Outdoor/Fitness
|
$ | 47,799 | 10 | % | $ | 32,800 | 8 | % | $ | 14,999 | 46 | % | ||||||||||||
|
Marine
|
18,177 | 10 | % | 17,536 | 9 | % | 641 | 4 | % | |||||||||||||||
|
Automotive/Mobile
|
172,473 | 8 | % | 206,954 | 8 | % | (34,481 | ) | -17 | % | ||||||||||||||
|
Aviation
|
25,753 | 10 | % | 19,922 | 6 | % | 5,831 | 29 | % | |||||||||||||||
|
Total
|
$ | 264,202 | 9 | % | $ | 277,212 | 8 | % | $ | (13,010 | ) | -5 | % | |||||||||||
Selling, general and administrative expense decreased 5% in 2009 while it increased as a percentage of sales compared to 2008 as costs throughout the Company were reduced but not as rapidly as the revenue declines. The decline in costs was primarily related to a reduction in bad debt expense due to specific reserves recorded in 2008 as a result of vendor bankruptcies offset by increased costs for product support and information technology. The increased expense for the outdoor/fitness segment and the decreased expense for the automotive/mobile segment were driven by the allocation of costs based on revenues. As outdoor/fitness
revenues have increased as a percentage of revenues, additional selling, general and administrative expenses are shifted to the segment. As a percent of sales, selling, general and administrative expenses increased from 8% in 2008 to 9% of sales in 2009, as revenues declined.
Research and Development Expense
|
52-weeks ended December 26, 2009
|
52-weeks ended December 27, 2008
|
|||||||||||||||||||||||
|
Research &
|
Research &
|
Year over Year
|
||||||||||||||||||||||
|
Development
|
% of Revenues
|
Development
|
% of Revenues
|
$ Change
|
% Change
|
|||||||||||||||||||
|
Outdoor/Fitness
|
$ | 23,776 | 5 | % | $ | 25,419 | 6 | % | $ | (1,643 | ) | -6 | % | |||||||||||
|
Marine
|
21,448 | 12 | % | 19,374 | 9 | % | 2,074 | 11 | % | |||||||||||||||
|
Automotive/Mobile
|
110,907 | 5 | % | 85,610 | 3 | % | 25,297 | 30 | % | |||||||||||||||
|
Aviation
|
82,247 | 33 | % | 75,706 | 23 | % | 6,541 | 9 | % | |||||||||||||||
|
Total
|
$ | 238,378 | 8 | % | $ | 206,109 | 6 | % | $ | 32,269 | 16 | % | ||||||||||||
55
The increase in research and development expense dollars was due to ongoing development activities for new products including the mobile handset initiative, the addition of 230 new engineering personnel to our staff during the period, and an increase in engineering program costs in 2009 as a result of our continued emphasis on product innovation.
Operating Income
|
52-weeks ended December 26, 2009
|
52-weeks ended December 27, 2008
|
Year over Year
|
||||||||||||||||||||||
|
Operating Income
|
% of Revenues
|
Operating Income
|
% of Revenues
|
$ Change
|
% Change
|
|||||||||||||||||||
|
Outdoor/Fitness
|
$ | 212,005 | 45 | % | $ | 160,595 | 38 | % | $ | 51,410 | 32 | % | ||||||||||||
|
Marine
|
55,908 | 31 | % | 59,983 | 29 | % | (4,075 | ) | -7 | % | ||||||||||||||
|
Automotive/Mobile
|
459,807 | 22 | % | 524,105 | 21 | % | (64,298 | ) | -12 | % | ||||||||||||||
|
Aviation
|
58,290 | 24 | % | 117,334 | 36 | % | (59,044 | ) | -50 | % | ||||||||||||||
|
Total
|
$ | 786,010 | 27 | % | $ | 862,017 | 25 | % | $ | (76,007 | ) | -9 | % | |||||||||||
Operating income increased 200 basis points as a percent of revenue but decreased 9% in absolute dollars when compared to the year-ago period as gross margin percentage improvements and reduced advertising expense were more than offset by declining revenues and increased research and development expenses.
Other Income (Expense)
|
52-weeks ended
|
52-weeks ended
|
|||||||
|
December 26, 2009
|
December 27, 2008
|
|||||||
|
Interest Income
|
$ | 23,519 | $ | 35,535 | ||||
|
Foreign Currency Exchange
|
(6,040 | ) | (35,286 | ) | ||||
|
Gain on sale of marketable securities
|
2,741 | 50,884 | ||||||
|
Other
|
2,421 | 1,216 | ||||||
|
Total
|
$ | 22,641 | $ | 52,349 | ||||
Other income (expense) principally consists of interest income and foreign currency exchange gains and losses. Other income (expense) was lower in fiscal 2009 relative to fiscal 2008, with the majority of this difference caused by a large gain on sale of equity securities in 2008. Interest income for fiscal 2009 decreased due to lower interest rates, partially offset by higher cash and marketable securities balances.
The $6.0 million currency loss in 2009 was due to the weakening of the U.S. Dollar compared to the Euro, the British Pound Sterling and the Taiwan Dollar. During 2009, the U.S. Dollar weakened 2.4% and 8.3% compared to the Euro and the British Pound Sterling, respectively, resulting in a gain of $5.8 million. A loss of $16.1 million resulted due to the U.S. Dollar weakening 2.3% against the Taiwan Dollar. The relative weakness of the Taiwan Dollar and Euro/British Pound Sterling have offsetting impacts due to the use of the Taiwan Dollar for manufacturing costs while the Euro and British Pound Sterling transactions relate to revenue. The remaining net currency gain of $4.3 million
related to other currencies and timing of transactions.
The $35.3 million currency loss in 2008 was related to the strengthening of the U.S. Dollar offset by a gain associated with the sales and tender of our Tele Atlas N.V. shares. During 2008, the Taiwan Dollar weakened 1.6% in comparison to the U.S. Dollar, resulting in a $20.8 million gain. The Euro weakened 4.1% and the British Pound Sterling weakened 26.1% relative to the U.S. Dollar in 2008 which resulted in a $77.3 million loss. Offsetting this net loss was a realized gain of $21.5 million due to the strengthening of the Euro between the date of purchase of the Tele Atlas N.V. shares in October 2007 to the dates of tender in February, March, and June 2008. Other net
currency losses and the timing of transactions created the remaining loss of $0.3 million.
Gain on sale of equity of securities of $50.9 million in 2008 was primarily generated from the sale of our equity interest in Tele Atlas N.V. which we acquired in 2007 in connection with our announced intent to make a cash offer for all outstanding shares, which was subsequently abandoned.
56
Income Tax Provision
Our fiscal 2009 earnings before taxes fell 12% when compared to 2008, while our income tax expense decreased 42%. Income taxes fell $76.8 million, to $104.7 million, for fiscal year 2009 from $181.5 million for fiscal year 2008, due to a lower effective tax rate and the reduced earnings before taxes. The effective tax rate was 12.9% for fiscal 2009 compared to 19.9% for fiscal 2008. The decrease in tax rate is due to the favorable mix of taxable income among the tax jurisdictions in which the Company operates and the release of income tax reserves for which the statute of limitations has expired.
Net Income
As a result of the various factors noted above, net income decreased 4% to $704.0 million for fiscal year 2009 compared to $732.8 million for fiscal year 2008.
Liquidity and Capital Resources
Net cash generated by operations was $770.6 million, $1,094.5 million, and $862.2 million for fiscal years 2010, 2009, and 2008, respectively. Primary drivers of the cash generation in 2010 included $584.6 million of net income with non-cash adjustments for depreciation/amortization of $94.7 million, foreign currency unrealized losses of $62.8 million, stock compensation expense of $40.3 million, $129.7 million related to decreased accounts receivable as sales levels have declined and $131.3 million of sales for which cash was received but revenue was deferred as required by our revenue recognition policies. This cash generation was partially offset by uses of cash including a $144.5 million
reduction in other current and noncurrent liabilities related primarily to the timing of royalty payments and the $146.4 million reversal of tax reserves associated with both release of uncertain tax position reserves from 2006 to 2008 related to our settlement with the IRS in the US and expiration of statute of limitations, a $81.4 million reduction in accounts payable primarily in our Taiwan manufacturing operations due to timing of payments, and a $77.1 million increase in inventories following a low inventory level exiting 2009. The decline in cash flow from operations over 2009 levels was due to reduced net income levels and the effect of the non cash income tax benefit realized from reduced tax reserves. We expect to generate cash flow from operations in 2011 with ongoing net income, as well as working capital gains through reduced accounts receivable and inventory
levels as sales decline.
Cash flow used in investing activities was $72.9 million, $547.9 million and $56.3 million for fiscal 2010, 2009 and 2008, respectively. Cash flow used in investing activities principally relates to the net redemption of or investment in fixed income securities, capital expenditures and acquisitions. Capital expenditures in 2010 totaled $32.2 million and related to business operations and maintenance activities. This has declined significantly from 2008 spending levels due to the completion of production and warehouse facility expansions. We have budgeted approximately $50 million of capital expenditures during fiscal 2011
to include normal ongoing capital expenditures and maintenance activities. In 2010 and 2009, net investment in fixed income securities of our on-hand cash was $25.5 million and $491.0 million, respectively, as we invested excess cash. In 2008, the net sale of fixed income securities was primarily related to $239.3 million of cash generated from the tender of our shares of Tele Atlas N.V. It is management’s goal to invest the on-hand cash consistent with Garmin’s investment policy, which has been approved by the Board of Directors. The investment policy’s primary purpose is to preserve capital, maintain an acceptable degree of liquidity, and maximize yield within the constraint of low credit risk. Garmin’s average interest rate returns on cash and investments during fiscal 2010, 2009 and 2008 were
approximately 1.3%, 1.7% and 3.4%, respectively. In 2010, cash flow used in investing activities also included the acquisition of MetriGear, Inc. In 2008, cash flow used in investing for acquisitions related to the purchase of European distributors.
Net cash used by financing activities in fiscal 2010 was $510.8 million resulting from the use of $298.9 million for payment of our declared dividend and $225.9 million for stock repurchased under our stock repurchase plan, partially offset by $14.0 million from the issuance of common stock related to our Company stock option plan and stock based compensation tax benefits. The 2010 dividend paid was significantly higher than prior years as the dividend was increased to $1.50 per share. Stock repurchases are made at the discretion of management under repurchase programs approved by the Board of Directors as business and market conditions warrant. In 2010, 2009 and 2008, the Company
repurchased 7.4 million shares, 0.7 million shares and 17.1 million shares, respectively.
57
We currently use cash flow from operations to fund our capital expenditures, to support our working capital requirements, to pay dividends and to repurchase shares. We expect that future cash requirements will principally be for capital expenditures, working capital, repurchase of shares, payment of dividends declared, and the funding of strategic acquisitions.
We believe that our existing cash balances and cash flow from operations will be sufficient to meet our projected capital expenditures, working capital and other cash requirements at least through the end of fiscal 2011.
Contractual Obligations and Commercial Commitments
Future commitments of Garmin, as of December 25, 2010, aggregated by type of contractual obligation, are:
|
Payments
due
by
period
|
||||||||||||||||||||
|
Less than
|
More than
|
|||||||||||||||||||
|
Contractual
Obligations
|
Total
|
1
year
|
1-3
years
|
3-5
years
|
5
years
|
|||||||||||||||
|
Operating Leases
|
$ | 44,920 | $ | 10,397 | $ | 17,737 | $ | 12,205 | $ | 4,581 | ||||||||||
Operating leases describes lease obligations associated with Garmin facilities located in the U.S., Taiwan, Europe, and Canada.
We may be required to make significant cash outlays related to unrecognized tax benefits. However, due to the uncertainty of the timing of future cash flows associated with our unrecognized tax benefits, we are unable to make reasonably reliable estimates of the period of cash settlement, if any, with the respective taxing authorities. Accordingly, unrecognized tax benefits of $153.6 million as of December 25, 2010, have been excluded from the contractual obligations table above. For further information related to unrecognized tax benefits, see Note 2, “Income Taxes”, to the consolidated financial statements included in this Report.
Off-Balance Sheet Arrangements
We do not have any off-balance sheet arrangements.
Market Sensitivity
We have market risk primarily in connection with the pricing of our products and services and the purchase of raw materials. Product pricing and raw materials costs are both significantly influenced by semiconductor market conditions. Historically, during cyclical industry downturns, we have been able to offset pricing declines for our products through a combination of improved product mix and success in obtaining price reductions in raw materials costs.
58
Inflation
We do not believe that inflation has had a material effect on our business, financial condition or results of operations. If our costs were to become subject to significant inflationary pressures, we may not be able to fully offset such higher costs through price increases. Our inability or failure to do so could adversely affect our business, financial condition and results of operations.
Foreign Currency Exchange Rate Risk
The operation of Garmin’s subsidiaries in international markets results in exposure to movements in currency exchange rates. We have experienced significant foreign currency gains and losses due to the strengthening and weakening of the U.S. dollar. The potential of volatile foreign exchange rate fluctuations in the future could have a significant effect on our results of operations.
The currencies that create a majority of the Company’s exchange rate exposure are the Taiwan Dollar, Euro, and British Pound Sterling. Garmin Corporation, headquartered in Sijhih, Taiwan, uses the local currency as the functional currency. The Company translates all assets and liabilities at year-end exchange rates and income and expense accounts at average rates during the year. In order to minimize the effect of the currency exchange fluctuations on our net assets, we have elected to retain most of our Taiwan subsidiary’s cash and investments in marketable securities denominated in U.S. dollars.
All European subsidiaries excluding Garmin (Europe) Ltd., Garmin Danmark, Garmin Sweden, Garmin Polska and Garmin Norge use the Euro as the functional currency
.
The functional currency of our largest European subsidiary, Garmin (Europe) Ltd. remains the U.S. dollar, and as some transactions occurred in British Pounds Sterling or Euros, foreign currency gains or losses have been realized historically related to the movements of those currencies relative to the U.S. dollar. The Company believes that gains and losses will become more material in the future as our European presence grows. In 2010, the U.S. Dollar strengthened
8.8% relative to the Euro and 3.3% relative to the British Pound Sterling. These currency moves resulted in a foreign currency loss of $51.0 million in Garmin Ltd. and our European subsidiaries. A loss of $38.7 million resulted due to the U.S. Dollar weakening 5.9% against the Taiwan Dollar. The net result of these currency moves combined with other gains of $1.3 million, and the timing of transactions during the year was a net loss of $88.4 million for the Company and a cumulative translation adjustment of $61.7 million at the end of fiscal 2010.
Interest Rate Risk
We have no outstanding long-term debt as of December 25, 2010. We, therefore, have no meaningful debt-related interest rate risk.
We are exposed to interest rate risk in connection with our investments in marketable securities. As interest rates change, the unrealized gains and losses associated with those securities will fluctuate accordingly. A hypothetical change of 10% in interest rates would not have a material effect on such unrealized gains or losses. At December 25, 2010, cumulative unrealized losses on those securities were $4.6 million.
59
CONSOLIDATED FINANCIAL STATEMENTS
Garmin Ltd. and Subsidiaries
Years Ended December 25, 2010, December 26, 2009 and December 27, 2008
Contents
|
Report of Ernst & Young LLP, Independent Registered Public Accounting Firm
|
61
|
|
Consolidated Balance Sheets at December 25, 2010 and December 26, 2009
|
62
|
|
Consolidated Statements of Income for the Years Ended December 25, 2010, December 26, 2009 and December 27, 2008
|
63
|
|
Consolidated Statements of Stockholders’ Equity for the Years Ended December 25, 2010, December 26, 2009 and December 27, 2008
|
64
|
|
Consolidated Statements of Cash Flows for the Years December 25, 2010, December 26, 2009 and December 27, 2008
|
65
|
|
Notes to Consolidated Financial Statements
|
67
|
60
Report of Ernst & Young LLP
Independent Registered Public Accounting Firm
The Board of Directors and Shareholders
Garmin Ltd.
We have audited the accompanying consolidated balance sheets of Garmin Ltd. and Subsidiaries (the Company) as of December 25, 2010 and December 26, 2009 and the related consolidated statements of income, stockholders' equity, and cash flows for each of the three years in the period ended December 25, 2010. Our audits also included the financial statement schedule listed in the index at Item 15(a)(2). These financial statements and schedule are the responsibility of the Company's management. Our responsibility is to express an opinion on these financial statements and schedule based on our audits.
We conducted our audits in accordance with the standards of the Public Company Accounting Oversight Board (United States). Those standards require that we plan and perform the audit to obtain reasonable assurance about whether the financial statements are free of material misstatement. An audit includes examining, on a test basis, evidence supporting the amounts and disclosures in the financial statements. An audit also includes assessing the accounting principles used and significant estimates made by management, as well as evaluating the overall financial statement presentation. We believe that our audits provide a reasonable basis for our opinion.
In our opinion, the financial statements referred to above present fairly, in all material respects, the consolidated financial position of Garmin Ltd. and Subsidiaries at December 25, 2010 and December 26, 2009 and the consolidated results of their operations and their cash flows for each of the three years in the period ended December 25, 2010, in conformity with U.S. generally accepted accounting principles. Also, in our opinion, the related financial statement schedule, when considered in relation to the basic financial statements taken as a whole, presents fairly in all material respects the information set forth therein.
We also have audited, in accordance with the standards of the Public Company Accounting Oversight Board (United States), Garmin Ltd.’s internal control over financial reporting as of December 25, 2010, based on criteria established in the Internal Control-Integrated Framework issued by the Committee of Sponsoring Organizations of the Treadway Commission and our report dated February 23, 2011 expressed an unqualified opinion thereon.
|
/s/ Ernst & Young LLP
|
|
|
Kansas City, Missouri
|
|
|
February 23, 2011
|
61
Garmin Ltd. And Subsidiaries
Consolidated Balance Sheets
(In thousands, except share information)
|
December 25,
|
December 26,
|
|||||||
|
2010
|
2009
|
|||||||
|
Assets
|
||||||||
|
Current assets:
|
||||||||
|
Cash and cash equivalents
|
$ | 1,260,936 | $ | 1,091,581 | ||||
|
Marketable securities
(Note 3)
|
24,418 | 19,583 | ||||||
|
Accounts receivable, less allowance for doubtful accounts of
|
||||||||
|
$31,822 in 2010 and $36,673 in 2009
|
747,249 | 874,110 | ||||||
|
Inventories, net
|
387,577 | 309,938 | ||||||
|
Deferred income taxes
(Note 6)
|
33,628 | 61,397 | ||||||
|
Deferred costs
|
20,053 | 5,314 | ||||||
|
Prepaid expenses and other current assets
|
24,894 | 34,156 | ||||||
|
Total current assets
|
2,498,755 | 2,396,079 | ||||||
|
Property and equipment, net
|
||||||||
|
Land and improvements
|
94,792 | 92,088 | ||||||
|
Building and improvements
|
274,163 | 268,011 | ||||||
|
Office furniture and equipment
|
98,779 | 84,544 | ||||||
|
Manufacturing equipment
|
119,829 | 115,179 | ||||||
|
Engineering equipment
|
71,709 | 65,240 | ||||||
|
Vehicles
|
18,437 | 15,247 | ||||||
| 677,709 | 640,309 | |||||||
|
Accumulated depreciation
|
(249,904 | ) | (198,971 | ) | ||||
| 427,805 | 441,338 | |||||||
|
Restricted cash
(Note 4)
|
1,277 | 2,047 | ||||||
|
Marketable securities
(Note 3)
|
777,401 | 746,464 | ||||||
|
License agreements, net
|
1,800 | 15,400 | ||||||
|
Noncurrent deferred income tax
(Note 6)
|
73,613 | 20,498 | ||||||
|
Noncurrent deferred costs
|
24,685 | 7,996 | ||||||
|
Other intangible assets
|
183,352 | 198,260 | ||||||
|
Total assets
|
$ | 3,988,688 | $ | 3,828,082 | ||||
|
Liabilities and Stockholders' Equity
|
||||||||
|
Current liabilities:
|
||||||||
|
Accounts payable
|
$ | 132,348 | $ | 203,388 | ||||
|
Salaries and benefits payable
|
49,288 | 45,236 | ||||||
|
Accrued warranty costs
|
49,885 | 87,424 | ||||||
|
Accrued sales program costs
|
107,261 | 119,150 | ||||||
|
Deferred revenue
|
89,711 | 27,910 | ||||||
|
Accrued royalty costs
|
95,086 | 103,195 | ||||||
|
Accrued advertising expense
|
21,587 | 34,146 | ||||||
|
Other accrued expenses
|
63,043 | 40,373 | ||||||
|
Deferred income taxes
(Note 6)
|
4,800 | 2,208 | ||||||
|
Income taxes payable
|
56,028 | 22,846 | ||||||
|
Total current liabilities
|
669,037 | 685,876 | ||||||
|
Deferred income taxes
(Note 6)
|
6,986 | 10,170 | ||||||
|
Non-current income taxes
|
153,621 | 255,748 | ||||||
|
Non-current deferred revenue
|
108,076 | 38,574 | ||||||
|
Other liabilities
|
1,406 | 1,267 | ||||||
|
Stockholders' equity:
|
||||||||
|
Shares, CHF 10 par value, 208,077,418 shares authorized and issued
|
||||||||
|
and 194,358,038 shares outstanding at December 25, 2010;
|
||||||||
|
Common stock, $0.005 par value, 1,000,000,000 shares authorized
|
||||||||
|
Issued and outstanding shares - 200,274,000 in 2009
|
||||||||
|
(Notes 9, 10, 11, and 12):
|
1,797,435 | 1,001 | ||||||
|
Additional paid-in capital
|
38,268 | 32,221 | ||||||
|
Treasury stock
|
(106,758 | ) | - | |||||
|
Retained earnings
|
1,264,613 | 2,816,607 | ||||||
|
Accumulated other comprehensive gain/(loss)
|
56,004 | (13,382 | ) | |||||
|
Total stockholders' equity
|
3,049,562 | 2,836,447 | ||||||
|
Total liabilities and stockholders' equity
|
$ | 3,988,688 | $ | 3,828,082 | ||||
See accompanying notes.
62
Consolidated Statements of Income
(In Thousands, Except Per Share Information)
|
Fiscal Year Ended
|
||||||||||||
|
December 25,
|
December 26,
|
December 27,
|
||||||||||
|
2010
|
2009
|
2008
|
||||||||||
|
Net sales
|
$ | 2,689,911 | $ | 2,946,440 | $ | 3,494,077 | ||||||
|
Cost of goods sold
|
1,343,537 | 1,502,329 | 1,940,562 | |||||||||
|
Gross profit
|
1,346,374 | 1,444,111 | 1,553,515 | |||||||||
|
Advertising expense
|
144,613 | 155,521 | 208,177 | |||||||||
|
Selling, general and administrative expenses
|
287,824 | 264,202 | 277,212 | |||||||||
|
Research and development expense
|
277,261 | 238,378 | 206,109 | |||||||||
| 709,698 | 658,101 | 691,498 | ||||||||||
|
Operating income
|
636,676 | 786,010 | 862,017 | |||||||||
|
Other income (expense):
|
||||||||||||
|
Interest income
|
24,979 | 23,519 | 35,535 | |||||||||
|
Interest expense
|
(1,246 | ) | - | (607 | ) | |||||||
|
Foreign currency
|
(88,377 | ) | (6,040 | ) | (35,286 | ) | ||||||
|
Gain/(loss) on sale of marketable securities
|
(2,382 | ) | 2,741 | 50,884 | ||||||||
|
Other
|
7,622 | 2,421 | 1,823 | |||||||||
| (59,404 | ) | 22,641 | 52,349 | |||||||||
|
Income before income taxes
|
577,272 | 808,651 | 914,366 | |||||||||
|
Income tax provision (benefit):
(Note 6)
|
||||||||||||
|
Current
|
(11,636 | ) | 128,036 | 136,252 | ||||||||
|
Deferred
|
4,305 | (23,335 | ) | 45,266 | ||||||||
| (7,331 | ) | 104,701 | 181,518 | |||||||||
|
Net income
|
$ | 584,603 | $ | 703,950 | $ | 732,848 | ||||||
|
Basic net income per share
(Note 10)
|
$ | 2.97 | $ | 3.51 | $ | 3.51 | ||||||
|
Diluted net income per share
(Note 10)
|
$ | 2.95 | $ | 3.50 | $ | 3.48 | ||||||
See accompanying notes.
63
Garmin Ltd. And Subsidiaries
Consolidated Statements of Stockholders' Equity
(In Thousands, Except Share and Per Share Information)
|
Accumulated
|
||||||||||||||||||||||||||||
|
Additional
|
Other
|
|||||||||||||||||||||||||||
|
Common Stock
|
Paid-In
|
Treasury
|
Retained
|
Comprehensive
|
||||||||||||||||||||||||
|
Shares
|
Dollars
|
Capital
|
Stock
|
Earnings
|
Gain/(Loss)
|
Total
|
||||||||||||||||||||||
|
Balance at December 29, 2007
|
216,980 | $ | 1,086 | $ | 132,264 | $ | 0 | $ | 2,171,134 | $ | 46,130 | $ | 2,350,614 | |||||||||||||||
|
Net income
|
– | – | – | – | 732,848 | – | 732,848 | |||||||||||||||||||||
|
Translation adjustment
|
– | – | (3,053 | ) | – | (1,595 | ) | (14,991 | ) | (19,639 | ) | |||||||||||||||||
|
Adjustment related to unrealized
gains (losses) on available-for-sale
securities, net of income tax effects
of $150
|
– | – | – | – | – | (68,790 | ) | (68,790 | ) | |||||||||||||||||||
|
Comprehensive income
|
644,419 | |||||||||||||||||||||||||||
|
Dividends paid
|
– | – | – | – | (150,251 | ) | – | (150,251 | ) | |||||||||||||||||||
|
Tax benefit from exercise of employee
stock options
|
– | – | 2,143 | – | – | – | 2,143 | |||||||||||||||||||||
|
Issuance of common stock from
exercise of stock options
|
158 | 2 | 2,873 | – | – | – | 2,875 | |||||||||||||||||||||
|
Stock compensation
|
– | – | 38,872 | – | – | – | 38,872 | |||||||||||||||||||||
|
Purchase and retirement of
common stock
|
(17,138 | ) | (86 | ) | (182,128 | ) | – | (489,633 | ) | – | (671,847 | ) | ||||||||||||||||
|
Issuance of common stock through
stock purchase plan
|
363 | – | 9,029 | – | – | – | 9,029 | |||||||||||||||||||||
|
Balance at December 27, 2008
|
200,363 | $ | 1,002 | $ | 0 | $ | 0 | $ | 2,262,503 | $ | (37,651 | ) | $ | 2,225,854 | ||||||||||||||
|
Net income
|
– | – | – | – | 703,950 | – | 703,950 | |||||||||||||||||||||
|
Translation adjustment
|
– | – | – | – | – | 24,537 | 24,537 | |||||||||||||||||||||
|
Adjustment related to unrealized
gains (losses) on available-for-sale
securities, net of income tax effects
of $676
|
– | – | – | – | – | (268 | ) | (268 | ) | |||||||||||||||||||
|
Comprehensive income
|
728,219 | |||||||||||||||||||||||||||
|
Dividends paid
|
– | – | – | – | (149,846 | ) | – | (149,846 | ) | |||||||||||||||||||
|
Tax benefit from exercise of employee
stock options
|
– | – | 1,366 | – | – | – | 1,366 | |||||||||||||||||||||
|
Issuance of common stock from
exercise of stock options
|
409 | 3 | 3,781 | – | – | – | 3,784 | |||||||||||||||||||||
|
Stock compensation
|
– | – | 43,616 | – | – | – | 43,616 | |||||||||||||||||||||
|
Purchase and retirement of
common stock
|
(708 | ) | (4 | ) | (20,254 | ) | – | – | – | (20,258 | ) | |||||||||||||||||
|
Issuance of common stock through
stock purchase plan
|
210 | – | 3,712 | – | – | – | 3,712 | |||||||||||||||||||||
|
Balance at December 26, 2009
|
200,274 | $ | 1,001 | $ | 32,221 | $ | 0 | $ | 2,816,607 | $ | (13,382 | ) | $ | 2,836,447 | ||||||||||||||
|
Net income
|
– | – | – | – | 584,603 | – | 584,603 | |||||||||||||||||||||
|
Translation adjustment
|
– | – | – | – | – | 52,509 | 52,509 | |||||||||||||||||||||
|
Adjustment related to unrealized gains
(losses) on available-for-sale securities
net of income tax effects of $348
|
– | – | – | – | – | 16,877 | 16,877 | |||||||||||||||||||||
|
Comprehensive income
|
653,989 | |||||||||||||||||||||||||||
|
Dividends paid
|
– | – | – | – | (298,853 | ) | – | (298,853 | ) | |||||||||||||||||||
|
Tax benefit from exercise of employee
stock options
|
– | – | 4,495 | – | – | – | 4,495 | |||||||||||||||||||||
|
Issuance of common stock from
exercise of stock options
|
928 | 2 | (867 | ) | 10,330 | – | – | 9,465 | ||||||||||||||||||||
|
Stock compensation
|
– | – | 40,332 | – | – | – | 40,332 | |||||||||||||||||||||
|
Purchase and retirement of
common stock (prior to June 27, 2010)
|
(6,844 | ) | (16 | ) | (67,528 | ) | – | (41,296 | ) | – | (108,840 | ) | ||||||||||||||||
|
Purchase of treasury stock
|
– | – | – | (117,088 | ) | – | – | (117,088 | ) | |||||||||||||||||||
|
Impact of redomestication on par value
of common shares
|
– | 1,796,448 | – | – | (1,796,448 | ) | – | – | ||||||||||||||||||||
|
Deferred tax impact of redomestication
|
– | – | 29,615 | – | – | – | 29,615 | |||||||||||||||||||||
|
Balance at December 25, 2010
|
194,358 | $ | 1,797,435 | $ | 38,268 | $ | (106,758 | ) | $ | 1,264,613 | $ | 56,004 | $ | 3,049,562 | ||||||||||||||
See accompanying notes.
64
Consolidated Statements of Cash Flows
(In Thousands)
|
Fiscal Year Ended
|
||||||||||||
|
December 25,
|
December 26,
|
December 27,
|
||||||||||
|
2010
|
2009
|
2008
|
||||||||||
|
Operating Activities:
|
||||||||||||
|
Net income
|
$ | 584,603 | $ | 703,950 | $ | 732,848 | ||||||
|
Adjustments to reconcile net income to net cash provided
|
||||||||||||
|
by operating activities:
|
||||||||||||
|
Depreciation
|
53,487 | 56,695 | 46,910 | |||||||||
|
Amortization
|
41,164 | 39,791 | 31,507 | |||||||||
|
(Gain)/loss on sale of property and equipment
|
(306 | ) | (14 | ) | 124 | |||||||
|
Provision for doubtful accounts
|
(4,476 | ) | (1,332 | ) | 32,355 | |||||||
|
Provision for obsolete and slow-moving inventories
|
5,753 | 61,323 | 24,461 | |||||||||
|
Unrealized foreign currency losses/(gains)
|
62,770 | 7,480 | 15,887 | |||||||||
|
Deferred income taxes
|
(471 | ) | (25,096 | ) | 50,887 | |||||||
|
Stock compensation
|
40,332 | 43,616 | 38,872 | |||||||||
|
Realized loss/(gains) on marketable securities
|
2,382 | (2,741 | ) | (50,884 | ) | |||||||
|
Changes in operating assets and liabilities, net of acquisitions:
|
||||||||||||
|
Accounts receivable
|
129,698 | (131,978 | ) | 206,101 | ||||||||
|
Inventories
|
(77,122 | ) | 61,189 | 83,035 | ||||||||
|
Prepaid expenses and other current assets
|
9,886 | 8,054 | (4,356 | ) | ||||||||
|
License fees
|
(3,329 | ) | (13,735 | ) | (15,289 | ) | ||||||
|
Accounts payable
|
(81,354 | ) | 38,875 | (236,287 | ) | |||||||
|
Other current and non-current liabilities
|
(144,476 | ) | 172,215 | (4,507 | ) | |||||||
|
Deferred revenue
|
131,303 | 65,706 | 680 | |||||||||
|
Deferred costs
|
(31,445 | ) | (5,314 | ) | - | |||||||
|
Income taxes payable
|
52,238 | 15,772 | (90,180 | ) | ||||||||
|
Net cash provided by operating activities
|
770,637 | 1,094,456 | 862,164 | |||||||||
|
Investing activities:
|
||||||||||||
|
Purchases of property and equipment
|
(32,232 | ) | (49,199 | ) | (119,623 | ) | ||||||
|
Proceeds from sale of property and equipment
|
139 | 5 | 19 | |||||||||
|
Purchase of intangible assets
|
(3,883 | ) | (7,573 | ) | (6,971 | ) | ||||||
|
Purchase of marketable securities
|
(694,038 | ) | (776,966 | ) | (373,580 | ) | ||||||
|
Redemption of marketable securities
|
668,495 | 285,970 | 504,324 | |||||||||
|
Acquistions, net of cash acquired
|
(12,120 | ) | - | (60,131 | ) | |||||||
|
Change in restricted cash
|
770 | (106 | ) | (387 | ) | |||||||
|
Net cash used in investing activities
|
(72,869 | ) | (547,869 | ) | (56,349 | ) | ||||||
|
Financing activities:
|
||||||||||||
|
Dividends
|
(298,853 | ) | (149,846 | ) | (150,251 | ) | ||||||
|
Proceeds from issuance of common stock through
|
||||||||||||
|
stock purchase plan
|
- | 3,712 | 9,029 | |||||||||
|
Proceeds from issuance of common stock from
|
||||||||||||
|
exercise of stock options
|
9,465 | 3,783 | 2,875 | |||||||||
|
Tax benefit related to stock option exercise
|
4,495 | 1,366 | 2,143 | |||||||||
|
Purchase of common stock
|
(225,928 | ) | (20,258 | ) | (671,847 | ) | ||||||
|
Net cash used in financing activities
|
(510,821 | ) | (161,243 | ) | (808,051 | ) | ||||||
|
Effect of exchange rate changes on cash and cash equivalents
|
(17,592 | ) | 9,902 | (9,118 | ) | |||||||
|
Net increase/(decrease) in cash and cash equivalents
|
169,355 | 395,246 | (11,354 | ) | ||||||||
|
Cash and cash equivalents at beginning of year
|
1,091,581 | 696,335 | 707,689 | |||||||||
|
Cash and cash equivalents at end of year
|
$ | 1,260,936 | $ | 1,091,581 | $ | 696,335 | ||||||
See accompanying notes.
65
Garmin Ltd. And Subsidiaries
Consolidated Statements of Cash Flows (continued)
(In Thousands)
|
Fiscal Year Ended
|
||||||||||||
|
December 25,
|
December 26,
|
December 27,
|
||||||||||
|
2010
|
2009
|
2008
|
||||||||||
|
Supplemental disclosures of cash flow information
|
||||||||||||
|
Cash paid during the year for income taxes
|
$ | 43,940 | $ | 69,186 | $ | 134,421 | ||||||
|
Cash received during the year from income tax refunds
|
$ | 4,526 | $ | 2,934 | $ | 177 | ||||||
|
Cash paid during the year for interest
|
$ | 1,246 | $ | 0 | $ | 607 | ||||||
|
Supplemental disclosure of non-cash investing and financing activities
|
||||||||||||
|
Change in marketable securities related to unrealized appreciation (depreciation)
|
$ | 17,226 | $ | 408 | $ | (68,668 | ) | |||||
|
Acquistions:
|
||||||||||||
|
Fair value of assets acquired
|
$ | 21,918 | $ | 0 | $ | 136,952 | ||||||
|
Liabilities assumed
|
(5,547 | ) | 0 | (60,336 | ) | |||||||
|
Less: cash acquired
|
(4,251 | ) | 0 | (16,485 | ) | |||||||
|
Net cash paid
|
$ | 12,120 | $ | 0 | $ | 60,131 | ||||||
See accompanying notes.
66
GARMIN LTD. AND SUBSIDIARIES
NOTES TO CONSOLIDATED FINANCIAL STATEMENTS
(In Thousands, Except Share and Per Share Information)
December 25, 2010 and December 26, 2009
1. Description of the Business
Garmin Ltd. and subsidiaries (together, the “Company”) manufacture, market, and distribute Global Positioning System-enabled products and other related products. Garmin Corporation (GC), wholly-owned by Garmin Ltd., is primarily responsible for the manufacturing and distribution of the Company’s products to Garmin International, Inc. (GII), a wholly-owned subsidiary of GC, and Garmin (Europe) Limited (GEL), a wholly-owned subsidiary of Garmin Ltd., and, to a lesser extent, new product development and sales and marketing of the Company’s products in Asia and the Far East. GII is primarily responsible for sales and marketing of the Company’s products in many
international markets and in the United States as well as research and new product development. GII also manufactures certain products for the Company’s aviation segment. GEL is responsible for sales and marketing of the Company’s products, principally within the European market.
2. Summary of Significant Accounting Policies
Basis of Presentation and Principles of Consolidation
The accompanying consolidated financial statements have been prepared in accordance with accounting principles generally accepted in the United States. The accompanying consolidated financial statements reflect the accounts of Garmin Ltd. and its wholly owned subsidiaries. All significant inter-company balances and transactions have been eliminated.
Fiscal Year
The Company has adopted a 52–53-week period ending on the last Saturday of the calendar year. Due to the fact that there are not exactly 52 weeks in a calendar year and there is slightly more than one additional day per year (not including the effects of leap year) in each calendar year as compared to a 52-week fiscal year, the Company will have a fiscal year comprising 53 weeks in certain fiscal years, as determined by when the last Saturday of the calendar year occurs.
In those resulting fiscal years that have 53 weeks, the Company will record an extra week of sales, costs, and related financial activity. Therefore, the financial results of those fiscal years, and the associated 14-week fourth quarter, will not be entirely comparable to the prior and subsequent 52-week fiscal years and the associated quarters having only 13 weeks. Fiscal 2010, 2009, and 2008 included 52 weeks.
Foreign Currency Translation
Many Garmin Ltd. subsidiaries utilize currencies other than the United States Dollar (USD) as their functional currency. As required by the
Foreign Currency Matters
topic of the Financial Accounting Standards Board (FASB) Accounting Standards Codification (ASC), the financial statements of these subsidiaries for all periods presented have been translated into USD, the functional currency of Garmin Ltd., and the reporting currency herein, for purposes of consolidation at rates prevailing during the year for sales, costs, and expenses and at end-of-year rates for all assets and liabilities. The effect of this translation is recorded in a separate
component of stockholders’ equity. Cumulative translation adjustments of $61,740 and $9,231 as of December 25, 2010 and December 26, 2009, respectively, have been included in accumulated other comprehensive gain/(loss) in the accompanying consolidated balance sheets.
67
Transactions in foreign currencies are recorded at the approximate rate of exchange at the transaction date. Assets and liabilities resulting from these transactions are translated at the rate of exchange in effect at the balance sheet date. All differences are recorded in results of operations and amounted to exchange gains/(losses) of ($88,377), ($6,040), and ($35,286) for the years ended December 25, 2010, December 26, 2009, and December 27, 2008, respectively. The loss in fiscal 2010 was primarily the result of the strengthening of the USD against the Euro and the British Pound Sterling and the weakening of the USD against the Taiwan Dollar. The loss in fiscal 2009 was primarily the
result of the weakening of the USD against the Taiwan Dollar offset by the weakening of the USD against the Euro and the British Pound Sterling. The loss in fiscal 2008 was the result of the strengthening of the USD offset by a gain associated with the sale and tender of our Tele Atlas N.V. shares.
Earnings Per Share
Basic earnings per share amounts are computed based on the weighted-average number of common shares outstanding. For purposes of diluted earnings per share, the number of shares that would be issued from the exercise of dilutive stock options has been reduced by the number of shares which could have been purchased from the proceeds of the exercise at the average market price of the Company’s stock during the period the options were outstanding. See Note 10.
Cash and Cash Equivalents
For purposes of reporting cash flows, cash and cash equivalents include cash on hand, operating accounts, money market funds, and securities with maturities of three months or less when purchased. The carrying amount of cash and cash equivalents approximates fair value, given the short maturity of those instruments.
Trade Accounts Receivable
The Company sells its products to retailers, wholesalers, and other customers and extends credit based on its evaluation of the customer’s financial condition. Potential losses on receivables are dependent on each individual customer’s financial condition. The Company carries its trade accounts receivable at net realizable value. Typically, its accounts receivable are collected within 80 days and do not bear interest. The Company monitors its exposure to losses on receivables and maintains allowances for potential losses or adjustments. The Company determines these allowances by (1) evaluating the aging of its receivables and (2) reviewing its high-risk customers. Past due receivable balances
are written off when its internal collection efforts have been unsuccessful in collecting the amount due.
Inventories
Inventories are stated at the lower of cost or market. Cost is determined using the weighted-average method (which approximates the first-in, first-out (FIFO) method) by GC and the FIFO method by GII, GAT and GEL. Inventories consisted of the following:
|
December
25,
2010
|
December
26,
2009
|
|||||||
|
Raw Materials
|
$ | 103,277 | $ | 80,963 | ||||
|
Work-in-process
|
$ | 43,507 | 32,587 | |||||
|
Finished goods
|
$ | 278,513 | 235,286 | |||||
|
Inventory Reserves
|
$ | (37,720 | ) | (38,898 | ) | |||
|
Inventory, net of reserves
|
$ | 387,577 | $ | 309,938 | ||||
Property and Equipment
Property and equipment are recorded at cost and depreciated using the straight-line method over the following estimated useful lives:
68
|
Buildings and improvements
|
39
|
|
Office furniture and equipment
|
3-5
|
|
Manufacturing and engineering equipment
|
5
|
|
Vehicles
|
5
|
Long-Lived Assets
As required by the
Property, Plant and Equipment
topic of the FASB ASC, the Company reviews long-lived assets for impairment whenever events or changes in circumstances indicate the carrying amount of an asset may not be fully recoverable. The carrying amount of a long-lived asset is not recoverable if it exceeds the sum of the undiscounted cash flows expected to result from the use and eventual disposition of the asset. That assessment is based on the carrying amount of the asset at the date it is tested for recoverability. An impairment loss is measured as the amount by which the carrying amount of a long-lived asset exceeds its fair
value.
The
Intangibles – Goodwill and Other
topic of the FASB ASC requires that goodwill and intangible assets with indefinite useful lives should not be amortized but rather be tested for impairment at least annually or sooner whenever events or changes in circumstances indicate that they may be impaired. The Company did not recognize any goodwill or intangible asset impairment charges in 2010, 2009, or 2008. The Company established reporting units based on its current reporting structure. For purposes of testing goodwill for impairment, goodwill has been allocated to these reporting units to the extent it relates to each reporting unit. The
accounting guidance also requires that intangible assets with definite lives be amortized over their estimated useful lives and reviewed for impairment. The Company is currently amortizing its acquired intangible assets with definite lives over periods ranging from 3 to 10 years.
Dividends
On March 16, 2010 the Board of Directors declared a dividend of $1.50 per share to be paid on April 30, 2010 to shareholders of record on April 15, 2010. The Company paid out a dividend in the amount of $298,853. The dividend has been reported as a reduction of retained earnings.
On July 30, 2009 the Board of Directors declared a dividend of $0.75 per share to be paid on December 15, 2009 to shareholders of record on December 1, 2009. The Company paid out a dividend in the amount of $149,846. The dividend has been reported as a reduction of retained earnings.
On June 6, 2008 the Board of Directors declared a dividend of $0.75 per share to be paid on December 15, 2008 to shareholders of record on December 1, 2008. The Company paid out a dividend in the amount of $150,251. The dividend has been reported as a reduction of retained earnings.
Approximately $213,486 and $199,549 of retained earnings are indefinitely restricted from distribution to stockholders pursuant to the laws of Taiwan at December 25, 2010 and December 26, 2009, respectively.
Intangible Assets
At December 25, 2010 and December 26, 2009, the Company had patents, license agreements, customer related intangibles and other identifiable finite-lived intangible assets recorded at a cost of $152,138 and $165,021, respectively. The Company’s excess purchase cost over fair value of net assets acquired (goodwill) was $136,548 at December 25, 2010 and $129,066 at December 26, 2009.
Identifiable, finite-lived intangible assets are amortized over their estimated useful lives on a straight-line basis over three to ten years. Accumulated amortization was $103,534 and $80,428 at December 25, 2010 and December 26, 2009 respectively. Amortization expense was $36,675, $37,444, and $30,874, for the years ended December 25, 2010, December 26, 2009, and December 27, 2008, respectively. In the next five years, the amortization expense is estimated to be $24,889, $10,584, $4,612, $2,482, and $2,317, respectively.
69
Marketable Securities
Management determines the appropriate classification of marketable securities at the time of purchase and reevaluates such designation as of each balance sheet date.
All of the Company’s marketable securities are considered available-for-sale at December 25, 2010. See Note 3. Available-for-sale securities are stated at fair value, with the unrealized gains and losses, net of tax, reported in other comprehensive gain/(loss). At December 25, 2010 and December 26, 2009, cumulative unrealized gains/(losses) of ($5,736) and ($22,613), respectively, were reported in accumulated other comprehensive gain/(loss), net of related taxes.
The amortized cost of debt securities classified as available-for-sale is adjusted for amortization of premiums and accretion of discounts to maturity, or in the case of mortgage-backed securities, over the estimated life of the security. Such amortization is included in interest income from investments. Realized gains and losses, and declines in value judged to be other-than-temporary are included in other income. The cost of securities sold is based on the specific identification method.
Income Taxes
The Company accounts for income taxes using the liability method in accordance with the FASB ASC topic
Income Taxes
. The liability method provides that deferred tax assets and liabilities are recorded based on the difference between the tax bases of assets and liabilities and their carrying amount for financial reporting purposes as measured by the enacted tax rates and laws that will be in effect when the differences are expected to reverse. Income taxes of $233,028 and $171,097 at December 25, 2010 and December 26, 2009, respectively, have not been accrued by the Company for the unremitted earnings of several of its subsidiaries because such earnings are
intended to be reinvested in the subsidiaries indefinitely.
The Company adopted the applicable guidance included in the FASB ASC topic
Income Taxes
related to accounting for uncertainty in income taxes on December 31, 2006, the beginning of fiscal year 2007. The total amount of unrecognized tax benefits as of December 25, 2010 was $153,621 including interest of $9,580. A reconciliation of the beginning and ending amount of unrecognized tax benefits for years ending December 25, 2010 and December 26, 2009 is as follows:
|
December 25,
|
December 26,
|
|||||||
|
2010
|
2009
|
|||||||
|
Balance at beginning of year
|
$ | 255,748 | $ | 214,366 | ||||
|
Additions based on tax positions related to prior years
|
11,443 | 14,241 | ||||||
|
Reductions based on tax positions related to prior years
|
(10,392 | ) | (16,141 | ) | ||||
|
Additions based on tax positions related to current period
|
43,202 | 63,053 | ||||||
|
Reductions based on tax positions related to current period
|
- | - | ||||||
|
Reductions related to settlements with tax authorities
|
(122,314 | ) | - | |||||
|
Expiration of statute of limitations
|
(24,066 | ) | (19,771 | ) | ||||
|
Balance at end of year
|
$ | 153,621 | $ | 255,748 | ||||
The December 25, 2010 balance of $153,621 of unrecognized tax benefits, if recognized, would reduce the effective tax rate. None of the unrecognized tax benefits are due to uncertainty in the timing of deductibility.
Accounting guidance requires unrecognized tax benefits to be classified as non-current liabilities, except for the portion that is expected to be paid within one year of the balance sheet date. The entire $153,621 and $255,748 are required to be classified as non-current at December 25, 2010 and December 26, 2009, respectively.
70
Interest expense and penalties, if any, accrued on the unrecognized tax benefits are reflected in income tax expense. At December 25, 2010 and December 26, 2009, the Company had accrued approximately $9,580 and $20,160 respectively for interest. Interest expense included in income tax expense for the years ending December 25, 2010 and December 26, 2009 are ($10,580) and $9,000, respectively. The Company had no amounts accrued for penalties as the nature of the unrecognized tax benefits, if recognized, would not warrant the imposition of penalties.
The Company files income tax returns in the U.S. federal jurisdiction, and various state, local and foreign jurisdictions. The Company is no longer subject to U.S. federal, state, or local tax examinations by tax authorities for years prior to 2007. The Company is no longer subject to Taiwan income tax examinations by tax authorities for years prior to 2005. The Company is no longer subject to United Kingdom tax examinations by tax authorities for years prior to 2008.
The Company also considers 2007 and 2008 US federal returns to have been effectively settled due to completion of an audit examination by the Internal Revenue Service. A reduction of income tax expense of ($122,314) was recognized to reflect this settlement. In addition, the Company recognized a reduction of income tax expense of $24,066 and $19,771 in fiscal years ended December 25, 2010 and December 26, 2009, respectively, to reflect the expiration of statute of limitations in various jurisdictions.
The Company believes that it is reasonably possible that approximately $14,069 million of its reserves for certain unrecognized tax benefits will decrease within the next 12 months as the result of the expiration of statute of limitations. This potential decrease in unrecognized tax benefits would impact the Company’s effective tax rate within the next 12 months.
Use of Estimates
The preparation of consolidated financial statements in conformity with accounting principles generally accepted in the United States requires management to make estimates and assumptions that affect the amounts reported in the consolidated financial statements and accompanying notes. Actual results could differ from those estimates.
Concentration of Credit Risk
The Company grants credit to certain customers who meet the Company’s pre-established credit requirements. Generally, the Company does not require security when trade credit is granted to customers. Credit losses are provided for in the Company’s consolidated financial statements and typically have been within management’s expectations. Certain customers are allowed extended terms consistent with normal industry practice. Most of these extended terms can be classified as either relating to seasonal sales variations or to the timing of new product releases by the Company.
Revenue Recognition
Garmin recognizes revenue when persuasive evidence of an arrangement exists, delivery has occurred, the sales price is fixed or determinable, and collection is probable. For the large majority of Garmin’s sales, these criteria are met once product has shipped and title and risk of loss have transferred to the customer. The Company recognizes revenue from the sale of hardware products and software bundled with hardware that is essential to the functionality of the hardware in accordance with general revenue recognition accounting guidance. The Company recognizes revenue in accordance with industry specific software accounting guidance for standalone sales of software products and sales of
software bundled with hardware not essential to the functionality of the hardware. The Company generally does not offer specified or unspecified upgrade rights to its customers in connection with software sales.
Garmin introduced nüMaps Lifetime™ in January 2009, which is a single fee program that, subject to the program’s terms and conditions, enables customers to download the latest map and point of interest information every quarter for the useful life of their PND. The revenue and associated cost of royalties for sales of nüMaps Lifetime™ products are deferred at the time of sale and recognized ratably on a straight-line basis over the currently estimated 36-month life of the products.
71
For multiple element arrangements that include tangible products that contain software that is essential to the tangible product’s functionality and undelivered software elements that relate to the tangible product’s essential software, the Company allocates revenue to all deliverables based on their relative selling prices. In such circumstances, the new accounting principles establish a hierarchy to determine the selling price to be used for allocating revenue to deliverables as follows: (i) vendor-specific objective evidence of fair value (“VSOE”), (ii) third-party evidence of selling price (“TPE”), and
(iii) best estimate of the selling price (“ESP”). VSOE generally exists only when the Company sells the deliverable separately and is the price actually charged by the Company for that deliverable. In addition to the products listed below, the Company has offered certain other products that involve multiple-element arrangements that are immaterial.
In 2010, Garmin began offering PNDs with lifetime map updates (LMU) bundled in the original purchase price. Similar to nüMaps Lifetime™ which was introduced in January 2009, this enables customers to download the latest map and point of interest information every quarter for the useful life of their PND. The Company has identified two deliverables contained in arrangements involving the sale of PNDs including LMU. The first deliverable is the hardware and software essential to the functionality of the hardware device delivered at the time of sale, and the second deliverable is the LMU. The Company has allocated revenue between these two deliverables using the relative selling
price method determined primarily using VSOE. Amounts allocated to the delivered hardware and the related essential software are recognized at the time of sale provided the other conditions for revenue recognition have been met. The revenue and associated cost of royalties allocated to the LMU are deferred and recognized on a straight-line basis over the estimated 36-month life of the products.
In addition, Garmin offers PNDs with premium traffic bundled in the original purchase price in the European market. The Company has identified two deliverables contained in arrangements involving the sale of PNDs including premium traffic. The first deliverable is the hardware and software essential to the functionality of the hardware device delivered at the time of sale, and the second deliverable is the premium traffic service. The Company has allocated revenue between these two deliverables using the relative selling price method determined using VSOE. Amounts allocated to the delivered hardware and the related essential software are recognized at the time of sale provided the other
conditions for revenue recognition have been met. The revenue and associated cost allocated to the premium traffic service are deferred and recognized on a straight-line basis over the estimated 36-month life of the products.
In 2009 and 2010 respectively, Garmin introduced the nüvi 1690 and 1695, premium PNDs with a built-in wireless module that lets customers access Garmin’s nüLink!™ service, which provides direct links to certain online information. The Company has identified two deliverables contained in arrangements involving the sale of the nüvi 1690 and 1695. The first deliverable is the hardware and software essential to the functionality of the hardware device delivered at the time of sale, and the second deliverable is the nüLink service. The Company has allocated revenue between these two deliverables using the relative selling price method determined using VSOE. Amounts
allocated to the delivered hardware and the related essential software are recognized at the time of sale provided the other conditions for revenue recognition have been met. The revenue and associated cost allocated to the nüLink services are deferred and recognized on a straight-line basis over the 24-month life of the service.
Garmin records estimated reductions to revenue for customer sales programs returns and incentive offerings including rebates, price protection (product discounts offered to retailers to assist in clearing older products from their inventories in advance of new product releases), promotions and other volume-based incentives. The reductions to revenue are based on estimates and judgments using historical experience and expectation of future conditions. Changes in these estimates could negatively affect Garmin’s operating results. These incentives are reviewed periodically and, with the exceptions of price protection and certain other promotions, are accrued
for on a percentage of sales basis. If market conditions were to decline, Garmin may take actions to increase customer incentive offerings possibly resulting in an incremental reduction of revenue at the time the incentive is offered.
72
The Company records reductions to revenue for expected future product returns based on the Company’s historical experience.
Deferred Revenues and Costs
At December 25, 2010 and December 26, 2009, the Company had deferred revenues totaling $197,787 and $66,484, respectively, and related deferred costs totaling $44,738 and $13,310, respectively.
The deferred revenues and costs are recognized over their estimated economic lives of two to three years on a straight-line basis. In the next three years, the gross margin recognition of deferred revenue and cost for the currently deferred amounts is estimated to be $69,623, $56,617, and $26,809, respectively.
Shipping and Handling Costs
Shipping and handling costs are included in cost of goods sold in the accompanying consolidated financial statements.
Product Warranty
The Company provides for estimated warranty costs at the time of sale. The warranty period is generally for one year from date of shipment with the exception of certain aviation products for which the warranty period is two years from the date of installation and certain marine products for which the warranty period is three years from the date of shipment
.
Sales Programs
The Company provides certain monthly and quarterly incentives for its dealers and distributors based on various factors including dealer purchasing volume and growth. Additionally, from time to time, the Company provides rebates to end users on certain products. Estimated rebates and incentives payable to dealers and distributors are regularly reviewed and recorded as accrued expenses on a monthly basis. In addition, the Company provides dealers and distributors with product discounts to assist these customers in clearing older products from their inventories in advance of new product releases. Each discount is tied to a specific product and can be applied to all customers who have purchased the
product or a special discount may be agreed to on an individual customer basis. These rebates, incentives, and discounts are recorded as reductions to net sales in the accompanying consolidated statements of income in the period the Company has sold the product.
Advertising Costs
The Company expenses advertising costs as incurred. Advertising expense amounted to approximately $144,613, $155,521, and $208,177 for the years ended December 25, 2010, December 26, 2009, and December 27, 2008, respectively.
Research and Development
A majority of the Company’s research and development is performed in the United States. Research and development costs, which are expensed as incurred, amounted to approximately $277,261, $238,378, and $206,109 for the years ended December 25, 2010, December 26, 2009, and December 27, 2008, respectively.
73
Customer Service and Technical Support
Customer service and technical support costs are included as selling, general and administrative expenses in the accompanying consolidated statements of operations. Customer service and technical support costs include costs associated with performing order processing, answering customer inquiries by telephone and through Web sites, e-mail and other electronic means, and providing free technical support assistance to customers. The technical support is provided within one year after the associated revenue is recognized. The related cost of providing this free support is not material.
Software Development Costs
The FASB ASC topic entitled
Software
requires companies to expense software development costs as they incur them until technological feasibility has been established, at which time those costs are capitalized until the product is available for general release to customers. Our capitalized software development costs are not significant as the time elapsed from working model to release is typically short. As required by the
Research and Development
topic of the FASB ASC, costs we incur to enhance our existing products or after the general release of the service using the product are expensed in the
period they are incurred and included in research and development costs in the accompanying consolidated statements of operations.
Accounting for Stock-Based Compensation
The Company currently sponsors three stock based employee compensation plans. The FASB ASC topic entitled
Compensation – Stock Compensation
requires the measurement and recognition of compensation expenses for all share-based payment awards made to employees and directors including employee stock options and restricted stock based on estimated fair values. See Note 9.
Accounting guidance requires companies to estimate the fair value of share-based payment awards on the date of grant using an option-pricing model. The value of the portion of the award that is ultimately expected to vest is recognized as stock-based compensation expenses over the requisite service period in the Company’s consolidated financial statements.
As stock-based compensation expenses recognized in the accompanying consolidated statement of income are based on awards ultimately expected to vest, they have been reduced for estimated forfeitures. Accounting guidance requires forfeitures to be estimated at the time of grant and revised, if necessary, in subsequent periods if actual forfeitures differ from those estimates. Forfeitures were estimated based on historical experience and management’s estimates.
Recently Issued Accounting Pronouncements
In January 2010, the FASB issued Accounting Standards Update (ASU) No. 2010-06, "Improving Disclosures about Fair Value Measurements" ("ASU 2010-06"), which is included in the ASC Topic 820 (Fair Value Measurements and Disclosures). ASU 2010-06 requires new disclosures on the amount and reason for transfers in and out of Level 1 and 2 fair value measurements. ASU 2010-06 also requires disclosure of activities, including purchases, sales, issuances, and settlements within the Level 3 fair value measurements and clarifies existing disclosure requirements on levels of disaggregation and disclosures about inputs and valuation techniques. Except as otherwise provided, ASU 2010-06 is effective for
interim and annual reporting periods beginning after December 15, 2009. The adoption of this standard did not have a material effect on the Company’s financial statements.
In February 2010, the FASB issued ASU No. 2010-09, "Amendments to Certain Recognition and Disclosure Requirements" ("ASU 2010-09"), which is included in ASC Topic 855 (Subsequent Events). ASU 2010-09 clarifies that an SEC filer is required to evaluate subsequent events through the date that the financial statements are issued. ASU 2010-09 was effective upon the issuance of the final update and did not have a significant impact on the Company's financial statements.
74
3. Marketable Securities
The FASB ASC topic entitled
Fair Value Measurements and Disclosures
defines fair value as the price that would be received to sell an asset or paid to transfer a liability in an orderly transaction between market participants at the measurement date (exit price). The accounting guidance classifies the inputs used to measure fair value into the following hierarchy:
|
Level 1
|
Unadjusted quoted prices in active markets for identical assets or liability
|
|
Level 2
|
Unadjusted quoted prices in active markets for similar assets or liabilities, or
unadjusted quoted prices for identical or similar assets
|
|
Level 3
|
Unobservable inputs for the asset or liability
|
The Company endeavors to utilize the best available information in measuring fair value. Financial assets and liabilities are classified in their entirety based on the lowest level of input that is significant to the fair value measurement.
For fair value measurements using significant unobservable inputs, an independent third party provided the valuation. The inputs used in the valuations used the following methodology. The collateral composition was used to estimate Weighted Average Life based on historical and projected payment information. Cash flows were projected for the issuing trusts, taking into account underlying loan principal, bonds outstanding, and payout formulas. Taking this information into account, assumptions were made as to the yields likely to be required, based upon then current market conditions for comparable or similar term Asset Based
Securities as well as other fixed income securities.
Assets and liabilities measured at estimated fair value on a recurring basis are summarized below:
|
Fair Value Measurements as
|
||||||||||||||||
|
of December 25, 2010
|
||||||||||||||||
|
Description
|
Total
|
Level 1
|
Level 2
|
Level 3
|
||||||||||||
|
Available for-sale securities
|
$ | 781,257 | $ | 781,257 | $ | - | $ | - | ||||||||
|
Failed Auction rate securities
|
20,562 | - | - | 20,562 | ||||||||||||
|
Total
|
$ | 801,819 | $ | 781,257 | $ | - | $ | 20,562 | ||||||||
|
Fair Value Measurements as
|
||||||||||||||||
|
of December 26, 2009
|
||||||||||||||||
|
Description
|
Total
|
Level 1
|
Level 2
|
Level 3
|
||||||||||||
|
Available for-sale securities
|
$ | 695,795 | $ | 695,795 | $ | - | $ | - | ||||||||
|
Failed Auction rate securities
|
70,252 | - | - | 70,252 | ||||||||||||
|
Total
|
$ | 766,047 | $ | 695,795 | $ | - | $ | 70,252 | ||||||||
75
All Level 3 investments have been in a continuous unrealized loss position for 12 months or longer. However, it is the Company’s intent to hold these securities until they recover their value. For assets and liabilities measured at fair value on a recurring basis using significant unobservable inputs (Level 3) during the period, the accounting guidance requires a reconciliation of the beginning and ending balances, separately for each major category of assets. The reconciliation is as follows:
|
Fair Value Measurements Using
|
||||||||
|
Significant
Unobservable
Inputs
(Level
3)
|
||||||||
|
Year Ended
|
Year Ended
|
|||||||
|
December
25,
2010
|
December
26,
2009
|
|||||||
|
Beginning balance of auction rate securities
|
$ | 70,252 | $ | 71,303 | ||||
|
Total unrealized gains included in other
|
||||||||
|
comprehensive income
|
16,410 | 99 | ||||||
|
Purchases in and/or sales out of Level 3
|
(66,100 | ) | (1,150 | ) | ||||
|
Transfers in and/or out of Level 3
|
- | - | ||||||
|
Ending balance of auction rate securities
|
$ | 20,562 | $ | 70,252 | ||||
The following is a summary of the company’s marketable securities classified as available-for-sale securities at December 25, 2010:
|
Gross
|
Other Than
|
Estimated Fair
|
||||||||||||||||||
|
Gross
|
Unrealized
|
Temporary
|
Value (Net Carrying
|
|||||||||||||||||
|
Amortized Cost
|
Unrealized Gains
|
Losses
|
Impairment
|
Amount)
|
||||||||||||||||
|
Mortgage-backed securities
|
$ | 527,249 | $ | 1,913 | $ | (1,519 | ) | $ | - | $ | 527,643 | |||||||||
|
Auction Rate Securities
|
25,599 | - | (5,038 | ) | - | 20,561 | ||||||||||||||
|
Obligations of states and political subdivisions
|
160,618 | 347 | (3,340 | ) | - | 157,625 | ||||||||||||||
|
U.S. corporate bonds
|
54,348 | 637 | (185 | ) | (1,274 | ) | 53,526 | |||||||||||||
|
Other
|
39,838 | 2,626 | - | - | 42,464 | |||||||||||||||
|
Total
|
$ | 807,652 | $ | 5,523 | $ | (10,082 | ) | $ | (1,274 | ) | $ | 801,819 | ||||||||
The following is a summary of the company’s marketable securities classified as available-for-sale securities at December 26, 2009:
|
Gross
|
Other Than
|
Estimated Fair
|
||||||||||||||||||
|
Gross
|
Unrealized
|
Temporary
|
Value (Net Carrying
|
|||||||||||||||||
|
Amortized Cost
|
Unrealized Gains
|
Losses
|
Impairment
|
Amount)
|
||||||||||||||||
|
Mortgage-backed securities
|
$ | 515,200 | $ | 2,682 | $ | (4,674 | ) | $ | - | $ | 513,208 | |||||||||
|
Auction Rate Securities
|
91,700 | - | (21,448 | ) | - | 70,252 | ||||||||||||||
|
Obligations of states and political subdivisions
|
112,419 | 908 | (181 | ) | - | 113,146 | ||||||||||||||
|
U.S. corporate bonds
|
35,883 | 768 | (701 | ) | (1,274 | ) | 34,676 | |||||||||||||
|
Other
|
33,903 | 1,070 | (208 | ) | - | 34,765 | ||||||||||||||
|
Total
|
$ | 789,105 | $ | 5,428 | $ | (27,212 | ) | $ | (1,274 | ) | $ | 766,047 | ||||||||
The cost of securities sold is based on the specific identification method.
The unrealized losses on the Company’s investments in 2009 and 2010 were caused primarily by changes in interest rates, specifically, widening credit spreads. The Company’s investment policy requires investments to be rated A or better with the objective of minimizing the potential risk of principal loss. The Company does not intend to sell the securities that have an unrealized loss shown in the table above and it is not more likely than not that the Company will be required to sell the investment before recovery of their amortized costs bases, which may be maturity. Therefore, the Company considers the declines to be temporary in nature. Fair values were
determined for each individual security in the investment portfolio. When evaluating the investments for other-than-temporary impairment, the Company reviews factors such as the length of time and extent to which fair value has been below cost basis, the financial condition of the issuer, and the Company’s ability and intent to hold the investment for a period of time, which may be sufficient for anticipated recovery in market value. During 2009 and 2010, the Company did not record any material impairment charges on its outstanding securities.
76
The amortized cost and estimated fair value of marketable securities at December 25, 2010, by contractual maturity, are shown below. Expected maturities will differ from contractual maturities because the issuers of the securities may have the right to prepay obligations without prepayment penalties.
|
Estimated
|
||||||||
|
Cost
|
Fair
Value
|
|||||||
|
Due in one year or less (2011)
|
$ | 24,314 | $ | 24,418 | ||||
|
Due after one year through five years (2012-2016)
|
196,567 | 195,604 | ||||||
|
Due after five years through ten years (2017-2021)
|
229,761 | 224,395 | ||||||
|
Due after ten years (2022 and thereafter)
|
322,681 | 320,779 | ||||||
|
Other (No contractual maturity dates)
|
34,329 | 36,623 | ||||||
| $ | 807,652 | $ | 801,819 | |||||
For certain of the Company’s financial instruments, including accounts receivable, accounts payable and other accrued liabilities, the carrying amounts approximate fair value due to their short maturities.
4. Commitments and Contingencies
Rental expense related to office, equipment, warehouse space and real estate amounted to $11,768, $10,293, and $8,419 for the years ended December 25, 2010, December 26, 2009, and December 27, 2008, respectively.
Future minimum lease payments are as follows:
|
Year
|
Amount
|
|||
|
2011
|
$ | 10,397 | ||
|
2012
|
9,430 | |||
|
2013
|
8,307 | |||
|
2014
|
7,172 | |||
|
2015
|
5,033 | |||
|
Thereafter
|
4,581 | |||
|
Total
|
$ | 44,920 | ||
Certain cash balances of GEL are held as collateral by a bank securing payment of the United Kingdom value-added tax requirements. The total amount of restricted cash balances were $1,277 and $2,047 at December 25, 2010 and December 26, 2009, respectively.
In the normal course of business, the Company and its subsidiaries are parties to various legal claims, actions, and complaints, including matters involving patent infringement and other intellectual property claims and various other risks. It is not possible to predict with certainty whether or not the Company and its subsidiaries will ultimately be successful in any of these legal matters, or if not, what the impact might be. However, the Company’s management does not expect that the results in any of these legal proceedings will have a material adverse effect on the Company’s results of operations, financial position or cash flows.
77
5. Employee Benefit Plans
GII sponsors a defined contribution employee retirement plan under which its employees may contribute up to 50% of their annual compensation subject to Internal Revenue Code maximum limitations and to which GII contributes a specified percentage of each participant’s annual compensation up to certain limits as defined in the Plan. Additionally, GEL has a defined contribution plan under which its employees may contribute up to 7.5% of their annual compensation. Both GII and GEL contribute an amount determined annually at the discretion of the Board of Directors. During the years ended December 25, 2010, December 26, 2009, and December 27, 2008, expense related to these plans of $17,952, $16,399,
and $14,927 was charged to operations.
Certain of the Company’s foreign subsidiaries participate in local defined benefit pension plans. Contributions are calculated by formulas that consider final pensionable salaries. Neither obligations nor contributions for the years ended December 25, 2010, December 26, 2009, and December 27, 2008, were significant.
6. Income Taxes
The Company’s income tax provision (benefit) consists of the following:
|
Fiscal
Year
Ended
|
||||||||||||
|
December 25,
|
December 26,
|
December 27,
|
||||||||||
|
2010
|
2009
|
2008
|
||||||||||
|
Federal:
|
||||||||||||
|
Current
|
$ | (46,674 | ) | $ | 104,186 | $ | 90,655 | |||||
|
Deferred
|
284 | (12,021 | ) | 23,639 | ||||||||
| (46,390 | ) | 92,165 | 114,294 | |||||||||
|
State:
|
||||||||||||
|
Current
|
3,929 | 5,381 | 1,318 | |||||||||
|
Deferred
|
(257 | ) | (947 | ) | 1,090 | |||||||
| 3,672 | 4,434 | 2,408 | ||||||||||
|
Foreign:
|
||||||||||||
|
Current
|
31,109 | 18,469 | 44,279 | |||||||||
|
Deferred
|
4,278 | (10,367 | ) | 20,537 | ||||||||
| 35,387 | 8,102 | 64,816 | ||||||||||
|
Total
|
$ | (7,331 | ) | $ | 104,701 | $ | 181,518 | |||||
The income tax provision differs from the amount computed by applying the statutory federal income tax rate to income before taxes. The sources and tax effects of the differences, including the impact of establishing tax contingency accruals, are as follows:
|
December 25,
|
December 26,
|
December 27,
|
||||||||||
|
2010
|
2009
|
2008
|
||||||||||
|
Federal income tax expense at
|
||||||||||||
|
U.S. statutory rate
|
$ | 202,045 | $ | 287,228 | $ | 332,278 | ||||||
|
State income tax expense, net of
|
||||||||||||
|
federal tax effect
|
2,482 | 2,604 | 2,030 | |||||||||
|
Foreign tax rate differential
|
(115,633 | ) | (219,482 | ) | (233,928 | ) | ||||||
|
Taiwan tax holiday benefit
|
(13,536 | ) | (18,556 | ) | (24,904 | ) | ||||||
|
Net change in uncertain tax postions
|
(102,100 | ) | 41,400 | 87,800 | ||||||||
|
Other foreign taxes less
|
||||||||||||
|
incentives and credits
|
26,707 | 10,379 | 20,428 | |||||||||
|
Other, net
|
(7,296 | ) | 1,128 | (2,186 | ) | |||||||
|
Income tax expense
|
$ | (7,331 | ) | $ | 104,701 | $ | 181,518 | |||||
78
The Company’s income before income taxes attributable to non-U.S. operations was $413,550, $678,868, and $823,364, for the years ended December 25, 2010, December 26, 2009, and December 27, 2008, respectively. The Taiwan tax holiday benefits included in the table above reflect $0.07, $0.09, and $0.12 per weighted-average common share outstanding for the years ended December 25, 2010, December 26, 2009, and December 27, 2008, respectively. The Company currently expects to benefit from these Taiwan tax holidays through 2015, at which time these tax benefits might expire.
Deferred income taxes reflect the net tax effects of temporary differences between the carrying amounts of assets and liabilities for financial reporting purposes and the amounts used for income tax purposes. Significant components of the Company’s deferred tax assets and liabilities are as follows:
|
December 25,
|
December 26,
|
|||||||
|
2010
|
2009
|
|||||||
|
Deferred tax assets:
|
||||||||
|
Product warranty accruals
|
$ | 1,646 | $ | 1,642 | ||||
|
Allowance for doubtful accounts
|
11,572 | 15,346 | ||||||
|
Inventory reserves
|
5,749 | 10,145 | ||||||
|
Sales program allowances
|
9,080 | 12,902 | ||||||
|
Reserve for sales returns
|
2,715 | - | ||||||
|
Other accruals
|
5,684 | 5,293 | ||||||
|
Unrealized intercompany profit in inventory
|
2,792 | 12,967 | ||||||
|
Unrealized foreign currency loss
|
266 | 248 | ||||||
|
Stock option compensation
|
40,785 | 31,034 | ||||||
|
Tax credit carryforwards, net
|
48,784 | 36,834 | ||||||
|
Amortization
|
28,431 | - | ||||||
|
Deferred revenue
|
10,671 | 121 | ||||||
|
Net operating losses of subsidiaries
|
11,583 | 3,480 | ||||||
|
Other
|
3,750 | 3,211 | ||||||
|
Valuation allowance related to loss carryforward and tax credits
|
(51,352 | ) | (35,617 | ) | ||||
| 132,156 | 97,606 | |||||||
|
Deferred tax liabilities:
|
||||||||
|
Depreciation
|
16,030 | 13,839 | ||||||
|
Prepaid expenses
|
4,145 | 2,014 | ||||||
|
Book basis in excess of tax basis for acquired entities
|
6,604 | 11,201 | ||||||
|
Unrealized investment gain
|
5,951 | 833 | ||||||
|
Marketable securities
|
3,038 | - | ||||||
|
Other
|
933 | 202 | ||||||
| 36,701 | 28,089 | |||||||
|
Net deferred tax assets
|
$ | 95,455 | $ | 69,517 | ||||
The Company recognized a $29,615 deferred tax asset during 2010 for the future tax benefit of the fair market value step-up in basis of intangible assets related to the redomestication to Switzerland and local statutory tax reporting requirements. The deferred tax asset was recognized as an increase to Additional Paid-In Capital in 2010.
At December 25, 2010, the Company had $48,784 million of tax credit carryover which includes $46,234 of Taiwan surtax credit with no expiration. There is a full valuation allowance for the Taiwan surtax credits. Additionally, the Company had $479 in Taiwan investment credit which will expire in 2012. The valuation allowance increased by $15,735 during 2010 including $12,109 related to Taiwan surtax credits.
7. Fair Value of Financial Instruments
As required by the
Financial Instruments
topic of the FASB ASC, the following summarizes required information about the fair value of certain financial instruments for which it is currently practicable to estimate such value. None of the financial instruments are held or issued for trading purposes. The carrying amounts and fair values of the Company’s financial instruments are as follows:
79
|
December
25,
2010
|
December
26,
2009
|
|||||||||||||||
|
Carrying
|
Fair
|
Carrying
|
Fair
|
|||||||||||||
|
Amount
|
Value
|
Amount
|
Value
|
|||||||||||||
|
Cash and cash equivalents
|
$ | 1,260,936 | $ | 1,260,936 | $ | 1,091,581 | $ | 1,091,581 | ||||||||
|
Restricted cash
|
1,277 | 1,277 | 2,047 | 2,047 | ||||||||||||
|
Marketable securities
|
801,819 | 801,819 | 766,047 | 766,047 | ||||||||||||
For certain of the Company’s financial instruments, including accounts receivable, accounts payable and other accrued liabilities, the carrying amounts approximate fair value due to their short maturities.
8. Segment Information
The Company operates within its targeted markets through four reportable segments, those being related to products sold into the marine, automotive/mobile, outdoor/fitness, and aviation markets. For external reporting purposes, we aggregate operating segments which have similar economic characteristics, products, production processes, types or classes of customers and distribution methods into reportable segments. All of the Company’s reportable segments offer products through the Company’s network of independent dealers and distributors as well as through OEM’s. However, the nature of products and types of customers for the
four reportable segments vary significantly. The Company’s marine, automotive/mobile, and outdoor/fitness segments include portable global positioning system (GPS) receivers and accessories sold primarily to retail outlets. These products are produced primarily by the Company’s subsidiary in Taiwan. The Company’s aviation products are portable and panel mount avionics for Visual Flight Rules and Instrument Flight Rules navigation and are sold primarily to aviation dealers and certain aircraft manufacturers.
The Company’s Chief Executive Officer has been identified as the Chief Operating Decision Maker (CODM). The CODM evaluates performance and allocates resources based on income before income taxes of each segment.
Income before income taxes represents net sales less operating expenses including certain allocated general and administrative costs, interest income and expense, foreign currency adjustments, and other non-operating corporate expenses. The accounting policies of the reportable segments are the same as those described in the summary of significant accounting policies. There are no inter-segment sales or transfers.
The identifiable assets associated with each reportable segment reviewed by the CODM include accounts receivable and inventories. The Company does not report property and equipment, intangible assets, depreciation and amortization, or capital expenditures by segment to the CODM.
Revenues, interest income and interest expense, income before income taxes, and identifiable assets for each of the Company’s reportable segments are presented below:
80
|
Fiscal Year Ended December 25, 2010
|
||||||||||||||||||||
|
Outdoor/
|
Auto/
|
|||||||||||||||||||
|
Aviation
|
Fitness
|
Marine
|
Mobile
|
Total
|
||||||||||||||||
|
Net sales to external customers
|
$ | 262,520 | $ | 559,592 | $ | 198,860 | $ | 1,668,939 | $ | 2,689,911 | ||||||||||
|
Allocated interest income
|
1,251 | 3,879 | 1,624 | 18,225 | 24,979 | |||||||||||||||
|
Allocated interest expense
|
(122 | ) | (259 | ) | (92 | ) | (773 | ) | (1,246 | ) | ||||||||||
|
Income before income taxes
|
71,482 | 237,472 | 62,431 | 205,887 | 577,272 | |||||||||||||||
|
Assets:
|
||||||||||||||||||||
|
Accounts receivable
|
72,927 | 155,453 | 55,243 | 463,626 | 747,249 | |||||||||||||||
|
Inventories
|
37,825 | 80,629 | 28,653 | 240,470 | 387,577 | |||||||||||||||
|
Fiscal Year Ended December 26, 2009
|
||||||||||||||||||||
|
Outdoor/
|
Auto/
|
|||||||||||||||||||
|
Aviation
|
Fitness
|
Marine
|
Mobile
|
Total
|
||||||||||||||||
|
Net sales to external customers
|
$ | 245,745 | $ | 468,924 | $ | 177,644 | $ | 2,054,127 | $ | 2,946,440 | ||||||||||
|
Allocated interest income
|
737 | 1,836 | 1,469 | 19,477 | 23,519 | |||||||||||||||
|
Allocated interest expense
|
0 | 0 | 0 | 0 | 0 | |||||||||||||||
|
Income before income taxes
|
56,595 | 206,042 | 57,430 | 488,584 | 808,651 | |||||||||||||||
|
Assets:
|
||||||||||||||||||||
|
Accounts receivable
|
72,904 | 139,114 | 52,701 | 609,391 | 874,110 | |||||||||||||||
|
Inventories
|
25,850 | 49,326 | 18,687 | 216,075 | 309,938 | |||||||||||||||
|
Fiscal Year Ended December 27, 2008
|
||||||||||||||||||||
|
Outdoor/
|
Auto/
|
|||||||||||||||||||
|
Aviation
|
Fitness
|
Marine
|
Mobile
|
Total
|
||||||||||||||||
|
Net sales to external customers
|
$ | 323,406 | $ | 427,783 | $ | 204,477 | $ | 2,538,411 | $ | 3,494,077 | ||||||||||
|
Allocated interest income
|
957 | 5,006 | 1,867 | 27,705 | 35,535 | |||||||||||||||
|
Allocated interest expense
|
(109 | ) | (23 | ) | (104 | ) | (371 | ) | (607 | ) | ||||||||||
|
Income before income taxes
|
118,737 | 165,986 | 63,904 | 565,739 | 914,366 | |||||||||||||||
|
Assets:
|
||||||||||||||||||||
|
Accounts receivable
|
68,615 | 90,761 | 43,383 | 538,562 | 741,321 | |||||||||||||||
|
Inventories
|
39,366 | 52,071 | 24,890 | 308,985 | 425,312 | |||||||||||||||
81
Net sales, long-lived assets (property and equipment), and net assets by geographic area are as follows as of and for the years ended December 25, 2010, December 26, 2009, and December 27, 2008:
|
North
|
||||||||||||||||
|
America
|
Asia
|
Europe
|
Total
|
|||||||||||||
|
December 25, 2010
|
||||||||||||||||
|
Net sales to external customers
|
$ | 1,646,590 | $ | 220,478 | $ | 822,843 | $ | 2,689,911 | ||||||||
|
Long lived assets
|
231,569 | 146,859 | 49,377 | 427,805 | ||||||||||||
|
Net assets (1)
|
1,149,826 | 1,719,769 | 179,967 | 3,049,562 | ||||||||||||
|
December 26, 2009
|
||||||||||||||||
|
Net sales to external customers
|
$ | 1,972,451 | $ | 149,920 | $ | 824,069 | $ | 2,946,440 | ||||||||
|
Long lived assets
|
233,573 | 153,878 | 53,887 | 441,338 | ||||||||||||
|
Net assets (1)
|
1,177,849 | 1,467,903 | 190,695 | 2,836,447 | ||||||||||||
|
December 27, 2008
|
||||||||||||||||
|
Net sales to external customers
|
$ | 2,333,585 | $ | 144,740 | $ | 1,015,752 | $ | 3,494,077 | ||||||||
|
Long lived assets
|
221,158 | 168,528 | 55,566 | 445,252 | ||||||||||||
|
Net assets (1)
|
687,638 | 1,371,240 | 166,976 | 2,225,854 | ||||||||||||
|
(1) Majority of assets held in the United States and Taiwan.
|
||||||||||||||||
Best Buy, a customer in the outdoor/fitness, marine, and auto/mobile segments, accounted for less than 10%, 13.4% and 12.0% of the Company’s consolidated net sales in the years ended December 25, 2010, December 26, 2009 and December 27, 2008, respectively.
9. Stock Compensation Plans
Accounting for Stock-Based Compensation
The various Company stock compensation plans are summarized below. For all Stock Compensation Plans, the company’s policy is to issue Treasury Shares or purchase shares on the open market for option/SAR exercises, RSU releases and ESPP purchases.
2005 Equity Incentive Plan
In June 2005, the shareholders adopted an equity incentive plan (the “2005 Plan”) providing for grants of incentive and nonqualified stock options, stock appreciation rights (“SARs”), restricted stock units (“RSUs”) and/or performance shares to employees of the Company and its subsidiaries, pursuant to which up to 10,000,000 common shares were available for issuance. The stock options and stock appreciation rights vest evenly over a period of five years or as otherwise determined by the Board of Directors or the Compensation Committee and generally expire ten years from the date of grant, if not exercised. During 2010, 2009, and 2008, the Company granted 0, 0,
and 1,454,050 stock appreciation rights, respectively. During 2010, 2009, and 2008, 494,995, 470,950, and 1,043,800 restricted stock units were granted under the 2005 Plan. In 2010, 2009, and 2008, 20,000, 30,000, and 0 performance shares were also granted under the 2005 Plan.
82
2000 Equity Incentive Plan
In October 2000, the shareholders adopted an equity incentive plan (the “2000 Plan”) providing for grants of incentive and nonqualified stock options, stock appreciation rights (“SARs”), restricted stock units (“RSUs”) and/or performance shares to employees of the Company and its subsidiaries, pursuant to which up to 7,000,000 common shares were available for issuance. The stock options and stock appreciation rights vest evenly over a period of five years or as otherwise determined by the Board of Directors or the Compensation Committee and generally expire ten years from the date of grant, if not exercised. The Company did not grant any stock awards from the
2000 Plan in 2010, 2009 or 2008.
2000 Non-employee Directors’ Option Plan
Also in October 2000, the stockholders adopted a stock option plan for non-employee directors (the Directors Plan) providing for grants of options for up to 100,000 common shares. The term of each award is ten years. All awards vest evenly over a three-year period. During 2010, 2009, and 2008, options to purchase 23,924, 34,648, and 15,696 shares, respectively, were granted under this plan. In 2009, the stockholders approved an additional 150,000 shares to the plan, making the total shares authorized under the plan 250,000.
Stock-Based Compensation Activity
A summary of the Company’s stock-based compensation activity and related information under the 2005 Equity Incentive Plan, the 2000 Equity Incentive Plan and the 2000 Non-employee Directors’ Option Plan for the years ended December 25, 2010, December 26, 2009, and December 27, 2008 is provided below:
|
Stock Options and SARs
|
||||||||
|
Weighted-Average
|
||||||||
|
Exercise
Price
|
Number
of
Shares
|
|||||||
|
(In Thousands)
|
||||||||
|
Outstanding at December 29, 2007 (3,111 Exercisable at $23.21)
|
$ | 46.82 | 9,531 | |||||
|
Granted
|
$ | 51.00 | 1,470 | |||||
|
Exercised
|
$ | 22.35 | (226 | ) | ||||
|
Forfeited
|
$ | 53.89 | (249 | ) | ||||
|
Outstanding at December 27, 2008 (4,656 Exercisable at $33.27)
|
$ | 47.76 | 10,526 | |||||
|
Granted
|
$ | 23.09 | 35 | |||||
|
Exercised
|
$ | 18.08 | (278 | ) | ||||
|
Forfeited
|
$ | 59.55 | (174 | ) | ||||
|
Outstanding at December 26, 2009 (6,148 Exercisable at $39.37)
|
$ | 48.28 | 10,109 | |||||
|
Granted
|
$ | 33.44 | 24 | |||||
|
Exercised
|
$ | 15.52 | (826 | ) | ||||
|
Forfeited
|
$ | 62.57 | (221 | ) | ||||
|
Outstanding at December 25, 2010
|
$ | 50.87 | 9,086 | |||||
|
Exercisable at December 25, 2010
|
$ | 45.95 | 6,761 | |||||
|
Expected to vest after December 25, 2010
|
$ | 65.19 | 2,299 | |||||
|
Stock
Options
and
SARs
as
of
December
25,
2010
|
||||||||||||
|
Exercise
|
Options
|
Remaining
|
Options
|
|||||||||
|
Price
|
Outstanding
|
Life
(Years)
|
Exercisable
|
|||||||||
|
(In Thousands)
|
(In Thousands)
|
|||||||||||
|
$8.00 -$20.00
|
1,180 | 2.93 | 1,177 | |||||||||
|
$20.01 - $40.00
|
1,871 | 4.26 | 1,825 | |||||||||
|
$40.01 - $60.00
|
3,440 | 6.34 | 2,199 | |||||||||
|
$60.01 - $80.00
|
1,266 | 6.39 | 761 | |||||||||
|
$80.01 - $100.00
|
3 | 5.05 | 2 | |||||||||
|
$100.01 - $120.00
|
1,323 | 6.87 | 795 | |||||||||
|
$120.01 - $140.00
|
3 | 5.49 | 2 | |||||||||
| 9,086 | 5.55 | 6,761 | ||||||||||
83
|
Restricted Stock Units
|
||||||||
|
Weighted-Average
|
||||||||
|
Grant
Price
|
Number
of
Shares
|
|||||||
|
(In Thousands)
|
||||||||
|
Outstanding at December 29, 2007
|
- | - | ||||||
|
Granted
|
$ | 19.59 | 1,044 | |||||
|
Released/Vested
|
- | - | ||||||
|
Cancelled
|
$ | 19.59 | (1 | ) | ||||
|
Outstanding at December 27, 2008
|
$ | 19.59 | 1,043 | |||||
|
Granted
|
$ | 29.79 | 501 | |||||
|
Released/Vested
|
$ | 19.59 | (204 | ) | ||||
|
Cancelled
|
$ | 19.63 | (24 | ) | ||||
|
Outstanding at December 26, 2009
|
$ | 23.47 | 1,316 | |||||
|
Granted
|
$ | 30.29 | 515 | |||||
|
Released/Vested
|
$ | 23.02 | (291 | ) | ||||
|
Cancelled
|
$ | 23.32 | (37 | ) | ||||
|
Outstanding at December 25, 2010
|
$ | 25.90 | 1,503 | |||||
The weighted-average remaining contract life for stock options and SARs outstanding and exercisable at December 25, 2010 is 5.55 and 5.14 years, respectively. The weighted-average remaining contract life of restricted stock units at December 25, 2010 was 2.39 years.
The fair value for these options was estimated at the date of grant using a Black-Scholes option pricing model with the following weighted-average assumptions for 2010, 2009, and 2008:
|
2010
|
2009
|
2008
|
||||||||||
|
Weighted average fair value of options granted
|
$ | 8.99 | $ | 7.32 | $ | 18.47 | ||||||
|
Expected volatility
|
0.4178 | 0.4286 | 0.3845 | |||||||||
|
Dividend yield
|
4.94 | % | 2.42 | % | 3.75 | % | ||||||
|
Expected life of options in years
|
6.3 | 6.2 | 6.0 | |||||||||
|
Risk-free interest rate
|
2.5 | % | 3.0 | % | 1.6 | % | ||||||
The Black-Scholes option valuation model was developed for use in estimating the fair value of traded options which have no vesting restrictions and are fully transferable. In addition, option valuation models require the input of highly subjective assumptions, including the expected stock price volatility. Because the Company’s employee stock options have characteristics significantly different from those of traded options, and because changes in the subjective input assumptions can materially affect the fair value estimate, in management’s opinion, the existing models do not necessarily provide a reliable single measure of the fair value of its employee stock options. The weighted-average
fair value for all awards granted during 2010, 2009, and 2008 was $29.09, $29.20, and $37.96, respectively.
The total fair value of awards vested during 2010, 2009, and 2008 was $41,249, $41,527, and $35,384, respectively. The aggregate intrinsic values of options and SARs outstanding and exercisable at December 25, 2010 were $21,723 and $21,563, respectively. The aggregate intrinsic value of options and SARs exercised during the year ended December 25, 2010 was $12,259. The aggregate intrinsic value of RSUs outstanding at December 25, 2010 was $45,645. The aggregate intrinsic value of RSUs released during the year ended December 25, 2010 was $8,828. Aggregate intrinsic value represents the positive difference between the Company’s closing stock price on the last
trading day of the fiscal period, which was $30.36 on December 25, 2010, and the exercise price multiplied by the number of options exercised. As of December 25, 2010, there was $83,559 of total unrecognized compensation cost related to unvested share-based compensation awards granted to employees under the stock compensation plans. That cost is expected to be recognized over the weighted average remaining contractual term.
84
Employee Stock Purchase Plan
The shareholders also adopted an employee stock purchase plan (ESPP). Up to 4,000,000 shares of common stock have been reserved for the ESPP with shareholders approving an additional 2,000,000 shares in May 2010. Shares will be offered to employees at a price equal to the lesser of 85% of the fair market value of the stock on the date of purchase or 85% of the fair market value on the enrollment date. The ESPP is intended to qualify as an “employee stock purchase plan” under Section 423 of the Internal Revenue Code. During 2010, 2009, and 2008, 349,173, 209,416, and 362,902 shares, respectively were purchased under the plan for a total purchase price of $8,134, $3,874, and $8,782,
respectively. During 2010, the purchases were made on the open market. At December 25, 2010, approximately 2,075,284 shares were available for future issuance.
10. Earnings Per Share
The following table sets forth the computation of basic and diluted net income per share:
|
Fiscal
Year
Ended
|
||||||||||||
|
December 25,
|
December 26,
|
December 27,
|
||||||||||
|
2010
|
2009
|
2008
|
||||||||||
|
Numerator (in thousands):
|
||||||||||||
|
Numerator for basic and diluted
|
||||||||||||
|
net income per share - net income
|
$ | 584,603 | $ | 703,950 | $ | 732,848 | ||||||
|
Denominator (in thousands):
|
||||||||||||
|
Denominator for basic net income per share -
|
||||||||||||
|
weighted-average common shares
|
196,979 | 200,395 | 208,993 | |||||||||
|
Effect of dilutive securities -
|
||||||||||||
|
employee stock-based awards
|
1,030 | 766 | 1,687 | |||||||||
|
Denominator for diluted net income per share -
|
||||||||||||
|
weighted-average common shares
|
198,009 | 201,161 | 210,680 | |||||||||
|
Basic net income per share
|
$ | 2.97 | $ | 3.51 | $ | 3.51 | ||||||
|
Diluted net income per share
|
$ | 2.95 | $ | 3.50 | $ | 3.48 | ||||||
Options to purchase 6,192,043, 7,814,000, and 5,846,000 common shares were outstanding during 2010, 2009, and 2008, respectively, but were not included in the computation of diluted earnings per share because the effect was antidilutive.
11. Share Repurchase Program
The Board of Directors approved a share repurchase program on February 12, 2010, authorizing the Company to purchase up to $300,000 of its common shares as market and business conditions warrant on the open market or in negotiated transactions in compliance with the SEC’s Rule 10b-18. The share repurchase authorization expires on December 31, 2011. As of December 25, 2010, the Company had repurchased 7,366,646 shares using cash of $223,149. There remains approximately $76,851 available for repurchase under this authorization.
The Board of Directors approved a share repurchase program on October 22, 2008, authorizing the Company to purchase up to $300 million of its common shares as market and business conditions warrant. The share repurchase authorization expired on December 31, 2009. From inception to expiration, $60 million of common shares were repurchased and retired under this plan.
85
The Board of Directors approved a share repurchase program on June 6, 2008, authorizing the Company to purchase up to 10,000,000 of its common shares as market and business conditions warrant. The share repurchase authorization expired on December 31, 2009. During fiscal 2008, 10,000,000 shares were repurchased and retired under this plan.
The Board of Directors approved a share repurchase program on February 4, 2008, authorizing the Company to purchase up to 5,000,000 of its common shares as market and business conditions warrant. The share repurchase authorization expired on December 31, 2009. During fiscal 2008, 5,000,000 shares were repurchased and retired under this plan.
12. Redomestication
The redomestication effectively changed the place of incorporation of the ultimate parent holding company of Garmin from the Cayman Islands to Switzerland.
The redomestication involved several steps. On February 9, 2010, Garmin Ltd. (Cayman) formed Garmin Ltd. (Switzerland) as a direct subsidiary. On April 6, 2010, Garmin Ltd. (Cayman) petitioned the Cayman Court to order, among other things, the calling of a meeting of Garmin Ltd. (Cayman) common shareholders to approve a scheme of arrangement. On April 7, 2010, the Cayman Court ordered us to seek shareholder approval of the scheme of arrangement. On May 20, 2010 we obtained the necessary shareholder approval. On June 4, 2010, a hearing was held by the Cayman Court and at which hearing the Cayman Court was asked to and did approve the scheme of arrangement. The scheme of arrangement
became effective at 3:00 a.m., Cayman Islands time, on Sunday, June 27, 2010 (the “Transaction Time”).
At and shortly following the Transaction Time, the following steps occurred:
|
|
1.
|
all issued and outstanding Garmin Ltd. (Cayman) common shares were transferred to Garmin Ltd. (Switzerland); and
|
|
|
2.
|
in consideration, Garmin Ltd. (Switzerland) (a) issued registered shares (on a one-for-one basis) to the holders of the Garmin Ltd. (Cayman) common shares that were transferred to Garmin Ltd. (Switzerland), and (b) increased the par value of the 10,000,000 shares of Garmin Ltd. (Switzerland) issued to Garmin Ltd. (Cayman) in connection with the formation of Garmin Ltd. (Switzerland) (the “Formation Shares”) to the same par value as the shares of Garmin Ltd. (Switzerland) issued to the Garmin Ltd. (Cayman) shareholders. The Formation Shares were subsequently transferred by Garmin Ltd. (Cayman) to its subsidiary, Garmin Luxembourg S.à r.l. for future use to satisfy our obligations to deliver shares in connection with awards granted under our equity incentive plans
for employees and other general corporate purposes.
|
As a result of the redomestication, the shareholders of Garmin Ltd. (Cayman) became shareholders of Garmin Ltd. (Switzerland), and Garmin Ltd. (Cayman) became a subsidiary of Garmin Ltd. (Switzerland). In addition, Garmin Ltd. (Switzerland) assumed, on a one-for-one basis, Garmin Ltd. (Cayman)’s existing obligations in connection with awards granted under Garmin Ltd. (Cayman)’s equity incentive plans and other similar equity awards. Any stock options, stock appreciation rights, restricted stock units or performance shares issued by Garmin Ltd. (Cayman) that are convertible, exchangeable or exercisable into common shares of Garmin Ltd. (Cayman) became convertible, exchangeable or exercisable, as the
case may be, into registered shares of Garmin Ltd. (Switzerland).
Subsequently on July 26, 2010, Garmin Ltd. (Cayman) relocated its registered office to Switzerland and changed its name to Garmin Switzerland GmbH. The reported capitalization of the Company also changed to that of Garmin Ltd. (Switzerland). Accordingly, common stock was increased by $1,796,448 to $1,797,435 (198,077,418 shares * CHF 10/ USD 9.0744)
,
and retained earnings was reduced by the same amount.
86
The summary of the components of authorized shares at December 25, 2010 is as follows:
|
Outstanding
|
Treasury
|
Issued
|
Conditional
|
Authorized
|
||||||||||||||||
|
Shares
|
Shares
|
Shares
1
|
Capital
|
Capital
|
||||||||||||||||
|
Components of authorized shares
|
||||||||||||||||||||
|
December 25, 2010
|
194,358,038 | 13,719,380 |
2
|
208,077,418 |
2,3
|
104,038,709 |
4
|
104,038,709 |
4
|
|||||||||||
|
1
|
Shares at CHF 10 par value (USD 9.0744)
|
|
2
|
Includes 10,000,000 formation shares at USD 0 historical cost
|
|
3
|
The par value of the share capital presented on the face of the balance sheet and in the consolidated statements of stockholders equity excludes the par value of the 10,000,000 formation shares.
|
|
4
|
Up to 104,038,709 conditional shares may be issued through the exercise of option rights which are granted to Garmin employees and/or members of its Board of Directors. In addition, the Board of Directors is authorized to issue up to 104,038,709 additional shares no later than June 27, 2012.
|
The general terms of Garmin Ltd. (Switzerland)'s capitalization (rights of shareholders, limitations on dividends, etc.) may be found in the proxy statement and Form 8-A/A registration statement filed with the SEC on April 9, 2010 and June 28, 2010, respectively.
13. Warranty Reserves
The Company’s products sold are generally covered by a warranty for periods ranging from one to two years. The Company’s estimate of costs to service its warranty obligations are based on historical experience and expectation of future conditions and are recorded as a liability on the balance sheet. The following reconciliation provides an illustration of changes in the aggregate warranty reserve:
|
Fiscal Year Ended
|
||||||||||||
|
December 25,
|
December 26,
|
December 27,
|
||||||||||
|
2010
|
2009
|
2008
|
||||||||||
|
Balance - beginning of period
|
$ | 87,424 | $ | 87,408 | $ | 71,636 | ||||||
|
Change in accrual for products sold in prior periods
|
(42,776 | ) | - | - | ||||||||
|
Accrual for products sold during the period
|
93,172 | 164,909 | 132,644 | |||||||||
|
Expenditures
|
(87,935 | ) | (164,893 | ) | (116,872 | ) | ||||||
|
Balance - end of period
|
$ | 49,885 | $ | 87,424 | $ | 87,408 | ||||||
87
14. Selected Quarterly Information (Unaudited)
|
Fiscal
Year
Ended
December
25,
2010
|
||||||||||||||||
|
Quarter
Ending
|
||||||||||||||||
|
March
27
|
June
26
|
September
25
(1)
|
December
25
|
|||||||||||||
|
Net sales
|
$ | 431,067 | $ | 728,765 | $ | 692,364 | $ | 837,715 | ||||||||
|
Gross profit
|
230,909 | 391,652 | 344,020 | 379,793 | ||||||||||||
|
Net income
|
37,329 | 134,816 | 279,552 | 132,906 | ||||||||||||
|
Basic net income per share
|
$ | 0.19 | $ | 0.68 | $ | 1.43 | $ | 0.67 | ||||||||
|
Fiscal
Year
Ended
December
26,
2009
|
||||||||||||||||
|
Quarter
Ending
|
||||||||||||||||
|
March
28
|
June
27
|
September
26
|
December
26
|
|||||||||||||
|
Net sales
|
$ | 436,699 | $ | 669,104 | $ | 781,254 | $ | 1,059,383 | ||||||||
|
Gross profit
|
195,995 | 351,614 | 409,742 | 486,760 | ||||||||||||
|
Net income
|
48,538 | 161,871 | 215,133 | 278,408 | ||||||||||||
|
Basic net income per share
|
$ | 0.24 | $ | 0.81 | $ | 1.07 | $ | 1.39 | ||||||||
| (1) Net income and Basic net income per share for quarter ending September 25, 2010 include a one-time tax adjustment of ($98.7) million which includes release of uncertain tax position reserves from 2006 to 2008 related to our settlement with the IRS in the US, partially offset by the amount of the settlement for the 2007 tax year in the US and Taiwan surtax expense due to the release of reserves. | ||||||||||||||||
The above quarterly financial data is unaudited, but in the opinion of management, all adjustments necessary for a fair presentation of the selected data for these interim periods presented have been included. These results are not necessarily indicative of future quarterly results.
88
None.
(a) Conclusion Regarding the Effectiveness of Disclosure Controls and Procedures
Under the supervision and with the participation of our management, including the Chief Executive Officer and Chief Financial Officer, we have evaluated the effectiveness of the design and operation of our disclosure controls and procedures pursuant to Exchange Act Rule 13a-15(b) as of the end of the period covered by this report. Based on the evaluation, the Chief Executive Officer and Chief Financial Officer have concluded that these disclosure controls and procedures are effective.
(b) Management’s Report on Internal Control over Financial Reporting
Management of the Company is responsible for establishing and maintaining adequate internal control over financial reporting for the Company. The Company’s internal control over financial reporting is a process designed to provide reasonable assurance regarding the reliability of financial reporting and the preparation of financial statements for external purposes in accordance with generally accepted accounting principles.
Because of its inherent limitations, internal control over financial reporting may not prevent or detect misstatements. Also, projections of any evaluation of effectiveness to future periods are subject to the risk that controls may become inadequate because of changes in conditions, or that the degree of compliance with the policies or procedures may deteriorate.
Management’s assessment of and conclusion on the effectiveness of internal control over financial reporting are included as Exhibits 31.1, 31.2, 32.1 and 32.2.
Management of the Company assessed the effectiveness of the Company’s internal control over financial reporting as of December 25, 2010. In making this assessment, management used the criteria set forth by the Committee of Sponsoring Organizations of the Treadway Commission (COSO) in “Internal Control-Integrated Framework”.
Based on such assessment and those criteria, management believes that the Company maintained effective internal control over financial reporting as of December 25, 2010.
Ernst & Young LLP, the independent registered public accounting firm that audited the Company’s consolidated financial statements, issued an attestation report on management’s effectiveness of the Company’s internal control over financial reporting as of December 25, 2010, as stated in their report which is included herein. That attestation report appears below.
89
Report of Independent Registered Public Accounting Firm
The Board of Directors and Shareholders
Garmin Ltd.
We have audited Garmin Ltd.’s internal control over financial reporting as of December 25, 2010, based on criteria established in Internal Control—Integrated Framework issued by the Committee of Sponsoring Organizations of the Treadway Commission (the COSO criteria). Garmin Ltd.’s management is responsible for maintaining effective internal control over financial reporting, and for its assessment of the effectiveness of internal control over financial reporting included in the accompanying Management’s Report on Internal Control over Financial Reporting. Our responsibility is to express an opinion on the Company’s internal control over financial reporting based on our
audit.
We conducted our audit in accordance with the standards of the Public Company Accounting Oversight Board (United States). Those standards require that we plan and perform the audit to obtain reasonable assurance about whether effective internal control over financial reporting was maintained in all material respects. Our audit included obtaining an understanding of internal control over financial reporting, assessing the risk that a material weakness exists, testing and evaluating the design and operating effectiveness of internal control based on the assessed risk, and performing such other procedures as we considered necessary in the circumstances. We believe that our audit provides a reasonable basis for our
opinion.
A company’s internal control over financial reporting is a process designed to provide reasonable assurance regarding the reliability of financial reporting and the preparation of financial statements for external purposes in accordance with generally accepted accounting principles. A company’s internal control over financial reporting includes those policies and procedures that (1) pertain to the maintenance of records that, in reasonable detail, accurately and fairly reflect the transactions and dispositions of the assets of the company; (2) provide reasonable assurance that transactions are recorded as necessary to permit preparation of financial statements in accordance with generally accepted
accounting principles, and that receipts and expenditures of the company are being made only in accordance with authorizations of management and directors of the company; and (3) provide reasonable assurance regarding prevention or timely detection of unauthorized acquisition, use, or disposition of the company’s assets that could have a material effect on the financial statements.
Because of its inherent limitations, internal control over financial reporting may not prevent or detect misstatements. Also, projections of any evaluation of effectiveness to future periods are subject to the risk that controls may become inadequate because of changes in conditions, or that the degree of compliance with the policies or procedures may deteriorate.
In our opinion, Garmin Ltd. maintained, in all material respects, effective internal control over financial reporting as of December 25, 2010, based on the COSO criteria.
We have also audited, in accordance with the standards of the Public Company Accounting Oversight Board (United States), the consolidated balance sheets of
Garmin Ltd. and Subsidiaries
as of December 25, 2010 and December 26, 2009 and the related consolidated statements of income, stockholders’ equity, and cash flows for each of the three years in the period ended December 25, 2010 of Garmin Ltd. and Subsidiaries and our report dated February 23, 2011 expressed an unqualified opinion thereon.
/s/ Ernst & Young LLP
Kansas City, Missouri
February 23, 2011
90
(d) Changes in Internal Control over Financial Reporting
There were no changes in our internal control over financial reporting during the quarter ended December 25, 2010 that have materially affected, or are reasonably likely to materially affect, our internal control over financial reporting
Not applicable.
91
Garmin has incorporated by reference certain information in response or partial response to the Items under this Part III of this Annual Report on Form 10-K pursuant to General Instruction G(3) of this Form 10-K and Rule 12b-23 under the Exchange Act. Garmin’s definitive proxy statement in connection with its annual meeting of shareholders scheduled for June 3, 2011 (the “Proxy Statement”) will be filed with the Securities and Exchange Commission no later than 120 days after December 25, 2010.
|
(a)
|
Directors of the Company
|
The information set forth in response to Item 401 of Regulation S-K under the headings “Proposal 1 - Election of Two Directors” and “The Board of Directors” in the Proxy Statement is hereby incorporated herein by reference in partial response to this Item 10.
|
(b)
|
Executive Officers of the Company
|
The information set forth in response to Item 401 of Regulation S-K under the heading “Executive Officers of the Registrant” in Part I of this Form 10-K is incorporated herein by reference in partial response to this Item 10.
|
(c)
|
Compliance with Section 16(a) of the Exchange Act
|
The information set forth in response to Item 405 of Regulation S-K under the heading “Section 16(a) Beneficial Ownership Reporting Compliance” in the Proxy Statement is hereby incorporated herein by reference in partial response to this Item 10.
|
(d)
|
Audit Committee and Audit Committee Financial Expert
|
The information set forth in response to Item 402 of Regulation S-K under the heading “The Board of Directors — Audit Committee” in the Proxy Statement is hereby incorporated herein by reference in partial response to this Item 10.
The Audit Committee consists of Gene M. Betts, Charles W. Peffer and Thomas P. Poberezny. Mr. Peffer serves as the Chairman of the Audit Committee. All members of the Audit Committee are “independent” within the meaning of the rules of the SEC and the NASDAQ Marketplace Rules. Garmin’s Board of Directors has determined that Mr. Betts and Mr. Peffer, are “audit committee financial experts” as defined by the SEC regulations implementing Section 407 of the Sarbanes-Oxley Act of 2002.
|
(e)
|
Code of Ethics
|
Garmin’s Board of Directors has adopted the Code of Conduct of Garmin Ltd. and Subsidiaries (the “Code”). The Code is applicable to all Garmin employees including the Chairman and Chief Executive Officer, the President and Chief Operating Officer, the Chief Financial Officer, the Controller and other officers. A copy of the Code is filed as Exhibit 14.1 to this Annual Report on Form 10-K. If any amendments to the Code are made, or any waivers with respect to the Code are granted to the Chief Executive Officer, Chief Financial Officer or Controller, such amendment or waiver will be disclosed in a Form 8-K filed with the Securities and Exchange
Commission.
92
The information set forth in response to Item 402 of Regulation S-K under the headings “Executive Compensation Matters” and “The Board of Directors – Non-Management Director Compensation” in the Proxy Statement is hereby incorporated herein by reference in partial response to this Item 11.
The information set forth in response to Item 407(e)(4) of Regulation S-K under the heading “The Board of Directors — Compensation Committee Interlocks and Insider Participation; Certain Relationships” in the Proxy Statement is hereby incorporated herein by reference in partial response to this Item 11.
The information set forth in response to Item 407(e)(5) of Regulation S-K under the heading “Executive Compensation Matters – Report of Compensation Committee” in the Proxy Statement is hereby incorporated herein by reference in partial response to this Item 11.
|
Item 12.
|
Security Ownership of Certain Beneficial Owners and Management and Related Stockholder
Matters
|
The information set forth in response to Item 403 of Regulation S-K under the heading “Stock Ownership of Certain Beneficial Owners and Management” in the Proxy Statement is hereby incorporated herein by reference in partial response to this Item 12.
Equity Compensation Plan Information
The following table gives information as of December 25, 2010 about the Garmin common shares that may be issued under all of the Company’s existing equity compensation plans, as adjusted for stock splits.
|
A
|
B
|
C
|
||||||||||
|
Number of securities
|
||||||||||||
|
remaining available for
|
||||||||||||
|
future issuance under
|
||||||||||||
|
Number of securities to be
|
Weighted-average
|
equity compensation
|
||||||||||
|
issued upon exercise of
|
exercise price of
|
plans (excluding
|
||||||||||
|
outstanding options,
|
outstanding options,
|
securities reflected in
|
||||||||||
|
Plan Category
|
warrants and rights
|
warrants and rights
|
column A)
|
|||||||||
|
Equity compensation plans approved by shareholders
|
10,589,930 | $ | 50.87 | 3,614,232 | ||||||||
|
Equity compensation plans not approved by shareholders
|
— | — | — | |||||||||
|
Total
|
10,589,930 | $ | 50.87 | 3,614,232 | ||||||||
Table consists of the Garmin Ltd. 2005 Equity Incentive Plan (as Amended and Restated Effective June 5, 2009), the Garmin Ltd. 2000 Equity Incentive Plan, the Garmin Ltd. Amended and Restated 2000 Non-Employee Directors’ Option Plan, effective June 5, 2009, and the Garmin Ltd. Amended and Restated Employee Stock Purchase Plan, effective January 1, 2010. The weighted-average exercise price does not reflect the shares that will be issued upon the payment of outstanding awards of RSUs.
The Company has no knowledge of any arrangement, the operation of which may at a subsequent date result in a change in control of the Company.
93
The information set forth in response to Item 404 of Regulation S-K under the heading “Compensation Committee Interlocks and Insider Participation; Certain Relationships” in the Proxy Statement is incorporated herein by reference in partial response to this Item 13.
The information set forth in response to Item 407(a) of Regulation S-K under the headings “Proposal One— Election of Two Directors” and “The Board of Directors” in the Proxy Statement is hereby incorporated herein by reference in partial response to this Item 13.
The information set forth under the headings “Audit Matters — Independent Registered Public Accounting Firm Fees” and “Pre-Approval of Services Provided by the Independent Auditor” in the Proxy Statement is hereby incorporated by reference in response to this Item 14.
94
|
(a)
|
List of Documents filed as part of this Report
|
|
(1)
|
Consolidated Financial Statements
|
The consolidated financial statements and related notes, together with the report of Ernst & Young LLP, appear in Part II, Item 8 “Financial Statements and Supplementary Data” of this Form 10-K.
|
(2)
|
Schedule II Valuation and Qualifying Accounts
|
|
|
All other schedules have been omitted because they are not applicable, are insignificant or the required information is shown in the consolidated financial statements or notes thereto.
|
|
(3)
|
Exhibits — The following exhibits are filed as part of, or incorporated by reference into, this Annual Report on Form 10-K:
|
|
EXHIBIT
|
||
|
NUMBER
|
DESCRIPTION
|
|
|
3.1
|
Articles of Association, as amended, of Garmin Ltd. (incorporated by reference to Exhibit 3.1 of the Registrant’s Current Report on Form 8-K filed on June 28, 2010).
|
|
|
3.2
|
Organizational Regulations of Garmin Ltd. (incorporated by reference to Exhibit 3.1 of the Registrant’s Current Report on Form 8-K filed on June 28, 2010).
|
|
|
10.1
|
Garmin Ltd. 2000 Equity Incentive Plan (incorporated by reference to Exhibit 10.1 of the Registrant’s Registration Statement on Form S-1 filed December 6, 2000 (Commission File No. 333-45514)).
|
|
|
10.2
|
Form of Stock Option Agreement pursuant to the Garmin Ltd. 2000 Equity Incentive Plan for Employees of Garmin International, Inc. (incorporated by reference to Exhibit 10.1 of the Registrant’s Current Report on Form 8-K filed on September 7, 2004).
|
|
|
10.3
|
Form of Stock Option Agreement pursuant to the Garmin Ltd. 2000 Equity Incentive Plan for Employees of Garmin Corporation (incorporated by reference to Exhibit 10.3 of the Registrant’s Current Report on Form 8-K filed on September 7, 2004).
|
|
|
10.4
|
Form of Stock Option Agreement pursuant to the Garmin Ltd. 2000 Equity Incentive Plan for UK-Approved Stock Options for Employees of Garmin (Europe) Ltd. (incorporated by reference to Exhibit 10.4 of the Registrant’s Current Report on Form 8-K filed on September 7, 2004).
|
|
|
10.5
|
Form of Stock Option Agreement pursuant to the Garmin Ltd. 2000 Equity Incentive Plan for Non UK-Approved Stock Options for Employees of Garmin (Europe) Ltd. (incorporated by reference to Exhibit 10.5 of the Registrant’s Current Report on Form 8-K filed on September 7, 2004).
|
95
|
10.6
|
Garmin Ltd. 2000 Non-Employee Directors’ Option Plan (incorporated by reference to Exhibit 10.2 of the Registrant’s Registration Statement on Form S-1 filed December 6, 2000 (Commission File No. 333-45514)).
|
|
|
10.7
|
Form of Stock Option Agreement pursuant to the Garmin Ltd. Non-Employee Directors’ Option Plan for Non-Employee Directors of Garmin Ltd. (incorporated by reference to Exhibit 10.2 of the Registrant’s Current Report on Form 8-K filed on September 7, 2004).
|
|
|
10.8
|
Garmin Ltd. Amended and Restated Employee Stock Purchase Plan (incorporated by reference to Exhibit 10.1 of the Registrant’s Quarterly Report on Form 10-Q filed August 9, 2006).
|
|
|
10.9
|
First Amendment to Garmin Ltd. Employee Stock Purchase Plan (incorporated by reference to Exhibit 10.4 of the Registrant’s Annual Report on Form 10-K filed on March 27, 2002).
|
|
|
10.10
|
Second Amendment to Garmin Ltd. Employee Stock Purchase Plan (incorporated by reference to Exhibit 10.1 of the Registrant’s Quarterly Report on Form 10-Q filed on August 13, 2003).
|
|
|
10.11
|
Garmin Ltd. 2005 Equity Incentive Plan (incorporated by reference to Exhibit 10.1 of the Registrant’s Current Report on Form 8-K filed on June 7, 2005).
|
|
|
10.12
|
Form of Stock Option Agreement pursuant to the Garmin Ltd. 2005 Equity Incentive Plan (incorporated by reference to Exhibit 10.2 of the Registrant’s Current Report on Form 8-K filed on June 7, 2005).
|
|
|
10.13
|
Form of Stock Appreciation Rights Agreement pursuant to the Garmin Ltd. 2005 Equity Incentive Plan (incorporated by reference to Exhibit 10.3 of the Registrant’s Current Report on Form 8-K filed on June 7, 2005).
|
|
|
10.14
|
Form of Stock Appreciation Rights Agreement pursuant to the Garmin Ltd. 2000 Equity Incentive Plan (incorporated by reference to Exhibit 10.4 of the Registrant’s Quarterly Report on Form 10-Q filed on May 8, 2007).
|
|
|
10.15
|
Amended and Restated Garmin Ltd. Employee Stock Purchase Plan effective January 1, 2008 (incorporated by reference to Exhibit 10.15 of the Registrant’s Annual Report on Form 10-K filed on February 25, 2009).
|
|
|
10.16
|
Form of Time Vested Restricted Stock Unit Award Agreement under the Garmin Ltd. 2005 Equity Incentive Plan (incorporated by reference to Exhibit 10.1 of the Registrant’s Current Report on Form 8-K filed on December 17, 2008).
|
|
|
10.17
|
Form of Performance Shares Award Agreement under the Garmin Ltd. 2005 Equity Incentive Plan (incorporated by reference to Exhibit 10.2 of the Registrant’s Current Report on Form 8-K filed on December 17, 2008).
|
|
|
10.18
|
Garmin Ltd. 2009 Cash Incentive Bonus Plan (incorporated by reference to Exhibit 10.18 of the Registrant’s Annual Report on Form 10-K filed on February 25, 2009).
|
|
|
10.19
|
Vendor Agreement dated February 27, 2004 between Best Buy Purchasing LLC and Garmin USA, Inc. (incorporated by reference to Exhibit 10.19 of the Registrant’s Annual Report on Form 10-K filed on February 25, 2009).
|
96
|
10.20
|
Best Buy Vendor Program Agreement dated February 29, 2008 (incorporated by reference to Exhibit 10.20 of the Registrant’s Annual Report on Form 10-K filed on February 25, 2009).
|
|
|
10.21
|
Best Buy Vendor Program Agreement and Addendum thereto dated March 30, 2009 (incorporated by reference to Exhibit 10.1 of the Registrant’s Quarterly Report on Form 10-Q filed on August 5, 2009).
|
|
|
10.22
|
Amended and Restated Garmin Ltd. Employee Stock Purchase Plan, effective January 1, 2010 (incorporated by reference to Exhibit 10.22 of the Registrant’s Annual Report on Form 10-K filed on February 24, 2010).
|
|
|
10.23
|
Form of Time Vested Restricted Stock Unit Award Agreement under the Garmin Ltd. 2005 Equity Incentive Plan, as revised by the Registrant’s Board of Directors on December 11, 2009 (incorporated by reference to Exhibit 10.22 of the Registrant’s Annual Report on Form 10-K filed on February 24, 2010).
|
|
|
10.24
|
Form of Performance Shares Award Agreement under the Garmin Ltd. 2005 Equity Incentive Plan, as revised by the Registrant’s Board of Directors on December 11, 2009 (incorporated by reference to Exhibit 10.22 of the Registrant’s Annual Report on Form 10-K filed on February 24, 2010).
|
|
|
10.25
|
Garmin Ltd. 2005 Equity Incentive Plan (as Amended and Restated Effective June 5, 2009) (incorporated by reference to Schedule 1 of the Registrant’s Proxy Statement on Schedule 14A filed on April 21, 2009).
|
|
|
10.26
|
Garmin Ltd. Amended and Restated 2000 Non-Employee Directors’ Option Plan, Effective June 5, 2009 (incorporated by reference to Schedule 2 of the Registrant’s Proxy Statement on Schedule 14A filed on April 21, 2009).
|
|
|
10.27
|
Garmin Ltd. Amended and Restated 2000 Equity Incentive Plan (incorporated by reference to Exhibit 10.2 of the Registrant’s Current Report on Form 8-K filed on June 28, 2010).
|
|
|
10.28
|
Garmin Ltd. Amended and Restated 2000 Non-Employee Directors’ Option Plan (incorporated by reference to Exhibit 10.3 of the Registrant’s Current Report on Form 8-K filed on June 28, 2010).
|
|
|
10.29
|
Garmin Ltd. Amended and Restated Employee Stock Purchase Plan (incorporated by reference to Exhibit 10.4 of the Registrant’s Current Report on Form 8-K filed on June 28, 2010).
|
|
|
10.30
|
Garmin Ltd. Amended and Restated 2005 Equity Incentive Plan (incorporated by reference to Exhibit 10.5 of the Registrant’s Current Report on Form 8-K filed on June 28, 2010).
|
|
|
10.31
|
Form of Stock Option Agreement pursuant to the Garmin Ltd. Amended and Restated 2000 Non-Employee Directors’ Option Plan (incorporated by reference to Exhibit 10.6 of the Registrant’s Current Report on Form 8-K filed on June 28, 2010).
|
|
|
10.32
|
Form of Performance Shares Award Agreement pursuant to the Garmin Ltd. 2005 Equity Incentive Plan (incorporated by reference to Exhibit 10.7 of the Registrant’s Current Report on Form 8-K filed on June 28, 2010).
|
97
|
10.33
|
Form of Restricted Stock Unit Award Agreement pursuant to the Garmin Ltd. 2005 Equity Incentive Plan, for Swiss residents (incorporated by reference to Exhibit 10.8 of the Registrant’s Current Report on Form 8-K filed on June 28, 2010).
|
|
|
10.34
|
Form of Restricted Stock Unit Award Agreement pursuant to the Garmin Ltd. 2005 Equity Incentive Plan, for non-Swiss residents (incorporated by reference to Exhibit 10.9 of the Registrant’s Current Report on Form 8-K filed on June 28, 2010).
|
|
|
10.35
|
Transaction Agreement between Garmin Ltd., a Cayman Islands company, and the Registrant, dated as of May 21, 2010 ((incorporated by reference to Exhibit 10.1 of the Registrant’s Current Report on Form 8-K filed on June 28, 2010).
|
|
|
14.1
|
Code of Conduct of Garmin Ltd. and Subsidiaries
|
|
|
21.1
|
List of subsidiaries
|
|
|
23.1
|
Consent of Ernst & Young LLP
|
|
|
24.1
|
Power of Attorney (included in signature page)
|
|
|
31.1
|
Chief Executive Officer’s Certification pursuant to Section 302 of the Sarbanes-Oxley Act of 2002.
|
|
|
31.2
|
Chief Financial Officer’s Certification pursuant to Section 302 of the Sarbanes-Oxley Act of 2002.
|
|
|
32.1
|
Chief Executive Officer’s Certification pursuant to Section 906 of the Sarbanes-Oxley Act of 2002.
|
|
|
32.2
|
Chief Financial Officer’s Certification pursuant to Section 906 of the Sarbanes-Oxley Act of 2002.
|
|
|
Exhibit 101.INS
|
XBRL Instance Document
|
|
|
Exhibit 101.SCH
|
XBRL Taxonomy Extension Schema
|
|
|
Exhibit 101.CAL
|
XBRL Taxonomy Extension Calculation Linkbase
|
|
|
Exhibit 101.LAB
|
XBRL Taxonomy Extension Label Linkbase
|
|
|
Exhibit 101.PRE
|
XBRL Taxonomy Extension Presentation Linkbase
|
|
|
Exhibit 101.DEF
|
XBRL Taxonomy Extension Definition Linkbase
|
|
(b)
|
Exhibits
.
|
The exhibits listed on the accompanying Exhibit Index in Item 15(a)(3) are filed as part of, or are incorporated by reference into, this Annual Report on Form 10-K.
|
(c)
|
Financial Statement Schedules
.
|
Reference is made to Item 15(a)(2) above.
98
SCHEDULE II - VALUATION AND QUALIFYING ACCOUNTS
Garmin Ltd. and Subsidiaries
(
In thousands
)
|
Additions
|
||||||||||||||||||||
|
Balance at
|
Charged to
|
Charged to
|
Balance at
|
|||||||||||||||||
|
Beginning of
|
Costs and
|
Other
|
End of
|
|||||||||||||||||
|
Description
|
Period
|
Expenses
|
Accounts
|
Deductions
|
Period
|
|||||||||||||||
|
Year Ended December 25, 2010:
|
||||||||||||||||||||
|
Deducted from asset accounts
|
||||||||||||||||||||
|
Allowance for doubtful accounts
|
$ | 36,673 | $ | (4,476 | ) | - | $ | (375 | ) | $ | 31,822 | |||||||||
|
Inventory reserve
|
38,898 | 5,753 | - | (6,931 | ) | 37,720 | ||||||||||||||
|
Deferred tax asset valuation allowance
|
35,617 | 15,735 | - | - | 51,352 | |||||||||||||||
|
Total
|
$ | 111,188 | $ | 17,012 | - | $ | (7,306 | ) | $ | 120,894 | ||||||||||
|
Year Ended December 26, 2009:
|
||||||||||||||||||||
|
Deducted from asset accounts
|
||||||||||||||||||||
|
Allowance for doubtful accounts
|
$ | 42,409 | $ | (1,332 | ) | - | $ | (4,404 | ) | $ | 36,673 | |||||||||
|
Inventory reserve
|
23,204 | 61,323 | - | (45,629 | ) | 38,898 | ||||||||||||||
|
Deferred tax asset valuation allowance
|
34,487 | 1,468 | - | (338 | ) | 35,617 | ||||||||||||||
|
Total
|
$ | 100,100 | $ | 61,459 | - | $ | (50,371 | ) | $ | 111,188 | ||||||||||
|
Year Ended December 27, 2008:
|
||||||||||||||||||||
|
Deducted from asset accounts
|
||||||||||||||||||||
|
Allowance for doubtful accounts
|
$ | 10,246 | $ | 32,355 | - | $ | (192 | ) | $ | 42,409 | ||||||||||
|
Inventory reserve
|
31,186 | 24,461 | - | (32,443 | ) | 23,204 | ||||||||||||||
|
Deferred tax asset valuation allowance
|
15,491 | 18,996 | - | - | 34,487 | |||||||||||||||
|
Total
|
$ | 56,923 | $ | 75,812 | - | $ | (32,635 | ) | $ | 100,100 | ||||||||||
99
SIGNATURES
Pursuant to the requirements of Section 13 or 15(d) of the Securities Exchange Act of 1934, the registrant has duly caused this report to be signed on its behalf by the undersigned, thereunto duly authorized.
|
GARMIN LTD.
|
||
|
By
|
/s/ Min H. Kao
|
|
|
Min H. Kao
|
||
|
Chief Executive Officer
|
||
Dated: February 23, 2011
POWER OF ATTORNEY
Know all persons by these presents, that each person whose signature appears below constitutes and appoints Min H. Kao and Kevin Rauckman and Andrew R. Etkind, and each of them, as his attorney-in-fact, with the power of substitution, for him in any and all capacities, to sign any amendments to this Annual Report on Form 10-K, and to file the same, with exhibits thereto and other documents in connection therewith, with the Securities and Exchange Commission, hereby ratifying and confirming all that said attorney-in-fact, or his substitute or substitutes, may do or cause to be done by virtue hereof.
Pursuant to the requirements of the Securities Exchange Act of 1934, this report on Form 10-K has been signed below by the following persons on behalf of the registrant and in the capacities indicated on February 23, 2011.
|
/s/ Min H. Kao
|
/s/ Gene M. Betts
|
||
|
Min H. Kao
|
Gene M. Betts
|
||
|
Chairman, Chief
|
Director
|
||
|
Executive Officer and Director
|
|||
|
(Principal Executive Officer)
|
|||
|
/s/ Kevin Rauckman
|
/s/Donald H. Eller
|
||
|
Kevin Rauckman
|
Donald H. Eller
|
||
|
(Principal Financial Officer and Principal Accounting Officer)
|
Director
|
||
|
Chief Financial Officer and Treasurer
|
|||
|
/s/ Charles W. Peffer
|
/s/ Thomas P. Poberezny
|
||
|
Charles W. Peffer
|
Thomas P. Poberezny
|
||
|
Director
|
Director
|
||
|
/s/
Clifton A. Pemble
|
|
||
|
Clifton A Pemble
|
|||
|
Director
|
|||
100
Garmin Ltd.
2010 Form 10-K Annual Report
Exhibit Index
The following exhibits are attached hereto. See Part IV of this Annual Report on Form 10-K for a complete list of exhibits.
|
Exhibit
|
||
|
Number
|
Document
|
|
|
14.1
|
Code of Conduct of Garmin Ltd. and Subsidiaries
|
|
|
21.1
|
List of subsidiaries
|
|
|
23.1
|
Consent of Ernst & Young LLP
|
|
|
31.1
|
Chief Executive Officer’s Certification pursuant to Section 302 of the Sarbanes-Oxley Act of 2002
|
|
|
31.2
|
Chief Financial Officer’s Certification pursuant to Section 302 of the Sarbanes-Oxley Act of 2002
|
|
|
32.1
|
Chief Executive Officer’s Certification pursuant to Section 906 of the Sarbanes-Oxley Act of 2002
|
|
|
32.2
|
Chief Financial Officer’s Certification pursuant to Section 906 of the Sarbanes-Oxley Act of 2002
|
|
|
Exhibit 101.INS
|
XBRL Instance Document
|
|
|
Exhibit 101.SCH
|
XBRL Taxonomy Extension Schema
|
|
|
Exhibit 101.CAL
|
XBRL Taxonomy Extension Calculation Linkbase
|
|
|
Exhibit 101.LAB
|
XBRL Taxonomy Extension Label Linkbase
|
|
|
Exhibit 101.PRE
|
XBRL Taxonomy Extension Presentation Linkbase
|
|
|
Exhibit 101.DEF
|
XBRL Taxonomy Extension Definition Linkbase
|
TABLE OF CONTENTS
Part IItem 1. BusinessItem 1A. Risk FactorsItem 1B. Unresolved Staff CommentsItem 2. PropertiesItem 3. Legal ProceedingsPart IIItem 5. Market For The Company S Common Shares, Related Shareholder Matters and Issuer Purchases Of Equity SecuritiesItem 6. Selected Financial DataItem 7. Management S Discussion and Analysis Of Financial Condition and Results Of OperationsItem 7A. Quantitative and Qualitative Disclosures About Market RiskItem 8. Financial Statements and Supplementary DataItem 9. Changes in and Disagreements with Accountants on Accounting and Financial DisclosureItem 9A. Controls and ProceduresItem 9B. Other InformationPart IIIItem 10. Directors, Executive Officers and Corporate GovernanceItem 11. Executive CompensationItem 12. Security Ownership Of Certain Beneficial Owners and Management and Related Stockholder MattersItem 13. Certain Relationships and Related Transactions, and Director IndependenceItem 14. Principal Accounting Fees and ServicesPart IVItem 15. Exhibits, and Financial Statement Schedules