U S GLOBAL INVESTORS INC
10-Ks and 10-Qs
UNITED STATES
SECURITIES AND EXCHANGE COMMISSION
Washington, D.C. 20549
FORM 10-K
x
Annual Report Pursuant to Section 13 or 15(d) of the Securities Exchange Act of 1934
For the Fiscal Year Ended
June 30, 2015
or
o
Transition Report Pursuant to Section 13 or 15(d) of the Securities Exchange Act of 1934
for the transition period from
to
Commission File Number 0-13928
U.S. GLOBAL INVESTORS, INC.
Incorporated in the State of Texas
IRS Employer Identification No. 74-1598370
Principal Executive Offices:
7900 Callaghan Road
San Antonio, Texas 78229
Telephone Number: 210-308-1234
Securities registered pursuant to Section 12(b) of the Act: None
Securities registered pursuant to Section 12(g) of the Act:
Class A common stock
($0.025 par value per share)
Registered: NASDAQ Capital Market
Indicate by check mark if the registrant is a well-known seasoned issuer, as defined in Rule 405 of the Securities Act.
Yes
¨
No
x
Indicate by check mark if the registrant is not required to file reports pursuant to Section 13 or 15(d) of the Exchange Act.
Yes
¨
No
x
Indicate by check mark whether the Company (1) has filed all reports required to be filed by Section 13 or 15(d) of the Securities Exchange Act of 1934 during the preceding 12 months (or for such shorter period that the registrant was required to file such reports), and (2) has been subject to such filing requirements for the past 90 days.
Yes
x
No
¨
Indicate by check mark whether the registrant has submitted electronically and posted on its corporate website, if any, every Interactive Data File required to be submitted and posted pursuant to Rule 405 of Regulations S-T (§232.405 of this chapter) during the preceding 12 months (or for such shorter period that the registrant was required to submit and post such files).
Yes
x
No
¨
Indicate by check mark if disclosure of delinquent filers pursuant to Item 405 of Regulation S-K (§229.405 of this chapter) is not contained herein, and will not be contained, to the best of registrant’s knowledge, in definitive proxy or information statements incorporated by reference in Part III of this Form 10-K or any amendment to this Form 10-K.
¨
Indicate by check mark whether the registrant is a large accelerated filer, an accelerated filer, or a non-accelerated filer. See definition of “accelerated filer and large accelerated filer” in Rule 12b-2 of the Exchange Act.
|
Large accelerated filer
o
|
Accelerated filer
o
|
Non-accelerated filer
x
|
Small reporting company
o
|
Indicate by check mark whether the registrant is a shell company (as defined in Rule 12b-2 of the Act).
Yes
¨
No
x
The aggregate market value of the
8,169,938
shares of nonvoting class A common stock held by nonaffiliates of the registrant was
$25,326,808
, based on the last sale price quoted on NASDAQ as of
December 31, 2014
, the last business day of the registrant’s most recently completed second fiscal quarter. Registrant’s only voting stock is its class C common stock, par value of $0.025 per share, for which there is no active market. The aggregate value of the
4,567
shares of the class C common stock held by nonaffiliates of the registrant on
December 31, 2014
(based on the last sale price of the class C common stock in a private transaction) was
$1,142
. For purposes of this disclosure only, the registrant has assumed that its directors, executive officers, and beneficial owners of 5 percent or more of the registrant’s common stock are affiliates of the registrant.
On
September 4, 2015
, there were
13,866,421
shares of Registrant’s class A nonvoting common stock issued and
13,264,590
shares of Registrant’s class A nonvoting common stock issued and outstanding, no shares of Registrant’s class B nonvoting common stock outstanding, and
2,069,127
shares of Registrant’s class C voting common stock issued and outstanding.
Documents incorporated by reference: None
Table of Contents
|
Exhibit 10.16 - Modification dated May 14, 2015, to Line of Credit Note dated February 26, 2009
|
|
|
Exhibit 10.18 - Credit agreement dated June 29, 2015
|
|
|
Exhibit 14.02 - Code of Ethics, adopted June 28, 1989, and amended April 29, 2015
|
|
|
Exhibit 21 — Subsidiaries of the Company, Jurisdiction of Incorporation, and Percentage of Ownership
|
|
|
Exhibit 23.1 — BDO USA, LLP consent
|
|
|
Exhibit 31.1 — Rule 13a – 14(a) Certifications (under Section 302 of the Sarbanes-Oxley Act of 2002)
|
|
|
Exhibit 32.1 — Section 1350 Certifications (under Section 906 of the Sarbanes-Oxley Act of 2002)
|
|
i
|
|

|
This Annual Report on Form 10-K contains “forward-looking statements” within the meaning of the Private Securities Litigation Reform Act of 1995. In addition, U.S. Global Investors, Inc. and its subsidiaries (collectively, “U.S. Global” or the “Company”) may make other written and oral communications from time to time that contain such statements. Forward-looking statements include statements as to industry trends, future expectations of the Company, and other matters that do not relate strictly to historical facts and are based on certain assumptions by management. These statements are often identified by the use of words such as “may,” “will,” “expect,” “believe,” “anticipate,” “intend,” “could,” “should,” “estimate,” or “continue,” and similar expressions or variations. These statements are based on the beliefs and assumptions of Company management based on information currently available to management. Such forward-looking statements are subject to risks, uncertainties and other factors that could cause actual results to differ materially from future results expressed or implied by such forward-looking statements. Important factors that could cause actual results to differ materially from the forward-looking statements include, among others, the risks described in Part I, Item 1A, Risk Factors, and elsewhere in this report and other documents filed or furnished by U.S. Global from time to time with the U.S. Securities and Exchange Commission (“SEC”). U.S. Global cautions readers to carefully consider such factors. Furthermore, such forward-looking statements speak only as of the date on which such statements are made. Except to the extent required by applicable law, U.S. Global undertakes no obligation to update any forward-looking statements to reflect events or circumstances after the date of such statements.
U.S. Global, a Texas corporation organized in 1968, is a registered investment adviser under the Investment Advisers Act of 1940, as amended (“Advisers Act”). The Company, with principal operations located in San Antonio, Texas, manages three business segments:
|
1.
|
Investment Management Services
, through which the Company offers, through U.S. Global Investors Funds (“USGIF” or the “Fund(s)”), offshore clients, and an exchange traded fund (“ETF”) client, a range of investment management products and services to meet the needs of individual and institutional investors;
|
|
2.
|
Investment Management Services - Canada
, through which, as of June 1, 2014, the Company owns a
65%
controlling interest in Galileo Global Equity Advisors Inc. (“Galileo”), a privately held Toronto-based asset management firm which offers investment management products and services in Canada; and
|
|
3.
|
Corporate Investments
, through which the Company invests for its own account in an effort to add growth and value to its cash position. Although the Company generates the majority of its revenues from its investment advisory segments, the Company holds a significant amount of its total assets in investments.
|
As part of its investment management businesses, the Company provides: (1) investment advisory services; (2) distribution services; and (3) administrative services to the mutual funds advised by the Company. The fees from these services, as well as investment income, are the primary sources of the Company’s revenue. Through December 2013, the Company also provided transfer agency services to the mutual funds advised by the Company.
|
Lines of Business
|
||||
Investment Management Services
Investment Advisory Services.
The Company furnishes an investment program for each of the clients it manages and determines, subject to overall supervision by the applicable board of trustees of the clients, the clients’ investments pursuant to an advisory agreement. Consistent with the investment restrictions, objectives and policies of the particular client, the portfolio team for each client determines what investments should be purchased, sold, and held, and makes changes in the portfolio deemed necessary or appropriate. In the advisory agreement, the Company is charged with seeking the best overall terms in executing portfolio transactions and selecting brokers or dealers.
As required by the Investment Company Act of 1940, as amended (“Investment Company Act”), the advisory agreement with USGIF is subject to annual renewal and is terminable upon 60-day notice. This agreement has been renewed through September
2016
.
1
In addition to providing advisory services to USGIF, the Company provides advisory services to two offshore clients and one ETF. A third offshore fund liquidated in November 2013.
Net assets under management on
June 30, 2015
, and
June 30, 2014
, are detailed in the following table.
|
Assets Under Management (
“
AUM
”
)
|
||||||||||
|
Fund
|
|
Ticker
|
|
June 30, 2015
|
|
June 30, 2014
|
||||
|
(dollars in thousands)
|
||||||||||
|
U.S. Global Investors Funds
|
||||||||||
|
Natural Resources
|
|
|
|
|
|
|||||
|
Global Resources
|
|
PSPFX/PIPFX
|
|
$
|
135,732
|
|
$
|
349,945
|
|
|
|
World Precious Minerals
|
|
UNWPX/UNWIX
|
|
94,897
|
|
166,993
|
|
|||
|
Gold and Precious Metals
|
|
USERX
|
|
64,021
|
|
97,339
|
|
|||
|
Total Natural Resources
|
|
|
|
294,650
|
|
614,277
|
|
|||
|
International Equity
|
|
|
|
|
|
|||||
|
Emerging Europe
|
|
EUROX
|
|
58,225
|
|
102,065
|
|
|||
|
China Region
|
|
USCOX
|
|
22,000
|
|
23,380
|
|
|||
|
Total International Equity
|
|
|
|
80,225
|
|
125,445
|
|
|||
|
Fixed Income
|
|
|
|
|
|
|||||
|
U.S. Government Securities Ultra-Short Bond
|
|
UGSDX
|
|
58,332
|
|
68,576
|
|
|||
|
Near-Term Tax Free
|
|
NEARX
|
|
90,251
|
|
61,984
|
|
|||
|
Total Fixed Income
|
|
|
|
148,583
|
|
130,560
|
|
|||
|
Domestic Equity
|
|
|
|
|
|
|||||
|
Holmes Macro Trends
|
|
MEGAX
|
|
46,368
|
|
51,980
|
|
|||
|
All American Equity
|
|
GBTFX
|
|
21,000
|
|
23,666
|
|
|||
|
Total Domestic Equity
|
|
|
|
67,368
|
|
75,646
|
|
|||
|
Total U.S. Global Investors Funds
|
|
|
|
590,826
|
|
|
945,928
|
|
||
|
U.S Global Jets ETF
|
JETS
|
39,200
|
|
—
|
|
|||||
|
Offshore Advisory Clients
|
|
|
|
11,527
|
|
|
20,012
|
|
||
|
|
|
|
|
641,553
|
|
|
965,940
|
|
||
|
Total Canada AUM (see separate discussion)
|
150,718
|
|
267,210
|
|
||||||
|
Total AUM
|
$
|
792,271
|
|
$
|
1,233,150
|
|
||||
Distribution Services.
The Company has registered its wholly-owned subsidiary, U.S. Global Brokerage, Inc. (“USGB”), with the Financial Industry Regulatory Authority (“FINRA”), the SEC and appropriate state regulatory authorities as a limited-purpose broker-dealer for the purpose of distributing Fund shares. The distribution agreement with USGIF is subject to annual renewal and is terminable upon 60-day notice. This agreement has been renewed through September
2016
.
Shareholder Services.
In connection with obtaining and/or providing administrative services to the beneficial owners of USGIF through broker-dealers, banks, trust companies and similar institutions which provide such services, the Company receives shareholder services fees at an annual rate of up to
0.20 percent
of the value of
shares held in accounts at the institutions, which helps offset related platform costs.
Administrative Services.
The Company also manages, supervises and conducts certain other affairs of USGIF, subject to the control of the Funds’ Board of Trustees pursuant to an administrative services agreement. It provides office space, facilities and certain business equipment as well as the services of executive and clerical personnel for administering the affairs of the Funds. U.S. Global and its affiliates compensate all personnel, officers, directors and interested trustees of the Funds if such persons are also employees of the Company or its affiliates. Effective December 2013, the Funds’ Board of Trustees increased the annual rate from
0.08 percent
to
0.10 percent
for each investor class and from
0.06 percent
to
0.08 percent
for each institutional class plus $10,000 per Fund. Effective November 1, 2014, the per fund fee changed to $7,000 per year. The administrative services agreement with USGIF is subject to renewal on an annual basis and is terminable upon 60-day notice. This agreement has been renewed through September
2016
.
2
Transfer Agency and Other Services.
Through December 6, 2013, the Company’s wholly-owned subsidiary, United Shareholder Services, Inc. (“USSI”), a transfer agent registered under the Securities Exchange Act of 1934 (“Exchange Act”), provided transfer agency, printing, and mailing services to investment company clients.
The Company’s Board of Directors formally agreed on August 23, 2013, to exit the transfer agency business so that the Company could focus more on its core strength of investment management. USSI served as transfer agent until conversion to the new transfer agent on December 9, 2013. The transfer agency results, together with expenses associated with discontinuing transfer agency operations, are reflected as discontinued operations in the Consolidated Statement of Operations and are, therefore, excluded from continuing operations results.
Investment Management Services - Canada
|
Assets Under Management (
“
AUM
”
)
|
||||||||||
|
(dollars in thousands)
|
Ticker
|
June 30, 2015
|
June 30, 2014
|
|||||||
|
Galileo Funds
|
||||||||||
|
Galileo High Income Plus Fund
|
N/A
1
|
$
|
63,607
|
|
$
|
119,329
|
|
|||
|
Galileo Growth and Income Fund
|
N/A
1
|
3,964
|
|
7,724
|
|
|||||
|
Total Galileo Funds
|
67,571
|
|
127,053
|
|
||||||
|
Other Advisory Clients
|
83,147
|
|
140,157
|
|
||||||
|
Total Canada AUM
|
$
|
150,718
|
|
|
$
|
267,210
|
|
|||
|
1.
|
The Galileo Funds are Canadian registered mutual funds and are not available in the United States.
|
Effective
March 31, 2013
, the Company, through its wholly-owned subsidiary, U.S. Global Investors (Canada) Limited (“USCAN”), purchased
50 percent
of the issued and outstanding shares of Galileo Global Equity Advisors, Inc., a privately held Toronto-based asset management firm, for
$600,000
cash.
Effective
June 1, 2014
, the Company, through USCAN, completed its purchase of an additional
15 percent
interest in Galileo from the company’s founder, Michael Waring, for
$180,000
cash. This strategic investment brought USCAN’s ownership to
65 percent
of the issued and outstanding shares of Galileo, which represents controlling interest of Galileo. The non-controlling interest in this subsidiary is included in “non-controlling interest in subsidiaries” in the equity section of the Consolidated Balance Sheets. Frank Holmes, CEO, and Susan McGee, President and General Counsel, serve as directors of Galileo.
Galileo Equity Management Inc. was incorporated under the Business Corporations Act (Ontario) on July 16, 1999. On May 17, 2007, its name changed to Galileo Global Equity Advisors, Inc. Galileo is registered as a portfolio manager and exempt market dealer with the Ontario Securities Commission (“OSC”), the Nova Scotia Securities Commission and the Quebec Securities Commission. Additionally, the company is registered as an exempt market dealer with the New Brunswick and Newfoundland and Labrador Securities Commissions. On July 31, 2012, Galileo was also registered as an investment fund manager with the OSC.
Corporate Investments
Investment Activities.
In addition to providing management and advisory services, the Company is actively engaged in trading for its own account. See segment information in the Notes to the Consolidated Financial Statements at Note 17 Financial Information by Business Segment, of this Annual Report in Form 10-K.
Additional Segment Information
See additional financial information about business segments in Part II, Item 8, Financial Statements and Supplementary Data at Note 17 Financial Information by Business Segment, of this Annual Report in Form 10-K.
3
|
Employees
|
||||
As of
June 30, 2015
, U.S. Global and its wholly-owned subsidiaries employed
40
full-time employees and
2
part-time employees; as of
June 30, 2014
, it employed
48
full-time employees and
4
part-time employees. The Company considers its relationship with its employees to be good.
|
Competition
|
||||
The mutual fund industry is highly competitive. According to the Investment Company Institute, at the end of
2014
there were approximately
9,300
domestically registered open-end investment companies of varying sizes and investment policies, whose shares are being offered to the public worldwide. Generally, there are two types of mutual funds: “load” and “no-load.” In addition, there are both load and no-load funds that have adopted Rule 12b-1 plans authorizing the payment of distribution costs of the funds out of fund assets. USGIF is a trust with no-load funds that have adopted 12b-1 plans. Load funds are typically sold through or sponsored by brokerage firms, and a sales commission is charged on the amount of the investment. No-load funds, such as the USGIF, however, may be purchased directly from the particular mutual fund organization or through a distributor, and no sales commissions are charged.
In addition to competition from other mutual fund managers and investment advisers, the Company and the mutual fund industry are in competition with various investment alternatives, offered by insurance companies, banks, securities broker-dealers, other financial institutions, and ETFs. ETFs have had a significant impact on the industry in the past decade, growing from nearly nothing to approximately
1,500
ETFs available at the end of
2014
. Many of these institutions are able to engage in more liberal advertising than mutual funds and may offer accounts at competitive interest rates, which may be insured by federally chartered corporations such as the Federal Deposit Insurance Corporation.
A number of mutual fund groups are significantly larger than the funds managed by U.S. Global, offer a greater variety of investment objectives and have more experience and greater resources to promote the sale of investments therein. However, the Company believes it has the resources, products, and personnel to compete with these other mutual funds. In particular, the Company is known for its expertise in the gold mining and exploration, natural resources and emerging markets. Competition for sales of fund shares is influenced by various factors, including investment objectives and performance, advertising and sales promotional efforts, distribution channels, and the types and quality of services offered to fund shareholders.
Success in the investment advisory and mutual fund distribution businesses is substantially dependent on each fund’s investment performance, the quality of services provided to shareholders, and the Company’s efforts to market the Funds effectively. Sales of Fund shares generate management, distribution and administrative services fees (which are based on the assets of the Funds), and shareholder services fees (which are based on the assets of the Funds held through institutions). Costs of distribution and compliance continue to put pressure on profit margins for the mutual fund industry.
Despite the Company’s expertise in gold mining and exploration, natural resources, and emerging markets, the Company faces the same obstacle many advisers face, namely uncovering undervalued investment opportunities as the markets face further uncertainty and increased volatility. In addition, the growing number of alternative investments, especially in specialized areas, has created pressure on the profit margins and increased competition for available investment opportunities.
|
Supervision and Regulation
|
|||
The Company, USGB, and the clients the Company manages and administers operate under certain laws, including federal and state securities laws, governing their organization, registration, operation, legal, financial, and tax status. Among the potential penalties for violation of the laws and regulations applicable to the Company and its subsidiaries are fines, imprisonment, injunctions, revocation of registration, and certain additional administrative sanctions. Any determination that the Company or its management has violated applicable laws and regulations could have a material adverse effect on the business of the Company. Moreover, there is no assurance that changes to existing laws, regulations, or rulings promulgated by governmental entities having jurisdiction over the Company and the Funds will not have a material adverse effect on the Company’s business. The Company has no control over regulatory rulemaking or the consequences it may have on the mutual fund and investment advisory industry.
Recent and accelerating regulatory pronouncements and oversight have significantly increased the burden of compliance infrastructure with respect to the mutual fund industry and the capital markets. This momentum of new regulations has contributed significantly to the costs of managing and administering mutual funds.
4
U.S. Global is registered as an investment adviser with the SEC. As a registered investment adviser, it is subject to the requirements of the Advisers Act, and the SEC’s regulations thereunder, as well as to examination by the SEC’s staff. The Advisers Act imposes substantive regulation on virtually all aspects of the Company’s business and relationships with the Company’s clients. Applicable rules relate to, among other things, fiduciary duties to clients, transactions with clients, effective compliance programs, conflicts of interest, advertising, recordkeeping, reporting, and disclosure requirements. The Funds and ETF for which the Company acts as the investment adviser are registered with the SEC under the Investment Company Act. The Investment Company Act imposes additional obligations, including detailed operational requirements for both funds and their advisers. Moreover, an investment adviser’s contract with a registered fund may be terminated by the fund on not more than 60 days’ notice and is subject to annual renewal by the fund’s board after an initial two-year term. Both the Advisers Act and the Investment Company Act regulate the “assignment” of advisory contracts by the investment adviser. The SEC is authorized to institute proceedings and impose sanctions for violations of the Investment Advisers Act and the Investment Company Act, ranging from fines and censures to termination of an investment adviser’s registration. The failure of the Company, or the Funds and ETF which the Company advises, to comply with the requirements of the SEC could have a material adverse effect on the Company. The Company is also subject to federal and state laws affecting corporate governance, including the Sarbanes-Oxley Act of 2002 (“S-Ox Act”), as well as rules adopted by the SEC.
USGB is subject to regulation by the SEC under the Exchange Act and regulation by FINRA, a self-regulatory organization composed of other registered broker-dealers. U.S. Global and USGB are required to keep and maintain certain reports and records, which must be made available to the SEC and FINRA upon request.
Galileo Global Equity Advisors Inc. (“Galileo”) is registered as a portfolio manager and investment fund manager with the Ontario Securities Commission (“OSC”). As a registered portfolio manager, the OSC imposes substantive regulation on virtually all aspects of Galileo's business and relationships with Galileo’s clients. Applicable legislation relate to, among other things, fiduciary duties to clients, transactions with clients, effective compliance programs, conflicts of interest, advertising, recordkeeping, reporting, and disclosure requirements. The Canadian funds for which Galileo acts as the investment fund manager are registered with the OSC follow under National Instrument 81-101/102/106. These National Policies impose additional obligations, including detailed operational requirements for both funds and their managers. The OSC is authorized to institute proceedings and impose sanctions for violations of the rules ranging from fines and censures to termination of a portfolio manager and investment fund manager’s registration. The failure of Galileo, or the Canadian funds which Galileo advises, to comply with the requirements of the OSC could have a material adverse effect on Galileo.
|
Relationships with Clients
|
||||
The businesses of the Company are to a very significant degree dependent on their associations and contractual relationships with USGIF. In the event the advisory or administrative agreements with USGIF are canceled or not renewed pursuant to the terms thereof, the Company would be substantially adversely affected. U.S. Global and USGB consider their relationships with the Funds to be good, and they have no reason to believe that their management and service contracts will not be renewed in the future; however, there is no assurance that USGIF will choose to continue its relationship with the Company or USGB.
In addition, the Company is also dependent on its relationships with its offshore and exchange traded fund clients. Even though the Company views its relationship with its offshore and exchange traded fund clients as stable, the Company could be adversely affected if these relationships ended.
Galileo is also dependent on its relationships with its clients. Even though Galileo views its relationship with its clients as stable, the Company could be adversely affected if these relationships ended.
|
Available Information
|
||||
Available Information
. The Company’s Internet website address is www.usfunds.com. Information contained on the Company’s website is not part of this annual report on Form 10-K. The Company’s annual reports on Form 10-K, quarterly reports on Form 10-Q, current reports on Form 8-K, and amendments to those reports filed with (or furnished to) the SEC are available through a link on the Company’s Internet website, free of charge, soon after such material is filed or furnished. (The link to the Company’s SEC filings can be found at www.usfunds.com by clicking “About Us,” followed by “Investor Relations,” followed by “SEC Filings.”) The Company routinely posts important information on its website.
The Company also posts its Corporate Governance Guidelines, Code of Business Conduct, Code of Ethics for Principal Executive and Senior Financial Officers and the charters of the audit and compensation committees of its Board of Directors on the Company’s website in the “Policies and Procedures” section. The Company’s SEC filings and governance documents are available in print to
5
any stockholder that makes a written request to: Investor Relations, U.S. Global Investors, Inc., 7900 Callaghan Road, San Antonio, Texas 78229.
The Company files reports electronically with the SEC via the SEC’s Electronic Data Gathering, Analysis and Retrieval system (“EDGAR”), which may be accessed through the Internet. The SEC maintains an Internet site that contains reports, proxy and information statements and other information regarding issuers that file electronically with the SEC, at www.sec.gov.
The public may read and copy any materials filed by the Company with the SEC at the SEC’s Public Reference Room at 100 F Street, N.E., Washington, D.C. 20549. The public may obtain information on the operation of the Public Reference Room by calling the SEC at 1-800-SEC-0330. The SEC also maintains a website at www.sec.gov that contains reports, proxy and information statements, and other information regarding issuers that file electronically with the SEC.
Investors and others should note that we announce material financial information to our investors using the website, SEC filings, press releases, public conference calls and webcasts. We also use social media to communicate with our customers and the public about our company. It is possible that the information we post on social media could be deemed to be material information. Therefore, we encourage investors, the media, and others interested in our company to review the information we post on social media channels listed below. This list may be updated from time to time.
https://www.facebook.com/USFunds
https://twitter.com/USFunds
https://twitter.com/USGlobalETFs
Information contained on our website or on social media channels is not deemed part of this report.
6
The Company faces a variety of significant and diverse risks, many of which are inherent in the business. Described below are certain risks that could materially affect the Company. Other risks and uncertainties that the Company does not presently consider to be material, or of which the Company is not presently aware, may become important factors that affect it in the future. The occurrence of any of the risks discussed below could materially and adversely affect the business, prospects, financial condition, results of operations, or cash flow.
The investment management business is intensely competitive.
Competition in the investment management business is based on a variety of factors, including:
|
•
|
Investment performance;
|
|
•
|
Investor perception of an investment team’s drive, focus, and alignment of interest with them;
|
|
•
|
Quality of service provided to, and duration of relationships with, clients and shareholders;
|
|
•
|
Business reputation; and
|
|
•
|
Level of fees charged for services.
|
The Company competes with a large number of investment management firms, commercial banks, broker-dealers, insurance companies, and other financial institutions. Competitive risk is heightened by the fact that some competitors may invest according to different investment styles or in alternative asset classes which the markets may perceive as more attractive than the Company’s investment approach. If the Company is unable to compete effectively, revenues and earnings may be reduced and the business could be materially affected.
Poor investment performance could lead to a decline in revenues.
Success in the investment management industry is largely dependent on investment performance relative to market conditions and the performance of competing products. Good relative performance generally attracts additional assets under management, resulting in additional revenues. Conversely, poor performance generally results in decreased sales and increased redemptions with a corresponding decrease in revenues. Therefore, poor investment performance relative to the portfolio benchmarks and to competitors could impair the Company’s revenues and growth. The
equity funds within USGIF have a performance fee whereby the base advisory fee is adjusted upwards or downwards by
0.25 percent
if there is a performance difference of
5 percent
or more between a Fund’s performance and that of its designated benchmark index over the prior rolling
12
months.
The Company’s clients can terminate their agreements with the Company on short notice, which may lead to unexpected declines in revenue and profitability.
The Company’s investment advisory agreements are generally terminable on short notice and subject to annual renewal. If the Company’s investment advisory agreements are terminated, which may occur in a short time frame, the Company may experience a decline in revenues and profitability.
Difficult market conditions can adversely affect the Company by reducing the market value of the assets we manage or causing shareholders to make significant redemptions.
Changes in economic or market conditions may adversely affect the profitability, performance of and demand for the Company’s investment products and services. Under the Company’s advisory fee arrangements, the fees received are primarily based on the market value of assets under management. Accordingly, a decline in the price of securities held in the Funds would be expected to cause revenues and net income to decline, which would result in lower advisory fees, or cause increased shareholder redemptions in favor of investments they perceive as offering greater opportunity or lower risk, which redemptions would also result in lower advisory fees. The ability of the Company to compete and grow is dependent on the relative attractiveness of the types of investment products the Company offers and its investment performance and strategies under prevailing market conditions.
Market-specific risks may negatively impact the Company’s earnings.
The Company manages certain funds in the emerging market and natural resources sectors, which are highly cyclical. The investments in the Funds are subject to significant loss due to political, economic and diplomatic developments, currency fluctuations, social instability, and changes in governmental policies. Foreign trading markets, particularly in some emerging market countries, are often smaller, less liquid, less regulated and significantly more volatile than the U.S. and other established markets.
7
The market price and trading volume of the Company’s class A common stock may be volatile, which could result in rapid and substantial losses for the Company’s stockholders.
The market price of the Company’s class A common stock may be volatile and the trading volume may fluctuate, causing significant price variations to occur. If the market price of the Company’s class A common stock declines significantly, stockholders may be unable to sell their shares at or above their purchase price. The Company cannot assure that the market price of its class A common stock will not fluctuate or decline significantly in the future. Some of the factors that could negatively affect the price of the Company’s class A common stock, or result in fluctuations in price or trading volume, include:
|
•
|
Decreases in assets under management;
|
|
•
|
Variations in quarterly and annual operating results;
|
|
•
|
Publication of research reports about the Company or the investment management industry;
|
|
•
|
Departures of key personnel;
|
|
•
|
Adverse market reactions to any indebtedness the Company may incur, acquisitions or disposals the Company may make, or securities the Company may issue in the future;
|
|
•
|
Changes in market valuations of similar companies;
|
|
•
|
Changes or proposed changes in laws or regulations, or differing interpretations thereof, affecting the business, or enforcement of these laws and regulations, or announcements relating to these matters;
|
|
•
|
Adverse publicity about the asset management industry, generally, or individual scandals, specifically; and
|
|
•
|
General market and economic conditions.
|
The market price of the Company’s class A common stock could decline due to the large number of shares of the Company’s class C common stock eligible for future sale upon conversion to class A shares.
The market price of the Company’s class A common stock could decline as a result of sales of a large number of shares of class A common stock eligible for future sale upon the conversion of class C shares, or the perception that such sales could occur. These sales, or the possibility that these sales may occur, also might make it more difficult for the Company to raise additional capital by selling equity securities in the future, at a time and price the Company deems appropriate.
Failure to comply with government regulations could result in fines, which could cause the Company’s earnings and stock price to decline.
The Company and its subsidiaries are subject to a variety of federal securities laws and agencies, including, but not limited to, the Advisers Act, the Investment Company Act, the S-Ox Act, the Gramm-Leach-Bliley Act of 1999, the Bank Secrecy Act of 1970, as amended, the USA PATRIOT Act of 2001, the SEC, FINRA, and NASDAQ. Moreover, financial reporting requirements and the processes, controls, and procedures that have been put in place to address them, are comprehensive and complex. While management has focused attention and resources on compliance policies and procedures, non-compliance with applicable laws or regulations could result in fines, sanctions or censures which could affect the Company’s reputation, and thus its revenues and earnings.
Furthermore, Galileo is subject to the rules and regulations of the OSC, and failure of the company or the funds it advises to comply with the requirements of the OSC could have a material adverse affect on the company.
Our business is subject to substantial risk from litigation, regulatory investigations and potential securities laws liability.
Many aspects of U.S. Global’s business involve substantial risks of litigation, regulatory investigations and/or arbitration. The Company is exposed to liability under federal and state securities laws, other federal and state laws and court decisions, as well as rules and regulations promulgated by the SEC, FINRA and other regulatory bodies. U.S. Global, its subsidiaries, and/or officers could be named as parties in legal actions, regulatory investigations and proceedings. An adverse resolution of any lawsuit, legal or regulatory proceeding or claim against the Company could result in substantial costs or reputational harm to the Company, and have a material adverse effect on the Company’s business, financial condition or results of operations, which, in turn, may negatively affect the market price of the Company’s common stock and U.S. Global’s ability to pay dividends. In addition to these financial costs and risks, the defense of litigation or arbitration may divert resources and management’s attention from operations.
Galileo is also subject to risks of litigation, regulatory investigations and/or arbitration. Galileo is exposed to liability under provincial laws and court decisions, as well as rules and regulations promulgated by the OSC.
Higher insurance premiums and related insurance coverage risks could increase costs and reduce profitability.
While U.S. Global carries insurance in amounts and under terms that it believes are appropriate, the Company cannot assure that its insurance will cover most liabilities and losses to which it may be exposed, or that our insurance policies will continue to be available at acceptable terms and fees. U.S. Global is subject to regulatory and governmental inquiries and civil litigation. An adverse outcome of any such proceeding could involve substantial financial penalties. From time to time, various claims against us arise in the ordinary course of business, including employment-related claims. There has been increased incidence of litigation
8
and regulatory investigations in the financial services industry in recent years, including customer claims and class action suits alleging substantial monetary damages. Certain insurance coverage may not be available or may be prohibitively expensive in future periods. As U.S. Global’s insurance policies come up for renewal, the Company may need to assume higher deductibles or co-insurance liabilities, or pay higher premiums, which would increase the Company’s expenses and reduce net income.
Increased regulatory and legislative actions and reforms could increase costs and negatively impact the Company’s profitability and future financial results.
During the past decade, federal securities laws have been substantially augmented and made significantly more complex by the S-Ox Act and the USA PATRIOT Act of 2001. With new laws and changes in interpretations and enforcement of existing requirements, the associated time the Company must dedicate to, and related costs the Company must incur in, meeting the regulatory complexities of the business have increased. In order to comply with these new requirements, the Company has had to expend additional time and resources, including substantial efforts to conduct evaluations required to ensure compliance with the S-Ox Act.
The Company is subject to financial services laws, regulations, corporate governance requirements, administrative actions and policies. During 2009 and 2010, as many emergency government programs slowed or wound down, global regulatory and legislative focus generally moved to a second phase of broader reform and a restructuring of financial institution regulation. On July 21, 2010, President Obama signed into law the Dodd-Frank Wall Street Reform and Consumer Protection Act (
“
Dodd-Frank Act
”
), which fundamentally changed the U.S. financial regulatory landscape. The full scope of the regulatory changes imposed by the Dodd-Frank Act will only be determined once extensive rules and regulations have been proposed and become effective, which may result in significant changes in the manner in which the Company’s operations are regulated.
Further, adverse results of regulatory investigations of mutual fund, investment advisory, and financial services firms could tarnish the reputation of the financial services industry generally, and mutual funds and investment advisers more specifically, causing investors to avoid further fund investments or redeem their balances. Redemptions would decrease the Company’s assets under management, which would reduce its advisory revenues and net income.
The Company intends to pay regular dividends to its stockholders, but the ability to do so is subject to the discretion of the Board of Directors.
The Company intends to pay cash dividends on a monthly basis, but the Board of Directors, at its discretion, may decrease the level or frequency of dividends or discontinue payment of dividends entirely based on earnings, operations, capital requirements, general financial condition of the Company, and general business conditions.
One person beneficially owns substantially all of our voting stock and controls the outcome of all matters requiring a vote of stockholders, which may influence the value of our publicly traded non-voting stock.
Frank Holmes, CEO, is the beneficial owner of over 99 percent of the class C voting convertible common stock and controls the outcome of all issues requiring a vote of stockholders. All of our publicly traded stock is nonvoting stock. Consequently, except to the extent provided by law, stockholders other than Frank Holmes have no vote with respect to the election of directors or any other matter requiring a vote of stockholders. This lack of voting rights may adversely affect the market value of the publicly traded class A nonvoting common stock.
The loss of key personnel could negatively affect the Company’s financial performance.
The success of the Company depends on key personnel, including the portfolio managers, analysts, and executive officers. Competition for qualified, motivated, and skilled personnel in the asset management industry remains significant. As the business grows, the Company will likely need to increase the number of employees. Moreover, in order to retain certain key personnel, the Company may be required to increase compensation to such individuals, resulting in additional expense. The loss of key personnel or the Company’s failure to attract replacement personnel could negatively affect its financial performance.
The Company could be subject to losses if it fails to properly safeguard sensitive and confidential information.
As part of the Company’s normal operations, it maintains and transmits confidential information about the Company and the Funds’ clients as well as proprietary information relating to its business operations. These systems could be victimized by unauthorized users or corrupted by computer viruses or other malicious software code, or authorized persons could inadvertently or intentionally release confidential or proprietary information. Such a breach could subject the Company to liability for a failure to safeguard client data, result in the termination of relationships with our existing customers, require significant capital and operating expenditures to investigate and remediate the breach and subject the Company to regulatory action.
9
We rely upon certain critical information systems for the operation of our business, and the failure of any critical information system, including a cyber-security breach, may result in harm to our business.
We are heavily dependent on technology infrastructure and rely upon certain critical information systems for the effective operation of our business. These information systems include data network and telecommunications, internet access and our websites, and various computer hardware equipment and software applications. These information systems are subject to damage or interruption from a number of potential sources including natural disasters, software viruses or other malware, power failures, cyber-attacks and other events to the extent that these information systems are under our control. We have implemented measures, such as virus protection software, intrusion detection systems and emergency recovery processes to address the outlined risks. However, security measures for information systems cannot be guaranteed to be failsafe. Any compromise of our data security or our inability to use or access these information systems at critical points in time could unfavorably impact the timely and efficient operation of our business and subject us to additional costs and liabilities, which could adversely affect our results of operations. Finally, federal legislation relating to cyber-security threats could impose additional requirements on our operations.
10
None
The Company presently owns and occupies an office building as its headquarters in San Antonio, Texas. The office building is approximately 46,000 square feet on approximately 2.5 acres of land. Galileo leases office space in Toronto, Canada.
There are no material legal proceedings in which the Company is involved.
Not applicable.
11
|
|
|
|
Market Information
|
||||
U.S. Global Investors, Inc. (“U.S. Global” or the “Company”) has three classes of common equity: class A, class B, and class C common stock, par value $0.025 per share.
The Company’s class A common stock is traded over-the-counter and is quoted daily under NASDAQ’s Capital Markets. Trades are reported under the symbol “GROW.”
There is no established public trading market for the Company’s class B and class C common stock.
The Company’s class A and class B common stock have no voting privileges.
The following table sets forth the range of high and low sales prices of “GROW” from NASDAQ for the fiscal years ended
June 30, 2015
, and
June 30, 2014
. The quotations represent prices between dealers and do not include any retail markup, markdown, or commission.
|
|
Sales Price
|
|||||||||||
|
|
2015
|
2014
|
||||||||||
|
|
High ($)
|
Low ($)
|
High ($)
|
Low ($)
|
||||||||
|
First quarter (9/30)
|
4.00
|
|
3.26
|
|
3.40
|
|
2.10
|
|
||||
|
Second quarter (12/31)
|
3.60
|
|
2.57
|
|
2.93
|
|
2.37
|
|
||||
|
Third quarter (3/31)
|
3.51
|
|
2.74
|
|
4.05
|
|
2.45
|
|
||||
|
Fourth quarter (6/30)
|
3.40
|
|
2.72
|
|
3.80
|
|
3.20
|
|
||||
|
Holders
|
||||
On
September 4, 2015
, there were approximately
159
holders of record of class A common stock,
no
holders of record of class B common stock, and
34
holders of record of class C common stock.
|
Dividends
|
||||
The Company has paid $0.005 per share per month in fiscal year
2015
and
2014
. A monthly dividend of
$0.005
has been authorized from
July
2015
through
September
2015
and a monthly dividend of
$0.0025
has been authorized from
October
2015
through
December
2015
, and will be reviewed by the Board quarterly. Payment of cash dividends is within the discretion of the Company’s Board of Directors and is dependent on earnings, operations, capital requirements, general financial condition of the Company, and general business conditions.
|
Securities authorized for issuance under equity compensation plans
|
||||
Information relating to equity compensation plans under which our stock is authorized for issuance is set forth in Item 12 of Part III of this Form 10-K under the heading “Equity Compensation Plan Information.”
12
|
Purchases of equity securities by the issuer
|
||||
Effective January 1, 2013, the Board of Directors approved a share repurchase program authorizing the Company to purchase up to $2.75 million of its outstanding class A common shares as market and business conditions warrant on the open market in compliance with Rule 10b-18 of the Securities Exchange Act of 1934. On
December 12, 2013
, and
December 10, 2014
, the Board of Directors renewed the share repurchase program for up to
$2.75 million
of its outstanding class A common stock through calendar year
2015
.
For the quarter ended
June 30, 2015
, the Company had purchased a total of
9,001
class A shares using cash of
$25,000
. The Company may repurchase class A stock from employees; however, none were repurchased from employees during the quarter ended
June 30, 2015
. The Company did not repurchase any classes B or C common stock during the quarter ended
June 30, 2015
.
|
(dollars in thousands, except price data)
|
|||||||||||||||||
|
Period
|
Total Number of
Shares
Purchased 1 |
Total
Amount
Purchased
|
Average
Price Paid
Per Share
2
|
Total Number of
Shares Purchased
as Part of
Publicly
Announced Plan
3
|
Approximate Dollar
Value of Shares that
May Yet Be Purchased
Under the Plan
|
||||||||||||
|
04-01-15 to 04-30-15
|
—
|
|
—
|
|
n/a
|
|
—
|
|
2,689
|
|
|||||||
|
05-01-15 to 05-31-15
|
400
|
|
1
|
|
2.83
|
|
400
|
|
2,688
|
|
|||||||
|
06-01-15 to 06-30-15
|
8,601
|
|
24
|
|
2.82
|
|
8,601
|
|
2,664
|
|
|||||||
|
Total
|
9,001
|
|
$
|
25
|
|
$
|
2.82
|
|
9,001
|
|
|||||||
|
1.
|
The Board of Directors of the Company approved on December 7, 2012, and renewed on
December 12, 2013
, and
December 10, 2014
, a repurchase of up to $2.75 million in each of calendar years 2013, 2014, and 2015, respectively, of its outstanding class A common stock from time to time on the open market in accordance with all applicable rules and regulations.
|
|
2.
|
The average price paid per share of stock repurchased under the stock repurchase program includes the commissions paid to brokers.
|
|
3.
|
The repurchase plan was approved on December 7, 2012, renewed on
December 12, 2013
, and
December 10, 2014
, and will continue through calendar year
2015
. The total dollar amount of shares that may be repurchased in
2015
under the renewed program is
$2.75 million
.
|
13
|
Company Performance Presentation
|
||||
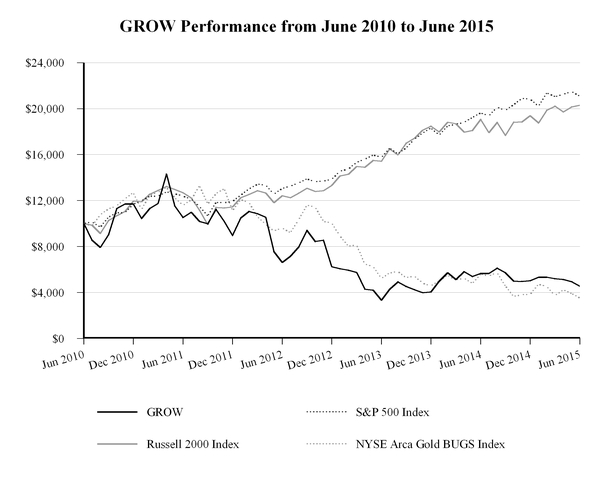
The following graph compares the cumulative total return for the Company’s class A common stock (GROW) to the cumulative total return for the S&P 500 Index, the Russell 2000 Index, and the NYSE Arca Gold BUGS Index for the Company’s last five fiscal years. The graph assumes an investment of $10,000 in the class A common stock and in each index as of
June 30, 2010
, and that all dividends are reinvested. The historical information included in this graph is not necessarily indicative of future performance and the Company does not make or endorse any predictions as to future stock performance.
|
|
Fiscal Year-End Date
|
|||||||||||||||||||||||
|
2010
|
2011
|
2012
|
2013
|
2014
|
2015
|
|||||||||||||||||||
|
U.S. Global Investors, Inc. class A (GROW)
|
$
|
10,000
|
|
$
|
10,529
|
|
$
|
6,622
|
|
$
|
3,323
|
|
$
|
5,655
|
|
$
|
4,550
|
|
||||||
|
S&P 500 Index
|
$
|
10,000
|
|
$
|
12,385
|
|
$
|
13,060
|
|
$
|
15,750
|
|
$
|
19,626
|
|
$
|
21,082
|
|
||||||
|
Russell 2000 Index
|
$
|
10,000
|
|
$
|
12,676
|
|
$
|
12,413
|
|
$
|
15,417
|
|
$
|
19,062
|
|
$
|
20,298
|
|
||||||
|
NYSE Arca Gold BUGS Index
|
$
|
10,000
|
|
$
|
11,579
|
|
$
|
9,620
|
|
$
|
5,219
|
|
$
|
5,592
|
|
$
|
3,525
|
|
||||||
14
The following selected financial data is qualified by reference to, and should be read in conjunction with, the Company’s Consolidated Financial Statements and related notes and Management’s Discussion and Analysis of Financial Condition and Results of Operations of this Annual Report in Form 10-K. The selected financial data as of
June 30, 2011
, through
June 30, 2015
, and the years then ended, is derived from the Company’s audited Consolidated Financial Statements.
The Company’s Board of Directors formally agreed on August 23, 2013, to exit the transfer agency business so that the Company could focus more on its core strength of investment management. USSI served as transfer agent until conversion to the new transfer agent on December 9, 2013. The transfer agency results, together with expenses associated with discontinuing transfer agency operations, are reflected as discontinued operations in the Consolidated Statement of Operations and are, therefore, excluded from continuing operations results.
|
(dollars in thousands, except operating data and per share data)
|
|
Year Ended June 30,
|
||||||||||||||||||
|
Selected Financial Data
|
|
2015
|
2014
|
2013
|
2012
|
2011
|
||||||||||||||
|
Operating revenues
|
|
$
|
9,371
|
|
$
|
11,439
|
|
$
|
17,318
|
|
$
|
22,374
|
|
$
|
39,118
|
|
||||
|
Operating expenses
|
|
12,959
|
|
14,841
|
|
17,509
|
|
19,535
|
|
27,890
|
|
|||||||||
|
Operating income (loss)
|
|
(3,588
|
)
|
(3,402
|
)
|
(191
|
)
|
2,839
|
|
11,228
|
|
|||||||||
|
Other income (loss)
|
|
434
|
|
2,165
|
|
262
|
|
(177
|
)
|
1,008
|
|
|||||||||
|
Income (loss) from continuing operations before income taxes
|
|
(3,154
|
)
|
(1,237
|
)
|
71
|
|
2,662
|
|
12,236
|
|
|||||||||
|
Income tax expense (benefit)
|
|
822
|
|
(517
|
)
|
100
|
|
1,024
|
|
4,268
|
|
|||||||||
|
Income (loss) from continuing operations
|
(3,976
|
)
|
(720
|
)
|
(29
|
)
|
1,638
|
|
7,968
|
|
||||||||||
|
Loss from discontinued operations
|
—
|
|
(243
|
)
|
(165
|
)
|
(108
|
)
|
(136
|
)
|
||||||||||
|
Net income (loss)
|
|
(3,976
|
)
|
(963
|
)
|
(194
|
)
|
1,530
|
|
7,832
|
|
|||||||||
|
Less net income attributable to non-controlling interest
|
54
|
|
7
|
|
—
|
|
—
|
|
—
|
|
||||||||||
|
Net income (loss) attributable to U.S. Global Investors, Inc.
|
$
|
(4,030
|
)
|
$
|
(970
|
)
|
$
|
(194
|
)
|
$
|
1,530
|
|
$
|
7,832
|
|
|||||
|
Earnings Per Share Attributable to U.S. Global Investors, Inc. - Basic
|
||||||||||||||||||||
|
Income (loss) from continuing operations
|
$
|
(0.26
|
)
|
$
|
(0.04
|
)
|
$
|
0.00
|
|
$
|
0.11
|
|
$
|
0.52
|
|
|||||
|
Loss from discontinued operations
|
0.00
|
|
(0.02
|
)
|
(0.01
|
)
|
(0.01
|
)
|
(0.01
|
)
|
||||||||||
|
Net income (loss) attributable to U.S. Global Investors, Inc.
|
|
$
|
(0.26
|
)
|
$
|
(0.06
|
)
|
$
|
(0.01
|
)
|
$
|
0.10
|
|
$
|
0.51
|
|
||||
|
Dividends per common share
|
$
|
0.06
|
|
$
|
0.06
|
|
$
|
0.17
|
|
$
|
0.24
|
|
$
|
0.24
|
|
|||||
|
Balance Sheet
|
||||||||||||||||||||
|
Working capital
|
|
$
|
19,767
|
|
$
|
24,673
|
|
$
|
22,958
|
|
$
|
25,711
|
|
$
|
32,366
|
|
||||
|
Total assets
|
|
30,770
|
|
37,846
|
|
38,683
|
|
41,756
|
|
45,967
|
|
|||||||||
|
Total U.S. Global Investors, Inc. Shareholders’ Equity
|
|
28,569
|
|
35,070
|
|
36,849
|
|
38,710
|
|
41,057
|
|
|||||||||
|
Cash Flow
|
||||||||||||||||||||
|
Net cash provided by (used in) operating activities
|
|
$
|
(672
|
)
|
$
|
(15,189
|
)
|
$
|
461
|
|
$
|
1,817
|
|
$
|
7,719
|
|
||||
|
Net cash provided by (used in) investing activities
|
|
(390
|
)
|
4,050
|
|
(368
|
)
|
(4,894
|
)
|
(846
|
)
|
|||||||||
|
Net cash used in financing activities
|
|
(1,122
|
)
|
(1,061
|
)
|
(2,621
|
)
|
(3,518
|
)
|
(3,503
|
)
|
|||||||||
|
Operating Data (in millions)
|
||||||||||||||||||||
|
Average assets under management
|
|
$
|
931
|
|
$
|
1,078
|
|
$
|
1,552
|
|
$
|
2,055
|
|
$
|
2,819
|
|
||||
15
This discussion reviews and analyzes the consolidated results of operations of U.S. Global Investors, Inc. and its subsidiaries (collectively, “U.S. Global” or the “Company”) for the past three fiscal years and other factors that may affect future financial performance. This discussion should be read in conjunction with the Consolidated Financial Statements, Notes to the Consolidated Financial Statements and Selected Financial Data of this Annual Report in Form 10-K.
Recent Trends in Financial Markets
During the fiscal year ended June 30, 2015, global markets faced a number of challenges, including Russia’s invasion of Ukraine, the Greek debt crisis, falling commodity prices, tepid manufacturing activity and an economic slowdown in China, the world’s second-largest economy. In March 2015, the European Central Bank (“ECB”) initiated a long-awaited quantitative easing (“QE”) program, after Japan began its own in 2013.
The Federal Reserve (“Fed”) completed its QE program in October 2014 with the belief that the economy had improved enough since the recession to weather a reduction of the monetary stimulus. However, this coincided with a peak in U.S. industrial production. Months of speculation as to when the Fed might begin the process of normalizing interest rates spooked some investors, even as dividends from S&P 500 Index companies jumped 15 percent in the first quarter of 2015 and stock buyback programs were expected to reach an all-time high of $1.2 trillion by the end of the year.
Gold prices have fallen from their peak in September 2011 when real interest rates were a negative three percent for a 10-year U.S. Treasury, versus a positive two percent at the end of June 2015. The fear of rising real interest rates, inflation minus the consumer price index (“CPI”), also put pressure on the price of gold, as the metal, which doesn’t pay a dividend, becomes less attractive to some investors when real rates are higher. Also putting pressure on gold and other commodities was the strong U.S. dollar, which began to rise in July 2014 on improved economic and employment trends. The dollar hit a high of 100 in March 2015 against a basket of currencies, its highest level since April 2003. There is a strong inverse relationship between the dollar and commodity prices.
During this period, the gold bear market was extended to four years, the second-longest such market in 40 years, with some investors wondering if the yellow metal had lost its “safe haven” status. In the past, gold prices have often responded positively to financial and economic crises, but they budged little in response to the Shanghai stock market crash in June 2015 or to Greece and Puerto Rico’s ongoing debt troubles. Despite losing 1.7 percent, the yellow metal was the second-best-performing global currency in 2014, following the U.S. dollar.
The U.S. leads the world in technology, including fracking, which greatly expands U.S. production to become a global leader again. The success of American ingenuity has both positive and negative consequences. It’s great for consumers at the gas pump as well as airlines but bad for drillers and producers.
Starting in July 2014, the price of crude oil fell dramatically as the shale revolution and unconventional extraction methods, including fracking, allowed American producers to increase output and saturate the marketplace with crude. Meanwhile, member of the Organization of the Petroleum Exporting Countries (“OPEC”) agreed in November 2014 to maintain the production level of 30 million barrels per day, in the interest of “restoring market equilibrium.” While low oil prices have been a detriment to net exporting countries such as Russia and Venezuela, they have been a boon to net importing countries, specifically in Asia: China, India, Thailand and others. Industries and sectors that benefited from the oil slump included transportation, travel and leisure and automobile manufacturing.
Mutual funds in general continued to see outflows as mutual funds were relatively out of favor compared to other investment alternatives, including exchange-traded funds (“ETFs”), whose asset flows increased during the period.
Assets under management (“AUM”) declined during the period along with falling emerging markets and resources. To manage expenses, the Company maintains a flexible structure for one of its largest costs, compensation expense, by setting relatively lower base salaries with bonuses that are tied to average AUM and fund performance. Thus, our expense model somewhat expands and contracts with asset swings and performance.
16
|
Business Segments
|
||||
The Company, with principal operations located in San Antonio, Texas, manages three business segments:
|
1.
|
Investment Management Services
, through which the Company offers, through U.S. Global Investors Funds (“USGIF” or the “Fund(s)”), offshore clients and an exchange traded fund (“ETF”), a range of investment management products and services to meet the needs of individual and institutional investors;
|
|
2.
|
Investment Management Services - Canada
, through which, as of June 1, 2014, the Company owns a
65%
controlling interest in Galileo Global Equity Advisors Inc. (“Galileo”), a privately held Toronto-based asset management firm which offers investment management products and services in Canada; and
|
|
3.
|
Corporate Investments
, through which the Company invests for its own account in an effort to add growth and value to its cash position. Although the Company generates the majority of its revenues from its investment advisory segments, the Company holds a significant amount of its total assets in investments.
|
|
Assets Under Management (
“
AUM
”
)
|
||||||||||
|
(dollars in thousands)
|
June 30, 2015
|
June 30, 2014
|
||||||||
|
Investment Management Services
|
USGIF
|
$
|
590,826
|
|
$
|
945,928
|
|
|||
|
U.S Global Jets ETF
|
39,200
|
|
—
|
|
||||||
|
Offshore Advisory Clients
|
11,527
|
|
20,012
|
|
||||||
|
Total AUM
|
641,553
|
|
965,940
|
|
||||||
|
Investment Management Services - Canada
|
||||||||||
|
Canadian Funds
|
67,571
|
|
127,053
|
|
||||||
|
Other Advisory Clients
|
83,147
|
|
140,157
|
|
||||||
|
Total AUM
|
150,718
|
|
267,210
|
|
||||||
|
Total AUM
|
$
|
792,271
|
|
$
|
1,233,150
|
|
||||
On
June 30, 2015
, total assets under management as of period end were
$792 million
versus
$1.23 billion
on
June 30, 2014
, a decrease of
36 percent
. The decrease was primarily due to market depreciation and redemptions in USGIF, offshore funds and Galileo funds, somewhat offset by the addition of the ETF.
During fiscal year
2015
, average assets under management were
$931 million
versus
$1.08 billion
in fiscal year
2014
, a decrease of
14 percent
. The decrease was primarily due to net shareholder redemptions and market depreciation.
The following is a brief discussion of the Company’s three business segments.
Investment Management Services
In fiscal year
2015
, the Company generated substantially all of its operating revenues from managing and servicing the Funds and offshore advisory clients. These revenues are largely dependent on the total value and composition of assets under its management. Fluctuations in the markets and investor sentiment directly impact the Funds’ asset levels, thereby affecting income and results of operations.
Detailed information regarding the funds managed by the Company within USGIF can be found on the Company’s website, www.usfunds.com, including performance information for each fund for various time periods, assets under management as of the most recent month end, and inception date of each fund.
The mutual fund shareholders in USGIF are not required to give advance notice prior to redemption of shares in the funds; however, the USGIF equity funds charge a redemption fee if the Fund shares have been held for less than the applicable periods of time set forth in the Funds’ prospectuses. The fixed income funds charge no redemption fee. Detailed information about redemption fees can be found in the Funds’ prospectus, which is available on the Company’s website, www.usfunds.com.
Beginning in April 2015, the Company provides advisory services for an ETF and receives monthly advisory fees, based on the net asset values of the fund. In fiscal year
2015
, the Company recorded advisory fees from the ETF client totaling
$26,000
. Information on the ETF can be found at www.usglobaletfs.com, including the prospectus, performance and holdings.
17
The Company provides advisory services for two offshore clients (a third offshore fund liquidated in November 2013) and receives monthly advisory fees, based on the net asset values of the clients and performance fees based on the overall increase in net asset values, if any. In fiscal year
2015
, the Company recorded advisory and performance fees from the offshore clients totaling
$130,000
and
$0
, respectively, and
$190,000
and
$4,000
, respectively, in fiscal year
2014
. The performance fees for these clients are calculated and recorded in accordance with the terms of the advisory agreements. These fees may fluctuate significantly from year to year based on factors that may be out of the Company’s control. Frank Holmes, CEO, serves as a director of the two offshore clients.
The following tables summarize the changes in assets under management for USGIF for fiscal years
2015
,
2014
and
2013
:
|
|
2015
|
|||||||||||
|
(dollars in thousands)
|
Equity
|
Fixed Income
|
Total
|
|||||||||
|
Beginning Balance
|
$
|
815,368
|
|
$
|
130,560
|
|
$
|
945,928
|
|
|||
|
Market appreciation/(depreciation)
|
(256,504
|
)
|
761
|
|
(255,743
|
)
|
||||||
|
Dividends and distributions
|
(10,590
|
)
|
(1,666
|
)
|
(12,256
|
)
|
||||||
|
Net shareholder purchases/(redemptions)
|
(106,031
|
)
|
18,928
|
|
(87,103
|
)
|
||||||
|
Ending Balance
|
$
|
442,243
|
|
$
|
148,583
|
|
$
|
590,826
|
|
|||
|
Average investment management fee
|
0.95
|
%
|
—
|
%
|
0.76
|
%
|
||||||
|
Average net assets
|
$
|
581,188
|
|
$
|
146,027
|
|
$
|
727,215
|
|
|||
|
|
2014
|
|||||||||||
|
(dollars in thousands)
|
Equity
|
Money Market
and
Fixed Income
|
Total
|
|||||||||
|
Beginning Balance
|
$
|
857,302
|
|
$
|
283,144
|
|
$
|
1,140,446
|
|
|||
|
Market appreciation
|
132,774
|
|
2,806
|
|
135,580
|
|
||||||
|
Dividends and distributions
|
(20,287
|
)
|
(1,695
|
)
|
(21,982
|
)
|
||||||
|
Net shareholder redemptions
|
(154,421
|
)
|
(153,695
|
)
|
(308,116
|
)
|
||||||
|
Ending Balance
|
$
|
815,368
|
|
$
|
130,560
|
|
$
|
945,928
|
|
|||
|
Average investment management fee
|
0.97
|
%
|
—
|
%
|
0.79
|
%
|
||||||
|
Average net assets
|
$
|
841,492
|
|
$
|
195,050
|
|
$
|
1,036,542
|
|
|||
|
|
2013
|
|||||||||||
|
(dollars in thousands)
|
Equity
|
Money Market
and
Fixed Income
|
Total
|
|||||||||
|
Beginning Balance
|
$
|
1,289,160
|
|
$
|
302,770
|
|
$
|
1,591,930
|
|
|||
|
Market depreciation
|
(146,115
|
)
|
(87
|
)
|
(146,202
|
)
|
||||||
|
Dividends and distributions
|
(14,981
|
)
|
(1,675
|
)
|
(16,656
|
)
|
||||||
|
Net shareholder redemptions
|
(270,762
|
)
|
(17,864
|
)
|
(288,626
|
)
|
||||||
|
Ending Balance
|
$
|
857,302
|
|
$
|
283,144
|
|
$
|
1,140,446
|
|
|||
|
Average investment management fee
|
0.98
|
%
|
—
|
%
|
0.79
|
%
|
||||||
|
Average net assets
|
$
|
1,229,373
|
|
$
|
293,027
|
|
$
|
1,522,400
|
|
|||
As shown above, both average and period-end assets under management decreased in fiscal year
2015
compared to fiscal year
2014
and in fiscal year
2014
compared to fiscal year
2013
. The decrease in assets under management in fiscal year
2015
was driven by market depreciation and redemptions, primarily in the natural resources funds, and redemptions in the international equity funds. The decrease in assets under management in fiscal year
2014
was driven by redemptions, primarily in the money market and natural resources funds, offset by market appreciation, primarily in the natural resources funds. In fiscal 2014, the Company liquidated one of its money market funds and converted the other money market fund to an ultra-short bond fund, which contributed to the redemptions in these funds.
A significant portion of the dividends and distributions shown above are reinvested and included in net shareholder purchases/(redemptions).
The average annualized investment management fee rate (total advisory fees, excluding performance fees, as a percentage of average assets under management) was
76
basis points fiscal year
2015
, and
79
basis points in fiscal year
2014
and fiscal year
2013
. The average investment management fee for equity funds in fiscal year
2015
,
2014
, and
2013
was
95
,
97
and
98
basis points,
18
respectively. The average investment management fee for the money market and fixed income funds was nil or close to nil for fiscal years
2015
,
2014
, and
2013
. This is due to voluntary fee waivers on these funds as discussed in Note 6 Investment Management and Other Fees of the Consolidated Financial Statements of this Annual Report in Form 10-K.
Investment Management Services - Canada
Effective
March 31, 2013
, the Company, through its wholly-owned subsidiary, U.S. Global Investors (Canada) Limited (“USCAN”), purchased
50 percent
of the issued and outstanding shares of Galileo Global Equity Advisors Inc. (“Galileo”), a privately held Toronto-based asset management firm, for
$600,000
cash.
Effective
June 1, 2014
, the Company, through USCAN, completed its purchase of an additional
15 percent
interest in Galileo from the company’s founder, Michael Waring, for
$180,000
cash. This strategic investment brings USCAN’s ownership to
65 percent
of the issued and outstanding shares of Galileo, which represents controlling interest of Galileo. Through Galileo, the Company expects to increase its presence in Canada. The non-controlling interest in this subsidiary is included in “non-controlling interest in subsidiaries” in the equity section of the Consolidated Balance Sheets. Frank Holmes, CEO, and Susan McGee, President and General Counsel, serve as directors of Galileo.
Corporate Investments
Management believes it can more effectively manage the Company’s cash position by maintaining certain types of investments utilized in cash management and continues to believe that such activities are in the best interest of the Company.
The following summarizes the market value, cost, and unrealized gain or loss on investments recorded at fair value as of
June 30, 2015
, and
June 30, 2014
.
|
Securities
|
Market Value
|
Cost
|
Unrealized Gain
(Loss)
|
Unrealized gains on
available-for-sale
securities, net of tax
|
||||||||||||
|
(dollars in thousands)
|
||||||||||||||||
|
Trading
1
|
$
|
15,640
|
|
$
|
16,491
|
|
$
|
(851
|
)
|
N/A
|
|
|||||
|
Available-for-sale
2
|
4,263
|
|
4,602
|
|
(339
|
)
|
$
|
(339
|
)
|
|||||||
|
Total at June 30, 2015
|
$
|
19,903
|
|
$
|
21,093
|
|
$
|
(1,190
|
)
|
|||||||
|
Trading
1
|
$
|
17,817
|
|
$
|
18,067
|
|
$
|
(250
|
)
|
N/A
|
|
|||||
|
Available-for-sale
2
|
6,196
|
|
4,851
|
|
1,345
|
|
$
|
888
|
|
|||||||
|
Total at June 30, 2014
|
$
|
24,013
|
|
$
|
22,918
|
|
$
|
1,095
|
|
|||||||
|
1.
|
Unrealized and realized gains and losses on trading securities are included in earnings in the Consolidated Statements of Operations.
|
|
2.
|
Unrealized gains and losses on available-for-sale securities are excluded from earnings and recorded in other comprehensive income (loss) as a separate component of shareholders’ equity until realized.
|
In addition, as of
June 30, 2015
, and
2014
the Company held approximately
$2.3 million
and
$1.4 million
, respectively, in other investments held at cost.
As of
June 30, 2015
, and
2014
, the Company held approximately
$5.1 million
and
$6.1 million
, respectively, in investments other than the clients the Company advises. Investments in securities classified as trading are reflected as current assets on the Consolidated Balance Sheets at their fair market value. Unrealized gains and losses on trading securities are included in earnings in the Consolidated Statements of Operations. Investments in securities classified as available for sale, which may not be readily marketable, are reflected as non-current assets on the Consolidated Balance Sheets at their fair value. Unrealized gains and losses on available-for-sale securities are excluded from earnings and reported in other comprehensive income (loss) as a separate component of shareholders’ equity until realized.
Investment income (loss) from the Company’s investments includes:
|
•
|
realized gains and losses on sales of securities;
|
|
•
|
unrealized gains and losses on trading securities;
|
|
•
|
realized foreign currency gains and losses;
|
|
•
|
other-than-temporary impairments on available-for-sale securities; and
|
|
•
|
dividend and interest income.
|
19
Investment income can be volatile and may vary depending on market fluctuations, the Company’s ability to participate in investment opportunities, and timing of transactions. A significant portion of the unrealized gains and losses is concentrated in a small number of issuers. For fiscal years
2015
,
2014
, and
2013
, the Company had net recognized gains (losses) on sales or other-than-temporary impairment of securities of
$313,000
;
$878,000
; and
$(26,000)
; respectively. Due to market volatility, the Company expects that gains or losses will continue to fluctuate in the future.
|
Consolidated Results of Operations
|
||||
The following is a discussion of the consolidated results of operations of the Company and a detailed discussion of the Company’s revenues and expenses.
|
|
Year Ended June 30,
|
|||||||||||
|
(dollars in thousands, except per share data)
|
2015
|
2014
|
2013
|
|||||||||
|
Net income (loss)
|
||||||||||||
|
Loss from continuing operations
|
$
|
(3,976
|
)
|
$
|
(720
|
)
|
$
|
(29
|
)
|
|||
|
Less: Income attributable to non-controlling interest in subsidiary
|
54
|
|
7
|
|
—
|
|
||||||
|
Loss from continuing operations attributable to U.S. Global Investors, Inc.
|
(4,030
|
)
|
(727
|
)
|
(29
|
)
|
||||||
|
Loss from discontinued operations attributable to U.S. Global Investors, Inc.
|
—
|
|
(243
|
)
|
(165
|
)
|
||||||
|
Net loss attributable to U.S. Global Investors, Inc.
|
$
|
(4,030
|
)
|
$
|
(970
|
)
|
$
|
(194
|
)
|
|||
|
Weighted average number of outstanding shares
|
||||||||||||
|
Basic
|
15,399,831
|
|
15,459,022
|
|
15,482,612
|
|
||||||
|
Effect of dilutive securities
|
||||||||||||
|
Employee stock options
|
—
|
|
—
|
|
—
|
|
||||||
|
Diluted
|
15,399,831
|
|
15,459,022
|
|
15,482,612
|
|
||||||
|
Earnings (loss) per share attributable to U.S. Global Investors, Inc.
|
||||||||||||
|
Basic
|
||||||||||||
|
Loss from continuing operations
|
$
|
(0.26
|
)
|
$
|
(0.04
|
)
|
$
|
0.00
|
|
|||
|
Loss from discontinued operations
|
0.00
|
|
(0.02
|
)
|
(0.01
|
)
|
||||||
|
Net loss attributable to U.S. Global Investors, Inc.
|
$
|
(0.26
|
)
|
$
|
(0.06
|
)
|
$
|
(0.01
|
)
|
|||
|
Diluted
|
||||||||||||
|
Loss from continuing operations
|
$
|
(0.26
|
)
|
$
|
(0.04
|
)
|
$
|
0.00
|
|
|||
|
Loss from discontinued operations
|
0.00
|
|
(0.02
|
)
|
(0.01
|
)
|
||||||
|
Net loss attributable to U.S. Global Investors, Inc.
|
$
|
(0.26
|
)
|
$
|
(0.06
|
)
|
$
|
(0.01
|
)
|
|||
20
Year Ended
June 30, 2015
Compared with Year Ended
June 30, 2014
The Company posted a net loss attributable to U.S. Global Investors, Inc. of
$4,030,000
(
$0.26
loss per share) for the year ended
June 30, 2015
, compared with a net loss attributable to U.S. Global Investors, Inc. of
$970,000
(
$0.06
loss per share) for the year ended
June 30, 2014
. This decrease in profitability is primarily attributable to the following factors:
Operating Revenues
Total consolidated operating revenues for the year ended
June 30, 2015
, decreased
$2.1 million
, or
18.1 percent
, compared with the year ended
June 30, 2014
. This decrease was primarily attributable to the following:
|
•
|
Advisory fees decreased by
$1.1 million
, or
13.9 percent
as the result of lower assets under management and increased performance fee adjustments. Investment advisory fees are comprised of two components: a base management fee and a performance fee. The performance fee is a fulcrum fee that is adjusted upwards or downwards by
0.25 percent
when there is a performance difference of
5 percent
or more between a fund’s performance and that of its designated benchmark index over the prior rolling
12
months.
|
|
◦
|
Base management fees
decreased
approximately
$893,000
primarily as a result of lower USGIF assets under management due to market depreciation in the natural resources funds and shareholder redemptions in the natural resources and international equity funds. Included in the net
$893,000
decrease was an increase in Canadian-based advisory fees of
$1.8 million
due to consolidating twelve months of Galileo revenue in fiscal year 2015 versus consolidating only one month in fiscal year 2014.
|
|
◦
|
Performance fee adjustments paid out in the current period
increased
$185,000
versus the corresponding period in the prior year.
|
|
•
|
Distribution fees
decreased
by
$566,000
, or
28.7 percent
, as a result of lower average net assets under management upon which these fees are based.
|
|
•
|
Shareholder services fees
decreased
by
$301,000
, or
32.3 percent
, as a result of a decline in net assets held through institutions.
|
|
•
|
Administrative services fees
decreased
by
$123,000
, or
15.9 percent
, as a result of lower average net assets under management upon which these fees are based.
|
Operating Expenses
Total consolidated operating expenses for the year ended
June 30, 2015
, decreased by
$1.9 million
, or
12.7 percent
, compared with the prior year and was primarily attributable to the following:
|
•
|
Employee compensation and benefits
decreased
by
$916,000
, or
13.5 percent
, primarily as a result of fewer employees and lower performance-based bonuses.
|
|
•
|
Platform fees
increased
by
$153,000
, or
8.0 percent
, due to consolidation of Galileo fees for twelve months in fiscal year 2015 versus one month in fiscal year 2014, but the increase in platform fees was somewhat offset by lower assets held through broker-dealer platforms.
|
|
•
|
Advertising
decreased
$204,000
, or
33.2 percent
, as a result of decreased marketing and sales costs.
|
|
•
|
General and administrative expenses
decreased
$986,000
, or
18.7 percent
, primarily due to higher fund reimbursements and fund restructuring costs in the prior year, but offset somewhat by the consolidation of twelve months of Galileo expenses in fiscal year 2015, versus one month of Galileo expenses in fiscal year 2014.
|
Other Income
Total consolidated other income for the year ended
June 30, 2015
,
decreased
$1.7 million
, or
80.0 percent
, compared with the year ended
June 30, 2014
. This decrease was primarily attributable to unrealized losses on trading securities in fiscal 2015 versus unrealized gains in fiscal 2014. The Company also recognized a gain in conjunction with the acquisition of Galileo and had more realized gains on sales of available-for-sale securities in fiscal 2014 versus fiscal 2015.
Discontinued Operations
There was no loss attributed to discontinued operation in the year ended June 30, 2015. Total loss, net of tax, on discontinued operations for the year ended
June 30, 2014
, was
$243,000
. This prior year loss reflects residual costs from winding down operations after the transfer agent transitioned to a third party in December 2013.
21
Year Ended
June 30, 2014
Compared with Year Ended
June 30, 2013
The Company posted a net loss attributable to U.S. Global Investors, Inc. of
$970,000
(
$0.06
loss per share) for the year ended
June 30, 2014
, compared with net loss attributable to U.S. Global Investors, Inc. of
$194,000
(
$0.01
loss per share) for the year ended
June 30, 2013
. This decrease in profitability is primarily attributable to the following factors:
Operating Revenues
Total consolidated operating revenues for the year ended
June 30, 2014
,
decreased
$5.9 million
, or
33.9 percent
, compared with the year ended
June 30, 2013
. This
decreased
was primarily attributable to the following:
|
•
|
Advisory fees
decreased
by
$4.4 million
, or
36.3 percent
as the result of lower assets under management and increased performance fees adjustment. Advisory fees are comprised of two components: a base management fee and a performance fee. The performance fee is a fulcrum fee that is adjusted upwards or downwards by
0.25 percent
when there is a performance difference of
5 percent
or more between a fund’s performance and that of its designated benchmark index over the prior rolling
12
months.
|
|
◦
|
Base management fees
decreased
$3.9 million as a result of lower assets under management due to market depreciation and shareholder redemptions in the natural resources and money markets funds.
|
|
◦
|
Performance fee adjustments paid out in the current period
increased
$682,000
versus the corresponding period in the prior year.
|
|
•
|
Distribution fees
decreased
by
$843,000
, or
29.9 percent
, as a result of lower average net assets under management upon which these fees are based.
|
|
•
|
Shareholder services fees
decreased
by
$452,000
, or
32.7 percent
, as a result of a decline in net assets held through institutions.
|
|
•
|
Administrative services fees
decreased
by
$155,000
, or
16.7 percent
, as a result of lower average net assets under management upon which these fees are based, offset by the fee change implemented in December 2013.
|
Operating Expenses
Total consolidated operating expenses for the year ended
June 30, 2014
,
decreased
by
$2.7 million
, or
15.2 percent
, compared with the prior year and was primarily attributable to the following:
|
•
|
Employee compensation and benefits
decreased
by
$1.5 million
, or
18.4 percent
, primarily as a result of lower performance-based bonuses and fewer employees.
|
|
•
|
Platform fees
decreased
by
$760,000
, or
28.5 percent
, primarily due to lower assets held through broker-dealer platforms.
|
|
•
|
Advertising decreased
$247,000
, or
28.7 percent
, as a result of decreased marketing and sales costs.
|
|
•
|
General and administrative expenses
decreased
$110,000
, or
2.0 percent
, representing a decrease of approximately $635,000 primarily due to lower fund and operation expenses offset by one-time costs of approximately $525,000, including legal and proxy filing and solicitation costs, related to strategic fund changes in the fall of 2013.
|
Other Income
Total consolidated other income for the year ended
June 30, 2014
,
increased
$1.9 million
, or
726.3 percent
, compared with the year ended
June 30, 2013
. This increase was primarily attributable to realized gains on sale of available-for-sale securities, unrealized gains on trading securities, increased dividend and interest income and gains recognized in conjunction with the acquisition of Galileo.
Discontinued Operations
Total loss, net of tax, on discontinued operations for the year ended
June 30, 2014
, increased by
$78,000
, or
47.3 percent
, from
$165,000
for fiscal year
2013
to
$243,000
for fiscal year
2014
. The prior year loss reflects a period in which the transfer agent was still in full operations while the current year reflects residual costs from winding down operations after the transfer agent transitioned to a third party in December 2013.
22
Operating Revenues and Other Income
|
(dollars in thousands)
|
2015
|
|
2014
|
|
%
Change
|
|
2014
|
|
2013
|
|
%
Change
|
|||||||||||
|
Investment advisory fees:
|
||||||||||||||||||||||
|
Natural resources funds
|
$
|
2,866
|
|
$
|
5,019
|
|
(42.9
|
)%
|
$
|
5,019
|
|
$
|
9,302
|
|
(46.0
|
)%
|
||||||
|
International equity funds
|
1,144
|
|
1,666
|
|
(31.3
|
)%
|
1,666
|
|
2,170
|
|
(23.2
|
)%
|
||||||||||
|
Domestic equity funds
|
509
|
|
640
|
|
(20.5
|
)%
|
640
|
|
399
|
|
60.4
|
%
|
||||||||||
|
Fixed income funds
|
—
|
|
7
|
|
(100.0
|
)%
|
7
|
|
—
|
|
N/A
|
|
||||||||||
|
Total investment advisory fees - USGIF
|
4,519
|
|
7,332
|
|
(38.4
|
)%
|
7,332
|
|
11,871
|
|
(38.2
|
)%
|
||||||||||
|
Galileo advisory fees
|
2,007
|
|
234
|
|
757.7
|
%
|
234
|
|
—
|
|
N/A
|
|
||||||||||
|
Offshore advisory fees
|
130
|
|
194
|
|
(33.0
|
)%
|
194
|
|
318
|
|
(39.0
|
)%
|
||||||||||
|
ETF advisory fees
|
26
|
|
—
|
|
N/A
|
|
—
|
|
—
|
|
N/A
|
|
||||||||||
|
Total advisory fees
|
6,682
|
|
7,760
|
|
(13.9
|
)%
|
7,760
|
|
12,189
|
|
(36.3
|
)%
|
||||||||||
|
Distribution fees
|
1,408
|
|
1,974
|
|
(28.7
|
)%
|
1,974
|
|
2,817
|
|
(29.9
|
)%
|
||||||||||
|
Shareholder services fees
|
630
|
|
931
|
|
(32.3
|
)%
|
931
|
|
1,383
|
|
(32.7
|
)%
|
||||||||||
|
Administrative services fees
|
651
|
|
774
|
|
(15.9
|
)%
|
774
|
|
929
|
|
(16.7
|
)%
|
||||||||||
|
Total Operating Revenue
|
$
|
9,371
|
|
$
|
11,439
|
|
(18.1
|
)%
|
$
|
11,439
|
|
$
|
17,318
|
|
(33.9
|
)%
|
||||||
|
Other Income (Loss)
|
||||||||||||||||||||||
|
Investment income (loss)
|
$
|
434
|
|
$
|
2,145
|
|
(79.8
|
)%
|
$
|
2,145
|
|
$
|
208
|
|
931.3
|
%
|
||||||
|
Equity in earnings of Galileo
|
—
|
|
20
|
|
(100.0
|
)%
|
20
|
|
54
|
|
(63.0
|
)%
|
||||||||||
|
Total Other Income (Loss)
|
$
|
434
|
|
$
|
2,165
|
|
(80.0
|
)%
|
$
|
2,165
|
|
$
|
262
|
|
726.3
|
%
|
||||||
Advisory Fees.
Advisory fees, the largest component of the Company’s revenues, are derived from four sources: USGIF advisory fees, Galileo advisory fees, offshore advisory fees and exchange traded fund advisory fees. In fiscal year
2015
, these sources accounted for
67.6 percent
,
30.0 percent
,
2.0 percent
and
0.4 percent
, respectively, of the Company’s total investment advisory fees.
Investment advisory fees from USGIF are calculated as a percentage of average net assets, ranging from 0.375 percent to 1.375 percent, and are paid monthly. These advisory fees
decreased
by approximately
$2.8 million
, or
38.4 percent
, in fiscal year
2015
compared to fiscal year
2014
, primarily as a result of decreased assets under management driven by market depreciation and redemptions, primarily in the natural resources funds and redemptions in the international equity market funds.
Investment advisory fees are affected by changes in assets under management, which include:
|
•
|
market appreciation or depreciation;
|
|
•
|
the addition of new client accounts;
|
|
•
|
client contributions of additional assets to existing accounts;
|
|
•
|
withdrawals of assets from and termination of client accounts;
|
|
•
|
exchanges of assets between accounts or products with different fee structures; and
|
|
•
|
the amount of fees voluntarily reimbursed.
|
As discussed above, the fees on the equity funds within USGIF consist of a base advisory fee that is adjusted upward or downward based on performance. For the year ended
June 30, 2015
,
2014
and
2013
, the Company adjusted its base advisory fees downward by
$1 million
,
$815,000
, and
$133,000
, respectively.
The Company also serves as investment advisor to an ETF, U.S. Global Jets ETF, that commenced operations in April 2015. The Company receives a unitary management fee of 0.60 percent of average net assets and has agreed to bear all expenses of the ETF.
Distribution Fees.
The Funds pay U.S. Global Brokerage, Inc. (“USGB”) a distribution fee at an annual rate of
0.25 percent
of the average daily net assets of the investor class of each of the
equity funds. Distribution fees
decreased
by
$566,000
and
$843,000
in fiscal years
2015
and
2014
, respectively, due to lower average net assets under management upon which these fees are based.
Shareholder Services Fees.
In connection with obtaining and/or providing administrative services to the beneficial owners of USGIF through broker-dealers, banks, trust companies and similar institutions which provide such services, the Company receives shareholder services fees at an annual rate of up to
0.20 percent
of the value of shares held in accounts at the institutions, which helps offset related platform costs. Shareholder services fees
decreased
by
$301,000
and
$452,000
in fiscal years
2015
and
2014
, respectively, due to a decline in net assets held through institutions.
23
Administrative Services Fees.
The Funds pay the Company compensation based on average daily net assets for administrative services provided by the Company to the Funds. Effective December 2013, the Funds’ Board of Trustees increased the rate from
0.08 percent
to
0.10 percent
for each investor class and from
0.06 percent
to
0.08 percent
for each institutional class plus
$10,000
per Fund. Effective November 1, 2014, the per fund fee changed to $7,000 per year. Administrative services fees
decreased
by
$123,000
and
$155,000
in fiscal years
2015
and
2014
, respectively, due to lower average net assets under management upon which these fees are based.
Investment Income (Loss).
Investment income (loss) from the Company’s investments includes:
|
•
|
realized gains and losses on sales of securities;
|
|
•
|
unrealized gains and losses on trading securities;
|
|
•
|
realized foreign currency gains and losses;
|
|
•
|
other-than-temporary impairments on available-for-sale securities; and
|
|
•
|
dividend and interest income.
|
This source of revenue is dependent on market fluctuations and does not remain at a consistent level. Timing of transactions and the Company’s ability to participate in investment opportunities largely affect this source of revenue.
Investment income
decreased
by
$1.7 million
in fiscal year
2015
primarily due to unrealized losses on trading securities in fiscal 2015 versus unrealized gains in fiscal 2014. The Company also recognized a gain in conjunction with the acquisition of Galileo and had more realized gains on sale of available-for-sale securities in fiscal 2014 versus fiscal 2015. Investment income
increased
by
$1.9 million
in fiscal year
2014
due to realized gains on sales of available-for-sale securities, unrealized gains on trading securities, increased dividend and interest income and gains recognized in conjunction with the acquisition of Galileo.This decrease was primarily attributable to unrealized losses on trading securities in fiscal 2015 versus unrealized gains in fiscal 2014.
Included in investment income were other-than-temporary impairments of
$247,000
;
$3,000
; and
$47,000
in fiscal years
2015
,
2014
, and
2013
, respectively. The impairment in fiscal year
2015
resulted from the issuers defaulting on scheduled payments. One security with a cost basis of
$44,000
was written down to its fair value of
$5,000
. Two other securities, which have resumed interest payments, were written down to the net present value of estimated cash flows. These securities had a cost basis of
$310,000
and
$1,102,000
, respectively, and were written down to
$234,000
and
$970,000
, respectively. In making these determinations, the Company considered the length of time and extent to which the fair value has been less than cost basis, financial condition and prospects of the issuers and the Company's ability to hold the investment until recovery.
Equity Investment in Galileo.
In fiscal year 2013, the Company made an investment in Galileo Global Equity Advisors Inc.
that was accounted for under the equity method. Effective
June 1, 2014
, the Company acquired an additional
15 percent
interest, bringing its ownership to
65 percent
of the issued and outstanding shares, which represents a controlling interest. From
March 31, 2013
, to
June 1, 2014
, the Company accounted for its interest in Galileo under the equity method with its share of Galileo’s profit or loss recognized in earnings, including
$20,000
in other income in fiscal year
2014
. Effective
June 1, 2014
, the Company accounted for the Galileo acquisition as a business combination. For additional details, please see Note 3 Business Combination to the Consolidated Financial Statements of this Annual Report in Form 10-K.
Operating Expenses
|
(dollars in thousands)
|
2015
|
2014
|
%
Change |
2014
|
2013
|
%
Change |
||||||||||||||||
|
Employee compensation and benefits
|
$
|
5,890
|
|
$
|
6,806
|
|
(13.5
|
)%
|
$
|
6,806
|
|
$
|
8,345
|
|
(18.4
|
)%
|
||||||
|
General and administrative
|
4,275
|
|
5,261
|
|
(18.7
|
)%
|
5,261
|
|
5,371
|
|
(2.0
|
)%
|
||||||||||
|
Platform fees
|
2,056
|
|
1,903
|
|
8.0
|
%
|
1,903
|
|
2,663
|
|
(28.5
|
)%
|
||||||||||
|
Advertising
|
411
|
|
615
|
|
(33.2
|
)%
|
615
|
|
862
|
|
(28.7
|
)%
|
||||||||||
|
Depreciation and amortization
|
327
|
|
256
|
|
27.7
|
%
|
256
|
|
268
|
|
(4.5
|
)%
|
||||||||||
|
Total operating expenses
|
$
|
12,959
|
|
$
|
14,841
|
|
(12.7
|
)%
|
$
|
14,841
|
|
$
|
17,509
|
|
(15.2
|
)%
|
||||||
Employee Compensation and Benefits.
Employee compensation and benefits
decreased
$916,000
, or
13.5 percent
, in fiscal year
2015
and
decreased
$1,539,000
, or
18.4 percent
, in fiscal year
2014
as a result of lower performance-based bonuses and fewer employees.
24
General and Administrative.
General and administrative expenses
decreased
$986,000
in fiscal year
2015
compared to fiscal year
2014
, primarily due to higher fund reimbursements and fund restructuring cost in the prior year, offset somewhat by the consolidation of twelve months of Galileo expenses in fiscal year 2015 versus one month of Galileo expenses in fiscal year 2014. General and administrative expenses were relatively flat in fiscal year
2014
compared to fiscal year
2013
. The change in fiscal year
2014
represents a decrease of approximately $635,000 primarily due to lower fund and operational expenses offset by one-time costs of approximately $525,000, including legal and proxy filing and solicitation costs related to strategic fund changes in the fall of 2013.
Platform Fees.
Broker-dealers typically charge an asset-based fee for assets held through their platforms. Platform fees
increased
$153,000
, or
8.0 percent
, in fiscal year
2015
due to consolidation of Galileo fees for twelve months in fiscal year 2015 versus one month in fiscal year 2014, but were offset by lower assets held through broker-dealer platforms in fiscal year
2015
. Platform fees
decreased
$760,000
, or
28.5 percent
, in fiscal year
2014
due to decreases in assets held through the broker-dealer platforms. The incremental assets received through the broker-dealer platforms are not as profitable as those received from direct shareholder accounts because of platform fees paid to various broker-dealers for the assets held through the platforms.
Advertising.
Advertising decreased by
$204,000
, or
33.2 percent
, in fiscal year
2015
and decreased by
$247,000
, or
28.7 percent
, in fiscal year
2014
as a result of reduced marketing and sales costs.
Income Taxes
The Company and its non-Canadian subsidiaries file a consolidated federal income tax return. USCAN and Galileo file separate tax returns in Canada. Provisions for income taxes include deferred taxes for temporary differences in the basis of assets and liabilities for financial and tax purposes resulting from the use of the liability method of accounting for income taxes.
A valuation allowance is provided when it is more likely than not that some portion of the deferred tax amount will not be realized. A valuation allowance of
$2,073,000
related to the net operating loss carryforward, other carryovers and book/tax differences in the balance sheet is included in deferred taxes at
June 30, 2015
. A valuation allowance of
$35,000
related to the charitable contribution carryover is included in deferred taxes at
June 30, 2014
.
Off Balance Sheet Arrangements
The Company does not have any off balance sheet arrangements.
Contractual Obligations
A summary of contractual obligations of the Company as of
June 30, 2015
, is as follows:
|
Payments due by period
|
||||||||||||||||||||
|
|
Less than
|
1-3
|
4-5
|
More than
|
||||||||||||||||
|
Contractual Obligations
|
Total
|
1 year
|
years
|
years
|
5 years
|
|||||||||||||||
|
(
dollars in thousands)
|
||||||||||||||||||||
|
Operating lease obligations
|
$
|
507
|
|
$
|
237
|
|
$
|
270
|
|
$
|
—
|
|
$
|
—
|
|
|||||
|
Contractual obligations
|
351
|
|
254
|
|
97
|
|
—
|
|
—
|
|
||||||||||
|
Total
|
$
|
858
|
|
$
|
491
|
|
$
|
367
|
|
$
|
—
|
|
$
|
—
|
|
|||||
Operating leases consist of office equipment leased from several vendors and office facilities in Canada. Contractual obligations consist of agreements for services used in daily operations. Other contractual obligations not included in this table consist of agreements to waive or reduce fees and/or pay expenses on certain funds. Future obligations under these agreements are dependent upon future levels of fund assets.
The Board of Directors has authorized a monthly dividend of
$0.005
per share from
July
2015
through
September
2015
and a monthly dividend of
$0.0025
from
October
2015
through
December
2015
, at which time the Board of Directors will consider continuation of the dividend. Payment of cash dividends is within the discretion of the Company’s Board of Directors and is dependent on earnings, operations, capital requirements, general financial condition of the Company, and general business conditions. The total amount of cash dividends to be paid to class A and class C shareholders from July
2015
to
December 2015
will be approximately
$345,000
.
25
Liquidity and Capital Resources
At
June 30, 2015
, the Company had net working capital (current assets minus current liabilities) of approximately
$19.8 million
and a current ratio (current assets divided by current liabilities) of
13.1
to 1. With approximately
$3.5 million
in cash and cash equivalents and
$19.9 million
in securities recorded at fair value, which together comprise approximately
76 percent
of total assets, the Company has adequate liquidity to meet its current obligations. Total shareholders’ equity attributable to U.S. Global Investors, Inc. was approximately
$28.6 million
. Approximately
$3.6 million
in cash and investments in USCAN and Galileo are included in the amounts above. USGI would be required to accrue and pay taxes to repatriate (i.e., bring back into the U.S.) these funds, and there is no current intention to repatriate.
The Company has no long-term debt; thus, the Company’s only material commitment going forward is for operating expenses. The Company also has access to a $1 million credit facility, which can be utilized for working capital purposes. The Company’s available working capital and projected cash flow are expected to be sufficient to cover current expenses.
Investment advisory pursuant to the Investment Company Act of 1940 and related affiliated contracts in the U.S., by law, may not exceed one year in length and, therefore, must be renewed at least annually after an initial two-year term. The investment advisory and related contracts between the Company or its subsidiaries and USGIF expire in September
2016
. The investment advisory contract between the Company and the ETF client is in its initial two-year term and will not expire until 2017.
With respect to the Company’s two offshore advisory clients, the contracts between the Company and the clients expire periodically and management anticipates that its offshore clients will renew the contracts.
Management believes current cash reserves, investments, and available financing will be sufficient to meet foreseeable cash needs or capital necessary for the above-mentioned activities and allow the Company to take advantage of investment opportunities whenever available.
Critical Accounting Estimates
The discussion and analysis of financial condition and results of operations are based on the Company’s financial statements, which have been prepared in accordance with generally accepted accounting principles in the U.S. (“GAAP”). The preparation of these financial statements requires the Company to make estimates and judgments that affect the reported amounts of assets, liabilities, and expenses. Management reviews these estimates on an ongoing basis. Estimates are based on experience and on various other assumptions that the Company believes to be reasonable under the circumstances. Actual results may differ from these estimates under different assumptions or conditions. While recent accounting policies are described in more detail in Note 2 Significant Accounting Policies to the Consolidated Financial Statements of this Annual Report in Form 10-K, the Company believes the accounting policies that require management to make assumptions and estimates involving significant judgment are those relating to valuation of investments, income taxes, and valuation of stock-based compensation.
Principles of Consolidation.
The consolidated financial statements include the accounts of the Company and its wholly-owned subsidiaries: United Shareholder Services, Inc.(“USSI”), U.S. Global Investors (Guernsey) Limited (“USGG”), U.S. Global Investors (Bermuda) Limited (“USBERM”, U.S. Global Brokerage, Inc. (“USGB”), U.S. Global Investors (Canada) Limited (“USCAN”) and U.S. Global Indices, LLC.
As previously discussed, effective June 1, 2014, the Company, through USCAN, completed its purchase of an additional
15 percent
interest in Galileo, which brings USCAN’s ownership to
65 percent
of the issued and outstanding shares of Galileo and represents controlling interest of Galileo. Galileo is consolidated with USCAN and the non-controlling interest in this subsidiary is included in “non-controlling interest in subsidiary” in the equity section of the Consolidated Balance Sheets. After the purchase of the additional interest, Galileo changed its fiscal year end from December 31 to June 30, effective June 30, 2014, to correspond to the Company’s year end. This change was treated as a change in accounting principle.
The Company’s evaluation for consolidation includes whether entities in which it has an interest are variable interest entities (“VIEs”) and whether the Company is the primary beneficiary of any VIEs identified in its analysis. A VIE is an entity in which either (a) the equity investment at risk is not sufficient to permit the entity to finance its own activities without additional financial support or (b) the group of holders of the equity investment at risk lacks certain characteristics of a controlling financial interest. The primary beneficiary is the entity that has the power to direct the activities that most significantly impact the VIE’s economic performance and the obligation to absorb losses of or right to receive benefits from the VIE that could potentially be significant to the VIE. If the VIE qualifies for the investment company deferral, the primary beneficiary is the entity that has the obligation to absorb a majority of the expected losses or the right to receive the majority of the residual returns.
The Company holds variable interests in, but is not deemed to be the primary beneficiary of, the funds it advises. The Company has determined that these entities qualify for the Investment Company deferral in the Accounting Standards Codification (
“
ASC
”
)
26
810-10-65-2 (aa) and thus determines whether it is the primary beneficiary of these entities by virtue of its exposure to the expected losses and expected residual returns of the entity. The Company’s interests in these entities consist of the Company’s direct ownership therein, which in each case is insignificant to the total ownership of the fund, and any fees earned but uncollected. In the ordinary course of business, the Company may choose to waive certain fees or assume operating expenses of the funds it advises for competitive, regulatory or contractual reasons (see No
te 6 Investment Management and Other Fees to the Consolidated Financial Statements of this Annual Report in Form 10-K f
or information regarding fee waivers). The Company has not provided financial support to any of these entities outside the ordinary course of business. The Company’s risk of loss with respect to these managed entities is limited to the carrying value of its investments in, and fees receivable from, the entities. The Company does not consolidate these VIEs because it is not the primary beneficiary of these VIEs.
Business Combinations.
Business combinations are accounted for under the acquisition method of accounting. Results of operations of an acquired business are included from the date of acquisition. Management estimates the fair value of the acquired assets, including identifiable intangible assets, assumed liabilities, and non-controlling interest in the acquiree based on their estimated fair values as of the date of acquisition. Any excess fair value of the acquired net assets over the acquisition date fair value of the consideration transferred, if any, is recorded as “goodwill” on the Consolidated Balance Sheets. Any excess acquisition date fair value of the consideration transferred over fair value of the acquired net assets is recorded as a gain on the Consolidated Statements of Operations.
Investments.
The Company classifies its investments based on intent at the time of purchase and reevaluates such designation as of each reporting period date. The Company records security transactions on trade date. Realized gains (losses) from security transactions are calculated on the first-in/first-out cost basis, unless otherwise identifiable, and are recorded in earnings on the date of sale.
Trading Securities.
Securities that are purchased and held principally for the purpose of selling in the near term are classified as trading securities and are reported at fair value. Unrealized holding gains and losses on these securities are included in earnings.
Held-to-Maturity Securities.
Investments in debt securities that are purchased with the intent and ability to hold until maturity are classified as held-to-maturity and measured at amortized cost. The Company currently has no investments classified as held-to-maturity.
Available-for-sale Securities.
Investments that are neither trading securities nor held-to-maturity securities and for which the Company does not have significant influence are classified as available-for-sale securities and reported at fair value. Unrealized holding gains and losses on these available-for-sale securities are excluded from earnings, reported net of tax as a separate component of shareholders’ equity, and recorded in earnings on the date of sale.
The Company evaluates its available-for-sale investments for other-than-temporary decline in value on a periodic basis. This may exist when the fair value of an investment security has been below the current value for an extended period of time. When a security in the Company’s investment portfolio has an unrealized loss in fair value that is deemed to be other than temporary, the Company reduces the book value of such security to its current fair value, recognizing the credit related decline as a realized loss in the Consolidated Statements of Operations and a revised GAAP cost basis for the security is established. For available-for-sale securities with declines in value deemed other than temporary, the unrealized loss recorded net of tax in accumulated other comprehensive income (loss) is realized as a charge to net income.
Other Investments.
Other investments consist of equity investments in entities over which the Company is unable to exercise significant influence and which do not have readily determinable fair values. These equity investments are accounted for under the cost method of accounting and evaluated for impairment. The Company considers many factors in determining impairment, including the severity and duration of the decline in value below cost, the Company’s interest and ability to hold the security for a period of time sufficient for an anticipated recovery in value, and the financial condition and specific events related to the issuer. When an impairment of an equity security is determined to be other-than-temporary, the impairment is recognized in earnings.
Equity Method Investments
.
Investments classified as equity method consist of investments in companies in which the Company is able to exercise significant influence but not control. Under the equity method of accounting, the Company’s proportional share of investee’s underlying net income or loss is recorded as a component of Other Income and increases or decreases to the carrying value of the investee. Distributions received from the investment reduce the Company’s carrying value of the investee. These investments are evaluated for impairment if events or circumstances arise that indicates that the carrying amount of such assets may not be recoverable.
Fair Value of Financial Instruments.
The financial instruments of the Company are reported on the Consolidated Balance Sheets at market or fair values or at carrying amounts that approximate fair values.
27
Intangible Asset.
An intangible asset, consisting of a non-compete agreement, acquired in connection with the acquisition of Galileo shares effective
June 1, 2014
, is recorded at fair value determined using a discounted cash flow model as of the date of acquisition. The discounted cash flow model included various factors to project future cash flows expected to be generated from the asset, including: (1) an estimated rate of change for underlying managed assets; (2) expected revenue per managed assets; (3) incremental operating expenses; and (4) a discount rate. Management estimates a rate of change for underlying managed assets based on an estimated net redemption or sales rate. Expected revenue per managed assets and incremental operating expenses of the acquired assets are generally based on contract terms.
The Company has determined that the non-compete agreement has a finite useful life. The Company amortizes this finite-lived identifiable intangible asset on a straight-line basis over its estimated useful life. Management periodically evaluates the remaining useful lives and carrying values of intangible assets to determine whether events and circumstances indicate that a change in the useful life or impairment in value may have occurred. Indicators of impairment monitored by management include a decline in the level of managed assets, changes to contractual provisions underlying the intangible assets and reductions in underlying operating cash flows. Should there be an indication of a change in the useful life or impairment in value of the finite-lived intangible asset, the Company compares the carrying value of the asset and its related useful life to the projected discounted cash flows expected to be generated from the underlying managed assets over its remaining useful life to determine whether impairment has occurred. If the carrying value of the asset exceeds the discounted cash flows, the asset is written down to its fair value determined using discounted cash flows.
Non-Controlling Interests.
The Company reports “non-controlling interest in subsidiary” as equity, separate from parent’s equity, on the Consolidated Balance Sheets. In addition, the Company’s Consolidated Statements of Operations includes “net income (loss) attributable to non-controlling interest.”
Income Taxes.
The Company’s annual effective income tax rate is based on the mix of income and losses in its U.S. and non-U.S. entities which are part of the Company’s Consolidated Financial Statements, statutory tax rates, and tax-planning opportunities available to the Company in the various jurisdictions in which it operates. Significant judgment is required in evaluating the Company’s tax positions.
Tax law requires certain items to be included in the tax return at different times from when these items are reflected in the Company’s Consolidated Statements of Operations. As a result, the effective tax rate reflected in the Consolidated Financial Statements is different from the tax rate reported on the Company’s consolidated tax return. Some of these differences are permanent, such as expenses that are not deductible in the tax return, and some differences reverse over time, such as depreciation expense. These timing differences create deferred tax assets and liabilities. Deferred tax assets and liabilities are determined based on temporary differences between the financial reporting and the tax basis of assets and liabilities and are measured using enacted tax rates expected to apply to taxable income in the years in which those temporary differences are expected to be recovered or settled. The effect on deferred tax assets and liabilities of a change in tax rates is recognized in income in the period that includes the enactment dates. In addition, excess tax benefits associated with stock option exercises also create a difference between the tax rate used in the consolidated tax return and the effective tax rate in the Company’s Consolidated Statements of Operations.
The Company assesses uncertain tax positions in accordance with ASC 740
Income Taxes
. Judgment is used to identify, recognize, and measure the amounts to be recorded in the financial statements related to tax positions taken or expected to be taken in a tax return. A liability is recognized to represent the potential future obligation to the taxing authority for the benefit taken in the tax return. These liabilities are adjusted, including any impact of the related interest and penalties, in light of changing facts and circumstances such as the progress of a tax audit. A number of years may elapse before a particular matter for which a reserve has been established is audited and finally resolved. The number of years with open tax audits varies depending on the tax jurisdiction.
Judgment is used in classifying unrecognized tax benefits as either current or noncurrent liabilities in the Company’s Consolidated Balance Sheets. Settlement of any particular issue would usually require the use of cash. A liability associated with unrecognized tax benefits will generally be classified as a noncurrent liability because there will usually be a period of several years between the filing of the tax return and the final resolution of an uncertain tax position with the taxing authority. Favorable resolutions of tax matters for which reserves have been established are recognized as a reduction to income tax expense when the amounts involved become known.
The Company assesses whether a valuation allowance should be established against its deferred income tax assets based on consideration of available evidence, both positive and negative, using a more likely than not standard. This assessment considers, among other matters, the nature, frequency and severity of recent losses, forecast of future profitability, the duration of statutory carry back and carry forward periods, the Company’s experience with tax attributes expiring unused, and tax planning alternatives.
Assessing the future tax consequences of events that have been recognized in the Company’s Consolidated Financial Statements or tax returns requires judgment. Variations in the actual outcome of these future tax consequences could materially impact the Company’s financial position, results of operations or cash flows.
28
Stock-Based Compensation.
Stock-based compensation expense is measured at the grant date based on the fair value of the award, and the cost is recognized as expense ratably over the award’s vesting period. No options were granted in fiscal years
2015
,
2014
or
2013
.
The Company believes that the estimates related to stock-based compensation expense are critical accounting estimates because the assumptions used could significantly impact the timing and amount of stock-based compensation expense recorded in the Company’s Consolidated Financial Statements.
Foreign Exchange.
The balance sheets of certain foreign subsidiaries of the Company and certain foreign-denominated investment products are translated at the current exchange rate as of the end of the accounting period and the related income or loss is translated at the average exchange rate in effect during the period. Net exchange gains and losses resulting from these translations are excluded from income and are recorded in “accumulated other comprehensive income (loss)” on the Consolidated Balance Sheets. Investment transactions denominated in foreign currencies are converted to U.S. dollars using the exchange rate on the date of the transaction and any related gain or loss is included in “investment income (loss)” on the Consolidated Statements of Operations.
29
|
Market Risk Disclosures
|
The Company’s Consolidated Balance Sheets includes assets whose fair value is subject to market risk. Due to the Company’s investments in securities recorded at fair value, price fluctuations represent a market risk factor affecting the Company’s consolidated financial position. The carrying values of investments subject to price risks are based on quoted market prices or, if not actively traded, management’s estimate of fair value as of the balance sheet date. Market prices fluctuate, and the amount realized in the subsequent sale of an investment may differ significantly from the reported market value.
The Company’s investment activities are reviewed and monitored by Company compliance personnel, and various reports are provided to certain investment advisory clients. Written procedures are in place to manage compliance with the code of ethics and other policies affecting the Company’s investment practices.
The table below summarizes the Company’s price risks as of
June 30, 2015
, and shows the effects of a hypothetical 25 percent increase and a 25 percent decrease in market prices.
|
(dollars in thousands)
|
Fair Value
|
Hypothetical
Percentage Change
|
Estimated Fair
Value After
Hypothetical Price
Change
|
Increase (Decrease) in
Shareholders’ Equity,
Net of Tax
|
||||||||||
|
Trading securities
1
|
$
|
15,640
|
|
25% increase
|
$
|
19,550
|
|
$
|
3,910
|
|
||||
|
25% decrease
|
11,730
|
|
(3,910
|
)
|
||||||||||
|
Available-for-sale
2
|
4,263
|
|
25% increase
|
5,329
|
|
1,066
|
|
|||||||
|
25% decrease
|
3,197
|
|
(1,066
|
)
|
||||||||||
|
1.
|
Unrealized and realized gains and losses on trading securities are included in earnings in the Consolidated Statements of Operations.
|
|
2.
|
Unrealized holding gains and losses on available-for-sale securities are excluded from earnings and recorded in other comprehensive income (loss) as a component of shareholders’ equity until realized.
|
The selected hypothetical changes do not reflect what could be considered best- or worst-case scenarios. Results could be significantly different due to both the nature of markets and the concentration of the Company’s investment portfolio.
30
|
Report of Independent Registered Public Accounting Firm on Consolidated
Financial Statements
|
Board of Directors and Stockholders
U.S. Global Investors, Inc.
San Antonio, Texas
We have audited the accompanying Consolidated Balance Sheets of U.S. Global Investors, Inc. (the “Company”) as of
June 30, 2015
and
2014
and the related Consolidated Statements of Operations, Comprehensive Income (Loss), Shareholders’ Equity, and Cash Flows for each of the three years in the period ended
June 30, 2015
. These financial statements are the responsibility of the Company’s management. Our responsibility is to express an opinion on these financial statements based on our audits.
We conducted our audits in accordance with the standards of the Public Company Accounting Oversight Board (United States). Those standards require that we plan and perform the audit to obtain reasonable assurance about whether the financial statements are free of material misstatement. The Company is not required to have, nor were we engaged to perform, an audit of its internal control over financial reporting. Our audits included consideration of internal control over financial reporting as a basis for designing audit procedures that are appropriate in the circumstances, but not for the purpose of expressing an opinion on the effectiveness of the Company’s internal control over financial reporting. Accordingly, we express no such opinion. An audit also includes examining, on a test basis, evidence supporting the amounts and disclosures in the financial statements, assessing the accounting principles used and significant estimates made by management, as well as evaluating the overall presentation of the financial statements. We believe that our audits provide a reasonable basis for our opinion.
In our opinion, the consolidated financial statements referred to above present fairly, in all material respects, the financial position of U.S. Global Investors, Inc. at
June 30, 2015
and
2014
, and the results of its operations and its cash flows for each of the three years in the period ended
June 30, 2015
,
in conformity with accounting principles generally accepted in the United States of
America.
|
/s/ BDO USA, LLP
|
|
BDO USA, LLP
|
|
Dallas, Texas
|
|
September 16, 2015
|
31
U.S. GLOBAL INVESTORS, INC.
|
Assets
|
June 30,
2015 |
|
June 30,
2014 |
|||||
|
(dollars in thousands)
|
||||||||
|
Current Assets
|
||||||||
|
Cash and cash equivalents
|
$
|
3,507
|
|
$
|
5,910
|
|
||
|
Trading securities, at fair value
|
15,640
|
|
17,817
|
|
||||
|
Receivables
|
1,837
|
|
2,513
|
|
||||
|
Prepaid expenses
|
410
|
|
525
|
|
||||
|
Deferred tax asset
|
—
|
|
51
|
|
||||
|
Total Current Assets
|
21,394
|
|
26,816
|
|
||||
|
Net Property and Equipment
|
2,736
|
|
3,024
|
|
||||
|
Other Assets
|
||||||||
|
Deferred tax asset, long-term
|
—
|
|
298
|
|
||||
|
Investment securities available-for-sale, at fair value
|
4,263
|
|
6,196
|
|
||||
|
Other investments
|
2,303
|
|
1,413
|
|
||||
|
Intangible assets, net
|
41
|
|
86
|
|
||||
|
Other assets, long term
|
33
|
|
13
|
|
||||
|
Total Other Assets
|
6,640
|
|
8,006
|
|
||||
|
Total Assets
|
$
|
30,770
|
|
$
|
37,846
|
|
||
|
Liabilities and Shareholders’ Equity
|
||||||||
|
Current Liabilities
|
||||||||
|
Accounts payable
|
$
|
119
|
|
$
|
219
|
|
||
|
Accrued compensation and related costs
|
456
|
|
581
|
|
||||
|
Dividends payable
|
231
|
|
232
|
|
||||
|
Other accrued expenses
|
821
|
|
1,064
|
|
||||
|
Total liabilities held related to discontinued operations
|
—
|
|
47
|
|
||||
|
Total Current Liabilities
|
1,627
|
|
2,143
|
|
||||
|
Commitments and Contingencies (Note 19)
|
|
|
||||||
|
Shareholders’ Equity
|
||||||||
|
Common stock (class A) - $0.025 par value; nonvoting; authorized, 28,000,000 shares; issued,13,866,421 and 13,866,361 shares at June 30, 2015, and June 30, 2014, respectively
|
347
|
|
347
|
|
||||
|
Common stock (class B) - $0.025 par value; nonvoting; authorized, 4,500,000 shares; no shares issued
|
—
|
|
—
|
|
||||
|
Convertible common stock (class C) - $0.025 par value; voting; authorized, 3,500,000 shares; issued, 2,069,127 and 2,069,187 shares at June 30, 2015, and June 30, 2014, respectively
|
52
|
|
52
|
|
||||
|
Additional paid-in-capital
|
15,694
|
|
15,669
|
|
||||
|
Treasury stock, class A shares at cost; 555,786 and 501,518 shares at June 30, 2015, and June 30, 2014, respectively
|
(1,464
|
)
|
(1,280
|
)
|
||||
|
Accumulated other comprehensive income (loss), net of tax
|
(483
|
)
|
906
|
|
||||
|
Retained earnings
|
14,423
|
|
19,376
|
|
||||
|
Total U.S. Global Investors, Inc. Shareholders’ Equity
|
28,569
|
|
35,070
|
|
||||
|
Non-Controlling Interest in Subsidiary
|
574
|
|
633
|
|
||||
|
Total Shareholders’ Equity
|
29,143
|
|
35,703
|
|
||||
|
Total Liabilities and Shareholders’ Equity
|
$
|
30,770
|
|
$
|
37,846
|
|
||
The accompanying notes are an integral part of these consolidated financial statements.
32
U.S. GLOBAL INVESTORS, INC.
|
|
Year Ended June 30,
|
|||||||||||
|
(dollars in thousands, except per share data)
|
2015
|
|
2014
|
|
2013
|
|||||||
|
Operating Revenues
|
||||||||||||
|
Advisory fees
|
$
|
6,682
|
|
$
|
7,760
|
|
$
|
12,189
|
|
|||
|
Distribution fees
|
1,408
|
|
1,974
|
|
2,817
|
|
||||||
|
Shareholder services fees
|
630
|
|
931
|
|
1,383
|
|
||||||
|
Administrative services fees
|
651
|
|
774
|
|
929
|
|
||||||
|
9,371
|
|
11,439
|
|
17,318
|
|
|||||||
|
Operating Expenses
|
||||||||||||
|
Employee compensation and benefits
|
5,890
|
|
6,806
|
|
8,345
|
|
||||||
|
General and administrative
|
4,275
|
|
5,261
|
|
5,371
|
|
||||||
|
Platform fees
|
2,056
|
|
1,903
|
|
2,663
|
|
||||||
|
Advertising
|
411
|
|
615
|
|
862
|
|
||||||
|
Depreciation and amortization
|
327
|
|
256
|
|
268
|
|
||||||
|
12,959
|
|
14,841
|
|
17,509
|
|
|||||||
|
Operating Loss
|
(3,588
|
)
|
(3,402
|
)
|
(191
|
)
|
||||||
|
Other Income
|
||||||||||||
|
Investment income
|
434
|
|
2,145
|
|
208
|
|
||||||
|
Equity in earnings of Galileo
|
|
—
|
|
|
20
|
|
|
54
|
|
|||
|
Total Other Income
|
434
|
|
2,165
|
|
262
|
|
||||||
|
Income (Loss) from Continuing Operations Before Income Taxes
|
(3,154
|
)
|
(1,237
|
)
|
71
|
|
||||||
|
Provision for Federal Income Taxes
|
||||||||||||
|
Tax expense (benefit)
|
822
|
|
(517
|
)
|
100
|
|
||||||
|
Loss from Continuing Operations
|
(3,976
|
)
|
(720
|
)
|
(29
|
)
|
||||||
|
Discontinued Operations
|
||||||||||||
|
Loss from operations of discontinued transfer agent
|
—
|
|
(368
|
)
|
(250
|
)
|
||||||
|
Tax benefit
|
—
|
|
(125
|
)
|
(85
|
)
|
||||||
|
Loss from Discontinued Operations
|
—
|
|
(243
|
)
|
(165
|
)
|
||||||
|
Net Loss
|
|
(3,976
|
)
|
|
(963
|
)
|
|
(194
|
)
|
|||
|
Less: Net Income Attributable to Non-Controlling Interest
|
|
54
|
|
|
7
|
|
|
—
|
|
|||
|
Net Loss Attributable to U.S. Global Investors, Inc.
|
|
$
|
(4,030
|
)
|
|
$
|
(970
|
)
|
|
$
|
(194
|
)
|
|
Earnings Per Share Attributable to U.S. Global Investors, Inc.
|
||||||||||||
|
Basic
|
||||||||||||
|
Loss from continuing operations
|
$
|
(0.26
|
)
|
$
|
(0.04
|
)
|
$
|
0.00
|
|
|||
|
Loss from discontinued operations
|
0.00
|
|
(0.02
|
)
|
(0.01
|
)
|
||||||
|
Net loss
|
$
|
(0.26
|
)
|
$
|
(0.06
|
)
|
$
|
(0.01
|
)
|
|||
|
Diluted
|
||||||||||||
|
Loss from continuing operations
|
$
|
(0.26
|
)
|
$
|
(0.04
|
)
|
$
|
0.00
|
|
|||
|
Loss from discontinued operations
|
0.00
|
|
(0.02
|
)
|
(0.01
|
)
|
||||||
|
Net loss
|
$
|
(0.26
|
)
|
$
|
(0.06
|
)
|
$
|
(0.01
|
)
|
|||
|
Basic weighted average number of common shares outstanding
|
15,399,831
|
|
15,459,022
|
|
15,482,612
|
|
||||||
|
Diluted weighted average number of common shares outstanding
|
15,399,831
|
|
15,459,022
|
|
15,482,612
|
|
||||||
The accompanying notes are an integral part of these consolidated financial statements.
33
U.S. GLOBAL INVESTORS, INC.
CONSOLIDATED STATEMENTS OF COMPREHENSIVE INCOME (LOSS)
|
Year Ended June 30,
|
||||||||||||
|
(dollars in thousands)
|
2015
|
2014
|
2013
|
|||||||||
|
Net Loss Attributable to U.S. Global Investors, Inc.
|
$
|
(4,030
|
)
|
$
|
(970
|
)
|
$
|
(194
|
)
|
|||
|
Other Comprehensive Income (Loss), Net of Tax:
|
|
|
|
|||||||||
|
Unrealized gains (losses) on available-for-sale securities arising during period
|
(1,000
|
)
|
923
|
|
350
|
|
||||||
|
Less: reclassification adjustment for gains included in net income
|
(227
|
)
|
(687
|
)
|
(164
|
)
|
||||||
|
Net change from available-for-sale investments, net of tax
|
(1,227
|
)
|
236
|
|
186
|
|
||||||
|
Foreign currency translation adjustments
|
(248
|
)
|
27
|
|
—
|
|
||||||
|
Other Comprehensive Income (Loss)
|
(1,475
|
)
|
263
|
|
186
|
|
||||||
|
Comprehensive Loss
|
(5,505
|
)
|
(707
|
)
|
(8
|
)
|
||||||
|
Less: Comprehensive Income Attributable to Non-Controlling Interest
|
(86
|
)
|
9
|
|
—
|
|
||||||
|
Comprehensive Loss Attributable to U.S. Global Investors, Inc.
|
$
|
(5,419
|
)
|
$
|
(716
|
)
|
$
|
(8
|
)
|
|||
The accompanying notes are an integral part of these consolidated financial statements.
34
U.S. GLOBAL INVESTORS, INC.
CONSOLIDATED STATEMENTS OF SHAREHOLDERS’ EQUITY
|
(dollars in thousands)
|
Common
Stock
(class A)
|
Common
Stock
(class C)
|
Additional
Paid-in
Capital
|
Treasury
Stock
|
Accumulated
Other
Comprehensive
Income (Loss)
|
Retained
Earnings
|
Non-Controlling Interest
|
Total
|
||||||||||||||||||||||||
|
Balance at June 30, 2012 (13,862,505 shares of class A; 2,073,043 shares of class C)
|
$
|
347
|
|
$
|
52
|
|
$
|
15,548
|
|
$
|
(1,107
|
)
|
$
|
466
|
|
$
|
23,404
|
|
$
|
—
|
|
$
|
38,710
|
|
||||||||
|
Purchases of 55,052 shares of common stock (class A)
|
—
|
|
—
|
|
—
|
|
(174
|
)
|
—
|
|
—
|
|
—
|
|
(174
|
)
|
||||||||||||||||
|
Issuance of stock under ESPP of 48,679 shares of common stock (class A)
|
—
|
|
—
|
|
69
|
|
116
|
|
—
|
|
—
|
|
—
|
|
185
|
|
||||||||||||||||
|
Conversion of 2,516 shares of class C common stock for class A common stock
|
—
|
|
—
|
|
—
|
|
—
|
|
—
|
|
—
|
|
—
|
|
—
|
|
||||||||||||||||
|
Dividends declared
|
—
|
|
—
|
|
—
|
|
—
|
|
—
|
|
(1,937
|
)
|
—
|
|
(1,937
|
)
|
||||||||||||||||
|
Stock bonuses
|
—
|
|
—
|
|
28
|
|
36
|
|
—
|
|
—
|
|
—
|
|
64
|
|
||||||||||||||||
|
Stock-based compensation expense
|
—
|
|
—
|
|
9
|
|
—
|
|
—
|
|
—
|
|
—
|
|
9
|
|
||||||||||||||||
|
Other comprehensive income, net of tax
|
—
|
|
—
|
|
—
|
|
—
|
|
186
|
|
—
|
|
—
|
|
186
|
|
||||||||||||||||
|
Net loss
|
—
|
|
—
|
|
—
|
|
—
|
|
—
|
|
(194
|
)
|
—
|
|
(194
|
)
|
||||||||||||||||
|
Balance at June 30, 2013 (13,865,021 shares of class A; 2,070,527 shares of class C)
|
347
|
|
52
|
|
15,654
|
|
(1,129
|
)
|
652
|
|
21,273
|
|
—
|
|
36,849
|
|
||||||||||||||||
|
Purchases of 93,351 shares of common stock (class A)
|
—
|
|
—
|
|
—
|
|
(289
|
)
|
—
|
|
—
|
|
—
|
|
(289
|
)
|
||||||||||||||||
|
Issuance of stock under ESPP of 52,191 shares of common stock (class A)
|
—
|
|
—
|
|
27
|
|
129
|
|
—
|
|
—
|
|
—
|
|
156
|
|
||||||||||||||||
|
Conversion of 1,340 shares of class C common stock for class A common stock
|
—
|
|
—
|
|
—
|
|
—
|
|
—
|
|
—
|
|
—
|
|
—
|
|
||||||||||||||||
|
Dividends declared
|
—
|
|
—
|
|
—
|
|
—
|
|
—
|
|
(927
|
)
|
—
|
|
(927
|
)
|
||||||||||||||||
|
Stock bonuses
|
—
|
|
—
|
|
2
|
|
9
|
|
—
|
|
—
|
|
—
|
|
11
|
|
||||||||||||||||
|
Stock-based compensation expense
|
—
|
|
—
|
|
(14
|
)
|
—
|
|
—
|
|
—
|
|
—
|
|
(14
|
)
|
||||||||||||||||
|
Galileo acquisition - non-controlling interest
|
617
|
|
617
|
|
||||||||||||||||||||||||||||
|
Other comprehensive income, net of tax
|
—
|
|
—
|
|
—
|
|
—
|
|
254
|
|
—
|
|
9
|
|
263
|
|
||||||||||||||||
|
Net loss
|
—
|
|
—
|
|
—
|
|
—
|
|
—
|
|
(970
|
)
|
7
|
|
(963
|
)
|
||||||||||||||||
|
Balance at June 30, 2014 (13,866,361 shares of class A; 2,069,187 shares of class C)
|
347
|
|
52
|
|
15,669
|
|
(1,280
|
)
|
906
|
|
19,376
|
|
633
|
|
35,703
|
|
||||||||||||||||
|
Purchases of 95,251 shares of common stock (class A)
|
—
|
|
—
|
|
—
|
|
(292
|
)
|
—
|
|
—
|
|
—
|
|
(292
|
)
|
||||||||||||||||
|
Issuance of stock under ESPP of 37,383 shares of common stock (class A)
|
—
|
|
—
|
|
23
|
|
98
|
|
—
|
|
—
|
|
—
|
|
121
|
|
||||||||||||||||
|
Conversion of 60 shares of class C common stock for class A common stock
|
—
|
|
—
|
|
—
|
|
—
|
|
—
|
|
—
|
|
—
|
|
—
|
|
||||||||||||||||
|
Dividends declared
|
—
|
|
—
|
|
—
|
|
—
|
|
—
|
|
(923
|
)
|
—
|
|
(923
|
)
|
||||||||||||||||
|
Stock bonuses
|
—
|
|
—
|
|
2
|
|
10
|
|
—
|
|
—
|
|
—
|
|
12
|
|
||||||||||||||||
|
Distribution to non-controlling interests in subsidiary
|
—
|
|
—
|
|
—
|
|
—
|
|
—
|
|
—
|
|
(27
|
)
|
(27
|
)
|
||||||||||||||||
|
Other comprehensive income, net of tax
|
—
|
|
—
|
|
—
|
|
—
|
|
(1,389
|
)
|
—
|
|
(86
|
)
|
(1,475
|
)
|
||||||||||||||||
|
Net loss
|
—
|
|
—
|
|
—
|
|
—
|
|
—
|
|
(4,030
|
)
|
54
|
|
(3,976
|
)
|
||||||||||||||||
|
Balance at June 30, 2015 (13,866,421 shares of class A; 2,069,127 shares of class C)
|
$
|
347
|
|
$
|
52
|
|
$
|
15,694
|
|
$
|
(1,464
|
)
|
$
|
(483
|
)
|
$
|
14,423
|
|
$
|
574
|
|
$
|
29,143
|
|
||||||||
The accompanying notes are an integral part of these consolidated financial statements.
35
U.S. GLOBAL INVESTORS, INC.
|
|
Year Ended June 30,
|
|||||||||||
|
(dollars in thousands)
|
2015
|
2014
|
2013
|
|||||||||
|
Cash Flows from Operating Activities:
|
||||||||||||
|
Net loss
|
$
|
(3,976
|
)
|
$
|
(963
|
)
|
$
|
(194
|
)
|
|||
|
Adjustments to reconcile net loss to net cash provided by (used in) operating activities:
|
|
|
|
|||||||||
|
Depreciation and amortization
|
327
|
|
259
|
|
275
|
|
||||||
|
Net recognized loss on disposal of property and equipment
|
26
|
|
26
|
|
—
|
|
||||||
|
Net recognized loss (gain) on securities
|
(313
|
)
|
(878
|
)
|
26
|
|
||||||
|
Gain on acquisition of Galileo
|
—
|
|
(290
|
)
|
—
|
|
||||||
|
Net income from equity method investment
|
—
|
|
(20
|
)
|
(54
|
)
|
||||||
|
Provision for deferred taxes
|
807
|
|
387
|
|
9
|
|
||||||
|
Stock bonuses
|
12
|
|
11
|
|
64
|
|
||||||
|
Stock-based compensation expense
|
—
|
|
1
|
|
9
|
|
||||||
|
Changes in operating assets and liabilities:
|
||||||||||||
|
Accounts receivable
|
655
|
|
(634
|
)
|
617
|
|
||||||
|
Prepaid expenses
|
86
|
|
109
|
|
1
|
|
||||||
|
Trading securities
|
2,176
|
|
(13,222
|
)
|
213
|
|
||||||
|
Accounts payable and accrued expenses
|
(472
|
)
|
25
|
|
(505
|
)
|
||||||
|
Total adjustments
|
3,304
|
|
(14,226
|
)
|
655
|
|
||||||
|
Net cash provided by (used in) operating activities
|
(672
|
)
|
(15,189
|
)
|
461
|
|
||||||
|
Cash Flows from Investing Activities:
|
||||||||||||
|
Purchase of property and equipment
|
(40
|
)
|
(30
|
)
|
(39
|
)
|
||||||
|
Purchase of Galileo shares
|
—
|
|
—
|
|
(600
|
)
|
||||||
|
Cash acquired in excess of payment to acquire Galileo shares
|
—
|
|
1,236
|
|
—
|
|
||||||
|
Purchase of available-for-sale securities
|
(186
|
)
|
(1,317
|
)
|
(473
|
)
|
||||||
|
Purchase of other investments
|
(1,000
|
)
|
(1,187
|
)
|
—
|
|
||||||
|
Proceeds on sale of available-for-sale securities
|
795
|
|
5,305
|
|
744
|
|
||||||
|
Proceeds from other investment
|
5
|
|
—
|
|
—
|
|
||||||
|
Return of capital on investments
|
36
|
|
43
|
|
—
|
|
||||||
|
Net cash provided by (used in) investing activities
|
(390
|
)
|
4,050
|
|
(368
|
)
|
||||||
|
Cash Flows from Financing Activities:
|
||||||||||||
|
Issuance of common stock
|
121
|
|
156
|
|
185
|
|
||||||
|
Repurchases of common stock
|
(292
|
)
|
(289
|
)
|
(174
|
)
|
||||||
|
Distributions to non-controlling interests in subsidiary
|
(27
|
)
|
—
|
|
—
|
|
||||||
|
Dividends paid
|
(924
|
)
|
(928
|
)
|
(2,632
|
)
|
||||||
|
Net cash used in financing activities
|
(1,122
|
)
|
(1,061
|
)
|
(2,621
|
)
|
||||||
|
Effect of exchange rate changes on cash and cash equivalents
|
(219
|
)
|
25
|
|
—
|
|
||||||
|
Net decrease in cash and cash equivalents
|
(2,403
|
)
|
(12,175
|
)
|
(2,528
|
)
|
||||||
|
Beginning cash and cash equivalents
|
5,910
|
|
18,085
|
|
20,613
|
|
||||||
|
Ending cash and cash equivalents
|
$
|
3,507
|
|
$
|
5,910
|
|
$
|
18,085
|
|
|||
|
Supplemental Disclosures of Cash Flow Information
|
||||||||||||
|
Cash paid for income taxes
|
$
|
8
|
|
$
|
—
|
|
$
|
118
|
|
|||
The accompanying notes are an integral part of these consolidated financial statements.
36
|
Notes to Consolidated Financial Statements
|
||||
U.S. Global Investors, Inc. (the “Company” or “U.S. Global”) serves as investment adviser to U.S. Global Investors funds (“USGIF” or the “Fund(s)”), a Delaware statutory trust that is a no-load, open-end investment company offering shares in numerous mutual funds to the investing public. The Company also provides administrative services and distribution to USGIF and through December 6, 2013, provided transfer agency functions. For these services, the Company receives fees from USGIF. The Company also provides advisory services to offshore clients and an SEC registered exchange traded fund (“ETF”). Effective June 1, 2014, the Company holds a controlling interest in Galileo Global Equity Advisors Inc. (“Galileo”), a privately held Toronto-based asset management firm. See Note 2 Significant Accounting Policies and Note 3 Business Combination for additional information on the acquisition of controlling interest of Galileo.
U.S. Global formed the following companies to provide transfer agent and distribution services to USGIF: United Shareholder Services, Inc. (“USSI”) and U.S. Global Brokerage, Inc. (“USGB”).
The Company formed three subsidiaries utilized primarily for corporate investment purposes: U.S. Global Investors (Guernsey) Limited (“USGG”), incorporated in Guernsey (on August 3, 2013, USGG was dissolved); U.S. Global Investors (Bermuda) Limited (“USBERM”), incorporated in Bermuda; and U.S. Global Investors (Canada) Limited (“USCAN”), formed in March 2013. In July 2013, the Company created U.S. Global Indices, LLC, a Texas limited liability company, of which the Company is the sole member, to provide indexing services to exchange-traded funds managed by the Company.
Principles of Consolidation.
The consolidated financial statements include the accounts of the Company and its wholly owned subsidiaries: USSI, USGB, USGG, USBERM, USCAN and U.S. Global Indices, LLC.
In addition, effective June 1, 2014, the Company, through USCAN, completed its purchase of an additional
15 percent
interest in Galileo from the company’s founder, Michael Waring. This additional investment brings USCAN’s ownership to
65 percent
of the issued and outstanding shares of Galileo and represents a controlling interest of Galileo. With the additional investment, the Company expects to increase its presence in Canada. Galileo is consolidated with USCAN and the non-controlling interest in this subsidiary is included in “non-controlling interest in subsidiary” in the equity section of the Consolidated Balance Sheets. See Note 3 Business Combination for additional information. After the purchase of the additional interest, Galileo changed its fiscal year end from December 31 to June 30, effective June 30, 2014, to correspond to the Company’s year end. This change was treated as a change in accounting principle.
The Company’s evaluation for consolidation includes whether entities in which it has an interest are variable interest entities (“VIEs”) and whether the Company is the primary beneficiary of any VIEs identified in its analysis. A VIE is an entity in which either (a) the equity investment at risk is not sufficient to permit the entity to finance its own activities without additional financial support or (b) the group of holders of the equity investment at risk lacks certain characteristics of a controlling financial interest. The primary beneficiary is the entity that has the power to direct the activities that most significantly impact the VIE’s economic performance and the obligation to absorb losses of or right to receive benefits from the VIE that could potentially be significant to the VIE. If the VIE qualifies for the investment company deferral, the primary beneficiary is the entity that has the obligation to absorb a majority of the expected losses or the right to receive the majority of the residual returns.
The Company holds variable interests in, but is not deemed to be the primary beneficiary of, the funds it advises. The Company has determined that these entities qualify for the Investment Company deferral in ASC 810-10-65-2 (aa) and thus determines whether it is the primary beneficiary of these entities by virtue of its exposure to the expected losses and expected residual returns of the entity. The Company’s interests in these entities consist of the Company’s direct ownership therein, which in each case is insignificant to the total ownership of the fund, and any fees earned but uncollected. In the ordinary course of business, the Company may choose to waive certain fees or assume operating expenses of the funds it advises for competitive, regulatory or contractual reasons (see No
te 6 Investment Management and Other Fees f
or information regarding fee waivers). The Company has not provided financial support to any of these entities outside the ordinary course of business. The Company’s risk of loss with respect to these managed entities is limited to the carrying value of its investments in, and fees receivable from, the entities. The Company does not consolidate these VIEs because it is not the primary beneficiary of these VIEs.
All significant intercompany balances and transactions have been eliminated in consolidation. Certain amounts have been reclassified for comparative purposes.
37
Business Combinations.
Business combinations are accounted for under the acquisition method of accounting. Results of operations of an acquired business are included from the date of acquisition. Management estimates the fair value of the acquired assets, including identifiable intangible assets, assumed liabilities, and non-controlling interest in the acquiree based on their estimated fair values as of the date of acquisition. Any excess acquisition date fair value of the consideration transferred over fair value of the acquired net assets, if any, is recorded as “goodwill” on the Consolidated Balance Sheets. Any excess fair value of the acquired net assets over the acquisition date fair value of the consideration transferred is recorded as a gain on the Consolidated Statements of Operations.
Cash and Cash Equivalents.
Cash and cash equivalents include highly liquid investments with original maturities of three months or less.
Investments.
The Company classifies its investments based on intent at the time of purchase and reevaluates such designation as of each reporting period date. The Company records security transactions on trade date. Realized gains (losses) from security transactions are calculated on the first-in/first-out cost basis, unless otherwise identifiable, and are recorded in earnings on the date of sale.
Trading Securities.
Securities that are purchased and held principally for the purpose of selling in the near term are classified as trading securities and reported at fair value. Unrealized gains and losses on these securities are included in Investment income (loss).
Held-to-Maturity Securities.
Investments in debt securities that are purchased with the intent and ability to hold until maturity are classified as held-to-maturity and measured at amortized cost. The Company currently has no investments in held-to-maturity securities.
Available-for-sale Securities.
Investments that are neither trading securities nor held-to-maturity securities and for which the Company does not have significant influence are classified as available-for-sale securities and reported at fair value. Unrealized gains and losses on these available-for-sale securities are excluded from earnings, reported net of tax as a separate component of shareholders’ equity, and recorded in earnings on the date of sale.
The Company evaluates its available-for-sale investments for other-than-temporary decline in value on a periodic basis. This may exist when the fair value of an investment security has been below the current value for an extended period of time. When a security in the Company’s investment portfolio has an unrealized loss in fair value that is deemed to be other than temporary, the Company reduces the book value of such security to its current fair value, recognizing the credit related decline as a realized loss in the Consolidated Statements of Operations and a revised GAAP cost basis for the security is established. For available-for-sale securities with declines in value deemed other than temporary, the unrealized loss recorded net of tax in accumulated other comprehensive income (loss) is realized as a charge to net income.
Other Investments.
Other investments consist of equity investments in entities over which the Company is unable to exercise significant influence and which do not have readily determinable fair values. These equity investments are accounted for under the cost method of accounting and evaluated for impairment. The Company considers many factors in determining impairment, including the severity and duration of the decline in value below cost, the Company’s interest and ability to hold the security for a period of time sufficient for an anticipated recovery in value, and the financial condition and specific events related to the issuer.
Equity Method Investments
.
Investments classified as equity method consist of investments in companies in which the Company is able to exercise significant influence but not control. Under the equity method of accounting, the Company’s proportional share of investee’s underlying net income or loss is recorded as a component of “other income” with a corresponding increase or decrease to the carrying value of the investment. Distributions received from the investee reduce the Company’s carrying value of the investment. These investments are evaluated for impairment if events or circumstances arise that indicate that the carrying amount of such assets may not be recoverable. No impairment was recognized for the Company’s equity method investment during the years presented.
No
investments were held at
June 30, 2015
or
2014
that are accounted for using the equity method. See Note 3 Business Combination for further information.
Fair Value of Financial Instruments.
The financial instruments of the Company are reported on the Consolidated Balance Sheets at market or fair values or at carrying amounts that approximate fair values.
Receivables.
Receivables consist primarily of monthly advisory and other fees owed to the Company by USGIF as well as receivables related to ETF and offshore investment advisory fees. Receivables also include advisory fees owed to Galileo by the funds and clients it manages. Management considers various factors including current sales amounts, historical charge-offs and specific accounts identified as high risk. Uncollectible accounts receivable, if any, are charged against the allowance for doubtful accounts when all reasonable efforts to collect the amounts due have been exhausted. The Company had
no
allowance for doubtful accounts as of
June 30, 2015
, and
2014
.
38
Property and Equipment.
Fixed assets are recorded at cost. Except for Galileo, depreciation for fixed assets is recorded using the straight-line method over the estimated useful life of each asset as follows: furniture and equipment are depreciated over
3
to
10
years, and the building and related improvements are depreciated over
14
to
40
years. Galileo fixed assets, consisting of furniture, equipment and leasehold improvements, are depreciated over
2
to
5
years.
Impairment of Long-Lived Assets.
The Company reviews property and equipment and other long-lived assets for impairment whenever events or changes in business circumstances indicate the net book values of the assets may not be recoverable. Impairment is indicated when the assets’ net book value is less than fair value of the asset. If this occurs, an impairment loss is recognized for the difference between the fair value and net book value. Factors that indicate potential impairment include: a significant decrease in the market value of the asset or a significant change in the asset’s physical condition or use. No impairments of long-lived assets were recorded during the years included in these financial statements.
Intangible Asset.
An intangible asset, consisting of a non-compete agreement, acquired in connection with the acquisition of Galileo shares effective
June 1, 2014
, is recorded at fair value determined using a discounted cash flow model as of the date of acquisition. The discounted cash flow model included various factors to project future cash flows expected to be generated from the asset, including: (1) an estimated rate of change for underlying managed assets; (2) expected revenue per managed assets; (3) incremental operating expenses; and (4) a discount rate. Management estimates a rate of change for underlying managed assets based on an estimated net redemption or sales rate. Expected revenue per managed assets and incremental operating expenses of the acquired assets are generally based on contract terms.
The Company has determined that the non-compete agreement has a finite useful life. The Company will amortize this finite-lived identifiable intangible asset on a straight-line basis over its estimated useful life, currently expected to be approximately
2
years. Management periodically evaluates the remaining useful lives and carrying values of intangible assets to determine whether events and circumstances indicate that a change in the useful life or impairment in value may have occurred. Indicators of impairment monitored by management include a decline in the level of managed assets, changes to contractual provisions underlying the intangible assets and reductions in underlying operating cash flows. Should there be an indication of a change in the useful life or impairment in value of the finite-lived intangible asset, the Company compares the carrying value of the asset and its related useful life to the projected discounted cash flows expected to be generated from the underlying managed assets over its remaining useful life to determine whether impairment has occurred. If the carrying value of the asset exceeds the discounted cash flows, the asset is written down to its fair value determined using discounted cash flows.
Non-Controlling Interests.
The Company reports “non-controlling interest in subsidiary” as equity, separate from parent’s equity, on the Consolidated Balance Sheets. In addition, the Company’s Consolidated Statements of Operations includes “net income (loss) attributable to non-controlling interest.”
Treasury Stock.
Treasury stock purchases are accounted for under the cost method. The subsequent issuances of these shares are accounted for based on their weighted-average cost basis.
Stock-Based Compensation.
Stock-based compensation expense is measured at the grant date based on the fair value of the award, and the cost is recognized as expense ratably over the award’s vesting period.
Income Taxes.
The Company and its non-Canadian subsidiaries file a consolidated federal income tax return. USCAN and Galileo file separate tax returns in Canada. Provisions for income taxes include deferred taxes for temporary differences in the bases of assets and liabilities for financial and tax purposes resulting from the use of the liability method of accounting for income taxes. The liability method requires that deferred tax assets be reduced by a valuation allowance in cases where it is more likely than not that the deferred tax assets will not be realized.
The Company accounts for income taxes in accordance with ASC 740,
Income Taxes.
The Company’s policy is to recognize interest and penalties related to uncertain tax positions in income tax expense. As of
June 30, 2015
, the Company did not have any accrued interest or penalties related to uncertain tax positions. The tax years from
2011
through
2014
remain open to examination by the U.S. Federal tax jurisdictions to which the Company is subject. The tax years from
2008
through
2014
remain open to examination by the non-U.S. Federal tax jurisdictions to which the Company is subject.
Revenue Recognition.
The Company earns substantially all of its revenues from advisory, distribution services, and administrative fees that are calculated as a percentage of assets under management and are recorded as revenue as services are performed. Offshore advisory client contracts provide for monthly management fees, in addition to performance fees. The advisory contract for the equity funds within USGIF provides for a performance fee on the base advisory fee that are calculated and recorded monthly. Shareholder services fees are based on the assets of the funds held through institutions. Revenue shown on the Consolidated Statements of Operations is net of fee waivers.
Dividends and Interest.
Dividends are recorded on the ex-dividend date, and interest income is recorded on an accrual basis. Both dividends and interest income are included in investment income.
39
Advertising Costs.
The Company expenses advertising costs as they are incurred. Certain sales materials, which are considered tangible assets, are capitalized and then expensed during the period in which they are distributed. Net advertising expenditures were
$411,000
;
$615,000
; and
$862,000
during fiscal years
2015
,
2014
, and
2013
, respectively.
Foreign Exchange.
The balance sheets of certain foreign subsidiaries of the Company and certain foreign-denominated investment products are translated at the current exchange rate as of the end of the accounting period and the related income or loss is translated at the average exchange rate in effect during the period. Net exchange gains and losses resulting from these translations are excluded from income and are recorded in “accumulated other comprehensive income (loss)” on the Consolidated Balance Sheets. Investment transactions denominated in foreign currencies are converted to U.S. dollars using the exchange rate on the date of the transaction and any related gain or loss is included in “investment income (loss)” on the Consolidated Statements of Operations.
Use of Estimates.
The preparation of the consolidated financial statements in conformity with generally accepted accounting principles requires the Company to make estimates and assumptions that affect the amounts reported in the consolidated financial statements and accompanying notes. Actual results could differ from these estimates.
Earnings Per Share.
The Company computes and presents earnings per share attributable to U.S. Global Investors, Inc. in accordance with ASC 260,
Earnings Per Share
. Basic earnings per share (“EPS”) excludes dilution and is computed by dividing net income (loss) attributable to U.S. Global Investors, Inc. by the weighted average number of common shares outstanding for the period. Diluted EPS reflects the potential dilution of EPS that could occur if options to issue common stock were exercised. The Company has two classes of common stock with outstanding shares. Both classes share equally in dividend and liquidation preferences.
Accumulated Other Comprehensive Income (Loss).
Accumulated other comprehensive income (loss) (“AOCI”), net of tax is reported in the Consolidated Balance Sheets and the Consolidated Statements of Shareholders’ Equity and includes the unrealized gains and losses on securities classified as available-for-sale and
foreign currency translation adjustments.
Recent Accounting Pronouncements
In April 2014, the FASB issued Accounting Standard Update (“ASU”) No. 2014-08,
Presentation of Financial Statements and Property, Plant, and Equipment - Reporting Discontinued Operations and Disclosures of Disposals of Components of an Entity
(“ASU 2014-08”)
.
ASU 2014-08 will become effective for the Company on July 1, 2015. Management is evaluating the ASU and its potential impact on the financial statements.
In May 2014, the FASB issued ASU No. 2014-09,
Revenue from Contracts with Customers
(“ASU 2014-09”), which supersedes nearly all existing revenue recognition guidance under U.S. GAAP. The core principle of ASU 2014-09 is to recognize revenues when promised goods or services are transferred to customers in an amount that reflects the consideration to which an entity expects to be entitled for those goods or services. ASU 2014-09 defines a five-step process to achieve this core principle and, in doing so, more judgment and estimates may be required within the revenue recognition process than are required under existing U.S. GAAP.
The standard is effective for annual periods beginning after December 15, 2017, and interim periods therein, using either of the following transition methods: (i) a full retrospective approach reflecting the application of the standard in each prior reporting period with the option to elect certain practical expedients, or (ii) a retrospective approach with the cumulative effect of initially adopting ASU 2014-09 recognized at the date of adoption (which includes additional footnote disclosures). We are currently evaluating the impact of our pending adoption of ASU 2014-09 on our consolidated financial statements and have not yet determined the method by which we will adopt the standard in 2018.
In August 2014, the FASB issued ASU 2014-15,
Disclosure of Uncertainties about an Entity's Ability to Continue as a Going
Concern
(“ASU 2014-15”). This update requires an entity's management to evaluate whether there are conditions or events,
considered in the aggregate, that raise substantial doubt about the entity's ability to continue as a going concern within one year
after the date that the financial statements are issued (or within one year after the date that the financial statements are available
to be issued when applicable). When conditions or events raise substantial doubts about an entity’s ability to continue as a going concern, management shall disclose: i) the principal conditions or events that raise substantial doubt about the entity's ability to continue as a going concern; ii) management's evaluation of the significance of those conditions or events in relation to the entity's ability to meet its obligations; and iii) management's plans that are intended to mitigate the conditions or events - and whether or not those plans alleviate the substantial doubt about the entity's ability to continue as a going concern. ASU 2014-15 is effective for the annual period ending after December 15, 2016, and early application is permitted. Management does not currently anticipate that this update will have any impact on the Company’s financial statement disclosures.
40
In November 2014, the FASB issued ASU 2014-17,
Business Combinations: Pushdown Accounting
(“ASU 2014-17”). ASU
2014-17 provides companies with the option to apply pushdown accounting in its separate financial statements upon occurrence of an event in which an acquirer obtains control of the acquired entity. The election to apply pushdown accounting can be made either in the period in which the change of control occurred, or in a subsequent period. If the election is made in a subsequent period, it would be considered a change in accounting principle and treated in accordance with Topic 250, Accounting Changes
and Error Corrections
. ASU 2014-17 became effective for the Company on November 18, 2014. The adoption of ASU 2014-17 was not material to the consolidated financial statements.
In February 2015, the FASB issued ASU 2015-02,
Amendments to the Consolidation Analysis
(“ASU 2015-02”), which amends the consolidation requirements in Accounting Standards Codification (“ASC”) 810, Consolidation. This standard modifies existing consolidation guidance for reporting organizations that are required to evaluate whether they should consolidate certain legal entities. ASU 2015-02 is effective for fiscal years and interim periods within those years beginning after December 15, 2015, and requires either a retrospective or a modified retrospective approach to adoption. Early adoption is permitted. The Company is currently evaluating the potential impact of this standard on its consolidated financial statements, as well as the available transition methods.
In May 2015, the FASB issued ASU 2015-07,
Disclosures for Investments in Certain Entities That Calculate Net Asset Value per Share (or Its Equivalent)
(“ ASU 2015-07”). ASU 2015-07 removes the requirement to categorize within the fair value hierarchy all investments for which fair value is measured using the NAV per share practical expedient. The update is effective for interim and annual reporting periods in fiscal years beginning after December 15, 2015, and early adoption is permitted. The update requires the retrospective adoption approach. The Company is currently evaluating the potential impact of this standard on its consolidated financial statements.
Effective
March 31, 2013
, the Company, through USCAN, purchased
50 percent
of the issued and outstanding shares of Galileo Global Equity Advisors, Inc., a privately held Toronto-based asset management firm, for
$600,000
cash.
Effective
June 1, 2014
, the Company, through USCAN, completed its purchase of an additional
15 percent
interest in Galileo from the company’s founder, Michael Waring, for
$180,000
cash. This strategic investment brought USCAN’s ownership to
65 percent
of the issued and outstanding shares of Galileo, which represents a controlling interest of Galileo. Through Galileo, the Company expects to increase its presence in Canada. The non-controlling interest in this subsidiary is included in “non-controlling interest in subsidiaries” in the equity section of the Consolidated Balance Sheets. Frank Holmes, CEO, and Susan McGee, President and General Counsel, serve as directors of Galileo.
From
March 31, 2013
, to
June 1, 2014
, the Company accounted for its interest in Galileo under the equity method with its share of Galileo’s profit or loss recognized in earnings.
$20,000
and
$54,000
was included in other income in fiscal year 2014 and 2013, respectively.
The Company accounted for the
June 1, 2014
, Galileo share purchase using the acquisition method of accounting, which requires, among other things, that the fair values of assets acquired, including an intangible asset, and liabilities assumed, along with the fair value of the non-controlling interest in the subsidiary, be recognized on the Consolidated Balance Sheets as of the acquisition date.
Business combinations achieved in stages also must value prior investments at fair value. A
$161,000
increase in fair value of the Company’s initial investment was recognized as a gain and included in investment income in fiscal year 2014.
The Company recognized a gain of
$129,000
on the
June 1, 2014
, purchase since the fair value of the net assets acquired was greater than the fair value of consideration given. This gain was also included in investment income in fiscal 2014.
41
The Consolidated Balance Sheet as of June 30, 2014, reflects the purchase price allocations based on an assessment of the fair value of the assets acquired, liabilities assumed and non-controlling interest in subsidiary. The table below presents the purchase price allocation as of the
June 1, 2014
, acquisition date:
|
(dollars in thousands)
|
||||
|
Fair value of acquisition components
|
||||
|
Current assets
|
|
$
|
1,788
|
|
|
Property and equipment
|
|
149
|
|
|
|
Intangible asset re: non-compete agreement
|
|
90
|
|
|
|
Other noncurrent assets
|
|
13
|
|
|
|
Current liabilities
|
|
(278
|
)
|
|
|
Non-controlling interest in subsidiary
|
|
(617
|
)
|
|
|
Gain on purchase of 15%
|
|
(129
|
)
|
|
|
$
|
1,016
|
|
||
|
Fair value of consideration as of June 1, 2014
|
||||
|
Fair value of March 31, 2013 initial investment for 50% of stock
|
$
|
836
|
|
|
|
June 1, 2014 acquisition for 15% of stock for cash
|
180
|
|
||
|
$
|
1,016
|
|
||
The following unaudited pro forma condensed consolidated results of operations for the years ended
2014
and
2013
are presented as if the Galileo acquisition had been completed on July 1, 2012. The unaudited pro forma results do not include any adjustments to eliminate the impact of cost savings or other synergies that may result from the acquisition. In addition, the unaudited pro forma results of operations do not purport to be indicative of the actual results that would have been achieved by the combined company for the periods presented or that may be achieved by the combined company in the future.
The information below reflects certain nonrecurring adjustments to remove the Company’s equity in earnings of Galileo and include amortization of the intangible asset.
|
|
|
Year Ended June 30,
|
|||||||
|
(dollars in thousands)
|
2014
|
2013
|
|||||||
|
Operating revenues
|
|
|
$
|
13,771
|
|
|
$
|
20,234
|
|
|
Net loss
|
|
|
(856
|
)
|
|
(13
|
)
|
||
|
Net loss attributable to U.S. Global Investors, Inc.
|
|
|
(916
|
)
|
|
(99
|
)
|
||
|
Net Loss per Share
|
|
||||||||
|
Loss from continuing operations - basic
|
|
|
$
|
(0.04
|
)
|
|
$
|
0.00
|
|
|
Loss from continuing operations - diluted
|
|
|
(0.04
|
)
|
|
0.00
|
|
||
Post-Acquisition Financial Information
The following amounts associated with the acquisition of Galileo, subsequent to the
June 1, 2014
, effective date, are included in the Consolidated Statements of Operations:
|
Year Ended June 30,
|
||||
|
(dollars in thousands)
|
2014
|
|||
|
Total revenues
|
|
$
|
234
|
|
|
Net income
|
18
|
|
||
|
Net income attributable to U.S. Global Investors, Inc.
|
|
12
|
|
|
|
Costs associated with the acquisition
1
|
|
33
|
|
|
|
1.
|
Costs associated with the Galileo acquisition are included in general
and administrative expenses in the Consolidated Statements of Operations.
|
42
The Company’s Board of Directors formally agreed on August 23, 2013, to exit the transfer agency business so that the Company could focus more on its core strength of investment management. USSI served as transfer agent until conversion to a third-party transfer agent on December 9, 2013.
The transfer agency results, together with expenses associated with discontinuing transfer agency operations, are reflected as “discontinued operations” in the Consolidated Statements of Operations and are therefore, excluded from continuing operations results. These expenses include approximately
$65,000
of expenses related to leased equipment that will not be utilized. Comparative periods shown in the Consolidated Financial Statements have been adjusted to conform to this presentation.
As of
June 30, 2015
, remaining liabilities related to the transfer agency business were immaterial.
The components of loss from discontinued operations were as follows:
|
|
Year Ended June 30,
|
|||||||||||
|
(dollars in thousands)
|
2015
|
|
2014
|
|
2013
|
|||||||
|
Operating revenue
|
$
|
—
|
|
$
|
529
|
|
$
|
1,348
|
|
|||
|
Operating expenses
|
—
|
|
897
|
|
1,598
|
|
||||||
|
Loss from discontinued operations before income taxes
|
—
|
|
(368
|
)
|
(250
|
)
|
||||||
|
Income tax benefit
|
—
|
|
(125
|
)
|
(85
|
)
|
||||||
|
Loss from discontinued operations, net of tax
|
$
|
—
|
|
$
|
(243
|
)
|
$
|
(165
|
)
|
|||
As of
June 30, 2015
, the Company held investments with a fair value of
$19.9 million
and a cost basis of
$21.1 million
. The market value of these investments is approximately
64.7 percent
of the Company’s total assets. In addition, the Company held other investments of
$2.3 million
accounted for under the cost method of accounting.
Investments in securities classified as trading are reflected as current assets on the Consolidated Balance Sheets at their fair market value. Unrealized gains and losses on trading securities are included in earnings in the Consolidated Statements of Operations.
Investments in securities classified as available-for-sale, which may not be readily marketable but have readily determinable fair values, are reflected as non-current assets on the Consolidated Balance Sheets at their fair value. Unrealized gains and losses on available-for-sale securities are excluded from earnings and reported in other comprehensive income (loss) as a separate component of shareholders’ equity until realized.
Other investments consist of equity investments in entities over which the Company is unable to exercise significant influence and which do not have readily determinable fair values. These equity investments are accounted for under the cost method of accounting and evaluated for impairment. The Company considers many factors in determining impairment, including the severity and duration of the decline in value below cost, the Company’s interest and ability to hold the security for a period of time sufficient for an anticipated recovery in value, and the financial condition and specific events related to the issuer. When an impairment of an equity security is determined to be other-than-temporary, the impairment is recognized in earnings.
In December 2013, the shareholders of the U.S. Government Securities Savings Fund approved a proposal resulting in the conversion of the fund from a money market fund to a U.S. Government ultra-short bond fund that is not a money market fund. The fund was renamed U.S. Government Securities Ultra-Short Bond Fund (“Government Fund”). Prior to the conversion, while the fund was a money market fund, the amount held in the fund was classified as a cash equivalent. After the conversion, the amount held in the fund is classified as a Level 1 trading mutual fund investment. The amount held in the fund by the Company as of the conversion date was
$14.1 million
.
43
The following details the components of the Company’s investments recorded at fair value as of
June 30, 2015
, and
2014
:
|
|
June 30, 2015
|
|||||||||||||||
|
(dollars in thousands)
|
Cost
|
Gains
|
(Losses)
|
Fair Value
|
||||||||||||
|
Trading securities
1
|
||||||||||||||||
|
Offshore fund
|
$
|
1,184
|
|
$
|
—
|
|
$
|
(703
|
)
|
$
|
481
|
|
||||
|
Mutual funds - Fixed income
|
14,691
|
|
68
|
|
(5
|
)
|
14,754
|
|
||||||||
|
Mutual funds - Domestic equity
|
535
|
|
—
|
|
(130
|
)
|
405
|
|
||||||||
|
Other
|
81
|
|
—
|
|
(81
|
)
|
—
|
|
||||||||
|
Total trading securities
|
$
|
16,491
|
|
$
|
68
|
|
$
|
(919
|
)
|
$
|
15,640
|
|
||||
|
Available-for-sale securities
2
|
||||||||||||||||
|
Common stock - Domestic
|
$
|
535
|
|
$
|
316
|
|
$
|
(9
|
)
|
$
|
842
|
|
||||
|
Common stock - International
|
695
|
|
309
|
|
(39
|
)
|
965
|
|
||||||||
|
Corporate debt
|
1,433
|
|
—
|
|
(817
|
)
|
616
|
|
||||||||
|
Mutual funds - Fixed income
|
1,227
|
|
9
|
|
(22
|
)
|
1,214
|
|
||||||||
|
Mutual funds - Domestic equity
|
543
|
|
—
|
|
(80
|
)
|
463
|
|
||||||||
|
Other
|
169
|
|
1
|
|
(7
|
)
|
163
|
|
||||||||
|
Total available-for-sale securities
3
|
$
|
4,602
|
|
$
|
635
|
|
$
|
(974
|
)
|
$
|
4,263
|
|
||||
|
|
June 30, 2014
|
|||||||||||||||
|
(dollars in thousands)
|
Cost
|
Gains
|
(Losses)
|
Fair Value
|
||||||||||||
|
Trading securities
1
|
||||||||||||||||
|
Offshore fund
|
$
|
1,184
|
|
$
|
—
|
|
$
|
(186
|
)
|
$
|
998
|
|
||||
|
Mutual funds - Fixed income
|
16,241
|
|
92
|
|
—
|
|
16,333
|
|
||||||||
|
Mutual funds - Domestic equity
|
535
|
|
—
|
|
(76
|
)
|
459
|
|
||||||||
|
Other
|
107
|
|
—
|
|
(80
|
)
|
27
|
|
||||||||
|
Total trading securities
|
$
|
18,067
|
|
$
|
92
|
|
$
|
(342
|
)
|
$
|
17,817
|
|
||||
|
Available-for-sale securities
2
|
||||||||||||||||
|
Common stock - Domestic
|
$
|
535
|
|
$
|
586
|
|
$
|
(3
|
)
|
$
|
1,118
|
|
||||
|
Common stock - International
|
607
|
|
802
|
|
—
|
|
1,409
|
|
||||||||
|
Corporate debt
|
1,706
|
|
—
|
|
(74
|
)
|
1,632
|
|
||||||||
|
Mutual funds - Fixed income
|
1,228
|
|
21
|
|
(2
|
)
|
1,247
|
|
||||||||
|
Mutual funds - Domestic equity
|
543
|
|
7
|
|
—
|
|
550
|
|
||||||||
|
Other
|
232
|
|
9
|
|
(1
|
)
|
240
|
|
||||||||
|
Total available-for-sale securities
3
|
$
|
4,851
|
|
$
|
1,425
|
|
$
|
(80
|
)
|
$
|
6,196
|
|
||||
|
1
|
Unrealized and realized gains and losses on trading securities are included in earnings in the statement of operations.
|
|
2
|
Unrealized gains and losses on available-for-sale securities are excluded from earnings and recorded in other comprehensive income (loss) as a separate component of shareholders’ equity until realized.
|
|
3
|
Net unrealized gains (losses) on available-for-sale securities gross and net of tax as of
June 30, 2015
, are
$(339)
and
$(339)
, respectively, and as of
June 30, 2014
, are
$1,345
and
$888
, respectively.
|
44
The following summarizes investment income (loss) reflected in earnings for the periods presented:
|
(dollars in thousands)
|
Year Ended June 30,
|
|||||||||||
|
Investment Income (Loss)
|
2015
|
2014
|
2013
|
|||||||||
|
Realized losses on sales of trading securities
|
$
|
(1
|
)
|
$
|
(163
|
)
|
$
|
(245
|
)
|
|||
|
Realized gains on sales of available-for-sale securities
|
591
|
|
1,044
|
|
266
|
|
||||||
|
Realized losses on sales of securities classified as other investments
|
(30
|
)
|
—
|
|
—
|
|
||||||
|
Unrealized gains (losses) on trading securities
|
(601
|
)
|
450
|
|
45
|
|
||||||
|
Realized gain on Galileo acquisition
|
|
—
|
|
|
290
|
|
|
—
|
|
|||
|
Realized foreign currency gains
|
71
|
|
1
|
|
1
|
|
||||||
|
Other-than-temporary declines in available-for-sale securities
|
(247
|
)
|
(3
|
)
|
(47
|
)
|
||||||
|
Dividend and interest income
|
651
|
|
526
|
|
188
|
|
||||||
|
Total Investment Income (Loss)
|
$
|
434
|
|
$
|
2,145
|
|
$
|
208
|
|
|||
Included in investment income were other-than-temporary impairments of
$247,000
;
$3,000
; and
$47,000
in fiscal years
2015
,
2014
, and
2013
, respectively. The impairment in fiscal year
2015
resulted from the issuers of these corporate notes defaulting on scheduled payments.
One
security with a cost basis of
$44,000
was written down to its fair value of
$5,000
.
Two
other securities, for which the common issuer has resumed interest payments, were written down to the net present value of estimated cash flows. These securities had a cost basis of
$310,000
and
$1,102,000
, respectively, and were written down to
$234,000
and
$970,000
, respectively. In making these determinations, the Company considered the length of time and extent to which the fair value has been less than cost basis, financial condition and prospects of the issuers and the Company's ability to hold the investment until recovery.
Unrealized Losses
The following tables show the gross unrealized losses and fair values of available-for-sale investment securities with unrealized losses aggregated by investment category and length of time that individual securities have been in a continuous unrealized loss position:
|
|
June 30, 2015
|
|||||||||||||||||||||||
|
|
Less Than 12 Months
|
12 Months or Greater
|
Total
|
|||||||||||||||||||||
|
(dollars in thousands)
|
Fair
Value
|
Gross
Unrealized
Losses
|
Fair
Value
|
Gross
Unrealized
Losses
|
Fair
Value
|
Gross
Unrealized
Losses
|
||||||||||||||||||
|
Available-for-sale securities
|
||||||||||||||||||||||||
|
Common stock - Domestic
|
$
|
77
|
|
$
|
(7
|
)
|
$
|
107
|
|
$
|
(2
|
)
|
$
|
184
|
|
$
|
(9
|
)
|
||||||
|
Common stock - International
|
114
|
|
(23
|
)
|
39
|
|
(16
|
)
|
153
|
|
(39
|
)
|
||||||||||||
|
Corporate debt
|
386
|
|
(817
|
)
|
—
|
|
—
|
|
386
|
|
(817
|
)
|
||||||||||||
|
Mutual funds - Fixed income
|
67
|
|
(7
|
)
|
139
|
|
(15
|
)
|
206
|
|
(22
|
)
|
||||||||||||
|
Mutual funds - Domestic equity
|
463
|
|
(80
|
)
|
—
|
|
—
|
|
463
|
|
(80
|
)
|
||||||||||||
|
Other
|
112
|
|
(7
|
)
|
—
|
|
—
|
|
112
|
|
(7
|
)
|
||||||||||||
|
Total available-for-sale securities
|
$
|
1,219
|
|
$
|
(941
|
)
|
$
|
285
|
|
$
|
(33
|
)
|
$
|
1,504
|
|
$
|
(974
|
)
|
||||||
|
|
June 30, 2014
|
|||||||||||||||||||||||
|
|
Less Than 12 Months
|
12 Months or Greater
|
Total
|
|||||||||||||||||||||
|
(dollars in thousands)
|
Fair
Value
|
Gross
Unrealized
Losses
|
Fair
Value
|
Gross
Unrealized
Losses
|
Fair
Value
|
Gross
Unrealized
Losses
|
||||||||||||||||||
|
Available-for-sale securities
|
||||||||||||||||||||||||
|
Common stock - Domestic
|
$
|
125
|
|
$
|
(3
|
)
|
$
|
—
|
|
$
|
—
|
|
$
|
125
|
|
$
|
(3
|
)
|
||||||
|
Corporate debt
|
1,382
|
|
(74
|
)
|
—
|
|
—
|
|
1,382
|
|
(74
|
)
|
||||||||||||
|
Mutual funds - Fixed income
|
151
|
|
(2
|
)
|
—
|
|
—
|
|
151
|
|
(2
|
)
|
||||||||||||
|
Other
|
118
|
|
(1
|
)
|
—
|
|
—
|
|
118
|
|
(1
|
)
|
||||||||||||
|
Total available-for-sale securities
|
$
|
1,776
|
|
$
|
(80
|
)
|
$
|
—
|
|
$
|
—
|
|
$
|
1,776
|
|
$
|
(80
|
)
|
||||||
45
Fair Value Hierarchy
ASC 820,
Fair Value Measurement and Disclosures
, defines fair value as the price that would be received to sell an asset or paid to transfer a liability in an orderly transaction between market participants at the measurement date. ASC 820 establishes a hierarchy that prioritizes inputs to valuation techniques used to measure fair value and requires companies to disclose the fair value of their financial instruments according to a fair value hierarchy (i.e., Levels 1, 2, and 3 inputs, as defined below). The fair value hierarchy gives the highest priority to quoted prices in active markets for identical assets or liabilities and the lowest priority to unobservable inputs. Additionally, companies are required to provide enhanced disclosures regarding instruments in the Level 3 category (which have inputs to the valuation techniques that are unobservable and require significant management judgment), including a reconciliation of the beginning and ending values separately for each major category of assets or liabilities.
Financial instruments measured and reported at fair value are classified and disclosed in one of the following categories:
Level 1 – Valuations based on quoted prices in active markets for identical assets or liabilities at the reporting date. Since valuations are based on quoted prices that are readily and regularly available in an active market, value of these products does not entail a significant degree of judgment.
Level 2 – Valuations based on quoted prices in markets for which not all significant inputs are observable, directly or indirectly. Corporate debt securities valued in accordance with the evaluated price supplied by an independent service are categorized as Level 2 in the hierarchy. Other securities categorized as Level 2 included securities valued at the mean between the last reported bid and ask quotation.
Level 3 – Valuations based on inputs that are unobservable and significant to the fair value measurement.
The Company’s assessment of the significance of a particular input to the fair value measurement in its entirety requires judgment and considers factors specific to the financial instrument. The inputs or methodology used for valuing securities are not necessarily an indication of the risk associated with the investing in those securities. Because of the inherent uncertainties of valuation, the values reflected may materially differ from the values received upon actual sale of those investments.
For actively traded securities, the Company values investments using the closing price of the securities on the exchange or market on which the securities principally trade. If the security is not traded on the last business day of the quarter, it is generally valued at the mean between the last bid and ask quotation. Mutual funds, which include open- and closed-end funds, exchange-traded funds, and offshore funds are valued at net asset value or closing price, as applicable. Certain corporate debt securities are valued by an independent pricing service using an evaluated quote based on such factors as institutional-size trading in similar groups of securities, yield, quality maturity, coupon rate, type of issuance and individual trading characteristics and other market data. As part of its independent price verification process, the Company periodically reviews the fair value provided by the pricing service using information such as transactions in these investments, broker quotes, market transactions in comparable investments, general market conditions and the issuer’s financial condition. Debt securities that are not valued by an independent pricing service are valued based on review of similarly structured issuances in similar jurisdictions when possible. The Company also takes into consideration numerous other factors that could affect valuation such as overall market conditions, liquidity of the security and bond structure. Securities for which market quotations are not readily available are valued at their fair value as determined by the portfolio management team. The portfolio management team includes representatives from the investment, accounting and legal/compliance departments. The portfolio management team meets periodically to consider a number of factors in determining a security’s fair value, including the security’s trading volume, market values of similar class issuances, investment personnel’s judgment regarding the market experience of the issuer, financial status of the issuer, the issuer’s management, and back testing, as appropriate. The fair values may differ from what may have been used had a broader market for these securities existed. The portfolio management team reviews inputs and assumptions and reports material items to the Board of Directors.
46
The following presents fair value measurements, as of each balance sheet date, for the major categories of U.S. Global’s investments measured at fair value on a recurring basis:
|
|
June 30, 2015
|
|||||||||||||||
|
Fair Value Measurement using
|
||||||||||||||||
|
(dollars in thousands)
|
Quoted Prices
(Level 1)
|
Significant Other
Inputs
(Level 2)
|
Significant
Unobservable Inputs
(Level 3)
|
Total
|
||||||||||||
|
Trading securities
|
||||||||||||||||
|
Offshore fund
|
$
|
—
|
|
$
|
481
|
|
$
|
—
|
|
$
|
481
|
|
||||
|
Mutual funds - Fixed income
|
14,754
|
|
—
|
|
—
|
|
14,754
|
|
||||||||
|
Mutual funds - Domestic equity
|
405
|
|
—
|
|
—
|
|
405
|
|
||||||||
|
Other
|
—
|
|
—
|
|
—
|
|
—
|
|
||||||||
|
Total trading securities
|
15,159
|
|
481
|
|
—
|
|
15,640
|
|
||||||||
|
Available-for-sale securities
|
||||||||||||||||
|
Common stock - Domestic
|
842
|
|
—
|
|
—
|
|
842
|
|
||||||||
|
Common stock - International
|
965
|
|
—
|
|
—
|
|
965
|
|
||||||||
|
Corporate debt
|
—
|
|
77
|
|
539
|
|
616
|
|
||||||||
|
Mutual funds - Fixed income
|
1,214
|
|
—
|
|
—
|
|
1,214
|
|
||||||||
|
Mutual funds - Domestic equity
|
463
|
|
—
|
|
—
|
|
463
|
|
||||||||
|
Other
|
163
|
|
—
|
|
—
|
|
163
|
|
||||||||
|
Total available-for-sale securities
|
3,647
|
|
77
|
|
539
|
|
4,263
|
|
||||||||
|
Total
|
$
|
18,806
|
|
$
|
558
|
|
$
|
539
|
|
$
|
19,903
|
|
||||
|
|
June 30, 2014
|
|||||||||||||||
|
Fair Value Measurement using
|
||||||||||||||||
|
(dollars in thousands)
|
Quoted Prices
(Level 1)
|
Significant Other
Inputs
(Level 2)
|
Significant
Unobservable Inputs
(Level 3)
|
Total
|
||||||||||||
|
Trading securities
|
||||||||||||||||
|
Offshore fund
|
$
|
—
|
|
$
|
998
|
|
$
|
—
|
|
$
|
998
|
|
||||
|
Mutual funds - Fixed income
|
16,333
|
|
—
|
|
—
|
|
16,333
|
|
||||||||
|
Mutual funds - Domestic equity
|
459
|
|
—
|
|
—
|
|
459
|
|
||||||||
|
Other
|
27
|
|
—
|
|
—
|
|
27
|
|
||||||||
|
Total trading securities
|
16,819
|
|
998
|
|
—
|
|
17,817
|
|
||||||||
|
Available-for-sale securities
|
||||||||||||||||
|
Common stock - Domestic
|
1,118
|
|
—
|
|
—
|
|
1,118
|
|
||||||||
|
Common stock - International
|
1,406
|
|
3
|
|
—
|
|
1,409
|
|
||||||||
|
Corporate debt
|
292
|
|
1,090
|
|
250
|
|
1,632
|
|
||||||||
|
Mutual funds - Fixed income
|
1,247
|
|
—
|
|
—
|
|
1,247
|
|
||||||||
|
Mutual funds - Domestic equity
|
550
|
|
—
|
|
—
|
|
550
|
|
||||||||
|
Other
|
240
|
|
—
|
|
—
|
|
240
|
|
||||||||
|
Total available-for-sale securities
|
4,853
|
|
1,093
|
|
250
|
|
6,196
|
|
||||||||
|
Total
|
$
|
21,672
|
|
$
|
2,091
|
|
$
|
250
|
|
$
|
24,013
|
|
||||
As of
June 30, 2015
, approximately
94 percent
of the Company’s financial assets measured at fair value are derived from Level 1 inputs,
three percent
are derived from Level 2 inputs and the remaining
three percent
are Level 3 inputs. As of
June 30, 2014
, approximately
90 percent
of the Company’s financial assets measured at fair value are derived from Level 1 inputs,
nine percent
are derived from Level 2 inputs and the remaining
one percent
are Level 3 inputs. The Company recognizes transfers between levels at the end of each quarter.
In Level 2, the Company has an investment in an affiliated offshore fund, classified as trading, with a fair value of
$481,000
and
$998,000
as of
June 30, 2015
, and
2014
, respectively, based on the net asset value per share, which invests in companies in the
47
energy and natural resources sectors. The Company may redeem this investment on the first business day of each month after providing a redemption notice at least
forty-five
days prior to the proposed redemption date.
In addition, the Company has investments in corporate debt securities, classified as available-for-sale, of
$77,000
and
$1.1 million
as of
June 30, 2015
, and
June 30, 2014
, respectively, categorized as Level 2 which the Company valued in accordance with the evaluated price supplied by an independent service or valued using the mean between the last reported bid ask quotation.
The corporate debt in Level 3 is valued based on review of similarly structured issuances in similar jurisdictions. At
June 30, 2015
, Level 3 corporate debt is valued at cost, which approximates fair value as a result of the Company’s review of similarly structured issuances in comparable jurisdictions or valued based on traded issuances from the issuer.
During the year ended June 30, 2014, approximately
$385,000
in investments in private and venture capital securities were transferred out of available-for-sale Level 3 assets and classified as other investments. During the year ended June 30, 2015, approximately
$343,000
in investments in available-for-sale corporate debt securities were transferred from level 2 into Level 3.
The following table is a reconciliation of investments recorded at fair value for which unobservable inputs (Level 3) were used in determining fair value during the years ended
June 30, 2015
, and
2014
:
|
|
|
Changes in Level 3 Assets Measured at Fair Value on a Recurring Basis
|
||||||||||||||
|
|
|
Year Ended June 30,
|
||||||||||||||
|
|
|
2015
|
2014
|
|||||||||||||
|
(dollars in thousands)
|
|
Corporate Debt
|
Common Stock - International
|
Corporate Debt
|
Other
|
|||||||||||
|
Beginning Balance
|
|
$
|
250
|
|
|
$
|
95
|
|
$
|
—
|
|
$
|
163
|
|
||
|
Return of capital
|
|
(25
|
)
|
|
—
|
|
—
|
|
(43
|
)
|
||||||
|
Total gains or losses (realized/unrealized)
|
|
|
||||||||||||||
|
Included in earnings (investment income)
|
|
(133
|
)
|
|
—
|
|
—
|
|
—
|
|
||||||
|
Included in other comprehensive income (loss)
|
|
104
|
|
|
5
|
|
—
|
|
5
|
|
||||||
|
Purchases
|
|
—
|
|
|
—
|
|
250
|
|
160
|
|
||||||
|
Sales
|
|
—
|
|
|
—
|
|
—
|
|
—
|
|
||||||
|
Transfers into Level 3
|
|
343
|
|
|
—
|
|
—
|
|
—
|
|
||||||
|
Transfers out of Level 3
|
|
—
|
|
|
(100
|
)
|
—
|
|
(285
|
)
|
||||||
|
Ending Balance
|
|
$
|
539
|
|
|
$
|
—
|
|
|
$
|
250
|
|
|
$
|
—
|
|
The Company serves as investment adviser to USGIF and receives a fee based on a specified percentage of net assets under management.
The advisory agreement for the equity funds within USGIF provides for a base advisory fee that is adjusted upwards or downwards by
0.25 percent
if there is a performance difference of
5 percent
or more between a fund’s performance and that of its designated benchmark index over the prior rolling
12
months. For the years ended
June 30, 2015
,
2014
, and
2013
, the Company realized a decrease in its base advisory fee of
$1,000,000
;
$815,000
; and
$133,000
; respectively.
The following changes were made during fiscal year 2014 to the mutual funds the Company manages: (1) the Global Emerging Markets Fund liquidated on October 31, 2013, (2) the MegaTrends Fund was reorganized into the Holmes Growth Fund (renamed Holmes Macro Trends Fund), (3) the Tax Free Fund was reorganized into the Near-Term Tax Free Fund, (4) the U.S. Government Securities Savings Fund changed from a money market fund to the U.S. Government Securities Ultra-Short Bond Fund, and (5) the U.S. Treasury Securities Cash Fund was liquidated on December 27, 2013.
The Company has agreed to contractually limit the expenses of the Near-Term Tax Free Fund through
April 2016
. The Company has voluntarily waived or reduced its fees and/or agreed to pay expenses on the remaining funds. These caps will continue on a voluntary basis at the Company’s discretion. The aggregate fees waived and expenses borne by the Company were
$1.3 million
;
$2.4 million
; and
$3.3 million
for the years ended
June 30, 2015
,
2014
, and
2013
, respectively. Management cannot predict the impact of future waivers due to the number of variables and the range of potential outcomes.
48
Prior to the U.S. Treasury Securities Cash Fund liquidation and the Government Fund conversion, the Company voluntarily agreed to waive fees and/or reimburse these funds to the extent necessary to maintain the respective fund’s yield at a certain level as determined by the Company (Minimum Yield). The above waived fees include fees waived and/or expenses reimbursed for these funds as a result of this agreement totaling
$583,000
and
$1.2 million
for the year ended
June 30, 2014
, and
June 30, 2013
, respectively.
The Company may recapture any fees waived and/or expenses reimbursed to maintain Minimum Yield within
three years
after the end of the funds’ fiscal year of such waiver and/or reimbursement to the extent that such recapture would not cause the funds’ yield to fall below the Minimum Yield. Thus,
$510,000
of the waiver for the Government Fund is recoverable by the Company through December 31,
2015
, and
$498,000
through December 31,
2016
. The U.S. Treasury Securities Cash Fund also had waivers subject to future recapture; however, because the fund was liquidated in December 2013, there will be no recapture.
In addition, effective December 2013, the Funds’ Board of Trustees increased the administrative services fees paid to the Company from an annual rate of
0.08 percent
to
0.10 percent
per investor class and from
0.06 percent
to
0.08 percent
per institutional class of each Fund, based on average daily net assets, plus
$10,000
per Fund. Effective November 1, 2014, the per fund fee changed to
$7,000
per year.
In connection with obtaining and/or providing administrative services to the beneficial owners of USGIF through broker-dealers, banks, trust companies and similar institutions which provide such services, the Company receives shareholder services fees at an annual rate of up to
0.20 percent
of the value of shares held in accounts at the institutions. The Company also receives distribution fees from USGIF based on average net assets.
The Company also serves as investment advisor to an ETF, U. S. Global Jets ETF, that commenced operations in April 2015. The Company receives a unitary management fee of
0.60
percent of average net assets and has agreed to bear all expenses of the ETF.
The Company provided advisory services to offshore clients and received a monthly advisory fee based on the net asset values of the clients and performance fees based on the overall increase in net asset values, if any.
One
of the offshore funds liquidated in November 2013. The contracts between the Company and the offshore clients expire periodically, and management anticipates that its remaining offshore clients will renew the contracts. The Company recorded advisory and performance fees from these clients totaling
$130,000
and
$0
for the year ended
June 30, 2015
;
$190,000
and
$4,000
for the year ended
June 30, 2014
; and
$299,000
and
$19,000
for the year ended
June 30, 2013
, respectively.
The Company’s Board of Directors formally agreed on August 23, 2013, to exit the transfer agency business so that the Company could focus more on its core strength of investment management. USSI served as transfer agent to USGIF until conversion to a third party transfer agent on December 9, 2013. Before the conversion, USSI received fees based on the number of shareholder accounts, transaction and activity-based fees and certain miscellaneous fees. The transfer agency fees are included in “discontinued operations” in the Consolidated Statements of Operations.
Property and equipment are composed of the following:
|
|
June 30,
|
|||||||
|
(dollars in thousands)
|
2015
|
2014
|
||||||
|
Building and land
|
$
|
4,608
|
|
$
|
4,608
|
|
||
|
Furniture, equipment, and other
|
2,412
|
|
2,795
|
|
||||
|
7,020
|
|
7,403
|
|
|||||
|
Accumulated depreciation
|
(4,284
|
)
|
(4,379
|
)
|
||||
|
Net property and equipment
|
$
|
2,736
|
|
$
|
3,024
|
|
||
Depreciation expense totaled
$282,000
;
$255,000
; and
$275,000
in fiscal years
2015
,
2014
, and
2013
, respectively.
49
Intangible assets consist of the following:
|
|
|
June 30,
|
||||||
|
(dollars in thousands)
|
|
2015
|
|
2014
|
||||
|
Intangible asset - Non-compete agreement
|
|
|
|
|
||||
|
Gross carrying amount
|
|
$
|
90
|
|
|
$
|
90
|
|
|
Accumulated amortization
|
|
(49
|
)
|
|
(4
|
)
|
||
|
Net carrying amount
|
|
$
|
41
|
|
|
$
|
86
|
|
The non-compete agreement included as an intangible asset was acquired effective June 1, 2014, in connection with the acquisition of Galileo. This finite-lived identifiable intangible asset is amortized on a straight-line basis over its estimated useful life. As of
June 30, 2015
, the remaining weighted-average estimated useful life is approximately
0.9
years.
Amortization expense totaled
$45,000
and
$4,000
for the year ended
June 30, 2015
, and
June 30, 2014
, respectively. There was
no
amortization expense for the year ended
2013
. Amortization expense is included in depreciation and amortization on the Consolidated Statements of Operations.
Estimated aggregate annual amortization expense for the intangible asset in each of the five succeeding fiscal years assuming no new acquisitions or impairments is as follows:
|
(dollars in thousands)
|
|
Amortization Expense
|
||
|
2016
|
|
$
|
41
|
|
|
2017
|
|
—
|
|
|
|
2018
|
|
—
|
|
|
|
2019
|
|
—
|
|
|
|
2020
|
|
—
|
|
|
Other accrued expenses consist of the following:
|
|
June 30,
|
|||||||
|
(dollars in thousands)
|
2015
|
2014
|
||||||
|
Legal, professional and consulting fees
|
$
|
270
|
|
$
|
325
|
|
||
|
Vendors payable
|
333
|
|
246
|
|
||||
|
Investments payable
|
—
|
|
187
|
|
||||
|
Platform fees
|
101
|
|
170
|
|
||||
|
Taxes payable
|
117
|
|
131
|
|
||||
|
Other
|
—
|
|
5
|
|
||||
|
Other accrued expenses
|
$
|
821
|
|
$
|
1,064
|
|
||
As of
June 30, 2015
, the Company has
no
long-term liabilities.
The Company has access to a
$1 million
credit facility with a
one year
maturity for working capital purposes. The credit agreement was renewed effective
May 14, 2015
, and requires the Company to maintain certain quarterly financial covenants to access the line of credit. The amended credit agreement will expire on
May 31, 2016
, and the Company intends to renew annually. The Company has been in compliance with all financial covenants during the fiscal year. As of
June 30, 2015
, the credit facility remains unutilized by the Company.
50
The Company has operating leases for office equipment that expire between fiscal years
2016
and 2018 and for office facilities in Canada that expire in 2018. Lease expenses totaled
$514,000
;
$494,000
; and
$491,000
; in fiscal years
2015
,
2014
, and
2013
, respectively. Minimum non-cancelable lease payments required under operating leases for future periods, are as follows:
|
(dollars in thousands)
|
|||
|
Fiscal Year
|
Amount
|
||
|
2016
|
$
|
237
|
|
|
2017
|
169
|
|
|
|
2018
|
101
|
|
|
|
2019
|
—
|
|
|
|
2020
|
—
|
|
|
|
Total
|
$
|
507
|
|
The Company offers a savings and investment plan qualified under Section 401(k) of the Internal Revenue Code covering substantially all employees. In connection with this 401(k) plan, participants can voluntarily contribute a portion of their compensation, up to certain limitations, to this plan, and the Company will match
100 percent
of participants’ contributions up to the first
3 percent
of compensation and
50 percent
of the next
2 percent
of compensation. The Company has recorded expenses related to the 401(k) plan for contributions of
$131,000
;
$175,000
; and
$220,000
for fiscal years
2015
,
2014
, and
2013
, respectively.
The 401(k) plan allows for a discretionary profit sharing contribution by the Company, as authorized by the Board of Directors. The Company made
no
profit sharing contribution in fiscal years
2015
,
2014
, or
2013
.
The Company offers employees, including its executive officers, an opportunity to participate in savings programs using mutual funds managed by the Company. Employees may contribute to an IRA, and the Company matches these contributions on a limited basis. Similarly, certain employees may contribute to the Near-Term Tax Free Fund, and the Company will match these contributions on a limited basis. A similar savings plan utilizing Uniform Gifts to Minors Act (“UGMA”) accounts is offered to employees to save for their minor relatives. The Company match, reflected in base salary expense, aggregated in all programs to
$51,000
;
$58,000
; and
$79,000
in fiscal years
2015
,
2014
, and
2013
, respectively.
The Company has an Employee Stock Purchase Plan, subject to a current registration statement, whereby eligible employees can purchase treasury shares at market price, and the Company will match their contributions up to
3 percent
of gross salary.
During fiscal years
2015
,
2014
, and
2013
, employees purchased
37,383
;
52,191
; and
48,679
, respectively, shares of treasury stock from the Company.
Additionally, the Company self-funds its employee health care plan. The Company has obtained reinsurance with both a specific and an aggregate stop-loss in the event of catastrophic claims. The Company has accrued an amount representing the Company’s estimate of claims incurred but not paid at
June 30, 2015
.
Dividends
A monthly dividend of
$0.005
is authorized from
July
2015
through
September
2015
and a monthly dividend of
$0.0025
is authorized from
October
2015
through
December
2015
, and will be considered for continuation at that time by the Board of Directors. Payment of cash dividends is within the discretion of the Company’s Board of Directors and is dependent on earnings, operations, capital requirements, general financial condition of the Company and general business conditions. On a per share basis, the holders of the class C common stock and the nonvoting class A common stock participate equally in dividends as declared by the Company’s Board of Directors.
51
Share Repurchase Plan
The Board of Directors approved a share repurchase program on December 7, 2012, authorizing the Company to purchase up to
$2.75 million
of its outstanding common shares, as market and business conditions warrant, on the open market in compliance with Rule 10b-18 of the Securities Exchange Act of 1934 through December 31, 2013. On December 12, 2013, and December 10, 2014, the Board of Directors renewed the repurchase program for calendar year 2014 and 2015, respectively. The total amount of shares that may be repurchased in
2015
under the renewed program is
$2.75 million
. The acquired shares may be used for corporate purposes, including shares issued to employees in the Company’s stock-based compensation programs. As of
June 30, 2015
, there remains approximately
$2.66 million
available for repurchase under this authorization.
During fiscal years
2015
,
2014
, and
2013
, the Company repurchased
95,251
;
93,351
; and
55,052
, respectively, of its class A shares on the open market using cash of
$292,000
;
$289,000
; and
$174,000
, respectively. To date, the Company has repurchased a total of
243,654
class A shares under the repurchase program using cash of
$755,000
.
Other Activity
The Company did not grant any shares of class A common stock to employees during fiscal year
2015
,
2014
or
2013
. Grants vest immediately after issuance.
The Company granted
3,600
;
3,600
; and
3,600
shares of class A common stock at a weighted average fair value of
$3.24
,
$3.07
, and
$4.16
to its non-employee directors in fiscal years
2015
,
2014
, and
2013
, respectively. Grants vest immediately after issuance.
Shareholders of class C shares are allowed to convert to class A. During fiscal years
2015
,
2014
, and
2013
,
60
;
1,340
; and
2,516
shares, respectively, were converted from class C to class A. Conversions are
one
class A share for
one
class C share and are recorded at par value. There are no restrictions or requirements to convert.
Stock-based compensation
In November 1989, the Board of Directors adopted the 1989 Non-Qualified Stock Option Plan (“1989 Plan”), amended in December 1991, which provides for the granting of options to purchase
1,600,000
shares of the Company’s class A common stock to directors, officers and employees of the Company and its subsidiaries. Options issued under the 1989 Plan vest
six months
from the grant date or
20 percent
on the first, second, third, fourth, and fifth anniversaries of the grant date. Options issued under the 1989 Plan expire
ten
years after issuance. As of
June 30, 2015
, there were
no
options outstanding under the 1989 Plan.
In April 1997, the Board of Directors adopted the 1997 Non-Qualified Stock Option Plan (“1997 Plan”), which provides for the granting of stock appreciation rights (SARs) and/or options to purchase
400,000
shares of the Company’s class A common stock to directors, officers, and employees of the Company and its subsidiaries. Options issued under the 1997 Plan expire
ten
years after issuance.
No
options were granted in fiscal years
2015
,
2014
, or
2013
.
52
The estimated fair value of options granted is amortized to expense over the options’ vesting period. The fair value of these options is estimated at the date of the grant using a Black-Scholes option pricing model.
Stock option transactions under the various employee stock option plans for the past three fiscal years are summarized below:
|
(dollars in thousands, except price data)
|
Shares
|
Weighted Average
Exercise Price
|
Weighted
Average Remaining
Contractual Life in Years
|
Aggregate Intrinsic
Value (net of tax)
|
|||||||||
|
Outstanding June 30, 2012
|
29,000
|
|
$
|
17.03
|
|
||||||||
|
Granted
|
—
|
|
n/a
|
|
|||||||||
|
Exercised
|
—
|
|
n/a
|
|
|||||||||
|
Forfeited
|
—
|
|
n/a
|
|
|||||||||
|
Outstanding June 30, 2013
|
29,000
|
|
$
|
17.03
|
|
||||||||
|
Granted
|
—
|
|
n/a
|
|
|||||||||
|
Exercised
|
—
|
|
n/a
|
|
|||||||||
|
Forfeited
|
7,000
|
|
$
|
11.74
|
|
||||||||
|
Outstanding June 30, 2014
|
22,000
|
|
$
|
18.72
|
|
||||||||
|
Granted
|
—
|
|
n/a
|
|
|||||||||
|
Exercised
|
—
|
|
n/a
|
|
|||||||||
|
Forfeited
|
—
|
|
n/a
|
|
|||||||||
|
Outstanding June 30, 2015
|
22,000
|
|
$
|
18.72
|
|
2.44
|
$
|
165
|
|
||||
As of
June 30, 2015
,
2014
, and
2013
, exercisable employee stock options totaled
22,000
;
22,000
; and
25,000
shares and had weighted average exercise prices of
$18.72
,
$18.72
, and
$18.71
per share, respectively.
Class A common stock options outstanding and exercisable under the employee stock option plans at
June 30, 2015
, were as follows:
|
|
Options Outstanding
|
Options Exercisable
|
||||||||||||||||
|
Date of
Option
Grant
|
Number
Outstanding
|
Remaining
Life in Years
|
Weighted
Average
Exercise
Price ($)
|
Number
Exercisable
|
Weighted
Average
Option Price
($ )
|
|||||||||||||
|
1997 Plan Class A
|
10/3/2007
|
20,000
|
|
2.25
|
$
|
19.36
|
|
20,000
|
|
$
|
19.36
|
|
||||||
|
10/7/2009
|
2,000
|
|
4.27
|
$
|
12.31
|
|
2,000
|
|
$
|
12.31
|
|
|||||||
|
22,000
|
|
2.44
|
$
|
18.72
|
|
22,000
|
|
$
|
18.72
|
|
||||||||
The Company and its non-Canadian subsidiaries file a consolidated federal income tax return. USCAN and Galileo file separate tax returns in Canada. Provisions for income taxes include deferred taxes for temporary differences in the bases of assets and liabilities for financial and tax purposes, resulting from the use of the liability method of accounting for income taxes. At
June 30, 2015
, the current deferred tax asset primarily consists of temporary differences in the deductibility of prepaid expenses, accrued liabilities and unrealized gains on trading securities. The long-term deferred tax asset is composed primarily of unrealized losses and other than temporary impairments on available-for-sale securities, differences in tax and book accumulated depreciation and the difference in tax treatment of stock options. The Company has not recognized deferred income taxes on undistributed earnings of USCAN and Galileo since such earnings are considered to be reinvested indefinitely.
For federal income tax purposes at
June 30, 2015
, the Company has capital loss carryovers of approximately
$24,000
expiring in fiscal year
2020
. The Company also has charitable contribution carryovers totaling approximately
$121,000
with
$68,000
expiring in fiscal year
2018
,
$34,000
expiring in fiscal year
2019
, and
$19,000
expiring in fiscal year
2020
. The Company has federal net operating loss carryovers of
$3.0 million
expiring in fiscal year
2035
. For Canadian income tax purposes, Galileo has cumulative eligible capital carryovers of
$287,000
with no expiration and net operating loss carryovers of
$85,000
,
$156,000
, and
$58,000
expiring in fiscal
2025
,
2027
and
2030
, respectively. If certain changes in the Company's ownership should occur, there could be an annual limitation on the amount of net operating loss carryovers that could be utilized.
53
A valuation allowance is provided when it is more likely than not that some portion of the deferred tax amount will not be realized. At
June 30, 2015
,
2014
, and
2013
a valuation allowance of
$2,073,000
,
$35,000
, and
$27,000
, respectively, was included related to net operating loss carryover, other carryovers and book/tax differences in the balance sheet.
The Company's components of income (loss) before tax by jurisdiction is as follows:
|
Year Ended June 30,
|
||||||||||||
|
(dollars in thousands)
|
2015
|
2014
|
2013
|
|||||||||
|
United States
|
$
|
(3,400
|
)
|
$
|
(1,934
|
)
|
$
|
(234
|
)
|
|||
|
Canada
|
246
|
|
329
|
|
55
|
|
||||||
|
Total
|
$
|
(3,154
|
)
|
$
|
(1,605
|
)
|
$
|
(179
|
)
|
|||
The reconciliation of income tax computed for continuing operations at the statutory rates to income tax expense is:
|
|
Year Ended June 30,
|
||||||||||||||||||||
|
(dollars in thousands)
|
2015
|
% of Pretax
|
2014
|
% of Pretax
|
2013
|
% of Pretax
|
|||||||||||||||
|
Tax expense (benefit)
at statutory rate - continuing operations
|
$
|
(1,072
|
)
|
34.0
|
%
|
$
|
(421
|
)
|
34.0
|
%
|
$
|
24
|
|
34.0
|
%
|
||||||
|
Valuation allowance
|
1,857
|
|
(58.9
|
)%
|
35
|
|
(2.8
|
)%
|
27
|
|
38.0
|
%
|
|||||||||
|
Nondeductible membership dues
|
23
|
|
(0.7
|
)%
|
25
|
|
(2.0
|
)%
|
27
|
|
38.0
|
%
|
|||||||||
|
Nondeductible meals and entertainment
|
15
|
|
(0.5
|
)%
|
25
|
|
(2.0
|
)%
|
44
|
|
62.0
|
%
|
|||||||||
|
Non-deductible insurance
|
8
|
|
(0.3
|
)%
|
8
|
|
(0.6
|
)%
|
8
|
|
11.3
|
%
|
|||||||||
|
Nondeductible gain on business combination
|
—
|
|
—
|
%
|
(99
|
)
|
8.0
|
%
|
—
|
|
—
|
%
|
|||||||||
|
Non-taxable dividend income
|
(25
|
)
|
0.8
|
%
|
(33
|
)
|
2.7
|
%
|
(35
|
)
|
(49.3
|
)%
|
|||||||||
|
Other
|
16
|
|
(0.5
|
)%
|
(57
|
)
|
4.5
|
%
|
5
|
|
7.0
|
%
|
|||||||||
|
Total tax expense (benefit) - continuing operations
|
$
|
822
|
|
(26.1
|
)%
|
$
|
(517
|
)
|
41.8
|
%
|
$
|
100
|
|
141.0
|
%
|
||||||
Components of total tax expense (benefit) are as follows:
|
|
Year Ended June 30,
|
|||||||||||
|
(dollars in thousands)
|
2015
|
2014
|
2013
|
|||||||||
|
Continuing Operations
|
||||||||||||
|
Current tax expense (benefit) - U.S. Federal
|
$
|
(21
|
)
|
$
|
(904
|
)
|
$
|
91
|
|
|||
|
Current tax expense (benefit) - Non-U.S.
|
36
|
|
—
|
|
—
|
|
||||||
|
Deferred tax expense (benefit) - U.S. Federal
|
807
|
|
387
|
|
9
|
|
||||||
|
Total tax expense (benefit) - continuing operations
|
$
|
822
|
|
$
|
(517
|
)
|
$
|
100
|
|
|||
|
Discontinued Operations
|
||||||||||||
|
Current tax expense (benefit) - U.S. Federal
|
—
|
|
(125
|
)
|
(85
|
)
|
||||||
|
Total tax expense (benefit)
|
$
|
822
|
|
$
|
(642
|
)
|
$
|
15
|
|
|||
54
Deferred income taxes reflect the net tax effects of temporary differences between the carrying amount of assets and liabilities for financial reporting purposes and the amounts used for income tax purposes. The Company’s deferred assets and liabilities using the effective statutory tax rate are as follows:
|
Year Ended June 30,
|
||||||||
|
(dollars in thousands)
|
2015
|
2014
|
||||||
|
Book/tax differences in the balance sheet
|
||||||||
|
Trading securities
|
$
|
289
|
|
$
|
84
|
|
||
|
Prepaid expenses
|
(115
|
)
|
(142
|
)
|
||||
|
Accumulated depreciation
|
129
|
|
120
|
|
||||
|
Available-for-sale securities
|
366
|
|
(176
|
)
|
||||
|
Accrued expenses
|
125
|
|
108
|
|
||||
|
Stock-based compensation expense
|
103
|
|
103
|
|
||||
|
Tax Carryovers
|
||||||||
|
Net operating loss carryover
|
1,051
|
|
—
|
|
||||
|
Cumulative eligible capital carryover
|
76
|
|
—
|
|
||||
|
Capital loss carryover
|
8
|
|
252
|
|
||||
|
Charitable contributions carryover
|
41
|
|
35
|
|
||||
|
Valuation Allowance
|
(2,073
|
)
|
(35
|
)
|
||||
|
Net deferred tax asset
|
$
|
—
|
|
$
|
349
|
|
||
The following table sets forth the computation for basic and diluted earnings per share (EPS):
|
|
Year Ended June 30,
|
|||||||||||
|
(dollars in thousands, except per share data)
|
2015
|
2014
|
2013
|
|||||||||
|
Net income (loss)
|
||||||||||||
|
Loss from continuing operations
|
$
|
(3,976
|
)
|
|
$
|
(720
|
)
|
|
$
|
(29
|
)
|
|
|
Less: Income attributable to non-controlling interest in subsidiary
|
54
|
|
7
|
|
—
|
|
||||||
|
Loss from continuing operations attributable to U.S. Global Investors, Inc.
|
(4,030
|
)
|
(727
|
)
|
(29
|
)
|
||||||
|
Loss from discontinued operations attributable to U.S. Global Investors, Inc.
|
—
|
|
|
(243
|
)
|
|
(165
|
)
|
||||
|
Net loss attributable to U.S. Global Investors, Inc.
|
$
|
(4,030
|
)
|
$
|
(970
|
)
|
$
|
(194
|
)
|
|||
|
|
||||||||||||
|
Weighted average number of outstanding shares
|
||||||||||||
|
Basic
|
15,399,831
|
|
|
15,459,022
|
|
|
15,482,612
|
|
||||
|
Effect of dilutive securities
|
||||||||||||
|
Employee stock options
|
—
|
|
—
|
|
—
|
|
||||||
|
Diluted
|
15,399,831
|
|
|
15,459,022
|
|
|
15,482,612
|
|
||||
|
|
||||||||||||
|
Earnings (loss) per share attributable to U.S. Global Investors, Inc.
|
||||||||||||
|
Basic
|
||||||||||||
|
Loss from continuing operations
|
$
|
(0.26
|
)
|
|
$
|
(0.04
|
)
|
|
$
|
0.00
|
|
|
|
Loss from discontinued operations
|
0.00
|
|
|
(0.02
|
)
|
|
(0.01
|
)
|
||||
|
Net loss attributable to U.S. Global Investors, Inc.
|
$
|
(0.26
|
)
|
$
|
(0.06
|
)
|
$
|
(0.01
|
)
|
|||
|
Diluted
|
||||||||||||
|
Loss from continuing operations
|
$
|
(0.26
|
)
|
|
$
|
(0.04
|
)
|
|
$
|
0.00
|
|
|
|
Loss from discontinued operations
|
0.00
|
|
|
(0.02
|
)
|
|
(0.01
|
)
|
||||
|
Net loss attributable to U.S. Global Investors, Inc.
|
$
|
(0.26
|
)
|
$
|
(0.06
|
)
|
$
|
(0.01
|
)
|
|||
55
The diluted EPS calculation excludes the effect of stock options when their exercise prices exceed the average market price for the period. For the years ended
June 30, 2015
,
2014
, and
2013
, employee stock options for
22,000
;
22,000
; and
29,000
shares were excluded from diluted EPS.
During fiscal years
2015
,
2014
, and
2013
, the Company repurchased class A shares on the open market. Repurchased shares are classified as treasury shares and are deducted from outstanding shares in the earnings per share calculation.
The following table presents changes in accumulated other comprehensive income (loss) by component:
|
(dollars in thousands)
|
Unrealized gains (losses) on available-for-sale investments
1
|
Foreign currency translation adjustment
|
Total
|
|||||||||
|
Balance at June 30, 2012
|
$
|
466
|
|
$
|
—
|
|
$
|
466
|
|
|||
|
Other comprehensive loss before reclassifications
|
530
|
|
—
|
|
530
|
|
||||||
|
Tax effect
|
(180
|
)
|
—
|
|
(180
|
)
|
||||||
|
Amount reclassified from AOCI
|
(248
|
)
|
—
|
|
(248
|
)
|
||||||
|
Tax effect
|
84
|
|
—
|
|
84
|
|
||||||
|
Net other comprehensive loss for 2013
|
186
|
|
—
|
|
186
|
|
||||||
|
Balance at June 30, 2013
|
652
|
|
—
|
|
652
|
|
||||||
|
Other comprehensive income before reclassifications
|
1,399
|
|
18
|
|
1,417
|
|
||||||
|
Tax effect
|
(476
|
)
|
—
|
|
(476
|
)
|
||||||
|
Amount reclassified from AOCI
|
(1,041
|
)
|
—
|
|
(1,041
|
)
|
||||||
|
Tax effect
|
354
|
|
—
|
|
354
|
|
||||||
|
Net other comprehensive income for 2014
|
236
|
|
18
|
|
254
|
|
||||||
|
Balance at June 30, 2014
|
888
|
|
18
|
|
906
|
|
||||||
|
Other comprehensive income before reclassifications
|
(1,341
|
)
|
(162
|
)
|
(1,503
|
)
|
||||||
|
Tax effect
|
341
|
|
—
|
|
341
|
|
||||||
|
Amount reclassified from AOCI
|
(344
|
)
|
—
|
|
(344
|
)
|
||||||
|
Tax effect
|
117
|
|
—
|
|
117
|
|
||||||
|
Net other comprehensive income for 2015
|
(1,227
|
)
|
(162
|
)
|
(1,389
|
)
|
||||||
|
Balance at June 30, 2015
|
$
|
(339
|
)
|
$
|
(144
|
)
|
$
|
(483
|
)
|
|||
|
1.
|
Amounts reclassified from unrealized gains (losses) on available-for-sale investments, net of tax, were recorded in investment income (loss) on the Consolidated Statements of Operations.
|
The Company manages the following business segments:
|
1.
|
Investment Management Services
, by which the Company offers, through USGIF, offshore clients, and an ETF client a range of investment management products and services to meet the needs of individual and institutional investors;
|
|
2.
|
Investment Management Services - Canada
, through which, as of June 1, 2014, the Company owns a
65%
controlling interest in Galileo Global Equity Advisors Inc., a privately held Toronto-based asset management firm which offers investment management products and services in Canada; and
|
|
3.
|
Corporate Investments
, through which the Company invests for its own account in an effort to add growth and value to its cash position. Although the Company generates the majority of its revenues from its investment advisory segments, the Company holds a significant amount of its total assets in investments.
|
56
The following schedule details total revenues and income by business segment:
|
(dollars in thousands)
|
Investment Management Services
|
Investment Management Services - Canada
|
Corporate Investments
|
Consolidated
|
||||||||||||
|
Year ended June 30, 2015
|
||||||||||||||||
|
Net operating revenues
|
$
|
7,364
|
|
1
|
$
|
2,007
|
|
2
|
$
|
—
|
|
$
|
9,371
|
|
||
|
Net other income
|
$
|
—
|
|
$
|
—
|
|
$
|
434
|
|
$
|
434
|
|
||||
|
Income (loss) from continuing operations before income taxes
|
$
|
(3,555
|
)
|
$
|
9
|
|
$
|
392
|
|
$
|
(3,154
|
)
|
||||
|
Loss from discontinued operations
|
$
|
—
|
|
$
|
—
|
|
$
|
—
|
|
$
|
—
|
|
||||
|
Depreciation and amortization
|
$
|
253
|
|
$
|
74
|
|
$
|
—
|
|
$
|
327
|
|
||||
|
Capital expenditures
|
$
|
40
|
|
$
|
—
|
|
$
|
—
|
|
$
|
40
|
|
||||
|
Gross identifiable assets at June 30, 2015
|
$
|
6,519
|
|
$
|
1,841
|
|
$
|
22,410
|
|
$
|
30,770
|
|
||||
|
Deferred tax asset
|
$
|
—
|
|
|||||||||||||
|
Consolidated total assets at June 30, 2015
|
$
|
30,770
|
|
|||||||||||||
|
Year ended June 30, 2014
|
||||||||||||||||
|
Net operating revenues
|
$
|
11,205
|
|
1
|
$
|
234
|
|
2
|
$
|
—
|
|
$
|
11,439
|
|
||
|
Net other income
|
$
|
—
|
|
$
|
—
|
|
$
|
2,165
|
|
$
|
2,165
|
|
||||
|
Income (loss) from continuing operations before income taxes
|
$
|
(3,426
|
)
|
$
|
31
|
|
$
|
2,158
|
|
$
|
(1,237
|
)
|
||||
|
Loss from discontinued operations
|
$
|
(243
|
)
|
$
|
—
|
|
$
|
—
|
|
$
|
(243
|
)
|
||||
|
Depreciation and amortization
|
$
|
252
|
|
$
|
7
|
|
$
|
—
|
|
259
|
|
|||||
|
Capital expenditures
|
$
|
30
|
|
$
|
—
|
|
$
|
—
|
|
$
|
30
|
|
||||
|
Year ended June 30, 2013
|
||||||||||||||||
|
Net operating revenues
|
$
|
17,318
|
|
1
|
$
|
—
|
|
2
|
$
|
—
|
|
$
|
17,318
|
|
||
|
Net other income
|
$
|
—
|
|
$
|
—
|
|
$
|
262
|
|
$
|
262
|
|
||||
|
Income (loss) from continuing operations before income taxes
|
$
|
(178
|
)
|
$
|
—
|
|
$
|
249
|
|
$
|
71
|
|
||||
|
Loss from discontinued operations
|
$
|
(165
|
)
|
$
|
—
|
|
$
|
—
|
|
$
|
(165
|
)
|
||||
|
Depreciation and amortization
|
$
|
275
|
|
$
|
—
|
|
$
|
—
|
|
275
|
|
|||||
|
Capital expenditures
|
$
|
39
|
|
$
|
—
|
|
$
|
—
|
|
$
|
39
|
|
||||
|
1
|
Includes operating revenues from USGIF of
$7,208
,
$11,011
and
$17,000
in fiscal years
2015
,
2014
, and
2013
, respectively.
|
|
2
|
Includes operating revenues from Galileo Funds of
$1,638
,
$184
and
$0
; and other advisory clients of
$354
,
$48
|
and
$0
in fiscal years
2015
,
2014
, and
2013
, respectively.
57
On
June 30, 2015
, and
2014
, the Company had
$17.1 million
and
$19.4 million
, respectively, at fair value invested in USGIF and offshore clients the Company advises. These amounts were included in the Consolidated Balance Sheet as “trading securities” and “available-for-sale securities” in fiscal year
2015
, and in “cash and cash equivalents,” “trading securities” and “available-for-sale securities” in fiscal year
2014
. The Company recorded
$157,000
;
$132,000
; and
$114,000
in dividend income and
$(846,000)
;
$(143,000)
; and
$(147,000)
in net unrealized gains (losses) on its investments in the Funds and offshore clients for fiscal years
2015
,
2014
, and
2013
, respectively.
The Company earned advisory, administrative, distribution and shareholder services fees, as applicable, from the various funds for which it and its subsidiaries act as investment adviser, as disclosed in Note 4. Receivables include amount due from the funds for those fees and out-of-pocket expenses, net of amounts payable to the funds, for expense reimbursements. As of
June 30, 2015
, and
2014
, the Company had
$701,000
and
$1.3 million
, respectively, of receivables from mutual funds included in the Consolidated Balance Sheets within “receivables.”
Frank Holmes, a director and Chief Executive Officer of the Company, is a trustee of USGIF. Mr. Holmes is a director of each offshore fund and is also a director of Meridian Fund Managers Ltd., the manager of the offshore funds.
The Company has an available-for-sale investment in Charlemagne Capital Limited with a fair value of approximately
$864,000
and
$1,314,000
at
June 30, 2015
and
2014
, respectively. Charlemagne Capital (IOM) Limited, a wholly owned subsidiary of Charlemagne Capital Limited, was the non-discretionary subadviser to the Emerging Europe Fund, a fund within USGIF, through July 31, 2014.
The Company continuously reviews all investor, employee, and vendor complaints and pending or threatened litigation. The likelihood that a loss contingency exists is evaluated through consultation with legal counsel, and a loss contingency is recorded if probable and reasonably estimable.
During the normal course of business, the Company may be subject to claims, legal proceedings, and other contingencies. These matters are subject to various uncertainties, and it is possible that some of these matters may be resolved unfavorably. The Company establishes accruals for matters for which the outcome is probable and can be reasonably estimated. Management believes that any liability in excess of these accruals upon the ultimate resolution of these matters will not have a material adverse effect on the consolidated financial statements of the Company.
The Board of Directors has authorized a monthly dividend of
$0.005
per share from
July
2015
through
September
2015
and a monthly dividend of
$0.0025
from
October
2015
through
December
2015
, at which time it will be considered for continuation by the Board of Directors. Payment of cash dividends is within the discretion of the Company’s Board of Directors and is dependent on earnings, operations, capital requirements, general financial condition of the Company and general business conditions. The total amount of cash dividends to be paid to class A and class C shareholders from July
2015
to
December 2015
will be approximately
$345,000
.
58
Note that quarterly per share amounts may not add to the annual total due to rounding.
|
Quarters
|
||||||||||||||||||||
|
Fiscal 2015
|
1st
|
2nd
|
3rd
|
4th
|
Total
|
|||||||||||||||
|
(dollars in thousands except per share data)
|
||||||||||||||||||||
|
Operating revenues
|
$
|
3,297
|
|
$
|
2,371
|
|
$
|
1,831
|
|
$
|
1,872
|
|
$
|
9,371
|
|
|||||
|
Loss from continuing operations before income taxes
|
(96
|
)
|
(838
|
)
|
(969
|
)
|
(1,251
|
)
|
(3,154
|
)
|
||||||||||
|
Tax expense (benefit)
|
(7
|
)
|
3
|
|
25
|
|
801
|
|
822
|
|
||||||||||
|
Loss from continuing operations
|
(89
|
)
|
(841
|
)
|
(994
|
)
|
(2,052
|
)
|
(3,976
|
)
|
||||||||||
|
Net loss
|
(89
|
)
|
(841
|
)
|
(994
|
)
|
(2,052
|
)
|
(3,976
|
)
|
||||||||||
|
Net income attributable to non-controlling interest
|
39
|
|
1
|
|
13
|
|
1
|
|
54
|
|
||||||||||
|
Net loss attributable to U.S. Global Investors, Inc.
|
(128
|
)
|
(842
|
)
|
(1,007
|
)
|
(2,053
|
)
|
(4,030
|
)
|
||||||||||
|
Comprehensive loss
|
(593
|
)
|
(1,586
|
)
|
(1,225
|
)
|
(2,101
|
)
|
(5,505
|
)
|
||||||||||
|
Comprehensive loss attributable to U.S. Global Investors, Inc.
|
(604
|
)
|
(1,562
|
)
|
(1,177
|
)
|
(2,076
|
)
|
(5,419
|
)
|
||||||||||
|
Earnings (loss) per share attributable to U.S. Global Investors, Inc.:
|
||||||||||||||||||||
|
Basic
|
||||||||||||||||||||
|
Loss from continuing operations
|
$
|
(0.01
|
)
|
$
|
(0.05
|
)
|
$
|
(0.07
|
)
|
$
|
(0.13
|
)
|
$
|
(0.26
|
)
|
|||||
|
Loss from discontinued operations
|
0.00
|
|
0.00
|
|
0.00
|
|
0.00
|
|
0.00
|
|
||||||||||
|
Net loss attributable to U.S. Global Investors, Inc.
|
$
|
(0.01
|
)
|
$
|
(0.05
|
)
|
$
|
(0.07
|
)
|
$
|
(0.13
|
)
|
$
|
(0.26
|
)
|
|||||
|
Diluted
|
||||||||||||||||||||
|
Loss from continuing operations
|
$
|
(0.01
|
)
|
$
|
(0.05
|
)
|
$
|
(0.07
|
)
|
$
|
(0.13
|
)
|
$
|
(0.26
|
)
|
|||||
|
Loss from discontinued operations
|
0.00
|
|
0.00
|
|
0.00
|
|
0.00
|
|
0.00
|
|
||||||||||
|
Net loss attributable to U.S. Global Investors, Inc.
|
$
|
(0.01
|
)
|
$
|
(0.05
|
)
|
$
|
(0.07
|
)
|
$
|
(0.13
|
)
|
$
|
(0.26
|
)
|
|||||
|
Quarters
|
||||||||||||||||||||
|
Fiscal 2014
|
1st
|
2nd
|
3rd
|
4th
|
Total
|
|||||||||||||||
|
(dollars in thousands except per share data)
|
||||||||||||||||||||
|
Operating revenues
|
$
|
3,052
|
|
$
|
2,740
|
|
$
|
2,742
|
|
$
|
2,905
|
|
$
|
11,439
|
|
|||||
|
Income (loss) from continuing operations before income taxes
|
(23
|
)
|
(1,424
|
)
|
(12
|
)
|
222
|
|
(1,237
|
)
|
||||||||||
|
Tax expense (benefit)
|
(14
|
)
|
(466
|
)
|
14
|
|
(51
|
)
|
(517
|
)
|
||||||||||
|
Income (loss) from continuing operations
|
(9
|
)
|
(958
|
)
|
(26
|
)
|
273
|
|
(720
|
)
|
||||||||||
|
Loss on discontinued operations
|
(28
|
)
|
(207
|
)
|
(2
|
)
|
(6
|
)
|
(243
|
)
|
||||||||||
|
Net income (loss)
|
(37
|
)
|
(1,165
|
)
|
(28
|
)
|
267
|
|
(963
|
)
|
||||||||||
|
Net income attributable to non-controlling interest
|
—
|
|
—
|
|
—
|
|
7
|
|
7
|
|
||||||||||
|
Net income (loss) attributable to U.S. Global Investors, Inc.
|
(37
|
)
|
(1,165
|
)
|
(28
|
)
|
260
|
|
(970
|
)
|
||||||||||
|
Comprehensive income (loss)
|
(236
|
)
|
(1,052
|
)
|
151
|
|
430
|
|
(707
|
)
|
||||||||||
|
Comprehensive income (loss) attributable to U.S. Global Investors, Inc.
|
(236
|
)
|
(1,052
|
)
|
151
|
|
421
|
|
(716
|
)
|
||||||||||
|
Earnings (loss) per share attributable to U.S. Global Investors, Inc.:
|
||||||||||||||||||||
|
Basic
|
||||||||||||||||||||
|
Income (loss) from continuing operations
|
$
|
0.00
|
|
$
|
(0.06
|
)
|
$
|
0.00
|
|
$
|
0.02
|
|
$
|
(0.04
|
)
|
|||||
|
Loss from discontinued operations
|
0.00
|
|
(0.02
|
)
|
0.00
|
|
0.00
|
|
(0.02
|
)
|
||||||||||
|
Net income (loss) attributable to U.S. Global Investors, Inc.
|
$
|
0.00
|
|
$
|
(0.08
|
)
|
$
|
0.00
|
|
$
|
0.02
|
|
$
|
(0.06
|
)
|
|||||
|
Diluted
|
||||||||||||||||||||
|
Income (loss) from continuing operations
|
$
|
0.00
|
|
$
|
(0.06
|
)
|
$
|
0.00
|
|
$
|
0.02
|
|
$
|
(0.04
|
)
|
|||||
|
Loss from discontinued operations
|
0.00
|
|
(0.02
|
)
|
0.00
|
|
0.00
|
|
(0.02
|
)
|
||||||||||
|
Net income (loss) attributable to U.S. Global Investors, Inc.
|
$
|
0.00
|
|
$
|
(0.08
|
)
|
$
|
0.00
|
|
$
|
0.02
|
|
$
|
(0.06
|
)
|
|||||
59
There were no changes in or disagreements with accountants on accounting and financial disclosure during the two most recent fiscal years.
Evaluation of Disclosure Controls and Procedures.
An evaluation was conducted under the supervision and with the participation of the Company’s management, including the Chief Executive Officer (“CEO”) and Chief Financial Officer (“CFO”), of the effectiveness of the design and operation of the Company’s disclosure controls and procedures as of
June 30, 2015
. Based on that evaluation, the CEO and CFO concluded that the Company’s disclosure controls and procedures were effective as of
June 30, 2015
, to ensure that information required to be disclosed in the reports that it files or submits under the Exchange Act is: (1) recorded, processed, summarized, and reported within the time periods specified in SEC rules and forms; and (2) accumulated and communicated to management, including the principal executive and principal financial officers, as appropriate, to allow timely decisions regarding required disclosure.
Management’s Report on Internal Control over Financial Reporting.
The Company’s management is responsible for establishing and maintaining adequate internal control over financial reporting as defined by Rules 13a-15(f) and 15d-15(f) under the Exchange Act. The Company’s internal control over financial reporting is designed to provide reasonable assurance regarding the reliability of financial reporting and the preparation of financial statements for external purposes in accordance with generally accepted accounting principles.
Because of inherent limitations, internal control over financial reporting may not prevent or detect misstatements. Projections of any evaluation of effectiveness to future periods are subject to the risk that controls may become inadequate because of changes in conditions, or that the degree of compliance with the policies or procedures may deteriorate.
The Company’s management assessed the effectiveness of its internal control over financial reporting as of
June 30, 2015
. In making this assessment, the Company’s management used the criteria set forth by the Committee of Sponsoring Organizations of the Treadway Commission (“COSO”) in Internal Control-Integrated Framework (2013). Based on the Company’s assessment, management believes that, as of
June 30, 2015
, the Company’s management has maintained effective internal control over financial reporting.
Changes in Internal Control over Financial Reporting.
There have not been any changes in the Company’s internal control over financial reporting (as defined in Exchange Act Rule 13a-15(f)) during the fourth quarter ended
June 30, 2015
, that have materially affected or are reasonably likely to materially affect the Company’s internal control over financial reporting.
Inherent Limitation of the Effectiveness of Internal Control
. A control system, no matter how well conceived, implemented and operated, can provide only reasonable, not absolute, assurance that the objectives of the internal control system are met. Because of such inherent limitations, no evaluation of controls can provide absolute assurance that all control issues, if any, within a company or any division of a company have been detected.
In light of Frank Holmes’ ownership of
99.78 percent
of the class C voting shares, the Company is eligible to rely on the exemption from certain of the NASDAQ corporate governance listing requirements relating to the independence of the Board of Directors and certain committees that is afforded to controlled companies. Under NASDAQ rules, a controlled company is a company of which more than 50 percent of the voting power for the election of directors is held by an individual, a group or another company.
60
|
|
|
The directors and executive officers of U.S. Global Investors, Inc. (“U.S. Global” or the “Company”) are as follows:
|
Name
|
Age
|
Position
|
|
Frank E. Holmes
|
60
|
Director of the Company and Chief Executive Officer of the Company since October 1989, and Chief Investment Officer since June 1999. Since October 1989, Mr. Holmes has served and continues to serve in various positions with the Company, its subsidiaries, and the investment companies it sponsors. Mr. Holmes has served as Trustee of U.S. Global Investors Funds since August 1989. Mr. Holmes has also served as Director of Meridian Fund Managers Ltd. since November 2003, Director of Meridian Global Gold & Resources Fund Ltd. since December 2003, Director of Meridian Global Energy & Resources Fund Ltd. since April 2006, Director of Meridian Global Dividend Income Fund from April 2011 to March 2014.
|
|
Jerold H. Rubinstein
|
77
|
Chairman of the Board of Directors since February 2006 and Director of the Company since October 1989. Director, Chairman of the Board and CEO of Stratus Media Group, Inc. from April 2011 to July 2014. Director, Chief Executive Officer, and Chairman of the Board for ProElite, Inc. from June 2012 to July 2014. Director, Chairman of the Board and Chairman of the Audit Committee of RestorGenex Corporation during the period April 2011 to July 2014. Director and Chairman of the Audit Committee of SpendSmart Payments Co. since October 2013. Founder and Chief Executive Officer of Music Imaging & Media, Inc. from July 2002 to January 2010. Director and Chairman of the Audit Committee of CKE Restaurants from June 2006 to July 2010.
|
|
Roy D. Terracina
|
68
|
Director of the Company since December 1994 and Vice Chairman of the Board of Directors since May 1997. Owner of Sunshine Ventures, Inc., a company formed to hold investments, since January 1994. Chairman of the Board of Our Lady of the Lake University since September 2006.
|
|
Thomas F. Lydon, Jr.
|
55
|
Director of the Company since June 1997. Chairman of the Board and President of Global Trends Investments since April 1996. Trustee of Rydex/SGI from June 2005 to February 2012. Trustee of Guggenheim Investments since February 2012.
|
|
Susan B. McGee
|
56
|
President of the Company since February 1998, General Counsel since March 1997. Since September 1992, Ms. McGee has served and continues to serve in various positions with the Company, its subsidiaries, and the investment companies it sponsors.
|
|
Lisa C. Callicotte
|
42
|
Chief Financial Officer of the Company since July 12, 2013. Controller of the Company from July 2009 until July 2013. Since July 2009, Ms. Callicotte has served and continues to serve in various positions with the Company, its subsidiaries, and the investment companies it sponsors.
|
None of the directors or executive officers of the Company has a family relationship with any of the other directors or executive officers.
The members of the Board of Directors are elected for one-year terms or until their successors are elected and qualified. The Board of Directors appoints the executive officers of the Company.
Director Independence
.
The Company’s Board of Directors is currently composed of four members. The Board of Directors has determined that three of the four members meet the definition of an independent director set forth in NASDAQ Rule 5605(a)(2), with the exception being Frank Holmes, who is the Chief Executive Officer and Chief Investment Officer of the Company. In assessing the independence of directors, the Board of Directors considered the business relationships between the Company and its directors or their affiliated businesses, including businesses owned and operated by family members, other than ordinary investment relationships. Furthermore, the Board of Directors has determined that none of the members of the two standing committees of the Board of Directors in existence during the
2015
fiscal year has any material relationship with the Company (either directly or as a partner, stockholder or officer of an organization that has a relationship with the Company) and that each such member is “independent” within the meaning of the independence standards applicable to each such committee.
61
The Board of Directors held
six
meetings over the past fiscal year. Each incumbent director attended at least
75 percent
of the board meetings during the last fiscal year. Directors are encouraged to attend the Annual Meeting of Shareholders.
Three
of the
four
directors attended the
2014
Annual Meeting. The standing committees of the Board of Directors currently consist of the Audit Committee and the Compensation Committee. The membership and responsibilities of those committees are described below:
|
Independent Directors
|
|
Audit Committee
|
|
Compensation Committee
|
|
Roy D. Terracina
|
|
Chairman
|
|
Member
|
|
Thomas F. Lydon, Jr.
|
|
Member
|
|
Chairman
|
|
Jerold H. Rubinstein
|
|
Member
|
|
Member
|
Audit Committee
.
The Company has a separately designated Audit Committee, established in accordance with Section 3(a)(58)(A) of the Exchange Act. The Audit Committee assists the Board of Directors in monitoring the integrity of the financial statements of the Company; the independent auditor’s qualifications and independence; the performance of the Company’s internal audit function and independent auditors; complaints relating to the Company’s accounting, internal accounting controls and audit matters; and the Company’s accounting and financial reporting processes and audits of the Company’s financial statements. The Board of Directors has determined that Director Roy Terracina qualifies as an “audit committee financial expert” as defined in Item 401(e) of Regulation S-K under the Exchange Act. Mr. Terracina’s pertinent experience, qualifications, attributes, and skills include: a bachelor’s degree and a master’s degree in finance, financial experience as a treasurer of a publicly traded company, managerial experience attained as the owner of a company responsible as a major supplier of baked and packaged goods primarily through the Department of Defense, the knowledge and experience he has attained from service on other boards and the knowledge and experience he has attained from his service on U.S. Global’s Board of Directors. The Audit Committee met
seven
times during the past fiscal year. Each incumbent committee member attended at least
75 percent
of the committee meetings during the last fiscal year.
Report of the Audit Committee.
Management is responsible for U.S. Global’s internal controls and financial reporting process. BDO USA, LLP, U.S. Global’s independent registered public accounting firm for the fiscal year ended
June 30, 2015
, is responsible for performing an independent audit of U.S. Global’s consolidated financial statements in accordance with the standards of the Public Company Accounting Oversight Board (“PCAOB”) and to issue its report thereon. The Audit Committee monitors and oversees these processes. The Audit Committee approves the selection and appointment of U.S. Global’s independent registered public accounting firm and recommends the ratification of such selection and appointment to U.S. Global’s Board of Directors.
The Audit Committee has reviewed and discussed U.S. Global’s audited financial statements with management and BDO USA, LLP. The committee has discussed with BDO USA, LLP the matters required to be discussed by the PCAOB auditing standards which relates to the conduct of our audit, including our auditors’ judgment about the quality of the accounting principles applied in our fiscal year
2015
audited consolidated financial statements. The Audit Committee has received the written disclosures and the letter from BDO USA, LLP required by applicable requirements of the PCAOB regarding the independent accountant’s communications with the committee concerning independence and has discussed with BDO USA, LLP that firm’s independence.
Based on the foregoing review and discussions and such other matters the Audit Committee considered relevant and appropriate, the committee recommended to the Board of Directors that the audited financial statements of U.S. Global be included in its Annual Report on Form 10-K for the year ended
June 30, 2015
.
Compensation Committee
.
The Compensation Committee assists the Board of Directors in carrying out its responsibilities with respect to employee qualified benefit plans and employee programs, executive compensation programs, stock option plans and director compensation programs. The Compensation Committee has broad responsibility for assuring that the Company’s executive officers, including the Company’s Chief Executive Officer, are effectively compensated in terms of salaries, supplemental compensation and benefits that are internally equitable and externally competitive. Additional responsibilities include the review and approval of corporate goals and objectives relevant to the Chief Executive Officer. The Compensation Committee reviews all components of compensation, including salaries, cash incentive plans, long-term incentive plans and various employee benefit matters. The Compensation Committee met
two
times during the past fiscal year. Each incumbent committee member attended at least
75 percent
of the committee meetings during the last fiscal year.
62
Compensation Committee Interlocks and Insider Participation.
During fiscal year
2015
, the Compensation Committee consisted of Roy D. Terracina, Thomas F. Lydon, Jr., and Jerold H. Rubinstein. All members of the Compensation Committee were independent directors, and no member was an employee or former employee. During fiscal year
2015
, none of the Company’s executive officers served on the compensation committee (or its equivalent) or board of directors of another entity whose executive officer served on the Company’s Compensation Committee.
Nomination of Directors
. Although the Company does not have a standing nominating committee, the Company’s Corporate Governance Guidelines effectively provide guidance on selection and nomination process whenever a vacancy occurs on the Board of Directors. Due to the longevity of service of the current Board of Directors, those Directors have not participated in consideration of director nominees.
The Company believes generally that its Board of Directors as a whole should encompass a range of talent and expertise enabling it to provide sound guidance with respect to the Company’s operations and interests. Whenever a vacancy occurs on the Board of Directors, the board members are responsible for identifying one or more candidates to fill that vacancy, investigating each candidate and evaluating their suitability for service on the board. The following attributes or qualifications will be considered by the Board of Directors in evaluating a person’s candidacy:
|
•
|
Management and leadership experience;
|
|
•
|
Skilled and diverse background; and
|
|
•
|
Integrity and professionalism.
|
The board members are authorized to use any methods it deems appropriate for identifying candidates for board membership. In addition, candidates recommended by the Company’s stockholders are considered in the same manner as other candidates.
The Company’s policy is to have at least a majority of directors qualify as “independent” under the NASDAQ Listing Rules and the Company’s Corporate Governance Guidelines, which are available at the Company’s website at www.usfunds.com.
|
Code of Ethics for Principal Executive and Senior Financial Officers
|
The Company has adopted a Code of Ethics for Principal Executive and Senior Financial Officers that applies to the Company’s principal executive officer and principal financial officer. This code charges these individuals with responsibilities regarding honest and ethical conduct, the preparation and quality of the disclosures in documents and reports the Company files with the SEC, and compliance with applicable laws, rules, and regulations.
|
Compliance with Section 16(a) of the 1934 Act
|
Section 16(a) of the 1934 Act requires directors and officers of the Company and persons who own more than 10 percent of the Company’s class A common stock to file with the SEC initial reports of ownership and reports of changes in ownership of the stock. Directors, officers and more than 10 percent shareholders are required by SEC regulations to furnish the Company with copies of all Section 16(a) forms they file.
Based solely on the Company’s review of the copies of such reports received by the Company and on written representations by the Company’s officers and directors regarding their compliance with the applicable reporting requirements under Section 16(a) of the Exchange Act, the Company believes that, with respect to the fiscal year ended
June 30, 2015
, its officers and directors, and all of the persons known to it to own more than 10 percent of its common stock, filed all required reports on a timely basis with the exception of one report for which a Form 4 relating to one transaction was not filed on behalf of Frank Holmes; however a Form 5 was filed.
63
Compensation Discussion and Analysis
Overview
The following section provides a discussion and analysis of the basis for the compensation awarded to the CEO, the CFO, and our other most highly compensated executive officer of the Company (“Named Executive Officers” or “NEOs”), as well as our directors in fiscal year
2015
. We provide investment advisory and other services to our clients. Our long-term success depends on our ability to provide superior investment returns and outstanding client service. As such, one of our greatest assets is the collective skill, experience and efforts of our employees. To achieve success, we must be able to attract, retain and motivate professionals within all levels of our Company who are committed to our core values.
We place great significance on our values of performance, teamwork, initiative, responsiveness, focused work ethic, and intellectual curiosity. We believe that adherence to these core values will contribute to the long-term success of the Company and our shareholders.
We compete for talent with a large number of investment management and financial services companies, many of which have significantly larger market capitalization than we do. Our relatively small size within the industry, geographic location, and lean executive management team provide unique challenges.
Setting Executive Compensation
The Compensation Committee of our Board of Directors is responsible for reviewing and approving corporate goals and objectives relevant to the CEO, Frank Holmes; evaluating the CEO’s performance in light of those goals and objectives; and determining and approving the CEO’s compensation level based on this evaluation. In addition, the committee is responsible for reviewing and approving compensation recommended by Mr. Holmes for our other executive officers. The Board of Directors appointed Messrs. Lydon, Terracina, and Rubinstein as members of the Compensation Committee. Mr. Lydon serves as the chairman of the Compensation Committee, and there are no Compensation Committee interlocks to report. The Compensation Committee has a charter that is available for review on our website at www.usfunds.com by clicking “About Us,” followed by “Investor Relations,” then “Policies and Procedures.”
The individuals listed below are the CEO and CFO, plus our other most highly compensated NEO in fiscal year
2015
.
|
Name
|
|
Title
|
|
Frank E. Holmes
|
|
Chief Executive Officer and Chief Investment Officer
|
|
Lisa C. Callicotte
|
|
Chief Financial Officer
|
|
Susan B. McGee
|
|
President and General Counsel
|
In establishing total annual compensation for Mr. Holmes, the Compensation Committee considers a number of factors. For assistance in determining the appropriate factors to consider, the Compensation Committee consulted in 2005 with Moss Adams LLP, an executive compensation consulting firm. Importantly, the Compensation Committee considers the various functions Mr. Holmes assumes, including the dual role of CEO and Chief Investment Officer (“CIO”). In addition, the Compensation Committee considers various measures of company performance, including profitability and total shareholder return. The Compensation Committee also reviews Mr. Holmes’ performance in managing our corporate investments, in overseeing the management of our client portfolios and the results of our operational earnings.
In addition to his base salary, Mr. Holmes receives a bonus based on operational earnings, which are substantially derived from assets under management, based on a percentage of operational earnings, and capped at a predetermined dollar amount, as computed for financial reporting purposes in accordance with GAAP (before consideration of this fee).
Mr. Holmes also receives a bonus when our investment team meets their performance goals. The bonus is based on calculated fund performance bonuses of the investment team and is in recognition of Mr. Holmes’ creation and oversight of the investment processes and strategy.
In addition, Mr. Holmes receives a percentage of offshore fund management and performance fees in recognition of attracting and managing offshore client accounts and a percentage of realized gains on investments, offset by realized losses and other-than-temporary write-downs, in recognition of his expertise in managing the investments of the company.
The committee has delegated to Mr. Holmes the responsibility for reviewing the performance of, and recommending the compensation levels for, our other NEOs. The committee does not use rigid formulas with respect to the compensation of NEOs. Mr. Holmes makes a recommendation based on the achievement of qualitative goals that apply to all employees, quantitative goals
64
that apply to an executive officer’s specific job responsibilities and other accomplishments, such as expansion in functional responsibility. In forming his recommendations, Mr. Holmes also considers the responsibilities and workload of the executive officer; the explicit and tacit knowledge required to perform these responsibilities, including any professional designations; the profitability of the company; and the cost of living in San Antonio, Texas.
Objectives
Our executive compensation programs are designed to:
|
•
|
attract and retain key executives,
|
|
•
|
align executive performance with our long-term interests and those of our shareholders, and
|
|
•
|
link executive pay with performance.
|
Elements of Executive Compensation
The committee reviews and approves all components of executive officer compensation. The principal elements of executive compensation, other than Mr. Holmes, are:
|
•
|
base salary,
|
|
•
|
performance-based cash and stock bonuses,
|
|
•
|
long-term incentive awards, and
|
|
•
|
other compensation and benefits.
|
Base Salary
Base salaries for NEOs are reviewed annually by the Compensation Committee. Generally, the salaries of NEOs are occasionally adjusted to recognize expansion of an individual’s role, outstanding and sustained performance, or to bring the officer’s pay into alignment with the market. We did not use any benchmarking studies in fiscal year
2015
to obtain market information. In addition, the Compensation Committee did not consider the equity ownership of the Company by Mr. Holmes when setting his compensation. Nor did the committee aim for a specific relationship between Mr. Holmes and the other executive officers. Base salaries paid to NEOs during the fiscal year are shown in the Summary Compensation Table.
Performance-Based Cash Bonuses
Executive officers, except Mr. Holmes, participate in a team performance pay program based on each employee’s annual salary to recognize monthly completion of departmental goals. Additionally, key executive officers are compensated based on individual performance pay arrangements. Discretionary cash bonuses are awarded from time to time for such things as completion of critical projects or outstanding performance.
Mr. Holmes considered a matrix of factors in reviewing the performance of, and compensation for, the CFO, Ms. Lisa Callicotte. Mr. Holmes considered such things as responsibilities, productivity, results of the Company’s actual versus targeted goals, hours of work, profitability of the Company, timely and accurate financial regulatory filings, unqualified S-Ox and audit results and the cost of living in San Antonio. Occasionally, Ms. Callicotte receives discretionary bonuses for the completion of special projects.
In reviewing the performance of and compensation for the President and General Counsel Susan McGee, Mr. Holmes considers a matrix of factors including responsibilities, productivity, hours of work, profitability of the Company, timely and accurate regulatory filings, completion of regulatory examinations, and the cost of living in San Antonio. In addition to her base salary, Ms. McGee is paid a monthly bonus based on retail assets in recognition of her strategic guidance of the sales personnel. Ms. McGee receives a monthly bonus when certain financial metrics are met. Occasionally, Ms. McGee receives discretionary bonuses for special projects such as completion of regulatory exams or managing significant new business relationships.
Long-Term Incentive Awards
Long-term incentive awards include stock options and restricted shares. We have utilized option grants to induce qualified individuals to join us, thereby providing the individual with an opportunity to benefit if we have significant growth. Similarly, options have been utilized to reward existing employees, including NEOs, for long and faithful service and to encourage them to stay with us. The Compensation Committee administers the stock option plans. Although the Company has no written policy for allocating between cash and equity, or current and long-term compensation for the CEO and other NEOs, the weighting has generally been in the range of less than 5 percent long-term compensation in the form of options or stock awards, with the remaining compensation in cash.
65
Stock Option Plans
In November 1989, the Board of Directors adopted the 1989 Non-Qualified Stock Option Plan (“1989 Plan”) which provides for the granting of options to purchase shares of our class A common stock to directors, officers, and employees. On December 6, 1991, shareholders approved and amended the 1989 Plan to provide provisions to cause the plan and future grants under the plan to qualify under 1934 Act Rule 16b-3. The 1989 Plan is administered by the Compensation Committee consisting of three outside members of the Board of Directors. The maximum number of shares of class A common stock initially approved for issuance under the 1989 Plan is
1,600,000
shares. During the fiscal year ended
June 30, 2015
, no stock options were granted. As of
June 30, 2015
, under this amended plan,
1,733,400
options had been granted,
883,000
options had been exercised,
850,400
options had expired, no options remained outstanding and
717,000
options are available for grant.
In April 1997, the Board of Directors adopted the 1997 Non-Qualified Stock Option Plan (“1997 Plan”), which shareholders approved on April 25, 1997. It provides for the granting of stock appreciation rights (“SARs”) and/or options to purchase shares of our class A common stock to directors, officers and employees. The 1997 Plan expressly requires that all grants under the plan qualify under 1934 Act Rule 16b-3. The 1997 Plan is administered by the Compensation Committee consisting of three outside members of the Board of Directors. The maximum number of shares of class A common stock initially approved for issuance under the 1997 Plan is
400,000
shares. During the fiscal year ended
June 30, 2015
, no stock options were granted. As of
June 30, 2015
,
581,300
options had been granted;
257,000
shares had been exercised;
302,300
options had expired;
22,000
options remained outstanding, and
121,000
options are available for grant.
2010 Stock Incentive Plan
In October 2010, at the Annual Meeting of Shareholders, the class C shareholders voted to adopt the 2010 Stock Incentive Plan. The 2010 Stock Incentive Plan is intended to promote the interests of the Company by providing eligible persons in the Company’s service with the opportunity to acquire a proprietary interest, or otherwise increase their proprietary interest, in the Company to align such persons’ interests with those of the Company’s shareholders and as an incentive for them to remain in such service. During fiscal year
2015
,
no
stock bonuses were awarded to NEOs.
Assessment of Risk
By design, the Company’s compensation program for all employees, including executive officers, does not incentivize excessive risk-taking. The Company’s base salary component of compensation does not encourage risk-taking because it is a fixed amount. Generally, incentive awards have the following risk-limiting characteristics:
|
•
|
Awards are made based on a review of a variety of indicators of performance, thus diversifying the risk associated with any single indicator of performance;
|
|
•
|
For executive officers other than Mr. Holmes (who is a significant U.S. Global shareholder), the majority of the award value is delivered in the form of stock that vests over a multiple years, which aligns the interests of executive officers to long-term shareholder interests; and
|
|
•
|
All participants, including executive officers, in the Employee Stock Purchase Plan are subject to stock ownership and holding guidelines.
|
Other Compensation and Benefits
Health, Welfare and Retirement Benefits
Health, welfare, and retirement benefits are designed to provide a safety net of protection for employees in the event of illness, disability, or death, and to provide employees an opportunity to accumulate retirement savings.
We offer a range of health and welfare benefits to substantially all employees, including the NEOs. These benefits include medical, dental, vision, prescription drug, short-term disability, long-term disability, group life and accidental death insurance, tuition reimbursement, and a free health club membership.
401(k) Plan
We offer a 401(k) plan covering substantially all employees, including NEOs. Participants may contribute, on a pretax basis, their base salary and cash incentive compensation, up to a limit imposed by the Internal Revenue Code, which is
$18,000
in calendar year
2015
. An additional “catch-up” pretax contribution of up to
$5,500
is allowed for employees over 50. We automatically match
100 percent
of the first
3 percent
of participating employees’ contributions and
50 percent
of the next
2 percent
of participating employees’ contributions. We contribute to participants’ accounts at the same time that the employee’s pay deferral is made. Employees are immediately vested in both their 401(k) salary deferral contribution and the matched contributions. Participants in our 401(k) plan may allocate some or all of their contributions to a separate designated Roth account, commonly known as a Roth 401(k).
66
Profit Sharing
The 401(k) plan allows for us to make a discretionary profit sharing contribution, as authorized by the Board of Directors. Factors that are considered by the Board of Directors include earnings, cash flows, capital requirements and the general financial condition of the Company. No specific performance thresholds or goals are required by the board to authorize a profit sharing contribution.
No
profit sharing contributions were made in fiscal years
2015
,
2014
, or
2013
.
Savings Plans
We also have a program pursuant to which we offer employees an opportunity to participate in savings programs using managed investment companies. Employee contributions to an Individual Retirement Account are matched to a maximum of $100 per month for certain management-level employees, including NEOs, and a maximum of $30 for all other employees. Similarly, certain management-level employees, including NEOs, may contribute to the Near-Term Tax Free Fund and we will match these contributions up to a maximum of $90 per month. A similar savings plan utilizing UGMA accounts is offered to all employees to save for minor relatives and is matched at a maximum of $15 per month per child.
Employee Stock Purchase Plan
We also have a program whereby eligible employees can purchase treasury shares, at market price, and we will automatically match their contribution up to 3 percent of gross salary. During fiscal years
2015
,
2014
, and
2013
, employees purchased
37,383
;
52,191
; and
48,679
shares of treasury stock from us, respectively. The purchase price used is the closing stock price on the last business day of each month. All participants, including executive officers, in the Employee Stock Purchase Plan are subject to stock ownership and holding guidelines. We do not restrict the ability of our employees or directors to hedge their position in our shares. In addition, neither the board nor NEOs are required to own or purchase a certain number of shares.
The Summary Compensation Table includes the matched contributions to the plans described above for each NEO.
Perquisites and Other Benefits
We provide certain perquisites that the committee believes are reasonable and consistent with our overall compensation program to a limited number of officers. The perquisites consist of such things as memberships for business entertainment purposes and policies for long-term disability and life insurance. The Summary Compensation Table shows the value of perquisites provided to NEOs in fiscal year
2015
in the “All Other Compensation” column.
Employment Agreements, Termination and Change-in Control Arrangements
We do not have any employment agreements, termination agreements, or change-in control agreements with any of our executive officers.
Compliance with Section 162(m)
Section 162(m) of the Internal Revenue Code generally disallows a tax deduction to public corporations for compensation greater than $1 million paid during any fiscal year to our CEO and our four other most highly compensated executive officers. However, the statute exempts qualifying performance-based compensation from the deduction limit if certain requirements are met. The Compensation Committee plans to review this matter as appropriate and take action as may be necessary to preserve the deductibility of compensation payments to the extent reasonably practical and consistent with our objectives.
67
Compensation of Named Executive Officers
The following table sets forth for the fiscal year ended
June 30, 2015
, the compensation reportable for the NEOs, as determined by SEC rules. Columns were omitted if they were not applicable.
|
Summary Compensation Table
|
||||||||||||||||||||
|
Name and Principal
Position
|
Year
|
Salary
($)
|
Bonus
($)
|
Stock
Awards
($)
|
Non-Equity
Incentive Plan
Compensation
($)
1
|
All Other
Compensation
($)
|
|
Total
($)
|
||||||||||||
|
(dollars in thousands)
|
||||||||||||||||||||
|
Frank E. Holmes
|
2013
|
412
|
|
6
|
|
—
|
|
230
|
|
123
|
|
|
771
|
|
||||||
|
Chief Executive Officer
|
2014
|
422
|
|
4
|
|
—
|
|
220
|
|
119
|
|
765
|
|
|||||||
|
Chief Investment Officer
|
2015
|
|
422
|
|
|
6
|
|
|
—
|
|
|
70
|
|
|
118
|
|
2
|
616
|
|
|
|
Catherine A. Rademacher
|
2013
|
101
|
|
49
|
|
—
|
|
—
|
|
18
|
|
168
|
|
|||||||
|
Chief Financial Officer
4
|
|
|
||||||||||||||||||
|
Lisa C. Callicotte
|
2014
|
135
|
|
27
|
|
—
|
|
—
|
|
19
|
|
181
|
|
|||||||
|
Chief Financial Officer
4
|
2015
|
135
|
|
30
|
|
—
|
|
—
|
|
19
|
|
3
|
184
|
|
||||||
|
Susan B. McGee
|
2013
|
258
|
|
29
|
|
—
|
|
48
|
|
133
|
|
|
468
|
|
||||||
|
President
|
2014
|
258
|
|
34
|
|
—
|
|
23
|
|
123
|
|
438
|
|
|||||||
|
General Counsel
|
2015
|
|
258
|
|
|
36
|
|
|
—
|
|
|
12
|
|
|
128
|
|
5
|
434
|
|
|
|
1.
|
Amounts consist of cash incentive compensation awards earned for services. The amounts were paid pursuant to the senior executive bonus programs.
|
|
2.
|
Represents amounts paid by us on behalf of Mr. Holmes as follows: (i) $57 in insurance, (ii) $33 in matched contributions, (iii) $18 in memberships, and (iv) $10 in miscellaneous items.
|
|
3.
|
Represents amounts paid by us on behalf of Ms. Callicotte as follows: (i) $17 in matched contributions and (ii) $2 in miscellaneous items.
|
|
4.
|
Ms. Callicotte replaced Ms. Rademacher as Chief Financial Officer effective July 12, 2013.
|
|
5.
|
Represents amounts paid by us on behalf of Ms. McGee as follows: (i) $73 in insurance, (ii) $26 in matched contributions, (iii) $19 in memberships, and (iv) $10 in miscellaneous items.
|
No stock awards were granted to the named executive officer in fiscal year
2015
.
During fiscal year
2015
, there were no exercises of stock options or vesting of restricted stock. As of
June 30, 2015
, Ms. Callicotte held
2,000
fully vested stock options exercisable at a price of
$12.31
. These options expire on October 7, 2019. No other options were outstanding for any of the named executive officers.
The Outstanding Equity Awards at Fiscal Year-End, Pension Benefits and Nonqualified Deferred Compensation Tables were omitted because they were not applicable.
68
Compensation of Directors
The compensation of directors is subject to a minimum of $6,000 in any quarter paid in arrears. We may grant non-employee directors options under our 1989 and 1997 Stock Option Plans. Directors are reimbursed for reasonable travel expenses incurred in attending the meetings held by the Board of Directors. Mr. Rubinstein serves as the Chairman of the Board. The Company grants each director 100 shares of stock per month. Director compensation for the fiscal year ended
June 30, 2015
, is detailed in the table below. Columns that were not applicable were omitted.
|
Director Compensation
|
||||||||||||
|
Name
|
Fees Earned or
Paid in Cash
1
|
Stock Awards
2
|
Total
|
|||||||||
|
(dollars in thousands)
|
||||||||||||
|
Jerold H. Rubinstein
|
$
|
109
|
|
$
|
4
|
|
$
|
113
|
|
|||
|
Roy D. Terracina
|
$
|
42
|
|
$
|
4
|
|
$
|
46
|
|
|||
|
Thomas F. Lydon, Jr.
|
$
|
24
|
|
$
|
4
|
|
$
|
28
|
|
|||
|
1.
|
The difference in fees earned was primarily due to Mr. Rubinstein receiving an additional $5,000 per month for added responsibilities as chairman.
|
|
2.
|
Amounts shown represent expense recognized in the consolidated financial statements for stock awards granted to non-employee directors in fiscal year
2015
.
|
Compensation Committee Report on Executive Compensation
The Compensation Committee is composed entirely of independent directors in accordance with the listing standards of the NASDAQ Stock Market. The Compensation Committee has reviewed and discussed the Compensation Discussion and Analysis required by Item 402(b) of Regulation S-K with management. Based upon this review and discussion, the committee has recommended to the Board of Directors that the Compensation Discussion and Analysis section be included in this annual report.
Respectfully,
Members of the Compensation Committee
Thomas F. Lydon, Jr., Chairman
Jerold H. Rubinstein
Roy D. Terracina
69
|
Security Ownership of Certain Beneficial Owners
|
Class C Common Stock (Voting Stock)
On
September 4, 2015
, there were
2,069,127
shares of the Company’s class C common stock outstanding. The following table sets forth, as of such date, information regarding the beneficial ownership of the Company’s class C common stock by each person known by the Company to own 5 percent or more of the outstanding shares of class C common stock.
|
Name and Address of Beneficial Owner
|
Class C Common Shares Beneficially Owned
|
Percent of
Class (%)
|
||||
|
Frank Holmes
|
2,064,560
|
|
99.78
|
%
|
||
|
7900 Callaghan Road
|
||||||
|
San Antonio, TX 78229
|
||||||
Class A Common Stock (Nonvoting Stock)
On
September 4, 2015
, there were
13,264,590
shares of the Company’s class A common stock issued and outstanding. The following table sets forth, as of such date, information regarding the beneficial ownership of the Company’s class A common stock by each person known by the Company to own 5 percent or more of the outstanding shares of class A common stock.
|
Name and Address of Beneficial Owner
|
Class A Common Shares Beneficially Owned
|
|
Percent of
Class (%)
|
||||
|
Financial & Investment Management Group, Ltd. - Traverse City, MI
1
|
|
2,638,047
|
|
1
|
|
19.89
|
%
|
|
Royce & Associates, LLC
2
|
|
2,050,954
|
|
2
|
|
15.46
|
%
|
|
1.
|
Information is from Schedule 13G as of
July 31, 2015
, filed with the SEC on
August 12, 2015
.
|
|
2.
|
Information is from Schedule 13F as of
June 30, 2015
, filed with the SEC on
August 10, 2015
.
|
Security Ownership of Management
The following table sets forth, as of
September 4, 2015
, information regarding the beneficial ownership of the Company’s class A and class C common stock by each director and named executive officer and by all directors and executive officers as a group. Except as otherwise indicated in the notes below, each person owns directly the number of shares indicated in the table and has sole voting power and investment power with respect to all such shares.
|
|
|
Class C
Common Stock
|
|
Class A
Common Stock
|
||||||||
|
Beneficial Owner
|
Number of
Shares
|
|
%
|
|
Number of
Shares
|
|
%
|
|||||
|
Frank E. Holmes, CEO, Director
|
|
2,064,560
|
|
99.78
|
%
|
|
415,321
|
|
3.13
|
%
|
||
|
Lisa C. Callicotte, CFO
|
|
—
|
|
—
|
|
|
12,803
|
|
0.10
|
%
|
||
|
Susan B. McGee, President, General Counsel
|
|
—
|
|
—
|
|
|
96,927
|
|
0.73
|
%
|
||
|
Jerold H. Rubinstein, Director
|
|
—
|
|
—
|
|
|
900
|
|
0.01
|
%
|
||
|
Roy D. Terracina, Director
|
|
—
|
|
—
|
|
|
55,700
|
|
0.42
|
%
|
||
|
Thomas F. Lydon, Jr., Director
|
|
—
|
|
—
|
|
|
9,400
|
|
0.07
|
%
|
||
|
All directors and executive officers as a group (six persons)
|
|
2,064,560
|
|
|
99.78
|
%
|
|
591,051
|
|
|
4.46
|
%
|
70
Equity Compensation Plan Information
|
Plan Category
|
Number of securities to
be issued upon exercise
of outstanding options,
warrants and rights
(a)
|
Weighted-average
exercise price of
outstanding options,
warrants and rights
(b)
|
Number of securities
remaining available for
future issuance under
equity compensation
plans (excluding
securities reflected in
column (a))
(c)
|
|||||||
|
Equity compensation plans approved by security holders
|
N/A
|
|
N/A
|
|
N/A
|
|
||||
|
Equity compensation plans not approved by security holders
|
||||||||||
|
1989 Stock Option Plan
1
|
—
|
|
—
|
|
717,000
|
|
||||
|
1997 Non-Qualified Stock Option Plan
2
|
22,000
|
|
$
|
18.72
|
|
121,000
|
|
|||
|
Employee Stock Purchase Plan
3
|
N/A
|
|
N/A
|
|
121,369
|
|
||||
|
2010 Stock Incentive Plan
4
|
N/A
|
|
N/A
|
|
81,400
|
|
||||
|
Total
|
22,000
|
|
1,040,769
|
|
||||||
|
1.
|
Stock options under this plan may be granted to directors, officers, and employees of the Company from authorized but unissued shares or treasury shares.
|
|
2.
|
Stock options under this plan may be granted to directors, executives, and key salaried employees of the Company from authorized but unissued shares or treasury shares. The term of the option periods must be less than ten years.
|
|
3.
|
The Company has adopted a stock purchase plan to provide eligible employees of the Company an opportunity to purchase common stock of the Company. There are authorized shares of treasury stock reserved for issuance under the plan for which a registration statement was filed. The Company contributes on behalf of each participant an amount equal to lesser of (i) the aggregate amount of the participant’s payroll deductions the purchase period, or (ii) 3% of the participant’s base compensation during the purchase period.
|
|
4.
|
The Company has adopted a stock incentive plan to provide eligible persons in the Company’s service an opportunity to acquire common stock of the Company. There are authorized shares of treasury stock reserved for issuance under the plan for which a registration statement has not been filed.
|
U.S. Global is invested in several of the mutual funds it manages. See Note 18 Related Party Transactions to the Consolidated Financial Statements of this Annual Report in Form 10-K, which incorporates the information of the relationships and related transaction for this Item 13. Refer to Item 10 for information regarding director independence.
The following table represents fees for professional audit services for the audit of the Company’s annual financial statements for the fiscal years ended
June 30, 2015
, and
2014
, respectively, rendered by BDO USA, LLP.
|
Fiscal year ended June 30,
|
||||||||
|
(dollars in thousands)
|
2015
|
2014
|
||||||
|
Audit fees
1
|
$
|
245
|
|
$
|
296
|
|
||
|
Audit-related fees
2
|
10
|
|
10
|
|
||||
|
Tax fees
3
|
39
|
|
29
|
|
||||
|
Total fees
|
$
|
294
|
|
$
|
335
|
|
||
|
1.
|
Audit fees consist of fees for professional services rendered by the principal accountant for the audit of the Company’s annual financial statements and review of the financial statements included in the Company’s Form 10-Q and for services that are normally provided by the accountant in connection with statutory and regulatory filings or engagements.
|
|
2.
|
Audit-related fees consist primarily of fees for assurance and related services by the accountant that are reasonably related to the performance of the audit or review of the Company’s financial statements and fees related to the audit of the Employee Stock Purchase Plan.
|
|
3.
|
Tax fees include the preparation of federal tax returns as well as tax planning and consultation on new tax legislation, regulations, rulings, and developments.
|
71
Audit Committee Pre-Approval Policies
The Audit Committee has established pre-approval policies pursuant to which all audit and auditor- provided non-audit engagement fees and terms must be approved. Pre-approval is generally provided and is detailed as to the particular service or category of services. The Audit Committee is also responsible for considering, to the extent applicable, whether the independent auditors’ provision of other non-audit services to the Company is compatible with maintaining the independence of the independent auditors.
All services provided by BDO USA, LLP in the fiscal years ended
June 30, 2015
, and
2014
, were pre-approved by the Audit Committee.
72
|
|
|
(a) The following documents are filed as part of this report:
|
1. Financial Statements
|
||||
See Item 8 of Part II of this report.
|
2. Financial Statement Schedules
|
||||
None.
|
3. Exhibits
|
||||
|
3.1
|
Fourth Restated and Amended Articles of Incorporation of Company, incorporated by reference to the Company’s Form 10-Q for the quarterly report ended March 31, 2007 (EDGAR Accession Number 000095134-07-010817).
|
|
|
3.2
|
Amended and Restated By-Laws of Company, incorporated by reference to Exhibit 3.02 of the Company’s Form 8-K filed on November 8, 2006, (EDGAR Accession Number 0000754811-06-000076).
|
|
|
10.1
|
Advisory Agreement with U.S. Global Investors Funds, dated October 1, 2008, incorporated by reference to Post-Effective Amendment 100 filed October 1, 2008 (EDGAR Accession No. 0000950134-08-017422).
|
|
|
10.2
|
Amended and Restated Transfer Agency Agreement, dated January 15, 2010, by and between U.S. Global Investors Funds and United Shareholder Services, Inc., incorporated by reference to Post-Effective Amendment 105 filed February 26, 2010 (EDGAR Accession No. 0000950123-10-018191).
|
|
|
10.3
|
Amended and Restated Administrative Services Agreement, dated December 9, 2013, by and between U.S. Global Investors Funds and U.S. Global Investors, Inc., incorporated by reference to Exhibit 10.3 of the Company’s Quarterly Report on Form 10-Q for the quarterly period ended December 31, 2013 (EDGAR Accession No. 0000754811-14-000019).
|
|
|
10.4
|
Amended and Restated Distribution Plan Pursuant to Rule 12b-1 Plan, dated January 15, 2010, by and between U.S. Global Investors Funds and U.S. Global Brokerage, Inc., incorporated by reference to Post-Effective Amendment 105 filed February 26, 2010 (EDGAR Accession No. 0000950123-10-018191).
|
|
|
10.5
|
Amended and Restated Distribution Agreement dated March 4, 2010, by and between U.S. Global Investors Funds and U.S. Global Brokerage, Inc., incorporated by reference to Post-Effective Amendment 107 filed April 30, 2010 (EDGAR Accession No. 0001104659-10-024038).
|
|
|
10.7
|
United Services Advisors, Inc. 1989 Non-Qualified Stock Option Plan, incorporated by reference to Exhibit 4(a) of the Company’s Registration Statement No. 33-3012, Post-Effective Amendment No. 2, filed on Form S-8 with the Commission on April 23, 1997 (EDGAR Accession No. 0000754811-97-000004).
|
|
|
10.8
|
U.S. Global Investors, Inc. 1997 Non-Qualified Stock Option Plan, incorporated by reference to Exhibit 4 of the Company’s Registration Statement No. 333-25699 filed on Form S-8 with the Commission on April 23, 1997 (EDGAR Accession No. 0000754811-97-000003).
|
|
|
10.9
|
Line of Credit Note dated June 3, 2005, between the Company and JP Morgan Chase Bank N.A., incorporated by reference to Exhibit 10.10 of the Company’s Form 10-K for fiscal year ended June 30, 2006 (EDGAR Accession No. 0000950134-06-017619).
|
|
|
10.10
|
2010 Stock Incentive Plan, incorporated by reference, filed on September 26, 2011 (EDGAR Accession No. 0000950123-11-082564).
|
|
|
10.11
|
Reserved
|
|
|
10.12
|
Amendment dated February 26, 2009 to Credit Agreement dated June 3, 2005, and Line of Credit Note dated February 26, 2009 by and between the Company and JP Morgan Chase Bank N.A., incorporated by reference, filed on September 10, 2009 (EDGAR Accession No. 0000950123-09-042459).
|
|
|
10.13
|
Registration statement for the U.S. Global Investors, Inc. Employee Stock Purchase Plan, as amended May 9, 2005, incorporated by reference, filed July 8, 2008 (EDGAR Accession No. 0000950134-08-012469).
|
|
|
10.14
|
Registration statement for the U.S. Global Investors, Inc. 401(k) Plan, as amended January 1, 2007, incorporated by reference, filed July 8, 2008 (EDGAR Accession No. 0000950134-08-012468).
|
|
73
|
10.15
|
Registration statement for the U.S. Global Investors, Inc. Employee Stock Purchase Plan, as amended April 28, 2009, incorporated by reference, filed April 30, 2009 (EDGAR Accession No. 0000950134-09-008950).
|
|
|
10.16
|
Note Modification Agreement dated May 14, 201, by and between the Company and JPMorgan Chase Bank, N.A., included herein.
|
|
|
10.17
|
Amended and Restated Administrative Services Agreement, dated August 14, 2014, and effective as of November 1, 2014, by and between U.S. Global Investors Funds and U.S. Global Investors, Inc., (EDGAR Accession No. 0001104659-14-062160).
|
|
|
10.18
|
Line of Credit Note dated June 29, 2015, between the Company and JP Morgan Chase Bank N.A., included herein.
|
|
|
14.01
|
Code of Ethics for Principal Executive and Senior Financial Officers, adopted December 15, 2003, and amended February 23, 2009, incorporated by reference, filed on September 10, 2009 (EDGAR Accession No. 0000950123-09-042459).
|
|
|
14.02
|
Code of Ethics, adopted June 28, 1989, and amended April 29, 2015, included herein.
|
|
|
21
|
List of Subsidiaries of the Company, included herein.
|
|
|
23.1
|
BDO USA, LLP consent of independent registered public accounting firm for Form 10-K for U.S. Global Investors, Inc., included herein.
|
|
|
24
|
Power of Attorney, incorporated by reference to Annual Report on Form 10-K for fiscal year ended June 30, 2001 (EDGAR Accession No. 0000754811-01-500016).
|
|
|
31.1
|
Rule 13a-14(a) Certifications (under Section 302 of the Sarbanes-Oxley Act of 2002), included herein.
|
|
|
32.1
|
Section 1350 Certifications (under Section 906 of the Sarbanes-Oxley Act of 2002), included herein.
|
|
|
101.INS
|
INS XBRL Instance Document.
|
|
|
101.SCH
|
SCH XBRL Taxonomy Extension Schema Document.
|
|
|
101.CAL
|
CAL XBRL Taxonomy Extension Calculation Linkbase Document.
|
|
|
101.DEF
|
DEF XBRL Taxonomy Extension Definition Linkbase Document.
|
|
|
101.LAB
|
LAB XBRL Taxonomy Extension Labels Linkbase Document.
|
|
|
101.PRE
|
PRE XBRL Taxonomy Extension Presentation Linkbase Document.
|
|
74
Signatures
Pursuant to the requirements of Section 13 of 15(d) of the Securities Exchange Act of 1934, the registrant has duly caused this report to be signed on its behalf by the undersigned, thereunto duly authorized.
|
|
U.S. G
LOBAL
I
NVESTORS
, I
NC
.
|
||||
|
|
By:
|
|
/s/ Frank E. Holmes
|
||
|
|
F
RANK
E. H
OLMES
|
||||
|
Date:
|
September 16, 2015
|
|
Chief Executive Officer
|
||
Pursuant to the requirements of the Securities Exchange Act of 1934, this report has been signed below by the following persons on behalf of the registrant and in the capacities and on the dates indicated.
|
S
IGNATURE
|
|
C
APACITY
IN
WHICH
SIGNED
|
|
D
ATE
|
|
/s/ Frank E. Holmes
|
|
|
||
|
F
RANK
E. H
OLMES
|
|
Chief Executive Officer
Chief Investment Officer
Director
|
|
September 16, 2015
|
|
* /s/ Thomas F. Lydon, Jr.
|
|
|
||
|
T
HOMAS
F. L
YDON
, J
R
.
|
|
Director
|
|
September 16, 2015
|
|
* /s/ Jerold H. Rubinstein
|
|
|
||
|
J
EROLD
H. R
UBINSTEIN
|
|
Chairman, Board of Directors
|
|
September 16, 2015
|
|
* /s/ Roy D. Terracina
|
|
|
||
|
R
OY
D. T
ERRACINA
|
|
Director
|
|
September 16, 2015
|
|
/s/ Lisa C. Callicotte
|
|
|
||
|
L
ISA
C. C
ALLICOTTE
|
|
Chief Financial Officer
|
|
September 16, 2015
|
|
*BY: /s/ Susan B. McGee
|
|
|
||
|
Susan B. McGee
Attorney-in-Fact under
Power of Attorney dated
September 26, 2001
|
|
|
September 16, 2015
|
|
75
TABLE OF CONTENTS
Part I Of Annual Report on Form 10-kItem 1. BusinessItem 1A. Risk FactorsItem 1B. Unresolved Staff CommentsItem 2. PropertiesItem 3. Legal ProceedingsItem 4. Mine Safety DisclosuresPart II Of Annual Report on Form 10-kItem 5. Market For Registrant S Common Equity, Related Shareholder Matters and Issuer Purchases Of Equity SecuritiesItem 6. Selected Financial DataItem 7. Management S Discussion and Analysis Of Financial Condition and Results Of OperationsItem 7A. Quantitative and Qualitative Disclosures About Market RiskItem 8. Financial Statements and Supplementary DataNote 1. OrganizationNote 2. Significant Accounting PoliciesNote 3. Business CombinationNote 4. Discontinued OperationsNote 5. InvestmentsNote 6. Investment Management and Other FeesNote 7. Property and EquipmentNote 8. Intangible AssetsNote 9. Other Accrued ExpensesNote 10. BorrowingsNote 11. Lease CommitmentsNote 12. Benefit PlansNote 13. Shareholders EquityNote 14. Income TaxesNote 15. Earnings Per ShareNote 16. Accumulated Other Comprehensive Income (loss)Note 17. Financial Information By Business SegmentNote 18. Related Party TransactionsNote 19. Contingencies and CommitmentsNote 20. Selected Quarterly Financial Data (unaudited)Item 9. Changes in and Disagreements with Accountants on Accounting and Financial DisclosureItem 9A. Controls and ProceduresItem 9B. Other InformationPart III Of Annual Report on Form 10-kItem 10. Directors, Executive Officers and Corporate GovernanceItem 11. Executive CompensationItem 12. Security Ownership Of Certain Beneficial Owners and Management and Related Stockholder MattersItem 13. Certain Relationships and Related Transactions, and Director IndependenceItem 14. Principal Accounting Fees and ServicesPart IV Of Annual Report on Form 10-kItem 15. Exhibits, Financial Statement Schedules