|
|
|
|
|
|
|
|
|
|
|
|
|
|
|
|
|
|
|
|
|
|
|
|
|
|
|
|
|
|
|
|
|
|
|
|
|
|
|
|
|
|
|
|
|
|
|
|
|
|
|
|
|
Table of Contents
|
For the fiscal year ended
December 31, 2009
|
Commission File Number: 001-14965 |
| Delaware | 13-4019460 | |
|
(State or other jurisdiction
of
incorporation or organization) |
(I.R.S. Employer
Identification No.) |
|
|
200 West Street
New York, N.Y. |
10282
(Zip Code) |
|
| (Address of principal executive offices) |
|
Title of each class:
|
Name of each exchange on which registered: | |
|
Common stock, par value $.01 per share
|
New York Stock Exchange | |
|
Depositary Shares, Each Representing 1/1,000th Interest in a
Share of Floating Rate
Non-Cumulative
Preferred Stock, Series A
|
New York Stock Exchange | |
|
Depositary Shares, Each Representing 1/1,000th Interest in a
Share of 6.20%
Non-Cumulative
Preferred Stock, Series B
|
New York Stock Exchange | |
|
Depositary Shares, Each Representing 1/1,000th Interest in a
Share of Floating Rate
Non-Cumulative
Preferred Stock, Series C
|
New York Stock Exchange | |
|
Depositary Shares, Each Representing 1/1,000th Interest in a
Share of Floating Rate
Non-Cumulative
Preferred Stock, Series D
|
New York Stock Exchange | |
|
5.793%
Fixed-to-Floating
Rate Normal Automatic Preferred Enhanced Capital Securities of
Goldman Sachs Capital II (and Registrant’s guarantee with
respect thereto)
|
New York Stock Exchange | |
|
Floating Rate Normal Automatic Preferred Enhanced Capital
Securities of Goldman Sachs Capital III (and Registrant’s
guarantee with respect thereto)
|
New York Stock Exchange | |
|
Medium-Term
Notes, Series B, Index-Linked Notes due February 2013;
Index-Linked Notes due April 2013; Index-Linked Notes due
May 2013; Index-Linked Notes due 2010; and Index-Linked
Notes due 2011
|
NYSE Alternext US | |
|
Medium-Term
Notes, Series B, Floating Rate Notes due 2011
|
New York Stock Exchange | |
|
Medium-Term
Notes, Series A, Index-Linked Notes due 2037 of GS Finance
Corp. (and Registrant’s guarantee with respect thereto)
|
NYSE Arca | |
|
Medium-Term
Notes, Series B, Index-Linked Notes due 2037
|
NYSE Arca | |
|
Medium-Term
Notes, Series D, 7.50% Notes due 2019
|
New York Stock Exchange |
Table of Contents
| Item 1. | Business |
Table of Contents
Table of Contents
(in millions)
| Year Ended | ||||||||||||||
|
December
|
November
|
November
|
||||||||||||
| 2009 | 2008 | 2007 | ||||||||||||
|
Investment
|
Net revenues | $ | 4,797 | $ | 5,185 | $ | 7,555 | |||||||
|
Banking
|
Operating expenses | 3,527 | 3,143 | 4,985 | ||||||||||
| Pre-tax earnings | $ | 1,270 | $ | 2,042 | $ | 2,570 | ||||||||
|
Trading and Principal
|
Net revenues | $ | 34,373 | $ | 9,063 | $ | 31,226 | |||||||
|
Investments
|
Operating expenses | 17,053 | 11,808 | 17,998 | ||||||||||
| Pre-tax earnings/(loss) | $ | 17,320 | $ | (2,745 | ) | $ | 13,228 | |||||||
|
Asset Management and
|
Net revenues | $ | 6,003 | $ | 7,974 | $ | 7,206 | |||||||
|
Securities Services
|
Operating expenses | 4,660 | 4,939 | 5,363 | ||||||||||
| Pre-tax earnings | $ | 1,343 | $ | 3,035 | $ | 1,843 | ||||||||
|
Total
|
Net revenues | $ | 45,173 | $ | 22,222 | $ | 45,987 | |||||||
| Operating expenses (1) | 25,344 | 19,886 | 28,383 | |||||||||||
| Pre-tax earnings | $ | 19,829 | $ | 2,336 | $ | 17,604 | ||||||||
| (1) | Operating expenses include net provisions for a number of litigation and regulatory proceedings of $104 million, $(4) million and $37 million for the years ended December 2009, November 2008 and November 2007, respectively, that have not been allocated to our segments. |
Table of Contents
| • | we are a member of and an active participant in most of the world’s major stock, options and futures exchanges and marketplaces; | |
| • | we are a primary dealer in many of the largest government bond markets around the world; | |
| • | we have interbank dealer status in currency markets around the world; | |
| • | we are a member of or have relationships with major commodities exchanges worldwide; and | |
| • | we have commercial banking or deposit-taking institutions organized or operating in the United States, the United Kingdom, Ireland, Brazil, Switzerland, Germany, France, Russia and South Korea. |
Table of Contents
| Business Segment/ Component | Primary Products and Activities | ||
|
Investment Banking:
|
|||
|
Financial Advisory
|
• Mergers and acquisitions advisory services
|
||
|
• Financial restructuring advisory services
|
|||
|
Underwriting
|
• Equity and debt underwriting
|
||
|
Trading and Principal Investments:
|
|||
|
Fixed Income, Currency and Commodities
|
• Commodities and commodity derivatives,
including power generation and related activities
|
||
|
• Credit products, including trading and
investing in credit derivatives, investment-grade corporate
securities, high-yield securities, bank and secured loans,
municipal securities, emerging market and distressed debt,
public and private equity securities and real estate
|
|||
|
• Currencies and currency derivatives
|
|||
|
• Interest rate products, including interest
rate derivatives, global government securities and money market
instruments, including matched book positions
|
|||
|
• Mortgage-related securities and loan products
and other asset-backed instruments
|
|||
|
Equities
|
• Equity securities and derivatives
|
||
|
• Equities and options exchange-based
market-making activities
|
|||
|
• Securities, futures and options clearing
services
|
|||
|
• Insurance activities
|
|||
|
Principal Investments
|
• Principal investments in connection with
merchant banking activities
|
||
|
• Investment in the ordinary shares of
Industrial and Commercial Bank of China Limited
|
|||
|
Asset Management and Securities Services:
|
|||
|
Asset Management
|
• Investment advisory services, financial
planning and investment products (primarily through separately
managed accounts and commingled vehicles) across all major asset
classes, including money markets, fixed income, equities and
alternative investments (including hedge funds, private equity,
real estate, currencies, commodities and asset allocation
strategies), for institutional and individual investors
(including
high-net-worth
clients, as well as retail clients through third-party channels)
|
||
|
• Management of merchant banking funds
|
|||
|
Securities Services
|
• Prime brokerage
|
||
|
• Financing services
|
|||
|
• Securities lending
|
|||
Table of Contents
Table of Contents
| • | First, in large, highly liquid markets, we undertake a high volume of transactions for modest spreads and fees. | |
| • | Second, by capitalizing on our strong relationships and capital position, we undertake transactions in less liquid markets where spreads and fees are generally larger. | |
| • | Finally, we structure and execute transactions that address complex client needs. |
Table of Contents
Table of Contents
Table of Contents
Table of Contents
Table of Contents
(in billions)
(in billions)
| As of | ||||||||||||
|
December 31,
|
November 30,
|
November 30,
|
||||||||||
|
2009
|
2008
|
2007
|
||||||||||
|
Alternative
investments
(1)
|
$ | 146 | $ | 146 | $ | 151 | ||||||
|
Equity
|
146 | 112 | 255 | |||||||||
|
Fixed income
|
315 | 248 | 256 | |||||||||
|
Total
non-money
market assets
|
607 | 506 | 662 | |||||||||
|
Money markets
|
264 | 273 | 206 | |||||||||
|
Total assets under management
|
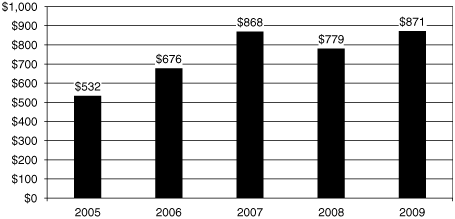
$ | 871 | $ | 779 | $ | 868 | ||||||
| (1) | Primarily includes hedge funds, private equity, real estate, currencies, commodities and asset allocation strategies. |
Table of Contents
(in billions)
| As of | ||||||||||||
|
December 31,
|
November 30,
|
November 30,
|
||||||||||
|
|
2009
|
2008
|
2007
|
|||||||||
|
• Directly Distributed
|
||||||||||||
|
— Institutional
|
$ | 297 | $ | 273 | $ | 354 | ||||||
|
— High-net-worth
individuals
|
231 | 215 | 219 | |||||||||
|
•
Third-Party
Distributed
|
||||||||||||
|
— Institutional,
high-net-worth
individuals and retail
|
343 | 291 | 295 | |||||||||
|
Total
|
$ | 871 | $ | 779 | $ | 868 | ||||||
| • | The Equity Research Departments provide fundamental analysis, earnings forecasts and investment opinions for equity securities; | |
| • | The Credit Research Department provides fundamental analysis, forecasts and investment opinions as to investment-grade and high-yield corporate bonds and credit derivatives; and |
Table of Contents
| • | The Global ECS Department formulates macroeconomic forecasts for economic activity, foreign exchange and interest rates, provides research on the commodity markets, and provides equity market forecasts, opinions on both asset and industry sector allocation, equity trading strategies, credit trading strategies and options research. |
Table of Contents
Table of Contents
Table of Contents
Table of Contents
Table of Contents
Table of Contents
Table of Contents
| • | to transfer any of the depository institution’s assets and liabilities to a new obligor without the approval of the depository institution’s creditors; | |
| • | to enforce the terms of the depository institution’s contracts pursuant to their terms; or | |
| • | to repudiate or disaffirm any contract or lease to which the depository institution is a party, the performance of which is determined by the FDIC to be burdensome and the disaffirmance or repudiation of which is determined by the FDIC to promote the orderly administration of the depository institution. |
Table of Contents
Table of Contents
Table of Contents
Table of Contents
Table of Contents
Table of Contents
Table of Contents
Table of Contents
Table of Contents
Table of Contents
Table of Contents
Table of Contents
Table of Contents
Table of Contents
Table of Contents
Table of Contents
Table of Contents
Table of Contents
| Item 2. | Properties |
Table of Contents
| Item 3. | Legal Proceedings |
Table of Contents
Table of Contents
Table of Contents
Table of Contents
Table of Contents
Table of Contents
Table of Contents
Table of Contents
Table of Contents
| Item 4. | Submission of Matters to a Vote of Security Holders |
Table of Contents
Table of Contents
Table of Contents
| Item 5. | Market for Registrant’s Common Equity, Related Stockholder Matters and Issuer Purchases of Equity Securities |
Table of Contents
|
Total Number of
|
Maximum Number
|
|||||||||||||||
|
Average
|
Shares Purchased
|
of Shares That May
|
||||||||||||||
|
Total Number
|
Price
|
as Part of Publicly
|
Yet Be Purchased
|
|||||||||||||
|
of Shares
|
Paid per
|
Announced Plans
|
Under the Plans or
|
|||||||||||||
|
Period
|
Purchased
|
Share
|
or
Programs
(1)
|
Programs
(1)
|
||||||||||||
|
Month #1
(September 26, 2009 to October 31, 2009) |
— | — | — | 60,838,106 | ||||||||||||
|
Month #2
(November 1, 2009 to November 30, 2009) |
650 | (2) | $ | 172.78 | 650 | (2) | 60,837,456 | |||||||||
|
Month #3
(December 1, 2009 to December 31, 2009) |
50 | (2) | $ | 165.71 | 50 | (2) | 60,837,406 | |||||||||
|
Total
|
700 | 700 | ||||||||||||||
| (1) | On March 21, 2000, we announced that our board of directors had approved a repurchase program, pursuant to which up to 15 million shares of our common stock may be repurchased. This repurchase program was increased by an aggregate of 280 million shares by resolutions of our board of directors adopted on June 18, 2001, March 18, 2002, November 20, 2002, January 30, 2004, January 25, 2005, September 16, 2005, September 11, 2006 and December 17, 2007. We use our share repurchase program to help maintain the appropriate level of common equity and to substantially offset increases in share count over time resulting from employee share-based compensation. |
| (2) | Relates to repurchases of common stock by a broker-dealer subsidiary to facilitate customer transactions in the ordinary course of business. |
| Item 6. | Selected Financial Data |
| Item 7. |
Management’s
Discussion and Analysis of Financial Condition and
Results of Operations |
|
Page
|
||||
| No. | ||||
| 55 | ||||
| 57 | ||||
| 59 | ||||
| 61 | ||||
| 65 | ||||
| 65 | ||||
| 73 | ||||
| 75 | ||||
| 76 | ||||
| 76 | ||||
| 82 | ||||
| 91 | ||||
| 91 | ||||
| 93 | ||||
| 100 | ||||
| 101 | ||||
| 103 | ||||
| 108 | ||||
| 109 | ||||
| 113 | ||||
| 120 | ||||
| 121 | ||||
Table of Contents
| • | Investment Banking. We provide a broad range of investment banking services to a diverse group of corporations, financial institutions, investment funds, governments and individuals. | |
| • | Trading and Principal Investments. We facilitate client transactions with a diverse group of corporations, financial institutions, investment funds, governments and individuals through market making in, trading of and investing in fixed income and equity products, currencies, commodities and derivatives on these products. We also take proprietary positions on certain of these products. In addition, we engage in market-making activities on equities and options exchanges, and we clear client transactions on major stock, options and futures exchanges worldwide. In connection with our merchant banking and other investing activities, we make principal investments directly and through funds that we raise and manage. | |
| • | Asset Management and Securities Services. We provide investment and wealth advisory services and offer investment products (primarily through separately managed accounts and commingled vehicles, such as mutual funds and private investment funds) across all major asset classes to a diverse group of institutions and individuals worldwide and provide prime brokerage services, financing services and securities lending services to institutional clients, including hedge funds, mutual funds, pension funds and foundations, and to high-net-worth individuals worldwide. |
Table of Contents
Table of Contents
Table of Contents
“— Certain Risk Factors That May Affect Our Businesses” below as well as “Risk Factors” in Part I, Item 1A of our Annual Report on Form 10-K.
Table of Contents
Table of Contents
Table of Contents
| • | Many of our businesses, such as our merchant banking businesses, our mortgages, leveraged loan and credit products businesses in our FICC segment, and our equity principal strategies business, have net “long” positions in debt securities, loans, derivatives, mortgages, equities (including private equity) and most other asset classes. In addition, many of our market-making and other businesses in which we act as a principal to facilitate our clients’ activities, including our exchange-based market-making businesses, commit large amounts of capital to maintain trading positions in interest rate and credit products, as well as currencies, commodities and equities. Because nearly all of these investing and trading positions are marked-to-market on a daily basis, declines in asset values directly and immediately impact our earnings, unless we have effectively “hedged” our exposures to such declines. In certain circumstances (particularly in the case of leveraged loans and private equities or other securities that are not freely tradable or lack established and liquid trading markets), it may not be possible or economic to hedge such exposures and to the extent that we do so the hedge may be ineffective or may greatly reduce our ability to profit from increases in the values of the assets. Sudden declines and significant volatility in the prices of assets may substantially curtail or eliminate the trading markets for certain assets, which may make it very difficult to sell, hedge or value such assets. The inability to sell or effectively hedge assets reduces our ability to limit losses in such positions and the difficulty in valuing assets may require us to maintain additional capital and increase our funding costs. | |
| • | Our cost of obtaining long-term unsecured funding is directly related to our credit spreads. Credit spreads are influenced by market perceptions of our creditworthiness. Widening credit spreads, as well as significant declines in the availability of credit, have in the past adversely affected our ability to borrow on a secured and unsecured basis and may do so in the future. We fund ourselves on an unsecured basis by issuing long-term debt, promissory notes and commercial paper, by accepting deposits at our bank subsidiaries or by obtaining bank loans or lines of credit. We seek to finance many of our assets on a secured basis, including by entering into repurchase agreements. Any disruptions in the credit markets may make it harder and more expensive to obtain funding for our businesses. If our available funding is limited or we are forced to fund our operations at a higher cost, these conditions may require us to curtail our business activities and increase our cost of funding, both of which could reduce our profitability, particularly in our businesses that involve investing, lending and taking principal positions, including market making. |
Table of Contents
| • | Our investment banking business has been and may continue to be adversely affected by market conditions. Poor economic conditions and other adverse geopolitical conditions can adversely affect and have adversely affected investor and CEO confidence, resulting in significant industry-wide declines in the size and number of underwritings and of financial advisory transactions, which could have an adverse effect on our revenues and our profit margins. In addition, our clients engaging in mergers and acquisitions often rely on access to the secured and unsecured credit markets to finance their transactions. A lack of available credit or an increased cost of credit can adversely affect the size, volume and timing of our clients’ merger and acquisition transactions — particularly large transactions. Because a significant portion of our investment banking revenues is derived from our participation in large transactions, a decline in the number of large transactions would adversely affect our investment banking business. | |
| • | Certain of our trading businesses depend on market volatility to provide trading and arbitrage opportunities, and decreases in volatility may reduce these opportunities and adversely affect the results of these businesses. On the other hand, increased volatility, while it can increase trading volumes and spreads, also increases risk as measured by VaR and may expose us to increased risks in connection with our market-making and proprietary businesses or cause us to reduce the size of these businesses in order to avoid increasing our VaR. Limiting the size of our market-making positions and investing businesses can adversely affect our profitability. | |
| • | We receive asset-based management fees based on the value of our clients’ portfolios or investment in funds managed by us and, in some cases, we also receive incentive fees based on increases in the value of such investments. Declines in asset values reduce the value of our clients’ portfolios or fund assets, which in turn reduce the fees we earn for managing such assets. Market uncertainty, volatility and adverse economic conditions, as well as declines in asset values, may cause our clients to transfer their assets out of our funds or other products or their brokerage accounts or affect our ability to attract new clients or additional assets from existing clients and result in reduced net revenues, principally in our asset management business. To the extent that clients do not withdraw their funds, they may invest them in products that generate less fee income. | |
| • | Concentration of risk increases the potential for significant losses in our market-making, proprietary trading, investing, block trading, merchant banking, underwriting and lending businesses. This risk may increase to the extent we expand our market-making, trading, investing and lending businesses. |
Table of Contents
Table of Contents
Table of Contents
(in millions)
| As of December 2009 | As of November 2008 | |||||||||||||||
|
Trading
|
Trading
|
Trading
|
Trading
|
|||||||||||||
|
Assets, at
|
Liabilities, at
|
Assets, at
|
Liabilities, at
|
|||||||||||||
|
Fair Value
|
Fair Value
|
Fair Value
|
Fair Value
|
|||||||||||||
|
Cash trading instruments
|
$ | 244,124 | $ | 72,117 | $ | 186,231 | $ | 57,143 | ||||||||
|
ICBC
|
8,111 | (1) | — | 5,496 | (1) | — | ||||||||||
|
SMFG
|
933 | 893 | (4) | 1,135 | 1,134 | (4) | ||||||||||
|
Other principal investments
|
13,981 | (2) | — | 15,126 | (2) | — | ||||||||||
|
Principal investments
|
23,025 | 893 | 21,757 | 1,134 | ||||||||||||
|
Cash instruments
|
267,149 | 73,010 | 207,988 | 58,277 | ||||||||||||
|
Exchange-traded
|
6,831 | 2,548 | 6,164 | 8,347 | ||||||||||||
|
Over-the-counter
|
68,422 | 53,461 | 124,173 | 109,348 | ||||||||||||
|
Derivative contracts
|
75,253 | (3) | 56,009 | (5) | 130,337 | (3) | 117,695 | (5) | ||||||||
|
Total
|
$ | 342,402 | $ | 129,019 | $ | 338,325 | $ | 175,972 | ||||||||
| (1) | Includes interests of $5.13 billion and $3.48 billion as of December 2009 and November 2008, respectively, held by investment funds managed by Goldman Sachs. The fair value of our investment in the ordinary shares of ICBC, which trade on The Stock Exchange of Hong Kong, includes the effect of foreign exchange revaluation for which we maintain an economic currency hedge. | |
| (2) | The following table sets forth the principal investments (other than our investments in ICBC and Sumitomo Mitsui Financial Group, Inc. (SMFG)) included within the Principal Investments component of our Trading and Principal Investments segment: |
| As of December 2009 | As of November 2008 | |||||||||||||||||||||||
|
Corporate
|
Real Estate
|
Total
|
Corporate
|
Real Estate
|
Total
|
|||||||||||||||||||
| (in millions) | ||||||||||||||||||||||||
|
Private
|
$ | 9,507 | $ | 1,325 | $ | 10,832 | $ | 10,726 | $ | 2,935 | $ | 13,661 | ||||||||||||
|
Public
|
3,091 | 58 | 3,149 | 1,436 | 29 | 1,465 | ||||||||||||||||||
|
Total
|
$ | 12,598 | $ | 1,383 | $ | 13,981 | $ | 12,162 | $ | 2,964 | $ | 15,126 | ||||||||||||
| (3) | Net of cash received pursuant to credit support agreements of $124.60 billion and $137.16 billion as of December 2009 and November 2008, respectively. | |
| (4) | Represents an economic hedge on the shares of common stock underlying our investment in the convertible preferred stock of SMFG. | |
| (5) | Net of cash paid pursuant to credit support agreements of $14.74 billion and $34.01 billion as of December 2009 and November 2008, respectively. |
Table of Contents
| • | Cash Trading Instruments. Our cash trading instruments (e.g., equity and debt securities) are generally valued using quoted market prices, broker or dealer quotations, or alternative pricing sources with reasonable levels of price transparency. The types of instruments valued based on quoted market prices in active markets include most government obligations, active listed equities and certain money market securities. |
| • | Public Principal Investments. Our public principal investments held within the Principal Investments component of our Trading and Principal Investments segment tend to be large, concentrated holdings resulting from initial public offerings or other corporate transactions, and are valued based on quoted market prices. For positions that are not traded in active markets or are subject to transfer restrictions, valuations are adjusted to reflect illiquidity and/or non-transferability. Such adjustments are generally based on market evidence where available. In the absence of such evidence, management’s best estimate is used. |
Table of Contents
| • | Private Principal Investments. Our private principal investments held within the Principal Investments component of our Trading and Principal Investments segment include investments in private equity, debt and real estate, primarily held through investment funds. By their nature, these investments have little or no price transparency. We value such instruments initially at transaction price and adjust valuations when evidence is available to support such adjustments. Such evidence includes recent third-party investments or pending transactions, third-party independent appraisals, transactions in similar instruments, discounted cash flow techniques, valuation multiples and public comparables. |
Table of Contents
Table of Contents
| • | Equities and convertible debentures. Substantially all of our level 3 equities and convertible debentures consist of private equity investments and real estate fund investments. For private equity investments, recent third-party investments or pending transactions are considered to be the best evidence for any change in fair value. In the absence of such evidence, valuations are based on one or more of the following methodologies, as appropriate and available: transactions in similar instruments, discounted cash flow techniques, third-party independent appraisals, valuation multiples and public comparables. Such evidence includes pending reorganizations (e.g., merger proposals, tender offers or debt restructurings); and significant changes in financial metrics (e.g., operating results as compared to previous projections, industry multiples, credit ratings and balance sheet ratios). Real estate fund investments are carried at net asset value per share. The underlying investments in the funds are generally valued using discounted cash flow techniques, for which the key inputs are the amount and timing of expected future cash flows, capitalization rates and valuation multiples. | |
| • | Bank loans and bridge loans and Corporate debt securities and other debt obligations. Valuations are generally based on discounted cash flow techniques, for which the key inputs are the amount and timing of expected future cash flows, market yields for such instruments and recovery assumptions. Inputs are generally determined based on relative value analyses, which incorporate comparisons both to credit default swaps that reference the same underlying credit risk and to other debt instruments for the same issuer for which observable prices or broker quotes are available. | |
| • | Loans and securities backed by commercial real estate. Loans and securities backed by commercial real estate are collateralized by specific assets and may be tranched into varying levels of subordination. Due to the nature of these instruments, valuation techniques vary by instrument. Methodologies include relative value analyses across different tranches, comparisons to transactions in both the underlying collateral and instruments with the same or substantially the same underlying collateral, market indices (such as the CMBX (1) ), and credit default swaps, as well as discounted cash flow techniques. | |
| • | Loans and securities backed by residential real estate. Valuations are based on both proprietary and industry recognized models (including Intex and Bloomberg), and discounted cash flow techniques. In the recent market environment, the most significant inputs to the valuation of these instruments are rates and timing of delinquency, default and loss expectations, which are driven in part by housing prices. Inputs are determined based on relative value analyses, which incorporate comparisons to instruments with similar collateral and risk profiles, including relevant indices such as the ABX (1) . | |
| • | Loan portfolios. Valuations are based on discounted cash flow techniques, for which the key inputs are the amount and timing of expected future cash flows and market yields for such instruments. Inputs are determined based on relative value analyses which incorporate comparisons to recent auction data for other similar loan portfolios. | |
| • | Derivative contracts. Valuation models are calibrated to initial transaction price. Subsequent changes in valuations are based on observable inputs to the valuation models (e.g., interest rates, credit spreads, volatilities, etc.). Inputs are changed only when corroborated by market data. Valuations of less liquid OTC derivatives are typically based on level 1 or level 2 inputs that can be observed in the market, as well as unobservable inputs, such as correlations and volatilities. |
Table of Contents
(in millions)
| As of | ||||||||
|
December
|
November
|
|||||||
| 2009 | 2008 | |||||||
|
Equities and convertible
debentures
(1)
|
$ | 11,871 | $ | 16,006 | ||||
|
Bank loans and bridge
loans
(2)
|
9,560 | 11,957 | ||||||
|
Corporate debt securities and other debt
obligations
(3)
|
5,584 | 7,596 | ||||||
|
Mortgage and other
asset-backed
loans and securities:
|
||||||||
|
Loans and securities backed by commercial real estate
|
4,620 | 9,340 | ||||||
|
Loans and securities backed by residential real estate
|
1,880 | 2,049 | ||||||
|
Loan
portfolios
(4)
|
1,364 | 4,118 | ||||||
|
Cash instruments
|
34,879 | 51,066 | ||||||
|
Derivative contracts
|
11,596 | 15,124 | ||||||
|
Total level 3 assets at fair value
|
46,475 | 66,190 | ||||||
|
Level 3 assets for which we do not bear economic
exposure
(5)
|
(3,127 | ) | (6,616 | ) | ||||
|
Level 3 assets for which we bear economic exposure
|
$ | 43,348 | $ | 59,574 | ||||
| (1) | Substantially all consists of private equity investments and real estate fund investments. Real estate investments were $1.23 billion and $2.62 billion as of December 2009 and November 2008, respectively. | |
| (2) | Includes certain mezzanine financing, leveraged loans arising from capital market transactions and other corporate bank debt. | |
| (3) | Includes $741 million and $804 million as of December 2009 and November 2008, respectively, of CDOs and collateralized loan obligations backed by corporate obligations. | |
| (4) | Consists of acquired portfolios of distressed loans, primarily backed by commercial and residential real estate collateral. | |
| (5) | We do not bear economic exposure to these level 3 assets as they are financed by nonrecourse debt, attributable to minority investors or attributable to employee interests in certain consolidated funds. |
Table of Contents
(in millions)
| As of | ||||||||
|
December
|
November
|
|||||||
| 2009 | 2008 | |||||||
|
Prime
(1)
|
$ | 2,483 | $ | 1,494 | ||||
|
Alt-A
|
1,761 | 1,845 | ||||||
|
Subprime
(2)
|
2,460 | 1,906 | ||||||
|
Total
(3)
|
$ | 6,704 | $ | 5,245 | ||||
| (1) | Excludes U.S. government agency-issued collateralized mortgage obligations of $6.33 billion and $4.27 billion as of December 2009 and November 2008, respectively. Also excludes U.S. government agency-issued mortgage pass-through certificates. | |
| (2) | Includes $381 million and $228 million of CDOs backed by subprime mortgages as of December 2009 and November 2008, respectively. | |
| (3) | Includes $1.88 billion and $2.05 billion of financial instruments (primarily loans and investment-grade securities, the majority of which were issued during 2006 and 2007) classified within level 3 of the fair value hierarchy as of December 2009 and November 2008, respectively. |
Commercial Real Estate by Geographic Region
(in millions)
| As of | ||||||||
|
December
|
November
|
|||||||
| 2009 | 2008 | |||||||
|
Americas
(1)
|
$ | 5,157 | $ | 7,433 | ||||
|
EMEA
(2)
|
1,032 | 3,304 | ||||||
|
Asia
|
14 | 157 | ||||||
|
Total
(3)
|
$ | 6,203 | (4) | $ | 10,894 | (5) | ||
| (1) | Substantially all relates to the U.S. | |
| (2) | EMEA (Europe, Middle East and Africa). | |
| (3) | Includes $4.62 billion and $9.34 billion of financial instruments classified within level 3 of the fair value hierarchy as of December 2009 and November 2008, respectively. | |
| (4) | Comprised of loans of $4.70 billion and commercial mortgage-backed securities of $1.50 billion as of December 2009, of which $5.68 billion was floating rate and $519 million was fixed rate. | |
| (5) | Comprised of loans of $9.23 billion and commercial mortgage-backed securities of $1.66 billion as of November 2008, of which $9.78 billion was floating rate and $1.11 billion was fixed rate. |
Table of Contents
(in millions)
| As of December 2009 | As of November 2008 | |||||||||||||||||||||||
|
Funded
|
Unfunded
|
Total
|
Funded
|
Unfunded
|
Total
|
|||||||||||||||||||
|
Americas
(1)
|
$ | 1,029 | $ | 1,120 | $ | 2,149 | $ | 3,036 | $ | 1,735 | $ | 4,771 | ||||||||||||
|
EMEA
|
1,624 | 50 | 1,674 | 2,294 | 259 | 2,553 | ||||||||||||||||||
|
Asia
|
600 | 27 | 627 | 568 | 73 | 641 | ||||||||||||||||||
|
Total
|
$ | 3,253 | $ | 1,197 | $ | 4,450 | (2) | $ | 5,898 | $ | 2,067 | $ | 7,965 | (2) | ||||||||||
| (1) | Substantially all relates to the U.S. | |
| (2) | Represents the notional amount. We account for these transactions at fair value and our exposure was $2.27 billion and $5.53 billion as of December 2009 and November 2008, respectively. |
| • | certain unsecured short-term borrowings, consisting of all promissory notes and commercial paper and certain hybrid financial instruments; | |
| • | certain other secured financings, primarily transfers accounted for as financings rather than sales, debt raised through our William Street credit extension program and certain other nonrecourse financings; | |
| • | certain unsecured long-term borrowings, including prepaid physical commodity transactions and certain hybrid financial instruments; | |
| • | resale and repurchase agreements; | |
| • | securities borrowed and loaned within Trading and Principal Investments, consisting of our matched book and certain firm financing activities; | |
| • | certain deposits issued by our bank subsidiaries, as well as securities held by GS Bank USA; | |
| • | certain receivables from customers and counterparties, including certain margin loans, transfers accounted for as secured loans rather than purchases and prepaid variable share forwards; | |
| • | certain insurance and reinsurance contracts and certain guarantees; and | |
| • | in general, investments acquired after November 24, 2006, when the fair value option became available, where we have significant influence over the investee and would otherwise apply the equity method of accounting. In certain cases, we apply the equity method of accounting to new investments that are strategic in nature or closely related to our principal business activities, where we have a significant degree of involvement in the cash flows or operations of the investee, or where cost-benefit considerations are less significant. |
Table of Contents
(in millions)
| As of | ||||||||
|
December
|
November
|
|||||||
| 2009 | 2008 | |||||||
|
Investment Banking
|
||||||||
|
Underwriting
|
$ | 125 | $ | 125 | ||||
|
Trading and Principal Investments
|
||||||||
|
FICC
|
265 | 247 | ||||||
|
Equities
(1)
|
2,389 | 2,389 | ||||||
|
Principal Investments
|
84 | 80 | ||||||
|
Asset Management and Securities Services
|
||||||||
|
Asset
Management
(2)
|
563 | 565 | ||||||
|
Securities Services
|
117 | 117 | ||||||
|
Total
|
$ | 3,543 | $ | 3,523 | ||||
| (1) | Primarily related to SLK. | |
| (2) | Primarily related to Ayco. |
Table of Contents
($ in millions)
| As of December 2009 | As of November 2008 | |||||||||||
|
Range of Estimated
|
||||||||||||
|
Carrying
|
Remaining Lives
|
Carrying
|
||||||||||
|
Value
|
(in years)
|
Value | ||||||||||
|
Customer
lists
(1)
|
$ | 645 | 2-16 | $ | 724 | |||||||
|
New York Stock Exchange (NYSE) Designated Market Maker
(DMM) rights
|
420 | 12 | 462 | |||||||||
|
Insurance-related
assets
(2)
|
150 | 6 | 155 | |||||||||
|
Exchange-traded
fund (ETF) lead market maker rights
|
90 | 18 | 95 | |||||||||
|
Other
(3)
|
72 | 2-16 | 93 | |||||||||
|
Total
|
$ | 1,377 | $ | 1,529 | ||||||||
| (1) | Primarily includes our clearance and execution and NASDAQ customer lists related to SLK and financial counseling customer lists related to Ayco. | |
| (2) | Primarily includes the value of business acquired related to our insurance businesses. | |
| (3) | Primarily includes marketing-related assets and other contractual rights. |
Table of Contents
Table of Contents
($ in millions, except per share amounts)
| Year Ended | One Month Ended | |||||||||||||||
|
December
|
November
|
November
|
December
|
|||||||||||||
| 2009 | 2008 | 2007 | 2008 | |||||||||||||
|
Net revenues
|
$ | 45,173 | $ | 22,222 | $ | 45,987 | $ | 183 | ||||||||
|
Pre-tax
earnings/(loss)
|
19,829 | 2,336 | 17,604 | (1,258 | ) | |||||||||||
|
Net earnings/(loss)
|
13,385 | 2,322 | 11,599 | (780 | ) | |||||||||||
|
Net earnings/(loss) applicable to common shareholders
|
12,192 | 2,041 | 11,407 | (1,028 | ) | |||||||||||
|
Diluted earnings/(loss) per common share
|
22.13 | 4.47 | 24.73 | (2.15 | ) | |||||||||||
|
Return on average common shareholders’
equity
(1)
|
22.5 | % | 4.9 | % | 32.7 | % | N.M. | |||||||||
| (1) | ROE is computed by dividing net earnings applicable to common shareholders by average monthly common shareholders’ equity. The following table sets forth our average common shareholders’ equity: |
| Average for the | ||||||||||||||||
| Year Ended | One Month Ended | |||||||||||||||
|
December
|
November
|
November
|
December
|
|||||||||||||
| 2009 | 2008 | 2007 | 2008 | |||||||||||||
| (in millions) | ||||||||||||||||
|
Total shareholders’ equity
|
$ | 65,527 | $ | 47,167 | $ | 37,959 | $ | 63,712 | ||||||||
|
Preferred stock
|
(11,363 | ) | (5,157 | ) | (3,100 | ) | (16,477 | ) | ||||||||
|
Common shareholders’ equity
|
$ | 54,164 | $ | 42,010 | $ | 34,859 | $ | 47,235 | ||||||||
Table of Contents
Table of Contents
Table of Contents
Table of Contents
($ in millions)
| Year Ended | One Month Ended | |||||||||||||||
|
December
|
November
|
November
|
December
|
|||||||||||||
| 2009 | 2008 | 2007 | 2008 | |||||||||||||
|
Compensation and benefits
|
$ | 16,193 | $ | 10,934 | $ | 20,190 | $ | 744 | ||||||||
|
Brokerage, clearing, exchange and distribution fees
|
2,298 | 2,998 | 2,758 | 165 | ||||||||||||
|
Market development
|
342 | 485 | 601 | 16 | ||||||||||||
|
Communications and technology
|
709 | 759 | 665 | 62 | ||||||||||||
|
Depreciation and
amortization
(1)
|
1,734 | 1,262 | 819 | 111 | ||||||||||||
|
Occupancy
|
950 | 960 | 975 | 82 | ||||||||||||
|
Professional fees
|
678 | 779 | 714 | 58 | ||||||||||||
|
Other expenses
|
2,440 | 1,709 | 1,661 | 203 | ||||||||||||
|
Total
non-compensation
expenses
|
9,151 | 8,952 | 8,193 | 697 | ||||||||||||
|
Total operating expenses
|
$ | 25,344 | $ | 19,886 | $ | 28,383 | $ | 1,441 | ||||||||
|
Total staff at period
end
(2)
|
32,500 | 34,500 | 35,500 | 33,300 | ||||||||||||
|
Total staff at period end including consolidated entities held
for investment
purposes
(3)
|
36,200 | 39,200 | 40,000 | 38,000 | ||||||||||||
| (1) | Beginning in the second quarter of 2009, “Amortization of identifiable intangible assets” is included in “Depreciation and amortization” in the consolidated statements of earnings. Prior periods have been reclassified to conform to the current presentation. | |
| (2) | Includes employees, consultants and temporary staff. | |
| (3) | Compensation and benefits and non-compensation expenses related to consolidated entities held for investment purposes are included in their respective line items in the consolidated statements of earnings. Consolidated entities held for investment purposes are entities that are held strictly for capital appreciation, have a defined exit strategy and are engaged in activities that are not closely related to our principal businesses. |
Table of Contents
Table of Contents
(in millions)
| Year Ended | One Month Ended | |||||||||||||||||
|
December
|
November
|
November
|
December
|
|||||||||||||||
| 2009 | 2008 | 2007 | 2008 | |||||||||||||||
|
Investment
|
Net revenues | $ | 4,797 | $ | 5,185 | $ | 7,555 | $ | 135 | |||||||||
|
Banking
|
Operating expenses | 3,527 | 3,143 | 4,985 | 169 | |||||||||||||
| Pre-tax earnings/(loss) | $ | 1,270 | $ | 2,042 | $ | 2,570 | $ | (34 | ) | |||||||||
|
Trading and Principal
|
Net revenues | $ | 34,373 | $ | 9,063 | $ | 31,226 | $ | (507 | ) | ||||||||
|
Investments
|
Operating expenses | 17,053 | 11,808 | 17,998 | 875 | |||||||||||||
| Pre-tax earnings/(loss) | $ | 17,320 | $ | (2,745 | ) | $ | 13,228 | $ | (1,382 | ) | ||||||||
|
Asset Management and
|
Net revenues | $ | 6,003 | $ | 7,974 | $ | 7,206 | $ | 555 | |||||||||
|
Securities Services
|
Operating expenses | 4,660 | 4,939 | 5,363 | 329 | |||||||||||||
| Pre-tax earnings | $ | 1,343 | $ | 3,035 | $ | 1,843 | $ | 226 | ||||||||||
|
Total
|
Net revenues | $ | 45,173 | $ | 22,222 | $ | 45,987 | $ | 183 | |||||||||
| Operating expenses (1) | 25,344 | 19,886 | 28,383 | 1,441 | ||||||||||||||
| Pre-tax earnings/(loss) | $ | 19,829 | $ | 2,336 | $ | 17,604 | $ | (1,258 | ) | |||||||||
| (1) | Operating expenses include net provisions for a number of litigation and regulatory proceedings of $104 million, $(4) million, $37 million and $68 million for the years ended December 2009, November 2008 and November 2007 and one month ended December 2008, respectively, that have not been allocated to our segments. |
Table of Contents
| • | Financial Advisory. Financial Advisory includes advisory assignments with respect to mergers and acquisitions, divestitures, corporate defense activities, restructurings and spin-offs. | |
| • | Underwriting. Underwriting includes public offerings and private placements of a wide range of securities and other financial instruments. |
(in millions)
| Year Ended | One Month Ended | |||||||||||||||
|
December
|
November
|
November
|
December
|
|||||||||||||
| 2009 | 2008 | 2007 | 2008 | |||||||||||||
|
Financial Advisory
|
$ | 1,893 | $ | 2,656 | $ | 4,222 | $ | 72 | ||||||||
|
Equity underwriting
|
1,771 | 1,353 | 1,382 | 19 | ||||||||||||
|
Debt underwriting
|
1,133 | 1,176 | 1,951 | 44 | ||||||||||||
|
Total Underwriting
|
2,904 | 2,529 | 3,333 | 63 | ||||||||||||
|
Total net revenues
|
4,797 | 5,185 | 7,555 | 135 | ||||||||||||
|
Operating expenses
|
3,527 | 3,143 | 4,985 | 169 | ||||||||||||
|
Pre-tax
earnings/(loss)
|
$ | 1,270 | $ | 2,042 | $ | 2,570 | $ | (34 | ) | |||||||
(in billions)
| Year Ended | One Month Ended | |||||||||||||||
|
December
|
November
|
November
|
December
|
|||||||||||||
| 2009 | 2008 | 2007 | 2008 | |||||||||||||
|
Announced mergers and
acquisitions
(2)
|
$ | 651 | $ | 804 | $ | 1,260 | $ | 18 | ||||||||
|
Completed mergers and
acquisitions
(2)
|
682 | 829 | 1,490 | 15 | ||||||||||||
|
Equity and
equity-related
offerings
(3)
|
78 | 56 | 66 | 2 | ||||||||||||
|
Debt
offerings
(4)
|
257 | 165 | 324 | 19 | ||||||||||||
| (1) | Announced and completed mergers and acquisitions volumes are based on full credit to each of the advisors in a transaction. Equity and equity-related offerings and debt offerings are based on full credit for single book managers and equal credit for joint book managers. Transaction volumes may not be indicative of net revenues in a given period. In addition, transaction volumes for prior periods may vary from amounts previously reported due to the subsequent withdrawal or a change in the value of a transaction. | |
| (2) | Source: Dealogic. | |
| (3) | Source: Thomson Reuters. Includes Rule 144A and public common stock offerings, convertible offerings and rights offerings. | |
| (4) | Source: Thomson Reuters. Includes non-convertible preferred stock, mortgage-backed securities, asset-backed securities and taxable municipal debt. Includes publicly registered and Rule 144A issues. Excludes leveraged loans. |
Table of Contents
Table of Contents
| • | FICC. We make markets in and trade interest rate and credit products, mortgage-related securities and loan products and other asset-backed instruments, currencies and commodities, structure and enter into a wide variety of derivative transactions, and engage in proprietary trading and investing. | |
| • | Equities. We make markets in and trade equities and equity-related products, structure and enter into equity derivative transactions and engage in proprietary trading. We generate commissions from executing and clearing client transactions on major stock, options and futures exchanges worldwide through our Equities client franchise and clearing activities. We also engage in exchange-based market-making activities and in insurance activities. | |
| • | Principal Investments. We make real estate and corporate principal investments, including our investment in the ordinary shares of ICBC. We generate net revenues from returns on these investments and from the increased share of the income and gains derived from our merchant banking funds when the return on a fund’s investments over the life of the fund exceeds certain threshold returns (typically referred to as an override). |
Table of Contents
(in millions)
| Year Ended | One Month Ended | |||||||||||||||
|
December
|
November
|
November
|
December
|
|||||||||||||
| 2009 | 2008 | 2007 | 2008 | |||||||||||||
|
FICC
|
$ | 23,316 | $ | 3,713 | $ | 16,165 | $ | (320 | ) | |||||||
|
Equities trading
|
6,046 | 4,208 | 6,725 | 363 | ||||||||||||
|
Equities commissions
|
3,840 | 4,998 | 4,579 | 251 | ||||||||||||
|
Total Equities
|
9,886 | 9,206 | 11,304 | 614 | ||||||||||||
|
ICBC
|
1,582 | (446 | ) | 495 | 228 | |||||||||||
|
Gross gains
|
3,415 | 1,335 | 3,728 | 213 | ||||||||||||
|
Gross losses
|
(3,870 | ) | (4,815 | ) | (943 | ) | (1,243 | ) | ||||||||
|
Net other corporate and real estate investments
|
(455 | ) | (3,480 | ) | 2,785 | (1,030 | ) | |||||||||
|
Overrides
|
44 | 70 | 477 | 1 | ||||||||||||
|
Total Principal Investments
|
1,171 | (3,856 | ) | 3,757 | (801 | ) | ||||||||||
|
Total net revenues
|
34,373 | 9,063 | 31,226 | (507 | ) | |||||||||||
|
Operating expenses
|
17,053 | 11,808 | 17,998 | 875 | ||||||||||||
|
Pre-tax
earnings/(loss)
|
$ | 17,320 | $ | (2,745 | ) | $ | 13,228 | $ | (1,382 | ) | ||||||
Table of Contents
Table of Contents
| • | Asset Management. Asset Management provides investment and wealth advisory services and offers investment products (primarily through separately managed accounts and commingled vehicles, such as mutual funds and private investment funds) across all major asset classes to a diverse group of institutions and individuals worldwide and primarily generates revenues in the form of management and incentive fees. | |
| • | Securities Services. Securities Services provides prime brokerage services, financing services and securities lending services to institutional clients, including hedge funds, mutual funds, pension funds and foundations, and to high-net-worth individuals worldwide, and generates revenues primarily in the form of interest rate spreads or fees. |
Table of Contents
(in millions)
| Year Ended | One Month Ended | |||||||||||||||
|
December
|
November
|
November
|
December
|
|||||||||||||
| 2009 | 2008 | 2007 | 2008 | |||||||||||||
|
Management and other fees
|
$ | 3,833 | $ | 4,321 | $ | 4,303 | $ | 318 | ||||||||
|
Incentive fees
|
137 | 231 | 187 | 1 | ||||||||||||
|
Total Asset Management
|
3,970 | 4,552 | 4,490 | 319 | ||||||||||||
|
Securities Services
|
2,033 | 3,422 | 2,716 | 236 | ||||||||||||
|
Total net revenues
|
6,003 | 7,974 | 7,206 | 555 | ||||||||||||
|
Operating expenses
|
4,660 | 4,939 | 5,363 | 329 | ||||||||||||
|
Pre-tax
earnings
|
$ | 1,343 | $ | 3,035 | $ | 1,843 | $ | 226 | ||||||||
| • | assets in brokerage accounts that generate commissions, mark-ups and spreads based on transactional activity; | |
| • | our own investments in funds that we manage; or | |
| • | non-fee-paying assets, including interest-bearing deposits held through our bank depository institution subsidiaries. |
(in billions)
| As of | ||||||||||||
|
December 31,
|
November 30, | |||||||||||
| 2009 | 2008 | 2007 | ||||||||||
|
Alternative
investments
(1)
|
$ | 146 | $ | 146 | $ | 151 | ||||||
|
Equity
|
146 | 112 | 255 | |||||||||
|
Fixed income
|
315 | 248 | 256 | |||||||||
|
Total
non-money
market assets
|
607 | 506 | 662 | |||||||||
|
Money markets
|
264 | 273 | 206 | |||||||||
|
Total assets under management
|
$ | 871 | $ | 779 | $ | 868 | ||||||
| (1) | Primarily includes hedge funds, private equity, real estate, currencies, commodities and asset allocation strategies. |
Table of Contents
(in billions)
| Year Ended | ||||||||||||
|
December 31,
|
November 30, | |||||||||||
| 2009 | 2008 | 2007 | ||||||||||
|
Balance, beginning of year
|
$ | 798 | (1) | $ | 868 | $ | 676 | |||||
|
Net inflows/(outflows)
|
||||||||||||
|
Alternative investments
|
(5 | ) | 8 | 9 | ||||||||
|
Equity
|
(2 | ) | (55 | ) | 26 | |||||||
|
Fixed income
|
26 | 14 | 38 | |||||||||
|
Total
non-money
market net inflows/(outflows)
|
19 | (33 | ) | 73 | (2) | |||||||
|
Money markets
|
(22 | ) | 67 | 88 | ||||||||
|
Total net inflows/(outflows)
|
(3 | ) | 34 | 161 | ||||||||
|
Net market appreciation/(depreciation)
|
76 | (123 | ) | 31 | ||||||||
|
Balance, end of year
|
$ | 871 | $ | 779 | $ | 868 | ||||||
| (1) | Includes market appreciation of $13 billion and net inflows of $6 billion during the calendar month of December 2008. | |
| (2) | Includes $7 billion in net asset inflows in connection with our acquisition of Macquarie — IMM Investment Management. |
Table of Contents
Table of Contents
| Type of Off-Balance-Sheet Arrangement | Disclosure in Annual Report on Form 10-K | |
| Retained interests or other continuing involvement relating to assets transferred by us to nonconsolidated entities | See Note 4 to the consolidated financial statements in Part II, Item 8 of our Annual Report on Form 10-K. | |
| Leases, letters of credit, and loans and other commitments | See Note 8 to the consolidated financial statements in Part II, Item 8 of our Annual Report on Form 10-K and “— Contractual Obligations” below. | |
| Guarantees | See Note 8 to the consolidated financial statements in Part II, Item 8 of our Annual Report on Form 10-K. | |
| Other obligations, including contingent obligations, arising out of variable interests we have in nonconsolidated entities | See Note 4 to the consolidated financial statements in Part II, Item 8 of our Annual Report on Form 10-K. | |
| Derivative contracts | See “— Critical Accounting Policies” above, and “— Risk Management” and “— Derivatives” below and Notes 3 and 7 to the consolidated financial statements in Part II, Item 8 of our Annual Report on Form 10-K. | |
Table of Contents
Table of Contents
|
As of
|
||||
|
December
|
||||
| 2009 | ||||
| ($ in millions) | ||||
|
Tier 1 Capital
|
||||
|
Common shareholders’ equity
|
$ | 63,757 | ||
|
Preferred stock
|
6,957 | |||
|
Junior subordinated debt issued to trusts
|
5,000 | |||
|
Less: Goodwill
|
(3,543 | ) | ||
|
Less: Disallowable intangible assets
|
(1,377 | ) | ||
|
Less: Other
deductions
(1)
|
(6,152 | ) | ||
|
Tier 1 Capital
|
64,642 | |||
|
Tier 2 Capital
|
||||
|
Qualifying subordinated
debt
(2)
|
14,004 | |||
|
Less: Other
deductions
(1)
|
(176 | ) | ||
|
Tier 2 Capital
|
$ | 13,828 | ||
|
Total Capital
|
$ | 78,470 | ||
|
Risk-Weighted
Assets
|
$ | 431,890 | ||
|
Tier 1 Capital Ratio
|
15.0 | % | ||
|
Total Capital Ratio
|
18.2 | % | ||
|
Tier 1 Leverage Ratio
|
7.6 | % | ||
| (1) | Principally includes equity investments in non-financial companies and the cumulative change in the fair value of our unsecured borrowings attributable to the impact of changes in our own credit spreads, disallowed deferred tax assets, and investments in certain nonconsolidating entities. | |
| (2) | Substantially all of our subordinated debt qualifies as Tier 2 capital for Basel I purposes. |
Table of Contents
Table of Contents
Table of Contents
Table of Contents
| As of | ||||||||
|
December
|
November
|
|||||||
| 2009 | 2008 | |||||||
|
($ in millions, except
|
||||||||
| per share amounts) | ||||||||
|
Total assets
|
$ | 848,942 | $ | 884,547 | ||||
|
Adjusted
assets
(1)
|
546,151 | 528,292 | ||||||
|
Total shareholders’ equity
|
70,714 | 64,369 | ||||||
|
Tangible equity
capital
(2)
|
70,794 | 64,317 | ||||||
|
Leverage
ratio
(3)
|
12.0 | x | 13.7 | x | ||||
|
Adjusted leverage
ratio
(4)
|
7.7 | x | 8.2 | x | ||||
|
Debt to equity
ratio
(5)
|
2.6 | x | 2.6 | x | ||||
|
Common shareholders’ equity
|
$ | 63,757 | $ | 47,898 | ||||
|
Tangible common shareholders’
equity
(6)
|
58,837 | 42,846 | ||||||
|
Book value per common
share
(7)
|
117.48 | 98.68 | ||||||
|
Tangible book value per common
share
(6)(7)
|
108.42 | 88.27 | ||||||
| As of | ||||||||
|
December
|
||||||||
| 2009 | ||||||||
| Basel I (8) | ||||||||
|
Tier 1 capital ratio
|
15.0 | % | ||||||
|
Total capital ratio
|
18.2 | % | ||||||
|
Tier 1 leverage ratio
|
7.6 | % | ||||||
|
Tier 1 common
ratio
(9)
|
12.2 | % | ||||||
|
Tangible common shareholders’
equity
(6)
to
risk-weighted
assets ratio
|
13.6 | % | ||||||
| (1) | Adjusted assets excludes (i) low-risk collateralized assets generally associated with our matched book and securities lending businesses and federal funds sold, (ii) cash and securities we segregate for regulatory and other purposes and (iii) goodwill and identifiable intangible assets which are deducted when calculating tangible equity capital (see footnote 2 below). |
| As of | ||||||||||
|
December
|
November
|
|||||||||
| 2009 | 2008 | |||||||||
| (in millions) | ||||||||||
|
Total assets
|
$ | 848,942 | $ | 884,547 | ||||||
|
Deduct:
|
Securities borrowed | (189,939 | ) | (180,795 | ) | |||||
| Securities purchased under agreements to resell and federal funds sold | (144,279 | ) | (122,021 | ) | ||||||
|
Add:
|
Trading liabilities, at fair value | 129,019 | 175,972 | |||||||
| Less derivative liabilities | (56,009 | ) | (117,695 | ) | ||||||
| Subtotal | 73,010 | 58,277 | ||||||||
|
Deduct:
|
Cash and securities segregated for regulatory and other purposes | (36,663 | ) | (106,664 | ) | |||||
| Goodwill and identifiable intangible assets | (4,920 | ) | (5,052 | ) | ||||||
|
Adjusted assets
|
$ | 546,151 | $ | 528,292 | ||||||
| (2) | Tangible equity capital equals total shareholders’ equity and junior subordinated debt issued to trusts less goodwill and identifiable intangible assets. We consider junior subordinated debt issued to trusts to be a component of our tangible equity capital base due to certain characteristics of the debt, including its long-term nature, our ability to defer payments due on the debt and the subordinated nature of the debt in our capital structure. |
Table of Contents
| As of | ||||||||||
|
December
|
November
|
|||||||||
| 2009 | 2008 | |||||||||
| (in millions) | ||||||||||
|
Total shareholders’ equity
|
$ | 70,714 | $ | 64,369 | ||||||
|
Add:
|
Junior subordinated debt issued to trusts | 5,000 | 5,000 | |||||||
|
Deduct:
|
Goodwill and identifiable intangible assets | (4,920 | ) | (5,052 | ) | |||||
|
Tangible equity capital
|
$ | 70,794 | $ | 64,317 | ||||||
| (3) | The leverage ratio equals total assets divided by total shareholders’ equity. This ratio is different from the Tier 1 leverage ratio included above, which is described in Note 17 to the consolidated financial statements in Part II, Item 8 of our Annual Report on Form 10-K. | |
| (4) | The adjusted leverage ratio equals adjusted assets divided by tangible equity capital. We believe that the adjusted leverage ratio is a more meaningful measure of our capital adequacy than the leverage ratio because it excludes certain low-risk collateralized assets that are generally supported with little or no capital and reflects the tangible equity capital deployed in our businesses. | |
| (5) | The debt to equity ratio equals unsecured long-term borrowings divided by total shareholders’ equity. | |
| (6) | Tangible common shareholders’ equity equals total shareholders’ equity less preferred stock, goodwill and identifiable intangible assets. Tangible book value per common share is computed by dividing tangible common shareholders’ equity by the number of common shares outstanding, including RSUs granted to employees with no future service requirements. We believe that tangible common shareholders’ equity is meaningful because it is one of the measures that we and investors use to assess capital adequacy. |
| As of | ||||||||||
|
December
|
November
|
|||||||||
| 2009 | 2008 | |||||||||
| (in millions) | ||||||||||
|
Total shareholders’ equity
|
$ | 70,714 | $ | 64,369 | ||||||
|
Deduct:
|
Preferred stock | (6,957 | ) | (16,471 | ) | |||||
|
Common shareholders’ equity
|
63,757 | 47,898 | ||||||||
|
Deduct:
|
Goodwill and identifiable intangible assets | (4,920 | ) | (5,052 | ) | |||||
|
Tangible common shareholders’ equity
|
$ | 58,837 | $ | 42,846 | ||||||
| (7) | Book value and tangible book value per common share are based on common shares outstanding, including RSUs granted to employees with no future service requirements, of 542.7 million and 485.4 million as of December 2009 and November 2008, respectively. | |
| (8) | Calculated in accordance with the regulatory capital requirements currently applicable to bank holding companies. RWAs were $431.89 billion as of December 2009 under Basel I. See Note 17 to the consolidated financial statements in Part II, Item 8 of our Annual Report on Form 10-K for further information regarding our regulatory capital ratios. | |
| (9) | The Tier 1 common ratio equals Tier 1 capital less preferred stock and junior subordinated debt issued to trusts, divided by RWAs. We believe that the Tier 1 common ratio is meaningful because it is one of the measures that we and investors use to assess capital adequacy. |
| As of | ||||||||||
|
December
|
||||||||||
| 2009 | ||||||||||
| (in millions) | ||||||||||
|
Tier 1 capital
|
$ | 64,642 | ||||||||
|
Deduct:
|
Preferred stock | (6,957 | ) | |||||||
|
Deduct:
|
Junior subordinated debt issued to trusts | (5,000 | ) | |||||||
|
Tier 1 common capital
|
$ | 52,685 | ||||||||
Table of Contents
(in millions)
|
2011-
|
2013-
|
2015-
|
||||||||||||||||||
| 2010 | 2012 | 2014 | Thereafter | Total | ||||||||||||||||
|
Unsecured
long-term
borrowings
(1)(2)(3)
|
$ | — | $ | 50,950 | $ | 41,674 | $ | 92,461 | $ | 185,085 | ||||||||||
|
Secured
long-term
financings
(1)(2)(4)
|
— | 5,558 | 3,135 | 2,510 | 11,203 | |||||||||||||||
|
Time deposits
(long-term)
(5)
|
— | 2,474 | 2,251 | 2,058 | 6,783 | |||||||||||||||
|
Contractual interest
payments
(6)
|
7,228 | 12,628 | 9,588 | 29,780 | 59,224 | |||||||||||||||
|
Insurance
liabilities
(7)
|
692 | 1,253 | 1,084 | 9,082 | 12,111 | |||||||||||||||
|
Minimum rental payments
|
494 | 664 | 455 | 1,555 | 3,168 | |||||||||||||||
|
Purchase obligations
|
251 | 58 | 38 | 33 | 380 | |||||||||||||||
| (1) | Obligations maturing within one year of our financial statement date or redeemable within one year of our financial statement date at the option of the holder are excluded from this table and are treated as short-term obligations. See Note 3 to the consolidated financial statements in Part II, Item 8 of our Annual Report on Form 10-K for further information regarding our secured financings. | |
| (2) | Obligations that are repayable prior to maturity at the option of Goldman Sachs are reflected at their contractual maturity dates. Obligations that are redeemable prior to maturity at the option of the holder are reflected at the dates such options become exercisable. | |
| (3) | Includes $21.39 billion accounted for at fair value under the fair value option, primarily consisting of hybrid financial instruments and prepaid physical commodity transactions. | |
| (4) | These obligations are reported in “Other secured financings” in the consolidated statements of financial condition and include $8.00 billion accounted for at fair value under the fair value option, primarily consisting of transfers accounted for as financings rather than sales and debt raised through our William Street credit extension program. | |
| (5) | Excludes $2.51 billion of time deposits maturing within one year of our financial statement date. | |
| (6) | Represents estimated future interest payments related to unsecured long-term borrowings, secured long-term financings and time deposits based on applicable interest rates as of December 2009. Includes stated coupons, if any, on structured notes. | |
| (7) | Represents estimated undiscounted payments related to future benefits and unpaid claims arising from policies associated with our insurance activities, excluding separate accounts and estimated recoveries under reinsurance contracts. |
Table of Contents
Table of Contents
Table of Contents
| • | Interest rate risks primarily result from exposures to changes in the level, slope and curvature of the yield curve, the volatility of interest rates, mortgage prepayment speeds and credit spreads. | |
| • | Equity price risks result from exposures to changes in prices and volatilities of individual equities, equity baskets and equity indices. | |
| • | Currency rate risks result from exposures to changes in spot prices, forward prices and volatilities of currency rates. | |
| • | Commodity price risks result from exposures to changes in spot prices, forward prices and volatilities of commodities, such as electricity, natural gas, crude oil, petroleum products, and precious and base metals. |
| • | risk limits based on a summary measure of market risk exposure referred to as VaR; | |
| • | scenario analyses, stress tests and other analytical tools that measure the potential effects on our trading net revenues of various market events, including, but not limited to, a large widening of credit spreads, a substantial decline in equity markets and significant moves in selected emerging markets; and | |
| • | inventory position limits for selected business units. |
Table of Contents
(in millions)
| Year Ended | ||||||||||||
|
December
|
November
|
November
|
||||||||||
|
Risk Categories
|
2009 | 2008 | 2007 | |||||||||
|
Interest rates
|
$ | 176 | $ | 142 | $ | 85 | ||||||
|
Equity prices
|
66 | 72 | 100 | |||||||||
|
Currency rates
|
36 | 30 | 23 | |||||||||
|
Commodity prices
|
36 | 44 | 26 | |||||||||
|
Diversification
effect
(2)
|
(96 | ) | (108 | ) | (96 | ) | ||||||
|
Total
|
$ | 218 | $ | 180 | $ | 138 | ||||||
| (1) | Certain portfolios and individual positions are not included in VaR, where VaR is not the most appropriate measure of risk (e.g., due to transfer restrictions and/or illiquidity). See “— Other Market Risk Measures” below. | |
| (2) | Equals the difference between total VaR and the sum of the VaRs for the four risk categories. This effect arises because the four market risk categories are not perfectly correlated. |
Table of Contents
(in millions)
| As of |
Year Ended
|
|||||||||||||||
|
December
|
November
|
December 2009 | ||||||||||||||
|
Risk Categories
|
2009 | 2008 |
High
|
Low
|
||||||||||||
|
Interest rates
|
$ | 122 | $ | 228 | $ | 252 | $ | 111 | ||||||||
|
Equity prices
|
99 | 38 | 123 | 32 | ||||||||||||
|
Currency rates
|
21 | 36 | 61 | 20 | ||||||||||||
|
Commodity prices
|
33 | 33 | 59 | 18 | ||||||||||||
|
Diversification
effect
(2)
|
(122 | ) | (91 | ) | ||||||||||||
|
Total
|
$ | 153 | $ | 244 | $ | 285 | $ | 153 | ||||||||
| (1) | Certain portfolios and individual positions are not included in VaR, where VaR is not the most appropriate measure of risk (e.g., due to transfer restrictions and/or illiquidity). See “— Other Market Risk Measures” below. | |
| (2) | Equals the difference between total VaR and the sum of the VaRs for the four risk categories. This effect arises because the four market risk categories are not perfectly correlated. |
($ in millions)

Table of Contents
($ in millions)

Table of Contents
|
Asset Categories
|
10% Sensitivity Measure
|
10% Sensitivity | ||||||||
| Amount as of | ||||||||||
|
December
|
November
|
|||||||||
| 2009 | 2008 | |||||||||
| (in millions) | ||||||||||
|
FICC and Equities
(1)
|
||||||||||
|
Equity
(2)
|
Underlying asset value | $ | 616 | $ | 790 | |||||
|
Debt
(3)
|
Underlying asset value | 431 | 808 | |||||||
|
Principal Investments
(4)
|
||||||||||
|
ICBC
|
ICBC ordinary share price | 298 | 202 | |||||||
|
Other
Equity
(5)
|
Underlying asset value | 1,001 | 1,155 | |||||||
|
Debt
(6)
|
Underlying asset value | 947 | 694 | |||||||
|
Real
Estate
(7)
|
Underlying asset value | 690 | 1,330 | |||||||
| (1) | In addition to the positions in these portfolios, which are accounted for at fair value, we make investments accounted for under the equity method and we also make direct investments in real estate, both of which are included in “Other assets” in the consolidated statements of financial condition. Direct investments in real estate are accounted for at cost less accumulated depreciation. See Note 12 to the consolidated financial statements in Part II, Item 8 of our Annual Report on Form 10-K for information on “Other assets.” | |
| (2) | Relates to private and restricted public equity securities held within the FICC and Equities components of our Trading and Principal Investments segment. | |
| (3) | Primarily relates to acquired portfolios of distressed loans (primarily backed by commercial and residential real estate collateral), loans backed by commercial real estate, and corporate debt held within the FICC component of our Trading and Principal Investments segment. | |
| (4) | Represents investments included within the Principal Investments component of our Trading and Principal Investments segment. | |
| (5) | Primarily relates to interests in our merchant banking funds that invest in corporate equities. | |
| (6) | Primarily relates to interests in our merchant banking funds that invest in corporate mezzanine debt instruments. | |
| (7) | Primarily relates to interests in our merchant banking funds that invest in real estate. Such funds typically employ leverage as part of the investment strategy. This sensitivity measure is based on our percentage ownership of the underlying asset values in the funds and unfunded commitments to the funds. |
Table of Contents
Table of Contents
Table of Contents
(in millions)
| Assets | As of December 2009 | |||||||||||||||||||
|
0 - 12
|
1 - 5
|
5 - 10
|
10 Years
|
|||||||||||||||||
|
Product Type
|
Months
|
Years
|
Years
|
or Greater
|
Total
|
|||||||||||||||
|
Interest rates
|
$ | 14,266 | $ | 37,146 | $ | 25,608 | $ | 37,721 | $ | 114,741 | ||||||||||
|
Credit derivatives
|
5,743 | 20,465 | 11,497 | 6,281 | 43,986 | |||||||||||||||
|
Currencies
|
9,870 | 12,789 | 6,408 | 6,955 | 36,022 | |||||||||||||||
|
Commodities
|
6,201 | 7,546 | 521 | 41 | 14,309 | |||||||||||||||
|
Equities
|
6,742 | 8,818 | 4,920 | 2,350 | 22,830 | |||||||||||||||
|
Netting across product
types
(1)
|
(3,480 | ) | (6,256 | ) | (3,047 | ) | (1,399 | ) | (14,182 | ) | ||||||||||
|
Subtotal
|
$ | 39,342 | (4) | $ | 80,508 | $ | 45,907 | $ | 51,949 | $ | 217,706 | |||||||||
|
Cross maturity
netting
(2)
|
(24,681 | ) | ||||||||||||||||||
|
Cash collateral
netting
(3)
|
(124,603 | ) | ||||||||||||||||||
|
Total
|
$ | 68,422 | ||||||||||||||||||
| Liabilities | ||||||||||||||||||||
|
0 - 12
|
1 - 5
|
5 - 10
|
10 Years
|
|||||||||||||||||
|
Product Type
|
Months
|
Years
|
Years
|
or Greater
|
Total
|
|||||||||||||||
|
Interest rates
|
$ | 7,042 | $ | 12,831 | $ | 11,421 | $ | 12,518 | $ | 43,812 | ||||||||||
|
Credit derivatives
|
2,487 | 7,168 | 2,356 | 2,116 | 14,127 | |||||||||||||||
|
Currencies
|
12,202 | 4,003 | 2,789 | 2,132 | 21,126 | |||||||||||||||
|
Commodities
|
6,922 | 7,161 | 1,157 | 846 | 16,086 | |||||||||||||||
|
Equities
|
4,213 | 3,746 | 3,371 | 586 | 11,916 | |||||||||||||||
|
Netting across product
types
(1)
|
(3,480 | ) | (6,256 | ) | (3,047 | ) | (1,399 | ) | (14,182 | ) | ||||||||||
|
Subtotal
|
$ | 29,386 | (4) | $ | 28,653 | $ | 18,047 | $ | 16,799 | $ | 92,885 | |||||||||
|
Cross maturity
netting
(2)
|
(24,681 | ) | ||||||||||||||||||
|
Cash collateral
netting
(3)
|
(14,743 | ) | ||||||||||||||||||
|
Total
|
$ | 53,461 | ||||||||||||||||||
| (1) | Represents the netting of receivable balances with payable balances for the same counterparty across product types within a tenor category, pursuant to enforceable netting agreements. Receivable and payable balances with the same counterparty in the same product type and tenor category are netted within such product type and tenor category, where appropriate. | |
| (2) | Represents the netting of receivable balances with payable balances for the same counterparty across tenor categories, pursuant to enforceable netting agreements. | |
| (3) | Represents the netting of cash collateral received and posted on a counterparty basis pursuant to credit support agreements. | |
| (4) | Includes fair values of OTC derivative assets and liabilities, maturing within six months, of $21.60 billion and $18.08 billion, respectively. |
Table of Contents
(in millions)
| Assets | As of November 2008 | |||||||||||||||||||
|
0 - 12
|
1 - 5
|
5 - 10
|
10 Years
|
|||||||||||||||||
|
Product Type
|
Months
|
Years
|
Years
|
or Greater
|
Total
|
|||||||||||||||
|
Interest rates
|
$ | 10,530 | $ | 38,918 | $ | 35,196 | $ | 48,008 | $ | 132,652 | ||||||||||
|
Credit derivatives
|
19,866 | 30,235 | 27,410 | 8,907 | 86,418 | |||||||||||||||
|
Currencies
|
28,148 | 12,259 | 6,102 | 4,440 | 50,949 | |||||||||||||||
|
Commodities
|
14,857 | 12,404 | 1,177 | 618 | 29,056 | |||||||||||||||
|
Equities
|
10,520 | 7,614 | 5,083 | 3,901 | 27,118 | |||||||||||||||
|
Netting across product
types
(1)
|
(4,736 | ) | (9,316 | ) | (5,864 | ) | (2,826 | ) | (22,742 | ) | ||||||||||
|
Subtotal
|
$ | 79,185 | (4) | $ | 92,114 | $ | 69,104 | $ | 63,048 | $ | 303,451 | |||||||||
|
Cross maturity
netting
(2)
|
(42,118 | ) | ||||||||||||||||||
|
Cash collateral
netting
(3)
|
(137,160 | ) | ||||||||||||||||||
|
Total
|
$ | 124,173 | ||||||||||||||||||
| Liabilities | ||||||||||||||||||||
|
0 - 12
|
1 - 5
|
5 - 10
|
10 Years
|
|||||||||||||||||
|
Product Type
|
Months
|
Years
|
Years
|
or Greater
|
Total
|
|||||||||||||||
|
Interest rates
|
$ | 7,465 | $ | 15,150 | $ | 14,160 | $ | 27,908 | $ | 64,683 | ||||||||||
|
Credit derivatives
|
8,943 | 23,603 | 13,259 | 2,242 | 48,047 | |||||||||||||||
|
Currencies
|
29,233 | 13,911 | 4,244 | 2,411 | 49,799 | |||||||||||||||
|
Commodities
|
12,884 | 10,359 | 1,577 | 483 | 25,303 | |||||||||||||||
|
Equities
|
11,381 | 2,038 | 5,533 | 1,433 | 20,385 | |||||||||||||||
|
Netting across product
types
(1)
|
(4,736 | ) | (9,316 | ) | (5,864 | ) | (2,826 | ) | (22,742 | ) | ||||||||||
|
Subtotal
|
$ | 65,170 | (4) | $ | 55,745 | $ | 32,909 | $ | 31,651 | $ | 185,475 | |||||||||
|
Cross maturity
netting
(2)
|
(42,118 | ) | ||||||||||||||||||
|
Cash collateral
netting
(3)
|
(34,009 | ) | ||||||||||||||||||
|
Total
|
$ | 109,348 | ||||||||||||||||||
| (1) | Represents the netting of receivable balances with payable balances for the same counterparty across product types within a tenor category, pursuant to enforceable netting agreements. Receivable and payable balances with the same counterparty in the same product type and tenor category are netted within such product type and tenor category, where appropriate. | |
| (2) | Represents the netting of receivable balances with payable balances for the same counterparty across tenor categories, pursuant to enforceable netting agreements. | |
| (3) | Represents the netting of cash collateral received and posted on a counterparty basis pursuant to credit support agreements. | |
| (4) | Includes fair values of OTC derivative assets and liabilities, maturing within six months, of $54.68 billion and $51.16 billion, respectively. |
Table of Contents
(in millions)
| As of December 2009 | ||||||||||||||||||||||||||||||||
|
Exposure
|
||||||||||||||||||||||||||||||||
|
Credit Rating
|
0 - 12
|
1 - 5
|
5 - 10
|
10 Years
|
Net of
|
|||||||||||||||||||||||||||
|
Equivalent
|
Months
|
Years
|
Years
|
or Greater
|
Total
|
Netting
(2)
|
Exposure
|
Collateral
|
||||||||||||||||||||||||
|
AAA/Aaa
|
$ | 2,020 | $ | 3,157 | $ | 3,507 | $ | 2,567 | $ | 11,251 | $ | (5,603 | ) | $ | 5,648 | $ | 5,109 | |||||||||||||||
|
AA/Aa2
|
5,285 | 10,745 | 7,090 | 8,954 | 32,074 | (19,653 | ) | 12,421 | 8,735 | |||||||||||||||||||||||
|
A/A2
|
22,707 | 47,891 | 30,267 | 31,203 | 132,068 | (107,942 | ) | 24,126 | 20,111 | |||||||||||||||||||||||
|
BBB/Baa2
|
4,402 | 8,300 | 3,024 | 7,830 | 23,556 | (11,064 | ) | 12,492 | 6,202 | |||||||||||||||||||||||
|
BB/Ba2 or lower
|
4,444 | 9,438 | 1,735 | 1,354 | 16,971 | (4,914 | ) | 12,057 | 7,381 | |||||||||||||||||||||||
|
Unrated
|
484 | 977 | 284 | 41 | 1,786 | (108 | ) | 1,678 | 1,161 | |||||||||||||||||||||||
|
Total
|
$ | 39,342 | (1) | $ | 80,508 | $ | 45,907 | $ | 51,949 | $ | 217,706 | $ | (149,284 | ) | $ | 68,422 | (3) | $ | 48,699 | |||||||||||||
| As of November 2008 | ||||||||||||||||||||||||||||||||
|
Exposure
|
||||||||||||||||||||||||||||||||
|
Credit Rating
|
0 - 12
|
1 - 5
|
5 - 10
|
10 Years
|
Net of
|
|||||||||||||||||||||||||||
|
Equivalent
|
Months
|
Years
|
Years
|
or Greater
|
Total
|
Netting
(2)
|
Exposure
|
Collateral
|
||||||||||||||||||||||||
|
AAA/Aaa
|
$ | 5,392 | $ | 3,792 | $ | 6,104 | $ | 4,652 | $ | 19,940 | $ | (6,583 | ) | $ | 13,357 | $ | 12,269 | |||||||||||||||
|
AA/Aa2
|
24,736 | 32,470 | 30,244 | 19,388 | 106,838 | (72,709 | ) | 34,129 | 29,857 | |||||||||||||||||||||||
|
A/A2
|
24,440 | 27,578 | 18,657 | 21,704 | 92,379 | (58,700 | ) | 33,679 | 28,081 | |||||||||||||||||||||||
|
BBB/Baa2
|
11,609 | 16,601 | 8,464 | 14,525 | 51,199 | (29,209 | ) | 21,990 | 15,955 | |||||||||||||||||||||||
|
BB/Ba2 or lower
|
12,264 | 10,857 | 4,718 | 2,563 | 30,402 | (12,064 | ) | 18,338 | 11,755 | |||||||||||||||||||||||
|
Unrated
|
744 | 816 | 917 | 216 | 2,693 | (13 | ) | 2,680 | 1,409 | |||||||||||||||||||||||
|
Total
|
$ | 79,185 | (1) | $ | 92,114 | $ | 69,104 | $ | 63,048 | $ | 303,451 | $ | (179,278 | ) | $ | 124,173 | $ | 99,326 | ||||||||||||||
| (1) | Includes fair values of OTC derivative assets, maturing within six months, of $21.60 billion and $54.68 billion as of December 2009 and November 2008, respectively. |
| (2) | Represents the netting of receivable balances with payable balances for the same counterparty across tenor categories, pursuant to enforceable netting agreements, and the netting of cash collateral received, pursuant to credit support agreements. Receivable and payable balances with the same counterparty in the same tenor category are netted within such tenor category, where appropriate. |
| (3) | The decrease in the fair value of our OTC derivative credit exposure from November 2008 to December 2009 primarily reflects increases in equity prices, tightening credit spreads, and changes in interest and currency rates. |
Table of Contents
| • | Excess Liquidity — We maintain substantial excess liquidity to meet a broad range of potential cash outflows in a stressed environment, including financing obligations. The amount of our excess liquidity is based on an internal liquidity model together with a qualitative assessment of the condition of the financial markets and of Goldman Sachs. | |
| • | Asset-Liability Management — Our funding strategy includes an assessment of the overall characteristics of our assets with respect to their anticipated holding periods and potential illiquidity in a stressed environment. In addition, we manage the maturities and diversity of our secured and unsecured funding liabilities across markets, products and counterparties, and we seek to maintain liabilities of appropriate term relative to our asset base. | |
| • | Contingency Funding Plan (CFP) — We maintain a CFP to help identify, measure, monitor and mitigate liquidity and funding risk. The CFP considers various risk factors that could occur during a crisis and provides a framework for analyzing and responding to a liquidity crisis. |
| • | The first days or weeks of a liquidity crisis are the most critical to a company’s survival. | |
| • | Focus must be maintained on all potential cash and collateral outflows, not just disruptions to financing flows. Our businesses are diverse, and our cash needs are driven by many factors, including market movements, collateral requirements and client commitments, all of which can change dramatically in a difficult funding environment. | |
| • | During a liquidity crisis, credit-sensitive funding, including unsecured debt and some types of secured financing agreements, may be unavailable, and the terms or availability of other types of secured financing may change. | |
| • | As a result of our policy to pre-fund liquidity that we estimate may be needed in a crisis, we hold more unencumbered securities and have larger debt balances than our businesses would otherwise require. We believe that our liquidity is stronger with greater balances of highly liquid unencumbered securities, even though it increases our total assets, and our funding costs. |
Table of Contents
| • | upcoming maturities of unsecured long-term debt, promissory notes, commercial paper, term deposits and other unsecured funding products; | |
| • | potential buybacks of a portion of our outstanding unsecured funding; | |
| • | potential withdrawals of client deposits in our banking entities; | |
| • | adverse changes in the terms of, or the inability to refinance, secured funding trades with upcoming maturities, reflecting, among other factors, the quality of the underlying collateral and counterparty concentration; |
| • | outflows of cash or collateral associated with the impact of market moves on our OTC derivatives, listed derivatives and securities and loans pledged as collateral for financing transactions; |
| • | other outflows of cash or collateral related to derivatives, including the impact of trade terminations, collateral substitutions, collateral disputes, collateral calls or termination payments (in the event of a two-notch downgrade in our credit ratings), collateral that has not been called by counterparties but is available to them, or additional margin that could be requested by exchanges or clearing houses in a stressed environment; | |
| • | potential liquidity outflows associated with our prime brokerage business, including those related to customer credit balances; | |
| • | draws on our unfunded commitments not supported by William Street Funding Corporation (1) , with draw assumptions varying in magnitude reflecting, among other things, the type of commitment and counterparty, and | |
| • | other upcoming cash outflows, such as tax and other large payments. |
| Year Ended | ||||||||
|
December
|
November
|
|||||||
| 2009 | 2008 | |||||||
| (in millions) | ||||||||
|
U.S. dollar-denominated
|
$ | 120,970 | $ | 78,048 | ||||
|
Non-U.S. dollar-denominated
|
45,404 | 18,677 | ||||||
|
Total Global Core Excess
|
$ | 166,374 | $ | 96,725 | ||||
Table of Contents
| • | Term Structure — We seek to structure our liabilities to have long-dated maturities in order to reduce refinancing risk. We manage maturity concentrations for both secured and unsecured funding to ensure we are able to mitigate any concentrated funding outflows. |
| • | Diversity of Funding Sources — We seek to maintain broad and diversified funding sources globally for both secured and unsecured funding. We make use of the repurchase agreement and securities lending markets, as well as other secured funding markets. We issue long-term debt through syndicated U.S. registered offerings, U.S. registered and 144A medium-term note programs, offshore medium-term note offerings and other debt offerings. We issue short-term debt through U.S. and non-U.S. commercial paper and promissory note issuances and other methods. We raise demand and savings deposits through cash sweep programs and time deposits through internal and third-party broker networks. We generally distribute our funding products through our own sales force to a large, diverse global creditor base. We believe that our relationships with our creditors are critical to our liquidity. Our creditors include banks, governments, securities lenders, pension funds, insurance companies, mutual funds and individuals. We access funding in a variety of markets in the Americas, Europe and Asia. We have imposed various internal guidelines on creditor concentration, including the amount of our commercial paper and promissory notes that can be owned by any single creditor or group of creditors. |
| • | Structural Protection — We structure our liabilities to reduce the risk that we may be required to redeem or repurchase certain of our borrowings prior to their contractual maturity. We issue substantially all of our unsecured debt without put provisions or other provisions that would, based solely upon an adverse change in our credit ratings, financial ratios, earnings, cash flows or stock price, trigger a requirement for an early payment, collateral support, change in terms, acceleration of maturity or the creation of an additional financial obligation. |
Table of Contents
($ in millions)

Table of Contents
| • | the portion of trading assets that we believe could not be funded on a secured basis in periods of market stress, assuming stressed loan values; | |
| • | goodwill and identifiable intangible assets, property, leasehold improvements and equipment, and other illiquid assets; | |
| • | derivative and other margin and collateral requirements; | |
| • | anticipated draws on our unfunded loan commitments; and | |
| • | capital or other forms of financing in our regulated subsidiaries that are in excess of their long-term financing requirements. |
Table of Contents
| As of | ||||||||
|
December
|
November
|
|||||||
| 2009 | 2008 | |||||||
| (in millions) | ||||||||
|
Mortgage and other
asset-backed
loans and securities
|
$ | 14,277 | $ | 22,393 | ||||
|
Bank loans and bridge
loans
(1)
|
19,345 | 21,839 | ||||||
|
Emerging market debt securities
|
2,957 | 2,827 | ||||||
|
High-yield
and other debt obligations
|
12,028 | 9,998 | ||||||
|
Private equity investments and real estate fund
investments
(2)
|
14,633 | 18,171 | ||||||
|
Emerging market equity securities
|
5,193 | 2,665 | ||||||
|
ICBC ordinary
shares
(3)
|
8,111 | 5,496 | ||||||
|
SMFG convertible preferred stock
|
933 | 1,135 | ||||||
|
Other restricted public equity securities
|
203 | 568 | ||||||
|
Other investments in
funds
(4)
|
2,911 | 2,714 | ||||||
| (1) | Includes funded commitments and inventory held in connection with our origination and secondary trading activities. | |
| (2) | Includes interests in our merchant banking funds. Such amounts exclude assets related to consolidated investment funds of $919 million and $1.16 billion as of December 2009 and November 2008, respectively, for which Goldman Sachs does not bear economic exposure. | |
| (3) | Includes interests of $5.13 billion and $3.48 billion as of December 2009 and November 2008, respectively, held by investment funds managed by Goldman Sachs. | |
| (4) | Includes interests in other investment funds that we manage. |
Table of Contents
|
Short-Term
|
Long-Term
|
Subordinated
|
Preferred
|
Rating
|
||||||
|
Debt
|
Debt
|
Debt
|
Stock
|
Outlook
|
||||||
|
DBRS, Inc.
|
R-1 (middle) | A (high) | A | BBB | Stable (3) | |||||
|
Fitch,
Inc.
(1)
|
F1+ | A+ | A | A- | Stable (4) | |||||
|
Moody’s Investors
Service
(2)
|
P-1 | A1 | A2 | A3 | Negative (5) | |||||
|
Standard & Poor
’
s Ratings Services
|
A-1 | A | A- | BBB | Negative (5) | |||||
|
Rating and Investment Information, Inc.
|
a-1+ | AA- | A+ | Not Applicable | Negative (6) |
| (1) | As of February 1, 2010, GS Bank USA has been assigned a rating of AA- for long-term bank deposits, F1+ for short-term bank deposits and A+ for long-term issuer. |
| (2) | GS Bank USA has been assigned a rating of Aa3 for long-term bank deposits, P-1 for short-term bank deposits and Aa3 for long-term issuer. |
| (3) | Applies to long-term and short-term ratings. |
| (4) | Applies to long-term issuer default ratings. |
| (5) | Applies to long-term ratings. |
| (6) | Applies to issuer rating. |
Table of Contents
Table of Contents
Table of Contents
| Item 8. | Financial Statements and Supplementary Data |
|
Page
|
||||
| No. | ||||
| 123 | ||||
| 124 | ||||
|
Consolidated Financial Statements
|
||||
| 125 | ||||
| 126 | ||||
| 127 | ||||
| 128 | ||||
| 129 | ||||
| 130 | ||||
| 131 | ||||
| 131 | ||||
| 145 | ||||
| 166 | ||||
| 173 | ||||
| 174 | ||||
| 175 | ||||
| 178 | ||||
| 183 | ||||
| 186 | ||||
| 187 | ||||
| 189 | ||||
| 191 | ||||
| 196 | ||||
| 200 | ||||
| 201 | ||||
| 204 | ||||
| 208 | ||||
| 212 | ||||
| 213 | ||||
| 214 | ||||
| 215 | ||||
| 216 | ||||
| 217 | ||||
Table of Contents
Financial Reporting
Table of Contents
Table of Contents
| Year Ended | ||||||||||||
|
December
|
November
|
November
|
||||||||||
| 2009 | 2008 | 2007 | ||||||||||
| (in millions, except per share amounts) | ||||||||||||
|
Revenues
|
||||||||||||
|
Investment banking
|
$ | 4,797 | $ | 5,179 | $ | 7,555 | ||||||
|
Trading and principal investments
|
28,879 | 8,095 | 29,714 | |||||||||
|
Asset management and securities services
|
4,090 | 4,672 | 4,731 | |||||||||
|
Total
non-interest
revenues
|
37,766 | 17,946 | 42,000 | |||||||||
|
Interest income
|
13,907 | 35,633 | 45,968 | |||||||||
|
Interest expense
|
6,500 | 31,357 | 41,981 | |||||||||
|
Net interest income
|
7,407 | 4,276 | 3,987 | |||||||||
|
Net revenues, including net interest income
|
45,173 | 22,222 | 45,987 | |||||||||
|
Operating expenses
|
||||||||||||
|
Compensation and benefits
|
16,193 | 10,934 | 20,190 | |||||||||
|
Brokerage, clearing, exchange and distribution fees
|
2,298 | 2,998 | 2,758 | |||||||||
|
Market development
|
342 | 485 | 601 | |||||||||
|
Communications and technology
|
709 | 759 | 665 | |||||||||
|
Depreciation and amortization
|
1,734 | 1,262 | 819 | |||||||||
|
Occupancy
|
950 | 960 | 975 | |||||||||
|
Professional fees
|
678 | 779 | 714 | |||||||||
|
Other expenses
|
2,440 | 1,709 | 1,661 | |||||||||
|
Total
non-compensation
expenses
|
9,151 | 8,952 | 8,193 | |||||||||
|
Total operating expenses
|
25,344 | 19,886 | 28,383 | |||||||||
|
Pre-tax
earnings
|
19,829 | 2,336 | 17,604 | |||||||||
|
Provision for taxes
|
6,444 | 14 | 6,005 | |||||||||
|
Net earnings
|
13,385 | 2,322 | 11,599 | |||||||||
|
Preferred stock dividends
|
1,193 | 281 | 192 | |||||||||
|
Net earnings applicable to common shareholders
|
$ | 12,192 | $ | 2,041 | $ | 11,407 | ||||||
|
Earnings per common share
|
||||||||||||
|
Basic
|
$ | 23.74 | $ | 4.67 | $ | 26.34 | ||||||
|
Diluted
|
22.13 | 4.47 | 24.73 | |||||||||
|
Average common shares outstanding
|
||||||||||||
|
Basic
|
512.3 | 437.0 | 433.0 | |||||||||
|
Diluted
|
550.9 | 456.2 | 461.2 | |||||||||
Table of Contents
| As of | ||||||||
|
December
|
November
|
|||||||
| 2009 | 2008 | |||||||
|
(in millions, except share
|
||||||||
| and per share amounts) | ||||||||
|
Assets
|
||||||||
|
Cash and cash equivalents
|
$ | 38,291 | $ | 15,740 | ||||
|
Cash and securities segregated for regulatory and other purposes
(includes $18,853 and $78,830 at fair value as of
December 2009 and November 2008, respectively)
|
36,663 | 106,664 | ||||||
|
Collateralized agreements:
|
||||||||
|
Securities purchased under agreements to resell and federal
funds sold (includes $144,279 and $116,671 at fair value as of
December 2009 and November 2008, respectively)
|
144,279 | 122,021 | ||||||
|
Securities borrowed (includes $66,329 and $59,810 at fair value
as of December 2009 and November 2008, respectively)
|
189,939 | 180,795 | ||||||
|
Receivables from brokers, dealers and clearing organizations
|
12,597 | 25,899 | ||||||
|
Receivables from customers and counterparties (includes $1,925
and $1,598 at fair value as of December 2009 and
November 2008, respectively)
|
55,303 | 64,665 | ||||||
|
Trading assets, at fair value (includes $31,485 and $26,313
pledged as collateral as of December 2009 and
November 2008, respectively)
|
342,402 | 338,325 | ||||||
|
Other assets
|
29,468 | 30,438 | ||||||
|
Total assets
|
$ | 848,942 | $ | 884,547 | ||||
|
Liabilities and shareholders’ equity
|
||||||||
|
Deposits (includes $1,947 and $4,224 at fair value as of
December 2009 and November 2008, respectively)
|
$ | 39,418 | $ | 27,643 | ||||
|
Collateralized financings:
|
||||||||
|
Securities sold under agreements to repurchase, at fair value
|
128,360 | 62,883 | ||||||
|
Securities loaned (includes $6,194 and $7,872 at fair value as
of December 2009 and November 2008, respectively)
|
15,207 | 17,060 | ||||||
|
Other secured financings (includes $15,228 and $20,249 at fair
value as of December 2009 and November 2008,
respectively)
|
24,134 | 38,683 | ||||||
|
Payables to brokers, dealers and clearing organizations
|
5,242 | 8,585 | ||||||
|
Payables to customers and counterparties
|
180,392 | 245,258 | ||||||
|
Trading liabilities, at fair value
|
129,019 | 175,972 | ||||||
|
Unsecured
short-term
borrowings, including the current portion of unsecured
long-term
borrowings (includes $18,403 and $23,075 at fair value as of
December 2009 and November 2008, respectively)
|
37,516 | 52,658 | ||||||
|
Unsecured
long-term
borrowings (includes $21,392 and $17,446 at fair value as of
December 2009 and November 2008, respectively)
|
185,085 | 168,220 | ||||||
|
Other liabilities and accrued expenses (includes $2,054 and $978
at fair value as of December 2009 and November 2008,
respectively)
|
33,855 | 23,216 | ||||||
|
Total liabilities
|
778,228 | 820,178 | ||||||
|
Commitments, contingencies and guarantees
|
||||||||
|
Shareholders’ equity
|
||||||||
|
Preferred stock, par value $0.01 per share; aggregate
liquidation preference of $8,100 and $18,100 as of
December 2009 and November 2008, respectively
|
6,957 | 16,471 | ||||||
|
Common stock, par value $0.01 per share;
4,000,000,000 shares authorized, 753,412,247 and
680,953,836 shares issued as of December 2009 and
November 2008, respectively, and 515,113,890 and
442,537,317 shares outstanding as of December 2009 and
November 2008, respectively
|
8 | 7 | ||||||
|
Restricted stock units and employee stock options
|
6,245 | 9,284 | ||||||
|
Nonvoting common stock, par value $0.01 per share;
200,000,000 shares authorized, no shares issued and
outstanding
|
— | — | ||||||
|
Additional
paid-in
capital
|
39,770 | 31,071 | ||||||
|
Retained earnings
|
50,252 | 39,913 | ||||||
|
Accumulated other comprehensive loss
|
(362 | ) | (202 | ) | ||||
|
Common stock held in treasury, at cost, par value $0.01 per
share; 238,298,357 and 238,416,519 shares as of
December 2009 and November 2008, respectively
|
(32,156 | ) | (32,175 | ) | ||||
|
Total shareholders’ equity
|
70,714 | 64,369 | ||||||
|
Total liabilities and shareholders’ equity
|
$ | 848,942 | $ | 884,547 | ||||
Table of Contents
| Year Ended | ||||||||||||
|
December
|
November
|
November
|
||||||||||
| 2009 (1) | 2008 | 2007 | ||||||||||
| (in millions) | ||||||||||||
|
Preferred stock
|
||||||||||||
|
Balance, beginning of year
|
$ | 16,483 | $ | 3,100 | $ | 3,100 | ||||||
|
Issued
|
— | 13,367 | — | |||||||||
|
Accretion
|
48 | 4 | — | |||||||||
|
Repurchased
|
(9,574 | ) | — | — | ||||||||
|
Balance, end of year
|
6,957 | 16,471 | 3,100 | |||||||||
|
Common stock
|
||||||||||||
|
Balance, beginning of year
|
7 | 6 | 6 | |||||||||
|
Issued
|
1 | 1 | — | |||||||||
|
Balance, end of year
|
8 | 7 | 6 | |||||||||
|
Restricted stock units and employee stock options
|
||||||||||||
|
Balance, beginning of year
|
9,463 | 9,302 | 6,290 | |||||||||
|
Issuance and amortization of restricted stock units and employee
stock options
|
2,064 | 2,254 | 4,684 | |||||||||
|
Delivery of common stock underlying restricted stock units
|
(5,206 | ) | (1,995 | ) | (1,548 | ) | ||||||
|
Forfeiture of restricted stock units and employee stock options
|
(73 | ) | (274 | ) | (113 | ) | ||||||
|
Exercise of employee stock options
|
(3 | ) | (3 | ) | (11 | ) | ||||||
|
Balance, end of year
|
6,245 | 9,284 | 9,302 | |||||||||
|
Additional
paid-in
capital
|
||||||||||||
|
Balance, beginning of year
|
31,070 | 22,027 | 19,731 | |||||||||
|
Issuance of common stock
|
5,750 | 5,750 | — | |||||||||
|
Issuance of common stock warrants
|
— | 1,633 | — | |||||||||
|
Repurchase of common stock warrants
|
(1,100 | ) | — | — | ||||||||
|
Delivery of common stock underlying restricted stock units and
proceeds from the exercise of employee stock options
|
5,708 | 2,331 | 2,338 | |||||||||
|
Cancellation of restricted stock units in satisfaction of
withholding tax requirements
|
(863 | ) | (1,314 | ) | (929 | ) | ||||||
|
Stock purchase contract fee related to automatic preferred
enhanced capital securities
|
— | — | (20 | ) | ||||||||
|
Preferred and common stock issuance costs
|
— | (1 | ) | — | ||||||||
|
Excess net tax benefit/(provision) related to
share-based
compensation
|
(793 | ) | 645 | 908 | ||||||||
|
Cash settlement of
share-based
compensation
|
(2 | ) | — | (1 | ) | |||||||
|
Balance, end of year
|
39,770 | 31,071 | 22,027 | |||||||||
|
Retained earnings
|
||||||||||||
|
Balance, beginning of year, as previously reported
|
38,579 | 38,642 | 27,868 | |||||||||
|
Cumulative effect from adoption of amended principles related to
accounting for uncertainty in income taxes
|
— | (201 | ) | — | ||||||||
|
Cumulative effect of adjustment from adoption of amended
accounting principles related to fair value measurements, net of
tax
|
— | — | 51 | |||||||||
|
Cumulative effect of adjustment from adoption of amended
accounting principles related to the fair value option, net of
tax
|
— | — | (45 | ) | ||||||||
|
Balance, beginning of year, after cumulative effect of
adjustments
|
38,579 | 38,441 | 27,874 | |||||||||
|
Net earnings
|
13,385 | 2,322 | 11,599 | |||||||||
|
Dividends and dividend equivalents declared on common stock and
restricted stock units
|
(588 | ) | (642 | ) | (639 | ) | ||||||
|
Dividends declared on preferred stock
|
(1,076 | ) | (204 | ) | (192 | ) | ||||||
|
Preferred stock accretion
|
(48 | ) | (4 | ) | — | |||||||
|
Balance, end of year
|
50,252 | 39,913 | 38,642 | |||||||||
|
Accumulated other comprehensive income/(loss)
|
||||||||||||
|
Balance, beginning of year
|
(372 | ) | (118 | ) | 21 | |||||||
|
Adjustment from adoption of amended accounting principles
related to employers’ accounting for defined benefit
pension and other postretirement plans, net of tax
|
— | — | (194 | ) | ||||||||
|
Currency translation adjustment, net of tax
|
(70 | ) | (98 | ) | 39 | |||||||
|
Pension and postretirement liability adjustments, net of tax
|
(17 | ) | 69 | 38 | ||||||||
|
Net gains/(losses) on cash flow hedges, net of tax
|
— | — | (2 | ) | ||||||||
|
Net unrealized gains/(losses) on
available-for-sale
securities, net of tax
|
97 | (55 | ) | (12 | ) | |||||||
|
Reclassification to retained earnings from adoption of amended
accounting principles related to the fair value option, net of
tax
|
— | — | (8 | ) | ||||||||
|
Balance, end of year
|
(362 | ) | (202 | ) | (118 | ) | ||||||
|
Common stock held in treasury, at cost
|
||||||||||||
|
Balance, beginning of year
|
(32,176 | ) | (30,159 | ) | (21,230 | ) | ||||||
|
Repurchased
|
(2 | ) (2) | (2,037 | ) | (8,956 | ) | ||||||
|
Reissued
|
22 | 21 | 27 | |||||||||
|
Balance, end of year
|
(32,156 | ) | (32,175 | ) | (30,159 | ) | ||||||
|
Total shareholders’ equity
|
$ | 70,714 | $ | 64,369 | $ | 42,800 | ||||||
| (1) | In connection with becoming a bank holding company, the firm was required to change its fiscal year-end from November to December. The beginning of the year ended December 2009 is December 27, 2008. |
| (2) | Relates primarily to repurchases of common stock by a broker-dealer subsidiary to facilitate customer transactions in the ordinary course of business and shares withheld to satisfy withholding tax requirements. |
Table of Contents
| Year Ended | ||||||||||||
|
December
|
November
|
November
|
||||||||||
| 2009 | 2008 | 2007 | ||||||||||
| (in millions) | ||||||||||||
|
Cash flows from operating activities
|
||||||||||||
|
Net earnings
|
$ | 13,385 | $ | 2,322 | $ | 11,599 | ||||||
|
Non-cash
items included in net earnings
|
||||||||||||
|
Depreciation and amortization
|
1,943 | 1,625 | 1,167 | |||||||||
|
Deferred income taxes
|
(431 | ) | (1,763 | ) | 129 | |||||||
|
Share-based
compensation
|
2,009 | 1,611 | 4,465 | |||||||||
|
Changes in operating assets and liabilities
|
||||||||||||
|
Cash and securities segregated for regulatory and other purposes
|
76,531 | 12,995 | (39,079 | ) | ||||||||
|
Net receivables from brokers, dealers and clearing organizations
|
6,265 | (6,587 | ) | (3,811 | ) | |||||||
|
Net payables to customers and counterparties
|
(47,414 | ) | (50 | ) | 53,857 | |||||||
|
Securities borrowed, net of securities loaned
|
7,033 | 85,054 | (51,655 | ) | ||||||||
|
Securities sold under agreements to repurchase, net of
securities purchased under agreements to resell and federal
funds sold
|
(146,807 | ) | (130,999 | ) | 6,845 | |||||||
|
Trading assets, at fair value
|
186,295 | 97,723 | (118,864 | ) | ||||||||
|
Trading liabilities, at fair value
|
(57,010 | ) | (39,051 | ) | 57,938 | |||||||
|
Other, net
|
7,076 | (20,986 | ) | 7,962 | ||||||||
|
Net cash provided by/(used for) operating activities
|
48,875 | 1,894 | (69,447 | ) | ||||||||
|
Cash flows from investing activities
|
||||||||||||
|
Purchase of property, leasehold improvements and equipment
|
(1,556 | ) | (2,027 | ) | (2,130 | ) | ||||||
|
Proceeds from sales of property, leasehold improvements and
equipment
|
82 | 121 | 93 | |||||||||
|
Business acquisitions, net of cash acquired
|
(221 | ) | (2,613 | ) | (1,900 | ) | ||||||
|
Proceeds from sales of investments
|
303 | 624 | 4,294 | |||||||||
|
Purchase of
available-for-sale
securities
|
(2,722 | ) | (3,851 | ) | (872 | ) | ||||||
|
Proceeds from sales of
available-for-sale
securities
|
2,553 | 3,409 | 911 | |||||||||
|
Net cash provided by/(used for) investing activities
|
(1,561 | ) | (4,337 | ) | 396 | |||||||
|
Cash flows from financing activities
|
||||||||||||
|
Unsecured
short-term
borrowings, net
|
(9,790 | ) | (19,295 | ) | 12,262 | |||||||
|
Other secured financings
(short-term),
net
|
(10,451 | ) | (8,727 | ) | 2,780 | |||||||
|
Proceeds from issuance of other secured financings
(long-term)
|
4,767 | 12,509 | 21,703 | |||||||||
|
Repayment of other secured financings
(long-term),
including the current portion
|
(6,667 | ) | (20,653 | ) | (7,355 | ) | ||||||
|
Proceeds from issuance of unsecured
long-term
borrowings
|
25,363 | 37,758 | 57,516 | |||||||||
|
Repayment of unsecured
long-term
borrowings, including the current portion
|
(29,018 | ) | (25,579 | ) | (14,823 | ) | ||||||
|
Preferred stock repurchased
|
(9,574 | ) | — | — | ||||||||
|
Repurchase of common stock warrants
|
(1,100 | ) | — | — | ||||||||
|
Derivative contracts with a financing element, net
|
2,168 | 781 | 4,814 | |||||||||
|
Deposits, net
|
7,288 | 12,273 | 4,673 | |||||||||
|
Common stock repurchased
|
(2 | ) | (2,034 | ) | (8,956 | ) | ||||||
|
Dividends and dividend equivalents paid on common stock,
preferred stock and restricted stock units
|
(2,205 | ) | (850 | ) | (831 | ) | ||||||
|
Proceeds from issuance of common stock, including stock option
exercises
|
6,260 | 6,105 | 791 | |||||||||
|
Proceeds from issuance of preferred stock, net of issuance costs
|
— | 13,366 | — | |||||||||
|
Proceeds from issuance of common stock warrants
|
— | 1,633 | — | |||||||||
|
Excess tax benefit related to
share-based
compensation
|
135 | 614 | 817 | |||||||||
|
Cash settlement of
share-based
compensation
|
(2 | ) | — | (1 | ) | |||||||
|
Net cash provided by/(used for) financing activities
|
(22,828 | ) | 7,901 | 73,390 | ||||||||
|
Net increase in cash and cash equivalents
|
24,486 | 5,458 | 4,339 | |||||||||
|
Cash and cash equivalents, beginning of year
|
13,805 | 10,282 | 5,943 | |||||||||
|
Cash and cash equivalents, end of year
|
$ | 38,291 | $ | 15,740 | $ | 10,282 | ||||||
Table of Contents
| Year Ended | ||||||||||||
|
December
|
November
|
November
|
||||||||||
| 2009 | 2008 | 2007 | ||||||||||
| (in millions) | ||||||||||||
|
Net earnings
|
$ | 13,385 | $ | 2,322 | $ | 11,599 | ||||||
|
Currency translation adjustment, net of tax
|
(70 | ) | (98 | ) | 39 | |||||||
|
Pension and postretirement liability adjustments, net of tax
|
(17 | ) | 69 | 38 | ||||||||
|
Net gains/(losses) on cash flow hedges, net of tax
|
— | — | (2 | ) | ||||||||
|
Net unrealized gains/(losses) on
available-for-sale
securities,
net of tax |
97 | (55 | ) | (12 | ) | |||||||
|
Comprehensive income
|
$ | 13,395 | $ | 2,238 | $ | 11,662 | ||||||
Table of Contents
| One Month Ended December 2008 | ||||
| (in millions, except per share amounts) | ||||
|
Revenues
|
||||
|
Investment banking
|
$ | 135 | ||
|
Trading and principal investments
|
(964 | ) | ||
|
Asset management and securities services
|
327 | |||
|
Total
non-interest
revenues
|
(502 | ) | ||
|
Interest income
|
1,687 | |||
|
Interest expense
|
1,002 | |||
|
Net interest income
|
685 | |||
|
Net revenues, including net interest income
|
183 | |||
|
Operating expenses
|
||||
|
Compensation and benefits
|
744 | |||
|
Brokerage, clearing, exchange and distribution fees
|
165 | |||
|
Market development
|
16 | |||
|
Communications and technology
|
62 | |||
|
Depreciation and amortization
|
111 | |||
|
Occupancy
|
82 | |||
|
Professional fees
|
58 | |||
|
Other expenses
|
203 | |||
|
Total
non-compensation
expenses
|
697 | |||
|
Total operating expenses
|
1,441 | |||
|
Pre-tax
loss
|
(1,258 | ) | ||
|
Benefit for taxes
|
(478 | ) | ||
|
Net loss
|
(780 | ) | ||
|
Preferred stock dividends
|
248 | |||
|
Net loss applicable to common shareholders
|
$ | (1,028 | ) | |
|
|
||||
|
Loss per common share
|
||||
|
Basic
|
$ | (2.15 | ) | |
|
Diluted
|
(2.15 | ) | ||
|
Dividends declared per common share
|
$ | 0.47 | (1) | |
|
Average common shares outstanding
|
||||
|
Basic
|
485.5 | |||
|
Diluted
|
485.5 | |||
|
(1)
|
Rounded to the nearest penny. Exact dividend amount was $0.4666666 per common share and was reflective of a four-month period (December 2008 through March 2009), due to the change in the firm’s fiscal year-end. |
| One Month Ended December 2008 | ||||
| (in millions) | ||||
|
Net loss
|
$ | (780 | ) | |
|
Currency translation adjustment, net of tax
|
(32 | ) | ||
|
Pension and postretirement liability adjustments, net of tax
|
(175 | ) | ||
|
Net unrealized gains on
available-for-sale
securities, net of tax
|
37 | |||
|
Comprehensive loss
|
$ | (950 | ) | |
|
|
||||
| One Month Ended December 2008 | ||||
| (in millions) | ||||
|
Cash flows from operating activities
|
||||
|
Net loss
|
$ | (780 | ) | |
|
Non-cash
items included in net loss
|
||||
|
Depreciation and amortization
|
143 | |||
|
Share-based
compensation
|
180 | |||
|
Changes in operating assets and liabilities
|
||||
|
Cash and securities segregated for regulatory and other purposes
|
(5,835 | ) | ||
|
Net receivables from brokers, dealers and clearing organizations
|
3,693 | |||
|
Net payables to customers and counterparties
|
(7,635 | ) | ||
|
Securities borrowed, net of securities loaned
|
(18,030 | ) | ||
|
Securities sold under agreements to repurchase, net of
securities purchased under agreements to resell and federal
funds sold
|
190,027 | |||
|
Trading assets, at fair value
|
(192,883 | ) | ||
|
Trading liabilities, at fair value
|
10,059 | |||
|
Other, net
|
7,156 | |||
|
Net cash used for operating activities
|
(13,905 | ) | ||
|
Cash flows from investing activities
|
||||
|
Purchase of property, leasehold improvements and equipment
|
(61 | ) | ||
|
Proceeds from sales of property, leasehold improvements and
equipment
|
4 | |||
|
Business acquisitions, net of cash acquired
|
(59 | ) | ||
|
Proceeds from sales of investments
|
141 | |||
|
Purchase of
available-for-sale
securities
|
(95 | ) | ||
|
Proceeds from sales of
available-for-sale
securities
|
26 | |||
|
Net cash used for investing activities
|
(44 | ) | ||
|
Cash flows from financing activities
|
||||
|
Unsecured
short-term
borrowings, net
|
2,816 | |||
|
Other secured financings
(short-term),
net
|
(1,068 | ) | ||
|
Proceeds from issuance of other secured financings
(long-term)
|
437 | |||
|
Repayment of other secured financings
(long-term),
including the current portion
|
(349 | ) | ||
|
Proceeds from issuance of unsecured
long-term
borrowings
|
9,310 | |||
|
Repayment of unsecured
long-term
borrowings, including the current portion
|
(3,686 | ) | ||
|
Derivative contracts with a financing element, net
|
66 | |||
|
Deposits, net
|
4,487 | |||
|
Common stock repurchased
|
(1 | ) | ||
|
Proceeds from issuance of common stock, including stock option
exercises
|
2 | |||
|
Net cash provided by financing activities
|
12,014 | |||
|
Net decrease in cash and cash equivalents
|
(1,935 | ) | ||
|
Cash and cash equivalents, beginning of period
|
15,740 | |||
|
Cash and cash equivalents, end of period
|
$ | 13,805 | ||
|
|
||||
Table of Contents
| Note 1. | Description of Business |
| • | Investment Banking. The firm provides a broad range of investment banking services to a diverse group of corporations, financial institutions, investment funds, governments and individuals. | |
| • | Trading and Principal Investments. The firm facilitates client transactions with a diverse group of corporations, financial institutions, investment funds, governments and individuals through market making in, trading of and investing in fixed income and equity products, currencies, commodities and derivatives on these products. The firm also takes proprietary positions on certain of these products. In addition, the firm engages in market-making activities on equities and options exchanges, and the firm clears client transactions on major stock, options and futures exchanges worldwide. In connection with the firm’s merchant banking and other investing activities, the firm makes principal investments directly and through funds that the firm raises and manages. | |
| • | Asset Management and Securities Services. The firm provides investment and wealth advisory services and offers investment products (primarily through separately managed accounts and commingled vehicles, such as mutual funds and private investment funds) across all major asset classes to a diverse group of institutions and individuals worldwide and provides prime brokerage services, financing services and securities lending services to institutional clients, including hedge funds, mutual funds, pension funds and foundations, and to high-net-worth individuals worldwide. |
| Note 2. | Significant Accounting Policies |
| • | Voting Interest Entities. Voting interest entities are entities in which (i) the total equity investment at risk is sufficient to enable the entity to finance its activities independently and (ii) the equity holders have the obligation to absorb losses, the right to receive residual returns and the right to make decisions about the entity’s activities. The usual condition for a controlling financial interest in a voting interest entity is ownership of a majority voting interest. Accordingly, the firm consolidates voting interest entities in which it has a majority voting interest. |
Table of Contents
| • | Variable Interest Entities. VIEs are entities that lack one or more of the characteristics of a voting interest entity. A controlling financial interest in a VIE is present when an enterprise has a variable interest, or a combination of variable interests, that will absorb a majority of the VIE’s expected losses, receive a majority of the VIE’s expected residual returns, or both. The enterprise with a controlling financial interest, known as the primary beneficiary, consolidates the VIE. The firm determines whether it is the primary beneficiary of a VIE by first performing a qualitative analysis of the VIE’s expected losses and expected residual returns. This analysis includes a review of, among other factors, the VIE’s capital structure, contractual terms, which interests create or absorb variability, related party relationships and the design of the VIE. Where qualitative analysis is not conclusive, the firm performs a quantitative analysis. For purposes of allocating a VIE’s expected losses and expected residual returns to its variable interest holders, the firm utilizes the “top down” method. Under this method, the firm calculates its share of the VIE’s expected losses and expected residual returns using the specific cash flows that would be allocated to it, based on contractual arrangements and/or the firm’s position in the capital structure of the VIE, under various probability-weighted scenarios. The firm reassesses its initial evaluation of an entity as a VIE and its initial determination of whether the firm is the primary beneficiary of a VIE upon the occurrence of certain reconsideration events. See “— Recent Accounting Developments” below for information regarding amendments to accounting for VIEs. | |
| • | QSPEs. QSPEs are passive entities that are commonly used in mortgage and other securitization transactions. To be considered a QSPE, an entity must satisfy certain criteria. These criteria include the types of assets a QSPE may hold, limits on asset sales, the use of derivatives and financial guarantees, and the level of discretion a servicer may exercise in attempting to collect receivables. These criteria may require management to make judgments about complex matters, such as whether a derivative is considered passive and the level of discretion a servicer may exercise, including, for example, determining when default is reasonably foreseeable. The firm does not consolidate QSPEs. See “— Recent Accounting Developments” below for information regarding amendments to accounting for QSPEs. | |
| • | Equity-Method Investments. When the firm does not have a controlling financial interest in an entity but exerts significant influence over the entity’s operating and financial policies (generally defined as owning a voting interest of 20% to 50%) and has an investment in common stock or in-substance common stock, the firm accounts for its investment either under the equity method of accounting or at fair value pursuant to the fair value option available under Financial Accounting Standards Board (FASB) Accounting Standards Codification (ASC) 825-10. In general, the firm accounts for investments acquired subsequent to November 24, 2006, when the fair value option became available, at fair value. In certain cases, the firm applies the equity method of accounting to new investments that are strategic in nature or closely related to the firm’s principal business activities, where the firm has a significant degree of involvement in the cash flows or operations of the investee, or where cost-benefit considerations are less significant. See “— Revenue Recognition — Other Financial Assets and Financial Liabilities at Fair Value” below for a discussion of the firm’s application of the fair value option. | |
| • | Other. If the firm does not consolidate an entity or apply the equity method of accounting, the firm accounts for its investment at fair value. The firm also has formed numerous nonconsolidated investment funds with third-party investors that are typically organized as limited partnerships. The firm acts as general partner for these funds and generally does not hold a majority of the economic interests in these funds. The firm has generally provided the third-party investors with rights to terminate the funds or to remove the firm as the general partner. As a result, the firm does not consolidate these funds. These fund investments are included in “Trading assets, at fair value” in the consolidated statements of financial condition. |
Table of Contents
| • | certain unsecured short-term borrowings, consisting of all promissory notes and commercial paper and certain hybrid financial instruments; |
Table of Contents
| • | certain other secured financings, primarily transfers accounted for as financings rather than sales, debt raised through the firm’s William Street credit extension program and certain other nonrecourse financings; | |
| • | certain unsecured long-term borrowings, including prepaid physical commodity transactions and certain hybrid financial instruments; | |
| • | resale and repurchase agreements; | |
| • | securities borrowed and loaned within Trading and Principal Investments, consisting of the firm’s matched book and certain firm financing activities; | |
| • | certain deposits issued by the firm’s bank subsidiaries, as well as securities held by Goldman Sachs Bank USA (GS Bank USA); | |
| • | certain receivables from customers and counterparties, including certain margin loans, transfers accounted for as secured loans rather than purchases and prepaid variable share forwards; | |
| • | certain insurance and reinsurance contracts and certain guarantees; and | |
| • | in general, investments acquired after November 24, 2006, when the fair value option became available, where the firm has significant influence over the investee and would otherwise apply the equity method of accounting. |
| Level 1 | Unadjusted quoted prices in active markets that are accessible at the measurement date for identical, unrestricted assets or liabilities; | |
| Level 2 | Quoted prices in markets that are not considered to be active or financial instruments for which all significant inputs are observable, either directly or indirectly; | |
| Level 3 | Prices or valuations that require inputs that are both significant to the fair value measurement and unobservable. |
Table of Contents
| • | Cash Instruments. The firm’s cash instruments are generally classified within level 1 or level 2 of the fair value hierarchy because they are valued using quoted market prices, broker or dealer quotations, or alternative pricing sources with reasonable levels of price transparency. The types of instruments valued based on quoted market prices in active markets include most government obligations, active listed equities and certain money market securities. Such instruments are generally classified within level 1 of the fair value hierarchy. Instruments classified within level 1 of the fair value hierarchy are required to be carried at quoted market prices, even in situations where the firm holds a large position and a sale could reasonably impact the quoted price. |
Table of Contents
| • | Derivative Contracts. Derivative contracts can be exchange-traded or over-the-counter (OTC). Exchange-traded derivatives typically fall within level 1 or level 2 of the fair value hierarchy depending on whether they are deemed to be actively traded or not. The firm generally values exchange-traded derivatives using models which calibrate to market-clearing levels and eliminate timing differences between the closing price of the exchange-traded derivatives and their underlying instruments. In such cases, exchange-traded derivatives are classified within level 2 of the fair value hierarchy. |
Table of Contents
| • | Resale and Repurchase Agreements. Securities purchased under agreements to resell and securities sold under agreements to repurchase, principally U.S. government, federal agency and investment-grade sovereign obligations, represent collateralized financing transactions. The firm receives securities purchased under agreements to resell, makes delivery of securities sold under agreements to repurchase, monitors the market value of these securities on a daily basis and delivers or obtains additional collateral as appropriate. As noted above, resale and repurchase agreements are carried in the consolidated statements of financial condition at fair value under the fair value option. Resale and repurchase agreements are generally valued based on inputs with reasonable levels of price transparency and are generally classified within level 2 of the fair value hierarchy. | |
| • | Securities Borrowed and Loaned. Securities borrowed and loaned are generally collateralized by cash, securities or letters of credit. The firm receives securities borrowed, makes delivery of securities loaned, monitors the market value of securities borrowed and loaned, and delivers or obtains additional collateral as appropriate. Securities borrowed and loaned within Securities Services, relating to both customer activities and, to a lesser extent, certain firm financing activities, are recorded based on the amount of cash collateral advanced or received plus accrued interest. As these arrangements generally can be terminated on demand, they exhibit little, if any, sensitivity to changes in interest rates. As noted above, securities borrowed and loaned within Trading and Principal Investments, which are related to the firm’s matched book and certain firm financing activities, are recorded at fair value under the fair value option. These securities borrowed and loaned transactions are generally valued based on inputs with reasonable levels of price transparency and are classified within level 2 of the fair value hierarchy. | |
| • | Other Secured Financings. In addition to repurchase agreements and securities loaned, the firm funds assets through the use of other secured financing arrangements and pledges financial instruments and other assets as collateral in these transactions. As noted above, the firm has elected to apply the fair value option to transfers accounted for as financings rather than sales, debt raised through the firm’s William Street credit extension program and certain other nonrecourse financings, for which the use of fair value eliminates non-economic volatility in earnings that would arise from using different measurement attributes. These other secured financing transactions are generally classified within level 2 of the fair value hierarchy. Other secured financings that are not recorded at fair value are recorded based on the amount of cash received plus accrued interest. See Note 3 for further information regarding other secured financings. |
Table of Contents
Table of Contents
Table of Contents
Table of Contents
Table of Contents
Table of Contents
Table of Contents
Table of Contents
| Note 3. | Financial Instruments |
| As of | ||||||||||||||||
| December 2009 | November 2008 | |||||||||||||||
| Assets | Liabilities | Assets | Liabilities | |||||||||||||
| (in millions) | ||||||||||||||||
|
Commercial paper, certificates of deposit, time deposits and
other money market instruments
|
$ | 9,111 | (1) | $ | — | $ | 8,662 | (1) | $ | — | ||||||
|
Government and U.S. federal agency obligations
|
117,194 | 44,825 | 69,653 | 37,000 | ||||||||||||
|
Mortgage and other
asset-backed
loans and securities
|
14,277 | 103 | 22,393 | 340 | ||||||||||||
|
Bank loans and bridge loans
|
19,345 | 1,541 | (4) | 21,839 | 3,108 | (4) | ||||||||||
|
Corporate debt securities and other debt obligations
|
32,041 | 6,265 | 27,879 | 5,711 | ||||||||||||
|
Equities and convertible debentures
|
71,474 | 20,253 | 57,049 | 12,116 | ||||||||||||
|
Physical commodities
|
3,707 | 23 | 513 | 2 | ||||||||||||
|
Derivative contracts
|
75,253 | (2) | 56,009 | (5) | 130,337 | (2) | 117,695 | (5) | ||||||||
|
Total
|
$ | 342,402 | (3) | $ | 129,019 | $ | 338,325 | (3) | $ | 175,972 | ||||||
| (1) | Includes $4.31 billion and $4.40 billion as of December 2009 and November 2008, respectively, of money market instruments held by William Street Funding Corporation (Funding Corp.) to support the William Street credit extension program. See Note 8 for further information regarding the William Street credit extension program. | |
| (2) | Net of cash received pursuant to credit support agreements of $124.60 billion and $137.16 billion as of December 2009 and November 2008, respectively. | |
| (3) | Includes $3.86 billion and $1.68 billion as of December 2009 and November 2008, respectively, of securities held within the firm’s insurance subsidiaries which are accounted for as available-for-sale. | |
| (4) | Consists of the fair value of unfunded commitments to extend credit. The fair value of partially funded commitments is included in trading assets, at fair value. | |
| (5) | Net of cash paid pursuant to credit support agreements of $14.74 billion and $34.01 billion as of December 2009 and November 2008, respectively. |
Table of Contents
| As of | ||||||||
|
December
|
November
|
|||||||
| 2009 | 2008 | |||||||
| ($ in millions) | ||||||||
|
Total level 3 assets
|
$ | 46,475 | $ | 66,190 | ||||
|
Level 3 assets for which the firm bears economic
exposure
(1)
|
43,348 | 59,574 | ||||||
|
Total assets
|
848,942 | 884,547 | ||||||
|
Total financial assets at fair value
|
573,788 | 595,234 | ||||||
|
Total level 3 assets as a percentage of Total assets
|
5.5 | % | 7.5 | % | ||||
|
Level 3 assets for which the firm bears economic exposure
as a percentage of Total assets
|
5.1 | 6.7 | ||||||
|
Total level 3 assets as a percentage of Total financial
assets at fair value
|
8.1 | 11.1 | ||||||
|
Level 3 assets for which the firm bears economic exposure
as a percentage of Total financial assets at fair value
|
7.6 | 10.0 | ||||||
| (1) | Excludes assets which are financed by nonrecourse debt, attributable to minority investors or attributable to employee interests in certain consolidated funds. |
Table of Contents
| Financial Assets at Fair Value as of December 2009 | ||||||||||||||||||||
|
Netting and
|
||||||||||||||||||||
| Level 1 | Level 2 | Level 3 | Collateral | Total | ||||||||||||||||
| (in millions) | ||||||||||||||||||||
|
Commercial paper, certificates of deposit, time deposits and
other money market instruments
|
$ | 5,026 | $ | 4,085 | $ | — | $ | — | $ | 9,111 | ||||||||||
|
U.S. government and federal agency obligations
|
36,391 | 41,945 | — | — | 78,336 | |||||||||||||||
|
Non-U.S. government
obligations
|
33,881 | 4,977 | — | — | 38,858 | |||||||||||||||
|
Mortgage and other
asset-backed
loans and
securities
(1)
:
|
||||||||||||||||||||
|
Loans and securities backed by commercial real estate
|
— | 1,583 | 4,620 | — | 6,203 | |||||||||||||||
|
Loans and securities backed by residential real estate
|
— | 4,824 | 1,880 | — | 6,704 | |||||||||||||||
|
Loan
portfolios
(2)
|
— | 6 | 1,364 | — | 1,370 | |||||||||||||||
|
Bank loans and bridge loans
|
— | 9,785 | 9,560 | — | 19,345 | |||||||||||||||
|
Corporate debt
securities
(3)
|
164 | 23,969 | 2,235 | — | 26,368 | |||||||||||||||
|
State and municipal obligations
|
— | 1,645 | 1,114 | — | 2,759 | |||||||||||||||
|
Other debt obligations
|
— | 679 | 2,235 | — | 2,914 | |||||||||||||||
|
Equities and convertible debentures
|
37,103 | (5) | 22,500 | (7) | 11,871 | (10) | — | 71,474 | ||||||||||||
|
Physical commodities
|
— | 3,707 | — | — | 3,707 | |||||||||||||||
|
Cash instruments
|
112,565 | 119,705 | 34,879 | — | 267,149 | |||||||||||||||
|
Derivative contracts
|
161 | 190,816 | (8) | 11,596 | (8) | (127,320 | ) (11) | 75,253 | ||||||||||||
|
Trading assets, at fair value
|
112,726 | 310,521 | 46,475 | (127,320 | ) | 342,402 | ||||||||||||||
|
Securities segregated for regulatory and other purposes
|
14,381 | (6) | 4,472 | (9) | — | — | 18,853 | |||||||||||||
|
Securities purchased under agreements to resell
|
— | 144,279 | — | — | 144,279 | |||||||||||||||
|
Securities borrowed
|
— | 66,329 | — | — | 66,329 | |||||||||||||||
|
Receivables from customers and counterparties
|
— | 1,925 | — | — | 1,925 | |||||||||||||||
|
Total financial assets at fair value
|
$ | 127,107 | $ | 527,526 | $ | 46,475 | $ | (127,320 | ) | $ | 573,788 | |||||||||
|
Level 3 assets for which the firm does not bear economic
exposure
(4)
|
(3,127 | ) | ||||||||||||||||||
|
Level 3 assets for which the firm bears economic exposure
|
$ | 43,348 | ||||||||||||||||||
| (1) | Includes $291 million and $311 million of CDOs and collateralized loan obligations (CLOs) backed by real estate within level 2 and level 3, respectively, of the fair value hierarchy. | |
| (2) | Consists of acquired portfolios of distressed loans, primarily backed by commercial and residential real estate collateral. | |
| (3) | Includes $338 million and $741 million of CDOs and CLOs backed by corporate obligations within level 2 and level 3, respectively, of the fair value hierarchy. | |
| (4) | Consists of level 3 assets which are financed by nonrecourse debt, attributable to minority investors or attributable to employee interests in certain consolidated funds. | |
| (5) | Consists of publicly listed equity securities. | |
| (6) | Principally consists of U.S. Department of the Treasury (U.S. Treasury) securities and money market instruments as well as insurance separate account assets measured at fair value. | |
| (7) | Substantially all of the firm’s level 2 equities and convertible debentures are less liquid publicly listed securities. | |
| (8) | Includes $31.44 billion and $9.58 billion of credit derivative assets within level 2 and level 3, respectively, of the fair value hierarchy. These amounts exclude the effects of netting under enforceable netting agreements across other derivative product types. | |
| (9) | Principally consists of securities borrowed and resale agreements. The underlying securities have been segregated to satisfy certain regulatory requirements. |
| (10) | Substantially all consists of private equity investments and real estate fund investments. Includes $10.56 billion of private equity investments, $1.23 billion of real estate investments and $79 million of convertible debentures. |
| (11) | Represents cash collateral and the impact of netting across the levels of the fair value hierarchy. Netting among positions classified within the same level is included in that level. |
Table of Contents
| Financial Liabilities at Fair Value as of December 2009 | ||||||||||||||||||||
|
Netting and
|
||||||||||||||||||||
| Level 1 | Level 2 | Level 3 | Collateral | Total | ||||||||||||||||
| (in millions) | ||||||||||||||||||||
|
U.S. government and federal agency obligations
|
$ | 20,940 | $ | 42 | $ | — | $ | — | $ | 20,982 | ||||||||||
|
Non-U.S. government
obligations
|
23,306 | 537 | — | — | 23,843 | |||||||||||||||
|
Mortgage and other
asset-backed
loans and securities:
|
||||||||||||||||||||
|
Loans and securities backed by commercial real estate
|
— | 29 | — | — | 29 | |||||||||||||||
|
Loans and securities backed by residential real estate
|
— | 74 | — | — | 74 | |||||||||||||||
|
Bank loans and bridge loans
|
— | 1,128 | 413 | — | 1,541 | |||||||||||||||
|
Corporate debt
securities
(1)
|
65 | 6,018 | 146 | — | 6,229 | |||||||||||||||
|
State and municipal obligations
|
— | 36 | — | — | 36 | |||||||||||||||
|
Equities and convertible
debentures
(2)
|
19,072 | 1,168 | 13 | — | 20,253 | |||||||||||||||
|
Physical commodities
|
— | 23 | — | — | 23 | |||||||||||||||
|
Cash instruments
|
63,383 | 9,055 | 572 | — | 73,010 | |||||||||||||||
|
Derivative contracts
|
126 | 66,943 | (3) | 6,400 | (3) | (17,460 | ) (5) | 56,009 | ||||||||||||
|
Trading liabilities, at fair value
|
63,509 | 75,998 | 6,972 | (17,460 | ) | 129,019 | ||||||||||||||
|
Deposits
|
— | 1,947 | — | — | 1,947 | |||||||||||||||
|
Securities sold under agreements to repurchase, at fair value
|
— | 127,966 | 394 | — | 128,360 | |||||||||||||||
|
Securities loaned
|
— | 6,194 | — | — | 6,194 | |||||||||||||||
|
Other secured financings
|
118 | 8,354 | 6,756 | — | 15,228 | |||||||||||||||
|
Unsecured
short-term
borrowings
|
— | 16,093 | 2,310 | — | 18,403 | |||||||||||||||
|
Unsecured
long-term
borrowings
|
— | 18,315 | 3,077 | — | 21,392 | |||||||||||||||
|
Other liabilities and accrued expenses
|
— | 141 | 1,913 | — | 2,054 | |||||||||||||||
|
Total financial liabilities at fair value
|
$ | 63,627 | $ | 255,008 | $ | 21,422 | (4) | $ | (17,460 | ) | $ | 322,597 | ||||||||
| (1) | Includes $45 million of CDOs and CLOs backed by corporate obligations within level 3 of the fair value hierarchy. |
| (2) | Substantially all consists of publicly listed equity securities. |
| (3) | Includes $7.96 billion and $3.20 billion of credit derivative liabilities within level 2 and level 3, respectively, of the fair value hierarchy. These amounts exclude the effects of netting under enforceable netting agreements across other derivative product types. |
| (4) | Level 3 liabilities were 6.6% of Total financial liabilities at fair value. |
| (5) | Represents cash collateral and the impact of netting across the levels of the fair value hierarchy. Netting among positions classified within the same level is included in that level. |
Table of Contents
| Financial Assets at Fair Value as of November 2008 | ||||||||||||||||||||
|
Netting and
|
||||||||||||||||||||
| Level 1 | Level 2 | Level 3 | Collateral | Total | ||||||||||||||||
| (in millions) | ||||||||||||||||||||
|
Commercial paper, certificates of deposit, time deposits and
other money market instruments
|
$ | 5,205 | $ | 3,457 | $ | — | $ | — | $ | 8,662 | ||||||||||
|
Government and U.S. federal agency obligations
|
35,069 | 34,584 | — | — | 69,653 | |||||||||||||||
|
Mortgage and other
asset-backed
loans and securities
|
— | 6,886 | 15,507 | — | 22,393 | |||||||||||||||
|
Bank loans and bridge loans
|
— | 9,882 | 11,957 | — | 21,839 | |||||||||||||||
|
Corporate debt securities and other debt obligations
|
14 | 20,269 | 7,596 | — | 27,879 | |||||||||||||||
|
Equities and convertible debentures
|
25,068 | 15,975 | 16,006 | (5) | — | 57,049 | ||||||||||||||
|
Physical commodities
|
— | 513 | — | — | 513 | |||||||||||||||
|
Cash instruments
|
65,356 | 91,566 | 51,066 | — | 207,988 | |||||||||||||||
|
Derivative contracts
|
24 | 256,412 | (3) | 15,124 | (3) | (141,223 | ) (6) | 130,337 | ||||||||||||
|
Trading assets, at fair value
|
65,380 | 347,978 | 66,190 | (141,223 | ) | 338,325 | ||||||||||||||
|
Securities segregated for regulatory and other purposes
|
20,030 | (2) | 58,800 | (4) | — | — | 78,830 | |||||||||||||
|
Securities purchased under agreements to resell
|
— | 116,671 | — | — | 116,671 | |||||||||||||||
|
Securities borrowed
|
— | 59,810 | — | — | 59,810 | |||||||||||||||
|
Receivables from customers and counterparties
|
— | 1,598 | — | — | 1,598 | |||||||||||||||
|
Total financial assets at fair value
|
$ | 85,410 | $ | 584,857 | $ | 66,190 | $ | (141,223 | ) | $ | 595,234 | |||||||||
|
Level 3 assets for which the firm does not bear economic
exposure
(1)
|
(6,616 | ) | ||||||||||||||||||
|
Level 3 assets for which the firm bears economic exposure
|
$ | 59,574 | ||||||||||||||||||
| (1) | Consists of level 3 assets which are financed by nonrecourse debt, attributable to minority investors or attributable to employee interests in certain consolidated funds. |
| (2) | Consists of U.S. Treasury securities and money market instruments as well as insurance separate account assets measured at fair value. |
| (3) | Includes $66.00 billion and $8.32 billion of credit derivative assets within level 2 and level 3, respectively, of the fair value hierarchy. These amounts exclude the effects of netting under enforceable netting agreements across other derivative product types. |
| (4) | Principally consists of securities borrowed and resale agreements. The underlying securities have been segregated to satisfy certain regulatory requirements. |
| (5) | Substantially all consists of private equity investments and real estate fund investments. |
| (6) | Represents cash collateral and the impact of netting across the levels of the fair value hierarchy. Netting among positions classified within the same level is included in that level. |
Table of Contents
| Financial Liabilities at Fair Value as of November 2008 | ||||||||||||||||||||
|
Netting and
|
||||||||||||||||||||
| Level 1 | Level 2 | Level 3 | Collateral | Total | ||||||||||||||||
| (in millions) | ||||||||||||||||||||
|
Government and U.S. federal agency obligations
|
$ | 36,385 | $ | 615 | $ | — | $ | — | $ | 37,000 | ||||||||||
|
Mortgage and other
asset-backed
loans and securities
|
— | 320 | 20 | — | 340 | |||||||||||||||
|
Bank loans and bridge loans
|
— | 2,278 | 830 | — | 3,108 | |||||||||||||||
|
Corporate debt securities and other debt obligations
|
11 | 5,185 | 515 | — | 5,711 | |||||||||||||||
|
Equities and convertible debentures
|
11,928 | 174 | 14 | — | 12,116 | |||||||||||||||
|
Physical commodities
|
2 | — | — | — | 2 | |||||||||||||||
|
Cash instruments
|
48,326 | 8,572 | 1,379 | — | 58,277 | |||||||||||||||
|
Derivative contracts
|
21 | 145,777 | (1) | 9,968 | (1) | (38,071 | ) (3) | 117,695 | ||||||||||||
|
Trading liabilities, at fair value
|
48,347 | 154,349 | 11,347 | (38,071 | ) | 175,972 | ||||||||||||||
|
Deposits
|
— | 4,224 | — | — | 4,224 | |||||||||||||||
|
Securities sold under agreements to repurchase, at fair value
|
— | 62,883 | — | — | 62,883 | |||||||||||||||
|
Securities loaned
|
— | 7,872 | — | — | 7,872 | |||||||||||||||
|
Other secured financings
|
— | 16,429 | 3,820 | — | 20,249 | |||||||||||||||
|
Unsecured
short-term
borrowings
|
— | 17,916 | 5,159 | — | 23,075 | |||||||||||||||
|
Unsecured
long-term
borrowings
|
— | 15,886 | 1,560 | — | 17,446 | |||||||||||||||
|
Other liabilities and accrued expenses
|
— | 978 | — | — | 978 | |||||||||||||||
|
Total financial liabilities at fair value
|
$ | 48,347 | $ | 280,537 | $ | 21,886 | (2) | $ | (38,071 | ) | $ | 312,699 | ||||||||
| (1) | Includes $31.20 billion and $4.74 billion of credit derivative liabilities within level 2 and level 3, respectively, of the fair value hierarchy. These amounts exclude the effects of netting under enforceable netting agreements across other derivative product types. |
| (2) | Level 3 liabilities were 7.0% of Total financial liabilities at fair value. |
| (3) | Represents cash collateral and the impact of netting across the levels of the fair value hierarchy. Netting among positions classified within the same level is included in that level. |
Table of Contents
| Level 3 Unrealized Gains/(Losses) | ||||||||||||||||
| Year Ended | One Month Ended | |||||||||||||||
|
December
|
November
|
November
|
December
|
|||||||||||||
| 2009 | 2008 | 2007 | 2008 | |||||||||||||
| (in millions) | ||||||||||||||||
|
Cash instruments — assets
|
$ | (4,781 | ) | $ | (11,485 | ) | $ | (2,292 | ) | $ | (3,116 | ) | ||||
|
Cash instruments — liabilities
|
474 | (871 | ) | (294 | ) | (78 | ) | |||||||||
|
Net unrealized losses on level 3 cash instruments
|
(4,307 | ) | (12,356 | ) | (2,586 | ) | (3,194 | ) | ||||||||
|
Derivative contracts — net
|
(1,018 | ) | 5,577 | 4,543 | (210 | ) | ||||||||||
|
Other secured financings
|
(812 | ) | 838 | — | (1 | ) | ||||||||||
|
Unsecured
short-term
borrowings
|
(81 | ) | 737 | (666 | ) | (70 | ) | |||||||||
|
Unsecured
long-term
borrowings
|
(291 | ) | 657 | 22 | (127 | ) | ||||||||||
|
Other liabilities and accrued expenses
|
53 | — | — | — | ||||||||||||
|
Total level 3 unrealized gains/(losses)
|
$ | (6,456 | ) | $ | (4,547 | ) | $ | 1,313 | $ | (3,602 | ) | |||||
Table of Contents
| • | A derivative contract with level 1 and/or level 2 inputs is classified as a level 3 financial instrument in its entirety if it has at least one significant level 3 input. | |
| • | If there is one significant level 3 input, the entire gain or loss from adjusting only observable inputs (i.e., level 1 and level 2) is still classified as level 3. | |
| • | Gains or losses that have been reported in level 3 resulting from changes in level 1 or level 2 inputs are frequently offset by gains or losses attributable to instruments classified within level 1 or level 2 or by cash instruments reported within level 3 of the fair value hierarchy. |
Table of Contents
| Level 3 Financial Assets and Financial Liabilities at Fair Value | ||||||||||||||||||||||||
|
Net unrealized
|
||||||||||||||||||||||||
|
gains/(losses)
|
Net
|
|||||||||||||||||||||||
|
relating to
|
purchases,
|
|||||||||||||||||||||||
|
Balance,
|
instruments still
|
issuances
|
Net transfers
|
Balance,
|
||||||||||||||||||||
|
beginning
|
Net realized
|
held at the
|
and
|
in
and/or
out
|
end of
|
|||||||||||||||||||
| of year | gains/(losses) | reporting date | settlements | of level 3 | year | |||||||||||||||||||
| (in millions) | ||||||||||||||||||||||||
|
Year Ended December 2009
|
||||||||||||||||||||||||
|
Mortgage and other
asset-backed
loans and securities:
|
||||||||||||||||||||||||
|
Loans and securities backed by commercial real estate
|
$ | 9,170 | $ | 166 | $ | (1,148 | ) | $ | (3,097 | ) | $ | (471 | ) | $ | 4,620 | |||||||||
|
Loans and securities backed by residential real estate
|
1,927 | 101 | 58 | (158 | ) | (48 | ) | 1,880 | ||||||||||||||||
|
Loan portfolios
|
4,266 | 167 | (327 | ) | (1,195 | ) | (1,547 | ) (4) | 1,364 | |||||||||||||||
|
Bank loans and bridge loans
|
11,169 | 747 | (145 | ) | (2,128 | ) | (83 | ) | 9,560 | |||||||||||||||
|
Corporate debt securities
|
2,734 | 366 | (68 | ) | (624 | ) | (173 | ) | 2,235 | |||||||||||||||
|
State and municipal obligations
|
1,356 | (5 | ) | 13 | (662 | ) | 412 | 1,114 | ||||||||||||||||
|
Other debt obligations
|
3,903 | 173 | (203 | ) | (1,425 | ) | (213 | ) | 2,235 | |||||||||||||||
|
Equities and convertible debentures
|
15,127 | 21 | (2,961 | ) | 662 | (978 | ) (5) | 11,871 | ||||||||||||||||
|
Total cash instruments — assets
|
49,652 | 1,736 | (1) | (4,781 | ) (1) | (8,627 | ) | (3,101 | ) | 34,879 | ||||||||||||||
|
Cash instruments — liabilities
|
(1,727 | ) | 38 | (2) | 474 | (2) | 463 | 180 | (572 | ) | ||||||||||||||
|
Derivative contracts — net
|
3,315 | 759 | (2) | (1,018 | ) (2)(3) | 2,333 | (193 | ) | 5,196 | |||||||||||||||
|
Securities sold under agreements to repurchase, at fair value
|
— | — | — | (394 | ) | — | (394 | ) | ||||||||||||||||
|
Other secured financings
|
(4,039 | ) | 19 | (2) | (812 | ) (2) | 804 | (2,728 | ) (6) | (6,756 | ) | |||||||||||||
|
Unsecured
short-term
borrowings
|
(4,712 | ) | (126 | ) (2) | (81 | ) (2) | (1,419 | ) | 4,028 | (6) | (2,310 | ) | ||||||||||||
|
Unsecured
long-term
borrowings
|
(1,689 | ) | (92 | ) (2) | (291 | ) (2) | 726 | (1,731 | ) (6) | (3,077 | ) | |||||||||||||
|
Other liabilities and accrued expenses
|
— | (22 | ) (2) | 53 | (2) | (991 | ) | (953 | ) (7) | (1,913 | ) | |||||||||||||
| (1) | The aggregate amounts include approximately $(4.69) billion and $1.64 billion reported in “Trading and principal investments” and “Interest income,” respectively, in the consolidated statements of earnings for the year ended December 2009. |
| (2) | Substantially all is reported in “Trading and principal investments” in the consolidated statements of earnings. |
| (3) | Principally resulted from changes in level 2 inputs. |
| (4) | Principally reflects the deconsolidation of certain loan portfolios for which the firm did not bear economic exposure. |
| (5) | Principally reflects transfers to level 2 within the fair value hierarchy of certain private equity investments, reflecting improved transparency of prices for these financial instruments, primarily as a result of market transactions. |
| (6) | Principally reflects transfers from level 3 unsecured short-term borrowings to level 3 other secured financings and level 3 unsecured long-term borrowings related to changes in the terms of certain notes. |
| (7) | Principally reflects transfers from level 2 within the fair value hierarchy of certain insurance contracts, reflecting reduced transparency of mortality curve inputs used to value these instruments as a result of less observable trading activity. |
Table of Contents
| Level 3 Financial Assets and Financial Liabilities at Fair Value | ||||||||||||||||||||||||
|
Net unrealized
|
||||||||||||||||||||||||
|
gains/(losses)
|
Net
|
|||||||||||||||||||||||
|
relating to
|
purchases,
|
|||||||||||||||||||||||
|
Balance,
|
instruments still
|
issuances
|
Net transfers
|
Balance,
|
||||||||||||||||||||
|
beginning
|
Net realized
|
held at the
|
and
|
in
and/or
out
|
end of
|
|||||||||||||||||||
| of year | gains/(losses) | reporting date | settlements | of level 3 | year | |||||||||||||||||||
| (in millions) | ||||||||||||||||||||||||
|
Year Ended November 2008
|
||||||||||||||||||||||||
|
Cash instruments — assets
|
$ | 53,451 | $ | 1,930 | (1) | $ | (11,485 | ) (1) | $ | 3,955 | $ | 3,215 | (4) | $ | 51,066 | |||||||||
|
Cash instruments — liabilities
|
(554 | ) | 28 | (2) | (871 | ) (2) | 55 | (37 | ) | (1,379 | ) | |||||||||||||
|
Derivative contracts — net
|
2,056 | 267 | (2) | 5,577 | (2)(3) | (1,813 | ) | (931 | ) (5) | 5,156 | ||||||||||||||
|
Other secured financings
|
— | 87 | (2) | 838 | (2) | 416 | (5,161 | ) (6) | (3,820 | ) | ||||||||||||||
|
Unsecured
short-term
borrowings
|
(4,271 | ) | 354 | (2) | 737 | (2) | (1,353 | ) | (626 | ) | (5,159 | ) | ||||||||||||
|
Unsecured
long-term
borrowings
|
(767 | ) | (20 | ) (2) | 657 | (2) | (1,314 | ) | (116 | ) | (1,560 | ) | ||||||||||||
| (1) | The aggregate amounts include approximately $(11.54) billion and $1.98 billion reported in “Trading and principal investments” and “Interest income,” respectively, in the consolidated statements of earnings for the year ended November 2008. |
| (2) | Substantially all is reported in “Trading and principal investments” in the consolidated statements of earnings. |
| (3) | Principally resulted from changes in level 2 inputs. |
| (4) | Principally reflects transfers from level 2 within the fair value hierarchy of loans and securities backed by commercial real estate, reflecting reduced price transparency for these financial instruments. |
| (5) | Principally reflects transfers to level 2 within the fair value hierarchy of mortgage-related derivative assets, as recent trading activity provided improved transparency of correlation inputs. This decrease was partially offset by transfers from level 2 within the fair value hierarchy of credit and equity-linked derivatives due to reduced price transparency. |
| (6) | Consists of transfers from level 2 within the fair value hierarchy. |
| Level 3 Financial Assets and Financial Liabilities at Fair Value | ||||||||||||||||||||||||
|
Net unrealized
|
Net
|
|||||||||||||||||||||||
|
losses relating to
|
purchases,
|
|||||||||||||||||||||||
|
Balance,
|
instruments still
|
issuances
|
Net transfers
|
Balance,
|
||||||||||||||||||||
|
beginning
|
Net realized
|
held at the
|
and
|
in
and/or
out
|
end of
|
|||||||||||||||||||
| of period | gains/(losses) | reporting date | settlements | of level 3 | period | |||||||||||||||||||
| (in millions) | ||||||||||||||||||||||||
|
One Month Ended December 2008
|
||||||||||||||||||||||||
|
Cash instruments — assets
|
$ | 51,066 | $ | 157 | (1) | $ | (3,116 | ) (1) | $ | 921 | $ | 624 | (4) | $ | 49,652 | |||||||||
|
Cash instruments — liabilities
|
(1,379 | ) | 3 | (2) | (78 | ) (2) | (159 | ) | (114 | ) | (1,727 | ) | ||||||||||||
|
Derivative contracts — net
|
5,156 | 15 | (2) | (210 | ) (2)(3) | (699 | ) | (947 | ) (5) | 3,315 | ||||||||||||||
|
Other secured financings
|
(3,820 | ) | (2 | ) (2) | (1 | ) (2) | (51 | ) | (165 | ) | (4,039 | ) | ||||||||||||
|
Unsecured
short-term
borrowings
|
(5,159 | ) | 27 | (2) | (70 | ) (2) | 482 | 8 | (4,712 | ) | ||||||||||||||
|
Unsecured
long-term
borrowings
|
(1,560 | ) | (1 | ) (2) | (127 | ) (2) | 42 | (43 | ) | (1,689 | ) | |||||||||||||
| (1) | The aggregate amounts include approximately $(3.18) billion and $221 million reported in “Trading and principal investments” and “Interest income,” respectively, in the consolidated statements of earnings for the one month ended December 2008. |
| (2) | Substantially all is reported in “Trading and principal investments” in the consolidated statements of earnings. |
| (3) | Principally resulted from changes in level 2 inputs. |
| (4) | Principally reflects transfers from level 2 within the fair value hierarchy of certain corporate debt securities and other debt obligations and loans and securities backed by commercial real estate, reflecting reduced price transparency for these financial instruments. |
| (5) | Principally reflects transfers to level 2 within the fair value hierarchy of credit-related derivative assets, due to improved transparency of correlation inputs used to value these financial instruments. |
Table of Contents
| Year Ended | One Month Ended | |||||||||||||||
|
December
|
November
|
November
|
December
|
|||||||||||||
| 2009 | 2008 | 2007 | 2008 | |||||||||||||
| (in millions) | ||||||||||||||||
|
Net gains/(losses) including hedges
|
$ | (1,103 | ) | $ | 1,127 | $ | 203 | $ | (113 | ) | ||||||
|
Net gains/(losses) excluding hedges
|
(1,116 | ) | 1,196 | 216 | (114 | ) | ||||||||||
Table of Contents
| Year Ended | One Month Ended | |||||||||||||||
|
December
|
November
|
November
|
December
|
|||||||||||||
| 2009 | 2008 | 2007 | 2008 | |||||||||||||
| (in millions) | ||||||||||||||||
|
Unsecured
long-term
borrowings
(1)
|
$ | (884 | ) | $ | 915 | $ | 202 | $ | (104 | ) | ||||||
|
Other secured
financings
(2)
|
(822 | ) | 894 | (293 | ) | (2 | ) | |||||||||
|
Unsecured
short-term
borrowings
(3)
|
(182 | ) | 266 | 6 | (9 | ) | ||||||||||
|
Receivables from customers and
counterparties
(4)
|
255 | (68 | ) | — | (41 | ) | ||||||||||
|
Other liabilities and accrued
expenses
(5)
|
(214 | ) | 131 | — | 7 | |||||||||||
|
Other
(6)
|
79 | (83 | ) | 18 | (60 | ) | ||||||||||
|
Total
(7)
|
$ | (1,768 | ) | $ | 2,055 | $ | (67 | ) | $ | (209 | ) | |||||
| (1) | Excludes gains/(losses) of $(4.15) billion, $2.42 billion, $(2.18) billion and $(623) million for the years ended December 2009, November 2008 and November 2007 and one month ended December 2008, respectively, related to the embedded derivative component of hybrid financial instruments. Such gains and losses would have been recognized even if the firm had not elected to account for the entire hybrid instrument at fair value under the fair value option. | |
| (2) | Excludes gains of $48 million, $1.29 billion and $2.19 billion for the years ended December 2009, November 2008 and November 2007, respectively, related to financings recorded as a result of transactions that were accounted for as secured financings rather than sales. Changes in the fair value of these secured financings are offset by changes in the fair value of the related financial instruments included in “Trading assets, at fair value” in the consolidated statements of financial condition. Such gains/(losses) were not material for the one month ended December 2008. | |
| (3) | Excludes gains/(losses) of $(3.15) billion, $6.37 billion, $(1.07) billion and $92 million for the years ended December 2009, November 2008 and November 2007 and one month ended December 2008, respectively, related to the embedded derivative component of hybrid financial instruments. Such gains and losses would have been recognized even if the firm had not elected to account for the entire hybrid instrument at fair value under the fair value option. | |
| (4) | Primarily consists of gains/(losses) on certain reinsurance contracts. | |
| (5) | Primarily consists of gains/(losses) on certain insurance and reinsurance contracts. | |
| (6) | Primarily consists of gains/(losses) on resale and repurchase agreements, and securities borrowed and loaned within Trading and Principal Investments. | |
| (7) | Reported in “Trading and principal investments” in the consolidated statements of earnings. The amounts exclude contractual interest, which is included in “Interest income” and “Interest expense” in the consolidated statements of earnings, for all instruments other than hybrid financial instruments. |
Table of Contents
Table of Contents
| As of December 2009 | ||||||||
|
Fair Value of
|
Unfunded
|
|||||||
| Investments | Commitments | |||||||
| (in millions) | ||||||||
|
Private equity
funds
(1)
|
$ | 8,229 | $ | 5,722 | ||||
|
Private debt
funds
(2)
|
3,628 | 4,048 | ||||||
|
Hedge
funds
(3)
|
3,133 | — | ||||||
|
Real estate
funds
(4)
|
939 | 2,398 | ||||||
|
Total
|
$ | 15,929 | $ | 12,168 | ||||
| (1) | These funds primarily invest in a broad range of industries worldwide in a variety of situations, including leveraged buy-outs, recapitalizations, and growth investments. | |
| (2) | These funds generally invest in fixed income instruments and an associated equity component and are focused on providing private high-yield capital for mid to large-sized leveraged and management buyout transactions, recapitalizations, financings, refinancings, acquisitions and restructurings for private equity firms, private family companies and corporate issuers. | |
| (3) | These funds are primarily multi-disciplinary hedge funds that employ a fundamental bottom-up investment approach across various asset classes and strategies including long/short equity, credit, convertibles, risk arbitrage, special situations and capital structure arbitrage. | |
| (4) | These funds invest globally, primarily in real estate companies, loan portfolios, debt recapitalizations and direct property. |
Table of Contents
Table of Contents
Table of Contents
| As of December 2009 | ||||||||||||
|
Number
|
||||||||||||
|
Derivative
|
Derivative
|
of
|
||||||||||
| Assets | Liabilities | Contracts | ||||||||||
| (in millions, except number of contracts) | ||||||||||||
|
Derivative contracts for trading activities
|
||||||||||||
|
Interest rates
|
$ | 458,614 | (4) | $ | 407,125 | (4) | 270,707 | |||||
|
Credit
|
164,669 | 134,810 | 443,450 | |||||||||
|
Currencies
|
77,223 | 62,413 | 171,760 | |||||||||
|
Commodities
|
47,234 | 48,163 | 73,010 | |||||||||
|
Equities
|
67,559 | 53,207 | 237,625 | |||||||||
|
Subtotal
|
$ | 815,299 | $ | 705,718 | 1,196,552 | |||||||
|
Derivative contracts accounted for as
hedges
(1)
|
||||||||||||
|
Interest rates
|
$ | 19,563 | (5) | $ | 1 | (5) | 806 | |||||
|
Currencies
|
8 | (6) | 47 | (6) | 58 | |||||||
|
Subtotal
|
$ | 19,571 | $ | 48 | 864 | |||||||
|
Gross fair value of derivative contracts
|
$ | 834,870 | $ | 705,766 | 1,197,416 | |||||||
|
Counterparty
netting
(2)
|
(635,014 | ) | (635,014 | ) | ||||||||
|
Cash collateral
netting
(3)
|
(124,603 | ) | (14,743 | ) | ||||||||
|
Fair value included in trading assets, at fair value
|
$ | 75,253 | ||||||||||
|
Fair value included in trading liabilities, at fair value
|
$ | 56,009 | ||||||||||
| (1) | As of November 2008, the gross fair value of derivative contracts accounted for as hedges consisted of $20.40 billion in assets and $128 million in liabilities. | |
| (2) | Represents the netting of receivable balances with payable balances for the same counterparty pursuant to enforceable netting agreements. | |
| (3) | Represents the netting of cash collateral received and posted on a counterparty basis pursuant to credit support agreements. | |
| (4) | Presented after giving effect to $412.08 billion of derivative assets and $395.57 billion of derivative liabilities settled with clearing organizations. | |
| (5) | For the year ended December 2009 and one month ended December 2008, the gain/(loss) recognized on interest rate derivative contracts accounted for as hedges was $(10.07) billion and $3.59 billion, respectively, and the related gain/(loss) recognized on the hedged borrowings and bank deposits was $9.95 billion and $(3.53) billion, respectively. These gains and losses are included in “Interest expense” in the consolidated statements of earnings. For the year ended December 2009, the gain/(loss) recognized on these derivative contracts included losses of $1.23 billion, which were excluded from the assessment of hedge effectiveness. Such excluded gains/(losses) were not material for the one month ended December 2008. | |
| (6) | For the year ended December 2009 and one month ended December 2008, the loss on currency derivative contracts accounted for as hedges was $495 million and $212 million, respectively. Such amounts are included in “Currency translation adjustment, net of tax” in the consolidated statements of comprehensive income. The gain/(loss) related to ineffectiveness and the gain/(loss) reclassified to earnings from accumulated other comprehensive income were not material for the year ended December 2009 or the one month ended December 2008. |
Table of Contents
|
Year Ended
|
One Month Ended
|
|||||||
| December 2009 | December 2008 | |||||||
| (in millions) | ||||||||
|
Interest rates
|
$ | 6,670 | $ | 2,226 | ||||
|
Credit
|
6,225 | (1,437 | ) | |||||
|
Currencies
(1)
|
(682 | ) | (2,256 | ) | ||||
|
Equities
|
6,632 | 130 | ||||||
|
Commodities and other
|
5,341 | 887 | ||||||
|
Total
|
$ | 24,186 | $ | (450 | ) | |||
| (1) | Includes gains/(losses) on currency contracts used to economically hedge positions included in other product types in this table. |
Table of Contents
| • | Credit default swaps: Single-name credit default swaps protect the buyer against the loss of principal on one or more bonds, loans or mortgages (reference obligations) in the event of a default by the issuer (reference entity). The buyer of protection pays an initial or periodic premium to the seller and receives credit default protection for the period of the contract. If there is no credit default event, as defined by the specific derivative contract, then the seller of protection makes no payments to the buyer of protection. However, if a credit default event occurs, the seller of protection will be required to make a payment to the buyer of protection. Typical credit default events requiring payment include bankruptcy of the reference credit entity, failure to pay the principal or interest, and restructuring of the relevant obligations of the reference entity. | |
| • | Credit indices, baskets and tranches: Credit derivatives may reference a basket of single-name credit default swaps or a broad-based index. Typically, in the event of a default of one of the underlying reference obligations, the protection seller will pay to the protection buyer a pro-rata portion of a transaction’s total notional amount relating to the underlying defaulted reference obligation. In tranched transactions, the credit risk of a basket or index is separated into various portions each having different levels of subordination. The most junior tranches cover initial defaults, and once losses exceed the notional amount of these tranches, the excess is covered by the next most senior tranche in the capital structure. | |
| • | Total return swaps: A total return swap transfers the risks relating to economic performance of a reference obligation from the protection buyer to the protection seller. Typically, the protection buyer receives from the protection seller a floating rate of interest and protection against any reduction in fair value of the reference obligation, and in return the protection seller receives the cash flows associated with the reference obligation, plus any increase in the fair value of the reference obligation. | |
| • | Credit options: In a credit option, the option writer assumes the obligation to purchase or sell a reference obligation at a specified price or credit spread. The option purchaser buys the right to sell the reference obligation to, or purchase it from, the option writer. The payments on credit options depend either on a particular credit spread or the price of the reference obligation. |
Table of Contents
|
Maximum
|
||||||||||||||||||||||||||||||||||||
|
Payout/Notional
|
||||||||||||||||||||||||||||||||||||
|
Maximum Payout/Notional Amount
|
Amount of Purchased
|
Fair Value of
|
||||||||||||||||||||||||||||||||||
| of Written Credit Derivatives by Tenor (1) | Credit Derivatives | Written Credit Derivatives | ||||||||||||||||||||||||||||||||||
|
Offsetting
|
Other
|
|||||||||||||||||||||||||||||||||||
|
5 Years
|
Purchased
|
Purchased
|
||||||||||||||||||||||||||||||||||
|
0 - 12
|
1 - 5
|
or
|
Credit
|
Credit
|
Net Asset/
|
|||||||||||||||||||||||||||||||
| Months | Years | Greater | Total | Derivatives (2) | Derivatives (3) | Asset | Liability | (Liability) | ||||||||||||||||||||||||||||
| ($ in millions) | ||||||||||||||||||||||||||||||||||||
|
As of December 2009
|
||||||||||||||||||||||||||||||||||||
|
Credit spread on
underlying (basis points) (4) |
||||||||||||||||||||||||||||||||||||
|
0-250
|
$ | 283,353 | $ | 1,342,649 | $ | 414,809 | $ | 2,040,811 | $ | 1,884,864 | $ | 299,329 | $ | 39,740 | $ | 13,441 | $ | 26,299 | ||||||||||||||||||
|
251-500
|
15,151 | 142,732 | 39,337 | 197,220 | 182,583 | 27,194 | 5,008 | 6,816 | (1,808 | ) | ||||||||||||||||||||||||||
|
501-1,000
|
10,364 | 101,621 | 34,194 | 146,179 | 141,317 | 5,673 | 2,841 | 12,448 | (9,607 | ) | ||||||||||||||||||||||||||
|
Greater than 1,000
|
20,262 | 107,768 | 31,208 | 159,238 | 117,914 | 48,699 | 1,524 | 60,279 | (58,755 | ) | ||||||||||||||||||||||||||
|
Total
|
$ | 329,130 | $ | 1,694,770 | $ | 519,548 | $ | 2,543,448 | $ | 2,326,678 | $ | 380,895 | $ | 49,113 | $ | 92,984 | $ | (43,871 | ) (5)(6) | |||||||||||||||||
|
As of November 2008
|
||||||||||||||||||||||||||||||||||||
|
Credit spread on
underlying (basis points) (4) |
||||||||||||||||||||||||||||||||||||
|
0-250
|
$ | 108,555 | $ | 1,093,651 | $ | 623,944 | $ | 1,826,150 | $ | 1,632,681 | $ | 347,573 | $ | 7,133 | $ | 84,969 | $ | (77,836 | ) | |||||||||||||||||
|
251-500
|
51,015 | 551,971 | 186,084 | 789,070 | 784,149 | 26,316 | 1,403 | 95,681 | (94,278 | ) | ||||||||||||||||||||||||||
|
501-1,000
|
34,756 | 404,661 | 148,052 | 587,469 | 538,251 | 67,958 | 680 | 75,759 | (75,079 | ) | ||||||||||||||||||||||||||
|
Greater than 1,000
|
41,496 | 373,211 | 161,475 | 576,182 | 533,816 | 103,362 | 100 | 222,446 | (222,346 | ) | ||||||||||||||||||||||||||
|
Total
|
$ | 235,822 | $ | 2,423,494 | $ | 1,119,555 | $ | 3,778,871 | $ | 3,488,897 | $ | 545,209 | $ | 9,316 | $ | 478,855 | $ | (469,539 | ) (5) | |||||||||||||||||
| (1) | Tenor is based on expected duration for mortgage-related credit derivatives and on remaining contractual maturity for other credit derivatives. |
| (2) | Offsetting purchased credit derivatives represent the notional amount of purchased credit derivatives to the extent they economically hedge written credit derivatives with identical underlyings. |
| (3) | Comprised of purchased protection in excess of the amount of written protection on identical underlyings and purchased protection on other underlyings on which the firm has not written protection. |
| (4) | Credit spread on the underlying, together with the tenor of the contract, are indicators of payment/performance risk. For example, the firm is least likely to pay or otherwise be required to perform where the credit spread on the underlying is “0-250” basis points and the tenor is “0-12 Months.” The likelihood of payment or performance is generally greater as the credit spread on the underlying and tenor increase. |
| (5) | These net liabilities differ from the carrying values related to credit derivatives in the firm’s consolidated statements of financial condition because they exclude the effects of both netting under enforceable netting agreements and netting of cash collateral paid pursuant to credit support agreements. Including the effects of netting receivable balances with payable balances for the same counterparty (across written and purchased credit derivatives) pursuant to enforceable netting agreements, the firm’s consolidated statements of financial condition as of December 2009 and November 2008 included a net asset related to credit derivatives of $39.74 billion and $71.78 billion, respectively, and a net liability related to credit derivatives of $9.75 billion and $33.48 billion, respectively. These net amounts exclude the netting of cash collateral paid pursuant to credit support agreements. |
| (6) | The decrease in this net liability from November 2008 to December 2009 primarily reflected tightening credit spreads. |
Table of Contents
Table of Contents
| As of | ||||||||
|
December
|
November
|
|||||||
| 2009 | 2008 | |||||||
| (in millions) | ||||||||
|
Other secured financings
(short-term)
(1)(2)
|
$ | 12,931 | $ | 21,225 | ||||
|
Other secured financings
(long-term):
|
||||||||
|
2010
|
— | 2,157 | ||||||
|
2011
|
3,832 | 4,578 | ||||||
|
2012
|
1,726 | 3,040 | ||||||
|
2013
|
1,518 | 1,377 | ||||||
|
2014
|
1,617 | 1,512 | ||||||
|
2015-thereafter
|
2,510 | 4,794 | ||||||
|
Total other secured financings
(long-term)
(3)(4)
|
11,203 | 17,458 | ||||||
|
Total other secured
financings
(5)(6)
|
$ | 24,134 | $ | 38,683 | ||||
| (1) | As of December 2009 and November 2008, consists of U.S. dollar-denominated financings of $6.47 billion and $12.53 billion, respectively, with a weighted average interest rate of 3.44% and 2.98%, respectively, and non-U.S. dollar-denominated financings of $6.46 billion and $8.70 billion, respectively, with a weighted average interest rate of 1.57% and 0.95%, respectively, after giving effect to hedging activities. The weighted average interest rates as of December 2009 and November 2008 excluded financial instruments accounted for at fair value under the fair value option. | |
| (2) | Includes other secured financings maturing within one year of the financial statement date and other secured financings that are redeemable within one year of the financial statement date at the option of the holder. | |
| (3) | As of December 2009 and November 2008, consists of U.S. dollar-denominated financings of $7.28 billion and $9.55 billion, respectively, with a weighted average interest rate of 1.83% and 4.62%, respectively, and non-U.S. dollar-denominated financings of $3.92 billion and $7.91 billion, respectively, with a weighted average interest rate of 2.30% and 4.39%, respectively, after giving effect to hedging activities. The weighted average interest rates as of December 2009 and November 2008 excluded financial instruments accounted for at fair value under the fair value option. | |
| (4) | Secured long-term financings that are repayable prior to maturity at the option of the firm are reflected at their contractual maturity dates. Secured long-term financings that are redeemable prior to maturity at the option of the holder are reflected at the dates such options become exercisable. | |
| (5) | As of December 2009 and November 2008, $18.25 billion and $31.54 billion, respectively, of these financings were collateralized by trading assets and $5.88 billion and $7.14 billion, respectively, by other assets (primarily real estate and cash). Other secured financings include $10.63 billion and $13.74 billion of nonrecourse obligations as of December 2009 and November 2008, respectively. | |
| (6) | As of December 2009, other secured financings includes $9.51 billion related to transfers of financial assets accounted for as financings rather than sales. Such financings were collateralized by financial assets included in “Trading assets, at fair value” in the consolidated statement of financial condition of $9.78 billion as of December 2009. |
| Note 4. | Securitization Activities and Variable Interest Entities |
Table of Contents
| As of December 2009 (1) | ||||||||||||
|
Outstanding
|
Fair Value of
|
Fair Value of
|
||||||||||
|
Principal
|
Retained
|
Purchased
|
||||||||||
| Amount | Interests | Interests (2) | ||||||||||
| (in millions) | ||||||||||||
|
Residential
mortgage-backed
(3)
|
$ | 59,410 | $ | 3,956 | $ | 17 | ||||||
|
Commercial
mortgage-backed
|
11,643 | 56 | 96 | |||||||||
|
Other
asset-backed
(4)
|
17,768 | 93 | 54 | |||||||||
|
Total
|
$ | 88,821 | $ | 4,105 | $ | 167 | ||||||
| (1) | As of December 2009, fair value of other continuing involvement excludes $1.04 billion of purchased interests in securitization entities where the firm’s involvement was related to secondary market-making activities. Continuing involvement also excludes derivative contracts that are used by securitization entities to manage credit, interest rate or foreign exchange risk. See Note 3 for information on the firm’s derivative contracts. | |
| (2) | Comprised of senior and subordinated interests purchased in connection with secondary market-making activities in VIEs and QSPEs in which the firm also holds retained interests. In addition to these interests, the firm had other continuing involvement in the form of derivative transactions and guarantees with certain nonconsolidated VIEs for which the carrying value was a net liability of $87 million as of December 2009. The notional amounts of these transactions are included in maximum exposure to loss in the nonconsolidated VIE table below. | |
| (3) | Primarily consists of outstanding principal and retained interests related to government agency QSPEs. | |
| (4) | Primarily consists of CDOs backed by corporate and mortgage obligations and CLOs. Outstanding principal amount and fair value of retained interests include $16.22 billion and $72 million, respectively, as of December 2009 related to VIEs which are also included in the nonconsolidated VIE table below. |
Table of Contents
| As of December 2009 | As of November 2008 | |||||||||||||||
| Type of Retained Interests (1) | Type of Retained Interests (1) | |||||||||||||||
|
Other
|
Other
|
|||||||||||||||
|
Mortgage-
|
Asset-
|
Mortgage-
|
Asset-
|
|||||||||||||
| Backed | Backed (2) | Backed | Backed | |||||||||||||
| ($ in millions) | ||||||||||||||||
|
Fair value of retained interests
|
$ | 4,012 | $ | 93 | $ | 1,415 | $ | 367 | (5) | |||||||
|
Weighted average life (years)
|
4.4 | 4.4 | 6.0 | 5.1 | ||||||||||||
|
Constant prepayment
rate
(3)
|
23.5 | % | N.M. | 15.5 | % | 4.5 | % | |||||||||
|
Impact of 10% adverse
change
(3)
|
$ | (44 | ) | N.M. | $ | (14 | ) | $ | (6 | ) | ||||||
|
Impact of 20% adverse
change
(3)
|
(92 | ) | N.M. | (27 | ) | (12 | ) | |||||||||
|
Discount
rate
(4)
|
8.4 | % | N.M. | 21.1 | % | 29.2 | % | |||||||||
|
Impact of 10% adverse change
|
$ | (76 | ) | N.M. | $ | (46 | ) | $ | (25 | ) | ||||||
|
Impact of 20% adverse change
|
(147 | ) | N.M. | (89 | ) | (45 | ) | |||||||||
| (1) | Includes $4.03 billion and $1.53 billion as of December 2009 and November 2008, respectively, held in QSPEs. | |
| (2) | Due to the nature and current fair value of certain of these retained interests, the weighted average assumptions for constant prepayment and discount rates and the related sensitivity to adverse changes are not meaningful as of December 2009. The firm’s maximum exposure to adverse changes in the value of these interests is the firm’s carrying value of $93 million. | |
| (3) | Constant prepayment rate is included only for positions for which constant prepayment rate is a key assumption in the determination of fair value. | |
| (4) | The majority of the firm’s mortgage-backed retained interests are U.S. government agency-issued collateralized mortgage obligations, for which there is no anticipated credit loss. For the remainder of the firm’s retained interests, the expected credit loss assumptions are reflected within the discount rate. | |
| (5) | Includes $192 million of retained interests related to transfers of securitized assets that were accounted for as secured financings rather than sales. |
Table of Contents
| Year Ended | ||||||||
|
December
|
November
|
|||||||
| 2009 | 2008 | |||||||
| (in millions) | ||||||||
|
Balance, beginning of period
|
$ | 153 | $ | 93 | ||||
|
Purchases
|
— | 272 | (3) | |||||
|
Servicing assets that resulted from transfers of financial assets
|
1 | 3 | ||||||
|
Changes in fair value due to changes in valuation inputs and
assumptions
|
(66 | ) | (221 | ) | ||||
|
Balance, end of
period
(1)
|
$ | 88 | $ | 147 | ||||
|
Contractually specified servicing
fees
(2)
|
$ | 320 | $ | 315 | ||||
| (1) | As of December 2009 and November 2008, the fair value was estimated using a weighted average discount rate of approximately 16% and 16%, respectively, and a weighted average prepayment rate of approximately 20% and 27%, respectively. | |
| (2) | Contractually specified servicing fees for the one month ended December 2008 were $25 million. | |
| (3) | Primarily related to the acquisition of Litton Loan Servicing LP. |
Table of Contents
| As of December 2009 | ||||||||||||||||||||||||||||||||||
|
Carrying Value of
|
||||||||||||||||||||||||||||||||||
|
the Firm’s
|
||||||||||||||||||||||||||||||||||
| Variable Interests | Maximum Exposure to Loss in Nonconsolidated VIEs (1) | |||||||||||||||||||||||||||||||||
|
Purchased
|
Commitments
|
|||||||||||||||||||||||||||||||||
|
Assets
|
and Retained
|
and
|
Loans and
|
|||||||||||||||||||||||||||||||
| in VIE | Assets | Liabilities | Interests | Guarantees | Derivatives | Investments | Total | |||||||||||||||||||||||||||
| (in millions) | ||||||||||||||||||||||||||||||||||
|
Mortgage
CDOs
(2)
|
$ | 9,114 | $ | 182 | $ | 10 | $ | 135 | $ | — | $ | 4,111 | (7) | $ | — | $ | 4,246 | |||||||||||||||||
|
Corporate CDOs and
CLOs
(2)
|
32,490 | 834 | 400 | 259 | 3 | 7,577 | (8) | — | 7,839 | |||||||||||||||||||||||||
|
Real estate,
credit-related
and other
investing
(3)
|
22,618 | 2,386 | 204 | — | 397 | — | 2,425 | 2,822 | ||||||||||||||||||||||||||
|
Other
asset-backed
(2)
|
497 | 16 | 12 | — | — | 497 | — | 497 | ||||||||||||||||||||||||||
|
Power-related
(4)
|
592 | 224 | 3 | — | 37 | — | 224 | 261 | ||||||||||||||||||||||||||
|
Principal-protected
notes
(5)
|
2,209 | 12 | 1,357 | — | — | 2,512 | — | 2,512 | ||||||||||||||||||||||||||
|
Total
|
$ | 67,520 | $ | 3,654 | $ | 1,986 | $ | 394 | $ | 437 | (6) | $ | 14,697 | (6) | $ | 2,649 | $ | 18,177 | ||||||||||||||||
| As of November 2008 | |||||||||||||||||||||||||||||||||
| Maximum Exposure to Loss in Nonconsolidated VIEs (1) | |||||||||||||||||||||||||||||||||
|
Purchased
|
Commitments
|
||||||||||||||||||||||||||||||||
|
Assets
|
and Retained
|
and
|
Loans and
|
||||||||||||||||||||||||||||||
| in VIE | Interests | Guarantees | Derivatives | Investments | Total | ||||||||||||||||||||||||||||
| (in millions) | |||||||||||||||||||||||||||||||||
|
Mortgage CDOs
|
$ | 13,061 | $ | 242 | $ | — | $ | 5,616 | (7) | $ | — | $ | 5,858 | ||||||||||||||||||||
|
Corporate CDOs and CLOs
|
8,584 | 161 | — | 918 | (8) | — | 1,079 | ||||||||||||||||||||||||||
|
Real estate,
credit-related
and other investing (3) |
26,898 | — | 143 | — | 3,223 | 3,366 | |||||||||||||||||||||||||||
|
Municipal bond securitizations
|
111 | — | 111 | — | — | 111 | |||||||||||||||||||||||||||
|
Other
asset-backed
|
4,355 | — | — | 1,084 | — | 1,084 | |||||||||||||||||||||||||||
|
Power-related
|
844 | — | 37 | — | 213 | 250 | |||||||||||||||||||||||||||
|
Principal-protected
notes
(5)
|
4,516 | — | — | 4,353 | — | 4,353 | |||||||||||||||||||||||||||
|
Total
|
$ | 58,369 | $ | 403 | $ | 291 | $ | 11,971 | $ | 3,436 | $ | 16,101 | |||||||||||||||||||||
Table of Contents
| (1) | Such amounts do not represent the anticipated losses in connection with these transactions because they exclude the effect of offsetting financial instruments that are held to mitigate these risks. |
| (2) | These VIEs are generally financed through the issuance of debt instruments collateralized by assets held by the VIE. Substantially all assets and liabilities held by the firm related to these VIEs are included in “Trading assets, at fair value” and “Trading liabilities, at fair value,” respectively, in the consolidated statement of financial condition. |
| (3) | The firm obtains interests in these VIEs in connection with making investments in real estate, distressed loans and other types of debt, mezzanine instruments and equities. These VIEs are generally financed through the issuance of debt and equity instruments which are either collateralized by or indexed to assets held by the VIE. Substantially all assets and liabilities held by the firm related to these VIEs are included in “Trading assets, at fair value” and “Other assets,” and “Other liabilities and accrued expenses,” respectively, in the consolidated statement of financial condition. |
| (4) | Assets and liabilities held by the firm related to these VIEs are included in “Other assets” and “Other liabilities and accrued expenses,” respectively, in the consolidated statement of financial condition. |
| (5) | Consists of out-of-the-money written put options that provide principal protection to clients invested in various fund products, with risk to the firm mitigated through portfolio rebalancing. Assets related to these VIEs are included in “Trading assets, at fair value” and liabilities related to these VIEs are included in “Other secured financings,” “Unsecured short-term borrowings, including the current portion of unsecured long-term borrowings” or “Unsecured long-term borrowings” in the consolidated statement of financial condition. Assets in VIE, carrying value of liabilities and maximum exposure to loss exclude $3.97 billion as of December 2009, associated with guarantees related to the firm’s performance under borrowings from the VIE, which are recorded as liabilities in the consolidated statement of financial condition. Substantially all of the liabilities included in the table above relate to additional borrowings from the VIE associated with principal protected notes guaranteed by the firm. |
| (6) | The aggregate amounts include $4.66 billion as of December 2009, related to guarantees and derivative transactions with VIEs to which the firm transferred assets. |
| (7) | Primarily consists of written protection on investment-grade, short-term collateral held by VIEs that have issued CDOs. |
| (8) | Primarily consists of total return swaps on CDOs and CLOs. The firm has generally transferred the risks related to the underlying securities through derivatives with non-VIEs. |
Table of Contents
| As of | ||||||||||||
| December 2009 | November 2008 | |||||||||||
|
VIE
|
VIE
|
VIE
|
||||||||||
| Assets (1) | Liabilities (1) | Assets (1) | ||||||||||
| (in millions) | ||||||||||||
|
Real estate,
credit-related
and other investing
|
$ | 942 | $ | 680 | (2) | $ | 1,560 | |||||
|
Municipal bond securitizations
|
679 | 782 | (3) | 985 | ||||||||
|
CDOs,
mortgage-backed
and other
asset-backed
|
639 | 583 | (4) | 32 | ||||||||
|
Foreign exchange and commodities
|
227 | 179 | (5) | 652 | ||||||||
|
Principal-protected notes
|
214 | 214 | (6) | 215 | ||||||||
|
Total
|
$ | 2,701 | $ | 2,438 | $ | 3,444 | ||||||
| (1) | Consolidated VIE assets and liabilities are presented after intercompany eliminations and include assets financed on a nonrecourse basis. Substantially all VIE assets are included in “Trading assets, at fair value” and “Other assets” in the consolidated statements of financial condition. | |
| (2) | These VIE liabilities are generally collateralized by the related VIE assets and included in “Other secured financings” and “Other liabilities and accrued expenses” in the consolidated statement of financial condition. These VIE liabilities generally do not provide for recourse to the general credit of the firm. | |
| (3) | These VIE liabilities, which are partially collateralized by the related VIE assets, are included in “Other secured financings” in the consolidated statement of financial condition. | |
| (4) | These VIE liabilities are primarily included in “Securities sold under agreements to repurchase, at fair value” and “Other secured financings” in the consolidated statement of financial condition and generally do not provide for recourse to the general credit of the firm. | |
| (5) | These VIE liabilities are primarily included in “Trading liabilities, at fair value” in the consolidated statement of financial condition. | |
| (6) | These VIE liabilities are included in “Unsecured short-term borrowings, including the current portion of unsecured long-term borrowings” in the consolidated statement of financial condition. |
Table of Contents
| Note 5. | Deposits |
| As of | ||||||||
|
December
|
November
|
|||||||
| 2009 | 2008 | |||||||
| (in millions) | ||||||||
|
U.S. offices
(1)
|
$ | 32,797 | $ | 23,018 | ||||
|
Non-U.S. offices
(2)
|
6,621 | 4,625 | ||||||
|
Total
|
$ | 39,418 | $ | 27,643 | ||||
| (1) | Substantially all U.S. deposits were interest-bearing and were held at GS Bank USA. | |
| (2) | Substantially all non-U.S. deposits were interest-bearing and were held at Goldman Sachs Bank (Europe) PLC (GS Bank Europe). |
| As of December 2009 | ||||||||||||
| U.S. | Non-U.S. | Total | ||||||||||
| (in millions) | ||||||||||||
|
2010
|
$ | 1,777 | $ | 737 | $ | 2,514 | ||||||
|
2011
|
1,603 | — | 1,603 | |||||||||
|
2012
|
871 | — | 871 | |||||||||
|
2013
|
1,720 | — | 1,720 | |||||||||
|
2014
|
531 | — | 531 | |||||||||
|
2015-thereafter
|
2,058 | — | 2,058 | |||||||||
|
Total
|
$ | 8,560 | (1) | $ | 737 | (2) | $ | 9,297 | ||||
| (1) | Includes $242 million greater than $100,000, of which $111 million matures within three months, $58 million matures within three to six months, $32 million matures within six to twelve months, and $41 million matures after twelve months. | |
| (2) | Substantially all were greater than $100,000. |
Table of Contents
| Note 6. | Short-Term Borrowings |
| As of | ||||||||
|
December
|
November
|
|||||||
| 2009 | 2008 | |||||||
| (in millions) | ||||||||
|
Current portion of unsecured
long-term
borrowings
(1)(2)
|
$ | 17,928 | $ | 26,281 | ||||
|
Hybrid financial instruments
|
10,741 | 12,086 | ||||||
|
Promissory
notes
(3)
|
2,119 | 6,944 | ||||||
|
Commercial
paper
(4)
|
1,660 | 1,125 | ||||||
|
Other
short-term
borrowings
|
5,068 | 6,222 | ||||||
|
Total
(5)
|
$ | 37,516 | $ | 52,658 | ||||
| (1) | Includes $1.73 billion as of December 2009, guaranteed by the Federal Deposit Insurance Corporation (FDIC) under the Temporary Liquidity Guarantee Program (TLGP). | |
| (2) | Includes $17.05 billion and $25.12 billion as of December 2009 and November 2008, respectively, issued by Group Inc. | |
| (3) | Includes $0 and $3.42 billion as of December 2009 and November 2008, respectively, guaranteed by the FDIC under the TLGP. | |
| (4) | Includes $0 and $751 million as of December 2009 and November 2008, respectively, guaranteed by the FDIC under the TLGP. | |
| (5) | The weighted average interest rates for these borrowings, after giving effect to hedging activities, were 1.31% and 3.37% as of December 2009 and November 2008, respectively, and excluded financial instruments accounted for at fair value under the fair value option. |
Table of Contents
| Note 7. | Long-Term Borrowings |
| As of | ||||||||
|
December
|
November
|
|||||||
| 2009 | 2008 | |||||||
| (in millions) | ||||||||
|
Fixed rate
obligations
(1)
|
||||||||
|
Group Inc.
|
$ | 114,695 | $ | 101,454 | ||||
|
Subsidiaries
|
2,718 | 2,371 | ||||||
|
Floating rate
obligations
(2)
|
||||||||
|
Group Inc.
|
60,390 | 57,018 | ||||||
|
Subsidiaries
|
7,282 | 7,377 | ||||||
|
Total
(3)
|
$ | 185,085 | $ | 168,220 | ||||
| (1) | As of December 2009 and November 2008, $79.12 billion and $70.08 billion, respectively, of the firm’s fixed rate debt obligations were denominated in U.S. dollars and interest rates ranged from 1.63% to 10.04% and from 3.87% to 10.04%, respectively. As of December 2009 and November 2008, $38.29 billion and $33.75 billion, respectively, of the firm’s fixed rate debt obligations were denominated in non-U.S. dollars and interest rates ranged from 0.80% to 7.45% and from 0.67% to 8.88%, respectively. | |
| (2) | As of December 2009 and November 2008, $32.26 billion and $32.41 billion, respectively, of the firm’s floating rate debt obligations were denominated in U.S. dollars. As of December 2009 and November 2008, $35.41 billion and $31.99 billion, respectively, of the firm’s floating rate debt obligations were denominated in non-U.S. dollars. Floating interest rates generally are based on LIBOR or the federal funds target rate. Equity-linked and indexed instruments are included in floating rate obligations. | |
| (3) | Includes $19.03 billion as of December 2009, guaranteed by the FDIC under the TLGP. |
| As of December 2009 | ||||||||||||
| Group Inc. | Subsidiaries | Total | ||||||||||
| (in millions) | ||||||||||||
|
2011
|
$ | 22,302 | $ | 1,234 | $ | 23,536 | ||||||
|
2012
|
25,749 | 1,665 | 27,414 | |||||||||
|
2013
|
23,305 | 33 | 23,338 | |||||||||
|
2014
|
18,303 | 33 | 18,336 | |||||||||
|
2015-thereafter
|
85,426 | 7,035 | 92,461 | |||||||||
|
Total
(1)(2)
|
$ | 175,085 | $ | 10,000 | $ | 185,085 | ||||||
| (1) | Unsecured long-term borrowings maturing within one year of the financial statement date and unsecured long-term borrowings that are redeemable within one year of the financial statement date at the option of the holder are included as unsecured short-term borrowings in the consolidated statements of financial condition. | |
| (2) | Unsecured long-term borrowings that are repayable prior to maturity at the option of the firm are reflected at their contractual maturity dates. Unsecured long-term borrowings that are redeemable prior to maturity at the option of the holder are reflected at the dates such options become exercisable. |
Table of Contents
| As of | ||||||||||||||||
| December 2009 | November 2008 | |||||||||||||||
| Amount | Rate | Amount | Rate | |||||||||||||
| ($ in millions) | ||||||||||||||||
|
Fixed rate obligations
|
||||||||||||||||
|
Group Inc.
|
$ | 1,896 | 5.52 | % | $ | 1,863 | 5.71 | % | ||||||||
|
Subsidiaries
|
2,424 | 5.46 | 2,152 | 4.32 | ||||||||||||
|
Floating rate
obligations
(1)(2)
|
||||||||||||||||
|
Group Inc.
|
173,189 | 1.33 | 156,609 | 2.66 | ||||||||||||
|
Subsidiaries
|
7,576 | 1.20 | 7,596 | 4.23 | ||||||||||||
|
Total
|
$ | 185,085 | 1.42 | $ | 168,220 | 2.73 | ||||||||||
| (1) | Includes fixed rate obligations that have been converted into floating rate obligations through derivative contracts. | |
| (2) | The weighted average interest rates as of December 2009 and November 2008 excluded financial instruments accounted for at fair value under the fair value option. |
Table of Contents
Table of Contents
| Note 8. | Commitments, Contingencies and Guarantees |
|
Commitment Amount by Period
|
||||||||||||||||||||||||
| of Expiration as of December 2009 | Total Commitments as of | |||||||||||||||||||||||
|
2011-
|
2013-
|
2015-
|
December
|
November
|
||||||||||||||||||||
| 2010 | 2012 | 2014 | Thereafter | 2009 | 2008 | |||||||||||||||||||
| (in millions) | ||||||||||||||||||||||||
|
Commitments to extend
credit
(1)
|
||||||||||||||||||||||||
|
Commercial lending:
|
||||||||||||||||||||||||
|
Investment-grade
|
$ | 4,665 | $ | 5,175 | $ | 1,000 | $ | 575 | $ | 11,415 | $ | 8,007 | ||||||||||||
|
Non-investment-grade
(2)
|
1,425 | 4,379 | 2,105 | 244 | 8,153 | 9,318 | ||||||||||||||||||
|
William Street credit extension program
|
4,850 | 18,112 | 2,256 | — | 25,218 | 22,610 | ||||||||||||||||||
|
Warehouse financing
|
12 | — | — | — | 12 | 1,101 | ||||||||||||||||||
|
Total commitments to extend credit
|
10,952 | 27,666 | 5,361 | 819 | 44,798 | 41,036 | ||||||||||||||||||
|
Forward starting resale and securities borrowing agreements
|
34,844 | — | — | — | 34,844 | 61,455 | ||||||||||||||||||
|
Forward starting repurchase and securities lending agreements
|
10,545 | — | — | — | 10,545 | 6,948 | ||||||||||||||||||
|
Underwriting commitments
|
1,811 | — | — | — | 1,811 | 241 | ||||||||||||||||||
|
Letters of
credit
(3)
|
1,621 | 33 | 146 | 4 | 1,804 | 7,251 | ||||||||||||||||||
|
Investment
commitments
(4)
|
2,686 | 9,153 | 128 | 1,273 | 13,240 | 14,266 | ||||||||||||||||||
|
Construction-related
commitments
(5)
|
142 | — | — | — | 142 | 483 | ||||||||||||||||||
|
Other
|
109 | 58 | 38 | 33 | 238 | 260 | ||||||||||||||||||
|
Total commitments
|
$ | 62,710 | $ | 36,910 | $ | 5,673 | $ | 2,129 | $ | 107,422 | $ | 131,940 | ||||||||||||
| (1) | Commitments to extend credit are presented net of amounts syndicated to third parties. |
| (2) | Included within non-investment-grade commitments as of December 2009 and November 2008 were $1.20 billion and $2.07 billion, respectively, related to leveraged lending capital market transactions; $40 million and $164 million, respectively, related to commercial real estate transactions; and $6.91 billion and $7.09 billion, respectively, arising from other unfunded credit facilities. Including funded loans, the total notional amount of the firm’s leveraged lending capital market transactions was $4.45 billion and $7.97 billion as of December 2009 and November 2008, respectively. |
| (3) | Consists of commitments under letters of credit issued by various banks which the firm provides to counterparties in lieu of securities or cash to satisfy various collateral and margin deposit requirements. |
| (4) | Consists of the firm’s commitments to invest in private equity, real estate and other assets directly and through funds that the firm raises and manages in connection with its merchant banking and other investing activities, consisting of $2.46 billion and $3.15 billion as of December 2009 and November 2008, respectively, related to real estate private investments and $10.78 billion and $11.12 billion as of December 2009 and November 2008, respectively, related to corporate and other private investments. Such commitments include $11.38 billion and $12.25 billion as of December 2009 and November 2008, respectively, of commitments to invest in funds managed by the firm, which will be funded at market value on the date of investment. |
| (5) | Includes commitments of $104 million and $388 million as of December 2009 and November 2008, respectively, related to the firm’s new headquarters in New York City. |
Table of Contents
| • | Commercial lending commitments. The firm’s commercial lending commitments are generally extended in connection with contingent acquisition financing and other types of corporate lending as well as commercial real estate financing. The total commitment amount does not necessarily reflect the actual future cash flow requirements, as the firm may syndicate all or substantial portions of these commitments in the future, the commitments may expire unused, or the commitments may be cancelled or reduced at the request of the counterparty. In addition, commitments that are extended for contingent acquisition financing are often intended to be short-term in nature, as borrowers often seek to replace them with other funding sources. | |
| • | William Street credit extension program. Substantially all of the commitments provided under the William Street credit extension program are to investment-grade corporate borrowers. Commitments under the program are principally extended by William Street Commitment Corporation (Commitment Corp.), a consolidated wholly owned subsidiary of GS Bank USA, GS Bank USA and other subsidiaries of GS Bank USA. The commitments extended by Commitment Corp. are supported, in part, by funding raised by William Street Funding Corporation (Funding Corp.), another consolidated wholly owned subsidiary of GS Bank USA. The assets and liabilities of Commitment Corp. and Funding Corp. are legally separated from other assets and liabilities of the firm. The assets of Commitment Corp. and of Funding Corp. will not be available to their respective shareholders until the claims of their respective creditors have been paid. In addition, no affiliate of either Commitment Corp. or Funding Corp., except in limited cases as expressly agreed in writing, is responsible for any obligation of either entity. With respect to most of the William Street commitments, Sumitomo Mitsui Financial Group, Inc. (SMFG) provides the firm with credit loss protection that is generally limited to 95% of the first loss the firm realizes on approved loan commitments, up to a maximum of approximately $950 million. In addition, subject to the satisfaction of certain conditions, upon the firm’s request, SMFG will provide protection for 70% of additional losses on such commitments, up to a maximum of $1.13 billion, of which $375 million of protection had been provided as of both December 2009 and November 2008. The firm also uses other financial instruments to mitigate credit risks related to certain William Street commitments not covered by SMFG. | |
| • | Warehouse financing. The firm provides financing for the warehousing of financial assets. These arrangements are secured by the warehoused assets, primarily consisting of commercial mortgages as of December 2009 and November 2008. |
Table of Contents
|
As of
|
||||
| December 2009 | ||||
| (in millions) | ||||
|
2010
|
$ | 494 | ||
|
2011
|
369 | |||
|
2012
|
295 | |||
|
2013
|
260 | |||
|
2014
|
195 | |||
|
2015-thereafter
|
1,555 | |||
|
Total
|
$ | 3,168 | ||
| (in millions) | ||||||
|
2007
|
$ | 412 | ||||
|
2008
|
438 | |||||
|
2009
|
434 | |||||
Table of Contents
| Maximum Payout/Notional Amount by Period of Expiration (1) | ||||||||||||||||||||||||
|
Carrying
|
||||||||||||||||||||||||
|
Value of
|
2011-
|
2013-
|
2015-
|
|||||||||||||||||||||
| Net Liability | 2010 | 2012 | 2014 | Thereafter | Total | |||||||||||||||||||
| (in millions) | ||||||||||||||||||||||||
|
As of
December 2009
|
||||||||||||||||||||||||
|
Derivatives
(2)
|
$ | 7,221 | $ | 145,126 | $ | 105,744 | $ | 48,350 | $ | 66,965 | $ | 366,185 | ||||||||||||
|
Securities lending
indemnifications
(3)
|
— | 27,314 | — | — | — | 27,314 | ||||||||||||||||||
|
Other financial
guarantees
(4)
|
207 | 357 | 352 | 358 | 1,010 | 2,077 | ||||||||||||||||||
| (1) | Such amounts do not represent the anticipated losses in connection with these contracts. |
| (2) | Because derivative contracts are accounted for at fair value, carrying value is considered the best indication of payment/performance risk for individual contracts. However, the carrying value excludes the effect of a legal right of setoff that may exist under an enforceable netting agreement and the effect of netting of cash paid pursuant to credit support agreements. These derivative contracts are risk managed together with derivative contracts that do not meet the definition of a guarantee under ASC 460 and, therefore, these amounts do not reflect the firm’s overall risk related to its derivative activities. As of November 2008, the carrying value of the net liability related to derivative guarantees was $17.46 billion. |
| (3) | Collateral held by the lenders in connection with securities lending indemnifications was $28.07 billion and $19.95 billion as of December 2009 and November 2008, respectively. Because the contractual nature of these arrangements requires the firm to obtain collateral with a market value that exceeds the value of the securities on loan from the borrower, there is minimal performance risk associated with these guarantees. |
| (4) | As of November 2008, the carrying value of the net liability related to other financial guarantees was $235 million. |
Table of Contents
Table of Contents
| Note 9. | Shareholders’ Equity |
Table of Contents
|
Dividend
|
Shares
|
Shares
|
Earliest
|
Redemption Value
|
||||||||||||||
| Series | Preference | Issued | Authorized | Dividend Rate | Redemption Date | (in millions) | ||||||||||||
|
A
|
Non-cumulative | 30,000 | 50,000 |
3 month LIBOR + 0.75%,
with floor of 3.75% per annum |
April 25, 2010 | $ | 750 | |||||||||||
|
B
|
Non-cumulative | 32,000 | 50,000 | 6.20% per annum | October 31, 2010 | 800 | ||||||||||||
|
C
|
Non-cumulative | 8,000 | 25,000 |
3 month LIBOR + 0.75%,
with floor of 4.00% per annum |
October 31, 2010 | 200 | ||||||||||||
|
D
|
Non-cumulative | 54,000 | 60,000 |
3 month LIBOR + 0.67%,
with floor of 4.00% per annum |
May 24, 2011 | 1,350 | ||||||||||||
|
G
|
Cumulative | 50,000 | 50,000 | 10.00% per annum | October 1, 2008 | 5,500 | ||||||||||||
| 174,000 | 235,000 | $ | 8,600 | |||||||||||||||
Table of Contents
| Year Ended | One Month Ended | |||||||||||||||||||||||||||||||
| December 2009 | November 2008 | November 2007 | December 2008 | |||||||||||||||||||||||||||||
| (per share) | (in millions) | (per share) | (in millions) | (per share) | (in millions) | (per share) | (in millions) | |||||||||||||||||||||||||
|
Series A
|
$ | 710.94 | $ | 21 | $ | 1,068.86 | $ | 32 | $ | 1,563.51 | $ | 47 | $ | 239.58 | $ | 7 | ||||||||||||||||
|
Series B
|
1,162.50 | 38 | 1,550.00 | 50 | 1,550.00 | 50 | 387.50 | 12 | ||||||||||||||||||||||||
|
Series C
|
758.34 | 6 | 1,110.18 | 9 | 1,563.51 | 12 | 255.56 | 2 | ||||||||||||||||||||||||
|
Series D
|
758.34 | 41 | 1,105.18 | 59 | 1,543.06 | 83 | 255.56 | 14 | ||||||||||||||||||||||||
|
Series G
|
7,500.00 | 375 | 1,083.33 | 54 | — | — | 2,500.00 | 125 | ||||||||||||||||||||||||
|
Series H
|
12.50 | (1) | 125 | (1) | — | — | — | — | 14.86 | 149 | ||||||||||||||||||||||
|
Total
|
$ | 606 | $ | 204 | $ | 192 | $ | 309 | ||||||||||||||||||||||||
| (1) | Excludes the one-time preferred dividend of $426 million related to the repurchase of the TARP Series H Preferred Stock in the second quarter of 2009, as well as $44 million of accrued dividends paid upon repurchase of the Series H Preferred Stock. |
| As of | ||||||||
|
December
|
November
|
|||||||
| 2009 | 2008 | |||||||
| (in millions) | ||||||||
|
Currency translation adjustment, net of tax
|
$ | (132 | ) | $ | (30 | ) | ||
|
Pension and postretirement liability adjustments, net of tax
|
(317 | ) | (125 | ) | ||||
|
Net unrealized gains/(losses) on
available-for-sale
securities,
net of tax (1) |
87 | (47 | ) | |||||
|
Total accumulated other comprehensive loss, net of tax
|
$ | (362 | ) | $ | (202 | ) | ||
| (1) | Consists of net unrealized gains/(losses) of $84 million and $(55) million on available-for-sale securities held by the firm’s insurance subsidiaries as of December 2009 and November 2008, respectively, and net unrealized gains of $3 million and $8 million on available-for-sale securities held by investees accounted for under the equity method as of December 2009 and November 2008, respectively. |
Table of Contents
| Note 10. | Earnings Per Common Share |
| Year Ended | One Month Ended | |||||||||||||||
|
December
|
November
|
November
|
December
|
|||||||||||||
| 2009 | 2008 | 2007 | 2008 | |||||||||||||
| (in millions, except per share amounts) | ||||||||||||||||
|
Numerator for basic and diluted EPS —
net earnings/(loss) applicable to common shareholders |
$ | 12,192 | $ | 2,041 | $ | 11,407 | $ | (1,028 | ) | |||||||
|
Denominator for basic EPS — weighted average number of
common shares
|
512.3 | 437.0 | 433.0 | 485.5 | ||||||||||||
|
Effect of dilutive
securities
(1)
|
||||||||||||||||
|
Restricted stock units
|
15.7 | 10.2 | 13.6 | — | ||||||||||||
|
Stock options and warrants
|
22.9 | 9.0 | 14.6 | — | ||||||||||||
|
Dilutive potential common shares
|
38.6 | 19.2 | 28.2 | — | ||||||||||||
|
Denominator for diluted EPS — weighted average number
of common shares and dilutive potential common shares
|
550.9 | 456.2 | 461.2 | 485.5 | ||||||||||||
|
Basic
EPS
(2)
|
$ | 23.74 | $ | 4.67 | $ | 26.34 | $ | (2.15 | ) | |||||||
|
Diluted
EPS
(2)
|
22.13 | 4.47 | 24.73 | (2.15 | ) | |||||||||||
| (1) | The diluted EPS computations do not include the antidilutive effect of RSUs, stock options and warrants as follows: |
| Year Ended | One Month Ended | |||||||||||||||
|
December
|
November
|
November
|
December
|
|||||||||||||
| 2009 | 2008 | 2007 | 2008 | |||||||||||||
| (in millions) | ||||||||||||||||
|
Number of antidilutive RSUs and common shares underlying
antidilutive stock options and warrants
|
24.7 | 60.5 | — | 157.2 | ||||||||||||
| (2) | In the first quarter of fiscal 2009, the firm adopted amended accounting principles which require that unvested share-based payment awards that have non-forfeitable rights to dividends or dividend equivalents be treated as a separate class of securities in calculating earnings per common share. The impact of applying these amended principles for the year ended December 2009 and one month ended December 2008 was a reduction in basic earnings per common share of $0.06 and an increase in basic and diluted loss per common share of $0.03, respectively. There was no impact on diluted earnings per common share for the year ended December 2009. Prior periods have not been restated due to immateriality. |
Table of Contents
| Note 11. | Goodwill and Identifiable Intangible Assets |
| As of | ||||||||
|
December
|
November
|
|||||||
| 2009 | 2008 | |||||||
| (in millions) | ||||||||
|
Investment Banking
|
||||||||
|
Underwriting
|
$ | 125 | $ | 125 | ||||
|
Trading and Principal Investments
|
||||||||
|
FICC
|
265 | 247 | ||||||
|
Equities
(1)
|
2,389 | 2,389 | ||||||
|
Principal Investments
|
84 | 80 | ||||||
|
Asset Management and Securities Services
|
||||||||
|
Asset
Management
(2)
|
563 | 565 | ||||||
|
Securities Services
|
117 | 117 | ||||||
|
Total
|
$ | 3,543 | $ | 3,523 | ||||
| (1) | Primarily related to SLK LLC (SLK). | |
| (2) | Primarily related to The Ayco Company, L.P. (Ayco). |
Table of Contents
| As of | ||||||||||
|
December
|
November
|
|||||||||
| 2009 | 2008 | |||||||||
| (in millions) | ||||||||||
|
Customer
lists
(1)
|
Gross carrying amount | $ | 1,117 | $ | 1,160 | |||||
| Accumulated amortization | (472 | ) | (436 | ) | ||||||
| Net carrying amount | $ | 645 | $ | 724 | ||||||
|
NYSE DMM rights
|
Gross carrying amount | $ | 714 | $ | 714 | |||||
| Accumulated amortization | (294 | ) | (252 | ) | ||||||
| Net carrying amount | $ | 420 | $ | 462 | ||||||
|
Insurance-related
|
Gross carrying amount | $ | 292 | $ | 292 | |||||
|
assets
(2)
|
Accumulated amortization | (142 | ) | (137 | ) | |||||
| Net carrying amount | $ | 150 | $ | 155 | ||||||
|
Exchange-traded
|
Gross carrying amount | $ | 138 | $ | 138 | |||||
|
fund (ETF) lead
|
Accumulated amortization | (48 | ) | (43 | ) | |||||
|
market maker rights
|
Net carrying amount | $ | 90 | $ | 95 | |||||
|
Other
(3)
|
Gross carrying amount | $ | 170 | $ | 178 | |||||
| Accumulated amortization | (98 | ) | (85 | ) | ||||||
| Net carrying amount | $ | 72 | $ | 93 | ||||||
|
Total
|
Gross carrying amount | $ | 2,431 | $ | 2,482 | |||||
| Accumulated amortization | (1,054 | ) | (953 | ) | ||||||
| Net carrying amount | $ | 1,377 | $ | 1,529 | ||||||
| (1) | Primarily includes the firm’s clearance and execution and NASDAQ customer lists related to SLK and financial counseling customer lists related to Ayco. | |
| (2) | Primarily includes VOBA related to the firm’s insurance businesses. | |
| (3) | Primarily includes marketing-related assets and other contractual rights. |
Table of Contents
|
As of
|
||||
| December 2009 | ||||
| (in millions) | ||||
|
2010
|
$ | 141 | ||
|
2011
|
135 | |||
|
2012
|
129 | |||
|
2013
|
123 | |||
|
2014
|
119 | |||
| Note 12. | Other Assets and Other Liabilities |
| As of | ||||||||
|
December
|
November
|
|||||||
| 2009 | 2008 | |||||||
| (in millions) | ||||||||
|
Property, leasehold improvements and
equipment
(1)
|
$ | 11,380 | $ | 10,793 | ||||
|
Goodwill and identifiable intangible
assets
(2)
|
4,920 | 5,052 | ||||||
|
Income tax-related assets
|
7,937 | 8,359 | ||||||
|
Equity-method
investments
(3)
|
1,484 | 1,454 | ||||||
|
Miscellaneous receivables and other
|
3,747 | 4,780 | ||||||
|
Total
|
$ | 29,468 | $ | 30,438 | ||||
| (1) | Net of accumulated depreciation and amortization of $7.28 billion and $6.55 billion as of December 2009 and November 2008, respectively. | |
| (2) | See Note 11 for further information regarding the firm’s goodwill and identifiable intangible assets. | |
| (3) | Excludes investments of $2.95 billion and $3.45 billion accounted for at fair value under the fair value option as of December 2009 and November 2008, respectively, which are included in “Trading assets, at fair value” in the consolidated statements of financial condition. |
Table of Contents
| As of | ||||||||
|
December
|
November
|
|||||||
| 2009 | 2008 | |||||||
| (in millions) | ||||||||
|
Compensation and benefits
|
$ | 11,170 | $ | 4,646 | ||||
|
Insurance-related
liabilities
(1)
|
11,832 | 9,673 | ||||||
|
Noncontrolling
interests
(2)
|
960 | 1,127 | ||||||
|
Income tax-related liabilities
|
4,022 | 2,865 | ||||||
|
Employee interests in consolidated funds
|
416 | 517 | ||||||
|
Accrued expenses and other payables
|
5,455 | 4,388 | ||||||
|
Total
|
$ | 33,855 | $ | 23,216 | ||||
| (1) | Insurance-related liabilities are set forth in the table below: |
| As of | ||||||||
|
December
|
November
|
|||||||
| 2009 | 2008 | |||||||
| (in millions) | ||||||||
|
Separate account liabilities
|
$ | 4,186 | $ | 3,628 | ||||
|
Liabilities for future benefits and unpaid claims
|
6,484 | 4,778 | ||||||
|
Contract holder account balances
|
874 | 899 | ||||||
|
Reserves for guaranteed minimum death and income benefits
|
288 | 368 | ||||||
|
Total insurance-related liabilities
|
$ | 11,832 | $ | 9,673 | ||||
| (2) | Includes $598 million and $784 million related to consolidated investment funds as of December 2009 and November 2008, respectively. |
Table of Contents
| Note 13. | Employee Benefit Plans |
Table of Contents
| As of or for the Year Ended | ||||||||||||||||||||||||
| December 2009 | November 2008 | |||||||||||||||||||||||
|
U.S.
|
Non-U.S.
|
Post-
|
U.S.
|
Non-U.S.
|
Post-
|
|||||||||||||||||||
| Pension | Pension | retirement | Pension | Pension | retirement | |||||||||||||||||||
| (in millions) | ||||||||||||||||||||||||
|
Benefit obligation
|
||||||||||||||||||||||||
|
Balance, beginning of year
|
$ | 485 | $ | 513 | $ | 569 | $ | 399 | $ | 748 | $ | 445 | ||||||||||||
|
Service cost
|
— | 52 | 18 | — | 84 | 26 | ||||||||||||||||||
|
Interest cost
|
25 | 34 | 27 | 24 | 41 | 31 | ||||||||||||||||||
|
Plan amendments
|
— | — | (35 | ) | — | — | (61 | ) | ||||||||||||||||
|
Actuarial loss/(gain)
|
(42 | ) | 325 | (84 | ) | (50 | ) | (261 | ) | 10 | ||||||||||||||
|
Benefits paid
|
(10 | ) | (11 | ) | (11 | ) | (8 | ) | (2 | ) | (10 | ) | ||||||||||||
|
Curtailment
|
— | (11 | ) | — | — | — | — | |||||||||||||||||
|
Effect of foreign exchange rates
|
— | 58 | — | — | (154 | ) | — | |||||||||||||||||
|
Balance, end of year
|
$ | 458 | $ | 960 | $ | 484 | $ | 365 | $ | 456 | $ | 441 | ||||||||||||
|
Fair value of plan assets
|
||||||||||||||||||||||||
|
Balance, beginning of year
|
$ | 299 | $ | 562 | $ | — | $ | 450 | $ | 614 | $ | — | ||||||||||||
|
Actual return on plan assets
|
78 | 113 | — | (151 | ) | (77 | ) | — | ||||||||||||||||
|
Firm contributions
|
— | 50 | 11 | — | 184 | 9 | ||||||||||||||||||
|
Employee contributions
|
— | 1 | — | — | 1 | — | ||||||||||||||||||
|
Benefits paid
|
(10 | ) | (10 | ) | (11 | ) | (8 | ) | (1 | ) | (9 | ) | ||||||||||||
|
Curtailment
|
— | (9 | ) | — | — | — | — | |||||||||||||||||
|
Effect of foreign exchange rates
|
— | 59 | — | — | (170 | ) | — | |||||||||||||||||
|
Balance, end of year
|
$ | 367 | $ | 766 | $ | — | $ | 291 | $ | 551 | $ | — | ||||||||||||
|
Funded status of plans
|
$ | (91 | ) | $ | (194 | ) | $ | (484 | ) | $ | (74 | ) | $ | 95 | $ | (441 | ) | |||||||
|
Amounts recognized in the Consolidated Statements of Financial
Condition consist of:
|
||||||||||||||||||||||||
|
Other assets
|
$ | — | $ | — | $ | — | $ | — | $ | 129 | $ | — | ||||||||||||
|
Other liabilities and accrued expenses
|
(91 | ) | (194 | ) | (484 | ) | (74 | ) | (34 | ) | (441 | ) | ||||||||||||
|
Net amount recognized
|
$ | (91 | ) | $ | (194 | ) | $ | (484 | ) | $ | (74 | ) | $ | 95 | $ | (441 | ) | |||||||
|
Amounts recognized in accumulated other comprehensive
income/(loss) consist of:
|
||||||||||||||||||||||||
|
Actuarial loss/(gain)
|
$ | 174 | $ | 231 | $ | 155 | $ | 195 | $ | (59 | ) | $ | 129 | |||||||||||
|
Prior service cost/(credit)
|
— | 3 | (82 | ) | — | 3 | (39 | ) | ||||||||||||||||
|
Transition obligation/(asset)
|
(8 | ) | 2 | — | (11 | ) | 3 | — | ||||||||||||||||
|
Total amount recognized —
Pre-tax
|
$ | 166 | $ | 236 | $ | 73 | $ | 184 | $ | (53 | ) | $ | 90 | |||||||||||
Table of Contents
| Year Ended | One Month Ended | |||||||||||||||
|
December
|
November
|
November
|
December
|
|||||||||||||
| 2009 | 2008 | 2007 | 2008 | |||||||||||||
| (in millions) | ||||||||||||||||
|
U.S. pension
|
||||||||||||||||
|
Interest cost
|
$ | 25 | $ | 24 | $ | 22 | $ | 2 | ||||||||
|
Expected return on plan assets
|
(20 | ) | (33 | ) | (32 | ) | (2 | ) | ||||||||
|
Net amortization
|
26 | (1 | ) | 1 | 2 | |||||||||||
|
Total
|
$ | 31 | $ | (10 | ) | $ | (9 | ) | $ | 2 | ||||||
|
Non-U.S. pension
|
||||||||||||||||
|
Service cost
|
$ | 52 | $ | 84 | $ | 78 | $ | 3 | ||||||||
|
Interest cost
|
34 | 41 | 34 | 3 | ||||||||||||
|
Expected return on plan assets
|
(36 | ) | (41 | ) | (36 | ) | (3 | ) | ||||||||
|
Net amortization
|
2 | 2 | 10 | — | ||||||||||||
|
Curtailment
|
1 | — | — | — | ||||||||||||
|
Total
|
$ | 53 | $ | 86 | $ | 86 | $ | 3 | ||||||||
|
Postretirement
|
||||||||||||||||
|
Service cost
|
$ | 18 | $ | 26 | $ | 21 | $ | 1 | ||||||||
|
Interest cost
|
27 | 31 | 23 | 2 | ||||||||||||
|
Net amortization
|
22 | 23 | 19 | 2 | ||||||||||||
|
Total
|
$ | 67 | $ | 80 | $ | 63 | $ | 5 | ||||||||
|
Estimated 2010 amortization from accumulated other comprehensive
income:
|
||||||||||||||||
|
Actuarial loss/(gain)
|
$ | 46 | ||||||||||||||
|
Prior service cost/(credit)
|
(9 | ) | ||||||||||||||
|
Transition obligation/(asset)
|
(3 | ) | ||||||||||||||
|
Total
|
$ | 34 | ||||||||||||||
Table of Contents
| Year Ended | One Month Ended | |||||||||||||||
|
December
|
November
|
November
|
December
|
|||||||||||||
| 2009 | 2008 | 2007 | 2008 | |||||||||||||
|
Defined benefit pension plans
|
||||||||||||||||
|
U.S. pension — projected benefit obligation
|
||||||||||||||||
|
Discount rate
|
5.75 | % | 6.75 | % | 6.00 | % | 5.25 | % | ||||||||
|
Rate of increase in future compensation levels
|
N/A | N/A | N/A | N/A | ||||||||||||
|
U.S. pension — net periodic benefit cost
|
||||||||||||||||
|
Discount rate
|
5.25 | 6.00 | 5.50 | 6.75 | ||||||||||||
|
Rate of increase in future compensation levels
|
N/A | N/A | N/A | N/A | ||||||||||||
|
Expected
long-term
rate of return on plan assets
|
7.00 | 7.50 | 7.50 | 7.00 | ||||||||||||
|
Non-U.S. pension —
projected benefit obligation
|
||||||||||||||||
|
Discount rate
|
5.60 | 6.79 | 5.91 | 6.35 | ||||||||||||
|
Rate of increase in future compensation levels
|
3.99 | 3.85 | 5.38 | 3.85 | ||||||||||||
|
Non-U.S. pension —
net periodic benefit cost
|
||||||||||||||||
|
Discount rate
|
6.35 | 5.91 | 4.85 | 6.79 | ||||||||||||
|
Rate of increase in future compensation levels
|
3.85 | 5.38 | 4.98 | 3.85 | ||||||||||||
|
Expected
long-term
rate of return on plan assets
|
7.05 | 5.89 | 6.84 | 5.73 | ||||||||||||
|
Postretirement plans — benefit obligation
|
||||||||||||||||
|
Discount rate
|
5.75 | % | 6.75 | % | 6.00 | % | 5.25 | % | ||||||||
|
Rate of increase in future compensation levels
|
5.00 | 5.00 | 5.00 | 5.00 | ||||||||||||
|
Postretirement plans — net periodic benefit cost
|
||||||||||||||||
|
Discount rate
|
5.25 | % | 6.00 | % | 5.50 | % | 6.75 | % | ||||||||
|
Rate of increase in future compensation levels
|
5.00 | 5.00 | 5.00 | 5.00 | ||||||||||||
Table of Contents
| 1% Increase | 1% Decrease | |||||||||||||||
|
December
|
November
|
December
|
November
|
|||||||||||||
| 2009 | 2008 | 2009 | 2008 | |||||||||||||
| (in millions) | ||||||||||||||||
|
Service plus interest costs
|
$ | 10 | $ | 11 | $ | (8 | ) | $ | (9 | ) | ||||||
|
Obligation
|
101 | 90 | (78 | ) | (70 | ) | ||||||||||
| As of | ||||||||||||||||
| December 2009 | November 2008 | |||||||||||||||
|
U.S.
|
Non-U.S.
|
U.S.
|
Non-U.S.
|
|||||||||||||
| Pension | Pension | Pension | Pension | |||||||||||||
|
Equity securities
|
72 | % | 65 | % | 69 | % | 28 | % | ||||||||
|
Debt securities
|
27 | 18 | 29 | 7 | ||||||||||||
|
Other
|
1 | 17 | 2 | 65 | ||||||||||||
|
Total
|
100 | % | 100 | % | 100 | % | 100 | % | ||||||||
Table of Contents
|
U.S.
|
Non-U.S.
|
Post-
|
||||||||||
| Pension | Pension | retirement | ||||||||||
| (in millions) | ||||||||||||
|
2010
|
$ | 11 | $ | 8 | $ | 13 | ||||||
|
2011
|
12 | 8 | 14 | |||||||||
|
2012
|
13 | 8 | 14 | |||||||||
|
2013
|
14 | 9 | 15 | |||||||||
|
2014
|
15 | 9 | 17 | |||||||||
|
2015-2019
|
94 | 48 | 112 | |||||||||
| Note 14. | Employee Incentive Plans |
Table of Contents
Table of Contents
|
Weighted Average Grant-Date
|
||||||||||||||||
|
Restricted Stock
|
Fair Value of Restricted
|
|||||||||||||||
| Units Outstanding | Stock Units Outstanding | |||||||||||||||
|
Future
|
No Future
|
Future
|
No Future
|
|||||||||||||
|
Service
|
Service
|
Service
|
Service
|
|||||||||||||
| Required | Required | Required | Required | |||||||||||||
|
Outstanding, November 2008
|
11,963,864 | 43,883,221 | $ | 203.19 | $ | 182.74 | ||||||||||
|
Granted
(1)(2)
|
20,610,264 | 54,632 | 67.59 | 69.18 | ||||||||||||
|
Forfeited
|
(56,129 | ) | (42,703 | ) | 170.68 | 187.40 | ||||||||||
|
Vested
(2)
|
(507,828 | ) | 507,828 | 168.42 | 168.42 | |||||||||||
|
Outstanding, December 2008
|
32,010,171 | 44,402,978 | $ | 116.49 | $ | 182.44 | ||||||||||
|
Granted
(1)(2)
|
1,106,498 | 8,862 | 151.85 | 83.67 | ||||||||||||
|
Forfeited
|
(1,553,816 | ) | (38,307 | ) | 117.81 | 270.22 | ||||||||||
|
Delivered
(3)
|
— | (31,215,605 | ) | — | 170.47 | |||||||||||
|
Vested
(2)
|
(14,907,659 | ) | 14,907,659 | 113.37 | 113.37 | |||||||||||
|
Outstanding, December 2009
|
16,655,194 | 28,065,587 | $ | 121.50 | $ | 158.91 | ||||||||||
| (1) | The weighted average grant-date fair value of RSUs granted during the years ended December 2009, November 2008 and November 2007 and one month ended December 2008 was $151.31, $154.31, $224.13 and $67.60, respectively. The fair value of the December 2008 grant includes a 14.3% liquidity discount to reflect post-vesting transfer restrictions of up to 4 years. | |
| (2) | The aggregate fair value of awards that vested during the years ended December 2009, November 2008 and November 2007 and one month ended December 2008 was $2.18 billion, $1.03 billion, $5.63 billion and $41 million, respectively. | |
| (3) | Includes RSUs that were cash settled. |
Table of Contents
|
Weighted
|
||||||||||||||||
|
Weighted
|
Aggregate
|
Average
|
||||||||||||||
|
Options
|
Average
|
Intrinsic Value
|
Remaining
|
|||||||||||||
| Outstanding | Exercise Price | (in millions) | Life (years) | |||||||||||||
|
Outstanding, November 2008
|
33,639,132 | $ | 109.47 | |||||||||||||
|
Granted
|
35,988,192 | 78.78 | ||||||||||||||
|
Exercised
|
(32,222 | ) | 53.00 | |||||||||||||
|
Forfeited
|
(93,615 | ) | 78.92 | |||||||||||||
|
Outstanding, December 2008
|
69,501,487 | $ | 93.65 | $ | 29 | 7.17 | ||||||||||
|
Exercised
|
(6,445,370 | ) | 79.77 | |||||||||||||
|
Forfeited
|
(784,020 | ) | 78.85 | |||||||||||||
|
Outstanding, December 2009
|
62,272,097 | $ | 95.27 | $ | 4,781 | 6.64 | ||||||||||
|
Exercisable, December 2009
|
21,164,084 | $ | 92.40 | $ | 1,618 | 2.50 | ||||||||||
|
Weighted
|
||||||||||||||||||||
|
Weighted
|
Average
|
|||||||||||||||||||
|
Options
|
Average
|
Remaining
|
||||||||||||||||||
|
Exercise Price
|
Outstanding | Exercise Price | Life (years) | |||||||||||||||||
| $ | 75.00 – | $ | 89.99 | 44,123,046 | $ | 79.19 | 7.57 | |||||||||||||
| 90.00 – | 104.99 | 9,376,427 | 91.86 | 1.99 | ||||||||||||||||
| 105.00 – | 119.99 | — | — | — | ||||||||||||||||
| 120.00 – | 134.99 | 2,791,500 | 131.64 | 5.92 | ||||||||||||||||
| 135.00 – | 194.99 | — | — | — | ||||||||||||||||
| 195.00 – | 209.99 | 5,981,124 | 202.27 | 7.48 | ||||||||||||||||
|
Outstanding, December 2009
|
62,272,097 | |||||||||||||||||||
Table of Contents
| Year Ended | One Month Ended | |||||||||||||||
|
December
|
November
|
November
|
December
|
|||||||||||||
| 2009 | 2008 | 2007 | 2008 | |||||||||||||
|
Risk-free
interest rate
|
N/A | N/A | 4.0 | % | 1.1 | % | ||||||||||
|
Expected volatility
|
N/A | N/A | 35.0 | 50.1 | ||||||||||||
|
Annual dividend per share
|
N/A | N/A | $1.40 | $1.40 | ||||||||||||
|
Expected life
|
N/A | N/A | 7.5 years | 4.0 years | ||||||||||||
| Year Ended | One Month Ended | |||||||||||||||
|
December
|
November
|
November
|
December
|
|||||||||||||
| 2009 | 2008 | 2007 | 2008 | |||||||||||||
| (in millions) | ||||||||||||||||
|
Share-based
compensation
|
$ | 2,030 | $ | 1,587 | $ | 4,549 | $ | 180 | ||||||||
|
Excess tax benefit related to options exercised
|
166 | 144 | 469 | — | ||||||||||||
|
Excess tax benefit/(provision) related to
share-based
compensation
(1)
|
(793 | ) | 645 | 908 | — | |||||||||||
| (1) | Represents the tax benefit/(provision), recognized in additional paid-in capital, on stock options exercised and the delivery of common stock underlying RSUs. |
| Note 15. | Transactions with Affiliated Funds |
Table of Contents
| Note 16. | Income Taxes |
| Year Ended | One Month Ended | |||||||||||||||
|
December
|
November
|
November
|
December
|
|||||||||||||
| 2009 | 2008 | 2007 | 2008 | |||||||||||||
| (in millions) | ||||||||||||||||
|
Current taxes
|
||||||||||||||||
|
U.S. federal
|
$ | 4,039 | $ | (278 | ) | $ | 2,934 | $ | 157 | |||||||
|
State and local
|
594 | 91 | 388 | 10 | ||||||||||||
|
Non-U.S.
|
2,242 | 1,964 | 2,554 | 287 | ||||||||||||
|
Total current tax expense
|
6,875 | 1,777 | 5,876 | 454 | ||||||||||||
|
Deferred taxes
|
||||||||||||||||
|
U.S. federal
|
(763 | ) | (880 | ) | 118 | (857 | ) | |||||||||
|
State and local
|
(130 | ) | (92 | ) | 100 | (26 | ) | |||||||||
|
Non-U.S.
|
462 | (791 | ) | (89 | ) | (49 | ) | |||||||||
|
Total deferred tax (benefit)/expense
|
(431 | ) | (1,763 | ) | 129 | (932 | ) | |||||||||
|
Net tax expense
|
$ | 6,444 | $ | 14 | $ | 6,005 | $ | (478 | ) | |||||||
| As of | ||||||||
|
December
|
November
|
|||||||
| 2009 | 2008 | |||||||
| (in millions) | ||||||||
|
Deferred tax assets
|
||||||||
|
Compensation and benefits
|
$ | 3,338 | $ | 3,732 | ||||
|
Unrealized losses
|
1,754 | 375 | ||||||
|
ASC 740 asset
|
1,004 | 625 | ||||||
|
Non-U.S. operations
|
807 | 657 | ||||||
|
Foreign tax credits
|
277 | 334 | ||||||
|
Net operating losses
|
184 | 212 | ||||||
|
Occupancy related
|
159 | 137 | ||||||
|
Other, net
|
427 | 194 | ||||||
| 7,950 | 6,266 | |||||||
|
Valuation
allowance
(1)
|
(74 | ) | (93 | ) | ||||
|
Total deferred tax
assets
(2)
|
$ | 7,876 | $ | 6,173 | ||||
|
Total deferred tax
liabilities
(2)(3)
|
$ | 1,611 | $ | 1,558 | ||||
| (1) | Relates primarily to the ability to utilize losses in various tax jurisdictions. | |
| (2) | Before netting within tax jurisdictions. | |
| (3) | Relates to depreciation and amortization. |
Table of Contents
| 2009 | 2008 | |||||||
|
Balance, beginning of year
|
$ | 1,548 | (1) | $ | 1,042 | |||
|
Increases based on tax positions related to the current year
|
143 | 172 | ||||||
|
Increases based on tax positions related to prior years
|
379 | 264 | ||||||
|
Decreases related to tax positions of prior years
|
(19 | ) | (67 | ) | ||||
|
Decreases related to settlements
|
(91 | ) | (38 | ) | ||||
|
Exchange rate fluctuations
|
(35 | ) | — | |||||
|
Balance, end of year
|
$ | 1,925 | $ | 1,373 | ||||
| (1) | Includes $175 million recorded in the one month ended December 2008. |
Table of Contents
|
As of
|
||||||||
|
Jurisdiction
|
December 2009 | |||||||
|
U.S. Federal
|
2005 | (1) | ||||||
|
New York State and City
|
2004 | (2) | ||||||
|
United Kingdom
|
2005 | |||||||
|
Japan
|
2005 | |||||||
|
Hong Kong
|
2003 | |||||||
|
Korea
|
2003 | |||||||
| (1) | IRS examination of fiscal 2005, 2006 and 2007 began during 2008. IRS examination of fiscal 2003 and 2004 has been completed but the liabilities for those years are not yet final. | |
| (2) | New York State and City examination of fiscal 2004, 2005 and 2006 began in 2008. |
Table of Contents
| Year Ended | One Month Ended | |||||||||||||||
|
December
|
November
|
November
|
December
|
|||||||||||||
| 2009 | 2008 | 2007 | 2008 | |||||||||||||
|
U.S. federal statutory income tax rate
|
35.0 | % | 35.0 | % | 35.0 | % | 35.0 | % | ||||||||
|
Increase related to state and local taxes, net of
U.S. income tax effects
|
1.5 | — | 1.8 | 0.8 | ||||||||||||
|
Tax credits
|
(0.3 | ) | (4.3 | ) | (0.5 | ) | 0.8 | |||||||||
|
Foreign operations
|
(3.5 | ) | (29.8 | ) | (1.6 | ) | 4.3 | |||||||||
|
Tax-exempt
income, including dividends
|
(0.4 | ) | (5.9 | ) | (0.4 | ) | 1.0 | |||||||||
|
Other
|
0.2 | 5.6 | (1) | (0.2 | ) (2) | (3.9 | ) | |||||||||
|
Effective income tax rate
|
32.5 | % | 0.6 | % | 34.1 | % | 38.0 | % | ||||||||
| (1) | Primarily includes the effect of the liability increase as a result of adopting amended principles related to accounting for uncertainty in income taxes. | |
| (2) | Primarily includes the effect of audit settlements. |
| Note 17. | Regulation and Capital Adequacy |
Table of Contents
|
As of
|
||||
| December 2009 | ||||
| ($ in millions) | ||||
|
Tier 1 capital
|
$ | 64,642 | ||
|
Tier 2 capital
|
13,828 | |||
|
Total capital
|
78,470 | |||
|
Risk-weighted
assets
|
431,890 | |||
|
Tier 1 capital ratio
|
15.0 | % | ||
|
Total capital ratio
|
18.2 | % | ||
|
Tier 1 leverage ratio
|
7.6 | % | ||
Table of Contents
|
As of
|
||||
| December 2009 | ||||
|
Tier 1 capital ratio
|
14.9 | % | ||
|
Total capital ratio
|
19.3 | % | ||
|
Tier 1 leverage ratio
|
15.4 | % | ||
Table of Contents
Table of Contents
| Note 18. | Business Segments |
| • | Revenues and expenses directly associated with each segment are included in determining pre-tax earnings. | |
| • | Net revenues in the firm’s segments include allocations of interest income and interest expense to specific securities, commodities and other positions in relation to the cash generated by, or funding requirements of, such underlying positions. Net interest is included within segment net revenues as it is consistent with the way in which management assesses segment performance. | |
| • | Overhead expenses not directly allocable to specific segments are allocated ratably based on direct segment expenses. |
Table of Contents
| As of or for the | ||||||||||||||||||
| Year Ended | One Month Ended | |||||||||||||||||
|
December
|
November
|
November
|
December
|
|||||||||||||||
| 2009 | 2008 | 2007 | 2008 | |||||||||||||||
| (in millions) | ||||||||||||||||||
|
Investment
|
Net revenues | $ | 4,797 | $ | 5,185 | $ | 7,555 | $ | 135 | |||||||||
|
Banking
|
Operating expenses | 3,527 | 3,143 | 4,985 | 169 | |||||||||||||
| Pre-tax earnings/(loss) | $ | 1,270 | $ | 2,042 | $ | 2,570 | $ | (34 | ) | |||||||||
| Segment assets | $ | 1,482 | $ | 1,948 | $ | 5,526 | $ | 1,491 | ||||||||||
|
Trading and
|
Net revenues | $ | 34,373 | $ | 9,063 | $ | 31,226 | $ | (507 | ) | ||||||||
|
Principal
|
Operating expenses | 17,053 | 11,808 | 17,998 | 875 | |||||||||||||
|
Investments
|
Pre-tax earnings/(loss) | $ | 17,320 | $ | (2,745 | ) | $ | 13,228 | $ | (1,382 | ) | |||||||
| Segment assets | $ | 662,754 | $ | 645,267 | $ | 744,647 | $ | 871,323 | ||||||||||
|
Asset Management
|
Net revenues | $ | 6,003 | $ | 7,974 | $ | 7,206 | $ | 555 | |||||||||
|
and Securities
|
Operating expenses | 4,660 | 4,939 | 5,363 | 329 | |||||||||||||
|
Services
|
Pre-tax earnings | $ | 1,343 | $ | 3,035 | $ | 1,843 | $ | 226 | |||||||||
| Segment assets | $ | 184,706 | $ | 237,332 | $ | 369,623 | $ | 239,411 | ||||||||||
|
Total
|
Net revenues (1)(2) | $ | 45,173 | $ | 22,222 | $ | 45,987 | $ | 183 | |||||||||
| Operating expenses (3) | 25,344 | 19,886 | 28,383 | 1,441 | ||||||||||||||
| Pre-tax earnings/(loss) (4) | $ | 19,829 | $ | 2,336 | $ | 17,604 | $ | (1,258 | ) | |||||||||
| Total assets | $ | 848,942 | $ | 884,547 | $ | 1,119,796 | $ | 1,112,225 | ||||||||||
| (1) | Net revenues include net interest income as set forth in the table below: |
| Year Ended | One Month Ended | |||||||||||||||
|
December
|
November
|
November
|
December
|
|||||||||||||
| 2009 | 2008 | 2007 | 2008 | |||||||||||||
| (in millions) | ||||||||||||||||
|
Investment Banking
|
$ | — | $ | 6 | $ | — | $ | — | ||||||||
|
Trading and Principal Investments
|
5,494 | 968 | 1,512 | 457 | ||||||||||||
|
Asset Management and Securities Services
|
1,913 | 3,302 | 2,475 | 228 | ||||||||||||
|
Total net interest
|
$ | 7,407 | $ | 4,276 | $ | 3,987 | $ | 685 | ||||||||
| (2) | Net revenues include non-interest revenues as set forth in the table below: |
| Year Ended | One Month Ended | |||||||||||||||
|
December
|
November
|
November
|
December
|
|||||||||||||
| 2009 | 2008 | 2007 | 2008 | |||||||||||||
| (in millions) | ||||||||||||||||
|
Investment banking fees
|
$ | 4,797 | $ | 5,179 | $ | 7,555 | $ | 135 | ||||||||
|
Equities commissions
|
3,840 | 4,998 | 4,579 | 251 | ||||||||||||
|
Asset management and other fees
|
4,090 | 4,672 | 4,731 | 327 | ||||||||||||
|
Trading and principal investments revenues
|
25,039 | 3,097 | 25,135 | (1,215 | ) | |||||||||||
|
Total
non-interest
revenues
|
$ | 37,766 | $ | 17,946 | $ | 42,000 | $ | (502 | ) | |||||||
Table of Contents
| (3) | Operating expenses include net provisions for a number of litigation and regulatory proceedings of $104 million, $(4) million, $37 million and $68 million for the years ended December 2009, November 2008 and November 2007 and one month ended December 2008, respectively, that have not been allocated to the firm’s segments. | |
| (4) | Pre-tax earnings include total depreciation and amortization as set forth in the table below: |
| Year Ended | One Month Ended | |||||||||||||||
|
December
|
November
|
November
|
December
|
|||||||||||||
| 2009 | 2008 | 2007 | 2008 | |||||||||||||
| (in millions) | ||||||||||||||||
|
Investment Banking
|
$ | 159 | $ | 187 | $ | 137 | $ | 14 | ||||||||
|
Trading and Principal Investments
|
1,510 | 1,161 | 845 | 101 | ||||||||||||
|
Asset Management and Securities Services
|
274 | 277 | 185 | 28 | ||||||||||||
|
Total depreciation and amortization
|
$ | 1,943 | $ | 1,625 | $ | 1,167 | $ | 143 | ||||||||
| • | Investment Banking: location of the client and investment banking team. | |
| • | Fixed Income, Currency and Commodities, and Equities: location of the trading desk. | |
| • | Principal Investments: location of the investment. | |
| • | Asset Management: location of the sales team. | |
| • | Securities Services: location of the primary market for the underlying security. |
Table of Contents
| Year Ended | One Month Ended | |||||||||||||||||||||||||||||||
|
December
|
November
|
November
|
December
|
|||||||||||||||||||||||||||||
| 2009 | 2008 | 2007 | 2008 | |||||||||||||||||||||||||||||
| ($ in millions) | ||||||||||||||||||||||||||||||||
|
Net revenues
|
||||||||||||||||||||||||||||||||
|
Americas
(1)
|
$ | 25,313 | 56 | % | $ | 15,485 | 70 | % | $ | 23,412 | 51 | % | $ | 197 | N.M. | |||||||||||||||||
|
EMEA
(2)
|
11,595 | 26 | 5,910 | 26 | 13,538 | 29 | (440 | ) | N.M. | |||||||||||||||||||||||
|
Asia
|
8,265 | 18 | 827 | 4 | 9,037 | 20 | 426 | N.M. | ||||||||||||||||||||||||
|
Total net revenues
|
$ | 45,173 | 100 | % | $ | 22,222 | 100 | % | $ | 45,987 | 100 | % | $ | 183 | 100 | % | ||||||||||||||||
|
Pre-tax
earnings/(loss)
|
||||||||||||||||||||||||||||||||
|
Americas
(1)
|
$ | 10,690 | 54 | % | $ | 4,879 | N.M. | $ | 7,673 | 43 | % | $ | (555 | ) | N.M. | |||||||||||||||||
|
EMEA
(2)
|
5,411 | 27 | 169 | N.M. | 5,458 | 31 | (806 | ) | N.M. | |||||||||||||||||||||||
|
Asia
|
3,832 | 19 | (2,716 | ) | N.M. | 4,510 | 26 | 171 | N.M. | |||||||||||||||||||||||
|
Corporate
(3)
|
(104 | ) | N.M. | 4 | N.M. | (37 | ) | N.M. | (68 | ) | N.M. | |||||||||||||||||||||
|
Total
pre-tax
earnings/(loss)
|
$ | 19,829 | 100 | % | $ | 2,336 | 100 | % | $ | 17,604 | 100 | % | $ | (1,258 | ) | 100 | % | |||||||||||||||
|
Net earnings/(loss)
|
||||||||||||||||||||||||||||||||
|
Americas
(1)
|
$ | 6,639 | 49 | % | $ | 3,371 | N.M. | $ | 4,981 | 43 | % | $ | (366 | ) | N.M. | |||||||||||||||||
|
EMEA
(2)
|
4,129 | 31 | 694 | N.M. | 3,735 | 32 | (498 | ) | N.M. | |||||||||||||||||||||||
|
Asia
|
2,686 | 20 | (1,746 | ) | N.M. | 2,907 | 25 | 130 | N.M. | |||||||||||||||||||||||
|
Corporate
(3)
|
(69 | ) | N.M. | 3 | N.M. | (24 | ) | N.M. | (46 | ) | N.M. | |||||||||||||||||||||
|
Total net earnings/(loss)
|
$ | 13,385 | 100 | % | $ | 2,322 | 100 | % | $ | 11,599 | 100 | % | $ | (780 | ) | 100 | % | |||||||||||||||
| (1) | Substantially all relates to the U.S. |
| (2) | EMEA (Europe, Middle East and Africa). |
| (3) | Consists of net provisions for a number of litigation and regulatory proceedings. |
Table of Contents
| Note 19. | Interest Income and Interest Expense |
| Year Ended | One Month Ended | |||||||||||||||
|
December
|
November
|
November
|
December
|
|||||||||||||
| 2009 | 2008 | 2007 | 2008 | |||||||||||||
| (in millions) | ||||||||||||||||
|
Interest
income
(1)
|
||||||||||||||||
|
Deposits with banks
|
$ | 65 | $ | 188 | $ | 119 | $ | 2 | ||||||||
|
Securities borrowed, securities purchased under agreements to
resell and federal funds sold
|
951 | 11,746 | 18,013 | 301 | ||||||||||||
|
Trading assets, at fair value
|
11,106 | 13,150 | 13,120 | 1,172 | ||||||||||||
|
Other
interest
(2)
|
1,785 | 10,549 | 14,716 | 212 | ||||||||||||
|
Total interest income
|
$ | 13,907 | $ | 35,633 | $ | 45,968 | $ | 1,687 | ||||||||
|
Interest expense
|
||||||||||||||||
|
Deposits
|
$ | 415 | $ | 756 | $ | 677 | $ | 51 | ||||||||
|
Securities loaned and securities sold under agreements to
repurchase, at fair value
|
1,317 | 7,414 | 12,612 | 229 | ||||||||||||
|
Trading liabilities, at fair value
|
1,854 | 2,789 | 3,866 | 174 | ||||||||||||
|
Short-term
borrowings
(3)
|
623 | 1,864 | 3,398 | 107 | ||||||||||||
|
Long-term
borrowings
(4)
|
2,585 | 6,975 | 6,830 | 297 | ||||||||||||
|
Other
interest
(5)
|
(294 | ) | 11,559 | 14,598 | 144 | |||||||||||
|
Total interest expense
|
$ | 6,500 | $ | 31,357 | $ | 41,981 | $ | 1,002 | ||||||||
|
Net interest income
|
$ | 7,407 | $ | 4,276 | $ | 3,987 | $ | 685 | ||||||||
| (1) | Interest income is recorded on an accrual basis based on contractual interest rates. | |
| (2) | Primarily includes interest income on customer debit balances and other interest-earning assets. | |
| (3) | Includes interest on unsecured short-term borrowings and short-term other secured financings. | |
| (4) | Includes interest on unsecured long-term borrowings and long-term other secured financings. | |
| (5) | Primarily includes interest expense on customer credit balances and other interest-bearing liabilities. |
Table of Contents
| Note 20. | Parent Company |
|
One
|
||||||||||||||||
|
Month
|
||||||||||||||||
| Year Ended | Ended | |||||||||||||||
|
December
|
November
|
November
|
December
|
|||||||||||||
| (in millions) | 2009 | 2008 | 2007 | 2008 | ||||||||||||
|
Revenues
|
||||||||||||||||
|
Dividends from bank subsidiary
|
$ | — | $ | 2,922 | $ | 18 | $ | 5 | ||||||||
|
Dividends from nonbank subsidiaries
|
8,793 | 3,716 | 4,273 | 130 | ||||||||||||
|
Undistributed earnings/(loss) of subsidiaries
|
5,884 | (3,971 | ) | 6,708 | (1,115 | ) | ||||||||||
|
Other revenues
|
(1,018 | ) | (2,886 | ) | 2,062 | (1,004 | ) | |||||||||
|
Interest income
|
4,565 | 7,167 | 9,049 | 462 | ||||||||||||
|
|
||||||||||||||||
|
Total revenues
|
18,224 | 6,948 | 22,110 | (1,522 | ) | |||||||||||
|
Interest expense
|
3,112 | 8,229 | 8,914 | 448 | ||||||||||||
|
Revenues, net of interest expense
|
15,112 | (1,281 | ) | 13,196 | (1,970 | ) | ||||||||||
|
Operating expenses
|
||||||||||||||||
|
Compensation and benefits
|
637 | 122 | 780 | (94 | ) | |||||||||||
|
Other expenses
|
1,034 | 471 | 281 | 32 | ||||||||||||
|
Total operating expenses
|
1,671 | 593 | 1,061 | (62 | ) | |||||||||||
|
Pre-tax
earnings/(loss)
|
13,441 | (1,874 | ) | 12,135 | (1,908 | ) | ||||||||||
|
Provision/(benefit) for taxes
|
56 | (4,196 | ) | 536 | (1,128 | ) | ||||||||||
|
Net earnings/(loss)
|
13,385 | 2,322 | 11,599 | (780 | ) | |||||||||||
|
Preferred stock dividends
|
1,193 | 281 | 192 | 248 | ||||||||||||
|
Net earnings/(loss) applicable to common shareholders
|
$ | 12,192 | $ | 2,041 | $ | 11,407 | $ | (1,028 | ) | |||||||
|
|
||||||||||||||||
| As of | ||||||||
|
December
|
November
|
|||||||
| (in millions) | 2009 | 2008 | ||||||
|
Assets
|
||||||||
|
Cash and cash equivalents
|
$ | 1,140 | $ | 1,035 | ||||
|
Loans to and receivables from subsidiaries
|
||||||||
|
Bank subsidiary
|
5,564 | 19,247 | ||||||
|
Nonbank subsidiaries
|
177,952 | 157,086 | ||||||
|
Investments in subsidiaries and associates
|
||||||||
|
Bank subsidiary
|
17,318 | 13,322 | ||||||
|
Nonbank subsidiaries and associates
|
48,421 | 38,375 | ||||||
|
Trading assets, at fair value
|
23,977 | 40,171 | ||||||
|
Other assets
|
11,254 | 10,414 | ||||||
|
Total assets
|
$ | 285,626 | $ | 279,650 | ||||
|
Liabilities and shareholders’ equity
|
||||||||
|
Unsecured
short-term
borrowings
(1)
|
||||||||
|
With third parties
|
$ | 24,604 | $ | 37,941 | ||||
|
With subsidiaries
|
4,208 | 7,462 | ||||||
|
Payables to subsidiaries
|
509 | 754 | ||||||
|
Trading liabilities, at fair value
|
1,907 | 3,530 | ||||||
|
Other liabilities
|
6,682 | 5,247 | ||||||
|
Unsecured
long-term
borrowings
(2)
|
||||||||
|
With third parties
|
175,300 | 158,472 | ||||||
|
With
subsidiaries
(3)
|
1,702 | 1,875 | ||||||
|
Total liabilities
|
214,912 | 215,281 | ||||||
|
Commitments, contingencies and guarantees
|
||||||||
|
Shareholders’ equity
|
||||||||
|
Preferred stock
|
6,957 | 16,471 | ||||||
|
Common stock
|
8 | 7 | ||||||
|
Restricted stock units and employee stock options
|
6,245 | 9,284 | ||||||
|
Additional
paid-in
capital
|
39,770 | 31,071 | ||||||
|
Retained earnings
|
50,252 | 39,913 | ||||||
|
Accumulated other comprehensive loss
|
(362 | ) | (202 | ) | ||||
|
Common stock held in treasury, at cost
|
(32,156 | ) | (32,175 | ) | ||||
|
Total shareholders’ equity
|
70,714 | 64,369 | ||||||
|
Total liabilities and shareholders’ equity
|
$ | 285,626 | $ | 279,650 | ||||
|
|
||||||||
|
One
|
||||||||||||||||
|
Month
|
||||||||||||||||
| Year Ended | Ended | |||||||||||||||
|
December
|
November
|
November
|
December
|
|||||||||||||
| (in millions) | 2009 | 2008 | 2007 | 2008 | ||||||||||||
|
Cash flows from operating activities
|
||||||||||||||||
|
Net earnings/(loss)
|
$ | 13,385 | $ | 2,322 | $ | 11,599 | $ | (780 | ) | |||||||
|
Non-cash
items included in net earnings
|
||||||||||||||||
|
Undistributed (earnings)/loss of subsidiaries
|
(5,884 | ) | 3,971 | (6,708 | ) | 1,115 | ||||||||||
|
Depreciation and
amortization
(4)
|
39 | 36 | 35 | 3 | ||||||||||||
|
Deferred income taxes
|
(3,347 | ) | (2,178 | ) | 877 | (847 | ) | |||||||||
|
Share-based
compensation
|
100 | 40 | 459 | — | ||||||||||||
|
Changes in operating assets and liabilities
|
||||||||||||||||
|
Trading assets, at fair value
|
24,382 | (4,661 | ) | (17,795 | ) | (8,188 | ) | |||||||||
|
Trading liabilities, at fair value
|
(1,032 | ) | 1,559 | 86 | (557 | ) | ||||||||||
|
Other,
net
(4)
|
10,081 | (12,162 | ) | 12,111 | 4,091 | |||||||||||
|
Net cash provided by/(used for) operating activities
|
37,724 | (11,073 | ) | 664 | (5,163 | ) | ||||||||||
|
Cash flows from investing activities
|
||||||||||||||||
|
Purchase of property, leasehold improvements and equipment
|
(5 | ) | (49 | ) | (29 | ) | — | |||||||||
|
Proceeds from sales of property, leasehold improvements and
equipment
|
— | — | 11 | — | ||||||||||||
|
Issuance of short-term loans to subsidiaries, net of repayments
|
(6,335 | ) | 3,701 | (22,668 | ) | 1,923 | ||||||||||
|
Issuance of term loans to subsidiaries
|
(13,823 | ) | (14,242 | ) | (48,299 | ) | (1,687 | ) | ||||||||
|
Repayments of term loans by subsidiaries
|
9,601 | 24,925 | 41,143 | 714 | ||||||||||||
|
Capital contributions to subsidiaries, net
|
(2,781 | ) | (22,245 | ) | (4,517 | ) | (6,179 | ) | ||||||||
|
Net cash used for investing activities
|
(13,343 | ) | (7,910 | ) | (34,359 | ) | (5,229 | ) | ||||||||
|
Cash flows from financing activities
|
||||||||||||||||
|
Unsecured
short-term
borrowings, net
|
(13,266 | ) | (10,564 | ) | 3,255 | 4,616 | ||||||||||
|
Secured
short-term
financings, net
|
— | — | (380 | ) | — | |||||||||||
|
Proceeds from issuance of
long-term
borrowings
|
22,814 | 35,645 | 53,041 | 9,171 | ||||||||||||
|
Repayment of
long-term
borrowings, including the current portion
|
(27,374 | ) | (23,959 | ) | (13,984 | ) | (3,358 | ) | ||||||||
|
Common stock repurchased
|
(2 | ) | (2,034 | ) | (8,956 | ) | (1 | ) | ||||||||
|
Preferred stock repurchased
|
(9,574 | ) | — | — | — | |||||||||||
|
Repurchase of common stock warrants
|
(1,100 | ) | — | — | — | |||||||||||
|
Dividends and dividend equivalents paid on common stock,
preferred stock and restricted stock units
|
(2,205 | ) | (850 | ) | (831 | ) | — | |||||||||
|
Proceeds from issuance of common stock, including stock option
exercises
|
6,260 | 6,105 | 791 | 2 | ||||||||||||
|
Proceeds from issuance of preferred stock, net of issuance costs
|
— | 13,366 | — | — | ||||||||||||
|
Proceeds from issuance of common stock warrants
|
— | 1,633 | — | — | ||||||||||||
|
Excess tax benefit related to
share-based
compensation
|
135 | 614 | 817 | — | ||||||||||||
|
Cash settlement of
share-based
compensation
|
(2 | ) | — | (1 | ) | — | ||||||||||
|
Net cash provided by/(used for) financing activities
|
(24,314 | ) | 19,956 | 33,752 | 10,430 | |||||||||||
|
Net increase in cash and cash equivalents
|
67 | 973 | 57 | 38 | ||||||||||||
|
Cash and cash equivalents, beginning of year
|
1,073 | 62 | 5 | 1,035 | ||||||||||||
|
Cash and cash equivalents, end of year
|
$ | 1,140 | $ | 1,035 | $ | 62 | $ | 1,073 | ||||||||
|
|
||||||||||||||||
|
(1)
Includes
$6.57 billion and $11.67 billion at fair value as of
December 2009 and November 2008, respectively.
|
||
|
(2)
Includes
$13.67 billion and $10.90 billion at fair value as of
December 2009 and November 2008, respectively.
|
||
|
(3)
Unsecured
long-term
borrowings with subsidiaries by maturity date are $1.05 billion
in 2011, $98 million in 2012, $179 million in 2013,
$64 million in 2014 and $309 million in
2015-thereafter.
|
||
|
(4)
Prior
periods have been reclassified to conform to the current
presentation.
|
Table of Contents
| Three Months Ended (1) | ||||||||||||||||
|
March
|
June
|
September
|
December
|
|||||||||||||
| 2009 | 2009 | 2009 | 2009 | |||||||||||||
| (in millions, except per share data) | ||||||||||||||||
|
Total
non-interest
revenues
|
$ | 7,518 | $ | 11,719 | $ | 10,682 | $ | 7,847 | ||||||||
|
Interest income
|
4,362 | 3,470 | 3,000 | 3,075 | ||||||||||||
|
Interest expense
|
2,455 | 1,428 | 1,310 | 1,307 | ||||||||||||
|
Net interest income
|
1,907 | 2,042 | 1,690 | 1,768 | ||||||||||||
|
Net revenues, including net interest income
|
9,425 | 13,761 | 12,372 | 9,615 | ||||||||||||
|
Operating
expenses
(2)
|
6,796 | 8,732 | 7,578 | 2,238 | ||||||||||||
|
Pre-tax
earnings
|
2,629 | 5,029 | 4,794 | 7,377 | ||||||||||||
|
Provision for taxes
|
815 | 1,594 | 1,606 | 2,429 | ||||||||||||
|
Net earnings
|
1,814 | 3,435 | 3,188 | 4,948 | ||||||||||||
|
Preferred stock dividends
|
155 | 717 | 160 | 161 | ||||||||||||
|
Net earnings applicable to common shareholders
|
$ | 1,659 | $ | 2,718 | $ | 3,028 | $ | 4,787 | ||||||||
|
Earnings per common share
|
||||||||||||||||
|
Basic
|
$ | 3.48 | $ | 5.27 | $ | 5.74 | $ | 9.01 | ||||||||
|
Diluted
|
3.39 | 4.93 | 5.25 | 8.20 | ||||||||||||
|
Dividends declared per common share
|
— | 0.35 | 0.35 | 0.35 | ||||||||||||
| Three Months Ended (1) | ||||||||||||||||
|
February
|
May
|
August
|
November
|
|||||||||||||
| 2008 | 2008 | 2008 | 2008 | |||||||||||||
| (in millions, except per share data) | ||||||||||||||||
|
Total
non-interest
revenues
|
$ | 7,384 | $ | 8,145 | $ | 4,908 | $ | (2,491 | ) | |||||||
|
Interest income
|
11,245 | 9,498 | 8,717 | 6,173 | ||||||||||||
|
Interest expense
|
10,294 | 8,221 | 7,582 | 5,260 | ||||||||||||
|
Net interest income
|
951 | 1,277 | 1,135 | 913 | ||||||||||||
|
Net revenues, including net interest income
|
8,335 | 9,422 | 6,043 | (1,578 | ) | |||||||||||
|
Operating
expenses
(2)
|
6,192 | 6,590 | 5,083 | 2,021 | ||||||||||||
|
Pre-tax
earnings/(loss)
|
2,143 | 2,832 | 960 | (3,599 | ) | |||||||||||
|
Provision/(benefit) for taxes
|
632 | 745 | 115 | (1,478 | ) | |||||||||||
|
Net earnings/(loss)
|
1,511 | 2,087 | 845 | (2,121 | ) | |||||||||||
|
Preferred stock dividends
|
44 | 36 | 35 | 166 | ||||||||||||
|
Net earnings/(loss) applicable to common shareholders
|
$ | 1,467 | $ | 2,051 | $ | 810 | $ | (2,287 | ) | |||||||
|
Earnings/(loss) per common share
|
||||||||||||||||
|
Basic
|
$ | 3.39 | $ | 4.80 | $ | 1.89 | $ | (4.97 | ) | |||||||
|
Diluted
|
3.23 | 4.58 | 1.81 | (4.97 | ) | |||||||||||
|
Dividends declared per common share
|
0.35 | 0.35 | 0.35 | 0.35 | ||||||||||||
| (1) | Financial information for the three months ended March 2008, June 2008, September 2008 and December 2008 has not been included for the following reasons: (i) the three months ended February 2008, May 2008, August 2008 and November 2008 (collectively, the 2008 quarters) provide a meaningful comparison for the three months ended March 2009, June 2009, September 2009 and December 2009 (collectively, the 2009 quarters), respectively; (ii) there are no seasonal or other factors that would impact the comparability of the results for the 2009 quarters with the results for the 2008 quarters; and (iii) it was not practicable or cost justified to prepare this information. |
| (2) | The timing and magnitude of changes in the firm’s discretionary compensation accruals can have a significant effect on results in a given quarter. |
Table of Contents
| Year Ended | ||||||||||||||||||||||||
|
December
|
November
|
November
|
||||||||||||||||||||||
| 2009 | 2008 | 2007 | ||||||||||||||||||||||
|
High
|
Low
|
High
|
Low
|
High
|
Low
|
|||||||||||||||||||
|
First quarter
|
$ | 115.65 | $ | 59.13 | $ | 229.35 | $ | 169.00 | $ | 222.75 | $ | 191.50 | ||||||||||||
|
Second quarter
|
151.17 | 100.46 | 203.39 | 140.27 | 232.41 | 189.85 | ||||||||||||||||||
|
Third quarter
|
188.00 | 135.23 | 190.04 | 152.25 | 233.97 | 157.38 | ||||||||||||||||||
|
Fourth quarter
|
193.60 | 160.20 | 172.45 | 47.41 | 250.70 | 175.00 | ||||||||||||||||||
Table of Contents
| As of or for the | ||||||||||||||||||||||||
| Year Ended | One Month Ended | |||||||||||||||||||||||
|
December
|
November
|
November
|
November
|
November
|
December
|
|||||||||||||||||||
| 2009 | 2008 | 2007 | 2006 | 2005 | 2008 | |||||||||||||||||||
|
Income statement data (in millions)
|
||||||||||||||||||||||||
|
Total
non-interest
revenues
|
$ | 37,766 | $ | 17,946 | $ | 42,000 | $ | 34,167 | $ | 22,141 | $ | (502 | ) | |||||||||||
|
Interest income
|
13,907 | 35,633 | 45,968 | 35,186 | 21,250 | 1,687 | ||||||||||||||||||
|
Interest expense
|
6,500 | 31,357 | 41,981 | 31,688 | 18,153 | 1,002 | ||||||||||||||||||
|
Net interest income
|
7,407 | 4,276 | 3,987 | 3,498 | 3,097 | 685 | ||||||||||||||||||
|
Net revenues, including net interest income
|
45,173 | 22,222 | 45,987 | 37,665 | 25,238 | 183 | ||||||||||||||||||
|
Compensation and benefits
|
16,193 | 10,934 | 20,190 | 16,457 | 11,758 | 744 | ||||||||||||||||||
|
Other operating expenses
|
9,151 | 8,952 | 8,193 | 6,648 | 5,207 | 697 | ||||||||||||||||||
|
Pre-tax
earnings/(loss)
|
$ | 19,829 | $ | 2,336 | $ | 17,604 | $ | 14,560 | $ | 8,273 | $ | (1,258 | ) | |||||||||||
|
Balance sheet data (in millions)
|
||||||||||||||||||||||||
|
Total assets
|
$ | 848,942 | $ | 884,547 | $ | 1,119,796 | $ | 838,201 | $ | 706,804 | $ | 1,112,225 | ||||||||||||
|
Other secured financings
(long-term)
|
11,203 | 17,458 | 33,300 | 26,134 | 15,669 | 18,413 | ||||||||||||||||||
|
Unsecured
long-term
borrowings
|
185,085 | 168,220 | 164,174 | 122,842 | 84,338 | 185,564 | ||||||||||||||||||
|
Total liabilities
|
778,228 | 820,178 | 1,076,996 | 802,415 | 678,802 | 1,049,171 | ||||||||||||||||||
|
Total shareholders’ equity
|
70,714 | 64,369 | 42,800 | 35,786 | 28,002 | 63,054 | ||||||||||||||||||
|
Common share data (in millions, except per share amounts)
|
||||||||||||||||||||||||
|
Earnings/(loss) per common share
|
||||||||||||||||||||||||
|
Basic
|
$ | 23.74 | $ | 4.67 | $ | 26.34 | $ | 20.93 | $ | 11.73 | $ | (2.15 | ) | |||||||||||
|
Diluted
|
22.13 | 4.47 | 24.73 | 19.69 | 11.21 | (2.15 | ) | |||||||||||||||||
|
Dividends declared per common share
|
1.05 | 1.40 | 1.40 | 1.30 | 1.00 | 0.47 | (5) | |||||||||||||||||
|
Book value per common
share
(1)
|
117.48 | 98.68 | 90.43 | 72.62 | 57.02 | 95.84 | ||||||||||||||||||
|
Average common shares outstanding
|
||||||||||||||||||||||||
|
Basic
|
512.3 | 437.0 | 433.0 | 449.0 | 478.1 | 485.5 | ||||||||||||||||||
|
Diluted
|
550.9 | 456.2 | 461.2 | 477.4 | 500.2 | 485.5 | ||||||||||||||||||
|
Selected data (unaudited)
|
||||||||||||||||||||||||
|
Total staff
|
||||||||||||||||||||||||
|
Americas
|
18,900 | 19,700 | 20,100 | 18,100 | 16,900 | 19,200 | ||||||||||||||||||
|
Non-Americas
|
13,600 | 14,800 | 15,400 | 12,800 | 10,600 | 14,100 | ||||||||||||||||||
|
Total
staff
(2)
|
32,500 | 34,500 | 35,500 | 30,900 | 27,500 | 33,300 | ||||||||||||||||||
|
Total staff, including consolidated entities held for investment
purposes
|
36,200 | 39,200 | 40,000 | 34,700 | 34,900 | 38,000 | ||||||||||||||||||
|
Assets under management (in
billions)
(3)
|
||||||||||||||||||||||||
|
Asset class
|
||||||||||||||||||||||||
|
Alternative
investments
(4)
|
$ | 146 | $ | 146 | $ | 151 | $ | 145 | $ | 110 | $ | 145 | ||||||||||||
|
Equity
|
146 | 112 | 255 | 215 | 167 | 114 | ||||||||||||||||||
|
Fixed income
|
315 | 248 | 256 | 198 | 154 | 253 | ||||||||||||||||||
|
Total
non-money
market assets
|
607 | 506 | 662 | 558 | 431 | 512 | ||||||||||||||||||
|
Money markets
|
264 | 273 | 206 | 118 | 101 | 286 | ||||||||||||||||||
|
Total assets under management
|
$ | 871 | $ | 779 | $ | 868 | $ | 676 | $ | 532 | $ | 798 | ||||||||||||
| (1) | Book value per common share is based on common shares outstanding, including RSUs granted to employees with no future service requirements, of 542.7 million, 485.4 million, 439.0 million, 450.1 million, 460.4 million and 485.9 million as of December 2009, November 2008, November 2007, November 2006, November 2005 and December 2008, respectively. |
| (2) | Includes employees, consultants and temporary staff. |
| (3) | Substantially all assets under management are valued as of calendar month-end. |
| (4) | Primarily includes hedge funds, private equity, real estate, currencies, commodities and asset allocation strategies. |
| (5) | Rounded to the nearest penny. Exact dividend amount was $0.4666666 per common share and was reflective of a four-month period (December 2008 through March 2009), due to the change in the firm’s fiscal year-end. |
Table of Contents
| For the Year Ended | ||||||||||||||||||||||||||||||||||||
| December 2009 | November 2008 | November 2007 | ||||||||||||||||||||||||||||||||||
|
Average
|
Average
|
Average
|
Average
|
Average
|
Average
|
|||||||||||||||||||||||||||||||
|
balance
|
Interest
|
rate
|
balance
|
Interest
|
rate
|
balance
|
Interest
|
rate
|
||||||||||||||||||||||||||||
| (in millions, except rates) | ||||||||||||||||||||||||||||||||||||
|
Assets
|
||||||||||||||||||||||||||||||||||||
|
Deposits with banks
|
$ | 22,108 | $ | 65 | 0.29 | % | $ | 5,887 | $ | 188 | 3.19 | % | $ | 3,516 | $ | 119 | 3.38 | % | ||||||||||||||||||
|
U.S.
|
18,134 | 45 | 0.25 | 1,541 | 41 | 2.66 | 741 | 23 | 3.10 | |||||||||||||||||||||||||||
|
Non-U.S.
|
3,974 | 20 | 0.50 | 4,346 | 147 | 3.38 | 2,775 | 96 | 3.46 | |||||||||||||||||||||||||||
|
Securities borrowed, securities purchased under agreements to
resell, at fair value, and federal funds sold
|
355,636 | 951 | 0.27 | 421,157 | 11,746 | 2.79 | 348,691 | 18,013 | 5.17 | |||||||||||||||||||||||||||
|
U.S.
|
255,785 | 14 | 0.01 | 331,043 | 8,791 | 2.66 | 279,456 | 15,449 | 5.53 | |||||||||||||||||||||||||||
|
Non-U.S.
|
99,851 | 937 | 0.94 | 90,114 | 2,955 | 3.28 | 69,235 | 2,564 | 3.70 | |||||||||||||||||||||||||||
|
Trading
assets
(1)(2)
|
277,706 | 11,106 | 4.00 | 328,208 | 13,150 | 4.01 | 336,412 | 13,120 | 3.90 | |||||||||||||||||||||||||||
|
U.S.
|
198,849 | 8,429 | 4.24 | 186,498 | 7,700 | 4.13 | 190,589 | 8,167 | 4.29 | |||||||||||||||||||||||||||
|
Non-U.S.
|
78,857 | 2,677 | 3.39 | 141,710 | 5,450 | 3.85 | 145,823 | 4,953 | 3.40 | |||||||||||||||||||||||||||
|
Other interest-earning
assets
(3)
|
127,067 | 1,785 | 1.40 | 221,040 | 10,549 | 4.77 | 203,048 | 14,716 | 7.25 | |||||||||||||||||||||||||||
|
U.S.
|
83,000 | 1,052 | 1.27 | 131,778 | 4,438 | 3.37 | 97,830 | 6,480 | 6.62 | |||||||||||||||||||||||||||
|
Non-U.S.
|
44,067 | 733 | 1.66 | 89,262 | 6,111 | 6.85 | 105,218 | 8,236 | 7.83 | |||||||||||||||||||||||||||
|
Total interest-earning assets
|
782,517 | 13,907 | 1.78 | 976,292 | 35,633 | 3.65 | 891,667 | 45,968 | 5.16 | |||||||||||||||||||||||||||
|
Cash and due from banks
|
5,066 | 7,975 | 3,926 | |||||||||||||||||||||||||||||||||
|
Other noninterest-earning
assets
(2)
|
124,554 | 154,727 | 102,312 | |||||||||||||||||||||||||||||||||
|
Total Assets
|
$ | 912,137 | $ | 1,138,994 | $ | 997,905 | ||||||||||||||||||||||||||||||
|
Liabilities
|
||||||||||||||||||||||||||||||||||||
|
Interest-bearing deposits
|
$ | 41,076 | 415 | 1.01 | $ | 26,455 | 756 | 2.86 | $ | 13,227 | 677 | 5.12 | ||||||||||||||||||||||||
|
U.S.
|
35,043 | 371 | 1.06 | 21,598 | 617 | 2.86 | 13,128 | 674 | 5.13 | |||||||||||||||||||||||||||
|
Non-U.S.
|
6,033 | 44 | 0.73 | 4,857 | 139 | 2.86 | 99 | 3 | 3.03 | |||||||||||||||||||||||||||
|
Securities loaned and securities sold under agreements to
repurchase, at fair value
|
156,794 | 1,317 | 0.84 | 194,935 | 7,414 | 3.80 | 214,511 | 12,612 | 5.88 | |||||||||||||||||||||||||||
|
U.S.
|
111,718 | 392 | 0.35 | 107,361 | 3,663 | 3.41 | 95,391 | 7,697 | 8.07 | |||||||||||||||||||||||||||
|
Non-U.S.
|
45,076 | 925 | 2.05 | 87,574 | 3,751 | 4.28 | 119,120 | 4,915 | 4.13 | |||||||||||||||||||||||||||
|
Trading
liabilities
(1)(2)
|
72,866 | 1,854 | 2.54 | 95,377 | 2,789 | 2.92 | 109,736 | 3,866 | 3.52 | |||||||||||||||||||||||||||
|
U.S.
|
39,647 | 586 | 1.48 | 49,152 | 1,202 | 2.45 | 61,510 | 2,334 | 3.79 | |||||||||||||||||||||||||||
|
Non-U.S.
|
33,219 | 1,268 | 3.82 | 46,225 | 1,587 | 3.43 | 48,226 | 1,532 | 3.18 | |||||||||||||||||||||||||||
|
Commercial paper
|
1,002 | 5 | 0.50 | 4,097 | 145 | 3.54 | 5,605 | 269 | 4.80 | |||||||||||||||||||||||||||
|
U.S.
|
284 | 3 | 1.06 | 3,147 | 121 | 3.84 | 4,871 | 242 | 4.97 | |||||||||||||||||||||||||||
|
Non-U.S.
|
718 | 2 | 0.28 | 950 | 24 | 2.53 | 734 | 27 | 3.68 | |||||||||||||||||||||||||||
|
Other
borrowings
(4)(5)
|
58,129 | 618 | 1.06 | 99,351 | 1,719 | 1.73 | 89,924 | 3,129 | 3.48 | |||||||||||||||||||||||||||
|
U.S.
|
36,164 | 525 | 1.45 | 52,126 | 1,046 | 2.01 | 44,789 | 1,779 | 3.97 | |||||||||||||||||||||||||||
|
Non-U.S.
|
21,965 | 93 | 0.42 | 47,225 | 673 | 1.43 | 45,135 | 1,350 | 2.99 | |||||||||||||||||||||||||||
|
Long-term
borrowings
(5)(6)
|
203,280 | 2,585 | 1.27 | 203,360 | 6,975 | 3.43 | 167,997 | 6,830 | 4.07 | |||||||||||||||||||||||||||
|
U.S.
|
192,054 | 2,313 | 1.20 | 181,775 | 6,271 | 3.45 | 158,694 | 6,416 | 4.04 | |||||||||||||||||||||||||||
|
Non-U.S.
|
11,226 | 272 | 2.42 | 21,585 | 704 | 3.26 | 9,303 | 414 | 4.45 | |||||||||||||||||||||||||||
|
Other interest-bearing
liabilities
(7)
|
207,148 | (294 | ) | (0.14 | ) | 345,956 | 11,559 | 3.34 | 248,640 | 14,598 | 5.87 | |||||||||||||||||||||||||
|
U.S.
|
147,206 | (723 | ) | (0.49 | ) | 214,780 | 6,275 | 2.92 | 142,002 | 10,567 | 7.44 | |||||||||||||||||||||||||
|
Non-U.S.
|
59,942 | 429 | 0.72 | 131,176 | 5,284 | 4.03 | 106,638 | 4,031 | 3.78 | |||||||||||||||||||||||||||
|
Total interest-bearing liabilities
|
740,295 | 6,500 | 0.88 | 969,531 | 31,357 | 3.23 | 849,640 | 41,981 | 4.94 | |||||||||||||||||||||||||||
|
Noninterest-bearing deposits
|
115 | 4 | — | |||||||||||||||||||||||||||||||||
|
Other noninterest-bearing
liabilities
(2)
|
106,200 | 122,292 | 110,306 | |||||||||||||||||||||||||||||||||
|
Total liabilities
|
846,610 | 1,091,827 | 959,946 | |||||||||||||||||||||||||||||||||
|
Shareholders’ equity
|
||||||||||||||||||||||||||||||||||||
|
Preferred stock
|
11,363 | 5,157 | 3,100 | |||||||||||||||||||||||||||||||||
|
Common stock
|
54,164 | 42,010 | 34,859 | |||||||||||||||||||||||||||||||||
|
Total shareholders’ equity
|
65,527 | 47,167 | 37,959 | |||||||||||||||||||||||||||||||||
|
Total liabilities, preferred stock and shareholders’
equity
|
$ | 912,137 | $ | 1,138,994 | $ | 997,905 | ||||||||||||||||||||||||||||||
|
Interest rate spread
|
0.90 | % | 0.42 | % | 0.22 | % | ||||||||||||||||||||||||||||||
|
Net interest income and net yield on interest-earning assets
|
$ | 7,407 | 0.95 | $ | 4,276 | 0.44 | $ | 3,987 | 0.45 | |||||||||||||||||||||||||||
|
U.S.
|
6,073 | 1.09 | 1,775 | 0.27 | 410 | 0.07 | ||||||||||||||||||||||||||||||
|
Non-U.S.
|
1,334 | 0.59 | 2,501 | 0.77 | 3,577 | 1.11 | ||||||||||||||||||||||||||||||
|
Percentage of interest-earning assets and interest-bearing
liabilities attributable to
non-U.S. operations
(8)
|
||||||||||||||||||||||||||||||||||||
|
Assets
|
28.98 | % | 33.33 | % | 36.23 | % | ||||||||||||||||||||||||||||||
|
Liabilities
|
24.07 | 35.03 | 38.75 | |||||||||||||||||||||||||||||||||
Table of Contents
| (1) | Consists of cash trading instruments, including equity securities and convertible debentures. |
| (2) | Derivative instruments are included in other noninterest-earning assets and other noninterest-bearing liabilities. |
| (3) | Primarily consists of cash and securities segregated for regulatory and other purposes and receivables from customers and counterparties. |
| (4) | Consists of short-term other secured financings and unsecured short-term borrowings, excluding commercial paper. |
| (5) | Interest rates include the effects of interest rate swaps accounted for as hedges. |
| (6) | Consists of long-term other secured financings and unsecured long-term borrowings. |
| (7) | Primarily consists of payables to customers and counterparties. |
| (8) | Assets, liabilities and interest are attributed to U.S. and non-U.S. based on the location of the legal entity in which the assets and liabilities are held. |
Table of Contents
| For the Year Ended | ||||||||||||||||||||||||
| December 2009 versus November 2008 | November 2008 versus November 2007 | |||||||||||||||||||||||
| Increase (decrease) due to change in: | Increase (decrease) due to change in: | |||||||||||||||||||||||
|
Net
|
Net
|
|||||||||||||||||||||||
|
Volume
|
Rate
|
change
|
Volume
|
Rate
|
change
|
|||||||||||||||||||
| (in millions) | ||||||||||||||||||||||||
|
Interest-earning assets
|
||||||||||||||||||||||||
|
Deposits with banks
|
$ | 39 | $ | (162 | ) | $ | (123 | ) | $ | 74 | $ | (5 | ) | $ | 69 | |||||||||
|
U.S.
|
41 | (37 | ) | 4 | 21 | (3 | ) | 18 | ||||||||||||||||
|
Non-U.S.
|
(2 | ) | (125 | ) | (127 | ) | 53 | (2 | ) | 51 | ||||||||||||||
|
Securities borrowed, securities purchased under agreements to
resell, at fair value and federal funds sold
|
87 | (10,882 | ) | (10,795 | ) | 2,055 | (8,322 | ) | (6,267 | ) | ||||||||||||||
|
U.S.
|
(4 | ) | (8,773 | ) | (8,777 | ) | 1,370 | (8,028 | ) | (6,658 | ) | |||||||||||||
|
Non-U.S.
|
91 | (2,109 | ) | (2,018 | ) | 685 | (294 | ) | 391 | |||||||||||||||
|
Trading assets
|
(1,610 | ) | (434 | ) | (2,044 | ) | (327 | ) | 357 | 30 | ||||||||||||||
|
U.S.
|
524 | 205 | 729 | (169 | ) | (298 | ) | (467 | ) | |||||||||||||||
|
Non-U.S.
|
(2,134 | ) | (639 | ) | (2,773 | ) | (158 | ) | 655 | 497 | ||||||||||||||
|
Other interest-earning assets
|
(1,370 | ) | (7,394 | ) | (8,764 | ) | 51 | (4,218 | ) | (4,167 | ) | |||||||||||||
|
U.S.
|
(618 | ) | (2,768 | ) | (3,386 | ) | 1,143 | (3,185 | ) | (2,042 | ) | |||||||||||||
|
Non-U.S.
|
(752 | ) | (4,626 | ) | (5,378 | ) | (1,092 | ) | (1,033 | ) | (2,125 | ) | ||||||||||||
|
Change in interest income
|
(2,854 | ) | (18,872 | ) | (21,726 | ) | 1,853 | (12,188 | ) | (10,335 | ) | |||||||||||||
|
Interest-bearing liabilities
|
||||||||||||||||||||||||
|
Interest-bearing deposits
|
151 | (492 | ) | (341 | ) | 378 | (299 | ) | 79 | |||||||||||||||
|
U.S.
|
142 | (388 | ) | (246 | ) | 242 | (299 | ) | (57 | ) | ||||||||||||||
|
Non-U.S.
|
9 | (104 | ) | (95 | ) | 136 | — | 136 | ||||||||||||||||
|
Securities loaned and securities sold under agreements to
repurchase, at fair value
|
(857 | ) | (5,240 | ) | (6,097 | ) | (943 | ) | (4,255 | ) | (5,198 | ) | ||||||||||||
|
U.S.
|
15 | (3,286 | ) | (3,271 | ) | 408 | (4,442 | ) | (4,034 | ) | ||||||||||||||
|
Non-U.S.
|
(872 | ) | (1,954 | ) | (2,826 | ) | (1,351 | ) | 187 | (1,164 | ) | |||||||||||||
|
Trading liabilities
|
(636 | ) | (299 | ) | (935 | ) | (371 | ) | (706 | ) | (1,077 | ) | ||||||||||||
|
U.S.
|
(140 | ) | (476 | ) | (616 | ) | (302 | ) | (830 | ) | (1,132 | ) | ||||||||||||
|
Non-U.S.
|
(496 | ) | 177 | (319 | ) | (69 | ) | 124 | 55 | |||||||||||||||
|
Commercial paper
|
(31 | ) | (109 | ) | (140 | ) | (61 | ) | (63 | ) | (124 | ) | ||||||||||||
|
U.S.
|
(30 | ) | (88 | ) | (118 | ) | (66 | ) | (55 | ) | (121 | ) | ||||||||||||
|
Non-U.S.
|
(1 | ) | (21 | ) | (22 | ) | 5 | (8 | ) | (3 | ) | |||||||||||||
|
Other borrowings
|
(339 | ) | (762 | ) | (1,101 | ) | 177 | (1,587 | ) | (1,410 | ) | |||||||||||||
|
U.S.
|
(232 | ) | (289 | ) | (521 | ) | 147 | (880 | ) | (733 | ) | |||||||||||||
|
Non-U.S.
|
(107 | ) | (473 | ) | (580 | ) | 30 | (707 | ) | (677 | ) | |||||||||||||
|
Long-term
debt
|
(128 | ) | (4,262 | ) | (4,390 | ) | 1,197 | (1,052 | ) | 145 | ||||||||||||||
|
U.S.
|
123 | (4,081 | ) | (3,958 | ) | 796 | (941 | ) | (145 | ) | ||||||||||||||
|
Non-U.S.
|
(251 | ) | (181 | ) | (432 | ) | 401 | (111 | ) | 290 | ||||||||||||||
|
Other interest-bearing liabilities
|
(178 | ) | (11,675 | ) | (11,853 | ) | 3,115 | (6,154 | ) | (3,039 | ) | |||||||||||||
|
U.S.
|
332 | (7,330 | ) | (6,998 | ) | 2,127 | (6,419 | ) | (4,292 | ) | ||||||||||||||
|
Non-U.S.
|
(510 | ) | (4,345 | ) | (4,855 | ) | 988 | 265 | 1,253 | |||||||||||||||
|
Change in interest expense
|
(2,018 | ) | (22,839 | ) | (24,857 | ) | 3,492 | (14,116 | ) | (10,624 | ) | |||||||||||||
|
Change in net interest income
|
$ | (836 | ) | $ | 3,967 | $ | 3,131 | $ | (1,639 | ) | $ | 1,928 | $ | 289 | ||||||||||
Table of Contents
|
Gross
|
Gross
|
|||||||||||||||
|
Amortized
|
Unrealized
|
Unrealized
|
Fair
|
|||||||||||||
|
Cost
|
Gains
|
Losses
|
Value
|
|||||||||||||
| (in millions) | ||||||||||||||||
|
Available-for-sale
securities, December 2009
|
||||||||||||||||
|
Commercial paper, certificates of deposit, time deposits and
other money market instruments
|
$ | 309 | $ | — | $ | — | $ | 309 | ||||||||
|
U.S. government, federal agency and sovereign obligations
|
1,014 | 9 | (40 | ) | 983 | |||||||||||
|
Mortgage and other
asset-backed
loans and securities
|
583 | 70 | (15 | ) | 638 | |||||||||||
|
Corporate debt securities and other debt obligations
|
1,772 | 168 | (6 | ) | 1,934 | |||||||||||
|
Total
available-for-sale
securities
|
$ | 3,678 | $ | 247 | $ | (61 | ) | $ | 3,864 | |||||||
|
Available-for-sale
securities, November 2008
|
||||||||||||||||
|
Commercial paper, certificates of deposit, time deposits and
other money market instruments
|
$ | 259 | $ | — | $ | — | $ | 259 | ||||||||
|
U.S. government, federal agency and sovereign obligations
|
574 | 23 | (3 | ) | 594 | |||||||||||
|
Mortgage and other
asset-backed
loans and securities
|
213 | — | (49 | ) | 164 | |||||||||||
|
Corporate debt securities and other debt obligations
|
750 | 5 | (90 | ) | 665 | |||||||||||
|
Total
available-for-sale
securities
|
$ | 1,796 | $ | 28 | $ | (142 | ) | $ | 1,682 | |||||||
Table of Contents
| As of December 2009 | ||||||||||||||||||||||||||||||||||||||||
|
Due After
|
Due After
|
|||||||||||||||||||||||||||||||||||||||
|
One Year
|
Five Years
|
|||||||||||||||||||||||||||||||||||||||
|
Through
|
Through
|
Due After
|
||||||||||||||||||||||||||||||||||||||
| Due in One Year or Less | Five Years | Ten Years | Ten Years | Total | ||||||||||||||||||||||||||||||||||||
|
Amount
|
Yield
(1)
|
Amount
|
Yield
(1)
|
Amount
|
Yield
(1)
|
Amount
|
Yield
(1)
|
Amount
|
Yield
(1)
|
|||||||||||||||||||||||||||||||
| ($ in millions) | ||||||||||||||||||||||||||||||||||||||||
|
Fair value of
available-for-sale
securities
|
||||||||||||||||||||||||||||||||||||||||
|
Commercial paper, certificates of deposit, time deposits and
other money market instruments
|
$ | 309 | — | % | $ | — | — | % | $ | — | — | % | $ | — | — | % | $ | 309 | — | % | ||||||||||||||||||||
|
U.S. government, federal agency and sovereign obligations
|
15 | 3 | 175 | 3 | 148 | 4 | 645 | 4 | 983 | 4 | ||||||||||||||||||||||||||||||
|
Mortgage and other
asset-backed
loans and securities
|
— | — | — | — | 22 | 5 | 616 | 15 | 638 | 15 | ||||||||||||||||||||||||||||||
|
Corporate debt securities and other debt obligations
|
71 | 6 | 303 | 5 | 663 | 6 | 897 | 7 | 1,934 | 6 | ||||||||||||||||||||||||||||||
|
Total
available-for-sale
securities
|
$ | 395 | $ | 478 | $ | 833 | $ | 2,158 | $ | 3,864 | ||||||||||||||||||||||||||||||
|
Amortized cost of available-for-sale securities
|
$ | 394 | $ | 458 | $ | 772 | $ | 2,054 | $ | 3,678 | ||||||||||||||||||||||||||||||
| As of November 2008 | ||||||||||||||||||||||||||||||||||||||||
|
Due After
|
Due After
|
|||||||||||||||||||||||||||||||||||||||
|
One Year
|
Five Years
|
|||||||||||||||||||||||||||||||||||||||
|
Due in One Year
|
Through
|
Through
|
Due After
|
|||||||||||||||||||||||||||||||||||||
| or Less | Five Years | Ten Years | Ten Years | Total | ||||||||||||||||||||||||||||||||||||
|
Amount
|
Yield
(1)
|
Amount
|
Yield
(1)
|
Amount
|
Yield
(1)
|
Amount
|
Yield
(1)
|
Amount
|
Yield
(1)
|
|||||||||||||||||||||||||||||||
| ($ in millions) | ||||||||||||||||||||||||||||||||||||||||
|
Fair value of
available-for-sale
securities
|
||||||||||||||||||||||||||||||||||||||||
|
Commercial paper, certificates of deposit, time deposits and
other money market instruments
|
$ | 259 | 1 | % | $ | — | — | % | $ | — | — | % | $ | — | — | % | $ | 259 | 1 | % | ||||||||||||||||||||
|
U.S. government, federal agency and sovereign obligations
|
— | — | 144 | 2 | 133 | 4 | 317 | 5 | 594 | 4 | ||||||||||||||||||||||||||||||
|
Mortgage and other
asset-backed
loans and securities
|
— | — | — | — | — | — | 164 | 21 | 164 | 21 | ||||||||||||||||||||||||||||||
|
Corporate debt securities and other debt obligations
|
48 | 16 | 227 | 7 | 94 | 8 | 296 | 9 | 665 | 9 | ||||||||||||||||||||||||||||||
|
Total
available-for-sale
securities
|
$ | 307 | $ | 371 | $ | 227 | $ | 777 | $ | 1,682 | ||||||||||||||||||||||||||||||
|
Amortized cost of available-for-sale securities
|
$ | 310 | $ | 377 | $ | 229 | $ | 880 | $ | 1,796 | ||||||||||||||||||||||||||||||
| (1) | Yields are calculated on a weighted average basis. |
Table of Contents
| Average Balances | Average Interest Rates | |||||||||||||||||||||||
|
December
|
November
|
November
|
December
|
November
|
November
|
|||||||||||||||||||
| 2009 | 2008 | 2007 | 2009 | 2008 | 2007 | |||||||||||||||||||
| ($ in millions) | ||||||||||||||||||||||||
|
U.S.:
|
||||||||||||||||||||||||
|
Savings
(1)
|
$ | 23,024 | $ | 20,214 | $ | 13,096 | 0.62 | % | 2.82 | % | 5.12 | % | ||||||||||||
|
Time
|
12,019 | 1,384 | 32 | 1.89 | 3.40 | 9.96 | ||||||||||||||||||
|
Total U.S. deposits
|
35,043 | 21,598 | 13,128 | 1.06 | 2.86 | 5.13 | ||||||||||||||||||
|
Non-U.S.:
|
||||||||||||||||||||||||
|
Demand
|
5,402 | 4,842 | 99 | 0.61 | 2.83 | 3.03 | ||||||||||||||||||
|
Time
|
631 | 15 | — | 1.65 | 13.00 | — | ||||||||||||||||||
|
Total
Non-U.S. deposits
|
6,033 | 4,857 | 99 | 0.73 | 2.86 | 3.03 | ||||||||||||||||||
|
Total deposits
|
$ | 41,076 | $ | 26,455 | $ | 13,227 | 1.01 | % | 2.86 | % | 5.12 | % | ||||||||||||
| (1) | Amounts are available for withdrawal upon short notice, generally within seven days. |
| Year Ended | ||||||||||||
|
December
|
November
|
November
|
||||||||||
| 2009 | 2008 | 2007 | ||||||||||
|
Net earnings to average assets
|
1.5 | % | 0.2 | % | 1.2 | % | ||||||
|
Return on common shareholders’
equity
(1)
|
22.5 | 4.9 | 32.7 | |||||||||
|
Return on total shareholders’
equity
(2)
|
20.4 | 4.9 | 30.6 | |||||||||
|
Total average equity to average assets
|
7.2 | 4.1 | 3.8 | |||||||||
| (1) | Based on net earnings applicable to common shareholders divided by average monthly common shareholders’ equity. | |
| (2) | Based on net earnings divided by average monthly total shareholders’ equity. |
Table of Contents
|
Securities Loaned and
|
||||||||||||||||||||||||||||||||||||
|
Securities Sold Under
|
||||||||||||||||||||||||||||||||||||
| Agreements to Repurchase | Commercial Paper | Other Funds Borrowed (2)(3) | ||||||||||||||||||||||||||||||||||
|
December
|
November
|
November
|
December
|
November
|
November
|
December
|
November
|
November
|
||||||||||||||||||||||||||||
| 2009 | 2008 | 2007 | 2009 | 2008 | 2007 | 2009 | 2008 | 2007 | ||||||||||||||||||||||||||||
| ($ in millions) | ||||||||||||||||||||||||||||||||||||
|
Amounts outstanding at year-end
|
$ | 143,567 | $ | 79,943 | $ | 187,802 | $ | 1,660 | $ | 1,125 | $ | 4,343 | $ | 48,787 | $ | 72,758 | $ | 99,624 | ||||||||||||||||||
|
Average outstanding during the year
|
156,794 | 194,935 | 214,511 | 1,002 | 4,097 | 5,605 | 58,129 | 99,351 | 89,924 | |||||||||||||||||||||||||||
|
Maximum month-end outstanding
|
169,083 | 256,596 | 270,991 | 3,060 | 12,718 | 8,846 | 77,712 | 109,927 | 105,845 | |||||||||||||||||||||||||||
|
Weighted average interest rate
|
||||||||||||||||||||||||||||||||||||
|
During the year
|
0.84 | % | 3.80 | % | 5.88 | % | 0.50 | % | 3.54 | % | 4.80 | % | 1.06 | % | 1.73 | % | 3.48 | % | ||||||||||||||||||
|
At year-end
|
0.26 | 3.27 | 5.15 | 0.37 | 2.79 | 4.81 | 0.76 | 2.06 | 3.11 | |||||||||||||||||||||||||||
| (1) | Includes borrowings maturing within one year of the financial statement date and borrowings that are redeemable at the option of the holder within one year of the financial statement date. |
| (2) | Includes short-term secured financings of $12.93 billion as of December 2009, $21.23 billion as of November 2008 and $32.41 billion as of November 2007. |
| (3) | As of December 2009, November 2008 and November 2007, weighted average interest rates include the effects of hedging. |
Table of Contents
| As of December 2009 | ||||||||||||||||
|
Banks
|
Governments
|
Other
|
Total
|
|||||||||||||
| (in millions) | ||||||||||||||||
|
Country
|
||||||||||||||||
|
United Kingdom
|
$ | 3,276 | $ | 4,843 | $ | 52,342 | $ | 60,461 | ||||||||
|
Japan
|
18,251 | 107 | 6,624 | 24,982 | ||||||||||||
|
France
|
8,844 | 4,648 | 5,863 | 19,355 | ||||||||||||
|
Germany
|
8,610 | 6,050 | 3,594 | 18,254 | ||||||||||||
|
China
|
9,105 | 108 | 4,196 | 13,409 | ||||||||||||
|
Ireland
|
5,633 | 20 | 1,815 | 7,468 | ||||||||||||
| As of November 2008 | ||||||||||||||||
|
Banks
|
Governments
|
Other
|
Total
|
|||||||||||||
| (in millions) | ||||||||||||||||
|
Country
|
||||||||||||||||
|
United Kingdom
|
$ | 5,104 | $ | 4,600 | $ | 51,898 | $ | 61,602 | ||||||||
|
Cayman Islands
|
50 | — | 14,461 | 14,511 | ||||||||||||
|
Germany
|
3,973 | 2,518 | 7,653 | 14,144 | ||||||||||||
|
France
|
2,264 | 1,320 | 9,632 | 13,216 | ||||||||||||
|
Japan
|
4,003 | 100 | 3,770 | 7,873 | ||||||||||||
Table of Contents
| Item 9. | Changes in and Disagreements with Accountants on Accounting and Financial Disclosure |
Table of Contents
| Item 10. | Directors, Executive Officers and Corporate Governance |
| Item 11. | Executive Compensation |
| Item 12. | Security Ownership of Certain Beneficial Owners and Management and Related Stockholder Matters |
Table of Contents
|
Number of Securities
|
||||||||||||||||
|
Number of
|
Remaining Available
|
|||||||||||||||
|
Securities to be
|
for Future Issuance
|
|||||||||||||||
|
Issued Upon
|
Weighted-Average
|
Under Equity
|
||||||||||||||
|
Exercise of
|
Exercise Price of
|
Compensation Plans
|
||||||||||||||
|
Outstanding
|
Outstanding
|
(Excluding Securities
|
||||||||||||||
|
Options, Warrants
|
Options, Warrants
|
Reflected in the
|
||||||||||||||
|
Plan Category
|
and Rights
|
and Rights
|
Second Column)
|
|||||||||||||
|
Equity compensation plans approved by security holders
|
The Goldman
Sachs Amended and Restated Stock Incentive Plan (1) |
106,752,445 | (2) | $ | 95.25 | (3) | 140,552,906 | (4) | ||||||||
|
Equity compensation plans not approved by security holders
|
None | — | — | — | ||||||||||||
|
Total
|
106,752,445 | (2) | 140,552,906 | (4) | ||||||||||||
| (1) | The Goldman Sachs Amended and Restated Stock Incentive Plan (SIP) was approved by the shareholders of Goldman Sachs at our 2003 Annual Meeting of Shareholders and is a successor plan to The Goldman Sachs 1999 Stock Incentive Plan (1999 Plan), which was approved by our shareholders immediately prior to our initial public offering in May 1999 and under which no additional awards have been granted since approval of the SIP. | |
| (2) | Includes: (i) 62,363,847 shares of common stock that may be issued upon exercise of outstanding options; (ii) 44,278,092 shares that may be issued pursuant to outstanding restricted stock units, including 44,250,832 shares granted under the SIP and 27,260 shares granted under the 1999 Plan; and (iii) 110,506 shares that may be issued pursuant to outstanding performance-based units granted under the SIP. These awards are subject to vesting and other conditions to the extent set forth in the respective award agreements, and the underlying shares will be delivered net of any required tax withholding. | |
| (3) | This weighted-average exercise price relates only to the options described in footnote (2). Shares underlying restricted stock units and performance-based units are deliverable without the payment of any consideration, and therefore these awards have not been taken into account in calculating the weighted-average exercise price. | |
| (4) | Represents shares remaining to be issued under the SIP, excluding shares reflected in the second column. The total number of shares of common stock that may be delivered pursuant to awards granted under the SIP through the end of our 2008 fiscal year could not exceed 250 million shares. The total number of shares of common stock that may be delivered pursuant to awards granted under the SIP in our 2009 fiscal year and each fiscal year thereafter cannot exceed 5% of the issued and outstanding shares of common stock, determined as of the last day of the immediately preceding fiscal year, increased by the number of shares available for awards in previous years but not covered by awards granted in such years. There are no shares remaining to be issued under the 1999 Plan other than those reflected in the second column. |
| Item 13. | Certain Relationships and Related Transactions, and Director Independence |
| Item 14. | Principal Accountant Fees and Services |
Table of Contents
| Item 15. | Exhibits and Financial Statement Schedules |
| (a) | Documents filed as part of this Report: |
| 1. | Consolidated Financial Statements |
| 2. | Exhibits |
|
2.1
|
Plan of Incorporation (incorporated by reference to the corresponding exhibit to the Registrant’s registration statement on Form S-1 (No. 333-74449)). | |||
|
3.1
|
Restated Certificate of Incorporation of The Goldman Sachs Group, Inc. (incorporated by reference to Exhibit 3.2 to the Registrant’s Quarterly Report on Form 10-Q for the period ended September 25, 2009). | |||
|
3.2
|
Amended and Restated By-Laws of The Goldman Sachs Group, Inc. (incorporated by reference to Exhibit 3.3 to the Registrant’s Quarterly Report on Form 10-Q for the period ended September 25, 2009). | |||
|
4.1
|
Indenture, dated as of May 19, 1999, between The Goldman Sachs Group, Inc. and The Bank of New York, as trustee (incorporated by reference to Exhibit 6 to the Registrant’s registration statement on Form 8-A, filed June 29, 1999). | |||
|
4.2
|
Subordinated Debt Indenture, dated as of February 20, 2004, between The Goldman Sachs Group, Inc. and The Bank of New York, as trustee (incorporated by reference to Exhibit 4.2 to the Registrant’s Annual Report on Form 10-K for the fiscal year ended November 28, 2003). | |||
|
4.3
|
Warrant Indenture, dated as of February 14, 2006, between The Goldman Sachs Group, Inc. and The Bank of New York, as trustee (incorporated by reference to Exhibit 4.34 to the Registrant’s Post-Effective Amendment No. 3 to Form S-3, filed on March 1, 2006). | |||
|
4.4
|
Senior Debt Indenture, dated as of December 4, 2007, among GS Finance Corp., as issuer, The Goldman Sachs Group, Inc., as guarantor, and The Bank of New York, as Trustee (incorporated by reference to Exhibit 4.69 to the Registrant’s Post-Effective Amendment No. 10 to Form S-3, filed on December 4, 2007). | |||
|
4.5
|
Form of floating rate senior debt security (TLGP) issued under the Senior Debt Indenture, dated as of July 16, 2008, between The Goldman Sachs Group, Inc. and The Bank of New York Mellon, as trustee (incorporated by reference to Exhibit 4.5 to the Registrant’s Annual Report on Form 10-K for the fiscal year ended November 28, 2008). | |||
|
4.6
|
Form of fixed rate senior debt security (TLGP) issued under the Senior Debt Indenture, dated as of July 16, 2008, between The Goldman Sachs Group, Inc. and The Bank of New York Mellon, as trustee (incorporated by reference to Exhibit 4.6 to the Registrant’s Annual Report on Form 10-K for the fiscal year ended November 28, 2008). | |||
|
4.7
|
Form of floating rate Medium-Term Note, Series D (TLGP) issued under the Senior Debt Indenture, dated as of July 16, 2008, between The Goldman Sachs Group, Inc. and The Bank of New York Mellon, as trustee (incorporated by reference to Exhibit 4.7 to the Registrant’s Annual Report on Form 10-K for the fiscal year ended November 28, 2008). |
Table of Contents
|
4.8
|
Form of fixed rate Medium-Term Note, Series D (TLGP) issued under the Senior Debt Indenture, dated as of July 16, 2008, between The Goldman Sachs Group, Inc. and The Bank of New York Mellon, as trustee (incorporated by reference to Exhibit 4.8 to the Registrant’s Annual Report on Form 10-K for the fiscal year ended November 28, 2008). | |||
| Certain instruments defining the rights of holders of long-term debt securities of the Registrant and its subsidiaries are omitted pursuant to Item 601(b)(4)(iii) of Regulation S - K. The Registrant hereby undertakes to furnish to the SEC, upon request, copies of any such instruments. | ||||
|
4.9
|
Senior Debt Indenture, dated as of July 16, 2008, between The Goldman Sachs Group, Inc. and The Bank of New York Mellon, as trustee (incorporated by reference to Exhibit 4.82 to the Registrant’s Post-Effective Amendment No. 11 to Form S-3 (No. 333-130074), filed July 17, 2008). | |||
|
4.10
|
Senior Debt Indenture, dated as of October 10, 2008, among GS Finance Corp., as issuer, The Goldman Sachs Group, Inc., as guarantor, and The Bank of New York Mellon, as trustee (incorporated by reference to Exhibit 4.70 to the Registrant’s registration statement on Form S-3 (No. 333-154173), filed October 10, 2008). | |||
|
10.1
|
The Goldman Sachs Amended and Restated Stock Incentive Plan (incorporated by reference to Exhibit 10.1 to the Registrant’s Annual Report on Form 10-K for the fiscal year ended November 28, 2008).† | |||
|
10.2
|
The Goldman Sachs Amended and Restated Restricted Partner Compensation Plan (incorporated by reference to Exhibit 10.1 to the Registrant’s Quarterly Report on Form 10-Q for the period ended February 24, 2006).† | |||
|
10.3
|
Form of Employment Agreement for pre-IPO Participating Managing Directors (incorporated by reference to Exhibit 10.19 to the Registrant’s registration statement on Form S-1 (No. 333-75213)).† | |||
|
10.4
|
Form of Agreement Relating to Noncompetition and Other Covenants (incorporated by reference to Exhibit 10.20 to the Registrant’s registration statement on Form S-1 (No. 333-75213)).† | |||
|
10.5
|
Tax Indemnification Agreement, dated as of May 7, 1999, by and among The Goldman Sachs Group, Inc. and various parties (incorporated by reference to Exhibit 10.25 to the Registrant’s registration statement on Form S-1 (No. 333-75213)). | |||
|
10.6
|
Amended and Restated Shareholders’ Agreement, effective as of January 22, 2010, among The Goldman Sachs Group, Inc. and various parties. | |||
|
10.7
|
Instrument of Indemnification (incorporated by reference to Exhibit 10.27 to the Registrant’s registration statement on Form S-1 (No. 333-75213)). | |||
|
10.8
|
Form of Indemnification Agreement (incorporated by reference to Exhibit 10.28 to the Registrant’s Annual Report on Form 10-K for the fiscal year ended November 26, 1999). | |||
|
10.9
|
Form of Indemnification Agreement (incorporated by reference to Exhibit 10.44 to the Registrant’s Annual Report on Form 10-K for the fiscal year ended November 26, 1999). | |||
|
10.10
|
Form of Indemnification Agreement, dated as of July 5, 2000 (incorporated by reference to Exhibit 10.1 to the Registrant’s Quarterly Report on Form 10-Q for the period ended August 25, 2000). | |||
|
10.11
|
Amendment No. 1, dated as of September 5, 2000, to the Tax Indemnification Agreement, dated as of May 7, 1999 (incorporated by reference to Exhibit 10.3 to the Registrant’s Quarterly Report on Form 10-Q for the period ended August 25, 2000). | |||
|
10.12
|
Letter, dated February 6, 2001, from The Goldman Sachs Group, Inc. to Dr. Ruth J. Simmons (incorporated by reference to Exhibit 10.63 to the Registrant’s Annual Report on Form 10-K for the fiscal year ended November 24, 2000).† |
Table of Contents
|
10.13
|
Letter, dated February 6, 2001, from The Goldman Sachs Group, Inc. to Mr. John H. Bryan (incorporated by reference to Exhibit 10.64 to the Registrant’s Annual Report on Form 10-K for the fiscal year ended November 24, 2000).† | |||
|
10.14
|
Letter, dated February 6, 2001, from The Goldman Sachs Group, Inc. to Mr. James A. Johnson (incorporated by reference to Exhibit 10.65 to the Registrant’s Annual Report on Form 10-K for the fiscal year ended November 24, 2000).† | |||
|
10.15
|
Letter, dated December 18, 2002, from The Goldman Sachs Group, Inc. to Mr. William W. George (incorporated by reference to Exhibit 10.39 to the Registrant’s Annual Report on Form 10-K for the fiscal year ended November 29, 2002).† | |||
|
10.16
|
Letter, dated June 20, 2003, from The Goldman Sachs Group, Inc. to Mr. Claes Dahlbäck (incorporated by reference to Exhibit 10.1 to the Registrant’s Quarterly Report on Form 10-Q for the period ended May 30, 2003).† | |||
|
10.17
|
Letter, dated March 31, 2004, from The Goldman Sachs Group, Inc. to Ms. Lois D. Juliber (incorporated by reference to Exhibit 10.1 to the Registrant’s Quarterly Report on Form 10-Q for the period ended May 28, 2004).† | |||
|
10.18
|
Letter, dated April 6, 2005, from The Goldman Sachs Group, Inc. to Mr. Stephen Friedman (incorporated by reference to Exhibit 10.1 to the Registrant’s Current Report on Form 8-K, filed April 8, 2005).† | |||
|
10.19
|
Letter, dated May 12, 2009, from The Goldman Sachs Group, Inc. to Mr. James J. Schiro (incorporated by reference to Exhibit 10.1 to the Registrant’s Quarterly Report on Form 10-Q for the period ended June 26, 2009).† | |||
|
10.20
|
Form of Amendment, dated November 27, 2004, to Agreement Relating to Noncompetition and Other Covenants, dated May 7, 1999 (incorporated by reference to Exhibit 10.32 to the Registrant’s Annual Report on Form 10-K for the fiscal year ended November 26, 2004).† | |||
|
10.21
|
Form of RSU Award Agreement for PMD Discount Stock Program (subject to transfer restrictions) (incorporated by reference to Exhibit 10.29 to the Registrant’s Annual Report on Form 10-K for the fiscal year ended November 30, 2007).† | |||
|
10.22
|
Form of RSU Award Agreement for PMD Discount Stock Program (not subject to transfer restrictions) (incorporated by reference to Exhibit 10.30 to the Registrant’s Annual Report on Form 10-K for the fiscal year ended November 30, 2007).† | |||
|
10.23
|
Form of RSU Award Agreement for PMD Discount Stock Program (subject to transfer restrictions) (French alternative award) (incorporated by reference to Exhibit 10.31 to the Registrant’s Annual Report on Form 10-K for the fiscal year ended November 30, 2007).† | |||
|
10.24
|
Form of RSU Award Agreement for PMD Discount Stock Program (not subject to transfer restrictions) (French alternative award) (incorporated by reference to Exhibit 10.32 to the Registrant’s Annual Report on Form 10-K for the fiscal year ended November 30, 2007).† | |||
|
10.25
|
Form of RSU Award Agreement for PMD Discount Stock Program (U.K. employee benefit trusts) (incorporated by reference to Exhibit 10.33 to the Registrant’s Annual Report on Form 10-K for the fiscal year ended November 30, 2007).† | |||
|
10.26
|
Form of Year-End Restricted Stock Award (incorporated by reference to Exhibit 10.34 to the Registrant’s Annual Report on Form 10-K for the fiscal year ended November 30, 2007).† | |||
|
10.27
|
Form of Year-End Restricted Stock Award in Connection with Outstanding RSU Awards (incorporated by reference to Exhibit 10.35 to the Registrant’s Annual Report on Form 10-K for the fiscal year ended November 30, 2007).† | |||
|
10.28
|
The Goldman Sachs Group, Inc. Non-Qualified Deferred Compensation Plan for U.S. Participating Managing Directors (terminated as of December 15, 2008) (incorporated by reference to Exhibit 10.36 to the Registrant’s Annual Report on Form 10-K for the fiscal year ended November 30, 2007).† |
Table of Contents
|
10.29
|
Form of Year-End Option Award Agreement (incorporated by reference to Exhibit 10.36 to the Registrant’s Annual Report on Form 10-K for the fiscal year ended November 28, 2008).† | |||
|
10.30
|
Form of Year-End RSU Award Agreement (not fully vested).† | |||
|
10.31
|
Form of Year-End RSU Award Agreement (fully vested).† | |||
|
10.32
|
Form of Year-End RSU Award Agreement (French alternative award).† | |||
|
10.33
|
Amendments to 2005 and 2006 Year-End RSU and Option Award Agreements (incorporated by reference to Exhibit 10.44 to the Registrant’s Annual Report on Form 10-K for the fiscal year ended November 30, 2007).† | |||
|
10.34
|
Form of Non-Employee Director Option Award Agreement.† | |||
|
10.35
|
Form of Non-Employee Director RSU Award Agreement.† | |||
|
10.36
|
Description of Non-Employee Director Compensation.† | |||
|
10.37
|
Ground Lease, dated August 23, 2005, between Battery Park City Authority d/b/a/ Hugh L. Carey Battery Park City Authority, as Landlord, and Goldman Sachs Headquarters LLC, as Tenant (incorporated by reference to Exhibit 10.1 to the Registrant’s Current Report on Form 8-K, filed August 26, 2005). | |||
|
10.38
|
General Guarantee Agreement, dated January 30, 2006, made by The Goldman Sachs Group, Inc. (incorporated by reference to Exhibit 10.45 to the Registrant’s Annual Report on Form 10-K for the fiscal year ended November 25, 2005). | |||
|
10.39
|
Letter, dated November 10, 2006, from The Goldman Sachs Group, Inc. to Mr. Rajat K. Gupta (incorporated by reference to Exhibit 99.1 to the Registrant’s Current Report on Form 8-K, filed November 13, 2006).† | |||
|
10.40
|
Goldman, Sachs & Co. Executive Life Insurance Policy and Certificate with Metropolitan Life Insurance Company for Participating Managing Directors (incorporated by reference to Exhibit 10.1 to the Registrant’s Quarterly Report on Form 10-Q for the period ended August 25, 2006).† | |||
|
10.41
|
Form of Goldman, Sachs & Co. Executive Life Insurance Policy with Pacific Life & Annuity Company for Participating Managing Directors, including policy specifications and form of restriction on Policy Owner’s Rights (incorporated by reference to Exhibit 10.2 to the Registrant’s Quarterly Report on Form 10-Q for the period ended August 25, 2006).† | |||
|
10.42
|
Form of Signature Card for Equity Awards.† | |||
|
10.43
|
Form of Employment Agreement for post-IPO Participating Managing Directors (incorporated by reference to Exhibit 10.50 to the Registrant’s Annual Report on Form 10-K for the fiscal year ended November 24, 2006).† | |||
|
10.44
|
Form of Second Amendment, dated November 25, 2006, to Agreement Relating to Noncompetition and Other Covenants, dated May 7, 1999, as amended effective November 27, 2004 (incorporated by reference to Exhibit 10.51 to the Registrant’s Annual Report on Form 10-K for the fiscal year ended November 24, 2006).† | |||
|
10.45
|
Description of PMD Retiree Medical Program (incorporated by reference to Exhibit 10.2 to the Registrant’s Quarterly Report on Form 10-Q for the period ended February 29, 2008).† | |||
|
10.46
|
Letter, dated June 28, 2008, from The Goldman Sachs Group, Inc. to Mr. Lakshmi N. Mittal (incorporated by reference to Exhibit 99.1 to the Registrant’s Current Report on Form 8-K, filed June 30, 2008).† | |||
|
10.47
|
Securities Purchase Agreement, dated September 29, 2008, between The Goldman Sachs Group, Inc. and Berkshire Hathaway Inc. (incorporated by reference to Exhibit 10.1 to the Registrant’s Quarterly Report on Form 10-Q for the period ended August 29, 2008). |
Table of Contents
|
10.48
|
General Guarantee Agreement, dated December 1, 2008, made by The Goldman Sachs Group, Inc. relating to certain obligations of Goldman Sachs Bank USA (incorporated by reference to Exhibit 4.80 to the Registrant’s Post-Effective Amendment No. 2 to Form S-3, filed March 19, 2009). | |||
|
10.49
|
Form of Letter Agreement between The Goldman Sachs Group, Inc. and each of Lloyd C. Blankfein, Gary D. Cohn, Jon Winkelried and David A. Viniar (incorporated by reference to Exhibit O to Amendment No. 70 to Schedule 13D, filed October 1, 2008, relating to the Registrant’s common stock (No. 005-56295)). | |||
|
10.50
|
General Guarantee Agreement, dated November 24, 2008, made by The Goldman Sachs Group, Inc. relating to the obligations of Goldman Sachs Bank (Europe) PLC (incorporated by reference to Exhibit 10.59 to the Registrant’s Annual Report on Form 10-K for the fiscal year ended November 28, 2008). | |||
|
10.51
|
Guarantee Agreement, dated November 28, 2008 and amended effective as of January 1, 2010, between The Goldman Sachs Group, Inc. and Goldman Sachs Bank USA. | |||
|
10.52
|
Collateral Agreement, dated November 28, 2008, between The Goldman Sachs Group, Inc., Goldman Sachs Bank USA and each other party that becomes a pledgor pursuant thereto (incorporated by reference to Exhibit 10.61 to the Registrant’s Annual Report on Form 10-K for the fiscal year ended November 28, 2008). | |||
|
10.53
|
Form of Performance-Based One-Time RSU Award Agreement.† | |||
|
10.54
|
Form of Make-Whole One-Time RSU Award Agreement.† | |||
|
10.55
|
Form of Incentive One-Time RSU Award Agreement.† | |||
|
10.56
|
Form of Signature Card for Equity Awards (employees in Asia outside China).† | |||
|
10.57
|
Form of Signature Card for Equity Awards (employees in China).† | |||
|
10.58
|
Amendments to Certain Equity Award Agreements (incorporated by reference to Exhibit 10.68 to the Registrant’s Annual Report on Form 10-K for the fiscal year ended November 28, 2008).† | |||
|
10.59
|
Amendments to Certain Non-Employee Director Equity Award Agreements (incorporated by reference to Exhibit 10.69 to the Registrant’s Annual Report on Form 10-K for the fiscal year ended November 28, 2008).† | |||
|
10.60
|
Form of Year-End RSU Award Agreement (U.K.).† | |||
|
10.61
|
Form of Year-End Supplemental RSU Award Agreement (U.K.).† | |||
|
10.62
|
Form of Year-End Supplemental RSU Award Agreement (U.K. and France).† | |||
|
12.1
|
Statement re: Computation of Ratios of Earnings to Fixed Charges and Ratios of Earnings to Combined Fixed Charges and Preferred Stock Dividends. | |||
|
21.1
|
List of significant subsidiaries of The Goldman Sachs Group, Inc. | |||
|
23.1
|
Consent of Independent Registered Public Accounting Firm. | |||
|
31.1
|
Rule 13a-14(a) Certifications.* | |||
|
32.1
|
Section 1350 Certifications.* |
Table of Contents
|
99.1
|
Report of Independent Registered Public Accounting Firm on Selected Financial Data. | |||
|
101
|
Interactive data files pursuant to Rule 405 of Regulation S-T: (i) the Consolidated Statements of Earnings for the fiscal years ended December 31, 2009, November 28, 2008 and November 30, 2007 and the one-month transition period ended December 26, 2008, (ii) the Consolidated Statements of Financial Condition as of December 31, 2009 and November 28, 2008, (iii) the Consolidated Statements of Changes in Shareholders’ Equity for the fiscal years ended December 31, 2009, November 28, 2008 and November 30, 2007, (iv) the Consolidated Statements of Cash Flows for the fiscal years ended December 31, 2009, November 28, 2008 and November 30, 2007 and the one-month transition period ended December 26, 2008, (v) the Consolidated Statements of Comprehensive Income for the fiscal years ended December 31, 2009, November 28, 2008 and November 30, 2007 and the one-month transition period ended December 26, 2008, and (vi) the notes to the Consolidated Financial Statements, tagged as blocks of text.* |
| † | This exhibit is a management contract or a compensatory plan or arrangement. |
| * | This information is furnished and not filed for purposes of Sections 11 and 12 of the Securities Act of 1933 and Section 18 of the Securities Exchange Act of 1934. |
Table of Contents
| By: |
/s/ David
A. Viniar
|
| Title: | Chief Financial Officer |
|
Signature
|
Capacity
|
Date
|
||||
|
/s/ Lloyd
C. Blankfein
|
Director, Chairman and
Chief Executive Officer (Principal Executive Officer) |
February 26, 2010 | ||||
|
/s/ John
H. Bryan
|
Director | February 26, 2010 | ||||
|
/s/ Gary
D. Cohn
|
Director | February 26, 2010 | ||||
|
/s/ Claes
Dahlbäck
|
Director | February 26, 2010 | ||||
|
/s/ Stephen
Friedman
|
Director | February 26, 2010 | ||||
|
/s/ William
W. George
|
Director | February 26, 2010 | ||||
|
/s/ Rajat
K. Gupta
|
Director | February 26, 2010 | ||||
|
/s/ James
A. Johnson
|
Director | February 26, 2010 | ||||
|
/s/ Lois
D. Juliber
|
Director | February 26, 2010 | ||||
|
/s/ Lakshmi
N. Mittal
|
Director | February 26, 2010 | ||||
|
/s/ James
J. Schiro
|
Director | February 26, 2010 | ||||
Table of Contents
|
Signature
|
Capacity
|
Date
|
||||
|
/s/ Ruth
J. Simmons
|
Director | February 26, 2010 | ||||
|
/s/ David
A. Viniar
|
Chief Financial Officer
(Principal Financial Officer) |
February 26, 2010 | ||||
|
/s/ Sarah
E. Smith
|
Principal Accounting Officer | February 26, 2010 | ||||