UNITED STATES
SECURITIES AND EXCHANGE COMMISSION
Washington, D.C. 20549
FORM 10-K
x
ANNUAL REPORT PURSUANT TO SECTION 13 OR 15(d) OF THE SECURITIES EXCHANGE ACT OF 1934
For the fiscal year ended December 31, 2018
¨
TRANSITION REPORT PURSUANT TO SECTION 13 OR 15(d) OF THE SECURITIES EXCHANGE ACT OF 1934
For the transition period from
to
Commission file number 001-38466
GOOSEHEAD INSURANCE, INC.
(Exact name of registrant as specified in its charter)
|
|
|
|
|
DELAWARE
|
|
82-3886022
|
|
(State or other jurisdiction of
incorporation or organization)
|
|
(I.R.S. Employer
Identification Number)
|
|
|
|
|
|
|
|
|
|
1500 Solana Blvd, Building 4, Suite 4500 Westlake, TX
|
|
76262
|
|
(Address of principal executive offices)
|
|
(Zip Code)
|
(214) 838-5500
Registrant’s telephone number, including area code
Securities registered pursuant to Section 12(b) of the Act:
|
|
|
|
|
Title of each class
|
|
Name of each exchange
on which registered
|
|
Class A Common Stock, par value $.01 per share
|
|
NASDAQ
|
|
Class B Common Stock, par value $.01 per share
|
NASDAQ
|
|
Securities registered pursuant to Section 12(g) of the Act:
None
Indicate by check mark if the registrant is a well-known seasoned issuer, as defined in Rule 405 of the Securities Act. Yes
¨
No
þ
.
Indicate by check mark if the registrant is not required to file reports pursuant to Section 13 or Section 15(d) of the Act. Yes
¨
No
þ
.
Note:
Checking the box above will not relieve any registrant required to file reports pursuant to Section 13 or 15(d) of the Exchange Act from their obligations under those Sections.
Indicate by check mark whether the registrant (1) has filed all reports required to be filed by Section 13 or 15(d) of the Securities Exchange Act of 1934 during the preceding 12 months (or for such shorter period that the registrant was required to file such reports), and (2) has been subject to such filing requirements for the past 90 days. Yes
þ
No
¨
.
Indicate by check mark whether the registrant has submitted electronically and posted on its corporate Web site, if any, every Interactive Data File required to be submitted and posted pursuant to Rule 405 of Regulation S-T during the preceding 12 months (or for such shorter period that the registrant was required to submit and post such files). Yes
þ
No
¨
.
Indicate by check mark if disclosure of delinquent filers pursuant to Item 405 of Regulation S-K is not contained herein, and will not be contained, to the best of registrant’s knowledge, in definitive proxy or information statements incorporated by reference in Part III of this Form 10-K or any amendment to this Form 10-K.
¨
Indicate by check mark whether the registrant is a large accelerated filer, an accelerated filer, a non-accelerated filer, or a smaller reporting company. See definitions of “large accelerated filer,” “accelerated filer,” and “smaller reporting company” in Rule 12b-2 of the Exchange Act. (Check one):
|
|
|
|
|
|
|
|
|
Large accelerated filer
|
|
¨
|
|
Accelerated filer
|
|
¨
|
|
|
|
|
|
|||
|
Non-accelerated filer
|
|
¨
|
|
Smaller reporting company
|
|
þ
|
|
|
|
|||||
|
|
Emerging growth company
|
|
þ
|
|||
If an emerging growth company, indicate by check mark if the registrant has elected not to use the extended transition period for complying with any new or revised financial accounting standards provided pursuant to Section 13(a) of the Exchange Act.
¨
Indicate by check mark whether the registrant is a shell company (as defined in Rule 12b-2 of the Exchange Act). Yes
¨
No
þ
.
The aggregate market value of the voting common equity held by non-affiliates of the registrant, computed by reference to the last reported price at which the registrant’s common equity was sold on
June 29, 2018
(the last day of the registrant’s most recently completed second quarter) was
$131,109,813
, computed using a closing price on that day of
$24.96
.
As of
March 14, 2019
, there were
14,421,363
shares of Class A common stock outstanding and
21,864,014
shares of Class B common stock outstanding
Documents incorporated by reference:
Portions of the registrant's definitive Proxy Statement for its 2019 Annual Meeting of Shareholders, which will be filed with the Securities and Exchange Commission within 120 days of December 31, 2018, are incorporated by reference into Part III, Items 10-14 of this Annual Report on Form 10-K.
Table of contents
|
|
Page
|
|
PART I
|
|
|
Item 1. Business
|
|
|
Item 1A. Risk Factors
|
|
|
Item 1B. Unresolved staff comments
|
|
|
Item 2. Properties
|
|
|
Item 3. Legal proceedings
|
|
|
Item 4. Mine safety disclosures
|
|
|
PART II
|
|
|
Item 5. Market for Registrant’s Common Equity, Related Stockholder Matters and Issuer Purchases of Equity Securities
|
|
|
Item 6. Selected financial data
|
|
|
Item 7. Management’s discussion and analysis of financial condition and results of operations
|
|
|
Item 7A. Quantitative and qualitative disclosure of market risks
|
|
|
Item 8. Financial statements and supplementary data
|
|
|
Item 9. Changes in and disagreements with accountants on accounting and financial statement disclosure
|
|
|
Item 9A. Controls and procedures
|
|
|
Item 9B. Other information
|
|
|
PART III
|
|
|
Item 10. Directors, executive officers, and corporate governance
|
|
|
Item 11. Executive compensation
|
|
|
Item 12. Security ownership of certain beneficial owners and management and related stockholder matters
|
|
|
Item 13. Certain relationships and related transactions, and director independence
|
|
|
Item 14. Principal accountant fees and services
|
|
|
PART IV
|
|
|
Item 15. Exhibits and financial statement schedules
|
|
|
Signatures
|
|
In this annual report on Form 10-K (“Annual Report”), “Goosehead,” the “Company,” “GSHD,” “we,” “us” and “our” refer to Goosehead Insurance, Inc. and its consolidated subsidiaries, including Goosehead Financial, LLC, together.
Commonly used defined terms
As used in this Annual Report, unless the context indicates or otherwise requires, the following terms have the following meanings:
|
•
|
Agency Fees: Fees separate from commissions charged directly to clients for efforts performed in the issuance of new insurance policies.
|
|
•
|
Book of Business: Insurance policies bound by us with our Carriers on behalf of our clients.
|
|
•
|
Best Practices Study: The industry group metrics are based on the latest date for which complete financial data are publicly available such as a 2018 Best Practices Study containing 2017 industry data conducted by Reagan Consulting and the Independent Insurance Agents & Brokers of America, Inc.
|
|
•
|
Captive Agent: An insurance agent who only sells insurance policies for one Carrier.
|
|
•
|
Carrier: An insurance company.
|
|
•
|
Carrier Appointment: A contractual relationship with a Carrier.
|
1
|
•
|
Client Retention: Calculated by comparing the number of all clients that had at least one policy in force twelve months prior to the date of measurement and still have at least one policy in force at the date of measurement.
|
|
•
|
Contingent Commission: Revenue in the form of contractual payments from Carriers contingent upon several factors, including growth and profitability of the business placed with the Carrier.
|
|
•
|
Corporate Channel: The Corporate Channel distributes insurance through a network of company-owned and financed operations with employees that are hired, trained and managed by Goosehead.
|
|
•
|
Corporate Channel Adjusted EBITDA: Segment earnings before interest, income taxes, depreciation and amortization allocable to the Corporate Channel, adjusted to exclude Class B share compensation.
|
|
•
|
Franchise Agreement: Agreements governing our relationships with Franchisees.
|
|
•
|
Franchise Channel: The Franchise Channel network consists of Franchisee operations that are owned and managed by Franchisees. These business owners have a contractual relationship with Goosehead to use our processes, training, implementation, systems and back-office support team to place insurance. In exchange, Goosehead is entitled to an Initial Franchise Fee and Royalty Fees.
|
|
•
|
Franchise Channel Adjusted EBITDA: Segment earnings before interest, income taxes, depreciation and amortization, adjusted to exclude other non-operating items allocable to the Franchise Channel and equity-based compensation.
|
|
•
|
Franchisee: An individual or entity who has entered into a Franchise Agreement with us.
|
|
•
|
GF: Goosehead Financial, LLC.
|
|
•
|
GM: Goosehead Management, LLC.
|
|
•
|
Initial Franchise Fee: Contracted fees paid by Franchisees to compensate Goosehead for the training and onboarding of new franchise locations.
|
|
•
|
LLC Unit: a limited liability company unit of Goosehead Financial, LLC.
|
|
•
|
New Business Production per Agent (Corporate): The New Business Revenue (Corporate) collected, divided by the average number of full-time Corporate Channel sales agents for the same period. This calculation excludes interns, part-time sales agents and partial full-time equivalent sales managers.
|
|
•
|
New Business Production per Agent (Franchise): The gross commissions paid by Carriers and agency fees received related to policies in their first term sold in the Franchise Channel divided by the average number of sales agents in the Franchise Channel for the same period prior to paying Royalty Fees to the Company. This calculation excludes part-time agents and production related to the Book of Business that was sold in 2017 related to a Franchisee termination.
|
|
•
|
New Business Production per Agency: The gross commissions paid by Carriers and agency fees received related to policies in their first term sold in the Franchise Channel divided by the average number of franchises in the Franchise Channel for the same period prior to paying Royalty Fees to the Company.
|
|
•
|
New Business Revenue: Commissions received from Carriers, Agency Fees received from clients, and Royalty Fees received from Franchisees relating to policies in their first term.
|
|
•
|
New Business Revenue (Corporate): Commissions received from Carriers and Agency Fees charged to clients relating to policies in their first term sold in the Corporate Channel.
|
|
•
|
NPS: Net Promoter Score is calculated based on a single question: “How likely are you to refer Goosehead Insurance to a friend, family member or colleague?” Customers that respond with a 6 or below are Detractors, a score of 7 or 8 are called Passives, and a 9 or 10 are Promoters. NPS is calculated by subtracting the percentage of Detractors from the percentage of Promoters.
|
|
•
|
P&C: Property and casualty insurance.
|
|
•
|
Policies in Force: As of any reported date, the total count of current (non-cancelled) policies placed by us with our Carriers.
|
|
•
|
Pre-IPO LLC Members: owners of LLC Units of GF prior to the Offering.
|
|
•
|
Referral Partner: An individual or entity with whom a sales agent establishes a referral relationship.
|
|
•
|
Renewal Revenue: Commissions received from Carriers and Royalty Fees received from Franchisees after the first term of policies.
|
2
|
•
|
Renewal Revenue (Corporate): Commissions received from Carriers after the first term of policies originally sold in the Corporate Channel.
|
|
•
|
Royalty Fees: Fees paid by Franchisees to the Company that are tied to the gross commissions paid by the Carriers related to policies sold or renewed in the Franchise Channel.
|
|
•
|
Segment: One of the two Goosehead sales distribution channels, the Corporate Channel or the Franchise Channel.
|
|
•
|
Segment Adjusted EBITDA: Either Corporate Channel Adjusted EBITDA or Franchise Channel Adjusted EBITDA.
|
|
•
|
The Offering: The initial public offering completed by Goosehead Insurance, Inc. on May 1st, 2018.
|
|
•
|
Total Written Premium: As of any reported date, the total amount of current (non-cancelled) gross premium that is placed with Goosehead’s portfolio of Carriers.
|
|
•
|
TWIHG: Texas Wasatch Insurance Holdings Group, LLC.
|
|
•
|
Unvalidated Producers: A metric used by Reagan Consulting describing agents whose production does not yet cover their wages under their agency’s commission formula.
|
3
Special note regarding forward-looking statements
We have made statements under the captions “Item 1. Business,” “Item 1A. Risk factors,” “Item 7. Management’s discussion and analysis of financial condition and results of operations” and in other sections of this Annual Report that are forward-looking statements. In some cases, you can identify these statements by forward-looking words such as “may,” “might,” “will,” “should,” “expects,” “plans,” “anticipates,” “believes,” “estimates,” “predicts,” “potential” or “continue,” the negative of these terms and other comparable terminology. These forward-looking statements, which are subject to risks, uncertainties and assumptions about us, may include projections of our future financial performance, our anticipated growth strategies and anticipated trends in our business. These statements are only predictions based on our current expectations and projections about future events. There are important factors that could cause our actual results, level of activity, performance or achievements to differ materially from the results, level of activity, performance or achievements expressed or implied by the forward-looking statements, including those factors discussed under “Item 1A. Risk factors.” You should specifically consider the numerous risks outlined under “Item 1A. Risk factors.”
Although we believe the expectations reflected in the forward-looking statements are reasonable, we cannot guarantee future results, level of activity, performance or achievements. Moreover, neither we nor any other person assumes responsibility for the accuracy and completeness of any of these forward-looking statements. We are under no duty to update any of these forward-looking statements after the date of this Annual Report to conform our prior statements to actual results or revised expectations.
4
PART I
Item 1. Business
Company overview
We are a leading independent personal lines insurance agency, based on personal lines revenue, reinventing the traditional approach to distributing personal lines products and services throughout the United States. We were founded with one vision in mind—to provide consumers with superior insurance coverage at the best available price and in a timely manner. By leveraging our differentiated business model and innovative technology platform, we are able to deliver to consumers a superior insurance experience. Our business model, in contrast to the traditional insurance agency model, separates the sales function from the service function, thus enabling agents to focus on selling, and service personnel to focus on delivering superior client service. In addition, our technology platform empowers our agents with tools to better manage their sales initiatives and provides our service personnel with real-time 360-degree visibility of client accounts. As a result, we have achieved best-in-class net promoter scores for client service, nearly
2.1x the 2017
P&C industry average.
We represent over
85
insurance companies that underwrite personal lines and small commercial lines risks, which typically enables us to provide broader insurance coverage at a lower price point than competing agents who represent only a few carriers, carriers with captive agents or carriers that distribute directly to consumers.
Our business has grown substantially since our founding in 2003. Today we are a rapidly-growing independent insurance agency and franchisor in the United States. Our operations now include a network of
seven
corporate sales offices and
646
franchise locations (inclusive of
189
franchises which are under contract but yet to be opened as of
December 31, 2018
). In addition, we have service center operations at our headquarters and in Henderson, Nevada. Our growth is reflected in our financial performance. Revenue grew period over period by
41%
and
36%
for the years ended
December 31, 2018
and
2017
, respectively. This growth has been driven by our recruiting team’s ability to recruit talented agents to our platform, our agents’ leveraging of Goosehead's sales blueprint and proprietary technology leading to higher levels of productivity in winning new business and our service centers’ ability to retain renewal business. All of our growth has been organic; we have not relied on mergers or acquisitions. Furthermore, we are profitable. For the year ended
December 31, 2018
the Company had
$8.7 million
of net loss due to IPO-related equity compensation, but generated
$14.8 million
of Adjusted EBITDA, a
$4.0 million
increase over
2017
. Adjusted EBITDA is a non-GAAP Measure. See "Item 7. Management's discussions and analysis of financial condition and results of operations - Key performance indicators" for additional information and a reconciliation to the most directly comparable GAAP financial measure.
Our insurance product offerings primarily consist of homeowner’s insurance; auto insurance; other personal lines products, including flood, wind and earthquake insurance; excess liability or umbrella insurance; specialty lines insurance (motorcycle, recreational vehicle and other insurance); commercial lines insurance (general liability, property and auto insurance for small businesses); and life insurance. We do not take any insurance underwriting risk in the operation of our business.
We enter into Carrier Appointments that set the terms of engagement, define legal ownership of client accounts and client data, and determine compensation. Our
2018
average commission rate on new business premium was
15%
and on renewal business premium was
14%
. Commission rates can vary across Carriers, states and lines of business, and typically range from 10% to 20%. Because we represent a broad set of Carriers that all have unique risk appetites and underwriting strategies, we can usually provide our clients with broader insurance coverage at a lower price point than competing agents who represent only one Carrier exclusively, or Carriers that distribute directly to insurance buyers.
We have two Segments that work together to drive our growth: the Corporate Channel and Franchise Channel. The Corporate Channel consists of company-owned and financed operations with employees who are hired, trained and managed by us. The Corporate Channel also serves as a research and development department, where we develop best practices and beta test new technology before implementing system-wide. The Franchise Channel consists of Franchisee operations that are owned and managed by Franchisees. These Franchisees have a contractual relationship with us to use our processes, systems, and back-office support team to sell insurance and manage their business. In exchange, we are entitled to an Initial Franchise Fee and ongoing Royalty Fees. We manage our two Segments from our headquarters in Westlake, Texas. In addition to managing our Segments, our headquarters is responsible for overseeing our client service centers, our network of Referral Partners, our recruiting team and our technology functions which tie all aspects of our business together. Our headquarters also provides various risk management, quality control, accounting, legal and finance functions.
5
In the Corporate Channel, we generate revenue in the form of New Business Revenue (Corporate), Renewal Revenue (Corporate), and non-refundable Agency Fees charged directly to clients for efforts performed in the issuance of new insurance policies. We also generate revenue in the form of Contingent Commissions from Carriers related to the overall performance of the Book of Business we have placed with them. The Corporate Channel is comprised of sales agents that are our employees located in six sales offices in Texas and one in Illinois. We have experienced rapid growth in sales agents and revenue in this Segment. During
2018
, our Corporate Channel sales agent headcount increased by
50%
and our Corporate Channel premiums placed grew by
33%
, in each case, versus the prior year. Corporate Channel premium growth trailed headcount growth due to the large renewal mix of our premiums placed and the ongoing ramp up of recently hired producers. As of
December 31, 2018
, we had corporate sales offices operating in the following locations: Westlake, Texas; Irving, Texas; Fort Worth, Texas; Houston, Texas; The Woodlands, Texas; Austin, Texas; and Rosemont, Illinois.
In the Franchise Channel, we generate revenue in the form of Royalty Fees paid by Franchisees that are tied to New Business Revenue and Renewal Revenue generated by the franchise location, Initial Franchise Fees related to the training and onboarding of new franchise locations and Contingent Commissions. Royalty Fees are set in the Franchise Agreements at 20% of New Business Revenue and 50% of Renewal Revenue. We charge a non-refundable Initial Franchise Fee to new Franchisees which compensates us for the training and onboarding efforts to launch a new franchise location. The Franchise Channel is comprised of Franchisees and sales agents that they hire in their franchised businesses. Our Franchise Agreement has a ten-year term, dictates the Initial Franchise Fee, Royalty Fees and other costs a Franchisee pays, and governs the terms under which we operate together. Franchisees have contractual rights to revenue related to the Book of Business during the term of their agreement.
We started franchising in 2012 and have grown rapidly in the Franchise Channel. Premiums in the Franchise Channel grew
60%
during
2018
. As of
December 31, 2018
, we have
457
franchise locations operating, a
57%
increase over year-end operating agencies in
2017
, and
189
signed Franchise Agreements that are in the implementation process. We have franchise locations either operating or signed in the following states:
|
Geographic footprint
|
Operating or signed agencies
|
||

|
State
|
December 31, 2018
|
|
|
Texas
|
226
|
|
|
|
California
|
72
|
|
|
|
Illinois
|
48
|
|
|
|
Florida
|
46
|
|
|
|
Pennsylvania
|
40
|
|
|
|
Michigan
|
35
|
|
|
|
North Carolina
|
26
|
|
|
|
Louisiana
|
19
|
|
|
|
New York
|
19
|
|
|
|
New Jersey
|
15
|
|
|
|
Virginia
|
15
|
|
|
|
Colorado
|
13
|
|
|
|
Maryland
|
13
|
|
|
|
South Carolina
|
13
|
|
|
|
Other
|
46
|
|
|
|
Total
(1)
|
646
|
|
|
|
(1)
|
Number of franchise locations include
189
franchises which are under contract but yet to be opened as of
December 31, 2018
.
|
Our business model allows our sales agents in both Segments to concentrate on sales and marketing activities related to acquiring new clients and issuing new policies, thus growing New Business Revenue and Renewal Revenue. Their primary marketing efforts are focused on establishing referral relationships with other financial services providers in their communities using our marketing strategy. The nature of Referral Partner leads allows us to realize higher close rates and lower client acquisition costs than what we believe to be standard in the industry. Furthermore, our agents are typically dealing with homeowners who own other assets, such as automobiles and therefore tend to be better insurance risks from a Carrier’s perspective. Such clients often purchase additional policies, such as auto insurance, which allows us to capture additional revenue and increases the likelihood of retaining the client in the future. Importantly, we do not compensate Referral Partners for leads, but rather rely on our servicing capabilities to generate repeat business.
6
We have significant room to expand our market share across the country. Our biggest presence is in Texas where we have been operating the longest. By leveraging our Referral Partners, we placed approximately
35 thousand
policies related to mortgage originations in
2018
. This represents
10.2%
of the approximately
344 thousand
Texas mortgage originations
2018
, according to the Texas A&M Real Estate Center.
Our model, which allows agents to focus on New Business Revenue, is highly differentiated from the traditional insurance agency model. In the traditional agency model, agents are responsible for both new business and ongoing service. The burden of providing ongoing service distracts from the ability to acquire new clients, and ultimately limits the opportunity for growth. Our agents are not only freed from the burden of ongoing service, but also given technology tools that create efficiency. As a result, agents in both Segments are substantially more productive than top performers in our industry as it relates to new sales. Compared to the 2018 Best Practices Study, which uses 2017 industry data, Corporate Channel agents with more than three years of tenure averaged
3.4x
as much New Business Production per Agent as the industry best practice during 2017. Franchise Channel agents with more than three years of tenure averaged
1.5x
as much New Business Production per Agent (Franchise) as the industry best practice during 2017.

Source: Internal data; Carrier provided information; Reagan Consulting
|
(1)
|
Represents industry best practice per Reagan Consulting; does not include Unvalidated Producers; most industry agents have tenures significantly longer than 2 to 3 years.
|
We believe our agent productivity compares even more favorably to the industry than the Best Practices Study would imply because the Best Practices Study excludes Unvalidated Producers. If the Best Practices Study included Unvalidated Producers, our New Business Production per Agent outperformance would be even larger.
In the Corporate Channel, New Business Production per Agent was $70 thousand and $127 thousand for agents with less than 1 year of tenure and greater than one year of tenure, respectively, during 2018. Including all producers in the Franchise Channel, New Business Production per Agency was $43 thousand and $87 thousand for agencies with less than 1 year of tenure and greater than one year of tenure in Texas, respectively, during 2018. Outside of Texas, New Business Production per Agency was $40 thousand and $59 thousand for agencies with less than 1 year of tenure and greater than one year of tenure, respectively, during 2018.
Both the Corporate Channel and the Franchise Channel are supported by our client service centers. Our service centers are staffed by fully licensed property and casualty service agents who provide fulfillment and quality control services for newly issued insurance policies, accounting services and ongoing support services for clients. Ongoing support services for clients include: handling client inquiries, facilitating the claims process with Carriers, accepting premium payments and processing policy changes and renewals. Our service agents are also focused on selling additional policy coverage to clients which accounts for additional New Business Revenue. Our two separate service centers provide us with the ability to cover the U.S. time zones more broadly, and the ability to better manage business continuity risks. We manage our service centers with the goal that clients reach an agent in less than 60 seconds and are able to have fully bound insurance policies in under an hour. This differentiated level of service has enabled us to earn an NPS of
89
in 2018 and
86
in
2017
—greater than highly regarded brands like Ritz Carlton and Nordstrom and
2.1x the 2017
industry average, according to Satmetrix. Our high degree of client
7
satisfaction drove our
88%
Client Retention rate during
2018
, which we believe to be among the highest in the industry. Our retention rate is even stronger on a premium basis. In
2018
, we retained
94%
of the premiums we distributed in
2017
. Our premium retention rate is higher than our Client Retention rate as a result of both premiums increasing year over year and additional coverages sold by our service team. By maintaining this strong level of Client Retention, we are able to generate revenue that is both highly visible and recurring in nature.
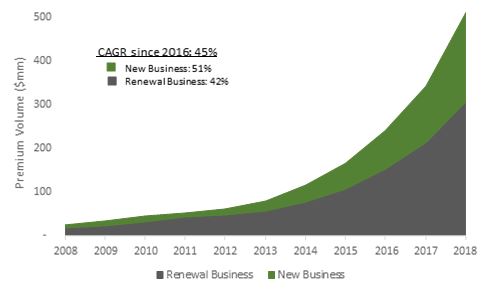
The combination of expanding headcount in the Corporate Channel, expanding franchise count in the Franchise Channel, leveraging technology and maintaining our commitment to service led to revenue growth of
41%
and Total Written Premium growth of
49%
in
2018
. This level of Total Written Premium growth is consistent with our historical experience of accelerated growth. As of
December 31, 2018
, our 10-year Total Written Premium CAGR was
35%
and our 5-year premium CAGR was
45%
.
|
Total Written Premium by channel
|
Total Written Premium by business type
|
|

|
|
|
Source: Carrier provided information
In addition to strong revenue and Total Written Premium growth, we have also experienced Franchise Channel Adjusted EBITDA margin expansion, which was
33%
in
2018
, up from
27%
in
2017
. Corporate Channel Adjusted EBITDA margin decreased modestly in
2018
to
22%
from
25%
due to our Corporate Channel sales agent headcount growth of
50%
.
|
|
2018
|
|
2017
|
||||||||||||
|
|
Corporate
Channel |
|
Franchise
Channel |
|
Corporate
Channel |
|
Franchise
Channel |
||||||||
|
|
($000s)
|
||||||||||||||
|
Revenue
|
$
|
34,287
|
|
|
$
|
25,861
|
|
|
$
|
25,521
|
|
|
$
|
17,190
|
|
|
Segment Adjusted EBITDA
|
7,536
|
|
|
8,615
|
|
|
6,367
|
|
|
4,693
|
|
||||
|
Segment Adjusted EBITDA margin
|
22
|
%
|
|
33
|
%
|
|
25
|
%
|
|
27
|
%
|
||||
|
2018
|
|||||
|
Corporate
Channel |
Franchise
Channel |
||||
|
Revenue growth over 2017
|
34
|
%
|
50
|
%
|
|
|
Segment Adjusted EBITDA growth over 2017
|
18
|
%
|
84
|
%
|
|
Industry trends
We primarily compete in the United States personal lines insurance distribution industry. Personal lines products typically include home, auto, umbrella, motorcycle, flood and recreational insurance. We compete for business on the basis of reputation, client service, product offerings and the ability to tailor our products to the specific needs of a client. There are principally three types of businesses that sell personal lines products:
8
|
•
|
Independent agencies (
35%
personal lines market share in 2017 according to the Independent Insurance Agents & Brokers of America, Inc.)
. Independent agencies are “independent” of any one Carrier and can offer insurance products from multiple Carriers to their clients. There are approximately
36,500
independent insurance agencies in the United States, according to the
2018
Future One Agency Universe Case Study. Many of the largest insurance agencies, such as Aon plc, Arthur J. Gallagher & Co., Brown & Brown Inc., Marsh & McLennan Companies, Inc. and Willis Towers Watson plc, focus primarily on commercial lines. We believe that we are one of the largest independent insurance agencies focused primarily on personal lines.
|
|
•
|
Captive Agencies (
47%
personal lines market share in 2017 according to the Independent Insurance Agents & Brokers of America, Inc.).
Captive Agencies sell products for only one Carrier. The Carrier compensates the Captive Agency through sales commissions based on premiums placed on behalf of clients. The Carrier also provides the Captive Agency with operational support including advertising and certain back office functions. The largest Captive Agencies in the United States include Allstate Corporation, State Farm Mutual Automobile Insurance Company and Farmers Group, Inc.
|
|
•
|
Direct distribution (
18%
personal lines market share in 2017 according to the Independent Insurance Agents & Brokers of America, Inc.)
. Certain Carriers market their products directly to clients. Historically, this strategy has been most effective for targeting clients who require auto insurance only, with clients seeking bundled solutions relying on advice from independent and captive agents. The largest Carriers that sell directly to clients include Berkshire Hathaway Inc. (via GEICO Corp.) and Progressive Corporation.
|
Personal lines insurance agents generate revenues through commissions, which are calculated as a percentage of the total insurance premium placed on behalf of clients, and through fees for other related services. Premiums in the personal lines insurance market have grown consistently with underlying insured values and the overall economy.
|
Personal lines products
|
|
Personal lines premium trends
|
||
|
Auto premiums
|
|
Homeowners premiums
|
|

|

|
|

|
|
|
Source: S&P Global Market Intelligence and A.M. Best
Premium pricing within the P&C insurance industry has historically been cyclical, based on the underwriting capacity of the insurance industry and economic conditions. External events, such as terrorist attacks, and man-made and natural disasters, can also have significant impacts on the insurance market. We use the terms ‘‘soft market’’ and ‘‘hard market’’ to describe the business cycles experienced by the industry. A soft market is an insurance market characterized by a period of declining premium rates, which can negatively affect commissions earned by insurance agents. A hard market is an insurance market characterized by a period of rising premium rates, which, absent other changes, can positively affect commissions earned by insurance agents.
In recent years, auto insurance premium pricing has been in a hard market as accident costs have risen
significantly. Between
2014
and
2016
, bodily injury costs rose
11.7%
and auto property damage costs rose
15.1%
,
according to the Insurance Information Institute. Conversely, homeowners insurance premium pricing has recently
been in a soft market according to the Counsel of Independent Agents and Brokers. However, the
2017
Atlantic
Hurricane season was one of the most active in recent history. Dowling & Partners Securities, LLC estimates
that Hurricanes Harvey, Irma and Maria will result in insured losses ranging from
$70 billion
to more than
$100 billion
and insured losses from the recent California wildfires to be
$15 billion
; similar levels of industry losses in the
past have resulted in a hardening of the insurance market.
Our segments
9
Our Segments are geared to leverage the strengths of two different talent pools to maximize productivity. The Corporate Channel recruits young agents who are typically new to insurance distribution; the Franchise Channel primarily recruits agents with industry experience. The combination of our two Segments enables us to prudently expand our business model while providing differentiated service to our clients.
Corporate Channel (
57%
of
2018
total revenue)
The Corporate Channel primarily targets young agents, particularly recent college graduates who typically do not have experience in the insurance industry. The majority of candidates are sourced through a combination of on-campus recruiting, employee referrals and highly targeted internet recruiting campaigns. Our recruitment team seeks candidates who display a high aptitude for learning new skills, are motivated by professional and financial incentives and display the ability to succeed in a team-oriented environment. After the recruitment team has selected candidates, they are placed into a training class that lasts approximately two weeks. Corporate Channel agents are required to become fully licensed P&C agents prior to training. During the training class, Corporate Channel agents acquire a wide variety of skills including:
|
•
|
knowledge of all available personal lines products and the trade-offs between pricing and coverage;
|
|
•
|
the ability to fit their clients to the best insurance products at the right price point;
|
|
•
|
the ability to leverage our well-established network of Referral Partners to win new business;
|
|
•
|
the ability to leverage our service centers to service policies and handle renewal activities; and
|
|
•
|
the ability to leverage our technology tools to increase productivity.
|
The combination of hiring highly motivated and talented individuals, giving them proper tools and training and removing the burden of ongoing client service allows our Corporate Channel agents to become significantly more productive than average personal lines agents. Compared to the 2018 Best Practices Study, Corporate Channel agents with more than two years of tenure averaged
3.4x
as much New Business Production per Agent (Corporate) as the industry best practice. Corporate Channel agents with less than two years of tenure averaged
2.0x
as much New Business Production per Agent (Corporate) as the industry best practice.
Franchise Channel (
43%
of
2018
total revenue)
The Franchise Channel primarily recruits agents with industry experience. Our Franchise Channel has a unique value proposition to experienced agents who understand the limits and pain points of the traditional agency model:
|
•
|
Franchise Channel agents gain access to products from multiple carriers in their markets, allowing Franchise Channel agents to better serve their clients and provide choice. Captive Agents typically can only sell products from one Carrier.
|
|
•
|
Franchise Channel agents can leverage our service centers to handle service requests and process renewals. Most traditional agencies require their agents to handle client service and renewals which diminishes the time they can devote to winning additional new business and growing their agencies. Traditional agencies can become the victims of their own success as their increasing service burden crowds out time to sell new business.
|
|
•
|
Franchise Channel agents use our well-established sales processes to win new business. Franchise Channel agents are trained side by side with Corporate Channel agents to leverage our training program, to acquire product and Carrier knowledge and to utilize our technology and back office support.
|
|
•
|
Franchise Channel agents benefit from lean startup costs as they do not require multiple employees or a retail location to run their agencies. Captive Agents are often required to immediately hire two to three additional employees as support staff, lease a storefront location, and contribute a specific percentage of revenue toward an advertising budget. Further, most fixed costs in a traditional agency (e.g., administrative costs, technology fees, training expenses and service costs) are diminished in our Franchise Channel due to Goosehead’s scale, and we expect that they will continue to decrease as the Franchise Channel grows.
|
|
•
|
Franchise Channel agents own an economic interest in their Books of Business.
|
Our franchise sales team is responsible for recruiting the Franchisee applicants that are ultimately approved to operate within the Franchise Channel. The franchise sales team seeks applicants who have demonstrated a strong capacity to win new business and a desire to own their own business. Our recruiting efforts have helped us create a franchise pool which is significantly more productive than average personal lines agents. Compared to the 2018 Best Practices Study, Franchise Channel agents with more than three years of tenure averaged
1.5
x as much New
10
Business Production per Agent (Franchise) as the industry best practice. Franchise Channel agents with less than two years of tenure maintained equally as much New Business Production per Agent (Franchise) as the industry best practice.
Our competitive strengths
We believe that our competitive strengths include the following:
|
•
|
Young and highly motivated producers in the Corporate Channel
. The agents in the Corporate Channel are fundamentally different than the typical agents in the personal lines industry. Substantially all of our agents are recent college graduates (average age of
27
), whereas
64%
of personal lines agents in the industry are over 50 years old, according to the 2018 Future One Agency Universe Case Study. This gives us a significant advantage both in the short- and long-term. In the short-term, our agents have proven to be especially adept at learning new techniques and mastering new technologies. This has enabled our agents to generate approximately
3.4x
as much new business as top performing personal lines agents after three years, according to the 2018 Best Practices Study. Over the long-term, we believe our youth will enable us to avoid the shrinking workforce challenges that many of our competitors face and win an even larger market share from other agencies. According to Independent Insurance Agents & Brokers of America, Inc.,
42%
of independent agencies anticipate a change of control within the next five years. We believe an aging industry workforce will create significant disruption in the personal lines distribution industry, and we will be in a position to win displaced clients.
|
|
•
|
Franchise Channel solves the inherent flaws in the traditional agency model
. We believe that the traditional agency model is flawed for several reasons, including: (1) Captive Agents can only offer clients products from one Carrier, limiting the agents’ ability to best serve their clients, (2) agents are typically responsible for handling their own client service and renewals, diminishing the time they can devote to winning new business and growing their overall Book of Business and (3) some Captive Agents do not own their Book of Business, giving them less incentive to win new business. Given the size of the traditional agency market and its inability to adapt to these challenges without introducing significant channel conflict, we believe there is a meaningful opportunity to disrupt the traditional agency marketplace. Our Franchise Channel seeks to solve the inherent problems in the traditional agency model. Agents in the Franchise Channel are able to focus on new business, provide clients with choice by offering products from multiple Carriers, and own an economic interest in their Book of Business. Furthermore, by removing the service burden which takes a significant amount of time and energy, we believe our platform provides Franchise Channel agents with the ability to manage larger Books of Business than agents working in a traditional agency model. As a result, the Goosehead model has proven to be attractive to high-performing agents who wish to achieve greater professional and financial success.
|
|
•
|
Single technology platform with end-to-end business process management
. Our operations utilize an innovative cloud-based technology solution which is built on the Salesforce.com platform with significant proprietary investment to customize it to suit our needs. Our technology provides our agents with tools to better manage their sales and marketing activities, and our service center operations with real-time 360-degree visibility of client accounts. Additionally, our technology provides agents with data and analytics which allow them to make smarter business decisions. We believe our single, sales-oriented technology platform is differentiated relative to most insurance agency IT environments that utilize disparate accounting-driven agency management vendors and legacy mainframe systems across their operations. Our technology platform has been a key enabler of our growth while also driving efficiencies. One of these efficiencies is service expenses. Our 2017 service expenses as a percentage of gross commissions were
4.0x
lower than the industry best practice according to the 2018 Best Practices Study, which uses 2017 data. Despite our reduced service expense load, we are able to maintain best in class NPS scores and typically deliver policy binders in under an hour.
|
|
•
|
Service centers drive both new and renewal business
. Our service centers handle all of our client service and renewals and have achieved a highly differentiated level of service as indicated by our NPS scores of
89
in
2018
and
86
in 2017—higher than many global service leaders such as Ritz Carlton and Nordstrom and
2.1x
the P&C industry average, according to Satmetrix. Having such a skilled service team provides three tangible benefits to our business: (1) allowing our agents to focus virtually all of their time on winning new business (instead of preserving existing business), (2) generating strong Client Retention which provides a stable source of highly visible and recurring revenue and (3) providing opportunities to earn additional revenue as our service agents are highly trained in cross-selling and generating referral business. Our service agents typically originate significant amounts of New Business Revenue through cross-sale and referral generation. We believe that our service centers will continue to drive a competitive advantage by supporting our industry-leading productivity and our recruiting efforts. We continue to make the necessary technology, staffing and real estate investments
|
11
in our service centers to support our planned agent hiring which we believe will allow us to readily scale and increase market share.
|
•
|
Unique value proposition to Referral Partners
. We have highly standardized processes across our entire organization due to the strong quality controls instituted in our service centers. Both new business and renewal business move through our systems in a tightly choreographed manner which enables both strong quality controls and quick delivery of services. We have found that the ability to quickly and accurately bind an insurance policy is attractive to both individuals buying insurance and third parties, such as Referral Partners, who can drive new business to us. Referral Partners include financial services providers who depend on us to timely place insurance policies and to provide the flexibility to facilitate necessary changes rapidly, including at the time of home closings. This allows our Referral Partners to close transactions on time and ultimately become more productive in their business. We do not compensate our Referral Partners for sending us new business.
|
|
•
|
Proven and experienced senior management team
. Our senior management team has a long history of cohesively operating together and implementing our business model. Our Chairman and Chief Executive Officer, Mark E. Jones, co-founded Goosehead in 2003. Prior to co-founding Goosehead, Mr. Jones was a Senior Partner and Director at Bain & Company, a global management consulting firm, where he also served for many years as Global Head of Recruiting. Many of our management, sales and recruiting practices were developed and refined by Mr. Jones during his time at Bain and instituted at Goosehead. Mr. Jones has received a wide variety of accolades for his leadership accomplishments, including being recognized as one of the Top Rated CEOs from among more than 7,000 companies with less than 1,000 employees on Glassdoor’s “Employee’s Choice Award” in 2017. In 2006, Mr. Jones recruited Michael Colby to join Goosehead as Controller. Over the last 12 years, Mr. Colby has worked closely with Mr. Jones in all aspects of the business, taking on increasing responsibility; becoming Chief Financial Officer in 2010, Chief Operating Officer of our Franchise Channel in 2011, Chief Operating Officer of Goosehead in 2014, and President and Chief Operating Officer of Goosehead in 2016.
|
Key elements of our growth strategy
Our goal is to achieve long-term returns for our stockholders by establishing ourselves as the premier national distributor of personal lines insurance products. To accomplish this goal, we intend to focus on the following key areas:
|
•
|
Continue to expand recruiting in the Corporate Channel
. We strive to prudently grow our business by expanding our agent count in the Corporate Channel. We have a highly developed process for recruiting new agents which we have continually refined over the last decade and has resulted in higher success rates for our Corporate Channel agents. As demonstrated in the chart below, our compensation package for sales agents is very competitive in comparison to other professional services and offers attractive long-term compensation opportunities.
|
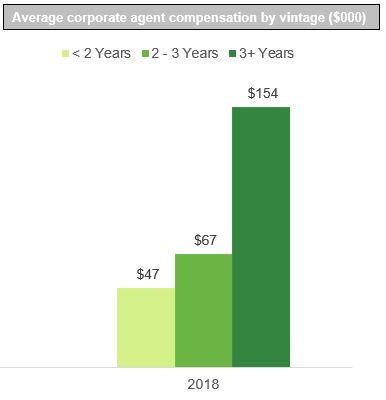
Given our success recruiting agents, we plan to expand our recruiting to additional college campuses and engage in highly targeted internet recruiting campaigns.
12
|
•
|
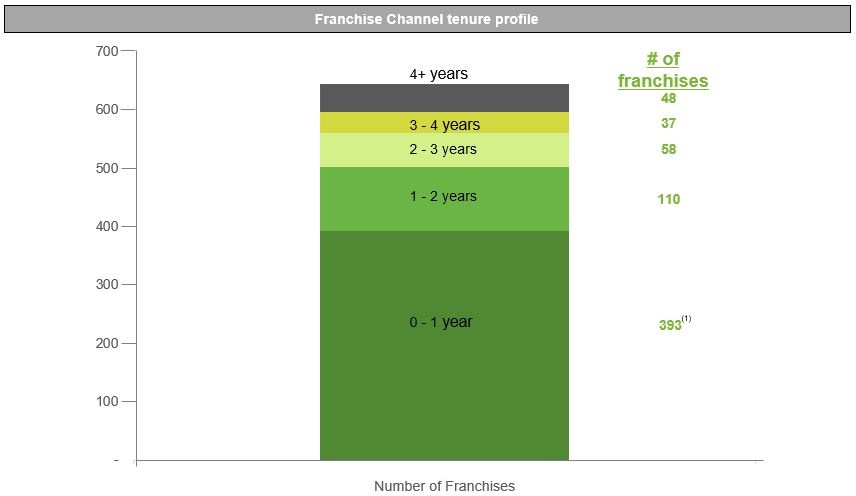
National rollout of the Franchise Channel
. Prior to
2018
, we had franchises in ten states (Texas, California, Florida, Virginia, Illinois, Pennsylvania, Michigan, North Carolina, Louisiana and Oklahoma). In
2018
, we targeted expansion into Colorado, Connecticut, Indiana, Maryland, Missouri, New Jersey, New York, Ohio, South Carolina, Washington and Wisconsin. As of December 31, 2018, we have signed Franchise Agreements in each of these states. The success of the national rollout of the Franchise Channel is only starting to emerge in our financial performance. As of
December 31, 2018
,
61%
of our Franchisees had less than one year of tenure.
|
|
(1)
|
Number of franchise locations include
189
franchises which are under contract but yet to be opened as of
December 31, 2018
.
|
Given the anticipated New Business productivity uplift that comes with more years of experience, and the elevated Royalty Fees on renewal business, we believe our Franchise Channel is positioned for strong growth and margin expansion. This growth will be further enhanced by the approximately
65,000
potential franchise candidates in our current pipeline. The number of potential franchise candidates is updated daily to reflect any new franchise candidates on our Salesforce.com platform. We identify our franchise candidates according to the following criteria: (1) work experience, including sales, entrepreneurial or insurance experience; (2) license status; and (3) geographic location. Of our total current pipeline, we estimate approximately 10% of the candidates would qualify over time as Franchisees under our exacting standards. Although the candidates that meet our franchise standards are not guaranteed to enter into Franchise Agreements, we believe our pipeline will allow us to execute a national build-out of our model. The pace of our national build-out will be aided by the regulatory approvals, product offering approvals and carrier relationships we have already obtained across the continental United States.
|
•
|
Continue to develop innovative ways to drive productivity
. We believe that our agents are already among the most efficient personal lines agents in the industry. Compared to the 2018 Best Practices Study, Corporate Channel agents with more than three years of tenure averaged
3.4x
as much New Business Production per Agent (Corporate) as the industry best practice; Franchise Channel agents with more than three years of tenure averaged
1.5
x as much New Business Production per Agent (Franchise) as the industry best practice. We believe there is an opportunity to further expand productivity, particularly in the Franchise Channel. We have historically deployed the intellectual capital accumulated in the Corporate Channel (including sales practices, client relationship management practices, recruiting practices and technology) into the Franchise Channel to optimize new business production. We will continue to innovate going forward in an effort to both better serve our clients and expand our platform.
|
13
|
•
|
Maximize our effectiveness in managing renewal business
. Renewal business mechanically increases revenue and mechanically decreases expenses. On the revenue side, we earn significantly larger Royalty Fees from our Franchisees for renewal business. On the expense side, many of our largest expenses are significantly lower for renewal business such as compensation costs, risk management costs and client development costs. Critical to converting new business into renewal business is strong Client Retention. Our Client Retention effort is led by our service centers which had a
2018
NPS score of
89
, leading to an
88%
Client Retention rate and
94%
premium retention rate in
2018
. Key to maintaining these NPS scores and Client Retention rates is the consistency of personnel in our service centers. Our consistency in service personnel is due to a combination of the respect we have for our service team and the competitive wages we offer; average compensation for service team employees was over
$46,000
in
2018
. Our Client Retention rates are further enhanced by Mr. Jones’ experience at Bain, where he was one of the leaders in developing Bain’s approach to managing client loyalty in the insurance industry. We actively employ the insights Mr. Jones gleaned during his time at Bain to successfully convert new business into higher-margin renewal business.
|
Technology
We have invested heavily in our technology platform to not only support our business, but to drive growth and productivity. Our operations utilize an innovative cloud-based technology solution which is built on the Salesforce.com platform with significant proprietary investment to customize it to suit our needs:
|
•
|
In 2009, we rolled out Salesforce.com across our entire platform. Our customized agency management system provided us with transparency into client lifecycle, a sophisticated commission accounting application and enhanced analytic capabilities.
|
|
•
|
In 2010, we integrated DocuSign into our Salesforce.com platform, improving client experience and Carrier compliance.
|
|
•
|
In 2011, we added Franchise Channel capabilities which enabled efficient management of Franchisees. We also created the infrastructure necessary to protect sensitive Franchisee information including Client lists. We also rolled-out our email engine which provides marketing automation for cross-selling.
|
|
•
|
In 2013, we created our Carrier knowledge database (a reference library of Carrier underwriting guidelines) and our Referral Partner platform (creates precision and coordination in Referral Partner marketing).
|
|
•
|
In 2015, we established our learning management system which enables efficient compliance training, initial training, and continuing education.
|
|
•
|
In 2016, we invested in InGenius which enhanced customer service capabilities with CTI (computer telephony integration), omni-channel and SMS texting capabilities.
|
|
•
|
2018 was a watershed year for GSHD's technology innovation as we further enhanced our technology platform and strengthened our barriers to entry. The year was highlighted by the following developments:
|
|
◦
|
GSHD's integrated comparative rater was rolled out that eliminated 75% of the required input fields, saving the majority of our agents approximately 15 minutes per quote.
|
|
◦
|
A proprietary mortgage database was made available to our agents providing them a marketing tool with sophistication and precision down to the micro-targeted level to improve client prospecting.
|
|
◦
|
A unified, cloud-based voice solution was implemented system-wide, using AI driven speech analytics to evaluate agent performance and customer sentiment.
|
|
◦
|
We further enhanced our cyber-security protection via Salesforce Shield, continuing education using our proprietary learning management system, and additional email filtering tools.
|
Markets & marketing
We primarily compete in the approximately
$329
billion U.S. personal lines P&C industry, according to A.M. Best. As a distributor, we compete for business on the basis of reputation, client service, product offerings and the ability to efficiently tailor our products to the specific needs of a client.
Agents in both the Corporate Channel and the Franchise Channel are primarily responsible for acquiring new clients. Agents are encouraged to procure new clients through both relationships with Referral Partners and traditional channels (friends, family, client referrals, inbound inquiries and outbound inquiries). Referral Partners are typically professionals in the home buying process who rely on us to quickly bind accurate home insurance policies.
14
While traditional channels are an important source of new business, Referral Partners typically provide us with a high-quality source of ongoing business leads. Clients sourced through Referral Partners are generally in the process of either buying or refinancing a house. These clients frequently purchase additional policies such as auto insurance. By leveraging our Referral Partner network, we have been able to quickly gain scale in the personal lines property and casualty industry without incurring other significant direct client acquisition costs, such as advertising or purchasing internet leads.
The Company represents over
85
Carriers, of which
30
provide national coverage. In
2018
,
two
carriers represented more than 10% of total revenue at
17%
and
11%
. In
2017
,
three
carriers represented more than 10% of total revenue at
18%
,
15%
and
11%
.
Franchise agreements
Our Franchise Channel operates under a franchising model and each franchise is governed by a Franchise Agreement. The Franchise Agreements for all existing franchises are nearly identical. We have taken the position that we do not negotiate the terms of our Franchise Agreements in order to maintain uniformity within the system.
Each Franchise Agreement contains one ten-year term with two optional five-year renewal terms. The Franchise Agreement may be terminated early if the Franchisee is violating a term of the contract, operating contrary to state law, or violating Goosehead procedures required by the operations manual.
Franchisees are required to pay an Initial Franchise Fee that varies depending on the state in which the franchise will be located. Franchisees are also required to pay a monthly Royalty Fee, which entitles the Franchisee to continue to operate in our Franchise Channel. The Royalty Fee is derived from a percentage of gross revenues on insurance policies in their initial (20%) and renewal terms (50%). Franchise owners are not entitled to an exclusive territory and may solicit sales from any location within the state in which they operate, subject to certain internal restrictions.
Franchisees who sign a Franchise Agreement after January 1, 2018, are required to pay a minimum monthly Royalty Fee if the Royalty Fee derived from the gross revenues on insurance policies does not exceed a specific amount.
Franchises operating in the Franchise Channel increased by
57%
to
457
in
2018
from
292
in
2017
and increased by
54%
to
292
in
2017
from
190
in
2016
.
Competition
The insurance brokerage business is highly competitive, and numerous firms actively compete with us for customers and insurance markets. Competition in the insurance business is largely based upon innovation, knowledge, terms and condition of coverage, quality of service and price. A number of firms and banks with substantially greater resources and market presence compete with us.
Our brokerage operations compete with firms, which operate globally or nationally or are strong in a particular region or locality and may have, in that region or locality, an office with revenues as large as or larger than those of our corresponding local office. We believe that the primary factors determining our competitive position with other organizations in our industry are the quality of the services we render, the technology we use, the diversity of products we offer, and the overall costs to our clients.
A number of Carriers directly sell insurance, primarily to individuals, and do not pay commissions to third-party agents and brokers. In addition, the Internet continues to be a source for direct placement of personal lines insurance business. While it is difficult to quantify the impact on our business from individuals purchasing insurance over the Internet, we believe this risk would generally be isolated to personal lines customers with single-line auto insurance coverage, which represent a small portion of our overall business.
Intellectual property
We have registered “Goosehead,” “Goosehead Insurance,” and our logo as trademarks in the U.S. We also have filed other trademark applications in the U.S. and will pursue additional trademark registrations and other intellectual property protection to the extent we believe it would be beneficial and cost effective. We also are the registered holder of a variety of domain names that include “Goosehead” and similar variations.
Regulatory matters
15
Franchise regulation
.
Offers and sales of franchises (so-called “pre-sale” franchise activities) are regulated in the United States by the FTC as well as certain states. The FTC (through its “Franchise Rule”) requires franchisors to provide certain disclosures, in the form of a franchise disclosure document (an “FDD”) to prospective Franchisees. One of the disclosure requirements is to include in the FDD audited financial statements of the franchisor (Goosehead Insurance Agency, LLC) or, if not the franchisor, an affiliate or parent of the franchisor who guarantees the franchisor’s obligations to its franchisees. In order to include our consolidated financial statements in the FDD, we are required to guarantee Goosehead Insurance Agency, LLC’s current and future obligations to its franchisees. The Franchise Rule does not require a franchisor to register or file an FDD with the FTC before offering franchises. Approximately twenty states also have pre-sale franchise or “business opportunity” laws and regulations that require franchisors to register with the state in some manner before that franchisor may offer or sell a franchise in that state, and in some cases to also provide prospective Franchisees with certain additional disclosures as part of the FDD. Approximately twenty-four states also have “franchise relationship laws” that address post-sale aspects of the franchisor-franchisee relationship, such as prohibiting enforcement of certain franchise agreement provisions, requiring a certain notice or cure period before termination of a franchise agreement, and also defining what constitutes “good cause” for terminating the franchise agreement or denying a transfer or renewal of the agreement. Although we believe that our Franchise Agreements and our relationships with Franchisees generally have complied with franchise relationship laws, a failure to comply with those laws could result in civil liability or the company’s inability to enforce a Franchise Agreement, among other things. In addition, while historically our franchising operations have not been materially adversely affected by such laws or regulations, we cannot predict the effect of any future federal or state franchise laws or regulations.
Licensing.
We and/or our designated employees must be licensed to act as brokers, intermediaries or third-party administrators by state regulatory authorities in the locations in which we conduct business. Regulations and licensing laws vary by individual state and are often complex.
The applicable licensing laws and regulations in all states are subject to amendment or reinterpretation by regulatory authorities, and such authorities are vested in most cases with relatively broad discretion as to the granting, revocation, suspension and renewal of licenses. It is our belief that we are in compliance with the applicable licensing laws and regulations of all states in which we currently operate. However, the possibility still exists that we and/or our employees could be excluded or temporarily suspended from carrying on some or all of our activities in, or could otherwise be subjected to penalties by, a particular jurisdiction.
Agent and broker compensation
. Some states, such as Texas, permit insurance agents to charge agency fees, while other states prohibit this practice. In recent years, several states considered new legislation or regulations regarding the compensation of brokers by Carriers. The proposals ranged in nature from new disclosure requirements to new duties on insurance agents and brokers in dealing with customers.
Rate regulation.
Nearly all states have insurance laws requiring personal property and casualty insurers to file rating plans, policy or coverage forms, and other information with the state’s regulatory authority. In many cases, such rating plans, policy or coverage forms, or both must be approved prior to use.
The speed with which an insurer can change rates in response to competition or in response to increasing costs depends, in part, on whether the rating laws are (i) prior approval, (ii) file-and-use, or (iii) use-and-file laws. In states having prior approval laws, the regulator must approve a rate before the insurer may use it. In states having file-and-use laws, the insurer does not have to wait for the regulator’s approval to use a rate, but the rate must be filed with the regulatory authority prior to being used. A use-and-file law requires an insurer to file rates within a certain period of time after the insurer begins using them. Eighteen states, including California and New York, have prior approval laws. Under all three types of rating laws, the regulator has the authority to disapprove a rate filing.
While we are not an insurer, and thus not required to comply with state laws and regulations regarding insurance rates, our commissions are derived from a percentage of the premium rates set by insurers in conjunction with state law.
Privacy regulation.
Federal law and the laws of many states require financial institutions to protect the security and confidentiality of customer information and to notify customers about their policies and practices relating to collection and disclosure of customer information and their policies relating to protecting the security and confidentiality of that information. Federal law and the laws of many states also regulate disclosures and disposal of customer information. Congress, state legislatures, and regulatory authorities are expected to consider additional regulation relating to privacy and other aspects of customer information.
Employees
16
As of
December 31, 2018
, we had approximately
389
full-time and
14
part-time employees. Our Franchisees are independent businesses and their employees and independent contractor sales associates are therefore not included in our employee count. None of our employees are represented by a union. We have a good relationship with our employees.
Corporate Channel sales agent headcount increased by
50%
to
167
in
2018
from
111
in
2017
and increased by
61%
to
111
in 2017 from
69
in
2016
.
Initial Public Offering and Organizational Transactions
On
May 1, 2018
Goosehead Insurance, Inc. completed an initial public offering (the “Offering”) of
10 million
shares of Class A common stock at a price of
$10.00
per share, which included
1 million
shares issued pursuant to the underwriter's over-allotment option. GSHD became the sole managing member of Goosehead Financial, LLC. GF was organized on January 1, 2016 as a Delaware Limited Liability Company and is headquartered in Westlake, TX. The operations of GF represent the predecessor to GSHD prior to the Offering, and the consolidated and combined entities of GF are described in more detail below. Information for any periods prior to
May 1, 2018
relates to GF and its subsidiaries and affiliates.
In connection with the Offering, the company completed the following transactions (the "Reorganization Transactions"):
|
•
|
The GF limited liability company agreement was amended to, among other things, i) appoint GSHD as the sole managing member of GF and ii) modify the capital structure of GF by reclassifying the interests previously held by Pre-IPO LLC Members into a single new class of non-voting LLC Units.
|
|
•
|
GSHD was authorized to issue
two
classes of common stock.
10 million
shares of Class A common stock were issued pursuant to the Offering, including the underwriters' over-allotment option.
23 million
shares of Class B common stock were issued to the Pre-IPO LLC Members in an amount equal to the number of LLC Units held by each such Pre-IPO LLC Member in exchange for certain management rights of GF. Each share of Class A common stock and Class B common stock entitles its holder to
one
vote per share on all matters submitted to a vote of GSHD's stockholders. Each share of Class B common stock can be exchanged for
one
share of Class A common stock or, at GSHD's discretion, a cash payment equal to the volume weighted average market price of
one
share of Class A common stock, thus canceling the share of Class B common stock on a
one
-for-one basis.
|
|
•
|
The Goosehead Management Holders and Texas Wasatch Holders indirectly transferred their ownership interests in GM and TWIHG, respectively, to GSHD in exchange for the Goosehead Management Note and Texas Wasatch Note. The aggregate principal amount of the Goosehead Management Note and the Texas Wasatch Note was approximately
$114 million
. Because the net proceeds from the Offering were insufficient to repay the aggregate principal amount of the notes,
4 million
shares of Class A common stock were issued to the Goosehead Management Holders and the Texas Wasatch Holders for the difference. GSHD contributed direct and indirect ownership interests in each of TWIHG and GM to GF.
|
Following completion of the Reorganization Transactions and the Offering, GSHD owned
37.3%
of GF and the Pre-IPO LLC Members owned the remaining
62.7%
. GSHD is the sole managing member of GF and, although GSHD holds a minority economic interest in GF, GSHD has the sole voting power and control of management of GF. Accordingly, GSHD consolidates the financial results of GF and reports non-controlling interest in GSHD's consolidated financial statements.
As of December 31, 2018, Goosehead Insurance, Inc. owned
38.0%
of Goosehead Financial, LLC and the non-controlling interest holders owned the remaining
62.0%
of Goosehead Financial, LLC.
Available Information
Our Annual Report on Form 10-K, Quarterly Reports on Form 10-Q, Current Reports on Form 8-K, and amendments to reports filed pursuant to Sections 13(a) and 15(d) of the Securities Exchange Act of 1934, as amended (the “Exchange Act”), are filed with the Securities and Exchange Commission (the “SEC”). We are subject to the informational requirements of the Exchange Act and file or furnish reports, proxy statements and other information with the SEC. Such reports and other information filed by us with the SEC are available free of charge on our website at ir.gooseheadinsurance.com when such reports are made available on the SEC’s website. The SEC maintains an Internet site that contains reports, proxy and information statements and other information regarding issuers that file electronically with the SEC at www.sec.gov. The contents of these websites are not incorporated into this filing. Further, our references to the URLs for these websites are intended to be inactive
17
textual references only.
18
Item 1A. Risk factors
An investment in our Class A common stock involves a high degree of risk. You should carefully consider the following risks, as well as the other information contained in this Annual Report on Form 10-K, before making an investment in our Class A common stock. If any of the following risks actually occur, our business, financial condition and results of operations may be materially adversely affected. In such an event, the trading price of our Class A common stock could decline, and you could lose part or all of your investment.
Risks relating to our business
An overall decline in economic activity could have a material adverse effect on the financial condition and results of operations of our business.
Factors, such as business revenue, economic conditions, the volatility and strength of the capital markets and inflation can affect the business and economic environment. The demand for property and casualty insurance generally rises as the overall level of household income increases and generally falls as household income decreases, affecting both the commissions and fees generated by our business. The majority of our new accounts are sourced by referral sources tied to home closing transactions, and major slowdowns in the various housing markets Goosehead serves could impact our ability to generate new business. The economic activity that impacts property and casualty insurance is most closely correlated with employment levels, corporate revenue and asset values. In addition, an increase in consumer preference for car- and ride-sharing services, as opposed to automobile ownership, may result in a long-term reduction in the number of vehicles per capita, and consequently the automobile insurance industry. Downward fluctuations in the year-over-year insurance premium charged by insurers to protect against the same risk, referred to in the industry as softening of the insurance market, could adversely affect our business as a significant portion of the earnings are determined as a percentage of premium charged to our clients. Insolvencies and consolidations associated with an economic downturn, especially insolvencies in the insurance industry, could adversely affect our brokerage business through the loss of clients by hampering our ability to place insurance
business. Our clients may have less need for insurance coverage, cancel existing insurance policies, modify their coverage or not renew the policies they hold with us. Also, error and omission claims against us, which we refer to as E&O claims, may increase in economic downturns, also adversely affecting our brokerage business. A decline in economic activity could have a material adverse effect on our business, financial condition and results of operations.
Volatility or declines in premiums or other adverse trends in the insurance industry may seriously undermine our profitability.
We derive most of our revenue from commissions and fees for our brokerage services. We do not determine the insurance premiums on which our commissions are generally based. Moreover, insurance premiums are cyclical in nature and may vary widely based on market conditions. Because of market cycles for insurance product pricing, which we cannot predict or control, our brokerage revenues and profitability can be volatile or remain depressed for significant periods of time. In addition, there have been and may continue to be various trends in the insurance industry toward alternative insurance markets including, among other things, greater levels of self-insurance, captives, rent-a-captives, risk retention groups and non-insurance capital markets-based solutions to traditional insurance.
As traditional risk-bearing Carriers continue to outsource the production of premium revenue to non-affiliated brokers or agents such as us, those Carriers may seek to further minimize their expenses by reducing the commission rates payable to insurance agents or brokers. The reduction of these commission rates, along with general volatility and/or declines in premiums, may significantly affect our profitability. Because we do not determine the timing or extent of premium pricing changes, it is difficult to precisely forecast our commission revenues, including whether they will significantly decline. As a result, we may have to adjust our budgets for future acquisitions, capital expenditures, dividend payments, loan repayments and other expenditures to account for unexpected changes in revenues, and any decreases in premium rates may adversely affect our business, financial condition and results of operations.
Because the revenue we earn on the sale of certain insurance products is based on premiums and commission rates set by insurers, any decreases in these premiums or commission rates, or actions by Carriers seeking repayment of commissions, could result in revenue decreases or expenses to us.
We derive revenue from commissions on the sale of insurance products that are paid by the Carriers from whom our clients purchase insurance. Because payments for the sale of insurance products are processed internally by Carriers, we may not receive a payment that is otherwise expected in any particular period until after the end of that
19
period, which can adversely affect our ability to budget for significant future expenditures. Additionally, Carriers or their affiliates may under certain circumstances seek the chargeback or repayment of commissions as a result of policy lapse, surrender, cancellation, rescission, default, or upon other specified circumstances. As a result of the chargeback or repayment of commissions, we may incur an expense in a particular period related to revenue previously recognized in a prior period and reflected in our financial statements. Such an expense could have a material adverse effect on our results of operations and financial condition, particularly if the expense is greater than the amount of related revenue retained by us.
The commission rates are set by Carriers and are based on the premiums that the Carriers charge. The potential for changes in premium rates is significant, due to pricing cyclicality in the insurance market. In addition, the insurance industry has been characterized by periods of intense price competition due to excessive underwriting capacity and periods of favorable premium levels due to shortages of capacity. Capacity could also be reduced by Carriers failing or withdrawing from writing certain coverages that we offer our customers. Commission rates and premiums can change based on prevailing legislative, economic and competitive factors that affect Carriers. These factors, which are not within our control, include the capacity of Carriers to place new business, underwriting and non-underwriting profits of Carriers, consumer demand for insurance products, the availability of comparable products from other Carriers at a lower cost and the availability of alternative insurance products, such as government benefits and self-insurance products, to consumers. We cannot predict the timing or extent of future changes in commission rates or premiums or the effect any of these changes will have on our business, financial condition and results of operations.
Contingent Commissions we receive from Carriers are less predictable than standard commissions, and any decrease in the amount of these kinds of commissions we receive could adversely affect our results of operations.
A portion of our revenues consists of Contingent Commissions we receive from Carriers. Contingent Commissions are paid by Carriers based upon the profitability, volume and/or growth of the business placed with such companies during the prior year. If, due to the current economic environment or for any other reason, we are unable to meet Carriers’ profitability, volume or growth thresholds, or Carriers increase their estimate of loss reserves (over which we have no control), actual Contingent Commissions we receive could be less than anticipated, which could adversely affect our business, financial condition and results of operations.
Our business is subject to risks related to legal proceedings and governmental inquiries.
We are subject to litigation, regulatory investigations and claims arising in the normal course of our business operations. The risks associated with these matters often may be difficult to assess or quantify and the existence and magnitude of potential claims often remain unknown for substantial periods of time. While we have insurance coverage for some of these potential claims, others may not be covered by insurance, insurers may dispute coverage, or any ultimate liabilities may exceed our coverage.
We may be subject to actions and claims relating to the sale of insurance, including the suitability of such products and services. Actions and claims may result in the rescission of such sales; consequently, Carriers may seek to recoup commissions paid to us, which may lead to legal action against us. The outcome of such actions cannot be predicted, and such claims or actions could have a material adverse effect on our business, financial condition and results of operations.
We are subject to laws and regulations, as well as regulatory investigations. The insurance industry has been subject to a significant level of scrutiny by various regulatory bodies, including state attorneys general and insurance departments, concerning certain practices within the insurance industry. These practices include, without limitation, the receipt of Contingent Commissions by insurance brokers and agents from Carriers and the extent to which such compensation has been disclosed, the collection of Agency Fees, bid rigging and related matters. From time to time, our subsidiaries received informational requests from governmental authorities. We have cooperated and will continue to cooperate fully with all governmental agencies.
There have been a number of revisions to existing, or proposals to modify or enact new, laws and regulations regarding insurance agents and brokers. These actions have imposed or could impose additional obligations on us with respect to our products sold. Some Carriers have agreed with regulatory authorities to end the payment of Contingent Commissions on insurance products, which could impact our commissions that are based on the volume, consistency and profitability of business generated by us.
We cannot predict the impact that any new laws, rules or regulations may have on our business and financial results. Given the current regulatory environment and the number of our subsidiaries operating in local markets throughout the country, it is possible that we will become subject to further governmental inquiries and subpoenas
20
and have lawsuits filed against us. Regulators may raise issues during investigations, examinations or audits that could, if determined adversely, have a material impact on us. The interpretations of regulations by regulators may change and statutes may be enacted with retroactive impact. We could also be materially adversely affected by any new industry-wide regulations or practices that may result from these proceedings.
Our involvement in any investigations and lawsuits would cause us to incur additional legal and other costs and, if we were found to have violated any laws, we could be required to pay fines, damages and other costs, perhaps in material amounts. Regardless of final costs, these matters could have a material adverse effect on us by exposing us to negative publicity, reputational damage, harm to client relationships, or diversion of personnel and management resources.
Conditions impacting Carriers or other parties that we do business with may impact us.
We have a significant amount of accounts receivable from Carriers with which we place insurance. If those Carriers were to experience liquidity problems or other financial difficulties, we could encounter delays or defaults in payments owed to us, which could have a significant adverse impact on our financial condition and results of operations. The potential for an insurer to cease writing insurance we offer our clients could negatively impact overall capacity in the industry, which in turn could have the effect of reduced placement of certain lines and types of insurance and reduced revenue and profitability for us. Questions about a Carrier’s perceived stability or financial strength may contribute to such insurers’ strategic decisions to focus on certain lines of insurance to the detriment of others.
Regulations affecting Carriers with which we place business affect how we conduct our operations.
Insurers are also regulated by state insurance departments for solvency issues and are subject to reserve requirements. We cannot guarantee that all Carriers with which we do business comply with regulations instituted by state insurance departments. We may need to expend resources to address questions or concerns regarding our relationships with these insurers, diverting management resources away from operating our business.
Competition in our industry is intense and, if we are unable to compete effectively, we may lose clients and our financial results may be negatively affected.
The business of providing insurance products and services is highly competitive and we expect competition to intensify. We compete for clients on the basis of reputation, client service, program and product offerings and our ability to tailor products and services to meet the specific needs of a client.
We actively compete with numerous integrated financial services organizations as well as Carriers and brokers, producer groups, individual insurance agents, investment management firms, independent financial planners and broker-dealers. Competition may reduce the fees that we can obtain for services provided, which would have an adverse effect on revenue and margins. Many of our competitors have greater financial and marketing resources than we do and may be able to offer products and services that we do not currently offer and may not offer in the future. To the extent that banks, securities firms and Carrier affiliates, the financial services industry may experience further consolidation, and we therefore may experience increased competition from Carriers and the financial services industry, as a growing number of larger financial institutions increasingly, and aggressively, offer a wider variety of financial services, including insurance intermediary services. In addition, a number of Carriers are engaged in the direct sale of insurance, primarily to individuals, and do not pay commissions to brokers.
In addition, new competitors, alliances among competitors or mergers of competitors could emerge and gain significant market share, and some of our competitors may have or may develop a lower cost structure, adopt more aggressive pricing policies or provide services that gain greater market acceptance than the services that we offer or develop. Competitors may be able to respond to the need for technological changes and innovate faster, or price their services more aggressively. They may also compete for skilled professionals, finance acquisitions, fund internal growth and compete for market share more effectively than we do. To respond to increased competition and pricing pressure, we may have to lower the cost of our services or decrease the level of service provided to clients, which could have an adverse effect on our business, financial condition and results of operations.
Some of our competitors may be able to sustain the costs of litigation more effectively than we can because they have substantially greater resources. In the event any of such competitors initiate litigation against us, such litigation, even if without merit, could be time-consuming and costly to defend and may divert management’s attention and resources away from our business and adversely affect our business, financial condition and results of operations.
Similarly, any increase in competition due to new legislative or industry developments could adversely affect us. These developments include:
21
|
•
|
Increased capital-raising by Carriers, which could result in new capital in the industry, which in turn may lead to lower insurance premiums and commissions;
|
|
•
|
Carriers selling insurance directly to insureds without the involvement of a broker or other intermediary;
|
|
•
|
Changes in our business compensation model as a result of regulatory developments;
|
|
•
|
Federal and state governments establishing programs to provide property insurance in catastrophe-prone areas or other alternative market types of coverage, that compete with, or completely replace, insurance products offered by Carriers; and
|
|
•
|
Increased competition from new market participants such as banks, accounting firms, consulting firms and Internet or other technology firms offering risk management or insurance brokerage services, or new distribution channels for insurance such as payroll firms.
|
New competition as a result of these or other competitive or industry developments could cause the demand for our products and services to decrease, which could in turn adversely affect our business, financial condition and results of operations.
Our business, financial condition and results of operations may be negatively affected by E&O claims.
We have significant insurance agency and brokerage operations and are subject to claims and litigation in the ordinary course of business resulting from alleged and actual errors and omissions in placing insurance and rendering coverage advice. These activities involve substantial amounts of money. Since E&O claims against us may allege our liability for all or part of the amounts in question, claimants may seek large damage awards. These claims can involve significant defense costs. Errors and omissions could include failure, whether negligently or intentionally, to place coverage on behalf of clients, to provide Carriers with complete and accurate information relating to the risks being insured, or to appropriately apply funds that we hold on a fiduciary basis. It is not always possible to prevent or detect errors and omissions, and the precautions we take may not be effective in all cases.
We have errors and omissions insurance coverage to protect against the risk of liability resulting from our alleged and actual errors and omissions. Prices for this insurance and the scope and limits of the coverage terms available are dependent on our claims history as well as market conditions that are outside of our control. While we endeavor to purchase coverage that is appropriate to our assessment of our risk, we are unable to predict with certainty the frequency, nature or magnitude of claims for direct or consequential damages or whether our errors and omissions insurance will cover such claims.
In establishing liabilities for E&O claims, we utilize case level reviews by inside and outside counsel and an internal analysis to estimate potential losses. The liability is reviewed annually and adjusted as developments warrant. Given the unpredictability of E&O claims and of litigation that could flow from them, it is possible that an adverse outcome in a particular matter could have a material adverse effect on our results of operations, financial condition or cash flow in a given quarterly or annual period.
Our business is dependent upon information processing systems. Security or data breaches may hurt our business.
Our ability to provide insurance services to clients and to create and maintain comprehensive tracking and reporting of client accounts depends on our capacity to store, retrieve and process data, manage significant databases and expand and periodically upgrade our information processing capabilities. As our operations evolve, we will need to continue to make investments in new and enhanced information systems. As our information system providers revise and upgrade their hardware, software and equipment technology, we may encounter difficulties in integrating these new technologies into our business. Interruption or loss of our information processing capabilities or adverse consequences from implementing new or enhanced systems could have a material adverse effect on our business, financial condition and results of operations.
In the course of providing financial services, we may electronically store or transmit personally identifiable information, such as social security numbers or credit card or bank information, of clients or employees of clients. Breaches in data security or infiltration by unauthorized persons of our network security could cause interruptions in operations and damage to our reputation. While we maintain policies, procedures and technological safeguards designed to protect the security and privacy of this information, we cannot entirely eliminate the risk of improper access to or disclosure of personally identifiable information nor the related costs we incur to mitigate the consequences from such events. Privacy laws and regulations are matters of growing public concern and are continuously changing in the states in which we operate. The failure to adhere to or successfully implement procedures to respond to these regulations could result in legal liability or impairment to our reputation.
22
Further, despite security measures taken, our systems may be vulnerable to physical break-ins, unauthorized access, viruses or other disruptive problems. If our systems or facilities were infiltrated or damaged, our clients could experience data loss, financial loss and significant business interruption leading to a material adverse effect on our business, financial condition and results of operations. We may be required to expend significant additional resources to modify protective measures, to investigate and remediate vulnerabilities or other exposures or to make required notifications.
We rely on the availability and performance of information technology services provided by third parties.
While we maintain some of our critical information technology systems, we are also dependent on third party service providers, including Salesforce.com, to provide important information technology services relating to, among other things, agency management services, sales and service support, electronic communications and certain finance functions. If the service providers to which we outsource these functions do not perform effectively, we may not be able to achieve the expected cost savings and may have to incur additional costs to correct errors made by such service providers. Depending on the function involved, such errors may also lead to business disruption, processing inefficiencies, the loss of or damage to intellectual property through security breach, the loss of sensitive data through security breach, or otherwise. While we or any third-party service provider have not experienced any significant disruption, failure or breach impacting our information technology systems, any such disruption, failure or breach could adversely affect our business, financial condition and results of operations.
Our inability to successfully recover should we experience a disaster or other business continuity problem could cause material financial loss, loss of human capital, regulatory actions, reputational harm or legal liability.
Should we experience a local or regional disaster or other business continuity problem, such as an earthquake, hurricane, terrorist attack, pandemic, security breach, power loss, telecommunications failure or other natural or man-made disaster, our continued success will depend, in part, on the availability of personnel, office facilities, and the proper functioning of computer, telecommunication and other related systems and operations. We could potentially lose client data or experience material adverse interruptions to our operations or delivery of services to clients in a disaster recovery scenario.
If we are unable to apply technology effectively in driving value for our clients through technology-based solutions or gain internal efficiencies and effective internal controls through the application of technology and related tools, our operating results, client relationships, growth and compliance programs could be adversely affected.
Our future success depends, in part, on our ability to anticipate and respond effectively to the threat of digital disruption and other technology change. We must also develop and implement technology solutions and technical expertise among our employees that anticipate and keep pace with rapid and continuing changes in technology, industry standards, client preferences and internal control standards. We may not be successful in anticipating or responding to these developments on a timely and cost-effective basis, and our ideas may not be accepted in the marketplace. Additionally, the effort to gain technological expertise and develop new technologies in our business requires us to incur significant expenses. If we cannot offer new technologies as quickly as our competitors, or if our competitors develop more cost-effective technologies or product offerings, we could experience a material adverse effect on our operating results, client relationships, growth and compliance programs.
In some cases, we depend on key vendors and partners to provide technology and other support for our strategic initiatives, such as the Salesforce.com platform. If these third parties fail to perform their obligations or cease to work with us, our ability to execute on our strategic initiatives could be adversely affected.
Damage to our reputation could have a material adverse effect on our business.
Our reputation is one of our key assets. We advise our clients on and provide services related to a wide range of subjects and our ability to attract and retain clients is highly dependent upon the external perceptions of our level of service, trustworthiness, business practices, financial condition and other subjective qualities. Negative perceptions or publicity regarding these or other matters, including our association with clients or business partners who themselves have a damaged reputation, or from actual or alleged conduct by us or our employees, could damage our reputation. Any resulting erosion of trust and confidence among existing and potential clients, regulators and other parties important to the success of our business could make it difficult for us to attract new clients and maintain existing ones, which could have a material adverse effect on our business, financial condition and results of operations.
Our inability to retain or hire qualified employees, as well as the loss of any of our executive officers, could negatively impact our ability to retain existing business and generate new business.
23
Our success depends on our ability to attract and retain skilled and experienced personnel. There is significant competition from within the insurance industry and from businesses outside the industry for exceptional employees, especially in key positions. If we are not able to successfully attract, retain and motivate our employees, our business, financial condition, results of operations and reputation could be materially and adversely affected.
If any of our key professionals were to join an existing competitor or form a competing company, some of our customers could choose to use the services of that competitor instead of our services. Our key personnel are prohibited by contract from soliciting our employees and customers and from competing in our industry in the vicinity of the Company office at which such key personnel member was employed for a period of two years following separation from employment with us. However, there can be no assurance that we will be successful in enforcing these contracts.
In addition, we could be adversely affected if we fail to adequately plan for the succession of our senior leaders, including our founders and key executives. In particular, our future success is substantially dependent on the continued service our co-founder, chairman and CEO, Mark Jones. Although we operate with a decentralized management system, the loss of our senior managers or other key personnel, or our inability to continue to identify, recruit and retain such personnel, could materially and adversely affect our business, financial condition and results of operation.
The occurrence of natural or man-made disasters could result in declines in business and increases in claims that could adversely affect our financial condition, results of operations and cash flows.
We are exposed to various risks arising out of natural disasters, including earthquakes, hurricanes, fires, floods, landslides, tornadoes, typhoons, tsunamis, hailstorms, explosions, climate events or weather patterns and pandemic health events, as well as man-made disasters, including acts of terrorism, military actions, cyber-terrorism, explosions and biological, chemical or radiological events. The continued threat of terrorism and ongoing military actions may cause significant volatility in global financial markets, and a natural or man-made disaster could trigger an economic downturn in the areas directly or indirectly affected by the disaster. These consequences could, among other things, result in a decline in business and increased claims from those areas. They could also result in reduced underwriting capacity of our Carriers, making it more difficult for our agents to place business. Disasters also could disrupt public and private infrastructure, including communications and financial services, which could disrupt our normal business operations. Any increases in loss ratios due to natural or man-made disasters could impact our Contingent Commissions, which are primarily driven by both growth and profitability metrics.
A natural or man-made disaster also could disrupt the operations of our counterparties or result in increased prices for the products and services they provide to us. Finally, a natural or man-made disaster could increase the incidence or severity of E&O claims against us.
Non-compliance with or changes in laws, regulations or licensing requirements applicable to us could restrict our ability to conduct our business.
The industry in which we operate is subject to extensive regulation. We are subject to regulation and supervision both federally and in each applicable local jurisdiction. In general, these regulations are designed to protect clients, policyholders and insureds and to protect the integrity of the financial markets, rather than to protect stockholders or creditors. Our ability to conduct business in these jurisdictions depends on our compliance with the rules and regulations promulgated by federal regulatory bodies and other regulatory authorities. Failure to comply with regulatory requirements, or changes in regulatory requirements or interpretations, could result in actions by regulators, potentially leading to fines and penalties, adverse publicity and damage to our reputation in the marketplace. There can be no assurance that we will be able to adapt effectively to any changes in law. In extreme cases, revocation of a subsidiary’s authority to do business in one or more jurisdictions could result from failure to comply with regulatory requirements. In addition, we could face lawsuits by clients, insureds and other parties for alleged violations of certain of these laws and regulations. It is difficult to predict whether changes resulting from new laws and regulations will affect the industry or our business and, if so, to what degree.
Employees and principals who engage in the solicitation, negotiation or sale of insurance, or provide certain other insurance services, generally are required to be licensed individually. Insurance and laws and regulations govern whether licensees may share commissions with unlicensed entities and individuals. We believe that any payments we make to third parties are in compliance with applicable laws. However, should any regulatory agency take a contrary position and prevail, we will be required to change the manner in which we pay fees to such employees or principals or require entities receiving such payments to become registered or licensed.
State insurance laws grant supervisory agencies, including state insurance departments, broad administrative authority. State insurance regulators and the National Association of Insurance Commissioners continually review existing laws and regulations, some of which affect our business. These supervisory agencies regulate many
24
aspects of the insurance business, including, the licensing of insurance brokers and agents and other insurance intermediaries, the handling of third-party funds held in a fiduciary capacity, and trade practices, such as marketing, advertising and compensation arrangements entered into by insurance brokers and agents.
Federal, state and other regulatory authorities have focused on, and continue to devote substantial attention to, the insurance industry as well as to the sale of products or services to seniors. Regulatory review or the issuance of interpretations of existing laws and regulations may result in the enactment of new laws and regulations that could adversely affect our operations or our ability to conduct business profitably. We are unable to predict whether any such laws or regulations will be enacted and to what extent such laws and regulations would affect our business.
In connection with the implementation of our corporate strategies, we face risks associated with the acquisition or disposition of businesses, the entry into new lines of business, the integration of acquired businesses and the growth and development of these businesses.
In pursuing our corporate strategy, we may acquire other businesses or dispose of or exit businesses we currently own. The success of this strategy is dependent upon our ability to identify appropriate acquisition and disposition targets, negotiate transactions on favorable terms, complete transactions and, in the case of acquisitions, successfully integrate them into our existing businesses. If a proposed transaction is not consummated, the time and resources spent in researching it could adversely result in missed opportunities to locate and acquire other businesses. If acquisitions are made, there can be no assurance that we will realize the anticipated benefits of such acquisitions, including, but not limited to, revenue growth, operational efficiencies or expected synergies. If we dispose of or otherwise exit certain businesses, there can be no assurance that we will not incur certain disposition related charges, or that we will be able to reduce overhead related to the divested assets.
From time to time, either through acquisitions or internal development, we may enter new lines of business or offer new products and services within existing lines of business. These new lines of business or new products and services may present additional risks, particularly in instances where the markets are not fully developed. Such risks include the investment of significant time and resources; the possibility that these efforts will be not be successful; the possibility that marketplace does not accept our products or services, or that we are unable to retain clients that adopt our new products or services; and the risk of additional liabilities associated with these efforts. In addition, many of the businesses that we acquire and develop will likely have significantly smaller scales of operations prior to the implementation of our growth strategy. If we are not able to manage the growing complexity of these businesses, including improving, refining or revising our systems and operational practices, and enlarging the scale and scope of the businesses, our business may be adversely affected. Other risks include developing knowledge of and experience in the new business, integrating the acquired business into our systems and culture, recruiting professionals and developing and capitalizing on new relationships with experienced market participants. External factors, such as compliance with new or revised regulations, competitive alternatives and shifting market preferences may also impact the successful implementation of a new line of business. Failure to manage these risks in the acquisition or development of new businesses could materially and adversely affect our business, financial condition and results of operations.
We have debt outstanding that could adversely affect our financial flexibility and subjects us to restrictions and limitations that could significantly impact our ability to operate our business.
As of
December 31, 2018
, we had total consolidated debt outstanding of approximately
$48.4 million
, collateralized by substantially all of the Company’s assets, including rights to future commissions. In the year ending
December 31, 2018
, we had debt servicing costs of
$53.8 million
, inclusive of
$49.4 million
in principal payments related to payoff of the original Credit Agreement (see "Item 7. Management’s discussion and analysis of financial condition and results of operations") and
$3.2 million
of which was attributable to interest. In the year ending
December 31, 2017
, we had debt servicing costs of
$2.7 million
, of which
$2.3 million
was attributable to interest. The level of debt we have outstanding during any period could adversely affect our financial flexibility. We also bear risk at the time debt matures. Our ability to make interest and principal payments, to refinance our debt obligations and to fund our planned capital expenditures will depend on our ability to generate cash from operations. Our ability to generate cash from operations is, to a certain extent, subject to general economic, financial, competitive, legislative, regulatory and other factors that are beyond our control, such as an environment of rising interest rates. The need to service our indebtedness will also reduce our ability to use cash for other purposes, including working capital, dividends to stockholders, acquisitions, capital expenditures, share repurchases, and general corporate purposes. If we cannot service our indebtedness, we may have to take actions such as selling assets, seeking additional equity or reducing or delaying capital expenditures, strategic acquisitions, and investments, any of which could impede the implementation of our business strategy or prevent us from entering into transactions that would otherwise benefit our business. Additionally, we may not be able to effect such actions, if necessary, on favorable terms, or at all. We may not be able to refinance any of our indebtedness on favorable terms, or at all.
25
The Credit Agreement (as defined below) governing our debt contains covenants that, among other things, restrict our ability to make certain restricted payments, incur additional debt, engage in certain asset sales, mergers, acquisitions or similar transactions, create liens on assets, engage in certain transactions with affiliates, change our business or make investments and require us to comply with certain financial covenants. The restrictions in the Credit Agreement governing our debt may prevent us from taking actions that we believe would be in the best interest of our business and our stockholders and may make it difficult for us to execute our business strategy successfully or effectively compete with companies that are not similarly restricted. We may also incur future debt obligations that might subject us to additional or more restrictive covenants that could affect our financial and operational flexibility, including our ability to pay dividends. We cannot make any assurances that we will be able to refinance our debt or obtain additional financing on terms acceptable to us, or at all. A failure to comply with the restrictions under the Credit Agreement could result in a default under the financing obligations or could require us to obtain waivers from our lenders for failure to comply with these restrictions. The occurrence of a default that remains uncured or the inability to secure a necessary consent or waiver could cause our obligations with respect to our debt to be accelerated and have a material adverse effect on our business, financial condition and results of operations.
Changes to reference rates could materially adversely affect our earnings
As a result of recent regulatory and other legal proceedings, actions by regulators or law enforcement agencies may result in changes to the manner in which the London interbank offered rate (LIBOR) is determined, its discontinuance or the establishment of alternative reference rates. At this time, it is not possible to predict the effect that these developments, any discontinuance, modification or other reforms to LIBOR or any other reference rate, the establishment of alternative reference rates, or the impact of any such events on contractual mechanisms may have on the markets, us or our floating rate debt. Uncertainty as to the nature of such potential discontinuance, modification, alternative reference rates or other reforms may negatively impact our access to funding. Furthermore, the use of alternative reference rates or other reforms could cause the interest payable on our outstanding floating rate debt to be materially different, and potentially higher, than expected.
Because our business is highly concentrated in Texas, California, Florida and Illinois, adverse economic conditions, natural disasters, or regulatory changes in these states could adversely affect our financial condition.
A significant portion of our business is concentrated in Texas, California, Florida and Illinois. The insurance business is primarily a state-regulated industry, and therefore, state legislatures may enact laws that adversely affect the insurance industry. Because our business is concentrated in the states identified above, we face greater exposure to unfavorable changes in regulatory conditions in those states than insurance intermediaries whose operations are more diversified through a greater number of states. In addition, the occurrence of adverse economic conditions, natural or other disasters, or other circumstances specific to or otherwise significantly impacting these states could adversely affect our financial condition, results of operations and cash flows. We are susceptible to losses and interruptions caused by hurricanes (particularly in Texas, where our headquarters and several offices are located), earthquakes, power shortages, telecommunications failures, water shortages, floods, fire, extreme weather conditions, geopolitical events such as terrorist acts and other natural or man-made disasters. Our insurance coverage with respect to natural disasters is limited and is subject to deductibles and coverage limits. Such coverage may not be adequate or may not continue to be available at commercially reasonable rates and terms.
Changes in tax laws as a result of the enactment of recent tax legislation could impact our operations and profitability.
Legislation commonly known as the Tax Cuts and Jobs Act (the “Tax Reform Act”) was signed into law on December 22, 2017. The Tax Reform Act will make significant changes to the U.S. federal income tax rules for taxation of individuals and corporations, generally effective for taxable years beginning after December 31, 2017. In the case of individuals, the tax brackets will be adjusted, the top federal income rate will be reduced to
37%
, special rules will reduce taxation of certain income earned through pass-through entities and various deductions will be eliminated or limited, including limiting the deduction for state and local taxes to
$10,000
per year, decreasing the mortgage interest deduction on new homes to
$750,000
and eliminating the home equity line of credit interest deduction for loans that are not considered home acquisition debt.
Changes in these deductions may affect taxpayers in states with high residential home prices and high state and local taxes, such as California and New York, and may also negatively impact the housing market. Our homeowner and dwelling property lines of business comprised
53%
of our premiums in
2018
and a majority of our new accounts are sourced by referral sources tied to home closing transactions. As we expand our franchise pipeline into new
26
geographies that are located in high tax jurisdictions, we cannot guarantee our ability to grow our client base at the same pace as our existing geographies and generate new business if there is lower demand in the housing market as a consequence of the Tax Reform Act.
We derive a significant portion of our commission revenues from a limited number of Carriers, the loss of which would result in additional expense and loss of market share.
During
2018
we had
two
Carriers who that represented 10% or more of our total revenue, these Carriers represented
17%
and
11%
of our total revenue. During
2017
we had
three
Carriers that represented 10% or more of our total revenue, these Carriers represented
18%
,
15%
and
11%
of our total revenue. Should any of these Carriers seek to terminate its arrangements with us, we could be forced to move our business to another Carrier and some additional expense and loss of market share could possibly result.
Our business may be harmed if we lose our relationships with Carriers, fail to maintain good relationships with Carriers, become dependent upon a limited number of Carriers or fail to develop new Carrier relationships.
Our business typically enters into contractual agency relationships with Carriers that are sometimes unique to Goosehead, but non-exclusive and terminable on short notice by either party for any reason. In many cases, Carriers also have the ability to amend the terms of our agreements unilaterally on short notice. Carriers may be unwilling to allow us to sell their existing or new insurance products or may amend our agreements with them, for a variety of reasons, including for competitive or regulatory reasons or because of a reluctance to distribute their products through our platform. Carriers may decide to rely on their own internal distribution channels, choose to exclude us from their most profitable or popular products, or decide not to distribute insurance products in individual markets in certain geographies or altogether. The termination or amendment of our relationship with a Carrier could reduce the variety of insurance products we offer. We also could lose a source of, or be paid reduced commissions for, future sales and could lose Renewal Revenue for past sales. Our business could also be harmed if we fail to develop new Carrier relationships.
In the future, it may become necessary for us to offer insurance products from a reduced number of Carriers or to derive a greater portion of our revenues from a more concentrated number of Carriers as our business and the insurance industry evolve. Should our dependence on a smaller number of Carriers increase, whether as a result of the termination of Carrier relationships, Carrier consolidation or otherwise, we may become more vulnerable to adverse changes in our relationships with our Carriers, particularly in states where we offer insurance products from a relatively small number of Carriers or where a small number of Carriers dominate the market. The termination, amendment or consolidation of our relationship with our Carriers could harm our business, financial condition and results of operations.
The failure by Mark Jones and Robyn Jones to maintain either a minimum voting interest in us or the ability to elect or designate for election at least a majority of our board of directors could trigger a change of control default under our Credit Agreement.
Pursuant to the Credit Agreement, a change of control default will be triggered when any person or group other than Mark Jones and Robyn Jones becomes the beneficial owner of more than 50% of the voting power represented by our outstanding equity interests, unless Mark and Robyn Jones have the ability to elect or designate for election at least a majority of our board of directors. Such a default could result in the acceleration of repayment of our and our subsidiaries’ indebtedness, including borrowings under the Revolving Credit Facility (as defined below) if not waived by the lenders under the Credit Agreement. Mark Jones and Robyn Jones may choose to dispose of part or all of their stakes in us and/or may cease to exercise the current level of control they have over the appointment and removal of members of our board of directors. Any such changes may trigger a change of control event that could result in us being forced to repay the outstanding sums owed under our Credit Agreement. If any such event occurs, this may negatively affect our financial condition and operating results. In addition, we may not have sufficient funds to finance repayment of any of such indebtedness upon any such change of control.
Risks relating to our franchise business
The failure to attract and retain highly qualified Franchisees could compromise our ability to expand the Goosehead network.
Our most important asset is the people in our network, and the success of Goosehead depends largely on our ability to attract and retain high quality franchise agents. If we fail to attract and retain franchise agents, our Franchisees may fail to generate the revenue necessary to pay the contractual fees owed to us.
27
The nature of franchise relationships can give rise to conflict. For example, Franchisees or agents may become dissatisfied with the amount of contractual fees owed under franchise or other applicable arrangements, particularly in the event that we decide to increase fees further. They may disagree with certain network-wide policies and procedures, including policies such as those dictating brand standards or affecting their marketing efforts. They may also be disappointed with any marketing campaigns designed to develop our brand. There are a variety of reasons why our franchisor-franchisee relationship can give rise to conflict. If we experience any conflicts with our Franchisees on a large scale, our Franchisees may decide not to renew their Franchise Agreements upon expiration or may file lawsuits against us or they may seek to disaffiliate with us, which could also result in litigation. These events may, in turn, materially and adversely affect our business, financial condition and results of operations.
Our financial results are affected directly by the operating results of Franchisees and agents, over whom we do not have direct control.
Our franchises generate revenue in the form of Agency Fees and commissions. Accordingly, our financial results depend upon the operational and financial success of our Franchisees and their agents. If industry trends or economic conditions are not sustained or do not continue to improve, our Franchisees’ financial results may worsen, and our revenue may decline. We may also have to terminate Franchisees due to non-reporting and non-payment. Further, if Franchisees fail to renew their Franchise Agreements, or if we decide to restructure Franchise Agreements in order to induce Franchisees to renew these agreements, then our revenues may decrease, and profitability from new Franchisees may be lower than in the past due to reduced ongoing fees and other non-standard incentives we may need to provide.
We rely in part on our Franchisees and the manner in which they operate their locations to develop and promote our business. Although we have developed criteria to evaluate and screen prospective Franchisees, we cannot be certain that our Franchisees will have the business acumen or financial resources necessary to operate successful franchises in their franchise areas and state franchise laws may limit our ability to terminate or modify these Franchise Agreements. Moreover, despite our training, support and monitoring, Franchisees may not successfully operate in a manner consistent with our standards and requirements or may not hire and train qualified personnel. The failure of our Franchisees to operate their franchises successfully could have a material adverse effect on us, our reputation, our brand and our ability to attract prospective Franchisees and could materially adversely affect our business, financial condition or results of operations.
Our Franchisees and agents could take actions that could harm our business.
Our Franchisees are independent businesses and the agents who work within these brokerages are independent contractors and, as such, are not our employees, and we do not exercise control over their day-to-day operations. Our Franchisees may not operate their insurance brokerage businesses in a manner consistent with industry standards or may not attract and retain qualified independent contractor agents. If Franchisees were to provide diminished quality of service to customers, engage in fraud, defalcation, misconduct or negligence or otherwise violate the law or realtor codes of ethics, our image and reputation may suffer materially, and we may become subject to liability claims based upon such actions of our Franchisees and agents. Any such incidence could adversely affect our results of operations.
Brand value can be severely damaged even by isolated incidents, particularly if the incidents receive considerable negative publicity or result in litigation. Some of these incidents may relate to the way we manage our relationship with our Franchisees, our growth strategies or the ordinary course of our business or our Franchisees’ business. Other incidents may arise from events that are or may be beyond our control and may damage our brand, such as actions taken (or not taken) by one or more Franchisees or their agents relating to health, safety, welfare or other matters; litigation and claims; failure to maintain high ethical and social standards for all of our operations and activities; failure to comply with local laws and regulations; and illegal activity targeted at us or others. Our brand value could diminish significantly if any such incidents or other matters erode consumer confidence in us, which may result in a decrease in our total agent count and, ultimately, lower continuing franchise fees, which in turn would materially and adversely affect our business, financial condition and results of operations.
We are subject to a variety of additional risks associated with our Franchisees.
Our franchise system subjects us to a number of risks, any one of which may harm the reputation associated with our brand, and/or may materially and adversely impact our business and results of operations.
Franchisee insurance.
The Franchise Agreements require each Franchisee to maintain certain insurance types and levels. Certain extraordinary hazards, however, may not be covered, and insurance may not be available (or may be available only at prohibitively expensive rates) with respect to many other risks. Moreover, any loss incurred
28
could exceed policy limits or the Franchisee could lack the required insurance at the time the claim arises, in breach of the insurance requirement, and policy payments made to Franchisees may not be made on a timely basis. Any such loss or delay in payment could have a material and adverse effect on a Franchisee’s ability to satisfy its obligations under its Franchise Agreement, including its ability to make payments for contractual fees or to indemnify us.
Franchise nonrenewal.
Each Franchise Agreement has an expiration date. Upon the expiration of the Franchise Agreement, we or the Franchisee may or may not elect to renew the Franchise Agreement. If the Franchise Agreement is renewed, such renewal is generally contingent on the Franchisee’s execution of the then-current form of Franchise Agreement (which may include terms the Franchisee deems to be more onerous than the prior Franchise Agreement), the satisfaction of certain conditions and the payment of a renewal fee. If a Franchisee is unable or unwilling to satisfy any of the foregoing conditions, the expiring Franchise Agreement will terminate upon expiration of the term of the Franchise Agreement. If Franchisees choose not to renew their Franchise Agreements, then this could have a material impact on our financial condition.
Failure to support our expanding franchise system could have a material adverse effect on our business, financial condition or results of operations.
Our growth strategy depends in part on expanding our franchise network, which will require the implementation of enhanced business support systems, management information systems, financial controls and other systems and procedures as well as additional management, franchise support and financial resources. We may not be able to manage our expanding franchise system effectively. Failure to provide our Franchisees with adequate support and resources could materially adversely affect both our new and existing Franchisees as well as cause disputes between us and our Franchisees and potentially lead to material liabilities. Any of the foregoing could materially adversely affect our business, financial condition and results of operations.
Our franchising activities are subject to a variety of state and federal laws and regulations regarding franchises, and any failure to comply with such existing or future laws and regulations could adversely affect our business.
The sale of franchises is regulated by various state laws as well as by the Federal Trade Commission (“FTC”). The FTC requires that franchisors make extensive disclosure to prospective Franchisees but does not require registration. A number of states require registration and/or disclosure in connection with franchise offers and sales. In addition, several states have “franchise relationship laws” or “business opportunity laws” that limit the ability of franchisors to terminate Franchise Agreements or to withhold consent to the renewal or transfer of these agreements. We believe that our franchising procedures, as well as any applicable state-specific procedures, comply in all material respects with both the FTC guidelines and all applicable state laws regulating franchising in those states in which we offer new Franchise Agreements. However, noncompliance could reduce anticipated revenue, which in turn may materially and adversely affect our business, financial condition and results of operations.
We are subject to certain risks related to litigation filed by or against us, and adverse results may harm our business and financial condition.
We cannot predict with certainty the costs of defense, the costs of prosecution, insurance coverage or the ultimate outcome of litigation and other proceedings filed by or against us, including remedies or damage awards, and adverse results in such litigation and other proceedings may harm our business and financial condition.
Such litigation and other proceedings may include, but are not limited to, complaints from or litigation by Franchisees, usually related to alleged breaches of contract or wrongful termination under the Franchise Agreements, actions relating to intellectual property, commercial arrangements and franchising arrangements.
In addition, litigation against a Franchisee or its affiliated sales agents by third parties, whether in the ordinary course of business or otherwise, may also include claims against us for liability by virtue of the franchise relationship. As our market share increases, competitors may pursue litigation to require us to change our business practices or offerings and limit our ability to compete effectively. Even claims without merit can be time-consuming and costly to defend and may divert management’s attention and resources away from our business and adversely affect our business, financial condition and results of operations. Franchisees may fail to obtain insurance naming Goosehead Insurance, Inc. as an additional insured on such claims. In addition to increasing Franchisees’ costs and limiting the funds available to pay us contractual fees and reducing the execution of new Franchise Agreements, claims against us (including vicarious liability claims) divert our management resources and could cause adverse publicity, which may materially and adversely affect us and our brand, regardless of whether such allegations are valid or whether we are liable. A substantial unsatisfied judgment against us or one of our
29
subsidiaries could result in bankruptcy, which would materially and adversely affect our business, financial condition and results of operations.
We may not be able to manage growth successfully.
In order to successfully expand our business, we must effectively recruit, develop and motivate new Franchisees, and we must maintain the beneficial aspects of our corporate culture. We may not be able to hire new employees with the expertise necessary to manage our growth quickly enough to meet our needs. If we fail to effectively manage our hiring needs and successfully develop our Franchisees, our Franchisee and employee morale, productivity and retention could suffer, and our brand and results of operations could be harmed. Effectively managing our potential growth could require significant capital expenditures and place increasing demands on our management. We may not be successful in managing or expanding our operations or in maintaining adequate financial and operating systems and controls. If we do not successfully manage these processes, our brand and results of operations could be adversely affected.
Risks relating to intellectual property and cybersecurity
Our business depends on a strong brand, and any failure to maintain, protect and enhance our brand would hurt our ability to grow our business, particularly in new markets where we have limited brand recognition.
We have developed a strong brand that we believe has contributed significantly to the success of our business. Maintaining, protecting and enhancing the “Goosehead Insurance” brand is critical to growing our business, particularly in new markets where we have limited brand recognition. If we do not successfully build and maintain a strong brand, our business could be materially harmed. Maintaining and enhancing the quality of our brand may require us to make substantial investments in areas such as marketing, community relations, outreach and employee training. We actively engage in advertisements, targeted promotional mailings and email communications, and engage on a regular basis in public relations and sponsorship activities. These investments may be substantial and may fail to encompass the optimal range of traditional, online and social advertising media to achieve maximum exposure and benefit to the brand.
Infringement, misappropriation or dilution of our intellectual property could harm our business.
We believe our Goosehead Insurance trademark has significant value and that this and other intellectual property are valuable assets that are critical to our success. Unauthorized uses or other infringement of our trademarks or service marks could diminish the value of our brand and may adversely affect our business. Effective intellectual property protection may not be available in every market. Failure to adequately protect our intellectual property rights could damage our brand and impair our ability to compete effectively. Even where we have effectively secured statutory protection for our trademarks and other intellectual property, our competitors and other third parties may misappropriate our intellectual property, and in the course of litigation, such competitors and other third parties occasionally attempt to challenge the breadth of our ability to prevent others from using similar marks or designs. If such challenges were to be successful, less ability to prevent others from using similar marks or designs may ultimately result in a reduced distinctiveness of our brand in the minds of consumers. Defending or enforcing our trademark rights, branding practices and other intellectual property could result in the expenditure of significant resources and divert the attention of management, which in turn may materially and adversely affect our business and operating results, even if such defense or enforcement is ultimately successful. Even though competitors occasionally may attempt to challenge our ability to prevent infringers from using our marks, we are not aware of any challenges to our right to use, and to authorize our Franchisees to use, any of our brand names or trademarks.
Failure to protect or enforce our intellectual property rights, or allegations that we have infringed on the intellectual property rights of others, could harm our reputation, ability to compete effectively, financial condition and business.
To protect our intellectual property rights, we rely on a combination of trademark laws, copyright laws, trade secret protection, confidentiality agreements and other contractual arrangements with our affiliates, employees, clients, strategic partners and others. However, the protective steps that we take may be inadequate to deter misappropriation of our proprietary information or infringement of our intellectual property. In addition, we may be unable to detect the unauthorized use of our intellectual property rights. Failure to protect our intellectual property adequately could harm our reputation and affect our ability to compete effectively. In addition, even if we initiate litigation against third parties such as infringement suits, we may not prevail.
Meanwhile, third parties may assert intellectual property rights claims against us, which may be costly to defend, could require the payment of damages and could limit our ability to use or offer certain technologies, products or
30
other intellectual property. Any intellectual property claims, with or without merit, could be expensive, take significant time and divert management’s attention from other business concerns. Successful challenges against us could require us to modify or discontinue our use of technology or business processes where such use is found to infringe or violate the rights of others, or require us to purchase licenses from third parties, any of which could adversely affect our business, financial condition and results of operations.
Improper disclosure of confidential, personal or proprietary data, whether due to human error, misuse of information by employees or vendors, or as a result of cyberattacks, could result in regulatory scrutiny, legal liability or reputational harm, and could have an adverse effect on our business or operations.
We maintain confidential, personal and proprietary information relating to our company, our employees and our clients. This information includes personally identifiable information, protected health information and financial information. We are subject to laws and regulations relating to the collection, use, retention, security and transfer of this information. These laws apply to transfers of information among our affiliates, as well as to transactions we enter into with third party vendors.
Cybersecurity breaches, such as computer viruses, unauthorized parties gaining access to our information technology systems and similar incidents could disrupt the security of our internal systems and business applications, impair our ability to provide services to our clients and protect the privacy of their data, compromise confidential business information, result in intellectual property or other confidential or proprietary information being lost or stolen, including client, employee or company data, which could harm our competitive position or otherwise adversely affect our business. Cyber threats are constantly evolving, which makes it more difficult to detect cybersecurity incidents, assess their severity or impact in a timely manner, and successfully defend against them.
We maintain policies, procedures and technical safeguards designed to protect the security and privacy of confidential, personal and proprietary information. Nonetheless, we cannot eliminate the risk of human error or guarantee our safeguards against employee, vendor or third-party malfeasance. It is possible that the steps we follow, including our security controls over personal data and training of employees on data security, may not prevent improper access to, disclosure of, or misuse of confidential, personal or proprietary information. This could cause harm to our reputation, create legal exposure, or subject us to liability under laws that protect personal data, resulting in increased costs or loss of revenue.
Data privacy is subject to frequently changing laws, rules and regulations in the various jurisdictions in which we operate. For example, legislators in the U.S. are proposing new and more robust cybersecurity legislation in light of the recent broad-based cyberattacks at a number of companies. These and similar initiatives around the country could increase the cost of developing, implementing or securing our servers and require us to allocate more resources to improved technologies, adding to our IT and compliance costs. Our failure to adhere to, or successfully implement processes in response to, changing legal or regulatory requirements in this area could result in legal liability or damage to our reputation in the marketplace.
Risks relating to our organizational structure
We are a holding company and our principal asset is our
40%
ownership interest in Goosehead Financial, LLC, and we are accordingly dependent upon distributions from Goosehead Financial, LLC to pay dividends, if any, taxes, make payments under the tax receivable agreement and pay other expenses.
We are a holding company and our principal asset is our direct or indirect ownership of
40%
of the outstanding LLC Units. We have no independent means of generating revenue. As the sole managing member of Goosehead Financial, LLC, we intend to cause Goosehead Financial, LLC to make distributions to the Pre-IPO LLC Members and us, in amounts sufficient to cover all applicable taxes payable by us and the Pre-IPO LLC members and any payments we are obligated to make under the tax receivable agreement we intend to enter into as part of the reorganization transactions and to fund dividends to our stockholders in accordance with our dividend policy, to the extent our board of directors declares such dividends.
Deterioration in the financial conditions, earnings or cash flow of Goosehead Financial, LLC and its subsidiaries for any reason could limit or impair their ability to pay such distributions. Additionally, to the extent that we need funds and Goosehead Financial, LLC is restricted from making such distributions to us under applicable law or regulation, as a result of covenants in our Credit Agreement or otherwise, we may not be able to obtain such funds on terms acceptable to us or at all and as a result could suffer a material adverse effect on our liquidity and financial condition.
31
In certain circumstances, Goosehead Financial, LLC will be required to make distributions to us and the other holders of LLC Units, and the distributions that Goosehead Financial, LLC will be required to make may be substantial.
Under the amended and restated Goosehead Financial, LLC agreement, Goosehead Financial, LLC will generally be required from time to time to make pro rata distributions in cash to us and the other holders of LLC Units in amounts that are intended to be sufficient to cover the taxes on our and the other LLC Units holders’ respective allocable shares of the taxable income of Goosehead Financial, LLC. As a result of (i) potential differences in the amount of net taxable income allocable to us and the other LLC Unit holders, (ii) the lower tax rate applicable to corporations than individuals and (iii) the favorable tax benefits that we anticipate receiving from (a) acquisitions of interests in Goosehead Financial, LLC in connection with future taxable redemptions or exchanges of LLC Units for shares of our Class A common stock and (b) payments under the tax receivable agreement, we expect that these tax distributions will be in amounts that exceed our tax liabilities and obligations to make payments under the tax receivable agreement. Our board of directors will determine the appropriate uses for any excess cash so accumulated, which may include, among other uses, dividends, the payment of obligations under the tax receivable agreement and the payment of other expenses. We will have no obligation to distribute such cash (or other available cash other than any declared dividend) to our stockholders. No adjustments to the redemption or exchange ratio of LLC Units for shares of Class A common stock will be made as a result of either (i) any cash distribution by us or (ii) any cash that we retain and do not distribute to our stockholders. To the extent that we do not distribute such excess cash as dividends on our Class A common stock and instead, for example, hold such cash balances or lend them to Goosehead Financial, LLC, the Pre-IPO LLC Members would benefit from any value attributable to such cash balances as a result of their ownership of Class A common stock following a redemption or exchange of their LLC Units. See "Item 13. Certain relationships and related transactions, and director independence".
We are controlled by the Pre-IPO LLC Members whose interests in our business may be different than yours, and certain statutory provisions afforded to stockholders are not applicable to us.
The Pre-IPO LLC Members control approximately
70%
of the combined voting power of our common stock. Further, pursuant to a stockholders agreement we and the Pre-IPO LLC Members entered into (the “Stockholders Agreement”), the Pre-IPO LLC Members may approve or disapprove substantially all transactions and other matters requiring approval by our stockholders, such as a merger, consolidation, dissolution or sale of all or substantially all of our assets, the issuance or redemption of certain additional equity interests in an amount exceeding $50 million, any change in the size of the board of directors and amendments to our certificate of incorporation or bylaws. In addition, the Stockholders Agreement provides that approval by the Pre-IPO LLC Members is required for any changes to the strategic direction or scope of Goosehead Insurance, Inc. and Goosehead Financial, LLC’s business, any acquisition or disposition of any asset or business having consideration in excess of 15% of our total assets and the hiring and termination of our Chief Executive Officer, Chief Financial Officer, Chief Operating Officer, General Counsel or Controller (including terms of compensation). Furthermore, the Stockholders Agreement will provide that, until the Substantial Ownership Requirement is no longer met, the Pre-IPO LLC Members may designate a majority of the nominees for election to our board of directors, including the nominee for election to serve as Chairman of our board of directors.
This concentration of ownership and voting power may also delay, defer or even prevent an acquisition by a third party or other change of control of our company which could deprive you of an opportunity to receive a premium for your shares of Class A common stock and may make some transactions more difficult or impossible without the support of the Pre-IPO LLC Members, even if such events are in the best interests of minority stockholders. Furthermore, this concentration of voting power with the Pre-IPO LLC Members may have a negative impact on the price of our Class A common stock. In addition, because the Pre-IPO LLC Members, will have the ability to designate a majority of the nominees for election to our board of directors, including the nominee for election to serve as Chairman of our board of directors until the Substantial Ownership Requirement is no longer met, the Pre-IPO LLC Members will be able to control us as long as they hold at least 10% of the aggregate number of outstanding shares of our common stock. The Pre-IPO LLC Members may not be inclined to permit us to issue additional shares of Class A common stock, including for the facilitation of acquisitions, if it would dilute their holdings below the 10% threshold.
We cannot predict whether our dual class structure, combined with the concentrated control of the Pre-IPO LLC Members, will result in a lower or more volatile market price of our Class A common stock or in adverse publicity or other adverse consequences. For example, certain index providers have announced restrictions on including companies with multiple-class share structures in certain of their indexes. In July 2017, FTSE Russell announced that it plans to require new constituents of its indexes to have greater than 5% of the company’s voting rights in the
32
hands of public stockholders, and S&P Dow Jones announced that it will no longer admit companies with multiple-class share structures to certain of its indexes. Because of our dual class structure, we will likely be excluded from these indexes and, in the event we are included in one of such indexes, we may be subsequently removed. In addition, we cannot assure you that other stock indexes will not take similar actions. Given the sustained flow of investment funds into passive strategies that seek to track certain indexes, exclusion or removal from stock indexes would likely preclude investment by many of these funds and could make our Class A common stock less attractive to other investors. As a result, the market price of our Class A common stock could be adversely affected.
The Pre-IPO LLC Members’ interests may not be fully aligned with yours, which could lead to actions that are not in your best interests. Because the Pre-IPO LLC Members hold a majority of their economic interests in our business through Goosehead Financial, LLC rather than through the public company, they may have conflicting interests with holders of shares of our Class A common stock. For example, the Pre-IPO LLC Members may have a different tax position from us, which could influence their decisions regarding whether and when we should dispose of assets or incur new or refinance existing indebtedness, especially in light of the existence of the tax receivable agreement, and whether and when we should undergo certain changes of control within the meaning of the tax receivable agreement or terminate the tax receivable agreement. In addition, the structuring of future transactions may take into consideration these tax or other considerations even where no similar benefit would accrue to us. See "Item 13. Certain relationships and related transactions, and director independence". In addition, the Pre-IPO LLC Members’ significant ownership in us and resulting ability to effectively control us may discourage someone from making a significant equity investment in us, or could discourage transactions involving a change in control, including transactions in which you as a holder of shares of our Class A common stock might otherwise receive a premium for your shares over the then-current market price.
We have opted out of Section 203 of the General Corporation Law of the State of Delaware (the “DGCL”), which prohibits a publicly held Delaware corporation from engaging in a business combination transaction with an interested stockholder for a period of three years after the interested stockholder became such unless the transaction fits within an applicable exemption, such as board approval of the business combination or the transaction which resulted in such stockholder becoming an interested stockholder. Therefore, the Pre-IPO LLC Members are able to transfer control of us to a third party by transferring their shares of our common stock (subject to certain restrictions and limitations), which would not require the approval of our board of directors or our other stockholders.
Our certificate of incorporation and Stockholders Agreement will provide that, to the fullest extent permitted by law, the doctrine of “corporate opportunity” under Delaware law will only apply against our directors and officers and their respective affiliates for competing activities related to insurance brokerage activities. This doctrine will not apply to any business activity other than insurance brokerage activities. See "Item 13. Certain relationships and related transactions, and director independence". Furthermore, the Pre-IPO LLC Members have business relationships outside of our business.
We are a “controlled company” within the meaning of the Nasdaq rules and, as a result, qualify for, and will rely on, exemptions from certain corporate governance requirements that provide protection to the stockholders of companies that are subject to such corporate governance requirements.
Mark E. Jones, our chief executive officer and Chairman of the Board, and Robyn Jones, Vice Chairman of the Board, beneficially own more than 50% of the voting power for the election of members of our board of directors. As a result, we will be a “controlled company” within the meaning of the corporate governance standards of the Nasdaq rules. Under these rules, a listed company of which more than 50% of the voting power is held by an individual, group or another company is a “controlled company” and may elect not to comply with certain of Nasdaq’s corporate governance requirements.
As a controlled company, we rely on certain exemptions from the Nasdaq standards that may enable us not to comply with certain Nasdaq corporate governance requirements. Accordingly, we have opted not to implement a stand-alone nominating and corporate governance committee and our compensation committee will not be fully independent. As a consequence of our reliance on certain exemptions from the Nasdaq standards provided to “controlled companies,” you will not have the same protections afforded to stockholders of companies that are subject to all of the corporate governance requirements of the Nasdaq Global Market.
We will be required to pay the Pre-IPO LLC Members for certain tax benefits we may claim, and the amounts we may pay could be significant.
As described under “Organizational structure,” future taxable redemptions or exchanges by the Pre-IPO LLC Members of LLC Units for shares of our Class A common stock are expected to result in tax basis adjustments to the assets of Goosehead Financial, LLC that will be allocated to us and thus produce favorable tax attributes.
33
These tax attributes would not be available to us in the absence of those transactions. The anticipated tax basis adjustments are expected to reduce the amount of tax that we would otherwise be required to pay in the future.
We entered into a tax receivable agreement with the Pre-IPO LLC Members that will provide for the payment by us to the Pre-IPO LLC Members of 85% of the amount of cash savings, if any, in U.S. federal, state and local income tax or franchise tax that we actually realize as a result of (i) any increase in tax basis in Goosehead Insurance, Inc.’s assets resulting from (a) the purchase of LLC Units from any of the Pre-IPO LLC Members using the net proceeds from any future offering, (b) redemptions or exchanges by the Pre-IPO LLC Members of LLC Units for shares of our Class A common stock or (c) payments under the tax receivable agreement and (ii) tax benefits related to imputed interest deemed arising as a result of payments made under the tax receivable agreement. This is a payment of obligation of us and not Goosehead Financial, LLC.
The actual increase in tax basis, as well as the amount and timing of any payments under the tax receivable agreement, will vary depending on a number of factors, including, but not limited to, the timing of any future redemptions, exchanges or purchases of the LLC Units held by Pre-IPO LLC Members, the price of our Class A common stock at the time of the purchase, redemption or exchange, the extent to which redemptions or exchanges are taxable, the amount and timing of the taxable income that we generate in the future, the tax rates then applicable and the portion of our payments under the tax receivable agreement constituting imputed interest. We expect that, as a result of the increases in the tax basis of the tangible and intangible assets of Goosehead Financial, LLC attributable to the redeemed or exchanged LLC Units, the payments that we may make to the existing Pre-IPO LLC Members could be substantial. Payments under the tax receivable agreement are not conditioned on the Pre-IPO LLC Members’ continued ownership of us. There may be a material negative effect on our liquidity if, as described below, the payments under the tax receivable agreement exceed the actual benefits we receive in respect of the tax attributes subject to the tax receivable agreement and/or distributions to us by Goosehead Financial, LLC are not sufficient to permit us to make payments under the tax receivable agreement.
In addition, although we are not aware of any issue that would cause the Internal Revenue Service (“IRS”) to challenge the tax basis increases or other benefits arising under the tax receivable agreement, the Pre-IPO LLC Members will not reimburse us for any payments previously made if such tax basis increases or other tax benefits are subsequently disallowed, except that any excess payments made to the Pre-IPO LLC Members will be netted against future payments otherwise to be made under the tax receivable agreement, if any, after our determination of such excess. As a result, in such circumstances we could make payments to the Pre-IPO LLC Members under the tax receivable agreement that are greater than our actual cash tax savings and may not be able to recoup those payments, which could negatively impact our liquidity.
In addition, the tax receivable agreement provides that, upon certain mergers, asset sales or other forms of business combination, or certain other changes of control, our or our successor’s obligations with respect to tax benefits would be based on certain assumptions, including that we or our successor would have sufficient taxable income to fully utilize the increased tax deductions and tax basis and other benefits covered by the tax receivable agreement. As a result, upon a change of control, we could be required to make payments under the tax receivable agreement that are greater than the specified percentage of our actual cash tax savings, which could negatively impact our liquidity.
This provision of the tax receivable agreement may result in situations where the Pre-IPO LLC Members have interests that differ from or are in addition to those of our other stockholders. In addition, we could be required to make payments under the tax receivable agreement that are substantial and in excess of our, or a potential acquirer’s, actual cash savings in income tax.
Finally, because we are a holding company with no operations of our own, our ability to make payments under the tax receivable agreement is dependent on the ability of Goosehead Financial, LLC to make distributions to us. Our Credit Agreement restricts the ability of Goosehead Financial, LLC to make distributions to us, which could affect our ability to make payments under the tax receivable agreement. To the extent that we are unable to make payments under the tax receivable agreement for any reason, such payments will be deferred and will accrue interest until paid, which could negatively impact our results of operations and could also affect our liquidity in periods in which such payments are made.
Risks relating to ownership of our Class A common stock
Some provisions of Delaware law and our certificate of incorporation and by-laws may deter third parties from acquiring us and diminish the value of our Class A common stock.
Our certificate of incorporation and by-laws provide for, among other things:
34
|
•
|
Until the Substantial Ownership Requirement is no longer met, the Pre-IPO LLC Members may designate a majority of the nominees for election to our board of directors, including the nominee for election to serve as Chairman of our board of directors;
|
|
•
|
at any time after the Substantial Ownership Requirement is no longer met, there will be:
|
|
•
|
restrictions on the ability of our stockholders to call a special meeting and the business that can be conducted at such meeting or to act by written consent;
|
|
•
|
supermajority approval requirements for amending or repealing provisions in the certificate of incorporation and by-laws;
|
|
•
|
a division of the board of directors into three classes of directors, with each class as equal in number as possible, serving staggered three-year terms, and such directors may only be removed for cause and by the affirmative vote of holders of 75% of the total voting power of our outstanding shares of common stock, voting together as a single class;
|
|
•
|
our ability to issue additional shares of Class A common stock and to issue preferred stock with terms that the board of directors may determine, in each case without stockholder approval (other than as specified in our certificate of incorporation);
|
|
•
|
the absence of cumulative voting in the election of directors; and
|
|
•
|
advance notice requirements for stockholder proposals and nominations.
|
These provisions in our certificate of incorporation and by-laws may discourage, delay or prevent a transaction involving a change in control of our company that is in the best interest of our minority stockholders. Even in the absence of a takeover attempt, the existence of these provisions may adversely affect the prevailing market price of our Class A common stock if they are viewed as discouraging future takeover attempts. These provisions could also make it more difficult for stockholders to nominate directors for election to our board of directors and take other corporate actions.
Future sales, or the possibility of future sales, of a substantial number of our shares of Class A common stock could adversely affect the price of our shares of Class A common stock.
Future sales of a substantial number of our shares of Class A common stock, or the perception that such sales will occur, could cause a decline in the market price of our shares of Class A common stock. Approximately
25.6 million
shares of our Class A common stock and LLC Units (which may be redeemed or exchanged for a corresponding number of shares of Class A common stock) are held by the Pre-IPO LLC Members, the Goosehead Management Holders and Texas Wasatch Holders. If these stockholders sell substantial amounts of shares of Class A common stock in the public market (including any shares of Class A common stock issued upon redemption or exchange of LLC Units), or the market perceives that such sales may occur, the market price of our shares of Class A common stock could be adversely affected. We have also entered into the Registration Rights Agreement (as defined below) pursuant to which we have agreed under certain circumstances to file a registration statement to register the resale of shares of our Class A commons stock held by the Pre-IPO LLC Members, the Goosehead Management Holders and Texas Wasatch Holders, as well as to cooperate in certain public offerings of such shares. We have also filed registration statements to register all shares of Class A common stock and other equity securities that we have issued, or may issue under the Omnibus Incentive Plan and Employee Stock Purchase Plan. These shares of Class A common stock may be freely sold in the public market upon issuance, subject to certain limitations applicable to affiliates. If a large number of our shares of Class A common stock are sold in the public market, the sales could reduce the trading price of shares of Class A common stock.
We may not be able to successfully maintain effective internal controls over financial reporting.
We identified and previously reported material weaknesses for the years ended
December 31
,
2016
and
2017
regarding the lack of adequate (i) executive management review of our GAAP financial statements, (ii) review of our accounting policies, including recent accounting pronouncements and significant transactions for the periods presented and (iii) information technology general controls in the areas of user access and program change management for certain information technology systems.
Using third party consultants along with internal resources, we implemented certain measures to remediate these material weaknesses during the year ended
December 31, 2018
.
While the previously identified material weaknesses have been remediated, we may suffer from other material weaknesses in the future. If we fail to maintain effective internal control over financial reporting in the future, such failure could result in a material misstatement of our annual or quarterly financial statements that would not be
35
prevented or detected on a timely basis and which could cause investors and other users to lose confidence in our financial statements, limit our ability to raise capital and have a negative effect on the trading price of our common stock. Additionally, failure to maintain effective internal control over financial reporting may also negatively impact our operating results and financial condition, impair our ability to timely file our periodic and other reports with the Securities and Exchange Commission (the “SEC”), subject us to additional litigation and regulatory actions and cause us to incur substantial additional costs in future periods relating to the implementation of remedial measures.
We are an “emerging growth company” and we cannot be certain if the reduced disclosure requirements applicable to emerging growth companies will make our common stock less attractive to investors.
We are an “emerging growth company,” as defined in the JOBS Act, and we intend to take advantage of certain exemptions from various reporting requirements that are applicable to public companies that are not “emerging growth companies” including, but not limited to, not being required to comply with the auditor attestation requirements of Section 404(b) of the Sarbanes-Oxley Act, reduced disclosure obligations regarding executive compensation, and exemptions from the requirements of holding non-binding advisory votes on executive compensation and golden parachute payments for so long as we remain an emerging growth company. We also intend to take advantage of an exemption that will permit us to comply with new or revised accounting standards within the same time periods as private companies. We cannot predict if investors will find our common stock less attractive if we rely on these exemptions. If some investors find our common stock less attractive as a result, there may be a less active trading market for our common stock and our stock price may be more volatile.
We expect that our stock price will be volatile, which could cause the value of your investment to decline, and you may not be able to resell your shares at or above the initial public offering price.
Securities markets worldwide have experienced, and are likely to continue to experience, significant price and volume fluctuations. This market volatility, as well as general economic, market or political conditions, could reduce the market price of our Class A common stock regardless of our results of operations. The trading price of our Class A common stock is likely to be volatile and subject to wide price fluctuations in response to various factors, including:
|
•
|
market conditions in the broader stock market in general, or in our industry in particular;
|
|
•
|
actual or anticipated fluctuations in our quarterly financial and operating results;
|
|
•
|
introduction of new products and services by us or our competitors;
|
|
•
|
issuance of new or changed securities analysts’ reports or recommendations;
|
|
•
|
investor perceptions of us and the industries in which we or our clients operate;
|
|
•
|
sales, or anticipated sales, of large blocks of our stock, including those by our existing investors;
|
|
•
|
additions or departures of key personnel;
|
|
•
|
regulatory or political developments;
|
|
•
|
litigation and governmental investigations; and
|
|
•
|
changing economic and political conditions.
|
These and other factors may cause the market price and demand for shares of our Class A common stock to fluctuate substantially, which may limit or prevent investors from readily selling their shares of Class A common stock and may otherwise negatively affect the liquidity of our Class A common stock. In addition, in the past, when the market price of a stock has been volatile, holders of that stock have sometimes instituted securities class action litigation against the company that issued the stock. If any of our stockholders brought a lawsuit against us, we could incur substantial costs defending the lawsuit. Such a lawsuit could also divert the time and attention of our management from our business, which could significantly harm our profitability and reputation.
Our ability to pay dividends to our stockholders may be limited by our holding company structure, contractual restrictions and regulatory requirements.
We are a holding company and have no material assets other than our ownership of LLC Units in Goosehead Financial, LLC and we will not have any independent means of generating revenue. We intend to cause Goosehead Financial, LLC to make pro rata distributions to the Pre-IPO LLC Members and us in an amount at least sufficient to allow us and the Pre-IPO LLC Members to pay all applicable taxes, to make payments under the tax receivable agreement we will enter into with the Pre-IPO LLC Members and to pay our corporate and other overhead expenses. Goosehead Financial, LLC is a distinct legal entity and may be subject to legal or contractual restrictions
36
that, under certain circumstances, may limit our ability to obtain cash from them. If Goosehead Financial, LLC is unable to make distributions, we may not receive adequate distributions, which could materially and adversely affect our dividends and financial position and our ability to fund any dividends.
Our board of directors will periodically review the cash generated from our business and the capital expenditures required to finance our global growth plans and determine whether to declare periodic dividends to our stockholders. Our board of directors will take into account general economic and business conditions, including our financial condition and results of operations, capital requirements, contractual restrictions, including restrictions and covenants contained in our debt agreements, business prospects and other factors that our board of directors considers relevant. In addition, our Credit Agreement limits the amount of distributions that Goosehead Financial, LLC can make to us and the purposes for which distributions could be made. Accordingly, we may not be able to pay dividends even if our board of directors would otherwise deem it appropriate. See "Item 7. Management’s discussion and analysis of financial condition and results of operations — Liquidity and capital resources — Dividend Policy".
If securities analysts do not publish research or reports about our business or if they publish negative evaluations of our Class A common stock, the price of our Class A common stock could decline.
The trading market for our Class A common stock will rely in part on the research and reports that industry or securities analysts publish about us or our business. We currently have research coverage by industry and securities analysts. If no or few analysts continue coverage of us, the trading price of our Class A common stock would likely decrease. If one or more of the analysts covering our business downgrade their evaluations of our stock, the price of our Class A common stock could decline. If one or more of these analysts cease to cover our Class A common stock, we could lose visibility in the market for our stock, which in turn could cause our Class A common stock price to decline.
37
Item 1B. Unresolved staff comments
None.
Item 2. Properties
Our headquarters is located in leased offices in Westlake, Texas. The lease consists of approximately
108,000
square feet and expires in January 2029. As of
December 31, 2018
, our company-owned insurance brokerage business leases approximately
103,978
square feet of office space in Texas, Nevada, and Illinois under approximately eight leases. These offices are typically located in small office parks, generally with lease terms of five to ten years. We believe that all of our properties and facilities are well maintained.
Item 3. Legal proceedings
From time to time, we may be involved in various legal proceedings, lawsuits and claims incidental to the conduct of our business. Our businesses are also subject to extensive regulation, which may result in regulatory proceedings against us. We are not currently party to any material legal proceedings.
Item 4. Mine safety disclosures
Not applicable.
PART II
Item 5. Market for Registrant’s Common Equity, Related Stockholder Matters and Issuer Purchases of Equity Securities
Market Information
Our Class A Common Stock is traded on NASDAQ under the symbol “GSHD.”
Our Class B Common Stock is not listed nor traded on any stock exchange.
Holders of Record
As of
March 14, 2019
, there were
13
shareholders of record of our Class A common stock. The number of record holders does not include persons who held shares of our Class A common stock in nominee or "street name" accounts through brokers. As of
March 14, 2019
, there were
44
shareholders of record of our Class B common stock.
Dividend Policy
Subject to funds being legally available, we intend to cause Goosehead Financial, LLC to make pro rata distributions to the Pre-IPO LLC Members and us in an amount at least sufficient to allow us and the Pre-IPO LLC Members to pay all applicable taxes, to make payments under the tax receivable agreement we entered into with the Pre-IPO LLC Members and to pay our corporate and other overhead expenses. The declaration and payment of any dividends by Goosehead Insurance, Inc. will be at the sole discretion of our board of directors, which may change our dividend policy at any time. Our board of directors will take into account:
|
•
|
general economic and business conditions;
|
|
•
|
our financial condition and operating results;
|
|
•
|
our available cash and current and anticipated cash needs;
|
|
•
|
our capital requirements;
|
|
•
|
contractual, legal, tax and regulatory restrictions and implications on the payment of dividends by us to our stockholders or by our subsidiaries (including Goosehead Financial, LLC) to us; and
|
38
|
•
|
such other factors as our board of directors may deem relevant.
|
Goosehead Insurance, Inc. will be a holding company and will have no material assets other than its ownership of LLC Units in Goosehead Financial, LLC, and as a consequence, our ability to declare and pay dividends to the holders of our Class A common stock will be subject to the ability of Goosehead Financial, LLC to provide distributions to us. If Goosehead Financial, LLC makes such distributions, the Pre-IPO LLC Members will be entitled to receive equivalent distributions from Goosehead Financial, LLC. However, because we must pay taxes, make payments under the tax receivable agreement and pay our expenses, amounts ultimately distributed as dividends to holders of our Class A common stock are expected to be less than the amounts distributed by Goosehead Financial, LLC to the Pre-IPO LLC Members on a per share basis. See "Item 13. Certain relationships and related transactions, and director independence."
Assuming Goosehead Financial, LLC makes distributions to its members in any given year, the determination to pay dividends, if any, to our Class A common stockholders out of the portion, if any, of such distributions remaining after our payment of taxes, tax receivable agreement payments and expenses (any such portion, an “excess distribution”) will be made by our board of directors. Because our board of directors may determine to pay or not pay dividends to our Class A common stockholders, our Class A common stockholders may not necessarily receive dividend distributions relating to excess distributions, even if Goosehead Financial, LLC makes such distributions to us.
Securities Authorized for Issuance Under Equity Incentive Plans
The following table provides information about our compensation plans under which our Class A Common Stock is authorized for issuance, as of
December 31, 2018
:
|
Number of securities to be issued upon exercise of outstanding options (in thousands)
|
1,650
|
|
|
Weighted-average exercise price of outstanding options
|
10.00
|
|
|
Number of securities remaining available for future issuances under equity compensation plans (in thousands)
|
—
|
|
|
Number of securities issued in connection with the Employee Stock Purchase Plan
|
5
|
|
|
Number of securities remaining available for future issuance in connection with the Employee Stock Purchase Plan
|
15
|
|
Issuer Purchases of Equity Securities
None.
Use of Proceeds
On April 26, 2018, our Registration Statement on Form S-1 (Registration No. 333-224080) was declared effective by the SEC in connection with the Offering pursuant to which we sold an aggregate of
$9.8 million
shares of our Class A common stock (including
$1.3 million
shares sold pursuant to the underwriters' over-allotment option) at a price of
$10.00
per share. J.P. Morgan Securities LLC and Merrill Lynch, Pierce Fenner & Smith Incorporated acted as joint book-running managers in the Offering. Keefe, Bruyette & Woods, Inc. and William Blair & Company, L.L.C. acted as co-managers in the Offering. The Offering resulted in net proceeds of approximately
$87 million
after deducting underwriters' discounts and commissions of
$7 million
and other offering expenses of
$4.3 million
.
We used the net proceeds to us from the base portion of the Offering (approximately
$77 million
) to effect partial repayment of notes issued by the Company in exchange for the transfer of certain ownership interests in Goosehead Management, LLC and Texas Wasatch Insurance Holdings Group, LLC held by their historical owners, which include certain members of the Company’s management and board of directors, including certain persons owning
10%
or more of our common stock. We used the net proceeds to us from the exercise of the underwriters’ over-allotment option to purchase from Goosehead Financial, LLC a number of LLC units equal to the number of shares of Class A common stock issued pursuant to the exercise of the underwriters’ over-allotment option. In turn, we intend to cause Goosehead Financial, LLC to use the proceeds it receives for general corporate purposes, which may include the repayment of debt. Between the effective date of the Registration Statement and
March 14, 2019
, Goosehead Financial, LLC has designated approximately
$10 million
of the net proceeds from the exercise of the underwriters’ over-allotment option to fund a dividend. Besides the aforementioned dividend, none of the net proceeds from the exercise of the underwriters’ over-allotment option were used to make payments, directly or indirectly, to (i) any of our directors, officers or their associates, (ii) any persons owning
10%
or more of our common shares or (iii) any of our affiliates. The intended use of the remaining net proceeds has not changed from the information mentioned in the final prospectus for the Offering.
39
Item 6. Selected financial data
The following selected consolidated historical financial data of GSHD and should be read in conjunction with, and are qualified by reference to, "Item 1A. Risk factors," "Item 7. Management’s discussion and analysis of financial condition and results of operations” and our audited financial statements and notes thereto included in "Item 8. Financial statements and supplementary data." The results indicated below and elsewhere in this Annual Report are not necessarily indicative of our future performance.
|
|
2018
|
|
2017
|
|
2016
|
|
||
|
Selected statements of income data (in thousands):
|
||||||||
|
Commissions and agency fees
|
36,704
|
|
27,030
|
|
21,283
|
|
||
|
Franchise revenues
|
23,022
|
|
15,438
|
|
10,101
|
|
||
|
Employee compensation and benefits
|
58,256
|
|
24,544
|
|
19,469
|
|
||
|
General and administrative expenses
|
13,060
|
|
8,597
|
|
5,732
|
|
||
|
Income (loss) from operations
|
(13,930
|
)
|
7,611
|
|
5,136
|
|
||
|
Net income (loss)
|
(18,667
|
)
|
8,678
|
|
4,723
|
|
||
|
Net income (loss) attributable to Goosehead Insurance, Inc.
|
(8,903
|
)
|
—
|
|
—
|
|
||
|
Per share data:
|
||||||||
|
Earnings per share - basic
(1)
|
(0.66
|
)
|
n/a
|
|
n/a
|
|
||
|
Earnings per share - diluted
(1)
|
(0.66
|
)
|
n/a
|
|
n/a
|
|
||
|
Selected balance sheets data (at period end, in thousands):
|
||||||||
|
Cash and cash equivalents
|
18,635
|
|
4,948
|
|
3,778
|
|
||
|
Total current assets
|
22,839
|
|
7,719
|
|
6,098
|
|
||
|
Total assets
|
34,798
|
|
16,706
|
|
8,695
|
|
||
|
Total current liabilities
|
7,812
|
|
5,767
|
|
3,476
|
|
||
|
Total debt
|
48,447
|
|
48,656
|
|
29,373
|
|
||
|
Total liabilities
|
60,001
|
|
57,839
|
|
32,935
|
|
||
|
Total equity
|
(25,203
|
)
|
(41,133
|
)
|
(24,240
|
)
|
||
|
Selected cash flow data (in thousands):
|
||||||||
|
Net cash provided by operating activities
|
10,275
|
|
13,542
|
|
4,402
|
|
||
|
Net cash used for investing activities
|
(2,180
|
)
|
(6,135
|
)
|
(696
|
)
|
||
|
Net cash provided by financing activities
|
5,592
|
|
(6,237
|
)
|
(965
|
)
|
||
|
Selected operating data:
|
||||||||
|
Adjusted EBITDA (in thousands)
(2)
|
14,752
|
|
10,718
|
|
8,112
|
|
||
|
Adjusted EBITDA margin
(2)
|
25
|
%
|
25
|
%
|
26
|
%
|
||
|
Total written premium (in thousands)
|
509,012
|
|
342,330
|
|
240,994
|
|
||
|
Corporate sales agents (at period end)
|
167
|
|
111
|
|
69
|
|
||
|
Operating franchises (at period end)
|
457
|
|
292
|
|
190
|
|
||
(1) Basic and diluted earnings per share for the years ended
December 31, 2017
and
2016
are not shown, as there were zero shares of Class A or Class B common stock outstanding as of
December 31, 2017
and
2016
.
(2) Adjusted EBITDA and Adjusted EBITDA margin are Non-GAAP Measures. See Item 7 "Management's discussion and analysis of financial condition and results of operation" for additional information and a reconciliation to the most directly comparable GAAP financial measure.
40
Item 7. Management’s discussion and analysis of financial condition and results of operations
Overview
The following discussion and analysis of our financial condition and results of operations should be read in conjunction with “Item 6. Selected financial data” and our financial statements and the related notes and other financial information included elsewhere in this Annual Report. In addition to historical financial information, the following discussion and analysis contains forward-looking statements that involve risks, uncertainties, and assumptions. Our actual results and timing of selected events may differ materially from those anticipated in these forward-looking statements as a result of many factors, including those discussed under “Risk factors” and elsewhere in this Annual Report.
The following discussion contains references to periods prior to The Offering, including January through April 2018 and calendar year 2017, which represents the consolidated and combined financial results of our predecessor Goosehead Financial, LLC and its subsidiaries Texas Wasatch Insurance Services, LP, Goosehead Insurance Agency, LLC and its affiliates Goosehead Management, LLC and Texas Wasatch Insurance Holdings Group, LLC.
We are a rapidly growing personal lines independent insurance agency, reinventing the traditional approach to distributing personal lines products and services throughout the United States. We were founded with one vision in mind—to provide consumers with superior insurance coverage at the best available price and in a timely manner. By leveraging our differentiated business model and innovative technology platform, we are able to deliver to consumers a superior insurance experience.
The following discussion contains references to the years ended
December 31, 2018
and
December 31, 2017
.
Financial Highlights for
2018
:
|
•
|
Total revenue increased
41%
from
2017
to
$60.1 million
|
|
•
|
Commissions and Agency fee revenues increased
36%
from
2017
to
$36.7 million
|
|
•
|
Franchise revenues increased
49%
from
2017
to
$23.0 million
|
|
•
|
Net income decreased by
315%
from
2017
to a loss of
$18.7 million
|
|
•
|
Adjusted EBITDA*, a non-GAAP measure, increased
38%
from
2017
to
$14.8 million
, or
25%
of total revenues
|
|
•
|
Corporate Channel Adjusted EBITDA increased
18%
from
2017
to
$7.5 million
, or
22%
of Corporate Channel revenues
|
|
•
|
Franchise Channel Adjusted EBITDA increased
84%
from
2017
to
$8.6 million
, or
33%
of Franchise channel revenues
|
|
•
|
Basic earnings per share was
$(0.66)
and Adjusted EPS*, a non-GAAP measure, was
$0.20
for the year ended
December 31, 2018
|
|
•
|
Policies in Force increased
47%
from
December 31, 2017
to
334 thousand
at
December 31, 2018
|
|
•
|
Corporate sales headcount increased
50%
from
December 31, 2017
to
167
at
December 31, 2018
|
|
◦
|
As of
December 31, 2018
,
90
of these Corporate sales agents had less than one year of tenure and
77
had greater than one year of tenure
|
|
•
|
Operating franchises increased
57%
from
December 31, 2017
to
457
at
December 31, 2018
|
|
◦
|
In Texas as of
December 31, 2018
,
36
operating franchisees had less than one year of tenure and
166
operating franchisees had greater than one year of tenure.
|
|
◦
|
Outside of Texas as of
December 31, 2018
,
168
operating franchisees had less than one year of tenure and
87
had greater than one year of tenure.
|
*Adjusted EBITDA and Adjusted EPS are non-GAAP measures. Reconciliation of Adjusted EBITDA to net income (loss) and Adjusted EPS to EPS, the most directly comparable financial measures presented in accordance with
41
GAAP, are set forth in the "Key performance indicators" section of Management’s discussion and analysis of financial condition and results of operations of this Form 10-K.
Factors affecting our results of operations
We believe that the most significant factors affecting our results of operations include:
|
•
|
Investment in growth.
We continue to invest in expanding our national footprint, increasing our revenue producing headcount, and increasing the level of support provided to our salespeople. Our ability to attract and retain top Corporate Channel sales agents and franchise owners, ramp up new agent productivity, and retain existing and future Policies in Force are key to continued profitable growth.
|
|
•
|
Investment in technology.
We continue to develop and invest in our technology platform to drive scalability, adaptability, and efficiency in both the Corporate Channel and Franchise Channel. We believe our significant proprietary investment in our technology is a key competitive advantage that supports our growth rate and operating margins.
|
|
•
|
Continued expansion of Franchise Channel into new markets.
We will be expanding our franchise marketing efforts to
9
new states in 2019, representing an approximate
20%
increase in the population where we are actively marketing our franchise offering. We will continue to market actively for new franchises in our established markets and these new markets. We are now licensed with the necessary state departments of commerce and insurance and registered as a franchisor in all of the lower 48 states in the U.S. Making our franchise offering available to more agents across the U.S. will allow us to continue to recruit an increasing number of talented agents into our system.
|
|
•
|
Continued retention of existing Book of Business.
We have made significant progress in recent years in Client Retention metrics, and maintaining these high levels of Client Retention is key to future profitability. A key lever in driving Client Retention is selling multiple lines of business to clients at the point of initial sale. In our Corporate Channel, we have made significant progress in recent years in this area. We expect to continue to maintain our high levels of cross-selling in the Corporate Channel, and we expect to see improvement in our Franchise Channel as we bring best demonstrated practices to our field of Franchisees.
|
|
•
|
Increase in margins as business shifts from new to renewal.
Because we are entitled to a higher percentage of revenue after the first term of a policy and the higher level of back-office support needed during the first term of an insurance policy, the Company begins to see higher levels of profitability on Renewal Revenue. We will focus simultaneously on converting New Business Revenue to Renewal Revenue through our retention efforts, and on continuing to grow New Business Revenue that will convert and allow us to expand our margins in future periods.
|
|
•
|
Strength of the insurance market or particular lines of business.
We generate the majority of our revenues through commissions, which are calculated as a percentage of the total insurance policy premium. A softening of the insurance market or the particular lines of business that are our focus, characterized by a period of declining premium rates, could negatively impact our profitability.
|
|
•
|
Seasonality and cyclicality of housing market conditions.
The majority of our new accounts are sourced by referral sources tied to home closing transactions. Major slowdowns in the various housing markets Goosehead serves could impact our ability to generate new business. We experience seasonality and revenue related to the sale of insurance policies throughout the course of a calendar year that is tied to the seasonality of new home sales. Revenue from home insurance leads is higher from April to August and lower from October through January. While this can impact month-to-month or quarter-to-quarter results, we expect productivity to increase year-over-year.
|
|
•
|
Effect of natural or man-made disasters
. Any increases in loss ratios due to natural or man-made disasters could impact our Contingent Commissions, which are primarily driven by both growth and profitability metrics.
|
|
•
|
Cost of being a public company
.
To operate as a public company, we will be required to continue to implement changes in certain aspects of our business and develop, manage, and train management level and other employees to comply with on-going public company requirements. We will also incur new expenses as a public company, including public reporting obligations, proxy statements, stockholder meetings, stock exchange fees and transfer agent fees.
|
42
Effects of the reorganization on our corporate structure
Goosehead Insurance, Inc. was formed for the purpose of the Offering and has engaged to date only in activities related to Goosehead Financial, LLC. Goosehead Insurance, Inc. is a holding company and its sole material asset is a controlling ownership and profits interest in Goosehead Financial, LLC. All of our business is conducted through Goosehead Financial, LLC and its consolidated subsidiaries and affiliates, and the financial results of Goosehead Financial, LLC and its consolidated subsidiaries are included in the consolidated financial statements of Goosehead Insurance, Inc. Goosehead Financial, LLC is currently taxed as a partnership for federal income tax purposes and, as a result, its members, including Goosehead Insurance, Inc., pay taxes with respect to their allocable shares of its net taxable income.
We expect that redemptions and exchanges of LLC Units will result in increases in the tax basis in our share of the tangible and intangible assets of Goosehead Financial, LLC that otherwise would not have been available. These increases in tax basis may reduce the amount of tax that we would otherwise be required to pay in the future. The tax receivable agreement requires Goosehead Insurance, Inc. to pay 85% of the amount of cash savings, if any, in U.S. federal, state and local income tax or franchise tax that we actually realize to the Pre-IPO LLC Members. Furthermore, payments under the tax receivable agreement give rise to additional tax benefits and therefore additional payments under the tax receivable agreement itself. See "Item 13. Certain relationships and related transactions, and director independence".
Certain income statement line items
Revenues
In
2018
, revenue increased by
41%
to
$60.1 million
from
$42.7 million
in
2017
. We discuss below the breakdown of our revenue by stream and line of business.
Corporate Channel Revenues
In the Corporate Channel, we generate revenue in the form of New Business Revenue (Corporate), Renewal Revenue (Corporate), Agency Fees, and Contingent Commissions.
The following table sets forth our revenues in the Corporate Channel type by amount and as a percentage of our revenues for the periods indicated (in thousands):
|
Years ended December 31,
|
||||||||||||||
|
2018
|
2017
|
|||||||||||||
|
New Business Revenue (Corporate)
|
$
|
9,347
|
|
27
|
%
|
$
|
5,765
|
|
23
|
%
|
||||
|
Renewal Revenue (Corporate)
|
18,357
|
|
54
|
%
|
15,162
|
|
59
|
%
|
||||||
|
Agency Fees
|
5,169
|
|
15
|
%
|
3,444
|
|
13
|
%
|
||||||
|
Contingent Commissions
|
1,414
|
|
4
|
%
|
1,150
|
|
5
|
%
|
||||||
|
Revenues
|
$
|
34,287
|
|
100
|
%
|
$
|
25,521
|
|
100
|
%
|
||||
Franchise Channel Revenues
In the Franchise Channel, we generate revenue from Royalty Fees, Initial Franchise Fees, Contingent Commissions, and interest income.
The Initial Franchise Fee is determined by the state of the Franchise location and the payment terms, as follows:
43
|
|
Initial franchise fees
|
||||||
|
Payment terms
|
TX/LA/OK
|
|
Other
|
||||
|
Pay-in full:
|
$
|
40,000
|
|
|
$
|
25,000
|
|
|
Payment plan:
|
|
|
|
||||
|
Down payment
|
$
|
10,000
|
|
|
$
|
10,000
|
|
|
Paid over 5 years
|
50,000
|
|
|
30,000
|
|
||
|
Total Paid
|
$
|
60,000
|
|
|
$
|
40,000
|
|
The following table sets forth our revenues in the Franchise Channel type by amount and as a percentage of our revenues for the periods indicated:
|
Years ended December 31,
|
||||||||||||||
|
2018
|
2017
|
|||||||||||||
|
New Business Royalty Fees
|
$
|
4,873
|
|
19
|
%
|
$
|
3,364
|
|
20
|
%
|
||||
|
Renewal Royalty Fees
|
12,104
|
|
47
|
%
|
7,704
|
|
45
|
%
|
||||||
|
Initial Franchise Fees
|
6,045
|
|
23
|
%
|
4,370
|
|
25
|
%
|
||||||
|
Contingent Commissions
|
2,417
|
|
9
|
%
|
1,509
|
|
9
|
%
|
||||||
|
Interest Income
|
422
|
|
2
|
%
|
243
|
|
1
|
%
|
||||||
|
Revenues
|
$
|
25,861
|
|
100
|
%
|
$
|
17,190
|
|
100
|
%
|
||||
Expenses
Employee compensation and benefits.
Employee compensation and benefits is our largest expense and consists of (a) base compensation comprising salary, bonuses and benefits paid and payable to employees and (b) equity-based compensation associated with the grants of restricted interest awards to senior employees. We expect to continue to experience a general rise in compensation and benefits expense commensurate with expected growth in headcount and with the need to maintain competitive compensation levels as we expand geographically and create new products and services.
Our compensation arrangements with our employees contain a significant bonus component driven by the results of our operations. Therefore, as our revenues, profitability and the amount of incentive fees earned by our customized separate accounts and specialized funds increase, our compensation costs rise.
General and administrative expenses.
General and administrative expenses include travel, accounting, legal and other professional fees, commissions, placement fees, office expenses, depreciation and other costs associated with our operations. Our occupancy-related costs and professional services expenses, in particular, generally increase or decrease in relative proportion to the number of our employees and the overall size and scale of our business operations. Expenses allocated to the Segments related to our service centers and other overhead are applied to the appropriate Segment using a transfer pricing methodology that seeks to maximize the scale efficiencies of our business by sharing certain expenses across the two Segments. These shared expenses are then allocated between the two Segments based on certain cost drivers related to each expense. Examples of specific expenses and their cost drivers include, but are not limited to: service team compensation costs are allocated based on the number of cases processed for each Segment, our rent expense by location is allocated based on the full time equivalent count and Segment, and our Salesforce.com charges are allocated based on the number of individual licenses used by each Segment.
Premium by line of business
We are a distributor of insurance policies in a range of lines of business including homeowner’s insurance, automotive, dwelling property insurance, flood, wind and earthquake insurance, excess liability or umbrella insurance, specialty lines insurance (motorcycle, recreational vehicle, and other insurance), commercial lines insurance (general liability, property and auto insurance for small businesses) and life insurance. The following table sets forth our Total Written Premium placed by line of business by amount and as a percentage of our Total Written Premium for the periods indicated (
in thousands
):
44
|
|
Year Ended December 31
|
||||||||||||
|
|
2018
|
|
2017
|
||||||||||
|
Line of business
|
|
|
|
|
|
|
|
||||||
|
Homeowner
|
$
|
270,479
|
|
|
53
|
%
|
|
$
|
188,570
|
|
55
|
%
|
|
|
Automotive
|
225,591
|
|
|
44
|
%
|
|
144,884
|
|
42
|
%
|
|||
|
Commercial
|
8,507
|
|
|
2
|
%
|
|
5,818
|
|
2
|
%
|
|||
|
Other
|
4,435
|
|
|
1
|
%
|
|
3,058
|
|
1
|
%
|
|||
|
Total Written Premium
|
$
|
509,012
|
|
|
100
|
%
|
|
$
|
342,330
|
|
100
|
%
|
|
Key performance indicators
Our key operating metrics are discussed below:
Total Written Premium
Total Written Premium represents for any reported period, the total amount of current (non-cancelled) gross premium that is placed with Goosehead’s portfolio of Carriers. We believe that Total Written Premium is an appropriate measure of operating performance because it reflects growth of our business relative to other insurance agencies.
For the year ended
December 31, 2018
, we had
$509.0 million
in Total Written Premium, representing a
49%
increase, compared to
$342.3 million
for the year ended
December 31, 2017
. The following table shows Total Written Premium by channel for the years ended
2018
and
2017
(in thousands)
.
|
Year Ended December 31
|
% Change
|
|||||||||
|
2018
|
|
2017
|
|
|||||||
|
Corporate Channel Total Written Premium
|
$
|
191,750
|
|
$
|
143,879
|
|
33
|
%
|
||
|
Franchise Channel Total Written Premium
|
317,262
|
|
198,451
|
|
60
|
%
|
||||
|
Total Written Premium
|
$
|
509,012
|
|
$
|
342,330
|
|
49
|
%
|
||
Policies in Force
Policies in Force means as of any reported date, the total count of current (non-cancelled) policies placed with Goosehead’s portfolio of Carriers. We believe that Policies in Force is an appropriate measure of operating performance because it reflects growth of our business relative to other insurance agencies.
As of
December 31, 2018
, we had
334 thousand
in Policies in Force compared to
228 thousand
as of
December 31, 2017
, representing a
47%
increase.
NPS
Net Promoter Score (NPS) is calculated based on a single question: “How likely are you to refer Goosehead Insurance to a friend, family member or colleague?” Clients that respond with a 6 or below are Detractors, a
score of 7 or 8 are called Passives, and a 9 or 10 are Promoters. NPS is calculated by subtracting the percentage of Detractors from the percentage of Promoters. For example, if 50% of respondents were Promoters and 10% were Detractors, NPS is a 40. NPS is a useful gauge of the loyalty of client relationships and can be compared across companies and industries.
NPS has increased to
89
as of
December 31, 2018
from
86
as of
December 31, 2017
, primarily driven by the service team’s continued focus on delivering highly differentiated service levels.
Client Retention
Client Retention is calculated by comparing the number of all clients that had at least one policy in force twelve months prior to the date of measurement and still have at least one policy in force at the date of measurement. We believe Client Retention is useful as a measure of how well Goosehead retains clients year-over-year and minimizes defections.
45
Client Retention has remained steady at
88%
at
December 31, 2018
when compared to
December 31, 2017
, again driven by the service team’s continued focus on delivering highly differentiated service levels. Our premium retention rate is higher than our Client Retention rate as a result of both premiums increasing year over year and additional coverages sold by our sales and service teams.
New Business Revenue
New Business Revenue is commissions received from the Carrier, Agency Fees received from clients, and Royalty Fees relating to policies in their first term.
For the year ended
December 31, 2018
, New Business Revenue grew
54%
to
$19.4 million
, from
$12.6 million
for the year ended
December 31, 2017
. Growth in New Business Revenue is driven by an increase in Corporate Channel sales agent headcount of
50%
and growth in franchises in the Franchise Channel of
57%
.
Renewal Revenue
Renewal Revenue is commissions received from the Carrier and Royalty Fees after the first term of a policy.
For the year ended
December 31, 2018
, Renewal Revenue grew
33%
to
$30.5 million
, from
$22.9 million
for the year ended
December 31, 2017
. Growth in Renewal Revenue was driven by Client Retention of
88%
at
December 31, 2018
. As our agent force matures on both the Corporate Channel and the Franchise Channel, the policies they wrote in prior years begins to convert from New Business Revenue to more profitable Renewal Revenue.
Non-GAAP Financial Measures
Adjusted EBITDA, Adjusted EBITDA Margin, and Adjusted EPS are not measures of financial performance under GAAP and should not be considered substitutes for net income or earnings per share, which we consider to be the most directly comparable GAAP measure. We refer to these measures as "non-GAAP financial measures." We consider these non-GAAP financial measures to be useful metrics for management and investors to facilitate operating performance comparisons from period to period by excluding potential differences caused by variations in capital structures, tax position, depreciation, amortization and certain other items that we believe are not representative of our core business. Adjusted EBITDA, Adjusted EBITDA Margin, and Adjusted EPS have limitations as analytical tools, and when assessing our operating performance, you should not consider Adjusted EBITDA, Adjusted EBITDA Margin, or Adjusted EPS in isolation or as substitutes for net income, earnings per share or other consolidated income statement data prepared in accordance with GAAP. Other companies may calculate Adjusted EBITDA, Adjusted EBITDA Margin, and Adjusted EPS differently than we do, limiting their usefulness as comparative measures.
Adjusted EBITDA
Adjusted EBITDA is a supplemental measure of our performance. We believe that Adjusted EBITDA is an appropriate measure of operating performance because it eliminates the impact of items that do not relate to business performance. Adjusted EBITDA is defined as net income (the most directly comparable GAAP measure) before interest, income taxes, depreciation and amortization, adjusted to exclude equity-based compensation and other non-operating items, including, among other things, certain non-cash charges and certain non-recurring or non-operating gains or losses.
Adjusted EBITDA increased by
$4.1 million
, or
38%
, to
$14.8 million
for the year ended
December 31, 2018
, from
$10.7 million
for the year ended
December 31, 2017
, driven by Franchise Channel Adjusted EBITDA growth of
$3.9 million
and by Corporate Channel Adjusted EBITDA growth of
$1.2 million
.
Adjusted EBITDA Margin
Adjusted EBITDA Margin is Adjusted EBITDA as defined above, divided by total revenue excluding other non-operating items. Adjusted EBITDA Margin is helpful in measuring profitability of operations on a consolidated level.
For the year ended
December 31, 2018
, Adjusted EBITDA Margin was
25%
compared to
25%
for the year ended
December 31, 2017
, primarily driven by Corporate Channel Adjusted EBITDA Margin compression, offset by Franchise Channel Adjusted EBITDA Margin expansion. Corporate Channel Adjusted EBITDA Margin compression can be attributed to increased expenses driven by a
50%
increase in Corporate Channel sales agent headcount and investments in technology. As these new sales agents ramp-up production and begin to receive Renewal Revenue (Corporate), we expect them to contribute to future Corporate Channel Adjusted EBITDA Margin
46
expansion. Franchise Channel Adjusted EBITDA Margin expansion is attributed to growth in more profitable Renewal Revenue as a percentage of total revenue and the increase in Contingent Commissions, offset by higher employee compensation and benefits and general and administrative expenses from investments in hiring and technology.
Adjusted EPS
Adjusted EPS is a supplemental measure of our performance, defined as earnings per share (the most directly comparable GAAP measure) before non-recurring or non-operating income and expenses, adjusted to assume a single class of stock (Class A) and assuming non-controlling interest does not exist. Adjusted EPS is a useful measure to management because it eliminates the impact of items that do not relate to business performance and helps compare companies that may not have a dual-share class structure.
GAAP to Non-GAAP Reconciliations
The following tables show a reconciliation from net income to Adjusted EBITDA for the year ended
December 31, 2018
and
2017
(in thousands)
:
|
|
|
Year ended December 31,
|
||||||
|
|
|
2018
|
|
2017
|
||||
|
Net income (loss)
|
|
$
|
(18,667
|
)
|
|
$
|
8,678
|
|
|
Interest expense
|
|
4,266
|
|
|
2,474
|
|
||
|
Depreciation and amortization
|
|
1,464
|
|
|
876
|
|
||
|
Tax expense
|
|
449
|
|
|
—
|
|
||
|
Equity-based compensation
|
|
27,083
|
|
|
2,231
|
|
||
|
Other income (expense, including state franchise tax)
|
|
157
|
|
|
(3,541
|
)
|
||
|
Adjusted EBITDA
|
|
$
|
14,752
|
|
|
$
|
10,718
|
|
|
Adjusted EBITDA Margin
(1)
|
|
25
|
%
|
|
25
|
%
|
||
(1) Adjusted EBITDA Margin is calculated as Adjusted EBITDA divided by Total Revenue (
$14,752
/
$60,148
) and (
$10,718
/
$42,711
) for the year ended
December 31, 2018
and
2017
.
47
The following tables show a reconciliation from basic earnings per share to Adjusted EPS for the year ended
December 31, 2018
. Note that totals may not sum due to rounding:
|
Year Ended December 31, 2018
|
||||
|
Earnings (loss) per share - basic (GAAP)
|
$
|
(0.66
|
)
|
|
|
Add: income prior to the Reorganization Transactions
(1)
|
0.12
|
|
||
|
Less: estimated controlling interest taxes on income prior to Reorganization Transactions
(2)
|
(0.03
|
)
|
||
|
Add: origination fees from previous debt immediately recognized upon refinance
(3)
|
0.02
|
|
||
|
Add: equity-based compensation
(4)
|
0.75
|
|
||
|
Less: Estimated taxes assuming Class B shares were fully converted to Class A
(5)
|
(0.01
|
)
|
||
|
Adjusted EPS (non-GAAP)
|
$
|
0.20
|
|
|
(1) Calculated as the income prior to the Reorganization Transactions divided by the sum of Class A and Class B shares at the time of IPO [
$4.4 million
/ (
13.5 million
+
22.7 million
). See "Item 8. Financial statements and supplementary data."
(2) Calculated as the income prior to the Reorganization Transactions, times the controlling interest percentage at the time of IPO, times the assumed effective tax rate of 25%, divided by the count of Class A shares at the time of the IPO [
$4.4 million
*
37.3%
*
25%
/
13.5 million
]. Income taxes attributable to non-controlling interests are included in (5) below.
(3) Calculated as the origination fees of previous debt immediately recognized upon refinance divided by sum of Class A and Class B shares at the time of the refinance [
$871.0 thousand
/ (
13.5 million
+
22.7 million
)]
(4) Calculated as equity-based compensation divided by the weighted average of Class A and Class B shares outstanding during the period [
$27.1 million
/ (
13.6 million
+
22.7 million
)]
(5) Calculated as net loss attributable to non-controlling interests, excluding taxes directly attributable to non-controlling interest, times the effective tax rate of controlling interests, divided by the weighted average Class B shares for the period [(
$(9.7) million
*
(2.0)%
) /
22.7 million
]. Not included in calculation are the effects of the conversion per the Tax Receivable Agreement or pre-IPO taxes attributable to non-controlling interests.
Consolidated results of operations
The following is a discussion of our consolidated results of operations for each of the years ended
December 31, 2018
and
December 31, 2017
. This information is derived from our accompanying consolidated financial statements prepared in accordance with GAAP.
48
Year ended
December 31, 2018
compared to year ended
December 31, 2017
The following table summarizes our results of operations for the years ended
December 31, 2018
and
2017
:
|
|
Year Ended December 31
|
||||||||||||
|
|
2018
|
2017
|
|||||||||||
|
Revenues:
|
|||||||||||||
|
Commissions and agency fees
|
$
|
36,704
|
|
61
|
%
|
$
|
27,030
|
|
63
|
%
|
|||
|
Franchise revenues
|
23,022
|
|
38
|
%
|
15,438
|
|
36
|
%
|
|||||
|
Interest income
|
422
|
|
1
|
%
|
243
|
|
1
|
%
|
|||||
|
Total revenues
|
60,148
|
|
100
|
%
|
42,711
|
|
100
|
%
|
|||||
|
Operating Expenses:
|
|
||||||||||||
|
Employee compensation and benefits (including Class B unit compensation of $26,134 and $2,231 for the years ended December 31, 2018 and 2017, respectively)
|
58,256
|
|
79
|
%
|
24,544
|
|
70
|
%
|
|||||
|
General and administrative expenses
|
13,060
|
|
18
|
%
|
8,597
|
|
24
|
%
|
|||||
|
Bad debts
|
1,298
|
|
2
|
%
|
1,083
|
|
3
|
%
|
|||||
|
Depreciation and amortization
|
1,464
|
|
2
|
%
|
876
|
|
2
|
%
|
|||||
|
Total operating expenses
|
74,078
|
|
100
|
%
|
35,100
|
|
100
|
%
|
|||||
|
Income (loss) from operations
|
(13,930
|
)
|
|
7,611
|
|
||||||||
|
Other Income (Expense):
|
|
||||||||||||
|
Other income (expense)
|
(22
|
)
|
|
3,541
|
|
||||||||
|
Interest expense
|
(4,266
|
)
|
|
(2,474
|
)
|
||||||||
|
Income (loss) before taxes
|
(18,218
|
)
|
|
8,678
|
|
||||||||
|
Tax expense
|
449
|
|
—
|
|
|||||||||
|
Net income (loss)
|
(18,667
|
)
|
8,678
|
|
|||||||||
|
Less: net income (loss) attributable to non-controlling interests
|
(9,764
|
)
|
8,678
|
|
|||||||||
|
Net income (loss) attributable to Goosehead Insurance, Inc.
|
$
|
(8,903
|
)
|
$
|
—
|
|
|||||||
Revenues
In
2018
, revenue increased by
41%
to
$60.1
million from
$42.7
million in
2017
.
Commissions and agency fees
Commissions and agency fees consist of new business commissions, renewal commissions, agency fees, and contingent commissions generated from the corporate channel, as well as contingent commissions generated from the franchise channel.
The following table sets forth our commissions and agency fees by amount and as a percentage of our revenues for the periods indicated (
in thousands
):
|
|
Year Ended December 31
|
||||||||||||
|
|
2018
|
|
2017
|
||||||||||
|
New Business Revenue (Corporate)
|
$
|
9,347
|
|
|
25
|
%
|
|
$
|
5,765
|
|
|
21
|
%
|
|
Renewal Revenue (Corporate)
|
18,357
|
|
|
50
|
%
|
|
15,162
|
|
|
56
|
%
|
||
|
Agency Fees
|
5,169
|
|
|
14
|
%
|
|
3,444
|
|
|
13
|
%
|
||
|
Contingent Commissions (Corporate)
|
1,414
|
|
|
4
|
%
|
|
1,150
|
|
|
4
|
%
|
||
|
Contingent Commissions (Franchise)
|
2,417
|
|
|
7
|
%
|
|
1,509
|
|
|
6
|
%
|
||
|
Commissions and agency fees
|
$
|
36,704
|
|
100
|
%
|
|
$
|
27,030
|
|
|
100
|
%
|
|
49
New Business Revenue (Corporate) increased by
$3.6 million
, or
62%
, to
$9.3 million
for the
year ended December 31, 2018
from
$5.8 million
for the
year ended December 31, 2017
. Revenue from Agency Fees increased by
$1.7 million
, or
50%
, to
$5.2 million
for the
year ended December 31, 2018
from
$3.4 million
for the
year ended December 31, 2017
. These increases were primarily attributable to an increase in total sales agent head count to
167
at
December 31, 2018
, from
111
at
December 31, 2017
, a
50%
increase.
Renewal Revenue (Corporate) increased by
$3.2 million
, or
21%
, to
$18.4 million
for the
year ended December 31, 2018
from
$15.2 million
for the
year ended December 31, 2017
. These increases are primarily attributable to an increase in the number of policies in the renewal term at
December 31, 2018
compared to
December 31, 2017
.
Revenue from Contingent Commissions in the Corporate Channel increased by
$0.3 million
, or
23%
, to
$1.4 million
for the
year ended December 31, 2018
, from
$1.2 million
for the
year ended December 31, 2017
. The increase is primarily attributable to the increase in Total Written Premium for
year ended December 31, 2018
compared to the
year ended December 31, 2017
.
Revenue from Contingent Commissions in the Franchise Channel increased
$0.9 million
, or
60%
, to
$2.4 million
for the
year ended December 31, 2018
from
$1.5 million
for the
year ended December 31, 2017
. The increase is primarily attributable to the increase in Total Written Premium for
year ended December 31, 2018
compared to the
year ended December 31, 2017
.
Franchise Revenues
Franchise Revenues consist of Royalty Fees, Initial Franchise Fees, and interest income.
The following table sets forth our franchise revenues by amount and as a percentage of our revenues for the periods indicated (
in thousands
):
|
|
Year Ended December 31
|
||||||||||||
|
|
2018
|
2017
|
|||||||||||
|
New Business Royalty Fees
|
$
|
4,873
|
|
21
|
%
|
$
|
3,364
|
|
22
|
%
|
|||
|
Renewal Royalty Fees
|
12,104
|
|
53
|
%
|
7,704
|
|
50
|
%
|
|||||
|
Initial Franchise Fees
|
6,045
|
|
26
|
%
|
4,370
|
|
28
|
%
|
|||||
|
Franchise revenues
|
$
|
23,022
|
|
100
|
%
|
$
|
15,438
|
|
100
|
%
|
|||
Revenue from New Business Royalty Fees increased by
$1.5 million
, or
45%
, to
$4.9 million
for the
year ended December 31, 2018
from
$3.4 million
for the
year ended December 31, 2017
. The increase in revenue from New Business Royalty Fees was primarily attributable to an increase in the total number of operating franchises at
December 31, 2018
compared to
December 31, 2017
.
Revenue from Renewal Royalty Fees increase by
$4.4 million
, or
57%
, to
$12.1 million
, for the
year ended December 31, 2018
from
$7.7 million
for the
year ended December 31, 2017
. The increase in revenue from Renewal Royalty Fees was primarily attributable to an increase in the number of policies in the renewal term, and the higher Royalty Fee rate on renewal business compared to new business (50% vs. 20%, respectively).
Revenues from Initial Franchise Fees increased by
$1.7 million
, or
38%
, to
$6.0 million
for the
year ended December 31, 2018
from
$4.4 million
for the
year ended December 31, 2017
. The increase in revenue from Initial Franchise Fees was attributable to an increase in the total number of franchises that attended training for the
year ended December 31, 2018
compared to the
year ended December 31, 2017
.
Interest Income
Interest Income increased
$179 thousand
, or
74%
to
$422 thousand
for
2018
from
$243 thousand
for
2017
.
This increase was primarily attributable to additional Franchise Agreements signed under the payment plan option.
Expenses
Employee compensation and benefits
Employee compensation and benefits expenses increased by
$33.7 million
, or
137%
, to
$58.3 million
for
2018
from
$24.5 million
for
2017
. This was primarily attributable to a
$23.9 million
increase in Class B unit compensation (of which
$19.8 million
was non-cash vesting of certain Pre-IPO LLC members' equity), a
$949 thousand
increase in non-cash stock option expense and an increase in total headcount from
2017
to
2018
.
50
General and administrative expenses
General and administrative expenses increased by
$4.5 million
, or
52%
, to
$13.1 million
for
2018
from
$8.6 million
for
2017
. This increase was attributable to
$1.4 million
of expenses related to operating as a public company, an increase of
$832 thousand
in occupancy costs related to our first full year at the Company's new headquarters in Westlake, Texas. The remainder of the increase is attributable to higher costs associated with an increase in operating franchises and employees.
Bad debts
Bad debts increased by
$215 thousand
, or
20%
, to
$1.3 million
for
2018
from
$1.1 million
for
2017
. This increase was primarily attributable to increases in Agency Fees and Initial Franchise Fees sold by the company.
Depreciation and amortization
Depreciation and amortization increased by
$588 thousand
, or
67%
, to
$1.5 million
for
2018
from
$0.9 million
for
2017
. This increase was primarily attributable to the increase in fixed assets during the same period, including a full year of depreciation on the fixed assets put in place in connection with the opening of the Company's corporate headquarters in Westlake, Texas. Additionally, fixed assets increased with continued expansion in the Company's Chicago, Illinois and Henderson, Nevada offices.
Other income (expense)
During
2018
the Company incurred expenses of
$22 thousand
related to the disposal of fixed assets located in the previous headquarters, compared to other income of
$3.5 million
in
2017
. The
2017
other income was attributable to a buyout agreement executed with a Franchisee on June 1, 2017 per the terms of a Franchise Agreement from 2014. As part of the buyout, the departing Franchisee purchased Goosehead’s economic interests in future Royalty Fees. Goosehead recognized a
$3.5 million
gain on the transaction in June 2017.
Interest expense
Interest expenses increased by
$1.8 million
, or
72%
, to
$4.3 million
for
2018
from
$2.5 million
for
2017
. This increase was attributable to an increase in the average note payable amount outstanding throughout year, as well as
$871 thousand
of origination fees from previous debt immediately recognized upon refinance on
August 3, 2018
, partially offset by the Company refinancing the existing term loan with a lower interest rate.
Segment adjusted EBITDA
Corporate Channel Adjusted EBITDA is segment earnings before interest, income taxes, depreciation and amortization allocable to the Corporate Channel.
Corporate Channel Adjusted EBITDA increased by
$1.2 million
, or
18%
, to
$7.5 million
for
2018
from
$6.4 million
for
2017
, primarily attributable higher New Business Revenue (Corporate) from increased hiring and agent ramp-up, plus an increase in more profitable Renewal Revenue (Corporate), offset by employee compensation and benefits from increased hiring.
Franchise Channel Adjusted EBITDA is segment earnings before interest, income taxes, depreciation and amortization, adjusted to exclude other non-operating items.
Franchise Channel Adjusted EBITDA increased by
$3.9 million
, or
84%
, to
$8.6 million
for
2018
from
$4.7 million
for
2017
, primarily attributable to an increase in Initial Franchise Fees, New Business Revenue and Contingent Commissions (Franchise) from an increase in operating agencies and Total Written Premium, plus an increase in more profitable Renewal Revenue.
Neither of Franchise Channel Adjusted EBITDA or Corporate Channel Adjusted EBITDA includes Class B share compensation, which is recorded at the consolidated level.
Liquidity and capital resources
Historical liquidity and capital resources
We have managed our historical liquidity and capital requirements primarily through the receipt of revenues from our Corporate Channel and our Franchise Channel. Our primary cash flow activities involve: (1) generating cash
51
flow from Corporate Channel operations, which largely includes Renewal Revenue (Corporate) and New Business Revenue (Corporate); (2) generating cash flow from Franchise Channel operations, which largely includes Royalty Fees and Initial Franchise Fees; (3) making distributions to the Goosehead Management Holders and Texas Wasatch Holders; and (4) borrowings, interest payments and repayments under our Credit Agreement. As of
December 31, 2018
, our cash and cash equivalents was
$18.6 million
. We have used cash flow from operations primarily to pay compensation and related expenses, general, administrative and other expenses, debt service and distributions to our owners.
Credit agreement
On
October 27, 2016
, Goosehead Insurance Holdings, LLC, as borrower representative, entered into a credit agreement (as subsequently amended, the “Credit Agreement”) with Madison Capital Funding LLC, as agent, and the lenders party thereto, consisting of a
$3.0 million
revolving credit facility (the “Revolving Credit Facility”) and
$30.0 million
term loan (the “Initial Term Loan”) used to pay off existing debt and fund a distribution to members. On
July 14, 2017
, Goosehead Insurance Holdings, LLC and the other loan parties entered into the first amendment to the Credit Agreement pursuant to which Goosehead Insurance Holdings, LLC borrowed an additional
$10.0 million
term loan (the “First Additional Term Loan”) used to fund a distribution to members. On
December 20, 2017
, the Company executed the second amendment to the Credit Agreement to borrow an additional
$10.0 million
term loan (together with the Initial Term Loan and the First Additional Term Loan, the “Term Loans”) for payment of a dividend to stockholders and to extend the maturity date of the Term Loans by one year. On
April 4, 2018
, Goosehead Insurance Holdings, LLC and the other loan parties amended and restated the Credit Agreement to permit the reorganization transactions in connection with the Offering.
On
August 3, 2018
, Goosehead Insurance Holdings, LLC, as borrower, entered into a credit agreement (the “New
Credit Agreement”) with JPMorgan Chase Bank, N.A., as agent, and the lenders party thereto, consisting of a
$13.0 million
revolving credit facility (the “New Revolving Credit Facility”) and
$40.0 million
term loan (the “New
Term Loan”) used to refinance the Credit Agreement, working capital needs and general corporate purposes. The Company has the right, subject to approval by the administrative agent and each issuing bank, to increase the commitments under the credit facilities an additional
$50.0 million
.
Interest on amounts drawn under the New Revolving Credit Facility accrues interest on amounts drawn at an initial interest rate of LIBOR plus
2.50%
, then at an interest rate determined by the Company's leverage ratio for the preceding period. At
December 31, 2018
, the Company had
$10.0 million
drawn against the revolver. At
December 31, 2018
, the Company had a letter of credit of
$417 thousand
applied against the maximum borrowing availability, thus amounts available to draw totaled
$2.6 million
. The revolving credit facility is collateralized by substantially all the Company’s assets, which includes rights to future commissions.
Interest on the New Term Loan is calculated initially at LIBOR plus
2.50%
, then at an interest rate determined by the Company’s leverage ratio for the preceding period. The aggregate principal amount of the New Term Loan as of
December 31, 2018
is
$39.0 million
, payable in quarterly installments of (x)
$500 thousand
from the fiscal quarter ending
March 31, 2019
through the fiscal quarter ending
June 30, 2019
, (y)
$750 thousand
from the fiscal quarter ending
September 30, 2019
through the fiscal quarter ending
June 30, 2020
, and (z)
$1,250 thousand
from the fiscal quarter ending
September 30, 2020
through the fiscal quarter ending
June 30, 2021
, with a balloon payment of the entire unpaid principal amount of the term note on
August 3, 2021
.The New Term Loan is collateralized by substantially all the Company’s assets, which includes rights to future commissions.
The interest rate for each leverage ratio tier are as follows:
|
Leverage Ratio
|
Interest Rate
|
|
< 1.50x
|
LIBOR + 175.0 bps
|
|
> 1.50x
|
LIBOR + 200.0 bps
|
|
> 2.50x
|
LIBOR + 225.0 bps
|
|
> 3.50x
|
LIBOR + 250.0 bps
|
52
Maturities of note payable for the next three calendar years as of
December 31, 2018
are as follows
(in thousands)
:
|
|
Amount
|
|
|
|
2019
|
$
|
2,500
|
|
|
2020
|
4,000
|
|
|
|
2021
|
32,500
|
|
|
|
$
|
39,000
|
|
|
The
$10.0 million
drawn against the revolver is coterminous with the term loan and is due in full on
August 3, 2021
.
Loan origination fees of
$553 thousand
at
December 31, 2018
are reflected as a reduction to the note balance and will be amortized through interest expense over three years (the term of the note payable). As part of the refinancing,
$871 thousand
of origination fees from previous debt were immediately recognized as interest expense.
The New Credit Agreement contains covenants that, among other things, restrict our ability to make certain restricted payments (including a covenant that restricts Goosehead Financial, LLC’s ability to make dividends or other distributions to Goosehead Insurance, Inc.), incur additional debt, engage in certain asset sales, mergers, acquisitions or similar transactions, create liens on assets, engage in certain transactions with affiliates, change our business or make investments. We may voluntarily prepay in whole or in part the outstanding principal under our New Term Loans at any time prior to the maturity date. In addition, the New Credit Agreement contains financial covenants requiring us to maintain our fixed charge coverage ratio at or above 1.20 to 1.00 and total debt to EBITDA (as defined in the New Credit Agreement) ratio at or below 4.50 to 1.0 (with a step down to 4.00 to 1.00 with respect to any fiscal quarter ending on or after September 30, 2019). Pursuant to the New Credit Agreement, a change of control default will be triggered when (x) any person or group other than Mark Jones and Robyn Jones or their controlled investment affiliates becomes the beneficial owner, directly or indirectly, of more than 50% of the aggregate ordinary voting power represented by our outstanding equity interests, unless Mark Jones and Robyn Jones or their controlled investment affiliates have the ability to elect or designate for election at least a majority of our board of directors or (y) Goosehead Insurance, Inc. ceases to directly own at least 35% of Goosehead Financial, LLC or Goosehead Insurance, Inc. ceases to be the managing member of Goosehead Financial, LLC. Such a default could result in the acceleration of repayment of our and our subsidiaries’ indebtedness, including borrowings under the New Revolving Credit Facility if not waived by the lenders under the New Credit Agreement. The failure by Mark Jones and Robyn Jones to maintain either a minimum voting interest in us or the ability to elect or designate for election at least a majority of our board of directors could trigger a change of control default under our New Credit Agreement.
As of
December 31, 2018
, the Company was in compliance with these covenants.
Comparative cash flows
The following table summarizes our cash flows from operational, investing and financing activities for the periods indicated:
|
|
Year Ended December 31
|
||||||
|
|
2018
|
2017
|
|||||
|
Net cash provided by operating activities
|
$
|
10,275
|
|
$
|
13,542
|
|
|
|
Net cash used for investing activities
|
(2,180
|
)
|
(6,135
|
)
|
|||
|
Net cash provided by financing activities
|
5,592
|
|
(6,237
|
)
|
|||
|
Net increase in cash and cash equivalents
|
13,687
|
|
1,170
|
|
|||
|
Cash, beginning of period
|
4,948
|
|
3,778
|
|
|||
|
Cash, end of period
|
$
|
18,635
|
|
$
|
4,948
|
|
|
Operational activities
Net cash provided by operational activities was
$10.3 million
for
2018
as compared to net cash provided by operational activities of
$13.5 million
for
2017
. This decrease in net cash provided by operational activities was primarily attributable to a
$3.2 million
decrease in the year over year change in deferred rent balance driven by
53
tenant reimbursements at the Westlake, Texas headquarters during 2017, a
$0.7 million
change in commissions and agency fees receivable, and a
$0.1 million
change in accounts payable and accrued expenses balance.
Business investment activities
Net cash used in business investment activities was
$2.2 million
for
2018
as compared to net cash used in business investment activities of
$6.1 million
for
2017
. This decrease in net cash used in business investment activities was primarily attributable to fixed asset growth directly related to headcount increases, additional office space buildout in Chicago, Austin, and The Woodlands, and the buildout of the new headquarters in Westlake, Texas during the
2017
.
Financing activities
Net cash provided by financing activities was
$5.6 million
for
2018
as compared to net cash used in financing activities of
$6.2 million
for
2017
. This increase in net cash provided by financing activities is due to activity related to the Offering, during which
$86.8 million
was received as proceeds net of offering costs. This increase in net cash provided by financing activities is offset by an increase in distributions of
$54.5 million
. The remaining increase is attributable to the refinancing of the existing term loan and revolving credit facility, leading to an increase in repayments of notes payable of
$50.3 million
, offset by an increase in proceeds received from notes payable of
$30.0 million
.
Future sources and uses of liquidity
Our initial sources of liquidity will be (1) cash on hand, (2) net working capital, (3) cash flows from operations and (4) our Revolving Credit Facility. Based on our current expectations, we believe that these sources of liquidity will be sufficient to fund our working capital requirements and to meet our commitments in the foreseeable future.
We expect that our primary liquidity needs will comprise cash to (1) provide capital to facilitate the organic growth of our business, (2) pay operating expenses, including cash compensation to our employees, (3) make payments under the tax receivable agreement, (4) pay interest and principal due on borrowings under our Credit Agreement and (5) pay income taxes.
Dividend policy
Assuming Goosehead Financial, LLC makes distributions to its members in any given year, the determination to pay dividends, if any, to our Class A common stockholders out of the portion, if any, of such distributions remaining after our payment of taxes, tax receivable agreement payments and expenses (any such portion, an “excess distribution”) will be made at the sole discretion of our board of directors. Our board of directors may change our dividend policy at any time. See “Item 5. Market for Registrant’s Common Equity, Related Stockholder Matters and
Issuer Purchases of Equity Securities — Dividend policy".
Tax receivable agreement
We entered into a tax receivable agreement with the Pre-IPO LLC Members on May 1, 2018 that provides for the payment by us to the Pre-IPO LLC Members of 85% of the amount of cash savings, if any, in U.S. federal, state and local income tax or franchise tax that we actually realize as a result of (i) any increase in tax basis in Goosehead Insurance, Inc.’s assets and (ii) tax benefits related to imputed interest deemed arising as a result of payments made under the tax receivable agreement. See "Item 13. Certain relationships and related transactions, and director independence".
Holders of Goosehead Financial, LLC Units (other than Goosehead Insurance, Inc.) may, subject to certain conditions and transfer restrictions described above, redeem or exchange their LLC Units for shares of Class A common stock of Goosehead Insurance, Inc. on a one-for-one basis. Goosehead Financial, LLC intends to make an election under Section 754 of the Internal Revenue Code of 1986, as amended, and the regulations thereunder (the “Code”) effective for each taxable year in which a redemption or exchange of LLC Units for shares of Class A common stock occurs, which is expected to result in increases to the tax basis of the assets of Goosehead Financial, LLC at the time of a redemption or exchange of LLC Units. The redemptions or exchanges are expected to result in increases in the tax basis of the tangible and intangible assets of Goosehead Financial, LLC. These increases in tax basis may reduce the amount of tax that Goosehead Insurance, Inc. would otherwise be required to pay in the future. We have entered into a tax receivable agreement with the Pre-IPO LLC Members that provides for the payment by us to the Pre-IPO LLC Members of 85% of the amount of cash savings, if any, in U.S. federal, state and local income tax or franchise tax that we actually realize as a result of (i) any increase in tax basis in
54
Goosehead Insurance, Inc.’s assets resulting from (a) the purchase of LLC Units from any of the Pre-IPO LLC Members using the net proceeds from any future offering, (b) redemptions or exchanges by the Pre-IPO LLC Members of LLC Units for shares of our Class A common stock or (c) payments under the tax receivable agreement and (ii) tax benefits related to imputed interest deemed arising as a result of payments made under the tax receivable agreement. This payment obligation is an obligation of Goosehead Insurance, Inc. and not of Goosehead Financial, LLC. For purposes of the tax receivable agreement, the cash tax savings in income tax will be computed by comparing the actual income tax liability of Goosehead Insurance, Inc. (calculated with certain assumptions) to the amount of such taxes that Goosehead Insurance, Inc. would have been required to pay had there been no increase to the tax basis of the assets of Goosehead Financial, LLC as a result of the redemptions or exchanges and had Goosehead Insurance, Inc. not entered into the tax receivable agreement. Estimating the amount of payments that may be made under the tax receivable agreement is by its nature imprecise, insofar as the calculation of amounts payable depends on a variety of factors. While the actual increase in tax basis, as well as the amount and timing of any payments under the tax receivable agreement, will vary depending upon a number of factors, including the timing of redemptions or exchanges, the price of shares of our Class A common stock at the time of the redemption or exchange, the extent to which such redemptions or exchanges are taxable and the amount and timing of our income. See "Item 13. Certain relationships and related transactions, and director independence". We anticipate that we will account for the effects of these increases in tax basis and associated payments under the tax receivable agreement arising from future redemptions or exchanges as follows:
|
•
|
we will record an increase in deferred tax assets for the estimated income tax effects of the increases in tax basis based on enacted federal and state tax rates at the date of the redemption or exchange;
|
|
•
|
to the extent we estimate that we will not realize the full benefit represented by the deferred tax asset, based on an analysis that will consider, among other things, our expectation of future earnings, we will reduce the deferred tax asset with a valuation allowance; and
|
|
•
|
we will record 85% of the estimated realizable tax benefit (which is the recorded deferred tax asset less any recorded valuation allowance) as an increase to the liability due under the tax receivable agreement and the remaining 15% of the estimated realizable tax benefit as an increase to additional paid-in capital.
|
All of the effects of changes in any of our estimates after the date of the redemption or exchange will be included in net income. Similarly, the effect of subsequent changes in the enacted tax rates will be included in net income.
Contractual obligations, commitments and contingencies
The following table represents our contractual obligations as of
December 31, 2018
, aggregated by type.
|
|
Contractual obligations, commitments and contingencies
|
|||||||||||||
|
(in thousands)
|
Total
|
|
Less than 1 year
|
|
1-3 years
|
|
3-5 years
|
|
More than 5 years
|
|
||||
|
Operating leases
(1)
|
24,022
|
|
1,688
|
|
5,368
|
|
5,340
|
|
11,626
|
|
||||
|
Debt obligations payable
(2)
|
49,000
|
|
2,500
|
|
46,500
|
|
—
|
|
—
|
|
||||
|
Interest expense
(3)
|
5,986
|
|
2,319
|
|
3,667
|
|
—
|
|
—
|
|
||||
|
Liabilities under tax receivable agreement
(4)
|
1,702
|
|
8
|
|
185
|
|
192
|
|
1,317
|
|
||||
|
Total
|
80,710
|
|
6,515
|
|
55,720
|
|
5,532
|
|
12,943
|
|
||||
|
(1)
|
The Company leases its facilities under non-cancelable operating leases. In addition to monthly lease payments, the lease agreements require the Company to reimburse the lessors for its portion of operating costs each year. Rent expense was
$1.6 million
for year ending
December 31, 2018
and
$1.0 million
for the year ending
December 31, 2017
.
|
|
(2)
|
The Company refinanced its credit facilities on
August 3, 2018
in the form of a
$40.0 million
term loan and
$13.0 million
revolving credit facility, of which
$10.0 million
was drawn as of
December 31, 2018
. The refinancing decreased the Company's borrowing costs by a minimum of
300
bps and shortened the term loan maturity to
3
years.
|
|
(3)
|
Interest payments on our outstanding debt obligations under our credit agreement. Our debt obligations have variable interest rates. We have calculated future interest obligations based on the interest rate for our debt obligations as of
December 31, 2018
.
|
|
(4)
|
See "Item 7. Management's discussion and analysis of financial condition and results of operation - Tax receivable agreement."
|
Off-balance sheet arrangements
We do not invest in any off-balance sheet vehicles that provide liquidity, capital resources, market or credit risk support, or engage in any activities that expose us to any liability that is not reflected in our consolidated financial statements except for those described under “—Contractual obligations, commitments and contingencies” above.
55
Critical accounting policies
We prepare our consolidated financial statements in accordance with GAAP. In applying many of these accounting principles, we need to make assumptions, estimates or judgments that affect the reported amounts of assets, liabilities, revenues and expenses in our consolidated financial statements. We base our estimates and judgments on historical experience and other assumptions that we believe are reasonable under the circumstances. These assumptions, estimates or judgments, however, are both subjective and subject to change, and actual results may differ from our assumptions and estimates. If actual amounts are ultimately different from our estimates, the revisions are included in our results of operations for the period in which the actual amounts become known. We believe the following critical accounting policies could potentially produce materially different results if we were to change underlying assumptions, estimates or judgments. See “Item 8. Financial statements and supplementary data - Summary of significant accounting policies” for a summary of our significant accounting policies, and discussion of recent accounting pronouncements.
Revenue recognition
Commissions and fees
Commissions, fees and Contingent Commissions from Carriers, net of estimated cancellations, are recognized as revenue when the data necessary to reasonably determine such amounts is made available to the Company.
Because billing is controlled by the Carriers, these types of revenue cannot be reasonably determined until the cash or the related policy detail is received by the Company from the Carrier. Subsequent commission adjustments, such as endorsements and policy changes, are recognized when the adjustments become known. Agency Fees are recognized as revenue on the date coverage is agreed to with the client.
Franchise revenues
Franchise revenues include Initial Franchise Fees and ongoing Royalty Fees from Franchisees. Initial Franchise Fees are contracted fees paid by Franchisees to compensate Goosehead for direct training and onboarding costs, plus a markup for overhead and profit, as part of the initial launch of the franchise unit. The Initial Franchise Fee can either be paid up front at or before the Franchisee comes to training, or for a higher Initial Franchise Fee, paid over a term not to exceed five years.
Royalty Fees are a set percentage of commissions received from Franchisees for consideration of their use of such business processes, trade secrets, know-how, trade names, trademarks, service marks, logos, emblems, trade dress, intellectual property, and back office support functions provided by Goosehead. For policies in their first term, the Company receives 20% of the initial commission and Agency Fees collected; for renewal policies, the Company receives 50% of the Renewal Revenue collected.
Liabilities under Tax Receivable Agreement
In connection with the Offering we entered into a tax receivable agreement with the Pre-IPO LLC Members that will provide for the payment by us to the Pre-IPO LLC Members of 85% of the amount of cash savings, if any, in U.S. federal, state and local income tax or franchise tax that we actually realize as a result of (i) any increase in tax basis in Goosehead Financial, LLC’s assets resulting from (a) the acquisition of LLC Units using the net proceeds from any future offering, (b) redemptions or exchanges by the Pre-IPO LLC Members of LLC Units and the corresponding number of shares of Class B common stock for shares of our Class A common stock or (c) payments under the tax receivable agreement, and (ii) tax benefits related to imputed interest deemed arising as a result of payments made under the tax receivable agreement.
The actual increase in tax basis, as well as the amount and timing of any payments under the tax receivable agreement, will vary depending on a number of factors, including, but not limited to, the timing of any future redemptions, exchanges or purchases of the LLC Units held by Pre-IPO LLC Members, the price of our Class A common stock at the time of the purchase, redemption or exchange, the extent to which redemptions or exchanges are taxable, the amount and timing of the taxable income that we generate in the future, the tax rates then applicable and the portion of our payments under the tax receivable agreement constituting imputed interest.
During the
2018
, as a result of the redemption of LLC Units, we recognized liabilities totaling
$1.7 million
relating to our obligations under the Tax Receivable Agreement.
56
Emerging growth company
Pursuant to the JOBS Act, an emerging growth company is provided the option to adopt new or revised accounting standards that may be issued by FASB or the SEC either (i) within the same periods as those otherwise applicable to non-emerging growth companies or (ii) within the same time periods as private companies. We intend to continue to take advantage of the exemption for complying with new or revised accounting standards within the same time periods as private companies. Accordingly, the information contained herein may be different than the information you receive from other public companies.
We also intend to continue to take advantage of some of the reduced regulatory and reporting requirements of emerging growth companies pursuant to the JOBS Act so long as we qualify as an emerging growth company, including, but not limited to, not being required to comply with the auditor attestation requirements of Section 404(b) of the Sarbanes-Oxley Act, reduced disclosure obligations regarding executive compensation, and exemptions from the requirements of holding non-binding advisory votes on executive compensation and golden parachute payments.
Item 7A. Quantitative and qualitative disclosure of market risks
Market risk is the potential loss arising from adverse changes in market rates and prices, such as premium amounts, interest rates, and equity prices. We are exposed to market risk through our Book of Business and borrowings under our Credit Agreement.
Insurance premium pricing within the P&C insurance industry has historically been cyclical, based on the underwriting capacity of the insurance industry and economic conditions. External events, such as terrorist attacks, man-made and natural disasters, can also have significant impacts on the insurance market. We use the terms ‘‘soft market’’ and ‘‘hard market’’ to describe the business cycles experienced by the industry. A soft market is an insurance market characterized by a period of declining premium rates, which can negatively affect commissions earned by insurance agents. A hard market is an insurance market characterized by a period of rising premium rates, which, absent other changes, can positively affect commissions earned by insurance agents.
As of
December 31, 2018
, we had
$49.0 million
of borrowings outstanding under our Credit Agreement which bears interest on a floating basis tied to the London Interbank Offered Rate (LIBOR) and therefore subject to changes in the associated interest expense. The effect of an immediate hypothetical 10% change in interest rates would not have a material effect on our consolidated financial statements.
Item 8. Financial statements and supplementary data
Index to consolidated financial statements
|
|
Page
|
|
Goosehead Insurance, Inc.
|
|
|
Annual consolidated financial statements
|
|
|
Report of Independent Registered Public Accounting Firm
|
|
|
Consolidated balance sheets as of December 31, 2018 and December 31, 2017
|
|
|
Consolidated statements of income for the years ended December 31, 2018 and December 31, 2017
|
|
|
Consolidated statement of stockholders' equity for the years ended December 31, 2018 and December 31, 2017
|
|
|
Consolidated statement of cash flows for the years ended December 31, 2018 and December 31, 2017
|
|
|
Notes to the consolidated financial statements
|
|
57
Report of Independent Registered Public Accounting Firm
To the stockholders and the Board of Directors of Goosehead Insurance, Inc.
Opinion on the Financial Statements
We have audited the accompanying consolidated balance sheets of Goosehead Insurance, Inc. and subsidiaries (the "Company") as of December 31, 2018 and 2017, the related consolidated statements of income, stockholders’ equity, and cash flows, for each of the two years in the period ended December 31, 2018, and the related notes (collectively referred to as the "financial statements"). In our opinion, the financial statements present fairly, in all material respects, the financial position of the Company as of December 31, 2018 and 2017, and the results of its operations and its cash flows for each of the two years in the period ended December 31, 2018, in conformity with accounting principles generally accepted in the United States of America.
Basis for Opinion
These financial statements are the responsibility of the Company's management. Our responsibility is to express an opinion on the Company's financial statements based on our audits. We are a public accounting firm registered with the Public Company Accounting Oversight Board (United States) (PCAOB) and are required to be independent with respect to the Company in accordance with the U.S. federal securities laws and the applicable rules and regulations of the Securities and Exchange Commission and the PCAOB.
We conducted our audits in accordance with the standards of the PCAOB. Those standards require that we plan and perform the audit to obtain reasonable assurance about whether the financial statements are free of material misstatement, whether due to error or fraud. The Company is not required to have, nor were we engaged to perform, an audit of its internal control over financial reporting. As part of our audits, we are required to obtain an understanding of internal control over financial reporting but not for the purpose of expressing an opinion on the effectiveness of the Company’s internal control over financial reporting. Accordingly, we express no such opinion.
Our audits included performing procedures to assess the risks of material misstatement of the financial statements, whether due to error or fraud, and performing procedures that respond to those risks. Such procedures included examining, on a test basis, evidence regarding the amounts and disclosures in the financial statements. Our audits also included evaluating the accounting principles used and significant estimates made by management, as well as evaluating the overall presentation of the financial statements. We believe that our audits provide a reasonable basis for our opinion.
/s/ Deloitte & Touche LLP
Dallas, Texas
March 14, 2019
We have served as the Company’s auditor since 2017.
58
Goosehead Insurance, Inc.
Consolidated balance sheets
(In thousands, except per share amounts)
|
|
December 31
|
|||||||
|
|
2018
|
2017
|
||||||
|
Assets
|
||||||||
|
Current Assets:
|
||||||||
|
Cash and cash equivalents
|
$
|
18,635
|
|
$
|
4,948
|
|
||
|
Restricted cash
|
376
|
|
418
|
|
||||
|
Commissions and agency fees receivable, net
|
2,016
|
|
1,268
|
|
||||
|
Receivable from franchisees, net
|
703
|
|
564
|
|
||||
|
Prepaid expenses
|
1,109
|
|
521
|
|
||||
|
Total current assets
|
22,839
|
|
7,719
|
|
||||
|
Receivable from franchisees, net of current portion
|
2,048
|
|
1,361
|
|
||||
|
Property and equipment, net of accumulated depreciation
|
7,575
|
|
6,845
|
|
||||
|
Intangible assets, net of accumulated amortization
|
248
|
|
216
|
|
||||
|
Deferred income taxes, net
|
1,958
|
|
—
|
|
||||
|
Other assets
|
130
|
|
565
|
|
||||
|
Total assets
|
$
|
34,798
|
|
$
|
16,706
|
|
||
|
Liabilities and Stockholders’ Equity
|
|
|
|
|
||||
|
Current Liabilities:
|
|
|
|
|
||||
|
Accounts payable and accrued expenses
|
$
|
3,978
|
|
$
|
2,759
|
|
||
|
Premiums payable
|
376
|
|
418
|
|
||||
|
Unearned revenue
|
530
|
|
1,062
|
|
||||
|
Dividends payable
|
—
|
|
550
|
|
||||
|
Deferred rent
|
428
|
|
478
|
|
||||
|
Note payable
|
2,500
|
|
500
|
|
||||
|
Total current liabilities
|
7,812
|
|
5,767
|
|
||||
|
Deferred rent, net of current portion
|
4,548
|
|
3,916
|
|
||||
|
Note payable, net of current portion
|
45,947
|
|
48,156
|
|
||||
|
Liabilities under tax receivable agreement, net of current portion
|
1,694
|
|
—
|
|
||||
|
Total liabilities
|
60,001
|
|
57,839
|
|
||||
|
Commitments and contingencies (see note 9)
|
|
|
|
|
||||
|
Members’ deficit
|
—
|
|
(41,133
|
)
|
||||
|
Class A common stock, $.01 par value per share - 300,000 shares authorized, 13,800 shares issued and outstanding as of December 31, 2018, zero issued and outstanding as of December 31, 2017
|
138
|
|
—
|
|
||||
|
Class B common stock, $.01 par value per share - 50,000 shares authorized, 22,486 issued and outstanding as of December 31, 2018, zero issued and outstanding as of December 31, 2017
|
224
|
|
—
|
|
||||
|
Additional paid in capital
|
88,811
|
|
—
|
|
||||
|
Accumulated deficit
|
(6,578
|
)
|
—
|
|
||||
|
Total stockholders' equity and members' deficit
|
82,595
|
|
(41,133
|
)
|
||||
|
Non-controlling interests
|
(107,798
|
)
|
—
|
|
||||
|
Total equity
|
(25,203
|
)
|
(41,133
|
)
|
||||
|
Total liabilities and equity
|
$
|
34,798
|
|
$
|
16,706
|
|
||
See Notes to the Consolidated Financial Statements
59
Goosehead Insurance, Inc.
Consolidated statements of income
(In thousands, except per share amounts)
|
|
Year Ended December 31
|
|||||||
|
|
2018
|
2017
|
||||||
|
Revenues:
|
|
|
||||||
|
Commissions and agency fees
|
$
|
36,704
|
|
$
|
27,030
|
|
||
|
Franchise revenues
|
23,022
|
|
15,438
|
|
||||
|
Interest income
|
422
|
|
243
|
|
||||
|
Total revenues
|
60,148
|
|
42,711
|
|
||||
|
Operating Expenses:
|
|
|
||||||
|
Employee compensation and benefits (including Class B unit compensation of $26,134 and $2,231 for the years ended December 31, 2018 and 2017, respectively)
|
58,256
|
|
24,544
|
|
||||
|
General and administrative expenses
|
13,060
|
|
8,597
|
|
||||
|
Bad debts
|
1,298
|
|
1,083
|
|
||||
|
Depreciation and amortization
|
1,464
|
|
876
|
|
||||
|
Total operating expenses
|
74,078
|
|
35,100
|
|
||||
|
Income (loss) from operations
|
(13,930
|
)
|
7,611
|
|
||||
|
Other Income (Expense):
|
|
|
||||||
|
Other income (expense)
|
(22
|
)
|
3,541
|
|
||||
|
Interest expense
|
(4,266
|
)
|
(2,474
|
)
|
||||
|
Income (loss) before taxes
|
(18,218
|
)
|
8,678
|
|
||||
|
Tax expense
|
449
|
|
—
|
|
||||
|
Net Income (loss)
|
(18,667
|
)
|
8,678
|
|
||||
|
Less: net income (loss) attributable to non-controlling interests
|
(9,764
|
)
|
8,678
|
|
||||
|
Net Income (loss) attributable to Goosehead Insurance Inc.
|
$
|
(8,903
|
)
|
$
|
—
|
|
||
|
|
|
|
|
|
||||
|
Earnings per share:
|
|
|
|
|
||||
|
Basic
|
$
|
(0.66
|
)
|
n/a
|
|
|||
|
Diluted
|
$
|
(0.66
|
)
|
n/a
|
|
|||
|
Weighted average shares of Class A common stock outstanding
|
|
|
|
|
||||
|
Basic
|
13,554
|
|
n/a
|
|
||||
|
Diluted
|
13,554
|
|
n/a
|
|
||||
|
|
|
|
|
|
||||
|
Unaudited Pro forma income before taxes attributable to Goosehead Insurance, Inc.
|
n/a
|
|
$
|
3,242
|
|
|||
|
Unaudited Pro forma income tax expense
|
n/a
|
|
(811
|
)
|
||||
|
Unaudited Pro forma net income attributable to Goosehead Insurance, Inc.
|
n/a
|
|
$
|
2,431
|
|
|||
|
|
|
|
|
|
||||
|
Unaudited Pro forma earnings per share basic
|
n/a
|
|
$
|
0.18
|
|
|||
|
Unaudited Pro forma earnings per share diluted
|
n/a
|
|
$
|
0.17
|
|
|||
|
Unaudited Pro Forma Weighted average shares of Class A common stock outstanding
|
|
|
|
|
||||
|
Basic
|
n/a
|
|
13,554
|
|
||||
|
Diluted
|
n/a
|
|
14,573
|
|
||||
See Notes to the Consolidated Financial Statements
60
Goosehead Insurance, Inc.
Consolidated statement of stockholders’ equity
(In thousands)
|
|
Members' deficit
|
Issued shares of Class A common stock
|
Issued shares of Class B common stock
|
Class A Common stock
|
Class B Common Stock
|
Additional paid in capital
|
Accumulated deficit
|
Total stockholders' equity
|
Non-controlling interest
|
Total equity
|
|||||||||||||||||||||||||||
|
Balance, December 31, 2016
|
$
|
(24,241
|
)
|
—
|
|
—
|
|
$
|
—
|
|
$
|
—
|
|
$
|
—
|
|
$
|
—
|
|
$
|
—
|
|
$
|
—
|
|
$
|
(24,241
|
)
|
|||||||||
|
Net income
|
8,678
|
|
—
|
|
—
|
|
—
|
|
—
|
|
—
|
|
—
|
|
—
|
|
—
|
|
8,678
|
|
|||||||||||||||||
|
Capital withdrawn
|
(25,570
|
)
|
—
|
|
—
|
|
—
|
|
—
|
|
—
|
|
—
|
|
—
|
|
—
|
|
(25,570
|
)
|
|||||||||||||||||
|
Balance, December 31, 2017
|
(41,133
|
)
|
—
|
|
—
|
|
—
|
|
—
|
|
—
|
|
—
|
|
—
|
|
—
|
|
(41,133
|
)
|
|||||||||||||||||
|
Net income prior to the Reorganization Transactions
|
4,389
|
|
—
|
|
—
|
|
—
|
|
—
|
|
—
|
|
—
|
|
—
|
|
—
|
|
4,389
|
|
|||||||||||||||||
|
Distributions prior to the Reorganization Transactions
|
(1,278
|
)
|
—
|
|
—
|
|
—
|
|
—
|
|
—
|
|
—
|
|
—
|
|
—
|
|
(1,278
|
)
|
|||||||||||||||||
|
Balance prior to the Reorganization Transactions
|
(38,022
|
)
|
—
|
|
—
|
|
—
|
|
—
|
|
—
|
|
—
|
|
—
|
|
—
|
|
(38,022
|
)
|
|||||||||||||||||
|
Effects of the Reorganization Transactions
|
38,022
|
|
—
|
|
22,747
|
|
—
|
|
227
|
|
(132,202
|
)
|
(7,379
|
)
|
(139,354
|
)
|
(12,402
|
)
|
(113,734
|
)
|
|||||||||||||||||
|
Initial non-controlling interest allocation
|
—
|
|
—
|
|
—
|
|
—
|
|
—
|
|
97,071
|
|
—
|
|
97,071
|
|
(97,071
|
)
|
—
|
|
|||||||||||||||||
|
Issuance of Class A common stock sold in initial public offering, net of offering costs
|
—
|
|
13,533
|
|
—
|
|
135
|
|
—
|
|
123,875
|
|
—
|
|
124,010
|
|
—
|
|
124,010
|
|
|||||||||||||||||
|
Distributions subsequent to initial public offering
|
—
|
|
—
|
|
—
|
|
—
|
|
—
|
|
—
|
|
—
|
|
—
|
|
(1,735
|
)
|
(1,735
|
)
|
|||||||||||||||||
|
Net income subsequent to initial public offering
|
—
|
|
—
|
|
—
|
|
—
|
|
—
|
|
—
|
|
801
|
|
801
|
|
2,159
|
|
2,960
|
|
|||||||||||||||||
|
Equity-based compensation subsequent to initial public offering
|
—
|
|
—
|
|
—
|
|
—
|
|
—
|
|
949
|
|
—
|
|
949
|
|
—
|
|
949
|
|
|||||||||||||||||
|
Activity under employee stock purchase plan
|
—
|
|
5
|
|
—
|
|
—
|
|
—
|
|
143
|
|
—
|
|
143
|
|
—
|
|
143
|
|
|||||||||||||||||
|
Redemption of LLC Units
|
—
|
|
261
|
|
(261
|
)
|
3
|
|
(3
|
)
|
(1,251
|
)
|
—
|
|
(1,251
|
)
|
1,251
|
|
—
|
|
|||||||||||||||||
|
Deferred tax adjustments related to Tax Receivable Agreement
|
—
|
|
—
|
|
—
|
|
—
|
|
—
|
|
315
|
|
—
|
|
315
|
|
—
|
|
315
|
|
|||||||||||||||||
|
Deferred tax adjustments
|
—
|
|
—
|
|
—
|
|
—
|
|
—
|
|
(89
|
)
|
—
|
|
(89
|
)
|
—
|
|
(89
|
)
|
|||||||||||||||||
|
Balance December 31, 2018
|
$
|
—
|
|
13,799
|
|
22,486
|
|
$
|
138
|
|
$
|
224
|
|
$
|
88,811
|
|
$
|
(6,578
|
)
|
$
|
82,595
|
|
$
|
(107,798
|
)
|
$
|
(25,203
|
)
|
|||||||||
See Notes to the Consolidated Financial Statements
61
Goosehead Insurance, Inc.
Consolidated statements of cash flows
(In thousands)
62
|
|
Year Ended December 31
|
|||||||
|
|
2018
|
2017
|
||||||
|
Cash flows from operating activities:
|
|
|
||||||
|
Net income (loss)
|
$
|
(18,667
|
)
|
$
|
8,678
|
|
||
|
Adjustments to reconcile net income to net cash provided by operating activities:
|
|
|
||||||
|
Depreciation and amortization
|
2,522
|
|
876
|
|
||||
|
Loss on disposal of fixed assets
|
22
|
|
—
|
|
||||
|
Bad debt expense
|
1,298
|
|
1,083
|
|
||||
|
Equity based compensation
|
26,960
|
|
—
|
|
||||
|
Tax receivable agreement liability
|
1,702
|
|
—
|
|
||||
|
Deferred income taxes
|
(1,732
|
)
|
—
|
|
||||
|
Changes in operating assets and liabilities:
|
|
|
||||||
|
Commissions and agency fees receivable
|
(1,637
|
)
|
(907
|
)
|
||||
|
Receivable from franchisees
|
(1,258
|
)
|
(1,077
|
)
|
||||
|
Prepaid expenses
|
(588
|
)
|
(212
|
)
|
||||
|
Other assets
|
435
|
|
(471
|
)
|
||||
|
Accounts payable and accrued expenses
|
1,210
|
|
1,330
|
|
||||
|
Deferred rent
|
582
|
|
3,817
|
|
||||
|
Premiums payable
|
(42
|
)
|
118
|
|
||||
|
Unearned revenue
|
(532
|
)
|
307
|
|
||||
|
Net cash provided by operating activities
|
10,275
|
|
13,542
|
|
||||
|
Cash flows from investing activities:
|
|
|
||||||
|
Changes in restricted cash
|
42
|
|
(117
|
)
|
||||
|
Proceeds from member note receivable
|
—
|
|
135
|
|
||||
|
Proceeds from notes receivable
|
22
|
|
299
|
|
||||
|
Purchase of software
|
(148
|
)
|
(236
|
)
|
||||
|
Purchase of property and equipment
|
(2,096
|
)
|
(6,216
|
)
|
||||
|
Net cash used for investing activities
|
(2,180
|
)
|
(6,135
|
)
|
||||
|
Cash flows from financing activities:
|
|
|
||||||
|
Loan origination fees
|
(639
|
)
|
(342
|
)
|
||||
|
Repayment of note payable
|
(50,625
|
)
|
(375
|
)
|
||||
|
Proceeds from notes payable
|
50,000
|
|
20,000
|
|
||||
|
Proceeds from the issuance of Class A common stock, net of underwriting discounts and offering costs
|
86,915
|
|
—
|
|
||||
|
Member distributions
|
(80,059
|
)
|
(25,520
|
)
|
||||
|
Net cash provided by financing activities
|
5,592
|
|
(6,237
|
)
|
||||
|
Net increase in cash and cash equivalents
|
13,687
|
|
1,170
|
|
||||
|
Cash, beginning of period
|
4,948
|
|
3,778
|
|
||||
|
Cash, end of period
|
$
|
18,635
|
|
$
|
4,948
|
|
||
|
Supplemental disclosure of cash flow data:
|
|
|
|
|
||||
|
Non-cash management fee note repayment
|
37,237
|
|
—
|
|
||||
|
Cash paid during the year for interest
|
3,207
|
|
2,001
|
|
||||
|
Cash paid for income taxes
|
300
|
|
—
|
|
||||
63
Index to the notes to consolidated financial statements
|
Page
|
|
|
Goosehead Insurance, Inc.
|
|
|
Notes to the consolidated financial statements
|
|
|
Note 1. Organization
|
|
|
Note 2. Summary of significant accounting policies
|
|
|
Note 3. Franchise fees receivable
|
|
|
Note 4. Allowance for uncollectible agency fees
|
|
|
Note 5. Property and equipment
|
|
|
Note 6. Intangible assets
|
|
|
Note 7. Employee benefit obligation
|
|
|
Note 8. Note payable
|
|
|
Note 9. Commitments and contingencies
|
|
|
Note 10. Income taxes
|
|
|
Note 11. Stockholder's equity
|
|
|
Note 12. Equity-based compensation
|
|
|
Note 13. Other income
|
|
|
Note 14. Segment information
|
|
|
Note 15. Litigation
|
|
|
Note 16. Subsequent events
|
|
|
Note 17. Selected quarterly financial data (unaudited)
|
|
1. Organization
On May 1, 2018 Goosehead Insurance, Inc. ("GSHD") completed the Offering of
9,810 thousand
shares of Class A common stock at a price of
$10.00
per share, which included
1,280 thousand
shares issued pursuant to the underwriter's over-allotment option. GSHD became the sole managing member of Goosehead Financial, LLC (“GF”). GF was organized on January 1, 2016 as a Delaware Limited Liability Company and is headquartered in Westlake, TX. The operations of GF represent the predecessor to GSHD prior to the Offering, and the consolidated entities of GF are described in more detail below. Information for any periods prior to May 1, 2018 relates to GF and its subsidiaries and affiliates.
GSHD (collectively with its consolidated subsidiaries, the “Company”) provides personal and commercial property and casualty insurance brokerage services for its clients through a network of corporate-owned agencies and franchise units across the nation.
The operations of the corporate-owned units are recorded in Texas Wasatch Insurance Services, L.P. (“TWIS”)—a Texas limited partnership headquartered in Westlake, TX and operating since 2003. TWIS is a wholly owned subsidiary of GF. The Company had
seven
corporate-owned locations in operation at
December 31, 2018
and
2017
.
The operations of the franchise units are recorded in Goosehead Insurance Agency, LLC (“GIA”)—a Delaware limited liability company headquartered in Westlake, TX and operating since 2011. GIA is
100%
owned by Goosehead Insurance Holdings ("GIH"). Franchisees are provided access to insurance Carrier Appointments, product training, technology infrastructure, client service centers and back office services. During
years ended December 31, 2018 and 2017
, the Company sold
214
and
140
franchise locations, respectively and had
457
and
292
operating franchise locations as of
December 31, 2018
and
2017
, respectively. No franchises were purchased by the Company during the
years ended December 31, 2018 and 2017
.
64
In connection with the Offering, both Goosehead Management, LLC (“GM”) and Texas Wasatch Insurance Holdings Group LLC (“TWIHG”) became wholly owned indirect subsidiaries of GF. Both GM and TWIHG are non-operating holding companies created to receive management fees from the operating entities TWIS and GIA.
All intercompany accounts and transactions have been eliminated in consolidation.
Reorganization Transactions
In connection with the Offering, the Company completed the following transactions (the "Reorganization Transactions"):
|
•
|
The GF limited liability company agreement was amended to, among other things, i) appoint GSHD as the sole managing member of GF and ii) modify the capital structure of GF by reclassifying the interests previously held by Pre-IPO LLC Members into a single new class of non-voting LLC Units.
|
|
•
|
GSHD was authorized to issue
two
classes of common stock.
9,810 thousand
shares of Class A common stock were issued pursuant to the Offering, including the underwriters' over-allotment option.
22,747 thousand
shares of Class B common stock were issued to the Pre-IPO LLC Members in an amount equal to the number of LLC Units held by each such Pre-IPO LLC Member in exchange for certain management rights of GF. Each share of Class A common stock and Class B common stock entitles its holder to
one
vote per share on all matters submitted to a vote of GSHD's stockholders. Each share of Class B common stock can be exchanged for
one
share of Class A common stock or, at GSHD's discretion, a cash payment equal to the volume weighted average market price of one share of Class A common stock, thus canceling the share of Class B common stock on a
one
-for-one basis.
|
|
•
|
The Goosehead Management Holders and Texas Wasatch Holders indirectly transferred their ownership interests in GM and TWIHG, respectively, to GSHD in exchange for the Goosehead Management Note and Texas Wasatch Note. The aggregate principal amount of the Goosehead Management Note and the Texas Wasatch Note was approximately
$114 million
. Because the net proceeds from the Offering were insufficient to repay the aggregate principal amount of the notes,
3,724 thousand
shares of Class A common stock were issued to the Goosehead Management Holders and the Texas Wasatch Holders for the difference. GSHD contributed direct and indirect ownership interests in each of TWIHG and GM to GF.
|
Following completion of the Reorganization Transactions and the Offering, GSHD owned
37.3%
of GF and the Pre-IPO LLC Members owned the remaining
62.7%
. GSHD is the sole managing member of GF and, although GSHD holds a minority economic interest in GF, GSHD has the sole voting power and control of management of GF. Accordingly, GSHD consolidates the financial results of GF and reports non-controlling interest in GSHD's consolidated financial statements.
2. Summary of significant accounting policies
Use of Estimates
The preparation of financial statements in conformity with GAAP requires management to make estimates and assumptions that affect the reported amounts of assets and liabilities, disclosure of contingent liabilities at the date of the financial statements, and the reported amounts of revenues and expenses during the reported period. Accordingly, actual results could differ from those estimates as more information becomes known.
Cash and cash equivalents
The Company maintains its cash in bank deposit accounts that, at times, may exceed federally insured limits; however, the Company has not historically experienced any losses in these accounts. The Company believes it is not exposed to any significant credit risk. The Company currently holds no financial instruments that would be considered cash equivalents.
Restricted cash
65
In the capacity as an insurance broker, the Company will typically collect the first premium payment from the insured and will then remit the premiums to insurance carriers. The Company holds unremitted insurance premiums in a fiduciary capacity until they are disbursed.
Commissions and agency fees receivable
Upon issuance of a new policy, the Company typically collects the first premium payment from the insured, and then will remit the full premium amount to the insurance carriers. The insurance carriers collect the remaining premiums directly from the insureds and remit the applicable commissions to the Company. Accordingly, as reported in the accompanying consolidated balance sheet, “commissions” are receivables from the insurance carriers. These direct-bill arrangements consist of a high volume of transactions with small premium amounts, with the billing controlled by the insurance carriers. The income statement and balance sheet effects of the commissions are recorded when collectability can be reasonably assured and determined from the commission statement and the commission payment received from the insurance carriers. The payment and commission statements are generally received within 30 days of the effective date of the policy. During
2018
, the Company wrote with
85
insurance carriers, of which
30
provided national coverage. In
2018
,
two
carriers represented more than 10% of total revenue at
17%
and
11%
. In
2017
,
three
carriers represented more than 10% of total revenue at
18%
,
15%
and
11%
.
In select states, agents have the option to charge an agency fee for the placement of the insurance policy. The income statement and balance sheet effect of these non-refundable fees are recorded on the date the policy is placed with the insurance carrier.
Reserve for Policy Cancellations
Management establishes the policy cancellation reserve based on historical and current data on cancellations and records commissions and agency fees receivable net of the cancellations reserve. The reserve was
$386 thousand
and
$337 thousand
at
December 31, 2018
and
2017
, respectively.
Allowance for uncollectible agency fees
The Company records agency fees receivable net of an allowance for estimated uncollectible accounts to reflect any loss anticipated for the related agency fees receivable balances and charge to bad debts. The agency fees receivable balance consists of numerous small-balance, homogenous accounts. The Company calculates the allowance based on collection history and writes off all uncollected agency fee balances outstanding over ninety days.
Receivable from franchisees
Receivable from franchisees consists of franchise fees receivable, net of allowance for uncollectible franchise fees and unamortized discount on franchise fees, royalty fees receivable, and notes receivable from franchisees.
Franchise fees receivable
When a franchisee concludes training and all material services and conditions related to the fee have been substantially performed, revenue is recorded as franchise fees within Franchise revenues, and a corresponding entry to Franchise fees receivable is recorded. Franchisees have the option to pay the full amount of franchise fees up front or to pay a deposit up front and the remaining balance by payment plan over time. The franchisees that elect to pay the initial franchise fee over a term extending greater than one year, pay in total an amount that exceeds the amount due had they paid the full amount up front. As such, the payment plan option is treated as a zero-interest rate note, which creates an imputation of interest. The imputed interest is recorded as a discount on the franchise fee receivable and amortized using the interest rate method over the life of the payment plan. The amount of interest recorded in
2018
and
2017
related to franchise fees on a payment plan was
$418 thousand
and
$231 thousand
, respectively, and is included in Interest income.
Allowance for uncollectible franchise fees receivable
66
The Company records franchise fees receivable net of an allowance for estimated uncollectible accounts to reflect any loss anticipated related to the franchise fees receivable balances and charged to bad debts. The franchise fees receivable balance consists of numerous small-balance, homogenous accounts. The Company calculates the allowance based on our history of write offs for all franchise accounts. Franchise fees receivable and the related allowance is written off once the franchisee owing the balance terminates.
Royalty fees receivable
The Company collects and reconciles commissions and agency fees on behalf of the franchisees, then calculates the Company’s royalty fees. Royalty fees are recorded monthly when the amounts can be determined from the carrier commission statements reconciled by the Company. The royalty fees are secured by the commissions of the franchisee with no historical losses incurred for uncollectible royalty fees. As such, there is no allowance for doubtful accounts relating to royalty fees.
Property & equipment
The Company carries fixed assets at cost, less accumulated depreciation, as stated in the accompanying consolidated balance sheets. Depreciation of property and equipment is calculated using the straight-line method over the estimated useful life of
five years
for furniture, fixtures and equipment and
three years
for computer equipment. Leasehold improvements are also amortized using the straight-line method and are amortized over the shorter of the remaining term of the lease or the useful life of the improvement. Expenditures for improvements are capitalized, and expenditures for maintenance and repairs are expensed as incurred. Upon sale or retirement, the cost and related accumulated depreciation and amortization is removed from the related accounts, and the resulting gain or loss, if any, is reflected in income.
Intangible assets
Intangible assets are stated at cost less accumulated amortization and reflect amounts paid for the Company’s web domain and computer software costs. The web domain is amortized over a useful life of
fifteen years
and software costs are amortized over a useful life of
three years
.
Capitalized IPO Related Costs
In connection with the Offering, the Company incurred costs which were recorded in other assets on the consolidated balance sheets. Upon completion of the Offering, these deferred costs were charged against the proceeds from the Offering with a corresponding reduction to additional paid-in capital. There were
$0
and
$170 thousand
of IPO related costs included in other assets at
December 31, 2018
and
2017
, respectively.
Premiums payable
Premiums payable represent premium payments that have been received from insureds, but not yet remitted to the insurance carriers.
Unearned revenue
When the Company collects initial franchise fees prior to the franchisee being trained and fully on boarded, the amount collected is recognized as unearned revenue until the Company fulfills its performance obligation and is able to recognize the revenue.
Deferred financing costs
Deferred financing costs incurred in connection with the issuance of notes payable are capitalized and amortized to interest expense in accordance with the related debt agreements. Deferred financing costs are included as a reduction in notes payable on the accompanying consolidated balance sheets.
67
Deferred rent
Deferred rent consists of rent abatement affecting the timing of cash rent payments related to the Company’s corporate office leases, as well as lease incentives such as construction allowances. Deferred rent is record as a liability and is amortized over the lease term as a reduction to rent expense.
Revenue recognition
Commissions and fees
Commissions and contingent commissions from insurance carriers, net of estimated cancellations, are recognized as revenue when the data necessary to reasonably determine such amounts is made available to the Company. Billing is controlled by the insurance carriers, therefore these types of revenue cannot be reasonably determined until the cash or the related policy detail is received by the Company from the insurance carrier. Subsequent commission adjustments, such as endorsements and policy changes, are recognized when the adjustments become known. Agency Fees are recognized as revenue on the date coverage is agreed upon with the client and placed with the Carrier.
Franchise revenues
Franchise revenues include initial franchise fees and ongoing royalty fees from franchisees. Initial franchise fees are contracted fees paid by franchisees to compensate Goosehead for direct training and onboarding costs, plus a markup for overhead and profit, as part of the initial launch of the franchise unit. The initial franchise fee can either be paid up front, at or before the franchisee comes to training, or for a higher initial franchise fee, paid over a term not to exceed
five years
. Initial franchise fees are recognized as revenue in the month the agency owner or initial agency representative attends training, which is the time in which Goosehead’s performance obligations are substantially complete. Initial franchise fee revenue was
$6.0 million
and
$4.4 million
for the years ended
December 31, 2018
and
2017
, respectively.
Royalty fees are a set percentage of commissions received from franchisees for consideration of their use of such business processes, trade secrets, know-how, trade names, trademarks, service marks, logos, emblems, trade dress, intellectual property, and back office support functions provided by Goosehead. For policies in their first term, the Company receives
20%
of the initial commission and agency fees collected; for renewal policies, the Company receives
50%
of the renewal commission collected. Royalty fees are recognized as revenue as earned and as the amounts become determinable by the Company. Royalty fee revenue was
$17.0 million
and
$11.1 million
for the years ended
December 31, 2018
and
2017
, respectively. Employees who also own franchises paid
$498 thousand
in royalty fees in
2018
comprising approximately
3%
of total royalty revenue.
Income Taxes
Prior to the Offering, GF was treated as a partnership for U.S. federal and applicable state and local income tax purposes. As a partnership, GF's taxable income or loss was included in the taxable income of its members. Accordingly, no income tax expense was recorded for federal and state and local jurisdictions for periods prior to the Offering.
In connection with the Offering completed on May 1, 2018, the Company became a taxable entity.
The Company accounts for income taxes pursuant to the asset and liability method which requires the recognition of deferred income tax assets and liabilities related to the expected future tax consequences arising from temporary differences between the carrying amounts and tax bases of assets and liabilities based on enacted statutory tax rates applicable to the periods in which the temporary differences are expected to reverse. Any effects of changes in income tax rates or laws are included in income tax expense in the period of enactment.
Advertising
68
The Company expenses advertising costs as they are incurred. Advertising expense for the years ended
December 31, 2018
and
2017
was
$521 thousand
and
$270 thousand
.
Recently issued accounting pronouncements
Statement of Cash Flows (ASU 2016-18)
: This standard requires that the Statement of Cash Flows explain the changes during the period of cash and cash equivalents inclusive of amounts categorized as Restricted Cash. As such, upon adoption, the Company’s consolidated statement of cash flows will show the sources and uses of cash that explain the movement in the balance of cash and cash equivalents, inclusive of restricted cash, over the period presented. As an emerging growth company (“EGC”), the standard will become effective for the Company January 1, 2019. The Company does not expect that this standard will have a material impact on the Company's Statement of Cash Flows.
Statement of Cash Flows (ASU 2016-15)
: This standard addresses eight specific cash flow issues with the objective of reducing the existing diversity in practice in how certain cash receipts and cash payments are presented and classified and applies to all entities, including both business entities and not-for-profit entities that are required to present a statement of cash flows under Topic 230. The standard will become effective for the Company on January 1, 2019. The Company has evaluated the impact of ASU 2016-15 and has determined the impact to be immaterial. The Company does not, at this time, engage in the activities being addressed by the standard.
Revenue from Contracts with Customers (ASU 2014-09)
: This standard supersedes the existing revenue recognition guidance and provides a new framework for recognizing revenue. The core principle of the standard is that an entity should recognize revenue to depict the transfer of promised goods or services to customers in an amount that reflects the consideration to which the entity expects to be entitled in exchange for those goods and services. The new standard also requires significantly more comprehensive disclosures than the existing standard. Guidance subsequent to ASU 2014-09 has been issued to clarify various provisions in the standard, including principal versus agent considerations, identifying performance obligations, licensing transactions, as well as various technical corrections and improvements. This standard may be adopted using either a retrospective or modified retrospective method. According to the superseding standard ASU 2015-14 that deferred the effective dates of the preceding, and because the Company is filing as an emerging growth company, the standard became effective for the Company January 1, 2019, but the Company is not required to present the impacts of the standard until it files its annual report on Form 10-K for the fiscal year ended December 31, 2019. The Company will continue to refine throughout 2019 the impact this standard is will have on the consolidated financial statements and expects to adopt the modified retrospective method. The primary anticipated impacts of the new standard to the Company's revenues and expenses are as follows:
Under the new guidance, the Company expects commission revenues will be recognized at the effective date of the policy, which will accelerate some revenues. Currently, commissions from insurance carriers, net of estimated cancellations, are recognized as revenue when the data necessary to reasonably determine such amounts is made available to the Company. For contingent commissions, the Company anticipates revenues will be estimated and recorded throughout the year as the underlying business is placed with the insurance carriers as opposed to the Company's historical recognition when the Company received cash, the related policy detail, or other carrier specific information from the insurance carrier, typically in the first quarter of the following year. The effect of this change will result in revenue being recognized more evenly throughout the year.
Franchise revenues, including franchise fees are also likely to change under the new guidance. Currently, initial franchise fees are recognized as revenue in the month the agency owner or initial agency representative attends training. Under the new guidance, the Company anticipates these revenues will likely be recognized over the contract term, typically 10 years.
The Company also expects to recognize an asset for the costs to obtain and/or fulfill a contract and to amortize on a systematic basis that is consistent with the transfer of the services to which the asset relates.
Leases (ASU 2016-02)
: This standard establishes a new lease accounting model, which introduces the recognition of lease assets and liabilities for those leases classified as operating leases under previous GAAP. It should be applied using a modified retrospective approach, with the option to elect various practical expedients. Early
69
adoption is permitted. The standard will become effective for the Company January 1, 2020. The Company is currently evaluating the impact this standard will have on the Company's consolidated financial statements. However we expect the impact of this guidance on our consolidated financial statements could be significant, as our future minimum operating lease commitments totaled
$24.0 million
as of
December 31, 2018
.
3. Franchise fees receivable
The balance of Franchise fees receivable included in Receivable from franchisees in the consolidated balance sheets consisted of the following
(in thousands)
:
|
December 31
|
|||||||
|
2018
|
|
2017
|
|
||||
|
Franchise fees receivable
|
$
|
3,906
|
|
$
|
2,501
|
|
|
|
Less: Unamortized discount
|
(1,381
|
)
|
(823
|
)
|
|||
|
Less: Allowance for uncollectible franchise fees
|
(455
|
)
|
(335
|
)
|
|||
|
|
$
|
2,070
|
|
$
|
1,343
|
|
|
Activity in the allowance for uncollectible franchise fees was as follows
(in thousands)
:
|
Allowance for Uncollectible Franchise Fees:
|
|||
|
Balance at January 1, 2017
|
$
|
193
|
|
|
Charges to bad debts
|
434
|
|
|
|
Write offs
|
(292
|
)
|
|
|
Balance at December 31, 2017
|
$
|
335
|
|
|
Charges to bad debts
|
409
|
|
|
|
Write offs
|
(289
|
)
|
|
|
Balance at December 31, 2018
|
$
|
455
|
|
4. Allowance for uncollectible agency fees
Activity in the allowance for uncollectible agency fees was as follows:
|
Allowance for Uncollectible Agency Fees:
|
|||
|
Balance at January 1, 2017
|
$
|
167
|
|
|
Charges to bad debts
|
649
|
|
|
|
Write offs
|
(634
|
)
|
|
|
Balance at December 31, 2017
|
$
|
182
|
|
|
Charges to bad debts
|
889
|
|
|
|
Write offs
|
(829
|
)
|
|
|
Balance at December 31, 2018
|
$
|
242
|
|
5. Property and equipment
Property and equipment consisted of the following at:
70
|
December 31
|
|||||||
|
2018
|
2017
|
||||||
|
Furniture & fixtures
|
$
|
2,233
|
|
$
|
1,977
|
|
|
|
Computer equipment
|
1,023
|
|
662
|
|
|||
|
Network equipment
|
252
|
|
242
|
|
|||
|
Phone system
|
824
|
|
710
|
|
|||
|
Leasehold improvements
|
6,692
|
|
5,788
|
|
|||
|
Total
|
11,024
|
|
9,379
|
|
|||
|
Less accumulated depreciation
|
(3,449
|
)
|
(2,534
|
)
|
|||
|
Property and equipment, net
|
$
|
7,575
|
|
$
|
6,845
|
|
|
Depreciation expense was
$1.3 million
and
$810 thousand
for the
years ended December 31, 2018 and 2017
, respectively.
6. Intangible assets
Intangible assets consisted of the following:
|
December 31
|
Weighted average amortization period (years)
|
||||||||
|
2018
|
|
2017
|
|
||||||
|
Computer software & web domain
|
$
|
679
|
|
$
|
530
|
|
3.18
|
||
|
Less accumulated amortization
|
(431
|
)
|
(314
|
)
|
|||||
|
Intangible assets, net
|
$
|
248
|
|
$
|
216
|
|
|||
Amortization expense was
$117 thousand
and
$66 thousand
for the
years ended December 31, 2018 and 2017
, respectively.
Expected amortization over the next five years is as follows:
|
Amount
|
|
||
|
Year Ending December 31,
|
|||
|
2019
|
$
|
132
|
|
|
2020
|
92
|
|
|
|
2021
|
21
|
|
|
|
2022
|
2
|
|
|
|
2023 and thereafter
|
1
|
|
|
|
Total
|
$
|
248
|
|
7. Employee benefit obligation
The Company has adopted a qualified deferred compensation plan under section 401(k) of the Internal Revenue Code. Full-time employees over the age of
21
with
six months
of service are eligible to participate. Under the plan, the Company’s contribution is based on a discretionary matching of
100%
of salary deferral elected by each eligible employee up to a maximum of
3%
of compensation. The Company’s matching portion vests over a
four
-year period, after which time the employee becomes fully vested and all future contributions will vest immediately.
Matching contributions may be changed at the discretion of the Company. Company contributions totaled
$529 thousand
and
$373 thousand
for the years ended
years ended December 31, 2018 and 2017
.
71
8. Note payable
On
August 3, 2018
, the Company refinanced its
$3.0 million
revolving credit facility and
$50.0 million
term note payable to a
$13.0 million
revolving credit facility and
$40.0 million
term note payable in order to obtain a more favorable interest rate on the outstanding debt. The Company has the right, subject to approval by the administrative agent and each issuing bank, to increase the commitments under the credit facilities an additional
$50.0 million
. The Company treated the refinancing as an extinguishment of the existing debt.
The
$13.0 million
revolving credit facility accrues interest on amounts drawn at an initial interest rate of LIBOR plus
2.5%
, then at an interest rate determined by the Company's leverage ratio for the preceding period. At
December 31, 2018
, the Company had
$10.0 million
drawn against the revolver. At
December 31, 2018
, the Company had a letter of credit of
$417 thousand
applied against the maximum borrowing availability, thus amounts available to draw totaled
$2.6 million
. The revolving credit facility is collateralized by substantially all the Company’s assets, which includes rights to future commissions. Interest payment on the revolving credit facility totaled
$198 thousand
for the
year ended December 31, 2018
.
The
$40.0 million
term note accrues interest at an initial interest rate of LIBOR plus
2.50%
, then at an interest rate determined by the Company's leverage ratio for the preceding period. As of
December 31, 2018
, the Company was in the greater than
2.50
x leverage ratio tranche, accruing interest of LIBOR plus
2.25%
. The aggregate principal amount of the term note as of
December 31, 2018
is
$39.0 million
, payable in quarterly installments of (x)
$500 thousand
from the fiscal quarter ending
March 31, 2019
through the fiscal quarter ending
June 30, 2019
, (y)
$750 thousand
from the fiscal quarter ending
September 30, 2019
through the fiscal quarter ending
June 30, 2020
, and (z)
$1.3 million
from the fiscal quarter ending
September 30, 2020
through the fiscal quarter ending
June 30, 2021
, with a balloon payment of the entire unpaid principal amount of the term note on
August 3, 2021
.The term note is collateralized by substantially all the Company’s assets, which includes rights to future commissions.
The interest rate for each leverage ratio tier are as follows:
|
Leverage Ratio
|
Interest Rate
|
|
< 1.50x
|
LIBOR + 175.0 bps
|
|
> 1.50x
|
LIBOR + 200.0 bps
|
|
> 2.50x
|
LIBOR + 225.0 bps
|
|
> 3.50x
|
LIBOR + 250.0 bps
|
Maturities of the term note payable for the next three calendar years as of
December 31, 2018
are as follows
(in thousands)
:
|
|
Amount
|
|
|
|
2019
|
2,500
|
|
|
|
2020
|
4,000
|
|
|
|
2021
|
32,500
|
|
|
|
$
|
39,000
|
|
|
The
$10.0 million
drawn against the revolver is coterminous with the term loan and is due in full on
August 3, 2021
.
Loan origination fees of
$553 thousand
at
December 31, 2018
are reflected as a reduction to the note balance and will be amortized through interest expense over
three years
(the term of the note payable). As part of the refinancing,
$871 thousand
of origination fees from previous debt were immediately recognized as interest expense.
The Company’s note payable agreement contains certain restrictions and covenants. Under these restrictions, the Company is limited in the amount of debt incurred and distributions payable. In addition, the credit agreement contains certain change of control provisions that, if broken, would trigger a default. Finally, the Company must maintain certain financial ratios. As of
December 31, 2018
, the Company was in compliance with these covenants.
72
Because of both instruments’ origination date and variable interest rate, the note payable balance at
December 31, 2018
and
December 31, 2017
, approximates fair value using Level 2 inputs, described below.
The framework for measuring fair value provides a fair value hierarchy that prioritizes the inputs to valuation techniques used to measure fair value. The hierarchy gives the highest priority to unadjusted quoted prices in active markets for identical assets or liabilities (level 1 measurements) and the lowest priority to unobservable inputs (level 3 measurements). The three levels of the fair value hierarchy are described as follows:
|
•
|
Level 1—Unadjusted quoted prices in active markets that are accessible at the measurement date for identical, unrestricted assets.
|
|
•
|
Level 2—Significant other observable inputs other than Level 1 prices such as quoted prices in markets that are not active, quoted prices for similar assets or other inputs that are observable, either directly or indirectly, for substantially the full term of the asset.
|
|
•
|
Level 3—Significant unobservable inputs that reflect a reporting entity’s own assumptions about the assumptions that market participants would use in pricing an asset or liability.
|
The asset or liability’s fair value measurement level within the fair value hierarchy is based on the lowest level of any input that is significant to the fair value measurement. The valuation techniques used need to maximize the use of observable inputs and minimize the use of unobservable inputs.
9. Commitments and contingencies
The Company leases its facilities under non-cancelable operating leases. In addition to monthly lease payments, the lease agreements require the Company to reimburse the lessors for its portion of operating costs each year. Rent expense was
$1.6 million
and
$1.0 million
for the years ended
December 31, 2018
and
2017
.
The following is a schedule of future minimum lease payments as of
December 31, 2018
:
|
|
Amount
|
|
|
|
Year ending December 31:
|
|||
|
2019
|
$
|
1,688
|
|
|
2020
|
2,575
|
|
|
|
2021
|
2,793
|
|
|
|
2022
|
2,762
|
|
|
|
2023
|
2,578
|
|
|
|
2024-2029
|
11,626
|
|
|
|
$
|
24,022
|
|
|
10. Income taxes
As a result of the Reorganization Transactions and the Offering, GSHD became the sole managing member of GF, which is treated as a partnership for U.S. federal and most applicable state and local income tax purposes. As a partnership, GF is not subject to U.S. federal and certain state and local income taxes. Any taxable income or loss generated by GF is passed through to and included in the taxable income or loss of its members, including GSHD, on a pro rata basis. GSHD is subject to U.S. federal income taxes, in addition to state and local income taxes, with respect to GSHD's allocable share of income of GF.
Income tax expense
A reconciliation of income tax expense computed at the U.S. federal statutory income tax rate to the income tax expense recognized is as follows
(in thousands)
:
73
|
Year Ended December 31
|
|||||||
|
2018
|
2017
|
||||||
|
Income (loss) before taxes
|
$
|
(18,218
|
)
|
$
|
8,678
|
|
|
|
Less: (income) prior to the Reorganization Transactions
|
(4,389
|
)
|
(8,678
|
)
|
|||
|
Income (loss) before taxes
|
$
|
(22,607
|
)
|
$
|
—
|
|
|
|
Income taxes at U.S. federal statutory rate
|
$
|
(4,747
|
)
|
—
|
|
||
|
Tax on income not subject to entity level federal income tax
|
(544
|
)
|
—
|
|
|||
|
Permanent Differences:
|
|
||||||
|
Non-controlling interest
|
3,536
|
|
—
|
|
|||
|
Non-deductible stock compensation costs
|
2,038
|
|
—
|
|
|||
|
Non-deductible excess compensation
|
27
|
|
—
|
|
|||
|
Meals & Entertainment
|
38
|
|
—
|
|
|||
|
State income tax, net of federal benefit
|
99
|
|
—
|
|
|||
|
Other Reconciling items:
|
|||||||
|
Other
|
2
|
|
—
|
|
|||
|
Income tax expense
|
$
|
449
|
|
$
|
—
|
|
|
Deferred tax assets and liabilities
The components of deferred tax assets are as follows (
in thousands
):
|
December 31, 2018
|
December 31, 2017
|
|||||
|
Investment in flow-through entity
|
$
|
1,958
|
|
—
|
|
|
|
Net deferred tax asset
|
$
|
1,958
|
|
$
|
—
|
|
Uncertain tax positions
GSHD has determined there are
no
material uncertain tax positions as of
December 31, 2018
.
Tax Receivable Agreement
GF intends to make an election under Section 754 of the Internal Revenue Code of 1986, as amended, and the regulations thereunder (the “Code”) effective for each taxable year in which a redemption or exchange of LLC Units and corresponding Class B common stock for shares of Class A common stock occurs. Future taxable redemptions or exchanges are expected to result in tax basis adjustments to the assets of GF that will be allocated to the Company and thus produce favorable tax attributes. These tax attributes would not be available to us in the absence of those transactions. The anticipated tax basis adjustments are expected to reduce the amount of tax that GSHD would otherwise be required to pay in the future.
GSHD entered into a tax receivable agreement with the Pre-IPO LLC Members on May 1, 2018 that provides for the payment by GSHD to the Pre-IPO LLC Members of
85%
of the amount of cash savings, if any, in U.S. federal, state and local income tax or franchise tax that GSHD actually realizes as a result of (i) any increase in tax basis in GSHD's assets and (ii) tax benefits related to imputed interest deemed arising as a result of payments made under the tax receivable agreement.
During the
year ended December 31, 2018
, an aggregate of
261 thousand
LLC Units were redeemed by the Pre-IPO LLC Members for newly-issued shares of Class A common stock. In connection with these redemptions, we received
261 thousand
LLC Units, which resulted in an increase in the tax basis of our investment in GF subject to the provisions of the Tax Receivable Agreement. We recognized a liability for the TRA Payments due to the Pre-IPO LLC Members, representing
85%
of the aggregate tax benefits we expect to realize from the tax basis increases related to the redemptions of LLC Units, after concluding it was probable that such TRA Payments would be paid
74
based on our estimates of future taxable income. As of
December 31, 2018
, the total amount of TRA Payments due to the Pre-IPO LLC Members under the Tax Receivable Agreement was
$1.7 million
, of which
$9 thousand
was current and included in Accounts payables and accrued expenses on the Consolidated Balance Sheet.
11. Stockholders' equity
Class A Common Stock
GSHD has a total of
13,800 thousand
shares of its Class A common stock outstanding at
December 31, 2018
. Each share of Class A common stock holds economic rights and entitles its holder to
one
vote per share on all matters submitted to a vote of the stockholders of GSHD.
Class B Common Stock
GSHD has a total of
22,486 thousand
shares of its Class B common stock outstanding at
December 31, 2018
. Each share of Class B common stock has no economic rights but entitles its holder to
one
vote per share on all matters submitted to a vote of the stockholders of GSHD.
Holders of Class A common stock and Class B common stock vote together as a single class on all matters presented to GSHD's stockholders for their vote or approval, except as otherwise required by applicable law, by agreement, or by GSHD's certificate of incorporation.
Non-Controlling Interests
Following the Offering, GSHD became the sole managing member of GF and, as a result, it consolidates the financial results of GF. GSHD reports a non-controlling interest representing the economic interest in GF held by the other members of GF.
On a quarterly basis, GF makes distributions to the LLC Unit holders on a pro rata basis. For the
year ended December 31, 2018
, GF made distributions of
$3.9 million
, of which
$3.0 million
were made to Pre-IPO LLC Members. The remaining
$0.9 million
was made to GSHD and was eliminated in consolidation.
Under the amended and restated Goosehead Financial, LLC Agreement, the Pre-IPO LLC Members have the right, from and after the completion of the Offering (subject to the terms of the amended and restated Goosehead Financial, LLC Agreement), to require GSHD to redeem all or a portion of their LLC Units for, at GSHD's election, newly-issued shares of Class A common stock on a
one
-for-
one
basis or a cash payment equal to the volume weighted average market price of one share of GSHD's Class A common stock for each LLC Unit redeemed (subject to customary adjustments, including for stock splits, stock dividends and reclassifications) in accordance with the terms of the amended and restated Goosehead Financial, LLC Agreement. Additionally, in the event of a redemption request by a Pre-IPO LLC Member, GSHD may, at its option, effect a direct exchange of cash or Class A common stock for LLC Units in lieu of such a redemption. Shares of Class B common stock will be cancelled on a
one
-for-
one
basis if GSHD, at the election of a Pre-IPO LLC Member, redeems or exchanges LLC Units of such Pre-IPO LLC Member pursuant to the terms of the amended and restated Goosehead Financial, LLC Agreement. Except for transfers to GSHD pursuant to the amended and restated Goosehead Financial, LLC Agreement or to certain permitted transferees, the Pre-IPO LLC Members are not permitted to sell, transfer or otherwise dispose of any LLC Units or shares of Class B common stock.
During
2018
, an aggregate of
261 thousand
LLC Units were redeemed by the non-controlling interest holders. Pursuant to the GF LLC Agreement, we issued
261 thousand
shares of Class A common stock in connection with these redemptions and received
261 thousand
LLC Interests, increasing our ownership interest in GF LLC. Simultaneously, and in connection with these redemptions,
261 thousand
shares of Class B common stock were surrendered and cancelled.
The following table summarizes the ownership interest in GF as of
December 31, 2018
(in thousands).
75
|
December 31, 2018
|
||
|
LLC Units
|
Ownership %
|
|
|
Number of LLC Units held by GSHD
|
13,800
|
38.0%
|
|
Number of LLC Units held by non-controlling interest holders
|
22,486
|
62.0%
|
|
Number of LLC Units outstanding
|
36,286
|
100.0%
|
The weighted average ownership percentages for the applicable reporting periods are used to attribute net income to GSHD and the non-controlling interest holders. The non-controlling interest holders' weighted average ownership percentage for the
year ended December 31, 2018
was
62.6%
. All net income prior to the Offering is attributed to non-controlling interest holders.
Earnings Per Share
The following table sets forth the calculation of basic earnings per share ("EPS") based on net income attributable to GSHD for the
year ended December 31, 2018
, divided by the basic weighted average number of Class A common stock as of
December 31, 2018
(in thousands, except per share amounts)
. Diluted earnings per share of Class A common stock is computed by dividing net income attributable to GSHD by the weighted average number of shares of Class A common stock outstanding adjusted to give effect to potentially dilutive securities. The Company has not included the effects of conversion of Class B shares to Class A shares in the diluted EPS calculation using the "if-converted" method, because doing so has no impact on diluted EPS.
|
December 31, 2018
|
||||
|
Numerator:
|
||||
|
Income (loss) before taxes
|
$
|
(18,218
|
)
|
|
|
Less: income (loss) before taxes attributable to non-controlling interests
|
(9,702
|
)
|
||
|
Income (loss) before taxes attributable to GSHD
|
(8,516
|
)
|
||
|
Less: income tax expense attributable to GSHD
|
387
|
|
||
|
Net income (loss) attributable to GSHD
(1)
|
$
|
(8,903
|
)
|
|
|
Denominator:
|
||||
|
Weighted average shares of Class A common stock outstanding - basic
|
13,554
|
|
||
|
Effect of dilutive securities:
|
||||
|
Stock options
(2)
|
—
|
|
||
|
Weighted average shares of Class A common stock outstanding - diluted
|
$
|
13,554
|
|
|
|
Earnings per share of Class A common stock - basic
|
$
|
(0.66
|
)
|
|
|
Earnings per share of Class A common stock - diluted
|
$
|
(0.66
|
)
|
|
(1) Net income attributable to GSHD excludes all net income prior to the Offering.
(2)
1,650 thousand
stock options were excluded from the computation of diluted earnings per share of Class A common stock for the
year ended December 31, 2018
because the effect would have been anti-dilutive, as GSHD recorded a net loss for the period.
The following table sets forth the calculation of unaudited pro forma basic EPS based on unaudited pro forma net income attributable to GSHD for the
year ended December 31, 2017
, divided by the unaudited pro forma basic weighted average number of Class A common stock as of
December 31, 2017
(
in thousands, except per share amounts
). Unaudited pro forma diluted earnings per share of Class A common stock is computed by dividing unaudited pro forma net income attributable to GSHD by the unaudited pro forma weighted average number of shares of Class A common stock outstanding adjusted to give effect to unaudited pro forma potentially dilutive securities.
76
|
December 31, 2017
|
||||
|
Numerator:
|
||||
|
Net income
|
$
|
8,678
|
|
|
|
Less: unaudited pro forma net income attributable to non-controlling interests
|
5,436
|
|
||
|
Unaudited pro forma income before taxes attributable to GSHD
|
3,242
|
|
||
|
Less: Unaudited pro forma income tax expense
|
811
|
|
||
|
Unaudited pro forma net income attributable to GSHD
|
$
|
2,431
|
|
|
|
Denominator:
|
||||
|
Unaudited pro forma weighted average shares of Class A common stock outstanding - basic
|
13,554
|
|
||
|
Unaudited pro forma effect of dilutive securities:
|
||||
|
Unaudited pro forma stock options
|
1,019
|
|
||
|
Unaudited pro forma weighted average shares of Class A common stock outstanding - diluted
|
14,573
|
|
||
|
Unaudited pro forma earnings per share of Class A common stock - basic
|
$
|
0.18
|
|
|
|
Unaudited pro forma earnings per share of Class A common stock - diluted
|
$
|
0.17
|
|
|
12. Equity-based compensation
A summary of equity-based compensation expense during the
years ended December 31, 2018 and 2017
is as follows
(in thousands)
:
|
Year Ended December 31
|
|||||||
|
2018
|
2017
|
||||||
|
Class B unit compensation
|
$
|
26,134
|
|
$
|
2,231
|
|
|
|
Stock options
|
949
|
|
—
|
|
|||
|
Equity-based compensation expense
|
$
|
27,083
|
|
$
|
2,231
|
|
|
Class B unit compensation:
Prior to the Offering, certain Pre-IPO LLC Members held non-vesting and non-voting Class B units. In accordance with accounting guidance, any dividends paid to Class B unit holders are recognized as compensation expense when declared, as the Class B non-vesting units are considered to be a non-substantive class of equity. Dividends paid to Class B unit holders prior to the Offering, included in employee compensation and benefits, totaled
$0.1 million
and
$2.2 million
for the
years ended December 31, 2018 and 2017
, respectively.
In connection with the Reorganization Transactions, immediately prior to the Offering, historical Class B interests in TWIHG and GM vested by converting to the Texas Wasatch Note and Goosehead Management Note, respectively, paid with a combination of proceeds from the Offering and shares of Class A common stock. This conversion changed the nature of the Class B interests from a profit sharing arrangement to a substantive class of equity and were expensed under the guidance of ASC 718. At the Offering price of
$10.00
per share, GSHD incurred total compensation expense of
$6.2 million
in connection with the conversion, recognized in the second quarter of 2018.
Class B interests in GF were also deemed vested by converting, along with all pre-offering Class A equity, on a
one
-to-one basis with the number of LLC units previously owned, to both LLC Units and shares of Class B common stock. This conversion changed the nature of the Class B interests from a profit sharing arrangement to a substantive class of equity and were expensed under the guidance of ASC 718. At the initial public offering price of
$10.00
per share, the Company issued a total of
2.0 million
LLC Units and shares of Class B common stock and incurred total compensation expense of
$19.8 million
as part of the conversion, recognized in the second quarter of 2018.
77
Stock options:
In connection with the IPO, GSHD granted
1,650 thousand
options to directors and certain employees. The stock options were granted with a strike price of
$10.00
per share (the initial public offering price). The
365 thousand
director stock options vest quarterly over a
three
-year period, and the
1,285 thousand
employee stock options vest annually from 2020 to 2022. The grant date fair value was determined using the Black-Scholes valuation model using the following assumptions:
|
Expected volatility
|
25
|
%
|
|
Expected dividend yield
|
—
|
|
|
Expected term (in years)
|
5.95
|
|
|
Risk-free interest rate
|
2.59
|
%
|
GSHD will recognize the total compensation expense of
$5.2 million
related to such option grants on a straight-line basis over the requisite service period of the award recipient (
three
years for directors and
four
years for certain employees).
In April 2018, GSHD adopted the Omnibus Incentive Plan, which reserved
1.5 million
shares of Class A Common Stock for delivery to directors, officers, and managing directors in connection with future awards granted under the plan. GSHD also adopted an Employee Stock Purchase Plan, which reserved
20 thousand
shares of Class A Common Stock for delivery to employees. There were
5 thousand
shares outstanding related to the Employee Stock Purchase Plan at
December 31, 2018
.
13. Other income
On June 1, 2017, the Company executed a buyout agreement with a franchisee per the terms of a franchise agreement from 2014. As part of the buyout, the departing franchisee purchased Goosehead’s economic interests in future royalty fees. Goosehead recognized a
$3.5 million
gain on the transaction in June 2017 which is included in Other income on the consolidated statement of income. The franchisee also paid off an outstanding note to Goosehead in the amount of
$242 thousand
.
14. Segment information
The Company has
two
reportable segments: Corporate Channel and Franchise Channel. The Corporate Channel consists of company-owned and financed operations with employees who are hired, trained, and managed by Goosehead. The Franchise Channel network consists of franchisee operations that are owned and managed by individual business owners. These business owners have a contractual relationship with Goosehead to use the Company's processes, systems, and back-office support team to sell insurance and manage their business. In exchange, Goosehead is entitled to an initial franchise fee and ongoing royalty fees. Allocations of contingent commissions and certain operating expenses are based on reasonable assumptions and estimates primarily using revenue, headcount and other information. The Company’s chief operating decision maker uses net income before interest, income taxes, depreciation and amortization, adjusted to exclude equity-based compensation and other non-operating items, including, among other things, certain non-cash charges and certain non-recurring or non-operating gains or losses (“Adjusted EBITDA”) as a performance measure to manage resources and make decisions about the business. Summarized financial information concerning the Company’s reportable segments is shown in the following tables (in thousands). There are no intersegment sales, only interest income and interest expense related to an intersegment line of credit, all of which eliminate in consolidation. The “Other” column includes any income and expenses not allocated to reportable segments and corporate-related items, including equity-based compensation, certain legal expenses and interest related to the note payable.
78
|
Corporate
Channel
|
|
Franchise
Channel
|
|
Other
|
|
Total
|
|
||||||||
|
Year ended December 31, 2018:
|
|||||||||||||||
|
Revenues:
|
|||||||||||||||
|
Commissions and agency fees
|
$
|
34,287
|
|
$
|
2,417
|
|
$
|
—
|
|
$
|
36,704
|
|
|||
|
Franchise revenues
|
—
|
|
23,022
|
|
—
|
|
23,022
|
|
|||||||
|
Interest income
|
—
|
|
422
|
|
—
|
|
422
|
|
|||||||
|
Total
|
34,287
|
|
25,861
|
|
—
|
|
60,148
|
|
|||||||
|
Operating expenses:
|
|||||||||||||||
|
Employee compensation and benefits, excluding equity-based compensation
|
18,662
|
|
12,511
|
|
—
|
|
31,173
|
|
|||||||
|
General and administrative expenses, excluding state franchise tax
(1)
|
7,200
|
|
4,326
|
|
1,399
|
|
12,925
|
|
|||||||
|
Bad debts
|
889
|
|
409
|
|
—
|
|
1,298
|
|
|||||||
|
Total
|
26,751
|
|
17,246
|
|
1,399
|
|
45,396
|
|
|||||||
|
Adjusted EBITDA
|
7,536
|
|
8,615
|
|
(1,399
|
)
|
14,752
|
|
|||||||
|
Other income (expense, including state franchise tax)
|
(22
|
)
|
—
|
|
(135
|
)
|
(157
|
)
|
|||||||
|
Equity based compensation
|
—
|
|
—
|
|
(27,083
|
)
|
(27,083
|
)
|
|||||||
|
Interest expense
|
—
|
|
—
|
|
(4,266
|
)
|
(4,266
|
)
|
|||||||
|
Depreciation and amortization
|
(945
|
)
|
(519
|
)
|
—
|
|
(1,464
|
)
|
|||||||
|
Taxes
|
—
|
|
—
|
|
(449
|
)
|
(449
|
)
|
|||||||
|
Net income
|
$
|
6,569
|
|
$
|
8,096
|
|
$
|
(33,332
|
)
|
$
|
(18,667
|
)
|
|||
|
At December 31, 2018:
|
|||||||||||||||
|
Total Assets
|
$
|
6,862
|
|
$
|
8,572
|
|
$
|
19,364
|
|
$
|
34,798
|
|
|||
(1) Excluded from general and administrative expenses is
$135 thousand
of state franchise tax that is not calculated based on income.
79
|
Corporate
Channel
|
|
Franchise
Channel
|
|
Other
|
|
Total
|
|
||||||||
|
Year Ended December 31, 2017:
|
|||||||||||||||
|
Revenues:
|
|||||||||||||||
|
Commissions and agency fees
|
$
|
25,521
|
|
$
|
1,509
|
|
$
|
—
|
|
$
|
27,030
|
|
|||
|
Franchise revenues
|
—
|
|
15,438
|
|
—
|
|
15,438
|
|
|||||||
|
Interest income
|
—
|
|
243
|
|
—
|
|
243
|
|
|||||||
|
Total
|
25,521
|
|
17,190
|
|
—
|
|
42,711
|
|
|||||||
|
Operating expenses:
|
|||||||||||||||
|
Employee compensation and benefits, excluding equity-based compensation
|
13,469
|
|
8,844
|
|
—
|
|
22,313
|
|
|||||||
|
General and administrative expenses
|
5,036
|
|
3,219
|
|
342
|
|
8,597
|
|
|||||||
|
Bad debts
|
649
|
|
434
|
|
—
|
|
1,083
|
|
|||||||
|
Total
|
19,154
|
|
12,497
|
|
342
|
|
31,993
|
|
|||||||
|
Adjusted EBITDA
|
6,367
|
|
4,693
|
|
(342
|
)
|
10,718
|
|
|||||||
|
Other income (expense)
|
—
|
|
3,541
|
|
—
|
|
3,541
|
|
|||||||
|
Equity based compensation
|
—
|
|
—
|
|
(2,231
|
)
|
(2,231
|
)
|
|||||||
|
Interest expense
|
—
|
|
—
|
|
(2,474
|
)
|
(2,474
|
)
|
|||||||
|
Depreciation and amortization
|
(657
|
)
|
(219
|
)
|
—
|
|
(876
|
)
|
|||||||
|
Net income
|
$
|
5,710
|
|
$
|
8,015
|
|
$
|
(5,047
|
)
|
$
|
8,678
|
|
|||
|
At December 31, 2017:
|
|||||||||||||||
|
Total Assets
|
$
|
7,855
|
|
$
|
6,945
|
|
$
|
1,906
|
|
$
|
16,706
|
|
|||
15. Litigation
From time to time, the Company may be involved in various legal proceedings, lawsuits and claims incidental to the conduct of our business. The amount of any loss from the ultimate outcomes is not probable or reasonably estimable. It is the opinion of management that the resolution of outstanding claims will not have a material adverse effect on the financial position or results of operations of the Company.
16. Subsequent events
On
March 7, 2019
, GF approved a
$15 million
extraordinary dividend to all holders of LLC Units, including GSHD. The board of directors of the Company then declared an extraordinary dividend of
$0.41
to all holders of Class A common stock of GSHD with a record date of
March 18, 2019
, to be paid on or before
April 1, 2019
. A summary of the total estimated amounts to be paid by GF is as follows
(in thousands)
:
|
LLC Units held as of March 14, 2019
|
Estimated dividend to be paid
|
|||||
|
Class A common stockholders
|
14,421
|
|
$
|
5,962
|
|
|
|
Class B common stockholders via LLC Units held
|
21,864
|
|
9,038
|
|
||
|
Total
|
36,285
|
|
$
|
15,000
|
|
|
Any future extraordinary dividends will be declared at the sole discretion of GF's managing members with respect to GF and the Company's board of directors with respect to GSHD. In determining whether a future extraordinary dividend will be declared by the Company, the board of directors may, at its sole discretion, consider the following: the Company's financial condition and operating results, the Company's available cash and current and anticipated
80
cash needs, the Company's capital requirements, any contractual, legal, tax and regulatory restrictions, general economic and business conditions, and such other factors or conditions as the board of directors deems relevant.
17. Selected quarterly financial data (unaudited)
The following tables sets forth certain unaudited quarterly results of operations for the years ended
December 31, 2018
and
2017
(in thousands, except per share data). The sum of the four quarters may differ from the annual amount due to rounding:
|
2018
|
|||||||||||||||
|
First Quarter
|
|
Second Quarter
|
|
Third Quarter
|
|
Fourth Quarter
|
|
||||||||
|
Total revenue
|
$
|
14,589
|
|
$
|
14,788
|
|
$
|
16,054
|
|
$
|
14,717
|
|
|||
|
Income from operations
|
4,763
|
|
(22,749
|
)
|
2,653
|
|
1,403
|
|
|||||||
|
Net income
|
3,768
|
|
(23,875
|
)
|
836
|
|
605
|
|
|||||||
|
Earnings per share
(1)(2)
|
|
|
|
|
|||||||||||
|
Basic
|
0.08
|
(0.68
|
)
|
0.02
|
0.01
|
|
|||||||||
|
Diluted
|
0.08
|
(0.68
|
)
|
0.02
|
0.01
|
|
|||||||||
|
|
|
|
|
|
|||||||||||
|
|
2017
|
||||||||||||||
|
|
First Quarter
|
|
Second Quarter
|
|
Third Quarter
|
|
Fourth Quarter
|
|
|||||||
|
Total revenue
|
$
|
9,891
|
|
$
|
10,879
|
|
$
|
10,807
|
|
$
|
11,134
|
|
|||
|
Income from operations
|
2,800
|
|
2,811
|
|
883
|
|
1,116
|
|
|||||||
|
Net income
|
2,267
|
|
5,824
|
|
209
|
|
376
|
|
|||||||
|
Earnings per share
(1)(2)
|
|
|
|
|
|||||||||||
|
Basic
|
0.05
|
0.12
|
—
|
|
0.01
|
|
|||||||||
|
Diluted
|
0.05
|
0.12
|
—
|
|
0.01
|
|
|||||||||
(1) Basic and diluted earnings per share are computed independently for each of the quarters presented. Therefore, the sum of quarterly basic and diluted earnings per share amounts may not equal annual basic and diluted earnings per share amounts.
(2) Basic and diluted earnings per share for the
first quarter of 2018
and year ended
December 31, 2017
are shown on a pro-forma basis, as there was no Class A or Class B common stock outstanding as of
March 31, 2018
or
December 31, 2017
, respectively.
Item 9. Changes in and disagreements with accountants on accounting and financial statement disclosure
None.
Item 9A. Controls and procedures
Evaluation of Disclosure Controls and Procedures
Under the supervision and with the participation of management, including the Chief Executive Officer and Chief Financial Officer, we conducted an evaluation of the effectiveness of our disclosure controls and procedures (as such term is defined in Rules 13a-15(e) and 15d-15(e) under the Exchange Act) as of the end of the period covered by this report. Based on this evaluation, our Chief Executive Officer and Chief Financial Officer have concluded that our disclosure controls and procedures were effective as of
December 31, 2018
.
Changes in Internal Controls Over Financial Reporting
81
We previously identified and reported material weaknesses regarding the lack of adequate (i) executive management review of our GAAP financial statements, (ii) review of our accounting policies, including recent accounting pronouncements and significant transactions for the periods presented and (iii) information technology general controls in the areas of user access and program change management for certain information technology systems.
Using third party consultants along with internal resources, we continued to implement certain measures to remediate them during the year ended
December 31, 2018
. For example, we implemented policies requiring our executive management to review our financial statements presented on a GAAP basis. Additionally, we have implemented policies requiring our Chief Financial Officer, controller and assistant controller (who was recently hired to assist with financial reporting requirements) to systematically review and document all accounting policies and procedures around significant transactions to ensure compliance with the most recent GAAP pronouncements, review and document quarterly GAAP and SEC disclosure checklists, and review and document monthly and quarterly financial statement close process checklists. As a result of the above actions, these material weaknesses have been remediated as of
December 31, 2018
.
Additionally, to address the information technology general control material weakness described above in (iii), we have updated certain users' access to ensure that financial data is adequately restricted to appropriate personnel. We have also implemented program change management controls to ensure that any system changes are adequately reviewed and deployed through the appropriate personnel. As a result of the above actions, this material weakness has been remediated as of
December 31, 2018
.
No material costs were incurred during the year ended
December 31, 2018
relating to remediation efforts discussed above
Management's Report on Internal Controls over Financial Reporting
This Annual Report on Form 10-K does not include a report of management's assessment regarding internal control over financial reporting due to a transition period established by the SEC for newly public companies.
In addition, because we are an "emerging growth company" under the JOBS Act, our independent registered public accounting firm will not be required to attest to the effectiveness of our internal control over financial reporting for so long as we are an emerging growth company.
Item 9B. Other information
Not applicable.
PART III
Item 10. Directors, executive officers, and corporate governance
The information required by this item is incorporated by reference to the Company's Proxy Statement for its 2019 Annual Meeting of Stockholders to be filed with the SEC within 120 days after the end of the fiscal year ended
December 31, 2018
.
Item 11. Executive compensation
The information required by this item is incorporated by reference to the Company's Proxy Statement for its 2019 Annual Meeting of Stockholders to be filed with the SEC within 120 days after the end of the fiscal year ended
December 31, 2018
.
Item 12. Security ownership of certain beneficial owners and management and related stockholder matters
82
The information required by this item with respect to securities authorized for issuance under equity compensation plans is set forth under “Item 5. Securities Authorized for Issuance under Equity Compensation Plans.”
The information required by Item 403 of Regulation S-K is incorporated by reference to the Company's Proxy Statement for its 2019 Annual Meeting of Stockholders to be filed with the SEC within 120 days after the end of the fiscal year ended
December 31, 2018
.
Item 13. Certain relationships and related transactions, and director independence
The information required by this item is incorporated by reference to the Company's Proxy Statement for its 2019 Annual Meeting of Stockholders to be filed with the SEC within 120 days after the end of the fiscal year ended
December 31, 2018
.
Item 14. Principal accountant fees and services
The information required by this item is incorporated by reference to the Company's Proxy Statement for its 2019 Annual Meeting of Stockholders to be filed with the SEC within 120 days after the end of the fiscal year ended
December 31, 2018
.
PART IV
83
Item 15. Exhibits and financial statement schedules
The following documents are filed as part of this Annual Report:
|
Exhibit Number
|
Description
|
|
101.INS
|
XBRL Instance Document
|
|
101.SCH
|
XBRL Schema Document
|
|
101.CAL
|
XBRL Calculation Linkbase Document
|
|
101.DEF
|
XBRL Definition Linkbase Document
|
|
101.LAB
|
XBRL Label Linkbase Document
|
|
101.PRE
|
XBRL Presentation Linkbase
|
84
Signatures
Pursuant to the requirements of Section 13 or 15(d) of the Securities Exchange Act of 1934, the registrant has duly caused this report to be signed on its behalf by the undersigned, thereunto duly authorized.
|
|
GOOSEHEAD INSURANCE, INC.
|
|||
|
|
||||
|
Date:
|
March 14, 2019
|
By:
|
|
/s/ Mark E. Jones
|
|
|
|
|
Mark E. Jones
|
|
|
|
|
|
Chairman and Chief Executive Officer
|
|
|
|
|
|
(Principal Executive Officer)
|
|
|
|
||||
|
Date:
|
March 14, 2019
|
By:
|
|
/s/ Mark S. Colby
|
|
|
|
|
Mark S. Colby
|
|
|
|
|
|
Chief Financial Officer
|
|
|
|
|
|
(Principal Financial Officer and Principal Accounting Officer)
|
|
Pursuant to the requirements of the Securities and Exchange Act of 1934, this report has been signed below by the following persons on behalf of the registrant and in the capacities and on the dates indicated.
|
Signature
|
Title
|
Date
|
|
/s/ Mark E. Jones
|
Chairman, Director and Chief Executive Officer
(Principal Executive Officer) |
March 14, 2019
|
|
Mark E. Jones
|
||
|
/s/ Robyn Jones
|
Vice Chairman and Director
|
March 14, 2019
|
|
Robyn Jones
|
||
|
/s/ Peter Lane
|
Director
|
March 14, 2019
|
|
Peter Lane
|
||
|
/s/ Mark Miller
|
Director
|
March 14, 2019
|
|
Mark Miller
|
||
|
/s/ James Reid
|
Director
|
March 14, 2019
|
|
James Reid
|
||
|
/s/ Mark S. Colby
|
Chief Financial Officer
(Principal Financial Officer and Principal Accounting Officer) |
March 14, 2019
|
|
Mark S. Colby
|
||
85
TABLE OF CONTENTS
Part IItem 1. BusinessItem 1A. Risk FactorsItem 1B. Unresolved Staff CommentsItem 2. PropertiesItem 3. Legal ProceedingsItem 4. Mine Safety DisclosuresPart IIItem 5. Market For Registrant S Common Equity, Related Stockholder Matters and Issuer Purchases Of Equity SecuritiesItem 6. Selected Financial DataItem 7. Management S Discussion and Analysis Of Financial Condition and Results Of OperationsItem 7A. Quantitative and Qualitative Disclosure Of Market RisksItem 8. Financial Statements and Supplementary DataItem 9. Changes in and Disagreements with Accountants on Accounting and Financial Statement DisclosureItem 9A. Controls and ProceduresItem 9B. Other InformationPart IIIItem 10. Directors, Executive Officers, and Corporate GovernanceItem 11. Executive CompensationItem 12. Security Ownership Of Certain Beneficial Owners and Management and Related Stockholder MattersItem 13. Certain Relationships and Related Transactions, and Director IndependenceItem 14. Principal Accountant Fees and ServicesPart IVItem 15. Exhibits and Financial Statement Schedules