GRAN TIERRA ENERGY INC.
10-Ks and 10-Qs
|
|
|
|
|
|
|
|
|
|
|
|
|
|
|
|
|
|
|
|
|
|
|
|
|
|
|
|
|
|
|
|
|
|
|
|
|
|
|
|
|
|
|
|
|
|
|
|
|
|
|
|
|
|
|
|
UNITED STATES SECURITIES AND EXCHANGE COMMISSION
Washington, D.C. 20549
FORM 10-K
(Mark One)
|
ý
|
|
ANNUAL REPORT PURSUANT TO SECTION 13 OR 15(d) OF THE SECURITIES EXCHANGE ACT OF 1934
|
For the fiscal year ended
December 31, 2013
or
|
o
|
|
TRANSITION REPORT PURSUANT TO SECTION 13 OR 15(d) OF THE SECURITIES EXCHANGE ACT OF 1934
|
For the transition period from __________ to __________
Commission file number
001-34018
GRAN TIERRA ENERGY INC.
(Exact name of registrant as specified in its charter)
|
Nevada
|
|
98-0479924
|
|
(State or other jurisdiction of incorporation or organization)
|
|
(I.R.S. Employer Identification No.)
|
|
|
|
|
|
300, 625 11 Avenue S.W.
Calgary, Alberta, Canada T2R 0E1
|
||
|
(Address of principal executive offices, including zip code)
|
||
(403) 265-3221
(Registrant’s telephone number, including area code)
Securities registered pursuant to Section 12(b) of the Act:
|
Title of each class
|
Name of each exchange on which registered
|
|
|
Common Stock, par value $0.001 per share
|
NYSE MKT
|
|
|
Toronto Stock Exchange
|
||
Securities Registered Pursuant to Section 12(g) of the Act:
None
Indicate by check mark if the registrant is a well-known seasoned issuer, as defined in Rule 405 of the Securities Act.
Yes
ý
No
o
Indicate by check mark if the registrant is not required to file reports pursuant to Section 13 or Section 15(d) of the Act.
Yes
o
No
ý
Indicate by check mark whether the registrant (1) has filed all reports required to be filed by Section 13 or 15(d) of the Securities Exchange Act of 1934 during the preceding 12 months (or for such shorter period that the registrant was required to file such reports), and (2) has been subject to such filing requirements for the past 90 days. Yes
ý
No
o
Indicate by check mark whether the registrant submitted electronically and posted on its corporate website, if any, every Interactive Data File required to be submitted and posted pursuant to Rule 405 of Regulation S-T (§ 232.405 of this chapter) during the preceding 12 months (or for such shorter period that the registrant was required to submit and post such files).
Yes
ý
No
o
Indicate by check mark if disclosure of delinquent filers pursuant to Item 405 of Regulation S-K is not contained herein, and will not be contained, to the best of registrant’s knowledge, in definitive proxy or information statements incorporated by reference in Part III of this Form 10-K or any amendment to this Form 10-K.
ý
Indicate by check mark whether the registrant is a large accelerated filer, an accelerated filer, a non-accelerated filer, or a smaller reporting company. See the definitions of “large accelerated filer,” “accelerated filer” and “smaller reporting company” in Rule 12b-2 of the Exchange Act.
|
Large accelerated filer
x
|
Accelerated filer
o
|
|
Non-accelerated filer
o
(do not check if a smaller reporting company)
|
Smaller reporting company
o
|
Indicate by check mark whether the registrant is a shell company (as defined in Rule 12b-2 of the Act). Yes
o
No
ý
The aggregate market value of the voting and non-voting common equity held by non-affiliates computed by reference to the price at which the common equity was last sold as of the last business day of the registrant’s most recently completed second fiscal quarter was approximately
$1.6 billion
(including shares issuable upon exercise of exchangeable shares). Aggregate market value excludes an aggregate of
2,894,897
shares of Common Stock and
7,407,427
shares issuable upon exercise of exchangeable shares held by officers and directors on such date. Exclusion of shares held by any of these persons should not be construed to indicate that such person possesses the power, direct or indirect, to direct or cause the direction of the management or policies of the registrant, or that such person is controlled by or under common control with the registrant.
On
February 19, 2014
, the following numbers of shares of the registrant’s capital stock were outstanding:
272,341,810
shares of the registrant’s Common Stock, $0.001 par value; one share of Special A Voting Stock, $0.001 par value, representing
4,534,127
shares of Gran Tierra Goldstrike Inc., which are exchangeable on a 1-for-1 basis into the registrant’s Common Stock; and one share of Special B Voting Stock, $0.001 par value, representing
6,334,313
shares of Gran Tierra Exchangeco Inc., which are exchangeable on a 1-for-1 basis into the registrant’s Common Stock.
DOCUMENTS INCORPORATED BY REFERENCE
The information required by Part III of this report, to the extent not set forth herein, is incorporated by reference from the registrant’s definitive proxy statement relating to the
2014
annual meeting of stockholders, which definitive proxy statement will be filed with the Securities and Exchange Commission within 120 days after
December 31, 2013
.
1
Gran Tierra Energy Inc.
Annual Report on Form 10-K
Year Ended
December 31, 2013
Table of contents
|
|
|
Page
|
|
|
|
|
|
PART I
|
|
|
|
Item 1.
|
Business
|
|
|
Item 1A.
|
Risk Factors
|
|
|
Item 1B.
|
Unresolved Staff Comments
|
|
|
Item 2.
|
Properties
|
|
|
Item 3.
|
Legal Proceedings
|
|
|
Item 4.
|
Mine Safety Disclosures
|
|
|
PART II
|
||
|
Item 5.
|
Market for Registrant's Common Equity, Related Stockholder Matters and Issuer Purchases of Equity Securities
|
|
|
Item 6.
|
Selected Financial Data
|
|
|
Item 7.
|
Management's Discussion and Analysis of Financial Condition and Results of Operations
|
|
|
Item 7A.
|
Quantitative and Qualitative Disclosures About Market Risk
|
|
|
Item 8.
|
Financial Statements and Supplementary Data
|
|
|
Item 9.
|
Changes in and Disagreements with Accountants on Accounting and Financial Disclosure
|
|
|
Item 9A.
|
Controls and Procedures
|
|
|
Item 9B.
|
Other Information
|
|
|
|
|
|
|
PART III
|
|
|
|
Item 10.
|
Directors, Executive Officers and Corporate Governance
|
|
|
Item 11.
|
Executive Compensation
|
|
|
Item 12.
|
Security Ownership of Certain Beneficial Owners and Management and Related Stockholder Matters
|
|
|
Item 13.
|
Certain Relationships and Related Transactions, and Director Independence
|
|
|
Item 14.
|
Principal Accounting Fees and Services
|
|
|
PART IV
|
||
|
Item 15.
|
Exhibits, Financial Statement Schedules
|
|
|
SIGNATURES
|
||
|
EXHIBIT INDEX
|
||
2
STATEMENT REGARDING FORWARD-LOOKING STATEMENTS
This Annual Report on Form 10-K, particularly in Item 1. “Business” and Item 7. “Management’s Discussion and Analysis of Financial Condition and Results of Operations,” includes forward-looking statements within the meaning of Section 27A of the Securities Act of 1933, as amended (the "Securities Act") and Section 21E of the Securities Exchange Act of 1934 (the "Exchange Act"). All statements other than statements of historical facts included in this Annual Report on Form 10-K, including without limitation statements in the Management’s Discussion and Analysis of Financial Condition and Results of Operations, regarding our financial position, estimated quantities and net present values of reserves, business strategy, plans and objectives of our management for future operations, covenant compliance, capital spending plans and those statements preceded by, followed by or that otherwise include the words “believe”, “expect”, “anticipate”, “intend”, “estimate”, “project”, “target”, “goal”, “plan”, “objective”, “should”, or similar expressions or variations on these expressions are forward-looking statements. We can give no assurances that the assumptions upon which the forward-looking statements are based will prove to be correct or that, even if correct, intervening circumstances will not occur to cause actual results to be different than expected. Because forward-looking statements are subject to risks and uncertainties, actual results may differ materially from those expressed or implied by the forward-looking statements. There are a number of risks, uncertainties and other important factors that could cause our actual results to differ materially from the forward-looking statements, including, but not limited to, those set out in Part I, Item 1A “Risk Factors” in this Annual Report on Form 10-K. The information included herein is given as of the filing date of this Form 10-K with the Securities and Exchange Commission (“SEC”) and, except as otherwise required by the federal securities laws, we disclaim any obligations or undertaking to publicly release any updates or revisions to any forward-looking statement contained in this Annual Report on Form 10-K to reflect any change in our expectations with regard thereto or any change in events, conditions or circumstances on which any forward-looking statement is based.
GLOSSARY OF OIL AND GAS TERMS
In this document, the abbreviations set forth below have the following meanings:
|
bbl
|
barrel
|
Mcf
|
thousand cubic feet
|
|
Mbbl
|
thousand barrels
|
MMcf
|
million cubic feet
|
|
MMbbl
|
million barrels
|
Bcf
|
billion cubic feet
|
|
BOE
|
barrels of oil equivalent
|
MMBtu
|
million British thermal units
|
|
MMBOE
|
million barrels of oil equivalent
|
NGL
|
natural gas liquids
|
|
BOEPD
|
barrels of oil equivalent per day
|
NAR
|
net after royalty
|
|
BOPD
|
barrels of oil per day
|
||
NGL volumes are converted to BOE on a one-to-one basis with oil. Gas volumes are converted to BOE at the rate of 6 Mcf of gas per bbl of oil, based upon the approximate relative energy content of gas and oil. The rate is not necessarily indicative of the relationship between oil and gas prices.
In the discussion that follows we discuss our interests in wells and/or acres in gross and net terms. Gross oil and natural gas wells or acres refer to the total number of wells or acres in which we own a working interest. Net oil and natural gas wells or acres are determined by multiplying gross wells or acres by the working interest that we own in such wells or acres. Working interest refers to the interest we own in a property, which entitles us to receive a specified percentage of the proceeds of the sale of oil and natural gas, and also requires us to bear a specified percentage of the cost to explore for, develop and produce that oil and natural gas. A working interest owner that owns a portion of the working interest may participate either as operator, or by voting its percentage interest to approve or disapprove the appointment of an operator, in drilling and other major activities in connection with the development of a property.
We also refer to royalties and farm-in or farm-out transactions. Royalties include payments to governments on the production of oil and gas, either in kind or in cash. Royalties also include overriding royalties paid to third parties. Our reserves, production volumes and sales are reported net after deduction of royalties. Production volumes are also reported net of inventory adjustments. Farm-in or farm-out transactions refer to transactions in which a portion of a working interest is sold by an owner of an oil and gas property. The transaction is labeled a farm-in by the purchaser of the working interest and a farm-out by the seller of the working interest. Payment in a farm-in or farm-out transaction can be in cash or in kind by committing to perform and/or pay for certain work obligations.
3
In the petroleum industry, geologic settings with proven petroleum source rocks, migration pathways, reservoir rocks and traps are referred to as petroleum systems.
Several items that relate to oil and gas operations, including aeromagnetic and aerogravity surveys, seismic operations and several kinds of drilling and other well operations, are also discussed in this document.
Aeromagnetic and aerogravity surveys are a remote sensing process by which data is gathered about the subsurface of the earth. An airplane is equipped with extremely sensitive instruments that measure changes in the earth's gravitational and magnetic field. Variations as small as 1/1,000th in the gravitational and magnetic field strength and direction can indicate structural changes below the ground surface. These structural changes may influence the trapping of hydrocarbons. These surveys are an efficient way of gathering data over large regions.
Seismic data is used by oil and natural gas companies as the principal source of information to locate oil and natural gas deposits, both for exploration for new deposits and to manage or enhance production from known reservoirs. To gather seismic data, an energy source is used to send sound waves into the subsurface strata. These waves are reflected back to the surface by underground formations, where they are detected by geophones which digitize and record the reflected waves. Computer software applications are then used to process the raw data to develop an image of underground formations. 2-D seismic is the standard acquisition technique used to image geologic formations over a broad area. 2-D seismic data is collected by a single line of energy sources which reflect seismic waves to a single line of geophones. When processed, 2-D seismic data produces an image of a single vertical plane of sub-surface data. 3-D seismic data is collected using a grid of energy sources, which are generally spread over several square miles. A 3-D seismic survey produces a three dimensional image of the subsurface geology by collecting seismic data along parallel lines and creating a cube of information that can be divided into various planes, thus improving visualization. Consequently, 3-D seismic data is generally considered a more reliable indicator of potential oil and natural gas reservoirs in the area evaluated.
Wells drilled are classified as exploration, development, injector or stratigraphic. An exploration well is a well drilled in search of a previously undiscovered hydrocarbon-bearing reservoir. A development well is a well drilled to develop a hydrocarbon-bearing reservoir that is already discovered. Exploration and development wells are tested during and after the drilling process to determine if they have oil or natural gas that can be produced economically in commercial quantities. If they do, the well will be completed for production, which could involve a variety of equipment, the specifics of which depend on a number of technical geological and engineering considerations. If there is no oil or natural gas (a “dry” well), or there is oil and natural gas but the quantities are too small and/or too difficult to produce, the well will be abandoned. Abandonment is a completion operation that involves closing or “plugging” the well and remediating the drilling site. An injector well is a development well that will be used to inject fluid into a reservoir to increase production from other wells. A stratigraphic well is a drilling effort, geologically directed, to obtain information pertaining to a specific geologic condition. These wells customarily are drilled without the intent of being completed for hydrocarbon production. The classification also includes tests identified as core tests and all types of expendable holes related to hydrocarbon exploration. Stratigraphic tests are classified as “exploratory type” if drilled in an unknown area or “development type” if drilled in a known area.
Workover is a term used to describe remedial operations on a previously completed well to clean, repair and/or maintain the well for the purpose of increasing or restoring production. It could include well deepening, plugging portions of the well, working with cementing, scale removal, acidizing, fracture stimulation, changing tubulars or installing/changing equipment to provide artificial lift.
The SEC definitions related to oil and natural gas reserves, per Regulation S-X, reflecting our use of deterministic reserve estimation methods, are as follows:
|
•
|
Reserves.
Reserves are estimated remaining quantities of oil and gas and related substances anticipated to be economically producible, as of a given date, by application of development projects to known accumulations. In addition, there must exist, or there must be a reasonable expectation that there will exist, the legal right to produce or a revenue interest in the production, installed means of delivering oil and gas or related substances to market, and all permits and financing required to implement the project.
|
|
•
|
Proved oil and gas reserves.
Proved oil and gas reserves are those quantities of oil and gas, which, by analysis of geoscience and engineering data, can be estimated with reasonable certainty to be economically producible from a given date forward, from known reservoirs, and under existing economic conditions, operating methods, and government regulations prior to the time at which contracts providing the right to operate expire, unless evidence indicates that renewal is reasonably certain, regardless of whether deterministic or probabilistic methods are used for
|
4
the estimation. The project to extract the hydrocarbons must have commenced or the operator must be reasonably certain that it will commence the project within a reasonable time.
|
i.
|
The area of the reservoir considered as proved includes:
|
|
A.
|
The area identified by drilling and limited by fluid contacts, if any, and
|
|
B.
|
Adjacent undrilled portions of the reservoir that can, with reasonable certainty, be judged to be continuous with it and to contain economically producible oil or gas on the basis of available geoscience and engineering data.
|
|
ii.
|
In the absence of data on fluid contacts, proved quantities in a reservoir are limited by the lowest known hydrocarbons as seen in a well penetration unless geoscience, engineering, or performance data and reliable technology establishes a lower contact with reasonable certainty.
|
|
iii.
|
Where direct observation from well penetrations has defined a highest known oil ("HKO") elevation and the potential exists for an associated gas cap, proved oil reserves may be assigned in the structurally higher portions of the reservoir only if geoscience, engineering, or performance data and reliable technology establish the higher contact with reasonable certainty.
|
|
iv.
|
Reserves which can be produced economically through application of improved recovery techniques (including, but not limited to, fluid injection) are included in the proved classification when:
|
|
A.
|
Successful testing by a pilot project in an area of the reservoir with properties no more favorable than in the reservoir as a whole, the operation of an installed program in the reservoir or an analogous reservoir, or other evidence using reliable technology establishes the reasonable certainty of the engineering analysis on which the project or program was based; and
|
|
B.
|
The project has been approved for development by all necessary parties and entities, including governmental entities.
|
|
v.
|
Existing economic conditions include prices and costs at which economic producibility from a reservoir is to be determined. The price shall be the average price during the 12-month period prior to the ending date of the period covered by the report, determined as an unweighted arithmetic average of the first-day-of-the-month price for each month within such period, unless prices are defined by contractual arrangements, excluding escalations based upon future conditions.
|
|
•
|
Probable reserves.
Probable reserves are those additional reserves that are less certain to be recovered than proved reserves but which, together with proved reserves, are as likely as not to be recovered.
|
|
i.
|
When deterministic methods are used, it is as likely as not that actual remaining quantities recovered will exceed the sum of estimated proved plus probable reserves. When probabilistic methods are used, there should be at least a 50% probability that the actual quantities recovered will equal or exceed the proved plus probable reserves estimates.
|
|
ii.
|
Probable reserves may be assigned to areas of a reservoir adjacent to proved reserves where data control or interpretations of available data are less certain, even if the interpreted reservoir continuity of structure or productivity does not meet the reasonable certainty criterion. Probable reserves may be assigned to areas that are structurally higher than the proved area if these areas are in communication with the proved reservoir.
|
|
iii.
|
Probable reserves estimates also include potential incremental quantities associated with a greater percentage recovery of the hydrocarbons in place than assumed for proved reserves.
|
|
iv.
|
See also guidelines in paragraphs (a)(17)(iv) and (a)(17)(vi) of section 210.4-10(a) of Regulations S-X.
|
|
•
|
Possible reserves.
Possible reserves are those additional reserves that are less certain to be recovered than probable reserves.
|
5
|
i.
|
When deterministic methods are used, the total quantities ultimately recovered from a project have a low probability of exceeding proved plus probable plus possible reserves. When probabilistic methods are used, there should be at least a 10% probability that the total quantities ultimately recovered will equal or exceed the proved plus probable plus possible reserves estimates.
|
|
ii.
|
Possible reserves may be assigned to areas of a reservoir adjacent to probable reserves where data control and interpretations of available data are progressively less certain. Frequently, this will be in areas where geoscience and engineering data are unable to define clearly the area and vertical limits of commercial production from the reservoir by a defined project.
|
|
iii.
|
Possible reserves also include incremental quantities associated with a greater percentage recovery of the hydrocarbons in place than the recovery quantities assumed for probable reserves.
|
|
iv.
|
The proved plus probable and proved plus probable plus possible reserves estimates must be based on reasonable alternative technical and commercial interpretations within the reservoir or subject project that are clearly documented, including comparisons to results in successful similar projects.
|
|
v.
|
Possible reserves may be assigned where geoscience and engineering data identify directly adjacent portions of a reservoir within the same accumulation that may be separated from proved areas by faults with displacement less than formation thickness or other geological discontinuities and that have not been penetrated by a wellbore, and the registrant believes that such adjacent portions are in communication with the known (proved) reservoir. Possible reserves may be assigned to areas that are structurally higher or lower than the proved area if these areas are in communication with the proved reservoir.
|
|
vi.
|
Pursuant to paragraph (a)(22)(iii) of section 210.4-10(a) of Regulations S-X, where direct observation has defined a HKO elevation and the potential exists for an associated gas cap, proved oil reserves should be assigned in the structurally higher portions of the reservoir above the HKO only if the higher contact can be established with reasonable certainty through reliable technology. Portions of the reservoir that do not meet this reasonable certainty criterion may be assigned as probable and possible oil or gas based on reservoir fluid properties and pressure gradient interpretations.
|
|
•
|
Reasonable certainty.
If deterministic methods are used, reasonable certainty means a high degree of confidence that the quantities will be recovered. A high degree of confidence exists if the quantity is much more likely to be achieved than not, and as changes due to increased availability of geoscience (geological, geophysical and geochemical), engineering and economic data are made to estimated ultimate recovery ("EUR") with time, reasonably certain EUR is much more likely to increase or remain constant than to decrease.
|
|
•
|
Deterministic estimate.
The method of estimating reserves or resources is called deterministic when a single value for each parameter (from the geoscience, engineering, or economic data) in the reserves calculation is used in the reserves estimation procedure.
|
|
•
|
Probabilistic estimate.
The method of estimating reserves or resources is called probabilistic when the full range of values that could reasonably occur for each unknown parameter (from the geoscience, engineering or economic data) is used to generate a full range of possible outcomes and their associated probabilities of occurrences.
|
|
•
|
Developed oil and gas reserves
. Developed oil and gas reserves are reserves of any category that can be expected to be recovered:
|
|
i.
|
Through existing wells with existing equipment and operating methods or in which the cost of the required equipment is relatively minor compared with the cost of a new well; and
|
|
ii.
|
Through installed extraction equipment and infrastructure operational at the time of the reserves estimate if the extraction is by means not involving a well.
|
|
•
|
Undeveloped oil and gas reserves
. Undeveloped oil and gas reserves are reserves of any category that are expected to be recovered from new wells on undrilled acreage, or from existing wells where a relatively major expenditure is required for recompletion.
|
6
|
i.
|
Reserves on undrilled acreage shall be limited to those directly offsetting development spacing areas that are reasonably certain of production when drilled, unless evidence using reliable technology exists that establishes reasonable certainty of economic producibility at greater distances.
|
|
ii.
|
Undrilled locations can be classified as having undeveloped reserves only if a development plan has been adopted indicating that they are scheduled to be drilled within five years, unless the specific circumstances, justify a longer time.
|
|
iii.
|
Under no circumstances shall estimates for undeveloped reserves be attributable to any acreage for which an application of fluid injection or other improved recovery technique is contemplated, unless such techniques have been proved effective by actual projects in the same reservoir or an analogous reservoir, as defined in paragraph (a)(2) of section 201.4-10(a) of Regulation S-X, or by other evidence using reliable technology establishing reasonable certainty.
|
Item 1.
Business
General
Gran Tierra Energy Inc. together with its subsidiaries (“Gran Tierra”, "us", "our", or “we”) is an independent international energy company engaged in oil and gas acquisition, exploration, development and production. We own the rights to oil and gas properties in Colombia, Argentina, Peru and Brazil.
Our principal executive offices are located at 300, 625-11th Avenue S.W., Calgary, Alberta, Canada. The telephone number at our principal executive offices is (403) 265-3221. All dollar ($) amounts referred to in this Annual Report on Form 10-K are United States (U.S.) dollars, unless otherwise indicated.
Development of Our Business
Our company was incorporated under the laws of the State of Nevada on June 6, 2003, originally under the name Goldstrike Inc. We made our initial acquisition of oil and gas producing and non-producing properties in Argentina in September 2005. Since then, we have acquired oil and gas producing and non-producing assets in Colombia, Peru, Argentina and Brazil, with our largest acquisitions being the acquisition of Solana Resources Limited (“Solana”) in 2008 and Petrolifera Petroleum Limited (“Petrolifera”) in 2011.
In
2013
:
|
•
|
in Colombia, we continued to focus on developing our producing conventional light oil fields, including Costayaco and Moqueta, and on the generation of exploration prospects;
|
|
•
|
in Argentina, we continued to focus on developing our producing fields, including the Surubi and Puesto Morales fields;
|
|
•
|
in Brazil, we added three onshore blocks to our core operating area in the Recôncavo Basin in the 2013 Brazil bid round 11;
|
|
•
|
in Peru, we completed drilling and testing of the Vivian formation sandstone reservoir in the Bretaña Norte 95-2-1XD exploration well and drilled a horizontal side-track extension of this well, completed a preliminary Front End Engineering Design ("FEED") study for the Bretaña field development and completed a 382 kilometer 2-D seismic program to provide a more detailed map of the Bretaña structure, along with maturing separate independent exploration leads on Block 95. Significant probable and possible reserves were added in Peru during 2013. We also received regulatory approval for the assignment of the remaining 40% working interest of Block 95; and received regulatory approval to assume operatorship of Blocks 123 and 129.
|
In the
year ended December 31, 2013
, we incurred capital expenditures of
$374.4 million
(excluding changes in non-cash working capital). In
2013
, capital expenditures included drilling expenditures of
$220.9 million
, geological and geophysical
7
(“G&G”) expenditures of
$93.0 million
, facilities expenditures of
$34.4 million
and other expenditures of
$26.1 million
. In 2013, we realized proceeds from oil and gas properties of
$59.6 million
.
Our acreage as of
December 31, 2013
, excluding acres where relinquishments and acreage changes were subject to various government approvals, included:
|
•
|
3.4 million
gross acres (
2.7 million
net) in Colombia covering
17
exploration and production contracts,
five
of which were producing and
15
of which were operated by Gran Tierra (excludes
1.0 million
gross and net acres on five blocks where relinquishments were subject to approval and acreage changes, also subject to approval, on a further three blocks);
|
|
•
|
1.3 million
gross acres (
0.9 million
net) in Argentina covering
11
exploration and production contracts,
eight
of which were producing and
nine
of which were operated by Gran Tierra;
|
|
•
|
47,734
gross acres (
47,734
net) in Brazil covering
seven
exploration blocks, one of which was producing and all of which were operated by Gran Tierra; and
|
|
•
|
5.8 million
gross acres (
5.8 million
net) in Peru covering
five
exploration licenses, none of which were producing and all of which were operated by Gran Tierra.
|
Oil and Gas Properties – Colombia

We have interests in
22
blocks in Colombia, and are the operator in
20
blocks. The Chaza, Guayuyaco, Garibay, Llanos-22 and Santana Blocks have producing oil wells. During the
year ended December 31, 2013
,
75%
of our consolidated production,
8
NAR adjusted for inventory changes, was from the Chaza Block. In 2013, we received proceeds of
$1.5 million
from the sale of our 15% working interest in the Mecaya Block.
Royalties
Colombian royalties are regulated under law 756 of 2002. All discoveries made subsequent to the enactment of this law have the sliding scale royalty described below. Discoveries made before the enactment of this law have a royalty of 20%. The Agencia Nacional de Hidrocarburos (National Hydrocarbons Agency) (“ANH”) contracts to which we are a party all have royalties that are based on a sliding scale described in law 756. This royalty works on an individual oil field basis starting with a base royalty rate of 8% for gross production of less than 5,000 BOPD. The royalty increases in a linear fashion from 8% to 20% for gross production between 5,000 and 125,000 BOPD, and is stable at 20% for gross production between 125,000 and 400,000 BOPD. For gross production between 400,000 and 600,000 BOPD the rate increases in a linear fashion from 20% to 25%. For gross production in excess of 600,000 BOPD the royalty rate is fixed at 25%. In addition to the sliding scale royalty, the Llanos-22, Sinu-1 and Sinu-3 Blocks have additional x-factor royalties of 1%, 3% and 17%, respectively.
For gas fields, the royalty is on an individual gas field basis starting with a base royalty rate of 6.4% for gross production of less than 28.5 MMcf of gas per day. The royalty increases in a linear fashion from 6.4% to 20% for gross production between 28.5 MMcf of gas per day and 3.42 Bcf of gas per day, and is stable at 16% for gross production between 712.5 to 2,280 MMcf of gas per day. For gross production between 2.28 to 3.42 Bcf of gas per day the rate increases in a linear fashion from 16% to 20%. For gross production in excess of 3.42 Bcf of gas per day the royalty rate is fixed at 20%.
Pursuant to the Chaza Block exploration and production contract (the "Chaza Contract") between the ANH and Gran Tierra, our production from the Costayaco Exploitation Area is also subject to an additional royalty (the "HPR royalty") that applies when cumulative gross production from an Exploitation Area is greater than five MMbbl. The HPR royalty is calculated on the difference between a trigger price defined in the Chaza Contract and the sales price. Pursuant to the Chaza Contract, any new Exploitation Area on the Chaza Block will also be subject to the HPR royalty once the production exceeds five MMbbl of cumulative production. The Moqueta Exploitation Area in the Chaza Block and the Jilguero Exploitation Area in the Garibay Block will each be subject to the HPR royalty once production from such Exploitation Areas has reached five MMbbl.
There is a dispute with the ANH as to whether the HPR royalty must be paid with respect to all production from the Moqueta Exploitation Area or only after production from the Moqueta Exploitation Area has reached five MMbbl (see “
Legal Proceedings”,
below, in Item 3)
.
As at
December 31, 2013
, total cumulative production from the Moqueta Exploitation Area was
2.3
MMbbl. The estimated HPR royalty that would be payable on cumulative production to that date if the ANH’s interpretation is successful is
$38.4 million
.
For exploration and production contracts awarded in the 2010 and 2012 Colombia Bid Rounds, the HPR royalty will apply once the production from the area governed by the contract, rather than any particular Exploitation Area designated under the contract, exceeds five MMbbl of cumulative production. We expect that this criterion for the HPR royalty will apply for subsequent bid rounds.
The Santana and Magangué Blocks have a flat 20% royalty as those discoveries were made before 2002. The Guayuyaco and Rio Magdalena Blocks have the sliding scale royalty but do not have the additional royalty.
In addition to these government royalties, our original interests in the Santana, Guayuyaco, Chaza, Rio Magdalena, and Azar Blocks acquired on our entry into Colombia in 2006 are subject to a third party royalty. The additional interests in Guayuyaco and Chaza that we acquired on the acquisition of Solana in 2008 are not subject to this third party royalty. On June 20, 2006, we entered into a participation agreement that would effectively compensate Crosby Capital, LLC ("Crosby") for its share in certain Colombian properties. The compensation is in the form of overriding royalty rights that apply to our original interests in production from the Santana, Guayuyaco, Chaza, Rio Magdalena, and Azar Blocks. The overriding royalty rights start with a 2% rate on working interest production less government royalties. For new commercial fields discovered within 10 years of the agreement date and after a prescribed threshold is reached, Crosby reserves the right to convert the overriding royalty rights to a net profit interest ("NPI"). This NPI ranges from 7.5% to 10% of working interest production less sliding scale government royalties, as described above, and operating and overhead costs. No adjustment is made for the HPR royalty. On certain pre-existing fields, Crosby does not have the right to convert its overriding royalty rights to an NPI. In addition, there are conditional overriding royalty rights that apply only to the pre-existing fields. Currently, we are subject to a 10% NPI on 50% of our working interest production from the Costayaco and Moqueta fields in the Chaza Block and 35% of our working interest production from the Juanambu field in the Guayuyaco Block, and overriding royalties on our working interest production from the Santana Block and the Guayuyaco field in the Guayuyaco Block.
9
Chaza Block
The Chaza Block covers
46,676
gross acres in the Putumayo Basin and is governed by the terms of an
Exploration and Exploitation Contract with the ANH
, which was signed June 27, 2005. We are the operator and hold a
100%
working interest in this block. The discovery of the Costayaco field in the Chaza Block was the result of drilling the Costayaco-1 exploration well in the second quarter of 2007. This well commenced production in July 2007. The discovery of the Moqueta field in the Chaza Block was the result of drilling the Moqueta-1 exploration well in the second quarter of 2010. During 2013, we applied for and were granted a second additional exploration program which extended the exploration phase of the contract to
June 26, 2015
. The second additional exploration program requires one exploration well to be drilled by June 26, 2015. The additional exploration program requires that 50% of this block's acreage, excluding exploitation and evaluation areas, be relinquished, however, we have not yet received final documentation from the ANH for this acreage change. This block includes
25
producing wells in two fields — Costayaco and Moqueta. The production phase for the Costayaco field will end in
2033
and for the Moqueta field will end in 2037. After the expiration of the production phase, we must carry out an abandonment program to the satisfaction of the ANH. In conjunction with the abandonment, we must establish and maintain an abandonment fund to ensure that financial resources are available at the end of the contract.
In
2013
, we drilled and completed the Moqueta-10 and -11 development wells and the Costayaco-18 development well as oil producers, completed drilling the Moqueta-12 development well and commenced drilling the Zapotero-1 and Corunta-1 exploration wells. We also drilled the Moqueta-9 well. Additionally, we continued facilities work at the Costayaco and Moqueta fields. Subsequent to year-end, we completed initial testing of the Moqueta-12 development well and decided to abandon the Corunta-1 exploration well due to drilling problems prior to reaching the reservoir target on this long-reach deviated well. The target location will be drilled again this year with a revised drilling plan.
In
2014
, we plan to drill three oil exploration wells, one appraisal well and eight development wells on the Chaza Block. We also plan to perform additional facilities work on this block.
Guayuyaco Block
The Guayuyaco Block contract was signed in September 2002 and covers
52,366
gross acres in the Putumayo Basin, which includes the area surrounding the producing fields of the Santana contract area. The Guayuyaco Block is governed by an
Association Contract with Ecopetrol
S.A. (“Ecopetrol”), the Colombian majority state owned oil company. We are the operator and have a
70%
working interest, with the remaining interest held by Ecopetrol. Ecopetrol has the option to back-in to a 30% participation interest in any other new discoveries in the block. We have completed all of our obligations in relation to this contract.
This block includes
six
gross producing wells in two fields — Guayuyaco and Juanambu. The Guayuyaco field was discovered in 2005. The production phase of the contract will end in
2030
, following which, the property will be returned to the government upon expiration of the production contract, and we are not obligated to perform remediation work.
In
2013
, we drilled one gross exploration well, Miraflor Oeste-1, which resulted in an oil discovery, and performed facilities upgrades on this block. In
2014
, we also plan to acquire 80 kilometers of 2-D seismic on the Verdeyaco prospect and plan to perform further facilities upgrades on this block.
Garibay Block
Solana acquired the Garibay Block in October 2005. The block covers
75,936
gross acres in the Llanos Basin and we have a non-operated
50%
working interest. Compania Espanola de Petroleos Colombia, S.A.U. (“CEPCOLSA”), a wholly-owned subsidiary of Compañia Española de Petróleos S.A., has the remaining interest and is the operator. This block includes
one
gross producing well in the Jilguero field. The block is held under an
Exploration and Exploitation Contract with the ANH
. We applied for and were granted a second additional exploratory program which extended the
exploration
phase of the contract to
October 24, 2015
. There is an obligation to drill one exploration well in this exploration phase. The additional exploration program requires that 50% of this block's acreage, excluding exploitation and evaluation areas, be relinquished; however, we have not yet received final documentation from the ANH for this acreage change. In
2013
, we acquired 80 square kilometers of 3-D seismic on this block. In
2014
, we plan to drill one gross oil exploration well and perform additional facilities work on this block.
10
Llanos-22 Block
During 2011, we earned a
45%
non-operated working interest in the Llanos-22 Block in the Llanos Basin pursuant to farm-out agreements with CEPCOLSA (CEPCOLSA retained a 55% working interest and operatorship). CEPCOLSA farmed-in for a 30% working interest on the Piedemonte Norte Block. The Llanos-22 Block is held under an
Exploration and Exploitation Contract with the ANH
and covers
42,388
gross acres. The second exploration phase of the contract ended on
February 4, 2014
and required one exploration well to be drilled. This obligation was satisfied by the completion of the Mayalito-1P oil exploration well and the relinquishment of 50% of this block in 2013. An oil discovery was made at the Mayalito-1P oil exploration well. We must decide whether to enter the first additional exploration phase by April 4, 2014
At December 31, 2013, this block had one gross oil producing well in the Ramiriqui field and the Mayalito-1P oil exploration well was on a short-term production test. In 2013, we also commenced seismic reprocessing and G&G studies. In
2014
, planning is underway to put this well on long-term production test and we plan to perform additional facilities work on this block.
Santana Block
The Santana Block contract was signed in July 1987 and covers
1,119
gross acres in the Putumayo Basin and includes
nine
gross producing wells in four fields — Linda, Mary, Miraflor and Toroyaco. Activities are governed by terms of a
Shared Risk Contract with Ecopetrol
and we are the operator. We hold a
35%
working interest in all fields and Ecopetrol holds the remaining interest. The block has been producing since 1991. Under the Shared Risk Contract, Ecopetrol initially backed into a 50% working interest upon declaration of commerciality in 1991. In June 1996, when the block reached seven MMbbl of oil produced, Ecopetrol had the right to back into a further 15% working interest, which it exercised, for a total ownership of 65%. We have completed all of our obligations in relation to the contract. The production phase of the contract will end in
2015
, at which time the property will be returned to the Ecopetrol and we will not be obligated to perform remediation work.
In
2013
, we performed workovers on this block. No significant capital expenditures are planned for
2014
.
Sierra Nevada Block
We acquired our interest in the Sierra Nevada Block through the Petrolifera acquisition in March 2011. The Sierra Nevada Block is located in the Lower Magdalena Basin and covers
178,162
gross acres. We have submitted documentation to the ANH to relinquish the exploration area of this block such that our remaining acreage in the commercial field would be 1,309 gross acres. This acreage change is subject to receipt of final documentation from the ANH. We are the operator of the block with a
100%
working interest. The block is held under an
Exploration and Exploitation Contract with the ANH
and a third party has a 1% overriding royalty right on the block. We are currently in an evaluation program period for the Brillante Discovery which will end on June 30, 2014. No work obligations remain on this block.
In
2013
, there were no significant capital expenditures on this block, and no significant capital expenditures are planned for
2014
.
Piedemonte Norte Block
In June 2009, we completed the conversion of our Technical Evaluation Areas (“TEA”) in the Putumayo Basin to blocks with
Exploration and Exploitation Contracts with the ANH
. The Piedemonte Norte Block covers
78,742
gross acres in the Putumayo Basin and we hold a
70%
working interest. In 2011, we farmed out 30% of the block to CEPCOLSA, but retained operatorship. This asset swap was in connection with the Llanos-22 Block farm-in agreement. The
first
exploration
phase was to end on
October 10, 2012
, and required the acquisition, processing and interpretation of
70 kilometers of 2-D seismic
. This block was under suspension from December 17, 2010, to January 4, 2014, and we have applied for a further suspension.The exploitation phase would end 24 years after commerciality, if a discovery is made and its development is approved.
In
2013
, there were no significant capital expenditures on this block, and no significant capital expenditures are planned for
2014
.
Piedemonte Sur Block
The Piedemonte Sur Block was part of the Putumayo West A TEA and became an exploration block with an
Exploration and Exploitation Contract with the ANH
in June 2009. The Piedemonte Sur Block covers
73,898
gross acres in the Putumayo Basin. We are the operator of the block with a
100%
working interest. We are in a
unified phase two and three
of six
11
exploration phases. This unified phase required the acquisition of 55 kilometers of 2-D seismic and the drilling of one exploration well by July 26, 2013; however, we applied for and were granted an extension of this phase to
February 9, 2014
. We applied for an additional extension and were granted an extension to May 23, 2014, but have applied for a longer extension of the phase. The exploration phase will end in February 2017 and the exploitation phase would end 24 years after commerciality, if a discovery is made and its development is approved.
In
2013
, we acquired 2-D seismic and performed environmental impact assessments ("EIA"s) on this block. No significant capital expenditures are planned for
2014
.
Cauca-6 Block
We were awarded the Cauca-6 Block in the 2010 Colombia Bid Round. The block covers
571,098
gross acres in the Cauca Basin. We are the operator of the block with a
100%
working interest. The block is held under a
TEA Contract with the ANH
. We are in the
exploration
phase of the contract which requires the
acquisition of 200 kilometers of 2-D seismic and the drilling of one stratigraphic well
by
December 15, 2014
. After the end of the current exploration phase, we may convert this TEA contract into an Exploration and Exploitation Contract.
In
2013
, there were no significant capital expenditures on this block. In
2014
, we plan to acquire 214 kilometers of 2-D seismic on this block.
Cauca-7 Block
We were awarded the Cauca-7 Block in the 2010 Colombia Bid Round. The block covers
785,451
gross acres in the Cauca Basin. We are the operator of the block with a
100%
working interest. The block is held under a
TEA Contract with the ANH
. The
exploration
phase of the contract requires
the acquisition of 250 kilometers of 2-D seismic and the drilling of one stratigraphic well
by
December 15, 2014
, however, we have applied for an extension of this phase. After the end of the current exploration phase, we may convert this TEA contract into an Exploration and Exploitation Contract.
In
2013
, we commenced the acquisition of 2-D seismic on this block. In
2014
we plan to acquire 253 kilometers of 2-D seismic on this block.
Putumayo 10 Block
We were awarded the Putumayo 10 Block in June 2010 in the 2010 Colombia Bid Round. The block covers
114,097
gross acres in the Putumayo Basin. We are the operator of the block with a
100%
working interest. The block is held under an
Exploration and Exploitation Contract with the ANH
. We are in the
first
of two
exploration
phases of the contract. This phase requires
the acquisition of 73 kilometers of 2-D seismic and two exploration wells to be drilled
by
September 15, 2014
; however, we applied for an extension of this phase. The exploration phase ends in September 2017 and the exploitation phase would end 24 years after commerciality, if a discovery is made and its development is approved.
In
2013
, we continued work to obtain the necessary environmental and social permits for a future seismic program and, in
2014
, we plan to acquire 100 kilometers of 2-D seismic on this block.
Putumayo 1 Block
We acquired a
55%
operated working interest in the Putumayo-1 Block in 2010. The block covers
114,881
gross acres in the Putumayo Basin. The block is held under an
Exploration and Exploitation Contract with the ANH
. We are in the
first
of two
exploration
phases. This phase required
the acquisition of 159 square kilometers of 3-D seismic and one exploration well to be drilled
by May 3, 2012; however, we requested and were granted an extension to
March 3, 2014
. Operations were suspended on this block due to security issues in the area, but recommenced in December 2013, and we have requested an additional extension. The exploration phase ends in March 2017 and the exploitation phase would end 24 years after commerciality, if a discovery is made and its development is approved.
In
2013
, we commenced 3-D seismic on this block. In
2014
, we plan to acquire 228 square kilometers of 3-D seismic and drill one gross oil exploration well on this block.
12
Catguas A and B Blocks
Solana acquired the Catguas Block in November 2005. We are the operator of the block which covers
330,355
gross acres in the Catatumbo Basin. The block is held under an
Exploration and Exploitation Contract with the ANH
. We have a
100%
working interest in the block; however, in December 2005, Solana and its partner signed a participation agreement whereby they defined the areas A and B and distributed them between the partners in the block. The participation agreement would transfer a 15% working interest in the southern part of the block (Catguas B) and a 50% working interest in the remainder of the block (Catguas A) to our partner. This agreement will be subject to approval by ANH. Catguas A covers
74,119
gross acres and Catguas B covers
256,236
gross acres. We are in a unified phase two and three of six exploration periods in the contract. This phase was to end in
May 2007
; however, the block contract is under suspension by ANH as a result of force majeure. This phase requires
three exploratory wells to be drilled, or two exploratory wells and one re-entry, and the acquisition of 50 square kilometers of 3-D seismic
. We may elect to enter into up to two subsequent exploration periods of 12 months each in length, which both require the drilling of one exploration well. The exploitation phase would end 24 years after commerciality, if a discovery is made and its development is approved.
In
2013
, there were no significant capital expenditures on this block, and no significant capital expenditures are planned for
2014
.
Sinu-1 Block
We acquired a
60%
operated working interest in the Sinu-1 Block in the 2012 Colombia Bid Round. The block covers
503,000
gross acres in the Sinu Basin. The block is held under an
TEA Contract with the ANH
. We are in the
community consultation
phase which will end on
February 28, 2014
.
In
2013
, we conducted community consultations and commenced G&G studies. In
2014
, we plan to acquire aeromagnetic surveys and commence the acquisition of 478 kilometers of 2-D seismic program on this block.
Sinu-3 Block
We acquired a
51%
operated working interest in the Sinu-3 Block in the 2012 Colombia Bid Round. The block covers
483,000
gross acres in the Sinu Basin. The block is held under an
Exploration and Exploitation Contract with the ANH
. We are in the
first
exploration
phase which will end on
September 11, 2016
, and requires
the acquisition of 488 kilometers of 2-D seismic, one exploration well to be drilled and 1,248 kilometers of regional studies
.
In
2013
, we conducted community consultations and commenced G&G studies. In
2014
, we plan to acquire aeromagnetic surveys and commence the acquisition of 488 kilometers of 2-D seismic on this block.
Turpial Block
We acquired our interest in the Turpial Block through the Petrolifera acquisition in March 2011. The Turpial block is located in the Middle Magdalena Basin and covers
111,066
gross acres. We are currently the operator of the block and hold a
50%
working interest and our partner holds the remaining working interest. However, we have indicated our withdrawal from the block and are attempting to transfer our interest and operatorship to our partner. The block is held under an
Exploration and Exploitation Contract with the ANH
and a third party has a 1% overriding royalty right on the block. We are in the
fifth
phase of six
exploration
phases. The fourth exploration phase required one exploration well to be drilled by November 3, 2013, but we applied for and were granted an extension to drill the well until March 21, 2014. We have started the ANH's fulfillment process. The fifth exploration phase requires an additional exploration well to be drilled by October 4, 2014. We expect that a third party will pay all costs in relation to the operation of this block. The exploration phase will end in August 2015 and the exploitation phase would end 24 years after commerciality, if a discovery is made and its development is approved.
In
2013
, there were no significant capital expenditures on this block and no significant capital expenditures are planned for
2014
.
Magdalena Block
We acquired our interest in the Magdalena Block through the Petrolifera acquisition in March 2011. The Magdalena Block is located in the Lower Magdalena Basin and covers
594,803
gross acres. We are the operator of the block with a
100%
working interest. The block is held under an
Exploration and Exploitation Contract with the ANH
and a third party has a 1% overriding royalty right on the block. The
third
of six
exploration
phases ended on
May 1, 2013
, and required one exploration well to be
13
drilled; however, we requested and were granted approval to change the work obligation to a 2-D seismic program. We have applied to the ANH to relinquish our interest in this block.
In
2013
, we acquired 2-D seismic on this block. No significant capital expenditures are planned for
2014
.
Magangué Block
Solana acquired the Magangué Block in October 2006. It is held pursuant to an
Association Contract with Ecopetrol
and covers
20,647
gross acres in the Lower Magdalena Basin. We are the operator of the block with a
42%
working interest and our partner Ecopetrol has the remaining working interest. We have completed all of our obligations in relation to the contract. We have applied to Ecopetrol to relinquish our interest in this block.
In
2013
, there were no significant capital expenditures on this block and no significant capital expenditures are planned for
2014
.
Azar Block
We have a
100%
working interest in the Azar Block.This block covers
47,224
gross acres in the Putumayo Basin and we are the operator. The block is held under an
Exploration and Exploitation Contract with the ANH
and we do not have any further work commitments on this block. We had entered into agreements to transfer a portion of our working interest to third parties, however, this transfer will not be completed before the ANH, as this block is in a relinquishment process
In
2013
, there were no significant capital expenditures on this block and no significant capital expenditures are planned for
2014
.
Rumiyaco Block
The Rumiyaco Block was part of the Putumayo West B TEA and became an exploration block with an
Exploration and Exploitation Contract with the ANH
in June 2009. Rumiyaco covers
82,624
gross acres in the Putumayo Basin. We are the operator of the block with a
100%
working interest. We have applied to the ANH to relinquish our interest in this block and do not have any further work commitments on this block.
In
2013
, there were no significant capital expenditures on this block and no significant capital expenditures are planned for
2014
.
Rio Magdalena Block
The Rio Magdalena
Association Contract with Ecopetrol
was signed in February 2002. The Rio Magdalena Block covers
36,154
gross acres in the Magdalena Basin. We are the operator of the block, hold a
70%
working interest and do not have any further work commitments on this block.We had entered into an agreement to transfer a portion of our working interest to a third party, however, this transfer will not be completed before Ecopetrol, as this block is in a relinquishment process.
In
2013
, there were no significant capital expenditures and no significant capital expenditures are planned for
2014
.
14
Oil and Gas Properties – Argentina
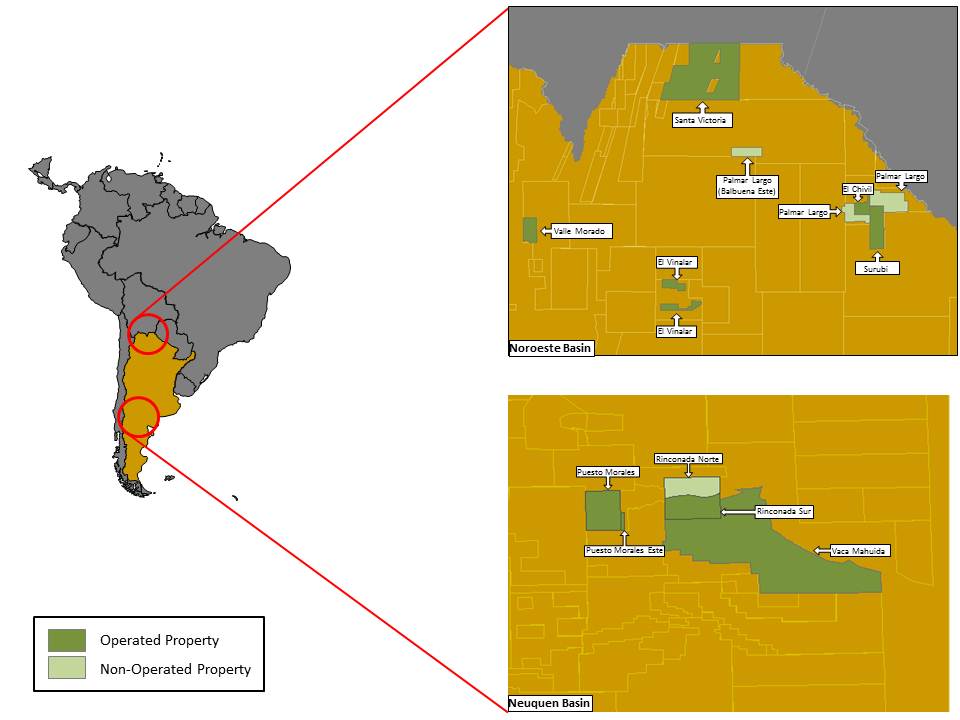
Our Argentina properties are located in the Noroeste Basin in northern Argentina and the Neuquen Basin in central Argentina. During 2013, we assumed our partners' 50% working interests in the Santa Victoria Block and the El Vinalar Block. The Puesto Morales, Puesto Morales Este, Rinconada Norte, Rinconada Sur, Surubi, El Chivil, Palmar Largo and El Vinalar Blocks have producing oil wells and the Puesto Morales Block also has producing gas wells. During the
year ended December 31, 2013
,
8%
of our consolidated production, NAR adjusted for inventory changes, was from the Puesto Morales Block and
5%
was from the Surubi Block. For all of our blocks in Argentina, upon expiry of the block rights, ownership of producing assets will revert to the provincial governments.
Some of our oil production in Argentina is trucked to a local refinery, therefore, sales of oil in the Noroeste Basin may be seasonally delayed by adverse weather and road conditions, particularly during the months November through February when the area is subject to periods of heavy rain and flooding. While storage facilities are designed to accommodate ordinary disruptions without curtailing production, delayed sales will delay revenues and may adversely impact our working capital position in Argentina.
Royalties in Argentina are based on a provincial royalty plus an additional provincial turnover tax. The provincial royalty rate is 24% for the Puesto Morales Este Block and 12% on all other blocks in Argentina. The provincial turnover tax ranges from 1.5% to 3% on our blocks.
Rio Negro Province, which includes the Puesto Morales, Puesto Morales Este, and Rinconada Sur Blocks, has enacted new legislation that changes the royalty regime associated with concession agreement extensions. Royalties in Rio Negro Province are expected to increase a minimum of 3.5% and required bonus payments, not determinable at this time, are being negotiated for the concession agreement extension. In addition, there is an additional royalty component of 0.5% per dollar per bbl on
15
realized oil prices greater than $80 per bbl and 0.5% per dollar per MMBtu for gas prices above $3.50 per MMBtu. Under the new legislation, negotiations are required to be carried and the resulting new terms are expected to come into effect immediately thereafter. Negotiations are still in progress between the Rio Negro Province and t
he largest p
roducers in the area. After terms are finalized between these parties, it is expected that these terms will form the starting base for negotiations with the smaller producers such as Gran Tierra.
Puesto Morales Block
We acquired our interest in the Puesto Morales Block through the Petrolifera acquisition in March 2011. The Puesto Morales Block covers
31,254
gross acres. We are the operator of the block with a
100%
working interest. The contract was awarded on October 18, 2010, and the
exploitation
phase we are currently in will end on
January 22, 2016, with a possible ten year extension
. We have commenced negotiations for an extension. We have no work obligations on this block.
In
2013
, we drilled and completed two development wells, PMN-1130-SB and PMN-1131-SB, on this block. Both wells are on production. We also commenced drilling a horizontal multi-stage fracture stimulated well into the Loma Montosa formation on this block to further evaluate this new play. Work on this well was suspended due to landowner blockades that prevented safe operations. We are planning to recommence drilling in 2014 based on rig availability. We also completed workovers and facilities upgrades on this block. In
2014
, we plan to drill one development well, continue the workover program and perform further facilities upgrades.
Surubi Block
We purchased the Surubi Block in late 2006. We are the operator of the Surubi Block, which covers
90,824
gross acres, and have an
85%
working interest. In 2008, we drilled the Proa-1 discovery well, which began production in September 2008. In 2012, we drilled the Proa-2 well, which began production in April 2012. In April 2008, the provincial oil company, Recursos Energeticos Formosa S.A., farmed-in to the block for a 15% working interest. The contract for this block will end on
August 17, 2026
. We have no work obligations on this block.
In
2013
, we performed facilities upgrades and purchased materials in preparation for drilling a development well on this block. In
2014
, we plan to drill one gross development well and perform additional facilities work.
Rinconada Sur Block
We acquired our interest in the Rinconada Sur Block through the Petrolifera acquisition in March 2011. The Rinconada Sur Block covers
28,417
gross acres and is part of the Puesto Morales concession. We are the operator of the block with a
100%
working interest. The contract was awarded on October 18, 2010, and the
exploitation
phase we are currently in will end on
January 22, 2016, with a possible ten year extension
. We have no work obligations on this block.
In
2013
, there were no significant capital expenditures and no significant capital expenditures are planned for
2014
.
Puesto Morales Este Block
We acquired our interest in the Puesto Morales Este Block through the Petrolifera acquisition in March 2011. The Puesto Morales Este Block covers
1,532
gross acres. We are the operator of the block with a
100%
working interest. The contract was awarded on October 18, 2010, and the
exploitation
phase we are currently in will end on
October 17, 2035, with a possible five year extension
. We have no work obligations on this block.
In
2013
, there were no significant capital expenditures and no significant capital expenditures are planned for
2014
.
Rinconada Norte Block
We acquired our interest in the Rinconada Norte Block through the Petrolifera acquisition in March 2011. The Rinconada Norte Block covers
23,475
gross acres. We have a
35%
non-operated working interest. Our partner is the operator and has the remaining working interest. This is an
exploitation
concession and the exploitation phase will end on
January 22, 2016, with a possible ten year extension
. We have no work obligations on this block.
In
2013
, there were no significant capital expenditures and no significant capital expenditures are planned for
2014
.
16
El Chivil Block
We purchased the El Chivil Block in 2006. We are the operator and hold a
100%
working interest in the block which covers
30,394
gross acres. The contract for this block will end on
September 7, 2015, with a possible ten year extension
. We have no work obligations on this block.
In
2013
, regular field maintenance and workover activities were performed. In
2014
, we plan to perform facilities upgrades.
Palmar Largo Block
We purchased a
14%
non-operated working interest in the Palmar Largo Block in September 2005. Three partners hold the remaining working interest. The Palmar Largo Block covers
186,688
gross acres. This asset comprises several producing oil fields in the Noroeste Basin and is subdivided into three sub-blocks. The Palmar Largo Block contract will end in
2017, with a possible ten year extension
. We have no work obligations on this block.
In
2013
, there were no significant capital expenditures and no significant capital expenditures are planned for
2014
.
El Vinalar Block
In June 2006, we acquired a 50% working interest in the El Vinalar Block. In November 2013, we acquired the remaining 50% working interest from our partner. We are the operator of the block, which covers
61,035
gross acres. The El Vinalar Block contract will end on
April 19, 2016, with a possible ten year extension
. We have no work obligations on this block.
In
2013
, there were no significant capital expenditures, other than the costs of acquiring our partner's working interest. In
2014
, we plan to perform facilities upgrades.
Valle Morado Block
We purchased our original interest in the Valle Morado Block in 2006 and purchased a further 3.4% working interest during 2011. This block covers
49,099
gross acres and we are the operator with a
96.6%
working interest. The Valle Morado GTE.St.VMor-2001 well was first drilled in 1989. A previous operator completed a 3-D seismic program over the field and constructed a gas plant and pipeline infrastructure. Production began in 1999 from the GTE.St.VMor-2001 well, but was shut-in in 2001 due to water incursion. During 2008, we performed long-term testing on the well. In July 2010, we commenced a re-entry and sidetrack operation on the well; however, these operations were suspended in February 2011 and the wellbore was abandoned due to operational challenges. We continue to review alternatives associated with the field development. The contract for this block expires in
2034
. We have no work obligations on this block.
In
2013
, there were no significant capital expenditures and no significant expenditures are planned for
2014
.
Santa Victoria Block
We purchased the Santa Victoria Block in 2006. This block covers
516,846
gross acres. We are the operator and have a
100%
working interest. In 2011, we relinquished 50% of the block as a condition to enter into the second phase and also farmed-out 50% of our working interest. In 2013, we assumed our partner's 50% working interest in this block. We are in the
second
of three
exploration
phases. This phase required
one exploration well to be drilled or 720 units of work ($3.6 million) to be completed
by
March 29, 2013
, but we have commenced negotiations to extend the expiry date of this phase. The exploration phase ends in March 2014.
In
2013
, there were no significant capital expenditures. In
2014
, we plan to evaluate the potential to drill a gas exploration well.
Vaca Mahuida Block
We acquired our interest in the Vaca Mahuida Block through the Petrolifera acquisition in March 2011. This block covers
232,798
gross acres. We are the operator and have a
25%
working interest. Our three partners share the remaining working interest. After three gas discoveries in 2010, an
exploitation
concession was requested and we are awaiting regulatory approval. We satisfied our obligation to perform long-term production gas tests and are evaluating the potential of these prospects and the block. We have no work obligations on this block.
In
2013
, there were no significant capital expenditures and no significant capital expenditures are planned for
2014
.
17
Oil and Gas Properties - Brazil

We have interests in seven blocks in Brazil, and are the operator in all of these blocks. Our Brazilian properties are located in the Recôncavo Basin in Eastern Brazil in the State of Bahia. Block 155 in the Recôncavo Basin has
three
producing oil wells. During 2013, we added three exploration blocks in Brazil through the 2013 bid round and relinquished our interest in Block BM-CAL-7 in the Camamu Basin, offshore Bahia.
All of our blocks in Brazil are subject to an 11% royalty, which consists of a 10% crown royalty and a 1% landowner royalty.
Blocks REC-T-129, REC-T-142, REC-T-155, and REC-T-224
Blocks REC-T-129, REC-T-142, REC-T-155 and REC-T-224 are located approximately 70 kilometers northeast of Salvador, Brazil in the Recôncavo Basin and cover
27,076
gross acres. We are the operator of these blocks with a
100%
working interest. In September 2012, we received declaration of commerciality for the Tiê field on Block REC-T-155. The
second
exploration
phase for all four blocks ended during the
fourth quarter of 2013
. This phase required the drilling of an exploration well on each block which was satisfied by drilling the 1-GTE-06HP-BA exploration well on REC-T-Block 129, the GTE-05HP-BA exploration well on Block REC-T-142 and the 1-GTE-08DP-BA exploration well on Block REC-T-155. A work commitment for an exploration well remains on Block REC-T-224. We have applied for an extension on Blocks REC-T-129, REC-T-142 and REC-T-155 and a suspension on REC-T-224 and are waiting for feedback from the ANP on our applications.
In
2013
, on Block REC-T-155, we drilled an exploration well, 1-GTE-8DP-BA, and a horizontal sidetrack oil exploration well, 1-GTE-7HPC-BA, from the 1-GTE-7-BA wellbore. Both of these wellbores are currently suspended awaiting fracture stimulation. On Block REC-T-129, we re-entered and isolated the final two fracture stages at the horizontal sidetrack oil exploration well, 1-GTE-6HP-BA.
18
In
2014
, we plan to perform additional facilities work in the Tiê field and continue the study of two unconventional resource plays through core analysis, geochemistry studies, 3D seismic re-processing and evaluating ongoing fracture stimulation test results, among other activities in an effort to establish the commercial viability of the resource opportunity in oil-saturated tight sandstones and shales in the Recôncavo Basin.
Blocks REC-T-86, REC-T-117 and REC-T-118
We were awarded Blocks REC-T-86, REC-T-117 and REC-T-118 in the 2013 Brazil Bid Round 11. These blocks are located north of our other blocks in the Recôncavo Basin and cover
20,658
gross acres. We are the operator with a
100%
working interest. Concession Agreements were executed on August 30, 2013. All three blocks are in the
first
exploration
phase which will end in
August 2016
. This phase requires the acquisition of a total of 120 square kilometers of 3-D seismic on the three blocks and two exploration wells to be drilled on Block REC-T-117 and three exploration wells on Block REC-T-118.
In
2013
, there were no significant capital expenditures, other than the signature bonuses paid in connection with the 2013 Brazil Bid Round 11. In
2014
, we plan to acquire a total 120 square kilometers of 3-D seismic on these three blocks.
Oil and Gas Properties - Peru
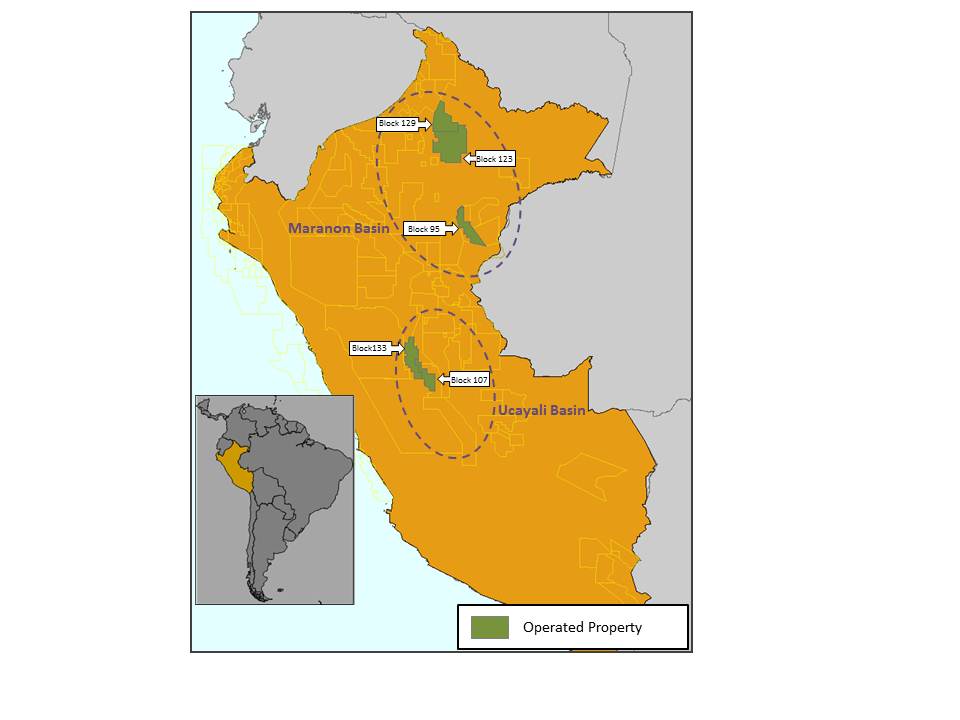
We have interests in five blocks in Peru and we are the operator in each of the blocks. All blocks in Peru are subject to a license agreement with PeruPetro. There is a 5-20%, sliding scale, royalty rate on the lands, dependent on production levels. Production less than 5,000 BOPD is assessed a royalty of 5%. For production between 5,000 and 100,000 BOPD there is a linear sliding scale between 5% and 20%. Production over 100,000 BOPD has a flat royalty of 20%. This royalty structure applies to all blocks in Peru in which we have an interest. Block 133 has an additional royalty 'X' factor of 15%.
19
Block 95
In December 2010, we acquired a 60% working interest in Block 95. During the first quarter of 2013, we acquired the remaining 40% working interest. We are the operator of this block. Block 95 has an area of
872,002
gross acres. An oil field has already been discovered on Block 95, with a discovery well drilled in 1974 flowing 807 BOPD naturally without pumps. The third
exploration
period of the contract required the drilling of one well or the completion of 400 units of work and the relinquishment of 31.58% of the block. This obligation was satisfied by the Bretaña Norte 95-2-1XD exploration well, which we completed drilling in the first quarter of 2013, and the relinquishment of 31.58% of the block. We are in the
fourth
exploration
period of six which requires the acquisition of 75 square kilometers of 3-D seismic or the completion of 225 units of work and the relinquishment of further acreage in the block by
June 27, 2014
. At the end of the fourth period, we will have relinquished a total of 50% of the block's acreage.The exploration period is currently due to end on December 27, 2015, and the exploitation period on December 27, 2038, but these periods would be extended in the event of force majeure.
In
2013
, in addition to the completion of drilling of Bretaña Norte 95-2-1XD exploration well, we completed drilling a horizontal side-track extension of this well. We also completed a preliminary FEED study for the Bretaña field development and completed a 382 kilometer 2-D seismic program to provide a more detailed map of the Bretaña structure, along with maturing separate independent exploration leads on Block 95. The 2013 2-D seismic program satisfied the fourth period work obligation. In
2014
, we plan to drill a water disposal well and an appraisal well in the Bretaña field. In addition, crude oil processing and loading facilities are expected to be completed in order to initiate long-term test production in 2014.
Block 123 and Block 129
In September 2010, we acquired a 20% working interest in Block 123 and Block 129. In October 2012, we increased our working interest in Blocks 123 and 129 to
100%
through the assumption of our partners' interests and assumed operatorship in January 2013. Blocks 123 and 129 have a total area of
3,491,240
gross acres. We are in the
third
exploration
period of five on Block 123, which was to end on November 29, 2012, but we applied for and were granted two three month extensions to May 29, 2013. However, this block has been under force majeure since April 29, 2013, to allow us time to assume operatorship. The current period requires one exploration well to be drilled or 300 units of work. This obligation was satisfied by acquisition of 318 kilometers of 2-D seismic prior to assuming operatorship. On Block 129, the
third
exploration
period of five was due to end on February 26, 2013, but we applied for and were granted a six month extension to August 26, 2013. However, this block has been under force majeure since July 17, 2013, to allow us time to assume operatorship. This period required one exploration well to be drilled or 204 units of work. This obligation was satisfied by the acquisition of 252 kilometers of 2-D seismic by our former partners on this block.
In
2013
, we continued work to obtain the necessary environmental and social permits for future drilling programs. In
2014
, we plan to continue the permitting process.
Block 107
We acquired our interest in Block 107 through the Petrolifera acquisition in March 2011. Block 107 covers
623,504
gross acres. We are the operator of the block with a
100%
working interest and a third party has a 3% overriding royalty right on the block. We are in the
fourth
and final
exploration
period, which requires one exploration well to be drilled or 300 units of work, but we applied for and approval was granted to change the work obligation to the acquisition of 300 kilometers of 2-D seismic. The block was under force majeure from May 25, 2012 to August 20, 2013 and has been under force majeure from September 25, 2013, due to delays in the permitting process. We have applied for an extension of the exploration period.
In
2013
, we continued work to obtain the necessary environmental and social permits for future seismic programs. In
2014
, we plan to complete a 312 kilometer 2-D seismic program, which will satisfy our fourth period work obligation, and begin pre-drilling activities.
Block 133
We acquired our interest in Block 133 through the Petrolifera acquisition in March 2011. Block 133 covers
764,320
gross acres. We are the operator of the block with a
100%
working interest. The second exploration period required that 20.96% of this block's acreage be relinquished, which occurred upon the end of the second exploration period in October 2013. We are in the
third
exploration
period of four. This period requires
one exploration well to be drilled or the completion of 300 units of work
, but is currently suspended pending the approval of a 2-D seismic and drilling program and pre-drilling EIAs.
20
In
2013
, we completed an aeromagnetic and aerogravity survey which satisfied the second exploration period work obligation. In
2014
, we plan to continue environmental impact assessments.
Estimated Reserves
The following table sets forth our estimated reserves NAR as of
December 31, 2013
. The process of estimating oil and gas reserves is complex and requires significant judgment, as discussed in Item 1A. “Risk Factors”. The reserve estimation process requires us to use significant decisions and assumptions in the evaluation of available geological, geophysical, engineering and economic data for each property. Therefore the accuracy of the reserve estimate is dependent on the quality of the data, the accuracy of the assumptions based on the data, and the interpretations and judgment related to the data.
We have developed internal policies for estimating and evaluating reserves. The policies we have developed are applied company wide, and are comprehensive in nature. Our internal controls over reserve estimates include reconciliation and review controls, including an independent internal review of assumptions used in the estimation by our reserves committee, and 100% of our reserves are evaluated by an independent reservoir engineering firm, GLJ Petroleum Consultants Ltd., at least annually.
The primary internal technical person in charge of overseeing the preparation of our reserve estimates is the General Manager of Engineering and Development Planning. He has a Bachelor of Science degree in petroleum engineering and is a professional engineer and member of the Association of Professional Engineers, Geologists and Geophysicists of Alberta. He is responsible for our engineering activities including reserves reporting, asset evaluation, reservoir management, and field development. He has over 30 years of industry experience in various domestic and international engineering and management roles.
The technical person responsible for overseeing the reserves evaluation is a Vice President, Corporate Evaluations of GLJ Petroleum Consultants Ltd. He has a Bachelor of Science degree in engineering physics and is a registered professional engineer in the Province of Alberta. He has over 20 years of industry experience in various domestic and international engineering and management roles.
By applying our policies we have developed SEC compliant reserve estimates and disclosures. Our policies are applied by all staff involved in generating and reporting reserve estimates including geological, engineering and finance personnel. Calculations and data are reviewed at multiple levels of the organization to ensure consistent and appropriate standards and procedures.
The Company’s
2013
proved reserves additions were based on estimates generated through the integration of relevant geological, engineering, and production data, utilizing technologies that have been demonstrated in the field to yield repeatable and consistent results as defined in the SEC regulations. Data used in these integrated assessments included information obtained directly from the subsurface through wellbores, such as well logs, reservoir core samples, fluid samples, static and dynamic pressure information, production test data, and surveillance and performance information. The data utilized also included subsurface information obtained through indirect measurements such as seismic data. The tools used to interpret the data included proprietary and commercially available seismic processing software and commercially available reservoir modeling and simulation software. Reservoir parameters from analogous reservoirs were used to increase the quality of and confidence in the reserves estimates when available. The method or combination of methods used to estimate the reserves of each reservoir was based on the unique circumstances of each reservoir and the dataset available at the time of the estimate.
The product prices that were used to determine the future gross revenue for each property reflect adjustments to the benchmark prices for gravity, quality, local conditions, and/or distance from market. The average realized prices for reserves in the report are:
|
Light/Medium Oil USD/bbl) - Argentina
|
$
|
73.47
|
|
|
|
Natural Gas (USD/Mcf) - Argentina
|
$
|
4.85
|
|
|
|
NGLs (USD/bbl) - Argentina
|
$
|
75.91
|
|
|
|
Light/Medium Oil (USD/bbl) - Brazil
|
$
|
90.70
|
|
|
|
Natural Gas (USD/Mcf) - Brazil
|
$
|
4.69
|
|
|
|
Oil and NGLs (USD/bbl) - Colombia
|
$
|
101.31
|
|
|
|
Natural Gas (USD/Mcf) - Colombia
|
$
|
2.00
|
|
|
|
Heavy Oil (USD/bbl) Peru
|
$
|
87.52
|
|
|
21
No estimates of reserves comparable to those included herein have been included in a report to any federal agency other than the SEC.
|
Liquids (1)
|
Natural Gas
|
|||||
|
Reserves Category
|
(Mbbl)
|
(MMcf)
|
||||
|
Proved
|
||||||
|
Developed
|
||||||
|
Colombia
|
28,598
|
|
8,776
|
|
||
|
Argentina
|
2,448
|
|
3,750
|
|
||
|
Brazil
|
537
|
|
—
|
|
||
|
Total proved developed reserves
|
31,583
|
|
12,526
|
|
||
|
Undeveloped
|
||||||
|
Colombia
|
5,961
|
|
—
|
|
||
|
Argentina
|
1,156
|
|
927
|
|
||
|
Brazil
|
1,146
|
|
—
|
|
||
|
Total proved undeveloped reserves
|
8,263
|
|
927
|
|
||
|
Total proved reserves
|
39,846
|
|
13,453
|
|
||
|
Probable
|
||||||
|
Developed
|
||||||
|
Colombia
|
5,223
|
|
2,372
|
|
||
|
Argentina
|
672
|
|
540
|
|
||
|
Brazil
|
138
|
|
—
|
|
||
|
Total probable developed reserves
|
6,033
|
|
2,912
|
|
||
|
Undeveloped
|
||||||
|
Colombia
|
2,861
|
|
—
|
|
||
|
Argentina
|
1,102
|
|
1,161
|
|
||
|
Brazil
|
1,219
|
|
1,459
|
|
||
|
Peru
|
57,635
|
|
—
|
|
||
|
Total probable undeveloped reserves
|
62,817
|
|
2,620
|
|
||
|
Total probable reserves
|
68,850
|
|
5,532
|
|
||
|
Possible
|
||||||
|
Developed
|
||||||
|
Colombia
|
6,722
|
|
2,785
|
|
||
|
Argentina
|
576
|
|
553
|
|
||
|
Brazil
|
139
|
|
—
|
|
||
|
Total possible developed reserves
|
7,437
|
|
3,338
|
|
||
|
Undeveloped
|
||||||
|
Colombia
|
5,736
|
|
540
|
|
||
|
Argentina
|
2,014
|
|
45,662
|
|
||
|
Brazil
|
1,421
|
|
773
|
|
||
|
Peru
|
47,042
|
|
—
|
|
||
|
Total possible undeveloped reserves
|
56,213
|
|
46,975
|
|
||
|
Total possible reserves
|
63,650
|
|
50,313
|
|
||
(1) Liquid reserves for Colombia and Argentina include small amounts of NGL reserves.Brazil liquids reserves are 100% oil.
22
Proved Undeveloped Reserves
At
December 31, 2013
, we had total proved undeveloped reserves NAR of
8.4
MMBOE (
December 31, 2012
-
11.2
MMBOE), including
6.0
MMBOE in Colombia (
December 31, 2012
–
6.6
MMBOE),
1.3
MMBOE in Argentina (
December 31, 2012
–
3.4
MMBOE) and
1.1
MMBOE in Brazil (
December 31, 2012
–
1.2
MMBOE). Approximately
60%
and
11%
of proved undeveloped reserves, respectively, are located in our Moqueta and Costayaco fields in Colombia,
13%
are in the Tie field in Brazil and
10%
and
6%
,respectively, are in our Puesto Morales and Surubi fields in Argentina. None of our proved undeveloped reserves at
December 31, 2013
, have remained undeveloped for five years or more since initial disclosure as proved reserves and we have adopted a development plan which indicates that the proved undeveloped reserves are scheduled to be drilled within five years of initial disclosure as proved reserves.
Significant changes in proved undeveloped reserves are summarized in the table below:
|
Oil Equivalent
(MMBOE)
|
|||
|
Balance, December 31, 2012
|
11.2
|
|
|
|
Converted to proved producing
|
(3.6
|
)
|
|
|
Discoveries and extensions
|
3.1
|
|
|
|
Technical revisions
|
(2.3
|
)
|
|
|
Balance, December 31, 2013
|
8.4
|
|
|
In
2013
, we converted
3.6
MMBOE, or
32%
of the total year-end
2012
proved undeveloped reserves, to developed status. In
2013
, we made investments, consisting solely of capital expenditures, of $
25.3 million
in Colombia and $
11.1 million
in Argentina associated with the development of proved undeveloped reserves. Approximately
97%
of proved undeveloped reserves conversions occurred in the Costayaco, Moqueta and Ramiriqui fields in Colombia. The majority of proved undeveloped conversions occurred as a result of ongoing development activities in the Moqueta and Costayaco fields in Colombia, including infill drilling and a pressure maintenance project in both of these fields and an appraisal drilling program in the Moqueta field.
Technical revisions include positive revisions resulting from better than expected production performance in the Costayaco field offset by negative te
c
hnical revisions resulting from deferred investment and inconclusive waterflood results on the Puesto Morales Block in Argentina.
Production Revenue and Price History
Certain information concerning oil and natural gas production, prices, revenues and operating expenses for the three years ended
December 31, 2013
, is set forth in Item 7. “Management’s Discussion and Analysis of Financial Condition and Results of Operations” and in the Unaudited Supplementary Data provided following our Financial Statements in Item 8, which information is incorporated by reference here.
The following table presents oil and NGL production NAR from our Costayaco and Moqueta fields for the three years ended
December 31, 2013
:
|
Year Ended December 31,
|
|||||||||
|
2013
|
2012
|
2011
|
|||||||
|
Costayaco
|
Moqueta
|
Costayaco
|
Moqueta
|
Costayaco
|
Moqueta
|
||||
|
Oil and NGL's, bbl
|
4,692,610
|
1,283,369
|
3,783,147
|
645,219
|
4,461,289
|
138,437
|
|||
We prepared the estimate of standardized measure of proved reserves in accordance with the Financial Accounting Standards Board (“FASB”) Accounting Standards Codification 932, “Extractive Activities – Oil and Gas”.
23
Drilling Activities
The following table summarizes the results of our exploration and development drilling activity for the past three years. Wells labeled as “In Progress” for a year were in progress as of
December 31, 2013
, 2012 or 2011.
|
2013
|
2012
|
2011
|
||||||||||||||||
|
Gross
|
Net
|
Gross
|
Net
|
Gross
|
Net
|
|||||||||||||
|
Colombia
|
||||||||||||||||||
|
Exploration
|
||||||||||||||||||
|
Productive
|
3.00
|
|
1.60
|
|
—
|
|
—
|
|
1.00
|
|
0.50
|
|
||||||
|
Dry
|
1.00
|
|
0.50
|
|
3.00
|
|
2.50
|
|
6.00
|
|
6.00
|
|
||||||
|
In Progress
|
2.00
|
|
2.00
|
|
2.00
|
|
0.95
|
|
1.00
|
|
0.44
|
|
||||||
|
Development
|
||||||||||||||||||
|
Productive
|
5.00
|
|
5.00
|
|
3.00
|
|
3.00
|
|
8.00
|
|
7.20
|
|
||||||
|
Dry
|
—
|
|
—
|
|
—
|
|
—
|
|
1.00
|
|
1.00
|
|
||||||
|
In Progress
|
—
|
|
—
|
|
2.00
|
|
2.00
|
|
—
|
|
—
|
|
||||||
|
Total Colombia
|
11.00
|
|
9.10
|
|
10.00
|
|
8.45
|
|
17.00
|
|
15.14
|
|
||||||
|
Argentina
|
||||||||||||||||||
|
Exploration
|
||||||||||||||||||
|
Productive
|
—
|
|
—
|
|
1.00
|
|
0.35
|
|
2.00
|
|
0.70
|
|
||||||
|
Dry
|
3.00
|
|
1.70
|
|
2.00
|
|
1.35
|
|
1.00
|
|
1.00
|
|
||||||
|
In Progress
|
—
|
|
—
|
|
3.00
|
|
1.70
|
|
2.00
|
|
0.70
|
|
||||||
|
Development
|
||||||||||||||||||
|
Productive
|
4.00
|
|
3.35
|
|
10.00
|
|
9.20
|
|
3.00
|
|
3.00
|
|
||||||
|
Dry
|
1.00
|
|
0.35
|
|
1.00
|
|
1.00
|
|
—
|
|
—
|
|
||||||
|
In Progress
|
1.00
|
|
1.00
|
|
3.00
|
|
1.70
|
|
2.00
|
|
2.00
|
|
||||||
|
Total Argentina
|
9.00
|
|
|
6.40
|
|
20.00
|
|
15.30
|
|
|
10.00
|
|
|
7.40
|
|
|||
|
Brazil
|
||||||||||||||||||
|
Exploration
|
||||||||||||||||||
|
Productive
|
—
|
|
—
|
|
—
|
|
—
|
|
—
|
|
—
|
|
||||||
|
Dry
|
2.00
|
|
2.00
|
|
—
|
|
—
|
|
—
|
|
—
|
|
||||||
|
In Progress
|
2.00
|
|
2.00
|
|
1.00
|
|
1.00
|
|
2.00
|
|
1.40
|
|
||||||
|
Development
|
||||||||||||||||||
|
Productive
|
—
|
|
—
|
|
2.00
|
|
2.00
|
|
—
|
|
—
|
|
||||||
|
Dry
|
—
|
|
—
|
|
—
|
|
—
|
|
—
|
|
—
|
|
||||||
|
In Progress
|
—
|
|
—
|
|
—
|
|
1.00
|
|
0.70
|
|
||||||||
|
Total Brazil
|
4.00
|
|
|
4.00
|
|
3.00
|
|
3.00
|
|
|
3.00
|
|
|
2.10
|
|
|||
|
Peru
|
||||||||||||||||||
|
Exploration
|
||||||||||||||||||
|
Productive
|
1.00
|
|
1.00
|
|
—
|
|
—
|
|
—
|
|
—
|
|
||||||
|
Dry
|
—
|
|
—
|
|
—
|
|
—
|
|
1.00
|
|
1.00
|
|
||||||
|
In Progress
|
—
|
|
—
|
|
1.00
|
|
1.00
|
|
—
|
|
—
|
|
||||||
|
Development
|
||||||||||||||||||
|
Productive
|
—
|
|
—
|
|
—
|
|
—
|
|
—
|
|
—
|
|
||||||
|
Dry
|
—
|
|
—
|
|
—
|
|
—
|
|
—
|
|
—
|
|
||||||
|
In Progress
|
—
|
|
—
|
|
—
|
|
—
|
|
—
|
|
—
|
|
||||||
|
Total Peru
|
1.00
|
|
|
1.00
|
|
1.00
|
|
1.00
|
|
|
1.00
|
|
|
1.00
|
|
|||
|
Total
|
25.00
|
|
20.50
|
|
34.00
|
|
27.75
|
|
31.00
|
|
25.64
|
|
||||||
24
In 2013, we also continued pressure maintenance projects in the Costayaco field in Colombia and the Puesto Morales Block in Argentina and commenced a pressure maintenance project in the Moqueta field in Colombia.
As at
February 19, 2014
, the results of wells in progress at
December 31, 2013
, are as follows:
|
Productive
|
Dry
|
Still in Progress
|
|||||||||||||||
|
Gross
|
Net
|
Gross
|
Net
|
Gross
|
Net
|
||||||||||||
|
Colombia
|
—
|
|
—
|
|
1.00
|
|
1.00
|
|
1.00
|
|
1.00
|
|
|||||
|
Argentina
|
—
|
|
—
|
|
—
|
|
—
|
|
1.00
|
|
1.00
|
|
|||||
|
Brazil
|
—
|
|
—
|
|
—
|
|
—
|
|
2.00
|
|
2.00
|
|
|||||
|
Peru
|
—
|
|
—
|
|
—
|
|
—
|
|
—
|
|
—
|
|
|||||
|
—
|
|
—
|
|
|
1.00
|
|
|
1.00
|
|
|
4.00
|
|
|
4.00
|
|
||
Well Statistics
The following table sets forth our producing wells as of
December 31, 2013
:
|
Oil Wells
|
Gas Wells
|
Total Wells
|
|||||||||||||||
|
Gross
|
Net
|
Gross
|
Net
|
Gross
|
Net
|
||||||||||||
|
Colombia (1)
|
43.0
|
|
33.4
|
|
—
|
|
—
|
|
43.0
|
|
33.4
|
|
|||||
|
Argentina (2)
|
109.0
|
|
86.1
|
|
14.0
|
|
14.0
|
|
123.0
|
|
100.1
|
|
|||||
|
Brazil
|
3.0
|
|
3.0
|
|
—
|
|
—
|
|
3.0
|
|
3.0
|
|
|||||
|
Peru
|
1.0
|
|
1.0
|
|
—
|
|
—
|
|
1.0
|
|
1.0
|
|
|||||
|
156.0
|
|
123.5
|
|
|
14.0
|
|
|
14.0
|
|
|
170.0
|
|
|
137.5
|
|
||
(1) Includes
6.0
gross and net water injector wells and
24.0
gross and
19.9
net wells with multiple completions.
(2) Includes
35.0
gross and
24.7
net water injector wells and
1.0
gross and net well with multiple completions.
Developed and Undeveloped Acreage
The following table sets forth our developed and undeveloped oil and gas lease and mineral acreage as of
December 31, 2013
:
|
Developed
|
Undeveloped
|
Total
|
|||||||||||||||
|
Gross
|
Net
|
Gross
|
Net
|
Gross
|
Net
|
||||||||||||
|
Colombia (1)
|
417,294
|
|
327,601
|
|
3,926,393
|
|
3,346,825
|
|
4,343,687
|
|
3,674,426
|
|
|||||
|
Argentina
|
686,417
|
|
322,384
|
|
565,945
|
|
564,271
|
|
1,252,362
|
|
886,655
|
|
|||||
|
Brazil
|
5,786
|
|
5,786
|
|
41,947
|
|
41,947
|
|
47,733
|
|
47,733
|
|
|||||
|
Peru
|
—
|
|
—
|
|
5,751,066
|
|
5,751,066
|
|
5,751,066
|
|
5,751,066
|
|
|||||
|
1,109,497
|
|
655,771
|
|
|
10,285,351
|
|
|
9,704,109
|
|
|
11,394,848
|
|
|
10,359,880
|
|
||
(1) Included in acres are blocks where relinquishments and acreage changes for which government approval was pending as of
December 31, 2013
. These pending approvals will result in a decrease of
1.0 million
net acres in Colombia.
At
December 31, 2013
, our gross undeveloped acreage was located
56%
in Peru (
34%
Blocks 123 and 129),
38%
in Colombia and
6%
in Argentina.
Business Strategy
Our plan is to continue to build an international oil and gas company through acquisition and exploitation of under-developed prospective oil and gas assets, and to develop these assets with exploration and development drilling to grow commercial
25
reserves and production. Our initial focus is in select countries in South America, currently Colombia, Argentina, Peru, and Brazil; we will consider other regions for future growth should those regions make strategic and commercial sense in creating additional value.
We have applied a two-stage approach to growth, initially establishing a base of production, development and exploration assets by selective acquisitions, and secondly achieving additional reserve and production growth through drilling. We intend to duplicate this business model in other areas as opportunities arise. We pursue opportunities in countries with proven petroleum systems; attractive royalty, taxation and other fiscal terms; and stable legal systems.
While continuing to pursue opportunities to grow our business both through internal growth and through mergers, acquisitions and other asset transactions, we will also pursue opportunities to dispose of non-core assets through farm-outs or outright disposition of assets, which may include a sale of the stock of one or more of our subsidiaries. To implement this strategy, we may be involved in various related discussions and activities at any given time. Acquisitions are motivated by many factors, including, among others, our desire to grow our business, obtain quality assets, including ones with attractive revenue streams, and acquire skilled personnel. Dispositions are motivated by our desire devote our resources to our best performing and most profitable assets that result in us achieving the best return.
A key to our business plan is positioning and being in the right place at the right time with the right resources. The fundamentals of this strategy are described in more detail below:
|
•
|
Position in countries that are welcoming to foreign investment, provide attractive fiscal terms, have stable legal systems, offer opportunities that we believe have been previously ignored or undervalued, and have an active market with many available deals;
|
|
•
|
Build a balanced portfolio of production, development and exploration assets and opportunities, with a drilling inventory that balances risks and rewards to create value;
|
|
•
|
Retain operatorship of assets whenever possible to retain control of work programs, budgets, prospect generation, drilling operations and development activities; non-operating positions will be taken when operators add a strategic advantage to our business growth;
|
|
•
|
Engage qualified, experienced and motivated professionals;
|
|
•
|
Establish an effective local presence, with strong constructive relationships with host governments, ministries, agencies and communities in which we operate;
|
|
•
|
Consolidate land and properties in close proximity to build operating efficiency; and
|
|
•
|
Manage asset and drilling portfolios closely, assessing value to the company and making changes where needed.
|
Research and Development
We have not expended any resources on pursuing research and development initiatives. We utilize existing technology, industry best practices and continual process improvement to execute our business plan.
Marketing and Major Customers
Colombia
Our oil in Colombia is good quality light oil, with
96%
of production coming from the Putumayo Basin with an average API of
29° to 30°
. Ecopetrol is the main purchaser of our crude oil production in Colombia and the source of a significant portion of our revenues. Sales to Ecopetrol accounted for
41%
,
74%
and 87% of our consolidated revenues in
2013
,
2012
and
2011
, respectively.
We have entered into agreements to sell to Ecopetrol the volume of crude oil production produced in the Chaza Block, Santana Block and Guayuyaco Block (the “Putumayo production”). The volume of crude oil does not include the volume of oil owned by the ANH corresponding to royalties, other than HPR royalties. These agreements are subject to renegotiation periodically and generally contain mutual termination provisions with 30 days notice. These agreements will expire November 30, 2014. In the event that Ecopetrol does not accept a full delivery of this production, we may sell to another party the crude oil not
26
accepted. We deliver our oil to Ecopetrol through our transportation facilities which include pipelines, gathering systems and trucking.
Prior to the end of January 2012, the sales point for our sales to Ecopetrol of the Putumayo production to be exported through the Port of Tumaco on the Pacific coast of Colombia was a point in the Putumayo Basin. Beginning in February 2012, the sales point was changed to the Port of Tumaco. Due to the change in the sales point for Putumayo production to the Port of Tumaco, we entered into crude oil transportation agreements with Ecopetrol pursuant to which we pay a transportation and commercialization tariff and transportation tax for the transportation of the Putumayo production from the Putumayo Basin to the Port of Tumaco.
In 2013, Ecopetrol transferred its hydrocarbon transport and logistics assets to its wholly-owned subsidiary, CENIT Transporte y Logistica de Hidrocarburos S.A.S ("CENIT"). We entered into transportation agreements (the “Transportation Agreements”) with CENIT, each dated August 31, 2013. Pursuant to the Transportation Agreements, each of Gran Tierra Energy Colombia Ltd. and Petrolifera Petroleum (Colombia) Limited have the right to transport up to 10,000 BOPD, subject to availability of capacity, of crude oil production from the Chaza Block, Santana Block and Guayuyaco Block in Colombia: (1) from Santana Station to CENIT’s facility at Orito through CENIT’s Mansoya – Orito Pipeline, and (2) from CENIT’s facility at Orito to the Port of Tumaco through CENIT’s Orito – Tumaco Pipeline. We can request that CENIT transport additional crude oil in excess of 20,000 BOPD through the pipelines on the same terms, which CENIT may do at its sole discretion.
Generally, under these agreements, CENIT is liable (subject to specified limitations) for risk of loss of oil during transportation except in cases where such loss is due to events in the nature of force majeure or acts of third parties or the shipper and CENIT has adopted reasonable and timely measures to prevent serious damage. Each of the Transportation Agreements have a term of one year ending August 31, 2014. Currently we have Firm Capacity Transportation Agreements for 6,000 BOPD, of which 3,000 BOPD are under ship or pay agreements, that are in place for eight years and the remainder of our Putumayo production is transported through the Transportation Agreements.
In the event Ecopetrol does not accept a full delivery of our production, we have four alternative purchasers: Gunvor Colombia SAS ("Gunvor"), Petrobras Colombia Limited (“Petrobras Colombia”), Core Petroleum LLC ("Core") and one other short-term customer. Sales to Gunvor, Petrobras Colombia, Core and the short-term customer accounted for
38%
,
2%
,
2%
and
3%
of our consolidated revenues during the
year ended December 31, 2013
, respectively.
We are under no obligation to sell any oil to Gunvor until we specify for a particular day the amount of oil we wish to sell to them. Oil is delivered to Gunvor at the Costayaco battery and the sales point is where the oil is loaded into trucks at our loading facility in Costayaco. On November 22, 2013, the Gunvor agreements were extended by one year to December 2, 2014. Oil is delivered to Petrobras Colombia at facilities at Guaduas or Vasconia Stations and the sales point is the Port of Coveñas upon oil export. Oil is delivered to Core via pipeline to the Port of Esmeraldas, Ecuador and the sales point is when oil is loaded into an export tanker. Our short-term customer in Colombia permits us to use excess capacity on their pipeline to transport our oil to the Port of Coveñas with no minimum volume obligation. For this customer, the delivery point is the flange of the customers crude oil facility, but the sales point is when oil is loaded into their export tanker, which is subject to the export program and off-take procedures of the Port of Coveñas. We are under no obligation to sell any oil to Petrobras Colombia, Core or the other short-term customer.
The majority of the oil produced is transported by pipeline. Varying amounts of oil are trucked: (1) from Santana Station to Ecopetrol’s storage terminal at Orito, a distance of approximately 46 kilometers; (2) from the Costayaco field to Ecopetrol’s storage terminal at Neiva (Dina Station), approximately 350 kilometers north of the Chaza Block; (3) from the Costayaco field to the Atlántico Oil Terminal in Barranquilla, a distance of approximately 1,500 kilometers; (4) from the Garibay field to facilities at Vasconia Station, a distance of approximately 640 kilometers; and; (5) during 2012, from the Costayaco field to our short-term customer's facilities at Rio Loro Station, approximately 220 kilometers north of the field.
Oil prices for sales to Ecopetrol are defined by agreements with Ecopetrol based on a “marker” price (generally the average export price for crude oil from the port of shipment) with adjustments for quality and specified fees depending on the port, including port operation and commercialization fees and a transportation fee and transportation tax. Oil prices for sales to Gunvor are based on the average of West Texas Intermediate ("WTI") prices plus a Vasconia differential and premium, adjusted for trucking costs, since the sales point is at the loading facility in Costayaco. Oil prices for sales to Petrobras Colombia are based on Vasconia crude oil price less adjustments for quality, transportation, marketing and handling. Oil prices for sales to Core are based on average WTI crude oil price plus a premium. Oil prices for sales to our additional short-term purchaser are determined based on Vasconia crude oil price less adjustments for quality, transportation, marketing and handling. We receive revenues for our Colombian oil sales in U.S. dollars.
27
Argentina
We market our own share of production in Argentina. The purchaser of our oil in the Noroeste Basin of Argentina is Refineria del Norte S.A. (“Refinor”). Our contract with Refinor expired on January 1, 2008; however, we are continuing sales of our oil under monthly agreements with Refinor. In the Noroeste Basin, oil is delivered to the refinery by truck. At
December 31, 2013
, Shell C.A.P.S.A. (“Shell”) and YPF S.A. ("YPF") were the main purchasers of our oil in the Neuquen Basin of Argentina. In the Neuquen Basin, oil is delivered to the refinery by pipeline.
Sales to Refinor and Shell accounted for
5%
and
1%
, respectively, of our oil and natural gas sales in
2013
, 6% and 3%, respectively, in 2012 and 3% each in 2011. The purchaser of our gas in Argentina is Albanesi S.A. Sales to Albanesi S.A. accounted for less than 1% of our oil and natural gas sales in each of the three years ended
December 31, 2013
.
In Argentina, export prices for oil are subject to an export withholding tax based on WTI price. This export tax has the effect of limiting the actual realized price for sales. Our oil prices are agreed on a spot basis, based on WTI price less adjustments for quality, transportation and an adjustment similar to the export tax. We receive revenues in Argentina pesos, based on U.S. dollar prices at the exchange rate on the payment date.
Brazil
Petróleo Brasileiro S.A (“Petrobras”) is the purchaser of all of the oil produced from Block 155 in Brazil. Oil is trucked 26 miles to the Petrobras Carmo Oil Treatment Station. Oil prices for sales to Petrobras are based on the monthly average Brent Dated price less a refining and quality discount.
There were no sales in any countries other than Colombia, Argentina and Brazil in
2013
,
2012
or
2011
.
See “Guerrilla Activity in Colombia Has Disrupted and Delayed, and Could Continue to Disrupt or Delay, Our Operations and We Are Concerned About Safeguarding Our Operations and Personnel in Colombia”, “Our Oil Sales Will Depend on a Relatively Small Group of Customers, Which Could Adversely Affect Our Financial Results,” and “Negative Political and Regulatory Developments in Argentina May Negatively Affect our Operations”, “Negative Political Developments in Peru May Negatively Affect our Proposed Operations,” “Our Business is Subject to Local Legal, Political and Economic Factors Which are Beyond Our Control, Which Could Impair Our Ability to Expand Our Operations or Operate Profitably” and other risk factors in Item 1A “Risk Factors” for a description of the risks faced by our dependency on a small number of customers and the regulatory systems under which we operate.
Competition
The oil and gas industry is highly competitive. We face competition from both local and international companies in acquiring properties, contracting for drilling and other oil field equipment and securing trained personnel. Many of these competitors have financial and technical resources that exceed ours, and we believe that these companies have a competitive advantage in these areas. Others are smaller, and we believe our technical and financial capabilities give us a competitive advantage over these companies. Our ability to acquire additional properties and to discover reserves in the future will depend on our ability to evaluate and select suitable properties and to consummate transactions in a highly competitive environment. In addition, there is substantial competition for prospects and resources in the oil and gas industry.
See “Competition in Obtaining Rights to Explore and Develop Oil and Gas Reserves and to Market Our Production May Impair Our Business” in Item 1A “Risk Factors” for risks associated with competition.
Geographic Information
Information regarding our geographic segments, including information on revenues, assets, expenses, and net income can be found in Note 4 to the Financial Statements, Segment and Geographic Reporting, in Item 8 “Financial Statements and Supplementary Data”, which information is incorporated by reference here. Long lived assets are Property, Plant and Equipment, which includes all oil and gas assets, furniture and fixtures, automobiles and computer equipment. No long lived assets are held in our country of domicile, which is the United States of America. "All Other" assets include assets held by our corporate head office in Calgary, Alberta, Canada. Because all of our exploration and development operations are in South America, we face many risks associated with these operations. See Item 1A “Risk Factors” for risks associated with our foreign operations.
Regulation
28
The oil and gas industry in Colombia, Argentina, Peru and Brazil is heavily regulated. Rights and obligations with regard to exploration, development and production activities are explicit for each project; economics are governed by a royalty/tax regime. Various government approvals are required for property acquisitions and transfers, including, but not limited to, meeting financial and technical qualification criteria in order to be certified as an oil and gas company in the country. Oil and gas concessions are typically granted for fixed terms with opportunity for extension.
Colombia
In Colombia, prior to 2004, Ecopetrol was the administrator of all hydrocarbons and therefore executed contracts with oil companies under different contractual types such as Association Contracts and Shared Risk Contracts. Under an Association Contract, the oil company (“Associate”) assumed all risk during the exploration phase and Ecopetrol had the obligation to reimburse the Associate, if the commerciality was accepted by Ecopetrol, the direct exploration costs which the Associate incurred in proportion to Ecopetrol's working interest. If Ecopetrol did not accept the initial commerciality of a field, the Associate could continue the activities at its sole risk and Ecopetrol would retain the right to back-in later, after Ecopetrol reimbursed the Associate for the initial exploitation work and exploration costs plus certain penalties, depending upon at what stage Ecopetrol later declared commerciality of the field.
Effective June 2003, the regulatory regime in Colombia underwent a significant change with the formation of the ANH. The ANH is now the administrator of the hydrocarbons in the country and therefore is responsible for regulating the Colombian oil and gas industry, including managing all exploration lands. Ecopetrol became a public company owned in majority by the state with the main purpose of exploring and producing hydrocarbons similar to any other oil company. However, Ecopetrol continues to have rights under the existing contracts executed with oil companies before the ANH was created. Ecopetrol continues to be the major purchaser and marketer of oil in Colombia, and operates the majority of the oil transportation infrastructure in the country.
In conjunction with this change, the ANH developed a new exploration risk contract that took effect as of June 2004. This Exploration and Production Contract has significantly changed the way the industry views Colombia. In place of the earlier association contracts, the new agreement provides full risk/reward benefits for the contractor. Under the terms of the contract the successful operator retains the rights to all reserves, production and income from any new exploration block, subject to existing royalty and tax regulations. Each contract contains an exploration phase and a production phase. The exploration phase will contain a number of exploration periods and each period will have an associated work commitment. The production phase will last a number of years (usually 24) from the declaration of a commercial hydrocarbon discovery.
We operate in Colombia through two branches – Gran Tierra Energy Colombia, Ltd. and Petrolifera Petroleum (Colombia) Limited. Both are qualified as operators of oil and gas properties by the ANH.
When operating under a contract, the contractor is the owner of the hydrocarbons extracted from the contract area during the performance of operations, and pays royalties which are collected by the ANH or Ecopetrol, depending on the type of contract. The contractor can market the hydrocarbons in any manner whatsoever, subject to a limitation in the case of natural emergencies where the law specifies the manner of sale.
Argentina
The Hydrocarbons Law 17.319, enacted in June 1967, established the basic legal framework for the regulation of exploration and production of hydrocarbons in Argentina. The Hydrocarbons Law empowers the National Executive Branch to establish a national policy for development of Argentina’s hydrocarbon reserves, with the main purpose of satisfying domestic demand. However, on January 5, 2007, Law 26.197 was passed by the Government of Argentina. This legal framework replaced article one of the Hydrocarbons Law 17.319 and provides for the provinces to assume complete ownership, authority and administration of the oil and natural gas reserves located within their territories, including offshore areas up to 12 nautical miles from the coast line. This includes all exploration permits and exploitation and transportation concessions.
On June 3, 2002, the Government of Argentina issued a resolution authorizing the Energy Secretariat to limit the amount of oil that companies can export. The restriction was to be in place from June 2002 to September 2002. However, on June 14, 2002, the government agreed to abandon the limit on oil export volumes in exchange for a guarantee from oil companies that domestic demand would be supplied. Oil companies also agreed not to raise natural gas and related prices to residential customers during the winter months and to maintain gasoline, natural gas and oil prices in line with those in other South American countries.
29
Near the end of 2007, the Government of Argentina issued decrees changing the withholding export tax structure and further regulating oil exports.
At the end of 2008, the Argentina government launched the Gas Plus and Petroleum Plus programs, programs designed to stimulate investments in and production of natural gas and oil through providing incentives for new production of natural gas or oil, either from new discoveries, enhanced recovery techniques or reactivation of older fields. Companies apply for the incentives, and qualification is based on a complex set of formulas involving increased production over a calculated base and increases in proved reserves for the year. We have received credits totaling
$6.2 million
under the Petroleum Plus program related to our production for the fourth quarter of 2008, first, third and fourth quarters of 2010 and 2011. Realization of the credits is contingent on establishing a contract with a third party to purchase the credits or exporting oil. During the
year ended December 31, 2013
, we recognized
$3.7 million
(
year ended December 31, 2012
-
$0.7 million
) upon the sale of credits. We have an additional
$1.8 million
of Petroleum Plus program credits which we plan to monetize in 2014. Future sales of these credits will be recognized when realized, as a contingent gain.
In October 2010, the Argentina Gas Authority (“ENARGAS”) issued Regulation I-1410 aimed at securing the supply of natural gas to residential consumers and small industry given the decline in gas production and the expected growing demand for gas. The regulation includes all the procedures created by the authorities since 2004 (restrictions of exports, deviation of gas sales to residential consumption) and gives ENARGAS power to control gas marketing in order to assure the supply of gas to residential consumers and small industry. This regulation is being challenged by gas producers on the grounds that it illegally interferes in their gas marketing activities.
After general elections in October 2011, the Government of Argentina decided to remove certain subsidies which were implemented after the 2001/2002 Argentina economic crisis. Consequently, in November 2011, ENARGAS issued Regulation 1982 which broadened the application of a charge to certain industries and services, including oil & gas upstream and natural gas processing activities, and increased the charge. The charge was created in 2008 to fund the importation of natural gas and liquefied natural gas into Argentina. This measure has been challenged by some important companies within the industry.
In July 2012, the Argentina government mandated the creation of an oil planning commission that sets national energy goals and has the power to review private oil companies' investment plans. Private companies must submit an annual investment plan by September 30 of each year. The committee has the power to approve or reject annual investment plans.
In July 2013, the Argentina government issued Decree 929, which created the Investment Promotional Regime on Hydrocarbons Exploitation. Pursuant to the Decree, holders of exploration permits and exploitation concessions may apply to be included in the Promotional Regime by filing an investment project to invest foreign currency of not less than $1 billion during the first five years of the project. Companies included in the Promotional Regime will receive benefits from the fifth year after the execution of the relevant investment project, including exemptions from export duties for a portion of their hydrocarbon production and a relaxation of currency restrictions on funds derived from such hydrocarbon exports.
Additionally in Argentina some provincial regulations are changing, introducing new royalties and fees associated with extensions of concession agreements.
We operate in Argentina through Gran Tierra Energy Argentina S.R.L. and two branches: Petrolifera Petroleum (Americas) Limited - Sucursal Argentina and Petrolifera Petroleum Limited - Sucursal Argentina. Gran Tierra Energy Argentina S.R.L. is qualified by the Federal Secretary of Energy to be a titleholder of Exploration Permits and Exploitation Concessions as well as to operate them. Petrolifera Petroleum Limited - Sucursal Argentina is qualified to be a titleholder of Exploration Permits and Exploitation Concessions, but not to operate them. Petrolifera Petroleum (Americas) Limited - Sucursal Argentina is authorized by the Federal Secretary of Energy to be a titleholder of Exploration Permits and Exploitation Concessions as well as to operate them and is taking steps to obtain its annual qualification renewal.
See “Negative Political and Regulatory Developments in Argentina May Negatively Affect our Operations” in Item 1A “Risk Factors” for a description of the risks associated with Argentina government controls.
Peru
Peru’s hydrocarbon legislation, which includes the Organic Hydrocarbon Law No. 26221 enacted in 1993 and the regulations thereunder (the “Organic Hydrocarbon Law”), governs our operations in Peru. This legislation covers the entire range of petroleum operations, defines the roles of Peruvian government agencies which regulate and interact with the oil and gas industry, provides that private investors (either national or foreign) may also make investments in the petroleum sector, and provides for the promotion of the development of hydrocarbon activities based on free competition and free access to all
30
economic activities. This law provides that pipeline transportation and natural gas distribution must be handled via concession contracts with the appropriate governmental authorities. All other petroleum activities are to be freely operated and are subject only to local and international safety and environment standards.
Under the Peruvian legal system, Peru is the owner of the hydrocarbons located below the surface in its national territory. However, Peru has given the ownership right to extracted hydrocarbons to PeruPetro S.A. ("PeruPetro"), a state company responsible for promoting and overseeing the investment of hydrocarbon exploration and exploitation activities in Peru. PeruPetro is empowered to enter into contracts for either the exploration and exploitation or just the exploitation of petroleum and natural gas on behalf of Peru, the nature of which are described further below. The Peruvian government also plays an active role in petroleum operations through the involvement of the Ministry of Energy and Mines, the specialized government department in charge of establishing energy, mining and environmental protection policies, enacting the rules applicable to all these sectors and supervising compliance with such policies and rules. We are subject to the laws and regulations of all of these entities and agencies.
PeruPetro enters into either license contracts or service contracts for hydrocarbon exploration and exploitation. Peruvian law also allows for other contract models, but the investor must propose contract terms compatible with Peru’s interests. We only operate under license contracts and do not foresee operating under any service contracts. A company must be qualified by PeruPetro to enter into hydrocarbon exploration and exploitation contracts in Peru. In order to qualify, the company must meet the standards under the Regulations Governing the Qualifications of Oil Companies. These qualifications generally require the company to have the technical, legal, economic and financial capacity to comply with all obligations it will assume under the contract based on the characteristics of the area requested, the possible investments and the environmental protection rules governing the performance of its operations. When a contractor is a foreign investor, it is expected to incorporate a subsidiary company or registered branch in accordance with Peruvian corporate law and appoint Peruvian representatives in accordance with the Organic Hydrocarbon Law who will interact with PeruPetro.
We operate in Peru through Gran Tierra Energy Peru S.R.L. and Petrolifera Petroleum Del Peru S.A.C. Gran Tierra Energy Peru S.R.L. has been qualified by PeruPetro with respect to its contracts for Blocks 95, 123 and 129 and Petrolifera has been qualified by PeruPetro with respect to its contracts for Blocks 107 and 133.
When operating under a license contract, the licensee is the owner of the hydrocarbons extracted from the contract area during the performance of operations, and pays royalties which are collected by PeruPetro. The licensee can market or export the hydrocarbons in any manner whatsoever, subject to a limitation in the case of national emergency where the law stipulates such manner.
See “Negative Political Developments in Peru May Negatively Affect our Proposed Operations” in Item 1A “Risk Factors” for a description of the risks associated with the political climate in Peru.
Brazil
In Brazil, Law No. 2004 enacted in 1953 created the state monopoly of the petroleum industry and Petrobras, a state-owned legal entity, which was the sole company conducting exploration and production activities in Brazil.
Amendment No. 9 to the Brazilian Constitution, enacted on November 9, 1995, authorized the Brazilian government to contract with state and private companies, with head offices and management located in Brazil, for the exploration and production of oil and natural gas, as well as to grant authorizations for the refining, transportation, import and export of oil, natural gas and its by-products, discontinuing Petrobras’ exclusive right to explore and produce petroleum and natural gas in Brazil.
The regulatory model is governed by Law No. 9478 of August 6, 1997 (the “Petroleum Law”), as amended, which controls the granting of concessions for carrying out exploration and production activities to Brazilian companies. The Petroleum Law, as amended, also established a legal framework for pre-salt layer areas and strategic areas to be defined by the Brazilian government and which will be subject to the Production Sharing Regime.
In accordance with the Petroleum Law, the acquisition of oil and natural gas property and oil and gas operations by state and private companies is subject to legal, technical and economic standards and regulations issued by the Agência Nacional de Petróleo, Gás Natural e Biocombustíveis ("ANP"), the agency created by the Petroleum Law and vested with regulatory and inspection authority to ensure adequate operational procedures with respect to industry activities and the supply of fuels throughout the national territory.
31
The ANP has authority for the implementation of the national oil and natural gas policy in accordance with the National Council of Energy Policy. The ANP conducts bid rounds to award exploration, development and production contracts, as well as to approve the construction and operation of refineries and gas processing units, transportation facilities (including port terminals), import and export of oil and natural gas, as well as supervision of the activities which integrate the petroleum industry and the general enforcement of the Petroleum Law.
During a public bid procedure, any company evidencing technical, financial and legal standards under the applicable regulations may qualify and apply for particular blocks made available for concession contracts. Qualified companies may compete alone or in association with other companies, including through the formation of “consortia” (unincorporated joint-ventures), provided they agree to comply with all the applicable requirements of Brazilian Corporate Law. Blocks awarded and the duration of the exploration and production periods are defined in the contracts which, besides the usual covenants that can be found in oil concessions, such as exploration and development programs, relinquishment of areas, and unitization, include reversion to the state of certain assets at the end of the concession. Contracts may be assigned or transferred to other Brazilian companies that comply with the technical, financial and legal requirements established by the ANP.
Oil and natural gas resources in Brazil, whether onshore or offshore, belong to the Brazilian government. However, under the Concession Regime, after the discovery of oil and gas reserves, ownership is assigned to the concessionaire. Under the principles of the Federal Constitution, the national territory comprises all land and the continental shelf. Brazil is a signatory of the conventions regulating the economic use of the sea and its subsoil. Brazil is thus entitled to the enjoyment of the resources over the territorial sea and marine platform up to the limits indicated in the pertinent treaties.
Concessionaires are required under Law No. 9478 to pay the government dues and fees, in addition to the charges for sale of pre-bid data and information. The ANP has the power to determine the criteria under which the Government Take will be assessed within the limits established by Decree No. 2705/98. Government Take comprises (i) signature bonus, (ii) royalties, (iii) special participation and (iv) area rentals. Part of the Government Take is passed on to States and Municipalities and other government branches according to law.
We operate in Brazil through Gran Tierra Energy Brasil Ltda. (“Gran Tierra Brazil”). Gran Tierra Brazil received approval from the ANP as a Class B operator permitting Grant Tierra Brazil to act as an operator both onshore and in the shallow water offshore Brazil.
In addition to the risk factors referenced in the Argentina and Peru sections above, see "Our Business is Subject to Local Legal, Political and Economic Factors Which are Beyond Our Control, Which Could Impair Our Ability to Expand Our Operations or Operate Profitably" in Item 1A “Risk Factors” for information regarding the regulatory risks that we face.
Environmental Compliance
Our activities are subject to existing laws and regulations governing environmental quality and pollution control in the foreign countries where we maintain operations. Our activities with respect to exploration, drilling, production and facilities, including the operation and construction of pipelines, plants and other facilities for transporting, processing, treating or storing oil and other products, are subject to stringent environmental regulation by provincial and federal authorities in Colombia, Argentina, Peru and Brazil. Such regulations relate to environmental impact studies, permissible levels of air and water emissions, control of hazardous waste, construction of facilities, recycling requirements and reclamation standards, among others. Risks are inherent in oil and gas exploration, development and production operations, and significant costs and liabilities may be incurred in connection with environmental compliance issues. Licenses and permits which we may require to carry out exploration and production activities may not be obtainable on reasonable terms or on a timely basis, and such laws and regulations may have an adverse effect on any project that we may wish to undertake.
In
2014
, we plan to spend approximately $16.0 million in Colombia on capital programs related to environmental studies, community consultations and environmental remediation. In Peru, costs for environmental and social projects are expected to be approximately $18.0 million and mainly relates to environmental and social impact assessments, implementation of environmental management plans, and environmental and social monitoring activities. We plan to spend approximately $2.5 million in Argentina on programs related to environmental matters, including environmental studies, environmental remediation and wastewater treatment facilities improvements. In Brazil, we plan to spend approximately $2.5 million on costs for environmental projects including waste management.
In
2013
, we experienced a limited number of environmental incidents and enacted the following environmental initiatives:
32
|
•
|
In Colombia, we continued measures to contain the release of oil from a flow-through drainage chamber in the Mary battery and investigated the source of the release. We are developing a plan for remediation activities. Additionally, during 2013, the number of illegal valves installed on the section of pipeline from Uchupayaco to Santana increased. Three oil seeps were found which related to pipeline disruptions in areas with difficult access. In each of these incidents, we completed a full clean up and remediation of the affected area. A number of minor incidents on our blocks occurred, each of which caused small quantities of oil to be spilled. In each of these minor incidents, we completed a full clean up and remediation of the affected area.
|
|
•
|
In Argentina, minor spills occurred relating to oil and produced water transported by pipeline. In each case, we completed a full clean up and remediation of the affected area. We also undertook site remediation and restoration activities.
|
|
•
|
In Peru, we continued the Environmental Monitoring Program for drilling and seismic activities on Block 95 and partnerships were established with the Pacaya Samiria Natural Reserve and Pucacuro National Reserve. We are also seeking the necessary permits for the relocation of four well pads and a new seismic project in Block 107 and we continued preparations for an Environmental Impact Study for seismic and drilling activities on Blocks 133, 123 and 129.
|
|
•
|
In Brazil, we implemented a water, soil and air monitoring program for our blocks in the Recôncavo Basin, constructed barriers on the Tiê field to prevent soil erosion and to contain minor spills and commenced a reforestation project.
|
We will continue to strive to be in compliance with all environmental and pollution control laws and regulations in Colombia, Argentina, Peru and Brazil. We plan to continue environmental, health and safety initiatives in order to minimize our environmental impact and expenses. We also plan to continue to improve internal audit procedures and practices in order to monitor current performance and search for improvement.
We expect the cost of compliance with federal, state and local provisions which have been enacted or adopted regulating the discharge of materials into the environment, or otherwise relating to the protection of the environment for the remainder of our operations, will not be material to Gran Tierra.
We have implemented a company wide web-based reporting system which allows us to better track incidents and respective corrective actions and associated costs. We have a Corporate Health, Safety and Environment Management System and follow Environmental Best Practices. We have an environmental risk management program in place as well as waste management procedures. Air and water testing occur regularly, and environmental contingency plans have been prepared for all sites and ground transportation of oil. We have a regular quarterly comprehensive reporting system, with a schedule of internal audits and routine checking of practices and procedures. Emergency response exercises were conducted in Calgary, Argentina, Colombia, Peru and Brazil.
Community Relations Initiatives
In
2013
, we continued standardized, quarterly reporting on our community relations initiatives. In addition to employing local people and hiring local companies as often as feasible in all of our operations, we have a program of community investment in all of our operating areas. We also continuously monitor the needs of the communities where we operate to ensure that our investments meet their requirements and have the highest positive impact possible.
Projects undertaken in
2013
were as follows:
Colombia
In
2013
, our most significant community relations initiatives and investments were made in the municipalities of Mocoa, Villagarzon and Puerto Guzman in the Department of Putumayo and the Municipality of Piamonte in the Department of Cauca.
We made voluntary investments in relation to community support during drilling projects on the Chaza Block. Below is a description of our $2.5 million voluntary social investment, responding to the needs identified and prioritized by the communities in those areas in which we operate.
|
•
|
Provided support for education, including providing funding for technology.
|
|
•
|
Supported community groups in projects that benefited local families with agriculture projects.
|
33
|
•
|
Various projects for the support of cultural identity such as sponsorship of local festivals that celebrate indigenous culture and history and sponsorship of local people to attend a conference of indigenous peoples from various areas in the country.
|
|
•
|
Various programs for strengthening local infrastructure such as paving streets in urban areas, construction of cultural venues, construction of sport facilities and computer rooms, and provision of materials for electric power supply in rural areas.
|
|
•
|
Projects related to health, basic sanitation and housing including construction of a hospital emergency room and improving health facilities and housing.
|
|
•
|
Provided strong communications with the communities and undertook consultations with ethnic minorities.
|
Argentina
In
2013
, we invested approximately $0.6 million in the following activities:
|
•
|
Provided and distributed education materials to schools in our operated areas. Ran workshops and provided training to teachers for health, and physical education.
|
|
•
|
Provided child protection related training courses to local organizations.
|
|
•
|
Provided materials and support to local communities for improvements to rain water gathering systems.
|
|
•
|
Worked with a local agricultural agency to improve crop production, including providing tools, seeds and education.
|
|
•
|
Supported fair trade initiatives for local artisans.
|
|
•
|
Worked with local communities to improve chaguar production, a plant that is used to make fabrics, baskets and belts.
|
|
•
|
Supported local youth environmental protection initiatives.
|
|
•
|
Delivered supplies and medicines to hospitals.
|
Peru
In
2013
, we invested approximately $1.0 million in the following activities:
|
•
|
On Block 95, we made improvements to the health center and electricity generators in Bretaña town.
|
|
•
|
Held consultation and education sessions with various communities located on our blocks and developed technical workshops with indigenous organizations on the uses of natural resources.
|
|
•
|
Provided healthcare support services to communities in our blocks.
|
|
•
|
Provided temporary employment to residents in our blocks.
|
|
•
|
Supported initiatives to provide identification documents to rural communities to enable them to work and access health, education and other social programs.
|
|
•
|
Provided funding for turtle conservation projects in the Pacaya Samiria National Reserve.
|
|
•
|
Supported conservation monitoring activities in the Pucacuro National Reserve, included financing the construction of a conservation research center.
|
Brazil
In
2013
, we invested approximately $80,000 in supporting schools in the municipality of Pojuca, in the Salvador region.
34
Employees
At
December 31, 2013
, we had
520
full-time employees:
48
located in the Calgary corporate office,
283
in Colombia (
142
staff in Bogota and
141
field personnel),
86
in Argentina (
39
office staff in Buenos Aires and
47
field staff, of which
32
were unionized),
60
in Peru (
50
office staff in Lima and
10
field staff) and
43
in Brazil (
31
office staff in Rio de Janeiro and Salvador and
12
field staff). Other than as disclosed above, none of our employees are represented by labor unions, and we consider our employee relations to be good.
Available Information
Our Annual Report on Form 10-K, Quarterly Reports on Form 10-Q and current reports on Form 8-K, as well as any amendments to such reports and all other filings pursuant to Section 13(a) or 15(d) of the Exchange Act which we make available as soon as reasonably practicable after we electronically file such material with, or furnish it to, the SEC, are available free of charge to the public on our website www.grantierra.com. To access our SEC filings, select SEC Filings from the investor relations menu on our website, which will provide a list of our SEC filings. Our website address is provided solely for informational purposes. We do not intend, by this reference, that our website should be deemed to be part of this Annual Report. Any materials we have filed with the SEC may be read and/or copied at the SEC’s Public Reference Room at 100 F Street N.E. Washington, D.C. 20549. You may obtain information on the operation of the Public Reference Room by calling the SEC at 1-800-SEC-0330. The SEC maintains an internet site that contains reports, proxy and information statements, and other information regarding us. Our SEC filings are also available to the public at the SEC’s website at www.SEC.gov.
Item 1A.
Risk Factors
Risks Related to Our Business
Guerrilla Activity in Colombia Has Disrupted and Delayed, and Could Continue to Disrupt or Delay, Our Operations and We Are Concerned About Safeguarding Our Operations and Personnel in Colombia.
During 2012 and 2013, guerrilla activity in Colombia increased significantly. This increased activity creates a greater risk for our operations and our employees and our mitigation activities may not be adequate to alleviate the risks arising from such guerrilla activity.
For over 40 years, the Colombian government has been engaged in a civil war with two main Marxist guerrilla groups: the Revolutionary Armed Forces of Colombia ("FARC") and the National Liberation Army ("ELN"). Both of these groups have been designated as terrorist organizations by the United States and the European Union. Another threat comes from criminal gangs formed from the former members of the United Self-Defense Forces of Colombia militia, a paramilitary group that originally sprouted up to combat FARC and ELN, which the Colombian government successfully dissolved.
We operate principally in the Putumayo Basin in Colombia, and have properties in other basins, including the Catatumbo, Cauca, Llanos, Sinu-San Jacinto, Middle Magdalena and Lower Magdalena Basins. The Putumayo and Catatumbo regions have been the breeding place of guerrilla activity. Pipelines have been primary targets because such pipelines cannot be adequately secured due to the sheer length of such pipelines and the remoteness of the areas in which the pipelines are laid. The Ecopetrol-operated Trans-Andean oil pipeline (the "OTA pipeline”) which transports oil from the Putumayo region and upon which we materially rely has been targeted by these guerrilla groups. Starting in 2008, the OTA pipeline experienced outages of various lengths. In 2012, the OTA pipeline was shutdown for over 162 days and the shutdown had a material adverse effect on our deliveries to Ecopetrol and our financial performance for 2012. Recently we have experienced outages from October 2012 through February 2014. In
2013
, the OTA pipeline was shutdown for approximately
229
days. We have employed mitigation strategies as discussed in the risk "
We May Encounter Difficulties Storing and Transporting Our Production, Which Could Cause a Decrease in Our Production or an Increase in Our Expenses"
later in this section. Such disruptions may continue indefinitely and could harm our business.
In 2013, we experienced damage to two of our facilities in the amount of approximately $0.8 million. Production of about 330 BOPD was shut in for 39 days. No long-term environmental damage or injury to personnel occurred in either incident. Continuing attempts by the Colombian government to reduce or prevent guerrilla activity may not be successful and guerrilla activity may continue to disrupt our operations in the future. Our efforts to increase security measures may not be successful and there can also be no assurance that we can maintain the safety of our or our contractors' field personnel and Bogota head office personnel or operations in Colombia or that this violence will not continue to adversely affect our operations in the future and cause significant loss.
35
Our Lack of Diversification Will Increase the Risk of an Investment in Our Common Stock.
Our business focuses on the oil and gas industry in a limited number of properties in Colombia, Argentina, Peru, and Brazil. Most of our production is in one basin in Colombia and two basins in Argentina. As a result, we lack diversification, in terms of both the nature and geographic scope of our business. Accordingly, factors affecting our industry or the regions in which we operate, including the geographic remoteness of our operations and weather conditions, will likely impact us more acutely than if our business was more diversified. In particular, most of our production is from the Putumayo Basin in Colombia, and we depend on the OTA pipeline and alternative transportation arrangements to transport our oil to market. Cash flow from these sales funds a large part of our business. Disruptions to this pipeline, as described in the risk "We May Encounter Difficulties Storing and Transporting Our Production, Which Could Cause a Decrease in Our Production or an Increase in Our Expenses" could harm our business in Colombia and other countries.
We May Encounter Difficulties Storing and Transporting Our Production, Which Could Cause a Decrease in Our Production or an Increase in Our Expenses.
To sell the oil and natural gas that we are able to produce, we have to make arrangements for storage and distribution to the market. We rely on local infrastructure and the availability of transportation for storage and shipment of our products, but infrastructure development and storage and transportation facilities may be insufficient for our needs at commercially acceptable terms in the localities in which we operate. This could be particularly problematic to the extent that our operations are conducted in remote areas that are difficult to access, such as areas that are distant from shipping and/or pipeline facilities. In certain areas, we may be required to rely on only one gathering system, trucking company or pipeline, and, if so, our ability to market our production would be subject to their reliability and operations. These factors may affect our ability to explore and develop properties and to store and transport our oil and gas production, and may increase our expenses. Furthermore, future instability in one or more of the countries in which we operate, weather conditions or natural disasters, actions by companies doing business in those countries, labor disputes or actions taken by the international community may impair the distribution of oil and/or natural gas and in turn diminish our financial condition or ability to maintain our operations.
The majority of our oil in Colombia is contracted for delivery to a single pipeline owned by CENIT S.A. ("CENIT"), a wholly-owned subsidiary of Ecopetrol, and operated by Ecopetrol. Sales of oil have been and could continue to be disrupted by damage to this pipeline or displaced by Ecopetrol’s use of the pipeline itself. Under our transportation contract with CENIT, the delivery point for our oil is at the end of the pipeline. This creates a risk of loss of oil due to sabotage by guerrillas or theft from the pipeline which may result in reduced revenues and increased clean-up or third party costs. We have attempted to mitigate the risk of increased costs with insurance and are investigating potential ways to mitigate and reduce revenue risk. CENIT and Ecopetrol maintain responsibility for clean-up of any spilled oil and for pipeline repair.
Problems with these pipelines can cause interruptions to our producing activities if they are for a long enough duration that our storage facilities become full. For example, we experienced disruptions in transportation on this pipeline in March and April of 2008, June, July and August of 2009, June, August, and September 2010, February 2011, February to August of 2012 and October 2012 to February 2014 as a result of sabotage by guerrillas. In addition, there is competition for space in these pipelines, and additional discoveries in our area of operations by other companies could decrease the pipeline capacity available to us. Trucking is an alternative to transportation by pipeline; however, it is generally more expensive and carries higher safety risks for us, our employees and the public.
Recent alternative transportation arrangements in Colombia allowed us to deliver our full production during 2013; however, these deliveries result in reduced realized prices compared to the Ecopetrol operated OTA pipeline deliveries and are not necessarily sustainable. When disruptions are of a long enough duration, our sales volumes may be lower than normal, which will cause our cash flow to be lower than normal, and if our storage facilities become full, we can be forced to reduce production.
As some of our oil production in Argentina is trucked to a local refinery, sales of oil in the Noroeste Basin can be delayed by adverse weather and road conditions, particularly during the months November through February when the area is subject to periods of heavy rain and flooding. While storage facilities are designed to accommodate ordinary disruptions without curtailing production, delayed sales will delay revenues and may adversely impact our working capital position in Argentina. Furthermore, a prolonged disruption in oil deliveries could exceed storage capacities and shut-in production, which could have a negative impact on future production capability.
36
Our Oil Sales Will Depend on a Relatively Small Group of Customers, Which Could Adversely Affect Our Financial Results.
Oil sales in Colombia are mainly to Ecopetrol and, in 2013, to another customer. While oil prices in Colombia are related to international market prices, lack of competition and reliance on a limited number of customers for sales of oil may diminish prices and depress our financial results.
The entire Argentina domestic refining market is small and export opportunities are limited by available infrastructure. As a result, our oil and gas sales in Argentina will depend on a relatively small group of customers, and currently, on two significant customers. The lack of competition in this market could result in unfavorable sales terms which, in turn, could adversely affect our financial results. Currently, all operators in Argentina are operating without long-term sales contracts. We cannot provide any certainty as to when the situation will be resolved or what the final outcome will be.
In Brazil, there are a number of potential customers for our oil, and we are working to establish relationships with as many as possible to ensure a stable market for our oil. Currently, essentially all of our production in Brazil is sold to Petróleo Brasileiro S.A (“Petrobras”). Petrobras’ refinery in the area of our operations has previously had some technical difficulties which have restricted its ability to receive deliveries. Our second option in the area is at full capacity. This could mean that we cannot produce to full capacity in the area because of restrictions in being able to deliver our oil.
Our Business is Subject to Local Legal, Political and Economic Factors Which Are Beyond Our Control, Which Could Impair Our Ability to Expand Our Operations or Operate Profitably.
We operate our business in Colombia, Argentina, Peru, and Brazil, and may eventually expand to other countries. Exploration and production operations in foreign countries are subject to legal, political and economic uncertainties, including terrorism, military repression, social unrest, strikes by local or national labor groups, interference with private contract rights (such as privatization), extreme fluctuations in currency exchange rates, high rates of inflation, exchange controls, changes in tax rates, changes in laws or policies affecting environmental issues (including land use and water use), workplace safety, foreign investment, foreign trade, investment or taxation, as well as restrictions imposed on the oil and natural gas industry, such as restrictions on production, price controls and export controls. For example, starting on November 21, 2008, we were forced to reduce production in Colombia on a gradual basis, culminating on December 11, 2008, when we suspended all production from the Santana, Guayuyaco and Chaza Blocks in the Putumayo Basin. This temporary suspension of production operations was the result of a declaration of a state of emergency and force majeure by Ecopetrol due to a general strike in the region. In January 2009, the situation was resolved and we were able to resume production and sales shipments. Starting in 2010, there was an increased presence of illegitimate unionization activities in the Putumayo Basin by the Sindicato de Trabajadores Petroleros del Putumayo, which disrupted our operations from time to time and may do so in the future. During 2011, 2012 and 2013, Argentina has experienced increased union activity and this may create disruptions in our Argentina operations in the future. During 2012 and 2013, we have also experienced related issues with landowners blocking access to our fields in Argentina. Our production in Brazil was shut in for three weeks in October 2013 as a result of a strike by employees of Petrobras which affected the crude oil receiving terminal we use in the Recôncavo Basin. We do not know how long such labor action will last, and if it lasts a significant amount of time, it may effect our ability to meet our production targets.
South America has a history of political and economic instability. This instability could result in new governments or the adoption of new policies, laws or regulations that might assume a substantially more hostile attitude toward foreign investment, including the imposition of additional taxes. In an extreme case, such a change could result in termination of contract rights and expropriation of foreign-owned assets. Any changes in oil and gas or investment regulations and policies or a shift in political attitudes in Argentina, Colombia, Peru or Brazil or other countries in which we intend to operate are beyond our control and may significantly hamper our ability to expand our operations or operate our business at a profit.
Changes in laws in the jurisdiction in which we operate or expand into with the effect of favoring local enterprises, and changes in political views regarding the exploitation of natural resources and economic pressures, may make it more difficult for us to negotiate agreements on favorable terms, obtain required licenses, comply with regulations or effectively adapt to adverse economic changes, such as increased taxes, higher costs, inflationary pressure and currency fluctuations. In certain jurisdictions the commitment of local business people, government officials and agencies and the judicial system to abide by legal requirements and negotiated agreements may be more uncertain, creating particular concerns with respect to licenses and agreements for business. These licenses and agreements may be susceptible to revision or cancellation and legal redress may be uncertain or delayed. Property right transfers, joint ventures, licenses, license applications or other legal arrangements pursuant to which we operate may be adversely affected by the actions of government authorities and the effectiveness of and enforcement of our rights under such arrangements in these jurisdictions may be impaired.
37
In July 2012, the Argentina government mandated the creation of an oil planning commission that will set national energy goals and have the power to review private oil companies' investment plans. Private companies must submit an annual investment plan by September 30 of each year. The committee will have the power to approve or reject the annual investment plan. This decree is new and many details are yet to be announced. However, we believe there is a risk that this may cause delays in our operations in Argentina, or cause changes to our investment plans that could negatively affect our business in Argentina or the rest of our operations.
Additionally in Argentina, some provincial regulations are changing, introducing new and/or increased royalties and fees associated with extensions of concession agreements. These royalties and fees represent increased costs for the affected concessions, specifically our Rio Negro Province concession, which could result in a decreased rate of return from this asset and could negatively affect our business in Argentina.
Almost All of Our Cash and Cash Equivalents is Held Outside of Canada and the United States, and if We Determine to, or Are Required to, Repatriate These Funds, We Could be Subject to Significant Taxes.
At December 31, 2013,
97%
of our cash and cash equivalents was held by subsidiaries and partnerships outside of Canada and the United States. Subsequent to year-end, some of this cash was used to pay amounts owing to the head office, however, this cash was generally not available to fund domestic or head office operations unless funds are repatriated. At this time, we do not intend to repatriate funds, but if we did, we might have to accrue and pay taxes in certain jurisdictions on the distribution of accumulated earnings.
We Have an Aggressive Business Plan, and if We do not Have the Resources to Execute on Our Business Plan, We May Be Required to Curtail Our Operations.
Our capital program for 2014 calls for approximately
$467 million
to fund our exploration and development, which we intend to fund through existing cash on hand and cash flows from operations at current production and commodity price levels. Funding this program relies in part on oil prices remaining high and other factors to generate sufficient cash flow. If we are not able to generate the sales which, together with our current cash resources, are sufficient to fund our capital program, we will not be able to efficiently execute our business plan which would cause us to decrease our exploration and development, which could harm our business outlook, investor confidence and our share price.
Strategic and Business Relationships Upon Which We May Rely Are Subject to Change, Which May Diminish Our Ability to Conduct Our Operations.
Our ability to successfully bid on and acquire additional properties, to discover reserves, to participate in drilling opportunities and to identify and enter into commercial arrangements will depend on developing and maintaining effective working relationships with industry participants and on our ability to select and evaluate suitable partners and to consummate transactions in a highly competitive environment. These relationships are subject to change and may impair our ability to grow.
To develop our business, we endeavor to use the business relationships of our management and Board of Directors to enter into strategic and business relationships, which may take the form of joint ventures with other parties or with local government bodies, or contractual arrangements with other oil and gas companies, including those that supply equipment and other resources that we will use in our business. We also have an active business development program to develop those relationships and foster new relationships. We may not be able to establish these business relationships, or if established, we may choose the wrong partner or we may not be able to maintain them. In addition, the dynamics of our relationships with strategic partners may require us to incur expenses or undertake activities we would not otherwise be inclined to take to fulfill our obligations to these partners or maintain our relationships. If we fail to make the cash calls required by our joint venture partners in the joint ventures we do not operate, we may be required to forfeit our interests in these joint ventures. If our strategic relationships are not established or maintained, our business prospects may be limited, which could diminish our ability to conduct our operations.
In addition, in cases where we are the operator, our partners may not be able to fulfill their obligations, which would require us to either take on their obligations in addition to our own, or possibly forfeit our rights to the area involved in the joint venture. In addition, despite our partner’s failure to fulfill its obligations, if we elect to terminate such relationship, we may be involved in litigation with such partners or may be required to pay amounts in settlement to avoid litigation despite such partner’s failure to perform. Alternatively, our partners may be able to fulfill their obligations, but will not agree with our proposals as operator of the property. In this case there could be disagreements between joint venture partners that could be costly in terms of dollars, time, deterioration of the partner relationship, and/or our reputation as a reputable operator. These joint venture partners may not comply with their responsibilities or may engage in conduct that could result in liability to us.
38
In cases where we are not the operator of the joint venture, the success of the projects held under these joint ventures is substantially dependent on our joint venture partners. The operator is responsible for day-to-day operations, safety, environmental compliance and relationships with government and vendors.
We have various work obligations on our blocks that must be fulfilled or we could face penalties, or lose our rights to those blocks if we do not fulfill our work obligations. Failure to fulfill obligations in one block can also have implications on the ability to operate other blocks in the country ranging from delays in government process and procedure to loss of rights in other blocks or in the country as a whole. Failure to meet obligations in one particular country may also have an impact on our ability to operate in others.
Disputes or Uncertainties May Arise in Relation to Our Royalty Obligations
Our production is subject to royalty obligations which may be prescribed by government regulation or by contract. These royalty obligations may be subject to changes in interpretation as business circumstances change.
As discussed above (see “Royalties”, above, in Item 1), our production from the Costayaco Exploitation Area is subject to the HPR royalty, which applies when cumulative gross production from an Exploitation Area is greater than five MMbbl. The HPR royalty is calculated on the difference between a trigger price defined in the Chaza Contract and the sales price. The ANH has interpreted the Chaza Contract as requiring that the HPR royalty must be paid with respect to all production from the Moqueta Exploitation Area and initiated a noncompliance procedure under the Chaza Contract, which we contested because the Moqueta Exploitation Area and the Costayaco Exploitation Area are separate Exploitation Areas. ANH did not proceed with that noncompliance procedure. We also believe that the evidence shows that the Costayaco and Moqueta fields are two clearly separate and independent hydrocarbon accumulations. Therefore, it is our view that, pursuant to the terms of the Chaza Contract, the HPR royalty is only to be paid with respect to production from the Moqueta Exploitation Area when the accumulated oil production from that Exploitation Area exceeds five MMbbl. Discussions with the ANH have not resolved this issue and we have initiated the dispute resolution process under the Chaza Contract and filed an arbitration claim seeking a decision that the HPR royalty is not payable until production from the Moqueta Exploitation Area exceeds five MMbbl. The ANH has filed a response to the claim seeking a declaration that its interpretation is correct and a counterclaim seeking, amongst other remedies, declarations that we breached the Chaza Contract by not paying the disputed HPR royalty, that the amount of the alleged HPR royalty that is payable, and that the Chaza Contract be terminated. As at
December 31, 2013
, total cumulative production from the Moqueta Exploitation Area was
2.3
MMbbl. The estimated compensation which would be payable on cumulative production to that date if the ANH is successful in the arbitration is
$38.4 million
. At this time no amount has been accrued in the financial statements nor deducted from our reserves for the disputed HPR royalty as we do not consider it probable that a loss will be incurred.
Additionally, the ANH and Gran Tierra are engaged in discussions regarding the interpretation of whether certain transportation and related costs are eligible to be deducted in the calculation of the HPR royalty. Discussions with the ANH are ongoing. Based on our understanding of the ANH's position, the estimated compensation which would be payable if the ANH’s interpretation is correct could be up to
$28.9 million
as at
December 31, 2013
. At this time no amount has been accrued in the financial statements as Gran Tierra does not consider it probable that a loss will be incurred.
In Argentina, some provincial regulations are changing, introducing new and/or increased royalties and fees associated with extensions of concession agreements. These royalties and fees represent increased costs for the affected concessions, specifically our Rio Negro Province concessions, which could result in a decreased rate of return from these assets and could negatively affect our business in Argentina.
Negative Political and Regulatory Developments in Argentina May Negatively Affect Our Operations.
The oil and natural gas industry in Argentina is subject to extensive regulation including land tenure, exploration, development, production, refining, transportation, and marketing, imposed by legislation enacted by various levels of government and, with respect to pricing and taxation of oil and natural gas, by agreements among the federal and provincial governments, all of which are subject to change and could have a material impact on our business in Argentina. The Federal Government of Argentina has implemented controls for domestic fuel prices and has placed a tax on oil and natural gas exports.
In October 2010, ENARGAS issued Regulation I-1410 aiming at securing the supply of natural gas to residential consumers and small industry given the decline in gas production and the expected growing demand for gas. The regulation includes all the procedures created by the authorities since 2004 (restrictions of exports, deviation of gas sales, to residential consumption)
39
and gives ENARGAS power to control gas marketing in order to assure the supply of gas to residential consumers and small industry.
Any future regulations that limit the amount of oil and gas that we could sell or any regulations that limit price increases in Argentina and elsewhere could severely limit the amount of our revenue and affect our results of operations.
Currently most oil and gas producers in Argentina are operating without sales contracts. In 2008, a new withholding tax regime for exports was introduced without specific guidance as to its application. The domestic price was regulated in a similar way, so that both exported and domestically sold products were priced the same. Producers and refiners of oil in Argentina were unable to determine an agreed sales price for oil deliveries to refineries. In our case, the refineries’ price offered to oil producers reflects their price received, less taxes and operating costs and their usual mark up. Along with most other oil producers in Argentina, we are continuing negotiating sales on a spot price basis with refiners and the price is negotiated on a month by month basis. The Provincial governments have also been hurt by these changes as their effective royalty and turnover tax takes have been reduced and capital investment in oilfields has declined, and so they are lobbying to change the situation. The government introduced the Petro Plus and Gas Plus programs in 2009, which grant higher prices to producers that sell production from new reserves. This positive step forward will hopefully lead to further opening of price regulation in Argentina.
The government of Argentina has been active in the oil and gas business. On April 16, 2012, the government announced their intention to acquire a 51% interest in YPF S.A. ("YPF") from Repsol S.A. (Repsol S.A. holds 56.7% of YPF), and retain 51% control for the Federal Government and distribute 49% of the shares to Argentina provinces. During 2012, the Argentina government took control of YPF's operations and signed deals with Chevron Corporation and others for developing shale resources. Repsol S.A. has filed international complaints and US lawsuits regarding the takeover and subsequent deals. Prior to this announcement, various provincial governments announced contract cancellations effecting YPF, Petrobras Argentina S.A., and Azabache Energy Inc., among others. The reason cited for the contract cancellations was lack of activity in the areas in question. We have active programs in all producing areas, which we believe helps mitigate our risk. However, despite the fact that all employees in Argentina are Argentines employed by a locally incorporated company, we also operate through two branches of foreign entities, and are viewed as a foreign company and could therefore face increased risk.
In July 2012, the Argentina government mandated the creation of an oil planning commission that will set national energy goals and have the power to review private oil companies' investment plans. The committee will have the power to approve or reject annual investment plans that must be submitted by private companies by September 30 of each year. This decree is new and many details are yet to be announced. However, we believe there is a risk that this may cause delays in our operations in Argentina, or cause changes to our investment plans that could negatively effect our business in Argentina or the rest of our operations.
Additionally in Argentina some provincial regulations are changing, which are introducing new royalties and fees associated with extensions of concession agreements. These royalties and fees represent increased costs for the affected concessions, specifically our Rio Negro Province concession, which could result in decreased rates of returns from this asset.
Our Business May Suffer if We do not Attract and Retain Talented Personnel.
Our success will depend in large measure on the abilities, expertise, judgment, discretion, integrity and good faith of our executive team and other personnel in conducting our business. The loss of any of these individuals or our inability to attract suitably qualified individuals to replace any of them could materially adversely impact our business. We are experiencing difficulties in finding and retaining suitably qualified staff in certain jurisdictions, particularly in Brazil and Peru, where experienced personnel in our industry are in high demand and competition for their talents is intense.
Our success depends on the ability of our management and employees to interpret market and geological data successfully and to interpret and respond to economic, market and other business conditions to locate and adopt appropriate investment opportunities, monitor such investments and ultimately, if required, successfully divest such investments. Further, our key personnel may not continue their association or employment with us and we may not be able to find replacement personnel with comparable skills. If we are unable to attract and retain key personnel, our business may be adversely affected.
Competition in Obtaining Rights to Explore and Develop Oil and Gas Reserves and to Market Our Production May Impair Our Business.
The oil and gas industry is highly competitive. Other oil and gas companies will compete with us by bidding for exploration and production licenses and other properties and services we will need to operate our business in the countries in which we
40
expect to operate. Additionally, other companies engaged in our line of business may compete with us from time to time in obtaining capital from investors. Competitors include larger companies, which, in particular, may have access to greater resources than us, may be more successful in the recruitment and retention of qualified employees and may conduct their own refining and petroleum marketing operations, which may give them a competitive advantage. In addition, actual or potential competitors may be strengthened through the acquisition of additional assets and interests. In the event that we do not succeed in negotiating additional property acquisitions, our future prospects will likely be substantially limited, and our financial condition and results of operations may deteriorate.
Foreign Currency Exchange Rate Fluctuations May Affect Our Financial Results.
We expect to sell our oil and natural gas production under agreements that will be denominated in U.S. dollars. Many of the operational and other expenses we incur will be paid in the local currency of the country where we perform our operations. Our income taxes in Colombia are paid in Colombian pesos. Our production in Argentina is primarily invoiced in U.S. dollars, but payment is made in Argentina pesos, at the then current exchange rate. As a result, we are exposed to translation risk when local currency financial statements are translated to U.S. dollars, our functional currency. Since September 1, 2005, exchange rates between the Colombian peso and U.S. dollar have varied between 1,648 pesos to one U.S. dollar to 2,632 pesos to one U.S. dollar, a fluctuation of approximately 60%. Since we began operating in Argentina (September 1, 2005), the rate of exchange between the Argentina peso and U.S. dollar has varied between 3.05 pesos to one U.S. dollar to 8.02 pesos to the U.S. dollar, a fluctuation of approximately 162%. Production in Brazil is invoiced and paid in Brazilian Reals. Since September 1, 2005, the exchange rate of the Brazilian Real has varied between 1.56 Reals to one U.S. dollar to 2.45 Reals to the U.S. dollar, a variance of 57%. Current and deferred tax liabilities in Colombia are denominated in Colombian pesos and the weakening of
9%
in the Colombian Peso against the U.S. dollar in the
year ended December 31, 2013
, resulted in a foreign exchange
gain
.
Maintaining Good Community Relationships and Being a Good Corporate Citizen May be Costly and Difficult to Manage.
Our operations have a significant effect on the areas in which we operate. To enjoy the confidence of local populations and the local governments, we must invest in the communities where were operate. In many cases, these communities are impoverished and lack many resources taken for granted in North America. The opportunities for investment are large, many and varied; however, we must be careful to invest carefully in projects that will truly benefit these areas. Improper management of these investments and relationships could lead to a delay in operations, loss of license or major impact to our reputation in these communities, which could adversely affect our business.
Our Operations Involve Substantial Costs and Are Subject to Certain Risks Because the Oil and Gas Industries in the Countries in Which We Operate Are Less Developed.
The oil and gas industry in South America is not as efficient or developed as the oil and gas industry in North America. As a result, our exploration and development activities may take longer to complete and may be more expensive than similar operations in North America. The availability of technical expertise, specific equipment and supplies may be more limited than in North America. We expect that such factors will subject our international operations to economic and operating risks that may not be experienced in North American operations.
Further, we operate in remote areas and may rely on helicopter, boats or other transport methods. Some of these transport methods may result in increased levels of risk and could lead to operational delays, serious injury or loss of life and could have a significant impact on our reputation.
Exchange Controls and New Taxes Could Materially Affect Our Ability to Fund Our Operations and Realize Profits from Our Foreign Operations.
Foreign operations may require funding if their cash requirements exceed operating cash flow. To the extent that funding is required, there may be exchange controls limiting such funding or adverse tax consequences associated with such funding. In addition, taxes and exchange controls may affect the dividends that we receive from foreign subsidiaries.
The governments in Brazil and Argentina require us to register funds that enter and exit the country with the central bank in each country. In Brazil, Argentina and Colombia, all transactions must be carried out in the local currency of the country. Exchange controls may prevent us from transferring funds abroad. For example, the Argentina government has imposed a number of monetary and currency exchange control measures that include restrictions on the free disposition of funds deposited with banks and tight restrictions on transferring funds abroad, with certain exceptions for transfers related to foreign trade and other authorized transactions approved by the Argentina Central Bank. The Central Bank may require prior authorization and may or may not grant such authorization for our Argentina subsidiaries to make dividend or loan payments to us and there may
41
be a tax imposed with respect to the expatriation of such proceeds. During the three months ending June 30, 2013, we repatriated
$11.1 million
to a Canadian subsidiary from one of our Argentina subsidiaries through loan repayments, authorized by the Argentina Central Bank. These were repayments of loan principal and as such had no withholding tax applied.
In Colombia, we participate in a special exchange regime, which allows us to receive revenue in U. S. dollars offshore. This regime gives us flexibility to determine the currency in which we receive our revenues, rather than to be restricted to Colombian pesos if received in Colombia, but also limits the ways in which we are able to fund our operations in Colombia. As such, this could cause us to employ funding strategies for our Colombian operations that are not as tax efficient as might otherwise be if we did not participate in the special exchange regime.
Tax law changes can impact the way we provide cross-border funding to our operating subsidiaries, as well as impact the after tax profits available for expatriation. For example, beginning in 2013, the Colombian rate of tax applicable to ordinary income derived by our Colombian operations has changed for the 3-year period 2013-2015 from 33% to 34%. Also in Colombia, beginning in 2013, a new definition of dividends is applied for branches. In this case, the transfer of branch profits are considered as dividends subject to a 25% tax if those dividends have not already been subject to Colombian tax. We do not currently expect that this change in Colombian law will have a material consequence.
Negative Political Developments in Colombia May Negatively Affect Our Proposed Operations.
Adverse political incidents may generate social unrest which could impact our operations and oil deliveries in Colombia. Peace process negotiations between the government and FARC may not generate the intended outcome for both parties. With the use of arms, and other methods of influence, the FARC may place pressure on organizations and communities that are in areas of operations of the company. These communities, and affiliated organizations, can generate protests to attract the attention of government. Protests or other demonstrations may establish blockades and could cause interruptions of operations, deliveries, and other disruptions to our work programs in the affected area.
Negative Political Developments in Peru May Negatively Affect our Proposed Operations.
Peru held a national election in June 2011 after which a new political regime was elected, led by the left-populist candidate, Ollante Humala, who was elected the President. Mr. Humala has noted that the past decade prioritized the strengthening of democracy with economic growth, while the new government will enhance social inclusion to benefit the neediest. This political regime may adopt new policies, laws and regulations that are more hostile toward foreign investment which may result in the imposition of additional taxes, the adoption of regulations that limit price increases, termination of contract rights, or the expropriation of foreign-owned assets. Such actions by the elected political regime could limit the amount of our future revenue in that country and affect our results of operations.
The United States Government May Impose Economic or Trade Sanctions on Colombia That Could Result In a Significant Loss to Us.
Colombia is among several nations whose eligibility to receive foreign aid from the United States is dependent on its progress in stemming the production and transit of illegal drugs, which is subject to an annual review by the President of the United States. Although Colombia is currently eligible for such aid, Colombia may not remain eligible in the future. A finding by the President that Colombia has failed demonstrably to meet its obligations under international counternarcotics agreements may result in any of the following:
|
•
|
all bilateral aid, except anti-narcotics and humanitarian aid, would be suspended;
|
|
•
|
the Export-Import Bank of the United States and the Overseas Private Investment Corporation would not approve financing for new projects in Colombia;
|
|
•
|
United States representatives at multilateral lending institutions would be required to vote against all loan requests from Colombia, although such votes would not constitute vetoes; and
|
|
•
|
the President of the United States and Congress would retain the right to apply future trade sanctions.
|
Each of these consequences could result in adverse economic consequences in Colombia and could further heighten the political and economic risks associated with our operations there. Any changes in the holders of significant government offices could have adverse consequences on our relationship with ANH and Ecopetrol and the Colombian government’s ability to control guerrilla activities and could exacerbate the factors relating to our foreign operations. Any sanctions imposed on
42
Colombia by the United States government could threaten our ability to obtain necessary financing to develop the Colombian properties or cause Colombia to retaliate against us, including by nationalizing our Colombian assets.
Accordingly, the imposition of the foregoing economic and trade sanctions on Colombia would likely result in a substantial loss and a decrease in the price of shares of our Common Stock. The United States may impose sanctions on Colombia in the future, and we cannot predict the effect in Colombia that these sanctions might cause.
We May not be Able to Effectively Manage Our Growth, Which May Harm Our Profitability.
Our strategy envisions continually expanding our business, both organically and through acquisition of other properties and companies. If we fail to effectively manage our growth or integrate successfully our acquisitions, our financial results could be adversely affected. Growth may place a strain on our management systems and resources. Integration efforts place a significant burden on our management and internal resources. The diversion of management attention and any difficulties encountered in the integration process could harm our business, financial condition and results of operations. In addition, we must continue to refine and expand our business development capabilities, our systems and processes and our access to financing sources. As we grow, we must continue to hire, train, supervise and manage new or acquired employees. We may not be able to:
|
•
|
expand our systems effectively or efficiently or in a timely manner;
|
|
•
|
allocate our human resources optimally;
|
|
•
|
identify and hire qualified employees or retain valued employees; or
|
|
•
|
incorporate effectively the components of any business that we may acquire in our effort to achieve growth.
|
If we are unable to manage our growth and our operations our financial results could be adversely affected by inefficiencies, which could diminish our profitability.
We May be Unable to Obtain Additional Capital That We Will Require to Implement Our Business Plan, Which Could Restrict Our Ability to Grow.
We expect that our existing cash resources and the availability to draw cash under our credit agreement will be sufficient to fund our currently planned activities. We may require additional capital to expand our exploration and development programs to additional properties. We may be unable to obtain additional capital required.
When we require additional capital, we plan to pursue sources of capital through various financing transactions or arrangements, including joint venturing of projects, debt financing, equity financing or other means. We may not be successful in locating suitable financing transactions in the time period required or at all, and we may not obtain the capital we require by other means. If we do succeed in raising additional capital, future financings may be dilutive to our shareholders, as we could issue additional shares of Common Stock or other equity to investors. In addition, debt and other mezzanine financing may involve a pledge of assets and may be senior to interests of equity holders. We may incur substantial costs in pursuing future capital financing, including investment banking fees, legal fees, accounting fees, securities law compliance fees, printing and distribution expenses and other costs. We may also be required to recognize non-cash expenses in connection with certain securities we may issue, such as convertibles and warrants, which will adversely impact our financial results.
Our ability to obtain needed financing may be impaired by factors such as the capital markets (both generally and in the oil and gas industry in particular), the location of our oil and natural gas properties in South America, prices of oil and natural gas on the commodities markets (which will impact the amount of asset-based financing available to us), and the loss of key management. Further, if oil and/or natural gas prices on the commodities markets decrease, then our revenues will likely decrease, and such decreased revenues may increase our requirements for capital. Some of the contractual arrangements governing our exploration activity may require us to commit to certain capital expenditures, and we may lose our contract rights if we do not have the required capital to fulfill these commitments. If the amount of capital we are able to raise from financing activities, together with our cash flow from operations, is not sufficient to satisfy our capital needs (even to the extent that we reduce our activities), we may be required to curtail our operations.
43
Guerrilla Activity in Peru Could Disrupt or Delay Our Operations and We Are Concerned About Safeguarding Our Operations and Personnel in Peru.
The Shining Path Guerilla group has been active in Peru since the early 1980’s and, at one point, was active throughout the country. Recently, the group’s activity has been confined to small areas of Peru and operations have been hampered by the capture of many high profile leaders and membership has fallen dramatically. During April 2012, 30 people working on the Camisea natural gas project in central Peru were kidnapped. Most of the workers were released after a short period of time, and the remainder were freed within a few days. The kidnapping was attributed to the Shining Path Guerilla group. Camisea is a very large, high profile project in an area where the group continues to be active. Our operations in Peru are in a different region, with no known activity by the group. Other groups may be active in other areas of the country and possibly our operational areas. We are monitoring the situation and increasing security measures as required. Nevertheless, we are concerned about the security of our operations in Peru and mitigate our risks through good relationships with local communities and stakeholders as well as strong security procedures.
We are subject to the U.S. Foreign Corrupt Practices Act, a Violation of Which Could Adversely Affect Our Business.
The U.S. Foreign Corrupt Practices Act ("FCPA") and similar anti-bribery laws in other jurisdictions prohibit corporations and individuals, including us and our employees, from making improper payments to non-U.S. officials and certain other individuals and organizations for the purpose of obtaining or retaining business or engaging in certain accounting practices. We do business and may do future business in countries in which we may face, directly or indirectly, corrupt demands by officials, tribal or insurgent organizations, international organizations, or private entities. As a result, we face the risk of unauthorized payments or offers of payments by employees, contractors and agents of ours or our subsidiaries or affiliates, even though these parties are not always subject to our control or direction. It is our policy to implement compliance procedures to prohibit these practices. However, our existing safeguards and any future improvements may prove to be less than effective or may not be followed, and our employees, contractors, agents, and partners may engage in illegal conduct for which we might be held responsible. Also, the FCPA contains certain accounting standards which obligate us to maintain accurate and complete books and records and a system of effective internal controls. These accounting provisions are very broad and a violation can occur
even if
there is no evidence of a bribe. The U.S. government is actively investigating and enforcing the FCPA and similar laws against companies and individuals. A violation of any of these laws, even if prohibited by our policies, may result in criminal or civil sanctions or other penalties (including profit disgorgement), could disrupt our business and could have a material adverse effect on our business. Actual or alleged violations could damage our reputation, be expensive to investigate and defend, and impair our ability to do business. A number of countries, including Canada, have strengthened their anti-corruption legislation. These laws prohibit both domestic and international bribery. There is a risk that an act of corruption can result in a violation of not only the FCPA, but also the laws of several other countries.
Our Business Could be Negatively Impacted by Security Threats, Including Cybersecurity Threats as Well as Other Disasters, and Related Disruptions.
Our business processes depend on the availability, capacity, reliability and security of our information technology infrastructure and our ability to expand and continually update this infrastructure in response to our changing needs. It is critical to our business that our facilities and infrastructure remain secure. Although we employ data encryption processes, an intrusion detection system, and other internal control procedures to assure the security of our data, we cannot guarantee that these measures will be sufficient for this purpose. The ability of the information technology function to support our business in the event of a security breach or a disaster such as fire or flood and our ability to recover key systems and information from unexpected interruptions cannot be fully tested and there is a risk that, if such an event actually occurs, we may not be able to address immediately the repercussions of the breach or disaster. In that event, key information and systems may be unavailable for a number of days or weeks, leading to our inability to conduct business or perform some business processes in a timely manner. In June 2013, the City of Calgary experienced flooding which caused power outages throughout the city. As a result, many of our key information systems were unavailable for two business days. We have implemented strategies to improve our ability to keep our systems functioning through a similar disaster.
We have expended significant time and money on the security of our facilities and on our information technology infrastructure including testing of our security at our facilities and infrastructure. If our security measures are breached as a result of third-party action, employee error or otherwise, and as a result our data becomes available to unauthorized parties, we may lose our competitive edge in certain of our business activities and our reputation may be damaged. If we experience any breaches of our network security or sabotage, we might be required to expend significant capital and other resources to remedy, protect against or alleviate these and related problems, and we may not be able to remedy these problems in a timely manner, or at all. Because techniques used by outsiders to obtain unauthorized network access or to sabotage systems change frequently and generally are
44
not recognized until launched against a target, we may be unable to anticipate these techniques or implement adequate preventative measures.
We have had past security breaches to our infrastructure, and, although they did not have a material adverse effect on our operations or our operating results, there can be no assurance of a similar result in the future. Our employees have been and will continue to be targeted by parties using fraudulent “spoof” and “phishing” emails to misappropriate information or to introduce viruses or other malware through “trojan horse” programs to our computers. These emails appear to be legitimate emails sent by us but direct recipients to fake websites operated by the sender of the email or request that the recipient send a password or other confidential information through email or download malware. Despite our efforts to mitigate “spoof” and “phishing” emails through education, “spoof” and “phishing” activities remain a serious problem that may damage our information technology infrastructure.
Risks Related to Our Industry
Unless We Are Able to Replace Our Reserves, and Develop and Manage Oil and Gas Reserves and Production on an Economically Viable Basis, Our Reserves, Production and Cash Flows May Decline as a Result.
Our future success depends on our ability to find, develop and acquire additional oil and gas reserves that are economically recoverable. Without successful exploration, development or acquisition activities, our reserves and production will decline. We may not be able to find, develop or acquire additional reserves at acceptable costs.
To the extent that we succeed in discovering oil and/or natural gas, reserves may not be capable of production levels we project or in sufficient quantities to be commercially viable. On a long-term basis, our viability depends on our ability to find or acquire, develop and commercially produce additional oil and gas reserves. Without the addition of reserves through exploration, acquisition or development activities, our reserves and production will decline over time as reserves are produced. Our future reserves will depend not only on our ability to develop and effectively manage then-existing properties, but also on our ability to identify and acquire additional suitable producing properties or prospects, to find markets for the oil and natural gas we develop and to effectively distribute our production into our markets. Future oil and gas exploration may involve unprofitable efforts, not only from dry wells, but from wells that are productive but do not produce sufficient net revenues to return a profit after drilling, operating and other costs. Completion of a well does not assure a profit on the investment or recovery of drilling, completion and operating costs. In addition, drilling hazards or environmental damage could greatly increase the cost of operations, and various field operating conditions may adversely affect the production from successful wells. These conditions include delays in obtaining governmental approvals or consents, shut-downs of connected wells resulting from extreme weather conditions, problems in storage and distribution and adverse geological and technical conditions. While we will endeavor to effectively manage these conditions, we may not be able to do so optimally, and we will not be able to eliminate them completely in any case. Therefore, these conditions could diminish our revenue and cash flow levels and result in the impairment of our oil and natural gas interests.
We Are Required to Obtain Licenses and Permits to Conduct Our Business and Failure to Obtain These Licenses Could Cause Significant Delays and Expenses That Could Materially Impact Our Business.
We are subject to licensing and permitting requirements relating to exploring and drilling for and development of oil and natural gas, including seismic, environmental and many other operating permits. We may not be able to obtain, sustain or renew such licenses and permits on a timely basis or at all. For example, the permitting process in Peru takes significant time, meaning that exploration and development projects have a longer cycle time to completion than they might elsewhere. In Colombia, other drilling and development projects are being delayed, most significantly our Moqueta field development, because of delays at the Ministry of the Environment and other government departments. In addition, environmental and social evaluation demands have increased in Colombia, causing permit processing to take longer than previously experienced in the areas where we operate. These delays are also significantly impacting other industry participants
.
Regulations and policies relating to these licenses and permits may change, be implemented in a way that we do not currently anticipate or take significantly greater time to obtain. These licenses and permits are subject to numerous requirements, including compliance with the environmental regulations of the local governments. As we are not the operator of all the joint ventures we are currently involved in, we may rely on the operator to obtain all necessary permits and licenses. If we fail to comply with these requirements, we could be prevented from drilling for oil and natural gas, and we could be subject to civil or criminal liability or fines. Revocation or suspension of our environmental and operating permits could have a material adverse effect on our business, financial condition and results of operations. For example, currently in Brazil, we are subject to restrictions on flaring natural gas, which have the impact of limiting our production capacity. Additionally in Brazil, the exploration phase of three of our concession agreements was due to expire on November 24, 2013. We have submitted an application to the ANP for
45
extensions of the exploration phase of these concession agreements as provided for in the agreements; however, we may not be successful and loss of these agreements may impair our ability to grow our business in Brazil.
Our Exploration for Oil and Natural Gas Is Risky and May Not Be Commercially Successful, Impairing Our Ability to Generate Revenues from Our Operations.
Oil and natural gas exploration involves a high degree of risk. These risks are more acute in the early stages of exploration. Our exploration expenditures may not result in new discoveries of oil or natural gas in commercially viable quantities. It is difficult to project the costs of implementing an exploratory drilling program due to the inherent uncertainties of drilling in unknown formations, the costs associated with encountering various drilling conditions, such as over pressured zones and tools lost in the hole, and changes in drilling plans and locations as a result of prior exploratory wells or additional seismic data and interpretations thereof. If exploration costs exceed our estimates, or if our exploration efforts do not produce results which meet our expectations, our exploration efforts may not be commercially successful, which could adversely impact our ability to generate revenues from our operations.
Our Inability to Obtain Necessary Facilities and/or Equipment Could Hamper Our Operations.
Oil and natural gas exploration and development activities are dependent on the availability of drilling and related equipment, transportation, power and technical support in the particular areas where these activities will be conducted, and our access to these facilities may be limited. To the extent that we conduct our activities in remote areas, needed facilities or equipment may not be proximate to our operations, which will increase our expenses. Demand for such limited equipment and other facilities or access restrictions may affect the availability of such equipment to us and may delay exploration and development activities. The quality and reliability of necessary facilities or equipment may also be unpredictable and we may be required to make efforts to standardize our facilities, which may entail unanticipated costs and delays. Shortages and/or the unavailability of necessary equipment or other facilities will impair our activities, either by delaying our activities, increasing our costs or otherwise.
Estimates of Oil and Natural Gas Reserves That We Make May be Inaccurate and Our Actual Revenues May be Lower and Our Operating Expenses May be Higher Than Our Financial Projections.
We make estimates of oil and natural gas reserves, upon which we will base our financial projections. We make these reserve estimates using various assumptions, including assumptions as to oil and natural gas prices, drilling and operating expenses, capital expenditures, taxes and availability of funds. Some of these assumptions are inherently subjective, and the accuracy of our reserve estimates relies in part on the ability of our management team, engineers and other advisors to make accurate assumptions. Economic factors beyond our control, such as interest rates and exchange rates, will also impact the value of our reserves. The process of estimating oil and gas reserves is complex, and will require us to use significant decisions and assumptions in the evaluation of available geological, geophysical, engineering and economic data for each property. As a result, our reserve estimates will be inherently imprecise. Actual future production, oil and natural gas prices, revenues, taxes, development expenditures, operating expenses and quantities of recoverable oil and gas reserves may vary substantially from those we estimate. If actual production results vary substantially from our reserve estimates, this could materially reduce our revenues and result in the impairment of our oil and natural gas interests.
Exploration, development, production (including transportation and workover costs), marketing (including distribution costs) and regulatory compliance costs (including taxes) will substantially impact the net revenues we derive from the oil and gas that we produce. These costs are subject to fluctuations and variation in different locales in which we operate, and we may not be able to predict or control these costs. If these costs exceed our expectations, this may adversely affect our results of operations. In addition, we may not be able to earn net revenue at our predicted levels, which may impact our ability to satisfy our obligations.
If Oil and Natural Gas Prices Decrease, We May be Required to Take Write-Downs of the Carrying Value of Our Oil and Natural Gas Properties.
We follow the full cost method of accounting for our oil and gas properties. A separate cost center is maintained for expenditures applicable to each country in which we conduct exploration and/or production activities. Under this method, the net book value of properties on a country-by-country basis, less related deferred income taxes, may not exceed a calculated “ceiling”. The ceiling is the estimated after tax future net revenues from proved oil and gas properties, discounted at 10% per year. In calculating discounted future net revenues, oil and natural gas prices are determined using the average price during the 12 months period prior to the ending date of the period covered by the balance sheet, calculated as an unweighted arithmetic average of the first-day-of-the month price for each month within such period for that oil and natural gas. That average price is
46
then held constant, except for changes which are fixed and determinable by existing contracts. The net book value is compared with the ceiling on a quarterly basis. The excess, if any, of the net book value above the ceiling is required to be written off as an expense. Under full cost accounting rules, any write-off recorded may not be reversed even if higher oil and natural gas prices increase the ceiling applicable to future periods. Future price decreases could result in reductions in the carrying value of such assets and an equivalent charge to earnings. In countries where we do not have proved reserves, dry wells drilled in a period would directly result in ceiling test impairment for that period.
In 2011, we recorded a ceiling test impairment loss of $42.0 million in our Peru cost center related to seismic and drilling costs on two blocks which were relinquished and a ceiling test impairment loss of $25.7 million in our Argentina cost center related to an increase in estimated future operating and capital costs to produce our remaining Argentina proved reserves and a decrease in reserve volumes. In 2012, we recorded a ceiling test impairment loss of
$20.2 million
in our Brazil cost center related to seismic and drilling costs on Block BM-CAL-10. The farm-out agreement for that block terminated during the first quarter of 2012 when we provided notice that we would not enter into the second exploration period. In 2013, we recorded a ceiling test impairment loss of
$30.8 million
in our Argentina cost center due to a decrease in reserves as a result of deferred investment and inconclusive waterflood results on the Puesto Morales Block and a
$2.0 million
in our Brazil cost center related to lower realized prices and an increase in operating costs.
Drilling New Wells and Producing Oil and Natural Gas From Existing Facilities Could Result in New Liabilities, Which Could Endanger Our Interests in Our Properties and Assets.
There are risks associated with the drilling of oil and natural gas wells, including encountering unexpected formations or pressures, premature declines of reservoirs, blow-outs, craterings, sour gas releases, fires and spills. Earthquakes or weather related phenomena such as heavy rain, landslides, storms and hurricanes can also cause problems in drilling new wells. There are also risks in producing oil and natural gas from existing facilities. For example, in January 2014, the Corunta-1 exploration well on the west flank of the Moqueta field encountered drilling problems prior to reaching the reservoir target on this long-reach deviated well, and the decision was made to abandon the well. The target location will be drilled again this year with a revised drilling plan. The occurrence of any of these events could significantly reduce our revenues or cause substantial losses, impairing our future operating results. We may become subject to liability for pollution, blow-outs or other hazards. Incidents such as these can lead to serious injury, property damage and even loss of life. We generally obtain insurance with respect to these hazards, but such insurance has limitations on liability that may not be sufficient to cover the full extent of such liabilities. The payment of such liabilities could reduce the funds available to us or could, in an extreme case, result in a total loss of our properties and assets. Moreover, we may not be able to maintain adequate insurance in the future at rates that are considered reasonable. Oil and natural gas production operations are also subject to all the risks typically associated with such operations, including premature decline of reservoirs and the invasion of water into producing formations.
Prices and Markets for Oil and Natural Gas Are Unpredictable and Tend to Fluctuate Significantly, Which Could Reduce Our Profitability, Growth and Value.
Oil and natural gas are commodities whose prices are determined based on world demand, supply and other factors, all of which are beyond our control. World prices for oil and natural gas have fluctuated widely in recent years. The average price for West Texas Intermediate ("WTI") per bbl has varied from $66 in 2006 to
$98
in 2013, demonstrating the inherent volatility in the market. The average Brent oil price per bbl was
$111
in 2011,
$112
in 2012 and
$109
in 2013. Given the current economic environment and unstable conditions in the Middle East, North Africa, the United States and Europe, the oil price environment is unpredictable and unstable. We expect that prices will fluctuate in the future. Price fluctuations will have a significant impact upon our revenue, the return from our oil and gas reserves and on our financial condition generally. Price fluctuations for oil and natural gas commodities may also impact the investment market for companies engaged in the oil and gas industry. Furthermore, prices which we receive for our oil sales, while based on international oil prices, are established by contract with purchasers with prescribed deductions for transportation and quality differentials. These differentials can change over time and have a detrimental impact on realized prices. Future decreases in the prices of oil and natural gas may have a material adverse effect on our financial condition, the future results of our operations and quantities of reserves recoverable on an economic basis.
In addition, oil and natural gas prices in Argentina are effectively regulated and during 2009 through 2013 were substantially lower than those received in North America. Oil prices in Colombia are related to international market prices, but adjustments that are defined by contracts with offtakers may cause realized prices to be lower or higher than those received in North America. Oil prices in Brazil are defined by contract with the refinery and may be lower or higher than those received in North America.
47
Decommissioning Costs Are Unknown and May be Substantial; Unplanned Costs Could Divert Resources from Other Projects.
We are responsible for costs associated with abandoning and reclaiming some of the wells, facilities and pipelines which we use for production of oil and gas reserves. Abandonment and reclamation of these facilities and the costs associated therewith is often referred to as “decommissioning.” We have determined that we require a reserve account for these potential costs in respect of our current properties and facilities at this time, and have booked such reserve on our financial statements. If decommissioning is required before economic depletion of our properties or if our estimates of the costs of decommissioning exceed the value of the reserves remaining at any particular time to cover such decommissioning costs, we may have to draw on funds from other sources to satisfy such costs. The use of other funds to satisfy decommissioning costs could impair our ability to focus capital investment in other areas of our business.
Penalties We May Incur Could Impair Our Business.
Our exploration, development, production and marketing operations are regulated extensively under foreign, federal, state and local laws and regulations. Under these laws and regulations, we could be held liable for personal injuries, property damage, site clean-up and restoration obligations or costs and other damages and liabilities. We may also be required to take corrective actions, such as installing additional safety or environmental equipment, which could require us to make significant capital expenditures. Failure to comply with these laws and regulations may also result in the suspension or termination of our operations and subject us to administrative, civil and criminal penalties, including the assessment of natural resource damages. We could be required to indemnify our employees in connection with any expenses or liabilities that they may incur individually in connection with regulatory action against them. As a result of these laws and regulations, our future business prospects could deteriorate and our profitability could be impaired by costs of compliance, remedy or indemnification of our employees, reducing our profitability.
Policies, Procedures and Systems to Safeguard Employee Health, Safety and Security May Not be Adequate.
Oil and natural gas exploration and production is dangerous. Detailed and specialized policies, procedures and systems are required to safeguard employee health, safety and security. We have undertaken to implement best practices for employee health, safety and security; however, if these policies, procedures and systems are not adequate, or employees do not receive adequate training, the consequences can be severe including serious injury or loss of life, which could impair our operations and cause us to incur significant legal liability.
Environmental Risks May Adversely Affect Our Business.
All phases of the oil and natural gas business present environmental risks and hazards and are subject to environmental regulation pursuant to a variety of international conventions and federal, provincial and municipal laws and regulations. Environmental legislation provides for, among other things, restrictions and prohibitions on spills, releases or emissions of various substances produced in association with oil and gas operations. The legislation also requires that wells and facility sites be operated, maintained, abandoned and reclaimed to the satisfaction of applicable regulatory authorities. Compliance with such legislation can require significant expenditures and a breach may result in the imposition of fines and penalties, some of which may be material. Environmental legislation is evolving in a manner we expect may result in stricter standards and enforcement, larger fines and liability and potentially increased capital expenditures and operating costs. The discharge of oil, natural gas or other pollutants into the air, soil or water may give rise to liabilities to foreign governments and third parties and may require us to incur costs to remedy such discharge. The application of environmental laws to our business may cause us to curtail our production or increase the costs of our production, development or exploration activities.
Our Insurance May be Inadequate to Cover Liabilities We May Incur.
Our involvement in the exploration for and development of oil and natural gas properties may result in our becoming subject to liability for pollution, blowouts, property damage, personal injury or other hazards. Although we have insurance in accordance with industry standards to address such risks, such insurance has limitations on liability that may not be sufficient to cover the full extent of such liabilities. In addition, such risks may not in all circumstances be insurable or, in certain circumstances, we may choose not to obtain insurance to protect against specific risks due to the high premiums associated with such insurance or for other reasons. The payment of such uninsured liabilities would reduce the funds available to us. If we suffer a significant event or occurrence that is not fully insured, or if the insurer of such event is not solvent, we could be required to divert funds from capital investment or other uses towards covering our liability for such events.
48
Challenges to Our Properties May Impact Our Financial Condition.
Title to oil and natural gas interests is often not capable of conclusive determination without incurring substantial expense. While we intend to make appropriate inquiries into the title of properties and other development rights we acquire, title defects may exist. In addition, we may be unable to obtain adequate insurance for title defects, on a commercially reasonable basis or at all. If title defects do exist, it is possible that we may lose all or a portion of our right, title and interest in and to the properties to which the title defects relate.
Furthermore, applicable governments may revoke or unfavorably alter the conditions of exploration and development authorizations that we procure, or third parties may challenge any exploration and development authorizations we procure. Such rights or additional rights we apply for may not be granted or renewed on terms satisfactory to us.
If our property rights are reduced, whether by governmental action or third party challenges, our ability to conduct our exploration, development and production may be impaired.
We Will Rely on Technology to Conduct Our Business and Our Technology Could Become Ineffective or Obsolete.
We rely on technology, including geographic and seismic analysis techniques and economic models, to develop our reserve estimates and to guide our exploration and development and production activities. We will be required to continually enhance and update our technology to maintain its efficacy and to avoid obsolescence. The costs of doing so may be substantial, and may be higher than the costs that we anticipate for technology maintenance and development. If we are unable to maintain the efficacy of our technology, our ability to manage our business and to compete may be impaired. Further, even if we are able to maintain technical effectiveness, our technology may not be the most efficient means of reaching our objectives, in which case we may incur higher operating costs than we would were our technology more efficient.
Risks Related to Our Common Stock
The Market Price of Our Common Stock May be Highly Volatile and Subject to Wide Fluctuations.
The market price of shares of our Common Stock may be highly volatile and could be subject to wide fluctuations in response to a number of factors that are beyond our control, including but not limited to:
|
•
|
dilution caused by our issuance of additional shares of Common Stock and other forms of equity securities, which we expect to make in connection with acquisitions of other companies or assets;
|
|
•
|
announcements of new acquisitions, reserve discoveries or other business initiatives by our competitors;
|
|
•
|
fluctuations in revenue from our oil and natural gas business;
|
|
•
|
changes in the market and/or WTI or Brent price for oil and natural gas commodities and/or in the capital markets generally, or under our credit agreement;
|
|
•
|
changes in the demand for oil and natural gas, including changes resulting from the introduction or expansion of alternative fuels;
|
|
•
|
changes in the social, political and/or legal climate in the regions in which we will operate;
|
|
•
|
changes in the valuation of similarly situated companies, both in our industry and in other industries;
|
|
•
|
changes in analysts’ estimates affecting us, our competitors and/or our industry;
|
|
•
|
changes in the accounting methods used in or otherwise affecting our industry;
|
|
•
|
announcements of technological innovations or new products available to the oil and natural gas industry;
|
|
•
|
announcements by relevant governments pertaining to incentives for alternative energy development programs;
|
|
•
|
fluctuations in interest rates, exchange rates and the availability of capital in the capital markets; and
|
49
|
•
|
significant sales of shares of our Common Stock, including sales by future investors in future offerings we expect to make to raise additional capital.
|
In addition, the market price of shares of our Common Stock could be subject to wide fluctuations in response to various factors, which could include the following, among others:
|
•
|
quarterly variations in our revenues and operating expenses; and
|
|
•
|
additions and departures of key personnel.
|
These and other factors are largely beyond our control, and the impact of these risks, singularly or in the aggregate, may result in material adverse changes to the market price of shares of our Common Stock and/or our results of operations and financial condition.
We do not Expect to Pay Dividends in the Foreseeable Future.
We do not intend to declare dividends for the foreseeable future, as we anticipate that we will reinvest any future earnings in the development and growth of our business. Therefore, investors will not receive any funds unless they sell their shares of Common Stock, and shareholders may be unable to sell their shares on favorable terms or at all. Investors cannot be assured of a positive return on investment or that they will not lose the entire amount of their investment in shares of our Common Stock.
Item 1B.
Unresolved Staff Comments
None.
Item 2.
Properties
We have described our properties, reserves, acreage, wells, production and drilling activity in Part I, Item 1. “Business” of this Annual Report on Form 10-K, which information and descriptions are incorporated by reference here.
Administrative Facilities
Our executive offices are located in Calgary, Canada. Our primary executive offices comprise approximately 15,700 square feet, which we lease for approximately $34,000 per month under a lease that expires on October 30, 2015. We also lease additional space in Calgary that we use to supplement our primary executive office space. We lease administrative office space in Colombia, Argentina, Peru and Brazil. We believe that our current executive and administrative offices are sufficient for our purposes or, to the extent that we need additional office space, that additional office space will be readily available to us.
Item 3.
Legal Proceedings
As discussed above (see “Royalties”, above, in Item 1), Gran Tierra’s production from the Costayaco Exploitation Area is subject to the HPR royalty, which applies when cumulative gross production from an Exploitation Area is greater than five MMbbl. The HPR royalty is calculated on the difference between a trigger price defined in the Chaza Contract and the sales price. The ANH has interpreted the Chaza Contract as requiring that the HPR royalty must be paid with respect to all production from the Moqueta Exploitation Area and initiated a noncompliance procedure under the Chaza Contract, which was contested by Gran Tierra because the Moqueta Exploitation Area and the Costayaco Exploitation Area are separate Exploitation Areas. ANH did not proceed with that noncompliance procedure. Gran Tierra also believes that the evidence shows that the Costayaco and Moqueta fields are two clearly separate and independent hydrocarbon accumulations. Therefore, it is Gran Tierra’s view that, pursuant to the terms of the Chaza Contract, the HPR royalty is only to be paid with respect to production from the Moqueta Exploitation Area when the accumulated oil production from that Exploitation Area exceeds five MMbbl. Discussions with the ANH have not resolved this issue and Gran Tierra has initiated the dispute resolution process under the Chaza Contract and filed an arbitration claim seeking a decision that the HPR royalty is not payable until production from the Moqueta Exploitation Area exceeds five MMbbl. The ANH has filed a response to the claim seeking a declaration that its interpretation is correct and a counterclaim seeking, amongst other remedies, declarations that Gran Tierra breached the Chaza Contract by not paying the disputed HPR royalty, that the amount of the alleged HPR royalty that is payable, and that the Chaza Contract be terminated. As at
December 31, 2013
, total cumulative production from the Moqueta Exploitation Area was
2.3
MMbbl. The estimated compensation which would be payable on cumulative production to that date if the ANH is successful in the arbitration is
$38.4 million
. At this time, no amount has been accrued in the financial statements nor deducted from our reserves for the disputed HPR royalty as Gran Tierra does not consider it probable that a loss will be incurred.
50
Additionally, the ANH and Gran Tierra are engaged in discussions regarding the interpretation of whether certain transportation and related costs are eligible to be deducted in the calculation of the HPR royalty. Discussions with the ANH are ongoing. Based on our understanding of the ANH's position, the estimated compensation which would be payable if the ANH’s interpretation is correct could be up to
$28.9 million
as at
December 31, 2013
. At this time no amount has been accrued in the financial statements as Gran Tierra does not consider it probable that a loss will be incurred.
We have several other lawsuits and claims pending. Although the outcome of these lawsuits and disputes cannot be predicted with certainty, we believe the resolution of these matters would not have a material adverse effect on our consolidated financial position, results of operations or cash flows. We record costs as they are incurred or become probable and determinable.
Item 4.
Mine Safety Disclosures
Not applicable.
End of Item 4
Executive Officers of the Registrant
Set forth below is information regarding our executive officers as of
February 19, 2014
.
|
Name
|
Age
|
Position
|
||
|
Dana Coffield
|
55
|
President and Chief Executive Officer; Director
|
||
|
James Rozon
|
50
|
Chief Financial Officer
|
||
|
Shane O’Leary
|
57
|
Chief Operating Officer
|
||
|
David Hardy
|
59
|
Vice-President, Legal, Secretary and General Counsel
|
||
|
Rafael Orunesu
|
58
|
President, Gran Tierra Energy Argentina
|
||
|
Duncan Nightingale
|
55
|
President, Gran Tierra Energy Colombia
|
||
|
Julio Cesar Moreira
|
52
|
President, Gran Tierra Energy Brazil
|
||
|
Carlos Monges
|
57
|
President, Gran Tierra Energy Peru
|
||
Dana Coffield, President, Chief Executive Officer and Director
. Before joining Gran Tierra as President, Chief Executive Officer and a Director in May, 2005, Mr. Coffield led the Middle East Business Unit for Encana Corporation, at the time North America’s largest independent oil and gas company, from 2003 to 2005. His responsibilities included business development, exploration operations, commercial evaluations, government and partner relations, planning and budgeting, environment/health/safety, security and management of several overseas operating offices. From 1998 through 2003, he was New Ventures Manager for Encana’s predecessor — Alberta Energy Company — where he expanded exploration operations into five new countries on three continents. Mr. Coffield was previously with ARCO International for ten years, where he participated in exploration and production operations in North Africa, Southeast Asia and Alaska. He began his career as a mud-logger in the Texas Gulf Coast and later as a Research Assistant with the Earth Sciences and Resources Institute where he conducted geoscience research in North Africa, the Middle East and Latin America. Mr. Coffield graduated from the University of South Carolina with a Masters of Science (MSc) degree and a doctorate (PhD) in Geology, based on research conducted in the Oman Mountains in Arabia and Gulf of Suez in Egypt, respectively. He has a Bachelor of Science degree in Geological Engineering from the Colorado School of Mines. Mr. Coffield is a member of the AAPG and the CSPG, and is a Fellow of the Explorers Club.
James Rozon, Chief Financial Officer
. On May 2, 2012, James Rozon was promoted from acting Chief Financial Officer to Chief Financial Officer. Mr. Rozon had been serving as acting Chief Financial Officer since December 9, 2011. Mr. Rozon served as Gran Tierra’s Corporate Controller from October 1, 2007 to December 9, 2011. He has previous experience in accounting, finance and administration in the petroleum and technology industries in Canada. During his career, his responsibilities have included management of finance related activities of Canadian and American oil and gas exploration and production companies operating in Canada and the United States and a software development company operating in Canada, the United States, China and Sweden. He was Controller of Sound Energy Trust, a publicly listed Canadian oil and gas trust from July 2006 to September 2007, at which time it was sold. From October 2002 to June 2006, and previously from July 1995 to February 1998, he was the Corporate Controller of Zi Corporation, a Canadian software development company publicly listed in both Canada and the United States of America. From June 2000 to September 2002, he was the Controller for Energy Exploration Technologies, an American publicly listed oil
51
and gas exploration company operating in Canada and the United States. From April 1998 to May 2000, he was the Manager, Financial Reporting of Summit Resources Limited, a publicly listed Canadian oil and gas exploration and development company with operations in Canada and the United States of America. From June 1990 to June 1995, Mr. Rozon worked in public practice for five years for Deloitte & Touche LLP including one year as an audit manager in the Oil and Gas group in the Calgary, Alberta office. Mr. Rozon holds a Bachelor of Commerce degree from the University of Saskatchewan and is a member of the Institute of Chartered Accountants of Alberta and the Institute of Chartered Accountants of Saskatchewan.
Shane P. O’Leary, Chief Operating Officer
. Mr. O’Leary joined the company as Chief Operating Officer effective March 2, 2009. Mr. O’Leary’s regional experience includes South America, North Africa, the Middle East, the former Soviet Union, and North America. Prior to joining Gran Tierra, Mr. O’Leary was President and Chief Executive Officer of First Calgary Petroleums Ltd., an oil and natural gas company actively engaged in exploration and development activities in Algeria. In this role, he was responsible for all operating and corporate activities involved in a $2 billion development program for the exploitation of a resource base exceeding three trillion cubic feet of natural gas equivalent in the Sahara desert, Algeria. Mr. O'Leary led initiatives to explore strategic options which resulted in the sale of the company to ENI SpA for over $1 billion. From 2002 to 2006, Mr. O’Leary worked for Encana Corporation where his positions included Vice President of Development Planning and Engineering, International New Ventures, as well as Vice President Brazil Business Unit. In these roles Mr. O'Leary was responsible for all engineering and development planning for new discoveries of the International New Ventures Division and later leading the Brazil team involved in appraising an offshore discovery subsequently divested for $360 million.
Mr. O'Leary was also architect of a technology cooperation agreement with Petrobras involving numerous partnerships in offshore acreage in exchange for assistance to Petrobras in applying Canadian Heavy Oil production technology in Brazil. From 1985 to 2002 he worked for the Amoco Production Company/BP Exploration where he occupied numerous senior finance, planning, and business development positions with assignments in Canada, U.S.A., Azerbaijan and Egypt, culminating in his role as Business Development Manager for BP Alaska Gas. Early in his career Mr. O’Leary worked as a Corporate Banking Officer for Bank of Montreal’s Petroleum group in Calgary, a Reservoir Engineer for Dome Petroleum, and as a Senior Field Engineer for Schlumberger Overseas, S.A. in Kuwait. Mr. O’Leary earned his Bachelor of Science degree in chemical engineering from Queen’s University in Kingston, Ontario and his Masters in Business Administration from the University of Western Ontario in London, Ontario. He is a member of the Canadian National Committee of the World Petroleum Council and The Association of Professional Engineers, Geologists, and Geophysicists of Alberta (P. Eng).
David Hardy, Vice President, Legal, and Secretary and General Counsel
. Mr. Hardy joined Gran Tierra as General Counsel, Vice President Legal and Secretary on March 1, 2010. He has more than 20 years’ experience in the legal profession. Before joining Gran Tierra, he worked for Encana Corporation from 2000 through 2009 where he held various positions, including: Vice President Divisional Legal Services, Integrated Oil and Canadian Plains Divisions; Vice President Regulatory Services, Corporate Relations Division; and Associate General Counsel, Offshore and International Division. For four of his eight years in the Offshore and International Division of Encana, Mr. Hardy led the Legal and Commercial Negotiations Group, where he was responsible for providing strategic legal, commercial and negotiation advice and support to the offshore and international business units. This included dealing with new venture activities and operational, joint venture and host government issues relating to projects in various countries, including Australia, Brazil, Chad, Libya, Oman, Qatar and Yemen. Prior to joining Encana, Mr. Hardy spent over 10 years in private practice and was a partner in a law firm in Calgary, Alberta. He holds a Juris Doctor Degree from the University of Calgary (converted from an LL.B Degree in 2011) and is a member of the Law Society of Alberta and the Association of International Petroleum Negotiators.
Rafael Orunesu, President, Gran Tierra Argentina
. Mr. Orunesu joined Gran Tierra in March 2005. He brings a mix of operations management, project evaluation, production geology, reservoir and production engineering skills to Gran Tierra, with a South American focus. Prior to joining Gran Tierra he was Engineering Manager for Pluspetrol Peru, from 1997 through 2004, responsible for planning and development operations in the Peruvian North jungle. He participated in numerous evaluation and asset purchase and sale transactions covering Latin America and North Africa, discovering 200 MMbbl of oil over a five-year period. Mr. Orunesu was previously with Pluspetrol Argentina from 1990 to 1996 where he managed the technical/economic evaluation of several oil fields. He began his career with YPF, initially as a geologist in the Austral Basin of Argentina and eventually as Chief of Exploitation Geology and Engineering for the Catriel Field in the Neuquén Basin, where he was responsible for drilling programs, workovers and secondary recovery projects.
Mr. Orunesu has a postgraduate degree in Reservoir Engineering and Exploitation Geology from Universidad Nacional de Buenos Aires and a degree in Geology from Universidad Nacional de la Plata, Argentina.
Duncan Nightingale, President, Gran Tierra Energy Colombia
. Mr. Nightingale joined Gran Tierra in September 2009, where he served in our Calgary, Canada office as our Vice President of Exploration from September 2009 to January 2011. He served in our Bogotá, Colombia office as our Senior Manager Project Planning and Exploration from January 2011 until August 2011, and was promoted to President of Gran Tierra Energy Colombia in August 2011. Prior to joining Gran Tierra, Mr. Nightingale was Senior Vice President, Exploration & Production, at Artumas Group Inc., a Canadian oil and gas company focusing on
52
exploration and development of hydrocarbon reserves in Tanzania and Mozambique, where he was responsible for Artumas Group’s exploration and production operations in Mozambique and Tanzania and management of its gas processing plant and power generation facility in Tanzania. Prior to Artumas Group, Mr. Nightingale was General Manager, Exploration & Production, with Dana Gas PJSC, a leading private sector natural gas company in the Middle East, where Mr. Nightingale was responsible for all of Dana Gas’s exploration and production operations, and was responsible for a multi-million dollar exploration and development program in Kurdistan. Prior to Dana Gas, Mr. Nightingale was with Encana Corporation’s International Division from May 2002 until March 2007. From June 2002 until September 2003, he was the Country Manager in Qatar, responsible for managing Encana’s activities in Qatar, including the execution of exploration programs and new venture activity. From October 2003 until June 2006, he had similar responsibilities in the Sultanate of Oman, where he served as Encana’s Country Manager. Mr. Nightingale has a total of 30 years of corporate head office and resident in-country international operating experience, spanning all aspects of managing exploration programs, development and production operations, new business ventures, portfolio management and strategic planning. Mr. Nightingale graduated from the University of Nottingham in the U.K. with a Bachelor of Science degree with honors in Geology.
Julio Cesar Moreira, President, Gran Tierra Energy Brasil
. Mr. Moreira joined our company as President, Gran Tierra Brazil in September 2009. Mr. Moreira has over 25 years of experience working for international companies in Brazil and USA in senior business development and management positions. Most recently, he was Managing Director for IBV Brasil Petroleo Ltda from September 2008 to August 2009 where he managed a portfolio of assets including 10 Exploration Deep Water Blocks located in Sergipe-Alagoas, Espirito Santo, Potiguar and Campos Basins, all in Brazil, and Brazil Country Manager for Encana Corporation from December 2001 to September 2008, where he was instrumental in capturing assets which were later sold for a combined value of over $500 million. Before Encana Corporation, Mr. Moreira was Brazil New Ventures & Business Development Vice President for Unocal Corporation where he successfully completed a $180 million corporate transaction to acquire a Natural Gas / Condensate field in Northeast Brazil and captured Deep Water Exploration assets offshore Brazil. Mr. Moreira holds an Information Technology degree from Universidade Federal Fluminense in Rio de Janeiro, and a post-graduate degree in Marketing from Rio Catholic University. In addition, he attended the Executive MBA Program at UFRJ/Coppead (Brazil), the Executive Management programs in Oil and Gas at Thunderbird (USA) and the Ivey Executive Program at the University of Western Ontario (Canada).
Carlos Monges, President, Gran Tierra Energy Peru.
Mr. Monges has over 30 years of experience in the oil industry. He joined our company upon its acquisition of Petrolifera Petroleum Limited ("Petrolifera") in March 2011. He was Petrolifera’s country manager in Peru since 2005, with responsibility for management and exploratory operations in three onshore blocks. He was the senior geologist on the team that performed for PeruPetro S.A. ("PeruPetro") a geological and geophysical assessment of Peru’s hydrocarbon basins which was sponsored by the Canadian and Peruvian governments. Prior to that, Mr. Monges was the Operations Manager for Energy Development, Anadarko Petroleum and then BPZ Energy with respect to various offshore and onshore blocks in Peru. He began his career in the industry working as a field development geologist and a well-site and production geologist in Talara Basin for Petróleos del Perú S.A. and Occidental Petroleum and also worked as a mud engineer in drilling operations in Venezuela and Argentina. Mr. Monges received his Bachelor of Science Degree in Geological Engineering from Universidad Nacional Mayor de San Marcos, Lima in 1978, performed studies on exploration techniques at Robertson Research Center in United Kingdom in 1990, and completed certificate studies on oil industry management at the IHRDC program in Boston, USA in 1997. He is a current member and past director of the Peruvian Geological Society.
Item 5.
Market for Registrant's Common Equity, Related Stockholder Matters and Issuer Purchases of Equity Securities
Shares of our Common Stock trade on the NYSE MKT, and on the Toronto Stock Exchange ("TSX") under the symbol “GTE”. In addition, the exchangeable shares in one of our subsidiaries, Gran Tierra Exchangeco, are listed on the TSX and are trading under the symbol “GTX”.
As of
February 19, 2014
, there were approximately:
38
holders of record of shares of our Common Stock and
272,341,810
shares outstanding with $0.001 par value; and one share of Special A Voting Stock, $0.001 par value representing approximately
six
holders of record of
4,534,127
exchangeable shares which may be exchanged on a 1-for-1 basis into shares of our Common Stock; and one share of Special B Voting Stock, $0.001 par value, representing
nine
holders of record of
6,334,313
shares of Gran Tierra Exchangeco Inc., which are exchangeable on a 1-for-1 basis into shares of our Common Stock.
For the quarters indicated from January 1,
2012
, through the end of the fourth quarter of
2013
, the following table shows the high and low closing sale prices per share of our Common Stock as reported on the NYSE MKT.
53
|
High
|
Low
|
|||||||
|
Fourth Quarter 2013
|
$
|
7.92
|
|
$
|
6.86
|
|
||
|
Third Quarter 2013
|
$
|
7.36
|
|
$
|
6.01
|
|
||
|
Second Quarter 2013
|
$
|
6.53
|
|
$
|
5.21
|
|
||
|
First Quarter 2013
|
$
|
6.12
|
|
$
|
5.00
|
|
||
|
Fourth Quarter 2012
|
$
|
5.93
|
|
$
|
4.87
|
|
||
|
Third Quarter 2012
|
$
|
5.51
|
|
$
|
4.17
|
|
||
|
Second Quarter 2012
|
$
|
6.64
|
|
$
|
4.44
|
|
||
|
First Quarter 2012
|
$
|
6.29
|
|
$
|
4.73
|
|
||
Dividend Policy
We have never declared or paid dividends on the shares of Common Stock and we intend to retain future earnings, if any, to support the development of the business and therefore do not anticipate paying cash dividends for the foreseeable future. Payment of future dividends, if any, would be at the discretion of our Board of Directors after taking into account various factors, including current financial condition, the tax impact of repatriating cash, operating results and current and anticipated cash needs. Under the terms of our credit facility we cannot pay any dividends to our shareholders if we are in default under the facility, and if we are not in default then are required to obtain bank approval for any dividend payments made by us exceeding $2 million in any fiscal year.
Performance Graph
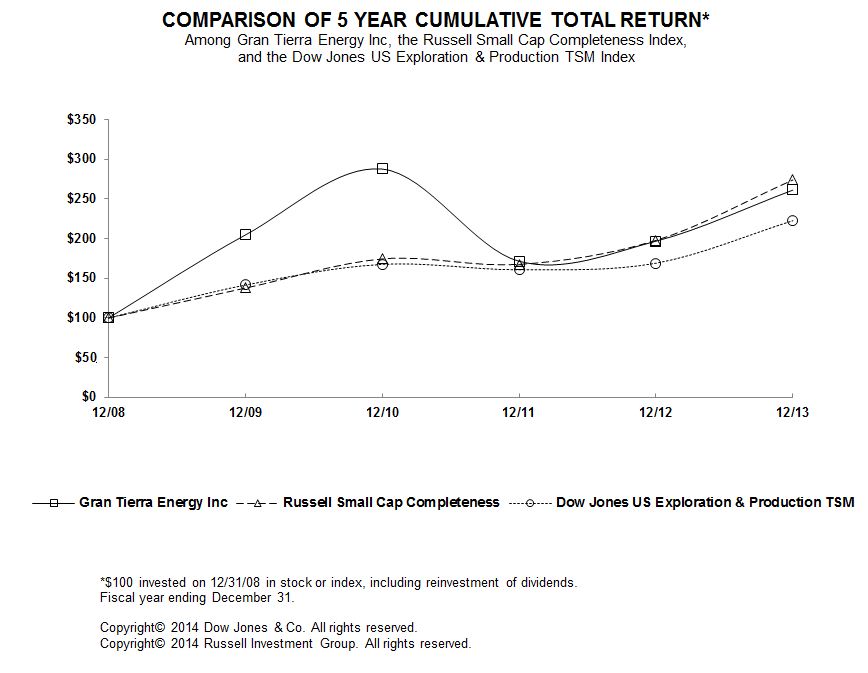
54

55
Item 6.
Selected Financial Data
(Thousands of U.S. Dollars, Except Share and Per Share Amounts)
|
Statement of Operations Data
|
|||||||||||||||||||
|
Year Ended December 31, 2013
|
Year Ended December 31, 2012
|
Year Ended December 31, 2011
|
Year Ended December 31, 2010
|
Year Ended December 31, 2009
|
|||||||||||||||
|
Oil and natural gas sales
|
$
|
720,450
|
|
$
|
583,109
|
|
$
|
596,191
|
|
$
|
373,286
|
|
$
|
262,629
|
|
||||
|
Interest income
|
3,193
|
|
2,078
|
|
1,216
|
|
1,174
|
|
1,087
|
|
|||||||||
|
723,643
|
|
585,187
|
|
|
597,407
|
|
|
374,460
|
|
|
263,716
|
|
|||||||
|
Operating expenses
|
149,059
|
|
124,903
|
|
86,497
|
|
59,446
|
|
40,784
|
|
|||||||||
|
DD&A expenses
|
267,146
|
|
182,037
|
|
231,235
|
|
163,573
|
|
135,863
|
|
|||||||||
|
G&A expenses
|
53,400
|
|
58,882
|
|
60,389
|
|
40,241
|
|
28,787
|
|
|||||||||
|
Other gain
|
—
|
|
(9,336
|
)
|
—
|
|
—
|
|
—
|
|
|||||||||
|
Other loss
|
4,400
|
|
—
|
|
—
|
|
—
|
|
—
|
|
|||||||||
|
Equity tax
|
—
|
|
—
|
|
8,271
|
|
—
|
|
—
|
|
|||||||||
|
Financial instruments (gain) loss
|
—
|
|
—
|
|
(1,522
|
)
|
(44
|
)
|
190
|
|
|||||||||
|
Gain on acquisition
|
—
|
|
—
|
|
(21,699
|
)
|
—
|
|
—
|
|
|||||||||
|
Foreign exchange (gain) loss
|
(12,198
|
)
|
31,338
|
|
(11
|
)
|
16,838
|
|
19,797
|
|
|||||||||
|
461,807
|
|
387,824
|
|
|
363,160
|
|
|
280,054
|
|
|
225,421
|
|
|||||||
|
Income before income taxes
|
261,836
|
|
|
197,363
|
|
|
234,247
|
|
94,406
|
|
38,295
|
|
|||||||
|
Income tax expense
|
(135,548
|
)
|
(97,704
|
)
|
(107,330
|
)
|
(57,234
|
)
|
(24,354
|
)
|
|||||||||
|
Net income
|
$
|
126,288
|
|
|
$
|
99,659
|
|
|
$
|
126,917
|
|
$
|
37,172
|
|
$
|
13,941
|
|
||
|
Net income per common share - basic
|
$
|
0.45
|
|
$
|
0.35
|
|
$
|
0.46
|
|
$
|
0.15
|
|
$
|
0.06
|
|
||||
|
Net income per common share - diluted
|
$
|
0.44
|
|
$
|
0.35
|
|
$
|
0.45
|
|
$
|
0.14
|
|
$
|
0.05
|
|
||||
|
Balance Sheet Data
|
|||||||||||||||||||
|
As at December 31, 2013
|
As at December 31, 2012
|
As at December 31, 2011
|
As at December 31, 2010
|
As at December 31, 2009
|
|||||||||||||||
|
Cash and cash equivalents
|
$
|
428,800
|
|
$
|
212,624
|
|
$
|
351,685
|
|
$
|
355,428
|
|
$
|
270,786
|
|
||||
|
Working capital (including cash)
|
245,827
|
|
222,468
|
|
213,100
|
|
265,835
|
|
215,161
|
|
|||||||||
|
Oil and gas properties
|
1,250,070
|
|
1,196,661
|
|
1,036,850
|
|
721,157
|
|
709,568
|
|
|||||||||
|
Deferred tax asset - long term
|
1,407
|
|
1,401
|
|
4,747
|
|
—
|
|
7,218
|
|
|||||||||
|
Total assets
|
1,904,550
|
|
1,732,875
|
|
1,626,780
|
|
1,249,254
|
|
1,143,808
|
|
|||||||||
|
Deferred tax liability - long term
|
177,082
|
|
225,195
|
|
186,799
|
|
204,570
|
|
216,625
|
|
|||||||||
|
Total long-term liabilities
|
208,077
|
|
250,059
|
|
207,633
|
|
210,075
|
|
221,786
|
|
|||||||||
|
Shareholders’ equity
|
1,429,908
|
|
1,291,431
|
|
1,174,318
|
|
886,866
|
|
816,426
|
|
|||||||||
On March 18, 2011, we completed the acquisition of all the issued and outstanding common shares and warrants of Petrolifera Petroleum Limited (“Petrolifera”) pursuant to the terms and conditions of an arrangement agreement dated January 17, 2011. Petrolifera is a Calgary-based oil, natural gas and NGL exploration, development and production company active in Argentina, Colombia and Peru. See “Business Combination” in Item 7. “Management’s Discussion and Analysis of Financial Condition and Results of Operations” for further details.
56
Item 7.
Management’s Discussion and Analysis of Financial Condition and Results of Operations
This report, and in particular this Management’s Discussion and Analysis of Financial Condition and Results of Operations, contains forward-looking statements within the meaning of Section 27A of the Securities Act of 1933 and Section 21E of the Securities Exchange Act of 1934. Please see the cautionary language at the very beginning of this Annual Report on Form 10-K regarding the identification of and risks relating to forward-looking statements, as well as Part I, Item 1A “Risk Factors” in this Annual Report on Form 10-K.
The following discussion of our financial condition and results of operations should be read in conjunction with the "Financial Statements and Supplementary Data" as set out in Part II, Item 8 of this Annual Report on Form 10-K.
Overview
We are an independent international energy company incorporated in the United States and engaged in oil and natural gas acquisition, exploration, development and production. Our operations are carried out in South America in Colombia, Argentina, Peru, and Brazil, and we are headquartered in Calgary, Alberta, Canada. For the
year ended
December 31, 2013
,
86%
(
year ended
December 31, 2012
-
84%
;
year ended December 31, 2011
-
91%
) of our revenue and other income was generated in Colombia.
As of
December 31, 2013
, we had estimated proved reserves NAR of
42.1
MMBOE, comprising
95%
oil and
5%
natural gas, of which
80%
were proved developed reserves. Our primary source of liquidity is cash generated from our operations.
The price of oil is a critical factor to our business and the price of oil has historically been volatile. Future volatility could be detrimental to our financial performance. During
2013
, the average price realized for our oil was
$90.61
per barrel (
2012
-
$97.31
;
2011
-
$96.60
).
Business Strategy
Our plan is to continue to build an international oil and gas company through acquisition and exploitation of under-developed prospective oil and gas assets, and to develop these assets with exploration and development drilling to grow commercial reserves and production. Our initial focus is in select countries in South America, currently Colombia, Argentina, Peru, and Brazil; we will consider other regions for future growth should those regions make strategic and commercial sense in creating additional value.
We have applied a two-stage approach to growth, initially establishing a base of production, development and exploration assets by selective acquisitions, and secondly achieving additional reserve and production growth through drilling. We intend to duplicate this business model in other areas as opportunities arise. We pursue opportunities in countries with proven petroleum systems; attractive royalty, taxation and other fiscal terms; and stable legal systems.
While continuing to pursue opportunities to grow our business both through internal growth and through mergers, acquisitions and other asset transactions, we will also pursue opportunities to dispose of non-core assets through farm-outs or outright disposition of assets, which may include a sale of the stock of one or more of our subsidiaries. To implement this strategy, we may be involved in various related discussions and activities at any given time. Acquisitions are motivated by many factors, including, among others, our desire to grow our business, obtain quality assets, including ones with attractive revenue streams, and acquire skilled personnel. Dispositions are motivated by our desire devote our resources to our best performing and most profitable assets that result in us achieving the best return.
57
Highlights
|
|
Year Ended December 31,
|
|||||||||||||||||
|
|
2013
|
% Change
|
2012
|
% Change
|
2011
|
|||||||||||||
|
Estimated Proved Oil and Gas Reserves, NAR, at December 31 (MMBOE)
|
42.1
|
|
4
|
|
40.6
|
|
19
|
|
34.0
|
|
||||||||
|
Estimated Probable Oil and Gas Reserves, NAR, at December 31 (MMBOE)
|
69.8
|
|
347
|
|
15.6
|
|
5
|
|
14.8
|
|
||||||||
|
Estimated Possible Oil and Gas Reserves, NAR, at December 31 (MMBOE)
|
72.0
|
|
139
|
|
30.1
|
|
(19
|
)
|
37.0
|
|
||||||||
|
Production (BOEPD) (1)
|
22,267
|
|
32
|
|
16,897
|
|
(3
|
)
|
17,408
|
|
||||||||
|
|
|
|||||||||||||||||
|
Prices Realized - per BOE
|
$
|
88.65
|
|
(6
|
)
|
$
|
94.29
|
|
—
|
|
$
|
93.83
|
|
|||||
|
|
|
|
|
|||||||||||||||
|
Revenue and Other Income ($000s)
|
$
|
723,643
|
|
24
|
|
$
|
585,187
|
|
(2
|
)
|
$
|
597,407
|
|
|||||
|
|
|
|
|
|||||||||||||||
|
Net Income ($000s)
|
$
|
126,288
|
|
27
|
|
$
|
99,659
|
|
(21
|
)
|
$
|
126,917
|
|
|||||
|
|
|
|
|
|||||||||||||||
|
Net Income Per Share - Basic
|
$
|
0.45
|
|
29
|
|
$
|
0.35
|
|
(24
|
)
|
$
|
0.46
|
|
|||||
|
|
|
|
|
|||||||||||||||
|
Net Income Per Share - Diluted
|
$
|
0.44
|
|
26
|
|
$
|
0.35
|
|
(22
|
)
|
$
|
0.45
|
|
|||||
|
|
|
|
|
|||||||||||||||
|
Funds Flow From Operations ($000s) (2)
|
$
|
352,929
|
|
9
|
|
$
|
323,756
|
|
1
|
|
$
|
319,046
|
|
|||||
|
|
|
|
|
|||||||||||||||
|
Net Capital Expenditures ($000s) (3)
|
$
|
314,818
|
|
1
|
|
$
|
313,176
|
|
(4
|
)
|
$
|
327,647
|
|
|||||
|
|
As at December 31,
|
|||||||||||||||
|
|
2013
|
% Change
|
2012
|
% Change
|
2011
|
|||||||||||
|
Cash & Cash Equivalents ($000s)
|
$
|
428,800
|
|
102
|
$
|
212,624
|
|
(40
|
)
|
$
|
351,685
|
|
||||
|
Working Capital (including cash & cash equivalents) ($000s)
|
$
|
245,827
|
|
10
|
$
|
222,468
|
|
4
|
|
$
|
213,100
|
|
||||
|
Property, Plant & Equipment ($000s)
|
$
|
1,260,172
|
|
5
|
$
|
1,205,426
|
|
15
|
|
$
|
1,044,842
|
|
||||
(1) Production represents production volumes NAR adjusted for inventory changes.
(2) Funds flow from operations is a non-GAAP measure which does not have any standardized meaning prescribed under generally accepted accounting principles in the United States of America (“GAAP”). Management uses this financial measure to analyze operating performance and the income generated by our principal business activities prior to the consideration of how non-cash items affect that income, and believes that this financial measure is also useful supplemental information for investors to analyze operating performance and our financial results. Investors should be cautioned that this measure should not be construed as an alternative to net income or other measures of financial performance as determined in accordance with GAAP. Our method of calculating this measure may differ from other companies and, accordingly, it may not be comparable to similar measures used by other companies. Funds flow from operations, as presented, is net income adjusted for depletion, depreciation, accretion and impairment (“DD&A”) expenses, deferred tax recovery or expense, stock-based compensation, unrealized gain on financial instruments, unrealized foreign exchange gain or loss, cash settlement of asset retirement obligation, other gain, other loss, equity tax and gain on acquisition. A reconciliation from net income to funds flow from operations is as follows:
58
|
|
Year Ended December 31,
|
|||||||||||
|
Funds Flow From Operations - Non-GAAP Measure ($000s)
|
2013
|
2012
|
2011
|
|||||||||
|
Net income
|
$
|
126,288
|
|
$
|
99,659
|
|
$
|
126,917
|
|
|||
|
Adjustments to reconcile net income to funds flow from operations
|
||||||||||||
|
DD&A expenses
|
267,146
|
|
182,037
|
|
231,235
|
|
||||||
|
Deferred tax (recovery) expense
|
(29,499
|
)
|
26,274
|
|
(28,685
|
)
|
||||||
|
Stock-based compensation
|
8,918
|
|
12,006
|
|
12,767
|
|
||||||
|
Unrealized gain on financial instruments
|
—
|
|
—
|
|
(1,354
|
)
|
||||||
|
Unrealized foreign exchange (gain) loss
|
(18,911
|
)
|
17,054
|
|
(2,232
|
)
|
||||||
|
Cash settlement of asset retirement obligation
|
(2,068
|
)
|
(404
|
)
|
(345
|
)
|
||||||
|
Other gain
|
—
|
|
(9,336
|
)
|
—
|
|
||||||
|
Other loss
|
4,400
|
|
—
|
|
—
|
|
||||||
|
Equity tax
|
(3,345
|
)
|
(3,534
|
)
|
2,442
|
|
||||||
|
Gain on acquisition
|
—
|
|
—
|
|
(21,699
|
)
|
||||||
|
Funds flow from operations
|
$
|
352,929
|
|
$
|
323,756
|
|
$
|
319,046
|
|
|||
(3) In 2013, capital expenditures are net of proceeds of
$54.0 million
relating to termination of a farm-in agreement in Brazil;
$4.1 million
relating to our assumption of the remaining 50% working interest in the Santa Victoria Block in Argentina; and
$1.5 million
relating to the sale of our 15% working interest in the Mecaya Block in Colombia. In 2011, capital expenditures are net of proceeds of:
$3.3 million
from the farm-out of a
50%
interest in the Santa Victoria Block in Argentina; and
$1.2 million
from the sale of a blow-out preventer in Argentina.
|
•
|
For the
year ended December 31, 2013
, oil and gas production, NAR and adjusted for inventory changes,
increased
by
32%
to
22,267
BOEPD compared with
2012
. In Colombia, alternative transportation arrangements to minimize the impact of pipeline disruptions, production from new wells and a decrease in oil inventory had a positive impact on production in 2013. Production in
2013
was
75%
from the Chaza Block in Colombia and
8%
and
5%
from the Puesto Morales and Surubi Blocks in Argentina, respectively.
|
|
•
|
Estimated proved oil and NGL reserves, NAR, as of
December 31, 2013
, were
39.8
MMbbl, a
4%
increase from the estimated proved reserves as at
December 31, 2012
. Proved reserves at
December 31, 2013
were after 2013 oil and NGL production of
7.8
MMbbl NAR before inventory changes. The increase was primarily due to positive technical adjustments for the Costayaco field due to reservoir performance, additional development drilling in the Costayaco field and the appraisal drilling program in the Moqueta field. Reserves were also added for the Tiê field in the Recôncavo Basin, Brazil due to production performance. These reserve additions were offset by a decrease of
2.2
MMbbl in Argentina reserves, primarily related to the Puesto Morales field due to deferred investment and inconclusive waterflood results.
|
|
•
|
Estimated probable and possible oil and NGL reserves, NAR, as of
December 31, 2013
, were
68.9
MMbbl and
63.7
MMbbl, respectively, compared with
14.8
MMbbl and
21.5
MMbbl as of December 31, 2012. Probable oil and NGL reserves, NAR, increased by
366%
and possible oil and NGL reserves, NAR, increased by
197%
compared with 2012. The increase was due primarily to the Bretaña oil discovery in Peru which resulted in
57.6
MMbbl of probable and
47.0
MMbbl of possible liquids reserves.
|
|
•
|
Estimated proved gas reserves, NAR, as of
December 31, 2013
, were
13.5
Bcf compared with
12.8
Bcf as at
December 31, 2012
. At
December 31, 2013
,
59%
of proved gas reserves were in the Sierra Nevada Block in Colombia and
35%
were in the Puesto Morales Block in Argentina. Proved gas reserves were consistent with the prior year end as new gas reserves were developed to replace
2013
production. Estimated probable and possible gas reserves, NAR, as of
December 31, 2013
, were
5.5
Bcf and
50.3
Bcf, respectively, compared with 5.1 Bcf and 51.7 Bcf as of December 31, 2012.
|
|
•
|
For the
year ended December 31, 2013
, revenue and other income
increase
d by
24%
to
$723.6 million
compared with
$585.2 million
in
2012
. The positive contribution from higher production levels was partially offset by lower realized prices. The average price realized per BOE decreased by
6%
to
$88.65
from
$94.29
in 2012.
|
59
|
•
|
Net income
increase
d by
27%
to
$126.3 million
, or
$0.45
per share basic and
$0.44
per share diluted, for the
year ended December 31, 2013
, compared with
$99.7 million
, or
$0.35
per share basic and diluted, in
2012
. In
2013
,
increase
d oil and natural gas sales and foreign exchange gains and lower G&A expenses were partially offset by
increase
d operating, DD&A and income tax expenses and other loss and the absence of other gain recorded in 2012. DD&A expenses for the
year ended December 31, 2013
, included a
$30.8 million
ceiling test impairment loss in our Argentina cost center due to a decrease in reserves as a result of deferred investment and inconclusive waterflood results on the Puesto Morales Block. DD&A expenses in
2012
included a
$20.2 million
ceiling test impairment in our Brazil cost center related to seismic and drilling costs on Block BM-CAL-10.
|
|
•
|
For the
year ended December 31, 2013
, funds flow from operations
increase
d by
9%
from
$323.8 million
to
$352.9 million
primarily due to
increase
d oil and natural gas sales and lower G&A expenses and realized foreign exchange losses partially offset by
increase
d operating and income tax expenses, including a
$10.4 million
non-recurring tax expense in Brazil on the proceeds from termination of a farmout agreement .
|
|
•
|
Cash and cash equivalents were
$428.8 million
at
December 31, 2013
, compared with
$212.6 million
at
December 31, 2012
. The change in cash and cash equivalents during
2013
was primarily the result of funds flow from operations of
$352.9 million
, a
$167.9 million
change in net assets and liabilities from operating activities, proceeds from oil and gas properties of
$59.6 million
, and proceeds from issuance of common stock of
$3.8 million
, partially offset by capital expenditures of
$367.3 million
and a
$0.8 million
increase
in restricted cash.
|
|
•
|
Working capital (including cash and cash equivalents) was
$245.8 million
at
December 31, 2013
, a
$23.4 million
increase
from
December 31, 2012
.
|
|
•
|
Property, plant and equipment at
December 31, 2013
, was
$1.3 billion
, an
increase
of
$54.7 million
from
December 31, 2012
, as a result of
$314.8 million
of net capital expenditures (net of proceeds from oil and gas properties of
$59.6 million
and excluding changes in non-cash working capital), partially offset by
$260.1 million
of depletion, depreciation and impairment expenses.
|
|
•
|
Net capital expenditures for the
year ended December 31, 2013
, were
$314.8 million
compared with
$313.2 million
for the
year ended December 31, 2012
. In
2013
, capital expenditures included drilling of
$220.9 million
, geological and geophysical (“G&G”) expenditures of
$93.0 million
, facilities of
$34.4 million
and other expenditures of
$26.1 million
. Capital expenditures in 2013 were offset by proceeds from oil and gas properties of
$59.6 million
.
|
Estimated Oil and Gas Reserves
As at
December 31, 2013
, the estimated proved oil and gas reserves, NAR, were
42.1
MMBOE compared with
40.6
MMBOE as at
December 31, 2012
and
34.0
MMBOE as at
December 31, 2011
. Proved reserves at
December 31, 2013
were after 2013 oil and gas production of
8.1
MMBOE NAR before inventory changes.
Estimated proved oil and NGL reserves, NAR, as of
December 31, 2013
, were
39.8
MMbbl, a
4%
increase from the estimated proved oil and NGL reserves as at
December 31, 2012
. The increase was due primarily due to positive technical adjustments for the Costayaco field due to reservoir performance, additional development drilling in the Costayaco field and the appraisal drilling program in the Moqueta field. Reserves were also added for the Tiê field in the Recôncavo Basin, Brazil due to production performance. These reserve additions were offset by a decrease of
2.2
MMbbl in Argentina reserves, primarily related to the Puesto Morales field due to deferred investment and inconclusive waterflood results.
Estimated probable and possible oil and NGL reserves, NAR, as of
December 31, 2013
were
68.9
MMbbl and
63.7
MMbbl, respectively, compared with
14.8
MMbbl and
21.5
MMbbl as of December 31, 2012. The increase was due primarily to the Bretaña oil discovery in Peru.
Estimated proved gas reserves, NAR, as of
December 31, 2013
, were
13.5
Bcf compared with
12.8
Bcf at
December 31, 2012
. At
December 31, 2013
,
59%
of proved gas reserves were in the Sierra Nevada Block and
35%
were in the Puesto Morales Block. Proved gas reserves were consistent with the prior year end as new gas reserves were developed to replace
2013
production. Estimated probable and possible gas reserves, NAR, as of
December 31, 2013
were
5.5
Bcf and
50.3
Bcf, respectively, compared with 5.1 Bcf and 51.7 Bcf as of December 31, 2012.
Estimated proved oil and NGL reserves, NAR, as of
December 31, 2012
, were
38.5
MMbbl, a
25%
increase from the estimated proved reserves as at
December 31, 2011
. The increase was due primarily to positive technical adjustments for the Costayaco field due to reservoir performance, successful appraisal drilling on the Moqueta field and exploration success with the
60
Ramiriqui-1 well in Colombia. Reserves were also added through development drilling on the Tiê field in the Recôncavo Basin, Brazil and the Proa-2 development well on the Surubi Block in Argentina. Estimated probable and possible oil and NGL reserves, NAR, as of
December 31, 2012
were 14.8 MMbbl and 21.5 MMbbl, respectively.
Estimated proved gas reserves, NAR, as of
December 31, 2012
, were
12.8
Bcf compared with 18.3 Bcf at
December 31, 2011
. Estimated proved gas reserves, NAR, in the Sierra Nevada Block decreased by 6.0 Bcf during the
year ended December 31, 2012
due to technical revisions. Proved gas reserves in the Puesto Morales Block were consistent with the prior year end as new gas reserves were created to replace 2012 production. Estimated probable and possible gas reserves, NAR, as of
December 31, 2012
were
5.1
Bcf and
51.7
Bcf, respectively.
Business Environment Outlook
Our revenues are significantly affected by pipeline disruptions in Colombia and the continuing fluctuations in oil prices. Oil prices are volatile and unpredictable and are influenced by concerns about financial markets and the impact of the worldwide economy on oil supply and demand growth.
We believe that our current operations and
2014
capital expenditure program can be funded from cash flow from existing operations and cash on hand. Should our operating cash flow decline due to unforeseen events, including additional pipeline delivery restrictions in Colombia or a downturn in oil and gas prices, we would examine measures such as capital expenditure program reductions, use of our revolving credit facility, issuance of debt, disposition of assets, or issuance of equity. Continuing social and political uncertainty in the Middle East, North Africa and South America, economic uncertainty in the United States, Europe and Asia and changes in global supply and infrastructure are having an impact on world markets, and we are unable to determine the impact, if any, these events may have on oil prices and demand. The timing and execution of our capital expenditure program are also affected by the availability of services from third party oil field contractors and our ability to obtain, sustain or renew necessary government licenses and permits on a timely basis to conduct exploration and development activities. Any delay may affect our ability to execute our capital expenditure program.
Our future growth and acquisitions may depend on our ability to raise additional funds through equity and debt markets. Should we be required to raise debt or equity financing to fund capital expenditures or other acquisition and development opportunities, such funding may be affected by the market value of shares of our Common Stock. Also, raising funds by issuing shares or other equity securities would further dilute our existing shareholders, and this dilution would be exacerbated by a decline in our share price. Any securities we issue may have rights, preferences and privileges that are senior to our existing equity securities. Borrowing money may also involve further pledging of some or all of our assets, may require compliance with debt covenants and will expose us to interest rate risk. Depending on the currency used to borrow money, we may also be exposed to further foreign exchange risk. Our ability to borrow money and the interest rate we pay for any money we borrow will be affected by market conditions, and we cannot predict what price we may pay for any borrowed money.
Business Combinations
On October 8, 2012, we received regulatory approval and acquired the remaining
30%
working interest in
four
blocks in Brazil pursuant to the terms of a purchase and sale agreement dated January 20, 2012. With the exception of
one
block which has three producing wells, the remaining blocks are unproved properties. We paid cash purchase consideration of
$35.5 million
. Contingent consideration up to an additional
$3.0 million
may be payable dependent on production volumes from the acquired blocks.
On March 18, 2011, we completed the acquisition of all the issued and outstanding common shares and warrants of Petrolifera pursuant to the terms and conditions of an arrangement agreement dated January 17, 2011. Petrolifera is a Calgary-based oil, natural gas and NGL exploration, development and production company active in Argentina, Colombia and Peru. As indicated in the allocation of the consideration transferred, the fair value of identifiable assets acquired and liabilities assumed exceeded the fair value of the consideration transferred. Consequently, we reassessed the recognition and measurement of identifiable assets acquired and liabilities assumed and concluded that all acquired assets and assumed liabilities were recognized and that the valuation procedures and resulting measures were appropriate. As a result, we recognized a gain on acquisition of
$21.7 million
in the consolidated statement of operations in the year ended December 31, 2011. The gain reflected the impact on Petrolifera’s pre-acquisition market value resulting from their lack of liquidity and capital resources required to maintain current production and reserves and further develop and explore their inventory of prospects.
For further details reference should be made to Note 3 of the consolidated financial statements in Item 8 “
Financial Statements and Supplementary Data
”.
61
Consolidated Results of Operations
|
|
Year Ended December 31,
|
|||||||||||||||||
|
|
2013
|
% Change
|
2012
|
% Change
|
2011
|
|||||||||||||
|
(Thousands of U.S. Dollars)
|
||||||||||||||||||
|
Oil and natural gas sales
|
$
|
720,450
|
|
24
|
|
$
|
583,109
|
|
(2
|
)
|
$
|
596,191
|
|
|||||
|
Interest income
|
3,193
|
|
54
|
|
2,078
|
|
71
|
|
1,216
|
|
||||||||
|
723,643
|
|
|
24
|
|
585,187
|
|
(2
|
)
|
597,407
|
|
||||||||
|
|
||||||||||||||||||
|
Operating expenses
|
149,059
|
|
19
|
|
124,903
|
|
44
|
|
86,497
|
|
||||||||
|
DD&A expenses
|
267,146
|
|
47
|
|
182,037
|
|
(21
|
)
|
231,235
|
|
||||||||
|
G&A expenses
|
53,400
|
|
(9
|
)
|
58,882
|
|
(2
|
)
|
60,389
|
|
||||||||
|
Other gain
|
—
|
|
(100
|
)
|
(9,336
|
)
|
—
|
|
—
|
|
||||||||
|
Other loss
|
4,400
|
|
—
|
|
—
|
|
—
|
|
—
|
|
||||||||
|
Equity tax
|
—
|
|
—
|
|
—
|
|
(100
|
)
|
8,271
|
|
||||||||
|
Financial instruments gain
|
—
|
|
—
|
|
—
|
|
(100
|
)
|
(1,522
|
)
|
||||||||
|
Gain on acquisition
|
—
|
|
—
|
|
—
|
|
(100
|
)
|
(21,699
|
)
|
||||||||
|
Foreign exchange (gain) loss
|
(12,198
|
)
|
(139
|
)
|
31,338
|
|
—
|
|
(11
|
)
|
||||||||
|
461,807
|
|
19
|
|
387,824
|
|
7
|
|
363,160
|
|
|||||||||
|
|
||||||||||||||||||
|
Income before income taxes
|
261,836
|
|
33
|
|
197,363
|
|
(16
|
)
|
234,247
|
|
||||||||
|
Income tax expense
|
(135,548
|
)
|
39
|
|
(97,704
|
)
|
(9
|
)
|
(107,330
|
)
|
||||||||
|
Net income
|
$
|
126,288
|
|
27
|
|
$
|
99,659
|
|
(21
|
)
|
$
|
126,917
|
|
|||||
|
|
||||||||||||||||||
|
Production
|
|
|||||||||||||||||
|
|
||||||||||||||||||
|
Oil and NGL's, bbl
|
7,888,767
|
|
33
|
|
5,934,107
|
|
(3
|
)
|
6,118,705
|
|
||||||||
|
Natural gas, Mcf
|
1,431,052
|
|
(5
|
)
|
1,501,070
|
|
6
|
|
1,411,188
|
|
||||||||
|
Total production, BOE (1)
|
8,127,276
|
31
|
|
6,184,285
|
(3
|
)
|
6,353,903
|
|
||||||||||
|
|
||||||||||||||||||
|
Average Prices
|
|
|||||||||||||||||
|
|
||||||||||||||||||
|
Oil and NGL's per bbl
|
$
|
90.61
|
|
(7
|
)
|
$
|
97.31
|
|
1
|
|
$
|
96.60
|
|
|||||
|
Natural gas per Mcf
|
$
|
3.94
|
|
5
|
|
$
|
3.76
|
|
3
|
|
$
|
3.65
|
|
|||||
|
|
|
|||||||||||||||||
|
Consolidated Results of Operations per BOE
|
|
|
||||||||||||||||
|
|
|
|||||||||||||||||
|
Oil and natural gas sales
|
$
|
88.65
|
|
(6
|
)
|
$
|
94.29
|
|
—
|
|
$
|
93.83
|
|
|||||
|
Interest income
|
0.39
|
|
15
|
|
0.34
|
|
79
|
|
0.19
|
|
||||||||
|
89.04
|
|
(6
|
)
|
94.63
|
|
1
|
|
94.02
|
|
|||||||||
|
|
|
|||||||||||||||||
|
Operating expenses
|
18.34
|
|
(9
|
)
|
20.20
|
|
48
|
|
13.61
|
|
||||||||
|
DD&A expenses
|
32.87
|
|
12
|
|
29.44
|
|
(19
|
)
|
36.39
|
|
||||||||
|
G&A expenses
|
6.57
|
|
(31
|
)
|
9.52
|
|
—
|
|
9.50
|
|
||||||||
|
Other gain
|
—
|
|
(100
|
)
|
(1.51)
|
|
—
|
|
—
|
|
||||||||
|
Other loss
|
0.54
|
|
—
|
|
—
|
|
—
|
|
—
|
|
||||||||
|
Equity tax
|
—
|
|
—
|
|
—
|
|
(100
|
)
|
1.30
|
|
||||||||
|
Financial instruments gain
|
—
|
|
—
|
|
—
|
|
(100
|
)
|
(0.24
|
)
|
||||||||
|
Gain on acquisition
|
—
|
|
—
|
|
—
|
|
(100
|
)
|
(3.42
|
)
|
||||||||
|
Foreign exchange (gain) loss
|
(1.50
|
)
|
(130
|
)
|
5.07
|
|
-
|
|
—
|
|
||||||||
|
56.82
|
|
(9
|
)
|
62.72
|
|
10
|
|
57.14
|
|
|||||||||
|
|
|
|||||||||||||||||
|
Income before income taxes
|
32.22
|
|
1
|
|
31.91
|
|
(13
|
)
|
36.88
|
|
||||||||
|
Income tax expense
|
(16.68)
|
|
6
|
|
(15.80)
|
|
(6
|
)
|
(16.89)
|
|
||||||||
|
Net income
|
$
|
15.54
|
|
(4
|
)
|
$
|
16.11
|
|
(19
|
)
|
$
|
19.99
|
|
|||||
(1) Production represents production volumes NAR adjusted for inventory changes.
62
Consolidated Results of Operations for the Year Ended
December 31, 2013
, Compared with the Results for the Year Ended
December 31, 2012
Net income
for the
year ended December 31, 2013
, was
$126.3 million
, a
27%
increase
from
2012
. On a per share basis, net income
increased
to
$0.45
per share basic and
$0.44
per share diluted from
$0.35
per share basic and diluted in
2012
. For the
year ended December 31, 2013
,
increase
d oil and natural gas sales and foreign exchange gains and lower G&A expenses were partially offset by
increase
d operating, DD&A, and income tax expenses and other loss and the absence of other gain recorded in 2012.
Oil and NGL production
, NAR and adjusted for inventory changes, for the
year ended December 31, 2013
,
increased
to
7.9
MMbbl compared with
5.9
MMbbl in
2012
due to the reduced impact of pipeline disruptions in Colombia, a decrease in oil inventory in the Ecopetrol S.A. ("Ecopetrol") operated Trans-Andean oil pipeline (the "OTA pipeline”) and associated Ecopetrol operated facilities in the Putumayo Basin, and production from new wells in Colombia. The net inventory reduction accounted for
0.1
MMbbl or
155
BOPD of the production increase. In the
year ended December 31, 2013
, the impact of OTA pipeline disruptions on production was mitigated by selling a portion of our oil through trucking and an alternative pipeline.
Average realized oil prices
decreased
by
7%
to
$90.61
per bbl for the
year ended December 31, 2013
, from
$97.31
per bbl for 2012. Average Brent oil prices for the
year ended
December 31, 2013
, were
$108.64
per bbl compared with
$111.67
per bbl in
2012
. West Texas Intermediate ("WTI") oil prices for the
year ended
December 31, 2013
, were
$97.97
per bbl compared with
$94.20
per bbl in
2012
. During the
year ended December 31, 2013
,
49%
of our oil and gas volumes sold in Colombia were to a customer which takes delivery at the Costayaco battery and transports the oil by truck over a 1,500 km route to the Port of Barranquilla. The sales price for this customer is based on average WTI prices plus a Vasconia differential and premium, less trucking costs. For sales to this customer, the trucking costs are recorded as a reduction of the realized price and not as operating costs.
Revenue and other income
for the
year ended December 31, 2013
,
increase
d to
$723.6 million
from
$585.2 million
in
2012
as a result of
increased
production, partially offset by
decrease
d realized prices.
Operating expenses
for the
year ended December 31, 2013
, were
$149.1 million
, or
$18.34
per BOE, compared with
$124.9 million
, or
$20.20
per BOE, in
2012
. For the
year ended December 31, 2013
, a decrease in the operating cost per BOE was more than offset by increased production. Operating expenses per BOE decreased in 2013 primarily due to OTA transportation costs and other trucking costs not incurred for those volumes subject to alternative transportation arrangements, whereby trucking costs are netted to arrive at our realized price.
DD&A expenses
for the
year ended December 31, 2013
,
increase
d to
$267.1 million
from
$182.0 million
in
2012
. DD&A expenses for the
year ended December 31, 2013
, included a
$30.8 million
ceiling test impairment loss in our Argentina cost center due to a decrease in reserves as a result of deferred investment and inconclusive waterflood results on the Puesto Morales Block and a
$2.0 million
ceiling test impairment loss in our Brazil cost center. DD&A expenses in
2012
included a
$20.2 million
ceiling test impairment in our Brazil cost center related to seismic and drilling costs on Block BM-CAL-10. On a per BOE basis, the depletion rate
increase
d by
12%
to
$32.87
from
$29.44
. Increased impairment losses and increased costs in the depletable base, were only partially offset by increased proved reserves.
G&A expenses
for the
year ended December 31, 2013
, of
$53.4 million
decrease
d by
9%
from
$58.9 million
in
2012
. Increased employee related costs reflecting expanded operations were more than offset by higher G&A allocations to operating expenses and capital projects within the business units. G&A expenses per BOE in the
year ended December 31, 2013
, of
$6.57
were
31%
lower compared with
$9.52
in
2012
due to increased production and higher G&A allocations to operating expenses and capital projects within the business units.
Other gain
in the year ended December 31, 2012, relates to a value added tax recovery resulting from the completion of a reorganization of companies and their Colombian branches in the Colombian reporting segment during the fourth quarter of 2012.
Other loss
in the year ended December 31, 2013, relates to a contingent loss accrued in connection with a legal dispute in which we received an adverse legal judgment in the first quarter of 2013. We have filed an appeal against the judgment.
For the
year ended December 31, 2013
, the
foreign exchange
gain
was
$12.2 million
, of which
$18.9 million
was an unrealized non-cash foreign exchange
gain
. The unrealized foreign exchange gain in 2013 was a result of a net monetary
63
liability position in Colombia combined with the weakening of the Colombian Peso. This was partially offset by foreign exchange losses resulting from a net monetary asset position in Argentina and the weakening of the Argentina Peso.
Income tax expense
was
$135.5 million
for the
year ended December 31, 2013
, compared with
$97.7 million
in
2012
. The
increase
was primarily due to
higher
taxable income in Colombia and Brazil. In Brazil, a net payment of
$54.0 million
from a third party in connection with the termination of a farm-in agreement resulted in a current tax expense of approximately
$10.4 million
during the third quarter of 2013. The effective tax rate was
52%
in the
year ended December 31, 2013
, compared with
50%
in
2012
. The change in the effective tax rate from 2013 was primarily due to an increase in the valuation allowance partially offset by a decrease in non-deductible foreign currency translation adjustments and other permanent differences.
For 2013, the differential between the effective tax rate of
52%
and the 35% U.S. statutory rate was primarily attributable to the increase in valuation allowance and a non-deductible third party royalty in Colombia, which were partially offset by a reduction in non-deductible foreign currency translation adjustments and other permanent differences. The variance from the 35% U.S. statutory rate for 2012 was primarily attributable to an increase in valuation allowance, a non-deductible third party royalty in Colombia, non-deductible foreign currency translation adjustments and other permanent differences.
Consolidated Results of Operations for the Year Ended
December 31, 2012
, Compared with the Results for the Year Ended
December 31, 2011
Net income
for the year ended December 31, 2012, was $99.7 million, a 21% decrease from 2011. On a per share basis, net income decreased to $0.35 per share basic and diluted from $0.46 per share basic and $0.45 per share diluted in 2011. For the year ended December 31, 2012, decreased DD&A, G&A and income tax expenses, the realization of a recovery of previously unrecognized value added tax which occurred upon the completion of a reorganization of companies and their Colombian branches and the absence of the Colombian equity tax expense were more than offset by decreased oil and natural gas sales and increased operating expenses and foreign exchange losses and the absence of the 2011 gain on acquisition. Net income in 2011 included a gain on the acquisition of Petrolifera of $21.7 million.
Oil and NGL production
, NAR and adjusted for inventory changes, for the year ended December 31, 2012, decreased to 5.9 MMbbl compared with 6.1 MMbbl in 2011 due to pipeline disruptions and the effect of a change in the sales point in Colombia. As a result of entering into new oil sales and transportation agreements with Ecopetrol as of February 1, 2012, which changed the sales point of our oil from Orito station to the Port of Tumaco, our oil inventory increased and now includes oil in the OTA pipeline and associated Ecopetrol operated facilities. Production during the year ended December 31, 2012, reflects approximately 162 days of oil delivery restrictions in Colombia.
Average realized oil prices
increased by 1% to $97.31 per bbl from $96.60 per bbl for the year ended December 31, 2012. We received a premium to WTI in Colombia during the year ended December 31, 2012. WTI oil prices for the year ended December 31, 2012, were $94.20 per bbl compared with $95.06 per bbl in 2011. Average Brent oil prices for the year ended December 31, 2012, were $111.67 per bbl compared with $111.26 per bbl in 2011.
Revenue and other income
for the year ended December 31, 2012, decreased to $585.2 million from $597.4 million in 2011 as a result of decreased production, partially offset by increased realized prices.
Operating expenses
for the year ended December 31, 2012, were $124.9 million, or $20.20 per BOE, compared with $86.5 million, or $13.61 per BOE, in 2011. The increase in operating expenses was primarily due to an increase of $29.3 million in Colombia mainly due to OTA pipeline oil transportation costs of $3.77 per BOE, previously deducted from realized sales prices and now included as operating costs due to the change in sales point in February 2012, and increased trucking to other sales points due to OTA pipeline disruptions.
DD&A expenses
for the year ended December 31, 2012, decreased to $182.0 million from $231.2 million in 2011. DD&A expenses for the year ended December 31, 2012, included a $20.2 million ceiling test impairment in our Brazil cost center related to seismic and drilling costs on Block BM-CAL-10. DD&A expenses in 2011 included a $42.0 million ceiling test impairment in our Peru cost center related to drilling costs from a dry well and seismic costs on relinquished blocks and a $25.7 million ceiling test impairment loss in our Argentina cost center related to an increase in estimated future operating and capital costs to produce our remaining Argentina proved reserves and a decrease in reserve volumes. On a per BOE basis, the depletion rate decreased by 19% to $29.44 from $36.39. The decrease was mainly due to lower impairment charges of $3.42 per BOE in the year ended December 31, 2012, compared with $10.65 per BOE in 2011 and increased reserves being only partially offset by increased costs in the depletable base.
64
G&A expenses
for the year ended December 31, 2012, of $58.9 million decreased by 2% from $60.4 million in 2011. Increased employee related costs and bank fees reflecting expanded operations were more than offset by increased recoveries, higher capitalized costs in Peru and the absence of expenses related to the 2011 Petrolifera acquisition. G&A expenses in 2011 included $1.2 million of expenses associated with the acquisition of Petrolifera and $1.6 million of interest on the Petrolifera debt. G&A expenses per BOE in the year ended December 31, 2012, of $9.52 were comparable with $9.50 in 2011.
Other gain
in the year ended December 31, 2012, relates to a value added tax recovery resulting from the completion of a reorganization of companies and their Colombian branches in the Colombian reporting segment during the fourth quarter of 2012.
Equity tax
in the year ended December 31, 2011, represented a Colombian tax of 6% which was calculated based on our Colombian segment’s balance sheet equity at January 1, 2011. The tax is payable in eight semi-annual installments over four years, but was expensed in the first quarter of 2011 at the commencement of the four-year period.
Gain on acquisition
of $21.7 million in the year ended December 31, 2011, related to the Petrolifera acquisition.
For the year ended December 31, 2012, the
foreign exchange loss
was $31.3 million, of which $17.1 million was an unrealized non-cash foreign exchange loss. The realized foreign exchange loss in 2012 primarily arose upon payment of 2011 Colombian income tax liabilities. For the year ended December 31, 2011, there was an unrealized non-cash foreign exchange gain of $2.2 million, but this was almost entirely offset by realized foreign exchange losses. The Colombian Peso strengthened by 9.0% and weakened by 1.5% against the U.S. dollar in the year ended December 31, 2012 and 2011, respectively. Under GAAP, deferred taxes are considered a monetary liability and require translation from local currency to U.S. dollar functional currency at each balance sheet date. This translation is the main source of the unrealized exchange losses or gains.
Income tax expense
was $97.7 million for the year ended December 31, 2012, compared with $107.3 million in 2011. The decrease was primarily due to lower income before tax. The effective tax rate was 50% in the year ended December 31, 2012, compared with 46% in 2011. The higher effective tax rate was primarily due to a non-taxable gain on the acquisition of Petrolifera recorded in 2011, an increase in non-deductible royalty payments, the impact of branch and other foreign loss pick-ups, an increase in the non-deductible foreign currency translation adjustments and other permanent differences in 2012. These factors were partially offset by the impact of foreign taxes as compared with the U.S. statutory rate and a lower valuation allowance in 2012.
For 2012, the differential between the effective tax rate of 50% and the 35% U.S. statutory rate was primarily attributable to non-deductible foreign currency translation adjustments, non-deductible royalty payments, other permanent differences, and an increase in valuation allowances. For 2011, the variance between the effective tax rate of 46% and the 35% U.S. statutory rate was mainly attributable to non-deductible royalty payments and an increase in valuation allowance offset partially by the inclusion of the non-taxable gain on acquisition and the positive impact of branch and other foreign loss pick-ups.
During 2012, a reorganization was completed which resulted in the combination of two Colombian branches. As a result of this merger, certain tax loss balances carried forward were utilized in the current year. The utilization of losses had no net impact on the tax provision as the decrease in the current tax expense was offset by an increase in the deferred tax expense. In addition, as previously discussed, a $9.3 million gain was recorded on a value added tax receivable which was previously treated as unrecoverable but, as a result of the reorganization transaction, is now considered to be recoverable. For tax purposes, this is a permanent difference as the gain is not taxable in Colombia.
2014
Work Program and Capital Expenditure Program
In December
2013
, we announced the details of our
2014
capital program. We have planned a
2014
capital program of
$467 million
consisting of:
$243 million
for Colombia;
$30 million
for Brazil;
$44 million
for Argentina;
$148 million
for Peru; and
$2 million
associated with corporate activities. Of this,
$227 million
is for drilling,
$104 million
is for facilities, pipelines and other; and
$136 million
is for G&G expenditures. Of the
$227 million
allocated to drilling, approximately
41%
is for exploration and the balance is for appraisal and development drilling.
Our
2014
work program is intended to create both growth and value by developing existing assets to increase reserves and
production levels, the construction of pipelines and facilities in the areas with proved reserves, and maturing our exploration prospects through seismic acquisition and drilling. We expect to finance our
2014
capital program through cash flows from operations and cash on hand, while retaining financial flexibility to undertake further development opportunities and pursue acquisitions. However, as a result of the nature of the oil and natural gas exploration, development and exploitation industry, budgets are regularly reviewed with respect to both the success of expenditures and other opportunities that become available.
65
Accordingly, while we currently intend that funds be expended as set forth in our
2014
work program, there may be circumstances where, for sound business reasons, actual expenditures may in fact differ.
66
Segmented Results – Colombia
|
|
Year Ended December 31,
|
|||||||||||||||||
|
|
2013
|
% Change
|
2012
|
% Change
|
2011
|
|||||||||||||
|
(Thousands of U.S. Dollars)
|
||||||||||||||||||
|
Oil and natural gas sales
|
$
|
624,410
|
|
26
|
|
$
|
493,615
|
|
(9
|
)
|
$
|
543,999
|
|
|||||
|
Interest income
|
623
|
|
(7
|
)
|
667
|
|
36
|
|
492
|
|
||||||||
|
625,033
|
|
|
26
|
|
494,282
|
|
(9
|
)
|
544,491
|
|
||||||||
|
Operating expenses
|
102,861
|
|
18
|
|
87,410
|
|
50
|
|
58,081
|
|
||||||||
|
DD&A expenses
|
184,697
|
|
51
|
|
122,055
|
|
(14
|
)
|
141,133
|
|
||||||||
|
G&A expenses
|
16,996
|
|
(26
|
)
|
23,019
|
|
(8
|
)
|
25,116
|
|
||||||||
|
Other gain
|
—
|
|
100
|
|
(9,336
|
)
|
—
|
|
—
|
|
||||||||
|
Other loss
|
4,400
|
|
—
|
|
—
|
|
—
|
|
—
|
|
||||||||
|
Equity tax
|
—
|
|
—
|
|
—
|
|
(100
|
)
|
8,271
|
|
||||||||
|
Foreign exchange (gain) loss
|
(20,100
|
)
|
(175
|
)
|
26,660
|
|
—
|
|
(1,626
|
)
|
||||||||
|
288,854
|
|
16
|
|
249,808
|
|
8
|
|
230,975
|
|
|||||||||
|
Income before income taxes
|
$
|
336,179
|
|
38
|
|
$
|
244,474
|
|
(22
|
)
|
$
|
313,516
|
|
|||||
|
Production
|
||||||||||||||||||
|
Oil and NGL's, bbl
|
6,767,617
|
|
41
|
|
4,785,643
|
|
(11
|
)
|
5,348,885
|
|
||||||||
|
Natural gas, Mcf
|
92,942
|
|
(40
|
)
|
154,702
|
|
(42
|
)
|
267,612
|
|
||||||||
|
Total production, BOE (1)
|
6,783,107
|
|
41
|
|
4,811,427
|
|
(11
|
)
|
5,393,487
|
|
||||||||
|
Average Prices
|
||||||||||||||||||
|
Oil and NGL's per bbl
|
$
|
92.21
|
|
(11
|
)
|
$
|
103.04
|
|
2
|
|
$
|
101.42
|
|
|||||
|
Natural gas per Mcf
|
$
|
3.64
|
|
15
|
|
$
|
3.16
|
|
(45
|
)
|
$
|
5.72
|
|
|||||
|
Segmented Results of Operations per BOE
|
||||||||||||||||||
|
Oil and natural gas sales
|
$
|
92.05
|
|
(10
|
)
|
$
|
102.59
|
|
2
|
|
$
|
100.86
|
|
|||||
|
Interest income
|
0.09
|
|
(36
|
)
|
0.14
|
|
56
|
|
0.09
|
|
||||||||
|
92.14
|
|
(10
|
)
|
102.73
|
|
2
|
|
100.95
|
|
|||||||||
|
Operating expenses
|
15.16
|
|
(17
|
)
|
18.17
|
|
69
|
|
10.77
|
|
||||||||
|
DD&A expenses
|
27.23
|
|
7
|
|
25.37
|
|
(3
|
)
|
26.17
|
|
||||||||
|
G&A expenses
|
2.51
|
|
(47
|
)
|
4.78
|
|
3
|
|
4.66
|
|
||||||||
|
Other gain
|
—
|
|
100
|
|
(1.94
|
)
|
—
|
|
—
|
|
||||||||
|
Other loss
|
0.65
|
|
—
|
|
—
|
|
—
|
|
—
|
|
||||||||
|
Equity tax
|
—
|
|
—
|
|
—
|
|
(100
|
)
|
1.53
|
|
||||||||
|
Foreign exchange (gain) loss
|
(2.96
|
)
|
(153
|
)
|
5.54
|
|
—
|
|
(0.30
|
)
|
||||||||
|
42.59
|
|
(18
|
)
|
51.92
|
|
|
21
|
|
42.83
|
|
||||||||
|
Income before income taxes
|
$
|
49.55
|
|
(2
|
)
|
$
|
50.81
|
|
(13
|
)
|
$
|
58.12
|
|
|||||
67
|
(1)
|
Production represents production volumes NAR adjusted for inventory changes.
|
Segmented Results of Operations - Colombia for the Year Ended
December 31, 2013
, Compared with the Results for the Year Ended
December 31, 2012
For the
year ended
December 31, 2013
,
income before income taxes
was
$336.2 million
compared with
$244.5 million
in
2012
. The
increase
was due to
higher
oil and natural gas sales as a result of
increased
production, lower G&A expenses and higher foreign exchange gains, partially offset by
increase
d operating and DD&A expenses, other loss and the absence of a gain relating to the recovery of value added tax in 2012.
Oil and NGL production
, NAR
and adjusted for inventory changes, for the
year ended December 31, 2013
,
increase
d to
6.8
MMbbl compared with
4.8
MMbbl for
2012
due to the reduced impact of pipeline disruptions, a decrease in oil inventory as previously discussed and increased production from new wells in the Costayaco and Moqueta fields in the Chaza Block and long-term test production from a new well on the Llanos-22 Block. The net inventory reduction accounted for
0.1
MMbbl or
233
BOPD of the production increase. Production during the
year ended December 31, 2013
, reflected approximately
229
days of oil delivery restrictions in Colombia compared with
162
days of oil delivery restrictions in 2012. In 2013, the impact of OTA pipeline disruptions on production was mitigated by selling a portion of our oil through trucking and an alternative pipeline.
Revenue and other income
increase
d by
26%
to
$625.0 million
for the
year ended December 31, 2013
, as compared with
$494.3 million
in
2012
.
For the
year ended December 31, 2013
, the average realized price per bbl for oil
decrease
d by
11%
to
$92.21
compared with
$103.04
in
2012
. Average Brent oil prices for the
year ended
December 31, 2013
, were
$108.64
per bbl compared with
$111.67
per bbl in
2012
.
During the
year ended December 31, 2013
,
49%
of our oil and gas volumes sold in Colombia were to a customer to which oil is delivered at the Costayaco battery and the sales price is based on average WTI prices plus a Vasconia differential and premium, adjusted for trucking costs related to a 1,500 km route. The effect on the Colombian realized price for the
year ended December 31, 2013
, was a reduction of approximately
$12.55
per BOE as compared with delivering all of our Colombian oil through the OTA pipeline.
During the second quarter of 2012, the recognition of additional royalties resulting from an arbitrator's decision on a dispute with a third party relating to the calculation of the third party's net profits interest on 50% of production from the Chaza Block in Colombia resulted in a
$10.9 million
revenue reduction. This amount related to
July 2009
to
May 2012
production. The recognition of this royalty resulted in a
$2.27
per BOE reduction in the average realized price in the year ended December 31, 2012.
O
perating expenses
increase
d by
18%
to
$102.9 million
for the
year ended December 31, 2013
, from
$87.4 million
in
2012
. The increase was due to higher production levels partially offset by lower operating cost per BOE. On a per BOE basis, operating expenses
decrease
d by
17%
to
$15.16
for the
year ended
December 31, 2013
, from
$18.17
in
2012
. Operating costs per BOE
decrease
d primarily due to lower transportation costs associated with OTA pipeline disruptions. Transportation costs were lower due to the absence of pipeline charges and trucking costs relating to volumes sold at the Costayaco battery. The trucking costs associated with the volumes sold at the Costayaco battery were a reduction to our realized price rather than recorded as transportation expenses. The estimated net effect of OTA pipeline disruptions on Colombian transportation costs for the
year ended December 31, 2013
, was a reduction of
$1.79
per BOE.
DD&A expenses
increas
ed by
51%
to
$184.7 million
for the
year ended December 31, 2013
, from
$122.1 million
in
2012
. The increase was due to increased production and an increase in the per BOE depletion rate. On a per BOE basis, DD&A expenses
increase
d by
7%
to
$27.23
due to increased costs in the depletable base, partially offset by higher reserves.
For the
year ended December 31, 2013
,
G&A expenses
decrease
d by
26%
to
$17.0 million
($
2.51
per BOE) from
$23.0 million
(
$4.78
per BOE) in
2012
. The decrease was due to increased G&A allocations to operating costs and capital projects, partially offset by increased salaries expense due to increased headcount from expanded operations. Additionally, bank fees were lower in 2013 due to lower tax installment payments resulting from a corporate reorganization in Colombia in the fourth quarter of 2012.
68
Other gain
in the year ended December 31, 2012, relates to a recovery of previously unrecognized value added tax which occurred upon the completion of a reorganization of companies and their Colombian branches in the Colombian reporting segment during the fourth quarter of 2012. Upon the completion of the reorganization, the combined entity had sufficient revenue to utilize the tax credits.
Other loss
of $4.4 million in the year ended December 31, 2013, relates to a contingent loss accrued in connection with a legal dispute in which we received an adverse legal judgment within the quarter. We have filed an appeal against the judgment.
For the
year ended
December 31, 2013
, the
foreign exchange
gain
was
$20.1 million
, of which
$18.8 million
was an unrealized non-cash foreign exchange
gain
. In the
year ended December 31, 2012
, we incurred a foreign exchange
loss
of
$26.7 million
of which
$17.1 million
was an unrealized non-cash foreign exchange
loss
. Furthermore, in 2012, we had a realized foreign exchange
loss
of
$9.5 million
which primarily arose upon payment of 2011 Colombian income tax liabilities. This compares with
$1.3 million
realized foreign exchange
gain
in 2013.The Colombian Peso
weakened
by
9%
against the U.S. dollar in the
year ended December 31, 2013
. In the
year ended December 31, 2012
, the Colombian Peso
strengthened
by
9%
against the U.S. dollar. Under GAAP, deferred taxes are considered a monetary liability and require translation from local currency to U.S. dollar functional currency at each balance sheet date. This translation is the main source of the unrealized foreign exchange losses or gains.
Segmented Results of Operations - Colombia for the Year Ended
December 31, 2012
, Compared with the Results for the Year Ended
December 31, 2011
For the year ended December 31, 2012,
income before income taxes
was $244.5 million compared with $313.5 million in 2011. The decrease was due to lower oil and natural gas sales and increased operating expenses and foreign exchange losses, partially offset by decreased DD&A and G&A expenses, the recognition of a gain relating to the recovery of value added tax and the absence of equity tax.
On February 1, 2012, the sales point for the majority of our oil sales in the Putumayo Basin changed. Ecopetrol now takes title at the Port of Tumaco on the Pacific coast of Colombia rather than at the entry into the OTA pipeline. As a result, our reported oil inventory increased, representing ownership of oil in the OTA pipeline and associated Ecopetrol owned facilities. OTA transportation costs were previously factored into the price we received for oil, but, due to the changes in sales point, are now invoiced separately and included in operating costs. This change resulted in an increase in OTA oil transportation costs of $3.77 per bbl during year ended December 31, 2012.
Oil and NGL production
, NAR and adjusted for inventory changes, for the year ended December 31, 2012, decreased to 4.8 MMbbl compared with 5.3 MMbbl for 2011 due to the impact of pipeline disruptions and the effect of a change in the sales point, which decreased production and increased inventory, partially offset by increased production from new producing wells. Production during the year ended December 31, 2012, reflects approximately 162 days of oil delivery restrictions in Colombia. We continued production at a reduced rate while the OTA pipeline was down, selling a portion of our oil through trucking and storing excess oil. The disruptions resulted in a reduction in oil production of approximately 4,000 BOPD NAR in the year ended December 31, 2012. In 2012, our NAR inventory increased by approximately: 196Mbbl in Ecopetrol's facilities as a result of the change in sales point and OTA pipeline disruptions; 36Mbbl in our own storage facilities as a result of OTA pipeline disruptions; and 110Mbbl as a result of the terms of a sales agreement with a third party. Sales to a third party increased oil inventory due to a protracted sales cycle whereby the transfer of ownership occurs upon export. Increases in production resulted from the development of the Moqueta field with six producing wells and production in the Garibay Block from the Jilguero-1 and -2 and Melero-1 wells.
As a result of achieving gross field production of five MMbbl in our Costayaco field, we are subject to an additional government royalty payable. This royalty is calculated on 30% of field production revenue over an inflation adjusted trigger point. That trigger point for Costayaco oil was $31.29 for 2012. Production revenue for this calculation is based on production volumes net of other government royalty volumes. Average government royalties at Costayaco with gross production of 17,000 BOPD and $100 WTI price per bbl are approximately 27.5%, including the additional government royalty of approximately 20.2%. The Colombian National Hydrocarbon Agency (“ANH”) sliding scale royalty at 17,000 BOPD is approximately 9.2% and this royalty is deductible prior to calculating the additional government royalty.
Revenue and other income
decreased by 9% to $494.3 million for the year ended December 31, 2012, as compared with $544.5 million in 2011.
For the year ended December 31, 2012, the average realized price per bbl for oil increased by 2% to $103.04 compared with 2011. As discussed above, effective February 1, 2012, the average realized price per bbl in Colombia increased due to the new
69
sales agreement with Ecopetrol. Higher prices were partially offset by the effect of the settlement of a royalty dispute. During the second quarter of 2012, the recognition of additional royalties resulting from an arbitrator's decision on a dispute with a third party relating to the calculation of the third party's net profits interest on 50% of production from the Chaza Block in Colombia resulted in a $10.9 million revenue reduction. This amount related to July 2009 to May 2012 production. The recognition of this royalty resulted in a $2.27 per BOE reduction in the average realized price in the year ended December 31, 2012. The decision will increase future net profit interests payable to this third party. The third party royalty settlement represented less than 1% of the reported revenue for the periods under dispute and it is not expected to have a materially different effect on future revenue.
Operating expenses
increased by 50% to $87.4 million for the year ended December 31, 2012, from $58.1 million in 2011. On a per BOE basis, operating expenses increased by 69% to $18.17 for the year ended December 31, 2012, from $10.77 in 2011. As discussed above, effective February 1, 2012, operating expenses per BOE increased due to the $3.77 per bbl OTA pipeline oil transportation costs now charged as operating costs. Additionally, operating expenses per BOE were higher due to increased trucking as a result of the pipeline disruptions and increased trucking to other sales points, additional maintenance, civil works and environmental activities and a higher percentage of production being from the Moqueta, Jilguero and Melero fields, which have higher per BOE operating costs. Workover costs increased by $0.44 per BOE compared with 2011 due to increased workovers in the Costayaco, Moqueta and Juanambu fields.
DD&A expenses
decreased by 14% to $122.1 million for the year ended December 31, 2012, from $141.1 million in 2011. The decrease was primarily due to increased reserves, partially offset by increased costs in the depletable base. On a per BOE basis, DD&A expenses decreased by 3% to $25.37 for the year ended December 31, 2012.
For the year ended December 31, 2012,
G&A expenses
decreased by 8% to $23.0 million ($4.78 per BOE) from $25.1 million ($4.66 per BOE) in 2011 due to increased G&A allocations and recoveries.
Other gain
in the year ended December 31, 2012, relates to a recovery of previously unrecognized value added tax which occurred upon the completion of a reorganization of companies and their Colombian branches in the Colombian reporting segment during the fourth quarter of 2012. Upon the completion of the reorganization, the combined entity had sufficient revenue to utilize the tax credits.
Equity tax
in the year ended December 31, 2011, represented a Colombian tax of 6% on a legislated measure which was based on our Colombian segment’s balance sheet equity at January 1, 2011.
For the year ended December 31, 2012, the
foreign exchange loss
was $26.7 million, of which $17.1 million was an unrealized non-cash foreign exchange loss. In the year ended December 31, 2011, we incurred a foreign exchange gain of $1.6 million of which $0.9 million was an unrealized non-cash foreign exchange gain.
Capital Program - Colombia
Capital expenditures in our Colombian segment during the
year ended December 31, 2013
, were
$190.0 million
. During 2013, we also received proceeds of
$1.5 million
from the sale of our 15% working interest in the Mecaya Block in Colombia.
The following table provides a breakdown of capital expenditures in the three years ended
December 31, 2013
:
|
|
Year Ended December 31,
|
|||||||||||
|
(Millions of U.S. Dollars)
|
2013
|
2012
|
2011
|
|||||||||
|
Drilling and completions
|
$
|
107.1
|
|
$
|
103.1
|
|
$
|
105.3
|
|
|||
|
Facilities and equipment
|
29.4
|
|
26.3
|
|
33.0
|
|
||||||
|
G&G
|
40.0
|
|
14.5
|
|
30.0
|
|
||||||
|
Other
|
13.5
|
|
9.4
|
|
34.3
|
|
||||||
|
|
$
|
190.0
|
|
$
|
153.3
|
|
|
$
|
202.6
|
|
||
The significant elements of our
2013
capital program in Colombia were:
|
•
|
On the Chaza Block (100% working interest ("WI"), operated), we drilled and completed the Moqueta-10 and -11 development wells in the Moqueta field and the Costayaco-18 development well in the Costayaco field as oil producers and commenced drilling the Moqueta-12 development well and the Zapotero-1 and Corunta-1 exploration
|
70
well. We also drilled and completed the Moqueta-9 water injector well. Subsequent to year-end, we completed initial testing of the Moqueta-12 development well and decided to abandon the Corunta-1 exploration well due to drilling problems prior to reaching the reservoir target on this long-reach deviated well. The target location will be drilled again this year with a revised drilling plan.
|
•
|
We drilled one gross exploration well, Miraflor Oeste-1, on the Guayuyaco Block (70% WI, operated), which resulted in an oil discovery.
|
|
•
|
Together with our partner, we continued drilling the Mayalito-1P exploration well on the Llanos-22 Block (45% WI, non-operated) and this also resulted in an oil discovery.
|
|
•
|
We performed workovers on the Santana Block (35% WI, operated).
|
|
•
|
We acquired 3-D seismic on the Garibay Block (50% WI, non-operated) and 2-D seismic on the Piedemonte Sur (100%, operated) and Magdalena Blocks (100% WI, operated). We started 3-D seismic on the Putumayo-1 Block (55% WI, operated) and 2-D seismic on the Cauca-7 Block (100% WI, operated) and Putumayo-10 (100% WI, operated) Blocks. We commenced G&G studies, including aeromagnetic surveys, on the Sinu-1 (60% WI, operated)and Sinu-3 Blocks (51% WI, operated). and seismic reprocessing and G&G studies on the Llanos-22 Block.
|
|
•
|
We also continued facilities work at the Costayaco and Moqueta fields on the Chaza Block, the Llanos-22 Block and the Guayuyaco Block.
|
Outlook - Colombia
The
2014
capital program in Colombia is
$243 million
with
$118 million
allocated to drilling,
$54 million
to facilities and pipelines and
$71 million
for G&G expenditures.
Our planned work program for
2014
in Colombia includes drilling three oil exploration wells on the Chaza Block and one gross exploration well on each of the Putumayo-1 Block and the Garibay Block . We also plan to drill one appraisal well and eight development wells on the Chaza Block (both Costayaco and Moqueta fields).
We also plan to commence the acquisition of 2-D seismic on the Chaza, Cauca-6, Cauca-7, Putumayo-10, Sinu-1 and Sinu-3 Blocks and 3-D seismic on the Putumayo-1 Block. Facilities work is also planned for the Chaza, Garibay, Guayuyaco and Llanos-22 Blocks.
71
Segmented Results – Argentina
|
|
Year Ended December 31,
|
||||||||||||||||
|
|
2013
|
% Change
|
2012
|
% Change
|
2011
|
||||||||||||
|
(Thousands of U.S. Dollars)
|
|||||||||||||||||
|
Oil and natural gas sales
|
$
|
73,495
|
|
(8
|
)
|
$
|
79,642
|
|
66
|
|
$
|
48,016
|
|
||||
|
Interest income
|
1,015
|
|
186
|
|
355
|
|
438
|
|
66
|
|
|||||||
|
74,510
|
|
(7
|
)
|
79,997
|
|
66
|
|
48,082
|
|
||||||||
|
Operating expenses
|
38,886
|
|
19
|
|
32,696
|
|
21
|
|
27,076
|
|
|||||||
|
DD&A expenses
|
64,295
|
|
104
|
|
31,466
|
|
(31
|
)
|
45,506
|
|
|||||||
|
G&A expenses
|
12,223
|
|
1
|
|
12,159
|
|
56
|
|
7,805
|
|
|||||||
|
Foreign exchange loss
|
6,484
|
|
148
|
|
2,616
|
|
693
|
|
330
|
|
|||||||
|
121,888
|
|
54
|
|
78,937
|
|
(2
|
)
|
80,717
|
|
||||||||
|
(Loss) income before income taxes
|
$
|
(47,378
|
)
|
(4,570
|
)
|
$
|
1,060
|
|
(103
|
)
|
$
|
(32,635
|
)
|
||||
|
Production
|
|||||||||||||||||
|
Oil and NGL's, bbl
|
882,110
|
|
(16
|
)
|
1,047,265
|
|
44
|
|
726,762
|
|
|||||||
|
Natural gas, Mcf
|
1,338,110
|
|
(1
|
)
|
1,346,368
|
|
18
|
|
1,143,576
|
|
|||||||
|
Total production, BOE (1)
|
1,105,128
|
|
(13
|
)
|
1,271,660
|
|
39
|
|
917,358
|
|
|||||||
|
Average Prices
|
|||||||||||||||||
|
Oil and NGL's per bbl
|
$
|
77.12
|
|
8
|
|
$
|
71.12
|
|
16
|
|
$
|
61.10
|
|
||||
|
Natural gas per Mcf
|
$
|
4.08
|
|
7
|
|
$
|
3.83
|
|
21
|
|
$
|
3.16
|
|
||||
|
Segmented Results of Operations per BOE
|
|||||||||||||||||
|
Oil and natural gas sales
|
$
|
66.50
|
|
6
|
|
$
|
62.63
|
|
20
|
|
$
|
52.34
|
|
||||
|
Interest income
|
0.92
|
|
229
|
|
0.28
|
|
300
|
|
0.07
|
|
|||||||
|
67.42
|
|
7
|
|
62.91
|
|
20
|
|
52.41
|
|
||||||||
|
Operating expenses
|
35.19
|
|
37
|
|
25.71
|
|
(13
|
)
|
29.52
|
|
|||||||
|
DD&A expenses
|
58.18
|
|
135
|
|
24.74
|
|
(50
|
)
|
49.61
|
|
|||||||
|
G&A expenses
|
11.06
|
|
16
|
|
9.56
|
|
12
|
|
8.51
|
|
|||||||
|
Foreign exchange loss
|
5.87
|
|
185
|
|
2.06
|
|
472
|
|
0.36
|
|
|||||||
|
110.30
|
|
78
|
|
62.07
|
|
(29
|
)
|
88.00
|
|
||||||||
|
(Loss) income before income taxes
|
$
|
(42.88
|
)
|
(5,205
|
)
|
$
|
0.84
|
|
(102
|
)
|
$
|
(35.59
|
)
|
||||
|
(1)
|
Production represents production volumes NAR adjusted for inventory changes.
|
72
Segmented Results of Operations - Argentina for the Year Ended
December 31, 2013
, Compared with the Results for the Year Ended
December 31, 2012
For the
year ended December 31, 2013
,
loss
before income taxes
in Argentina was
$47.4 million
compared with
income
before taxes of
$1.1 million
in
2012
. In
2013
, DD&A expenses included a ceiling test impairment loss of
$30.8 million
. Additionally, oil and natural gas sales
decrease
d and operating expenses and foreign exchange losses
increase
d.
Total oil and gas production from the Argentina segment
decrease
d by
13%
to
1.1
MMBOE, NAR and adjusted for inventory changes, for the
year ended December 31, 2013
, compared with
1.3
MMBOE in
2012
.
Oil and NGL production
, NAR and adjusted for inventory changes,
decrease
d
16%
to
0.9
MMbbl for the
year ended December 31, 2013
, compared with
1.0
MMbbl in 2012. The
decrease
was primarily due to the following: reduced production from the Puesto Morales Block due to expected production declines and well downtime for workovers; reduced production from the Surubi Block due to stabilization of Proa-2 production, which came on-stream in April 2012, and well downtime for workovers; and reduced production from the El Chivil Block due to well downtime for workovers. In 2013, gas production of
1.3
Bcf was consistent with 2012.
Revenue and other income
decrease
d by
7%
to
$74.5 million
for the
year ended December 31, 2013
, compared with
$80.0 million
in
2012
. During the
year ended December 31, 2013
, we recognized
$3.7 million
, or
$4.20
per bbl, upon the sale of some of our Petroleum Plus program credits. These credits are granted by the Argentina government to companies for new production of oil or natural gas, either from new discoveries, enhanced recovery techniques or reactivation of older fields. We have an additional
$1.8 million
of Petroleum Plus program credits which we expect to monetize. Future sales of these credits will be recognized when realized, as a contingent gain.
In 2013, production decreases were partially offset by increased oil and natural gas prices. The average realized price for oil
increase
d by
8%
to
$77.12
compared with
$71.12
in 2012. As noted above, the impact of the sale of some of our Petroleum Plus program credits in the
year ended December 31, 2013
, was
$4.20
per bbl. The prices we receive in Argentina are influenced by the Argentina regulatory regime. Currently, most oil and gas producers in Argentina are operating without sales contracts for periods longer than several months. We are continuing deliveries to refineries and are negotiating a price for those deliveries on a regular and short-term basis.
Operating expenses
increase
d by
19%
to
$38.9 million
for the
year ended December 31, 2013
, compared with
$32.7 million
in
2012
. On a per BOE basis, operating expenses
increase
d by
37%
to
$35.19
for the
year ended
December 31, 2013
, from
$25.71
in
2012
. The increase in operating costs on a per BOE basis was primarily due to reduced production volumes, an increase of
$4.73
per BOE in workover expenses and increased security on the Puesto Morales and Surubi Blocks, partially offset by reduced transportation costs. During the
year ended December 31, 2013
, workovers were performed on the Puesto Morales, Surubi, El Chivil, El Vinalar and Palmar Largo Blocks; whereas, in 2012, workovers were performed only on the Puesto Morales and Palmar Largo Blocks.
DD&A
expenses
increase
d by
104%
to
$64.3 million
for the
year ended December 31, 2013
, compared with
$31.5 million
in
2012
. DD&A expenses for the
year ended December 31, 2013
, included a ceiling test impairment loss of
$30.8 million
in our Argentina cost center due to a decrease in reserves as a result of deferred investment and inconclusive waterflood results
on the Puesto Morales Block. On a per BOE basis, DD&A expenses increased by
135%
to
$58.18
compared with
$24.74
in 2012. The 2013 ceiling test impairment loss accounted for
$27.87
per BOE of the increase. The remainder of the increase was due to increased costs in the depletable base and lower reserves.
G&A
expenses
were
$12.2 million
(
$11.06
per BOE) in the
year ended December 31, 2013
, consistent with
$12.2 million
(
$9.56
per BOE) in
2012
.
For the
year ended
December 31, 2013
, the
foreign exchange
loss
was
$6.5 million
, compared with
$2.6 million
in
2012
. The loss primarily relates to realized foreign exchange losses on monetary assets in Argentina during the year. The Argentina Peso
weakened
by
33%
and
14%
against the U.S. dollar in the years ended
December 31, 2013
, and
2012
, respectively. The net monetary asset balance exposed to foreign exchange losses was higher throughout 2013 as compared with 2012.
Segmented Results of Operations - Argentina for the Year Ended
December 31, 2012
, Compared with the Results for the Year Ended
December 31, 2011
For the year ended December 31, 2012,
income before income taxes
in Argentina was $1.1 million compared with loss before taxes of $32.6 million in 2011. In 2011, a ceiling test impairment charge of $25.7 million was recorded in the Argentina cost
73
center. In 2012, increased oil and natural gas sales and the absence of the impairment charge more than offset increased operating and G&A expenses and foreign exchange losses.
Total production of oil and gas from the Argentina segment increased by 39% to 1.3 MMBOE, NAR and adjusted for inventory changes, for the year ended December 31, 2012, compared with 0.9 MMBOE in 2011. The acquisition of Petrolifera on March 18, 2011, added seven blocks in the Neuquen Basin, including production from four blocks, to the Argentina segment. Production in the year ended December 31, 2012, included Petrolifera production of 0.7 MMBOE, NAR and adjusted for inventory changes, which was a 40% increase from 0.5 MMBOE in 2011 due to a full 12 months of production.
Oil and NGL production
, NAR and adjusted for inventory changes, increased 44% to 1.0 MMbbl for the year ended December 31, 2012, compared with 0.7 MMbbl in 2011. The increase was primarily due to production from the Proa-2 well, in the Surubi Block, which began production in April 2012.
Natural gas production
, NAR, was 1.3 Bcf in the year ended December 31, 2012, compared with 1.1 Bcf in 2011. The increase was mainly attributable to a full year of production from Petrolifera's properties.
Revenue and other income
increased by 66% to $80.0 million for the year ended December 31, 2012, compared with $48.1 million in 2011, due to increased production volumes and increased prices.
Average oil prices increased by 16% in the year ended December 31, 2012, compared with 2011. Due to the Argentina regulatory regime, the average oil price we received for production from our blocks during the year ended December 31, 2012, was $71.12 per bbl. During 2012, we were able to negotiate higher oil prices with refineries as a result of the Argentina government’s decision to allow an increase in domestic petroleum product prices; however, prices have now stabilized.
Operating expenses
increased by 21% to $32.7 million for the year ended December 31, 2012, compared with $27.1 million in 2011. The increase was due to higher production volumes. On a per BOE basis, operating expenses decreased by 13% to $25.71 for the year ended December 31, 2012, from $29.52 in 2011. The decrease in operating costs on a per BOE basis was due to increased production from the Surubi Block, which has lower operating costs per BOE due to high volumes produced.
DD&A expenses
decreased by 31% to $31.5 million for the year ended December 31, 2012, compared with $45.5 million in 2011. DD&A expenses in 2011 included a ceiling test impairment charge for the Argentina cost center of $25.7 million. The 2011 impairment loss resulted from an increase in estimated future operating and capital costs to produce our remaining Argentina proved reserves and a decrease in reserve volumes. In 2012, the impact of the absence of the impairment charge was partially offset by the impact of higher production volumes. On a per BOE basis, DD&A expenses were $24.74 for the year ended December 31, 2012, 50% lower than DD&A expenses in 2011 of $49.61 mainly due to the ceiling test impairment charge of $28.02 per BOE in 2011.
G&A expenses
were $12.2 million ($9.56 per BOE) in the year ended December 31, 2012, compared with $7.8 million ($8.51 per BOE) in 2011. For the year ended December 31, 2012, G&A expenses increased due to a $1.9 million loss recorded against a value added tax receivable balance due from a former partner and increased employee related expenses due to an increased headcount from expanded operations. G&A expenses in the year ended December 31, 2011, included $1.6 million of interest expense on debt acquired on the Petrolifera acquisition which was repaid in August 2011, when Argentina's regulatory requirements allowed its repayment.
For the year ended December 31, 2012, the
foreign exchange loss
was $2.6 million, compared with $0.3 million in 2011. The loss primarily relates to realized foreign exchange losses on monetary assets in Argentina during the year. The Argentina Peso weakened by 14% and 9% against the U.S. dollar in the year ended December 31, 2012, and 2011, respectively, and the net asset balance exposed to foreign exchange losses was higher throughout 2012 as compared to 2011 as a result of increased production and sales.
Capital Program - Argentina
Capital expenditures in our Argentina segment during the
year ended December 31, 2013
, were
$23.6 million
, including drilling of
$14.6 million
, G&G expenditures of
$3.1 million
, facilities of
$2.0 million
and other expenditures of
$3.9 million
. During the second quarter of 2013, we assumed our partner's 50% working interest in the Santa Victoria Block and received cash consideration of
$4.1 million
from our partner, comprising the balance owing for carry consideration and compensation for the second exploration phase work commitment.
The significant elements of our
2013
capital program in Argentina were:
74
|
•
|
We drilled and completed two development wells, PMN-1130-SB and PMN-1131-SB, on the Puesto Morales Block (100% WI, operated). Both wells are on production.
|
|
•
|
We commenced drilling a horizontal multi-stage fracture stimulated well into the Loma Montosa formation on the Puesto Morales Block to further evaluate this new play. Work on this well is currently suspended due to landowner blockades that prevent safe operations. We also completed workovers on wells on the Puesto Morales Block.
|
|
•
|
We purchased materials in preparation for drilling a development well on the Surubi Block (85% WI, operated).
|
|
•
|
We acquired the remaining 50% working interest in the El Vinalar Block (100% WI, operated) from our partner.
|
|
•
|
We undertook facilities work at the Surubi and Puesto Morales Blocks.
|
Outlook – Argentina
The
2014
capital program in Argentina is
$44 million
with
$18 million
allocated to drilling,
$20 million
to facilities and pipelines, and
$6 million
to G&G expenditures.
Our planned work program for
2014
in Argentina includes drilling one gross development well on each of the Puesto Morales Block and the Surubi Block and workovers on existing wells. We also plan to perform facilities work on the Puesto Morales Block, the Surubi Block, the El Chivil Block and the El Vinalar Block.
Segmented Results – Peru
|
|
Year Ended December 31,
|
||||||||||||||||
|
|
2013
|
% Change
|
2012
|
% Change
|
2011
|
||||||||||||
|
(Thousands of U.S. Dollars)
|
|||||||||||||||||
|
Interest income
|
$
|
27
|
|
(45
|
)
|
$
|
49
|
|
(65
|
)
|
$
|
140
|
|
||||
|
Operating expenses
|
—
|
|
(100
|
)
|
$
|
160
|
|
(50
|
)
|
322
|
|
||||||
|
DD&A expenses
|
362
|
|
(71
|
)
|
1,234
|
|
(97
|
)
|
42,035
|
|
|||||||
|
G&A expenses
|
5,524
|
|
21
|
|
4,573
|
|
8
|
|
4,249
|
|
|||||||
|
Foreign exchange loss (gain)
|
1,208
|
|
(384
|
)
|
(425
|
)
|
96
|
|
(217
|
)
|
|||||||
|
|
7,094
|
|
28
|
|
5,542
|
|
(88
|
)
|
46,389
|
|
|||||||
|
Loss before income taxes
|
$
|
(7,067
|
)
|
29
|
|
$
|
(5,493
|
)
|
(88
|
)
|
$
|
(46,249
|
)
|
||||
Segmented Results of Operations - Peru for the Year Ended
December 31, 2013
, Compared with the Results for the Years Ended
December 31, 2012
, and
December 31, 2011
DD&A expenses
for the year ended December 31, 2011, included
$42.0 million
of impairment charges relating to drilling costs from a dry well and seismic costs on blocks which were relinquished.
G&A
expenses
were
$5.5 million
in the year ended December 31, 2013,
$4.6 million
in the year ended December 31, 2012, and
$4.2 million
in 2011. The increases were due to higher salaries expense resulting from expanded operations partially offset by increased capitalized costs.
For the
year ended
December 31, 2013
, the
foreign exchange
loss
was
$1.2 million
, compared with a gain of
$0.4 million
in
2012
. The loss primarily relates to realized foreign exchange losses on monetary assets in Peru during the year. The Peruvian Nuevo Sol
weakened
by
9%
and
strengthened
by
5%
against the U.S. dollar in the years ended
December 31, 2013
, and
2012
, respectively.
75
Capital Program – Peru
Capital expenditures in our Peruvian segment for the
year ended December 31, 2013
, were
$83.0 million
. Capital expenditures in
2013
included drilling of
$42.9 million
, G&G expenditures of
$34.8 million
, facilities expenditures of
$1.5 million
and other expenditures of
$3.8 million
.
The significant elements of our
2013
capital program in Peru were:
|
•
|
On Block 95 (100% WI, operated), we completed drilling a horizontal side-track extension of the Bretaña Norte 95-2-1XD exploration well. We also completed a preliminary Front End Engineering Design study for the Bretaña field development and completed a 2-D seismic program to provide a more detailed map of the Bretaña structure, along with maturing separate independent exploration leads on Block 95.
|
|
•
|
On Blocks 123, 129 and 107 (all 100% WI, operated), we continued work to obtain the necessary environmental and social permits for future seismic programs.
|
|
•
|
On Block 133 (100% WI, operated), we completed an aeromagnetic and aerogravity survey.
|
Outlook - Peru
The
2014
capital program in Peru is
$148 million
with
$83 million
allocated to drilling,
$22 million
for facilities and
$43 million
for G&G expenditures.
Our planned work program for
2014
in Peru includes drilling a water disposal well and an appraisal well in the Bretaña field. In addition, crude oil processing and loading facilities are expected to be completed in order to initiate long-term test production in 2014. Additionally, we expect to acquire 2-D seismic on Block 107 and continue work to obtain the necessary environmental and social permits in anticipation of drilling our first wells on Blocks 123, 129 and 107 in future years.
76
Segmented Results - Brazil
|
Year Ended December 31,
|
|||||||||||||||||
|
2013
|
% Change
|
2012
|
% Change
|
2011
|
|||||||||||||
|
(Thousands of U.S. Dollars)
|
|||||||||||||||||
|
Oil and natural gas sales
|
$
|
22,545
|
|
129
|
|
$
|
9,852
|
|
136
|
|
$
|
4,176
|
|
||||
|
Interest income
|
909
|
|
50
|
|
607
|
|
623
|
|
84
|
|
|||||||
|
23,454
|
|
124
|
|
10,459
|
|
146
|
|
4,260
|
|
||||||||
|
Operating expenses
|
7,311
|
|
58
|
|
4,637
|
|
356
|
|
1,018
|
|
|||||||
|
DD&A expenses
|
16,761
|
|
(36
|
)
|
26,300
|
|
—
|
|
1,819
|
|
|||||||
|
G&A expenses
|
2,231
|
|
7
|
|
2,092
|
|
(54
|
)
|
4,542
|
|
|||||||
|
Foreign exchange (gain) loss
|
(199
|
)
|
(110
|
)
|
1,973
|
|
160
|
|
759
|
|
|||||||
|
26,104
|
|
(25
|
)
|
35,002
|
|
330
|
|
8,138
|
|
||||||||
|
Loss before income taxes
|
$
|
(2,650
|
)
|
(89
|
)
|
$
|
(24,543
|
)
|
533
|
|
$
|
(3,878
|
)
|
||||
|
|
|
||||||||||||||||
|
Production (1)
|
|||||||||||||||||
|
Oil and NGL's, bbl
|
239,040
|
|
136
|
|
101,199
|
|
135
|
|
43,058
|
|
|||||||
|
Average Prices
|
|||||||||||||||||
|
Oil and NGL's per bbl
|
$
|
94.31
|
|
(3
|
)
|
$
|
97.35
|
|
—
|
|
$
|
96.99
|
|
||||
|
Segmented Results of Operations per BOE
|
|||||||||||||||||
|
Oil and natural gas sales
|
$
|
94.31
|
|
(3
|
)
|
$
|
97.35
|
|
—
|
|
$
|
96.99
|
|
||||
|
Interest income
|
3.80
|
|
(37
|
)
|
6.00
|
|
208
|
|
1.95
|
|
|||||||
|
98.11
|
|
(5
|
)
|
103.35
|
|
4
|
|
98.94
|
|
||||||||
|
Operating expenses
|
30.58
|
|
(33
|
)
|
45.82
|
|
94
|
|
23.64
|
|
|||||||
|
DD&A expenses
|
70.12
|
|
(73
|
)
|
259.88
|
|
515
|
|
42.25
|
|
|||||||
|
G&A expenses
|
9.33
|
|
(55
|
)
|
20.67
|
|
(80
|
)
|
105.49
|
|
|||||||
|
Foreign exchange (gain) loss
|
(0.83
|
)
|
(104
|
)
|
19.50
|
|
11
|
|
17.63
|
|
|||||||
|
109.20
|
|
(68
|
)
|
345.87
|
|
83
|
|
189.01
|
|
||||||||
|
Loss before income taxes
|
$
|
(11.09
|
)
|
(95
|
)
|
$
|
(242.52
|
)
|
169
|
|
$
|
(90.07
|
)
|
||||
|
(1)
|
Production represents production volumes NAR adjusted for inventory changes.
|
Segmented Results of Operations - Brazil for the Year Ended
December 31, 2013
, Compared with the Results for the Years Ended
December 31, 2012
, and
December 31, 2011
For the
year ended December 31, 2013
,
loss before income taxes
was
$2.7 million
compared with
$24.5 million
in
2012
and
$3.9 million
in
2011
. Loss before income taxes included a ceiling test impairment loss of
$2.0 million
in 2013 and
$20.2 million
in 2012.
77
Oil and NGL production
in Brazil is from the Tiê field in Block 155 in the onshore Recôncavo Basin. We began recording revenue from this block in June 2011, the date regulatory approval was received for the purchase of our initial 70% working interest in this block. In October 2012, we increased our working interest in Block 155 from 70% to 100%. Additionally, our number of producing wells was increased from one to three during 2012. Our production in Brazil was shut in for three weeks in October 2013 as a result of a strike by employees of Petróleo Brasileiro S.A. which affected the crude oil receiving terminal we use in the Recôncavo Basin. During 2012, production was shut in between the expiry of the long-term test phase on July 31, 2012, and the declaration of commerciality for the Tiê field. Production recommenced on September 21, 2012, after the receipt of regulatory approval. Our production in Brazil is currently limited due to gas flaring restrictions, but we are continuing to evaluate options to mitigate the effect of these restrictions.
Revenue and other income
increased to
$23.5 million
for the
year ended December 31, 2013
, compared with
$10.5 million
in 2012 and
$4.3 million
in 2011. Revenue increased in both years primarily as a result of increased oil production volumes. For the
year ended December 31, 2013
, the average realized price per bbl for oil
decrease
d by
3%
to
$94.31
compared with
$97.35
in 2012.The average realized price per bbl for oil in 2012 was consistent with the price in 2011. The price we receive in Brazil is at a discount to Brent due to refining and quality discounts. Average Brent oil prices for the
year ended
December 31, 2013
, were
$108.64
per bbl compared with
$111.67
per bbl in
2012
.
Operating expenses
increased to
$7.3 million
for the
year ended December 31, 2013
, compared with
$4.6 million
in 2012 and
$1.0 million
in 2011, due to higher production volumes. On a per bbl basis, operating expenses decreased to
$30.58
for the
year ended December 31, 2013
, from
$45.82
per bbl in 2012. Operating expenses per bbl decreased in 2013 compared with 2012 due to increased production, partially offset by increased costs for water disposal and slickline services. Operating expenses per bbl increased from
$23.64
in
2011
to
$45.82
in
2012
due to the increased well count.
DD&A expenses
were
$16.8 million
(
$70.12
per bbl) in the
year ended December 31, 2013
, compared with
$26.3 million
(
$259.88
per bbl) in 2012 and
$1.8 million
(
$42.25
per bbl) for the year ended December 31, 2011. In 2013, we recorded a ceiling test impairment loss of
$2.0 million
(
$8.37
per bbl). DD&A expenses in 2012, included a ceiling test impairment loss of
$20.2 million
(
$199.61
per bbl) relating to seismic and drilling costs on Block BM-CAL-10. In 2013, the effect of reduced ceiling test impairment losses, was partially offset by the effect of increased costs in the depletable base, primarily related to the acquisition of the remaining 30% WI in four blocks in the Recôncavo Basin in October 2012. The increase in DD&A expense per bbl in 2012 compared with 2011 was due to the effect of increased ceiling test impairment losses combined with the effect of increased costs in the depletable base.
G&A
expenses
were
$2.2 million
(
$9.33
per bbl) in the
year ended December 31, 2013
, compared with
$2.1 million
(
$20.67
per bbl) in
2012
and
$4.5 million
(
$105.49
per bbl) in
2011
. We began recognizing production in Brazil in June 2011 upon receipt of regulatory approval. This resulted in a significant increase in the costs that were directly attributable to operations and exploration and development and a corresponding reduction in G&A expenses in 2012 compared with 2011.
Capital Program – Brazil
Capital expenditures in our Brazilian segment during the
year ended December 31, 2013
, were
$77.0 million
, including drilling of
$56.3 million
, facilities of
$1.5 million
, G&G expenditures of
$15.1 million
and
$4.1 million
of other expenditures.
During the third quarter of 2013, we received a net payment of
$54.0 million
(before income taxes) from a third party in connection with termination of a farm-in agreement in the Recôncavo Basin relating to Block REC-T-129, Block REC-T-142, Block REC-T-155 and Block REC-T-224. We retain a 100% operated WI in these blocks.
We successfully bid on three blocks in the 2013 Brazil Bid Round 11 administered by Brazil's Agência Nacional de Petróleo, Gás Natural e Biocombustíveis ("ANP") and, in the third quarter of 2013, paid a signature bonus of
$14.4 million
upon finalization of the concession agreements. The three blocks, Block REC-T-86, Block REC-T-117 and Block REC-T-118, are located north of our core existing areas in the Recôncavo Basin onshore Brazil and we hold a 100% operated WI in these blocks.
The significant elements of our
2013
capital program in Brazil were:
|
•
|
On Block REC-T-155 , we drilled an exploration well, 1-GTE-8DP-BA and a horizontal sidetrack oil exploration well, 1-GTE-7HPC-BA, from the 1-GTE-7-BA wellbore. Both of these wells are currently suspended awaiting fracture stimulation. We also performed facilities work on Block 155.
|
78
|
•
|
On Block REC-T-129 , we re-entered and isolated the final two fracture stages at the horizontal sidetrack oil exploration well, 1-GTE-6HP-BA.
|
|
•
|
Together with our partners, we relinquished our interest in Block BM-CAL-7 and paid a penalty of
$1.3 million
for not meeting the first exploration phase work obligation to drill a well on this block.
|
Outlook – Brazil
The
2014
capital program in Brazil is
$30 million
with
$8 million
allocated to drilling,
$6 million
to facilities and pipelines and
$16 million
for G&G and other expenditures.
Our planned work program for
2014
in Brazil will focus on facilities work in the Tiê field along with seismic acquisition on Block REC-T-86, Block REC-T-117 and Block REC-T-118. We will continue the study of two unconventional resource plays in 2014 through core analysis, geochemistry studies, 3D seismic re-processing and evaluating ongoing fracture stimulation test results, among other activities in an effort to establish the commercial viability of the resource opportunity in oil-saturated tight sandstones and shales in the Recôncavo Basin.
Results - Corporate Activities
|
|
Year Ended December 31,
|
||||||||||||||||
|
|
2013
|
% Change
|
2012
|
% Change
|
2011
|
||||||||||||
|
(Thousands of U.S. Dollars)
|
|||||||||||||||||
|
Interest income
|
$
|
619
|
|
55
|
|
$
|
400
|
|
(8
|
)
|
434
|
|
|||||
|
|
|
||||||||||||||||
|
DD&A expenses
|
1,031
|
|
5
|
|
982
|
|
32
|
|
742
|
|
|||||||
|
G&A expenses
|
16,425
|
|
(4
|
)
|
17,039
|
|
(9
|
)
|
18,677
|
|
|||||||
|
Financial instruments gain
|
—
|
|
—
|
|
—
|
|
—
|
|
(1,522
|
)
|
|||||||
|
Gain on acquisition
|
—
|
|
—
|
|
—
|
|
(100
|
)
|
(21,699
|
)
|
|||||||
|
Foreign exchange loss (gain)
|
411
|
|
(20
|
)
|
514
|
|
(31
|
)
|
743
|
|
|||||||
|
17,867
|
|
(4
|
)
|
18,535
|
|
(706
|
)
|
|
(3,059
|
)
|
|||||||
|
|
|
||||||||||||||||
|
(Loss) income before income taxes
|
$
|
(17,248
|
)
|
(5
|
)
|
$
|
(18,135
|
)
|
(619
|
)
|
$
|
3,493
|
|
||||
Results of Operations - Corporate Activities for the Year Ended
December 31, 2013
, Compared with the Results for the Years Ended
December 31, 2012
, and
December 31, 2011
G&A
expenses
in the
year ended December 31, 2013
, were
$16.4 million
compared with
$17.0 million
in
2012
. The
decrease
in G&A expenses in 2013 was primarily due to an increase in costs recovered from business units, lower stock-based compensation expense and compensation for damages, partially offset by increased tax consulting fees. During 2013, we received $1.0 million from the U.S. Federal Government for assets recovered from our former U.S. securities counsel as compensation for damages suffered in 2006. This amount was recorded as a reduction of G&A expenses in the year. Stock-based compensation expense decreased due to less residual amortization of prior year higher value stock-based payment awards in 2013 and lower amortization of current year awards due to a later grant date than in 2012.
G&A expenses in the
year ended December 31, 2012
, were
$17.0 million
compared with
$18.7 million
in 2011. Increases in salaries due to expanded operations were more than offset by an increase in the amount of costs recovered from business units, a reduction in consulting costs and the absence of Petrolifera acquisition costs ($1.2 million in 2011).
Gain on acquisition
in the year ended December 31, 2011, related to the acquisition of Petrolifera.
Liquidity and Capital Resources
At
December 31, 2013
, we had cash and cash equivalents of
$428.8 million
compared with
$212.6 million
at
December 31, 2012
, and
$351.7 million
at
December 31, 2011
.
79
We believe that our cash resources, including cash on hand and cash generated from operations will provide us with sufficient liquidity to meet our strategic objectives and planned capital program for
2014
, given current oil price trends and production levels. In accordance with our investment policy, cash balances are held in our primary cash management bank, HSBC Bank plc., in interest earning current accounts or are invested in U.S. or Canadian government-backed federal, provincial or state securities or other money market instruments with high credit ratings and short-term liquidity. We believe that our current financial position provides us the flexibility to respond to both internal growth opportunities and those available through acquisitions.
At December 31, 2013,
97%
of our cash and cash equivalents was held by subsidiaries and partnerships outside of Canada and the United States. Subsequent to year-end, some of this cash was used to pay amounts owing to the head office; however, this cash was generally not available to fund domestic or head office operations unless funds were repatriated. During the three months ended June 30, 2013, we repatriated
$11.1 million
to a Canadian subsidiary from one of our Argentina subsidiaries through loan repayments, authorized by the Argentina Central Bank. These were repayments of loan principal and as such had no withholding tax applied. At this time, we do not intend to repatriate further funds, but if we did, we might have to accrue and pay taxes in certain jurisdictions on the distribution of accumulated earnings. Undistributed earnings of foreign subsidiaries are considered to be permanently reinvested and a determination of the amount of unrecognized deferred tax liability on these undistributed earnings is not practicable.
The governments in Brazil and Argentina require us to register funds that enter and exit the country with the central bank in each country. In Brazil, Argentina and Colombia, all transactions must be carried out in the local currency of the country. In Colombia, we participate in a special exchange regime, which allows us to receive revenue in U.S. dollars offshore. Beginning in 2013, transfers of branch profits are considered as dividends subject to a 25% tax if those profits have not already been subject to Colombian tax. We do not currently expect that this change in Colombian law will have a material consequence to us.
The Argentina government has imposed a number of monetary and currency exchange control measures that include restrictions on the free disposition of funds deposited with banks and tight restrictions on transferring funds abroad, with certain exceptions for transfers related to foreign trade and other authorized transactions approved by the Argentina Central Bank. The Argentina Central Bank may require prior authorization and may or may not grant such authorization for our Argentina subsidiaries to make dividends or loan payments to us. At
December 31, 2013
,
$19.5 million
, or
5%
, of our cash and cash equivalents was deposited with banks in Argentina. We expect to use these funds for the Argentina work program and operations in 2014.
At
December 31, 2013
, one of our subsidiaries had a credit facility with a syndicate of banks, led by Wells Fargo Bank National Association as administrative agent. This reserve-based facility has a current borrowing base of
$150 million
and a maximum borrowing base up to
$300 million
and is supported by the present value of the petroleum reserves of two of our subsidiaries with operating branches in Colombia and our subsidiary in Brazil. Amounts drawn down under the facility bear interest at the U.S. dollar LIBOR rate plus a margin ranging between
2.25%
and
3.25%
per annum depending on the rate of borrowing base utilization. In addition, a stand-by fee of
0.875%
per annum is charged on the unutilized balance of the committed borrowing base and is included in G&A expenses. The credit facility was entered into on August 30, 2013 and became effective on October 31, 2013 for a three-year term. Under the terms of the facility, we are required to maintain and were in compliance with certain financial and operating covenants. Under the terms of the credit facility, we cannot pay any dividends to our shareholders if we are in default under the facility and, if we are not in default, we are required to obtain bank approval for any dividend payments exceeding
$2.0 million
in any fiscal year. No amounts have been drawn on this facility.
Cash Flows
During the
year ended
December 31, 2013
, our cash and cash equivalents
increase
d by
$216.2 million
as a result of cash provided by operating activities of
$520.9 million
and cash provided by financing activities of
$3.8 million
, partially offset by cash used in investing activities of
$308.5 million
.
Cash
provided by
operating activities in the
year ended
December 31, 2013
, was primarily affected by increased oil and natural gas sales, decreased G&A expenses, lower realized foreign exchange losses and a
$167.9 million
change in assets and liabilities from operating activities. These increases were partially offset by increased operating and income tax expenses. The main changes in assets and liabilities from operating activities were as follows: accounts receivable and other long-term assets decreased by
$67.0 million
primarily due to a reduction in the number of days of sales outstanding in Colombia which resulted from a larger portion of sales in 2013 being to a customer with more favorable payment terms; inventory decreased by
$13.9 million
primarily due to the reduced oil inventory in the OTA pipeline and associated Ecopetrol operated facilities in the Putumayo Basin, and reduced oil inventory related to the timing of recognition of oil sales to a short-term customer in Colombia; accounts payable and accrued liabilities decreased by
$5.2 million
due to the timing of payments for drilling
80
activity; and net taxes payable increased by
$94.5 million
due to increased taxable income in Colombia and the reimbursement of value added tax receivable in Colombia.
Cash provided by operating activities of $156.3 million in the year ended December 31, 2012, was primarily affected by increased operating expenses and realized foreign exchange losses and a $167.4 million change in assets and liabilities from operating activities.The main changes in assets and liabilities from operating activities were as follows: accounts receivable and other long-term assets increased by $56.7 million due to the change in the timing of collection of Ecopetrol receivables, new customers in Colombia and increased oil and gas sales in Argentina; inventory increased by $18.2 million primarily due to a change in the sales point under new sales agreements with Ecopetrol and increased sales to other third parties with different sales points due to the timing of the transfer of risks in Colombia; accounts payable and accrued liabilities decreased by $8.4 million due to the payment of royalties and reduced royalties payable resulting from lower production, partially offset by increased operating cost and other payables as a result of increased activity in all business units; and taxes receivable and payable decreased by $83.7 million as a result of a decrease in taxes payable due to utilization of tax losses and tax deductions resulting from a corporate reorganization, and lower taxable income in Colombia, partially offset by an increase in taxes receivable due to value added tax and income tax recoveries in Colombia generated upon completion of the same corporate reorganization.
Cash provided by operating activities of $353.8 million in the year ended December 31, 2011, was positively affected by increased production and improved oil prices and a decrease in non-cash working capital. These positive contributions were partially offset by increased operating and G&A expenses to support expanded operations.
Cash outflows from investing activities in the
year ended
December 31, 2013
, included capital expenditures of
$367.3 million
(including changes in non-cash working capital related to investing activities) and an increase in restricted cash of
$0.8 million
and were partially offset by proceeds from oil and gas properties of
$59.6 million
. Cash outflows from investing activities in the year ended December 31, 2012, included capital expenditures of $276.1 million and cash paid for the 30% working interest acquisition in Brazil of $35.5 million, partially offset by a decrease in restricted cash of $11.9 million related to the same acquisition. Cash outflows from investing activities in the year ended December 31, 2011, included capital expenditures of $333.2 million and an increase in restricted cash of $10.2 million, partially offset by proceeds on sale of asset-backed commercial paper of $22.7 million, $7.7 million cash acquired through the Petrolifera acquisition and $4.5 million of proceeds from disposition of oil and gas properties.
Cash provided by financing activities in the years ended
December 31, 2013
,
2012
and
2011
related to proceeds from issuance of shares of our Common Stock upon the exercise of stock options.
Off-Balance Sheet Arrangements
As at
December 31, 2013
,
2012
and
2011
we had no off-balance sheet arrangements.
Contractual Obligations
The following is a schedule by year of purchase obligations, future minimum payments for firm agreements and leases that have initial or remaining non-cancellable lease terms in excess of one year as of
December 31, 2013
:
|
|
Year ending December 31
|
||||||||||||||||||||||||||
|
|
Total
|
2014
|
2015
|
2016
|
2017
|
2018
|
Thereafter
|
||||||||||||||||||||
|
(Thousands of U.S. Dollars)
|
|
|
|
|
|
||||||||||||||||||||||
|
Oil transportation services
|
$
|
52,339
|
|
$
|
23,261
|
|
$
|
10,635
|
|
$
|
3,812
|
|
$
|
3,812
|
|
$
|
3,812
|
|
$
|
7,007
|
|
||||||
|
Drilling and G&G
|
56,143
|
|
55,806
|
|
337
|
|
—
|
|
—
|
|
—
|
|
—
|
|
|||||||||||||
|
Completions
|
48,500
|
|
26,544
|
|
14,289
|
|
7,667
|
|
—
|
|
—
|
|
—
|
|
|||||||||||||
|
Facility construction
|
19,446
|
|
18,748
|
|
698
|
|
—
|
|
—
|
|
—
|
|
—
|
|
|||||||||||||
|
Operating leases
|
3,949
|
|
2,690
|
|
989
|
|
163
|
|
26
|
|
16
|
|
65
|
|
|||||||||||||
|
Software and telecommunication
|
1,992
|
|
1,824
|
|
137
|
|
31
|
|
—
|
|
—
|
|
—
|
|
|||||||||||||
|
Consulting
|
1,225
|
|
937
|
|
288
|
|
—
|
|
—
|
|
—
|
|
—
|
|
|||||||||||||
|
$
|
183,594
|
|
$
|
129,810
|
|
|
$
|
27,373
|
|
|
$
|
11,673
|
|
|
$
|
3,838
|
|
|
$
|
3,828
|
|
|
$
|
7,072
|
|
||
81
Total contractual obligations at
December 31, 2013
were
$183.6 million
(
December 31, 2012
-
$121.0 million
). The
increase
in
2013
was primarily due to drilling and completion commitments for the Chaza and Guayuyaco Blocks in Colombia, new transportation agreements in the Garibay, Chaza, and Llanos-22 Blocks in Colombia, and facilities commitments for Block 95 in Peru, partially offset by the amortization of transportation contracts in Colombia.
At
December 31, 2013
, we had provided promissory notes totaling
$52.5 million
as security for letters of credit relating to work commitment guarantees contained in exploration contracts and other capital or operating requirements.
Critical Accounting Policies and Estimates
The preparation of financial statements under GAAP requires management to make estimates, judgments and assumptions that affect the reported amounts of assets and liabilities as well as the revenues and expenses reported and disclosure of contingent liabilities. Changes in these estimates related to judgments and assumptions will occur as a result of changes in facts and circumstances or discovery of new information, and, accordingly, actual results could differ from amounts estimated.
On a regular basis we evaluate our estimates, judgments and assumptions. We also discuss our critical accounting policies and estimates with the Audit Committee of the Board of Directors.
Certain accounting estimates are considered to be critical if (a) the nature of the estimates and assumptions is material due to the level of subjectivity and judgment necessary to account for highly uncertain matters or the susceptibility of such matters to changes; and (b) the impact of the estimates and assumptions on financial condition or operating performance is material. The areas of accounting and the associated critical estimates and assumptions made are discussed below.
Full Cost Method of Accounting, Proved Reserves, DD&A and Impairments of Oil and Gas Properties
We follow the full cost method of accounting for our oil and natural gas properties in accordance with SEC Regulation S-X Rule 4-10, as described in Note 2 to our annual consolidated financial statements. Under the full cost method of accounting, all costs incurred in the acquisition, exploration and development of properties are capitalized, including internal costs directly attributable to these activities. The sum of net capitalized costs, including estimated asset retirement obligations ("ARO"), and estimated future development costs to be incurred in developing proved reserves are depleted using the unit-of-production method.
Companies that use the full cost method of accounting for oil and natural gas exploration and development activities are required to perform a ceiling test calculation. The ceiling test limits pooled costs to the aggregate of the discounted estimated after-tax future net revenues from proved oil and gas properties, plus the lower of cost or estimated fair value of unproved properties less any associated tax effects.
If our net book value of oil and gas properties, less related deferred income taxes, is in excess of the calculated ceiling, the excess must be written off as an expense. Any such write-down will reduce earnings in the period of occurrence and result in lower DD&A expenses in future periods. The ceiling limitation is imposed separately for each country in which we have oil and gas properties. An expense recorded in one period may not be reversed in a subsequent period even though higher oil and gas prices may have increased the ceiling applicable to the subsequent period.
Our estimates of proved oil and gas reserves are a major component of the depletion and full cost ceiling calculations. Additionally, our proved reserves represent the element of these calculations that require the most subjective judgments. Estimates of reserves are forecasts based on engineering data, projected future rates of production and the amount and timing of future expenditures. The process of estimating oil and natural gas reserves requires substantial judgment, resulting in imprecise determinations, particularly for new discoveries. Different reserve engineers may make different estimates of reserve quantities based on the same data.
We believe our assumptions are reasonable based on the information available to us at the time we prepare our estimates. However, these estimates may change substantially as additional data from ongoing development activities and production performance becomes available and as economic conditions impacting oil and gas prices and costs change.
Management is responsible for estimating the quantities of proved oil and natural gas reserves and for preparing related disclosures. Estimates and related disclosures are prepared in accordance with SEC requirements and generally accepted industry practices in the United States as prescribed by the Society of Petroleum Engineers. Reserve estimates are evaluated at least annually by independent qualified reserves consultants.
82
While the quantities of proved reserves require substantial judgment, the associated prices of oil and natural gas, and the applicable discount rate, that are used to calculate the discounted present value of the reserves do not require judgment. The ceiling calculation dictates that a 10% discount factor be used and future net revenues are calculated using prices that represent the average of the first day of each month price for the 12-month period. Therefore, the future net revenues associated with the estimated proved reserves are not based on our assessment of future prices or costs, but reflect adjustments for gravity, quality, local conditions, gathering and transportation fees and distance from market. Estimates of standardized measure of our future cash flows from proved reserves for our
December 31, 2013
, ceiling tests were based on wellhead prices per BOE as of the first day of each month within that twelve month period of
$96.49
for Colombia,
$65.46
for Argentina and
$90.70
for Brazil.
Because the ceiling calculation dictates the use of prices that are not representative of future prices and requires a 10% discount factor, the resulting value should not be construed as the current market value of the estimated oil and gas reserves attributable to our properties. Historical oil and gas prices for any particular 12-month period, can be either higher or lower than our price forecast. Therefore, oil and gas property writedowns that result from applying the full cost ceiling limitation, and that are caused by fluctuations in price as opposed to reductions to the underlying quantities of reserves, should not be viewed as absolute indicators of a reduction of the ultimate value of the related reserves.
Our Reserves Committee oversees the annual review of our oil and gas reserves and related disclosures. The Board meets with management periodically to review the reserves process, results and related disclosures and appoints and meets with the independent reserves consultants to review the scope of their work, whether they have had access to sufficient information, the nature and satisfactory resolution of any material differences of opinion, and in the case of the independent reserves consultants, their independence.
At June 30, 2013, we recorded a ceiling test impairment loss of
$2.0 million
in our Brazil cost center related to lower realized prices and an increase in estimate of operating costs. We assessed our oil and gas properties for impairment as at
December 31, 2013
, and found no further impairment write-down was required based on our calculations for our Colombia, Brazil and Peru cost centers. As a result of assessing oil and gas properties in our Argentina cost center, a ceiling test impairment loss of
$30.8 million
was recorded. The 2013 impairment charge in the Argentina cost center was a result of deferred investment and inconclusive waterflood results in the Puesto Morales field.
At March 31, 2012, we recorded a ceiling test impairment loss of
$20.2 million
in our Brazil cost center related to seismic and drilling costs on Block BM-CAL-10. We assessed our oil and gas properties for impairment as at December 31, 2011, and found no impairment write-down was required based on our calculations for our Colombia and Brazil cost centers. As a result of assessing oil and gas properties in our Peru and Argentina cost centers, ceiling test impairment losses of
$42.0 million
and
$25.7 million
respectively were recorded. The 2011 impairment charge in the Peru cost center related to drilling costs on a dry well and seismic costs on blocks which were relinquished. The 2011 impairment charge in the Argentina cost center related to an increase in estimated future operating and capital costs to produce our remaining Argentina proved reserves and a decrease in reserve volumes.
Because of the volatile nature of oil and gas prices, it is not possible to predict the timing or magnitude of full cost writedowns. In addition, due to the inter-relationship of the various judgments made to estimate proved reserves, it is impractical to provide a quantitative analysis of the effects of potential changes in these estimates. However, decreases in estimates of proved reserves would generally increase our depletion rate and, thus, our DD&A expense. Decreases in our proved reserves may result from lower market prices, which may make it uneconomic to drill for and produce higher cost fields. The decline in proved reserve estimates may impact the outcome of the full cost ceiling test previously discussed. In addition, increases in costs required to develop our reserves would increase the rate at which we record DD&A expenses.
Unproved properties
Unproved properties are not depleted pending the determination of the existence of proved reserves. Costs are transferred into the amortization base on an ongoing basis as the properties are evaluated and proved reserves are established or impairment is determined. Unproved properties are evaluated quarterly to ascertain whether impairment has occurred. Unproved properties, the costs of which are individually significant, are assessed individually by considering seismic data, plans or requirements to relinquish acreage, drilling results and activity, remaining time in the commitment period, remaining capital plans, and political, economic, and market conditions. Where it is not practicable to individually assess the amount of impairment of properties for which costs are not individually significant, these properties are grouped for purposes of assessing impairment. During any period in which factors indicate an impairment, the cumulative costs incurred to date for such property are transferred to the full cost pool and are then subject to amortization. The transfer of costs into the amortization base involves a significant amount of judgment and may be subject to changes over time based on our drilling plans and results, G&G
83
evaluations, the assignment of proved reserves, availability of capital, and other factors. For countries where a reserve base has not yet been established, the impairment is charged to earnings.
Asset Retirement Obligations
We are required to remove or remedy the effect of our activities on the environment at our present and former operating sites by dismantling and removing production facilities and remediating any damage caused. Estimating our future ARO requires us to make estimates and judgments with respect to activities that will occur many years into the future. In addition, the ultimate financial impact of environmental laws and regulations is not always clearly known and cannot be reasonably estimated as standards evolve in the countries in which we operate.
We record ARO in our consolidated financial statements by discounting the present value of the estimated retirement obligations associated with our oil and gas wells and facilities. In arriving at amounts recorded, we make numerous assumptions and judgments with respect to the existence of a legal obligation for an ARO, estimated probabilities, amounts and timing of settlements, inflation factors, credit-adjusted risk-free discount rates and changes in legal, regulatory, environmental and political environments. Because costs typically extend many years into the future, estimating future costs is difficult and requires management to make judgments that are subject to future revisions based upon numerous factors, including changing technology and the political and regulatory environment. In periods subsequent to initial measurement of the ARO, we must recognize period-to-period changes in the liability resulting from the passage of time and revisions to either the timing or the amount of the original estimate of undiscounted cash flows. Increases in the ARO liability due to passage of time impact net income as accretion expense. The related capitalized costs, including revisions thereto, are charged to expense through DD&A.
It is difficult to determine the impact of a change in any one of our assumptions. As a result, we are unable to provide a reasonable sensitivity analysis of the impact a change in our assumptions would have on our financial results.
Allocation of Consideration Transferred in Business Combinations
The acquisition of properties in Brazil in 2012 and the acquisition of Petrolifera in 2011 were both accounted for using the acquisition method, with Gran Tierra being the acquirer, whereby the assets acquired and liabilities assumed were recorded at their fair values at the acquisition date. For the 2012 acquisition, the fair value of the consideration transferred was equal to the fair value of the net assets acquired and no gain or goodwill was recorded on acquisition. For the 2011 acquisition, the excess of the fair values of the net assets acquired over the consideration transferred recorded as a gain on acquisition. Calculation of fair values of assets and liabilities, which was done with the assistance of independent advisors, was subject to estimates which include various assumptions including the fair value of proved and unproved reserves of the assets acquired as well as future production and development costs and future oil and gas prices.
While these estimates of fair value for the various assets acquired and liabilities assumed have no effect on our liquidity or capital resources, they can have an effect on the future results of operations. Generally, the higher the fair value assigned to both oil and gas properties and non-oil and gas properties, the lower future net income will be as a result of higher future DD&A expenses. Also, a higher fair value assigned to the oil and gas properties, based on higher future estimates of oil and gas prices, will increase the likelihood of a full cost ceiling write down in the event that future oil and gas prices drop below the price forecast used to originally determine fair value.
Goodwill
Goodwill represents the excess of the aggregate of the consideration transferred over net identifiable assets acquired and liabilities assumed. The goodwill on our balance sheet resulted from the Solana Resources Limited and Argosy Energy International L.P. acquisitions, in 2008 and 2006 respectively, and relates entirely to the Colombia reporting unit.
At each reporting date, we assess qualitative factors to determine whether it is more likely than not that the fair value of the reporting unit is less than its carrying amount and whether it is necessary to perform the two-step goodwill impairment test. Changes in our future cash flows, operating results, growth rates, capital expenditures, cost of capital, discount rates, stock price or related market capitalization, could affect the results of our annual goodwill assessment and, accordingly, potentially lead to future goodwill impairment charges.
84
The two-step goodwill impairment test would require a comparison of the fair value of each reporting unit to the net book value of the reporting unit. If the estimated fair value of the reporting unit is less than the net book value, including goodwill, we would write down the goodwill to the implied fair value of the goodwill through a charge to expense. The most significant judgments involved in estimating the fair values of our reporting units would relate to the valuation of our property and equipment. A lower goodwill value decreases the likelihood of an impairment charge. Unfavorable changes in reserves or in our price forecast would increase the likelihood of a goodwill impairment charge. A goodwill impairment charge would have no effect on liquidity or capital resources. However, it would adversely affect our results of operations in that period.
Income Taxes
We follow the liability method of accounting for income taxes whereby we recognize deferred income tax assets and liabilities for the future tax consequences attributable to differences between the financial statement carrying amounts of assets and liabilities and their respective tax bases. Deferred tax assets are also recognized for the future tax benefits attributable to the expected utilization of existing tax net operating loss carryforwards and other types of carryforwards. Deferred tax assets and liabilities are measured using enacted tax rates expected to apply to taxable income in the years in which those temporary differences and carryforwards are expected to be recovered or settled. The effect on deferred tax assets and liabilities of a change in tax rates is recognized in income in the period that includes the enactment date.
We carry on business in several countries and as a result, we are subject to income taxes in numerous jurisdictions. The determination of our income tax provision is inherently complex and we are required to interpret continually changing regulations and make certain judgments. While income tax filings are subject to audits and reassessments, we believe we have made adequate provision for all income tax obligations. However, changes in facts and circumstances as a result of income tax audits, reassessments, jurisprudence and any new legislation may result in an increase or decrease in our provision for income taxes.
To assess the realization of deferred tax assets, management considers whether it is more likely than not that some portion or all of the deferred tax assets will not be realized. The ultimate realization of deferred tax assets is dependent upon the generation of future taxable income during the periods in which those temporary differences become deductible. We consider the scheduled reversal of deferred tax liabilities, projected future taxable income and tax planning strategies in making this assessment.
Our effective tax rate is based on pre-tax income and the tax rates applicable to that income in the various jurisdictions in which we operate. An estimated effective tax rate for the year is applied to our quarterly operating results. In the event that there is a significant unusual or discrete item recognized, or expected to be recognized, in our quarterly operating results, the tax attributable to that item would be separately calculated and recorded at the same time as the unusual or discrete item. We consider the resolution of prior-year tax matters to be such items. Significant judgment is required in determining our effective tax rate and in evaluating our tax positions. We establish reserves when it is more likely than not that we will not realize the full tax benefit of the position. We adjust these reserves in light of changing facts and circumstances.
We routinely assess potential uncertain tax positions and, if required, estimate and establish accruals for such amounts.
Legal and Other Contingencies
A provision for legal and other contingencies is charged to expense when the loss is probable and the cost can be reasonably estimated. Determining when expenses should be recorded for these contingencies and the appropriate amounts for accrual is a complex estimation process that includes the subjective judgment of management. In many cases, management’s judgment is based on interpretation of laws and regulations, which can be interpreted differently by regulators and/or courts of law. Management closely monitors known and potential legal and other contingencies and periodically determines when we should record losses for these items based on information available to us.
Stock-Based Compensation
Our stock-based compensation cost is measured based on the fair value of the award on the grant date. The compensation cost is recognized net of estimated forfeitures over the requisite service period. GAAP requires forfeitures to be estimated at the time of grant and revised, if necessary, in subsequent periods if actual forfeitures differ from those estimates.
We utilize the Black-Scholes option pricing model to measure the fair value of all of our stock options. The use of such models requires substantial judgment with respect to expected life, volatility, expected returns and other factors. Expected volatility is based on the historical volatility of our shares. We use historical experience for exercises to determine expected life. We are responsible for determining the assumptions used in estimating the fair value of our share based payment awards.
85
New Accounting Pronouncements
We have reviewed all recently issued, but not yet adopted, accounting standard updates in order to determine their effects, if any, on our consolidated financial statements. Based on that review, we believe that the implementation of these standards will not materially impact our consolidated financial position, operating results, cash flows, or disclosure requirements.
Item 7A.
Quantitative and Qualitative Disclosures About Market Risk
Our principal market risk relates to oil prices. Most of our revenues are from oil sales at prices which reflect the blended prices received upon shipment by the purchaser at defined sales points or are defined by contract relative to West Texas Intermediate ("WTI") or Brent and adjusted for quality each month. In Argentina, a further discount factor which is related to a tax on oil exports establishes a common pricing mechanism for all oil produced in the country, regardless of its destination.
Foreign currency risk is a factor for our company but is ameliorated to a large degree by the nature of expenditures and revenues in the countries where we operate. During 2013, we did not engage in any formal hedging activity with regard to foreign currency risk. Subsequent to year end, we have purchased non-deliverable forward contracts for purposes of fixing the exchange rate at which we will purchase Colombian Pesos to settle our income tax installment payments due in April and June 2014. Our reporting currency is U.S. dollars and essentially 100% of our revenues are related to the U.S. dollar price of WTI or Brent oil.
In Colombia, we receive 100% of our revenues in U.S. dollars and the majority of our capital expenditures are in U.S. dollars or are based on U.S. dollar prices. In Argentina and Brazil, prices for oil are in U.S. dollars, but revenues are received in local currency translated according to current exchange rates. The majority of our capital expenditures within Argentina and Brazil are based on U.S. dollar prices, but are paid in local currency translated according to current exchange rates. The majority of our capital expenditures in Peru are in U.S. dollars. The majority of income and value added taxes and G&A expenses in all locations are in local currency. While we operate in South America exclusively, the majority of our acquisition expenditures have been valued and paid in U.S. dollars.
Additionally, foreign exchange gains and losses result primarily from the fluctuation of the U.S. dollar to the Colombian peso due to our current and deferred tax liabilities, which are monetary liabilities, denominated in the local currency of the Colombian foreign operations. As a result, a foreign exchange gain or loss must be calculated on conversion to the U.S. dollar functional currency. A strengthening in the Colombian peso against the U.S. dollar results in foreign exchange losses, estimated at
$90,000
for each one peso decrease in the exchange rate of the Colombian peso to one U.S. dollar. For the
year ended December 31, 2013
, our realized foreign exchange loss was
$6.7 million
(
2012
-
$17.1 million
). In 2013, the realized foreign exchange loss primarily related to foreign exchange losses on the net monetary assets in Argentina during the period. The Argentina Peso
weakened
by
33%
and
14%
against the U.S. dollar in the
year ended December 31, 2013
, and 2012, respectively. In 2012, the realized foreign exchange loss primarily arose upon payment of the 2011 Colombian income tax liability during the second quarter of 2012.
We consider our exposure to interest rate risk to be immaterial. Our interest rate exposures primarily relate to our investment portfolio. Our investment objectives are focused on preservation of principal and liquidity. By policy, we manage our exposure to market risks by limiting investments to high quality bank issues at overnight rates, or U.S. or Canadian government-backed federal, provincial or state securities or other money market instruments with high credit ratings and short-term liquidity. A 10% change in interest rates would not have a material effect on the value of our investment portfolio. We do not hold any of these investments for trading purposes. We do not hold equity investments, and we have no debt.
86
Item 8.
Financial Statements and Supplementary Data
Report of Independent Registered Public Accounting Firm
To the Board of Directors and Shareholders of Gran Tierra Energy Inc.
We have audited the accompanying consolidated financial statements of Gran Tierra Energy Inc. and subsidiaries (the "Company"), which comprise the consolidated balance sheets as at
December 31, 2013
and
2012
, and the consolidated statements of operations and retained earnings, consolidated statements of shareholders' equity and consolidated statements of cash flows for each of the years in the three-year period ended
December 31, 2013
, and a summary of significant accounting policies and other exploratory information.
Management's Responsibility for the Consolidated Financial Statements
Management is responsible for the preparation and fair presentation of these consolidated financial statements in accordance with accounting principles generally accepted in the United States of America, and for such internal control as management determines is necessary to enable the preparation of consolidated financial statements that are free from material misstatement, whether due to fraud or error.
Auditor's Responsibility
Our responsibility is to express an opinion on these consolidated financial statements based on our audits. We conducted our audits in accordance with Canadian generally accepted auditing standards and the standards of the Public Company Accounting Oversight Board (United States). Those standards require that we comply with ethical requirements and plan and perform the audit to obtain reasonable assurance about whether the consolidated financial statements are free from material misstatement.
An audit involves performing procedures to obtain audit evidence about the amounts and disclosures in the consolidated financial statements. The procedures selected depend on the auditor's judgment, including the assessment of the risks of material misstatement of the consolidated financial statements, whether due to fraud or error. In making those risk assessments, the auditor considers internal control relevant to the entity's preparation and fair presentation of the consolidated financial statements in order to design audit procedures that are appropriate in the circumstances. An audit also includes evaluating the appropriateness of accounting policies used and the reasonableness of accounting estimates made by management, as well as evaluating the overall presentation of the consolidated financial statements.
We believe that the audit evidence we have obtained in our audits is sufficient and appropriate to provide a basis for our audit opinion.
Opinion
In our opinion, the consolidated financial statements present fairly, in all material respects, the financial position of Gran Tierra Energy Inc. and subsidiaries as at
December 31, 2013
and December 31,
2012
, and the results of their operations and their cash flows for each of the years in the three-year period ended
December 31, 2013
in accordance with the accounting principles generally accepted in the United States of America.
Other Matter
We have also audited, in accordance with the standards of the Public Company Accounting Oversight Board (United States),
the Company's internal control over financial reporting as of
December 31, 2013
, based on the criteria established in
Internal Control—Integrated Framework
(1992)
issued by the Committee of Sponsoring Organizations of the Treadway Commission and our report dated
February 25, 2014
expressed an unqualified opinion on the Company’s internal control over financial reporting.
/s/ Deloitte LLP
Chartered Accountants
February 25, 2014
Calgary, Canada
87
Gran Tierra Energy Inc.
(Thousands of U.S. Dollars, Except Share and Per Share Amounts)
|
|
Year Ended December 31,
|
|||||||||||
|
|
2013
|
2012
|
2011
|
|||||||||
|
REVENUE AND OTHER INCOME
|
||||||||||||
|
Oil and natural gas sales
|
$
|
720,450
|
|
$
|
583,109
|
|
$
|
596,191
|
|
|||
|
Interest income
|
3,193
|
|
2,078
|
|
1,216
|
|
||||||
|
|
723,643
|
|
585,187
|
|
597,407
|
|
||||||
|
EXPENSES
|
||||||||||||
|
Operating
|
149,059
|
|
124,903
|
|
86,497
|
|
||||||
|
Depletion, depreciation, accretion and impairment
|
267,146
|
|
182,037
|
|
231,235
|
|
||||||
|
General and administrative
|
53,400
|
|
58,882
|
|
60,389
|
|
||||||
|
Other gain (Note 9)
|
—
|
|
(9,336
|
)
|
—
|
|
||||||
|
Other loss (Notes 11 and 12)
|
4,400
|
|
—
|
|
—
|
|
||||||
|
Equity tax (Note 9)
|
—
|
|
—
|
|
8,271
|
|
||||||
|
Financial instruments gain (Note 3)
|
—
|
|
—
|
|
(1,522
|
)
|
||||||
|
Gain on acquisition (Note 3)
|
—
|
|
—
|
|
(21,699
|
)
|
||||||
|
Foreign exchange (gain) loss
|
(12,198
|
)
|
31,338
|
|
(11
|
)
|
||||||
|
|
461,807
|
|
387,824
|
|
363,160
|
|
||||||
|
INCOME BEFORE INCOME TAXES
|
261,836
|
|
197,363
|
|
234,247
|
|
||||||
|
Income tax expense (Note 9)
|
(135,548
|
)
|
(97,704
|
)
|
(107,330
|
)
|
||||||
|
NET INCOME AND COMPREHENSIVE INCOME
|
126,288
|
|
99,659
|
|
126,917
|
|
||||||
|
RETAINED EARNINGS, BEGINNING OF YEAR
|
284,673
|
|
185,014
|
|
58,097
|
|
||||||
|
RETAINED EARNINGS, END OF YEAR
|
$
|
410,961
|
|
$
|
284,673
|
|
$
|
185,014
|
|
|||
|
NET INCOME PER SHARE — BASIC
|
|
$
|
0.45
|
|
|
$
|
0.35
|
|
$
|
0.46
|
|
|
|
NET INCOME PER SHARE — DILUTED
|
|
$
|
0.44
|
|
|
$
|
0.35
|
|
$
|
0.45
|
|
|
|
WEIGHTED AVERAGE SHARES OUTSTANDING - BASIC (Note 7)
|
282,808,497
|
|
280,741,255
|
|
273,491,564
|
|
||||||
|
WEIGHTED AVERAGE SHARES OUTSTANDING - DILUTED (Note 7)
|
286,127,897
|
|
284,172,254
|
|
281,287,002
|
|
||||||
(See notes to the consolidated financial statements)
88
Gran Tierra Energy Inc.
(Thousands of U.S. Dollars, Except Share and Per Share Amounts)
|
|
As at December 31,
|
||||||
|
|
2013
|
2012
|
|||||
|
ASSETS
|
|
|
|||||
|
Current Assets
|
|
|
|||||
|
Cash and cash equivalents
|
$
|
428,800
|
|
$
|
212,624
|
|
|
|
Restricted cash
|
1,478
|
|
1,404
|
|
|||
|
Accounts receivable (Note 5)
|
49,703
|
|
119,844
|
|
|||
|
Inventory (Note 5)
|
13,725
|
|
33,468
|
|
|||
|
Taxes receivable
|
9,980
|
|
39,922
|
|
|||
|
Prepaids
|
6,450
|
|
4,074
|
|
|||
|
Deferred tax assets (Note 9)
|
2,256
|
|
2,517
|
|
|||
|
Total Current Assets
|
512,392
|
|
413,853
|
|
|||
|
Oil and Gas Properties (using the full cost method of accounting)
|
|
|
|
|
|||
|
Proved
|
794,069
|
|
813,247
|
|
|||
|
Unproved
|
456,001
|
|
383,414
|
|
|||
|
Total Oil and Gas Properties
|
1,250,070
|
|
1,196,661
|
|
|||
|
Other capital assets
|
10,102
|
|
8,765
|
|
|||
|
Total Property, Plant and Equipment (Note 6)
|
1,260,172
|
|
1,205,426
|
|
|||
|
Other Long-Term Assets
|
|
|
|
|
|||
|
Restricted cash
|
2,300
|
|
1,619
|
|
|||
|
Deferred tax assets (Note 9)
|
1,407
|
|
1,401
|
|
|||
|
Taxes receivable
|
18,535
|
|
1,374
|
|
|||
|
Other long-term assets
|
7,163
|
|
6,621
|
|
|||
|
Goodwill (Note 2)
|
102,581
|
|
102,581
|
|
|||
|
Total Other Long-Term Assets
|
131,986
|
|
113,596
|
|
|||
|
Total Assets
|
$
|
1,904,550
|
|
$
|
1,732,875
|
|
|
|
LIABILITIES AND SHAREHOLDERS’ EQUITY
|
|
|
|
|
|||
|
Current Liabilities
|
|
|
|
|
|||
|
Accounts payable (Note 10)
|
$
|
72,400
|
|
$
|
102,263
|
|
|
|
Accrued liabilities (Note 10)
|
89,567
|
|
66,418
|
|
|||
|
Taxes payable
|
102,887
|
|
22,339
|
|
|||
|
Deferred tax liabilities (Note 9)
|
1,193
|
|
337
|
|
|||
|
Asset retirement obligation (Note 8)
|
518
|
|
28
|
|
|||
|
Total Current Liabilities
|
266,565
|
|
191,385
|
|
|||
|
Long-Term Liabilities
|
|
|
|
|
|||
|
Deferred tax liabilities (Note 9)
|
177,082
|
|
225,195
|
|
|||
|
Equity tax payable
|
—
|
|
3,562
|
|
|||
|
Asset retirement obligation (Note 8)
|
21,455
|
|
18,264
|
|
|||
|
Other long-term liabilities
|
9,540
|
|
3,038
|
|
|||
|
Total Long-Term Liabilities
|
208,077
|
|
250,059
|
|
|||
|
Commitments and Contingencies (Note 11)
|
|
|
|
|
|||
|
Shareholders’ Equity
|
|
|
|
|
|||
|
Common Stock (Note 7) (272,327,810 and 268,482,445 shares of Common Stock and 10,882,440 and 13,421,488 exchangeable shares, par value $0.001 per share, issued and outstanding as at December 31, 2013 and December 31, 2012, respectively)
|
10,187
|
|
7,986
|
|
|||
|
Additional paid in capital
|
1,008,760
|
|
998,772
|
|
|||
|
Retained earnings
|
410,961
|
|
284,673
|
|
|||
|
Total Shareholders’ Equity
|
1,429,908
|
|
1,291,431
|
|
|||
|
Total Liabilities and Shareholders’ Equity
|
$
|
1,904,550
|
|
$
|
1,732,875
|
|
|
(See notes to the consolidated financial statements)
89
Gran Tierra Energy Inc.
(Thousands of U.S. Dollars)
|
|
Year Ended December 31,
|
||||||||||
|
|
2013
|
2012
|
2011
|
||||||||
|
Operating Activities
|
|
|
|||||||||
|
Net income
|
$
|
126,288
|
|
$
|
99,659
|
|
$
|
126,917
|
|
||
|
Adjustments to reconcile net income to net cash provided by operating activities:
|
|
|
|||||||||
|
Depletion, depreciation, accretion and impairment
|
267,146
|
|
182,037
|
|
231,235
|
|
|||||
|
Deferred tax (recovery) expense (Note 9)
|
(29,499
|
)
|
26,274
|
|
(28,685
|
)
|
|||||
|
Stock-based compensation (Note 7)
|
8,918
|
|
12,006
|
|
12,767
|
|
|||||
|
Unrealized gain on financial instruments (Note 3)
|
—
|
|
—
|
|
(1,354
|
)
|
|||||
|
Unrealized foreign exchange (gain) loss
|
(18,911
|
)
|
17,054
|
|
(2,232
|
)
|
|||||
|
Cash settlement of asset retirement obligation (Note 8)
|
(2,068
|
)
|
(404
|
)
|
(345
|
)
|
|||||
|
Other gain (Note 9)
|
—
|
|
(9,336
|
)
|
—
|
|
|||||
|
Other loss (Notes 11 and 12)
|
4,400
|
|
—
|
|
—
|
|
|||||
|
Equity tax
|
(3,345
|
)
|
(3,534
|
)
|
2,442
|
|
|||||
|
Gain on acquisition (Note 3)
|
—
|
|
—
|
|
(21,699
|
)
|
|||||
|
Net change in assets and liabilities from operating activities
|
|
|
|
|
|||||||
|
Accounts receivable and other long-term assets
|
67,034
|
|
(56,669
|
)
|
(15,627
|
)
|
|||||
|
Inventory
|
13,947
|
|
(18,195
|
)
|
(548
|
)
|
|||||
|
Prepaids
|
(2,375
|
)
|
(477
|
)
|
(1,321
|
)
|
|||||
|
Accounts payable and accrued and other liabilities
|
(5,170
|
)
|
(8,387
|
)
|
16,780
|
|
|||||
|
Taxes receivable and payable
|
94,496
|
|
(83,709
|
)
|
35,422
|
|
|||||
|
Net cash provided by operating activities
|
520,861
|
|
156,319
|
|
353,752
|
|
|||||
|
Investing Activities
|
|
|
|
|
|||||||
|
(Increase) decrease in restricted cash
|
(755
|
)
|
11,859
|
|
(10,197
|
)
|
|||||
|
Additions to property, plant and equipment
|
(367,322
|
)
|
(276,084
|
)
|
(333,194
|
)
|
|||||
|
Proceeds from oil and gas properties (Note 6)
|
59,621
|
|
—
|
|
4,450
|
|
|||||
|
Cash paid for acquisition (Note 3)
|
—
|
|
(35,495
|
)
|
—
|
|
|||||
|
Cash acquired on acquisition (Note 3)
|
—
|
|
—
|
|
7,747
|
|
|||||
|
Proceeds on sale of asset-backed commercial paper (Note 3)
|
—
|
|
—
|
|
22,679
|
|
|||||
|
Net cash used in investing activities
|
(308,456
|
)
|
(299,720
|
)
|
(308,515
|
)
|
|||||
|
Financing Activities
|
|
|
|
|
|||||||
|
Settlement of bank debt (Note 3)
|
—
|
|
—
|
|
(54,103
|
)
|
|||||
|
Proceeds from issuance of shares of Common Stock
|
3,771
|
|
4,340
|
|
5,123
|
|
|||||
|
Net cash provided by (used in) financing activities
|
3,771
|
|
4,340
|
|
(48,980
|
)
|
|||||
|
Net increase (decrease) in cash and cash equivalents
|
216,176
|
|
(139,061
|
)
|
(3,743
|
)
|
|||||
|
Cash and cash equivalents, beginning of year
|
212,624
|
|
351,685
|
|
355,428
|
|
|||||
|
Cash and cash equivalents, end of year
|
$
|
428,800
|
|
$
|
212,624
|
|
$
|
351,685
|
|
||
|
Cash
|
$
|
408,568
|
|
$
|
207,392
|
|
$
|
172,645
|
|
||
|
Term deposits
|
20,232
|
|
5,232
|
|
179,040
|
|
|||||
|
Cash and cash equivalents, end of year
|
$
|
428,800
|
|
$
|
212,624
|
|
$
|
351,685
|
|
||
|
Supplemental cash flow disclosures:
|
|
|
|
|
|||||||
|
Cash paid for interest (Note 3)
|
$
|
—
|
|
$
|
—
|
|
$
|
1,604
|
|
||
|
Cash paid for income taxes
|
$
|
51,183
|
|
$
|
143,498
|
|
$
|
67,053
|
|
||
|
Non-cash investing activities:
|
|
|
|
|
|||||||
|
Non-cash net assets and liabilities related to property, plant and equipment, end of year
|
$
|
75,580
|
|
$
|
75,393
|
|
$
|
43,333
|
|
||
(See notes to the consolidated financial statements)
90
Gran Tierra Energy Inc.
Consolidated Statements of Shareholders’ Equity
(Thousands of U.S. Dollars)
|
|
Year Ended December 31,
|
||||||||||
|
|
2013
|
2012
|
2011
|
||||||||
|
Share Capital
|
|
|
|||||||||
|
Balance, beginning of year
|
$
|
7,986
|
|
$
|
7,510
|
|
$
|
4,797
|
|
||
|
Issue of shares of Common Stock
|
2,201
|
|
476
|
|
2,713
|
|
|||||
|
Balance, end of year
|
10,187
|
|
7,986
|
|
7,510
|
|
|||||
|
Additional Paid in Capital
|
|
|
|
|
|||||||
|
Balance, beginning of year
|
998,772
|
|
980,014
|
|
821,781
|
|
|||||
|
Issue of shares of Common Stock
|
—
|
|
2,902
|
|
142,109
|
|
|||||
|
Exercise of warrants (Note 7)
|
—
|
|
1,590
|
|
411
|
|
|||||
|
Expiry of warrants (Note 7)
|
—
|
|
190
|
|
—
|
|
|||||
|
Exercise of stock options (Note 7)
|
1,570
|
|
960
|
|
1,990
|
|
|||||
|
Stock-based compensation (Note 7)
|
8,418
|
|
13,116
|
|
13,723
|
|
|||||
|
Balance, end of year
|
1,008,760
|
|
998,772
|
|
980,014
|
|
|||||
|
Warrants
|
|
|
|
|
|||||||
|
Balance, beginning of year
|
—
|
|
1,780
|
|
2,191
|
|
|||||
|
Exercise of warrants (Note 7)
|
—
|
|
(1,590
|
)
|
(411
|
)
|
|||||
|
Expiry of warrants (Note 7)
|
—
|
|
(190
|
)
|
—
|
|
|||||
|
Balance, end of year
|
—
|
|
—
|
|
1,780
|
|
|||||
|
Retained Earnings
|
|
|
|
|
|||||||
|
Balance, beginning of year
|
284,673
|
|
185,014
|
|
58,097
|
|
|||||
|
Net income
|
126,288
|
|
99,659
|
|
126,917
|
|
|||||
|
Balance, end of year
|
410,961
|
|
284,673
|
|
185,014
|
|
|||||
|
Total Shareholders’ Equity
|
$
|
1,429,908
|
|
$
|
1,291,431
|
|
$
|
1,174,318
|
|
||
(See notes to the consolidated financial statements)
91
Gran Tierra Energy Inc.
Notes to the Consolidated Financial Statements
For the Years Ended December 31, 2013, 2012 and 2011
(Expressed in U.S. Dollars, unless otherwise indicated)
1. Description of Business
Gran Tierra Energy Inc., a Nevada corporation (the “Company” or “Gran Tierra”), is a publicly traded oil and gas company engaged in the acquisition, exploration, development and production of oil and natural gas properties. The Company’s principal business activities are in Colombia, Argentina, Peru and Brazil.
2. Significant Accounting Policies
The consolidated financial statements have been prepared in accordance with generally accepted accounting principles in the United States of America (“GAAP”). The Company believes that the information and disclosures presented are adequate to ensure the information presented is not misleading.
Significant accounting policies are:
Basis of consolidation
These consolidated financial statements include the accounts of the Company and its wholly-owned subsidiaries. All intercompany accounts and transactions have been eliminated.
Use of estimates
The preparation of financial statements in conformity with GAAP requires management to make estimates and assumptions that affect the reported amounts of assets and liabilities and disclosure of contingent assets and liabilities at the date of the consolidated financial statements and the reported amounts of revenues and expenses during the reporting period. Significant estimates made by management include: oil and natural gas reserves and related present value of future cash flows; depreciation, depletion, amortization and impairment (“DD&A”); impairment assessments of goodwill; timing of transfers from oil and gas properties not subject to depletion to the depletable base; asset retirement obligations; determining the value of the consideration transferred and the net identifiable assets acquired and liabilities assumed in connection with business combinations and determining goodwill; income taxes; legal and other contingencies; and stock-based compensation. Although management believes these estimates are reasonable, changes in facts and circumstances or discovery of new information may result in revised estimates, and actual results may differ from these estimates.
Cash and cash equivalents
The Company considers all highly liquid investments with an original maturity of three months or less to be cash equivalents.
Restricted cash
Restricted cash comprises cash and cash equivalents pledged to secure letters of credit and to settle asset retirement obligations. Letters of credit currently secured by cash relate to work commitment guarantees contained in exploration contracts. Cash and claims to cash that are restricted as to withdrawal or use for other than current operations or are designated for expenditure in the acquisition or construction of long-term assets are excluded from the current asset classification.
Allowance for doubtful accounts
The Company estimates losses on receivables based on known uncollectible accounts, if any, and historical experience of losses incurred and accrues a reserve on a receivable when, based on the judgment of management, it is probable that a receivable will not be collected and the amount of the reserve may be reasonably estimated. The allowance for doubtful receivables was
nil
at
December 31, 2013
, and
2012
.
92
Inventory
Inventory consists of oil in tanks and third party pipelines, and supplies and is valued at the lower of cost or market value. The cost of inventory is determined using the weighted average method. Oil inventories include expenditures incurred to produce, upgrade and transport the product to the storage facilities and include operating, depletion and depreciation expenses and cash royalties.
Income taxes
Income taxes are recognized using the liability method, whereby deferred tax assets and liabilities are recognized for the future tax consequences attributable to differences between the consolidated financial statement carrying amounts of existing assets and liabilities and their respective tax base, and operating loss and tax credit carry forwards. Deferred tax assets and liabilities are measured using enacted tax rates expected to apply to taxable income in the years in which those temporary differences and carryforwards are expected to be recovered or settled. Valuation allowances are provided if, after considering available evidence, it is not more likely than not that some or all of the deferred tax assets will be realized.
The tax benefit from an uncertain tax position is recognized when it is more likely than not, based on the technical merits of the position, that the position will be sustained on examination by the taxing authorities. Additionally, the amount of the tax benefit recognized is the largest amount of benefit that has a greater than 50% likelihood of being realized upon ultimate settlement. In evaluating whether a tax position has met the more-likely-than-not recognition threshold, the Company presumes that the position will be examined by the appropriate taxing authority that has full knowledge of all relevant information. The Company recognizes potential penalties and interest related to unrecognized tax benefits as a component of income tax expense.
Oil and gas properties
The Company uses the full cost method of accounting for its investment in oil and natural gas properties as defined by the Securities and Exchange Commission (“SEC”). Under this method, the Company capitalizes all acquisition, exploration and development costs incurred for the purpose of finding oil and natural gas reserves, including salaries, benefits and other internal costs directly attributable to these activities. Costs associated with production and general corporate activities; however, are expensed as incurred. Interest costs related to unproved properties and properties under development are also capitalized to oil and natural gas properties. Separate cost centers are maintained for each country in which the Company incurs costs.
The Company computes depletion of oil and natural gas properties on a quarterly basis using the unit-of-production method based upon production and estimates of proved reserve quantities. Future development costs related to properties with proved reserves are also included in the amortization base for computation of depletion. The costs of unproved properties are excluded from the amortization base until the properties are evaluated. The cost of exploratory dry wells is transferred to proved properties, and thus is subject to amortization, immediately upon determination that a well is dry in those countries where proved reserves exist.
The Company performs a ceiling test calculation each quarter in accordance with SEC Regulation S-X Rule 4-10. In performing its quarterly ceiling test, the Company limits, on a country-by-country basis, the capitalized costs of proved oil and natural gas properties, net of accumulated depletion and deferred income taxes, to the estimated future net cash flows from proved oil and natural gas reserves discounted at 10%, net of related tax effects, plus the lower of cost or fair value of unproved properties included in the costs being amortized. If such capitalized costs exceed the ceiling, the Company will record a write-down to the extent of such excess as a non-cash charge to net income. Any such write-down will reduce earnings in the period of occurrence and results in a lower DD&A rate in future periods. A write-down may not be reversed in future periods even though higher oil and natural gas prices may subsequently increase the ceiling.
The Company calculates future net cash flows by applying the unweighted average of prices in effect on the first day of the month for the preceding 12-month period, adjusted for location and quality differentials. Such prices are utilized except where different prices are fixed and determinable from applicable contracts for the remaining term of those contracts.
Unproved properties are not depleted pending the determination of the existence of proved reserves. Costs are transferred into the depletable base on an ongoing basis as the properties are evaluated and proved reserves are established or impairment is determined. Unproved properties are evaluated quarterly to ascertain whether impairment has occurred. This evaluation considers, among other factors, seismic data, requirements to relinquish acreage, drilling results and activity, remaining time in the commitment period, remaining capital plans, and political, economic, and market conditions. During any period in which factors indicate an impairment, the cumulative costs incurred to date for such property are transferred to the full cost pool and
93
are then subject to depletion. For countries where a reserve base has not yet been established, the impairment is charged to earnings.
In exploration areas, related geological and geophysical (“G&G”) costs are capitalized in unproved property and evaluated as part of the total capitalized costs associated with a property. G&G costs related to development projects are recorded in proved properties and therefore subject to depletion as incurred.
Gains and losses on the sale or other disposition of oil and natural gas properties are not recognized, unless the gain or loss would significantly alter the relationship between capitalized costs and proved reserves of oil and natural gas attributable to a country.
Asset retirement obligation
The Company records an estimated liability for future costs associated with the abandonment of its oil and gas properties including the costs of reclamation of drilling sites. The Company records the fair value of a liability for a legal obligation to retire an asset in the period in which the liability is incurred with an offsetting increase to the related oil and gas properties. The fair value of an asset retirement obligation is measured by reference to the expected future cash outflows required to satisfy the retirement obligation discounted at the Company’s credit-adjusted risk-free interest rate. Accretion expense is recognized over time as the discounted liabilities are accreted to their expected settlement value, while the asset retirement cost is amortized over the estimated productive life of the related assets. The accretion of the asset retirement obligation and amortization of the asset retirement cost are included in DD&A. If estimated future costs of an asset retirement obligation change, an adjustment is recorded to both the asset retirement obligation and oil and gas properties. Revisions to the estimated asset retirement obligation can result from changes in retirement cost estimates, revisions to estimated inflation rates and changes in the estimated timing of abandonment.
Other capital assets
Other capital assets, including additions and replacements, are recorded at cost upon acquisition and include furniture, fixtures and leasehold improvement, computer equipment and automobiles. Depreciation is provided using the declining-balance method at a
30%
annual rate for furniture and fixtures, computer equipment and automobiles. Leasehold improvements are depreciated on a straight-line basis over the shorter of the estimated useful life and the term of the related lease. The cost of repairs and maintenance is charged to expense as incurred.
Goodwill
Goodwill represents the excess of the aggregate of the consideration transferred over the net identifiable assets acquired and liabilities assumed. The Company assesses qualitative factors annually, or more frequently if necessary, to determine whether it is more likely than not that the fair value of a reporting unit is less than its carrying amount and whether it is necessary to perform the two-step goodwill impairment test. The impairment test requires allocating goodwill and certain other assets and liabilities to assigned reporting units. The fair value of each reporting unit is estimated and compared with the net book value of the reporting unit. If the estimated fair value of the reporting unit is less than the net book value, including goodwill, then the goodwill is written down to the implied fair value of the goodwill through a charge to expense. Because quoted market prices are not available for the Company’s reporting units, the fair values of the reporting units are estimated based upon estimated future cash flows of the reporting unit.
The Company recorded
$87.6 million
of goodwill in relation to the acquisition of Solana Resources Limited (“Solana”) in 2008 and
$15.0 million
of goodwill in relation to the Argosy Energy International L.P. acquisition in 2006. The goodwill relates entirely to the Colombia reportable segment. The Company performed a qualitative assessment of goodwill at
December 31, 2013
, and based on this assessment, no impairment of goodwill was identified.
Revenue recognition
Revenue from the production of oil and natural gas is recognized when the customer has taken title and has assumed the risks and rewards of ownership, prices are fixed or determinable, the sale is evidenced by a contract and collection of the revenue is reasonably assured.
On February 1, 2012, the sales point for the Company’s Colombian oil sales to a significant customer in the Putumayo Basin changed. Gran Tierra’s customer, Ecopetrol S.A. (“Ecopetrol”), now takes title at the Port of Tumaco on the Pacific coast of Colombia rather than at the entry into the Ecopetrol-operated Trans-Andean oil pipeline (“the OTA pipeline”) at the Orito
94
Station in the Putumayo Basin. In Colombia, the Company has other sales contracts where the sales point is the purchaser's facilities or when oil is loaded into a truck at Gran Tierra's loading facility or an export tanker.
In Argentina, Gran Tierra transports oil from the field to the customer’s refinery or the oil terminal by pipeline or truck, where title is transferred. For the Company’s gas sales in Argentina, Gran Tierra’s customers take title when the gas is transferred to their pipeline. In Brazil, Gran Tierra transports product from the field to the customer’s station by truck, where title is transferred.
Revenue represents the Company’s share and is recorded net of royalty payments to governments and other mineral interest owners.
Stock-based compensation
The Company grants time-vested restricted stock units ("RSUs") to officers, employees and consultants. RSUs entitle the holder to receive, at the option of the Company, either the underlying number of shares of the Company's Common Stock upon vesting of such shares or a cash payment equal to the value of the underlying shares. The Company expects its practice will be to settle RSUs in cash and, therefore, RSUs are accounted for as liability instruments. Compensation expense for RSUs granted is based on the estimated fair value, which is determined using the closing share price, at each reporting date, and the expense, net of estimated forfeitures, is recognized over the requisite service period using the accelerated method, with a corresponding change to liabilities. An adjustment is made to compensation expense for any difference between the estimated forfeitures and the actual forfeitures related to vested awards.
Additionally, the Company grants options to purchase shares of Common Stock to certain directors, officers, employees and consultants. The Company follows the fair-value based method of accounting for stock options granted. Compensation expense for options granted is based on the estimated fair value, using the Black-Scholes option pricing model, at the time of grant and the expense, net of estimated forfeitures, is recognized over the requisite service period using the accelerated method. An adjustment is made to compensation expense for any difference between the estimated forfeitures and the actual forfeitures related to vested awards. The Company uses historical data to estimate option exercises, expected term and employee departure behavior used in the Black-Scholes option pricing model. Expected volatilities used in the fair value estimate are based on historical volatility of the Company’s shares. The risk-free rate for periods within the expected term of the stock options is based on the U.S. Treasury yield curve in effect at the time of grant.
Stock-based compensation expense relating to RSUs and stock options is capitalized as part of oil and natural gas properties or expensed as part of operating expenses or general and administrative (“G&A”) expenses, as appropriate.
Warrants
The Company issued warrants (“Replacement Warrants”) in connection with its acquisition of Petrolifera Petroleum Limited (“Petrolifera”) in March 2011 (Note 3). The Replacement Warrants expired unexercised during August 2011. These warrants were derivative financial instruments and were recognized at fair value in the consolidated balance sheet as a current liability and as part of the consideration paid for the acquisition. The Company determined the fair value of warrants issued using the Black-Scholes option pricing model.
Foreign currency translation
The functional currency of the Company, including its subsidiaries, is the United States dollar. Monetary items are translated into the reporting currency at the exchange rate in effect at the balance sheet date and non-monetary items are translated at historical exchange rates. Revenue and expense items are translated in a manner that produces substantially the same reporting currency amounts that would have resulted had the underlying transactions been translated on the dates they occurred.
Depreciation or amortization of assets is translated at the historical exchange rates similar to the assets to which they relate.
Gains and losses resulting from foreign currency transactions, which are transactions denominated in a currency other than the entity’s functional currency, are recognized in net income.
Net income per share
Basic net income per share is calculated by dividing net income attributable to common shareholders by the weighted average number of shares of Common Stock and exchangeable shares issued and outstanding during each period. Diluted net income per share is calculated by adjusting the weighted average number of shares of Common Stock and exchangeable shares
95
outstanding for the dilutive effect, if any, of share equivalents. The Company uses the treasury stock method to determine the dilutive effect. This method assumes that all Common Stock equivalents have been exercised at the beginning of the period (or at the time of issuance, if later), and that the funds obtained thereby were used to purchase shares of Common Stock of the Company at the volume weighted average trading price of shares of Common Stock during the period.
Recently Issued Accounting Pronouncements
Obligations Resulting from Joint and Several Liability Arrangements for Which the Total Amount of the Obligation is fixed at the Reporting Date
In February 2013, the Financial Accounting Standards Board (“FASB”) issued Accounting Standards Update (“ASU”) 2013- 04, “
Obligations Resulting from Joint and Several Liability Arrangements for Which the Total Amount of the Obligation is fixed at the Reporting Date
”. The ASU provides guidance for the recognition, measurement, and disclosure of obligations resulting from joint and several liability arrangements for which the total amount of the obligation is fixed at the reporting date. Examples of obligations within the scope of this update include debt arrangements, other contractual obligations, and settled litigation and judicial rulings. The ASU is effective for fiscal years, and interim periods within those years, beginning after December 15, 2013. The implementation of this update is not expected to materially impact the Company’s consolidated financial position, results of operations or cash flows or disclosure.
Presentation of an Unrecognized Tax Benefit When a Net Operating Loss Carryforward, a Similar Tax Loss, or a Tax Credit Carryforward Exists
In July 2013, the FASB issued ASU 2013-11, “
Presentation of an Unrecognized Tax Benefit When a Net Operating Loss Carryforward, a Similar Tax Loss, or a Tax Credit Carryforward Exists
". The ASU provides guidance on the financial statement presentation of an unrecognized tax benefit when a net operating loss carryforward, a similar tax loss, or a tax credit carryforward exists. The ASU is effective for fiscal years, and interim periods within those years, beginning after December 15, 2013. The implementation of this update is not expected to materially impact the Company’s consolidated financial position, results of operations or cash flows or disclosure.
3. Business Combination
Brazil
On October 8, 2012, the Company received regulatory approval and acquired the remaining
30%
working interest in
four
blocks in Brazil pursuant to the terms of a purchase and sale agreement dated January 20, 2012. With the exception of
one
block which has
three
producing wells, the remaining blocks are unproved properties.
The Company paid initial cash purchase consideration of
$28.0 million
and an interim period purchase price adjustment of
$7.5 million
, representing the
30%
share of all benefits and costs with respect to the period between the effective date and the completion of the transaction. Contingent consideration up to an additional
$3.0 million
may be payable dependent on production volumes from the acquired blocks.
The acquisition was accounted for as a business combination using the acquisition method, with Gran Tierra being the acquirer, whereby the assets acquired and liabilities assumed were recognized at their fair values as at October 8, 2012, the acquisition date, and the results of the blocks were included with those of Gran Tierra from that date. Fair value estimates were made based on significant unobservable (Level 3) inputs and based on the best information available at the time.
Contingent consideration was recorded on the balance sheet at the acquisition date fair value based on the consideration expected to be transferred, discounted back to present value by applying an appropriate discount rate that reflected the risk factors associated with the payment streams. The discount rate used was determined at the time of measurement in accordance with accepted valuation methods. The acquisition date fair value of the contingent consideration was
$1.1 million
and was recorded in other long-term liabilities. The fair value of the contingent consideration is being remeasured at the estimated fair value at each reporting period and any change in fair value will be recognized as income or expense in operating income. There was no significant change in the fair value of the contingent consideration between October 8, 2012, December 31, 2012, and
December 31, 2013
. Any changes in fair value will impact earnings in such reporting period until the contingencies are resolved.
The following table shows the allocation of the consideration transferred based on the fair values of the assets and liabilities acquired:
96
|
(Thousands of U.S. Dollars)
|
|||
|
Consideration Transferred:
|
|||
|
Cash
|
$
|
35,495
|
|
|
Fair value of contingent consideration payable
|
1,061
|
|
|
|
$
|
36,556
|
|
|
|
Allocation of Consideration Transferred:
|
|
||
|
Oil and gas properties
|
|||
|
Proved
|
$
|
24,107
|
|
|
Unproved
|
12,859
|
|
|
|
Asset retirement obligation
|
(410
|
)
|
|
|
$
|
36,556
|
|
|
Pro forma results (unaudited)
Pro forma results related to this acquisition have not been disclosed because oil and natural gas sales and net income related to the
30%
working interest for the years ended December 31, 2012, and 2011 were not material in relation to the Company's consolidated financial statements. Production from these blocks was not significant during these periods.
Petrolifera Petroleum Limited
On
March 18, 2011
(the “Acquisition Date”), Gran Tierra completed its acquisition of all the issued and outstanding common shares and warrants of Petrolifera, a Canadian corporation, pursuant to the terms and conditions of an arrangement agreement dated January 17, 2011 (the “Arrangement”). Petrolifera is a Calgary based oil, natural gas and natural gas liquids exploration, development and production company active in Argentina, Colombia and Peru. The transaction contemplated by the Arrangement was effected through a court approved plan of arrangement in Canada. The Arrangement was approved at a special meeting of Petrolifera shareholders on
March 17, 2011
, and by the Court of Queen's Bench of Alberta on
March 18, 2011
.
Under the Arrangement, Petrolifera shareholders received, for each Petrolifera share held,
0.1241
of a share of Gran Tierra Common Stock, and Petrolifera warrant holders received, for each Petrolifera warrant held,
0.1241
of a warrant (a "Replacement Warrant") to purchase a share of Gran Tierra Common Stock at an exercise price of
$9.67
Canadian (“CDN”) dollars per share. The Replacement Warrants expired unexercised on
August 28, 2011
.
Gran Tierra acquired all the issued and outstanding Petrolifera shares and warrants through the issuance of
18,075,247
shares of Gran Tierra Common Stock, par value
$0.001
, and
4,125,036
Replacement Warrants. Upon completion of the transaction on the Acquisition Date, Petrolifera became an indirect wholly-owned subsidiary of Gran Tierra. On a diluted basis, upon the closing of the Arrangement, Petrolifera and Gran Tierra security holders owned approximately
6.6%
and
93.4%
of the Company, respectively, immediately following the transaction. The total consideration for the transaction was approximately
$143.0 million
.
The fair value of Gran Tierra’s Common Stock was determined as the closing price of shares of the Common Stock of Gran Tierra as at the Acquisition Date.
The
fair value of the Replacement Warrants was estimated on the Acquisition Date using the Black-Scholes option pricing model with the following assumptions
:
|
Exercise price (CDN dollars per warrant)
|
$
|
9.67
|
|
|
Risk-free interest rate
|
1.3
|
%
|
|
|
Expected life
|
0.45 years
|
|
|
|
Volatility
|
44
|
%
|
|
|
Expected annual dividend per share
|
Nil
|
|
|
|
Estimated fair value per warrant (CDN dollars)
|
$
|
0.32
|
|
97
The Replacement Warrants met the definition of a derivative and, due to the fact that the exercise price of the Replacement Warrants was denominated in Canadian dollars, which is different from Gran Tierra’s functional currency, the Replacement Warrants were not considered indexed to Gran Tierra’s shares of Common Stock and the Replacement Warrants could not be classified within equity. Therefore, the Replacement Warrants were classified as a current liability on Gran Tierra’s consolidated balance sheet. Furthermore, these derivative instruments did not qualify as fair value hedges or cash flow hedges, and accordingly, changes in their fair value were recognized as income or expense in the consolidated statement of operations with a corresponding adjustment to the fair value of derivative instruments recognized on the balance sheet. The financial instruments gain for the year ended December 31, 2011, included a
$1.3 million
gain arising from the fair value of the expired Replacement Warrants.
The acquisition was accounted for using the acquisition method, with Gran Tierra being the acquirer, whereby Petrolifera’s assets acquired and liabilities assumed are recognized at their fair values as at the Acquisition Date and the results of Petrolifera have been consolidated with those of Gran Tierra from that date.
The following table shows the allocation of the consideration transferred based on the fair values of the assets and liabilities acquired:
|
(Thousands of U.S. Dollars)
|
|
||
|
Consideration Transferred:
|
|
||
|
Shares of Common Stock issued net of share issue costs
|
$
|
141,690
|
|
|
Replacement warrants
|
1,354
|
|
|
|
|
$
|
143,044
|
|
|
|
|
|
|
|
Allocation of Consideration Transferred:
|
|
|
|
|
Oil and gas properties
|
|
|
|
|
Proved
|
$
|
58,457
|
|
|
Unproved
|
161,278
|
|
|
|
Other long-term assets
|
4,417
|
|
|
|
Net working capital (including cash acquired of $7.7 million and accounts receivable of $6.4 million)
|
(17,223
|
)
|
|
|
Asset retirement obligation
|
(4,901
|
)
|
|
|
Bank debt
|
(22,853
|
)
|
|
|
Other long-term liabilities
|
(14,432
|
)
|
|
|
Gain on acquisition
|
(21,699
|
)
|
|
|
|
$
|
143,044
|
|
As shown above, the fair value of identifiable assets acquired and liabilities assumed exceeded the fair value of the consideration transferred. Consequently, Gran Tierra reassessed the recognition and measurement of identifiable assets acquired and liabilities assumed and concluded that all acquired assets and assumed liabilities were recognized and that the valuation procedures and resulting measures were appropriate. As a result, Gran Tierra recognized a gain of
$21.7 million
, which was reported as “Gain on acquisition” in the consolidated statement of operations. The gain reflected the impact on Petrolifera’s pre-acquisition market value of a lack of liquidity and capital resources required to maintain current production and reserves and further develop and explore their inventory of prospects.
As part of the assets acquired and included in the net working capital in the allocation of the consideration transferred, the Company assigned
$22.5 million
in fair value to investments in notes that Petrolifera received in exchange for asset-backed commercial paper (“ABCP”) with a face value of
$31.3 million
. On
March 28, 2011
, these notes were sold to an unrelated party for proceeds of
$22.7 million
after the associated line of credit was settled. When combined with the gain arising on expiry of the Replacement Warrants, the financial instruments gain for the year ended December 31, 2011, was
$1.5 million
.
The associated ABCP line of credit that Gran Tierra assumed was with a Canadian chartered bank, to a maximum of CDN
$23.2 million
with an initial expiry in April 2012. Gran Tierra settled this line of credit immediately after the completion of the acquisition of Petrolifera for the face value of CDN
$22.5 million
in borrowings plus accrued interest.
Also upon the acquisition of Petrolifera, Gran Tierra assumed a second line of credit agreement (“Second ABCP line of credit”) with the same Canadian chartered bank to a maximum of CDN
$5.0 million
, which was fully drawn as at the Acquisition Date.
98
This Second ABCP line of credit, which expired on
April 8, 2011
, was secured by ineligible
master asset vehicles Classes 1 & 2 (“MAV IA 1 & 2”) notes with a face value of $6.6 million
. Gran Tierra retained the option to settle the Second ABCP line of credit of CDN
$5.0 million
through delivery to the lender of the MAV IA 1 & 2 notes. Subsequent to the acquisition, Gran Tierra elected to record this second line of credit at fair value and planned at that time to settle the debt through delivery of the MAV IA 1 & 2 notes. Accordingly, a value of $
nil
was recorded for the debt upon its acquisition. Gran Tierra settled such borrowings by delivery of the MAV IA 1 & 2 notes on
April 8, 2011
.
Gran Tierra also assumed a reserve-backed credit facility upon the Petrolifera acquisition with an outstanding balance of
$31.3 million
. The amount outstanding under this credit facility was included as part of net working capital in the allocation of consideration transferred. The credit facility bore interest at
LIBOR
plus
8.25%
and was partially secured by the pledge of the shares of Petrolifera’s subsidiaries. The outstanding balance was repaid when the Argentina restriction preventing its repayment expired on
August 5, 2011
, resulting in a total debt repayment of
$54.1 million
, when combined with the repayment of the CDN$22.5 million ABCP line of credit. Interest expense on the credit facility for the
140
-day period from the Acquisition Date to
August 5, 2011
, was
$1.6 million
. This amount is recorded in the consolidated statements of operations as part of G&A expenses in the Argentina segment.
Pro forma results (unaudited)
Pro forma results for the
year ended
December 31, 2011, are shown below, as if the acquisition had occurred on
January 1, 2010
. Pro forma results are not indicative of actual results or future performance.
|
Year Ended December 31,
|
|||
|
(Unaudited, thousands of U.S. Dollars, except per share amounts)
|
2011
|
||
|
Revenue and other income
|
$
|
606,602
|
|
|
Net income
|
$
|
94,094
|
|
|
Net income per share - basic
|
$
|
0.34
|
|
|
Net income per share - diluted
|
$
|
0.33
|
|
The supplemental pro forma earnings of Gran Tierra for the year ended December 31, 2011, were adjusted to exclude
$4.4 million
of acquisition costs recorded in G&A expenses and the
$21.7 million
gain on acquisition because they were not expected to have a continuing impact on Gran Tierra’s results of operations. The consolidated statement of operations for the year ended December 31, 2011, included revenue of
$32.5 million
from Petrolifera for the period subsequent to the Acquisition Date. Petrolifera incurred a loss after tax of
$8.0 million
in the period from the Acquisition Date to December 31, 2011.
4. Segment and Geographic Reporting
The Company is primarily engaged in the exploration and production of oil and natural gas. The Company’s reportable segments are Colombia, Argentina, Peru and Brazil based on geographic organization. The level of activity in Brazil was not significant at
December 31, 2013
; however, the Company has separately disclosed its results of operations in Brazil as a reportable segment. The All Other category represents the Company’s corporate activities.
The accounting policies of the reportable segments are the same as those described in
Note 2
. The Company evaluates reportable segment performance based on income or loss before income taxes. The segmented results include the operations of Petrolifera subsequent to
March 18, 2011
, the Acquisition Date (
Note 3
).
The following tables present information on the Company’s reportable segments and other activities:
99
|
|
Year Ended December 31, 2013
|
||||||||||||||||||||||
|
(Thousands of U.S. Dollars, except per unit of production amounts)
|
Colombia
|
Argentina
|
Peru
|
Brazil
|
All Other
|
Total
|
|||||||||||||||||
|
Oil and natural gas sales
|
$
|
624,410
|
|
$
|
73,495
|
|
$
|
—
|
|
$
|
22,545
|
|
$
|
—
|
|
$
|
720,450
|
|
|||||
|
Interest income
|
623
|
|
1,015
|
|
27
|
|
909
|
|
619
|
|
3,193
|
|
|||||||||||
|
DD&A expenses
|
184,697
|
|
64,295
|
|
362
|
|
16,761
|
|
1,031
|
|
267,146
|
|
|||||||||||
|
DD&A - per unit of production
|
27.23
|
|
58.18
|
|
—
|
|
70.12
|
|
—
|
|
32.87
|
|
|||||||||||
|
Income (loss) before income taxes
|
336,179
|
|
(47,378
|
)
|
(7,067
|
)
|
(2,650
|
)
|
(17,248
|
)
|
261,836
|
|
|||||||||||
|
Segment capital expenditures (1)
|
188,547
|
|
19,503
|
|
82,954
|
|
23,039
|
|
775
|
|
314,818
|
|
|||||||||||
|
|
Year Ended December 31, 2012
|
||||||||||||||||||||||
|
(Thousands of U.S. Dollars, except per unit of production amounts)
|
Colombia
|
Argentina
|
Peru
|
Brazil
|
All Other
|
Total
|
|||||||||||||||||
|
Oil and natural gas sales
|
$
|
493,615
|
|
$
|
79,642
|
|
$
|
—
|
|
$
|
9,852
|
|
$
|
—
|
|
$
|
583,109
|
|
|||||
|
Interest income
|
667
|
|
355
|
|
49
|
|
607
|
|
400
|
|
2,078
|
|
|||||||||||
|
DD&A expenses
|
122,055
|
|
31,466
|
|
1,234
|
|
26,300
|
|
982
|
|
182,037
|
|
|||||||||||
|
DD&A - per unit of production
|
25.37
|
|
24.74
|
|
—
|
|
259.88
|
|
—
|
|
29.44
|
|
|||||||||||
|
Income (loss) before income taxes
|
244,474
|
|
1,060
|
|
(5,493
|
)
|
(24,543
|
)
|
(18,135
|
)
|
197,363
|
|
|||||||||||
|
Segment capital expenditures (1)
|
153,331
|
|
40,653
|
|
62,869
|
|
55,239
|
|
1,084
|
|
313,176
|
|
|||||||||||
|
|
Year Ended December 31, 2011
|
||||||||||||||||||||||
|
(Thousands of U.S. Dollars, except per unit of production amounts)
|
Colombia
|
Argentina
|
Peru
|
Brazil
|
All Other
|
Total
|
|||||||||||||||||
|
Oil and natural gas sales
|
$
|
543,999
|
|
$
|
48,016
|
|
$
|
—
|
|
$
|
4,176
|
|
$
|
—
|
|
$
|
596,191
|
|
|||||
|
Interest income
|
492
|
|
66
|
|
140
|
|
84
|
|
434
|
|
1,216
|
|
|||||||||||
|
DD&A expenses
|
141,133
|
|
45,506
|
|
42,035
|
|
1,819
|
|
742
|
|
231,235
|
|
|||||||||||
|
DD&A - per unit of production
|
26.17
|
|
49.61
|
|
—
|
|
42.25
|
|
—
|
|
36.39
|
|
|||||||||||
|
Income (loss) before income taxes
|
313,516
|
|
(32,635
|
)
|
(46,249
|
)
|
(3,878
|
)
|
3,493
|
|
234,247
|
|
|||||||||||
|
Segment capital expenditures (1)
|
202,551
|
|
36,289
|
|
36,224
|
|
50,836
|
|
1,747
|
|
327,647
|
|
|||||||||||
(1) In 2013, segment capital expenditures are net of proceeds of:
$54.0 million
relating to termination of a farm-in agreement in Brazil;
$4.1 million
relating to the Company's assumption of the remaining
50%
working interest in the Santa Victoria Block in Argentina; and
$1.5 million
relating to the Company's sale of its
15%
working interest in the Mecaya Block in Colombia (Note 6). In 2012, the Company paid
$35.5 million
and recorded
$1.1 million
of contingent consideration in connection with the acquisition of the remaining
30%
working interest in four blocks in Brazil (Note 3). In 2011, amounts are net of proceeds from the farm-out of a
50%
working interest in the Santa Victoria Block and the sale of a blow-out preventer, both in Argentina (Note 6). In 2011, the Company also completed its acquisition of all the issued and outstanding common shares and warrants of Petrolifera (Note 3).
The Company’s revenues are derived principally from uncollateralized sales to customers in the oil and natural gas industry. The concentration of credit risk in a single industry affects the Company’s overall exposure to credit risk because customers may be similarly affected by changes in economic and other conditions.
The Company has
two
significant customers in Colombia, Ecopetrol and one other customer. Sales to Ecopetrol accounted for
41%
,
74%
and
87%
of the Company's consolidated oil and gas sales for the years ended
December 31, 2013
,
2012
and
2011
, respectively. Sales to the other customer in Colombia accounted for
38%
of the Company's consolidated oil and gas sales for the year ended
December 31, 2013
.
100
|
As at December 31, 2013
|
|||||||||||||||||||||||
|
(Thousands of U.S. Dollars)
|
Colombia
|
Argentina
|
Peru
|
Brazil
|
All Other
|
Total
|
|||||||||||||||||
|
Property, plant and equipment
|
$
|
850,359
|
|
$
|
94,366
|
|
$
|
178,531
|
|
$
|
133,874
|
|
$
|
3,042
|
|
$
|
1,260,172
|
|
|||||
|
Goodwill
|
102,581
|
|
—
|
|
—
|
|
—
|
|
—
|
|
102,581
|
|
|||||||||||
|
Other assets
|
233,336
|
|
39,209
|
|
24,240
|
|
24,477
|
|
220,535
|
|
541,797
|
|
|||||||||||
|
Total Assets
|
$
|
1,186,276
|
|
$
|
133,575
|
|
$
|
202,771
|
|
$
|
158,351
|
|
$
|
223,577
|
|
$
|
1,904,550
|
|
|||||
|
|
As at December 31, 2012
|
||||||||||||||||||||||
|
(Thousands of U.S. Dollars)
|
Colombia
|
Argentina
|
Peru
|
Brazil
|
All Other
|
Total
|
|||||||||||||||||
|
Property, plant and equipment
|
$
|
840,027
|
|
$
|
138,768
|
|
$
|
95,940
|
|
$
|
127,394
|
|
$
|
3,297
|
|
$
|
1,205,426
|
|
|||||
|
Goodwill
|
102,581
|
|
—
|
|
—
|
|
—
|
|
—
|
|
102,581
|
|
|||||||||||
|
Other assets
|
222,220
|
|
47,038
|
|
10,880
|
|
8,498
|
|
136,232
|
|
424,868
|
|
|||||||||||
|
Total Assets
|
$
|
1,164,828
|
|
$
|
185,806
|
|
$
|
106,820
|
|
$
|
135,892
|
|
$
|
139,529
|
|
$
|
1,732,875
|
|
|||||
5. Accounts Receivable and Inventory
Accounts Receivable
|
As at December 31,
|
|||||||
|
(Thousands of U.S. Dollars)
|
2013
|
2012
|
|||||
|
Trade
|
$
|
46,113
|
|
$
|
116,434
|
|
|
|
Other
|
3,590
|
|
3,410
|
|
|||
|
$
|
49,703
|
|
$
|
119,844
|
|
||
Inventory
At
December 31, 2013
, oil and supplies inventories were
$11.7 million
and
$2.0 million
, respectively (
December 31, 2012
-
$31.2 million
and
$2.3 million
, respectively).
6. Property, Plant and Equipment
Property, Plant and Equipment
|
|
As at December 31, 2013
|
As at December 31, 2012
|
|||||||||||||||||||||
|
(Thousands of U.S. Dollars)
|
Cost
|
Accumulated
depletion,
depreciation
and
impairment
|
Net book value
|
Cost
|
Accumulated
depletion,
depreciation
and
impairment
|
Net book value
|
|||||||||||||||||
|
Oil and natural gas properties
|
|
|
|
|
|
|
|
|
|
|
|
||||||||||||
|
Proved
|
$
|
1,799,544
|
|
$
|
(1,005,475
|
)
|
$
|
794,069
|
|
$
|
1,562,477
|
|
$
|
(749,230
|
)
|
$
|
813,247
|
|
|||||
|
Unproved
|
456,001
|
|
—
|
|
456,001
|
|
383,414
|
|
—
|
|
383,414
|
|
|||||||||||
|
|
2,255,545
|
|
(1,005,475
|
)
|
1,250,070
|
|
1,945,891
|
|
(749,230
|
)
|
1,196,661
|
|
|||||||||||
|
Furniture and fixtures and leasehold improvements
|
8,919
|
|
(6,568
|
)
|
2,351
|
|
7,575
|
|
(5,093
|
)
|
2,482
|
|
|||||||||||
|
Computer equipment
|
14,786
|
|
(7,605
|
)
|
7,181
|
|
10,971
|
|
(5,248
|
)
|
5,723
|
|
|||||||||||
|
Automobiles
|
1,381
|
|
(811
|
)
|
570
|
|
1,376
|
|
(816
|
)
|
560
|
|
|||||||||||
|
Total Property, Plant and Equipment
|
$
|
2,280,631
|
|
$
|
(1,020,459
|
)
|
$
|
1,260,172
|
|
$
|
1,965,813
|
|
$
|
(760,387
|
)
|
$
|
1,205,426
|
|
|||||
Depletion and depreciation expense on property, plant and equipment for the
year ended
December 31, 2013
, was
$227.3 million
(
year ended
December 31, 2012
-
$168.0 million
;
year ended December 31, 2011
-
$162.6 million
). A portion of depletion and depreciation expense was recorded as inventory in each year and adjusted for inventory changes.
101
In the second quarter of 2013, the Company assumed its partner's
50%
working interest in the Santa Victoria Block in Argentina and received cash consideration of
$4.1 million
from its partner, comprising the balance owing for carry consideration and compensation for the second exploration phase work commitment. The Company also received proceeds of
$1.5 million
relating to a sale of its
15%
working interest in the Mecaya Block in Colombia.
In the third quarter of 2013, the Company received a net payment of
$54.0 million
(before income taxes) from a third party in connection with termination of a farm-in agreement in the Recôncavo Basin relating to Block REC-T-129, Block REC-T-142, Block REC-T-155 and Block REC-T-224 in Brazil.
The Company successfully bid on
three
blocks in the 2013 Brazil Bid Round 11 administered by Brazil's Agência Nacional de Petróleo, Gás Natural e Biocombustíveis ("ANP") and, in the third quarter of 2013, paid a signature bonus of
$14.4 million
upon finalization of the concession agreements.
On June 5, 2012, the Company received regulatory approval of a farm-in agreement on a block in Colombia. This approval triggered a payment of
$21.1 million
related to drilling costs for a previously drilled oil exploration well, which was recorded as a capital expenditure in the second quarter of 2012.
Effective June 1, 2012, the Company entered into an agreement to acquire the remaining
40%
working interest in a block in Peru. The block is an unproved property. Purchase consideration was
$5.4 million
and was recorded as a capital expenditure in the second quarter of 2012.
On August 26, 2010, the Company entered into an agreement to acquire a
70%
working interest in
four
blocks in Brazil. The agreement was effective September 1, 2010, subject to regulatory approvals, and the transaction was completed on June 15, 2011. Purchase consideration was
$40.1 million
and was recorded as capital expenditures in 2011 and 2010. On January 20, 2012, the Company entered into an agreement to acquire the remaining
30%
working interest in these
four
blocks and, on October 8, 2012, received regulatory approval and acquired the remaining
30%
working interest. The
30%
working interest acquisition was accounted for as a business combination using the acquisition method (Note 3).
In September 2011, the Company announced
two
farm-out agreements with Statoil do Brasil Ltda. ("Statoil") in a joint venture with PetróleoBrasileiro S.A. pursuant to which, the Company would receive an assignment of a non-operated
10%
working interest in Block BM-CAL-7 and a non-operated
15%
working interest in Block BM-CAL-10. Both blocks are located in the Camamu Basin, offshore Bahia, Brazil. On February 17, 2012, in accordance with the terms of the farm-out agreement for Block BM-CAL-10 in Brazil, the Company gave notice to its joint venture partner that it would not enter into and assume its share of the work obligations of the second exploration period of the block. As a result, the farm-out agreement terminated and the Company did not receive any interest in this block. Pursuant to the farm-out agreement, the Company was obligated to make payment for a certain percentage of the costs relating to Block BM-CAL-10, which relate primarily to a well that was drilled during the term of the farm-out agreement. The notice of withdrawal was a trigger for payment of amounts that would otherwise have been due if the farm-out agreement had closed and the Company had acquired a working interest. In the first quarter of 2012, the Company received regulatory approval from the ANP for the Block BM-CAL-7 farm-out agreement. Purchase consideration of
$0.7 million
was paid and the assignment became effective on April 3, 2012. The Company relinquished its interest in Block 186 of Block BM-CAL-7 effective in the fourth quarter of 2013 and paid a penalty of
$1.3 million
for not meeting the first exploration phase work obligation to drill a well on this block.
In March 2011, the Company recorded proceeds of
$3.3 million
from the farm-out of a
50%
interest in the Santa Victoria Block in Argentina. The Company also recorded
$1.2 million
from the sale of a blow-out preventer in Argentina in September 2011.
In the
year ended December 31, 2013
, the Company recorded a ceiling test impairment loss of
$30.8 million
in the Company's Argentina cost center as a result of deferred investment and inconclusive waterflood results and a ceiling test impairment loss of
$2.0 million
in the Company's Brazil cost center as a result of lower realized prices and increased operating costs.
In the first quarter of 2012, the Company recorded a ceiling test impairment loss in the Company’s Brazil cost center of
$20.2 million
. This impairment loss resulted from the recognition of
$23.8 million
of capital expenditures in relation to the Block BM-CAL-10 farm-out agreement in the first quarter of 2012.
In the year ended December 31, 2011, the Company recorded a ceiling test impairment loss in the Company’s Peru cost center of
$42.0 million
. This impairment charge related to drilling costs from a dry well and seismic costs on blocks which were relinquished.
102
In the year ended December 31, 2011, the Company recorded a ceiling test impairment loss in the Company’s Argentina cost center of
$25.7 million
. This impairment charge related to an increase in estimated future operating and capital costs to produce the Company's remaining Argentina proved reserves and a decrease in reserve volumes.
In Brazil, the exploration phase of the concession agreements on Blocks REC-T-129, REC-T-142 and REC-T-155 was due to expire on November 24, 2013 and the exploration phase of the concession agreement on Block REC-T-224 was due to expire on December 11, 2013; however, under the concession agreements the Company was able and did submit applications to the ANP for extensions or suspensions of the exploration phases of these blocks. At December 31, 2013, unproved properties included
$51.4 million
relating to exploration expenditures on these
four
blocks. Management assessed these blocks for impairment at December 31, 2013 and concluded no impairment had occurred.
In Argentina, Rio Negro Province has enacted legislation that changes the royalty regime associated with concession agreement extensions. The Company is negotiating concession agreement extensions and royalty rates for its Puesto Morales, Puesto Morales Este, Rinconada Norte and Rinconada Sur Blocks and expects that royalty rates in Rio Negro Province will likely increase and a bonus payment, not determinable at this time, may be payable for the concession agreement extensions.
The amounts of G&A and stock-based compensation capitalized in each of the Company's cost centers during the years ended
December 31, 2013
,
2012
and
2011
, respectively, were as follows:
|
|
Year Ended December 31, 2013
|
||||||||||||||||||
|
(Thousands of U.S. Dollars)
|
Colombia
|
Argentina
|
Peru
|
Brazil
|
Total
|
||||||||||||||
|
Capitalized G&A, including stock-based compensation
|
$
|
21,415
|
|
$
|
3,423
|
|
$
|
7,896
|
|
$
|
7,220
|
|
$
|
39,954
|
|
||||
|
Capitalized stock-based compensation
|
921
|
|
128
|
|
669
|
|
718
|
|
2,436
|
|
|||||||||
|
|
Year Ended December 31, 2012
|
||||||||||||||||||
|
(Thousands of U.S. Dollars)
|
Colombia
|
Argentina
|
Peru
|
Brazil
|
Total
|
||||||||||||||
|
Capitalized G&A, including stock-based compensation
|
$
|
15,054
|
|
$
|
4,605
|
|
$
|
4,761
|
|
$
|
3,844
|
|
$
|
28,264
|
|
||||
|
Capitalized stock-based compensation
|
481
|
|
354
|
|
—
|
|
275
|
|
1,110
|
|
|||||||||
|
|
Year Ended December 31, 2011
|
||||||||||||||||||
|
(Thousands of U.S. Dollars)
|
Colombia
|
Argentina
|
Peru
|
Brazil
|
Total
|
||||||||||||||
|
Capitalized G&A, including stock-based compensation
|
$
|
7,996
|
|
$
|
3,189
|
|
$
|
1,183
|
|
$
|
1,985
|
|
$
|
14,353
|
|
||||
|
Capitalized stock-based compensation
|
456
|
|
266
|
|
—
|
|
234
|
|
956
|
|
|||||||||
Unproved oil and natural gas properties consist of exploration lands held in Colombia, Argentina, Peru and Brazil. As at
December 31, 2013
, the Company had
$176.1 million
(
December 31, 2012
-
$175.9 million
) of unproved assets in Colombia,
$18.2 million
(
December 31, 2012
-
$42.3 million
) of unproved assets in Argentina,
$177.5 million
(
December 31, 2012
-
$95.1 million
) of unproved assets in Peru, and
$84.2 million
(
December 31, 2012
-
$70.1 million
) of unproved assets in Brazil for a total of
$456.0 million
(
December 31, 2012
-
$383.4 million
). These properties are being held for their exploration value and are not being depleted pending determination of the existence of proved reserves. Gran Tierra will continue to assess the unproved properties over the next several years as proved reserves are established and as exploration dictates whether or not future areas will be developed. The Company expects that approximately
75%
of costs not subject to depletion at
December 31, 2013
, will be transferred to the depletable base within the next
five
years and the remainder in the next
five
to
10
years.
The following is a summary of Gran Tierra’s oil and natural gas properties not subject to depletion as at
December 31, 2013
:
103
|
Costs Incurred in
|
|||||||||||||||||||
|
(Thousands of U.S. Dollars)
|
2013
|
2012
|
2011
|
Prior to 2011
|
|
Total
|
|||||||||||||
|
Acquisition costs - Colombia
|
$
|
—
|
|
$
|
—
|
|
$
|
3,900
|
|
$
|
127,842
|
|
$
|
131,742
|
|
||||
|
Acquisition costs - Argentina
|
(4,088
|
)
|
—
|
|
14,889
|
|
—
|
|
10,801
|
|
|||||||||
|
Acquisition costs - Peru
|
—
|
|
5,400
|
|
23,423
|
|
2,000
|
|
30,823
|
|
|||||||||
|
Acquisition costs - Brazil
|
—
|
|
12,802
|
|
22,668
|
|
—
|
|
35,470
|
|
|||||||||
|
Exploration costs - Colombia
|
4,965
|
|
16,092
|
|
7,225
|
|
16,064
|
|
44,346
|
|
|||||||||
|
Exploration costs - Argentina
|
204
|
|
(588
|
)
|
2,595
|
|
5,226
|
|
7,437
|
|
|||||||||
|
Exploration costs - Peru
|
82,311
|
|
58,286
|
|
6,019
|
|
—
|
|
146,616
|
|
|||||||||
|
Exploration costs - Brazil
|
14,106
|
|
17,128
|
|
17,532
|
|
—
|
|
48,766
|
|
|||||||||
|
Total oil and natural gas properties not subject to depletion
|
$
|
97,498
|
|
$
|
109,120
|
|
|
$
|
98,251
|
|
|
$
|
151,132
|
|
|
$
|
456,001
|
|
|
7. Share Capital
The Company’s authorized share capital consists of
595,000,002
shares of capital stock, of which
570 million
are designated as Common Stock, par value
$0.001
per share,
25 million
are designated as Preferred Stock, par value
$0.001
per share, and
two
shares are designated as special voting stock, par value
$0.001
per share.
As at
December 31, 2013
, outstanding share capital consists of
272,327,810
shares of Common Stock of the Company,
6,348,313
exchangeable shares of Gran Tierra Exchangeco Inc., (the "Exchangeco exchangeable shares") and
4,534,127
exchangeable shares of Gran Tierra Goldstrike Inc. (the "Goldstrike exchangeable shares"). The Exchangeco exchangeable shares were issued upon the acquisition of Solana. The Goldstrike exchangeable shares were issued upon the business combination between Gran Tierra Energy Inc., an Alberta corporation, and Goldstrike, Inc., which is now the Company.
The redemption date of the Exchangeco exchangeable shares was previously established as November 14, 2013 (or at an earlier date under certain specified circumstances). However, pursuant to resolutions of the Board of Directors of Gran Tierra Exchangeco Inc., effective October 25, 2013, the redemption date for the Exchangeco exchangeable shares was extended to such later date as may be established by the Board of Directors of Gran Tierra Exchangeco Inc. at its discretion. The redemption date of the Goldstrike exchangeable shares was previously established as November 10, 2013. However, pursuant to resolutions of the Board of Directors of Gran Tierra Goldstrike Inc., effective October 31, 2013, the redemption date for the Goldstrike exchangeable shares was extended to such later date as may be established by the Board of Directors of Gran Tierra Goldstrike Inc. at its discretion. During the
year ended December 31, 2013
,
1,306,317
shares of Common Stock were issued upon the exercise of stock options,
1,689,683
shares of Common Stock were issued upon the exchange of the Goldstrike exchangeable shares and
849,365
shares of common stock were issued upon the exchange of the Exchangeco exchangeable shares.
The holders of shares of Common Stock are entitled to
one
vote for each share on all matters submitted to a stockholder vote and are entitled to share in all dividends that the Company’s Board of Directors, in its discretion, declares from legally available funds. The holders of Common Stock have no pre-emptive rights, no conversion rights, and there are no redemption provisions applicable to the shares. Holders of exchangeable shares have substantially the same rights as holders of shares of Common Stock. Each exchangeable share is exchangeable into
one
share of Common Stock of the Company.
Restricted Stock Units and Stock Options
As at
December 31, 2013
, the Company followed the 2007 Equity Incentive Plan, formed through the approval by shareholders of the amendment and restatement of the 2005 Equity Incentive Plan, under which the Company’s Board of Directors is authorized to issue options or other rights to acquire shares of the Company’s Common Stock. On June 27, 2012, the shareholders of Gran Tierra approved an amendment to the Company’s 2007 Equity Incentive Plan, which increased the Common Stock available for issuance thereunder from
23,306,100
shares to
39,806,100
shares.
The Company grants time-vested RSUs to officers, employees and consultants. RSUs entitle the holder to receive, at the option of the Company, either the underlying number of shares of the Company's Common Stock upon vesting of such shares or a cash payment equal to the value of the underlying shares. The Company expects its practice will be to settle RSUs in cash.
104
Additionally, the Company grants options to purchase shares of Common Stock to certain directors, officers, employees and consultants. Each option permits the holder to purchase one share of Common Stock at the stated exercise price. At the time of grant, the exercise price equals the market price. Options vest over
three
years. The Company does not expect to repurchase any shares in the open market to settle any such exercises.
In May 2013, the Company issued RSUs and stock options, which will vest as to 1/3 of the awards on each of March 1, 2014, March 1, 2015 and March 1, 2016. The term of options granted starting May 2013 is
five
years or
three
months after the grantee’s end of service to the Company, whichever occurs first. Options granted prior to May 2013 continue to have a term of
ten
years or
three
months after the grantee’s end of service to the Company, whichever occurs first. Once an RSU is vested, it is immediately settled and considered to be at the end of its term.
The fair value of each stock option award is estimated on the date of grant using the Black-Scholes option pricing model based on assumptions noted in the following table:
|
|
Year Ended December 31,
|
|||||
|
|
2013
|
2012
|
2011
|
|||
|
Dividend yield (per share)
|
Nil
|
|
Nil
|
|
Nil
|
|
|
Volatility
|
42% to 54%
|
|
59% to 75%
|
|
75% to 81%
|
|
|
Weighted average volatility
|
53
|
%
|
75
|
%
|
80
|
%
|
|
Risk-free interest rate
|
0.3% to 0.7%
|
|
0.3% to 0.4%
|
|
0.4% to 1.4%
|
|
|
Expected term
|
4-5 years
|
|
4-6 years
|
|
4-6 years
|
|
The following table provides information about stock option and RSU activity for the
year ended
December 31, 2013
:
|
RSUs
|
Options
|
||||||
|
Number of Outstanding Share Units
|
Number of Outstanding Options
|
Weighted Average Exercise Price $/Option
|
|||||
|
Balance, December 31, 2012
|
—
|
|
15,399,662
|
|
5.11
|
|
|
|
Granted
|
966,320
|
|
2,121,375
|
|
6.29
|
|
|
|
Exercised
|
—
|
|
(1,306,317
|
)
|
(2.89
|
)
|
|
|
Forfeited
|
(44,275
|
)
|
(396,003
|
)
|
(7.01
|
)
|
|
|
Expired
|
—
|
|
(150,259
|
)
|
(6.25
|
)
|
|
|
Balance, December 31, 2013
|
922,045
|
|
15,668,458
|
|
5.41
|
|
|
|
Exercisable, at December 31, 2013
|
10,372,602
|
|
4.87
|
|
|||
|
Vested, or expected to vest, at December 31, 2013, through the life of the options
|
15,142,311
|
|
5.37
|
|
|||
For the year ended
December 31, 2013
,
1,306,317
shares of Common Stock were issued upon the exercise of
1,306,317
stock options (
2012
–
482,841
;
2011
–
1,695,049
). Cash proceeds from the exercise of stock options in the
year ended December 31, 2013
were
$3.8 million
.
At
December 31, 2013
, the weighted average remaining contractual term of outstanding stock options was
6.1
years and of
exercisable stock options was
5.8
years.
The weighted average grant date fair value for options granted in the
year ended
December 31, 2013
, was
$2.62
(
2012
-
$3.33
;
2011
-
$4.84
). The weighted average grant date fair value for options vested in the
year ended
December 31, 2013
, was
$3.94
(
2012
-
$3.90
;
2011
-
$2.26
). The total fair value of stock options vested during
year ended
December 31, 2013
, was
$12.4 million
(
2012
-
$10.2 million
;
2011
-
$6.6 million
).
The amounts recognized for stock-based compensation were as follows:
105
|
(Thousands of U.S. Dollars)
|
Year Ended December 31,
|
|||||||||||
|
|
2013
|
2012
|
2011
|
|||||||||
|
Compensation costs for stock options
|
$
|
8,418
|
|
$
|
13,116
|
|
$
|
13,723
|
|
|||
|
Compensation costs for RSUs
|
2,936
|
|
—
|
|
—
|
|
||||||
|
11,354
|
|
13,116
|
|
13,723
|
|
|||||||
|
Less: stock-based compensation costs capitalized
|
(2,436
|
)
|
(1,110
|
)
|
(956
|
)
|
||||||
|
Total stock-based compensation expense
|
$
|
8,918
|
|
$
|
12,006
|
|
$
|
12,767
|
|
|||
Of the total compensation expense for the
year ended December 31, 2013
,
$7.9 million
(
2012
-
$10.9 million
;
2011
-
$11.4 million
) was recorded in G&A expenses and
$1.0 million
(
2012
–
$1.1 million
;
2011
-
$1.3 million
) was recorded in operating expenses.
At
December 31, 2013
, there was
$8.1 million
(
December 31, 2012
-
$8.2 million
) of unrecognized compensation cost related to unvested stock options and RSUs which is expected to be recognized over a weighted average period of
2.9
years.
The aggregate intrinsic value of options outstanding at
December 31, 2013
, was
$32.9 million
(
2012
-
$17.8 million
;
2011
-
$14.7 million
) based on the Company’s closing share price of
$7.31
at
December 31, 2013
(
December 31, 2012
-
$5.51
;
December 31, 2011
-
$4.80
). The aggregate intrinsic value of options exercisable at
December 31, 2013
, was
$27.4 million
(
December 31, 2012
-
$17.6 million
;
December 31, 2011
-
$14.2 million
). The aggregate intrinsic value of options exercised in the
year ended
December 31, 2013
, was
$3.3 million
(
2012
-
$1.4 million
;
2011
-
$6.2 million
). The aggregate intrinsic value of options vested, or expected to vest, at
December 31, 2013
, through the life of the options was
$32.4 million
and the weighted-average remaining contractual term of these options was
6.1
years.
Warrants
At December 31, 2013, and 2012, the Company did not have any warrants outstanding. At December 31, 2011, the Company had
6,298,230
warrants outstanding to purchase
3,149,115
shares of Common Stock for
$1.05
per share, expiring between
June 20, 2012
, and
June 30, 2012
. During the year ended December 31, 2012,
2,766,834
shares of Common Stock were issued upon the exercise of
5,550,668
warrants (2011 -
735,817
shares of Common Stock were issued upon the exercise of
1,471,634
warrants),
26,190
shares of Common Stock were issued with
7,143
shares withheld in lieu of a cashless exchange upon the exercise of
66,666
warrants, and
680,896
warrants expired unexercised.
Weighted Average Shares Outstanding
|
|
Year Ended December 31,
|
||||||||
|
|
2013
|
2012
|
2011
|
||||||
|
Weighted average number of common and exchangeable shares outstanding
|
282,808,497
|
|
280,741,255
|
|
273,491,564
|
|
|||
|
Shares issuable pursuant to warrants
|
—
|
|
175,061
|
|
2,708,183
|
|
|||
|
Shares issuable pursuant to stock options
|
12,041,260
|
|
5,879,929
|
|
5,143,498
|
|
|||
|
Shares assumed to be purchased from proceeds of stock options
|
(8,721,860
|
)
|
(2,623,991
|
)
|
(56,243
|
)
|
|||
|
Weighted average number of diluted common and exchangeable shares outstanding
|
286,127,897
|
|
284,172,254
|
|
281,287,002
|
|
|||
For the
year ended
December 31, 2013
,
4,217,082
options (
2012
-
9,784,874
options;
2011
-
3,726,999
) were excluded from the diluted income per share calculation as the options were anti-dilutive.
106
8. Asset Retirement Obligation
Changes in the carrying amounts of the asset retirement obligation associated with the Company’s oil and natural gas properties were as follows:
|
|
Year Ended December 31,
|
||||||
|
(Thousands of U.S. Dollars)
|
2013
|
2012
|
|||||
|
Balance, beginning of year
|
$
|
18,292
|
|
$
|
12,669
|
|
|
|
Settlements
|
(2,068
|
)
|
(404
|
)
|
|||
|
Liability incurred
|
2,623
|
|
5,190
|
|
|||
|
Liability assumed in a business combination (Note 3)
|
—
|
|
410
|
|
|||
|
Foreign exchange
|
(25
|
)
|
45
|
|
|||
|
Accretion
|
1,279
|
|
998
|
|
|||
|
Revisions in estimated liability
|
1,872
|
|
(616
|
)
|
|||
|
Balance, end of year
|
$
|
21,973
|
|
$
|
18,292
|
|
|
|
Asset retirement obligation - current
|
$
|
518
|
|
$
|
28
|
|
|
|
Asset retirement obligation - long-term
|
21,455
|
|
18,264
|
|
|||
|
Balance, end of year
|
$
|
21,973
|
|
$
|
18,292
|
|
|
Revisions to estimated liabilities relate primarily to changes in estimates of asset retirement costs and include, but are not limited to, revisions of estimated inflation rates, changes in property lives and the expected timing of settling the asset retirement obligation. At
December 31, 2013
, the fair value of assets that are legally restricted for purposes of settling asset retirement obligations was
$1.9 million
(
December 31, 2012
-
$1.3 million
). These assets are included in restricted cash on the Company's balance sheet.
107
9. Taxes
The income tax expense reported differs from the amount computed by applying the U.S. statutory rate to income before income taxes for the following reasons:
|
|
Year Ended December 31,
|
||||||||||
|
(Thousands of U.S. Dollars)
|
2013
|
2012
|
2011
|
||||||||
|
Income (loss) before income taxes
|
|||||||||||
|
United States
|
$
|
(13,566
|
)
|
$
|
(13,918
|
)
|
$
|
4,984
|
|
||
|
Foreign
|
275,402
|
|
211,281
|
|
229,263
|
|
|||||
|
261,836
|
|
197,363
|
|
234,247
|
|
||||||
|
|
35
|
%
|
35
|
%
|
35
|
%
|
|||||
|
Income tax expense expected
|
91,643
|
|
69,077
|
|
81,986
|
|
|||||
|
Foreign currency translation adjustments
|
(2,978
|
)
|
5,473
|
|
(417
|
)
|
|||||
|
Impact of foreign taxes
|
(1,287
|
)
|
(1,833
|
)
|
3,890
|
|
|||||
|
Stock-based compensation
|
2,859
|
|
3,982
|
|
4,013
|
|
|||||
|
Increase in valuation allowance
|
39,028
|
|
6,709
|
|
36,815
|
|
|||||
|
Branch and other foreign loss pick-up
|
(2,362
|
)
|
(3,809
|
)
|
(14,363
|
)
|
|||||
|
Non-deductible third party royalty in Colombia
|
11,073
|
|
11,938
|
|
8,525
|
|
|||||
|
Non-taxable gain on acquisition
|
—
|
|
—
|
|
(7,595
|
)
|
|||||
|
Other permanent differences (1)
|
(2,428
|
)
|
6,167
|
|
(5,524
|
)
|
|||||
|
Total income tax expense
|
$
|
135,548
|
|
$
|
97,704
|
|
$
|
107,330
|
|
||
|
Current income tax expense
|
|||||||||||
|
United States
|
$
|
1,250
|
|
$
|
1,233
|
|
$
|
1,029
|
|
||
|
Foreign
|
163,797
|
|
70,197
|
|
134,986
|
|
|||||
|
165,047
|
|
71,430
|
|
136,015
|
|
||||||
|
Deferred income tax expense (recovery)
|
|||||||||||
|
United States
|
—
|
|
—
|
|
—
|
|
|||||
|
Foreign
|
(29,499
|
)
|
26,274
|
|
(28,685
|
)
|
|||||
|
(29,499
|
)
|
26,274
|
|
(28,685
|
)
|
||||||
|
Total income tax expense
|
$
|
135,548
|
|
$
|
97,704
|
|
$
|
107,330
|
|
||
(1) Other permanent differences in the rate reconciliation are tax effected at the
35%
statutory rate. For the
year ended
December 31, 2013
, these differences include
$9.1 million
(
2012
-
$11.4 million
) of tax basis and loss adjustments,
$3.8 million
(
2012
-
$8.7 million
) of which are offset by a change in the valuation allowance and
$2.9 million
(
2012
-
$2.7 million
) of which are subject to local tax at a rate of
1.75%
.
The Colombian income tax rate was
33%
for the years ended December 31, 2011 and 2012. On December 26, 2012, the Colombian Congress enacted tax reform which effectively increased the income tax rate to
34%
from
33%
, effective January 1, 2013 until December 31, 2015. As part of this tax reform Colombia reduced the corporate income tax rate from
33%
to
25%
and introduced a new
9%
tax (CREE tax) which was introduced in addition to the regular corporate income tax. A portion of the CREE tax is considered a minimum tax based on net equity and has not been included as part of the overall income tax expense.
The Canadian statutory income tax rate changed from
26%
for the year ended December 31, 2011 to
25%
for the year ended December 31, 2012 as a result of the enacted reduction of Canadian corporate tax rates.
108
|
|
As at December 31,
|
||||||
|
(Thousands of U.S. Dollars)
|
2013
|
2012
|
|||||
|
Deferred Tax Assets
|
|
|
|
|
|||
|
Tax benefit of operating loss carryforwards
|
$
|
47,154
|
|
$
|
51,920
|
|
|
|
Tax basis in excess of book basis
|
59,168
|
|
22,519
|
|
|||
|
Foreign tax credits and other accruals
|
34,894
|
|
30,926
|
|
|||
|
Tax benefit of capital loss carryforwards
|
4,769
|
|
4,779
|
|
|||
|
Deferred tax assets before valuation allowance
|
145,985
|
|
110,144
|
|
|||
|
Valuation allowance
|
(142,322
|
)
|
(106,226
|
)
|
|||
|
|
$
|
3,663
|
|
$
|
3,918
|
|
|
|
Deferred tax assets - current
|
$
|
2,256
|
|
$
|
2,517
|
|
|
|
Deferred tax assets - long-term
|
1,407
|
|
1,401
|
|
|||
|
|
3,663
|
|
3,918
|
|
|||
|
Deferred tax liabilities - current
|
(1,193
|
)
|
(337
|
)
|
|||
|
Deferred tax liabilities - long-term
|
(177,082
|
)
|
(225,195
|
)
|
|||
|
(178,275
|
)
|
(225,532
|
)
|
||||
|
Net Deferred Tax Liabilities
|
$
|
(174,612
|
)
|
|
$
|
(221,614
|
)
|
Undistributed earnings of foreign subsidiaries as of
December 31, 2013
, were considered to be permanently reinvested. A determination of the amount of unrecognized deferred tax liability on these undistributed earnings is not practicable.
As at
December 31, 2013
, the Company had operating loss carryforwards of
$215.4 million
(
December 31, 2012
-
$213.1 million
) and capital loss carryforwards of
$32.6 million
(
December 31, 2012
–
$35.9 million
) before valuation allowance. Of these operating loss carryforwards and capital loss carryforwards,
$213.8 million
(
December 31, 2012
-
$215.2 million
) were losses generated by the foreign subsidiaries of the Company. In certain jurisdictions, the operating loss carryforwards expire between 2014 and 2033 and the capital loss carryforwards expire between 2016 and 2017, while certain other jurisdictions allow operating losses to be carried forward indefinitely.
The valuation allowance increased by
$36.1 million
during the year ended
December 31, 2013
. The change in the valuation allowance was primarily due to a ceiling test impairment loss of
$30.8 million
in Argentina (Note 6) and losses in Brazil and the U.S. The largest offset to the increase in the valuation allowance related to an Argentina entity where taxable income was generated, but sheltered by minimal notional tax credits. The Company continues to incur losses in the U.S., Peru, Brazil, Canada and certain Argentina entities.The losses are fully offset by a valuation allowance as their recognition does not meet the “more likely than not” threshold.
As at
December 31, 2013
, the total amount of Gran Tierra’s unrecognized tax benefit was
$22.1 million
(
December 31, 2012
-
$21.8 million
;
December 31, 2011
-
$20.5 million
), approximately
$12.6 million
of which, if recognized, would affect the Company’s effective tax rate. To the extent interest and penalties may be assessed by taxing authorities on any underpayment of income tax, such amounts have been accrued and are classified as a component of income taxes in the consolidated statement of operations. As at
December 31, 2013
, the amount of interest and penalties on the unrecognized tax benefit included in current income tax liabilities in the consolidated balance sheet was approximately
$5.4 million
(
December 31, 2012
-
$3.6 million
). Interest and penalties on the unrecognized tax benefit included in income tax expense for the year ended
December 31, 2013
was
$1.8 million
(2012 -
$2.0 million
; 2011 -
$0.6 million
). The Company had
no
other material interest or penalties included in the consolidated statement of operations for the three years ended
December 31, 2013
, respectively.
Changes in the Company's unrecognized tax benefit are as follows:
109
|
|
Year Ended December 31,
|
||||||||||
|
|
2013
|
2012
|
2011
|
||||||||
|
(Thousands of U.S. Dollars)
|
|
|
|||||||||
|
Unrecognized tax benefit, beginning of year
|
$
|
21,800
|
|
$
|
20,500
|
|
$
|
4,175
|
|
||
|
Increases for positions relating to prior year
|
3,200
|
|
1,300
|
|
585
|
|
|||||
|
Additions to tax position related to the current year
|
—
|
|
—
|
|
15,740
|
|
|||||
|
Decreases due to lapse of statute of limitations
|
(1,500
|
)
|
—
|
|
—
|
|
|||||
|
Settlements
|
(1,400
|
)
|
—
|
|
—
|
|
|||||
|
Unrecognized tax benefit, end of year
|
$
|
22,100
|
|
$
|
21,800
|
|
$
|
20,500
|
|
||
The Company and its subsidiaries file income tax returns in the U.S. and certain other foreign jurisdictions. The Company is potentially subject to income tax examinations for the tax years 2005 through 2013 in certain jurisdictions. The Company does not anticipate any material changes to the unrecognized tax benefit disclosed above within the next twelve months.
The other gain for the year ended December 31, 2012, of
$9.3 million
represented a value added tax recovery which occurred upon the completion of a reorganization of subsidiary companies and their Colombian branches in the Colombian reporting segment during the fourth quarter of 2012.
Equity tax for the year ended December 31, 2011, of
$8.3 million
represented a Colombian tax of
6%
on a legislated measure and was calculated based on the Company’s Colombian segment’s balance sheet equity for tax purposes at January 1, 2011. The tax is payable in
eight
semi-annual installments over
four
years, but was expensed in the first quarter of 2011 at the commencement of the four-year period. The equity tax liability at
December 31, 2013
, and
December 31, 2012
, was also partially related to an equity tax liability assumed upon the acquisition of Petrolifera.
10. Accounts Payable and Accrued Liabilities
|
As at December 31,
|
||||||||
|
(Thousands of U.S. Dollars)
|
2013
|
2012
|
||||||
|
Trade
|
$
|
97,947
|
|
$
|
103,720
|
|
||
|
Royalties
|
14,969
|
|
17,607
|
|
||||
|
VAT and withholding tax
|
24,882
|
|
28,169
|
|
||||
|
Employee compensation
|
16,525
|
|
13,178
|
|
||||
|
Other
|
7,644
|
|
6,007
|
|
||||
|
$
|
161,967
|
|
$
|
168,681
|
|
|||
11. Commitments and Contingencies
Purchase Obligations, Firm Agreements and Leases
The following is a schedule by year of purchase obligations, future minimum payments for firm agreements and leases that have initial or remaining lease terms in excess of one year as of
December 31, 2013
:
110
|
|
Year ending December 31
|
||||||||||||||||||||||||||
|
|
Total
|
2014
|
2015
|
2016
|
2017
|
2018
|
Thereafter
|
||||||||||||||||||||
|
(Thousands of U.S. Dollars)
|
|
|
|
|
|
||||||||||||||||||||||
|
Oil transportation services
|
$
|
52,339
|
|
$
|
23,261
|
|
$
|
10,635
|
|
$
|
3,812
|
|
$
|
3,812
|
|
$
|
3,812
|
|
$
|
7,007
|
|
||||||
|
Drilling and G&G
|
56,143
|
|
55,806
|
|
337
|
|
—
|
|
—
|
|
—
|
|
—
|
|
|||||||||||||
|
Completions
|
48,500
|
|
26,544
|
|
14,289
|
|
7,667
|
|
—
|
|
—
|
|
—
|
|
|||||||||||||
|
Facility construction
|
19,446
|
|
18,748
|
|
698
|
|
—
|
|
—
|
|
—
|
|
—
|
|
|||||||||||||
|
Operating leases
|
3,949
|
|
2,690
|
|
989
|
|
163
|
|
26
|
|
16
|
|
65
|
|
|||||||||||||
|
Software and telecommunication
|
1,992
|
|
1,824
|
|
137
|
|
31
|
|
—
|
|
—
|
|
—
|
|
|||||||||||||
|
Consulting
|
1,225
|
|
937
|
|
288
|
|
—
|
|
—
|
|
—
|
|
—
|
|
|||||||||||||
|
$
|
183,594
|
|
$
|
129,810
|
|
$
|
27,373
|
|
$
|
11,673
|
|
$
|
3,838
|
|
$
|
3,828
|
|
|
$
|
7,072
|
|
||||||
Gran Tierra leases certain office space, compressors, vehicles, equipment and housing. Total rent expense for the
year ended December 31, 2013
, was
$3.1 million
(
year ended December 31, 2012
–
$2.7 million
;
year ended December 31, 2011
-
$3.0 million
).
Indemnities
Corporate indemnities have been provided by the Company to directors and officers for various items including, but not limited to, all costs to settle suits or actions due to their association with the Company and its subsidiaries and/or affiliates, subject to certain restrictions. The Company has purchased directors’ and officers’ liability insurance to mitigate the cost of any potential future suits or actions. The maximum amount of any potential future payment cannot be reasonably estimated. The Company may provide indemnifications in the normal course of business that are often standard contractual terms to counterparties in certain transactions such as purchase and sale agreements. The terms of these indemnifications will vary based upon the contract, the nature of which prevents the Company from making a reasonable estimate of the maximum potential amounts that may be required to be paid.
Letters of credit
At
December 31, 2013
, the Company had provided promissory notes totaling
$52.5 million
(
December 31, 2012
-
$34.2 million
) as security for letters of credit relating to work commitment guarantees contained in exploration contracts and other capital or operating requirements.
Contingencies
Gran Tierra Energy Colombia, Ltd. and Petrolifera Petroleum (Colombia) Ltd (collectively “GTEC”) and Ecopetrol, the contracting parties of the Guayuyaco Association Contract, are engaged in a dispute regarding the interpretation of the procedure for allocation of oil produced and sold during the long-term test of the Guayuyaco-1 and Guayuyaco-2 wells, prior to GTEC's purchase of the companies originally involved in the dispute. There has been no agreement between the parties, and Ecopetrol filed a lawsuit in the Contravention Administrative Tribunal in the District of Cauca (the "Tribunal") regarding this matter. During the first quarter of 2013, the Tribunal ruled in favor of Ecopetrol and awarded Ecopetrol
44,025
bbl of oil. GTEC has filed an appeal of the ruling to the Supreme Administrative Court (Consejo de Estado) in a second instance procedure. During the
year ended December 31, 2013
, based on market oil prices in Colombia, Gran Tierra accrued
$4.4 million
in the consolidated financial statements in relation to this dispute.
Gran Tierra’s production from the Costayaco Exploitation Area is subject to an additional royalty (the "HPR royalty"), which applies when cumulative gross production from an Exploitation Area is greater than
five MMbbl
. The HPR royalty is calculated on the difference between a trigger price defined in the Chaza Block exploration and production contract (the "Chaza Contract") and the sales price. The Agencia Nacional de Hidrocarburos (National Hydrocarbons Agency) (“ANH”) has interpreted the Chaza Contract as requiring that the HPR royalty must be paid with respect to all production from the Moqueta Exploitation Area and initiated a noncompliance procedure under the Chaza Contract, which was contested by Gran Tierra because the Moqueta Exploitation Area and the Costayaco Exploitation Area are separate Exploitation Areas. ANH did not proceed with that noncompliance procedure. Gran Tierra also believes that the evidence shows that the Costayaco and Moqueta fields are two clearly separate and independent hydrocarbon accumulations. Therefore, it is Gran Tierra’s view that, pursuant to the terms of the Chaza Contract, the HPR royalty is only to be paid with respect to production from the Moqueta Exploitation
111
Area when the accumulated oil production from that Exploitation Area exceeds five MMbbl. Discussions with the ANH have not resolved this issue and Gran Tierra has initiated the dispute resolution process under the Chaza Contract and filed an arbitration claim seeking a decision that the HPR royalty is not payable until production from the Moqueta Exploitation Area exceeds five MMbbl. The ANH has filed a response to the claim seeking a declaration that its interpretation is correct and a counterclaim seeking, amongst other remedies, declarations that Gran Tierra breached the Chaza Contract by not paying the disputed HPR royalty, that the amount of the alleged HPR royalty that is payable, and that the Chaza Contract be terminated. As at
December 31, 2013
, total cumulative production from the Moqueta Exploitation Area was
2.3 MMbbl
. The estimated compensation which would be payable on cumulative production to that date if the ANH is successful in the arbitration is
$38.4 million
. At this time no amount has been accrued in the financial statements nor deducted from the Company's reserves for the disputed HPR royalty as Gran Tierra does not consider it probable that a loss will be incurred.
Additionally, the ANH and Gran Tierra are engaged in discussions regarding the interpretation of whether certain transportation and related costs are eligible to be deducted in the calculation of the HPR royalty. Discussions with the ANH are ongoing. Based on our understanding of the ANH's position, the estimated compensation which would be payable if the ANH’s interpretation is correct could be up to
$28.9 million
as at
December 31, 2013
. At this time no amount has been accrued in the financial statements as Gran Tierra does not consider it probable that a loss will be incurred.
Gran Tierra has several other lawsuits and claims pending. Although the outcome of these lawsuits and disputes cannot be predicted with certainty, Gran Tierra believes the resolution of these matters would not have a material adverse effect on the Company’s consolidated financial position, results of operations or cash flows. Gran Tierra records costs as they are incurred or become probable and determinable.
12. Financial Instruments, Fair Value Measurements and Credit Risk
At
December 31, 2013
, the Company’s financial instruments recognized in the balance sheet consist of cash and cash equivalents, restricted cash, accounts receivable, accounts payable, accrued liabilities and contingent consideration and contingent liability included in other long-term liabilities. The fair value of long-term restricted cash approximates its carrying value because interest rates are variable and reflective of market rates.
Contingent consideration, which relates to the acquisition of the remaining
30%
working interest in certain properties in Brazil (Note 3), was recorded on the balance sheet at the acquisition date fair value based on the consideration expected to be transferred and discounted back to present value by applying an appropriate discount rate that reflected the risk factors associated with the payment streams. The discount rate used was determined at the time of measurement in accordance with accepted valuation methods. The contingent liability which relates to a dispute with Ecopetrol (Note 11) was based on the fair value of the amount awarded using market oil prices in Colombia. The fair value of the contingent consideration and contingent liability are being remeasured at the estimated fair value at each reporting period with the change in fair value recognized as income or expense in operating income. The fair value of the contingent consideration and this contingent liability at
December 31, 2013
and
December 31, 2012
were as follows:
|
As at December 31,
|
|||||||
|
(Thousands of U.S. Dollars)
|
2013
|
2012
|
|||||
|
Contingent consideration (Note 3)
|
$
|
1,061
|
|
$
|
1,061
|
|
|
|
Contingent liability (Note 11)
|
$
|
4,400
|
|
$
|
—
|
|
|
The fair values of other financial instruments approximate their carrying amounts due to the short-term maturity of these instruments. At
December 31, 2013
and
December 31, 2012
, the Company held no derivative instruments.
GAAP establishes a fair value hierarchy that prioritizes the inputs to valuation techniques used to measure fair value. This hierarchy consists of three broad levels. Level 1 inputs consist of quoted prices (unadjusted) in active markets for identical assets and liabilities and have the highest priority. Level 2 and 3 inputs are based on significant other observable inputs and significant unobservable inputs, respectively, and have lower priorities. The Company uses appropriate valuation techniques based on the available inputs to measure the fair values of assets and liabilities. At
December 31, 2013
, the fair value of the contingent liability which relates to a dispute with Ecopetrol (Note 11) was determined using Level 1 inputs and the fair value of the contingent consideration payable in connection with the Brazil acquisition (Note 3) was determined using Level 3 inputs. The disclosure in the paragraph above regarding the fair value of cash and restricted cash is based on Level 1 inputs.
Credit risk arises from the potential that the Company may incur a loss if a counterparty to a financial instrument fails to meet its obligation in accordance with agreed terms. The Company’s financial instruments that are exposed to concentrations of credit risk consist primarily of cash and accounts receivables. The carrying value of cash and accounts receivable reflects management’s assessment of credit risk
.
At
December 31, 2013
, cash and cash equivalents and restricted cash included balances in savings and checking accounts, as well as term deposits and certificates of deposit, placed primarily with financial institutions with strong investment grade ratings or governments, or the equivalent in the Company’s operating areas. Any foreign currency transactions are conducted on a spot basis with major financial institutions in the Company’s operating areas.
Most of the Company’s accounts receivable relate to uncollateralized sales to customers in the oil and natural gas industry and are exposed to typical industry credit risks. The concentration of revenues in a single industry affects the Company’s overall exposure to credit risk because customers may be similarly affected by changes in economic and other conditions. The Company manages this credit risk by entering into sales contracts with only credit worthy entities and reviewing its exposure to individual entities on a regular basis. For the
year ended
December 31, 2013
, the Company had
two
customers which were significant to the Colombian segment,
three
customers which were significant to the Argentine segment and
one
customer which was significant to the Brazil segment.
For the
year ended
December 31, 2013
,
86%
(
year ended
December 31, 2012
-
84%
,
year ended December 31, 2011
-
91%
) of the Company's revenue and other income was generated in Colombia.
Additionally, foreign exchange gains and losses mainly result from fluctuation of the U.S. dollar to the Colombian peso due to Gran Tierra’s current and deferred tax liabilities, which are monetary liabilities mainly denominated in the local currency of the Colombian foreign operations. As a result, foreign exchange gains and losses must be calculated on conversion to the U.S. dollar functional currency. A strengthening in the Colombian peso against the U.S. dollar results in foreign exchange losses, estimated at
$90,000
for each one peso decrease in the exchange rate of the Colombian peso to one U.S. dollar
.
In February 2014, the Company purchased non-deliverable forward contracts totaling
149.8 billion
Colombian Pesos for purposes of fixing the exchange rate at which it will purchase Colombian Pesos to settle its income tax installment payments due in April and June 2014. As a result, the Company will effectively settle its 2013 Colombian income tax liability at exchange rates ranging from
2,034
to
2,053
Colombian Pesos to the U.S. dollar.
The Argentina government has imposed a number of monetary and currency exchange control measures that include restrictions on the free disposition of funds deposited with banks and tight restrictions on transferring funds abroad, with certain exceptions for transfers related to foreign trade and other authorized transactions approved by the Argentina Central Bank. The Argentina Central Bank may require prior authorization and may or may not grant such authorization for Gran Tierra's Argentina subsidiaries to make payments. During the
year ended December 31, 2013
, the Company repatriated
$11.1 million
from one of its Argentina subsidiaries through loan repayments, authorized by the Argentina Central Bank. These were repayments of loan principal and as such had no withholding tax applied. At
December 31, 2013
,
$19.5 million
, or
5%
, of our cash and cash equivalents was deposited with banks in Argentina.
13. Credit Facilities
At
December 31, 2013
, a subsidiary of Gran Tierra had a credit facility with a syndicate of banks, led by Wells Fargo Bank National Association as administrative agent. This reserve-based facility has a current borrowing base of
$150 million
and a maximum borrowing base of up to
$300 million
and is supported by the present value of the petroleum reserves of
two
of the Company’s subsidiaries with operating branches in Colombia and the Company's subsidiary in Brazil. Amounts drawn down under the facility bear interest at the U.S. dollar LIBOR rate plus a margin ranging between
2.25%
and
3.25%
per annum depending on the rate of borrowing base utilization. In addition, a stand-by fee of
0.875%
per annum is charged on the unutilized balance of the committed borrowing base and is included in G&A expenses. The credit facility was entered into on August 30, 2013 and became effective on October 31, 2013 for a
three
-year term. As at
December 31, 2013
, the Company had not drawn down any amounts under this facility. Under the terms of the facility, the Company is required to maintain and was in compliance with certain financial and operating covenants. Under the terms of the credit facility, the Company cannot pay any dividends to its shareholders if it is in default under the facility and, if the Company is not in default, then it is required to obtain bank approval for any dividend payments exceeding
$2 million
in any fiscal year.
112
14. Related Party Transactions
On August 7, 2012, Gran Tierra entered into a contract related to the Brazil drilling program with a company for which one of Gran Tierra’s directors is a shareholder and was a director. During the
year ended December 31, 2013
,
$11.9 million
was incurred and capitalized under this contract and at
December 31, 2013
,
$2.0 million
was included in accounts payable relating to this contract. Similarly, on August 3, 2010, Gran Tierra entered into a contract related to the Peru drilling program with the same company and
$1.7 million
was incurred and capitalized under this contract during the
year ended December 31, 2012
, and at
December 31, 2012
,
$1.1 million
was included in accounts payable relating to this contract.
113
Supplementary Data (Unaudited)
1) Oil and Gas Producing Activities
In accordance with Financial Accounting Standards Board (FASB) Accounting Standards Codification Topic 932, “Extractive Activities—Oil and Gas,” and regulations of the U.S. Securities and Exchange Commission (SEC), the Company is making certain supplemental disclosures about its oil and gas exploration and production operations.
A. Reserve Quantity Information
Gran Tierra’s net proved reserves and changes in those reserves for operations are disclosed below. The net proved reserves represent management’s best estimate of proved oil and natural gas reserves after royalties. Reserve estimates for each property are prepared internally each year and 100% of the reserves have been evaluated by independent qualified reserves consultants, GLJ Petroleum Consultants.
Estimates of crude oil and natural gas proved reserves are determined through analysis of geological and engineering data, and demonstrate reasonable certainty that they are recoverable from known reservoirs under economic and operating conditions that existed at year end.
The determination of oil and natural gas reserves is complex and highly interpretive. Assumptions used to estimate reserve information may significantly increase or decrease such reserves in future periods. The estimates of reserves are subject to continuing changes and, therefore, an accurate determination of reserves may not be possible for many years because of the time needed for development, drilling, testing, and studies of reservoirs. See Critical Accounting Estimates in Item 7 for a description of Gran Tierra’s reserves estimation process.
114
Proved Reserves NAR (1)
|
Colombia
|
Argentina
|
Brazil
|
Total
|
|||||||||||||||||||||
|
Liquids (3)
|
Gas
|
Liquids (3)
|
Gas
|
Liquids (3)
|
Gas
|
Liquids (3)
|
Gas
|
|||||||||||||||||
|
(Mbbl)
|
(MMcf)
|
(Mbbl)
|
(MMcf)
|
(Mbbl)
|
(MMcf)
|
(Mbbl)
|
(MMcf)
|
|||||||||||||||||
|
Proved developed and undeveloped reserves, December 31, 2010
|
22,485
|
|
1,232
|
|
1,112
|
|
—
|
|
—
|
|
—
|
|
23,597
|
|
1,232
|
|
||||||||
|
Extensions and discoveries
|
4,009
|
|
—
|
|
47
|
|
—
|
|
—
|
|
—
|
|
4,056
|
|
—
|
|
||||||||
|
Purchases of reserves in place
|
238
|
|
13,797
|
|
4,639
|
|
4,825
|
|
396
|
|
—
|
|
5,273
|
|
18,622
|
|
||||||||
|
Production
|
(5,349
|
)
|
(268
|
)
|
(727
|
)
|
(1,143
|
)
|
(43
|
)
|
—
|
|
(6,119
|
)
|
(1,411
|
)
|
||||||||
|
Revisions of previous estimates
|
4,042
|
|
(121
|
)
|
72
|
|
—
|
|
—
|
|
—
|
|
4,114
|
|
(121
|
)
|
||||||||
|
Proved developed and undeveloped reserves, December 31, 2011
|
25,425
|
|
14,640
|
|
|
5,143
|
|
|
3,682
|
|
|
353
|
|
|
—
|
|
|
30,921
|
|
|
18,322
|
|
||
|
Extensions and discoveries
|
4,680
|
|
921
|
|
1,731
|
|
56
|
|
1,006
|
|
—
|
|
7,417
|
|
977
|
|
||||||||
|
Purchases of reserves in place
|
—
|
|
—
|
|
|
—
|
|
222
|
|
—
|
|
222
|
|
—
|
|
|||||||||
|
Production
|
(5,200
|
)
|
(138
|
)
|
(1,049
|
)
|
(1,346
|
)
|
(107
|
)
|
—
|
|
(6,356
|
)
|
(1,484
|
)
|
||||||||
|
Revisions of previous estimates
|
6,204
|
|
(5,951
|
)
|
(32
|
)
|
912
|
|
117
|
|
—
|
|
6,289
|
|
(5,039
|
)
|
||||||||
|
Proved developed and undeveloped reserves, December 31, 2012
|
31,109
|
|
9,472
|
|
|
5,793
|
|
|
3,304
|
|
|
1,591
|
|
|
—
|
|
|
38,493
|
|
|
12,776
|
|
||
|
Extensions and discoveries
|
4,625
|
|
—
|
|
29
|
|
1,115
|
|
—
|
|
—
|
|
4,654
|
|
1,115
|
|
||||||||
|
Purchases of reserves in place
|
—
|
|
—
|
|
—
|
|
—
|
|
—
|
|
—
|
|
—
|
|
—
|
|
||||||||
|
Production
|
(6,684
|
)
|
(82
|
)
|
(887
|
)
|
(1,338
|
)
|
(263
|
)
|
—
|
|
(7,834
|
)
|
(1,420
|
)
|
||||||||
|
Revisions of previous estimates
|
5,509
|
|
(614
|
)
|
(1,331
|
)
|
1,596
|
|
355
|
|
—
|
|
4,533
|
|
982
|
|
||||||||
|
Proved developed and undeveloped reserves, December 31, 2013
|
34,559
|
|
8,776
|
|
3,604
|
|
4,677
|
|
1,683
|
|
—
|
|
39,846
|
|
13,453
|
|
||||||||
|
Proved developed reserves, December 31, 2011 (2)
|
20,899
|
|
13,927
|
|
1,918
|
|
3,351
|
|
54
|
|
—
|
|
22,871
|
|
17,278
|
|
||||||||
|
Proved developed reserves, December 31, 2012 (2)
|
24,677
|
|
8,551
|
|
2,459
|
|
2,777
|
|
347
|
|
—
|
|
27,483
|
|
11,328
|
|
||||||||
|
Proved developed reserves, December 31, 2013 (2)
|
28,598
|
|
8,776
|
|
2,448
|
|
3,750
|
|
537
|
|
—
|
|
31,583
|
|
12,526
|
|
||||||||
|
Proved undeveloped reserves, December 31, 2011
|
4,526
|
|
713
|
|
|
3,225
|
|
|
331
|
|
|
299
|
|
|
—
|
|
|
8,050
|
|
|
1,044
|
|
||
|
Proved undeveloped reserves, December 31, 2012
|
6,432
|
|
921
|
|
|
3,334
|
|
|
527
|
|
|
1,244
|
|
|
—
|
|
|
11,010
|
|
|
1,448
|
|
||
|
Proved undeveloped reserves, December 31, 2013
|
5,961
|
|
—
|
|
|
1,156
|
|
|
927
|
|
|
1,146
|
|
|
—
|
|
|
8,263
|
|
|
927
|
|
||
(1) Proved oil and gas reserves are the estimated quantities of natural gas, crude oil, condensate and NGLs that geological and engineering data demonstrate with reasonable certainty can be recovered in future years from known reservoirs under existing economic and operating conditions. Reserves are considered “proved” if they can be produced economically, as demonstrated by either actual production or conclusive formation testing.
(2) Proved developed oil and gas reserves are expected to be recovered through existing wells with existing equipment and operating methods.
115
(3) Liquids include oil and NGLs. The Company has NGL reserves in small amounts in Colombia and Argentina only. Brazil liquids reserves are 100% oil.
B. Capitalized Costs
|
Proved Properties
|
Unproved Properties
|
Accumulated
depletion,
depreciation
and
impairment
|
Capitalized Costs
|
||||||||||||
|
Colombia
|
$
|
1,219,640
|
|
$
|
175,871
|
|
$
|
(558,423
|
)
|
$
|
837,088
|
|
|||
|
Argentina
|
215,030
|
|
42,284
|
|
(120,649
|
)
|
136,665
|
|
|||||||
|
Brazil
|
84,807
|
|
70,129
|
|
(28,158
|
)
|
126,778
|
|
|||||||
|
Peru
|
—
|
|
96,130
|
|
—
|
|
96,130
|
|
|||||||
|
Balance, December 31, 2012
|
$
|
1,519,477
|
|
$
|
384,414
|
|
$
|
(707,230
|
)
|
$
|
1,196,661
|
|
|||
|
Colombia
|
$
|
1,403,625
|
|
$
|
176,071
|
|
$
|
(733,028
|
)
|
$
|
846,668
|
|
|||
|
Argentina
|
258,758
|
|
18,238
|
|
(183,859
|
)
|
93,137
|
|
|||||||
|
Brazil
|
93,020
|
|
84,236
|
|
(44,447
|
)
|
132,809
|
|
|||||||
|
Peru
|
—
|
|
177,456
|
|
—
|
|
177,456
|
|
|||||||
|
Balance, December 31, 2013
|
$
|
1,755,403
|
|
|
$
|
456,001
|
|
|
$
|
(961,334
|
)
|
|
$
|
1,250,070
|
|
C. Costs Incurred
|
Colombia
|
Argentina
|
Brazil
|
Peru
|
Total
|
||||||||||||||||
|
Balance, December 31, 2010
|
$
|
941,539
|
|
$
|
73,843
|
|
$
|
—
|
|
$
|
40,633
|
|
$
|
1,056,015
|
|
|||||
|
Property acquisition costs
|
|
|||||||||||||||||||
|
Proved
|
—
|
|
58,458
|
|
4,601
|
|
—
|
|
63,059
|
|
||||||||||
|
Unproved
|
114,993
|
|
49,784
|
|
35,285
|
|
—
|
|
200,062
|
|
||||||||||
|
Exploration costs
|
54,486
|
|
11,270
|
|
17,225
|
|
34,461
|
|
117,442
|
|
||||||||||
|
Development costs
|
133,121
|
|
23,749
|
|
5,923
|
|
—
|
|
162,793
|
|
||||||||||
|
Balance, December 31, 2011
|
1,244,139
|
|
217,104
|
|
|
63,034
|
|
|
75,094
|
|
1,599,371
|
|
||||||||
|
Property acquisition costs
|
|
|||||||||||||||||||
|
Proved
|
24,403
|
|
—
|
|
24,106
|
|
—
|
|
48,509
|
|
||||||||||
|
Unproved
|
—
|
|
—
|
|
37,309
|
|
12,543
|
|
49,852
|
|
||||||||||
|
Exploration costs
|
32,472
|
|
1,310
|
|
19,128
|
|
51,493
|
|
104,403
|
|
||||||||||
|
Development costs
|
95,415
|
|
38,044
|
|
10,297
|
|
—
|
|
143,756
|
|
||||||||||
|
Balance, December 31, 2012
|
1,396,429
|
|
256,458
|
|
153,874
|
|
139,130
|
|
1,945,891
|
|
||||||||||
|
Property acquisition costs
|
|
|||||||||||||||||||
|
Proved
|
—
|
|
—
|
|
—
|
|
—
|
|
—
|
|
||||||||||
|
Unproved
|
—
|
|
(4,083
|
)
|
—
|
|
—
|
|
(4,083
|
)
|
||||||||||
|
Exploration costs
|
41,628
|
|
—
|
|
26,429
|
|
82,275
|
|
150,332
|
|
||||||||||
|
Development costs
|
144,790
|
|
22,601
|
|
(3,986
|
)
|
—
|
|
163,405
|
|
||||||||||
|
Balance, December 31, 2013
|
$
|
1,582,847
|
|
$
|
274,976
|
|
$
|
176,317
|
|
$
|
221,405
|
|
$
|
2,255,545
|
|
|||||
116
D. Results of Operations for Oil and Gas Producing Activities
|
Colombia
|
Argentina
|
Brazil
|
Peru
|
Total
|
|||||||||||||||
|
Year Ended December 31, 2011
|
|||||||||||||||||||
|
Oil and natural gas sales
|
$
|
543,999
|
|
$
|
48,016
|
|
$
|
4,176
|
|
$
|
—
|
|
$
|
596,191
|
|
||||
|
Production costs
|
(58,081
|
)
|
(27,076
|
)
|
(1,018
|
)
|
(322
|
)
|
(86,497
|
)
|
|||||||||
|
Exploration expenses
|
—
|
|
—
|
|
—
|
|
—
|
|
—
|
|
|||||||||
|
DD&A expenses
|
(141,133
|
)
|
(45,506
|
)
|
(1,819
|
)
|
(42,035
|
)
|
(230,493
|
)
|
|||||||||
|
Income tax expense
|
(114,255
|
)
|
5,489
|
|
—
|
|
(6
|
)
|
(108,772
|
)
|
|||||||||
|
Results of Operations
|
$
|
230,530
|
|
$
|
(19,077
|
)
|
|
$
|
1,339
|
|
|
$
|
(42,363
|
)
|
$
|
170,429
|
|
||
|
Year Ended December 31, 2012
|
|||||||||||||||||||
|
Oil and natural gas sales
|
$
|
493,615
|
|
$
|
79,642
|
|
$
|
9,852
|
|
$
|
—
|
|
$
|
583,109
|
|
||||
|
Production costs
|
(87,410
|
)
|
(32,696
|
)
|
(4,637
|
)
|
(160
|
)
|
(124,903
|
)
|
|||||||||
|
Exploration expenses
|
—
|
|
—
|
|
—
|
|
—
|
|
—
|
|
|||||||||
|
DD&A expenses
|
(122,055
|
)
|
(31,466
|
)
|
(26,300
|
)
|
(1,234
|
)
|
(181,055
|
)
|
|||||||||
|
Income tax expense
|
(95,042
|
)
|
(1,412
|
)
|
—
|
|
—
|
|
(96,454
|
)
|
|||||||||
|
Results of Operations
|
$
|
189,108
|
|
$
|
14,068
|
|
$
|
(21,085
|
)
|
$
|
(1,394
|
)
|
$
|
180,697
|
|
||||
|
Year Ended December 31, 2013
|
|||||||||||||||||||
|
Oil and natural gas sales
|
$
|
624,410
|
|
$
|
73,495
|
|
$
|
22,545
|
|
$
|
—
|
|
$
|
720,450
|
|
||||
|
Production costs
|
(102,861
|
)
|
(38,886
|
)
|
(7,311
|
)
|
—
|
|
(149,058
|
)
|
|||||||||
|
Exploration expenses
|
—
|
|
—
|
|
—
|
|
—
|
|
—
|
|
|||||||||
|
DD&A expenses
|
(184,697
|
)
|
(64,295
|
)
|
(16,761
|
)
|
(362
|
)
|
(266,115
|
)
|
|||||||||
|
Income tax expense
|
(115,546
|
)
|
(6,547
|
)
|
(11,091
|
)
|
(81
|
)
|
(133,265
|
)
|
|||||||||
|
Results of Operations
|
$
|
221,306
|
|
$
|
(36,233
|
)
|
$
|
(12,618
|
)
|
$
|
(443
|
)
|
$
|
172,012
|
|
||||
E. Standardized Measure of Discounted Future Net Cash Flows and Changes
The following disclosure is based on estimates of net proved reserves and the period during which they are expected to be produced. Future cash inflows are computed by applying the twelve month period unweighted arithmetic average of the price as of the first day of each month within that twelve month period, unless prices are defined by contractual arrangements, excluding escalations based on future conditions to Gran Tierra’s after royalty share of estimated annual future production from proved oil and gas reserves. The
2013
twelve month period unweighted arithmetic average of the wellhead price as of the first day of each month within that twelve month period was
$96.49
(2012 - $103.57; 2011 - $95.20) for Colombia,
$65.46
(2012 - $66.12; 2011 - $54.26) for Argentina and
$90.70
(2012 - $95.38; 2011 - $97.07) for Brazil. The calculated weighted average production costs at
December 31, 2013
, were
$11.89
(2012 - $18.49; 2011 - $10.10) for Colombia,
$26.10
(2012 - $22.99; 2011 - $28.50) for Argentina and
$20.43
(2012 - $5.71; 2011 - $15.65; 2010 - $nil) for Brazil. Future development and production costs to be incurred in producing and further developing the proved reserves are based on year end cost indicators. Future income taxes are computed by applying year end statutory tax rates. These rates reflect allowable deductions and tax credits, and are applied to the estimated pre-tax future net cash flows. Discounted future net cash flows are calculated using 10% mid-year discount factors. The calculations assume the continuation of existing economic, operating and contractual conditions. However, such arbitrary assumptions have not proved to be the case in the past. Other assumptions could give rise to substantially different results.
The Company believes this information does not in any way reflect the current economic value of its oil and gas producing properties or the present value of their estimated future cash flows as:
|
•
|
no economic value is attributed to probable and possible reserves;
|
|
•
|
use of a 10% discount rate is arbitrary; and
|
|
•
|
prices change constantly from the twelve month period unweighted arithmetic average of the price as of the first day of each month within that twelve month period.
|
117
|
Colombia
|
Argentina
|
Brazil
|
Total
|
||||||||||||
|
December 31, 2011
|
|||||||||||||||
|
Future cash inflows
|
$
|
2,535,662
|
|
$
|
331,554
|
|
$
|
34,244
|
|
$
|
2,901,460
|
|
|||
|
Future production costs
|
(459,955
|
)
|
(179,277
|
)
|
(11,667
|
)
|
(650,899
|
)
|
|||||||
|
Future development costs
|
(145,513
|
)
|
(50,742
|
)
|
(4,900
|
)
|
(201,155
|
)
|
|||||||
|
Future asset retirement obligations
|
(12,420
|
)
|
(3,063
|
)
|
(525
|
)
|
(16,008
|
)
|
|||||||
|
Future income tax expense
|
(500,700
|
)
|
(18,207
|
)
|
(1,215
|
)
|
(520,122
|
)
|
|||||||
|
Future net cash flows
|
1,417,074
|
|
|
80,265
|
|
|
15,937
|
|
1,513,276
|
|
|||||
|
10% discount
|
(369,112
|
)
|
(26,274
|
)
|
(2,543
|
)
|
(397,929
|
)
|
|||||||
|
Standardized Measure of Discounted Future Net Cash Flows
|
$
|
1,047,962
|
|
$
|
53,991
|
|
$
|
13,394
|
|
$
|
1,115,347
|
|
|||
|
December 31, 2012
|
|||||||||||||||
|
Future cash inflows
|
$
|
3,283,618
|
|
$
|
423,867
|
|
$
|
151,726
|
|
$
|
3,859,211
|
|
|||
|
Future production costs
|
(915,035
|
)
|
(193,434
|
)
|
(17,758
|
)
|
(1,126,227
|
)
|
|||||||
|
Future development costs
|
(204,658
|
)
|
(61,165
|
)
|
(27,550
|
)
|
(293,373
|
)
|
|||||||
|
Future asset retirement obligations
|
(13,360
|
)
|
(3,681
|
)
|
(1,750
|
)
|
(18,791
|
)
|
|||||||
|
Future income tax expense
|
(584,762
|
)
|
(44,023
|
)
|
—
|
|
(628,785
|
)
|
|||||||
|
Future net cash flows
|
1,565,803
|
|
121,564
|
|
104,668
|
|
1,792,035
|
|
|||||||
|
10% discount
|
(428,616
|
)
|
(36,006
|
)
|
(29,961
|
)
|
(494,583
|
)
|
|||||||
|
Standardized Measure of Discounted Future Net Cash Flows
|
$
|
1,137,187
|
|
$
|
85,558
|
|
$
|
74,707
|
|
|
$
|
1,297,452
|
|
||
|
December 31, 2013
|
|||||||||||||||
|
Future cash inflows
|
$
|
3,518,822
|
|
$
|
287,689
|
|
$
|
152,692
|
|
$
|
3,959,203
|
|
|||
|
Future production costs
|
(969,644
|
)
|
(132,184
|
)
|
(46,489
|
)
|
(1,148,317
|
)
|
|||||||
|
Future development costs
|
(194,178
|
)
|
(45,479
|
)
|
(10,800
|
)
|
(250,457
|
)
|
|||||||
|
Future asset retirement obligations
|
(13,540
|
)
|
(3,794
|
)
|
(2,500
|
)
|
(19,834
|
)
|
|||||||
|
Future income tax expense
|
(628,628
|
)
|
(21,929
|
)
|
—
|
|
(650,557
|
)
|
|||||||
|
Future net cash flows
|
1,712,832
|
|
84,303
|
|
92,903
|
|
1,890,038
|
|
|||||||
|
10% discount
|
(489,836
|
)
|
(29,767
|
)
|
(25,482
|
)
|
(545,085
|
)
|
|||||||
|
Standardized Measure of Discounted Future Net Cash Flows
|
$
|
1,222,996
|
|
$
|
54,536
|
|
$
|
67,421
|
|
$
|
1,344,953
|
|
|||
118
Changes in the Standardized Measure of Discounted Future Net Cash Flows
The following are the principal sources of change in the standardized measure of discounted future net cash flows:
|
2013
|
2012
|
2011
|
|||||||||
|
Balance, beginning of year
|
$
|
1,297,452
|
|
$
|
1,115,347
|
|
$
|
600,999
|
|
||
|
Sales and transfers of oil and gas produced, net of production costs
|
(571,391
|
)
|
(457,095
|
)
|
(491,046
|
)
|
|||||
|
Net changes in prices and production costs related to future production
|
(66,370
|
)
|
162,623
|
|
446,111
|
|
|||||
|
Extensions, discoveries and improved recovery, less related costs
|
239,125
|
|
342,906
|
|
206,762
|
|
|||||
|
Previously estimated development costs incurred during the year
|
127,255
|
|
90,801
|
|
106,291
|
|
|||||
|
Revisions of previous quantity estimates
|
262,888
|
|
286,995
|
|
242,761
|
|
|||||
|
Accretion of discount
|
175,980
|
|
149,850
|
|
81,422
|
|
|||||
|
Purchases of reserves in place
|
—
|
|
10,422
|
|
93,071
|
|
|||||
|
Sales of reserves in place
|
—
|
|
—
|
|
—
|
|
|||||
|
Net change in income taxes
|
(26,943
|
)
|
(198,808
|
)
|
(148,529
|
)
|
|||||
|
Changes in future development costs
|
(93,043
|
)
|
(205,589
|
)
|
(22,495
|
)
|
|||||
|
Net increase
|
47,501
|
|
182,105
|
|
514,348
|
|
|||||
|
Balance, end of year
|
$
|
1,344,953
|
|
$
|
1,297,452
|
|
$
|
1,115,347
|
|
||
2) Summarized Quarterly Financial Information
|
Revenue and other Income
|
Expenses
|
Income before income taxes
|
Income taxes
|
Net income (loss)
|
Net income (loss) per share - basic
|
Net income (loss) per share - diluted
|
||||||||||||||||||||||
|
2013
|
||||||||||||||||||||||||||||
|
First quarter
|
$
|
205,371
|
|
$
|
110,019
|
|
$
|
95,352
|
|
$
|
(37,439
|
)
|
$
|
57,913
|
|
$
|
0.21
|
|
$
|
0.20
|
|
|||||||
|
Second quarter
|
168,810
|
|
94,690
|
|
74,120
|
|
(26,337
|
)
|
47,783
|
|
0.17
|
|
0.17
|
|
||||||||||||||
|
Third quarter
|
189,658
|
|
111,016
|
|
78,642
|
|
(45,585
|
)
|
33,057
|
|
0.12
|
|
0.12
|
|
||||||||||||||
|
Fourth quarter
|
159,804
|
|
146,082
|
|
13,722
|
|
(26,187
|
)
|
(12,465
|
)
|
(0.04
|
)
|
(0.04
|
)
|
||||||||||||||
|
$
|
723,643
|
|
$
|
461,807
|
|
|
$
|
261,836
|
|
|
$
|
(135,548
|
)
|
|
$
|
126,288
|
|
$
|
0.45
|
|
$
|
0.44
|
|
|||||
|
2012
|
||||||||||||||||||||||||||||
|
First quarter
|
$
|
155,951
|
|
$
|
125,128
|
|
$
|
30,823
|
|
$
|
(31,136
|
)
|
$
|
(313
|
)
|
$
|
—
|
|
$
|
—
|
|
|||||||
|
Second quarter
|
115,150
|
|
82,310
|
|
32,840
|
|
(19,736
|
)
|
13,104
|
|
0.05
|
|
0.05
|
|
||||||||||||||
|
Third quarter
|
168,933
|
|
92,920
|
|
76,013
|
|
(31,408
|
)
|
44,605
|
|
0.16
|
|
0.16
|
|
||||||||||||||
|
Fourth quarter
|
145,153
|
|
87,466
|
|
57,687
|
|
(15,424
|
)
|
42,263
|
|
0.15
|
|
0.15
|
|
||||||||||||||
|
$
|
585,187
|
|
$
|
387,824
|
|
|
$
|
197,363
|
|
|
$
|
(97,704
|
)
|
|
$
|
99,659
|
|
$
|
0.35
|
|
$
|
0.35
|
|
|||||
Item 9.
Changes in and Disagreements with Accountants on Accounting and Financial Disclosure
None.
119
Item 9A.
Controls and Procedures
Disclosure Controls and Procedures
We have established disclosure controls and procedures (as defined in Rules 13a-15(e) and 15d-15(e) under the Securities Exchange Act of 1934, or Exchange Act). Our management, including our Chief Executive Officer and Chief Financial Officer, evaluated the effectiveness of the design and operation of our disclosure controls and procedures as of the end of the period covered by this report, as required by Rule l3a-15(e) of the Exchange Act. Based on their evaluation, our principal executive and principal financial officers have concluded that Gran Tierra's disclosure controls and procedures were effective as of
December 31, 2013
to provide reasonable assurance that the information required to be disclosed by Gran Tierra in the reports that it files or submits under the Exchange Act is recorded, processed, summarized and reported within the time periods specified in the SEC rules and forms and that such information is accumulated and communicated to management, including our Chief Executive Officer and Chief Financial Officer, as appropriate, to allow timely decisions regarding required disclosure.
Management’s Annual Report on Internal Control Over Financial Reporting
Gran Tierra’s management is responsible for establishing and maintaining adequate internal control over financial reporting for Gran Tierra, as such term is defined in Rules 13a-15(f) and 15d-15(f) under the Exchange Act. Under the supervision and with the participation of Gran Tierra’s management, including our principal executive and principal financial officers, Gran Tierra conducted an evaluation of the effectiveness of its internal control over financial reporting based on the framework in
Internal Control — Integrated Framework
issued by the Committee of Sponsoring Organizations of the Treadway Commission in 1992 (the “1992 COSO Framework”). Based on this evaluation under the 1992 COSO Framework, management concluded that its internal control over financial reporting was effective as of
December 31, 2013
. The effectiveness of Gran Tierra’s internal control over financial reporting as of
December 31, 2013
has been audited by Deloitte LLP, independent registered public accounting firm, as stated in their report which appears herein.
Changes in Internal Control over Financial Reporting
There were no changes in our internal control over financial reporting during the quarter ended
December 31, 2013
, that have materially affected, or are reasonably likely to materially affect, our internal control over financial reporting. On May 14, 2013, the Committee of Sponsoring Organizations of the Treadway Commission published an updated
Internal Control - Integrated Framework
and related illustrative documents which will supersede the 1992 COSO Framework. As of
December 31, 2013
, Gran Tierra was utilizing the original framework published in 1992.
120
Report of Independent Registered Public Accounting Firm
To the Board of Directors and Shareholders of Gran Tierra Energy Inc.
We have audited the internal control over financial reporting of Gran Tierra Energy Inc. and subsidiaries (the “Company”) as of
December 31, 2013
, based on the criteria established in
Internal Control — Integrated Framework
(
1992
) issued by the Committee of Sponsoring Organizations of the Treadway Commission. The Company's management is responsible for maintaining effective internal control over financial reporting and for its assessment of the effectiveness of internal control over financial reporting, included in the accompanying Management’s Annual Report on Internal Control Over Financial Reporting. Our responsibility is to express an opinion on the Company's internal control over financial reporting based on our audit.
We conducted our audit in accordance with the standards of the Public Company Accounting Oversight Board (United States). Those standards require that we plan and perform the audit to obtain reasonable assurance about whether effective internal control over financial reporting was maintained in all material respects. Our audit included obtaining an understanding of internal control over financial reporting, assessing the risk that a material weakness exists, testing and evaluating the design and operating effectiveness of internal control based on the assessed risk, and performing such other procedures as we considered necessary in the circumstances. We believe that our audit provides a reasonable basis for our opinion.
A company's internal control over financial reporting is a process designed by, or under the supervision of, the company's principal executive and principal financial officers, or persons performing similar functions, and effected by the company's board of directors, management, and other personnel to provide reasonable assurance regarding the reliability of financial reporting and the preparation of financial statements for external purposes in accordance with generally accepted accounting principles. A company's internal control over financial reporting includes those policies and procedures that (1) pertain to the maintenance of records that, in reasonable detail, accurately and fairly reflect the transactions and dispositions of the assets of the company; (2) provide reasonable assurance that transactions are recorded as necessary to permit preparation of financial statements in accordance with generally accepted accounting principles, and that receipts and expenditures of the company are being made only in accordance with authorizations of management and directors of the company; and (3) provide reasonable assurance regarding prevention or timely detection of unauthorized acquisition, use, or disposition of the company's assets that could have a material effect on the financial statements.
Because of the inherent limitations of internal control over financial reporting, including the possibility of collusion or improper management override of controls, material misstatements due to error or fraud may not be prevented or detected on a timely basis. Also, projections of any evaluation of the effectiveness of the internal control over financial reporting to future periods are subject to the risk that the controls may become inadequate because of changes in conditions, or that the degree of compliance with the policies or procedures may deteriorate.
In our opinion, the Company maintained, in all material respects, effective internal control over financial reporting as of
December 31, 2013
, based on the criteria established in
Internal Control — Integrated Framework
(1992)
issued by the Committee of Sponsoring Organizations of the Treadway Commission.
We have also audited, in accordance with Canadian generally accepted auditing standards and the standards of the Public Company Accounting Oversight Board (United States), the consolidated financial statements as of and for the year ended
December 31, 2013
of the Company and our report dated
February 25, 2014
expressed an unqualified opinion on those financial statements.
/s/ Deloitte LLP
Chartered Accountants
February 25, 2014
Calgary, Canada
121
Item 9B.
Other Information
None.
Item 10.
Directors, Executive Officers and Corporate Governance
The information required regarding our directors is incorporated herein by reference from the information contained in the section entitled “Proposal 1 - Election of Directors” in our definitive Proxy Statement for the
2014
Annual Meeting of Stockholders (our “Proxy Statement”), a copy of which will be filed with the Securities and Exchange Commission within 120 days after
December 31, 2013
. For information with respect to our executive officers, see “Executive Officers of the Registrant” at the end of Part I of this report, following Item 4.
The information required regarding Section 16(a) beneficial ownership reporting compliance is incorporated by reference from the information contained in the section entitled “Section 16(a) Beneficial Ownership Reporting Compliance” in our Proxy Statement.
The information required with respect to procedures by which security holders may recommend nominees to our Board of Directors, the composition of our Audit Committee, and whether we have an “audit committee financial expert”, is incorporated by reference from the information contained in the section entitled “Proposal 1 - Election of Directors” in our Proxy Statement.
Adoption of Code of Ethics
Gran Tierra has adopted a Code of Business Conduct and Ethics (the “Code”) applicable to all of its Board members, employees and executive officers, including its Chief Executive Officer (Principal Executive Officer), and Chief Financial Officer (Principal Financial Officer and Principal Accounting Officer). Gran Tierra has made the Code available on its website at http://www.grantierra.com/corporate-responsibility.html.
Gran Tierra intends to satisfy the public disclosure requirements regarding (1) any amendments to the Code, or (2) any waivers under the Code given to Gran Tierra’s Principal Executive Officer, Principal Financial Officer and Principal Accounting Officer by posting such information on its website at http://www.grantierra.com/corporate-responsibility.html. There were no amendments to the Code or waivers granted thereunder relating to the Principal Executive Officer, Principal Financial Officer or Principal Accounting Officer during
2013
.
Item 11.
Executive Compensation
The information required regarding the compensation of our directors and executive officers is incorporated herein by reference from the information contained in the section entitled “Executive Compensation and Related Information” in our Proxy Statement, including under the subheadings “Director Compensation,” “Compensation Committee Report” and “Compensation Committee Interlocks and Insider Participation”.
Item 12.
Security Ownership of Certain Beneficial Owners and Management and Related Stockholder Matters
The information required regarding security ownership of our 10% or greater stockholders and of our directors and management is incorporated herein by reference from the information contained in the section entitled “Security Ownership of Certain Beneficial Owners and Management” in our Proxy Statement.
The following table provides certain information with respect to securities authorized for issuance under Gran Tierra’s equity compensation plans in effect as of the end of
December 31, 2013
:
122
Equity Compensation Plan Information
|
Plan category
|
Number of securities to be issued upon exercise of options
|
Weighted average exercise price of
outstanding options |
Number of securities remaining available for future issuance
|
||||||
|
Equity compensation plans approved by security holders
|
15,668,458
|
|
5.41
|
|
16,157,691
|
|
|||
|
Equity compensation plans not approved by security holders
|
—
|
|
—
|
|
—
|
|
|||
|
15,668,458
|
|
5.41
|
|
16,157,691
|
|
||||
The only equity compensation plan approved by our stockholders is our 2007 Equity Incentive Plan, which is an amendment and restatement of our 2005 Equity Plan.
Item 13.
Certain Relationships and Related Transactions, and Director Independence
The information required regarding related transactions is incorporated herein by reference from the information contained in the section entitled “Certain Relationships and Related Transactions” and, with respect to director independence, the section entitled “Proposal 1 - Election of Directors”, in our Proxy Statement.
Item 14.
Principal Accounting Fees and Services
The information required is incorporated herein by reference from the information contained in the sections entitled “Principal Accountant Fees and Services” and “Pre-Approval Policies and Procedures” in the proposal entitled “Ratification of Selection of Independent Auditors” in our Proxy Statement.
Item 15.
Exhibits, Financial Statement Schedules
(a) The following documents are filed as part of this Annual Report on Form 10-K:
(1) Financial Statements
The following documents are included as Part II, Item 8. of this Annual Report on Form 10-K:
|
Page
|
|
|
Report of Independent Registered Public Accounting Firm
|
|
|
Consolidated Statements of Operations and Retained Earnings
|
|
|
Consolidated Balance Sheets
|
|
|
Consolidated Statements of Cash Flow
|
|
|
Consolidated Statements of Shareholders’ Equity
|
|
|
Notes to the Consolidated Financial Statements
|
|
|
Supplementary Data (Unaudited)
|
|
(2) Financial Statement Schedules
None.
(3) Exhibits
See the Exhibit Index which follows the signature page of this Annual Report on Form 10-K, which is incorporated herein by reference.
123
SIGNATURES
Pursuant to the requirements of Section 13 or 15(d) of the Securities Exchange Act of 1934, the registrant has duly caused this report to be signed on its behalf by the undersigned thereunto duly authorized.
GRAN TIERRA ENERGY INC.
|
Date: February 25, 2014
|
/s/ Dana Coffield
|
|
|
|
By: Dana Coffield
|
|
|
|
Chief Executive Officer and President
|
|
|
|
(Principal Executive Officer)
|
|
|
Date: February 25, 2014
|
/s/ James Rozon
|
|
|
|
By: James Rozon
|
|
|
Chief Financial Officer
|
||
|
|
(Principal Financial and Accounting Officer)
|
|
124
POWER OF ATTORNEY
KNOW ALL PERSONS BY THESE PRESENTS, that each person whose signature appears below constitutes and appoints Dana Coffield and James Rozon, and each of them, as his true and lawful attorneys-in-fact and agents, with full power of substitution and resubstitution, for him and in his name, place and stead, in any and all capacities, to sign any and all amendments (including post-effective amendments) to this Annual Report on Form 10-K, and to file the same, with all exhibits thereto, and other documents in connection therewith, with the Securities and Exchange Commission, granting unto said attorneys-in-fact and agents, and each of them, full power and authority to do and perform each and every act and thing requisite and necessary to be done in connection therewith, as fully to all intents and purposes as he might or could do in person, hereby ratifying and confirming all that said attorneys-in-fact and agents, or any of them, or their or his substitute or substitutes, may lawfully do or cause to be done by virtue hereof.
Pursuant to the requirements of the Securities Exchange Act of 1934, this report has been signed below by the following persons on behalf of the registrant and in the capacities and on the dates indicated:
|
Name
|
Title
|
Date
|
||
|
/s/ Dana Coffield
|
Chief Executive Officer and President
|
February 25, 2014
|
||
|
Dana Coffield
|
(Principal Executive Officer)
|
|||
|
/s/ James Rozon
|
Chief Financial Officer
|
February 25, 2014
|
||
|
James Rozon
|
(Principal Financial and Accounting Officer)
|
|||
|
/s/ Jeffrey Scott
|
Chairman of the Board, Director
|
February 25, 2014
|
||
|
Jeffrey Scott
|
||||
|
/s/ Verne Johnson
|
Director
|
February 25, 2014
|
||
|
Verne Johnson
|
||||
|
/s/ Nicholas G. Kirton
|
Director
|
February 25, 2014
|
||
|
Nicholas G. Kirton
|
||||
|
/s/ J. Scott Price
|
Director
|
February 25, 2014
|
||
|
J. Scott Price
|
||||
|
/s/ Gerry Macey
|
Director
|
February 25, 2014
|
||
|
Gerry Macey
|
||||
125
EXHIBIT INDEX
|
Exhibit No.
|
Description
|
Reference
|
|
|
2.1
|
Arrangement Agreement, dated as of July 28, 2008, by and among Gran Tierra Energy Inc., Solana Resources Limited and Gran Tierra Exchangeco Inc.
|
Incorporated by reference to Exhibit 2.1 to the Current Report on Form 8-K (SEC File No. 001-34018), filed with the SEC on August 1, 2008.
|
|
|
|
|
|
|
|
2.2
|
Amendment No. 2 to Arrangement Agreement, which supersedes Amendment No. 1 thereto and includes the Plan of Arrangement, including appendices.
|
Incorporated by reference to Exhibit 2.2 to the Registration Statement on Form S-3 (SEC File No. 333-153376), filed with the SEC on October 10, 2008.
|
|
|
|
|
|
|
|
2.3
|
Arrangement Agreement, dated January 17, 2011, by and between Gran Tierra Energy Inc. and Petrolifera Petroleum Limited.
+
|
Incorporated by reference to Exhibit 2.1 to the Current Report on Form 8-K, filed with the SEC on January 21, 2011 (SEC File No. 001-34018).
|
|
|
|
|
|
|
|
3.1
|
Amended and Restated Articles of Incorporation.
|
Filed herewith.
|
|
|
|
|
|
|
|
3.2
|
Amended and Restated Bylaws of Gran Tierra Energy Inc.
|
Incorporated by reference to Exhibit 3.1 to the Current Report on Form 8-K filed with the SEC on February 27, 2013 (SEC File No. 001-34018).
|
|
|
|
|
|
|
|
4.1
|
Reference is made to Exhibits 3.1 to 3.2.
|
|
|
|
|
|
|
|
|
4.2
|
Details of the Goldstrike Special Voting Share.
|
Incorporated by reference to Exhibit 10.14 to the Annual Report on Form 10-KSB/A for the period ended December 31, 2005, and filed with the SEC on April 21, 2006 (SEC File No. 333-111656).
|
|
|
|
|
|
|
|
4.3
|
Goldstrike Exchangeable Share Provisions.
|
Incorporated by reference to Exhibit 10.15 to the Annual Report on Form 10-KSB/A for the period ended December 31, 2005 and filed with the SEC on April 21, 2006 (SEC File No. 333-111656).
|
|
|
|
|
|
|
|
4.4
|
Provisions Attaching to the GTE–Solana Exchangeable Shares.
|
Incorporated by reference to Annex E to the Proxy Statement on Schedule 14A filed with the SEC on October 14, 2008 (SEC File No. 001-34018).
|
|
|
|
|
||
|
10.1
|
Voting Exchange and Support Agreement by and between Goldstrike, Inc., 1203647 Alberta Inc., Gran Tierra Goldstrike Inc. and Olympia Trust Company dated as of November 10, 2005.
|
Incorporated by reference to Exhibit 10.3 to the Current Report on Form 8-K filed with the Securities and Exchange Commission on November 10, 2005 (SEC File No. 333-111656).
|
|
|
|
|
||
|
10.2
|
Voting and Exchange Trust Agreement, dated as of November 14, 2008, between Gran Tierra Energy Inc., Gran Tierra Exchangeco Inc. and Computershare Trust Company of Canada.
|
Incorporated by reference to Exhibit 10.1 to the Current Report on Form 8-K filed with the Securities and Exchange Commission on November 17, 2008 (SEC File No. 001-34018).
|
|
|
|
|
||
|
10.3
|
Support Agreement, dated as of November 14, 2008, between Gran Tierra Energy Inc., Gran Tierra Callco ULC and Gran Tierra Exchangeco Inc.
|
Incorporated by reference to Exhibit 10.2 to the Current Report on Form 8-K, filed with the SEC on November 17, 2008 (SEC File No. 001-34018).
|
|
|
|
|
|
|
|
10.4
|
Amended and Restated 2007 Equity Incentive Plan. *
|
Incorporated by reference to Exhibit 10.6 to the Quarterly Report on Form 10-Q filed with the Securities and Exchange Commission on August 7, 2012 (SEC File No. 001-34018).
|
|
|
|
|
|
|
|
10.5
|
Form of Option Agreement under the Company's 2007 Equity Incentive Plan. *
|
Incorporated by reference to Exhibit 99.1 to the current report on Form 8-K filed with the Securities and Exchange Commission on December 21, 2007 (SEC File No. 000-52594).
|
|
|
|
|
|
|
|
10.6
|
Form of Grant Notice under the Company's 2007 Equity Incentive Plan. *
|
Incorporated by reference to Exhibit 99.2 to the current report on Form 8-K filed with the Securities and Exchange Commission on December 21, 2007 (SEC File No. 000-52594).
|
|
|
|
|
|
|
126
|
10.7
|
Form of Exercise Notice under the Company's 2007 Equity Incentive Plan. *
|
Incorporated by reference to Exhibit 99.3 to the current report on Form 8-K filed with the Securities and Exchange Commission on December 21, 2007 (SEC File No. 000-52594).
|
|
|
|
|
|
|
|
10.8
|
Form of Indemnity Agreement. *
|
Incorporated by reference to Exhibit 99.1 to the Current Report on Form 8-K filed with the Securities and Exchange Commission on April 2, 2008 (SEC File No. 000-52594).
|
|
|
|
|
|
|
|
10.9
|
2005 Equity Incentive Plan. *
|
Incorporated by reference to Exhibit 10.11 to the Current Report on Form 8-K filed with the Securities and Exchange Commission on November 10, 2005 (SEC File No. 333-111656).
|
|
|
|
|||
|
10.10
|
2012 Cash Compensation Arrangements. *
|
Incorporated by reference to Exhibit 10.7 to the Quarterly Report on Form 10-Q filed with the Securities and Exchange Commission on May 7, 2012, with respect to 2012 Cash Compensation Arrangements (SEC File No. 001-34018).
|
|
|
|
|||
|
10.11
|
Employment Agreement, dated November 4, 2008, between Gran Tierra Energy Inc. and Dana Coffield. *
|
Incorporated by reference to Exhibit 10.58 to the Annual Report on Form 10-K, filed with the SEC on February 27, 2009 (SEC File No. 001-34018).
|
|
|
|
|
||
|
10.12
|
Employment Agreement, dated June 17, 2008, between Gran Tierra Energy Inc. and Rafael Orunesu. *
|
Incorporated by reference to Exhibit 10.61 to the Quarterly Report on Form 10-Q, filed with the SEC on August 11, 2008 (SEC File No. 001-34018).
|
|
|
|
|
||
|
10.13
|
Offer Letter between Gran Tierra Energy Inc. and Shane P. O'Leary dated January 26, 2009. *
|
Incorporated by reference to Exhibit 10.1 to the Current Report on Form 8-K, filed with the SEC on February 4, 2009 (SEC File No. 001-34018).
|
|
|
|
|
||
|
10.14
|
Employment Agreement between Gran Tierra Energy Inc. and Shane P. O'Leary dated as of January 26, 2009. *
|
Incorporated by reference to Exhibit 10.2 to the Current Report on Form 8-K, filed with the SEC on February 4, 2009 (SEC File No. 001-34018).
|
|
|
10.15
|
Employment Agreement, dated July 1, 2009, between Gran Tierra Energy Inc. and Julio César Moreira. *
|
Incorporated by reference to Exhibit 10.62 to the Annual Report on Form 10-K for the period ended December 31, 2009, and filed with the Securities and Exchange on February 26, 2010 (SEC File No. 001-34018).
|
|
|
10.16
|
Colombian Participation Agreement, dated as of June 22, 2006, by and among Argosy Energy International, Gran Tierra Energy Inc., and Crosby Capital, LLC.
|
Incorporated by reference to Exhibit 10.55 to the Quarterly Report on Form 10-Q, filed with the SEC on August 11, 2008 (SEC File No. 333-111656).
|
|
|
|
|
||
|
10.17
|
Amendment No. 1 to Colombian Participation Agreement, dated as of November 1, 2006, by and among Argosy Energy International, Gran Tierra Energy Inc., and Crosby Capital, LLC.
|
Incorporated by reference to Exhibit 10.56 to the Quarterly Report on Form 10-Q, filed with the SEC on August 11, 2008 (SEC File No. 001-34018).
|
|
|
|
|
||
|
10.18
|
Amendment No. 2 to Colombian Participation Agreement, dated as of July 3, 2008, between Gran Tierra Energy Inc. and Crosby Capital, LLC.
|
Incorporated by reference to Exhibit 10.3 to the Quarterly Report on Form 10-Q/A, filed with the SEC on November 19, 2008 (SEC File No. 001-34018).
|
|
|
|
|
||
|
10.19
|
Amendment No. 3 to Participation Agreement, dated as of December 31, 2008, by and among Gran Tierra Energy Colombia, Ltd., Gran Tierra Energy Inc. and Crosby Capital, LLC.
|
Incorporated by reference to Exhibit 10.1 to the Current Report on Form 8-K, filed with the SEC on January 7, 2009 (SEC File No. 001-34018).
|
|
|
10.20
|
Form of Voting Support Agreement Respecting the Arrangement Involving Petrolifera Petroleum Limited and Gran Tierra Energy Inc. (Petrolifera Directors and Officers)
|
Incorporated by reference to Exhibit 10.1 to the Current Report on Form 8-K, filed with the SEC on January 21, 2011 (SEC File No. 001-34018).
|
|
|
|
|
||
|
10.21
|
Form of Voting Support Agreement Respecting the Arrangement Involving Petrolifera Petroleum Limited and Gran Tierra Energy Inc. (Petrolifera largest stockholder)
|
Incorporated by reference to Exhibit 10.2 to the Current Report on Form 8-K, filed with the SEC on January 21, 2011 (SEC File No. 001-34018).
|
|
127
|
10.22
|
Credit Agreement, dated as of July 30, 2010, among Solana Resources Limited, Gran Tierra Energy Inc., the Lenders party thereto, and BNP Paribas.
|
Incorporated by reference to Exhibit 10.2 to the Current Report on Form 8-K filed with the Securities and Exchange Commission on August 5, 2010 (SEC File No. 001-34018).
|
|
|
10.23
|
First Amendment to Credit Agreement, dated as of August 30, 2010, among Solana Resources Limited, Gran Tierra Energy Inc., BNP Paribas and Other Lenders.
|
Incorporated by reference to Exhibit 10.2 to the Quarterly Report on Form 10-Q filed with the Securities and Exchange Commission on November 5, 2010 (SEC File No. 001-34018).
|
|
|
10.24
|
Second Amendment to Credit Agreement, dated as of November 5, 2010, among Solana Resources Limited, Gran Tierra Energy Inc., BNP Paribas and Other Lenders.
|
Incorporated by reference to Exhibit 10.46 to the Annual Report on Form 10-K, filed with the SEC on February 25, 2011 (SEC File No. 001-34018).
|
|
|
10.25
|
Third Amendment to Credit Agreement, dated as of January 20, 2011, among Solana Resources Limited, Gran Tierra Energy Inc., BNP Paribas and Other Lenders.
|
Incorporated by reference to Exhibit 10.47 to the Annual Report on Form 10-K, filed with the SEC on February 25, 2011 (SEC File No. 001-34018).
|
|
|
10.26
|
Contract, dated July 27, 2011, between Gran Tierra Colombia Ltd. and Ecopetrol S.A., for the Purchase and Sale of Crude Oil from the Chaza, Santana and Guayuyaco Blocks.
|
Incorporated by reference to Exhibit 10.3 to the Quarterly Report on Form 10-Q filed with the Securities and Exchange Commission on August 9, 2011 (SEC File No. 001-34018).
|
|
|
|
|
||
|
10.27
|
Contract, dated July 27, 2011, between Solana Petroleum Exploration Colombia Ltd. and Ecopetrol S.A., for the Purchase and Sale of Crude Oil from the Chaza, Santana and Guayuyaco Blocks.
|
Incorporated by reference to Exhibit 10.4 to the Quarterly Report on Form 10-Q filed with the Securities and Exchange Commission on August 9, 2011 (SEC File No. 001-34018).
|
|
|
|
|
||
|
10.28
|
Executive Employment Agreement dated July 30, 2009, between Gran Tierra Energy Inc. and Duncan Nightingale. *
|
Incorporated by reference to Exhibit 10.2 to the Quarterly Report on Form 10-Q filed with the Securities and Exchange Commission on November 8, 2011 (SEC File No. 001-34018).
|
|
|
|
|
||
|
10.29
|
Expatriate Assignment Agreement to Gran Tierra Colombia Ltd., dated December 7, 2010, between Gran Tierra Energy Inc. and Duncan Nightingale. *
|
Incorporated by reference to Exhibit 10.3 to the Quarterly Report on Form 10-Q filed with the Securities and Exchange Commission on November 8, 2011 (SEC File No. 001-34018).
|
|
|
|
|||
|
10.30
|
Employment Contract dated January 31, 2011, between Gran Tierra Colombia Ltd. and Duncan Nightingale. *
|
Incorporated by reference to Exhibit 10.4 to the Quarterly Report on Form 10-Q filed with the Securities and Exchange Commission on November 8, 2011 (SEC File No. 001-34018).
|
|
|
|
|||
|
10.31
|
Amendment to Expatriate Assignment Agreement, dated October 13, 2011, between Gran Tierra Energy Inc. and Duncan Nightingale. *
|
Incorporated by reference to Exhibit 10.5 to the Quarterly Report on Form 10-Q filed with the Securities and Exchange Commission on November 8, 2011 (SEC File No. 001-34018).
|
|
|
|
|
||
|
10.32
|
Executive Employment Agreement, dated January 20, 2010, between Gran Tierra Energy Inc. and David Hardy. *
|
Incorporated by reference to Exhibit 10.6 to the Quarterly Report on Form 10-Q filed with the Securities and Exchange Commission on May 10, 2011 (SEC File No. 001-34018).
|
|
|
10.33
|
Notice of termination of contract dated December 2, 2011, regarding the contract dated July 27, 2011, between Gran Tierra Colombia Ltd. and Ecopetrol S.A., for the Purchase and Sale of Crude Oil from the Chaza, Santana and Guayuyaco Blocks.
|
Incorporated by reference to Exhibit 10.53 to the Annual Report on Form 10-K filed with the Securities and Exchange Commission on February 27, 2012 (SEC File No. 001-34018).
|
|
|
|
|||
|
10.34
|
Notice of termination of contract dated December 2, 2011, regarding the contract, dated July 27, 2011, between Solana Petroleum Exploration Colombia Ltd. and Ecopetrol S.A., for the Purchase and Sale of Crude Oil from the Chaza, Santana and Guayuyaco Blocks.
|
Incorporated by reference to Exhibit 10.54 to the Annual Report on Form 10-K filed with the Securities and Exchange Commission on February 27, 2012 (SEC File No. 001-34018).
|
|
|
|
|||
128
|
10.35
|
Amendment dated December 22, 2011, to notice of termination of contract dated December 2, 2011, regarding the contract dated July 27, 2011, between Gran Tierra Colombia Ltd. and Ecopetrol S.A., for the Purchase and Sale of Crude Oil from the Chaza, Santana and Guayuyaco Blocks.
|
Incorporated by reference to Exhibit 10.55 to the Annual Report on Form 10-K filed with the Securities and Exchange Commission on February 27, 2012 (SEC File No. 001-34018).
|
|
|
|
|||
|
10.36
|
Amendment dated December 22, 2011, to notice of termination of contract dated December 2, 2011, regarding the contract, dated July 27, 2011, between Solana Petroleum Exploration Colombia Ltd. and Ecopetrol S.A., for the Purchase and Sale of Crude Oil from the Chaza, Santana and Guayuyaco Blocks.
|
Incorporated by reference to Exhibit 10.56 to the Annual Report on Form 10-K filed with the Securities and Exchange Commission on February 27, 2012 (SEC File No. 001-34018).
|
|
|
10.37
|
Amendment dated January 30, 2012, to contract, dated July 27, 2011, between Gran Tierra Colombia Ltd and Ecopetrol S.A., for the Purchase and Sale of Crude Oil from the Chaza, Santana and Guayuyaco Blocks.
|
Incorporated by reference to Exhibit 10.58 to the Annual Report on Form 10-K filed with the Securities and Exchange Commission on February 27, 2012 (SEC File No. 001-34018).
|
|
|
|
|||
|
10.38
|
Amendment dated January 30, 2012, to contract, dated July 27, 2011, between Solana Petroleum Exploration Colombia Ltd. and Ecopetrol S.A., for the Purchase and Sale of Crude Oil from the Chaza, Santana and Guayuyaco Blocks.
|
Incorporated by reference to Exhibit 10.59 to the Annual Report on Form 10-K filed with the Securities and Exchange Commission on February 27, 2012 (SEC File No. 001-34018).
|
|
|
10.39
|
Amendment No. 4 dated June 13, 2011, to the Colombian Participation Agreement dated June 22, 2006, between Gran Tierra Colombia Ltd and Crosby Capital, LLC.
|
Incorporated by reference to Exhibit 10.1 to the Quarterly Report on Form 10-Q filed with the Securities and Exchange Commission on May 7, 2012 (SEC File No. 001-34018).
|
|
|
10.40
|
Amendment No. 5 dated February 10, 2011, to the Colombian Participation Agreement dated June 22, 2006, between Gran Tierra Colombia Ltd and Crosby Capital, LLC.
|
Incorporated by reference to Exhibit 10.2 to the Quarterly Report on Form 10-Q filed with the Securities and Exchange Commission on May 7, 2012 (SEC File No. 001-34018).
|
|
|
10.41
|
Agreement between Gran Tierra Colombia Ltd and Ecopetrol S.A., dated January 30, 2012, with respect to the transportation of crude oil from the Chaza Block.
|
Incorporated by reference to Exhibit 10.5 to the Quarterly Report on Form 10-Q filed with the Securities and Exchange Commission on May 7, 2012 (SEC File No. 001-34018).
|
|
|
10.42
|
Agreement between Solana Petroleum Exploration Colombia Ltd. and Ecopetrol S.A., dated January 30, 2012, with respect to the transportation of crude oil from the Chaza Block.
|
Incorporated by reference to Exhibit 10.6 to the Quarterly Report on Form 10-Q filed with the Securities and Exchange Commission on May 7, 2012 (SEC File No. 001-34018).
|
|
|
10.43
|
Fourth Amendment to Credit Agreement, dated as of February 14, 2012, among Solana Resources Limited, Gran Tierra Energy Inc., BNP Paribas and Other Lenders.
|
Incorporated by reference to Exhibit 10.8 to the Quarterly Report on Form 10-Q filed with the Securities and Exchange Commission on May 7, 2012 (SEC File No. 001-34018).
|
|
|
10.44
|
Amendment No. 6 dated March 1, 2012, to the Colombian Participation Agreement dated June 22, 2006, between Gran Tierra Colombia Ltd and Crosby Capital, LLC.
|
Incorporated by reference to Exhibit 10.9 to the Quarterly Report on Form 10-Q filed with the Securities and Exchange Commission on May 7, 2012 (SEC File No. 001-34018).
|
|
|
10.45
|
Amendment to Employment Agreement dated May 2, 2012, between Gran Tierra Energy Inc. and David Hardy. *
|
Incorporated by reference to Exhibit 10.11 to the Quarterly Report on Form 10-Q filed with the Securities and Exchange Commission on May 7, 2012 (SEC File No. 001-34018).
|
|
|
10.46
|
Executive Employment Agreement dated May 2, 2012, between Gran Tierra Energy Inc. and James Rozon. *
|
Incorporated by reference to Exhibit 10.12 to the Quarterly Report on Form 10-Q filed with the Securities and Exchange Commission on May 7, 2012 (SEC File No. 001-34018).
|
|
|
10.47
|
Resignation, Consent and Appointment Agreement and Amendment Agreement, effective May 17, 2012, assigning the Credit Agreement among Solana Resources Limited, Gran Tierra Energy Inc., BNP Paribas and Lenders, to Wells Fargo Bank, National Association.
|
Incorporated by reference to Exhibit 10.4 to the Quarterly Report on Form 10-Q filed with the Securities and Exchange Commission on August 7, 2012 (SEC File No. 001-34018).
|
|
129
|
10.48
|
Fifth Amendment to Credit Agreement, dated as of May 18, 2012, among Solana Resources Limited, Gran Tierra Energy Inc. Wells Fargo Bank, National Association, and the Lenders.
|
Incorporated by reference to Exhibit 10.5 to the Quarterly Report on Form 10-Q filed with the Securities and Exchange Commission on August 7, 2012 (SEC File No. 001-34018).
|
|
|
10.49
|
Amendment No. 2 to the Purchase Agreement between Gran Tierra Energy Colombia, Ltd. and Ecopetrol S.A. with respect to the sale of crude oil from the Chaza Block, Santana Block and Guayuyaco Block.
|
Incorporated by reference to Exhibit 10.1 to the Quarterly Report on Form 10-Q filed with the Securities and Exchange Commission on November 7, 2012 (SEC File No. 001-34018).
|
|
|
|
|||
|
10.50
|
Amendment No. 2 to the Purchase Agreement between Solana Petroleum Exploration Colombia Ltd. and Ecopetrol S.A. with respect to the sale of crude oil from the Chaza Block, Santana Block and Guayuyaco Block.
|
Incorporated by reference to Exhibit 10.2 to the Quarterly Report on Form 10-Q filed with the Securities and Exchange Commission on November 7, 2012 (SEC File No. 001-34018).
|
|
|
|
|||
|
10.51
|
Addendum No. 1 to the Transportation Agreement between Gran Tierra Energy Colombia, Ltd. and Ecopetrol S.A.
|
Incorporated by reference to Exhibit 10.3 to the Quarterly Report on Form 10-Q filed with the Securities and Exchange Commission on November 7, 2012 (SEC File No. 001-34018).
|
|
|
|
|||
|
10.52
|
Addendum No. 1 to the Transportation Agreement between Solana Petroleum Exploration Colombia Ltd. and Ecopetrol S.A.
|
Incorporated by reference to Exhibit 10.4 to the Quarterly Report on Form 10-Q filed with the Securities and Exchange Commission on November 7, 2012 (SEC File No. 001-34018).
|
|
|
|
|||
|
10.53
|
Sixth Amendment to Credit Agreement, dated as of October 9, 2012, among Solana Resources Limited, Gran Tierra Energy Inc., Wells Fargo Bank, National Association, and the Lenders.
|
Incorporated by reference to Exhibit 10.5 to the Quarterly Report on Form 10-Q filed with the Securities and Exchange Commission on November 7, 2012 (SEC File No. 001-34018).
|
|
|
10.54
|
Agreement between Gran Tierra Energy Colombia, Ltd and Ecopetrol S.A., dated December 1, 2012, with respect to the sale of crude oil from the Chaza, Santana and Guayuyaco Blocks.
|
Incorporated by reference to Exhibit 10.67 to the Annual Report on Form 10-K filed with the Securities and Exchange Commission on February 26, 2013 (SEC File No. 001-34018).
|
|
|
10.55
|
Agreement between Petrolifera Petroleum (Colombia) Limited and Ecopetrol S.A., dated December 1, 2012, with respect to the sale of crude oil from the Chaza, Santana and Guayuyaco Blocks.
|
Incorporated by reference to Exhibit 10.68 to the Annual Report on Form 10-K filed with the Securities and Exchange Commission on February 26, 2013 (SEC File No. 001-34018).
|
|
|
10.56
|
Agreement between Gran Tierra Colombia Ltd and Gunvor Colombia SAS, dated December 3, 2012, with respect to the sale of crude oil.
|
Incorporated by reference to Exhibit 10.69 to the Annual Report on Form 10-K filed with the Securities and Exchange Commission on February 26, 2013 (SEC File No. 001-34018).
|
|
|
10.57
|
Agreement between Petrolifera Petroleum (Colombia) Limited and Gunvor Colombia SAS, dated December 3, 2012, with respect to the sale of crude oil.
|
Incorporated by reference to Exhibit 10.70 to the Annual Report on Form 10-K filed with the Securities and Exchange Commission on February 26, 2013 (SEC File No. 001-34018).
|
|
|
10.58
|
Seventh Amendment to Credit Agreement, dated as of January 17, 2013, among Solana Resources Limited, Gran Tierra Energy Inc., Wells Fargo Bank, National Association, and the Lenders.
|
Incorporated by reference to Exhibit 10.71 to the Annual Report on Form 10-K filed with the Securities and Exchange Commission on February 26, 2013 (SEC File No. 001-34018).
|
|
|
10.59
|
Addendum No. 3 to the Transportation Agreement between Gran Tierra Energy Colombia, Ltd. and Ecopetrol S.A.
|
Incorporated by reference to Exhibit 10.72 to the Annual Report on Form 10-K filed with the Securities and Exchange Commission on February 26, 2013 (SEC File No. 001-34018).
|
|
|
10.60
|
Addendum No. 3 to the Transportation Agreement between Petrolifera Petroleum (Colombia) Ltd. and Ecopetrol S.A.
|
Incorporated by reference to Exhibit 10.73 to the Annual Report on Form 10-K filed with the Securities and Exchange Commission on February 26, 2013 (SEC File No. 001-34018).
|
|
130
|
10.61
|
Notice dated February 15, 2013, from Wells Fargo Bank that the borrowing base amount for the Solana Resources Ltd credit facility has been increased and the increase is effective.
|
Incorporated by reference to Exhibit 10.74 to the Annual Report on Form 10-K filed with the Securities and Exchange Commission on February 26, 2013 (SEC File No. 001-34018).
|
|
|
10.62
|
2012 Executive Officer Cash Bonus Compensation and 2013 Cash Compensation Arrangements. *
|
Incorporated by reference to Item 5.02 of the Current Report on Form 8-K, filed with the SEC on February 19, 2013, with respect to 2012 Cash Bonus Compensation and 2013 Cash Compensation Arrangements (SEC File No. 001-34018).
|
|
|
10.63
|
Chaza Block Hydrocarbons Exploration and Exploitation Agreement between Argosy Energy International and the National Hydrocarbons Agency dated June 25, 2005.
|
Incorporated by reference to Exhibit 10.76 to the Annual Report on Form 10-K filed with the Securities and Exchange Commission on February 26, 2013 (SEC File No. 001-34018).
|
|
|
10.64
|
Addendum No. 1 to the Chaza Block Hydrocarbons Exploration and Exploitation Agreement between Argosy Energy International and the National Hydrocarbons Agency.
|
Incorporated by reference to Exhibit 10.77 to the Annual Report on Form 10-K filed with the Securities and Exchange Commission on February 26, 2013 (SEC File No. 001-34018).
|
|
|
10.65
|
Addendum No. 2 to the Transportation Agreement between Petrolifera Petroleum (Colombia) Ltd. and Ecopetrol S.A.
|
Incorporated by reference to Exhibit 10.6 to the Quarterly Report on Form 10-Q filed with the Securities and Exchange Commission on May 6, 2013 (SEC File No. 001-34018).
|
|
|
10.66
|
Amendment to Executive Employment Agreement, dated February 21, 2003, between Gran Tierra Energy Brasil Ltda. and Julio Moreira. *
|
Incorporated by reference to Exhibit 10.7 to the Quarterly Report on Form 10-Q filed with the Securities and Exchange Commission on May 6, 2013 (SEC File No. 001-34018).
|
|
|
10.67
|
Form of Restricted Stock Unit Award Agreement *
|
Incorporated by reference to Exhibit 10.1 to the Quarterly Report on Form 10-Q filed with the Securities and Exchange Commission on August 7, 2013 (SEC File No. 001-34018).
|
|
|
10.68
|
Form of Option Agreement *
|
Incorporated by reference to Exhibit 10.2 to the Quarterly Report on Form 10-Q filed with the Securities and Exchange Commission on August 7, 2013 (SEC File No. 001-34018).
|
|
|
10.69
|
Addendum No. 4 to the Transportation Agreement between Petrolifera Petroleum (Colombia) Ltd. and Ecopetrol S.A.
|
Incorporated by reference to Exhibit 10.3 to the Quarterly Report on Form 10-Q filed with the Securities and Exchange Commission on August 7, 2013 (SEC File No. 001-34018).
|
|
|
10.70
|
Addendum No. 4 to the Transportation Agreement between Gran Tierra Energy Colombia, Ltd. and Ecopetrol S.A.
|
Incorporated by reference to Exhibit 10.4 to the Quarterly Report on Form 10-Q filed with the Securities and Exchange Commission on August 7, 2013 (SEC File No. 001-34018).
|
|
|
10.71
|
Credit Agreement, dated as of August 30, 2013, among Gran Tierra Energy International Holdings Ltd., Gran Tierra Energy Inc., the Lenders party thereto, and Wells Fargo Bank, National Association.
|
Incorporated by reference to Exhibit 10.1 to the Current Report on Form 8-K, filed with the SEC on September 6, 2013 (SEC File No. 001-34018).
|
|
|
10.72
|
Crude Oil Transportation Agreement for the Orito to Tumaco (OTA) pipeline, dated as of August 31, 2013, between Gran Tierra Energy Colombia, Ltd. and Cenit Transporte y Logística de Hidrocarburos S.A.S.
|
Incorporated by reference to Exhibit 10.4 to the Quarterly Report on Form 10-Q filed with the Securities and Exchange Commission on November 12, 2013 (SEC File No. 001-34018).
|
|
|
10.73
|
Crude Oil Transportation Agreement for the Orito to Tumaco (OTA) pipeline, dated as of August 31, 2013, between Petrolifera Petroleum (Colombia) Ltd. and Cenit Transporte y Logística de Hidrocarburos S.A.S.
|
Incorporated by reference to Exhibit 10.5 to the Quarterly Report on Form 10-Q filed with the Securities and Exchange Commission on November 12, 2013 (SEC File No. 001-34018).
|
|
|
|
|||
|
10.74
|
Crude Oil Transportation Agreement for the Mansoyá - Orito (OMO) pipeline, dated as of August 31, 2013, between Gran Tierra Energy Colombia, Ltd. and Cenit Transporte y Logística de Hidrocarburos S.A.S.
|
Incorporated by reference to Exhibit 10.6 to the Quarterly Report on Form 10-Q filed with the Securities and Exchange Commission on November 12, 2013 (SEC File No. 001-34018).
|
|
131
|
10.75
|
Crude Oil Transportation Agreement for the Mansoyá - Orito (OMO) pipeline, dated as of August 31, 2013, between Petrolifera Petroleum (Colombia) Ltd. and Cenit Transporte y Logística de Hidrocarburos S.A.S.
|
Incorporated by reference to Exhibit 10.7 to the Quarterly Report on Form 10-Q filed with the Securities and Exchange Commission on November 12, 2013 (SEC File No. 001-34018).
|
|
|
10.76
|
Indefinite Employment Contract, dated August 1, 2009, between Gran Tierra Energy Inc. and Carlos Monges. *
|
Filed herewith.
|
|
|
10.77
|
Individual Labor Contract, dated September 30, 2011, between Gran Tierra Energy Peru S.R.L. and Carlos Monges. *
|
Filed herewith.
|
|
|
10.78
|
Addenda to the Individual Labor Contract, dated September 30, 2011, between Gran Tierra Energy Peru S.R.L. and Carlos Monges. *
|
Filed herewith.
|
|
|
10.79
|
Employment Agreement dated December 14, 2011, between Gran Tierra Energy Peru S.R.L. and Carlos Monges. *
|
Filed herewith.
|
|
|
10.80
|
Expat Assignment Letter Agreement dated January 10, 2014, between Gran Tierra Energy Inc. and Duncan Nightingale. *
|
Filed herewith.
|
|
|
10.81
|
Agreement between Gran Tierra Energy Colombia, Ltd and Ecopetrol S.A., dated December 1, 2013, with respect to the sale of crude oil from the Chaza, Santana and Guayuyaco Blocks.
|
Incorporated by reference to Exhibit 10.1 to the Current Report on Form 8-K filed with the Securities and Exchange Commission on February 24, 2014 (SEC File No. 001-34018).
|
|
|
10.82
|
Agreement between Petrolifera Petroleum (Colombia) Limited and Ecopetrol S.A., dated December 1, 2013, with respect to the sale of crude oil from the Chaza, Santana and Guayuyaco Blocks.
|
Incorporated by reference to Exhibit 10.2 to the Current Report on Form 8-K filed with the Securities and Exchange Commission on February 24, 2014 (SEC File No. 001-34018).
|
|
|
10.83
|
Addendum No. 1 dated November 22, 2013, to agreement between Gran Tierra Energy Colombia Ltd and Gunvor Colombia SAS with respect to the sale of crude oil.
|
Incorporated by reference to Exhibit 10.3 to the Current Report on Form 8-K filed with the Securities and Exchange Commission on February 24, 2014 (SEC File No. 001-34018).
|
|
|
10.84
|
Addendum No. 1 dated November 22, 2013, to agreement between Petrolifera Petroleum (Colombia) Limited and Gunvor Colombia SAS with respect to the sale of crude oil.
|
Incorporated by reference to Exhibit 10.4 to the Current Report on Form 8-K filed with the Securities and Exchange Commission on February 24, 2014 (SEC File No. 001-34018).
|
|
|
10.77
|
2013 Executive Officer Cash Bonus Compensation and 2014 Cash Compensation Arrangements. *
|
Incorporated by reference to Item 5.02 of the Current Report on Form 8-K, filed with the SEC on February 12, 2014, with respect to 2013 Cash Bonus Compensation and 2014 Cash Compensation Arrangements (SEC File No. 001-34018).
|
|
|
21.1
|
List of subsidiaries.
|
Filed herewith.
|
|
|
23.1
|
Consent of Deloitte LLP.
|
Filed herewith.
|
|
|
23.2
|
Consent of GLJ Petroleum Consultants.
|
Filed herewith.
|
|
|
24.1
|
Power of Attorney.
|
See signature page.
|
|
|
31.1
|
Certification of Principal Executive Officer.
|
Filed herewith.
|
|
|
|
|
|
|
|
31.2
|
Certification of Principal Financial Officer.
|
Filed herewith.
|
|
|
|
|
|
|
|
32.1
|
Section 1350 Certifications.
|
Filed herewith.
|
|
|
99.1
|
Gran Tierra Energy Inc. Reserves Assessment and Evaluation of Colombian, Argentina and Brazilian Oil and Gas Properties Corporate Summary, effective December 31, 2013.
|
Filed herewith.
|
|
132
101.SCH XBRL Taxonomy Extension Schema Document
101.CAL XBRL Taxonomy Extension Calculation Linkbase Document
101.DEF XBRL Taxonomy Extension Definition Linkbase Document
101.LAB XBRL Taxonomy Extension Label Linkbase Document
101.PRE XBRL Taxonomy Extension Presentation Linkbase Document
+
Schedules have been omitted pursuant to Item 601(b)(2) of Regulation S-K. Gran Tierra undertakes to furnish supplemental copies of any of the omitted schedules upon request by the SEC.
* Management contract or compensatory plan or arrangement.
133
TABLE OF CONTENTS
Part IItem 1. BusinessItem 1A. Risk FactorsItem 1B. Unresolved Staff CommentsItem 2. PropertiesItem 3. Legal ProceedingsItem 4. Mine Safety DisclosuresPart IIItem 5. Market For Registrant's Common Equity, Related Stockholder Matters and Issuer Purchases Of Equity SecuritiesItem 6. Selected Financial DataItem 7. Management S Discussion and Analysis Of Financial Condition and Results Of OperationsItem 7A. Quantitative and Qualitative Disclosures About Market RiskItem 8. Financial Statements and Supplementary DataItem 9. Changes in and Disagreements with Accountants on Accounting and Financial DisclosureItem 9A. Controls and ProceduresItem 9B. Other InformationPart IIIItem 10. Directors, Executive Officers and Corporate GovernanceItem 11. Executive CompensationItem 12. Security Ownership Of Certain Beneficial Owners and Management and Related Stockholder MattersItem 13. Certain Relationships and Related Transactions, and Director IndependenceItem 14. Principal Accounting Fees and ServicesPart IVItem 15. Exhibits, Financial Statement Schedules