CHART INDUSTRIES INC
10-Ks and 10-Qs
|
|
|
|
|
|
|
|
|
|
|
|
|
|
|
|
|
|
|
|
|
|
|
|
|
|
|
|
|
|
|
|
|
|
|
|
|
|
|
|
|
|
|
|
|
|
|
|
|
|
|
|
|
|
|
|
|
|
|
UNITED STATES
SECURITIES AND EXCHANGE COMMISSION
Washington, D.C. 20549
Form 10-K
|
x
|
ANNUAL REPORT PURSUANT TO SECTION 13 OR 15(d) OF THE SECURITIES EXCHANGE ACT OF 1934
|
|
For the fiscal year ended December 31, 2017
|
|
OR
|
o
|
TRANSITION REPORT PURSUANT TO SECTION 13 OR 15(d) OF THE SECURITIES EXCHANGE ACT OF 1934
|
|
For the transition period from to
|
|
Commission File No. 1-11442
CHART INDUSTRIES, INC.
(Exact Name of Registrant as Specified in its Charter)
|
Delaware
|
34-1712937
|
|
|
(State or Other Jurisdiction of
Incorporation or Organization)
|
(IRS Employer
Identification No.)
|
|
|
3055 Torrington Drive,
|
||
|
Ball Ground, Georgia
|
30107
|
|
|
(Address of Principal Executive Offices)
|
(Zip Code)
|
|
Registrant’s telephone number, including area code:
(770) 721-8800
Securities registered pursuant to Section 12(b) of the Act:
|
Title of Each Class
|
Name of Each Exchange on Which Registered
|
|
|
Common Stock, par value $0.01
|
The NASDAQ Stock Market LLC
|
|
Securities registered pursuant to Section 12(g) of the Act:
None
Indicate by check mark if the registrant is a well-known seasoned issuer, as defined in Rule 405 of the Securities Act. Yes
x
No
o
Indicate by check mark if the registrant is not required to file reports pursuant to Section 13 or Section 15(d) of the Act. Yes
o
No
x
Indicate by check mark whether the registrant: (1) has filed all reports required to be filed by Section 13 or 15(d) of the Securities Exchange Act of 1934 during the preceding 12 months (or for such shorter period that the registrant was required to file such reports), and (2) has been subject to such filing requirements for the past 90 days. Yes
x
No
o
Indicate by check mark whether the registrant has submitted electronically and posted on its corporate Web site, if any, every Interactive Data File required to submitted and posted pursuant to Rule 405 of Regulation S-T (§232.405 of this chapter) during the preceding 12 months (or for such shorter period that the registrant was required to submit and post such files). Yes
x
No
o
Indicate by check mark if disclosure of delinquent filers pursuant to Item 405 of Regulation S-K (§229.405) is not contained herein, and will not be contained, to the best of registrant’s knowledge, in definitive proxy or information statements incorporated by reference in Part III of this Form 10-K or any amendment to this Form 10-K.
x
Indicate by check mark whether the registrant is a large accelerated filer, an accelerated filer, a non-accelerated filer or a smaller reporting company. See definitions of “large accelerated filer,” “accelerated filer” and “smaller reporting company” in Rule 12b-2 of the Exchange Act. (Check one):
|
Large accelerated filer
|
|
x
|
|
Accelerated filer
|
|
o
|
|
Non-accelerated filer
|
|
o
(Do not check if a smaller reporting company)
|
|
Smaller reporting company
|
|
o
|
|
Emerging growth company
|
o
|
|||||
If an emerging growth company, indicate by check mark if the registrant has elected not to use the extended transition period for complying with any new or revised financial accounting standards provided pursuant to Section 13(a) of the Exchange Act.
¨
Indicate by check mark whether the registrant is a shell company (as defined in Rule 12b-2 of the Act). Yes
¨
No
x
The aggregate market value of the voting common equity held by non-affiliates computed by reference to the price of
$34.61
per share at which the common equity was last sold, as of the last business day of the registrant’s most recently completed second fiscal quarter, was
$1,052,067,547
.
As of February 19,
2018
, there were
30,921,691
outstanding shares of the Company’s common stock, par value $0.01 per share.
Documents Incorporated by Reference
Portions of the following document are incorporated by reference into Part III of this Annual Report on Form 10-K: the definitive Proxy Statement to be used in connection with the Registrant’s Annual Meeting of Stockholders to be held on May 25, 2018 (the “
2018
Proxy Statement”).
Except as otherwise stated, the information contained in this Annual Report on Form 10-K is as of
December 31, 2017
.
CHART INDUSTRIES, INC.
TABLE OF CONTENTS
|
Page
|
|
|
Item 1.
|
Business
|
THE COMPANY
Overview
Chart Industries, Inc., a Delaware corporation incorporated in 1992 (the “Company,” “Chart,” “we,” “us,” or “our” as used herein refers to Chart Industries, Inc. and our consolidated subsidiaries, unless the context indicates otherwise), is a leading diversified global manufacturer of highly engineered equipment, packaged solutions, and value-add services used throughout the gas to liquid cycle in all industries that require gases as cryogenic liquids or alternative equipment for gas generation, generally for the industrial gas, energy, and biomedical industries. Our equipment and engineered systems are primarily used to cool gases often to cryogenic liquid temperatures and then to transport and store them as liquids utilizing our expertise in cryogenic systems and equipment. Our equipment often operates at temperatures approaching absolute zero (0 Kelvin; -273° Centigrade; -459° Fahrenheit). Our products include vacuum insulated containment vessels, heat exchangers, cold boxes, liquefaction process units, other cryogenic components, gas processing equipment, ambient temperature fans and equipment for respiratory therapy.
Our primary customers are large, multinational producers and distributors of hydrocarbon and industrial gases and their end-users. We sell our products and services to more than 2,000 customers worldwide. We have developed long-standing relationships with leading companies in the gas production, gas distribution, gas processing, liquefied natural gas or LNG, petroleum refining, chemical and industrial gas industries, including Air Products, Praxair, Airgas “an Air Liquide company,” Air Liquide, The Linde Group or Linde, Bechtel Corporation, ExxonMobil, British Petroleum or BP, ConocoPhillips, PetroChina, CB&I, Toyo, JGC, Samsung, UOP, and Shell, some of whom have been purchasing our products for over 20 years.
We have attained this position by capitalizing on our technical expertise and know-how, broad product offering, reputation for quality, low-cost global manufacturing footprint, and by focusing on attractive, growing markets. We have an established sales and customer support presence across the globe and manufacturing operations in the United States, Central Europe, and China. For the years ended December 31,
2017, 2016 and 2015
, we generated sales of
$988.8 million
,
$859.2 million
, and
$1,040.2 million
, respectively.
On September 20, 2017 we completed the acquisition of RCHPH Holdings, Inc., parent of Hudson. Hudson designs, manufactures, sells and services an array of strong brands and products used in refining, heating, ventilation and air conditioning (HVAC), petrochemical, natural gas, power generation and other industrial and commercial end markets. Hudson is a North American leader in air-cooled heat exchangers and a global leader in axial flow cooling fans. For additional information, see “Note 10: Business Combinations.”
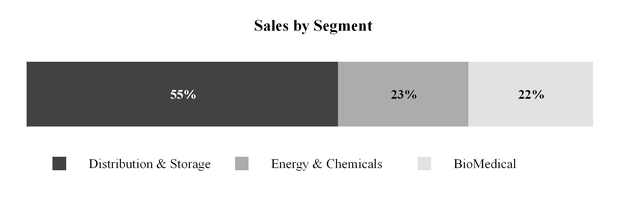
Segments, Applications and Products
We operate in four major end-market applications: Energy, Industrial, Cryobiological Storage, and Respiratory Healthcare, through our three business segments: (i) Energy & Chemicals or E&C, (ii) Distribution & Storage or D&S, and (iii) BioMedical. While each segment manufactures and markets different cryogenic and gas processing equipment and systems to distinct end-users, they all share a reliance on our heat transfer, vacuum insulation, low temperature storage, and gas processing know-how and expertise. The E&C and D&S segments manufacture products used primarily in energy-related and industrial applications, such as the separation, liquefaction, distribution, and storage of hydrocarbon and industrial gases. The recent Hudson Products acquisition has expanded our product offerings in these areas, as well as added end-user diversification to include HVAC, petrochemical and power generation. Through our BioMedical segment, we manufacture and supply medical devices, including cryogenic and non-cryogenic equipment, used in respiratory healthcare. We also manufacture and supply products for cryobiological storage including biological research and animal breeding. Further information about these segments is located in
Note 20
of the notes to our consolidated financial statements included in Item 8 of this Annual Report on Form 10-K.
3
The following charts show the proportion of our revenues generated by each business segment, as well as our estimate of the proportion of revenue generated by end-user application for the year ended
December 31, 2017
:

Energy & Chemicals Segment
E&C (
23%
of sales for the year ended
December 31, 2017
) facilitates major natural gas, petrochemical processing, petroleum refining, power generation and industrial gas companies in the production of their products. E&C supplies mission critical engineered equipment and systems used in the separation, liquefaction, and purification of hydrocarbon and industrial gases that span gas-to-liquid applications including natural gas processing, petrochemical, LNG, petroleum reefing and industrial gas applications. Our principal products include brazed aluminum heat exchangers, Core-in-Kettle
®
heat exchangers, air cooled heat exchangers, cold boxes, process systems as well as axial cooling fans for power, HVAC, and refining end user applications. Brazed aluminum heat exchangers accounted for
4.7%
,
7.4%
, and
11.9%
of consolidated sales for the years ended December 31,
2017, 2016 and 2015
, respectively. Process systems accounted for
2.6%
,
5.8%
, and
14.0%
of consolidated sales for the years ended December 31,
2017, 2016 and 2015
, respectively.
Natural Gas Processing (including Petrochemical) Applications
We provide natural gas processing solutions that facilitate the progressive cooling and liquefaction of hydrocarbon mixtures for the subsequent recovery or purification of component gases, which accounted for
15.5%
,
12.3%
, and
17.4%
of consolidated sales for the years ended
December 31, 2017
,
2016
, and
2015
, respectively. Primary products used in these applications include brazed aluminum heat exchangers, cold boxes and air cooled heat exchangers. Our brazed aluminum heat exchangers allow producers to obtain purified hydrocarbon by-products, such as methane, ethane, propane, and ethylene, which are commercially marketable for various industrial or residential uses. Our cold boxes are highly engineered systems that incorporate brazed aluminum heat exchangers, pressure vessels, and interconnecting piping used to significantly reduce the temperature of gas mixtures to liquefy component gases so that they can be separated and purified for further use in multiple energy, industrial, scientific, and commercial applications. Our air cooled heat exchangers are used to cool or condense fluids to allow for further processing and for cooling gas compression equipment. Customers for our natural gas processing applications include large companies in the hydrocarbon processing industry, as well as engineering, procurement and construction (“EPC”) contractors.
Demand for these applications is primarily driven by the growth in the natural gas liquids (or NGLs) separation and other natural gas segments of the hydrocarbon processing industries, including LNG. In the future, management believes that continuing efforts by petroleum producing countries to better utilize stranded natural gas and associated gases which historically had been flared present a promising source of demand. We have a number of competitors for our heat exchangers and cold boxes, including
4
certain leading companies in the industrial gas and hydrocarbon processing industries and many smaller fabrication-only facilities around the world. Competition with respect to our more specialized brazed aluminum heat exchangers includes a small number of global (European and Asian) manufacturers.
LNG Applications
We provide process technology, liquefaction train, and independent mission critical equipment for the liquefaction of LNG, including small to mid-scale facilities, floating LNG applications, and large base-load export facilities, which accounted for
3.0%
,
4.4%
, and
13.1%
of consolidated sales for the years ended
December 31, 2017
,
2016
, and
2015
, respectively. We are a leading supplier to EPC firms where we provide equipment or design the process and provide equipment, providing an integrated and optimized approach to the project. These “Concept-to-Reality” process systems incorporate many of Chart’s core products, including brazed aluminum heat exchangers, Core-in-Kettle
®
heat exchangers
,
cold boxes, pressure vessels, pipe work, and air cooled heat exchangers. These systems are used for global LNG projects, including projects in North America and China, for local LNG production and LNG export terminals. Our proprietary IPSMR
®
(Integrated Pre-cooled Single Mixed Refrigerant) liquefaction process technology offers lower capital expenditure rates than competing processes per ton of LNG produced and very competitive operating costs.
Demand for LNG applications is primarily driven by increased use and global trade in natural gas (transported as LNG) since natural gas offers significant cost and environmental advantages over other fossil fuels. Demand for LNG applications is also driven by diesel displacement and continuing efforts by petroleum producing countries to better utilize stranded natural gas and previously flared gases. We have a number of competitors for these applications, including leading industrial gas companies, other brazed aluminum heat exchanger manufacturers, and other equipment fabricators to whom we also act as a supplier of equipment, including heat exchangers and cold boxes.
Industrial Gas Applications
For industrial gas applications, our brazed aluminum heat exchangers (BAHX) and cold boxes are used to produce high purity atmospheric gases, such as oxygen, nitrogen, and argon, which have diverse industrial applications. Cold boxes, which incorporate our BAHX are used to separate air into its major atmospheric components, including oxygen, nitrogen, and argon, where the gases are used in a diverse range of applications such as metal production and heat treating, enhanced oil and gas production, coal gasification, chemical and oil refining, electronics, medical, the quick-freezing of food, wastewater treatment, and industrial welding. Our brazed aluminum heat exchangers and cold boxes are also used in the purification of helium and hydrogen.
Demand for industrial gas applications is driven by growth in manufacturing and industrial gas use. Other key global drivers involve developing Gas to Liquids, or GTL, clean coal processes including Coal to Liquids, or CTL, and Integrated Gasification Combined Cycle, or IGCC, power projects. In addition, demand for our products in developed countries is expected to continue as customers upgrade their facilities for greater efficiency and regulatory compliance. We have a number of competitors for these applications, including leading industrial gas companies and EPC firms, to whom we also act as a supplier of equipment, including heat exchangers and cold boxes.
HVAC, Power and Refining Applications
Our Air Cooled Heat Exchangers (ACHX) and fans are used in HVAC, power and refining applications. Demand for HVAC is driven by growing construction activities and demand for energy efficient devices, and there is also positive impact from growing industrial production. Refining demand continues to be driven by United States shale production, benefiting from low cost shale crude and gas resulting in high utilization and increased investment. Our ACHX products are used in each phase of refining processing to condense and cool fluids. Worldwide power use is projected to grow 48% through 2040, with growth steady in the United States and Europe, while additional growth comes from emerging economies.
After Market Services
To support the products and solutions we sell, our Lifecycle group offers services through the entire lifecycle of our products, which is unique and unparalleled in the markets we serve. Our focus is to build relationships with plant stakeholders, from process and mechanical engineers to operations and maintenance personnel, focusing on the optimized performance and lifespan of Chart proprietary equipment. Lifecycle services include extended warranties, plant start-up, parts, 24/7 support, monitoring and process optimization, as well as repair, maintenance, and upgrades. We perform plant services on equipment, including brazed aluminum heat exchangers, air cooled heat exchangers, fans, cold boxes, etc.
5
Distribution & Storage Segment
D&S (
55%
of sales for the year ended
December 31, 2017
) designs, manufactures, and services cryogenic solutions for the storage and delivery of cryogenic liquids used in industrial gas and LNG applications. Using sophisticated vacuum insulation technology, our cryogenic storage systems are able to store and transport liquefied industrial gases and hydrocarbon gases at temperatures from 0° Fahrenheit to temperatures nearing absolute zero. End-use customers for our cryogenic storage equipment include industrial gas producers and distributors, chemical producers, manufacturers of electrical components, health care organizations, food processors, and businesses in the oil and natural gas industries. On a product line basis, cryogenic bulk storage systems, which include LNG cryogenic systems and after market services, accounted for
57.2%
of D&S segment sales in 2017, and represented
31.3%
,
36.2%
and
27.8%
of consolidated sales for the years ended December 31,
2017, 2016 and 2015
, respectively. Cryogenic packaged gas systems, which include LNG cryogenic systems and after market services, accounted for
42.8%
of D&S segment sales in 2017, and represented
23.4%
,
21.7%
and
19.0%
of consolidated sales for the years ended December 31,
2017, 2016 and 2015
, respectively. We service industrial gas and LNG applications as follows:
Industrial Gas Applications
We design, manufacture, install, service, and maintain bulk and packaged gas cryogenic solutions for the storage, distribution, vaporization, and application of industrial gases, which accounted for
40.7%
,
45.1%
, and
35.7%
of consolidated sales for the years ended
December 31, 2017
,
2016
, and
2015
, respectively. Industrial gas applications include any end-use of the major elements of air (nitrogen, oxygen, and argon), including manufacturing, welding, electronics, medical, nitrogen dosing, food processing, and beverage carbonation. Carbon dioxide, nitrous oxide, hydrogen, and helium applications also utilize our equipment. Our products span the entire spectrum of industrial gas demand from small customers requiring cryogenic packaged gases to large users requiring custom engineered cryogenic storage systems in both mobile and stationary applications. We also offer cryogenic components, including vacuum insulated pipe (“VIP”), engineered bulk gas installations, specialty liquid nitrogen, or LN2, end-use equipment, and cryogenic flow meters. Principal customers for industrial applications are global industrial gas producers and distributors.
Demand for industrial gas applications is driven primarily by the significant installed base of users of cryogenic liquids, as well as new applications and distribution technologies for cryogenic liquids. Our competitors tend to be regionally focused while we are able to supply a broad range of systems on a worldwide basis. We also compete with several suppliers owned by the global industrial gas producers. From a technology perspective, we tend to compete with compressed gas alternatives or on-site generated gas supply.
LNG Applications
We supply cryogenic solutions for the storage, distribution, regasification, and use of LNG, which accounted for
13.9%
,
12.8%
, and
11.1%
of consolidated sales for the years ended
December 31, 2017
,
2016
, and
2015
, respectively. LNG may be utilized as an alternative to other fossil fuels such as diesel, propane, or fuel oil in transportation or off pipeline applications. Examples include heavy duty truck and transit bus transportation, locomotive propulsion, marine, and power generation in remote areas that often occurs in oil and gas drilling. We refer to our LNG distribution products as a “Virtual Pipeline,” as the traditional natural gas pipeline is replaced with cryogenic distribution to deliver the gas to the end-user. We supply cryogenic trailers, ISO containers, railcars, bulk storage tanks, fuel stations, loading facilities, and regasification equipment specially configured for delivering LNG into Virtual Pipeline applications. LNG may also be used as a fuel for a variety of on and off-road vehicles and applications. Our LNG vehicle fueling applications primarily consist of LNG and liquefied/compressed natural gas refueling systems for heavy-duty truck and bus fleets. We sell LNG applications around the world from various D&S facilities to numerous end-users, energy companies, and gas distributors. Additionally, we supply large vacuum insulated storage tanks as equipment for purchasers of standard liquefaction plants sold by our E&C business.
Demand for LNG applications is driven by the spread in price between oil and gas, diesel displacement initiatives, environmental and energy security initiatives, and the associated cost of equipment. Our competitors tend to be regionally focused or product-specific, while we are able to supply a broad range of solutions required by LNG applications. We compete with compressed natural gas (or CNG) or field gas in several of these applications and LNG is most highly valued where its energy density and purity are beneficial to the end-user.
After Market Services
D&S operates multiple service locations in the United States, China, and Europe. These service locations provide installation, service, repair, maintenance, and refurbishment of cryogenic products. We service Chart products, as well as our competitors throughout the world. We provide services for storage vessels, VIP, reconfigurations, relocation, trailers, ISO containers, vaporizers, and other gas to liquid equipment.
6
BioMedical Segment
BioMedical (
22%
of sales for the year ended
December 31, 2017
) consists of various health care, cryobiological storage and environmental product lines built around our core competencies in cryogenics, vacuum insulation, low temperature storage, and pressure swing adsorption gas generation, with a focus on the respiratory and biological users of the liquids and gases instead of the large producers and distributors of cryogenic liquids. Applications in the BioMedical segment include the following:
Respiratory Therapy
Respiratory therapy products accounted for
12.6%
,
13.8%
, and
12.7%
of consolidated sales for the years ended
December 31, 2017
,
2016
, and
2015
, respectively. Our respiratory oxygen product line is comprised of a range of medical respiratory products, including liquid oxygen systems and stationary, transportable, and portable oxygen concentrators, all of which are used primarily for in-home supplemental oxygen treatment of patients with chronic obstructive pulmonary diseases, such as bronchitis, emphysema, and asthma.
We believe that competition for our respiratory products is based primarily upon product quality, performance, reliability, ease-of-use and price, therefore we focus our marketing strategies on these considerations. Furthermore, competition also includes the impact of other modalities in the broader respiratory industry.
Cryobiological Storage
Our cryobiological storage products include vacuum insulated containment vessels for the storage of biological materials. The primary applications for this product line include medical laboratories, biotech/pharmaceutical research facilities, blood and tissue banks, veterinary laboratories, large-scale repositories, and artificial insemination, particularly in the beef and dairy industry.
The significant competitors for cryobiological storage products include a number of companies worldwide. These products are sold through multiple channels of distribution specifically applicable to each industry sector. The distribution channels range from highly specialized cryogenic storage systems providers to general supply and catalogue distribution operations and breeding service providers. Competition in this field is focused on design, reliability, and price. Alternatives to vacuum insulated containment vessels include electrically powered mechanical refrigeration.
On-site Generation Systems
Our on-site generation products include self-contained generators, standard generators, and packaged systems for industrial and medical oxygen and nitrogen generating systems. These generators produce oxygen or nitrogen from compressed air and provide an efficient and cost-effective alternative to the procurement of oxygen or nitrogen from third party cylinder or liquid suppliers. Applications include mining operations, industrial plants, ozone generation, hospital medical oxygen, and wastewater treatment, among other commercial or military applications. Management expects demand for this product line to increase over the long-term with competition focused on design, reliability, and price.
Domestic and Foreign Operations
Financial and other information regarding domestic and foreign operations is located in
Note 20
of the notes to our consolidated financial statements included in Item 8 of this Annual Report on Form 10-K. Additional information regarding risks attendant to foreign operations is set forth in Item 7A of this Annual Report on Form 10-K under the caption “Quantitative and Qualitative Disclosures About Market Risk” and Item 7 under the caption “Management’s Discussion and Analysis of Financial Condition and Results of Operations.”
Engineering and Product Development
Our engineering and product development activities are focused primarily on developing new and improved solutions and equipment for the users of cryogenic liquids and hydrocarbon and industrial gases across all industries served. Our engineering, technical and marketing employees actively assist customers in specifying their needs and in determining appropriate products to meet those needs. Portions of our engineering expenditures typically are charged to customers, either as separate items or as components of product cost.
Competition
We believe we can compete effectively around the world and that we are a leading competitor in the industries we serve. Competition is based primarily on performance and the ability to provide the design, engineering, and manufacturing capabilities required in a timely and cost-efficient manner. Contracts are usually awarded on a competitive bid basis. Quality, technical expertise, and timeliness of delivery are the principal competitive factors within the industries we serve. Price and terms of sale are also important competitive factors. Because our equipment is specialized and independent third-party prepared market share data is not available, it is difficult to know for certain our exact position in our markets, although we believe we rank among the leaders in each of the markets we serve. We base our statements about industry and market positions on our reviews of annual
7
reports and published investor presentations of our competitors and augment this data with information received by marketing consultants conducting competition interviews and our sales force and field contacts. For information concerning competition within a specific segment of our business, see the descriptions provided under segment captions in this Annual Report on Form 10-K.
Marketing
We market our products and services in each of our segments throughout the world primarily through direct sales personnel and independent sales representatives and distributors. The technical and custom design nature of our products requires a professional, highly trained sales force. We use independent sales representatives and distributors to market our products and services in certain foreign countries and in certain North American regions. These independent sales representatives supplement our direct sales force in dealing with language and cultural matters. Our domestic and foreign independent sales representatives earn commissions on sales, which vary by product type.
Backlog
The dollar amount of our backlog as of December 31,
2017, 2016 and 2015
was
$461.3 million
,
$342.6 million
, and
$374.6 million
, respectively. Backlog as of December 31, 2017 included
$65.8 million
related to our September 20, 2017 acquisition of RCHPH Holdings, Inc. (“Hudson”). Approximately
13.3%
of the
December 31, 2017
backlog is expected to be filled beyond
2018
. Backlog is comprised of the portion of firm signed purchase orders or other written contractual commitments received from customers that we have not recognized as revenue under the percentage of completion method or based upon shipment. Backlog can be significantly affected by the timing of orders for large products, particularly in the E&C segment, and the amount of backlog at
December 31, 2017
described above is not necessarily indicative of future backlog levels or the rate at which backlog will be recognized as sales. Orders included in our backlog may include customary cancellation provisions under which the customer could cancel all or part of the order, potentially subject to the payment of certain costs and/or penalties. For further information about our backlog, including backlog by business segment, see Item 7, “Management’s Discussion and Analysis of Financial Condition and Results of Operations.”
Customers
We sell our products primarily to gas producers, distributors, and end-users across energy, industrial, cryobiological storage, power, HVAC, refining, and respiratory healthcare applications in countries throughout the world. Sales to our top ten customers accounted for
35%
,
38%
, and
36%
of consolidated sales in
2017, 2016 and 2015
, respectively. No customer exceeded 10% of consolidated sales in 2017 or 2015. One customer, Airgas “an Air Liquide company” and Air Liquide, exceeded 10% of consolidated sales in 2016. Sales from this customer represented approximately $98.9 million or
11.5%
of total consolidated sales in 2016 and is primarily attributable to the D&S segment, along with the BioMedical and E&C segments.
Our sales to particular customers fluctuate from period to period, but the global producers and distributors of hydrocarbon and industrial gases and their suppliers tend to be a consistently large source of revenue for us. Our supply contracts are generally contracts for “requirements” only. While our customers may be obligated to purchase a certain percentage of their supplies from us, there are generally no minimum requirements. Also, many of our contracts may be canceled at any time, subject to possible cancellation charges. To minimize credit risk from trade receivables, we review the financial condition of potential customers in relation to established credit requirements before sales credit is extended and we monitor the financial condition of customers to help ensure timely collections and to minimize losses. In addition, for certain domestic and foreign customers, particularly in the D&S and E&C segments, we require advance payments, letters of credit, bankers’ acceptances, and other such guarantees of payment. Certain customers also require us to issue letters of credit or performance bonds, particularly in instances where advance payments are involved, as a condition to placing the order. We believe our relationships with our customers are generally good.
Intellectual Property
Although we have a number of patents, trademarks, and licenses related to our business, no one of them or related group of them is considered by us to be of such importance that its expiration or termination would have a material adverse effect on our business. In general, we depend upon technological capabilities, manufacturing quality control, and application of know-how, rather than patents or other proprietary rights, in the conduct of our business.
Raw Materials and Suppliers
We manufacture most of the products we sell. The raw materials used in manufacturing include aluminum products (including sheets, bars, plate, and piping), stainless steel products (including sheets, plates, heads, and piping), palladium oxide, carbon steel products (including sheets, plates, and heads), valves and gauges, and fabricated metal components. Most raw materials are available from multiple sources of supply. We have long-term relationships with our raw material suppliers and other vendors.
8
Commodity components of our raw material (stainless steel and carbon steel) could experience some level of volatility during
2018
and may have a relational impact on raw material pricing. Subject to certain risks related to our suppliers as discussed under Item 1A. “Risk Factors,” we foresee no acute shortages of any raw materials that would have a material adverse effect on our operations.
Employees
As of January 31,
2018
, we had
4,424
employees, including
2,393
domestic employees and
2,031
international employees.
We are party to one collective bargaining agreement with the International Association of Machinists and Aerospace Workers (“IAM”) covering
193
employees at our La Crosse, Wisconsin heat exchanger facility. Effective February 3, 2018, we entered into a five-year agreement with the IAM which expires on February 6, 2021.
Environmental Matters
Our operations have historically included and currently include the handling and use of hazardous and other regulated substances, such as various cleaning fluids used to remove grease from metal, that are subject to federal, state, local, and foreign environmental laws and regulations. These regulations impose limitations on the discharge of pollutants into the soil, air, and water and establish standards for their handling, management, use, storage, and disposal. We monitor and review our procedures and policies for compliance with environmental laws and regulations. Our management is familiar with these regulations and supports an ongoing program to maintain our adherence to required standards.
We are involved with environmental compliance, investigation, monitoring, and remediation activities at certain of our owned or formerly owned manufacturing facilities and at one owned facility that is leased to a third party. We believe that we are currently in substantial compliance with all known environmental regulations. We accrue for certain environmental remediation-related activities for which commitments or remediation plans have been developed or for which costs can be reasonably estimated. These estimates are determined based upon currently available facts regarding each facility. Actual costs incurred may vary from these estimates due to the inherent uncertainties involved. Future expenditures relating to these environmental remediation efforts are expected to be made over the next
10 years
as ongoing costs of remediation programs. We do not believe that these regulatory requirements have had a material effect upon our capital expenditures, earnings, or competitive position. We are not anticipating any material capital expenditures in
2018
that are directly related to regulatory compliance matters. Although we believe we have adequately provided for the cost of all known environmental conditions, additional contamination, the outcome of disputed matters, or changes in regulatory posture could result in more costly remediation measures than budgeted, or those we believe are adequate or required by existing law. We believe that any additional liability in excess of amounts accrued which may result from the resolution of such matters will not have a material adverse effect on our financial position, liquidity, cash flows, or results of operations.
Available Information
Additional information about the Company is available at www.chartindustries.com. On the Investor Relations page of the website, the public may obtain free copies of our Annual Report on Form 10-K, Quarterly Reports on Form 10-Q, Current Reports on Form 8-K and any amendments to those reports filed or furnished pursuant to Section 13(a) or 15(d) of the Securities Exchange Act of 1934 as soon as reasonably practicable following the time that they are filed with, or furnished to, the Securities and Exchange Commission (“SEC”). Additionally, we have posted our Code of Ethical Business Conduct and Officer Code of Ethics on our website, which are also available free of charge to any shareholder interested in obtaining a copy. This Form 10-K and reports filed with the SEC are also accessible through the SEC’s website at www.sec.gov. References to our website or the SEC’s website do not constitute incorporation by reference of the information contained on such websites, and such information is not part of this Form 10-K.
9
|
Item 1A.
|
Risk Factors
|
Investing in our common stock involves risk. You should carefully consider the risks described below, as well as the other information contained in this Annual Report on Form 10-K in evaluating your investment in us. If any of the following risks actually occur, our business, financial condition, operating results, or cash flows could be harmed materially. Additional risks, uncertainties, and other factors that are not currently known to us or that we believe are not currently material may also adversely affect our business, financial condition, operating results or cash flows. In any of these cases, you may lose all or part of your investment in us.
Risks Related to Our Business
The markets we serve are subject to cyclical demand and vulnerable to economic downturn, which could harm our business and make it difficult to project long-term performance.
Demand for our products depends in large part upon the level of capital and maintenance expenditures by many of our customers and end-users, in particular those customers in the global hydrocarbon and industrial gas markets. These customers’ expenditures historically have been cyclical in nature and vulnerable to economic downturns. Decreased capital and maintenance spending by these customers could have a material adverse effect on the demand for our products and our business, financial condition, and results of operations. In addition, this historically cyclical demand limits our ability to make accurate long-term predictions about the performance of our company. Even if demand improves, it is difficult to predict whether any improvement represents a long-term improving trend or the extent or timing of improvement. There can be no assurance that historically improving cycles are representative of actual future demand.
The loss of, or significant reduction or delay in, purchases by our largest customers could reduce our sales and profitability.
A small number of customers has accounted for a substantial portion of our historical net sales. For example, sales to our top ten customers accounted for
35%
,
38%
, and
36%
of consolidated sales in
2017, 2016 and 2015
, respectively, with sales to one customer of approximately
11.5%
of consolidated sales in 2016. We expect that a limited number of customers will continue to represent a substantial portion of our sales for the foreseeable future. While our sales to particular customers fluctuate from period to period, the global producers and distributors of hydrocarbon and industrial gases and their suppliers tend to be a consistently large source of our sales.
The loss of any of our major customers, consolidation of our customers, or a decrease or delay in orders or anticipated spending by such customers could materially reduce our sales and profitability. Although order activity in 2017 increased year over year, we continued to experience energy price volatility and our customers’ adjusted project timing. Delays in the anticipated timing of LNG infrastructure build out could materially reduce the demand for our products. Our largest customers could also engage in business combinations, which could increase their size, reduce their demand for our products as they recognize synergies or rationalize assets and increase or decrease the portion of our total sales concentration to any single customer. For example, two of our largest customers, Airgas and Air Liquide, combined during 2016. Further industry consolidation could further exacerbate our customer concentration risk.
If we are unable to successfully control our costs and efficiently manage our operations, it may place a significant strain on our management and administrative resources and lead to increased costs and reduced profitability.
We have implemented cost savings initiatives to align our business with current and expected economic conditions. Our ability to operate our business successfully and implement our strategies depends, in part, on our ability to allocate our resources optimally in each of our facilities in order to maintain efficient operations. Ineffective management could cause manufacturing inefficiencies, increase our operating costs, place significant strain on our management and administrative resources, and prevent us from being able to take advantage of opportunities as economic conditions improve. If we are unable to align our cost structure in response to prevailing economic conditions on a timely basis, or if implementation or failure to implement any cost structure adjustments has an adverse impact on our business or prospects, then our financial condition, results of operations, and cash flows may be negatively affected.
Similarly, it is critical that we appropriately manage our planned capital expenditures in this challenging economic environment. For example, we have invested or plan to invest approximately
$35
to
$45 million
in new capital expenditures in
2018
. If we fail to manage the projects related to these capital expenditures in an effective manner, we may lose the opportunity to obtain some new customer orders or the ability to operate our businesses efficiently. Even if we effectively implement these projects, the orders needed to support the capital expenditure may not be obtained, may be delayed, or may be less than expected, which may result in sales or profitability at lower levels than anticipated. For example, while we invested in the expansion of our D&S segment in China in recent years, we have experienced significant delays in some of the related orders anticipated to support that expansion, which has resulted in the underutilization of our capacity in China.
10
Decreases in energy prices, or a decrease in the cost of oil relative to natural gas, may decrease demand for some of our products and cause downward pressure on the prices we charge, which could harm our business, financial condition, and results of operations.
A significant amount of our sales is to customers in the energy production and supply industry. We estimate that
35%
of our sales for the year ended
December 31, 2017
were generated by end-users in the energy industry, with many of our products sold for natural gas-related applications. Accordingly, demand for a significant portion of our products depends upon the level of capital expenditures by companies in the oil and gas industry, which depends, in part, on energy prices, as well as the price of oil relative to natural gas for some applications. Some applications for our products could see greater demand when prices for natural gas are relatively low compared to oil prices, but a sustained decline in energy prices generally and a resultant downturn in energy production activities could negatively affect the capital expenditures of our customers. For example, the sharp decline in oil prices since the fourth quarter of 2014 has had a negative impact on demand for some of our products. Although prices have recovered somewhat from recent lows, any further deterioration and significant decline in the capital expenditures of our customers, whether due to a decrease in the market price of energy or otherwise, may decrease demand for our products and cause downward pressure on the prices we charge. Accordingly, if there is a continued or further downturn in the energy production and supply industry, including a decline in the cost of oil relative to natural gas, our business, financial condition, and results of operations could be adversely affected.
We carry goodwill and indefinite-lived intangible assets on our balance sheet, which are subject to impairment testing and could subject us to significant non-cash charges to earnings in the future if impairment occurs.
As of
December 31, 2017
, we had goodwill and indefinite-lived intangible assets of
$573.9 million
, which represented approximately
33.3%
of our total assets. Goodwill and indefinite-lived intangible assets are not amortized, but are tested for impairment annually in the fourth quarter or more often if events or changes in circumstances indicate a potential impairment may exist. Factors that could indicate that our goodwill or indefinite-lived intangible assets are impaired include a decline in our stock price and market capitalization, lower than projected operating results and cash flows, and slower growth rates in our industry. Our stock price historically has shown volatility and often fluctuates significantly in response to market and other factors. Declines in our stock price, lower operating results and any decline in industry conditions in the future could increase the risk of impairment. Impairment testing incorporates our estimates of future operating results and cash flows, estimates of allocations of certain assets and cash flows among reporting segments, estimates of future growth rates, and our judgment regarding the applicable discount rates used on estimated operating results and cash flows. For example, as a result of our impairment analyses, we recorded an impairment charge related to goodwill and indefinite-live intangible assets of
$207.6 million
during the fourth quarter of 2015. During 2017 and 2016, there were no further goodwill and indefinite-lived intangible asset impairment charges. If we determine that further impairment exists, it may result in a significant non-cash charge to earnings and lower stockholders’ equity.
Our backlog is subject to modification, termination or reduction of orders, which could negatively impact our sales.
Our backlog is comprised of the portion of firm signed purchase orders or other written contractual commitments received from customers that we have not recognized as sales. The dollar amount of backlog as of
December 31, 2017
was
$461.3 million
. Our backlog can be significantly affected by the timing of orders for large projects, particularly in our E&C segment, and the amount of our backlog at
December 31, 2017
is not necessarily indicative of future backlog levels or the rate at which backlog will be recognized as sales. Although modifications and terminations of our orders may be partially offset by cancellation fees, customers can, and sometimes do, terminate or modify these orders. We cannot predict whether cancellations will accelerate or diminish in the future. Cancellations of purchase orders, indications that the customers will not perform or reductions of product quantities in existing contracts could substantially and materially reduce our backlog and, consequently, our future sales. For example, during 2015, D&S segment backlog was reduced by approximately $150.0 million when circumstances suggested that our customers were not likely to take delivery in the future. Our failure to replace canceled orders could negatively impact our sales and results of operations. Included in the E&C backlog is approximately $40 million related to the previously announced Magnolia LNG order where production release is delayed into early 2019. We did not have any significant cancellations in 2017.
We may fail to successfully integrate companies that provide complementary products or technologies, including the recent Hudson acquisition.
A component of our business strategy is the acquisition of businesses that complement our existing products and services. Such a strategy involves the potential risks inherent in assessing the value, strengths, weaknesses, contingent or other liabilities, and potential profitability of acquisition candidates and in integrating the operations of acquired companies. In addition, any acquisitions of businesses with foreign operations or sales may increase our exposure to risks inherent in doing business outside the United States.
11
For example, we acquired Hudson on September 30, 2017 for a purchase price of $419.5 million, net of cash acquired (including certain estimated net working capital adjustments and acquisition-related tax benefits acquired). The benefits that are expected to result from the Hudson acquisition will depend, in part, on our ability to realize the anticipated growth opportunities and cost synergies from the acquisition. There can be no assurance that we successfully or cost-effectively integrate Hudson into our business and realize these expected benefits. The failure to do so could have a material adverse effect on our business, financial condition and results of operations.
From time to time, we may have acquisition discussions with other potential target companies both domestically and internationally. If a large acquisition opportunity arises and we proceed, a substantial portion of our cash and surplus borrowing capacity could be used for the acquisition or we may seek additional debt or equity financing.
Potential acquisition opportunities become available to us from time to time, and we periodically engage in discussions or negotiations relating to potential acquisitions, including acquisitions that may be material in size or scope to our business. Any acquisition may or may not occur and, if an acquisition does occur, such as the recent Hudson acquisition, it may not be successful in enhancing our business for one or more of the following reasons:
|
•
|
Any business acquired may not be integrated successfully and may not prove profitable;
|
|
•
|
The price we pay for any business acquired may overstate the value of that business or otherwise be too high;
|
|
•
|
Liabilities we take on through the acquisition may prove to be higher than we expected;
|
|
•
|
We may fail to achieve acquisition synergies; or
|
|
•
|
The focus on the integration of operations of acquired entities may divert management’s attention from the day-to-day operation of our businesses.
|
Inherent in any future acquisition is the risk of transitioning company cultures and facilities. The failure to efficiently and effectively achieve such transitions could increase our costs and decrease our profitability.
Governmental energy policies could change or expected changes could fail to materialize which could adversely affect our business or prospects.
Energy policy can develop rapidly in the markets we serve, including the United States, Asia, Australia, Europe, and Latin America. Within the last few years, significant developments have taken place, primarily in international markets that we serve with respect to energy policy and related regulations. We anticipate that energy policy will continue to be an important regulatory priority globally, as well as on a national, state, and local level. As energy policy continues to evolve, the existing rules and incentives that impact the energy-related segments of our business may change. It is difficult, if not impossible, to predict whether changes in energy policy might occur in the future and the timing of potential changes and their impact on our business. The elimination or reduction of favorable policies for our energy-related business, or the failure to adopt expected policies that would benefit our business, could negatively impact our sales and profitability.
Our exposure to fixed-price contracts, including exposure to fixed pricing on long-term customer contracts and performance guarantees, could negatively impact our financial results.
A substantial portion of our sales has historically been derived from fixed-price contracts for large system projects which may involve long-term fixed price commitments to customers or guarantees of equipment or process performance and which are sometimes difficult to execute. To the extent that any of our fixed-price contracts are delayed, we fail to satisfy a performance guarantee, our subcontractors fail to perform, contract counterparties successfully assert claims against us, the original cost estimates in these or other contracts prove to be inaccurate or the contracts do not permit us to pass increased costs on to our customers, profitability from a particular contract may decrease or project losses may be incurred, which, in turn, could decrease our sales and overall profitability. The uncertainties associated with our fixed-price contracts make it more difficult to predict our future results and exacerbate the risk that our results will not match expectations, which has happened in the past.
We depend on the availability of certain key suppliers; if we experience difficulty with a supplier, we may have difficulty finding alternative sources of supply.
The cost, quality, and availability of raw materials, certain specialty metals and specialized components used to manufacture our products are critical to our success. The materials and components we use to manufacture our products are sometimes custom made and may be available only from a few suppliers, and the lead times required to obtain these materials and components can often be significant. We rely on sole suppliers or a limited number of suppliers for some of these materials, including special grades of aluminum used in our brazed aluminum heat exchangers and compressors included in some of our product offerings. While we have not historically encountered problems with availability, this does not mean that we will continue to have timely access to adequate supplies of essential materials and components in the future or that supplies of these materials and components will be
12
available on satisfactory terms when needed. If our vendors for these materials and components are unable to meet our requirements, fail to make shipments in a timely manner, or ship defective materials or components, we could experience a shortage or delay in supply or fail to meet our contractual requirements, which would adversely affect our results of operations and negatively impact our cash flow and profitability.
Health care reform or other changes in government and other third-party payor reimbursement levels and practices could negatively impact our sales and profitability.
Many of our BioMedical segment’s customers are reimbursed for products and services by third-party payors, such as government programs, including Medicare and Medicaid, private insurance plans and managed care programs in the U.S., and by similar programs and entities in the other countries in which we operate or sell our equipment.
The Centers for Medicare & Medicaid Services (“CMS”), the agency responsible for administering the Medicare program, has implemented a number of payment rules that reduced Medicare payments for oxygen and oxygen equipment. There remains a significant amount of uncertainty regarding healthcare reform and the effect of competitive bidding on the durable medical equipment industry. The potential impact of new and changing policies on the demand for our products or the prices at which we sell our products could have a material adverse effect on our business, results of operations, and/or financial condition.
Due to the nature of our business and products, we may be liable for damages based on product liability and warranty claims.
Due to the high pressures and low temperatures at which many of our products are used, the inherent risks associated with concentrated industrial and hydrocarbon gases, and the fact that some of our products are relied upon by our customers or end users in their facilities or operations or are manufactured for relatively broad industrial, medical, transportation, or consumer use, we face an inherent risk of exposure to claims in the event that the failure, use, or misuse of our products results, or is alleged to result, in death, bodily injury, property damage, or economic loss. We believe that we meet or exceed existing professional specification standards recognized or required in the industries in which we operate. We have been subject to claims from time to time, some of which were substantial. Although we currently maintain product liability coverage, it includes customary exclusions and conditions, it may not cover certain specialized applications such as aerospace-related applications, and it generally does not cover warranty claims. Additionally, such insurance may become difficult to obtain or be unobtainable in the future on terms acceptable to us. A successful product liability claim or series of claims against us, including one or more consumer claims purporting to constitute class actions or claims resulting from extraordinary loss events, in excess of or outside our insurance coverage, or a significant warranty claim or series of claims against us, could materially decrease our liquidity, impair our financial condition, and adversely affect our results of operations.
Fluctuations in currency exchange or interest rates may adversely affect our financial condition and operating results.
A significant portion of our revenue and expense is incurred outside of the United States. We must translate revenues, income and expenses, as well as assets and liabilities into U.S. dollars using exchange rates during or at the end of each period. Fluctuations in currency exchange rates have had, and will continue to have an impact on our financial condition, operating results, and cash flow. While we monitor and manage our foreign currency exposure with limited use of derivative financial instruments to mitigate these exposures, fluctuations in currency exchange rates may materially impact our financial and operational results.
In addition, we are exposed to changes in interest rates. While our convertible notes have a fixed cash coupon, other instruments, primarily borrowings under our senior secured revolving credit facility, are exposed to a variable interest rate. The impact of a 200 basis point increase in interest rates to our senior secured revolving credit facility is discussed in the “Quantitative and Qualitative Disclosures About Market Risk” section of this report.
As a global business, we are exposed to economic, political, and other risks in different countries which could materially reduce our sales, profitability or cash flows, or materially increase our liabilities.
Since we manufacture and sell our products worldwide, our business is subject to risks associated with doing business internationally. In
2017, 2016 and 2015
,
47%
,
50%
, and
51%
, respectively, of our sales occurred in international markets. Our future results could be harmed by a variety of factors, including:
|
•
|
changes in foreign currency exchange rates;
|
|
•
|
exchange controls and currency restrictions;
|
|
•
|
changes in a specific country’s or region’s political, social or economic conditions, particularly in emerging markets;
|
|
•
|
civil unrest, turmoil or outbreak of disease in any of the countries in which we operate or sell our products;
|
|
•
|
tariffs, other trade protection measures and import or export licensing requirements;
|
13
|
•
|
potential adverse changes in trade agreements between the United States and foreign countries, including the North American Free Trade Agreement (NAFTA) among the United States, Canada and Mexico;
|
|
•
|
potentially negative consequences from changes in U.S. and international tax laws;
|
|
•
|
difficulty in staffing and managing geographically widespread operations;
|
|
•
|
differing labor regulations;
|
|
•
|
requirements relating to withholding taxes on remittances and other payments by subsidiaries;
|
|
•
|
different regulatory regimes controlling the protection of our intellectual property;
|
|
•
|
restrictions on our ability to own or operate subsidiaries, make investments or acquire new businesses in these jurisdictions;
|
|
•
|
restrictions on our ability to repatriate dividends from our foreign subsidiaries;
|
|
•
|
difficulty in collecting international accounts receivable;
|
|
•
|
difficulty in enforcement of contractual obligations under non-U.S. law;
|
|
•
|
transportation delays or interruptions;
|
|
•
|
changes in regulatory requirements; and
|
|
•
|
the burden of complying with multiple and potentially conflicting laws.
|
Our international operations and sales also expose us to different local political and business risks and challenges. For example, we are faced with potential difficulties in staffing and managing local operations and we have to design local solutions to manage credit and legal risks of local customers and distributors, which may not be effective. In addition, because some of our international sales are to suppliers that perform work for foreign governments, we are subject to the political risks associated with foreign government projects. For example, certain foreign governments may require suppliers for a project to obtain products solely from local manufacturers or may prohibit the use of products manufactured in certain countries.
Our operations in markets such as Asia, Australia, Europe, and Latin America, may cause us difficulty due to greater regulatory barriers than in the United States, the necessity of adapting to new regulatory systems, problems related to entering new markets with different economic, social and political systems and conditions, and significant competition from the primary participants in these markets, some of which may have substantially greater resources than us. In addition, unstable political conditions or civil unrest, including political instability in Eastern Europe, the Middle East or elsewhere, could negatively impact our order levels and sales in a region or our ability to collect receivables from customers or operate or execute projects in a region.
Our international operations and transactions also depend upon favorable trade relations between the United States and those foreign countries in which our customers and suppliers have operations. A protectionist trade environment in either the United States or those foreign countries in which we do business or sell products, such as a change in the current tariff structures, export compliance, government subsidies or other trade policies, may adversely affect our ability to sell our products or do business in foreign markets. Our overall success as a global business depends, in part, upon our ability to succeed in differing economic, social and political conditions. We may not succeed in developing and implementing policies and strategies to counter the foregoing factors effectively in each location where we do business and the foregoing factors may cause a reduction in our sales, profitability or cash flows, or cause an increase in our liabilities.
Increased IT security threats and more sophisticated and targeted computer crime could pose a risk to our systems, networks, products, solutions and services.
Increased global IT security threats and more sophisticated and targeted computer crime pose a risk to the security of our systems and networks and the confidentiality, availability and integrity of our data. While we attempt to mitigate these risks by employing a number of measures, including employee training, comprehensive monitoring of our networks and systems, and maintenance of backup and protective systems, our systems, networks, products, solutions and services remain potentially vulnerable to advanced persistent threats. Depending on their nature and scope, such threats could potentially lead to the compromising of confidential information, improper use of our systems and networks, manipulation and destruction of data, defective products, production downtimes and operational disruptions, which in turn could adversely affect our reputation, competitiveness and results of operations.
We are subject to potential insolvency or financial distress of third parties.
We are exposed to the risk that third parties to various arrangements who owe us money or goods and services, or who purchase goods and services from us, will not be able to perform their obligations or continue to place orders due to insolvency or financial distress. If third parties fail to perform their obligations under arrangements with us, we may be forced to replace the underlying commitment at current or above market prices or on other terms that are less favorable to us or we may have to write
14
off receivables in the case of customer failures to pay. If this happens, whether as a result of the insolvency or financial distress of a third party or otherwise, we may incur losses, or our results of operations, financial position or liquidity could otherwise be adversely affected.
Failure to protect our intellectual property and know-how could reduce or eliminate any competitive advantage and reduce our sales and profitability, and the cost of protecting our intellectual property may be significant.
We rely on a combination of internal procedures, nondisclosure agreements and intellectual property rights assignment agreements, as well as licenses, patents, trademarks and copyright law to protect our intellectual property and know-how. Our intellectual property rights may not be successfully asserted in the future or may be invalidated, circumvented or challenged. For example, we frequently explore and evaluate potential relationships and projects with other parties, which often require that we provide the potential partner with confidential technical information. While confidentiality agreements are typically put in place, there is a risk the potential partner could violate the confidentiality agreement and use our technical information for its own benefit or the benefit of others or compromise the confidentiality. In addition, the laws of certain foreign countries in which our products may be sold or manufactured do not protect our intellectual property rights to the same extent as the laws of the United States. In addition, the United States has transitioned from a “first-to-invent” to a “first-to-file” patent system, which means that between two identical, pending patent applications, the first inventor no longer receives priority on the patent to the invention. As a result, the Leahy-Smith America Invents Act may require us to incur significant additional expense and effort to protect our intellectual property. Failure or inability to protect our proprietary information could result in a decrease in our sales or profitability.
We have obtained and applied for some U.S. and foreign trademark and patent registrations and will continue to evaluate the registration of additional trademarks and patents, as appropriate. We cannot guarantee that any of our pending applications will be approved. Moreover, even if the applications are approved, third parties may seek to oppose or otherwise challenge them. A failure to obtain registrations in the United States or elsewhere could limit our ability to protect our trademarks and technologies and could impede our business. Further, the protection of our intellectual property may require expensive investment in protracted litigation and the investment of substantial management time and there is no assurance we ultimately would prevail or that a successful outcome would lead to an economic benefit that is greater than the investment in the litigation. The patents in our patent portfolio are scheduled to expire between 2018 and 2037.
In addition, we may be unable to prevent third parties from using our intellectual property rights and know-how without our authorization or from independently developing intellectual property that is the same as or similar to ours, particularly in those countries where the laws do not protect our intellectual property rights as fully as in the United States. We compete in a number of industries (e.g., heat exchangers and cryogenic storage) that are small or specialized, which makes it easier for a competitor to monitor our activities and increases the risk that ideas will be stolen. The unauthorized use of our know-how by third parties could reduce or eliminate any competitive advantage we have developed, cause us to lose sales or otherwise harm our business or increase our expenses as we attempt to enforce our rights.
Some of our products are subject to regulation by the U.S. Food and Drug Administration and other governmental authorities.
Some of our products are subject to regulation by the U.S. Food and Drug Administration and other national, supranational, federal and state governmental authorities. It can be costly and time consuming to obtain regulatory approvals to market a medical device, such as those sold by our BioMedical segment. Approvals might not be granted for new devices on a timely basis, if at all. Regulations are subject to change as a result of legislative, administrative or judicial action, which may further increase our costs or reduce sales. Our failure to maintain approvals or obtain approval for new products could adversely affect our business, results of operations, financial condition and cash flows.
In addition, we are subject to regulations covering manufacturing practices, product labeling, advertising and adverse-event reporting that apply after we have obtained approval to sell a product. Many of our facilities’ procedures and those of our suppliers are subject to ongoing oversight, including periodic inspection by governmental authorities. Compliance with production, safety, quality control and quality assurance regulations is costly and time-consuming, and while we seek to be in full compliance, noncompliance could arise from time to time. If we fail to comply, our operations, financial condition and cash flows could be adversely affected, including through the imposition of fines, costly remediation or plant shutdowns, suspension or delay in product approval, product seizure or recall, or withdrawal of product approval as a result of noncompliance.
We may be required to make material expenditures in order to comply with environmental, health and safety laws and climate change regulations, or incur additional liabilities under these laws and regulations.
We are subject to numerous environmental, health and safety laws and regulations that impose various environmental controls on us or otherwise relate to environmental protection and various health and safety matters, including the discharge of pollutants in the air and water, the handling, use, treatment, storage and clean-up of solid and hazardous materials and wastes, the investigation and remediation of soil and groundwater affected by hazardous substances and the requirement to obtain and maintain permits
15
and licenses. These laws and regulations often impose strict, retroactive and joint and several liability for the costs and damages resulting from cleaning up our or our predecessors’ facilities and third party disposal sites. Compliance with these laws generally increases the costs of transportation and storage of raw materials and finished products, as well as the costs of storing and disposing waste, and could decrease our liquidity and profitability and increase our liabilities. Health and safety and other laws in the jurisdictions in which we operate impose various requirements on us including state licensing requirements that may benefit our customers. If we are found to have violated any of these laws, we may become subject to corrective action orders and fines or penalties, and incur substantial costs, including substantial remediation costs and commercial liability to our customers. Further, we also could be subject to future liability resulting from conditions that are currently unknown to us that could be discovered in the future.
We are currently remediating or developing work plans for remediation of environmental conditions involving certain current or former facilities. For example, the discovery of contamination arising from historical industrial operations at our Clarksville, Arkansas property, which is currently being leased to a third party business, has exposed us, and in the future may continue to expose us, to remediation obligations. We have also been subject to environmental liabilities for other sites where we formerly operated or at locations where we or our predecessors did or are alleged to have operated. To date, our environmental remediation expenditures and costs for otherwise complying with environmental laws and regulations have not been material, but the uncertainties associated with the investigation and remediation of contamination and the fact that such laws or regulations change frequently makes predicting the cost or impact of such laws and regulations on our future operations uncertain. Stricter environmental, safety and health laws, regulations or enforcement policies could result in substantial costs and liabilities to us and could subject us to more rigorous scrutiny. Consequently, compliance with these laws could result in significant expenditures, as well as other costs and liabilities that could decrease our liquidity and profitability and increase our liabilities.
There is a growing political and scientific belief that emissions of greenhouse gases alter the composition of the global atmosphere in ways that are affecting the global climate. Various stakeholders, including legislators and regulators, stockholders and non-governmental organizations, as well as companies in many business sectors, are considering ways to reduce greenhouse gas emissions. New regulations could result in product standard requirements for our global businesses but because any impact is dependent on the design of the mandate or standard, we are unable to predict its significance at this time. Furthermore, the potential physical impacts of theorized climate change on our customers, and therefore on our operations, are speculative and highly uncertain, and would be particular to the circumstances developing in various geographical regions. These may include changes in weather patterns (including drought and rainfall levels), water availability, storm patterns and intensities, and temperature levels. These potential physical effects may adversely impact the cost, production, sales and financial performance of our operations.
Our pension plan is currently underfunded and we contribute to a multi-employer plan for collective bargaining U.S. employees, which is also underfunded.
Certain U.S. hourly and salaried employees are covered by our defined benefit pension plan. The plan has been frozen since February 2006. As of
December 31, 2017
, the projected benefit obligation under our pension plan was approximately
$57.0 million
and the value of the assets of the plan was approximately
$48.5 million
, resulting in our pension plan being underfunded by approximately
$8.5 million
.
As part of the Hudson acquisition we acquired a noncontributory defined benefit plan covering certain employees of a Hudson subsidiary. This plan is closed to new participants. As of December 31, 2017, the projected benefit obligation of the plan was $2.8 million and the fair value of plan assets were $1.9 million, resulting in the pension plan being underfunded by approximately $0.9 million.
We are also a participant in a multi-employer plan, which is underfunded. Among other risks associated with multi-employer plans, contributions and unfunded obligations of the multi-employer plan are shared by the plan participants and we may inherit unfunded obligations if other plan participants withdraw from the plan or cease to participate. Additionally, if we elect to stop participating in the multi-employer plan, we may be required to pay amounts related to withdrawal liabilities associated with the underfunded status of the plan. If the performance of the assets in our pension plan or the multi-employer plan does not meet expectations or if other actuarial assumptions are modified, our required pension contributions for future years could be higher than we expect, which may negatively impact our results of operations, cash flows and financial condition.
16
We operate in many different jurisdictions and we could be adversely affected by violations of the U.S. Foreign Corrupt Practices Act and similar worldwide anti-corruption laws.
The U.S. Foreign Corrupt Practices Act (“FCPA”) and similar worldwide anti-corruption laws generally prohibit companies and their intermediaries from making improper payments for the purpose of obtaining or retaining business. Our internal policies mandate compliance with these anti-corruption laws. We operate in many parts of the world that have experienced corruption to some degree, and in certain circumstances, strict compliance with anti-corruption laws may conflict with local customs and practices. Despite our training and compliance programs, we cannot assure you that our internal control policies and procedures always will protect us from reckless or criminal acts committed by our employees or agents. Our continued expansion outside the U.S., including in developing countries, could increase the risk of such violations in the future. Violations of these laws, or allegations of such violations, could disrupt our business and result in a material adverse effect on our results of operations or financial condition.
Our operations could be impacted by the effects of severe weather.
Some of our operations, including our operations in New Iberia, Louisiana and Houston, Texas, are located in geographic regions and physical locations that are susceptible to physical damage and longer-term economic disruption from hurricanes or other severe weather. We also could make significant future capital expenditures in hurricane-susceptible or other severe weather locations from time to time. These weather events can disrupt our operations, result in damage to our properties and negatively affect the local economy in which these facilities operate. In September 2008, for example, our New Iberia, Louisiana facility was forced to close as a result of heavy rainfall, evacuations, strong winds and power outages resulting from Hurricane Gustav. Two weeks after Hurricane Gustav, winds and flooding from Hurricane Ike damaged our New Iberia, Louisiana, Houston, Texas and The Woodlands, Texas operations and offices, and those facilities were also closed for a period of time, and in September 2017, our employees in Beasley, Texas and in the Houston area were impacted by the flooding and damage from Hurricane Harvey. Future hurricanes or other severe weather may cause production or delivery delays as a result of the physical damage to the facilities, the unavailability of employees and temporary workers, the shortage of or delay in receiving certain raw materials or manufacturing supplies and the diminished availability or delay of transportation for customer shipments, any of which may have an adverse effect on our sales and profitability. Additionally, the potential physical impact of theorized climate change could include more frequent and intense storms, which would heighten the risk to our operations in areas that are susceptible to hurricanes and other severe weather. Although we maintain insurance subject to certain deductibles, which may cover some of our losses, that insurance may become unavailable or prove to be inadequate.
We are subject to regulations governing the export of our products.
Due to our significant foreign sales, our export activities are subject to regulation, including the U.S. Treasury Department’s Office of Foreign Assets Control’s regulations. We believe we are in compliance with these regulations and maintain robust programs intended to maintain compliance. However, unintentional lapses in our compliance or uncertainties associated with changing regulatory requirements could result in future violations (or alleged violations) of these regulations. Any violations may subject us to government scrutiny, investigation and civil and criminal penalties and may limit our ability to export our products.
As a provider of products to the U.S. government, we are subject to federal rules, regulations, audits and investigations, the violation or failure of which could adversely affect our business.
We sell certain of our products to the U.S. government; and, therefore, we must comply with and are affected by laws and regulations governing purchases by the U.S. government. Government contract laws and regulations affect how we do business with our government customers and, in some instances, impose added costs on our business. For example, a violation of specific laws and regulations could result in the imposition of fines and penalties or the termination of our contracts or debarment from bidding on contracts. In some instances, these laws and regulations impose terms or rights that are more favorable to the government than those typically available to commercial parties in negotiated transactions.
Current economic and political conditions make tax rules in jurisdictions subject to significant change, and unanticipated changes in our effective tax rate could adversely affect our future results.
Our future results of operations could be affected by changes in the effective tax rate as a result of changes in tax laws, regulations and judicial rulings. In December 2017, the Tax Cuts and Jobs Act of 2017 was signed into law in the United States, which among other things, lowered the federal corporate income tax rate from 35% to 21% and moved the country towards a territorial tax system with a one-time mandatory tax on previously deferred foreign earnings of foreign subsidiaries. We are continuing to evaluate the impact of tax reform and expect our effective tax rate to decrease. However, there can be no assurances that any expected benefit from the Tax Cuts and Jobs Act will be maintained long-term given political and other uncertainties.
17
Also, further changes in the tax laws of foreign jurisdictions could arise, including as a result of the base erosion and profit shifting (BEPS) project undertaken by the Organisation for Economic Cooperation and Development (OECD). The OECD, which represents a coalition of member countries, has issued recommendations that, in some cases, would make substantial changes to numerous long-standing tax positions and principles. These contemplated changes, to the extent adopted by OECD members and/or other countries, could increase tax uncertainty and may adversely affect our provision for income taxes.
Our effective tax rate could also be adversely affected by changes in the mix of earnings and losses in countries with differing statutory tax rates, certain non-deductible expenses arising from share based compensation, the valuation of deferred tax assets and liabilities and changes in accounting principles. In addition, we are subject to income tax audits by many tax jurisdictions throughout the world. Although we believe our income tax liabilities are reasonably estimated and accounted for in accordance with applicable laws and principles, an adverse resolution of one or more uncertain tax positions in any period could have a material impact on the results of operations for that period.
Risks Related to Our Leverage
Our leverage and future debt service obligations could adversely affect our financial condition, limit our ability to raise additional capital to fund our operations, limit our ability to react to changes in the economy or our industry, impact the way we operate our business, expose us to interest rate risk to the extent of our variable rate debt and prevent us from fulfilling our debt service obligations.
We are leveraged and have future debt service obligations. Our financial performance could be affected by our leverage. As of
December 31, 2017
, our total indebtedness was
$562.8 million
. In addition, at that date, under our senior secured revolving credit facility, we had
$42.9 million
of letters of credit and bank guarantees outstanding and borrowing capacity of approximately
$168.1 million
. Through separate facilities, our subsidiaries had
$7.2 million
in bank guarantees outstanding at
December 31, 2017
.
Our level of indebtedness could have important negative consequences, including:
|
•
|
difficulty in generating sufficient cash flow and reduced availability of cash for our operations and other business activities;
|
|
•
|
difficulty in obtaining financing in the future;
|
|
•
|
exposure to risk of increased interest rates due to variable rates of interest under our senior secured revolving credit facility;
|
|
•
|
vulnerability to general economic downturns and adverse industry conditions;
|
|
•
|
increased competitive disadvantage due to our debt service obligations;
|
|
•
|
adverse customer reaction to our debt levels;
|
|
•
|
inability to comply with covenants in, and potential for default under, our debt instruments; and
|
|
•
|
failure to refinance any of our debt. See Item 7. “Management’s Discussion and Analysis of Financial Condition and Results of Operations — Liquidity and Capital Resources.”
|
If our cash flows and capital resources are insufficient to fund our debt service obligations, we may be forced to sell assets, seek additional capital or seek to restructure or refinance our indebtedness. These alternative measures may not be successful and may not permit us to meet our scheduled debt service obligations. We may be unable to consummate those asset sales to raise capital or sell assets at prices that we believe are fair and proceeds that we do receive may be inadequate to meet any debt service obligations then due.
We may still be able to incur substantially more debt. This could further exacerbate the risks that we face
.
We may be able to incur substantial additional indebtedness in the future. The terms of our debt instruments do not fully prohibit us from doing so. Our senior secured revolving credit facility provides commitments of up to $450.0 million, approximately
$168.1 million
of which would have been available for future borrowings (after giving effect to letters of credit and bank guarantees outstanding) as of
December 31, 2017
. See Item 7. “Management’s Discussion and Analysis of Financial Condition and Results of Operations — Liquidity and Capital Resources — Debt Instruments and Related Covenants.” We may also further increase the size of our senior secured revolving credit facility which includes an expansion option permitting us to add up to an aggregate of $225.0 million in additional borrowings, subject to certain conditions, or we could refinance with higher borrowing limits. If new debt is added to our current debt levels, the related risks that we now face could intensify.
18
The senior secured revolving credit facility contains a number of restrictive covenants which limit our ability to finance future operations or capital needs or engage in other business activities that may be in our interest.
The senior secured revolving credit facility imposes, and the terms of any future indebtedness may impose, operating and other restrictions on us and our subsidiaries. Such restrictions affect or will affect, and in various circumstances limit or prohibit, among other things, our ability and the ability of our subsidiaries to:
|
•
|
incur additional indebtedness;
|
|
•
|
create liens;
|
|
•
|
pay dividends based on our leverage ratio and make other distributions in respect of our capital stock;
|
|
•
|
redeem or buy back our capital stock based on our leverage ratio;
|
|
•
|
make certain investments or certain other restricted payments;
|
|
•
|
sell or transfer certain kinds of assets;
|
|
•
|
enter into certain types of transactions with affiliates; and
|
|
•
|
effect mergers or consolidations.
|
The senior secured revolving credit facility also requires us to achieve certain financial and operating results and maintain compliance with specified financial ratios. Our ability to comply with these ratios may be affected by events beyond our control.
The restrictions contained in the senior secured revolving credit facility could:
|
•
|
limit our ability to plan for or react to market or economic conditions or meet capital needs or otherwise restrict our activities or business plans; and
|
|
•
|
adversely affect our ability to finance our operations, acquisitions, investments or strategic alliances or other capital needs or to engage in other business activities that would be in our interest.
|
A breach of any of these covenants or our inability to comply with the required financial ratios could result in a default under our senior secured revolving credit facility. If an event of default occurs under our senior secured revolving credit facility, which includes an event of default under the indenture governing our 2.00% Convertible Senior Subordinated Notes due August 2018 and an event of default under the indenture governing our 1.00% Convertible Senior Subordinated Notes due November 2024, the lenders could elect to:
|
•
|
declare all borrowings outstanding, together with accrued and unpaid interest, to be immediately due and payable; or
|
|
•
|
require us to apply all of our available cash to repay the borrowings,
|
either of which could result in an event of default under our convertible notes or prevent us from making payments on the convertible notes when due in 2018 or 2024, as the case may be. The lenders will also have the right in these circumstances to terminate any commitments they have to provide further financing.
If we were unable to repay or otherwise refinance these borrowings when due, our lenders could sell the collateral securing the senior secured revolving credit facility, which constitutes substantially all of our and our domestic wholly-owned subsidiaries’ assets.
Our 2.00% Convertible Senior Subordinated Notes due August 2018 and our 1.00% Convertible Senior Subordinated Notes due November 2024 have certain fundamental change and conditional conversion features which, if triggered, may adversely affect our financial condition.
If a fundamental change occurs under our 2.00% Convertible Senior Subordinated Notes due August 2018 or our 1.00% Convertible Senior Subordinated Notes due November 2024, the holders of the convertible notes may require us to purchase for cash any or all of the convertible notes. However, there can be no assurance that we will have sufficient funds at the time of the fundamental change to purchase all of the convertible notes delivered for purchase, and we may not be able to arrange necessary financing on acceptable terms, if at all. Likewise, if one of the conversion contingencies of our convertible notes is triggered, holders of convertible notes will be entitled to convert the convertible notes at any time during specified periods. For example, as a result of attaining specified market price triggers, the 2.00% Convertible Senior Subordinated Notes due August 2018 were convertible during several quarters in 2013, although no notes have been converted to date. If one or more holders elects to convert their convertible notes during such future specified periods, we would be required to settle any converted principal through the payment of cash, which could adversely affect our liquidity.
19
We are subject to counterparty risk with respect to the convertible note hedge and capped call transactions associated with our 2.00% Convertible Senior Subordinated Notes due August 2018 and our 1.00% Convertible Senior Subordinated Notes due November 2024.
The option counterparties for our convertible note hedging arrangements are financial institutions, and we will be subject to the risk that any or all of them might default under the convertible note hedge and capped call transactions. Our exposure to the credit risk of the option counterparties is not secured by any collateral. Global economic conditions during the 2008-2009 economic downturn resulted in the actual or perceived failure or financial difficulties of many financial institutions. If an option counterparty becomes subject to insolvency proceedings, we will become an unsecured creditor in those proceedings with a claim equal to our exposure at that time under the convertible note hedge and capped call transactions with that option counterparty. Our exposure will depend on many factors but, generally, the increase in our exposure will be correlated to the increase in the market price and in the volatility of our common stock. In addition, upon a default by an option counterparty, we may suffer adverse tax consequences and more dilution than we currently anticipate with respect to our common stock. We can provide no assurances as to the financial stability or viability of the option counterparties.
Risks Related to the Trading Market for Our Common Stock
Our common stock has experienced, and may continue to experience, price volatility.
Our common stock has at times experienced substantial price volatility as a result of many factors, including the general volatility of stock market prices and volumes, changes in securities analysts’ estimates of our financial performance, variations between our actual and anticipated financial results, fluctuations in order or backlog levels, fluctuations in energy prices, or uncertainty about current global economic conditions. For these reasons, among others, the price of our stock may continue to fluctuate.
Provisions in our amended and restated certificate of incorporation and amended and restated bylaws and other agreements and in Delaware law may discourage a takeover attempt.
Provisions contained in our amended and restated certificate of incorporation and amended and restated bylaws and Delaware law could make it more difficult for a third party to acquire us. Provisions of our amended and restated certificate of incorporation and amended and restated bylaws and Delaware law impose various procedural and other requirements, which could make it more difficult for stockholders to effect certain corporate actions. For example, our amended and restated certificate of incorporation authorizes our board of directors to determine the rights, preferences, privileges and restrictions of unissued series of preferred stock, without any vote or action by our stockholders. Therefore, our board of directors can authorize and issue shares of preferred stock with voting or conversion rights that could adversely affect the voting or other rights of holders of our common stock. These rights may have the effect of delaying or deterring a change of control of our company. These provisions could limit the price that certain investors might be willing to pay in the future for shares of our common stock.
In addition, the terms of our 2.00% Convertible Senior Subordinated Notes due August 2018 and our 1.00% Convertible Senior Subordinated Notes due November 2024 may require us to purchase these convertible notes for cash in the event of a takeover of our Company. The indentures governing the convertible notes also prohibit us from engaging in certain mergers or acquisitions unless, among other things, the surviving entity assumes our obligations under the convertible notes. These and other provisions applicable to the convertible notes may have the effect of increasing the cost of acquiring us or otherwise discourage a third party from acquiring us.
The issuance of common stock upon conversion of our 2.00% Convertible Senior Subordinated Notes due August 2018 and our 1.00% Convertible Senior Subordinated Notes due November 2024 could cause dilution to the interests of our existing stockholders.
As of
December 31, 2017
, we had $57.1 million and $258.8 million aggregate principal amount of our 2.00% Convertible Senior Subordinated Notes due August 2018 and our 1.00% Convertible Senior Subordinated Notes due November 2024, respectively. Prior to the close of business on the business day immediately preceding May 1, 2018 (with respect to the 2.00% convertible notes), and prior to the close of business on the business day immediately preceding August 15, 2024 (with respect to the 1.00% convertible notes), the convertible notes will be convertible only upon satisfaction of certain conditions. As a result of attaining specified market price triggers, the 2.00% convertible notes were convertible during several quarters in 2013, although no notes have been converted to date. Holders may convert their 2.00% convertible notes at their option at any time after May 1, 2018 until the close of business on the second scheduled trading day immediately prior to August 1, 2018, and holders may convert their 1.00% convertible notes at their option at any time after August 15, 2024 until the close of business on the second scheduled trading day immediately preceding November 15, 2024. We will settle conversions of 2.00% convertible notes by paying cash up to the aggregate principal amount of the convertible notes to be converted and paying or delivering, as the case may be, cash, shares of our common stock, or a combination of cash and shares of our common stock, at our election, in respect of the remainder,
20
if any, of our conversion obligation in excess of the aggregate principal amount of the notes being converted. We currently intend to settle conversions of 1.00% convertible notes through a combination of the payment of cash and issuance of shares, with payments of cash up to the aggregate principal amount of the convertible notes to be converted and delivering shares of our common stock in respect of the remainder, if any, of our conversion obligation in excess of the aggregate principal amount of the notes being converted. The number of shares issued could be significant and such an issuance could cause significant dilution to the interests of the existing stockholders.
21
|
Item 1B.
|
Unresolved Staff Comments
|
Not applicable.
|
Item 2.
|
Properties
|
We occupy
49
facilities totaling approximately
4.9 million
square feet, including the locations listed below, with the majority devoted to manufacturing, assembly, and storage. Of these facilities, approximately
3.9 million
square feet are owned and
1.0 million
square feet are occupied under operating leases. One of our owned facilities, a
0.1 million
square foot facility in Clarksville, Arkansas, is leased to a third party. We currently lease approximately
20 thousand
square feet for our corporate office in Ball Ground, Georgia. Our major owned facilities in the United States are subject to mortgages securing our senior secured revolving credit facility.
The following table summarizes information about our principal plants and other materially important physical properties as of January 31, 2018:
|
Location
|
Segment
|
Ownership
|
Use
|
|||
|
Ball Ground, Georgia
|
Corporate
|
Leased
|
Office
|
|||
|
Luxembourg, Luxembourg
|
Corporate
|
Leased
|
Office
|
|||
|
Chengdu, China
|
BioMedical
|
Owned
|
Manufacturing/Office
|
|||
|
Wuppertal, Germany
|
BioMedical
|
Leased
|
Office/Warehouse/Service
|
|||
|
Ball Ground, Georgia
|
BioMedical/Distribution & Storage
|
Leased/Owned
|
Manufacturing/Warehouse/Office/Service
|
|||
|
Decin, Czech Republic
|
Distribution & Storage
|
Owned
|
Manufacturing/Office
|
|||
|
Goch, Germany
|
Distribution & Storage
|
Owned
|
Manufacturing/Office
|
|||
|
Kuala Lumpur, Malaysia
|
Distribution & Storage
|
Leased
|
Marketing & Sales/Office
|
|||
|
New Prague, Minnesota
|
Distribution & Storage
|
Leased/Owned
|
Manufacturing/Office/Service
|
|||
|
Owatonna, Minnesota
|
Distribution & Storage
|
Leased
|
Manufacturing/Office
|
|||
|
Solingen, Germany
|
Distribution & Storage
|
Leased
|
Manufacturing/Warehouse/Office/Service
|
|||
|
Changzhou, China
|
Distribution & Storage/Energy & Chemicals
|
Leased/Owned
|
Manufacturing/Office
|
|||
|
Houston, Texas
|
Distribution & Storage/Energy & Chemicals
|
Leased/Owned
|
Manufacturing/Office/Service
|
|||
|
Beasley, Texas
|
Energy & Chemicals
|
Owned
|
Manufacturing/Office
|
|||
|
Franklin, Indiana
|
Energy & Chemicals
|
Leased
|
Manufacturing/Office/Service
|
|||
|
La Crosse, Wisconsin
|
Energy & Chemicals
|
Leased/Owned
|
Manufacturing/Office
|
|||
|
New Iberia, Louisiana
|
Energy & Chemicals
|
Leased
|
Manufacturing
|
|||
|
Pobia, Italy
|
Energy & Chemicals
|
Leased
|
Manufacturing/Office
|
|||
|
The Woodlands, Texas
|
Energy & Chemicals
|
Leased
|
Office
|
|||
|
Tulsa, Oklahoma
|
Energy & Chemicals
|
Leased/Owned
|
Manufacturing/Office
|
|||
Regulatory Environment
We are subject to federal, state, and local regulations relating to the discharge of materials into the environment, production and handling of hazardous and regulated materials, and the conduct and condition of our production facilities. We do not believe that these regulatory requirements have had a material effect upon our capital expenditures, earnings, or competitive position. We are not anticipating any material capital expenditures in
2018
that are directly related to regulatory compliance matters. We are also not aware of any pending or potential regulatory changes that would have a material adverse impact on our business.
22
|
Item 3.
|
Legal Proceedings
|
Chart Cryogenic Engineering Systems (Changzhou) Company Limited (“CCESC”) and Chart Cryogenic Distribution Equipment (Changzhou) Company Limited (“CCDEC”) were involved in litigation with an external sales representative in China who claimed we owed commissions of approximately
64.8 million
Chinese yuan (equivalent to
$9.9 million
) plus interest. In prior years, we accrued
30.0 million
Chinese yuan (equivalent to
$4.6 million
) as our best estimate of the related contingent liability. Based on a China court ruling received during February 2018, the claimant was awarded a reduced amount of
53.9 million
Chinese yuan (equivalent to
$8.3 million
), which included accrued interest (the “Award Amount”). As a result of this ruling, we accrued an additional
23.9 million
Chinese yuan (equivalent to
$3.7 million
) in commissions and interest in the fourth quarter of 2017. The Award Amount was recorded in other current liabilities in our consolidated balance sheet at December 31, 2017. Management is currently evaluating alternatives under the arbitration award.
We are occasionally subject to various legal claims related to performance under contracts, product liability, environmental liability, taxes, employment, intellectual property, and other matters, several of which claims assert substantial damages in the ordinary course of our business. Based on our historical experience in litigating these claims, as well as our current assessment of the underlying merits of the claims and applicable insurance, if any, we believe the resolution of these legal claims will not have a material adverse effect on our financial position, liquidity, cash flows or results of operations. Future developments may, however, result in resolution of these legal claims in a way that could have a material adverse effect. See Item 1A. “Risk Factors.”
Item 4.
Mine Safety Disclosures
Not applicable.
|
Item 4A.
|
Executive Officers of the Registrant*
|
The name, age and positions of each Executive Officer of the Company as of February 15,
2018
are as follows:
|
Name
|
Age
|
Position
|
||
|
Samuel F. Thomas
(1)
|
66
|
Executive Chairman of the Board
|
||
|
William C. (Bill) Johnson
|
54
|
Chief Executive Officer and President
|
||
|
Jillian C. (Jill) Evanko
|
40
|
Vice President, Chief Financial Officer, Chief Accounting Officer and Treasurer
|
||
|
DeWayne R. Youngberg
|
55
|
Vice President, General Counsel and Secretary
|
||
|
Gerald F. (Gerry) Vinci
|
52
|
Vice President, Chief Human Resources Officer
|
||
* Included pursuant to Instruction 3 to Item 401(b) of Regulation S-K.
_______________
|
(1)
|
Mr. Thomas will retire from his position as Executive Chairman effective as of our May 25, 2018 Annual Meeting of Stockholders.
|
Samuel F. Thomas
was appointed our Executive Chairman of the Board and has served in this role since May 25, 2017. Previously Mr. Thomas served as Chairman of our Board of Directors since March 2007 and served as our Chief Executive Officer and President and as a member of our Board of Directors since October 2003. Prior to joining our Company, Mr. Thomas was Executive Vice President of Global Consumables at ESAB Holdings Ltd., a provider of welding consumables and equipment. In addition to his most recent position at ESAB, Mr. Thomas was responsible for ESAB North America during his employment at ESAB Holdings Ltd. Prior to joining ESAB in February 1999, Mr. Thomas was Vice President of Friction Products for Federal Mogul, Inc. Prior to its acquisition by Federal Mogul in 1998, Mr. Thomas was employed by T&N plc from 1976 to 1998, where he served from 1991 as chief executive of several global operating divisions, including industrial sealing, camshafts and friction products. Mr. Thomas also serves on the board of Lumentum Holdings Inc.
William C. (Bill) Johnson
was appointed Chief Executive Officer and President effective on May 25, 2017. Prior to this, he served as our President and Chief Operating Officer since July 2016. Prior to joining our Company, Mr. Johnson served as President and Chief Executive Officer at Dover Refrigeration & Food Equipment, Inc., a subsidiary of Dover Corporation, a diversified global manufacturer. Mr. Johnson held multiple executive positions at Dover and its manufacturing companies, which he joined in August 2006 as Executive Vice President at Hill Phoenix, Inc. Prior to his tenure with Dover, Mr. Johnson served as President and Chief Executive Officer of Graham Corporation.
Jillian C. (Jill) Evanko
was appointed Chief Financial Officer on March 1, 2017 and Chief Accounting Officer on September 8, 2017. Ms. Evanko joined Chart on February 13, 2017 as Vice President of Finance. Prior to joining Chart,
23
Ms. Evanko served as the Vice President and Chief Financial Officer of Truck-Lite Co., LLC, a manufacturer of lighting and specialty products for the truck and commercial vehicle industries, since October 2016, prior to which she held multiple executive positions at Dover Corporation, a diversified global manufacturer, and its subsidiaries, including the role of Vice President and Chief Financial Officer of Dover Fluids since January 2014. Prior to joining Dover in 2004, Ms. Evanko worked in valuation services at Arthur Andersen, LLP and also held audit and accounting roles for Honeywell and Sony Corporation of America.
DeWayne R. Youngberg
was appointed Vice President, General Counsel and Secretary on October 26, 2017. Mr. Youngberg served as the General Counsel & Chief Compliance Officer of Hudson Products Holdings, Inc. from April 2012 until October 2017. Hudson Products, a designer and manufacturer of air cooled heat exchangers and axial flow fans, was acquired by our Company in September 2017. Prior to joining Hudson Products, Mr. Youngberg served as general counsel for several public and private companies as well as working in corporate development roles with Motorola, Inc. and Freescale Semiconductor, Inc. Mr. Youngberg began his career as an associate attorney with Willkie Farr & Gallagher LLP in New York and subsequently with Kirkland & Ellis LLP in Chicago.
Gerald F. (Gerry) Vinci
was appointed our Vice President and Chief Human Resources Officer and has served in that capacity since December 5, 2016, when he joined Chart. Mr. Vinci was designated an executive officer of Chart on August 23, 2017. Prior to joining Chart, Mr. Vinci held various executive Human Resources roles at Dover Corporation, a diversified global manufacturer, from February 2013 to November 2016, including Vice President, Human Resources for Dover Engineered Systems and Dover Refrigeration and Food Equipment Segments. From 1997 to 2013, Mr. Vinci served in numerous Human Resources executive roles and as Senior Counsel for Harsco Corporation. Prior to that, Mr. Vinci was an attorney for Sunoco, Inc.
24
|
Item 5.
|
Market for Registrant’s Common Equity, Related Stockholder Matters and Issuer Purchases of Equity Securities
|
Chart’s common stock is traded on the NASDAQ Global Select Market under the symbol “GTLS.” The high and low sales prices for the shares of common stock for the periods indicated are set forth in the table below:
|
|
High and Low Sales Price
|
||||||||||||||
|
|
2017
|
2016
|
|||||||||||||
|
|
High
|
Low
|
High
|
Low
|
|||||||||||
|
First quarter
|
$
|
40.87
|
|
$
|
32.08
|
|
$
|
22.05
|
|
$
|
13.27
|
|
|||
|
Second quarter
|
37.98
|
|
32.04
|
|
28.24
|
|
20.86
|
|
|||||||
|
Third quarter
|
39.48
|
|
32.54
|
|
33.06
|
|
22.74
|
|
|||||||
|
Fourth quarter
|
48.78
|
|
37.31
|
|
40.74
|
|
27.01
|
|
|||||||
|
Year
|
48.78
|
|
32.04
|
|
40.74
|
|
13.27
|
|
|||||||
As of February 1,
2018
, there were
168
holders of record of our common stock. Since many holders hold shares in “street name,” we believe that there are a significantly larger number of beneficial owners of our common stock than the number of record holders.
We do not currently intend to pay any cash dividends on our common stock, and instead intend to retain earnings, if any, for future operations, potential acquisitions and debt reduction. The amounts available to us to pay future cash dividends may be restricted by our senior secured revolving credit facility to the extent our pro forma leverage ratio exceeds certain targets. Any decision to declare and pay dividends in the future will be made at the discretion of our board of directors and will depend on, among other things, our results of operations, financial condition, cash requirements, contractual restrictions and other factors that our board of directors may deem relevant.
25
Cumulative Total Return Comparison
Set forth below is a line graph comparing the cumulative total return of a hypothetical investment in the shares of common stock of Chart with the cumulative return of a hypothetical investment in each of the S&P SmallCap 600 Index and our Peer Group Index based on the respective market prices of each such investment on the dates shown below, assuming an initial investment of $100 on
December 31, 2012
, including reinvestment of dividends, if any.
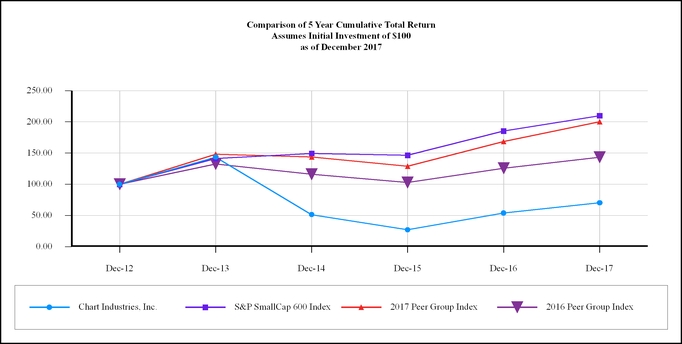
|
December 31,
|
|||||||||||||||||||||||
|
2012
|
2013
|
2014
|
2015
|
2016
|
2017
|
||||||||||||||||||
|
Chart Industries, Inc.
|
$
|
100.00
|
|
$
|
143.41
|
|
$
|
51.28
|
|
$
|
26.93
|
|
$
|
54.01
|
|
$
|
70.27
|
|
|||||
|
S&P SmallCap 600 Index
|
100.00
|
|
141.31
|
|
149.45
|
|
146.50
|
|
185.40
|
|
209.94
|
|
|||||||||||
|
2017 Peer Group Index
|
100.00
|
|
148.16
|
|
143.73
|
|
128.89
|
|
168.37
|
|
200.23
|
|
|||||||||||
|
2016 Peer Group Index
|
100.00
|
|
132.42
|
|
116.06
|
|
102.85
|
|
125.72
|
|
143.35
|
|
|||||||||||
We select the peer companies that comprise the Peer Group Index solely on the basis of objective criteria. These criteria result in an index composed of oil field equipment/service and other comparable industrial companies. The 2017 Peer Group Index was comprised of Acuity Brands, Inc., Barnes Group Inc., Circor International, Inc., Colfax Corp., Enpro Industries Inc., Esco Technologies Inc., Graco Inc., Harsco Corporation, Idex Corp., Nordson Corporation, SPX Corporation and Worthington Industries, Inc. The 2017 Peer Group Index was updated to include Harsco Corporation and SPX Corporation, which have similar industrial manufacturing profiles and serve industries closer in similarity than the two companies removed from the index.
The 2016 Peer Group Index was comprised of Acuity Brands, Inc., Barnes Group Inc., Circor International, Inc., Colfax Corp., Enpro Industries Inc., Ensco plc, Esco Technologies Inc., Graco Inc., Idex Corp., Nordson Corporation, Powell Industries Inc. and Worthington Industries, Inc. In accordance with SEC rules, the both the 2016 Peer Group and 2017 Peer Group are represented in the graph above.
26
Purchases of Equity Securities by the Issuer and Affiliated Purchasers
During the fourth quarter of
2017
,
373
shares of common stock were surrendered to us by participants under our share-based compensation plans to satisfy tax withholding obligations relating to the vesting or payment of equity awards for an aggregate purchase price of approximately
$15,900
. The total number of shares repurchased represents the net shares issued to satisfy tax withholdings. All such repurchased shares were subsequently retired during the three months ended
December 31, 2017
.
|
Issuer Purchases of Equity Securities
|
||||||||||||||
|
Period
|
Total Number of Shares Purchased
|
Average Price Paid Per Share
|
Total Number of Shares Purchased As Part of Publicly Announced Plans or Programs
|
Approximate Dollar Value of Shares that May Yet Be Purchased Under the Plans or Programs
|
||||||||||
|
October 1 — 31, 2017
|
373
|
|
$
|
42.72
|
|
—
|
|
$
|
—
|
|
||||
|
November 1 — 30, 2017
|
—
|
|
—
|
|
—
|
|
—
|
|
||||||
|
December 1 — 31, 2017
|
—
|
|
—
|
|
—
|
|
—
|
|
||||||
|
Total
|
373
|
|
$
|
42.72
|
|
—
|
|
$
|
—
|
|
||||
27
|
Item 6.
|
Selected Financial Data
|
The following table sets forth selected historical consolidated financial information as of the dates and for each of the periods indicated. We selected historical financial consolidated data as of and for the years ended December 31,
2017, 2016 and 2015
derived from our audited financial statements for such periods incorporated by reference into Item 8 of this Annual Report on Form 10-K, which have been audited by Ernst & Young LLP. We selected historical financial consolidated data as of and for the years ended
December 31, 2014
and
2013
derived from our audited financial statements for such periods, which have been audited by Ernst & Young LLP and which are not included in this Annual Report on Form 10-K.
You should read the following table together with Item 7. “Management’s Discussion and Analysis of Financial Condition and Results of Operations” and our consolidated financial statements and related notes included elsewhere in this Annual Report on Form 10-K (all dollar amounts, except per share data, in millions):
|
|
Year Ended December 31,
|
||||||||||||||||||
|
|
2017
|
2016
|
2015
|
2014
|
2013
|
||||||||||||||
|
Statements of Operations Data:
|
|||||||||||||||||||
|
Sales
|
$
|
988.8
|
|
$
|
859.2
|
|
$
|
1,040.2
|
|
$
|
1,193.0
|
|
$
|
1,177.4
|
|
||||
|
Cost of sales
(1) (2)
|
716.7
|
|
592.8
|
|
751.7
|
|
835.1
|
|
825.7
|
|
|||||||||
|
Gross profit
|
272.1
|
|
266.4
|
|
288.5
|
|
357.9
|
|
351.7
|
|
|||||||||
|
Operating expenses
(1) (3)
|
230.1
|
|
207.8
|
|
218.1
|
|
219.7
|
|
215.7
|
|
|||||||||
|
Asset impairments
(4)
|
—
|
|
1.2
|
|
253.6
|
|
—
|
|
—
|
|
|||||||||
|
Operating income (loss)
(5) (6)
|
42.0
|
|
57.4
|
|
(183.2
|
)
|
138.2
|
|
136.0
|
|
|||||||||
|
Interest expense, net (including deferred financing costs amortization)
|
20.7
|
|
18.6
|
|
17.3
|
|
18.0
|
|
17.6
|
|
|||||||||
|
Loss on extinguishment of debt
(7)
|
4.9
|
|
—
|
|
—
|
|
—
|
|
—
|
|
|||||||||
|
Foreign currency loss (gain)
|
2.8
|
|
0.4
|
|
1.3
|
|
1.0
|
|
(0.2
|
)
|
|||||||||
|
Other expense, net
|
28.4
|
|
19.0
|
|
18.6
|
|
19.0
|
|
17.3
|
|
|||||||||
|
Income (loss) before income taxes
|
13.6
|
|
38.4
|
|
(201.8
|
)
|
119.2
|
|
118.7
|
|
|||||||||
|
Income tax (benefit) expense, net
(8)
|
(15.9
|
)
|
13.7
|
|
2.7
|
|
36.1
|
|
31.3
|
|
|||||||||
|
Net income (loss)
|
29.5
|
|
24.7
|
|
(204.5
|
)
|
83.1
|
|
87.4
|
|
|||||||||
|
Less: Income (loss) attributable to noncontrolling interests, net of taxes
|
1.5
|
|
(3.5
|
)
|
(1.5
|
)
|
1.2
|
|
4.2
|
|
|||||||||
|
Net income (loss) attributable to Chart Industries, Inc.
|
$
|
28.0
|
|
$
|
28.2
|
|
$
|
(203.0
|
)
|
$
|
81.9
|
|
$
|
83.2
|
|
||||
|
Earnings Per Share Data:
|
|||||||||||||||||||
|
Basic earnings (loss) per share
|
$
|
0.91
|
|
$
|
0.92
|
|
$
|
(6.66
|
)
|
$
|
2.69
|
|
$
|
2.75
|
|
||||
|
Diluted earnings (loss) per share
(9)
|
$
|
0.89
|
|
$
|
0.91
|
|
$
|
(6.66
|
)
|
$
|
2.67
|
|
$
|
2.60
|
|
||||
|
Weighted-average shares — basic
|
30.74
|
|
30.58
|
|
30.49
|
|
30.38
|
|
30.21
|
|
|||||||||
|
Weighted-average shares — diluted
|
31.34
|
|
30.99
|
|
30.49
|
|
30.67
|
|
31.93
|
|
|||||||||
|
Cash Flow Data:
|
|||||||||||||||||||
|
Cash provided by operating activities
|
$
|
47.0
|
|
$
|
170.8
|
|
$
|
101.0
|
|
$
|
118.6
|
|
$
|
59.5
|
|
||||
|
Cash used in investing activities
|
(480.0
|
)
|
(18.1
|
)
|
(73.5
|
)
|
(72.5
|
)
|
(75.0
|
)
|
|||||||||
|
Cash provided by (used in) financing activities
|
275.2
|
|
7.7
|
|
0.4
|
|
(70.7
|
)
|
8.3
|
|
|||||||||
|
Other Financial Data:
|
|||||||||||||||||||
|
Depreciation and amortization
(10)
|
$
|
43.2
|
|
$
|
38.8
|
|
$
|
46.7
|
|
$
|
44.6
|
|
$
|
41.7
|
|
||||
28
|
As of December 31,
|
|||||||||||||||||||
|
2017
|
2016
|
2015
|
2014
|
2013
|
|||||||||||||||
|
Balance Sheet Data:
|
|||||||||||||||||||
|
Cash and cash equivalents
|
$
|
122.6
|
|
$
|
282.0
|
|
$
|
123.7
|
|
$
|
103.7
|
|
$
|
137.3
|
|
||||
|
Working capital
(11)
|
182.7
|
|
116.0
|
|
207.6
|
|
218.1
|
|
213.3
|
|
|||||||||
|
Goodwill
(12)
|
468.8
|
|
218.0
|
|
218.4
|
|
405.5
|
|
398.9
|
|
|||||||||
|
Identifiable intangible assets, net
(12)
|
302.5
|
|
93.4
|
|
106.7
|
|
153.7
|
|
172.1
|
|
|||||||||
|
Total assets
(12)
|
1,724.7
|
|
1,233.0
|
|
1,200.1
|
|
1,459.5
|
|
1,457.4
|
|
|||||||||
|
Long-term debt
(13)
|
439.2
|
|
233.7
|
|
213.8
|
|
201.6
|
|
60.5
|
|
|||||||||
|
Total debt
(13)
|
498.1
|
|
240.2
|
|
220.0
|
|
206.5
|
|
260.9
|
|
|||||||||
|
Chart Industries, Inc. shareholders’ equity
|
802.2
|
|
697.2
|
|
670.6
|
|
879.9
|
|
754.8
|
|
|||||||||
_______________
|
(1)
|
During the third quarter of 2016, we recovered for breaches of representations and warranties primarily related to warranty costs for certain product lines acquired in the 2012 acquisition of AirSep under the related representation and warranty insurance. For the year ended December 31, 2016, this reduced cost of sales by
$15.2 million
and reduced SG&A expenses by $0.3 million, net of associated legal fees recorded in 2016.
|
|
(2)
|
Cost of sales includes restructuring costs of
$5.2 million
,
$4.4 million
and
$3.6 million
for the years ended December 31, 2017, 2016 and 2015, respectively.
|
|
(3)
|
Operating expenses include selling, general and administrative expenses and amortization expense. Amortization expense related to intangible assets for the years ended
December 31, 2017
,
2016
,
2015
,
2014
and
2013
was
$15.0 million
,
$11.9 million
,
$17.3 million
,
$17.9 million
, and
$19.2 million
, respectively.
|
|
(4)
|
Includes asset impairment charges of
$1.2 million
and
$255.1 million
for the years ended December 31, 2016 and 2015, respectively. For further information, see Note 3, Asset Impairments, in the consolidated financial statements located elsewhere in this report.
|
|
(5)
|
Operating income (loss) includes restructuring costs of
$15.6 million
,
$10.9 million
and
$12.2 million
for the
December 31, 2017
,
2016
and
2015
, respectively.
|
|
(6)
|
Includes acquisition-related expenses of
$10.1 million
,
$0.4 million
,
$0.7 million
,
$1.2 million
, and
$0.6 million
for the years ended
December 31, 2017
,
2016
,
2015
,
2014
and
2013
, respectively.
|
|
(7)
|
During the fourth quarter of 2017, we recorded a $4.9 million loss on extinguishment of debt associated with the repurchase of $192.9 million principal amount of our $250.0 million 2.00% convertible notes due August 2018 and refinance of our senior secured revolving credit facility.
|
|
(8)
|
Includes a one-time
$22.5 million
net favorable tax benefit that was recorded during the fourth quarter of 2017, which resulted from the enactment of the Tax Cuts and Jobs Act. This benefit mainly consisted of a one-time, provisional benefit of
$26.9 million
related to the remeasurement of certain of our deferred tax liabilities using the lower U.S. federal corporate tax rate of 21%. This was partially offset by (i) a one-time, provisional charge of $8.7 million related to the deemed repatriation transition tax, which is a tax on previously untaxed accumulated earnings and profits of certain of our foreign subsidiaries, and (ii) a one-time tax expense and tax benefit of $4.5 million and $8.7 million, respectively, related to our intent to amend pre-acquisition Hudson U.S. federal tax returns.
|
|
(9)
|
Zero incremental shares from share-based awards are included in the computation of diluted net loss per share for periods in which a net loss occurs, because to do so would be anti-dilutive.
|
|
(10)
|
Includes financing costs amortization for the years ended
December 31, 2017
,
2016
,
2015
,
2014
and
2013
of
$1.3 million
,
$1.3 million
,
$1.3 million
,
$1.4 million
, and
$1.3 million
, respectively.
|
|
(11)
|
Working capital is defined as current assets excluding cash and cash equivalents minus current liabilities excluding short-term debt and current portion of long-term debt (including current convertible notes, if applicable).
|
|
(12)
|
Total assets at
December 31, 2017
includes
$572.8 million
related to Hudson of which
$238.3 million
and
$207.7 million
represented acquired goodwill and identifiable intangible assets, net, respectively. For further information, see Note 10, Business Combinations, in the consolidated financial statements located elsewhere in this report.
|
|
(13)
|
Total debt at
December 31, 2017
includes convertible notes, net of unamortized discounts and debt issuance costs of
$251.2 million
,
$239.0 million
outstanding borrowings on our senior secured revolving credit facility and
$7.9 million
in borrowings on our foreign facilities. Long-term debt represents total debt less current maturities. At
December 31, 2017
current maturities were
$58.9 million
, which includes
$55.1 million
of Convertible notes due August 2018, net of unamortized discount and debt issuance costs.
|
29
|
Item 7.
|
Management’s Discussion and Analysis of Financial Condition and Results of Operations
|
You should read the following discussion of our results of operations and financial condition in conjunction with the “Selected Financial Data” section and our consolidated financial statements and related notes appearing elsewhere in this Annual Report on Form 10-K. This discussion contains forward-looking statements. Actual results may differ materially from those discussed below. See “Forward-Looking Statements” at the end of this discussion and Item 1A. “Risk Factors” for a discussion of the uncertainties, risks and assumptions associated with this discussion.
Overview
We are a leading diversified global manufacturer of highly engineered equipment for the industrial gas, energy, and biomedical industries. Our equipment and engineered systems are primarily used for low-temperature and cryogenic applications utilizing our expertise in cryogenic systems and equipment which operate at low temperatures sometimes approaching absolute zero (0 Kelvin; -273° Centigrade; -459° Fahrenheit).
2017
Highlights
Sales in
2017
were
$988.8 million
, which represents an increase of
15%
from 2016, including 5% organic growth, and operating income of
$42.0 million
in
2017
, inclusive of acquisitions made during the year. The RCHPH Holdings, Inc. (“Hudson”) acquisition, which was completed on September 20, 2017, contributed
$58.0 million
in sales,
$15.4 million
of gross profit, and
$6.4 million
of operating income to Chart for our period of ownership in 2017. Net income for 2017 was
$28.0 million
, compared to
$28.2 million
for 2016. Net income for 2017 was favorably impacted by a net tax benefit of
$22.5 million
related to the Tax Cuts and Jobs Act and negatively impacted by a loss on early extinguishment of debt of
$4.9 million
, acquisition-related costs of $10.1 million and restructuring costs of
$15.6 million
. Net income for 2016 was favorably impacted by several short lead-time orders, which contributed approximately $38.7 million of gross profit and improved the gross margin by 25.1 percentage points, and an insurance settlement of $15.5 million, partially offset by the negative impact of restructuring costs of
$10.9 million
, impairments of goodwill and intangible assets of
$1.2 million
, and acquisition-related costs of
$0.4 million
.
Market and order activity increased year-over-year, with
$1,004.5 million
in orders received in 2017, inclusive of
$31.3 million
of orders from Hudson, which was an
18%
increase over 2016, or a 14% increase excluding Hudson. E&C orders of
$243.6 million
, or
$212.3 million
excluding orders from Hudson, were an increase over 2016 by
121%
in total, or 94% excluding Hudson. The main drivers of the increase in E&C order activity were the growth in Lifecycle, the Hudson acquisition and increases in U.S. shale and associated gas, which drove natural gas processing plant activity throughout 2017. Backlog increased to
$461.3 million
at December 31, 2017 (or
$395.5 million
, excluding Hudson) from
$342.6 million
at December 31, 2016.
We acquired Hudson for a purchase price of
$419.5 million
. Hudson’s results of operations are included in our E&C segment since that date. On August 31, 2017, we acquired VCT Vogel (“VCT”). The purchase price was
$4.2 million
, and VCT’s results are included in our D&S segment since that date. On January 13, 2017, we acquired Hetsco, Inc. for a purchase price of
$22.8 million
, and its results are included in the E&C segment since that date.
Outlook
Our 2018 full year outlook reflects continued tempered energy prices related to our core LNG E&C business, year-to-date order growth in our segments and the impact of 2017 acquisitions (Hetsco, Inc., Hudson, and VCT) as well as our acquisition of Skaff Cryogenics and Cryo-Lease, LLC in January 2018. We continue to anticipate that the forecasted global supply/demand LNG gas balance will be reached in 2022-2023, thereby driving LNG export facility orders in late 2018 / early 2019. A majority of upcoming projects for U.S. LNG export have transitioned from utilizing traditional single train base load plants to multi-train mid-scale projects, with a modular approach to achieve baseload capacities. This is important to us because multi-train mid-scale, such as the recently announced Driftwood LNG project, may use Chart’s patented IPSMR technology as well as our brazed aluminum heat exchanger and cold boxes as the main liquefaction heat exchanger technology.
We continue to invest in our automation, process improvement, and productivity activities across Chart, with anticipated capital expenditures for
2018
to be in the range of
$35.0
to
$45.0 million
. This is inclusive of the completion of the capacity expansion in our brazed aluminum heat exchanger La Crosse, Wisconsin facility that totals approximately $24.0 million in capital spend of which $11.0 million is included in our 2018 capital expenditures outlook.
Restructuring costs in 2017 were
$15.6 million
which primarily related to the completion of the Buffalo, New York respiratory facility consolidation, costs to relocate the corporate office from Garfield Heights, Ohio to Ball Ground, Georgia and consolidation of certain facilities in China and costs associated with the reduction in force in the third quarter of 2017. We expect the recent restructuring actions to result in improvements to our gross margins and selling, general and administrative expenses on an incremental volume basis, with a combined projected annualized run rate savings of $15 million beginning with the first full year of savings in 2018.
30
On December 22, 2017, the Tax Cuts and Jobs Act was signed into law. The Tax Cuts and Jobs Act, among other things, reduced the U.S. federal corporate tax rate from 35% to 21%, requires companies to pay a one-time transition tax on certain unrepatriated earnings of foreign subsidiaries, requires a current inclusion in U.S. federal taxable income of certain earnings of foreign corporations, and creates a new limitation on deductible interest expense. As a result of the Tax Cuts and Jobs Act, we expect the reduction in the U.S. federal corporate tax rate combined with our tax planning strategy will result in an effective annual tax rate of 27% to 29% in 2018. As we complete our analysis of the Tax Cuts and Jobs Act, further collect and analyze data, interpret any additional guidance issued by the U.S. Treasury Department, the IRS, and other standard-setting bodies, we may make adjustments to the actual tax rate. Those adjustments may materially impact our provision for income taxes in the period in which the adjustments are made.
Operating Results
The following table sets forth the percentage relationship that each line item in our consolidated statements of operations represents to sales for the years ended December 31,
2017, 2016 and 2015
(dollars in millions):
|
2017
|
2016
|
2015
|
||||||
|
Sales
|
100.0
|
%
|
100.0
|
%
|
100.0
|
%
|
||
|
Cost of sales
(1) (2)
|
72.5
|
|
69.0
|
|
72.3
|
|
||
|
Gross profit
|
27.5
|
|
31.0
|
|
27.7
|
|
||
|
Selling, general and administrative expenses
(1) (3)
|
21.8
|
|
22.8
|
|
19.3
|
|
||
|
Amortization expense
|
1.5
|
|
1.4
|
|
1.7
|
|
||
|
Asset impairments
(4)
|
—
|
|
0.1
|
|
24.4
|
|
||
|
Operating income (loss)
|
4.2
|
|
6.7
|
|
(17.6
|
)
|
||
|
Interest expense, net
(5) (6)
|
2.0
|
|
2.0
|
|
1.5
|
|
||
|
Loss on extinguishment of debt
(7)
|
0.5
|
|
—
|
|
—
|
|
||
|
Financing costs amortization
|
0.1
|
|
0.1
|
|
0.1
|
|
||
|
Foreign currency loss
|
0.3
|
|
—
|
|
0.1
|
|
||
|
Income tax (benefit) expense, net
(8)
|
(1.6
|
)
|
1.6
|
|
0.3
|
|
||
|
Net income (loss)
|
3.0
|
|
2.9
|
|
(19.7
|
)
|
||
|
Income (loss) attributable to noncontrolling interests, net of taxes
|
0.1
|
|
(0.4
|
)
|
(0.1
|
)
|
||
|
Net income (loss) attributable to Chart Industries, Inc.
|
2.8
|
|
3.3
|
|
(19.5
|
)
|
||
_______________
|
(1)
|
During the third quarter of 2016, we recovered for breaches of representations and warranties primarily related to warranty costs for certain product lines acquired in the 2012 acquisition of AirSep under the related representation and warranty insurance. For the year ended December 31, 2016, this reduced cost of sales by
$15.2 million
and reduced SG&A expenses by $0.3 million, net of associated legal fees recorded in 2016.
|
|
(2)
|
Cost of sales includes restructuring costs of
$5.2 million
,
$4.4 million
and
$3.6 million
for the years ended December 31, 2017, 2016 and 2015, respectively.
|
|
(3)
|
Selling, general and administrative expenses includes restructuring costs of
$10.4 million
,
$6.5 million
and
$8.6 million
for the years ended December 31, 2017, 2016 and 2015, respectively.
|
Includes acquisition-related expenses of
$10.1 million
for the
year ended December 31, 2017
.
Includes share-based compensation expense of
$11.1 million
,
$10.7 million
, and
$11.3 million
, representing
1.1%
,
1.2%
, and
1.1%
of sales, for the years ended December 31,
2017, 2016 and 2015
, respectively.
|
(4)
|
See Note 3, Asset Impairments, in the consolidated financial statements.
|
|
(5)
|
Includes
$11.8 million
,
$12.5 million
, and
$11.5 million
of non-cash interest accretion expense related to the carrying amount of the 2.00% Convertible Senior Subordinated Notes due August 2018 (the “2018 Notes”), representing
1.2%
,
1.5%
, and
1.1%
of sales, for the years ended December 31,
2017, 2016 and 2015
, respectively.
|
|
(6)
|
Includes
$1.1 million
of non-cash interest accretion expense related to the carrying amount of the 1.00% Convertible Senior Subordinated Notes due November 2024 (the “2024 Notes”), representing
0.1%
of sales for the year ended December 31,
2017
.
|
31
|
(7)
|
During the year ended December 31, 2017, we recorded a $4.9 million loss on extinguishment of debt associated with the repurchase of $192.9 million principal amount of our $250.0 million 2.00% convertible notes due August 2018 and refinance of our senior secured revolving credit facility.
|
|
(8)
|
Includes a one-time
$22.5 million
net favorable tax benefit that was recorded during the fourth quarter of 2017, which resulted from the enactment of the Tax Cuts and Jobs Act. This benefit mainly consisted of a one-time, provisional benefit of
$26.9 million
related to the remeasurement of certain of our deferred tax liabilities using the lower U.S. federal corporate tax rate of 21%. This was partially offset by (i) a one-time, provisional charge of $8.7 million related to the deemed repatriation transition tax, which is a tax on previously untaxed accumulated earnings and profits of certain of our foreign subsidiaries, and (ii) a one-time tax expense and tax benefit of $4.5 million and $8.7 million, respectively, related to our intent to amend pre-acquisition Hudson U.S. federal tax returns.
|
32
Consolidated Results for the Years Ended December 31,
2017, 2016 and 2015
The following table includes key metrics used to evaluate our business and measure our performance and represents selected financial data for our operating segments for the years ended December 31,
2017, 2016 and 2015
(dollars in millions). Further detailed information regarding our operating segments is presented in
Note 20
of the consolidated financial statements included elsewhere in this report.
Selected Segment Financial Information
|
|
Year Ended December 31,
|
||||||||||
|
|
2017
|
2016
|
2015
|
||||||||
|
Sales
|
|||||||||||
|
Energy & Chemicals
|
$
|
225.6
|
|
$
|
154.3
|
|
$
|
331.0
|
|
||
|
Distribution & Storage
|
540.3
|
|
497.1
|
|
487.6
|
|
|||||
|
BioMedical
|
222.9
|
|
207.8
|
|
221.6
|
|
|||||
|
Consolidated
|
$
|
988.8
|
|
$
|
859.2
|
|
$
|
1,040.2
|
|
||
|
Gross Profit
(1) (2)
|
|||||||||||
|
Energy & Chemicals
|
$
|
45.1
|
|
$
|
44.9
|
|
$
|
94.6
|
|
||
|
Distribution & Storage
|
146.3
|
|
130.3
|
|
123.5
|
|
|||||
|
BioMedical
|
80.7
|
|
91.2
|
|
70.4
|
|
|||||
|
Consolidated
|
$
|
272.1
|
|
$
|
266.4
|
|
$
|
288.5
|
|
||
|
Gross Profit Margin
|
|||||||||||
|
Energy & Chemicals
|
20.0
|
%
|
29.1
|
%
|
28.6
|
%
|
|||||
|
Distribution & Storage
|
27.1
|
%
|
26.2
|
%
|
25.3
|
%
|
|||||
|
BioMedical
|
36.2
|
%
|
43.9
|
%
|
31.8
|
%
|
|||||
|
Consolidated
|
27.5
|
%
|
31.0
|
%
|
27.7
|
%
|
|||||
|
SG&A Expenses
(1) (2)
|
|||||||||||
|
Energy & Chemicals
|
$
|
34.3
|
|
$
|
29.4
|
|
$
|
33.1
|
|
||
|
Distribution & Storage
|
74.8
|
|
72.7
|
|
77.2
|
|
|||||
|
BioMedical
|
42.1
|
|
45.7
|
|
42.9
|
|
|||||
|
Corporate
(4)
|
63.9
|
|
48.1
|
|
47.6
|
|
|||||
|
Consolidated
|
$
|
215.1
|
|
$
|
195.9
|
|
$
|
200.8
|
|
||
|
SG&A Expenses (% of Sales)
|
|||||||||||
|
Energy & Chemicals
|
15.2
|
%
|
19.1
|
%
|
10.0
|
%
|
|||||
|
Distribution & Storage
|
13.8
|
%
|
14.6
|
%
|
15.9
|
%
|
|||||
|
BioMedical
|
18.9
|
%
|
22.0
|
%
|
19.4
|
%
|
|||||
|
Consolidated
|
21.8
|
%
|
22.8
|
%
|
19.3
|
%
|
|||||
|
Operating Income (Loss)
(2) (3)
|
|||||||||||
|
Energy & Chemicals
|
$
|
5.1
|
|
$
|
13.3
|
|
$
|
(10.0
|
)
|
||
|
Distribution & Storage
|
66.1
|
|
50.4
|
|
39.5
|
|
|||||
|
BioMedical
|
35.5
|
|
42.0
|
|
(165.3
|
)
|
|||||
|
Corporate
(4)
|
(64.7
|
)
|
(48.3
|
)
|
(47.4
|
)
|
|||||
|
Consolidated
|
$
|
42.0
|
|
$
|
57.4
|
|
$
|
(183.2
|
)
|
||
|
Operating Margin (Loss)
|
|||||||||||
|
Energy & Chemicals
|
2.3
|
%
|
8.6
|
%
|
(3.1
|
)%
|
|||||
|
Distribution & Storage
|
12.2
|
%
|
10.1
|
%
|
8.1
|
%
|
|||||
|
BioMedical
|
15.9
|
%
|
20.2
|
%
|
(74.6
|
)%
|
|||||
|
Consolidated
|
4.2
|
%
|
6.7
|
%
|
(17.6
|
)%
|
|||||
_______________
|
(1)
|
During the third quarter of 2016, we recovered for breaches of representations and warranties primarily related to warranty costs for certain product lines acquired in the 2012 acquisition of AirSep under the related representation and warranty insurance. For the year ended December 31, 2016, this reduced BioMedical cost of sales by
$15.2 million
and reduced Corporate SG&A expenses by $0.3 million, net of associated legal fees recorded in 2016.
|
|
(2)
|
Restructuring costs for 2017 were
$15.6 million
(
$2.4 million
– E&C,
$2.2 million
– D&S,
$5.0 million
BioMedical, and
$6.0 million
– Corporate). Restructuring costs for 2016 were
$10.9 million
(
$1.0 million
– E&C,
$3.8 million
– D&S,
$1.9 million
BioMedical, and
$4.2 million
– Corporate). Restructuring costs for 2015 were
$12.2 million
(
$1.4 million
– E&C,
$7.7 million
– D&S,
$1.8 million
BioMedical, and
$1.3 million
– Corporate).
|
33
|
(3)
|
The year ended December 31, 2016 includes asset impairment charges of $1.2 million attributed to D&S. The year ended December 31, 2015 includes asset impairment charges of $255.1 million attributed to E&C – $68.8 million, D&S – $2.0 million, and BioMedical – $184.3 million.
|
|
(4)
|
Includes acquisition-related expenses of
$10.1 million
for 2017.
|
Results of Operations for the Years Ended December 31, 2017 and 2016
Sales in 2017 increased compared to 2016 by
$129.6 million
or
15.1%
, across all of our segments. E&C sales included sales from the Hudson acquisition which added
$58.0 million
in sales during the period of our ownership from September 20, 2017 through December 31, 2017, and
$44.6 million
of incremental sales from Lifecycle, which includes the Hetsco acquisition. E&C segment sales in 2016 included several short-lead time replacement equipment sales and contract expiration fees. The overall increase in 2017 sales was also driven by stronger sales in D&S as a result of increased sales in bulk and packaged gas industrial applications, especially in the U.S and China.
Gross profit increased
$5.8 million
, while the related margin decreased from
31.0%
to
27.5%
during 2017 compared to 2016. The prior year included several high margin short-lead time replacement equipment sales and contract expiration fees in our E&C segment that did not recur in 2017 as well as the BioMedical insurance recovery for breaches of representations and warranties related to warranty costs for certain product lines acquired from AirSep in 2012. For the year ended December 31, 2016, this reduced BioMedical’s cost of sales by
$15.2 million
and added 1.8% to the consolidated gross margin.
SG&A expenses increased by
$15.8 million
during 2017 compared to 2016. During 2017, Corporate incurred
$10.1 million
in acquisition-related costs. Restructuring expenses increased
$4.7 million
over 2016 as further discussed below. The D&S segment incurred additional commissions as a result of a litigation award in China. See Item 3, “Legal Proceedings” for further information.
Restructuring costs of
$15.6 million
in 2017 were recorded in cost of goods sold (
$5.2 million
) and SG&A (
$10.4 million
) as a result of our cost reduction and operating efficiency initiatives primarily related to the corporate office relocation, the Buffalo BioMedical respiratory consolidation to our Ball Ground, Georgia facilities and our China facilities consolidation. Restructuring costs of
$10.9 million
in 2016 were recorded in cost of goods sold (
$4.4 million
) and SG&A (
$6.5 million
).
Operating Income
As a result of the foregoing, operating income for 2017 was
$42.0 million
, or
4.2%
of sales, compared to operating income of
$57.4 million
, or
6.7%
of sales, for the same period in 2016.
Interest Expense, Net and Financing Costs Amortization
Net interest expense for
2017
and
2016
was
$19.4 million
and
$17.3 million
, respectively. Interest expense for
2017
included
$4.3 million
of 2.0% cash interest and
$11.8 million
of non-cash interest accretion expense related to the carrying value of the 2018 Notes,
$2.7 million
in interest related to borrowings on our senior secured revolving credit facility for the Hudson acquisition and
$0.4 million
of 1.0% cash interest and
$1.1 million
of non-cash interest accretion expense related to the carrying value of the 2024 Notes. For
2017
and
2016
, financing costs amortization were
$1.3 million
in each period.
On November 6, 2017, we repurchased $192.9 million principal of our $250.0 million 2018 Notes for total consideration of $195.9 million in cash, which included
$1.0 million
of accrued interest and
$194.9 million
for the notes. The amount by which total consideration exceeded the fair value of the 2018 Notes was recorded as a reduction of additional paid-in capital. The loss from early extinguishment of the 2018 Notes and refinance of our senior secured revolving credit facility was
$4.9 million
in
2017
.
Foreign Currency Loss
For
2017
and
2016
, foreign currency losses were
$2.8 million
and
$0.4 million
, respectively. Losses increased by
$2.4 million
during
2017
due to exchange rate volatility, especially with respect to the euro.
Income Tax Benefit/Expense
Income tax benefit of
$15.9 million
for
2017
and income tax expense of
$13.7 million
for
2016
, represents taxes on both U.S. and foreign earnings at a combined effective income tax rate of
(117.2)%
and
35.7%
, respectively. The income tax benefit in 2017 was mainly driven by a one-time
$22.5 million
net favorable tax benefit that was recorded during the fourth quarter of 2017, which resulted from the enactment of the Tax Cuts and Jobs Act. This benefit mainly consisted of a one-time, provisional
34
benefit of
$26.9 million
related to the remeasurement of certain of our deferred tax liabilities using the lower U.S. federal corporate tax rate of 21%. This was partially offset by (i) a one-time, provisional charge of $8.7 million related to the deemed repatriation transition tax, which is a tax on previously untaxed accumulated earnings and profits of certain of our foreign subsidiaries, and (ii) a one-time tax expense and tax benefit of $4.5 million and $8.7 million, respectively, related to our intent to amend pre-acquisition Hudson U.S. federal tax returns. In the prior year, the favorable impact of an insurance settlement for breaches of representations and warranties that resulted in an adjustment to our purchase price of AirSep shares was offset by valuation allowances recorded against current and accumulated operating losses incurred by certain of our foreign operations (primarily China) for which no benefit was recorded.
Net Income
As a result of the foregoing, net income attributable to Chart was
$28.0 million
and
$28.2 million
for 2017 and 2016, respectively.
Results of Operations for the Years Ended December 31, 2016 and 2015
Sales for 2016 were $859.2 million compared to $1,040.2 million for 2015, reflecting a decrease of $181.0 million, or 17.4%. This decrease was largely driven by our E&C segment where low energy prices impacted our backlog and order trends as customers delayed or deferred large projects. Additionally, our E&C segment completed several major projects in 2015 with no major projects awarded in 2016 given the volatile energy environment. BioMedical segment sales decreased driven by lower respiratory therapy equipment sales primarily in the U.S. due to competitive pressure. The overall decrease in sales was partially offset by an increase in D&S segment sales primarily attributable to bulk industrial gas applications.
Gross profit for 2016 was $266.4 million, or 31.0% of sales compared to $288.5 million, or 27.7% of sales, for 2015, which reflected a decrease of $22.1 million, while the related margin percentage increased by 3.3 percentage points. Gross profit and the related margin for the year ended December 31, 2016 were positively impacted by an insurance recovery during the third quarter at our BioMedical segment as further described in the BioMedical segment section below. For the year ended December 31, 2016, the insurance recovery added 1.8% to the consolidated margin and 7.3% to the BioMedical segment’s margin. The favorable impact of the insurance recovery was offset by decreased gross profit resulting from lower sales volumes at our E&C segment, however the overall margin was favorably impacted by several short-lead time orders and contract expiration fees which improved gross profit by $38.7 million in 2016 and the gross margin by 25.1 percentage points for the year.
SG&A expenses for 2016 were $195.9 million, or 22.8% of sales, compared to $200.8 million, or 19.3% of sales, for 2015, representing a decrease of $4.9 million. SG&A expenses related to restructuring activities were $6.5 million during 2016, which was primarily comprised of severance costs related to facility consolidation efforts. This compares to restructuring costs relating to facility shutdown and headcount reductions of $8.6 million during 2015. Additionally, SG&A expenses declined by $14.9 million due to lower payroll and benefits, professional services, travel and entertainment, commissions, and restructuring-related expenses. This was partially offset by increases of $10.4 million for variable short-term incentive compensation based on performance, primarily with respect to the D&S, BioMedical, and Corporate segments, and higher bad debt expense.
Beginning in 2016, we allocated share-based compensation expense to each operating segment and maintained share-based compensation expense related to Corporate employees at Corporate. Prior to 2016, all share-based compensation expense was recorded at Corporate. Reclassifications from Corporate to the operating segments have been made to prior SG&A expenses to conform to the current presentation.
Asset Impairments
During 2016, we recorded asset impairment charges of $1.2 million attributed to our D&S segment. In comparison, during 2015, we recorded asset impairment charges of $253.6 million attributed to our operating segments as follows: E&C - $68.8 million, D&S - $0.5 million, and BioMedical - $184.3 million. See Note 3, Asset Impairments, to the accompanying financial statements for more information relating to the 2016 and 2015 asset impairments.
Operating Income (Loss)
As a result of the foregoing, operating income for 2016 was $57.4 million, or 6.7% of sales, compared to operating loss of $183.2 million, or 17.6% of sales, for the same period in 2015.
Interest Expense, Net and Financing Costs Amortization
Net interest expense for 2016 and 2015 was $17.3 million and $16.0 million, respectively. Interest expense for 2016 included $5.0 million of 2.0% cash interest and $12.5 million of non-cash interest accretion expense related to the carrying value of the 2018 Notes. For 2016 and 2015, financing costs amortization were $1.3 million in each period.
35
Foreign Currency Loss
For 2016 and 2015, foreign currency losses were $0.4 million and $1.3 million, respectively. Losses decreased by $0.9 million during 2016 due to reduced exchange rate volatility, especially with respect to the euro.
Income Tax Expense
Income tax expense of $13.7 million and $2.7 million for 2016 and 2015, respectively, represents taxes on both U.S. and foreign earnings at a combined effective income tax rate of 35.7% and (1.3)%, respectively. The favorable impact of an insurance settlement for breaches of representations and warranties that resulted in an adjustment to our purchase price of AirSep shares was offset by valuation allowances recorded against current and accumulated operating losses incurred by certain of our foreign operations (primarily China) for which no benefit was recorded. The change in rate from the prior year was primarily due to the $67.3 million tax impact in 2015 related to the impairment charges of $253.6 million.
Net Income (Loss)
As a result of the foregoing, net income attributable to Chart during 2016 was $28.2 million while the net loss was $203.0 million during 2015, including asset impairment charges of $1.2 million and $255.1 million for 2016 and 2015, respectively.
36
Segment Results for the Years Ended December 31,
2017, 2016 and 2015
Energy & Chemicals
Results of Operations for the Years Ended
December 31, 2017
and
2016
|
Year Ended December 31,
|
2017 vs. 2016
|
|||||||||||||
|
2017
|
2016
|
Variance
($)
|
Variance
(%)
|
|||||||||||
|
Sales
|
$
|
225.6
|
|
$
|
154.3
|
|
$
|
71.4
|
|
46.3
|
%
|
|||
|
Gross Profit
|
45.1
|
|
44.9
|
|
0.2
|
|
0.5
|
%
|
||||||
|
Gross Profit Margin
|
20.0
|
%
|
29.1
|
%
|
||||||||||
|
SG&A Expenses
|
$
|
34.3
|
|
$
|
29.4
|
|
$
|
4.9
|
|
16.7
|
%
|
|||
|
SG&A Expenses (% of Sales)
|
15.2
|
%
|
19.1
|
%
|
||||||||||
|
Operating Income
|
$
|
5.1
|
|
$
|
13.3
|
|
$
|
(8.2
|
)
|
(61.7
|
)%
|
|||
|
Operating Margin
|
2.3
|
%
|
8.6
|
%
|
||||||||||
During 2017, E&C segment sales increased as compared to 2016. The increase was primarily driven by increases in U.S. shale and associated gas, which drove natural gas processing plant activity throughout 2017, the Hudson acquisition, which added
$58.0 million
of sales in 2017, and incremental sales increases in our Lifecycle business of
$44.6 million
, which included the Hetsco acquisition.
E&C gross profit increased slightly while the related margin decreased during 2017 as compared to 2016. The increase in gross profit was primarily driven by Hudson and growth in Lifecycle which added incremental gross profit of
$15.4 million
and
$5.2 million
, respectively, during 2017. Included in 2016 were several short lead-time orders and contract expiration fees which contributed approximately $38.7 million of gross profit in 2016 and improved the gross margin by 25.1 percentage points for the year.
E&C segment SG&A expenses increased mainly as a result of the Hudson acquisition which added
$5.7 million
to SG&A expenses during 2017 and incremental SG&A expenses from Lifecycle of
$2.5 million
during 2017.
Results of Operations for the Years Ended
December 31, 2016
and
2015
|
Year Ended December 31,
|
2016 vs. 2015
|
|||||||||||||
|
2016
|
2015
|
Variance
($)
|
Variance
(%)
|
|||||||||||
|
Sales
|
$
|
154.3
|
|
$
|
331.0
|
|
$
|
(176.7
|
)
|
(53.4
|
)%
|
|||
|
Gross Profit
|
44.9
|
|
94.6
|
|
(49.7
|
)
|
(52.5
|
)%
|
||||||
|
Gross Profit Margin
|
29.1
|
%
|
28.6
|
%
|
||||||||||
|
SG&A Expenses
|
$
|
29.4
|
|
$
|
33.1
|
|
$
|
(3.7
|
)
|
(11.2
|
)%
|
|||
|
SG&A Expenses (% of Sales)
|
19.1
|
%
|
10.0
|
%
|
||||||||||
|
Operating Income (Loss)
|
$
|
13.3
|
|
$
|
(10.0
|
)
|
$
|
23.4
|
|
(232.7
|
)%
|
|||
|
Operating Margin (Loss)
|
8.6
|
%
|
(3.1
|
)%
|
||||||||||
E&C segment sales in 2016 decreased by $176.7 million, or 53.4%, compared to 2015. This reduction was due to lower sales of LNG applications of $97.9 million, a $75.5 million decrease within natural gas processing (including petrochemical) applications, and a decline in industrial gas applications of $3.3 million. Low energy prices continued to impact backlog and order trends as customers delayed or deferred large projects. Additionally, our E&C segment completed several major projects in 2015 with no major projects awarded in 2016 given the volatile energy environment.
E&C segment gross profit decreased by $49.7 million primarily due to decreased volume within LNG and natural gas applications, but was favorably impacted by several short-lead time orders and contract expiration fees which improved gross profit by $38.7 million in 2016 and the gross margin by 25.1 percentage points for the year.
E&C segment SG&A expenses decreased by $3.7 million compared to the prior year. SG&A expense declined by $4.5 million due to decreased variable short-term incentive compensation, lower costs related to outside professional services, and reduced employee costs due to headcount reductions. This was partially offset by an increase of $1.0 million related to bad debt expense and higher marketing costs.
37
Distribution & Storage
Results of Operations for the Years Ended
December 31, 2017
and
2016
|
Year Ended December 31,
|
2017 vs. 2016
|
|||||||||||||
|
2017
|
2016
|
Variance
($)
|
Variance
(%)
|
|||||||||||
|
Sales
|
$
|
540.3
|
|
$
|
497.1
|
|
$
|
43.2
|
|
8.7
|
%
|
|||
|
Gross Profit
|
146.3
|
|
130.3
|
|
16.0
|
|
12.3
|
%
|
||||||
|
Gross Profit Margin
|
27.1
|
%
|
26.2
|
%
|
||||||||||
|
SG&A Expenses
|
$
|
74.8
|
|
$
|
72.7
|
|
$
|
2.1
|
|
2.9
|
%
|
|||
|
SG&A Expenses (% of Sales)
|
13.8
|
%
|
14.6
|
%
|
||||||||||
|
Operating Income
|
$
|
66.1
|
|
$
|
50.4
|
|
$
|
15.7
|
|
31.2
|
%
|
|||
|
Operating Margin
|
12.2
|
%
|
10.1
|
%
|
||||||||||
D&S segment sales increased during 2017 as compared to 2016 mainly due to a
$27.9 million
increase in sales for liquefied natural gas applications and a
$21.1 million
increase in packaged gas industrial applications, partially offset by a
$5.8 million
decrease in bulk industrial gas applications.
D&S segment gross profit increased during 2017 as compared to 2016 mainly driven by higher volume across all regions, and the related margin increased, especially in China, primarily due to improved execution.
D&S segment SG&A expenses increased during 2017 as compared to 2016 mainly due to additional commissions as a result of a litigation award in China. See Item 3, “Legal Proceedings” for further information. This increase was partially offset by lower bad debt expense driven by successful accounts receivable collection activities in China and the impact of a reduction in a contingent consideration liability associated with a prior acquisition, which was recorded during 2017.
Results of Operations for the Years Ended
December 31, 2016
and
2015
|
Year Ended December 31,
|
2016 vs. 2015
|
|||||||||||||
|
2016
|
2015
|
Variance
($)
|
Variance
(%)
|
|||||||||||
|
Sales
|
$
|
497.1
|
|
$
|
487.6
|
|
$
|
9.5
|
|
2.0
|
%
|
|||
|
Gross Profit
|
130.3
|
|
123.5
|
|
6.8
|
|
5.5
|
%
|
||||||
|
Gross Profit Margin
|
26.2
|
%
|
25.3
|
%
|
||||||||||
|
SG&A Expenses
|
$
|
72.7
|
|
$
|
77.2
|
|
$
|
(4.5
|
)
|
(5.8
|
)%
|
|||
|
SG&A Expenses (% of Sales)
|
14.6
|
%
|
15.9
|
%
|
||||||||||
|
Operating Income
|
$
|
50.4
|
|
$
|
39.5
|
|
$
|
10.9
|
|
27.6
|
%
|
|||
|
Operating Margin
|
10.1
|
%
|
8.1
|
%
|
||||||||||
D&S segment sales in 2016 increased by
$9.5 million
, or 2.0%, compared to 2015, primarily attributable to a $23.8 million increase within bulk industrial gas applications largely due to engineered systems. This increase was partially offset by an $8.1 million decrease related to packaged gas industrial applications largely due to beverage applications, and a $6.1 million decrease within LNG applications. Continued weakness in China was offset by improved sales in Europe and the U.S. compared to 2015. The overall currency translation impact on sales attributable to the D&S segment was approximately $4.9 million unfavorable on a constant currency basis given the strength of the U.S. dollar versus the Chinese yuan.
D&S segment gross profit increased by $6.8 million and the related margin increased by 0.9 percentage points compared to the prior year primarily due to higher volume and productivity initiatives in the U.S. and Europe. The finalization of an insurance claim during the first quarter of 2016 positively impacted gross margin by approximately $1.0 million. These increases are partially offset by severance costs of $2.3 million that are reflected in cost of sales, which equates to a 0.5% gross margin impact, along with unfavorable product mix and inventory write-downs in China.
D&S segment SG&A expenses decreased by $4.5 million compared to the prior year. The decrease was due to $10.8 million of lower restructuring-related expenses, outside professional services, travel and entertainment, employee costs due to headcount reductions, and decreased severance charges, and supplies expense. This was partially offset by an increase of $7.5 million for higher variable short-term incentive compensation, bad debt expense, and additional commissions as a result of a litigation award in China. See Item 3, “Legal Proceedings” for further information.
38
BioMedical
Results of Operations for the Years Ended
December 31, 2017
and
2016
|
Year Ended December 31,
|
2017 vs. 2016
|
|||||||||||||
|
2017
|
2016
|
Variance
($)
|
Variance
(%)
|
|||||||||||
|
Sales
|
$
|
222.9
|
|
$
|
207.8
|
|
$
|
15.1
|
|
7.3
|
%
|
|||
|
Gross Profit
|
80.7
|
|
91.2
|
|
(10.5
|
)
|
(11.5
|
)%
|
||||||
|
Gross Profit Margin
|
36.2
|
%
|
43.9
|
%
|
||||||||||
|
SG&A Expenses
|
$
|
42.1
|
|
$
|
45.7
|
|
$
|
(3.6
|
)
|
(7.9
|
)%
|
|||
|
SG&A Expenses (% of Sales)
|
18.9
|
%
|
22.0
|
%
|
||||||||||
|
Operating Income
|
$
|
35.5
|
|
$
|
42.0
|
|
$
|
(6.5
|
)
|
(15.5
|
)%
|
|||
|
Operating Margin
|
15.9
|
%
|
20.2
|
%
|
||||||||||
The increase in BioMedical segment sales during 2017 as compared to 2016 was primarily driven by military-based respiratory therapy equipment sales, stainless freezer sales within our cryobiological storage applications, particularly in Asia, and an increase in projects within on-site generation systems applications partially offset by lower liquid oxygen systems sales primarily in Europe.
During 2017, BioMedical segment gross profit and the related margin decreased as compared to 2016. The third quarter of 2016 included the impact of an insurance recovery for breaches of representations and warranties related to warranty costs for certain product lines acquired from AirSep in 2012. For 2016, this reduced BioMedical’s cost of sales by
$15.2 million
and added
7.3%
to the year-to-date margin. Excluding this impact, gross profit increased by
$4.7 million
mainly on increased volume.
BioMedical segment SG&A expenses, which included $2.5 million of restructuring costs during 2017, decreased as compared to the prior year primarily due to one-time costs in 2016 related to expansion into a direct-to-consumer sales channel, regulatory, and legal fees. Higher restructuring costs were incurred during 2017 to support the operations and engineering transition from our Buffalo BioMedical respiratory facilities to our Ball Ground, Georgia facilities along with the divestiture of our Qdrive® business.
Results of Operations for the Years Ended
December 31, 2016
and
2015
|
Year Ended December 31,
|
2016 vs. 2015
|
|||||||||||||
|
2016
|
2015
|
Variance
($)
|
Variance
(%)
|
|||||||||||
|
Sales
|
$
|
207.8
|
|
$
|
221.6
|
|
$
|
(13.8
|
)
|
(6.2
|
)%
|
|||
|
Gross Profit
|
91.2
|
|
70.4
|
|
20.8
|
|
29.6
|
%
|
||||||
|
Gross Profit Margin
|
43.9
|
%
|
31.8
|
%
|
||||||||||
|
SG&A Expenses
|
$
|
45.7
|
|
$
|
42.9
|
|
$
|
2.8
|
|
6.5
|
%
|
|||
|
SG&A Expenses (% of Sales)
|
22.0
|
%
|
19.4
|
%
|
||||||||||
|
Operating Income (Loss)
|
$
|
42.0
|
|
$
|
(165.3
|
)
|
$
|
207.3
|
|
(125.4
|
)%
|
|||
|
Operating Margin (Loss)
|
20.2
|
%
|
(74.6
|
)%
|
||||||||||
BioMedical segment sales decreased in 2016 by $13.9 million, or 6.3%, compared to 2015. This decrease was driven by a $13.4 million decrease in respiratory therapy equipment sales primarily in the U.S. due to competitive pressure and a decrease in on-site generation systems applications of $6.4 million, primarily attributable to a decline in large project revenue. These decreases were partially offset by an increase in cryobiological storage of $5.9 million during 2016.
BioMedical segment gross profit increased by $20.8 million and the related margin increased by 12.1 percentage points compared to the prior-year period, primarily due to an insurance recovery, as well as lower warranty expense and favorable product mix. During the third quarter of 2016, we recovered for breaches of representations and warranties primarily related to warranty costs for certain product lines acquired in the 2012 acquisition of AirSep under the related representation and warranty insurance. For the year ended December 31, 2016, this reduced BioMedical’s cost of sales by
$15.2 million
and added 7.3% to the year-to-date margin. The BioMedical segment’s warranty expense as a percent of sales was 1.6% during 2016 compared to 4.1% in the prior-year period. Warranty expense decreased due to lower return rates on certain products and product mix.
BioMedical segment SG&A expenses increased by $2.8 million compared to the prior year primarily due to $4.4 million of increases related to higher variable short-term incentive compensation and increased bad debt expense. This was partially offset
39
by decreases of $2.8 million related to lower restructuring related expenses, lower employee costs due to headcount reductions, and lower commission expense.
Corporate
Corporate SG&A expenses increased by
$15.8 million
during 2017 as compared 2016 primarily due to
$10.1 million
in acquisition-related costs, and
$6.0 million
in corporate restructuring costs in 2017 compared to
$4.2 million
in 2016 attributable to the relocation of our corporate offices to Ball Ground, Georgia.
Corporate SG&A expenses increased by
$0.5 million
during 2016 as compared to 2015. SG&A expenses increased by $5.9 million due to higher restructuring-related expenses and variable short-term incentive compensation expense. This was partially offset by lower costs of $4.6 million related to outside professional services and lower employee costs due to headcount reductions.
Orders and Backlog
We consider orders to be those for which we have received a firm signed purchase order or other written contractual commitment from the customer. Backlog is comprised of the portion of firm signed purchase orders or other written contractual commitments received from customers that we have not recognized as revenue upon shipment or under the percentage of completion method. Backlog can be significantly affected by the timing of orders for large projects, particularly in the E&C segment, and is not necessarily indicative of future backlog levels or the rate at which backlog will be recognized as sales. Orders included in our backlog may include customary cancellation provisions under which the customer could cancel part or all of the order, potentially subject to the payment of certain costs and/or fees. Our backlog as of December 31,
2017, 2016 and 2015
was
$461.3 million
,
$342.6 million
and
$374.6 million
, respectively.
The table below represents orders received and backlog by segment for the periods indicated (dollar amounts in millions):
|
|
Year Ended December 31,
|
||||||||||
|
|
2017
|
2016
|
2015
|
||||||||
|
Orders
|
|||||||||||
|
Energy & Chemicals
|
$
|
243.6
|
|
$
|
110.2
|
|
$
|
187.6
|
|
||
|
Distribution & Storage
|
541.5
|
|
531.0
|
|
529.1
|
|
|||||
|
BioMedical
|
219.4
|
|
213.6
|
|
218.1
|
|
|||||
|
Total
|
$
|
1,004.5
|
|
$
|
854.8
|
|
$
|
934.8
|
|
||
|
As of December 31,
|
|||||||||||
|
2017
|
2016
|
2015
|
|||||||||
|
Backlog
|
|||||||||||
|
Energy & Chemicals
|
$
|
210.9
|
|
$
|
99.8
|
|
$
|
151.6
|
|
||
|
Distribution & Storage
|
227.5
|
|
218.2
|
|
206.5
|
|
|||||
|
BioMedical
|
22.9
|
|
24.6
|
|
16.5
|
|
|||||
|
Total
|
$
|
461.3
|
|
$
|
342.6
|
|
$
|
374.6
|
|
||
Orders and Backlog for the Year Ended and As of
December 31, 2017
Compared to the Year Ended and As of
December 31, 2016
Orders for
2017
were
$1,004.5 million
compared to
$854.8 million
for
2016
, representing
an increase
of
$149.7 million
, or
17.5%
.
E&C orders for
2017
were
$243.6 million
compared to
$110.2 million
for
2016
, an increase of
$133.4 million
. E&C backlog totaled
$210.9 million
at
December 31, 2017
, compared to
$99.8 million
as of
December 31, 2016
, an increase of
$111.1 million
. The increases in orders and backlog were impacted by the inclusion of Hudson since we acquired them on September 20, 2017, the results include
$31.3 million
of Hudson orders in 2017 and
$65.8 million
of Hudson backlog. Even considering the impact of Hudson, both E&C’s orders and backlog have increased as natural gas demand, from Petrochemical and LNG export projects continue to drive new gas transmission pipelines creating further opportunities for Chart’s projects. Although low energy prices continue to delay some further LNG-related opportunities, and although we have seen some improvements, current market conditions reinforce a challenging short-term outlook for project awards given the reduction in capital spending by our energy-related customers. Included in the E&C backlog is approximately $40 million related to the previously announced Magnolia LNG order where production release is delayed into early 2019. Order flow in the E&C segment is historically volatile due to project size and it is not unusual to see order intake change significantly year over year.
40
D&S orders for
2017
were
$541.5 million
compared to
$531.0 million
for
2016
,
an increase
of
$10.5 million
. Increases in D&S segment orders over the prior year were seen in the U.S. and Asia and were driven by a $35.0 million increase in packaged gas industrial applications partially offset by lower orders in bulk industrial gas applications. D&S backlog totaled
$227.5 million
at
December 31, 2017
compared to
$218.2 million
as of
December 31, 2016
, an increase of
$9.3 million
. The increases in backlog was attributable to increased backlog in packaged gas industrial applications.
BioMedical orders for
2017
were
$219.4 million
compared to
$213.6 million
for
2016
, an increase of
$5.8 million
. The increase in BioMedical orders was primarily attributable to the addition of projects within on-site generation systems applications and stronger orders in our cryobiological storage business. BioMedical backlog totaled
$22.9 million
at December 31, 2017, compared to
$24.6 million
as of December 31, 2016, a decrease of
$1.7 million
. The slight decrease in BioMedical backlog was mainly attributable to a decrease in respiratory therapy applications backlog due to higher sales in the fourth quarter of 2017.
Orders and Backlog for the Year Ended and As of
December 31, 2016
Compared to the Year Ended and As of
December 31, 2015
Orders for 2016 were $854.8 million compared to $934.8 million for 2015, representing a decrease of $80.0 million, or 8.6%.
E&C orders for 2016 were $110.2 million compared to $187.6 million for 2015, a decrease of $77.6 million. E&C backlog totaled $99.8 million at December 31, 2016, compared to $151.6 million as of December 31, 2015. Low energy prices continued to delay natural gas, petrochemical, and LNG-related opportunities and market conditions hurt project awards given the reduction in capital spending by our energy-related customers. Included in the E&C backlog was approximately $40 million related to the previously announced Magnolia LNG order. E&C backlog at December 31, 2016 was reduced approximately $6.2 million related to orders received prior to 2016 and cancelled during the year ended December 31, 2016.
D&S orders for 2016 were $531.0 million compared to $529.1 million for 2015, an increase of $1.9 million, or 0.4%. D&S backlog totaled $218.2 million at December 31, 2016 compared to $206.5 million as of December 31, 2015. The increase in D&S segment orders and backlog was primarily attributable to LNG applications in Europe.
BioMedical orders for 2016 were $213.6 million compared to $218.1 million for 2015. The decrease in BioMedical orders was primarily attributable to respiratory therapy applications. BioMedical backlog totaled $24.6 million at December 31, 2016, compared to $16.5 million as of December 31, 2015.
Liquidity and Capital Resources
Debt Instruments and Related Covenants
2024 Notes:
On November 6, 2017, we issued 1.00% Convertible Senior Subordinated Notes due 2024 (the “2024 Notes”), the outstanding aggregate principal amount of such notes being $258.8 million at
December 31, 2017
. The 2024 Notes bear interest at a fixed rate of 1.0% per year, payable semiannually in arrears on May 15 and November 15 of each year, and will mature on November 15, 2024, unless converted or repurchased. The effective interest rate at issuance, under generally accepted accounting principles, was 4.8%. Upon conversion, it is our intention to settle the principal amount of the 2024 Notes in cash and excess conversion value in shares of our common stock. The initial conversion price of $58.725 per share represents a conversion premium of 35% over the last reported sale price of our common stock on October 31, 2017, the date of the 2024 Notes offering, which was $43.50 per share. The 2024 Notes are classified as long-term liabilities at
December 31, 2017
. At the end of the fourth quarter of 2017, events for early conversion were not met; and thus, the 2024 Notes were not convertible as of, and for the fiscal quarter beginning January 1, 2018. There have been no conversions as of the date of this filing. In the event that holders of 2024 Notes elect to convert, we expect to fund any cash settlement of any such conversion from cash balances or borrowings under our senior secured revolving credit facility.
2018 Notes:
Concurrent with our November 2017 offering of the 2024 Notes, we repurchased $192.9 million of the principal amount of our outstanding 2.00% Convertible Senior Subordinated Notes due 2018 (the “2018 Notes”). The outstanding aggregate principal amount of our 2018 Notes was $57.1 million at
December 31, 2017
. The 2018 Notes bear interest at a fixed rate of 2.0% per year, payable semiannually in arrears on February 1 and August 1 of each year, and will mature on August 1, 2018. Upon conversion, holders of the 2018 Notes will receive cash up to the principal amount of the 2018 Notes, and it is our intention to settle any excess conversion value in shares of our common stock. However, we may elect to settle, at our discretion, any such excess value in cash, shares of our common stock or a combination of cash and shares. The initial conversion price of $69.03 per share represents a conversion premium of 30% over the last reported sale price of our common stock on July 28, 2011, the date of the 2018 Notes offering, which was $53.10 per share. The 2018 Notes are classified as current liabilities at
December 31, 2017
as their maturity is within 12 months of the balance sheet date. At the end of the fourth quarter of 2017, events for early conversion
41
were not met; and thus, the 2024 Notes were not convertible as of, and for the fiscal quarter beginning January 1, 2018. On or after May 1, 2018, holders of the 2018 Notes may convert regardless of the foregoing. There have been no conversions as of the date of this filing. In the event that holders of 2018 Notes elect to convert, we expect to fund any cash settlement of any such conversion from cash balances or borrowings under its senior secured revolving credit facility.
Senior Secured Revolving Credit Facility:
On November 3, 2017, we amended and extended our
five
-year
$450.0 million
senior secured revolving credit facility (the “Prior Credit Facility”) with a five-year
$450.0 million
senior secured revolving credit facility (the “SSRCF”) which matures on November 3, 2022. The SSRCF includes a $25.0 million sub-limit for the issuance of swingline loans and a
$100.0 million
base sub-limit along with a
$100.0 million
discretionary sub-limit to be used for letters of credit. There is a foreign currency limit of $100.0 million under the SSRCF which can be used for foreign currency denominated letters of credit and borrowings in a foreign currency, in each case in currencies agreed upon with the lenders. In addition, the facility permits borrowings up to $100.0 million made by our wholly-owned subsidiaries, Chart Industries Luxembourg S.à r.l. (“Chart Luxembourg”) and Chart Asia Investment Company Limited. The SSRCF also includes an expansion option permitting us to add up to an aggregate $225.0 million in term loans or revolving credit commitments from its lenders. Loans under the SSRCF bear interest at either (a) the Adjusted Base Rate, or (b) the Adjusted LIBOR (each as defined in the Debt and Credit Arrangements note (
Note 7
) to our consolidated financial statements included elsewhere in this report), plus, in each case, a margin that varies with our leverage ratio. Significant financial covenants for the SSRCF include a leverage ratio and an interest coverage ratio. At
December 31, 2017
, there were
$239.0 million
in borrowings outstanding under the SSRCF, bearing interest at
4.00%
. We borrowed $300.0 million against this facility in September 2017 to fund the acquisition of Hudson. We had
$42.9 million
in letters of credit and bank guarantees supported by the SSRCF, which had availability of
$168.1 million
, at
December 31, 2017
. We were in compliance with all covenants, including its financial covenants, at
December 31, 2017
.
Foreign Facilities – China:
Chart Cryogenic Engineering Systems (Changzhou) Company Limited (“CCESC”) and Chart Biomedical (Chengdu) Co. Ltd. (“Chengdu”), wholly-owned subsidiaries of Chart, and Chart Cryogenic Distribution Equipment (Changzhou) Company Limited (“CCDEC”), a joint venture of Chart, maintain joint banking facilities (the “China Facilities”) which include a revolving facility with
50.0 million
Chinese yuan (equivalent to
$7.7 million
) in borrowing capacity which can be utilized for either revolving loans, bonds/guarantees, or bank draft acceptances. Any borrowings made by CCESC, CCDEC or Chengdu under the China Facilities are guaranteed by Chart. At
December 31, 2017
, there were no borrowings outstanding under the revolving facility, but CCESC and CCDEC, together, had a combined total of
1.6 million
Chinese yuan (equivalent to
$0.3 million
), in bank guarantees.
CCDEC maintains an unsecured credit facility whereby CCDEC may borrow up to
30.0 million
Chinese yuan (equivalent to
$4.6 million
) for working capital purposes. At
December 31, 2017
, there was
5.0 million
Chinese yuan (equivalent to
$0.8 million
) outstanding under this facility, bearing interest at
4.35%
.
CCESC has a term loan that is secured by certain CCESC land use rights and allows for up to
86.6 million
Chinese yuan (equivalent to
$13.3 million
) in borrowings. The loan has a term of eight years with semi-annual installment payments of at least
10.0 million
Chinese yuan and a final maturity date of May 26, 2024. At
December 31, 2017
, there was
46.6 million
Chinese yuan (equivalent to
$7.1 million
) outstanding on this loan, bearing interest at
5.39%
.
Foreign Facilities – Europe:
Chart Ferox, a.s. (“Ferox”), a wholly-owned subsidiary of Chart, maintains a secured credit facility with capacity of up to
125.0 million
Czech koruna (equivalent to
$5.9 million
) and two secured credit facilities with capacity of up to
5.6 million
euros (equivalent to
$6.7 million
). All three facilities (the “Ferox Credit Facilities”) allow Ferox to request bank guarantees and letters of credit. None of these facilities allow revolving credit borrowings. Under two of the facilities, Ferox must pay letter of credit and guarantee fees equal to 0.70% per annum on the face amount of each guarantee or letter of credit, and under one facility, Ferox must pay the letter of credit and guarantee fees equal to 0.50%. Ferox’s land, buildings, and cash collateral secure the credit facilities. At
December 31, 2017
, there were bank guarantees of
147.8 million
Czech koruna (equivalent to
$7.0 million
) supported by the Ferox Credit Facilities.
Chart Luxembourg maintains an overdraft facility with
$5.0 million
in borrowing capacity. There were no borrowings under the Chart Luxembourg facility as of
December 31, 2017
.
Our debt and related covenants are further described in
Note 7
to our consolidated financial statements included elsewhere in this report.
42
Sources and Uses of Cash
Our cash and cash equivalents totaled
$122.6 million
as of
December 31, 2017
,
a decrease
of
$159.4 million
from the balance at
December 31, 2016
. Our foreign subsidiaries held cash of approximately
$110.5 million
and
$72.9 million
at
December 31, 2017
and
December 31, 2016
, respectively, to meet their liquidity needs. We expect to repatriate approximately $50 million in cash held by our foreign subsidiaries in 2018 as a result of the Tax Cuts and Jobs Act. No material restrictions exist in accessing cash held by our foreign subsidiaries. Cash equivalents are invested in money market funds that invest in high quality, short-term instruments, such as U.S. government obligations, certificates of deposit, repurchase obligations, and commercial paper issued by corporations that have been highly rated by at least one nationally recognized rating organization. We believe that our existing cash and cash equivalents, funds available under our SSRCF and cash provided by operations will be sufficient to finance our normal working capital needs, acquisitions and investments in properties, facilities, and equipment for the foreseeable future.
Years Ended
December 31, 2017
and
2016
Cash
provided by
operating activities during
2017
was
$47.0 million
, a decrease of
$123.8 million
from 2016, largely due to increases in working capital, due to higher accounts receivables and inventory, driven by higher sales and increases in operations. Cash
provided by
operating activities during
2016
was
$170.8 million
, largely due to improvements in working capital, including greater cash collections during 2016, and reductions in inventory. Also, 2016 cash flows reflect the $16.7 million receipt of the representation and warranty insurance recovery proceeds.
Cash
used in
investing activities was
$480.0 million
and
$18.1 million
during
2017
and
2016
, respectively. During 2017, we used
$419.5 million
of cash related to the Hudson acquisition,
$22.8 million
of cash related to the Hetsco acquisition,
$3.8 million
of cash related to the VCT acquisition and
$35.2 million
for capital expenditures, partially offset by
$1.3 million
of cash provided by the sale of assets and government grants. Cash used in investing activities in 2016 was primarily for capital expenditures.
Cash
provided by
financing activities during
2017
and
2016
was
$275.2 million
and
$7.7 million
, respectively. During 2017 we borrowed
$236.1 million
(net of repayments) from our revolving credit facilities. We received proceeds from the issuance of convertible notes and warrants of
$304.8 million
of which
$194.9 million
was used to repay a portion of the previously issued 2018 Notes and
$59.5 million
to purchase a bond hedge related to the 2024 Notes. We also made
$8.2 million
in payments for debt issuance costs related to the 2024 Notes and SSRCF. Also during 2017, we received
$2.0 million
in proceeds from stock option exercises, and we used
$2.0 million
for the purchase of common stock which was surrendered to cover tax withholdings during 2017. During 2016, we borrowed 111.6 million Chinese yuan (equivalent to $17.0 million) and repaid 60.0 million Chinese yuan (equivalent to $9.0 million) on our China Facilities. Also during 2016, we received $0.4 million in proceeds from stock option exercises, and we used $0.7 million for the purchase of common stock which was surrendered to cover tax withholdings during 2016.
Years Ended
December 31, 2016
and
2015
Cash provided by operating activities during 2016 and 2015 was $170.8 million and $101.0 million, respectively. The increase in cash provided by operations was largely due to improvements in working capital, including greater cash collections during 2016, and reductions in inventory. Also, 2016 cash flows reflect the $16.7 million receipt of the representation and warranty insurance recovery proceeds.
Cash used in investing activities was $18.1 million and $73.5 million during 2016 and 2015, respectively. Cash used in investing activities in 2016 was largely for capital expenditures. Investing activities in 2015 included capital expenditures of $47.0 million and payments for land use rights of $11.0 million, which were largely attributed to the D&S segment’s capacity expansion project in China. Also, in connection with this expansion, we received an $8.7 million government grant. Additionally, we used $24.5 million of cash related to the Thermax Inc. (“Thermax”) acquisition in 2015.
Cash provided by financing activities during 2016 and 2015 was $7.7 million and $0.4 million, respectively. During 2016, we borrowed 111.6 million Chinese yuan (equivalent to $17.0 million) and repaid 60.0 million Chinese yuan (equivalent to $9.0 million) on our China Facilities. We used $0.7 million for the purchase of common stock which was surrendered to cover tax withholdings during 2016. Also during 2016, we received $0.4 million in proceeds from stock option exercises.
Accounts Receivable and Allowance for Doubtful Accounts
Our accounts receivable, net balance was
$222.7 million
at
December 31, 2017
compared to
$142.8 million
at
December 31, 2016
, representing an increase of
$79.9 million
. The increase was driven by higher sales, as well as the Hudson acquisition, which added $39.0 million to our accounts receivable balance at
December 31, 2017
. Our accounts receivable allowance was
$10.8 million
at
December 31, 2017
and
$10.2 million
at
December 31, 2016
. The accounts receivable allowance includes
$6.8 million
and
$6.5 million
attributed to receivables in China at December 31, 2017 and 2016, respectively, in light of the economic environment and collection challenges in China.
43
Inventories, net
Our inventories, net, balance was
$208.9 million
at
December 31, 2017
compared to
$169.7 million
at
December 31, 2016
, representing an increase of
$39.2 million
. The Hudson acquisition added
$23.1 million
to our inventories, net balance at
December 31, 2017
. The Hudson acquisition is further described in Note 10 to our consolidated financial statements included elsewhere in this report.
Cash Requirements
We do not currently anticipate any unusual cash requirements for working capital needs for the year ending December 31,
2018
. Management anticipates we will be able to satisfy cash requirements for our ongoing business for the foreseeable future with cash generated by operations, existing cash balances and available borrowings under our credit facilities. We may repurchase remaining 2018 Notes from time to time during 2018. To the extent that we repurchase convertible notes, we would expect to enter into an agreement with each of the option counterparties to our convertible note hedge, warrants and capped call agreements providing for the partial unwind of such agreements in a notional amount corresponding to the aggregate principal amount of convertible notes that we repurchase. We expect capital expenditures for
2018
to be in the range of
$35.0
to
$45.0 million
. Larger capital projects planned for 2018 include the completion of the capacity expansion of the brazed aluminum heat exchanger facility in La Crosse, Wisconsin, and capacity increase in Ball Ground, Georgia, to support demand for LNG vehicle tanks. In January 2018, we used approximately $12.5 million to acquire Skaff Cryogenics and Cryo-Lease, LLC, as further described in the Subsequent Events note to the consolidated financial statements included elsewhere in this report.
Contractual Obligations
Our known contractual obligations as of
December 31, 2017
and cash requirements resulting from those obligations are as follows (all dollar amounts in millions):
|
|
Payments Due by Period
|
||||||||||||||||||
|
|
Total
|
Less Than 1 Year
|
1 – 3 Years
|
3 – 5 Years
|
More Than 5 Years
|
||||||||||||||
|
|
|||||||||||||||||||
|
Gross debt
(1)
|
$
|
562.8
|
|
$
|
60.9
|
|
$
|
4.1
|
|
$
|
239.0
|
|
$
|
258.8
|
|
||||
|
Contractual convertible notes interest
|
19.1
|
|
3.5
|
|
5.2
|
|
5.2
|
|
5.2
|
|
|||||||||
|
Operating leases
|
40.6
|
|
9.2
|
|
12.7
|
|
7.9
|
|
10.8
|
|
|||||||||
|
Severance
|
1.5
|
|
1.5
|
|
—
|
|
—
|
|
—
|
|
|||||||||
|
Pension obligations
(2)
|
1.8
|
|
—
|
|
1.4
|
|
0.4
|
|
—
|
|
|||||||||
|
Total contractual cash obligations
|
$
|
625.8
|
|
$
|
75.1
|
|
$
|
23.3
|
|
$
|
252.5
|
|
$
|
274.8
|
|
||||
_______________
|
(1)
|
The $57.1 principal balance of the 2018 Notes will mature on August 1, 2018.
|
|
(2)
|
The planned funding of the pension obligations is based upon actuarial and management estimates taking into consideration the current status of the plan.
|
Not included in the table above is an estimate from a one-time, provisional charge of $8.7 million related to the deemed repatriation transition tax, which is a tax on previously untaxed accumulated earnings and profits of certain of our foreign subsidiaries, offset by a one-time tax expense and tax benefit of $4.5 million and $8.7 million, respectively, related to our intent to amend pre-acquisition Hudson U.S. federal tax returns, as well as unrecognized tax benefits of
$0.8 million
at
December 31, 2017
and contingent consideration arrangements from prior acquisitions with a potential payout range of $0.0 million to $11.3 million.
Our commercial commitments as of
December 31, 2017
, which include standby letters of credit and bank guarantees, represent potential cash requirements resulting from contingent events that require performance by us or our subsidiaries pursuant to funding commitments, and are as follows (all dollar amounts in millions):
|
Total
|
Expiring in 2018
|
Expiring in 2019 and beyond
|
|||||||||
|
Standby letters of credit
|
$
|
36.8
|
|
$
|
20.6
|
|
$
|
16.2
|
|
||
|
Bank guarantees
|
13.4
|
|
9.3
|
|
4.1
|
|
|||||
|
Total commercial commitments
|
$
|
50.2
|
|
$
|
29.9
|
|
$
|
20.3
|
|
||
44
Off-Balance Sheet Arrangements
We do not have any off-balance sheet arrangements.
Contingencies
We are involved with environmental compliance, investigation, monitoring, and remediation activities at certain of our operating facilities or formerly owned manufacturing facilities and accrue for these activities when commitments or remediation plans have been developed and when costs are probable and can be reasonably estimated. Historical annual cash expenditures for these activities have been charged against the related environmental reserves. Future expenditures relating to these environmental remediation efforts are expected to be made over the next
10 years
as ongoing costs of remediation programs. Management believes that any additional liability in excess of amounts accrued, which may result from the resolution of such matters, should not have a material adverse effect on our financial position, liquidity, cash flows or results of operations.
We are occasionally subject to various legal claims related to performance under contracts, product liability, taxes, employment matters, environmental matters, intellectual property, and other matters, several of which claims assert substantial damages, in the ordinary course of our business. Based on our historical experience in litigating these claims, as well as our current assessment of the underlying merits of the claims and applicable insurance, if any, we believe the resolution of these legal claims will not have a material adverse effect on our financial position, liquidity, cash flows or results of operations. Future developments may, however, result in resolution of these legal claims in a way that could have a material adverse effect. See Item 1A. “Risk Factors” and Item 3, “Legal Proceedings” for further information.
Foreign Operations
During
2017
, we had operations in Asia, Australia, Europe, and Latin America, which accounted for approximately
31%
of consolidated sales and
20%
of total assets at
December 31, 2017
. Functional currencies used by these operations include the U.S. dollar, Chinese yuan, the euro, the British pound, and the Japanese yen. We are exposed to foreign currency exchange risk as a result of transactions by these subsidiaries in currencies other than their functional currencies, and from transactions by our domestic operations in currencies other than the U.S. dollar. The majority of these functional currencies and the other currencies in which we record transactions are fairly stable, although we experienced variability in the current year as more fully discussed in Item 7A. The use of these currencies, combined with the use of foreign currency forward purchase and sale contracts, has enabled us to be sheltered from significant gains or losses resulting from foreign currency transactions. This situation could change if these currencies experience significant fluctuations or the volume of forward contracts changes.
Application of Critical Accounting Policies
Our consolidated financial statements have been prepared in accordance with U.S. generally accepted accounting principles and are based on the selection and application of significant accounting policies, which require management to make estimates and assumptions about future events that affect the amounts reported in the financial statements and accompanying notes. Actual results could differ materially from those estimates. Management believes the following are the more critical judgmental areas in the application of its accounting policies that affect its financial position and results of operations.
Goodwill and Indefinite-Lived Intangible Assets.
We evaluate goodwill and indefinite-lived intangible assets for impairment on an annual basis, as of October 1 or whenever events or changes in circumstances indicate that an evaluation should be completed. A significant amount of judgment is involved in determining if an indicator of impairment has occurred. Such indicators may include deterioration in general economic conditions, negative developments in equity and credit markets, a decline in stock price and market capitalization, adverse changes in the markets in which we operate, and a trend of negative or declining cash flows over multiple periods. The fair value that could be realized in an actual transaction may differ from that used to evaluate the impairment of goodwill.
Goodwill is analyzed on a reporting unit basis. The reporting units are the same as our operating and reportable segments: E&C, D&S and BioMedical. We first evaluate qualitative factors, such as macroeconomic conditions and our overall financial performance to determine whether it is more likely than not that the fair value of a reporting unit is less than its carrying amount, including goodwill. We then evaluate how significant each of the identified factors could be to the fair value or carrying amount of a reporting unit and weigh these factors in totality in forming a conclusion of whether or not it is more likely than not that the fair value of a reporting unit is less than its carrying amount (the “Step 0 Test”). If we determine that it is not more likely than not that the fair value of a reporting unit is less than its carrying amount, the first and second steps of the goodwill impairment test are not necessary. Otherwise, we would perform the first step of the two-step goodwill impairment test.
Alternatively, we may also bypass the Step 0 Test and proceed directly to the two-step goodwill impairment test. Under the first step (“Step 1”), we estimate the fair value of our reporting units by considering income and market approaches to develop
45
fair value estimates, which are weighted to arrive at a fair value estimate for each reporting unit. With respect to the income approach, a model has been developed to estimate the fair value of each reporting unit. This fair value model incorporates estimates of future cash flows, estimates of allocations of certain assets and cash flows among reporting units, estimates of future growth rates, and management’s judgment regarding the applicable discount rates to use to discount such estimates of cash flows. With respect to the market approach, a guideline company method is employed whereby pricing multiples are derived from companies with similar assets or businesses to estimate fair value of each reporting unit. If the fair value of the reporting unit exceeds the carrying amount of the net assets assigned to that reporting unit, then goodwill is not impaired and no further testing is required. However, if the fair value of the reporting unit is less than its carrying amount, we perform the second step (“Step 2”) of the goodwill impairment test to measure the amount of impairment loss, if any, to recognize.
In Step 2, the implied fair value of the reporting unit’s goodwill is determined by allocating the reporting unit’s fair value to the assets and liabilities, other than goodwill, in a hypothetical purchase price allocation. The resulting implied fair value is then compared to the carrying amount of the goodwill and if the carrying amount exceeds the implied fair value, an impairment charge is recorded for the difference.
In order to assess the reasonableness of the calculated fair values of our reporting units, we also compare the sum of the reporting units’ fair values to our market capitalization and calculate an implied control premium (the excess of the sum of the reporting units’ fair values over the market capitalization). We evaluate the control premium by comparing it to control premiums of recent comparable transactions. If the implied control premium is not reasonable in light of this assessment, we reevaluate our fair value estimates of the reporting units by adjusting the discount rates and other assumptions as necessary.
Changes to the assumptions and estimates used throughout the steps described above may result in a significantly different estimate of the fair value of the reporting units, which could result in a different assessment of the recoverability of goodwill and result in future impairment charges.
With respect to indefinite-lived intangible assets, we first evaluate relevant events and circumstances to determine whether it is more likely than not that the fair value of an indefinite-lived intangible asset is less than its carrying amount. If, in weighing all relevant events and circumstances in totality, we determine that it is not more likely than not that an indefinite-lived intangible asset is impaired, no further action is necessary. Otherwise, we would determine the fair value of indefinite-lived intangible assets and perform a quantitative impairment assessment by comparing the indefinite-lived intangible asset’s fair value to its carrying amount. We may bypass such a qualitative assessment and proceed directly to the quantitative assessment. We estimate the fair value of our indefinite-lived assets using the income approach. This may include the relief from royalty method or use of a model similar to the one described above related to goodwill which estimates the future cash flows attributed to the indefinite-lived intangible asset and then discounting these cash flows back to a present value. Under the relief from royalty method, fair value is estimated by discounting the royalty savings, as well as any tax benefits related to ownership to a present value. The fair value from either approach is compared to the carrying value and an impairment is recorded if the fair value is determined to be less than the carrying value.
2017 and 2016 Goodwill and Indefinite-Lived Intangible Assets Impairment Assessments
As of October 1, 2017 and 2016 (“annual assessment dates”) we elected to bypass the Step 0 test and based on our Step 1 test, we determined that the fair value of each of our reporting units was greater than its respective carrying value at each annual assessment date and, therefore, the second step of the goodwill impairment test was not necessary. Furthermore, as of the annual assessment dates, we also elected to bypass the qualitative assessment for the indefinite-lived intangible assets and based on our quantitative assessments, we determined that the fair value of each of the indefinite-lived intangible assets was greater than its respective carrying value, therefore, no further action was necessary.
Goodwill at December 31, 2017 and 2016 was
$468.8 million
and $218.0 million (attributed to the segments as follows: E&C -
$275.1 million
and $27.9 million; D&S -
$169.2 million
and $165.5 million; and BioMedical
$24.5 million
and $24.6 million), respectively.
2015 Goodwill and Indefinite-Lived Intangible Assets Impairment Assessment
We performed an interim impairment assessment in the third quarter of 2015 and as a result of that assessment, we noted that the estimated fair values of our D&S and BioMedical reporting units were within 10% to 20% of their carrying values. We anticipated at that time that the fair values of each reporting unit would increase over time; however, as outlined below, projected additional declines in the operating results of each reporting unit (including E&C) were identified in the annual forecasting process in November and December of 2015.
We quantitatively evaluated indefinite-lived intangible assets as part of the impairment testing. As a result of these tests, we recorded goodwill and indefinite-lived intangible asset impairment charges in the fourth quarter of 2015 as management concluded
46
that the goodwill and certain indefinite-lived intangible assets within each reporting unit were impaired. The total goodwill and indefinite-lived impairment charges in the fourth quarter of 2015 were
$207.6 million
(attributed to the segments as follows: E&C -
$65.0 million
, D&S -
$0.3 million
and BioMedical -
$142.3 million
).
Key factors that affected our conclusion that impairment indicators had occurred during the fourth quarter included the continued significant decline in the energy markets, a continued decline in economic activity in China, and the deferral of large capital expenditures by many companies given macroeconomic uncertainties. Each of these factors, as further described below, have a material direct impact on the operating results of our reporting units. These factors contributed significantly to less favorable longer-term forecasted operating results. Management prepares its annual forecast mid-November through December each year. As the 2016 forecast was developed, management considered many factors when assessing the outlook for 2016 and beyond. Because of these factors, management revised its forecasts down significantly, which led to the impairment charges described below. In addition to the items considered for each reporting unit below, management also considered the sustained decline in our market capitalization. Our stock price was $95.64 on December 31, 2013, $34.20 on December 31, 2014 and $17.96 on December 31, 2015.
Based on the results of Step 1, we determined that the E&C and BioMedical reporting units failed Step 1; and, therefore, we performed a Step 2 analysis for these reporting units. Our D&S reporting unit passed the Step 1 test with an estimated fair value within 10% of its carrying value. Discount rates used to present value the forecasted cash flows ranged from 14.0% to 16.5% for the reporting units.
Goodwill and indefinite-lived intangible assets within the E&C reporting unit were impaired
$65.0 million
as a result of revised estimates developed during our annual forecasting process. The revised estimates were the result of the following: 1) continued significant decline in energy prices during the fourth quarter which led to a significant reduction in expected order levels as LNG projects were cancelled or deferred, which impacted our longer-term forecasts; 2) in late 2015, we received notification of delays in major projects from several large customers; and 3) concerns with global growth, recent negative macroeconomic developments and highly competitive market conditions.
Indefinite-lived intangible assets within the D&S reporting unit were impaired
$0.3 million
as a result of revised estimates developed during our annual forecasting process.
Goodwill and indefinite-lived intangible assets within the BioMedical reporting unit were impaired
$142.3 million
as a result of revised estimates developed during our annual forecasting process. The revised estimates were the result of the following: 1) realization that the effects of Medicare competitive bidding, including the reduction of reimbursement rates and the subsequent consolidation of our customers, can no longer be considered temporary and will have lasting negative impacts on the growth of the homecare industry and their suppliers; 2) increased rivalry with competitive technology; and 3) concerns with global growth and recent negative macroeconomic developments.
Remaining goodwill at December 31, 2015 was
$218.0 million
(attributed to the segments as follows: E&C -
$27.9 million
, D&S -
$165.5 million
, and BioMedical -
$24.6 million
). Remaining indefinite-lived intangible assets at December 31, 2015 were
$35.6 million
. A significant amount of judgment was used in the analyses prepared for goodwill and indefinite-lived impairment testing.
Long-Lived Assets.
We monitor our property, plant and equipment, and finite-lived intangible assets for impairment indicators on an ongoing basis. If impairment indicators exist, assets are grouped and tested at the lowest level for which identifiable cash flows are available and we perform the required analysis and record impairment charges if applicable. In conducting its analysis, we compare the undiscounted cash flows expected to be generated from the long-lived assets to the related net book values. If the undiscounted cash flows exceed the net book value, the long-lived assets are considered not to be impaired. If the net book value exceeds the undiscounted cash flows, an impairment loss is measured and recognized. An impairment loss is measured as the difference between the net book value and the fair value of the long-lived assets. Fair value is estimated from discounted future net cash flows (for assets held for use) or net realizable value (for assets held for sale). In assessing the recoverability of our long-lived assets, a significant amount of judgment is involved in estimating the future cash flows, discount rates and other factors necessary to determine the fair value of the respective assets. If these estimates or the related assumptions change in the future, we may be required to record impairment charges for these assets in the period such determination was made. We amortize intangible assets that have finite lives over their estimated useful lives.
47
2017 Long-Lived Asset Impairments
:
None.
2016 Long-Lived Asset Impairments
:
During the third quarter of 2016, we identified impairment indicators that suggested the carrying value of a certain asset group in China within the D&S segment may not be recoverable. The primary impairment indicators included recently completed projections of future cash flows and the associated impact on the long-range strategic plan forecasts, lower than expected cash flows attributed to this asset group and poor market conditions. An undiscounted cash flow test performed for this asset group indicated it was not recoverable. The fair value of the asset group was established using a discounted cash flow model which utilized Level 3 inputs in the fair value hierarchy. As a result of the long-lived asset impairment assessment performed, we recorded long-lived asset impairment charges on our D&S reporting unit of $1.2 million. The impairment charges were $0.5 million related to finite-lived intangible assets and $0.7 million related to tangible property, plant and equipment. There were no remaining long-lived assets recorded on the consolidated balance sheet for this asset group as of December 31, 2016.
Additionally, during the third quarter of 2016, events and circumstances indicated that other tangible property, plant and equipment in China within our D&S segment might be impaired. However, our estimate of undiscounted cash flows indicated that such carrying values were expected to be recovered. Nonetheless, it is reasonably possible that the estimate of undiscounted cash flows may negatively change in the near term, which may result in the need to write down these assets to fair value. Our estimate of cash flows may change in the future due to poor market conditions and excess capacity in the industry.
2015 Long-Lived Asset Impairments
:
During the fourth quarter of 2015, we identified impairment indicators described above in the
Goodwill and Indefinite-Lived Intangible Assets
section that suggested the carrying values of certain asset groups within each segment may not be recoverable. The primary indicators included projections of future cash flows and the associated impact on our long-range strategic plan forecasts, lower than expected cash flows attributed to certain asset groups, increased competition, the continued decline in energy prices, and lower market capitalization. As a result of the analyses, we recorded
$38.1 million
of impairment charges for finite-lived intangible assets related to the BioMedical segment (attributed to customer relationships –
$15.7 million
and unpatented technology –
$22.4 million
). We also impaired
$3.9 million
of BioMedical property, plant and equipment. The BioMedical impairment charges were due to reductions in expected future cash flows associated with the respiratory product lines. We impaired
$3.8 million
of E&C property, plant and equipment due to reductions in expected future cash flows associated with certain assets in China. The results of impairment analyses in 2015 for other asset groups in the D&S and E&C segments indicated recoverability of their carrying value.
Convertible Debt.
We determined that the conversion option within our 2.00% Convertible Senior Subordinated Notes due August 2018 and 1.00% Convertible Senior Subordinated Notes due November 2024 (together, the “Convertible Notes”) was not clearly and closely related to the debt instrument host, however, the conversion option met a scope exception to derivative instrument accounting since the conversion feature is indexed to the our common stock and meets equity classification criteria. Convertible debt instruments exempt from derivative accounting and subject to cash settlement of the conversion option are recognized by bifurcating the principal balance into a liability component and an equity component where the fair value of the liability component is estimated by calculating the present value of its cash flows discounted at an interest rate that we would have received for similar debt instruments that have no conversion rights (the “straight-debt rate”), and the equity component is the residual amount, net of tax, which creates a discount on the Convertible Notes. We recognize non-cash interest accretion expense related to the carrying amount of the Convertible Notes which is accreted back to its principal amount over the expected life of the debt, which is also the stated life of the debt.
Business Combinations
. We account for business combinations using the acquisition method. The purchase price is allocated, separately from goodwill, to the identifiable assets acquired and liabilities assumed based on their estimated fair values. The excess of the purchase price over the fair value of the net assets acquired, including identifiable intangible assets, is assigned to goodwill. As additional information becomes available, we may further revise the preliminary acquisition consideration allocation during the remainder of the measurement period, which shall not exceed twelve months from the closing of the acquisition.
Identifiable finite-lived intangible assets generally consist of customer relationships, unpatented technology, patents and trademarks and trade names and are amortized over their estimate useful lives which generally range from 2 to 15 years. Identifiable indefinite-lived intangible assets generally consist of trademarks and trade names and are subject to impairment testing on at least an annual basis. We estimate the fair value of identifiable intangible assets under income approaches where the fair value models incorporate estimates of future cash flows, estimates of allocations of certain assets and cash flows, estimates of future growth rates, and management’s judgment regarding the applicable discount rates to use to discount such estimates of cash flows.
We expense acquisition-related costs, including legal, consulting, accounting and other costs, in the periods in which the costs are incurred.
Defined Benefit Pension Plans.
We sponsor two defined benefit pension plans including the Chart Pension Plan, which has been frozen since February 2006, and a noncontributory defined benefit plan that we acquired as part of the Hudson acquisition
48
(the “Hudson Plan”). The Hudson Plan is closed to new participants and not considered significant to our consolidated financial statements. Critical accounting estimates related to the Chart Pension Plan are discussed below:
The funded status is measured as the difference between the fair value of the plan assets and the projected benefit obligation. We recognize the change in the funded status of the plan in the year in which the change occurs through accumulated other comprehensive loss. Our funding policy is to contribute at least the minimum funding amounts required by law. We have chosen policies according to accounting guidance that allow the use of a calculated value of plan assets (which is further described below), which generally reduces the volatility of expense (income) from changes in pension liability discount rates and the performance of the pension plans’ assets.
A significant element in determining our pension expense in accordance with accounting guidance is the expected return on plan assets. We have assumed that the expected long-term rate of return on plan assets as of
December 31, 2017
and
2016
was
7.0%
and
7.0%
, respectively. The expected return assumptions were developed using an averaging formula based upon the plans’ investment guidelines, mix of asset classes, historical returns of equities and bonds, and expected future returns. We believe our assumptions for expected future returns are reasonable. However, we cannot guarantee that we will achieve these returns in the future. The assumed long-term rate of return on assets is applied to the market value of plan assets. This produces the expected return on plan assets that reduces pension expense. The difference between this expected return and the actual return on plan assets is deferred. The net deferral of past asset gains or losses affects future net periodic pension expense.
At the end of each year, we determine the rate to be used to discount plan liabilities. The discount rate reflects the current rate at which the pension liabilities could be effectively settled at the end of the year. In estimating this rate, we look to rates of return on high quality, fixed-income investments that receive one of the two highest ratings given by a recognized rating agency and the expected timing of benefit payments under the plan. At
December 31, 2017
and
2016
, we determined this rate to be
3.7%
and
4.0%
, respectively. Changes in discount rates over the past three years have not materially affected pension expense (income), and the net effect of changes in the discount rate, as well as the net effect of other changes in actuarial assumptions and experience, have been deferred and amortized over the expected future service of participants.
Assumptions as to the mortality of the plan participants is a key estimate in measuring expected payments a participant may receive over their lifetime and therefore, the amount of pension expense we will recognize. During 2014, the Society of Actuaries released a series of updated mortality tables resulting from recent studies conducted by them measuring mortality rates for various groups of individuals. In subsequent years, the Society of Actuaries updated the mortality tables which reflected additional improvements in mortality than the 2014 mortality tables. The updated mortality tables reflected improved trends in longevity and therefore have had the effect of increasing the estimate of benefits to be received by the plan participants. We adopted these updated assumptions which did not have a significant impact on the benefit obligation at
December 31, 2017
and
2016
.
At
December 31, 2017
, our consolidated net pension liability recognized was
$8.5 million
,
a decrease
of
$5.9 million
from
December 31, 2016
. This decrease in the liability was due to improved pension asset returns, as well as a contribution of
$3.0 million
during 2017. Benefit payments were
$2.3 million
in
2017
. We recognized approximately
$0.6 million
,
$1.0 million
and
$0.5 million
in net periodic pension expense for the years ended
December 31, 2017
, 2016 and 2015, respectively. See
Note 15
to our consolidated financial statements included elsewhere in this report for further information.
Product Warranties.
We provide product warranties with varying terms and durations for the majority of our products. We estimate product warranty costs and accrue for these costs as products are sold with a charge to cost of sales. Factors considered in estimating warranty costs include historical and projected warranty claims, historical and projected cost-per-claim and knowledge of specific product issues that are outside of our typical experience. Warranty accruals are evaluated and adjusted as necessary based on actual claims experience and changes in future claim and cost estimates.
During 2016, we recovered for breaches of representations and warranties primarily related to warranty costs for certain product lines acquired in the acquisition of AirSep under the related representation and warranty insurance. This reduced our BioMedical segment’s cost of sales by
$15.2 million
.
Changes in assumptions used to calculate the warranty reserve estimates, including the number of expected warranty claims, the costs of satisfying those claims, or other issues, could materially affect our financial position and results from operations in future periods.
Revenue Recognition — Long-Term Contracts.
We recognize revenue and gross profit as work on certain long-term contracts progresses using the percentage of completion method of accounting, which relies on estimates of total expected contract revenues and costs. We follow this method since reasonably dependable estimates of the revenue and costs applicable to various stages of a contract can be made. Since the financial reporting of these contracts depends on estimates, which are assessed continually during the term of the contract, recognized revenues and profit are subject to revisions as the contract progresses toward completion. Revisions in profit estimates are reflected in the period in which the facts that give rise to the revision become known. Accordingly,
49
favorable changes in estimates result in additional profit recognition, and unfavorable changes will result in the reversal of previously recognized revenue and profits. When estimates indicate a loss is expected to be incurred under a contract, cost of sales is charged with a provision for the full loss immediately. As work progresses under a loss contract, revenue and cost of sales continue to be recognized in equal amounts, and the excess of costs over revenues is charged to the contract loss reserve. Change orders resulting in additional revenue and profit are recognized upon approval by the customer based on the percentage that incurred costs to date bear to total estimated costs at completion. Pre-contract costs relate primarily to salaries and benefits incurred to support the selling effort and, accordingly, are expensed as incurred. Certain contracts include incentive-fee arrangements clearly defined in the agreement and are not recognized until earned. The percentage of completion method of accounting is primarily used in the E&C segment, although it is used on certain contracts in our D&S and BioMedical segments.
Income Taxes.
The Company and its U.S. subsidiaries file a consolidated federal income tax return. Deferred income taxes are provided for temporary differences between financial reporting and the consolidated tax return in accordance with the liability method. A valuation allowance is provided against net deferred tax assets when conditions indicate that it is more likely than not that the benefit related to such assets will not be realized. In assessing the need for a valuation allowance against deferred tax assets, we consider all available evidence, including past operating results, estimates of future taxable income, and the feasibility of tax planning strategies. In the event that we change our determination as to the amount of deferred tax assets that can be realized, the valuation allowance will be adjusted with a corresponding impact to the provision for income taxes in the period in which such determination is made.
We utilize a two-step approach for the recognition and measurement of uncertain tax positions. The first step is to evaluate the tax position and determine whether it is more likely than not that the position will be sustained upon examination by tax authorities. The second step is to measure the tax benefit as the largest amount that is more likely than not of being realized upon settlement.
Interest and penalties related to income taxes are accounted for as income tax (benefit) expense, net on the consolidated statements of operations.
We have accounted for the tax effects of the Tax Cuts and Jobs Act, which was signed into law on December 22, 2017, on a provisional basis. Our accounting for certain income tax effects is incomplete, but we have determined reasonable estimates for those effects and have recorded provisional amounts in our financial statements as of December 31, 2017. As we complete our analysis of the Tax Cuts and Jobs Act, further collect and analyze data, interpret any additional guidance issued by the U.S. Treasury Department, the Internal Revenue Service, and other standard-setting bodies, we may make adjustments to the provisional amounts. Those adjustments may materially impact our provision for income taxes in the period in which the adjustments are made.
Recent Accounting Standards
Refer to the Significant Accounting Policies note (
Note 2
) to our consolidated financial statements included elsewhere in this report for disclosure regarding recent accounting standards.
50
Forward-Looking Statements
We are making this statement in order to satisfy the “safe harbor” provisions contained in the Private Securities Litigation Reform Act of 1995. This Annual Report on Form 10-K includes “forward-looking statements.” These forward-looking statements include statements relating to our business. In some cases, forward-looking statements may be identified by terminology such as “may,” “should,” “expects,” “anticipates,” “believes,” “projects,” “forecasts,” “continue” or the negative of such terms or comparable terminology. Forward-looking statements contained herein (including future cash contractual obligations, liquidity, cash flow, orders, results of operations, projected revenues, and trends, among other matters) or in other statements made by us are made based on management’s expectations and beliefs concerning future events impacting us and are subject to uncertainties and factors relating to our operations and business environment, all of which are difficult to predict and many of which are beyond our control, that could cause our actual results to differ materially from those matters expressed or implied by forward-looking statements.
The risk factors discussed in Item 1A. “Risk Factors” and the factors discussed in Item 7. “Management’s Discussion and Analysis of Financial Condition and Results of Operations,” among others, could affect our future performance and liquidity and value of our securities and could cause our actual results to differ materially from those expressed or implied by forward-looking statements made by us or on our behalf. These factors should not be construed as exhaustive and there may also be other risks that we are unable to predict at this time. All forward-looking statements included in this Report are expressly qualified in their entirety by these cautionary statements.
All forward-looking statements attributable to us or persons acting on our behalf apply only as of the date of this Annual Report and are expressly qualified in their entirety by the cautionary statements included in this Annual Report. We undertake no obligation to update or revise forward-looking statements which may be made to reflect events or circumstances that arise after the filing date of this document or to reflect the occurrence of unanticipated events, except as otherwise required by law.
51
|
Item 7A.
|
Quantitative and Qualitative Disclosures About Market Risk
|
In the normal course of business, our operations are exposed to fluctuations in interest rates and foreign currency values that can affect the cost of operating and financing. Accordingly, we address a portion of these risks through a program of risk management.
Interest Rate Risk:
Our primary interest rate risk exposure results from the SSRCF’s various floating rate pricing mechanisms. If interest rates were to increase 200 basis points (2 percent) from the weighted-average interest rate of
4.00%
at December 31, 2017, and assuming no changes in the
$239.0 million
of borrowings outstanding under the SSRCF at December 31, 2017, our additional annual expense would be approximately
$4.8 million
on a pre-tax basis.
Foreign Currency Exchange Rate Risk:
We operate in the United States and other foreign countries, which creates exposure to foreign currency exchange fluctuations in the normal course of business, which can impact our financial position, results of operations, cash flow, and competitive position. The financial statements of foreign subsidiaries are translated into their U.S. dollar equivalents at end-of-period exchange rates for assets and liabilities, while income and expenses are translated at average monthly exchange rates. Translation gains and losses are components of other comprehensive income (loss) as reported in the consolidated statements of comprehensive income (loss). Translation exposure is primarily with the euro, the Czech koruna, the Chinese yuan, and the J
apa
nese yen. During 2017, the Chinese yuan and euro increased in relation to the U.S. dollar by 6% and 12%, respectively. During 2017, the Japanese yen decreased in relation to the U.S. dollar by 3%. At
December 31, 2017
, a hypothetical further 10% strengthening of the U.S. dollar would not materially affect our financial statements.
Chart’s primary transaction exchange rate exposures are with the euro, the Japanese yen, the Czech koruna, the Australian dollar, the British pound, and the Chinese yuan. Transaction gains and losses arising from fluctuations in currency exchange rates on transactions denominated in currencies other than the functional currency are recognized in the consolidated statements of operations as a component of foreign currency loss. We enter into foreign exchange forward contracts to hedge anticipated and firmly committed foreign currency transactions. We do not use derivative financial instruments for speculative or trading purposes. The terms of the contracts are generally one year or less. At
December 31, 2017
, a hypothetical 10% weakening of the U.S. dollar would not materially affect our outstanding foreign exchange forward contracts.
Market Price Sensitive Instruments
In connection with the pricing of the 2024 Notes, we entered into privately-negotiated convertible note hedge transactions (the “Note Hedge Transactions”) with certain parties, including affiliates of the initial purchasers of the 2024 Notes (the “Option Counterparties”). We also entered into privately-negotiated convertible note hedge and capped call transactions related to the 2018 Notes (together with the Note Hedge Transactions, the “Convertible Notes Hedge Transactions”) with affiliates of certain of the underwriters (together with the Option Counterparties, the “Convertible Notes Counterparties”). These Convertible Note Hedge Transactions are expected to reduce the potential dilution upon any future conversion of our convertible debt.
We also entered into separate, privately-negotiated warrant transactions with the Convertible Notes Counterparties to acquire up to 5.2 million shares of our common stock. The warrant transactions will have a dilutive effect with respect to our common stock to the extent that the price per share of our common stock exceeds the strike price of the warrants unless we elect, subject to certain conditions, to settle the warrants in cash. The strike price of the warrant transactions related to the 2024 Notes was initially $71.775 per share. The cap price of the capped call transactions and the strike price of the warrant transactions related to the 2018 Notes was initially $84.96 per share. Further information is located in
Note 7
to our consolidated financial statements included in Item 8 of this Annual Report on Form 10-K.
52
|
Item 8.
|
Financial Statements and Supplementary Data
|
Our Financial Statements and the accompanying Notes that are filed as part of this Annual Report are listed under Item 15. “Exhibits and Financial Statement Schedules” and are set forth beginning on page F-1 immediately following the signature page of this Form 10-K and are incorporated into this Item 8 by reference.
|
Item 9.
|
Changes in and Disagreements With Accountants on Accounting and Financial Disclosure
|
None.
|
Item 9A.
|
Controls and Procedures
|
Evaluation of Disclosure Controls and Procedures
As of
December 31, 2017
, an evaluation was performed under the supervision and with the participation of our management including our Chief Executive Officer and Chief Financial Officer, of the effectiveness of the design and operation of our disclosure controls and procedures pursuant to Rule 13a-15 under the Securities and Exchange Act of 1934, as amended (the “Exchange Act”). Based upon that evaluation, such officers concluded that our disclosure controls and procedures are effective to ensure that information required to be disclosed by us in the reports we file or submit under the Exchange Act (1) is recorded, processed, summarized and reported within the time periods specified in the Securities and Exchange Commission’s rules and forms and (2) is accumulated and communicated to our management including the Chief Executive Officer and Chief Financial Officer, as appropriate to allow for timely decisions regarding required disclosure.
Management’s Report on Internal Control Over Financial Reporting
Management’s Report on Internal Control Over Financial Reporting is set forth on page F-1 of this Annual Report on Form 10-K and incorporated herein by reference. Management used the updated Internal Control-Integrated Framework (2013) issued by the Committee of Sponsoring Organizations of the Treadway Commission to perform the evaluation.
The effectiveness of our internal control over financial reporting as of
December 31, 2017
has been audited by Ernst & Young LLP, an independent registered public accounting firm, as stated in our report which is set forth in Item 8. “Financial Statements and Supplementary Data,” on page F-3 under the caption “Report of Independent Registered Public Accounting Firm” and incorporated herein by reference.
Our evaluation of the effectiveness of our internal control over financial reporting as of December 31, 2017 did not include the internal control of Hudson because it was acquired in a business combination in September 2017. Pursuant to SEC guidance, an assessment of a recently acquired business may be omitted in management’s report on internal control over financial reporting in the year of the acquisition. Hudson constituted approximately
33%
and
52%
of our total assets and net assets, respectively, at December 31, 2017 and approximately
6%
and
1%
of sales and net income, respectively, for the year ended December 31, 2017.
Changes in Internal Control over Financial Reporting
There were no changes in our internal control over financial reporting that occurred during our most recent fiscal quarter that have materially affected, or are reasonably likely to materially affect, our internal control over financial reporting.
|
Item 9B.
|
Other Information
|
Not applicable.
53
|
Item 10.
|
Directors, Executive Officers and Corporate Governance
|
Information required by this item as to the Directors of the Company appearing under the caption “Election of Directors” in our
2018
Proxy Statement is incorporated herein by reference. Information required by this item as to the Executive Officers of the Company is included as Item 4A of this Annual Report on Form 10-K as permitted by Instruction 3 to Item 401(b) of Regulation S-K. Information required by Item 405 is set forth in the
2018
Proxy Statement under the heading “Section 16(a) Beneficial Ownership Reporting Compliance,” which information is incorporated herein by reference. Information required by Items 406 and 407(c)(3), (d)(4) and (d)(5) of Regulation S-K is set forth in the
2018
Proxy Statement under the headings “Information Regarding Meetings and Committees of the Board of Directors,” “Code of Ethical Business Conduct and Officer Code of Ethics” and “Stockholder Communications with the Board,” which information is incorporated herein by reference.
The Charters of the Audit Committee, Compensation Committee and Nominations and Corporate Governance Committee and the Corporate Governance Guidelines, Officer Code of Ethics and Code of Ethical Business Conduct are available free of charge
on our website at www.chartindustries.com and in print to any stockholder who requests a copy. Requests for copies should be directed to Secretary, Chart Industries, Inc., 3055 Torrington Drive, Ball Ground, Georgia 30107. We intend to disclose any amendments to the Code of Ethical Business Conduct or Officer Code of Ethics and any waiver of the Code of Ethical Business Conduct or Officer Code of Ethics granted to any Director or Executive Officer of the Company on our website.
Set forth below is a list of the members of our Board of Directors as of February 22, 2018:
|
Directors
|
|
SAMUEL F. THOMAS
(1)
|
|
Executive Chairman of the Board
|
|
Chart Industries, Inc.
|
|
WILLIAM C. JOHNSON
|
|
President and Chief Executive Officer
|
|
Chart Industries, Inc.
|
|
W. DOUGLAS BROWN
(2) (3)
|
|
Retired Vice President, General Counsel and Secretary
|
|
Air Products and Chemicals, Inc.
|
|
Supplier of industrial gases, performance materials, and equipment and services
|
|
RICHARD E. GOODRICH
(2) (4)
|
|
Retired Executive Vice President and Chief Financial Officer
|
|
Chicago Bridge & Iron Company N.V.
|
|
Engineering, procurement and construction company
|
|
TERRENCE J. KEATING
(3) (4)
|
|
Retired President, Chief Executive Officer and Chairman of Accuride Corporation
|
|
Manufacturer and supplier of commercial vehicle components
|
|
STEVEN W. KRABLIN
(2) (3) (5)
|
|
Retired President, Chief Executive Officer and Chairman of the Board
|
|
T-3 Energy Services, Inc.
|
|
Oilfield services company that manufactures products used in the drilling, production and transportation of oil and gas
|
54
|
MICHAEL L. MOLININI
(2)
|
|
Retired Chief Executive Officer and President
|
|
Airgas, Inc.
|
|
Supplier of gases, welding equipment and supplies, and safety products
|
|
ELIZABETH G. SPOMER
(3) (4)
|
|
Executive Vice President
|
|
Veresen Inc.
|
|
President and Chief Executive Officer
|
|
Jordan Cove LNG LLC, a wholly owned subsidiary of Veresen, Inc.
|
|
Diversified energy infrastructure company
|
|
THOMAS L. WILLIAMS
(2) (3)
|
|
Chairman of the Board and Chief Executive Officer
|
|
Parker Hannifin Corporation
|
|
Manufacturer of motion and control products
|
_______________
|
(1)
|
Mr. Thomas will retire from his position as Executive Chairman effective as of our May 25, 2018 Annual Meeting of Stockholders.
|
|
(2)
|
Compensation Committee
|
|
(3)
|
Nominations and Corporate Governance Committee
|
|
(4)
|
Audit Committee
|
|
(5)
|
Lead Independent Director
|
55
|
Item 11.
|
Executive Compensation
|
The information required by Item 402 of Regulation S-K is set forth in the
2018
Proxy Statement under the heading “Executive and Director Compensation,” which information is incorporated herein by reference. The information required by Items 407(e)(4) and 407(e)(5) of Regulation S-K is set forth in the
2018
Proxy Statement under the headings “Compensation Committee Interlocks and Insider Participation” and “Compensation Committee Report,” respectively, which information is incorporated herein by reference.
|
Item 12.
|
Security Ownership of Certain Beneficial Owners and Management and Related Stockholder Matters
|
The information required by this item is set forth in the
2018
Proxy Statement under the headings “Security Ownership of Certain Beneficial Owners” and “Equity Compensation Plan Information,” which information is incorporated herein by reference.
|
Item 13.
|
Certain Relationships, Related Transactions, and Director Independence
|
The information required by this item is set forth in the
2018
Proxy Statement under the headings “Related Party Transactions” and “Director Independence,” which information is incorporated herein by reference.
|
Item 14.
|
Principal Accounting Fees and Services
|
The information required by this item is set forth in the
2018
Proxy Statement under the heading “Principal Accounting Fees and Services,” which information is incorporated herein by reference.
56
|
Item 15.
|
Exhibits and Financial Statement Schedules
|
(a) The following documents are filed as part of this
2017
Annual Report on Form 10-K:
1.
Financial Statements.
The following consolidated financial statements of the Company and its subsidiaries and the reports of the Company’s independent registered public accounting firm are incorporated by reference in Item 8:
Management’s Report on Internal Control over Financial Reporting
Reports of Independent Registered Public Accounting Firm
Consolidated Balance Sheets at
December 31, 2017
and
2016
Consolidated Statements of Operations for the Years Ended December 31,
2017, 2016 and 2015
Consolidated Statements of Comprehensive Income (Loss) for the Years Ended December 31,
2017, 2016 and 2015
Consolidated Statements of Cash Flows for the Years Ended December 31,
2017, 2016 and 2015
Consolidated Statements of Equity for the Years Ended December 31,
2017, 2016 and 2015
Notes to Consolidated Financial Statements
2.
Financial Statement Schedules
. The following additional information should be read in conjunction with the consolidated financial statements:
Schedule II Valuation and Qualifying Accounts for the Years Ended December 31,
2017, 2016 and 2015
All other financial statement schedules have been omitted since they are either not required, not applicable, or the information is otherwise included.
3.
Exhibits
. See the Index to Exhibits at page E-1 of this Annual Report on Form 10-K.
Item 16.
Form 10–K Summary
None.
57
SIGNATURES
Pursuant to the requirements of Section 13 or 15(d) of the Securities Exchange Act of 1934, the Registrant has duly caused this report to be signed on its behalf by the undersigned, thereunto duly authorized.
|
Chart Industries, Inc.
|
||
|
By:
|
/s/ William C. Johnson
|
|
|
William C. Johnson
Chief Executive Officer and President
(Principal Executive Officer)
|
||
Date:
February 22, 2018
Pursuant to the requirements of the Securities Exchange Act of 1934, this report has been signed below by the following persons on behalf of the Registrant and in the capacities and on the dates indicated.
|
By:
|
||
|
/s/ Samuel F. Thomas
|
Executive Chairman of the Board, Director
|
|
|
Samuel F. Thomas
|
||
|
/s/ William C. Johnson
|
Chief Executive Officer and President, Director
|
|
|
William C. Johnson
|
||
|
/s/ Jillian C. Evanko
|
Vice President, Chief Financial Officer,
Chief Accounting Officer and Treasurer
(Principal Financial Officer and Principal Accounting Officer)
|
|
|
Jillian C. Evanko
|
||
|
/s/ W. Douglas Brown
|
Director
|
|
|
W. Douglas Brown
|
||
|
/s/ Richard E. Goodrich
|
Director
|
|
|
Richard E. Goodrich
|
||
|
/s/ Terrence J. Keating
|
Director
|
|
|
Terrence J. Keating
|
||
|
/s/ Steven W. Krablin
|
Director
|
|
|
Steven W. Krablin
|
||
|
/s/ Michael L. Molinini
|
Director
|
|
|
Michael L. Molinini
|
||
|
/s/ Elizabeth G. Spomer
|
Director
|
|
|
Elizabeth G. Spomer
|
||
|
/s/ Thomas L. Williams
|
Director
|
|
|
Thomas L. Williams
|
||
Date:
February 22, 2018
58
INDEX TO FINANCIAL STATEMENTS
|
Audited Consolidated Financial Statements:
|
|
|
|
|
||
|
|
||
|
|
||
|
|
||
|
|
||
|
|
||
|
|
||
59
MANAGEMENT’S REPORT ON INTERNAL CONTROL OVER
FINANCIAL REPORTING
Management of Chart Industries, Inc. and its subsidiaries (the “Company”) is responsible for establishing and maintaining adequate internal control over financial reporting. The Company’s internal control over financial reporting is a process designed under the supervision of the Company’s principal executive and financial officers to provide reasonable assurance regarding the reliability of financial reporting and the preparation of the Company’s financial statements for external reporting purposes in accordance with U.S. generally accepted accounting principles.
The Company’s internal control over financial reporting includes policies and procedures that:
|
•
|
Pertain to the maintenance of records that, in reasonable detail, accurately and fairly reflect transactions and dispositions of assets of the Company;
|
|
•
|
Provide reasonable assurance that transactions are recorded as necessary to permit preparation of financial statements in accordance with U.S. generally accepted accounting principles, and that receipts and expenditures of the Company are being made only in accordance with authorizations of management and the directors of the Company; and
|
|
•
|
Provide reasonable assurance regarding prevention or timely detection of unauthorized acquisition, use or disposition of the Company’s assets that could have a material effect on the Company’s financial statements.
|
Because of its inherent limitations, internal control over financial reporting may not prevent or detect misstatements. Also, projections of any evaluation of effectiveness to future periods are subject to the risk that controls may become inadequate because of changes in conditions, or that the degree of compliance with the policies and procedures may deteriorate.
Management has assessed the effectiveness of its internal control over financial reporting as of
December 31, 2017
based on the framework established in Internal Control — Integrated Framework issued by the Committee of Sponsoring Organizations of the Treadway Commission (2013 Framework) (the “COSO criteria”).
The Company’s evaluation of the effectiveness of the Company’s internal control over financial reporting as of December 31, 2017 did not include the internal control of RCHPH Holdings, Inc. (“Hudson”) because it was acquired in a business combination in September 2017. Pursuant to SEC guidance, an assessment of a recently acquired business may be omitted in management’s report on internal control over financial reporting in the year of the acquisition. Hudson constituted approximately
33%
and
52%
of the Company’s total assets and net assets, respectively, at December 31, 2017 and approximately
6%
and
1%
of sales and net income, respectively, for the year ended December 31, 2017.
Based on this assessment, management has determined that the Company’s internal control over financial reporting is effective as of
December 31, 2017
.
The effectiveness of the Company’s internal control over financial reporting as of
December 31, 2017
has been audited by Ernst & Young LLP, an independent registered public accounting firm, as stated in their report appearing below, which expresses an unqualified opinion on the effectiveness of the Company’s internal control over financial reporting as of
December 31, 2017
.
|
/s/ William C. Johnson
|
/s/ Jillian C. Evanko
|
|
|
William C. Johnson
|
Jillian C. Evanko
|
|
|
Chief Executive Officer and President
|
Vice President, Chief Financial Officer, Chief Accounting Officer and Treasurer
|
|
F-1
REPORT OF INDEPENDENT REGISTERED PUBLIC ACCOUNTING FIRM
To the Shareholders and the Board of Directors of
Chart Industries, Inc. and Subsidiaries
Opinion on the Financial Statements
We have audited the accompanying consolidated balance sheets of Chart Industries, Inc. and Subsidiaries (the Company) as of December 31,
2017
and
2016
, the related consolidated statements of operations, comprehensive income (loss), equity and cash flows for each of the three years in the period ended December 31,
2017
, and the related notes and the financial statement schedule listed in the index at Item 15(a) 2 (collectively referred to as the “consolidated financial statements”). In our opinion, the consolidated financial statements present fairly, in all material respects, the financial position of the Company at December 31,
2017
and
2016
, and the results of its operations and its cash flows for each of the three years in the period ended December 31,
2017
, in conformity with U.S. generally accepted accounting principles.
We also have audited, in accordance with the standards of the Public Company Accounting Oversight Board (United States) (PCAOB), the Company's internal control over financial reporting as of December 31,
2017
, based on criteria established in Internal Control-Integrated Framework issued by the Committee of Sponsoring Organizations of the Treadway Commission (2013 framework) and our report dated
February 22, 2018
expressed an unqualified opinion thereon.
Basis for Opinion
These financial statements are the responsibility of the Company’s management. Our responsibility is to express an opinion on the Company’s financial statements based on our audits. We are a public accounting firm registered with the PCAOB and are required to be independent with respect to the Company in accordance with the U.S. federal securities laws and the applicable rules and regulations of the Securities and Exchange Commission and the PCAOB.
We conducted our audits in accordance with the standards of the PCAOB. Those standards require that we plan and perform the audit to obtain reasonable assurance about whether the financial statements are free of material misstatement, whether due to error or fraud. Our audits included performing procedures to assess the risks of material misstatement of the financial statements, whether due to error or fraud, and performing procedures that respond to those risks. Such procedures included examining, on a test basis, evidence regarding the amounts and disclosures in the financial statements. Our audits also included evaluating the accounting principles used and significant estimates made by management, as well as evaluating the overall presentation of the financial statements. We believe that our audits provide a reasonable basis for our opinion.
/s/ Ernst & Young LLP
We have served as the Company’s auditor since 1991.
Atlanta, Georgia
February 22, 2018
F-2
REPORT OF INDEPENDENT REGISTERED PUBLIC ACCOUNTING FIRM
To the Shareholders and the Board of Directors of
Chart Industries, Inc. and Subsidiaries
Opinion on Internal Control over Financial Reporting
We have audited Chart Industries, Inc. and Subsidiaries’ internal control over financial reporting as of December 31,
2017
, based on criteria established in Internal Control-Integrated Framework issued by the Committee of Sponsoring Organizations of the Treadway Commission (2013 framework) (the COSO criteria). In our opinion, Chart Industries, Inc. and Subsidiaries (the Company) maintained, in all material respects, effective internal control over financial reporting as of December 31,
2017
, based on the COSO criteria.
As indicated in the accompanying Management’s Report on Internal Control Over Financial Reporting, management’s assessment of and conclusion on the effectiveness of internal control over financial reporting did not include the internal controls of RCHPH Holdings, Inc. (“Hudson”), which is included in the
2017
consolidated financial statements of the Company and constituted
33%
and
52%
of total and net assets, respectively, as of December 31,
2017
and
6%
and
1%
of sales and net income, respectively, for the year then ended. Our audit of internal control over financial reporting of the Company also did not include an evaluation of internal control over financial reporting of Hudson.
We also have audited, in accordance with the standards of the Public Company Accounting Oversight Board (United States) (PCAOB), the consolidated balance sheets of the Company as of December 31,
2017
and
2016
, and the related consolidated statements of operations, comprehensive income (loss), equity, and cash flows for each of the three years in the period ended December 31,
2017
, and the related notes and the financial statement schedule listed in the index at Item 15(a) 2 and our report dated
February 22, 2018
expressed an unqualified opinion thereon.
Basis for Opinion
The Company’s management is responsible for maintaining effective internal control over financial reporting and for its assessment of the effectiveness of internal control over financial reporting included in the accompanying Management’s Report on Internal Control Over Financial Reporting. Our responsibility is to express an opinion on the Company’s internal control over financial reporting based on our audit. We are a public accounting firm registered with the PCAOB and are required to be independent with respect to the Company in accordance with the U.S. federal securities laws and the applicable rules and regulations of the Securities and Exchange Commission and the PCAOB.
We conducted our audit in accordance with the standards of the PCAOB. Those standards require that we plan and perform the audit to obtain reasonable assurance about whether effective internal control over financial reporting was maintained in all material respects.
Our audit included obtaining an understanding of internal control over financial reporting, assessing the risk that a material weakness exists, testing and evaluating the design and operating effectiveness of internal control based on the assessed risk, and performing such other procedures as we considered necessary in the circumstances. We believe that our audit provides a reasonable basis for our opinion.
Definition and Limitations of Internal Control Over Financial Reporting
A company’s internal control over financial reporting is a process designed to provide reasonable assurance regarding the reliability of financial reporting and the preparation of financial statements for external purposes in accordance with generally accepted accounting principles. A company’s internal control over financial reporting includes those policies and procedures that (1) pertain to the maintenance of records that, in reasonable detail, accurately and fairly reflect the transactions and dispositions of the assets of the company; (2) provide reasonable assurance that transactions are recorded as necessary to permit preparation of financial statements in accordance with generally accepted accounting principles, and that receipts and expenditures of the company are being made only in accordance with authorizations of management and directors of the company; and (3) provide reasonable assurance regarding prevention or timely detection of unauthorized acquisition, use, or disposition of the company’s assets that could have a material effect on the financial statements.
Because of its inherent limitations, internal control over financial reporting may not prevent or detect misstatements. Also, projections of any evaluation of effectiveness to future periods are subject to the risk that controls may become inadequate because of changes in conditions, or that the degree of compliance with the policies or procedures may deteriorate.
/s/ Ernst & Young LLP
Atlanta, Georgia
February 22, 2018
F-3
CHART INDUSTRIES, INC. AND SUBSIDIARIES
(Dollars in millions, except per share amounts)
|
|
December 31,
|
||||||
|
|
2017
|
2016
|
|||||
|
ASSETS
|
|||||||
|
Current Assets
|
|||||||
|
Cash and cash equivalents
|
$
|
122.6
|
|
$
|
282.0
|
|
|
|
Accounts receivable, less allowances of $10.8 and $10.2
|
222.7
|
|
142.8
|
|
|||
|
Inventories, net
|
208.9
|
|
169.7
|
|
|||
|
Unbilled contract revenue
|
37.0
|
|
26.7
|
|
|||
|
Prepaid expenses
|
15.4
|
|
16.8
|
|
|||
|
Other current assets
|
27.4
|
|
15.0
|
|
|||
|
Total Current Assets
|
634.0
|
|
653.0
|
|
|||
|
Property, plant and equipment, net
|
297.6
|
|
251.0
|
|
|||
|
Goodwill
|
468.8
|
|
218.0
|
|
|||
|
Identifiable intangible assets, net
|
302.5
|
|
93.4
|
|
|||
|
Other assets
|
21.8
|
|
17.6
|
|
|||
|
TOTAL ASSETS
|
$
|
1,724.7
|
|
$
|
1,233.0
|
|
|
|
LIABILITIES AND EQUITY
|
|||||||
|
Current Liabilities
|
|||||||
|
Accounts payable
|
$
|
113.9
|
|
$
|
80.0
|
|
|
|
Customer advances and billings in excess of contract revenue
|
110.2
|
|
74.7
|
|
|||
|
Accrued salaries, wages and benefits
|
49.1
|
|
41.7
|
|
|||
|
Current portion of warranty reserve
|
14.1
|
|
15.3
|
|
|||
|
Short-term debt and current portion of long-term debt
|
58.9
|
|
6.5
|
|
|||
|
Other current liabilities
|
41.4
|
|
43.3
|
|
|||
|
Total Current Liabilities
|
387.6
|
|
261.5
|
|
|||
|
Long-term debt
|
439.2
|
|
233.7
|
|
|||
|
Long-term deferred tax liabilities
|
62.5
|
|
4.2
|
|
|||
|
Accrued pension liabilities
|
9.4
|
|
14.4
|
|
|||
|
Other long-term liabilities
|
20.8
|
|
20.6
|
|
|||
|
Total Liabilities
|
919.5
|
|
534.4
|
|
|||
|
Equity
|
|||||||
|
Common stock, par value $0.01 per share — 150,000,000 shares authorized, 30,804,832 and 30,613,166 shares issued and outstanding at December 31, 2017 and 2016, respectively
|
0.3
|
|
0.3
|
|
|||
|
Additional paid-in capital
|
445.7
|
|
395.8
|
|
|||
|
Retained earnings
|
364.3
|
|
336.3
|
|
|||
|
Accumulated other comprehensive loss
|
(8.1
|
)
|
(35.2
|
)
|
|||
|
Total Chart Industries, Inc. Shareholders’ Equity
|
802.2
|
|
697.2
|
|
|||
|
Noncontrolling interests
|
3.0
|
|
1.4
|
|
|||
|
Total Equity
|
805.2
|
|
698.6
|
|
|||
|
TOTAL LIABILITIES AND EQUITY
|
$
|
1,724.7
|
|
$
|
1,233.0
|
|
|
The accompanying notes are an integral part of these consolidated financial statements.
F-4
CHART INDUSTRIES, INC. AND SUBSIDIARIES
(Dollars and shares in millions, except per share amounts)
|
|
Year Ended December 31,
|
||||||||||
|
|
2017
|
2016
|
2015
|
||||||||
|
Sales
|
$
|
988.8
|
|
$
|
859.2
|
|
$
|
1,040.2
|
|
||
|
Cost of sales
|
716.7
|
|
592.8
|
|
751.7
|
|
|||||
|
Gross profit
|
272.1
|
|
266.4
|
|
288.5
|
|
|||||
|
Selling, general and administrative expenses
|
215.1
|
|
195.9
|
|
200.8
|
|
|||||
|
Amortization expense
|
15.0
|
|
11.9
|
|
17.3
|
|
|||||
|
Asset impairments
|
—
|
|
1.2
|
|
253.6
|
|
|||||
|
Operating expenses
|
230.1
|
|
209.0
|
|
471.7
|
|
|||||
|
Operating income (loss)
|
42.0
|
|
57.4
|
|
(183.2
|
)
|
|||||
|
Other expenses:
|
|||||||||||
|
Interest expense, net
|
19.4
|
|
17.3
|
|
16.0
|
|
|||||
|
Loss on extinguishment of debt
|
4.9
|
|
—
|
|
—
|
|
|||||
|
Financing costs amortization
|
1.3
|
|
1.3
|
|
1.3
|
|
|||||
|
Foreign currency loss
|
2.8
|
|
0.4
|
|
1.3
|
|
|||||
|
Other expenses, net
|
28.4
|
|
19.0
|
|
18.6
|
|
|||||
|
Income (loss) before income taxes
|
13.6
|
|
38.4
|
|
(201.8
|
)
|
|||||
|
Income tax (benefit) expense:
|
|||||||||||
|
Current
|
13.9
|
|
16.3
|
|
27.1
|
|
|||||
|
Deferred
|
(29.8
|
)
|
(2.6
|
)
|
(24.4
|
)
|
|||||
|
Income tax (benefit) expense, net
|
(15.9
|
)
|
13.7
|
|
2.7
|
|
|||||
|
Net income (loss)
|
29.5
|
|
24.7
|
|
(204.5
|
)
|
|||||
|
Less: Income (loss) attributable to noncontrolling interests, net of taxes
|
1.5
|
|
(3.5
|
)
|
(1.5
|
)
|
|||||
|
Net income (loss) attributable to Chart Industries, Inc.
|
$
|
28.0
|
|
$
|
28.2
|
|
$
|
(203.0
|
)
|
||
|
Net income (loss) attributable to Chart Industries, Inc. per common share:
|
|||||||||||
|
Basic
|
$
|
0.91
|
|
$
|
0.92
|
|
$
|
(6.66
|
)
|
||
|
Diluted
|
$
|
0.89
|
|
$
|
0.91
|
|
$
|
(6.66
|
)
|
||
|
Weighted-average number of common shares outstanding:
|
|||||||||||
|
Basic
|
30.74
|
|
30.58
|
|
30.49
|
|
|||||
|
Diluted
|
31.34
|
|
30.99
|
|
30.49
|
|
|||||
The accompanying notes are an integral part of these consolidated financial statements.
F-5
CHART INDUSTRIES, INC. AND SUBSIDIARIES
CONSOLIDATED STATEMENTS OF COMPREHENSIVE INCOME (LOSS)
(Dollars in millions)
|
|
Year Ended December 31,
|
||||||||||
|
|
2017
|
2016
|
2015
|
||||||||
|
Net income (loss)
|
$
|
29.5
|
|
$
|
24.7
|
|
$
|
(204.5
|
)
|
||
|
Other comprehensive income (loss):
|
|||||||||||
|
Foreign currency translation adjustments
|
26.9
|
|
(12.2
|
)
|
(16.6
|
)
|
|||||
|
Defined benefit pension plan:
|
|||||||||||
|
Actuarial gain (loss) on remeasurement
|
2.4
|
|
1.5
|
|
(1.3
|
)
|
|||||
|
Amortization of prior service cost included in net periodic pension expense
|
1.2
|
|
1.5
|
|
1.4
|
|
|||||
|
Defined benefit pension plan
|
3.6
|
|
3.0
|
|
0.1
|
|
|||||
|
Other comprehensive income (loss), before tax
|
30.5
|
|
(9.2
|
)
|
(16.5
|
)
|
|||||
|
Income tax expense related to defined benefit pension plan
|
(3.3
|
)
|
(1.1
|
)
|
(0.1
|
)
|
|||||
|
Other comprehensive income (loss), net of taxes
|
27.2
|
|
(10.3
|
)
|
(16.6
|
)
|
|||||
|
Comprehensive income (loss)
|
56.7
|
|
14.4
|
|
(221.1
|
)
|
|||||
|
Less: comprehensive (income) loss attributable to noncontrolling interests, net of taxes
|
(1.6
|
)
|
3.5
|
|
1.9
|
|
|||||
|
Comprehensive income (loss) attributable to Chart Industries, Inc.
|
$
|
55.1
|
|
$
|
17.9
|
|
$
|
(219.2
|
)
|
||
The accompanying notes are an integral part of these consolidated financial statements.
F-6
CHART INDUSTRIES, INC. AND SUBSIDIARIES
(Dollars in millions)
|
|
Year Ended December 31,
|
||||||||||
|
|
2017
|
2016
|
2015
|
||||||||
|
OPERATING ACTIVITIES
|
|||||||||||
|
Net income (loss)
|
$
|
29.5
|
|
$
|
24.7
|
|
$
|
(204.5
|
)
|
||
|
Adjustments to reconcile net income (loss) to net cash provided by operating activities:
|
|||||||||||
|
Depreciation and amortization
|
41.9
|
|
37.5
|
|
45.4
|
|
|||||
|
Asset impairments
|
—
|
|
1.2
|
|
255.1
|
|
|||||
|
Interest accretion of convertible notes discount
|
12.8
|
|
12.5
|
|
11.5
|
|
|||||
|
Loss on extinguishment of debt
|
4.9
|
|
—
|
|
—
|
|
|||||
|
Financing costs amortization
|
1.3
|
|
1.3
|
|
1.3
|
|
|||||
|
Employee share-based compensation expense
|
11.1
|
|
10.7
|
|
11.3
|
|
|||||
|
Unrealized foreign currency transaction loss
|
0.3
|
|
0.5
|
|
0.1
|
|
|||||
|
Deferred income tax benefit
|
(29.8
|
)
|
(2.6
|
)
|
(24.4
|
)
|
|||||
|
Other non-cash operating activities
|
2.3
|
|
1.3
|
|
0.8
|
|
|||||
|
Changes in assets and liabilities, net of acquisitions:
|
|||||||||||
|
Accounts receivable
|
(37.1
|
)
|
43.6
|
|
7.2
|
|
|||||
|
Inventory
|
(11.7
|
)
|
25.7
|
|
12.0
|
|
|||||
|
Unbilled contract revenues and other assets
|
6.6
|
|
20.8
|
|
12.3
|
|
|||||
|
Accounts payable and other liabilities
|
(1.5
|
)
|
(11.5
|
)
|
(17.4
|
)
|
|||||
|
Customer advances and billings in excess of contract revenue
|
16.4
|
|
5.1
|
|
(9.7
|
)
|
|||||
|
Net Cash Provided By Operating Activities
|
47.0
|
|
170.8
|
|
101.0
|
|
|||||
|
INVESTING ACTIVITIES
|
|||||||||||
|
Acquisition of businesses, net of cash acquired
|
(446.1
|
)
|
(1.4
|
)
|
(24.5
|
)
|
|||||
|
Capital expenditures
|
(35.2
|
)
|
(17.8
|
)
|
(47.1
|
)
|
|||||
|
Payments for China land use rights
|
—
|
|
—
|
|
(11.0
|
)
|
|||||
|
Government grants
|
0.4
|
|
1.1
|
|
8.7
|
|
|||||
|
Proceeds from sale of assets
|
0.9
|
|
—
|
|
0.4
|
|
|||||
|
Net Cash Used In Investing Activities
|
(480.0
|
)
|
(18.1
|
)
|
(73.5
|
)
|
|||||
|
FINANCING ACTIVITIES
|
|||||||||||
|
Borrowings on revolving credit facilities
|
302.2
|
|
3.8
|
|
68.8
|
|
|||||
|
Repayments on revolving credit facilities
|
(66.1
|
)
|
(6.1
|
)
|
(67.2
|
)
|
|||||
|
Repurchase of convertible notes
|
(194.9
|
)
|
—
|
|
—
|
|
|||||
|
Proceeds from issuance of convertible notes
|
258.8
|
|
—
|
|
—
|
|
|||||
|
Proceeds from issuance of warrants
|
46.0
|
|
—
|
|
—
|
|
|||||
|
Payments for call options related to convertible notes
|
(59.5
|
)
|
—
|
|
—
|
|
|||||
|
Borrowings on term loan
|
—
|
|
13.2
|
|
—
|
|
|||||
|
Repayments on term loan
|
(3.1
|
)
|
(2.9
|
)
|
—
|
|
|||||
|
Payments for debt issuance costs
|
(8.2
|
)
|
—
|
|
—
|
|
|||||
|
Payment of contingent consideration
|
—
|
|
—
|
|
(0.6
|
)
|
|||||
|
Proceeds from exercise of stock options
|
2.0
|
|
0.4
|
|
0.5
|
|
|||||
|
Excess tax benefit from share-based compensation
|
—
|
|
—
|
|
0.1
|
|
|||||
|
Common stock repurchases
|
(2.0
|
)
|
(0.7
|
)
|
(0.9
|
)
|
|||||
|
Dividend distribution to noncontrolling interests
|
—
|
|
—
|
|
(0.1
|
)
|
|||||
|
Other financing activities
|
—
|
|
—
|
|
(0.2
|
)
|
|||||
|
Net Cash Provided By Financing Activities
|
275.2
|
|
7.7
|
|
0.4
|
|
|||||
|
Effect of exchange rate changes on cash and cash equivalents
|
7.2
|
|
(2.1
|
)
|
(7.8
|
)
|
|||||
|
Net (decrease) increase in cash, cash equivalents, restricted cash, and restricted cash equivalents
|
(150.6
|
)
|
158.3
|
|
20.1
|
|
|||||
|
Cash, cash equivalents, restricted cash, and restricted cash equivalents at beginning of period
|
282.0
|
|
123.7
|
|
103.6
|
|
|||||
|
CASH, CASH EQUIVALENTS, RESTRICTED CASH, AND RESTRICTED CASH EQUIVALENTS AT END OF PERIOD
(1)
|
$
|
131.4
|
|
$
|
282.0
|
|
$
|
123.7
|
|
||
|
(1)
|
Refer to Note 7, Debt and Credit Arrangements and Note 10, Business Combinations for further information regarding restricted cash and restricted cash equivalents balances.
|
The accompanying notes are an integral part of these consolidated financial statements.
F-7
CHART INDUSTRIES, INC. AND SUBSIDIARIES
CONSOLIDATED STATEMENTS OF EQUITY
(Dollars and shares in millions)
|
Common Stock
|
Additional Paid-in Capital
|
Accumulated Other Comprehensive
(Loss) Income |
Non-controlling Interests
|
|||||||||||||||||||||||
|
|
Shares
Outstanding
|
Amount
|
Retained
Earnings
|
Total
Equity
|
||||||||||||||||||||||
|
Balance at January 1, 2015
|
30.48
|
|
$
|
0.3
|
|
$
|
377.2
|
|
$
|
511.1
|
|
$
|
(8.7
|
)
|
$
|
7.2
|
|
$
|
887.1
|
|
||||||
|
Net loss
|
—
|
|
—
|
|
—
|
|
(203.0
|
)
|
—
|
|
(1.5
|
)
|
(204.5
|
)
|
||||||||||||
|
Other comprehensive loss
|
—
|
|
—
|
|
—
|
|
—
|
|
(16.2
|
)
|
(0.4
|
)
|
(16.6
|
)
|
||||||||||||
|
Share-based compensation expense
|
—
|
|
—
|
|
11.3
|
|
—
|
|
—
|
|
—
|
|
11.3
|
|
||||||||||||
|
Common stock issued from share-based compensation plans
|
0.10
|
|
—
|
|
0.5
|
|
—
|
|
—
|
|
—
|
|
0.5
|
|
||||||||||||
|
Excess tax deficiency from exercise of stock options
|
—
|
|
—
|
|
(0.9
|
)
|
—
|
|
—
|
|
—
|
|
(0.9
|
)
|
||||||||||||
|
Common stock repurchases
|
(0.03
|
)
|
—
|
|
(0.9
|
)
|
—
|
|
—
|
|
—
|
|
(0.9
|
)
|
||||||||||||
|
Dividend distribution to noncontrolling interest
|
—
|
|
—
|
|
—
|
|
—
|
|
—
|
|
(0.2
|
)
|
(0.2
|
)
|
||||||||||||
|
Other
|
—
|
|
—
|
|
(0.1
|
)
|
—
|
|
—
|
|
—
|
|
(0.1
|
)
|
||||||||||||
|
Balance at December 31, 2015
|
30.55
|
|
0.3
|
|
387.1
|
|
308.1
|
|
(24.9
|
)
|
5.1
|
|
675.7
|
|
||||||||||||
|
Net income (loss)
|
—
|
|
—
|
|
—
|
|
28.2
|
|
—
|
|
(3.5
|
)
|
24.7
|
|
||||||||||||
|
Other comprehensive (loss) income
|
—
|
|
—
|
|
—
|
|
—
|
|
(10.3
|
)
|
—
|
|
(10.3
|
)
|
||||||||||||
|
Share-based compensation expense
|
—
|
|
—
|
|
10.7
|
|
—
|
|
—
|
|
—
|
|
10.7
|
|
||||||||||||
|
Common stock issued from share-based compensation plans
|
0.10
|
|
—
|
|
0.4
|
|
—
|
|
—
|
|
—
|
|
0.4
|
|
||||||||||||
|
Excess tax deficiency from exercise of stock options
|
—
|
|
—
|
|
(1.7
|
)
|
—
|
|
—
|
|
—
|
|
(1.7
|
)
|
||||||||||||
|
Common stock repurchases
|
(0.04
|
)
|
—
|
|
(0.7
|
)
|
—
|
|
—
|
|
—
|
|
(0.7
|
)
|
||||||||||||
|
Other
|
—
|
|
—
|
|
—
|
|
—
|
|
—
|
|
(0.2
|
)
|
(0.2
|
)
|
||||||||||||
|
Balance at December 31, 2016
|
30.61
|
|
0.3
|
|
395.8
|
|
336.3
|
|
(35.2
|
)
|
1.4
|
|
698.6
|
|
||||||||||||
|
Net income
|
—
|
|
—
|
|
—
|
|
28.0
|
|
—
|
|
1.5
|
|
29.5
|
|
||||||||||||
|
Other comprehensive income
|
—
|
|
—
|
|
—
|
|
—
|
|
27.1
|
|
0.1
|
|
27.2
|
|
||||||||||||
|
Equity component of convertible notes issuance, net of deferred financing fees and deferred taxes
|
—
|
|
—
|
|
36.6
|
|
—
|
|
—
|
|
—
|
|
36.6
|
|
||||||||||||
|
Proceeds from issuance of warrants
|
—
|
|
—
|
|
46.0
|
|
—
|
|
—
|
|
—
|
|
46.0
|
|
||||||||||||
|
Purchase of call options, net of deferred taxes
|
—
|
|
—
|
|
(38.1
|
)
|
—
|
|
—
|
|
—
|
|
(38.1
|
)
|
||||||||||||
|
Repurchase of convertible notes
|
—
|
|
—
|
|
(5.8
|
)
|
—
|
|
—
|
|
—
|
|
(5.8
|
)
|
||||||||||||
|
Share-based compensation expense
|
—
|
|
—
|
|
11.1
|
|
—
|
|
—
|
|
—
|
|
11.1
|
|
||||||||||||
|
Common stock issued from share-based compensation plans
|
0.25
|
|
—
|
|
2.0
|
|
—
|
|
—
|
|
—
|
|
2.0
|
|
||||||||||||
|
Common stock repurchases
|
(0.05
|
)
|
—
|
|
(2.0
|
)
|
—
|
|
—
|
|
—
|
|
(2.0
|
)
|
||||||||||||
|
Other
|
—
|
|
—
|
|
0.1
|
|
—
|
|
|
|
—
|
|
0.1
|
|
||||||||||||
|
Balance at December 31, 2017
|
30.81
|
|
$
|
0.3
|
|
$
|
445.7
|
|
$
|
364.3
|
|
$
|
(8.1
|
)
|
$
|
3.0
|
|
$
|
805.2
|
|
||||||
The accompanying notes are an integral part of these consolidated financial statements.
F-8
CHART INDUSTRIES, INC. AND SUBSIDIARIES
NOTES TO CONSOLIDATED FINANCIAL STATEMENTS
(Dollars and shares in millions, except per share amounts)
Nature of Operations:
Chart Industries, Inc. and its consolidated subsidiaries (herein referred to as the “Company,” “Chart,” “we,” “us,” or “our”), is a leading diversified global manufacturer of highly engineered equipment for the industrial gas, energy, and biomedical industries. Chart’s equipment and engineered systems are primarily used for low-temperature and cryogenic applications utilizing our expertise in cryogenic systems and equipment which operate at low temperatures sometimes approaching absolute zero (0 Kelvin; -273° Centigrade; -459° Fahrenheit). We have domestic operations located across the United States, including principal executive offices located in Georgia, and an international presence in Asia, Australia, Europe, and Latin America.
On September 20, 2017, we completed the acquisition of RCHPH Holdings, Inc. (“Hudson”). Hudson designs, manufactures, sells and services products used in refining, heating, ventilation and air conditioning (HVAC), petrochemical, natural gas, power generation, industrial and commercial end markets. See Note 10, Business Combinations, for further information regarding the Hudson acquisition.
Principles of Consolidation:
The consolidated financial statements include the accounts of Chart Industries, Inc. and its subsidiaries. Intercompany accounts and transactions are eliminated in consolidation.
Recently Adopted Accounting Standards:
In November 2016, the Financial Accounting Standards Board (“FASB”) issued Accounting Standards Update (“ASU”) 2016-18, “Statement of Cash Flows (Topic 230): Restricted Cash.” The FASB issued the update to clarify how restricted cash or restricted cash equivalents should be presented in the statement of cash flows. We early adopted the amendments provided in ASU 2016-18 effective January 1, 2017 as reflected in these consolidated financial statements to provide financial statement users with more transparent disclosure about restricted cash and restricted cash equivalents. The amendments were applied using a retrospective transition method to each period presented. Prior periods were not restated as the impact of adoption of ASU 2016-18 was not material to prior periods. The cash, cash equivalents, restricted cash, and restricted cash equivalents balance included
$8.8
of restricted cash and restricted cash equivalents at
December 31, 2017
. Restricted cash and restricted cash equivalents are included in other current assets and other assets in the accompanying consolidated balance sheet at
December 31, 2017
.
In March 2016, the FASB issued ASU 2016-09, “Compensation – Stock Compensation (Topic 718): Improvements to Employee Share-Based Payment Accounting.” The FASB issued the update to change certain aspects of accounting for share-based payments to employees. The update eliminated additional paid-in capital pools and requires all income tax effects of awards to be recognized in the statements of operations when the awards vest or settle. We prospectively recognized the excess income tax effects of awards as income tax expense or benefit in the statements of operations and have elected to continue to estimate the number of share-based awards expected to vest rather than electing to account for forfeitures as they occur. In addition, we prospectively recognized the excess tax benefits along with other income tax cash flows as an operating activity in the consolidated statements of cash flows. We adopted this guidance effective January 1, 2017. The adoption of the guidance did not have a material impact on our consolidated financial statements.
In July 2015, the FASB issued ASU 2015-11, “Simplifying the Measurement of Inventory.” The amendments require an entity to measure inventory at the lower of cost and net realizable value. Net realizable value is the estimated selling prices in the ordinary course of business, less reasonably predictable costs of completion, disposal, and transportation. We adopted this guidance prospectively for the fiscal year beginning January 1, 2017. The adoption of the guidance did not have a material impact on our consolidated financial statements.
Use of Estimates:
The preparation of financial statements in conformity with U.S. generally accepted accounting principles requires management to make estimates and assumptions that affect the reported amounts of assets and liabilities and the disclosure of contingent assets and liabilities at the date of the financial statements. These estimates may also affect the reported amounts of revenues and expenses during the reporting period. Actual results could differ from those estimates and assumptions.
Cash, Cash Equivalents, Restricted Cash, and Restricted Cash Equivalents:
We consider all investments with an initial maturity of three months or less when purchased to be cash equivalents. See the Debt and Credit Arrangements and Business Combinations notes for additional information about restricted cash and restricted cash equivalents, which is included in other current assets and other assets in the accompanying consolidated balance sheets.
F-9
CHART INDUSTRIES, INC. AND SUBSIDIARIES
NOTES TO CONSOLIDATED FINANCIAL STATEMENTS — (Continued)
(Dollars and shares in millions, except per share amounts)
Accounts Receivable, Net of Allowances:
We evaluate the collectibility of accounts receivable based on a combination of factors. In circumstances where we are aware of a specific customer’s inability to meet its financial obligations (e.g., bankruptcy filings, or substantial downgrading of credit scores), a specific reserve is recorded to reduce the receivable to the amount we believe will be collected. We also record allowances for doubtful accounts based on historical experience. When collection of a specific amount due is deemed not probable, the account is written off against the allowance.
Inventories:
Inventories are stated at the lower of cost or net realizable value with cost being determined by the first-in, first-out (“FIFO”) method. We determine inventory valuation reserves based on a combination of factors. In circumstances where we are aware of a specific problem in the valuation of a certain item, a specific reserve is recorded to reduce the item to its net realizable value. We also recognize reserves based on the actual usage in recent history and projected usage in the near-term.
Property, Plant and Equipment:
Capital expenditures for property, plant and equipment are recorded at cost. Expenditures for maintenance and repairs are charged to expense as incurred, whereas major improvements that extend the useful life are capitalized. The cost of applicable assets is depreciated over their estimated useful lives. Depreciation is computed using the straight-line method for financial reporting purposes and accelerated methods for income tax purposes.
Guarantees of Third-Party Performance:
During the first quarter of 2016, we became a member to a consortium agreement relating to a project with a third-party. This agreement entails us guaranteeing not only our own performance, but also the work of a third-party consortium partner. In the event of non-fulfillment of contractual obligations by the consortium partner, we may be required to perform the obligations of the consortium partner. The agreement term covers the project through completion, approximately
1.5
years. At December 31, 2017, the estimated cost of the performance under this guarantee was
14.6
million euros (equivalent to
$15.4
). If losses are incurred under the guarantee due to third-party non-performance, we have certain rights that would allow us to mitigate such losses. If necessary, the carrying amount of any liability recorded in the consolidated balance sheet would reflect our best estimate of future payments which we may incur as part of fulfilling our guarantee obligation. There is no liability recorded at December 31, 2017.
Long-lived Assets:
We monitor our property, plant, equipment, and finite-lived intangible assets for impairment indicators on an ongoing basis. If impairment indicators exist, assets are grouped and tested at the lowest level for which identifiable cash flows are available. We perform the required analysis and record impairment charges, if applicable. In conducting our analysis, we compare the undiscounted cash flows expected to be generated from the long-lived assets to the related net book values. If the undiscounted cash flows exceed the net book value, the long-lived assets are considered not to be impaired. If the net book value exceeds the undiscounted cash flows, an impairment loss is measured and recognized. An impairment loss is measured as the difference between the net book value and the fair value of the long-lived assets. Fair value is estimated from discounted future net cash flows (for assets held and used) or net realizable value (for assets held for sale). Changes in economic or operating conditions impacting these estimates and assumptions could result in the impairment of long-lived assets. We amortize intangible assets that have finite lives over their estimated useful lives.
See
Note 3
,
Asset Impairments
, for more information relating to finite-lived intangible asset impairment losses recorded during 2016 and 2015.
Goodwill and Indefinite-Lived Intangible Assets:
Goodwill is recognized as the excess cost of an acquired entity over the net amount assigned to assets acquired and liabilities assumed. We do not amortize goodwill or indefinite-lived intangible assets, but review them for impairment annually in the fourth quarter or whenever events or changes in circumstances indicate that an evaluation should be completed.
Goodwill is analyzed on a reporting unit basis. The reporting units are the same as the operating and reportable segments: Energy & Chemicals (“E&C”), Distribution & Storage (“D&S”) and BioMedical. We first evaluate qualitative factors, such as macroeconomic conditions and our overall financial performance to determine whether it is more likely than not that the fair value of a reporting unit is less than its carrying amount, including goodwill. We then evaluate how significant each of the identified factors could be to the fair value or carrying amount of a reporting unit and weigh these factors in totality in forming a conclusion of whether or not it is more likely than not that the fair value of a reporting unit is less than its carrying amount (the “Step 0 Test”). If we determine that it is not more likely than not that the fair value of a reporting unit is less than its carrying amount, the first and second steps of the goodwill impairment test are not necessary. Otherwise, we would perform the first step of the two-step goodwill impairment test.
Alternatively, we may also bypass the Step 0 Test and proceed directly to the two-step goodwill impairment test. Under the first step (“Step 1”), we estimate the fair value of the reporting units by considering income and market approaches to develop
F-10
CHART INDUSTRIES, INC. AND SUBSIDIARIES
NOTES TO CONSOLIDATED FINANCIAL STATEMENTS — (Continued)
(Dollars and shares in millions, except per share amounts)
fair value estimates, which are weighted to arrive at a fair value estimate for each reporting unit. With respect to the income approach, a model has been developed to estimate the fair value of each reporting unit. This fair value model incorporates estimates of future cash flows, estimates of allocations of certain assets and cash flows among reporting units, estimates of future growth rates and management’s judgment regarding the applicable discount rates to use to discount such estimates of cash flows. With respect to the market approach, a guideline company method is employed whereby pricing multiples are derived from companies with similar assets or businesses to estimate fair value of each reporting unit. If the fair value of the reporting unit exceeds the carrying amount of the net assets assigned to that reporting unit, then goodwill is not impaired and no further testing is required. However, if the fair value of the reporting unit is less than its carrying amount, we perform the second step (“Step 2”) of the goodwill impairment test to measure the amount of impairment loss, if any, to recognize.
In Step 2, the implied fair value of the reporting unit’s goodwill is determined by allocating the reporting unit’s fair value to the assets and liabilities, other than goodwill, in a hypothetical purchase price allocation. The resulting implied fair value is then compared to the carrying amount of the goodwill and if the carrying amount exceeds the implied fair value, an impairment charge is recorded for the difference.
In order to assess the reasonableness of the calculated fair values of the reporting units, we also compare the sum of the reporting units’ fair values to the market capitalization and calculate an implied control premium (the excess of the sum of the reporting units’ fair values over the market capitalization). We evaluate the control premium by comparing it to control premiums of recent comparable transactions. If the implied control premium is not reasonable in light of this assessment, we reevaluate the fair value estimates of the reporting units by adjusting the discount rates and other assumptions as necessary.
Changes to the assumptions and estimates used throughout the steps described above may result in a significantly different estimate of the fair value of the reporting units, which could result in a different assessment of the recoverability of goodwill and result in future impairment charges.
With respect to indefinite-lived intangible assets, we first evaluate relevant events and circumstances to determine whether it is more likely than not that the fair value of an indefinite-lived intangible asset is less than its carrying amount. If, in weighing all relevant events and circumstances in totality, we determine that it is more likely than not that an indefinite-lived intangible asset is not impaired, no further action is necessary. Otherwise, we would determine the fair value of indefinite-lived intangible assets and perform a quantitative impairment assessment by comparing the indefinite-lived intangible asset’s fair value to its carrying amount. We may bypass such a qualitative assessment and proceed directly to the quantitative assessment. We estimate the fair value of the indefinite-lived assets using the income approach. This may include the relief from royalty method or use of a model similar to the one described above related to goodwill which estimates the future cash flows attributed to the indefinite-lived intangible asset and then discounting these cash flows back to a present value. Under the relief from royalty method, fair value is estimated by discounting the royalty savings, as well as any tax benefits related to ownership to a present value. The fair value from either approach is compared to the carrying value and an impairment is recorded if the fair value is determined to be less than the carrying value.
See
Note 3
,
Asset Impairments
, and
Note 6
,
Goodwill and Intangible Assets
, for more information relating to goodwill and indefinite-lived intangible assets and the asset impairment charges recorded during 2016 and 2015.
Convertible Debt:
We determined that the conversion option within our 2.00% Convertible Senior Subordinated Notes due August 2018 and 1.00% Convertible Senior Subordinated Notes due November 2024 (together, the “Convertible Notes”) was not clearly and closely related to the debt instrument host, however, the conversion option met a scope exception to derivative instrument accounting since the conversion feature is indexed to the our common stock and meets equity classification criteria. Convertible debt instruments exempt from derivative accounting and subject to cash settlement of the conversion option are recognized by bifurcating the principal balance into a liability component and an equity component where the fair value of the liability component is estimated by calculating the present value of its cash flows discounted at an interest rate that we would have received for similar debt instruments that have no conversion rights (the “straight-debt rate”), and the equity component is the residual amount, net of tax, which creates a discount on the Convertible Notes. We recognize non-cash interest accretion expense related to the carrying amount of the Convertible Notes which is accreted back to its principal amount over the expected life of the debt, which is also the stated life of the debt.
Financial Instruments:
The fair values of cash equivalents, accounts receivable, accounts payable and short-term bank debt approximate their carrying amount because of the short maturity of these instruments.
F-11
CHART INDUSTRIES, INC. AND SUBSIDIARIES
NOTES TO CONSOLIDATED FINANCIAL STATEMENTS — (Continued)
(Dollars and shares in millions, except per share amounts)
To minimize credit risk from trade receivables, we review the financial condition of potential customers in relation to established credit requirements before sales credit is extended and monitor the financial condition and payment history of customers to help ensure timely collections and to minimize losses. Additionally, for certain domestic and foreign customers, particularly in the E&C segment, we require advance payments, letters of credit, bankers’ acceptances, and other such guarantees of payment. Certain customers also require us to issue letters of credit or performance bonds, particularly in instances where advance payments are involved, as a condition of placing the order.
Derivative Financial Instruments:
We utilize certain derivative financial instruments to enhance our ability to manage foreign currency risk that exists as part of ongoing business operations. Derivative instruments are entered into for periods consistent with related underlying exposures and do not constitute positions independent of those exposures. We do not enter into contracts for speculative purposes nor are we a party to any leveraged derivative instrument. We are exposed to foreign currency exchange risk as a result of transactions in currencies other than the functional currency of certain subsidiaries. We utilize foreign currency forward purchase and sale contracts to manage the volatility associated with foreign currency purchases and certain intercompany transactions in the normal course of business. Contracts typically have maturities of less than one year. Principal currencies include the U.S. dollar, the euro, the Chinese yuan, the Czech koruna, the Australian dollar, the British pound, the Canadian dollar, and the Japanese yen. Our foreign currency forward contracts do not qualify as hedges as defined by accounting guidance. Foreign currency forward contracts are measured at fair value and recorded on the consolidated balance sheets as other current liabilities or assets. Changes in their fair value are recorded in the consolidated statements of operations as foreign currency gains or losses. Our foreign currency forward contracts are not exchange traded instruments and, accordingly, the valuation is performed using Level 2 inputs as defined in
Note 11
. Gains or losses on settled or expired contracts are recorded in the consolidated statements of operations as foreign currency gains or losses.
Product Warranties:
We provide product warranties with varying terms and durations for the majority of our products. We estimate product warranty costs and accrues for these costs as products are sold with a charge to cost of sales. Factors considered in estimating warranty costs include historical and projected warranty claims, historical and projected cost-per-claim, and knowledge of specific product issues that are outside of typical experience. Warranty accruals are evaluated and adjusted as necessary based on actual claims experience and changes in future claim and cost estimates.
Business Combinations:
We account for business combinations using the acquisition method. The purchase price is allocated, separately from goodwill, to the identifiable assets acquired and liabilities assumed based on their estimated fair values. The excess of the purchase price over the fair value of the net assets acquired, including identifiable intangible assets, is assigned to goodwill. As additional information becomes available, we may further revise the preliminary acquisition consideration allocation during the remainder of the measurement period, which shall not exceed twelve months from the closing of the acquisition.
Identifiable finite-lived intangible assets generally consist of customer relationships, unpatented technology, patents and trademarks and trade names and are amortized over their estimate useful lives which generally range from 2 to 15 years. Identifiable indefinite-lived intangible assets generally consist of trademarks and trade names and are subject to impairment testing on at least an annual basis. We estimate the fair value of identifiable intangible assets under income approaches where the fair value models incorporate estimates of future cash flows, estimates of allocations of certain assets and cash flows, estimates of future growth rates, and management’s judgment regarding the applicable discount rates to use to discount such estimates of cash flows.
We expense acquisition-related costs, including legal, consulting, accounting and other costs, in the periods in which the costs are incurred.
Revenue Recognition:
For the majority of our products, revenue is recognized when products are shipped, title has transferred, and collection is reasonably assured. For these products, there is also persuasive evidence of an arrangement and the selling price to the buyer is fixed or determinable. For brazed aluminum heat exchangers, cold boxes, liquefied natural gas fueling stations, engineered tanks, and on-site generation systems, we primarily use the percentage of completion method of accounting. Earned revenue is based on the percentage of incurred costs to date compared to total estimated costs at completion after giving effect to the most current estimates. Timing of amounts billed on contracts varies from contract to contract and could cause significant variation in working capital needs. The cumulative impact of revisions in total cost estimates during the progress of work is reflected in the period in which these changes become known. Earned revenue reflects the original contract price adjusted for agreed upon claims and change orders, if any. Losses expected to be incurred on contracts in process, after consideration of estimated minimum recoveries from claims and change orders, are charged to operations as soon as such losses are known. Pre-contract costs relate primarily to salaries and benefits incurred to support the selling effort and are expensed as incurred. Change orders resulting in additional revenue and profit are recognized upon approval by the customer based on the percentage of incurred
F-12
CHART INDUSTRIES, INC. AND SUBSIDIARIES
NOTES TO CONSOLIDATED FINANCIAL STATEMENTS — (Continued)
(Dollars and shares in millions, except per share amounts)
costs to date compared to total estimated costs at completion. Certain contracts include incentive-fee arrangements. The incentive fees in such contracts can be based on a variety of factors, but the most common are the achievement of target completion dates, target costs, and/or other performance criteria. Incentive-fee revenue is not recognized until it is earned.
We report sales net of tax assessed by governmental authorities.
Cost of Sales:
Manufacturing expenses associated with sales are included in cost of sales. Cost of sales includes all materials, direct and indirect labor, inbound freight, purchasing and receiving, inspection, internal transfers, and distribution and warehousing of inventory. In addition, shop supplies, facility maintenance costs, manufacturing engineering, project management, and depreciation expense for assets used in the manufacturing process are included in cost of sales on the consolidated statements of operations.
Selling, General and Administrative Expenses (“SG&A”):
SG&A expenses include selling, marketing, customer service, product management, design engineering, and other administrative expenses not directly supporting the manufacturing process, as well as depreciation and amortization expense associated with non-manufacturing assets. In addition, SG&A expenses include corporate operating expenses for executive management, accounting, tax, treasury, corporate development, human resources, information technology, investor relations, legal, internal audit and risk management.
Shipping and Handling Costs:
Amounts billed to customers for shipping are classified as sales, and the related costs are classified as cost of sales on the consolidated statements of operations. Shipping revenue of
$10.2
,
$8.7
, and
$11.6
for the years ended December 31,
2017, 2016 and 2015
, respectively, are included in sales. Shipping costs of
$13.9
,
$12.2
, and
$15.2
for the years ended December 31,
2017, 2016 and 2015
, respectively, are included in cost of sales.
Advertising Costs:
We incurred advertising costs of
$5.1
,
$4.7
, and
$5.1
for the years ended December 31,
2017, 2016 and 2015
, respectively. Such costs are expensed as incurred and included in SG&A expenses on the consolidated statements of operations.
Research and Development Costs:
We incurred research and development costs of
$16.0
,
$18.1
, and
$15.8
for the years ended December 31,
2017, 2016 and 2015
, respectively. Such costs are expensed as incurred and included in SG&A expenses on the consolidated statements of operations.
Foreign Currency Translation:
The functional currency for the majority of our foreign operations is the applicable local currency. The translation from the applicable foreign currencies to U.S. dollars is performed for asset and liability accounts using exchange rates in effect at the balance sheet date and for revenue and expense accounts using the average exchange rate during the period. The resulting translation adjustments are recorded as a component of other comprehensive income (loss) in the consolidated statements of comprehensive income (loss). Remeasurement from local to functional currencies is included in cost of goods sold or foreign currency loss (gain) on the consolidated statements of operations. Gains or losses resulting from foreign currency transactions are charged to operations as incurred.
Income Taxes:
The Company and its U.S. subsidiaries file a consolidated federal income tax return. Deferred income taxes are provided for temporary differences between financial reporting and the consolidated tax return in accordance with the liability method. A valuation allowance is provided against net deferred tax assets when conditions indicate that it is more likely than not that the benefit related to such assets will not be realized. In assessing the need for a valuation allowance against deferred tax assets, we consider all available evidence, including past operating results, estimates of future taxable income, and the feasibility of tax planning strategies. In the event that we change our determination as to the amount of deferred tax assets that can be realized, the valuation allowance will be adjusted with a corresponding impact to the provision for income taxes in the period in which such determination is made.
We utilize a two-step approach for the recognition and measurement of uncertain tax positions. The first step is to evaluate the tax position and determine whether it is more likely than not that the position will be sustained upon examination by tax authorities. The second step is to measure the tax benefit as the largest amount that is more likely than not of being realized upon settlement.
Interest and penalties related to income taxes are accounted for as income tax expense on the consolidated statements of operations.
We have accounted for the tax effects of the Tax Cuts and Jobs Act, which was signed into law on December 22, 2017, on a provisional basis. Our accounting for certain income tax effects is incomplete, but we have determined reasonable estimates for
F-13
CHART INDUSTRIES, INC. AND SUBSIDIARIES
NOTES TO CONSOLIDATED FINANCIAL STATEMENTS — (Continued)
(Dollars and shares in millions, except per share amounts)
those effects and have recorded provisional amounts in our financial statements as of December 31, 2017. As we complete our analysis of the Tax Cuts and Jobs Act, further collect and analyze data, interpret any additional guidance issued by the U.S. Treasury Department, the Internal Revenue Service (“IRS”), and other standard-setting bodies, we may make adjustments to the provisional amounts. Those adjustments may materially impact our provision for income taxes in the period in which the adjustments are made.
Share-based Compensation:
We measure share-based compensation expense for share-based payments to employees and directors, including grants of employee stock options, restricted stock, restricted stock units, performance units, and leveraged restricted share units based on the grant-date fair value. The fair value of stock options is calculated using the Black-Scholes pricing model and is recognized on an accelerated basis over the vesting period. The grant-date fair value calculation under the Black-Scholes pricing model requires the use of variables such as exercise term of the option, future volatility, dividend yield, and risk-free interest rate. The fair value of restricted stock and restricted stock units is based on Chart’s market price on the date of grant and is generally recognized on an accelerated basis over the vesting period. The fair value of performance units is based on Chart’s market price on the date of grant and pre-determined performance conditions as determined by the Compensation Committee of the Board of Directors and is recognized on a straight-line basis over the performance measurement period based on the probability that the performance conditions will be achieved. We reassess the vesting probability of performance units each reporting period and adjust share-based compensation expense based on our probability assessment. The fair value of leveraged restricted share units is based on market conditions, calculated using a Monte Carlo simulation model, and is recognized on a straight-line basis over the vesting period. Share-based compensation expense for all awards considers estimated forfeitures.
During the year, we may repurchase shares of common stock from equity plan participants to satisfy tax withholding obligations relating to the vesting or payment of equity awards. All such repurchased shares are retired in the period in which the repurchases occur.
Defined Benefit Pension Plans:
We sponsor two defined benefit pension plans including the Chart Pension Plan, which has been frozen since February 2006, and a noncontributory defined benefit plan that we acquired as part of the Hudson acquisition (the “Hudson Plan”). The Hudson Plan is closed to new participants and not considered significant to our consolidated financial statements. Significant accounting policies related to the Chart Pension Plan are discussed below:
The funded status is measured as the difference between the fair value of the plan assets and the projected benefit obligation. The change in the funded status of the plan is recognized in the year in which the change occurs through accumulated other comprehensive loss. Our funding policy is to contribute at least the minimum funding amounts required by law. Management has chosen policies according to accounting guidance that allow the use of a calculated value of plan assets, which generally reduces the volatility of expense (income) from changes in pension liability discount rates and the performance of the pension plan’s assets.
Recently Issued Accounting Standards:
In February 2018, the FASB issued ASU 2018-02, “Income Statement – Reporting Comprehensive Income (Topic 220): Reclassification of Certain Tax Effects from Accumulated Other Comprehensive Income.” The FASB issued the update to provide amended guidance to “allow a reclassification from accumulated other comprehensive income to retained earnings for stranded tax effects resulting from the Tax Cuts and Jobs Act.” Additionally, under the new guidance an entity will be required to provide certain disclosures regarding stranded tax effects. The guidance is effective for fiscal years beginning after December 15, 2018, including interim periods within those years, and the guidance may be applied either in the period of adoption or retrospectively to each period (or periods) in which the effect of the change in the U.S. federal income tax rate in the Tax Cuts and Jobs Act is recognized. Early adoption is permitted. We are currently assessing the effect that the ASU will have on our financial position, results of operations, and disclosures.
In August 2017, the FASB issued ASU 2017-12, “Derivatives and Hedging (Topic 815): Targeted Improvements to Accounting for Hedging Activities.” The ASU expands and enhances hedge accounting to become more closely aligned with an entity’s risk management activities through hedging strategies. The ASU provides changes to both the designation and measurement guidance for qualifying hedging relationships and the presentation of hedge results in the financial statements and creates more transparency and better understandability around how economic results are presented in the financial statements. In addition, the new guidance makes certain targeted improvements to ease the application of accounting guidance relative to hedge effectiveness. The guidance will be applied prospectively for annual periods and interim periods beginning after December 15, 2018. Early adoption is permitted. We are currently assessing the effect that the ASU will have on our financial position, results of operations, and disclosures.
F-14
CHART INDUSTRIES, INC. AND SUBSIDIARIES
NOTES TO CONSOLIDATED FINANCIAL STATEMENTS — (Continued)
(Dollars and shares in millions, except per share amounts)
In May 2017, the FASB issued ASU 2017-09, “Compensation – Stock Compensation (Topic 718): Scope of Modification Accounting.” The FASB issued the guidance to provide clarity as to when modification accounting should be applied when there is a change to the terms or conditions of a share-based payment award in order to prevent diversity in practice. The ASU requires modification accounting to be applied unless all of the following conditions exist: (1) the fair value (or calculated value or intrinsic value, if such measurement is used) of the modified award is the same as the fair value (or calculated value or intrinsic value, if such measurement is used) of the original award before the original award is modified; if the modification does not affect any of the inputs to the valuation, the entity is not required to estimate the value immediately before and after the modification; (2) the vesting conditions of the modified award are the same as the vesting conditions of the original award before it was modified; and (3) the classification of the modified award as an equity instrument or a liability instrument is the same as the classification of the original award before it was modified. The guidance will be applied prospectively for annual periods and interim periods beginning after December 15, 2017. We are currently assessing the effect that the ASU will have on our financial position, results of operations, and disclosures.
In March 2017, the FASB issued ASU 2017-07, “Compensation – Retirement Benefits (Topic 715): Improving the Presentation of Net Periodic Pension Cost and Net Periodic Postretirement Benefit Cost.” The new guidance requires companies with sponsored defined benefit pension and/or other postretirement benefit plans to present the service cost component of net periodic benefit cost in the same income statement line item as other compensation costs. The other components of net periodic benefit cost will be presented separately and not included in operating income. In addition, only service costs are eligible to be capitalized as an asset. The standard will be effective for fiscal years beginning after December 15, 2017, including interim periods within those years, and the guidance will generally be applied retrospectively, whereas the capitalization of the service cost component will be applied prospectively. We are currently assessing the effect that the ASU will have on our financial position, results of operations, and disclosures.
In January 2017, the FASB issued ASU 2017-04, “Intangibles - Goodwill and Other (Topic 350): Simplifying the Test for Goodwill Impairment.” The new guidance eliminates the requirement to calculate the implied fair value of goodwill (Step 2 of the current guidance’s goodwill impairment test) to measure a goodwill impairment charge. Instead, entities will record an impairment charge based on the excess of a reporting unit’s carrying amount over its fair value (i.e., measure the charge based on current guidance’s Step 1). We have early adopted this guidance as of January 1, 2018. This guidance will only have an impact on future periods’ financial position, results of operations, and disclosures if a goodwill impairment occurs.
In January 2017, the FASB issued ASU 2017-01 “Business Combinations (Topic 805): Clarifying the Definition of a Business.” The ASU provides guidance to evaluate whether transactions should be accounted for as acquisitions (or disposals) of assets or businesses. If substantially all of the fair value of the gross assets acquired (or disposed of) is concentrated in a single asset or a group of similar assets, the assets acquired (or disposed of) are not considered a business. The guidance will be applied prospectively for annual periods and interim periods beginning after December 15, 2018. Early adoption is permitted. We will assess the effect that the ASU will have on our financial position, results of operations, and disclosures depending on potential future business combinations.
In August 2016, the FASB issued ASU 2016-15, “Statement of Cash Flows (Topic 230): Classification of Certain Cash Receipts and Cash Payments.” The FASB issued the update to clarify how entities should classify certain cash receipts and cash payments on the statement of cash flows. The new guidance also clarifies how the predominance principle should be applied when cash receipts and cash payments have aspects of more than one class of cash flows. The standard will be effective for fiscal years beginning after December 15, 2017, including interim periods within those years, and the guidance will generally be applied retrospectively. We are currently assessing the effect that the ASU will have on our consolidated statements of cash flows.
In February 2016, the FASB issued ASU 2016-02, “Leases (Topic 842).” The FASB issued the update to require the recognition of lease assets and lease liabilities on the balance sheet of lessees. The standard will be effective for fiscal years beginning after December 15, 2018, including interim periods within such fiscal years. The ASU requires a modified retrospective transition method with the option to elect a package of practical expedients. Early adoption is permitted. We expect adoption to increase the assets and liabilities recorded on our consolidated balance sheet and increase the level of disclosures related to leases. We also expect that adoption of the new standard will require changes to our internal controls to support recognition and disclosure requirements under the new standard. We are currently assessing the effect that the ASU will have on our consolidated financial statements.
In May 2014, the FASB issued ASU 2014-09, “Revenue from Contracts with Customers (Topic 606)” and subsequently issued additional guidance that modified ASU 2014-09. ASU 2014-09 and the subsequent modifications are identified as
F-15
CHART INDUSTRIES, INC. AND SUBSIDIARIES
NOTES TO CONSOLIDATED FINANCIAL STATEMENTS — (Continued)
(Dollars and shares in millions, except per share amounts)
“Accounting Standards Codification (“ASC”) 606.” ASC 606 replaces existing revenue recognition rules with a comprehensive revenue measurement and recognition standard and provides for expanded disclosure requirements. The update requires entities to recognize revenue to depict the transfer of promised goods or services to customers in an amount that reflects the consideration to which the entity expects to be entitled in exchange for those goods or services. ASC 606 applies to all contracts with customers except those that are within the scope of other topics in the FASB ASC. ASC 606 is effective for fiscal years beginning after December 15, 2017. We will adopt ASC 606 as of January 1, 2018 using the modified retrospective approach through a cumulative adjustment to retained earnings.
As part of the implementation plan, we identified our revenue streams and performed contract reviews to assess the impact of ASC 606 on our results of operations. We expect to complete the contract reviews in the near future. While we continue to assess all impacts of the accounting change, we currently believe that the most significant impact will relate to the timing of revenue recognition. We expect the majority of revenue that has historically been recognized when products are shipped, title has transferred and collection is reasonably assured will meet the criteria for using point-in-time revenue recognition. We also expect that the majority of the revenue that has historically been recognized using the percentage of completion method of accounting will meet the criteria for over time revenue recognition. At this time, we have identified the following impacts related to timing of revenue recognition:
|
•
|
Certain operations that have historically recognized revenue at a point-in-time will be required to change to the over time revenue recognition model as certain contracts contain language that meets the over time criteria established in ASC 606.
|
|
•
|
A portion of the revenue that has been deferred due to the current guidance for bill and hold revenues will be required to be recognized when the manufacturing process has been completed.
|
We do not expect the above changes to be material to our consolidated financial statements. We expect adoption to increase the level of disclosures related to revenue recognition.
The following tables summarize information about the impairment charges recorded in 2016 and 2015. These charges relate to non-financial assets that were measured at fair value on a non-recurring basis using Level 3 inputs according to the fair value hierarchy as described further in
Note 11
,
Fair Value Measurements
.
|
December 31, 2016
|
|||||||||||||||
|
Goodwill and Indefinite-lived Intangible Assets
|
Finite-lived Intangible Assets
|
Property, Plant & Equipment
|
Total
|
||||||||||||
|
Distribution & Storage
|
—
|
|
$
|
0.5
|
|
$
|
0.7
|
|
$
|
1.2
|
|
||||
|
Consolidated
|
$
|
—
|
|
$
|
0.5
|
|
$
|
0.7
|
|
$
|
1.2
|
|
|||
|
December 31, 2015
|
|||||||||||||||
|
Goodwill and Indefinite-lived Intangible Assets
|
Finite-lived Intangible Assets
|
Property, Plant & Equipment
|
Total
|
||||||||||||
|
Energy & Chemicals
|
$
|
65.0
|
|
$
|
—
|
|
$
|
3.8
|
|
$
|
68.8
|
|
|||
|
Distribution & Storage
(1)
|
0.3
|
|
—
|
|
1.7
|
|
2.0
|
|
|||||||
|
BioMedical
|
142.3
|
|
38.1
|
|
3.9
|
|
184.3
|
|
|||||||
|
Consolidated
|
$
|
207.6
|
|
$
|
38.1
|
|
$
|
9.4
|
|
$
|
255.1
|
|
|||
|
(1)
|
Asset impairments of
$1.5
were included in cost of sales on the consolidated statement of operations for the year ended December 31, 2015.
|
F-16
CHART INDUSTRIES, INC. AND SUBSIDIARIES
NOTES TO CONSOLIDATED FINANCIAL STATEMENTS — (Continued)
(Dollars and shares in millions, except per share amounts)
Goodwill and Indefinite-lived Intangible Assets
2017 and 2016 Goodwill and Indefinite-lived Asset Impairments:
None.
2015 Goodwill and Indefinite-lived Asset Impairments:
We recorded goodwill and indefinite-lived asset impairment charges in the fourth quarter of 2015 as management concluded that the goodwill and certain indefinite-lived intangible assets within certain reporting units were impaired. The total goodwill and indefinite-lived intangible asset impairment charges were
$207.6
. Management prepares its annual forecast mid-November through December each year. As the 2016 forecast was developed, management considered several factors when assessing the outlook for 2016 and beyond. Because of those factors, management revised its forecasts down significantly which led to the impairment charges described below. In addition to the items considered for each reporting unit below, management also considered the sustained decline in our market capitalization at that time. Our stock price was
$95.64
on December 31, 2013,
$34.20
on December 31, 2014 and
$17.96
on December 31, 2015.
Goodwill and indefinite-lived intangible assets within the E&C reporting unit were impaired
$65.0
as a result of revised estimates developed during our annual forecasting process. The revised estimates were the result of the following: 1) continued significant decline in energy prices during the fourth quarter of 2015 which led to a significant reduction in expected order levels as Liquefied Natural Gas (“LNG”) projects were cancelled or deferred, which impacted our longer-term forecasts; 2) in late 2015, we received notification of delays in major projects from several large customers; and 3) concerns with global growth, negative macroeconomic developments at the time and highly competitive market conditions.
Indefinite-lived intangible assets within the D&S reporting unit were impaired
$0.3
as a result of revised estimates developed during our annual forecasting process.
Goodwill and indefinite-lived intangible assets within the BioMedical reporting unit were impaired
$142.3
as a result of revised estimates developed during the annual forecasting process. The revised estimates were the result of the following: 1) realization that the effects of Medicare competitive bidding, including the reduction of reimbursement rates and the subsequent consolidation of our customers, were no longer considered temporary and would have lasting negative impacts on the growth of the homecare industry and their suppliers; 2) increased rivalry with competitive technology; and 3) concerns with global growth and negative macroeconomic developments at the time.
Long-lived Asset Impairments
2017 Long-lived Asset Impairments:
None.
2016 Long-lived Asset Impairments:
During the third quarter of 2016, we identified impairment indicators that suggest the carrying value of a certain asset group in China within the D&S segment may not be recoverable. The primary impairment indicators included projections of future cash flows and the associated impact on the long-range strategic plan forecasts, lower than expected cash flows attributed to this asset group, and poor market conditions. An undiscounted cash flow test performed for this asset group indicated it was not recoverable. The fair value of the asset group was established using a discounted cash flow model which utilized Level 3 inputs in the fair value hierarchy. As a result of the long-lived asset impairment assessment performed, we recorded long-lived asset impairment charges on our D&S reporting unit as described further below. There were no remaining long-lived assets recorded on the consolidated balance sheet for this asset group as of December 31, 2016.
Additionally, during the third quarter of 2016, events and circumstances indicated that other tangible property, plant and equipment in China within the D&S segment might be impaired. However, our estimate of undiscounted cash flows indicated that such carrying values were expected to be recovered.
2015 Long-lived Asset Impairments:
During the fourth quarter of 2015, we identified impairment indicators described above in the Goodwill and Indefinite-Lived Intangible Assets section that suggest the carrying values of certain asset groups within each reporting unit may not be recoverable. The primary indicators include projections of future cash flows and the associated impact on the long-range strategic plan forecasts, lower than expected cash flows attributed to certain asset groups, increased competition, the continued decline in energy prices, and our lower market capitalization at that time. As a result of the long-lived asset impairment assessments performed, we recorded long-lived asset impairments described further below.
The BioMedical long-lived asset impairment charges were due to declines in estimated fair value resulting from reductions in expected future cash flows associated with the respiratory product lines. The E&C long-lived asset impairment charges were due to reductions in expected future cash flows associated with certain assets in China.
F-17
CHART INDUSTRIES, INC. AND SUBSIDIARIES
NOTES TO CONSOLIDATED FINANCIAL STATEMENTS — (Continued)
(Dollars and shares in millions, except per share amounts)
Finite-lived Intangible Assets:
For the year ended December 31, 2016, we recorded impairment charges of
$0.5
related to finite-lived intangible assets in its D&S reporting unit, attributed to customer relationships, trademarks, technology and patents. For the year ended December 31, 2015, we recorded impairment charges of
$38.1
related to finite-lived intangible assets in its BioMedical reporting unit, attributed to customer relationships –
$15.7
and unpatented technology –
$22.4
.
Property, Plant & Equipment:
As a result of long-lived asset impairment assessments performed in the third quarter of 2016, we recorded long-lived asset impairment charges for certain tangible property, plant and equipment of
$0.7
attributed to D&S. As a result of long-lived asset impairment assessments performed in the fourth quarter of 2015, we recorded long-lived asset impairment charges for certain tangible property, plant and equipment of
$7.7
;
$3.8
attributed to E&C and
$3.9
attributed to BioMedical. Additionally, as a result of restructuring activities in 2015 within the D&S segment, we recorded
$1.7
of asset impairment charges to record certain property, plant and equipment at fair value.
The following table summarizes the components of inventory:
|
|
December 31,
|
||||||
|
|
2017
|
2016
|
|||||
|
Raw materials and supplies
|
$
|
97.2
|
|
$
|
65.7
|
|
|
|
Work in process
|
37.4
|
|
31.6
|
|
|||
|
Finished goods
|
74.3
|
|
72.4
|
|
|||
|
Total inventories, net
|
$
|
208.9
|
|
$
|
169.7
|
|
|
The Hudson acquisition added
$23.1
to our inventories, net balance at
December 31, 2017
, of which
$21.3
was classified as raw materials and supplies. Refer to Note 10, Business Combinations, for further information related to inventories acquired during 2017. The allowance for excess and obsolete inventory balance at
December 31, 2017
and
2016
was
$8.5
and
$10.1
, respectively.
The following table summarizes the components of property, plant and equipment:
|
|
|
December 31,
|
||||||||
|
Classification
|
Estimated Useful Life
|
2017
|
2016
|
|||||||
|
Land and buildings
|
20-35 years
|
$
|
231.4
|
|
$
|
163.0
|
|
|||
|
Machinery and equipment
|
3-12 years
|
199.7
|
|
169.4
|
|
|||||
|
Computer equipment, furniture and fixtures
|
3-7 years
|
37.0
|
|
35.4
|
|
|||||
|
Construction in process
|
26.6
|
|
50.9
|
|
||||||
|
Total property, plant and equipment, gross
|
494.7
|
|
418.7
|
|
||||||
|
Less: accumulated depreciation
|
(197.1
|
)
|
(167.7
|
)
|
||||||
|
Total property, plant and equipment, net
|
$
|
297.6
|
|
$
|
251.0
|
|
||||
Depreciation expense was
$26.9
,
$25.6
and
$28.1
for the years ended December 31,
2017, 2016 and 2015
, respectively. Construction in progress included approximately
$46.0
related to the plant expansion in Changzhou, China at December 31, 2016, the majority of which was placed in service during 2017.
See
Note 3
,
Asset Impairments
, for information regarding property, plant and equipment impaired in 2016 and 2015.
F-18
CHART INDUSTRIES, INC. AND SUBSIDIARIES
NOTES TO CONSOLIDATED FINANCIAL STATEMENTS — (Continued)
(Dollars and shares in millions, except per share amounts)
Goodwill
The following table represents the changes in goodwill by segment:
|
|
Energy &
Chemicals
|
Distribution & Storage
|
BioMedical
|
Total
|
|||||||||||
|
Balance at January 1, 2016
|
$
|
27.9
|
|
$
|
165.9
|
|
$
|
24.6
|
|
$
|
218.4
|
|
|||
|
Foreign currency translation adjustments and other
|
—
|
|
(0.4
|
)
|
—
|
|
(0.4
|
)
|
|||||||
|
Balance at December 31, 2016
|
27.9
|
|
165.5
|
|
24.6
|
|
218.0
|
|
|||||||
|
Foreign currency translation adjustments and other
|
0.1
|
|
2.5
|
|
(0.1
|
)
|
2.5
|
|
|||||||
|
Goodwill acquired during the year
|
247.1
|
|
1.2
|
|
—
|
|
248.3
|
|
|||||||
|
Balance at December 31, 2017
|
$
|
275.1
|
|
$
|
169.2
|
|
$
|
24.5
|
|
$
|
468.8
|
|
|||
|
Accumulated goodwill impairment loss at December 31, 2017 and 2016
|
$
|
64.6
|
|
$
|
—
|
|
$
|
131.2
|
|
$
|
195.8
|
|
|||
Intangible Assets
The following table displays the gross carrying amount and accumulated amortization for finite-lived intangible assets and indefinite-lived intangible assets (exclusive of goodwill)
(1)
:
|
|
December 31, 2017
|
December 31, 2016
|
|||||||||||||||
|
|
Weighted-average Estimated Useful Life
|
Gross
Carrying
Amount
|
Accumulated
Amortization
|
Gross
Carrying
Amount
|
Accumulated
Amortization
|
||||||||||||
|
Finite-lived intangible assets:
|
|||||||||||||||||
|
Customer relationships
|
12 years
|
$
|
246.3
|
|
$
|
(88.2
|
)
|
$
|
119.3
|
|
$
|
(81.6
|
)
|
||||
|
Unpatented technology
|
12 years
|
26.8
|
|
(4.5
|
)
|
8.2
|
|
(3.1
|
)
|
||||||||
|
Land use rights
|
50 years
|
13.4
|
|
(1.2
|
)
|
12.7
|
|
(0.9
|
)
|
||||||||
|
Trademarks and trade names
|
14 years
|
5.5
|
|
(2.9
|
)
|
4.9
|
|
(2.2
|
)
|
||||||||
|
Patents and other
|
6 years
|
3.0
|
|
(0.8
|
)
|
1.2
|
|
(0.7
|
)
|
||||||||
|
Total finite-lived intangible assets
|
14 years
|
$
|
295.0
|
|
$
|
(97.6
|
)
|
$
|
146.3
|
|
$
|
(88.5
|
)
|
||||
|
Indefinite-lived intangible assets:
|
|||||||||||||||||
|
Trademarks and trade names
|
$
|
105.1
|
|
$
|
35.6
|
|
|||||||||||
_______________
|
(1)
|
Amounts include the impact of foreign currency translation. Fully amortized or impaired amounts are written off.
|
Amortization expense for intangible assets subject to amortization was
$15.0
,
$11.9
and
$17.3
for the years ended December 31,
2017, 2016 and 2015
, respectively. We estimate amortization expense to be recognized during the next five years as follows:
|
For the Year Ending December 31,
|
|||
|
2018
|
$
|
25.8
|
|
|
2019
|
25.4
|
|
|
|
2020
|
23.4
|
|
|
|
2021
|
17.3
|
|
|
|
2022
|
17.1
|
|
|
F-19
CHART INDUSTRIES, INC. AND SUBSIDIARIES
NOTES TO CONSOLIDATED FINANCIAL STATEMENTS — (Continued)
(Dollars and shares in millions, except per share amounts)
See Note 10, Business Combinations, for further information related to intangible assets acquired during 2017, and see
Note 3
,
Asset Impairments
, for information related to the intangible impairment charges recorded in 2016.
Government Grants
We received
$0.4
and
$1.1
in government grants during 2017 and 2016, respectively, related to property, plant and equipment and land use rights related to the expansion in China. The grants are recorded in other current liabilities and other long-term liabilities in the consolidated balance sheets and recognized into income over the useful life of the associated assets (
10
to
50
years). At December 31, 2017,
$0.5
and
$8.7
was recorded in other current liabilities and other long-term liabilities, respectively, related to the government grants. At December 31, 2016,
$0.4
and
$8.2
was recorded in other current liabilities and other long-term-liabilities, respectively, related to the government grants.
F-20
CHART INDUSTRIES, INC. AND SUBSIDIARIES
NOTES TO CONSOLIDATED FINANCIAL STATEMENTS — (Continued)
(Dollars and shares in millions, except per share amounts)
Summary of Outstanding Borrowings
The following table represents the components of our borrowings:
|
|
December 31,
|
||||||
|
|
2017
|
2016
|
|||||
|
Convertible notes due November 2024:
|
|||||||
|
Principal amount
|
$
|
258.8
|
|
$
|
—
|
|
|
|
Unamortized discount
|
(57.6
|
)
|
—
|
|
|||
|
Unamortized debt issuance costs
|
(5.1
|
)
|
—
|
|
|||
|
Convertible notes due November 2024, net of unamortized discount and debt issuance costs
|
196.1
|
|
—
|
|
|||
|
Convertible notes due August 2018:
|
|||||||
|
Principal amount
|
57.1
|
|
250.0
|
|
|||
|
Unamortized discount
|
(1.9
|
)
|
(21.9
|
)
|
|||
|
Unamortized debt issuance costs
|
(0.1
|
)
|
(1.1
|
)
|
|||
|
Convertible notes due August 2018, net of unamortized discount and debt issuance costs
|
55.1
|
|
227.0
|
|
|||
|
Senior secured revolving credit facility due November 2022
|
239.0
|
|
—
|
|
|||
|
Foreign facilities
|
7.9
|
|
13.2
|
|
|||
|
Total debt, net of unamortized discount and debt issuance costs
|
498.1
|
|
240.2
|
|
|||
|
Less: current maturities
(1)
|
(58.9
|
)
|
(6.5
|
)
|
|||
|
Long-term debt
|
$
|
439.2
|
|
$
|
233.7
|
|
|
|
(1)
|
Current maturities at
December 31, 2017
includes
$55.1
of Convertible notes due August 2018, net of unamortized discount and debt issuance costs.
|
2024 Convertible Notes
On November 6, 2017, we issued 1.00% Convertible Senior Subordinated Notes due November 2024 (the “2024 Notes”) in the aggregate principal amount of
$258.8
, pursuant to an Indenture, dated as of such date (the “Indenture”). The 2024 Notes bear interest at an annual rate of
1.00%
, payable on May 15 and November 15 of each year, beginning on May 15, 2018, and will mature on November 15, 2024 unless earlier converted or repurchased.
The 2024 Notes are senior subordinated unsecured obligations of the Company and are not guaranteed by any of our subsidiaries. The 2024 Notes are senior in right of payment to our future subordinated debt, equal in right of payment with the Company’s future senior subordinated debt, and are subordinated in right of payment to our existing and future senior indebtedness, including indebtedness under our existing credit agreement.
A conversion of the 2024 Notes may be settled in cash, shares of our common stock or a combination of cash and shares of our common stock, at our election (subject to, and in accordance with, the settlement provisions of the Indenture). The initial conversion rate for the 2024 Notes is
17.0285
shares of common stock (subject to adjustment as provided for in the Indenture) per $1,000 principal amount of the 2024 Notes, which is equal to an initial conversion price of approximately
$58.73
per share, representing a conversion premium of approximately
35%
above the closing price of our common stock of
$43.50
per share on October 31, 2017. In addition, following certain corporate events that occur prior to the maturity date as described in the Indenture, we will pay a make-whole premium by increasing the conversion rate for a holder who elects to convert its 2024 Notes in connection with such a corporate event in certain circumstances. For purposes of calculating earnings per share, if the average market price of our common stock exceeds the applicable conversion price during the periods reported, shares contingently issuable under the 2024 Notes will have a dilutive effect with respect to our common stock. At
December 31, 2017
, the “if-converted value” did not
F-21
CHART INDUSTRIES, INC. AND SUBSIDIARIES
NOTES TO CONSOLIDATED FINANCIAL STATEMENTS — (Continued)
(Dollars and shares in millions, except per share amounts)
exceed the principal amount of the 2024 Notes since the closing sales price of our common stock was less than the conversion price of the 2024 Notes.
Holders of the 2024 Notes may convert their 2024 Notes at their option at any time prior to the close of business on the business day immediately preceding August 15, 2024 only under the following circumstances: (1) during any fiscal quarter commencing after December 31, 2017 (and only during such fiscal quarter), if the last reported sale price of our common stock for at least 20 trading days (whether or not consecutive) during the period of 30 consecutive trading days ending on, and including, the last trading day of the immediately preceding fiscal quarter is greater than or equal to 130% of the applicable conversion price for the 2024 Notes on each applicable trading day; (2) during the five business day period after any 10 consecutive trading day period (the “measurement period”) in which the “trading price” (as defined in the Indenture) per one thousand U.S. dollar principal amount of Notes for each trading day of such measurement period was less than 97% of the product of the last reported sale price of our common stock and the applicable conversion rate for the 2024 Notes on each such trading day; or (3) upon the occurrence of specified corporate events described in the Indenture.
On or after August 15, 2024 until the close of business on the second scheduled trading day immediately preceding November 15, 2024, holders may convert their 2024 Notes at the option of the holder regardless of the foregoing circumstances. Upon conversion, we may settle the conversion by paying or delivering either shares of our common stock, solely cash, or a combination of cash and shares of our common stock, at our election. It is our intention to settle the principal amount of the 2024 Notes in cash and excess conversion value in shares of our common stock.
We reassess the convertibility of the 2024 Notes and the related balance sheet classification on a quarterly basis.
As of December 31, 2017
, events for early conversion were not met, and thus the 2024 Notes were not convertible as of and for the fiscal quarter beginning
January 1, 2018
. There have been no conversions as of the date of this filing.
We allocated the gross proceeds of the 2024 Notes between the liability and equity components of the 2024 Notes. The initial liability component of
$200.1
, which was recorded as long-term debt, represents the fair value of similar debt instruments that have no conversion rights. The initial equity component of
$58.7
, which was recorded as additional paid-in capital, represents the debt discount and was calculated as the difference between the fair value of the liability component and gross proceeds of the 2024 Notes. The liability component was recognized at the present value of its associated cash flows using a
4.8%
straight-debt rate (as defined in Note 2) and is being accreted to interest expense over the term of the 2024 Notes.
We recorded
$5.2
in deferred debt issuance costs associated with the 2024 Notes, which are being amortized over the term of the 2024 Notes using the effective interest method. We also recorded
$1.5
in equity issuance costs, which was recorded as a reduction to additional paid-in capital in the December 31, 2017 consolidated balance sheet.
The following table summarizes interest accretion of the 2024 Notes discount, 1.0% contractual interest coupon and financing costs amortization associated with the 2024 Notes:
|
|
Year Ended December 31, 2017
|
||
|
2024 Notes, interest accretion of convertible notes discount
|
$
|
1.1
|
|
|
2024 Notes, 1.0% contractual interest coupon
|
0.4
|
|
|
|
2024 Notes, total interest expense
|
$
|
1.5
|
|
|
2024 Notes, financing costs amortization
|
$
|
0.1
|
|
Convertible Note Hedge and Warrant Transactions Associated with the 2024 Notes
In connection with the pricing of the 2024 Notes, we entered into convertible note hedge transactions (the “Note Hedge Transactions”) with certain parties, including the initial purchasers of the 2024 Notes (the “Option Counterparties”). The Note Hedge Transactions are expected generally to reduce the potential dilution upon any future conversion of the 2024 Notes. Payments for the Note Hedge Transactions totaled approximately
$59.5
and were recorded as a reduction to additional paid-in capital in the December 31, 2017 consolidated balance sheet.
We also entered into separate, privately negotiated warrant transactions (the “Warrant Transactions”) with the Option Counterparties to acquire up to
4.4
shares of our common stock. Proceeds received from the issuance of the Warrant Transactions totaled approximately
$46.0
and were recorded as an addition to additional paid-in capital in the December 31, 2017 consolidated
F-22
CHART INDUSTRIES, INC. AND SUBSIDIARIES
NOTES TO CONSOLIDATED FINANCIAL STATEMENTS — (Continued)
(Dollars and shares in millions, except per share amounts)
balance sheet. The strike price of the Warrant Transactions will initially be
$71.775
per share (subject to adjustment), which is approximately 65% above the last reported sale price of our common stock on October 31, 2017. The Warrant Transactions could have a dilutive effect to our stockholders to the extent that the market price per share of our common stock, as measured under the terms of the Warrant Transactions, exceeds the applicable strike price of the warrants.
The Note Hedge Transactions and Warrant Transactions effectively increased the conversion price of the 2024 Notes. The net cost of the Note Hedge Transactions and Warrant Transactions was approximately
$13.5
.
2018 Convertible Notes
On August 3, 2011, we issued 2.00% Convertible Senior Subordinated Notes due August 2018 (the “2018 Notes”) in the aggregate principal amount of
$250.0
, pursuant to an Indenture, dated as of such date (the “Senior Debt Indenture”). The 2018 notes bear interest at the annual rate of
2.0%
per year, payable on February 1 and August 1 of each year, and will mature on August 1, 2018 unless earlier converted or repurchased. The effective interest rate at issuance was
7.9%
.
2018 Convertible Notes Repurchase and Loss on Extinguishment of Debt
On November 6, 2017, we used
$195.9
of the proceeds from the offering of the 2024 Notes to repurchase
$192.9
principal amount of the 2018 Notes, which included
$1.0
of accrued interest and
$194.9
for the notes. As of December 31, 2017,
$57.1
principal amount remains outstanding under the 2018 Notes.
Pursuant to extinguishment guidance, settlement consideration is first allocated to the extinguishment of the liability component equal to the fair value of that component immediately prior to extinguishment, and any difference between the net carrying amount and that allocated amount and unamortized deferred debt issuance costs should be recognized as a gain or loss on debt extinguishment. Any remaining consideration is allocated to the reacquisition of the equity component and recognized as a reduction of shareholders’ equity. The fair value of the liability component immediately prior to the extinguishment of debt was measured first, with the difference between the fair value of the aggregate consideration remitted to the holder and the fair value of the liability component attributed to the reacquisition of the equity component.
The fair value of the liability component was estimated by calculating the present value of its cash flows using a discount rate of
4.8%
, the then-current market rate for similar debt instruments that have no conversion rights. Of the
$194.9
of consideration transferred at settlement,
$189.0
was attributed to the extinguishment of the liability component, and
$5.8
was attributed to the reacquisition of the equity component, which was recorded as a reduction to additional paid-in capital. The carrying amount of the liability was
$184.7
on the day immediately before the settlement, resulting in a
$4.3
loss on extinguishment associated with the bond cost portion of the 2018 Notes. Additionally,
$1.0
of interest, which had previously been accrued was paid at settlement.
2018 Notes Details
The 2018 Notes are senior subordinated unsecured obligations of the Company and are not guaranteed by any of our subsidiaries. The 2018 Notes are senior in right of payment to our future subordinated debt, equal in right of payment with our future senior subordinated debt and are subordinated in right of payment to our existing and future senior indebtedness, including indebtedness under our existing credit agreement.
A conversion of the 2018 Notes may be settled in cash, shares of our common stock or a combination of cash and shares of our common stock in excess of the aggregate principal amount of the 2018 Notes being converted, at our election (subject to, and in accordance with, the settlement provisions of the Senior Debt Indenture). The initial conversion rate for the 2018 Notes is
14.4865
shares of common stock (subject to adjustment as provided for in the Senior Debt Indenture) per one thousand U.S. dollar principal amount of the 2018 Notes, which is equal to an initial conversion price of approximately
$69.03
per share. In addition, following certain corporate events that occur prior to the maturity date as described in the Senior Debt Indenture, we will pay a make-whole premium by increasing the conversion rate for a holder who elects to convert its 2018 Notes in connection with such a corporate event in certain circumstances. For purposes of calculating earnings per share, if the average market price of our common stock exceeds the applicable conversion price during the periods reported, shares contingently issuable under the 2018 Notes will have a dilutive effect with respect to our common stock. At
December 31, 2017
, the “if-converted value” did not exceed the principal amount of the 2018 Notes since the closing sales price of our common stock was less than the conversion price of the 2018 Notes.
F-23
CHART INDUSTRIES, INC. AND SUBSIDIARIES
NOTES TO CONSOLIDATED FINANCIAL STATEMENTS — (Continued)
(Dollars and shares in millions, except per share amounts)
Holders of the 2018 Notes may convert their 2018 Notes at their option at any time prior to the close of business on the business day immediately preceding May 1, 2018 only under the following circumstances: (1) during any fiscal quarter commencing after September 11, 2011 (and only during such fiscal quarter), if the last reported sale price of our common stock for at least 20 trading days (whether or not consecutive) during a period of 30 consecutive trading days ending on, and including, the last trading day of the immediately preceding fiscal quarter is greater than or equal to 130% of the applicable conversion price for the 2018 Notes on each applicable trading day; (2) during the five consecutive business day period after any five consecutive trading day period (the “2018 Notes measurement period”) in which the “trading price” (as defined in the Senior Debt Indenture) per one thousand U.S. dollar principal amount of 2018 Notes for each trading day of such measurement period was less than 97% of the product of the last reported sale price of our common stock and the applicable conversion rate for the Notes on each such trading day; or (3) upon the occurrence of specified corporate events described in the Indenture.
On or after May 1, 2018 until the close of business on the second scheduled trading day immediately preceding August 1, 2018, holders may convert their 2018 Notes at the option of the holder regardless of the foregoing circumstances. Upon conversion, we will pay cash up to the aggregate principal amount of the 2018 Notes to be converted and pay or deliver, as the case may be, cash, shares of our common stock or a combination of cash and shares of our common stock, at our election, in respect of the remainder, if any, of our conversion obligation in excess of the aggregate principal amount of the 2018 Notes being converted. It is our intention to settle any excess conversion value in shares of our common stock.
We reassess the convertibility of the 2018 Notes and the related balance sheet classification on a quarterly basis.
As of December 31, 2017
and 2016 events for early conversion were not met, and thus the 2018 Notes were not convertible as of and for the fiscal quarters beginning
January 1, 2018
and 2017. There have been no conversions as of the date of this filing.
Upon issuance in 2011, we allocated the gross proceeds of the 2018 Notes between the liability and equity components of the 2018 Notes. The initial liability component of
$170.9
, which was recorded as long-term debt, represented the fair value of similar debt instruments that had no conversion rights. The initial equity component of
$79.1
, which was recorded as additional paid-in capital, represented the debt discount and was calculated as the difference between the fair value of the liability component and gross proceeds of the 2018 Notes. The liability component was recognized at the present value of its associated cash flows using a
7.9%
straight-debt rate (as defined in Note 2) and is being accreted to interest expense over the term of the 2024 Notes.
The following table summarizes interest accretion of the 2018 Notes discount, 2.0% contractual interest coupon, loss on extinguishment of debt and financing costs amortization associated with the 2018 Notes:
|
Year Ended December 31,
|
|||||||||||
|
|
2017
|
2016
|
2015
|
||||||||
|
2018 Notes, interest accretion of convertible notes discount
|
$
|
11.8
|
|
$
|
12.5
|
|
$
|
11.5
|
|
||
|
2018 Notes, 2.0% contractual interest coupon
|
4.3
|
|
5.0
|
|
5.0
|
|
|||||
|
2018 Notes, total interest expense
|
$
|
16.1
|
|
$
|
17.5
|
|
$
|
16.5
|
|
||
|
2018 Notes, loss on extinguishment of debt, bond cost portion
|
4.3
|
|
—
|
|
—
|
|
|||||
|
2018 Notes, write off of unamortized debt issuance costs
|
0.4
|
|
—
|
|
—
|
|
|||||
|
2018 Notes, total loss on extinguishment of debt
(1)
|
$
|
4.7
|
|
$
|
—
|
|
$
|
—
|
|
||
|
2018 Notes, financing costs amortization
|
$
|
0.6
|
|
$
|
0.7
|
|
$
|
0.7
|
|
||
______________
|
(1)
|
During the year ended December 31, 2017, we wrote off
$0.2
of unamortized debt issuance costs related to our senior secured revolving credit facility. When combined with the total loss on extinguishment associated with the 2018 Notes, consolidated loss on extinguishment is
$4.9
.
|
Convertible Note Hedge, Capped Call and Warrant Transactions Associated with the 2018 Notes
In connection with the issuance of the 2018 Notes, we entered into privately-negotiated convertible note hedge, capped call and separate warrant transactions (the “Existing Call Spread”). These transactions were accounted for as equity instruments at issuance. The cap price of the capped call transactions and the strike price of the warrant transactions was initially
$84.96
per share. In connection with the partial extinguishment of the 2018 Notes, we entered into transactions with financial institutions to
F-24
CHART INDUSTRIES, INC. AND SUBSIDIARIES
NOTES TO CONSOLIDATED FINANCIAL STATEMENTS — (Continued)
(Dollars and shares in millions, except per share amounts)
terminate a portion of the Existing Call Spread (the “Partial Unwind Transactions”). On the payment date, the number of warrants as a result of the Partial Unwind Transactions was reduced to
0.8
shares of common stock, which represents the number of shares of our common stock underlying the 2018 Notes after the partial extinguishment of debt.
Senior Secured Revolving Credit Facility
On November 3, 2017, we amended and extended our prior
five
-year
$450.0
senior secured revolving credit facility with a
five
-year
$450.0
senior secured revolving credit facility (the “SSRCF”), which matures on November 3, 2022. The SSRCF includes a
$25.0
sub-limit for the issuance of swingline loans and a
$100.0
base sub-limit along with a
$100.0
discretionary sub-limit to be used for letters of credit. There is a foreign currency limit of
$100.0
under the SSRCF which can be used for foreign currency denominated letters of credit and borrowings in a foreign currency, in each case in currencies agreed upon with the lenders. In addition, the facility permits borrowings up to
$100.0
made by our wholly-owned subsidiaries, Chart Industries Luxembourg S.à r.l. (“Chart Luxembourg”) and Chart Asia Investment Company Limited (“Chart Asia”). The SSRCF also includes an expansion option permitting us to add up to an aggregate
$225.0
in term loans or revolving credit commitments from its lenders.
Revolving loans under the SSRCF bear interest, at the applicable Borrower’s election, at a rate per annum equal to either (i) the greatest of (a) the Prime Rate (as defined in the SSRCF) in effect on such day, (b) the NYFRB Rate (as defined in the SSRCF) in effect on such day plus 1/2 of 1.0% and (c) the Adjusted LIBOR (as defined in the SSRCF) for a one-month interest period on such day (or if such day is not a business day, the immediately preceding business day) plus 1.0% (the “Adjusted Base Rate”), plus a margin that varies with our leverage ratio, or (ii) the Adjusted LIBOR (as defined in the SSRCF) for the relevant interest period in effect for such day, plus a margin that varies with our leverage ratio.
In addition, we are required to pay a commitment fee of between
0.20%
and
0.375%
of the unused revolver balance and a letter of credit participation fee equal to the daily aggregate letter of credit exposure at the rate per annum equal to the Applicable Margin for Eurocurrency Revolving Facility Borrowings (as defined in the SSRCF, ranging from
1.5%
to
2.5%
, depending on the leverage ratio calculated at each fiscal quarter end). A fronting fee must be paid on each letter of credit that is issued equal to
0.125%
per annum of the stated dollar amount of the letter of credit.
Significant financial covenants for the SSRCF include a minimum liquidity requirement equal to the principal amount of the 2018 Notes outstanding six months prior to the maturity date of the 2018 Notes and when holders of the 2018 Notes have the option to require us to repurchase the 2018 Notes, a maximum leverage ratio of 3.25 and a minimum interest coverage to EBITDA ratio of 3.0. The required leverage ratio can be relaxed on up to two occasions, upon notification to the lenders, to 3.75 for up to four consecutive fiscal quarters, for acquisitions and plant expansions of $100.0 or greater. The SSRCF contains a number of other customary covenants including, but not limited to, restrictions on our ability to incur additional indebtedness, create liens or other encumbrances, sell assets, enter into sale and lease-back transactions, make certain payments, investments, loans, advances or guarantees, make acquisitions and engage in mergers or consolidations and pay dividends or distributions. At
December 31, 2017
, we were in compliance with all covenants.
We recorded
$1.6
in deferred debt issuance costs associated with the SSRCF which are being amortized over the five-year term of the SSRCF. At
December 31, 2017
, unamortized debt issuance costs associated with the SSRCF were
$2.4
. For each of the years ended December 31, 2017, 2016, and 2015, deferred financing fees amortization was
$0.6
.
At
December 31, 2017
, there were
$239.0
in borrowings outstanding under the SSRCF (“SSRCF Borrowings”), bearing interest at
4.00%
. We borrowed
$300.0
against this facility to fund the acquisition of Hudson. For the year ended December 31, 2017, interest expense related to the SSRCF Borrowings was
$2.7
. We had
$42.9
in letters of credit issued and bank guarantees supported by the SSRCF, which had availability of
$168.1
at
December 31, 2017
. The obligations under the SSRCF are guaranteed by the Company and substantially all of its U.S. subsidiaries and secured by substantially all of the assets of the Company and its U.S. subsidiaries and
65%
of the capital stock of our material non-U.S. subsidiaries (as defined by the SSRCF) that are owned by U.S. subsidiaries.
F-25
CHART INDUSTRIES, INC. AND SUBSIDIARIES
NOTES TO CONSOLIDATED FINANCIAL STATEMENTS — (Continued)
(Dollars and shares in millions, except per share amounts)
Foreign Facilities – China
Chart Cryogenic Engineering Systems (Changzhou) Company Limited (“CCESC”) and Chart Biomedical (Chengdu) Co. Ltd. (“Chengdu”), wholly-owned subsidiaries of the Company, and Chart Cryogenic Distribution Equipment (Changzhou) Company Limited (“CCDEC”), a joint venture of the Company, maintain joint banking facilities (the “China Facilities”) which include a revolving facility with
50.0 million
Chinese yuan (equivalent to
$7.7
) in borrowing capacity which can be utilized for either revolving loans, bonds/guarantees, or bank draft acceptances. Any borrowings made by CCESC, CCDEC or Chengdu under the China Facilities are guaranteed by the Company. At
December 31, 2017
, there were no borrowings outstanding under the revolving facility, but CCESC and CCDEC, together, had a combined total of
1.6 million
Chinese yuan (equivalent to
$0.3
), in bank guarantees.
CCDEC maintains an unsecured credit facility whereby CCDEC may borrow up to
30.0 million
Chinese yuan (equivalent to
$4.6
) for working capital purposes. At
December 31, 2017
, there was
5.0 million
Chinese yuan (equivalent to
$0.8
) outstanding under this facility, bearing interest at
4.35%
.
CCESC has a term loan that is secured by certain CCESC land use rights and allows for up to
86.6 million
Chinese yuan (equivalent to
$13.3
) in borrowings. The loan has a term of eight years with semi-annual installment payments of at least
10.0 million
Chinese yuan and a final maturity date of May 26, 2024. At
December 31, 2017
, there was
46.6 million
Chinese yuan (equivalent to
$7.1
) outstanding on this loan, bearing interest at
5.39%
.
Foreign Facilities – Europe
Chart Ferox, a.s. (“Ferox”), a wholly-owned subsidiary of the Company, maintains a secured credit facility with capacity of up to
125.0 million
Czech koruna (equivalent to
$5.9
) and two secured credit facilities with capacity of up to
5.6 million
euros (equivalent to
$6.7
). All three facilities (the “Ferox Credit Facilities”) allow Ferox to request bank guarantees and letters of credit. None of these facilities allow revolving credit borrowings. Under two of the facilities, Ferox must pay letter of credit and guarantee fees equal to
0.70%
per annum on the face amount of each guarantee or letter of credit, and under one facility, Ferox must pay the letter of credit and guarantee fees equal to
0.50%
. Ferox’s land, buildings, and cash collateral secure the credit facilities. At
December 31, 2017
there were bank guarantees of
147.8 million
Czech koruna (equivalent to
$7.0
) supported by the Ferox Credit Facilities.
Chart Luxembourg maintains an overdraft facility with
$5.0
in borrowing capacity. There were no borrowings under the Chart Luxembourg facility as of
December 31, 2017
.
Scheduled Annual Maturities
The scheduled annual maturities of debt at
December 31, 2017
, are as follows:
|
Year
|
Amount
|
||
|
2018
(1)
|
$
|
60.9
|
|
|
2019
|
4.1
|
|
|
|
2022
|
239.0
|
|
|
|
Thereafter
|
258.8
|
|
|
|
Total
|
$
|
562.8
|
|
_______________
|
(1)
|
Includes the
$57.1
fully accreted amount of our 2018 Notes and
$3.8
current maturities related to foreign facilities.
|
Cash paid for interest during the years ended December 31,
2017, 2016 and 2015
was
$9.3
,
$5.6
, and
$5.1
, respectively.
Letters of Credit
Chart Energy & Chemicals, Inc. (“Chart E&C”), a wholly-owned subsidiary of the Company, has
$6.4
in deposits in a bank outside of the SSRCF to secure letters of credit. The deposits are treated as restricted cash and restricted cash equivalents in the consolidated balance sheets (
$5.4
in other current assets and
$1.0
in other assets at
December 31, 2017
).
F-26
CHART INDUSTRIES, INC. AND SUBSIDIARIES
NOTES TO CONSOLIDATED FINANCIAL STATEMENTS — (Continued)
(Dollars and shares in millions, except per share amounts)
Fair Value Disclosures
The fair value of the 2024 Notes was approximately 105% of their par value as of
December 31, 2017
. The fair value of the 2018 Notes was approximately 99% of their par value as of
December 31, 2017
and approximately 96% of their par value as of
December 31, 2016
. The 2024 Notes and 2018 Notes are actively quoted instruments and, accordingly, the fair values of the 2024 Notes and 2018 Notes were determined using Level 1 inputs as defined in
Note 11
.
Concentrations of Credit Risks:
We sell our products to gas producers, distributors and end-users across the industrial gas, hydrocarbon, chemical processing, respiratory therapy, and cryobiological storage industries in countries all over the world. Approximately
47%
,
50%
, and
51%
of sales were to customers in foreign countries in
2017, 2016 and 2015
, respectively. No single customer exceeded 10% of consolidated sales in 2017 and 2015. One customer exceeded 10% of consolidated sales in 2016. Total sales from this customer represented approximately $
98.9
of 2016 consolidated sales and is attributable to the E&C, D&S, and BioMedical segments. Sales to our top ten customers accounted for
35%
,
38%
and
36%
of consolidated sales in
2017, 2016 and 2015
, respectively. Our sales to particular customers fluctuate from period to period, but the large industrial gas producer and distributor customers of ours tend to be a consistently large source of revenue for us.
We are subject to concentrations of credit risk with respect to our cash and cash equivalents, restricted cash and restricted cash equivalents and forward foreign currency exchange contracts. To minimize credit risk from these financial instruments, we enter into arrangements with major banks and other quality financial institutions and invest only in high-quality instruments. We do not expect any counterparties to fail to meet their obligations.
The changes in fair value with respect to our foreign currency forward contracts generated a net gain of
$0.5
for the year ended December 31,
2017
, a net loss of
$0.8
for the year ended December 31,
2016
and a net gain of
$2.7
for the year ended December 31,
2015
.
We provide product warranties with varying terms and durations for the majority of our products. We estimate our warranty reserve by considering historical and projected warranty claims, historical and projected cost-per-claim, and knowledge of specific product issues that are outside our typical experience. We record warranty expense in cost of sales in the consolidated statement of operations. Product warranty claims not expected to occur within one year are included as part of other long-term liabilities in the consolidated balance sheets.
The following table represents changes in our consolidated warranty reserve:
|
Year Ended December 31,
|
|||||||||||
|
2017
|
2016
|
2015
|
|||||||||
|
Beginning Balance
|
$
|
18.3
|
|
$
|
21.0
|
|
$
|
24.2
|
|
||
|
Issued - Warranty Expense
|
7.1
|
|
8.8
|
|
13.7
|
|
|||||
|
Acquired - Warranty Reserve
|
0.9
|
|
—
|
|
—
|
|
|||||
|
Change in Estimate - Warranty Expense
|
2.1
|
|
1.2
|
|
3.0
|
|
|||||
|
Warranty Usage
|
(11.7
|
)
|
(12.7
|
)
|
(19.9
|
)
|
|||||
|
Ending Balance
|
$
|
16.7
|
|
$
|
18.3
|
|
$
|
21.0
|
|
||
During the third quarter of 2016, we recovered for breaches of representations and warranties primarily related to warranty costs for certain product lines acquired from AirSep Corporation (“AirSep”) in 2012 under the related representation and warranty insurance. For the year ended December 31, 2016, this reduced our BioMedical segment’s cost of sales by
$15.2
.
Hudson Acquisition
On September 20, 2017, the Company and Chart Sully Corporation, a wholly owned subsidiary of the Company (“Merger Sub”), completed the previously announced acquisition of Hudson pursuant to the terms of the Agreement and Plan of Merger, as amended (the “Merger Agreement”), by and between Chart, Merger Sub, Hudson and R/C Hudson Holdings, L.P., solely in its
F-27
CHART INDUSTRIES, INC. AND SUBSIDIARIES
NOTES TO CONSOLIDATED FINANCIAL STATEMENTS — (Continued)
(Dollars and shares in millions, except per share amounts)
capacity as the Initial Holder Representative under the Merger Agreement. The acquisition was accomplished by the merger of Merger Sub with and into Hudson, with Hudson surviving the merger as a wholly owned subsidiary of the Company (the “Acquisition”). The acquisition purchase price was
$419.5
, net of cash acquired, including a net working capital adjustment amount of
$6.0
, and
$3.5
in acquisition-related tax benefits acquired, as defined in the Merger Agreement. Approximately
$300.0
of the purchase price was funded through borrowings under our senior secured revolving credit facility, and the remainder of the purchase price was funded with cash on hand.
Hudson, which has operations in the United States, China and Italy and a joint venture in Mexico, designs, manufactures, sells and services products used in refining, heating, ventilation and air conditioning (HVAC), petrochemical, natural gas, power generation, industrial and commercial end markets. Hudson is a North American leader in air-cooled heat exchangers and a global leader in axial flow cooling fans. Hudson’s results of operations are included in our E&C segment since the date of the acquisition.
As defined in our significant accounting policy for business combinations in Note 2, we preliminarily allocated the acquisition consideration to tangible and identifiable intangible assets acquired and liabilities assumed based on their preliminary estimated fair values as of the acquisition date. The preliminary fair value of the acquired tangible and identifiable intangible assets were determined based on inputs that are unobservable and significant to the overall fair value measurement. It is also based on estimates and assumptions made by management at the time of the acquisition. As such, this was classified as Level 3 fair value hierarchy measurements and disclosures.
We estimated the preliminary fair value of acquired unpatented technology and trademarks and trade names using the relief from royalty method. The preliminary fair values of acquired customer backlog and customer relationships were estimated using the multi-period excess earnings method. Under both the relief from royalty and multi-period excess earnings methods, the fair value models incorporate estimates of future cash flows, estimates of allocations of certain assets and cash flows, estimates of future growth rates, and management’s judgment regarding the applicable discount rates to use to discount such estimates of cash flows. The estimated useful lives of identifiable finite-lived intangible assets range from
2
to
15
years.
Hudson complements our E&C segment with the addition of its Fin-Fan® brand and other air cooled heat exchangers which broaden E&C’s end market diversity from primarily liquefied natural gas, industrial and natural gas to include HVAC, petrochemical and power generation. The addition of Hudson’s fans business, known by the Tuf-Lite® and Cofimco® brands, allows E&C to offer a broader technology solution for our customers. Management anticipates the combination of strong engineering cultures will continue to further develop full service solutions for our customers. The preliminary estimated goodwill was established due to the benefits outlined above, as well as the benefits derived from the anticipated synergies of Hudson integrating with Chart’s E&C segment. Goodwill recorded for the Hudson acquisition is not expected to be deductible for tax purposes.
The acquisition consideration allocation below is preliminary, pending completion of the fair value analyses of acquired assets and liabilities as well as certain other analyses. The excess of the purchase price over the estimated fair values is assigned to goodwill. As additional information becomes available, we may further revise the preliminary acquisition consideration allocation during the remainder of the measurement period, which shall not exceed twelve months from the closing of the acquisition. Any such revisions or changes may be material.
F-28
CHART INDUSTRIES, INC. AND SUBSIDIARIES
NOTES TO CONSOLIDATED FINANCIAL STATEMENTS — (Continued)
(Dollars and shares in millions, except per share amounts)
The following table summarizes the estimated fair values of the assets acquired and liabilities assumed in the Hudson acquisition:
|
December 31, 2017
|
Adjustments
|
As Previously Reported
September 30, 2017
|
|||||||||
|
Net assets acquired:
|
|||||||||||
|
Goodwill
|
$
|
238.3
|
|
$
|
10.9
|
|
$
|
227.4
|
|
||
|
Identifiable intangible assets
|
211.0
|
|
9.0
|
|
202.0
|
|
|||||
|
Accounts receivable
|
34.6
|
|
—
|
|
34.6
|
|
|||||
|
Property, plant and equipment
|
29.4
|
|
(1.2
|
)
|
30.6
|
|
|||||
|
Inventories
|
26.5
|
|
1.6
|
|
24.9
|
|
|||||
|
Other current assets
(1)
|
8.1
|
|
(1.2
|
)
|
9.3
|
|
|||||
|
Unbilled contract revenue
|
4.9
|
|
0.3
|
|
4.6
|
|
|||||
|
Other assets
|
2.9
|
|
—
|
|
2.9
|
|
|||||
|
Prepaid expenses
|
0.9
|
|
—
|
|
0.9
|
|
|||||
|
Deferred tax liabilities
|
(87.6
|
)
|
(19.0
|
)
|
(68.6
|
)
|
|||||
|
Accounts payable
|
(21.2
|
)
|
—
|
|
(21.2
|
)
|
|||||
|
Customer advances and billings in excess of contract revenue
|
(17.4
|
)
|
(0.5
|
)
|
(16.9
|
)
|
|||||
|
Accrued salaries, wages and benefits
|
(4.4
|
)
|
—
|
|
(4.4
|
)
|
|||||
|
Other current liabilities
|
(3.8
|
)
|
0.2
|
|
(4.0
|
)
|
|||||
|
Other long-term liabilities
|
(1.9
|
)
|
—
|
|
(1.9
|
)
|
|||||
|
Current portion of warranty reserve
|
(0.8
|
)
|
—
|
|
(0.8
|
)
|
|||||
|
Net assets acquired
|
$
|
419.5
|
|
$
|
0.1
|
|
$
|
419.4
|
|
||
_______________
|
(1)
|
Pursuant to the provisions of the Merger Agreement, Hudson deposited
$2.3
into a Rabbi Trust which represents amounts payable to eligible parties under Long-Term Incentive Agreements. This balance is treated as restricted cash and restricted cash equivalents in the consolidated balance sheets and is classified as other current assets.
|
Information regarding identifiable intangible assets acquired in the Hudson acquisition is presented below:
|
Weighted-average Estimated Useful Life
|
Preliminary Estimated Asset Fair Value
|
||||
|
Finite-lived intangible assets:
|
|||||
|
Customer relationships
|
13 years
|
$
|
122.1
|
|
|
|
Unpatented technology
|
10 years
|
18.3
|
|
||
|
Customer backlog
(1)
|
2 years
|
1.3
|
|
||
|
Total finite-lived intangible assets acquired
|
12 years
|
141.7
|
|
||
|
Indefinite-lived intangible assets:
|
|||||
|
Trademarks and trade names
|
69.3
|
|
|||
|
Total identifiable intangible assets acquired
|
$
|
211.0
|
|
||
_______________
|
(1)
|
Customer backlog acquired is included in “Patents and other” in Note 6. Goodwill and Intangible Assets.
|
For the year ended December 31, 2017, net sales attributed to the acquired Hudson operations were
$58.0
. For the same period, Hudson contributed
$6.4
to operating income which included
$3.3
of intangible asset amortization expense. During the year ended December 31, 2017, we incurred
$9.0
in acquisition related costs related to the Hudson acquisition which were recorded in Corporate selling, general and administrative expenses in the consolidated statements of operations.
F-29
CHART INDUSTRIES, INC. AND SUBSIDIARIES
NOTES TO CONSOLIDATED FINANCIAL STATEMENTS — (Continued)
(Dollars and shares in millions, except per share amounts)
Unaudited Supplemental Pro Forma Information
The following unaudited supplemental pro forma financial information is based on our historical consolidated financial statements and Hudson’s historical consolidated financial statements as adjusted to give effect to the September 20, 2017 acquisition of Hudson. The unaudited supplemental pro forma financial information for the periods presented gives effect to the acquisition as if it had occurred on January 1, 2016.
The following adjustments are reflected in the unaudited pro forma financial table below:
|
•
|
the effect of decreased interest expense related to the repayment of the Hudson term loan and revolving credit facility, net of the additional borrowing on the Chart senior secured revolving credit facility,
|
•
amortization of acquired intangible assets,
•
step-up depreciation of acquired property, plant and equipment,
•
inventory fair value step-up amortization expense,
|
•
|
nonrecurring acquisition-related expenses incurred by Hudson directly attributable to the Hudson acquisition of
$16.5
was adjusted out of the pro forma net income attributable to the Company for the year ended December 31, 2017, and
|
|
•
|
nonrecurring acquisition-related expenses incurred by Chart directly related to the Hudson acquisition of
$9.0
was adjusted out of the pro forma net income attributable to the Company for the year ended December 31, 2017.
|
This unaudited pro forma financial information is presented for informational purposes only and is not necessarily indicative of the results of operations that actually would have resulted had the acquisition been in effect at the beginning of the periods presented. In addition, the unaudited pro forma results are not intended to be a projection of future results and do not reflect any operating efficiencies or cost savings that might be achievable.
The following table presents pro forma sales, net income attributable to the Company, and net income attributable to the Company per common share data assuming Hudson was acquired at the beginning of the 2016 fiscal year, and assuming a 35% effective tax rate in both years:
|
|
Year Ended December 31,
|
||||||
|
|
2017
|
2016
|
|||||
|
Pro forma sales
|
$
|
1,130.0
|
|
$
|
1,029.0
|
|
|
|
Pro forma net income attributable to Chart Industries, Inc.
|
16.8
|
|
17.1
|
|
|||
|
Pro forma net income attributable to Chart Industries, Inc. per common share, basic
|
0.55
|
|
0.56
|
|
|||
|
Pro forma net income attributable to Chart Industries, Inc. per common share, diluted
|
0.54
|
|
0.55
|
|
|||
VCT Vogel GmbH Acquisition
On August 31, 2017, Chart Germany GmbH, a wholly-owned subsidiary of the Company, acquired
100%
of the equity interests of VCT Vogel GmbH (“VCT”) for a total purchase price of
3.6 million
euros (equivalent to
$4.2
) less a hold back amount of
0.4 million
euros (equivalent to
$0.4
) to be paid to the sellers over a two-year period. VCT, located in Gablingen, Germany, services and repairs cryogenic and other mobile gas tank equipment and trucks. VCT also designs, manufactures and sells truck mounted drive and control systems for the operation of cryogenic pumps on trailers, rigid trucks and containers. VCT’s results are included in our D&S segment from the date of acquisition.
Additional information related to the VCT acquisition has not been presented because the impact on our consolidated results of operations and financial position is not material.
F-30
CHART INDUSTRIES, INC. AND SUBSIDIARIES
NOTES TO CONSOLIDATED FINANCIAL STATEMENTS — (Continued)
(Dollars and shares in millions, except per share amounts)
Hetsco, Inc. Acquisition
On January 13, 2017, we acquired
100%
of the equity interests in Hetsco, Inc. from Global Power Equipment Group, Inc. for an estimated purchase price of
$23.2
, which was paid upon closing. The purchase price allocation reported at March 31, 2017 was preliminary and was based on provisional fair values. During the second quarter, we received revised third-party valuations, performed other analyses and recorded
$0.4
in accounts receivable for post-closing adjustments, which resulted in an adjusted net purchase price of
$22.8
. No further post-closing adjustments are expected. The post-closing adjustments and revised fair values resulted in the following adjustments to the net assets acquired:
|
December 31, 2017
|
Adjustments
|
As Previously Reported
March 31, 2017
|
|||||||||
|
Goodwill
|
$
|
8.8
|
|
$
|
(1.3
|
)
|
$
|
10.1
|
|
||
|
Identifiable intangible assets – customer relationships
|
8.1
|
|
0.8
|
|
7.3
|
|
|||||
|
Other identifiable intangible assets
|
1.2
|
|
—
|
|
1.2
|
|
|||||
|
Other net assets
|
4.7
|
|
0.1
|
|
4.6
|
|
|||||
|
Net assets acquired
|
$
|
22.8
|
|
$
|
(0.4
|
)
|
$
|
23.2
|
|
||
The assets acquired and liabilities assumed were recorded at their estimated fair values as of the acquisition date.
Hetsco, Inc. is headquartered in Franklin, Indiana and provides emergency, specialty welding and construction services to natural gas processing, petrochemical, and air gas separation industries. Hetsco’s results are included in our E&C segment from the date of acquisition.
Pro-forma information related to the Hetsco, Inc. acquisition has not been presented because the impact on our consolidated results of operations and financial position is not material.
Contingent Consideration
The estimated fair value of contingent consideration relating to the 2015 D&S Thermax acquisition was
$1.8
at the date of acquisition and was valued according to a discounted cash flow approach, which included assumptions regarding the probability of achieving certain earnings targets and a discount rate applied to the potential payments. Potential payments may be paid between January 1, 2018 and July 1, 2019 based on the attainment of certain earnings targets. The potential payments related to Thermax contingent consideration are between
$0.0
and
$11.3
.
Valuations are performed using Level 3 inputs as defined in the Fair Value Measurements note and are evaluated on a quarterly basis based on forecasted sales and earnings targets. Contingent consideration liabilities are classified as other current liabilities and other long-term liabilities in the consolidated balance sheets. Changes in fair value of contingent consideration, including accretion, are recorded as selling, general, and administrative expenses in the consolidated statements of operations.
The following table represents the changes in contingent consideration liabilities by segment:
|
|
Distribution & Storage
|
BioMedical
|
Total
|
||||||||
|
Balance at January 1, 2015
|
$
|
—
|
|
$
|
1.1
|
|
$
|
1.1
|
|
||
|
Fair value of contingent consideration at inception
|
1.8
|
|
—
|
|
1.8
|
|
|||||
|
Decrease in fair value of contingent consideration liabilities
|
—
|
|
(0.5
|
)
|
(0.5
|
)
|
|||||
|
Payment of contingent consideration
|
—
|
|
(0.6
|
)
|
(0.6
|
)
|
|||||
|
Balance at December 31, 2015
|
1.8
|
|
—
|
|
1.8
|
|
|||||
|
Increase in fair value of contingent consideration liabilities
|
0.1
|
|
—
|
|
0.1
|
|
|||||
|
Balance at December 31, 2016
|
1.9
|
|
—
|
|
1.9
|
|
|||||
|
Decrease in fair value of contingent consideration liabilities
|
(1.6
|
)
|
—
|
|
(1.6
|
)
|
|||||
|
Balance at December 31, 2017
|
$
|
0.3
|
|
$
|
—
|
|
$
|
0.3
|
|
||
For the year ended December 31, 2017, the fair value of contingent consideration decreased by
$1.6
, which was primarily driven by economic circumstances that significantly reduced the likelihood of achieving certain earnings targets for the duration of the remaining potential payout period.
F-31
CHART INDUSTRIES, INC. AND SUBSIDIARIES
NOTES TO CONSOLIDATED FINANCIAL STATEMENTS — (Continued)
(Dollars and shares in millions, except per share amounts)
We measure our financial assets and liabilities at fair value on a recurring basis using a three-tier fair value hierarchy, which prioritizes the inputs used in the valuation methodologies. The three levels of inputs used to measure fair value are as follows:
Level 1
— Valuations based on quoted prices for identical assets and liabilities in active markets.
Level 2
— Valuations based on observable inputs other than quoted prices included in Level 1, such as quoted prices for similar assets and liabilities in active markets, quoted prices for identical or similar assets and liabilities in markets that are not active, or other inputs that are observable or can be corroborated by observable market data.
Level 3
— Valuations based on unobservable inputs reflecting our own assumptions, consistent with reasonably available assumptions made by other market participants. These valuations require significant judgment.
Recurring Fair Value Measurements
Financial assets and liabilities measured at fair value on a recurring basis and presented in our consolidated balance sheets are as follows:
|
December 31, 2017
|
|||||||||||
|
Total
|
Level 2
|
Level 3
|
|||||||||
|
Foreign currency forward contracts
|
$
|
0.1
|
|
$
|
0.1
|
|
$
|
—
|
|
||
|
Total financial assets
|
$
|
0.1
|
|
$
|
0.1
|
|
$
|
—
|
|
||
|
Contingent consideration liabilities
|
$
|
0.3
|
|
$
|
—
|
|
$
|
0.3
|
|
||
|
Total financial liabilities
|
$
|
0.3
|
|
$
|
—
|
|
$
|
0.3
|
|
||
|
December 31, 2016
|
|||||||||||
|
Total
|
Level 2
|
Level 3
|
|||||||||
|
Foreign currency forward contracts
|
$
|
0.1
|
|
$
|
0.1
|
|
$
|
—
|
|
||
|
Contingent consideration liabilities
|
1.9
|
|
—
|
|
1.9
|
|
|||||
|
Total financial liabilities
|
$
|
2.0
|
|
$
|
0.1
|
|
$
|
1.9
|
|
||
Refer to
Note 8
for further information regarding foreign currency forward contracts and
Note 10
for further information regarding contingent consideration liabilities.
Non-Recurring Fair Value Measurements
During 2016, we recorded asset impairment charges of
$1.2
. Refer to
Note 3
,
Asset Impairments
, for further information regarding these charges and the associated significant unobservable inputs.
F-32
CHART INDUSTRIES, INC. AND SUBSIDIARIES
NOTES TO CONSOLIDATED FINANCIAL STATEMENTS — (Continued)
(Dollars and shares in millions, except per share amounts)
The components of accumulated other comprehensive loss are as follows:
|
|
December 31, 2017
|
||||||||||
|
|
Foreign currency translation adjustments
|
Pension liability adjustments, net of taxes
|
Accumulated other comprehensive loss
|
||||||||
|
Beginning Balance
|
$
|
(24.7
|
)
|
$
|
(10.5
|
)
|
$
|
(35.2
|
)
|
||
|
Other comprehensive income before reclassifications, net of a tax expense of $2.9
|
25.6
|
|
(0.6
|
)
|
25.0
|
|
|||||
|
Amounts reclassified from accumulated other comprehensive loss, net of taxes of $0.4
(1) (2)
|
1.3
|
|
0.8
|
|
2.1
|
|
|||||
|
Net current-period other comprehensive income, net of taxes
|
26.9
|
|
0.2
|
|
27.1
|
|
|||||
|
Ending Balance
|
$
|
2.2
|
|
$
|
(10.3
|
)
|
$
|
(8.1
|
)
|
||
|
|
December 31, 2016
|
||||||||||
|
Foreign currency translation adjustments
|
Pension liability adjustments, net of taxes
|
Accumulated other comprehensive loss
|
|||||||||
|
Beginning Balance
|
$
|
(12.5
|
)
|
$
|
(12.4
|
)
|
$
|
(24.9
|
)
|
||
|
Other comprehensive (loss) income before reclassifications, net of taxes of $0.6
|
(12.2
|
)
|
0.9
|
|
(11.3
|
)
|
|||||
|
Amounts reclassified from accumulated other comprehensive loss, net of taxes of $0.5
(1)
|
—
|
|
1.0
|
|
1.0
|
|
|||||
|
Net current-period other comprehensive (loss) income, net of taxes
|
(12.2
|
)
|
1.9
|
|
(10.3
|
)
|
|||||
|
Ending Balance
|
$
|
(24.7
|
)
|
$
|
(10.5
|
)
|
$
|
(35.2
|
)
|
||
|
(1)
|
Amounts reclassified from accumulated other comprehensive loss were expensed and included in cost of sales (
$0.5
and
$0.6
for the years ended December 31,
2017
and
2016
, respectively) and selling, general and administrative expenses (
$0.7
and
$0.9
for the years ended December 31,
2017
and
2016
, respectively) in the consolidated statements of operations.
|
|
(2)
|
For the year ended December 31, 2017,
$1.3
was reclassified from accumulated other comprehensive loss to foreign currency loss in the consolidated statements of operations and comprehensive income related to certain intercompany transactions.
|
F-33
CHART INDUSTRIES, INC. AND SUBSIDIARIES
NOTES TO CONSOLIDATED FINANCIAL STATEMENTS — (Continued)
(Dollars and shares in millions, except per share amounts)
The following table presents calculations of net income (loss) per share of common stock:
|
|
Year Ended December 31,
|
||||||||||
|
|
2017
|
2016
|
2015
|
||||||||
|
Net income (loss) attributable to Chart Industries, Inc.
|
$
|
28.0
|
|
$
|
28.2
|
|
$
|
(203.0
|
)
|
||
|
Net income (loss) attributable to Chart Industries, Inc. per common share:
|
|||||||||||
|
Basic
|
$
|
0.91
|
|
$
|
0.92
|
|
$
|
(6.66
|
)
|
||
|
Diluted
|
$
|
0.89
|
|
$
|
0.91
|
|
$
|
(6.66
|
)
|
||
|
Weighted average number of common shares outstanding — basic
|
30.74
|
|
30.58
|
|
30.49
|
|
|||||
|
Incremental shares issuable upon assumed conversion and exercise of share-based awards
|
0.60
|
|
0.41
|
|
—
|
|
|||||
|
Weighted average number of common shares outstanding — diluted
|
31.34
|
|
30.99
|
|
30.49
|
|
|||||
Diluted earnings per share does not consider the following potential common shares as the effect would be anti-dilutive:
|
|
Year Ended December 31,
|
|||||||
|
|
2017
|
2016
|
2015
|
|||||
|
Share-based awards
|
0.40
|
|
0.56
|
|
0.94
|
|
||
|
Warrants
|
5.18
|
|
3.37
|
|
3.37
|
|
||
|
Total anti-dilutive securities
|
5.58
|
|
3.93
|
|
4.31
|
|
||
F-34
CHART INDUSTRIES, INC. AND SUBSIDIARIES
NOTES TO CONSOLIDATED FINANCIAL STATEMENTS — (Continued)
(Dollars and shares in millions, except per share amounts)
On December 22, 2017, the Tax Cuts and Jobs Act (“Tax Act”) was signed into law. The Tax Act, among other things, reduced the U.S. federal corporate tax rate from 35% to 21%, requires companies to pay a one-time transition tax on certain unrepatriated earnings of foreign subsidiaries, requires a current inclusion in U.S. federal taxable income of certain earnings of foreign corporations, and creates a new limitation on deductible interest expense. Consequently, we recorded a
$22.5
net favorable tax benefit during the fourth quarter of 2017 related to the Tax Act. This benefit mainly consisted of a one-time, provisional benefit of
$26.9
related to the remeasurement of certain of our deferred tax liabilities using the lower U.S. federal corporate tax rate of
21%
. This was partially offset by (i) a one-time, provisional charge of
$8.7
related to the deemed repatriation transition tax, which is a tax on previously untaxed accumulated earnings and profits of certain of our foreign subsidiaries, and (ii) a one-time tax expense and tax benefit of
$4.5
and
$8.7
, respectively, related to our intent to amend pre-acquisition Hudson U.S. federal tax returns.
As we complete our analysis of the Tax Act, further collect and analyze data, interpret any additional guidance issued by the U.S. Treasury Department, the IRS, and other standard-setting bodies, we may make adjustments to the provisional amounts. Those adjustments may materially impact our provision for income taxes in the period in which the adjustments are made.
At December 31, 2017, we have not completed our accounting for the income tax effects of certain elements of the Tax Act. If we were able to make reasonable estimates of the effects of elements for which our analysis is not yet complete, we recorded provisional adjustments. If we were not yet able to make reasonable estimates of the impact of certain elements, we have not recorded any adjustments related to those elements and have continued accounting for them in accordance with ASC 740 on the basis of the tax laws in effect before the Tax Act.
Our accounting for the following elements of the Tax Act is incomplete. However, we were able to make reasonable estimates of certain effects and, therefore, recorded provisional adjustments as follows:
Reduction of U.S. federal corporate tax rate:
The Tax Act reduces the U.S. federal corporate tax rate to
21%
effective January 1, 2018. For certain of our deferred tax liabilities, we have recorded a provisional decrease of
$26.9
, with a corresponding adjustment to deferred income tax benefit
$26.9
for the year ended December 31, 2017. While we are able to make a reasonable estimate of the impact of the reduction in the U.S. federal corporate tax rate, it may be affected by other analyses related to the Tax Act, including, but not limited to, our calculation of deemed repatriation of deferred foreign income and the state tax effect of adjustments made to federal temporary differences.
Deemed Repatriation Transition Tax:
The Deemed Repatriation Transition Tax (“Transition Tax”) is a tax on total post-1986 earnings and profits (E&P) of certain of our foreign subsidiaries. We were able to make a reasonable estimate of the Transition Tax and recorded (i) a one-time, provisional charge of
$8.7
related to the deemed repatriation transition tax, and (ii) a one-time tax expense and tax benefit of
$4.5
and
$8.7
, respectively, related to our intent to amend pre-acquisition Hudson U.S. federal tax returns. We have not yet completed our calculation of the total post-1986 E&P for these foreign subsidiaries. Furthermore, the Transition Tax is based in part on the amount of those earnings held in cash and other specified assets. This amount may change when we finalize the calculation of post-1986 foreign E&P previously deferred from U.S. federal taxation and finalize the amounts held in cash or other specified assets. No additional income taxes have been provided for any remaining undistributed foreign earnings not subject to the Transition Tax, or any additional outside basis difference inherent in these entities since these amounts continue to be indefinitely reinvested in foreign operations. Determining the amount of unrecognized deferred tax liability related to any remaining undistributed foreign earnings not subject to the Transition Tax and additional outside basis difference in these entities (i.e., basis difference in excess of that subject to the one-time Transition Tax) is not practicable.
Valuation allowances:
We must assess whether our valuation allowance analyses are affected by various aspects of the Tax Act (e.g. deemed repatriation of deferred foreign income, Global intangible low-taxed income (GILTI) inclusions, new categories of foreign tax credits). The GILTI provisions require us in our U.S. income tax return, to include foreign subsidiary earnings in excess of an allowable return on the foreign subsidiary’s tangible assets. We are evaluating if it will be subject to incremental U.S. tax on GILTI income beginning in 2018, due to expense allocations required by the U.S. foreign tax credit rules. We have provisionally elected to account for GILTI tax in the period in which it is incurred, and therefore, we have not provided any provisional deferred tax impacts of GILTI in our consolidated financial statements for the year ended December 31, 2017. Since, as discussed herein, we have recorded provisional amounts related to certain portions of the Tax Act, any corresponding determination of the need for or change in a valuation allowance is also provisional.
F-35
CHART INDUSTRIES, INC. AND SUBSIDIARIES
NOTES TO CONSOLIDATED FINANCIAL STATEMENTS — (Continued)
(Dollars and shares in millions, except per share amounts)
Income (Loss) Before Income Taxes
Income (loss) before income taxes consists of the following:
|
|
Year Ended December 31,
|
||||||||||
|
|
2017
|
2016
|
2015
|
||||||||
|
United States
|
$
|
2.7
|
|
$
|
40.5
|
|
$
|
(187.2
|
)
|
||
|
Foreign
|
10.9
|
|
(2.1
|
)
|
(14.6
|
)
|
|||||
|
Income (loss) before income taxes
|
$
|
13.6
|
|
$
|
38.4
|
|
$
|
(201.8
|
)
|
||
Provision
Significant components of income tax (benefit) expense are as follows:
|
|
Year Ended December 31,
|
||||||||||
|
|
2017
|
2016
|
2015
|
||||||||
|
Current:
|
|||||||||||
|
Federal
|
$
|
6.1
|
|
$
|
10.0
|
|
$
|
22.9
|
|
||
|
State and local
|
0.5
|
|
1.0
|
|
1.1
|
|
|||||
|
Foreign
|
7.3
|
|
5.3
|
|
3.1
|
|
|||||
|
Total current
|
13.9
|
|
16.3
|
|
27.1
|
|
|||||
|
Deferred:
|
|||||||||||
|
Federal
|
(28.8
|
)
|
(3.3
|
)
|
(25.7
|
)
|
|||||
|
State and local
|
(0.4
|
)
|
(0.2
|
)
|
(0.6
|
)
|
|||||
|
Foreign
|
(0.6
|
)
|
0.9
|
|
1.9
|
|
|||||
|
Total deferred
|
(29.8
|
)
|
(2.6
|
)
|
(24.4
|
)
|
|||||
|
Total income tax (benefit) expense
|
$
|
(15.9
|
)
|
$
|
13.7
|
|
$
|
2.7
|
|
||
Effective Tax Rate Reconciliation
The reconciliation of income taxes computed at the U.S. federal statutory tax rate to income tax (benefit) expense is as follows:
|
|
Year Ended December 31,
|
||||||||||
|
|
2017
|
2016
|
2015
|
||||||||
|
Income tax expense (benefit) at U.S. statutory rate
|
$
|
4.8
|
|
$
|
13.4
|
|
$
|
(70.6
|
)
|
||
|
State income taxes, net of federal tax benefit
|
0.6
|
|
0.7
|
|
0.4
|
|
|||||
|
Foreign income, net of credit on foreign taxes
|
8.8
|
|
0.2
|
|
—
|
|
|||||
|
Effective tax rate differential of earnings outside of U.S.
|
(0.5
|
)
|
0.5
|
|
—
|
|
|||||
|
Change in valuation allowance
|
7.8
|
|
6.6
|
|
5.6
|
|
|||||
|
Research & experimentation credits
|
(0.6
|
)
|
(0.9
|
)
|
(0.9
|
)
|
|||||
|
Non-deductible items
|
0.6
|
|
0.7
|
|
2.7
|
|
|||||
|
Change in uncertain tax positions
|
0.1
|
|
(0.2
|
)
|
0.1
|
|
|||||
|
Domestic production activities deduction
|
(0.4
|
)
|
(1.2
|
)
|
(2.1
|
)
|
|||||
|
Tax effect of asset impairments
|
—
|
|
—
|
|
67.3
|
|
|||||
|
Tax effect of insurance proceeds
|
—
|
|
(5.8
|
)
|
—
|
|
|||||
|
Tax effect of 2017 tax reform federal rate change
|
(26.9
|
)
|
—
|
|
—
|
|
|||||
|
Tax effect of carryforward foreign tax credits
|
(10.3
|
)
|
—
|
|
—
|
|
|||||
|
Other items
|
0.1
|
|
(0.3
|
)
|
0.2
|
|
|||||
|
Income tax (benefit) expense
|
$
|
(15.9
|
)
|
$
|
13.7
|
|
$
|
2.7
|
|
||
F-36
CHART INDUSTRIES, INC. AND SUBSIDIARIES
NOTES TO CONSOLIDATED FINANCIAL STATEMENTS — (Continued)
(Dollars and shares in millions, except per share amounts)
Deferred Taxes
Deferred income taxes reflect the net tax effect of temporary differences between the carrying amounts of assets and liabilities for financial reporting purposes and the amounts used for income tax purposes. Significant components of our deferred tax assets and liabilities are as follows:
|
December 31,
|
|||||||
|
2017
|
2016
|
||||||
|
Deferred tax assets:
|
|||||||
|
Accruals and reserves
|
$
|
11.8
|
|
$
|
24.1
|
|
|
|
Pensions
|
2.0
|
|
5.3
|
|
|||
|
Inventory
|
4.3
|
|
6.8
|
|
|||
|
Share-based compensation
|
6.6
|
|
9.4
|
|
|||
|
Tax credit carryforwards
|
16.4
|
|
2.2
|
|
|||
|
Foreign net operating loss carryforwards
|
12.4
|
|
5.9
|
|
|||
|
State net operating loss carryforwards
|
2.0
|
|
1.6
|
|
|||
|
Other – net
|
0.2
|
|
0.9
|
|
|||
|
Total deferred tax assets before valuation allowances
|
55.7
|
|
56.2
|
|
|||
|
Valuation allowances
|
(27.2
|
)
|
(15.1
|
)
|
|||
|
Total deferred tax assets, net of valuation allowances
|
$
|
28.5
|
|
$
|
41.1
|
|
|
|
Deferred tax liabilities:
|
|||||||
|
Property, plant and equipment
|
$
|
15.0
|
|
$
|
19.4
|
|
|
|
Goodwill and intangible assets
|
72.9
|
|
22.9
|
|
|||
|
Convertible notes
|
(0.5
|
)
|
1.0
|
|
|||
|
Other – net
|
2.9
|
|
—
|
|
|||
|
Total deferred tax liabilities
|
$
|
90.3
|
|
$
|
43.3
|
|
|
|
Net deferred tax liabilities
|
$
|
61.8
|
|
$
|
2.2
|
|
|
|
The net deferred tax liability is classified as follows:
|
|||||||
|
Other assets
|
(0.7
|
)
|
(2.0
|
)
|
|||
|
Long-term deferred tax liabilities
|
62.5
|
|
4.2
|
|
|||
|
Net deferred tax liabilities
|
$
|
61.8
|
|
$
|
2.2
|
|
|
Federal, State and Local Net Operating Loss Carryforwards
: As a result of our acquisition of SeQual in 2010, we have
$15.9
of state net operating losses. California tax law limits the use of these state net operating losses. The remaining state net operating losses expire between 2018 and 2030. In addition, we have state net operating losses in various other states which begin to expire in 2018. The gross deferred tax asset for the state net operating losses of
$2.5
is substantially offset by a valuation allowance of
$2.2
.
Foreign Net Operating Loss and Tax Credit Carryforwards
: As of
December 31, 2017
, cumulative foreign operating losses of
$70.8
generated by the Company were available to reduce future taxable income. Approximately
$67.6
of these operating losses expire between 2019 and 2028. The remaining
$3.2
can be carried forward indefinitely. The deferred tax asset for the foreign operating losses of
$12.4
is substantially offset by a valuation allowance of
$12.1
. As of
December 31, 2017
, we have
$1.0
of investment tax credits available to reduce its future tax liability. The gross deferred tax asset of
$1.0
is fully offset by a valuation allowance due to uncertainties relating to our ability to fully use these credits prior to expiration.
F-37
CHART INDUSTRIES, INC. AND SUBSIDIARIES
NOTES TO CONSOLIDATED FINANCIAL STATEMENTS — (Continued)
(Dollars and shares in millions, except per share amounts)
Other Tax Information
We previously considered the earnings in our non-U.S. subsidiaries to be indefinitely reinvested and, accordingly, recorded no deferred income taxes. As of December 31, 2016, we had undistributed foreign earnings of approximately
$190.4
. While the Tax Act subjected approximately
$200.0
of undistributed foreign earnings to tax, an actual repatriation from our non-U.S. subsidiaries could still be subject to additional foreign withholding taxes and U.S. state taxes. We have analyzed our global working capital and cash requirements and have determined that we may be repatriating approximately
$50.0
, for which we were not able to make a reasonable estimate of foreign withholding taxes and U.S. state taxes at
December 31, 2017
. We will record the tax effects of the
$50.0
cash repatriation in the period that we are first able to make a reasonable estimate, no later than December 31, 2018.
Cash paid for income taxes during the years ended December 31,
2017, 2016 and 2015
was
$15.4
,
$17.6
, and
$30.5
, respectively.
Unrecognized Income Tax Benefits
The reconciliation of beginning to ending unrecognized tax benefits is as follows:
|
|
Year Ended December 31,
|
||||||||||
|
|
2017
|
2016
|
2015
|
||||||||
|
Unrecognized tax benefits at beginning of the year
|
$
|
0.8
|
|
$
|
1.0
|
|
$
|
0.9
|
|
||
|
Additions for tax positions of prior years
|
0.1
|
|
—
|
|
0.1
|
|
|||||
|
Reductions for tax positions of prior years
|
(0.1
|
)
|
—
|
|
—
|
|
|||||
|
Lapse of statutes of limitation
|
—
|
|
(0.2
|
)
|
—
|
|
|||||
|
Unrecognized tax benefits at end of the year
|
$
|
0.8
|
|
$
|
0.8
|
|
$
|
1.0
|
|
||
Included in the balance of unrecognized tax benefits at both
December 31, 2017
and
2016
were $0.6 of income tax benefits which, if ultimately recognized, would impact our annual effective tax rate.
We had accrued approximately $0.1 for the payment of interest and penalties at both
December 31, 2017
and
2016
.
We are subject to income taxes in the U.S. federal jurisdiction and various state and foreign jurisdictions. Tax regulations within each jurisdiction are subject to the interpretation of the related tax laws and regulations and require significant judgment to apply. With few exceptions, we are no longer subject to U.S. federal, state and local or non-U.S. income tax examinations by tax authorities for years prior to 2013.
Due to the expiration of various statutes of limitation, it is reasonably possible our unrecognized tax benefits at
December 31, 2017
may decrease within the next twelve months, the amount by which was insignificant for disclosure.
Defined Benefit Plan
We have a defined benefit pension plan which is frozen, that covers certain U.S. hourly and salary employees. The defined benefit plan provides benefits based primarily on the participants’ years of service and compensation.
The components of net periodic pension expense are as follows
:
|
|
Year Ended December 31,
|
||||||||||
|
|
2017
|
2016
|
2015
|
||||||||
|
Interest cost
|
$
|
2.2
|
|
$
|
2.3
|
|
$
|
2.3
|
|
||
|
Expected return on plan assets
|
(2.8
|
)
|
(2.8
|
)
|
(3.2
|
)
|
|||||
|
Amortization of net loss
|
1.2
|
|
1.5
|
|
1.4
|
|
|||||
|
Total net periodic pension expense
|
$
|
0.6
|
|
$
|
1.0
|
|
$
|
0.5
|
|
||
F-38
CHART INDUSTRIES, INC. AND SUBSIDIARIES
NOTES TO CONSOLIDATED FINANCIAL STATEMENTS — (Continued)
(Dollars and shares in millions, except per share amounts)
The changes in the projected benefit obligation and plan assets, the funded status of the plans and the amounts recognized in the consolidated balance sheets are as follows:
|
December 31,
|
|||||||
|
2017
|
2016
|
||||||
|
Change in projected benefit obligation:
|
|||||||
|
Projected benefit obligation at beginning of year
|
$
|
55.5
|
|
$
|
58.3
|
|
|
|
Interest cost
|
2.2
|
|
2.3
|
|
|||
|
Benefits paid
|
(2.3
|
)
|
(3.9
|
)
|
|||
|
Actuarial gains (losses)
|
1.6
|
|
(1.2
|
)
|
|||
|
Projected benefit obligation at year end
|
$
|
57.0
|
|
$
|
55.5
|
|
|
|
Change in plan assets:
|
|||||||
|
Fair value of plan assets at beginning of year
|
$
|
41.1
|
|
$
|
41.0
|
|
|
|
Actual return
|
6.7
|
|
3.0
|
|
|||
|
Employer contributions
|
3.0
|
|
1.0
|
|
|||
|
Benefits paid
|
(2.3
|
)
|
(3.9
|
)
|
|||
|
Fair value of plan assets at year end
|
$
|
48.5
|
|
$
|
41.1
|
|
|
|
Funded status (Accrued pension liabilities)
(1)
|
$
|
(8.5
|
)
|
$
|
(14.4
|
)
|
|
|
Unrecognized actuarial loss recognized in accumulated other comprehensive loss
|
$
|
13.2
|
|
$
|
16.7
|
|
|
_______________
|
(1)
|
Accrued pension liabilities on the December 31, 2017 consolidated balance sheet includes $0.9 related to Hudson, which is not included in the table above.
|
The estimated net periodic pension income for the defined benefit pension plan that will be amortized from accumulated other comprehensive loss over the next fiscal year is
$0.9
.
The actuarial assumptions used in determining pension plan information are as follows:
|
|
December 31,
|
|||||||
|
|
2017
|
2016
|
2015
|
|||||
|
Assumptions used to determine benefit obligation at year end:
|
||||||||
|
Discount rate
|
3.7
|
%
|
4.0
|
%
|
4.0
|
%
|
||
|
Assumptions used to determine net periodic benefit cost:
|
||||||||
|
Discount rate
|
4.0
|
%
|
4.0
|
%
|
3.8
|
%
|
||
|
Expected long-term weighted-average rate of return on plan assets
|
7.0
|
%
|
7.0
|
%
|
7.3
|
%
|
||
The discount rate reflects the current rate at which the pension liabilities could be effectively settled at year end. In estimating this rate, we look to rates of return on high quality, fixed-income investments that receive one of the two highest ratings given by a recognized rating agency and the expected timing of benefit payments under the plan.
The expected return assumptions were developed using an averaging formula based upon the plans’ investment guidelines, mix of asset classes, historical returns of equities and bonds, and expected future returns. We employ a total return investment approach whereby a mix of equities and fixed income investments are used to maximize the long-term return of plan assets for a prudent level of risk. Risk tolerance is established through careful consideration of short and long-term plan liabilities, plan funded status and corporate financial condition. The investment portfolio contains a diversified blend of equity and fixed-income investments. Furthermore, equity investments are diversified across U.S. and non-U.S. stocks, as well as growth, value, and small and large capitalizations. Investment risk is measured and monitored on an ongoing basis through quarterly investment portfolio reviews, annual liability measurements, and periodic asset/liability studies.
F-39
CHART INDUSTRIES, INC. AND SUBSIDIARIES
NOTES TO CONSOLIDATED FINANCIAL STATEMENTS — (Continued)
(Dollars and shares in millions, except per share amounts)
The target allocations by asset category and fair values of the plan assets by asset class at December 31 are as follows:
|
Target Allocations by Asset Category
|
Fair Value
|
||||||||||||||||||||||||
|
Total
|
Level 2
|
Level 3
|
|||||||||||||||||||||||
|
Plan Assets:
|
2017
|
2016
|
2017
|
2016
|
2017
|
2016
|
|||||||||||||||||||
|
Equity funds
|
60% – 68%
|
$
|
33.0
|
|
$
|
28.1
|
|
$
|
33.0
|
|
$
|
28.1
|
|
$
|
—
|
|
$
|
—
|
|
||||||
|
Fixed income funds
|
26% – 30%
|
12.6
|
|
11.7
|
|
12.6
|
|
11.7
|
|
—
|
|
—
|
|
||||||||||||
|
Other investments
|
3% – 6%
|
2.9
|
|
1.3
|
|
—
|
|
—
|
|
2.9
|
|
1.3
|
|
||||||||||||
|
Total
|
$
|
48.5
|
|
$
|
41.1
|
|
$
|
45.6
|
|
$
|
39.8
|
|
$
|
2.9
|
|
$
|
1.3
|
|
|||||||
The plan assets are primarily invested in pooled separate funds. The fair values of equity securities and fixed income securities held in pooled separate funds are based on net asset value of the units of the funds as determined by the fund manager. These funds are similar in nature to retail mutual funds, but are typically more efficient for institutional investors. The fair value of pooled funds is determined by the value of the underlying assets held by the fund and the units outstanding. The value of the pooled funds is not directly observable, but is based on observable inputs. As such, these plan assets are valued using Level 2 inputs as defined in
Note 11
. Certain plan assets in the other investments asset category are invested in a general investment account where the fair value is derived from the liquidation value based on an actuarial formula as defined under terms of the investment contract. These plan assets were valued using unobservable inputs and, accordingly, the valuation was performed using Level 3 inputs as defined in
Note 11
.
The following table represents changes in the fair value of plan assets categorized as Level 3 from the preceding table:
|
Balance at January 1, 2016
|
$
|
0.3
|
|
|
Purchases, sales and settlements, net
|
(4.2
|
)
|
|
|
Transfers, net
|
5.2
|
|
|
|
Balance at December 31, 2016
|
$
|
1.3
|
|
|
Purchases, sales and settlements, net
|
(2.4
|
)
|
|
|
Transfers, net
|
4.0
|
|
|
|
Balance at December 31, 2017
|
$
|
2.9
|
|
Our funding policy is to contribute at least the minimum funding amounts required by law. Based upon current actuarial estimates, we do not expect to contribute to our defined benefit pension plan until 2019. The following benefit payments are expected to be paid by the plan in each of the next five years and in the aggregate for the subsequent five years:
|
2018
|
$
|
2.6
|
|
|
2019
|
2.8
|
|
|
|
2020
|
2.9
|
|
|
|
2021
|
3.0
|
|
|
|
2022
|
3.1
|
|
|
|
In aggregate during five years thereafter
|
16.6
|
|
|
F-40
CHART INDUSTRIES, INC. AND SUBSIDIARIES
NOTES TO CONSOLIDATED FINANCIAL STATEMENTS — (Continued)
(Dollars and shares in millions, except per share amounts)
Hudson Defined Benefit Plan
As part of the Hudson acquisition (see Note 10, Business Combinations) we acquired a noncontributory defined benefit plan (the “Hudson Plan”) covering certain employees at a Hudson subsidiary who meet the plan’s eligibility requirements. The Hudson Plan is closed to new participants. Our funding policy is to make the minimum annual contribution that is required by applicable regulations, plus such amounts as we may determine to be appropriate from time to time. At December 31, 2017, the projected benefit obligation of the Hudson Plan was
$2.8
and the fair value of plan assets were
$1.9
. Consequently, a liability of
$0.9
was included in accrued pension liabilities on the consolidated balance sheet for the underfunded status of the Hudson Plan. Pension expense from the date of acquisition to December 31, 2017 was not significant. The Hudson Plan did not and is not expected to have a material impact on our financial position, results of operations and cash flows.
Multi-Employer Plan
We contribute to a multi-employer plan for certain collective bargaining U.S. employees. The risks of participating in this multi-employer plan are different from a single employer plan in the following aspects:
|
(a)
|
Assets contributed to the multi-employer by one employer may be used to provide benefits to employees of other participating employers.
|
|
(b)
|
If a participating employer ceases contributing to the plan, the unfunded obligations of the plan may be inherited by the remaining participating employers.
|
|
(c)
|
If we choose to stop participating in the multi-employer plan, we may be required to pay those plans an amount based on the underfunded status of the plan, referred to as a withdrawal liability.
|
We have assessed and determined that the multi-employer plan to which we contribute is not significant to our financial statements. We do not expect to incur a withdrawal liability or expect to significantly increase our contribution over the remainder of the current contract period, which ends in February 2023. We made contributions to the bargaining unit supported multi-employer pension plan resulting in expense of
$0.3
,
$0.3
, and
$0.7
for the years ended December 31,
2017, 2016 and 2015
, respectively. The reduction in contributions is due to fewer employees participating in this plan.
Defined Contribution Savings Plan
We have a defined contribution savings plan that covers most of our U.S. employees. Company contributions to the plan are based on employee contributions, and include a Company match and discretionary contributions. Expenses under the plan totaled
$9.7
,
$10.0
, and
$10.8
for the years ended December 31,
2017, 2016 and 2015
, respectively.
Voluntary Deferred Income Plan
We provide additional retirement plan benefits to certain members of management under the Amended and Restated Chart Industries, Inc. Voluntary Deferred Income Plan. This is an unfunded plan. We recorded
$0.5
,
$0.3
, and
$0.3
of expense associated with this plan for the years ended December 31,
2017, 2016 and 2015
, respectively.
On May 25, 2017, we held our annual meeting of stockholders. At the annual meeting, our stockholders approved the Chart Industries, Inc. 2017 Omnibus Equity Plan (the “2017 Omnibus Equity Plan”). As described in our definitive proxy statement for the annual meeting, our directors, officers and employees (including its principal executive officer, principal financial officer and other “named executive officers”) are eligible to be granted stock options, stock appreciation rights (“SARs”), restricted stock, restricted stock units (“RSUs”), performance shares and common shares under the 2017 Omnibus Equity Plan. The maximum number of shares available for grant was
1.70
, which may be treasury shares or unissued shares. As of
December 31, 2017
,
0.01
RSUs, were outstanding under the 2017 Omnibus Equity Plan.
Under the Amended and Restated 2009 Omnibus Equity Plan (“2009 Omnibus Equity Plan”) which was originally approved by our shareholders in May 2009 and re-approved by shareholders in May 2012 as amended and restated, we could grant stock options, SARs, RSUs, restricted stock, performance shares, leveraged restricted shares, and common shares to employees and directors. The maximum number of shares available for grant was
3.35
, which could be treasury shares or unissued shares. As of
December 31, 2017
,
1.20
stock options,
0.32
shares of restricted stock and RSUs, and
0.08
performance units were outstanding under the 2009 Omnibus Equity Plan.
F-41
CHART INDUSTRIES, INC. AND SUBSIDIARIES
NOTES TO CONSOLIDATED FINANCIAL STATEMENTS — (Continued)
(Dollars and shares in millions, except per share amounts)
Under the Amended and Restated 2005 Stock Incentive Plan (“2005 Stock Incentive Plan”) which became effective in October 2005, we could grant stock options, SARs, RSUs, stock awards, and performance based stock awards to employees and directors. The 2005 Stock Incentive Plan had reserved
3.42
shares of our common stock for issuance. As of
December 31, 2017
,
0.06
options were outstanding under the Stock Incentive Plan. We no longer grant awards under the 2009 Omnibus Equity Plan and 2005 Stock Incentive Plan.
We recognized share-based compensation expense of
$11.1
,
$10.7
, and
$11.3
for the years ended December 31,
2017, 2016 and 2015
, respectively. This expense is included in selling, general and administrative expenses in the consolidated statements of operations. The tax impact related to share-based compensation expense was insignificant during the year ended December 31, 2017, which was recorded in income tax (benefit) expense, net. The tax impact related to share-based compensation expense was
$1.7
and
$0.9
for the years ended December 31, 2016 and 2015, respectively, which was recorded in additional paid-in capital in the consolidated balance sheets. As of
December 31, 2017
, total share-based compensation of
$5.8
is expected to be recognized over the remaining weighted-average period of approximately
2.1 years
.
Stock Options
We use a Black-Scholes option pricing model to estimate the fair value of stock options. The expected volatility is based on historical information. The risk-free rate is based on the U.S. Treasury yield in effect at the time of the grant. Weighted-average grant-date fair values of stock options and the assumptions used in estimating the fair values are as follows:
|
Year Ended December 31,
|
|||||||||||
|
2017
|
2016
|
2015
|
|||||||||
|
Weighted-average grant-date fair value per share
|
$
|
20.10
|
|
$
|
10.36
|
|
$
|
19.04
|
|
||
|
Expected term (years)
|
5.4
|
|
5.2
|
|
5.6
|
|
|||||
|
Risk-free interest rate
|
2.00
|
%
|
1.66
|
%
|
1.70
|
%
|
|||||
|
Expected volatility
|
60.31
|
%
|
61.40
|
%
|
61.54
|
%
|
|||||
Stock options generally have a
four
-year graded vesting period, an exercise price equal to the fair market value of a share of common stock on the date of grant, and a contractual term of
10 years
. The following table summarizes our stock option activity:
|
|
December 31, 2017
|
|||||||||||
|
|
Number
of Shares
|
Weighted-average
Exercise
Price
|
Aggregate Intrinsic Value
|
Weighted- average Remaining Contractual Term
|
||||||||
|
Outstanding at beginning of year
|
1.11
|
|
$
|
31.13
|
|
|||||||
|
Granted
|
0.32
|
|
37.06
|
|
||||||||
|
Exercised
|
(0.08
|
)
|
25.71
|
|
||||||||
|
Forfeited / Cancelled
|
(0.10
|
)
|
36.16
|
|
||||||||
|
Outstanding at end of year
|
1.25
|
|
$
|
32.58
|
|
$
|
21.9
|
|
6.4 years
|
|||
|
Vested and expected to vest at end of year
|
1.24
|
|
$
|
32.60
|
|
$
|
9.4
|
|
6.4 years
|
|||
|
Exercisable at end of year
|
0.56
|
|
$
|
36.29
|
|
$
|
21.7
|
|
4.7 years
|
|||
As of
December 31, 2017
, total unrecognized compensation cost related to stock options expected to be recognized over the weighted-average period of approximately
2.4 years
is
$2.4
.
The total intrinsic value of options exercised during the years ended December 31,
2017, 2016 and 2015
was
$1.2
,
$0.2
, and
$0.7
, respectively. The total fair value of stock options vested during the years ended December 31,
2017, 2016 and 2015
was
$3.4
,
$3.9
, and
$3.6
, respectively.
F-42
CHART INDUSTRIES, INC. AND SUBSIDIARIES
NOTES TO CONSOLIDATED FINANCIAL STATEMENTS — (Continued)
(Dollars and shares in millions, except per share amounts)
Restricted Stock and RSUs
Restricted stock and RSUs generally vest ratably over a
three
-year period and are valued based on our market price on the date of grant. The following table summarizes our unvested restricted stock and RSUs activity:
|
|
December 31, 2017
|
|||||
|
|
Number
of Shares
|
Weighted-Average
Grant-Date Fair Value
|
||||
|
Unvested at beginning of year
|
0.33
|
|
$
|
24.06
|
|
|
|
Granted
|
0.16
|
|
37.13
|
|
||
|
Forfeited
|
(0.03
|
)
|
26.51
|
|
||
|
Vested
|
(0.13
|
)
|
28.52
|
|
||
|
Unvested at end of year
|
0.33
|
|
$
|
28.38
|
|
|
As of
December 31, 2017
, total unrecognized compensation cost related to unvested restricted stock and RSUs expected to be recognized over the weighted-average period of approximately
1.8 years
is
$2.6
.
The weighted-average grant-date fair value of restricted stock and RSUs granted during the years ended
December 31, 2017
,
2016
, and
2015
was
$37.13
,
$19.08
, and
$34.15
, respectively. The total fair value of restricted stock and RSUs that vested during the years ended
December 31, 2017
,
2016
, and
2015
was
$4.8
,
$1.2
, and
$1.6
, respectively.
Performance Units
Performance units are earned over a
three
-year period. Based on the attainment of pre-determined performance condition targets as determined by the Compensation Committee of the Board of Directors, performance units earned may be in the range of between 0% and 200%. The following table, which is stated at a 100% earned percentage, summarizes our performance units activity:
|
|
December 31, 2017
|
|||||
|
|
Number
of Shares
|
Weighted-Average
Grant-Date Fair Value
|
||||
|
Unvested at beginning of year
|
0.08
|
|
$
|
31.84
|
|
|
|
Granted
|
0.03
|
|
38.00
|
|
||
|
Forfeited / Cancelled
|
(0.01
|
)
|
31.14
|
|
||
|
Vested
|
(0.02
|
)
|
93.34
|
|
||
|
Unvested at end of year
|
0.08
|
|
$
|
24.81
|
|
|
As of
December 31, 2017
, total unrecognized compensation cost related to performance units expected to be recognized over a weighted-average period of approximately
1.6 years
is
$0.8
.
The weighted-average grant-date fair value of performance units granted during the years ended
December 31, 2017
,
2016
, and
2015
was
$38.00
,
$19.94
, and
$28.25
, respectively. The total fair value of performance units that vested during the years ended
December 31, 2017
,
2016
, and
2015
was
$0.8
,
$1.8
, and
$0.8
, respectively.
F-43
CHART INDUSTRIES, INC. AND SUBSIDIARIES
NOTES TO CONSOLIDATED FINANCIAL STATEMENTS — (Continued)
(Dollars and shares in millions, except per share amounts)
Leveraged Restricted Share Units
Leveraged restricted share unit awards vest based on the attainment of pre-determined market condition targets as determined by the Compensation Committee of the Board of Directors over a
three
-year performance period. Units earned may be in the range of between
50%
and
150%
. We valued the leverage restricted share unit awards based on market conditions using a Monte Carlo Simulation model. The following table, which is stated at a 100% earned percentage, summarizes our leveraged restricted share unit awards activity:
|
|
December 31, 2017
|
|||||
|
|
Number
of Shares
|
Weighted-average
Grant-Date Fair Value
|
||||
|
Unvested at beginning of year
|
0.010
|
|
$
|
106.90
|
|
|
|
Forfeited / Cancelled
|
(0.005
|
)
|
106.90
|
|
||
|
Vested
|
(0.005
|
)
|
106.90
|
|
||
|
Unvested at end of year
|
—
|
|
$
|
—
|
|
|
The total fair value of leveraged restricted share units that vested during the years ended
December 31, 2017
,
2016
, and
2015
was
$0.2
,
$1.0
and
$0.6
, respectively.
Directors’ Stock Grants
In
2017, 2016 and 2015
, we granted the non-employee directors stock awards covering
0.02
,
0.03
, and
0.02
shares of common stock, respectively, which had fair values of
$0.7
,
$0.6
, and
$0.7
, respectively. These stock awards were fully vested on the grant date. Likewise, the fair values were recognized immediately on the grant date.
We incurred
$11.5
,
$9.5
, and
$11.1
of rental expense under operating leases for the years ended December 31,
2017, 2016 and 2015
, respectively. Certain leases contain rent escalation clauses and lease concessions that require additional rental payments in the later years of the term. Rent expense for these types of leases is recognized on a straight-line basis over the minimum lease term. In addition, we have the right, but no obligation, to renew certain leases for various renewal terms.
The following table summarizes future minimum lease payments for non-cancelable operating leases as of
December 31, 2017
:
|
2018
|
$
|
9.2
|
|
|
2019
|
7.1
|
|
|
|
2020
|
5.6
|
|
|
|
2021
|
4.1
|
|
|
|
2022
|
3.8
|
|
|
|
Thereafter
|
10.8
|
|
|
|
Total future minimum lease payments
|
$
|
40.6
|
|
Environmental
We are subject to federal, state, local, and foreign environmental laws and regulations concerning, among other matters, waste water effluents, air emissions, and handling and disposal of hazardous materials, such as cleaning fluids. We are involved with environmental compliance, investigation, monitoring, and remediation activities at certain of our owned and formerly owned manufacturing facilities and at one owned facility that is leased to a third party, and, except for these continuing remediation efforts, believes we are currently in substantial compliance with all known environmental regulations. At
December 31, 2017
and
2016
, we had undiscounted accrued environmental reserves of
$2.1
and
$3.0
, respectively. We accrue for certain environmental remediation-related activities for which commitments or remediation plans have been developed and for which costs can be reasonably estimated. These estimates are determined based upon currently available facts and circumstances regarding each facility. Actual costs incurred may vary from these estimates due to the inherent uncertainties involved. Future expenditures
F-44
CHART INDUSTRIES, INC. AND SUBSIDIARIES
NOTES TO CONSOLIDATED FINANCIAL STATEMENTS — (Continued)
(Dollars and shares in millions, except per share amounts)
relating to these environmental remediation efforts are expected to be made over the next
10 years
as ongoing costs of remediation programs.
Although we believe we have adequately provided for the cost of all known environmental conditions, the applicable regulatory agencies could insist upon different and more costly remediation than those we believe are adequate or required by existing law or third parties may seek to impose environmental liabilities on us. We believe that any additional liability in excess of amounts accrued which may result from the resolution of such matters will not have a material adverse effect on our financial position, liquidity, cash flows or results of operations.
Legal Proceedings
CCESC and CCDEC were involved in litigation with an external sales representative in China who claimed we owed commissions of approximately
64.8 million
Chinese yuan (equivalent to
$9.9
) plus interest. In prior years, we accrued
30.0 million
Chinese yuan (equivalent to
$4.6
) as our best estimate of the related contingent liability. Based on a China court ruling received during February 2018, the claimant was awarded a reduced amount of
53.9 million
Chinese yuan (equivalent to
$8.3
), which included accrued interest (the “Award Amount”). As a result of this ruling, we accrued an additional
23.9 million
Chinese yuan (equivalent to
$3.7
) in commissions and interest in the fourth quarter of 2017. The Award Amount was recorded in other current liabilities in our consolidated balance sheet at December 31, 2017. Management is currently evaluating alternatives under the arbitration award.
We are occasionally subject to various legal claims related to performance under contracts, product liability, taxes, employment matters, environmental matters, intellectual property, and other matters incidental to the normal course of our business. Based on our historical experience in litigating these claims, as well as our current assessment of the underlying merits of the claims and applicable insurance, if any, management believes that the final resolution of these matters will not have a material adverse effect on our financial position, liquidity, cash flows, or results of operations. Future developments may, however, result in resolution of these legal claims in a way that could have a material adverse effect.
We have implemented a number of cost reduction or avoidance actions, including headcount reductions and facility closures and relocations primarily relating to the consolidation of certain of our facilities in China, the Buffalo BioMedical respiratory consolidation, and relocation of the corporate headquarters. The Buffalo BioMedical respiratory facility consolidation into Ball Ground, Georgia, was completed during the first quarter of 2017, and the reduction in force was completed in the third quarter of 2017. The E&C Wuxi, China facility consolidation was completed during the second quarter of 2017, and the D&S China facility consolidation was substantially completed during the fourth quarter of 2017. Our corporate headquarters move from Garfield Heights, Ohio to Ball Ground, Georgia (which was officially effective October 26, 2017) was substantially completed during the third quarter of 2017, and our Garfield Heights lease commitment ended on December 31, 2017.
The following table is a summary of the severance and other restructuring costs, which included employee-related costs, facility rent and exit costs, relocation, recruiting, travel and other, for the years ended December 31, 2017, 2016 and 2015:
|
Year Ended December 31,
|
||||||||||||
|
2017
|
2016
|
2015
|
||||||||||
|
Severance:
|
||||||||||||
|
Cost of sales
|
$
|
0.8
|
|
$
|
4.2
|
|
$
|
2.2
|
|
|||
|
Selling, general, and administrative expenses
|
3.8
|
|
5.8
|
|
5.2
|
|
||||||
|
Total severance costs
|
$
|
4.6
|
|
$
|
10.0
|
|
$
|
7.4
|
|
|||
|
Other restructuring:
|
||||||||||||
|
Cost of sales
|
$
|
4.4
|
|
$
|
0.2
|
|
$
|
1.4
|
|
|||
|
Selling, general, and administrative expenses
|
6.6
|
|
0.7
|
|
3.4
|
|
||||||
|
Total other restructuring costs
|
$
|
11.0
|
|
$
|
0.9
|
|
$
|
4.8
|
|
|||
|
Total restructuring costs
|
$
|
15.6
|
|
$
|
10.9
|
|
$
|
12.2
|
|
|||
F-45
CHART INDUSTRIES, INC. AND SUBSIDIARIES
NOTES TO CONSOLIDATED FINANCIAL STATEMENTS — (Continued)
(Dollars and shares in millions, except per share amounts)
We currently do not expect any significant severance or restructuring charges in 2018. We are closely monitoring our end markets and order rates and will continue to take appropriate and timely actions as necessary.
The following tables summarize our restructuring activities for the years ended 2017, 2016 and 2015:
|
Twelve Months Ended December 31, 2017
|
|||||||||||||||||||
|
Energy & Chemicals
|
Distribution & Storage
|
BioMedical
|
Corporate
|
Total
|
|||||||||||||||
|
Balance as of December 31, 2016
|
$
|
0.1
|
|
$
|
2.9
|
|
$
|
1.3
|
|
$
|
3.0
|
|
$
|
7.3
|
|
||||
|
Restructuring costs
|
2.4
|
|
2.2
|
|
5.0
|
|
6.0
|
|
15.6
|
|
|||||||||
|
Cash payments
|
(2.5
|
)
|
(3.9
|
)
|
(6.0
|
)
|
(7.9
|
)
|
(20.3
|
)
|
|||||||||
|
Acquired restructuring reserve
|
0.2
|
|
—
|
|
—
|
|
—
|
|
0.2
|
|
|||||||||
|
Balance as of December 31, 2017
|
$
|
0.2
|
|
$
|
1.2
|
|
$
|
0.3
|
|
$
|
1.1
|
|
$
|
2.8
|
|
||||
|
Twelve Months Ended December 31, 2016
|
|||||||||||||||||||
|
Energy & Chemicals
|
Distribution & Storage
|
BioMedical
|
Corporate
|
Total
|
|||||||||||||||
|
Balance as of December 31, 2015
|
$
|
1.1
|
|
$
|
3.4
|
|
$
|
0.4
|
|
$
|
0.9
|
|
$
|
5.8
|
|
||||
|
Restructuring costs
|
1.0
|
|
3.8
|
|
1.9
|
|
4.2
|
|
10.9
|
|
|||||||||
|
Cash payments
|
(2.0
|
)
|
(4.3
|
)
|
(1.0
|
)
|
(2.1
|
)
|
(9.4
|
)
|
|||||||||
|
Balance as of December 31, 2016
|
$
|
0.1
|
|
$
|
2.9
|
|
$
|
1.3
|
|
$
|
3.0
|
|
$
|
7.3
|
|
||||
|
Twelve Months Ended December 31, 2015
|
|||||||||||||||||||
|
Energy & Chemicals
|
Distribution & Storage
|
BioMedical
|
Corporate
|
Total
|
|||||||||||||||
|
Balance as of December 31, 2014
|
$
|
—
|
|
$
|
—
|
|
$
|
—
|
|
$
|
—
|
|
$
|
—
|
|
||||
|
Restructuring costs
|
1.4
|
|
7.7
|
|
1.8
|
|
1.3
|
|
12.2
|
|
|||||||||
|
Cash payments
|
(0.3
|
)
|
(4.3
|
)
|
(1.4
|
)
|
(0.4
|
)
|
(6.4
|
)
|
|||||||||
|
Balance as of December 31, 2015
|
$
|
1.1
|
|
$
|
3.4
|
|
$
|
0.4
|
|
$
|
0.9
|
|
$
|
5.8
|
|
||||
The structure of our internal organization is divided into the following reportable segments, which are also our operating segments: E&C, D&S, and BioMedical. Our reportable segments are business units that are each managed separately because they manufacture, offer, and distribute distinct products with different production processes. The E&C and D&S segments manufacture products used primarily in energy-related and industrial applications, such as the separation, liquefaction, distribution, and storage of hydrocarbon and industrial gases. The BioMedical segment supplies cryogenic and other equipment used in the medical, biological research, and animal breeding industries. Intersegment sales are not material. Corporate includes operating expenses for executive management, accounting, tax, treasury, corporate development, human resources, information technology, investor relations, legal, internal audit, and risk management. Corporate support functions are not currently allocated to the segments.
We evaluate performance and allocates resources based on operating income or loss from continuing operations before interest expense, net, loss on extinguishment of debt, financing costs amortization, foreign currency loss (gain), income tax (benefit) expense, net, and income (loss) attributable to noncontrolling interests, net of taxes. The accounting policies of the reportable segments are the same as those described in
Note 2
.
F-46
CHART INDUSTRIES, INC. AND SUBSIDIARIES
NOTES TO CONSOLIDATED FINANCIAL STATEMENTS — (Continued)
(Dollars and shares in millions, except per share amounts)
Segment Financial Information
_______________
|
|
Year Ended December 31, 2017
|
||||||||||||||||||
|
|
Energy &
Chemicals
|
Distribution &
Storage
|
BioMedical
|
Corporate
|
Total
|
||||||||||||||
|
Sales to external customers
|
$
|
225.6
|
|
$
|
540.3
|
|
$
|
222.9
|
|
$
|
—
|
|
$
|
988.8
|
|
||||
|
Depreciation and amortization expense
|
15.3
|
|
18.8
|
|
5.6
|
|
2.2
|
|
41.9
|
|
|||||||||
|
Operating income (loss)
(1) (2)
|
5.1
|
|
66.1
|
|
35.5
|
|
(64.7
|
)
|
42.0
|
|
|||||||||
|
Total assets
|
782.9
|
|
685.2
|
|
165.9
|
|
90.7
|
|
1,724.7
|
|
|||||||||
|
Capital expenditures
|
15.5
|
|
14.4
|
|
3.0
|
|
2.3
|
|
35.2
|
|
|||||||||
|
|
Year Ended December 31, 2016
|
||||||||||||||||||
|
|
Energy &
Chemicals |
Distribution &
Storage |
BioMedical
|
Corporate
|
Total
|
||||||||||||||
|
Sales to external customers
|
$
|
154.3
|
|
$
|
497.1
|
|
$
|
207.8
|
|
$
|
—
|
|
$
|
859.2
|
|
||||
|
Depreciation and amortization expense
|
10.0
|
|
18.4
|
|
6.0
|
|
3.1
|
|
37.5
|
|
|||||||||
|
Operating income (loss)
(1) (3)
|
13.3
|
|
50.4
|
|
42.0
|
|
(48.3
|
)
|
57.4
|
|
|||||||||
|
Total assets
|
177.5
|
|
657.6
|
|
178.7
|
|
219.2
|
|
1,233.0
|
|
|||||||||
|
Capital expenditures
|
3.3
|
|
11.7
|
|
2.3
|
|
0.5
|
|
17.8
|
|
|||||||||
|
|
Year Ended December 31, 2015
|
||||||||||||||||||
|
|
Energy &
Chemicals |
Distribution &
Storage |
BioMedical
|
Corporate
|
Total
|
||||||||||||||
|
Sales to external customers
|
$
|
331.0
|
|
$
|
487.6
|
|
$
|
221.6
|
|
$
|
—
|
|
$
|
1,040.2
|
|
||||
|
Depreciation and amortization expense
|
11.8
|
|
18.3
|
|
12.0
|
|
3.3
|
|
45.4
|
|
|||||||||
|
Operating (loss) income
(1) (4)
|
(10.0
|
)
|
39.5
|
|
(165.3
|
)
|
(47.4
|
)
|
(183.2
|
)
|
|||||||||
|
Total assets
|
251.8
|
|
689.1
|
|
224.4
|
|
34.8
|
|
1,200.1
|
|
|||||||||
|
Capital expenditures
|
4.1
|
|
36.8
|
|
3.9
|
|
2.3
|
|
47.1
|
|
|||||||||
|
(1)
|
Includes restructuring costs of
$15.6
,
$10.9
and
$12.2
for the years ended December 31, 2017, 2016 and 2015, respectively.
|
|
(2)
|
Includes acquisition-related expenses of
$10.1
for the
year ended December 31, 2017
.
|
|
(3)
|
During the third quarter of 2016, we recovered for breaches of representations and warranties primarily related to warranty costs for certain product lines acquired in the 2012 acquisition of AirSep under the related representation and warranty insurance. For the year ended December 31, 2016, this reduced BioMedical segment’s cost of sales by
$15.2
and Corporate SG&A expenses by
$0.3
, net of associated legal fees recorded in 2016.
The 2016 operating income also includes asset impairment charges of
$1.2
attributed to D&S.
|
|
(4)
|
Includes asset impairment charges of
$255.1
for the year ended December 31, 2015, attributed to E&C –
$68.8
, D&S –
$2.0
, and BioMedical –
$184.3
.
|
F-47
CHART INDUSTRIES, INC. AND SUBSIDIARIES
NOTES TO CONSOLIDATED FINANCIAL STATEMENTS — (Continued)
(Dollars and shares in millions, except per share amounts)
Product Sales Information
|
|
Year Ended December 31,
|
||||||||||
|
|
2017
|
2016
|
2015
|
||||||||
|
Energy & Chemicals
|
|||||||||||
|
Natural gas processing (including petrochemical) applications
|
$
|
152.9
|
|
$
|
105.4
|
|
$
|
180.9
|
|
||
|
Liquefied natural gas applications
|
29.5
|
|
38.2
|
|
136.1
|
|
|||||
|
Industrial gas applications
|
22.4
|
|
10.7
|
|
14.0
|
|
|||||
|
HVAC, power and refining
|
20.8
|
|
—
|
|
—
|
|
|||||
|
Total Energy & Chemicals
|
225.6
|
|
154.3
|
|
331.0
|
|
|||||
|
Distribution & Storage
|
|||||||||||
|
Bulk industrial gas applications
|
221.9
|
|
227.6
|
|
203.9
|
|
|||||
|
Packaged gas industrial applications
|
180.7
|
|
159.7
|
|
167.8
|
|
|||||
|
Liquefied natural gas applications
|
137.7
|
|
109.8
|
|
115.9
|
|
|||||
|
Total Distribution & Storage
|
540.3
|
|
497.1
|
|
487.6
|
|
|||||
|
BioMedical
|
|||||||||||
|
Respiratory therapy
|
124.4
|
|
118.9
|
|
132.3
|
|
|||||
|
Cryobiological storage
|
77.0
|
|
70.6
|
|
64.6
|
|
|||||
|
On-site generation systems
|
21.5
|
|
18.3
|
|
24.7
|
|
|||||
|
Total BioMedical
|
222.9
|
|
207.8
|
|
221.6
|
|
|||||
|
Total
|
$
|
988.8
|
|
$
|
859.2
|
|
$
|
1,040.2
|
|
||
In 2017 and 2015, no one customer accounted for more than 10% of our consolidated sales. In 2016, one customer, Airgas “an Air Liquide company” and Air Liquide, accounted for more than 10% of our consolidated sales. Total sales from this customer represented approximately
$98.9
of our 2016 consolidated sales and is attributable to our E&C, D&S and BioMedical segments.
F-48
CHART INDUSTRIES, INC. AND SUBSIDIARIES
NOTES TO CONSOLIDATED FINANCIAL STATEMENTS — (Continued)
(Dollars and shares in millions, except per share amounts)
Geographic Information
Net sales by geographic area are reported by the destination of sales. Net property, plant and equipment by geographic area are reported by country of domicile.
|
|
Sales for the Year Ended December 31,
|
||||||||||
|
2017
|
2016
|
2015
|
|||||||||
|
United States
|
$
|
526.7
|
|
$
|
426.0
|
|
$
|
513.7
|
|
||
|
Foreign
|
|||||||||||
|
China
|
110.0
|
|
147.7
|
|
110.0
|
|
|||||
|
Other foreign countries
|
352.1
|
|
285.5
|
|
416.5
|
|
|||||
|
Total Foreign
|
462.1
|
|
433.2
|
|
526.5
|
|
|||||
|
Total
|
$
|
988.8
|
|
$
|
859.2
|
|
$
|
1,040.2
|
|
||
|
|
Property, plant and equipment, net as of December 31,
|
||||||
|
2017
|
2016
|
||||||
|
United States
|
$
|
177.9
|
|
$
|
145.0
|
|
|
|
Foreign
|
|||||||
|
China
|
82.9
|
|
75.4
|
|
|||
|
Czech Republic
|
20.7
|
|
18.5
|
|
|||
|
Germany
|
13.4
|
|
11.5
|
|
|||
|
Other foreign countries
|
2.7
|
|
0.6
|
|
|||
|
Total Foreign
|
119.7
|
|
106.0
|
|
|||
|
Total
|
$
|
297.6
|
|
$
|
251.0
|
|
|
Selected quarterly data for the years ended
December 31, 2017
and
2016
are as follows:
|
|
Year Ended December 31, 2017
|
||||||||||||||||||
|
|
First
Quarter
|
Second
Quarter
|
Third
Quarter
|
Fourth
Quarter
|
Total
|
||||||||||||||
|
Sales
(1)
|
$
|
204.1
|
|
$
|
238.2
|
|
$
|
240.5
|
|
$
|
306.0
|
|
$
|
988.8
|
|
||||
|
Gross profit
|
55.6
|
|
63.2
|
|
70.4
|
|
82.9
|
|
272.1
|
|
|||||||||
|
Operating income
(1) (2)
|
0.3
|
|
9.9
|
|
10.5
|
|
21.3
|
|
42.0
|
|
|||||||||
|
Net (loss) income
(3) (4)
|
(2.9
|
)
|
3.3
|
|
2.1
|
|
27.0
|
|
29.5
|
|
|||||||||
|
Net (loss) income attributable to Chart Industries, Inc.
(3) (4)
|
(2.9
|
)
|
2.8
|
|
1.5
|
|
26.7
|
|
28.0
|
|
|||||||||
|
Net (loss) income attributable to Chart Industries, Inc. per share—basic
(5)
|
$
|
(0.09
|
)
|
$
|
0.09
|
|
$
|
0.05
|
|
$
|
0.87
|
|
$
|
0.91
|
|
||||
|
Net (loss) income attributable to Chart Industries, Inc. per share—diluted
(5) (6)
|
$
|
(0.09
|
)
|
$
|
0.09
|
|
$
|
0.05
|
|
$
|
0.85
|
|
$
|
0.89
|
|
||||
_______________
|
(1)
|
Hudson, included in these results since the acquisition date, September 20, 2017, added net sales and operating income of
$58.0
and
$6.4
for the year ended December 31, 2017, including
$6.1
and
$1.2
in the third quarter and
$51.9
and
$5.2
in the fourth quarter, respectively.
|
|
(2)
|
The fourth quarter of 2017 includes additional expense as a result of a litigation award in China. Refer to Note 18, Commitments and Contingencies, for further information.
|
F-49
CHART INDUSTRIES, INC. AND SUBSIDIARIES
NOTES TO CONSOLIDATED FINANCIAL STATEMENTS — (Continued)
(Dollars and shares in millions, except per share amounts)
|
(3)
|
During the fourth quarter of 2017, we recorded a
$4.9
loss on extinguishment of debt associated with the repurchase of
$192.9
principal amount of our
$250.0
2.00%
convertible notes due August 2018 and refinance of our senior secured revolving credit facility.
|
|
(4)
|
The fourth quarter of 2017 includes a one-time
$22.5
net favorable tax benefit that was recorded during the fourth quarter of 2017, which resulted from the enactment of the Tax Cuts and Jobs Act. This benefit mainly consisted of a one-time, provisional benefit of
$26.9
related to the remeasurement of certain of our deferred tax liabilities using the lower U.S. federal corporate tax rate of
21%
. This was partially offset by (i) a one-time, provisional charge of
$8.7
related to the deemed repatriation transition tax, which is a tax on previously untaxed accumulated earnings and profits of certain of our foreign subsidiaries, and (ii) a one-time tax expense and tax benefit of
$4.5
and
$8.7
, respectively, related to our intent to amend pre-acquisition Hudson U.S. federal tax returns.
|
|
(5)
|
Basic and diluted (loss) earnings per share are computed independently for each of the quarters presented. As such, the sum of quarterly basic and diluted (loss) earnings per share may not equal reported annual basic and diluted (loss) earnings per share.
|
|
(6)
|
Zero incremental shares from share-based awards are included in the computation of diluted net loss per share for periods in which a net loss occurs, because to do so would be anti-dilutive.
|
|
|
Year Ended December 31, 2016
|
||||||||||||||||||
|
|
First
Quarter
|
Second
Quarter
|
Third
Quarter
|
Fourth
Quarter
|
Total
|
||||||||||||||
|
Sales
|
$
|
193.8
|
|
$
|
247.1
|
|
$
|
203.9
|
|
$
|
214.4
|
|
$
|
859.2
|
|
||||
|
Gross profit
|
52.7
|
|
87.0
|
|
69.6
|
|
57.1
|
|
266.4
|
|
|||||||||
|
Operating income
(1)
|
0.1
|
|
34.9
|
|
20.1
|
|
2.3
|
|
57.4
|
|
|||||||||
|
Net (loss) income
|
(4.7
|
)
|
19.6
|
|
13.7
|
|
(3.9
|
)
|
24.7
|
|
|||||||||
|
Net (loss) income attributable to Chart Industries, Inc.
|
(4.7
|
)
|
21.2
|
|
15.0
|
|
(3.3
|
)
|
28.2
|
|
|||||||||
|
Net (loss) income attributable to Chart Industries, Inc. per share—basic
(2)
|
$
|
(0.15
|
)
|
$
|
0.69
|
|
$
|
0.49
|
|
$
|
(0.11
|
)
|
$
|
0.92
|
|
||||
|
Net (loss) income attributable to Chart Industries, Inc. per share—diluted
(2) (3)
|
$
|
(0.15
|
)
|
$
|
0.68
|
|
$
|
0.48
|
|
$
|
(0.11
|
)
|
$
|
0.91
|
|
||||
|
(1)
|
During the third quarter of 2016, we recovered for breaches of representations and warranties primarily related to warranty costs for certain product lines acquired in the 2012 acquisition of AirSep under the related representation and warranty insurance. For the year ended December 31, 2016, this reduced BioMedical segment’s cost of sales by
$15.2
and Corporate SG&A expenses by
$0.3
, net of associated legal fees recorded in 2016. The 2016 operating income also includes impairment of goodwill and intangible assets totaling
$1.2
as described in
Note 3
,
Asset Impairments
, to the consolidated financial statements.
|
|
(2)
|
Basic and diluted (loss) earnings per share are computed independently for each of the quarters presented. As such, the sum of quarterly basic and diluted (loss) earnings per share may not equal reported annual basic and diluted (loss) earnings per share.
|
|
(3)
|
Zero incremental shares from share-based awards are included in the computation of diluted net loss per share for periods in which a net loss occurs, because to do so would be anti-dilutive.
|
We acquired 100% of the equity interests of Skaff Cryogenics and Cryo-Lease, LLC (together “Skaff”) on January 2, 2018 for an approximate purchase price of $12.5. Skaff provides quality repair service and remanufacturing of cryogenic and liquefied natural gas storage tanks and trailers and also maintains a portfolio of cryogenic storage equipment that is leased to customers for temporary and permanent needs. Skaff is headquartered in Brentwood, New Hampshire and provides services and equipment to customers in North America. Skaff’s results will be included in the D&S operating segment.
F-50
CHART INDUSTRIES, INC. AND SUBSIDIARIES
SCHEDULE II – VALUATION AND QUALIFYING ACCOUNTS
(Dollars in millions)
|
Additions
|
|||||||||||||||||||||
|
Balance at
beginning
of period
|
Charged to
costs and
expenses
|
Deductions
|
Translations
|
Balance
at end of
period
|
|||||||||||||||||
|
Year Ended December 31, 2017:
|
|||||||||||||||||||||
|
Allowance for doubtful accounts
|
$
|
10.2
|
|
$
|
1.2
|
|
$
|
(1.2
|
)
|
(1)
|
$
|
0.6
|
|
$
|
10.8
|
|
|||||
|
Allowance for obsolete and excess inventory
|
10.1
|
|
5.3
|
|
(7.8
|
)
|
(2)
|
0.9
|
|
8.5
|
|
||||||||||
|
Deferred tax assets valuation allowance
|
15.1
|
|
11.1
|
|
—
|
|
(3)
|
1.0
|
|
27.2
|
|
||||||||||
|
Year Ended December 31, 2016:
|
|||||||||||||||||||||
|
Allowance for doubtful accounts
|
$
|
7.0
|
|
$
|
4.7
|
|
$
|
(1.3
|
)
|
(1)
|
$
|
(0.2
|
)
|
$
|
10.2
|
|
|||||
|
Allowance for obsolete and excess inventory
|
11.3
|
|
3.8
|
|
(4.7
|
)
|
(2)
|
(0.3
|
)
|
10.1
|
|
||||||||||
|
Deferred tax assets valuation allowance
|
8.8
|
|
7.0
|
|
(0.1
|
)
|
(3)
|
(0.6
|
)
|
15.1
|
|
||||||||||
|
Year Ended December 31, 2015:
|
|||||||||||||||||||||
|
Allowance for doubtful accounts
|
$
|
6.5
|
|
$
|
1.6
|
|
$
|
(0.9
|
)
|
(1)
|
$
|
(0.2
|
)
|
$
|
7.0
|
|
|||||
|
Allowance for obsolete and excess inventory
|
5.2
|
|
14.8
|
|
(8.3
|
)
|
(2)
|
(0.4
|
)
|
11.3
|
|
||||||||||
|
Deferred tax assets valuation allowance
|
1.9
|
|
7.2
|
|
(0.1
|
)
|
(3)
|
(0.2
|
)
|
8.8
|
|
||||||||||
_______________
|
(1)
|
Reversal of amounts previously recorded as bad debt and uncollectible accounts written off.
|
|
(2)
|
Inventory items written off against the allowance.
|
|
(3)
|
Deductions to the deferred tax assets valuation allowance relate to decreased deferred tax assets and the release of the valuation allowance.
|
F-51
INDEX TO EXHIBITS
|
Exhibit No.
|
Description
|
|
|
2.1
|
||
|
2.1.1
|
||
|
2.2
|
||
|
2.2.1
|
|
|
|
3.1
|
||
|
3.2
|
||
|
4.1
|
||
|
4.2
|
||
|
4.3
|
||
|
4.4
|
||
|
4.5
|
||
|
10.1
|
||
|
10.2
|
||
|
10.2.1
|
||
|
10.2.2
|
||
E-1
|
10.2.3
|
||
|
10.2.4
|
||
|
10.2.5
|
||
|
10.3
|
||
|
10.3.1
|
||
|
10.3.2
|
||
|
10.3.3
|
||
|
10.3.4
|
||
|
10.3.5
|
||
|
10.3.6
|
||
|
10.3.7
|
||
|
10.3.8
|
||
|
10.3.9
|
||
|
10.3.10
|
||
|
10.3.11
|
||
|
10.3.12
|
||
|
10.3.13
|
||
E-2
|
10.3.14
|
||
|
10.3.15
|
||
|
10.3.16
|
||
|
10.3.17
|
||
|
10.3.18
|
||
|
10.3.19
|
||
|
10.3.20
|
||
|
10.3.21
|
|
|
|
10.3.22
|
|
|
|
10.3.23
|
|
|
|
10.3.24
|
||
|
10.3.25
|
||
|
10.3.26
|
||
|
10.3.27
|
||
|
10.3.28
|
||
|
10.4
|
||
|
10.4.1
|
||
|
10.4.2
|
||
|
10.5
|
||
E-3
|
10.6
|
||
|
10.7
|
||
|
10.8
|
||
|
10.9
|
|
|
|
10.10
|
||
|
10.10.1
|
||
|
10.10.2
|
||
|
10.10.3
|
||
|
10.10.4
|
||
|
10.10.5
|
||
|
10.10.6
|
||
|
10.11
|
||
|
10.12
|
||
|
10.13
|
||
|
10.13.1
|
||
|
10.13.2
|
||
|
10.14
|
||
|
10.15
|
||
E-4
|
10.16
|
||
|
10.16.1
|
||
|
10.16.2
|
||
|
10.16.3
|
||
|
10.16.4
|
||
|
10.16.5
|
||
|
10.17
|
||
|
10.17.1
|
||
|
10.17.2
|
||
|
10.17.3
|
||
|
10.17.4
|
||
|
10.17.5
|
||
|
10.17.6
|
||
|
10.17.7
|
||
|
10.17.8
|
||
E-5
|
10.17.9
|
|
|
|
10.17.10
|
||
|
10.17.11
|
||
|
10.18
|
||
|
10.19
|
||
|
21.1
|
||
|
23.1
|
||
|
31.1
|
||
|
31.2
|
||
|
32.1
|
||
|
32.2
|
||
|
101.INS
|
XBRL Instance Document (x)
|
|
|
101.SCH
|
XBRL Taxonomy Extension Schema Document (x)
|
|
|
101.CAL
|
XBRL Taxonomy Extension Calculation Linkbase Document (x)
|
|
|
101.DEF
|
XBRL Taxonomy Extension Definition Linkbase Document (x)
|
|
|
101.LAB
|
XBRL Taxonomy Extension Label Linkbase Document (x)
|
|
|
101.PRE
|
XBRL Taxonomy Extension Presentation Linkbase Document (x)
|
|
_______________
|
(x)
|
Filed herewith.
|
|
(xx)
|
Furnished herewith.
|
|
*
|
Management contract or compensatory plan or arrangement.
|
|
**
|
Certain exhibits and schedules have been omitted and Chart agrees to furnish supplementally to the Securities and Exchange Commission a copy of any omitted exhibits and schedules upon request.
|
E-6
TABLE OF CONTENTS
Part IItem 1. BusinessItem 1A. Risk FactorsItem 1B. Unresolved Staff CommentsItem 2. PropertiesItem 3. Legal ProceedingsItem 4. Mine Safety DisclosuresItem 4A. Executive Officers Of The Registrant*Part IIItem 5. Market For Registrant S Common Equity, Related Stockholder Matters and Issuer Purchases Of Equity SecuritiesItem 6. Selected Financial DataItem 7. Management S Discussion and Analysis Of Financial Condition and Results Of OperationsItem 7A. Quantitative and Qualitative Disclosures About Market RiskItem 8. Financial Statements and Supplementary DataItem 9. Changes in and Disagreements with Accountants on Accounting and Financial DisclosureItem 9A. Controls and ProceduresItem 9B. Other InformationPart IIIItem 10. Directors, Executive Officers and Corporate GovernanceItem 11. Executive CompensationItem 12. Security Ownership Of Certain Beneficial Owners and Management and Related Stockholder MattersItem 13. Certain Relationships, Related Transactions, and Director IndependenceItem 14. Principal Accounting Fees and ServicesPart IVItem 15. Exhibits and Financial Statement SchedulesItem 16. Form 10 K SummaryNote 1 Nature Of Operations and Principles Of ConsolidationNote 2 Significant Accounting PoliciesNote 3 Asset ImpairmentsNote 4 InventoriesNote 5 Property, Plant and EquipmentNote 6 Goodwill and Intangible AssetsNote 7 Debt and Credit ArrangementsNote 8 Financial Instruments and Derivative Financial InstrumentsNote 9 Product WarrantiesNote 10 Business CombinationsNote 11 Fair Value MeasurementsNote 12 Accumulated Other Comprehensive LossNote 13 Earnings (loss) Per ShareNote 14 Income TaxesNote 15 Employee Benefit PlansNote 16 Share-based CompensationNote 17 Lease CommitmentsNote 18 Commitments and ContingenciesNote 19 Restructuring ActivitiesNote 20 Segment and Geographic InformationNote 21 Quarterly Data (unaudited)Note 22 Subsequent Event