GRANITE CONSTRUCTION INC
10-Ks and 10-Qs
|
|
|
|
|
|
|
|
|
|
|
|
|
|
|
|
|
|
|
|
|
|
|
|
|
|
|
|
|
|
|
|
|
|
|
|
|
|
|
|
|
|
|
|
|
|
|
|
|
|
|
|
|
|
|
|

UNITED STATES
SECURITIES AND EXCHANGE COMMISSION
Washington, D.C. 20549
FORM 10-K
|
x
|
ANNUAL REPORT PURSUANT TO SECTION 13 OR 15(d) OF THE SECURITIES EXCHANGE ACT OF 1934
|
For the fiscal year ended
December 31, 2016
OR
|
o
|
TRANSITION REPORT PURSUANT TO SECTION 13 OR 15(d) OF THE SECURITIES EXCHANGE ACT OF 1934
|
For the transition period from _____ to _____
Commission file number 1-12911
Granite Construction Incorporated
(Exact name of registrant as specified in its charter)
|
Delaware
|
77-0239383
|
|
(State or other jurisdiction of incorporation or organization)
|
(I.R.S. Employer Identification Number)
|
|
585 West Beach Street
|
|
|
Watsonville, California
|
95076
|
|
(Address of principal executive offices)
|
(Zip Code)
|
Registrant’s telephone number, including area code:
(831) 724-1011
Securities registered pursuant to Section 12(b) of the Act:
|
Title of each class
|
Name of each exchange on which registered
|
|
Common Stock, $0.01 par value
|
New York Stock Exchange
|
Securities registered pursuant to Section 12(g) of the Act:
None
Indicate by check mark if the registrant is a well-known seasoned issuer, as defined in Rule 405 of the Securities Act. Yes
x
No
o
Indicate by check mark if the registrant is not required to file reports pursuant to Section 13 or Section 15(d) of the Act. Yes
o
No
x
Indicate by check mark whether the registrant (1) has filed all reports required to be filed by Section 13 or 15(d) of the Securities Exchange Act of 1934 during the preceding 12 months (or for such shorter period that the registrant was required to file such reports), and (2) has been subject to such filing requirements for the past 90 days. Yes
x
No
o
Indicate by check mark whether the registrant has submitted electronically and posted on its corporate Web site, if any, every Interactive Data File required to be submitted and posted pursuant to Rule 405 of Regulation S-T (§ 232.405 of this chapter) during the preceding 12 months (or for such shorter period that the registrant was required to submit and post such files). Yes
x
No
o
Indicate by check mark if disclosure of delinquent filers pursuant to Item 405 of Regulation S-K (§ 229.405 of this chapter) is not contained herein, and will not be contained, to the best of registrant’s knowledge, in definitive proxy or information statements incorporated by reference in Part III of this Form 10-K or any amendment to this Form 10-K.
o
Indicate by check mark whether the registrant is a large accelerated filer, an accelerated filer, a non-accelerated filer, or a smaller reporting company. See the definitions of “large accelerated filer,” “accelerated filer” and “smaller reporting company” in Rule 12b-2 of the Exchange Act. Large accelerated filer
x
Accelerated filer
o
Non-accelerated filer
o
Smaller reporting company
o
Indicate by check mark whether the registrant is a shell company (as defined in Rule 12b-2 of the Act). Yes
o
No
x
The aggregate market value of voting and non-voting common equity held by non-affiliates of the registrant was
$1.8 billion
as of
June 30,
2016
, based upon the price at which the registrant’s Common Stock was last sold as reported on the New York Stock Exchange on such date.
At
February 15, 2017
,
39,624,986
shares of Common Stock, par value $0.01, of the registrant were outstanding.
DOCUMENTS INCORPORATED BY REFERENCE
Certain information called for by Part III is incorporated by reference to the definitive Proxy Statement for the Annual Meeting of Shareholders of Granite Construction Incorporated to be held on
June 8, 2017
, which will be filed with the Securities and Exchange Commission not later than 120 days after
December 31, 2016
.
Index
PART IV
|
|
|
|
|
|
|
|
|
|
|
EXHIBIT 101.INS
|
|
|
EXHIBIT 101.SCH
|
|
|
EXHIBIT 101.CAL
|
|
|
EXHIBIT 101.DEF
|
|
|
EXHIBIT 101.LAB
|
|
|
EXHIBIT 101.PRE
|
1
DISCLOSURE REGARDING FORWARD-LOOKING STATEMENTS
From time to time, Granite makes certain comments and disclosures in reports and statements, including in this Annual Report on Form 10-K, or statements made by its officers or directors, that are not based on historical facts, including statements regarding future events, occurrences, circumstances, activities, performance, outcomes and results that may constitute forward-looking statements within the meaning of the Private Securities Litigation Reform Act of 1995. These forward-looking statements are identified by words such as “future,” “outlook,” “assumes,” “believes,” “expects,” “estimates,” “anticipates,” “intends,” “plans,” “appears,” “may,” “will,” “should,” “could,” “would,” “continue,” and the negatives thereof or other comparable terminology or by the context in which they are made. In addition, other written or oral statements which constitute forward-looking statements have been made and may in the future be made by or on behalf of Granite. These forward-looking statements are estimates reflecting the best judgment of senior management and reflect our current expectations regarding future events, occurrences, circumstances, activities, performance, outcomes and results. These expectations may or may not be realized. Some of these expectations may be based on beliefs, assumptions or estimates that may prove to be incorrect. In addition, our business and operations involve numerous risks and uncertainties, many of which are beyond our control, which could result in our expectations not being realized or otherwise materially affect our business, financial condition, results of operations, cash flows and liquidity. Such risks and uncertainties include, but are not limited to, those more specifically described in this report under “Item 1A. Risk Factors.” Due to the inherent risks and uncertainties associated with our forward-looking statements, the reader is cautioned not to place undue reliance on them. The reader is also cautioned that the forward-looking statements contained herein speak only as of the date of this Annual Report on Form 10-K, and, except as required by law, we undertake no obligation to revise or update any forward-looking statements for any reason.
Introduction
Granite Construction Company was originally incorporated in 1922. In 1990, Granite Construction Incorporated was formed as the holding company for Granite Construction Company and its wholly-owned subsidiaries and was incorporated in Delaware. Unless otherwise indicated, the terms “we,” “us,” “our,” “Company” and “Granite” refer to Granite Construction Incorporated and its consolidated subsidiaries.
We deliver infrastructure solutions for public and private clients primarily in the United States. We are one of the largest diversified heavy civil contractors and construction materials producers in the United States. We operate nationwide, serving both public and private sector clients. Within the public sector, we primarily concentrate on heavy-civil infrastructure projects, including the construction of streets, roads, highways, mass transit facilities, airport infrastructure, bridges, trenchless and underground utilities, power-related facilities, water and wastewater facilities, utilities, tunnels, dams and other infrastructure-related projects. Within the private sector, we perform site preparation and infrastructure services for residential development, energy development, commercial and industrial sites, and other facilities, as well as provide construction management professional services.
Operating Structure
Our business is organized into three reportable business segments. These business segments are: Construction, Large Project Construction and Construction Materials. See Note 18 of “Notes to the Consolidated Financial Statements” for additional information about our reportable business segments.
In addition to business segments, we review our business by operating groups and by public and private market sectors. Our operating groups are defined as follows: (i) California; (ii) Northwest, which primarily includes offices in Alaska, Arizona, Nevada, Utah and Washington; (iii) Heavy Civil, which primarily includes offices in California, Florida, New York and Texas; and (iv) Kenny, which primarily includes offices in Illinois. Each of these operating groups includes financial results from our Construction and Large Project Construction segments. A project’s results are reported in the operating group that is responsible for the project, not necessarily the geographic area where the work is located. In some cases, the operations of an operating group include the results of work performed outside of that geographic region. Our California and Northwest operating groups include financial results from our Construction Materials segment.
2
Construction:
Revenue from our Construction segment was
$1.4 billion
and
$1.3 billion
(
54.3%
and
53.3%
of our total revenue) in
2016
and
2015
, respectively. Revenue from our Construction segment is derived from both public and private sector clients. The Construction segment performs construction management, as well as various civil construction projects with a large portion of the work focused on new construction and improvement of streets, roads, highways, bridges, site work, underground, power-related facilities, water-related facilities, utilities and other infrastructure projects. These projects are typically bid-build projects completed within two years with a contract value of less than $75 million.
Large Project Construction:
Revenue from our Large Project Construction segment was
$888.2 million
and
$812.7 million
(
35.3%
and
34.3%
of our total revenue) in
2016
and
2015
, respectively. The Large Project Construction segment focuses on large, complex infrastructure projects which typically have a longer duration than our Construction segment work. These projects include major highways, mass transit facilities, bridges, tunnels, waterway locks and dams, pipelines, canals, power-related facilities, water-related facilities, utilities and airport infrastructure. This segment primarily includes bid-build, design-build and construction management/general contractor contracts, together with various contract methods relating to public-private partnerships, generally with contract values in excess of $75 million.
We utilize design-build, construction management/general contractor, construction management at-risk, and other alternative procurement methods of project delivery. Unlike traditional bid-build projects where owners first hire a design firm or design a project themselves and then put the project out to bid for construction, design-build projects provide the owner with a single point of responsibility and a single contact for both final design and construction. Although design-build projects carry additional risk as compared to traditional bid-build projects, the profit potential can also be higher. Under the construction management/general contractor and construction management at-risk methods of delivery, we contract with owners to assist the owner during the design phase of the contract with constructability efficiencies, with the understanding that we will negotiate a contract on the construction phase when the design nears completion. Revenue from alternative procurement method projects represented
81.0%
and
83.6%
of Large Project Construction revenue in
2016
and
2015
, respectively.
We participate in joint ventures with other construction companies mainly on projects in our Large Project Construction segment. Joint ventures are typically used for large, technically complex projects, including design-build projects, where it is necessary or desirable to share risk and resources. Joint venture partners typically provide independently prepared estimates, shared financing and equipment, and often bring local knowledge and expertise. For more information see the “Joint Ventures” section below.
Construction Materials:
Revenue from our Construction Materials segment to third parties was
$261.2 million
and
$295.6 million
(
10.4%
and
12.5%
of our total revenue) in
2016
and
2015
, respectively. The Construction Materials segment mines and processes aggregates and operates plants that produce construction materials for internal use and for sale to third parties. We have significant aggregate reserves that we own or lease through long-term leases. Sales to our construction projects represented
38.5%
of our combined internal and external Construction Materials sales during
2016
, and ranged from
30.5%
to
43.2%
over the last five years. The remainder is sold to third parties.
Business Strategy
Our business strategy is to consistently deliver ideas, innovations, products and services to our clients to power today’s mobile society by executing entrepreneurial market strategies that leverage the benefits of our company-wide resources and our core values. Our most fundamental objective is to increase long-term shareholder value as measured by the appreciation of the value of our common stock over a period of time, as well as dividend payouts. In alphabetical order, the following are key factors in our ability to achieve these objectives:
Aggregate Materials -
We own and lease aggregate reserves and own processing plants that are vertically integrated into our construction operations. By ensuring availability of these resources and providing quality products, we believe we have a competitive advantage in many of our markets, as well as a source of revenue and earnings from the sale of construction materials to third parties.
Decentralized Profit Centers -
Each of our operating groups is established as an individual profit center which encourages entrepreneurial activity while allowing the operating groups to benefit from centralized administrative, operational expertise and support functions.
Dedicated Construction Equipment
- We own and lease a large fleet of well-maintained heavy construction equipment. Dedicated access to a large pool of construction equipment enables us to compete more effectively by ensuring availability and maximizing returns on investment of the equipment.
3
Diversification -
To mitigate the risks inherent in the construction business as the result of general economic factors, we pursue projects: (i) in both the public and private sectors; (ii) in federal, rail, power, water and renewable energy markets; (iii) for a wide range of customers within each sector (from the federal government to small municipalities and from large corporations to individual homeowners); (iv) in diverse geographic markets; (v) that are construction management/general contractor, design-build and bid-build; (vi) at fixed price, time and materials, cost reimbursable and fixed unit price; and (vii) of various sizes, durations and complexity. In addition to pursuing opportunities with traditional project funding, we continue to evaluate other sources of project funding (e.g., public and private partnerships).
Employee Development
- We believe that our employees are the primary factor for the successful implementation of our business strategies. Significant resources are employed to attract, develop and retain extraordinary talent and fully promote each employee’s capabilities.
Performance-based Incentives -
Managers are incentivized with cash compensation and restricted stock unit equity awards, payable upon the attainment of pre-established annual financial and non-financial metrics.
Risk-Balanced Growth -
We intend to grow our business by working on many types of infrastructure projects, as well as by expanding into new geographic areas and end markets organically and through acquisitions. Growth opportunities are evaluated relative to their incremental impact to the execution risk and profitability profile of our operating portfolio.
Selective Bidding
- We focus our resources on bidding jobs that meet our selective bidding criteria, which include analyzing the risk of a potential job relative to: (i) available personnel to estimate and prepare the proposal as well as to effectively manage and build the project; (ii) the competitive environment; (iii) our experience with the type of work and with the owner; (iv) local resources and partnerships; (v) equipment resources; and (vi) the size, complexity and expected profitability of the job.
Our operating principles include:
Quality and High Ethical Standards
- We believe in the importance of performing high quality work. Additionally, we believe in maintaining high ethical standards through an established code of conduct and an effective company-wide compliance program, while being guided by our Core Values at all times.
Safety
- We believe the safety of our employees, the public and the environment is a moral obligation as well as good business. By identifying and concentrating resources to address jobsite hazards, we continually strive to eliminate our incident rates and the costs associated with accidents.
Sustainability -
Our focus on sustainability encompasses many aspects of how we conduct ourselves and practice our Core Values. We believe sustainability is important to our customers, employees, shareholders, and communities, and is also a long-term business driver. By focusing on specific initiatives that address social, environmental and economic challenges, we can minimize risk and increase our competitive advantage.
Raw Materials
We purchase raw materials, including but not limited to, aggregate products, cement, diesel and gasoline fuel, liquid asphalt, natural gas, propane and steel, from numerous sources. Our aggregate reserves supply a portion of the raw materials needed in our construction projects. The price and availability of raw materials may vary from year to year due to market conditions and production capacities. We do not foresee a lack of availability of any raw materials over the next twelve months.
Seasonality
Our operations are typically affected more by weather conditions during the first and fourth quarters of our fiscal year which may alter our construction schedules and can create variability in our revenues, profitability and the required number of employees.
Customers
Customers in our Construction segment include certain federal agencies, state departments of transportation, county and city public works departments, school districts and developers, utilities and private owners of industrial, commercial and residential sites. Customers of our Large Project Construction and Construction segments are predominantly in the public sector and currently include various state departments of transportation, local transit authorities, utilities and federal agencies. Customers of our Construction Materials segment include internal usage by our own construction projects, as well as third-party customers. Our third party customers include, but, are not limited to, contractors, landscapers, manufacturers of products requiring aggregate materials, retailers, homeowners, farmers and brokers.
4
During the year ended
December 31, 2016
, our largest volume customer, including both prime and subcontractor arrangements, was the
California Department of Transportation
(“
Caltrans
”). Revenue recognized from contracts with
Caltrans
during
2016
represented
$222.4 million
(
8.8%
of our total revenue), of which
$173.4 million
(
12.7%
of segment revenue) was in the Construction segment and
$48.7 million
(
5.5%
of segment revenue) was in the Large Project Construction segment. During the years ended
December 31, 2015
and
2014
, our largest volume customers, including both prime and subcontractor arrangements, were the
New York State Department of Transportation
(“
NYSDOT
”) and Caltrans, respectively. Revenue recognized from contracts with NYSDOT during 2015 represented
$199.0 million
(
8.4%
of total revenue), all of which was in the Large Project Construction segment (24.5% of segment revenue). Revenue recognized from contracts with Caltrans during 2014 totaled
$195.4 million
(
8.6%
of total revenue), of which
$178.7 million
(
15.1%
of segment revenue) was in the Construction segment and
$16.8 million
(
2.0%
of segment revenue) was in the Large Project Construction segment.
Contract Backlog
Our contract backlog consists of the unearned revenue on awarded contracts, including 100% of our consolidated joint venture contracts and our proportionate share of unconsolidated joint venture contracts. We generally include a project in our contract backlog at the time it is awarded and to the extent we believe funding is probable. Certain government contracts where funding is appropriated on a periodic basis are included in contract backlog at the time of the award and when it is probable that the contract value will be funded and executed. Certain contracts contain contract options that are exercisable at the option of our customers without requiring us to go through an additional competitive bidding process or contain task orders that are signed under master contracts under which we perform work only when the customer awards specific task orders to us. Awarded contracts that include unexercised contract options and unissued task orders are included in contract backlog to the extent options are exercised or task order issuance is probable.
Substantially all of the contracts in our contract backlog, as well as unexercised contract options and unissued task orders, may be canceled or modified at the election of the customer; however, we have not been materially adversely affected by contract cancellations or modifications in the past (see “Contract Provisions and Subcontracting”). Many projects in our Construction segment are added to backlog and completed within the same fiscal year and therefore may not be reflected in our beginning or year-end contract backlog. Contract backlog by segment is presented in “Contract Backlog” under “Item 7. Management’s Discussion and Analysis of Financial Condition and Results of Operations.” Our contract backlog was
$3.5 billion
and
$2.9 billion
at
December 31, 2016
and 2015, respectively. Approximately
$1.9 billion
of the
December 31, 2016
contract backlog is expected to be completed during
2017
.
Equipment
At
December 31, 2016
and
2015
, we owned the following number of construction equipment and vehicles:
|
December 31,
|
2016
|
2015
|
||
|
Heavy construction equipment
|
1,934
|
|
1,964
|
|
|
Trucks, truck-tractors, trailers and vehicles
|
3,503
|
|
3,440
|
|
Our portfolio of equipment includes backhoes, barges, bulldozers, cranes, excavators, loaders, motor graders, pavers, rollers, scrapers, trucks, special equipment for pipeline rehabilitation and tunnel boring machines that are used in our Construction, Large Project Construction and Construction Materials segments. We pool certain equipment to maximize utilization. We continually monitor and adjust our fleet size so that it is consistent with the size of our business, considering both existing contract backlog and expected future work. We lease or rent equipment to supplement our portfolio of equipment in response to construction activity cycles. In
2016
and
2015
, we spent
$65.1 million
and
$20.0 million
, respectively, on purchases of construction equipment and vehicles. The increase in 2016 was primarily due to purchases to replace a mature construction equipment fleet, to replace trucks for California Air Resources Board (“CARB”) regulation compliance as well as
$17.8 million
of job specific equipment for our Large Project Construction segment of which approximately
$9.4 million
is our consolidated construction joint ventures (“CCJVs”) partners’ share.
Employees
On
December 31, 2016
, we employed approximately
2,000
salaried employees who work in management, estimating and clerical capacities, plus approximately
1,400
hourly employees. The total number of hourly personnel is subject to the volume of construction in progress and is seasonal. During
2016
, the number of hourly employees ranged from approximately
1,400
to
3,300
and averaged approximately
2,700
. Four of our wholly-owned subsidiaries, Granite Construction Company, Granite Construction Northeast, Inc., Granite Infrastructure Constructors, Inc., and Kenny Construction Company, are parties to craft collective bargaining agreements in many areas in which they work.
We believe our employees are our most valuable resource, and our workforce possesses a strong dedication to and pride in our company. Our managerial and supervisory personnel have an average of approximately
10
years of service with Granite.
5
Competition
Competitors in our Construction segment typically range from small, local construction companies to large, regional, national and international construction companies. We compete with numerous companies in individual markets; however, there are few, if any, companies which compete in all of our market areas. Many of our Construction segment competitors have the ability to perform work in either the private or public sectors. When opportunities for work in one sector are reduced, competitors tend to look for opportunities in the other sector. This migration has the potential to reduce revenue growth and/or increase pressure on gross profit margins.
The scale and complexity of jobs in the Large Project Construction segment preclude many smaller contractors from bidding such work. Consequently, our Large Project Construction segment competition is typically comprised of large, regional, national and international construction companies.
We own and/or have long-term leases on aggregate resources that we believe provide a competitive advantage in certain markets for both the Construction and Large Project Construction segments.
Competitors in our Construction Materials segment typically range from small local materials companies to large regional, national and international materials companies. We compete with numerous companies in individual markets; however, there are few, if any, companies which compete in all of our market areas.
Factors influencing our competitiveness include price, estimating abilities, knowledge of local markets and conditions, project management, financial strength, reputation for quality, aggregate materials availability, and machinery and equipment. Historically, the construction business has not required large amounts of capital for the smaller size construction work pursued by our Construction segment, which can result in relative ease of market entry for companies possessing acceptable qualifications. By contrast, the construction work pursued and performed by our Large Project Construction segment typically requires large amounts of capital that may make entry into the market by future competitors more difficult. Historically, the required amount of capital has not had a significant impact on our ability to compete in the marketplace. Although the construction business is highly competitive, we believe we are well positioned to compete effectively in the markets in which we operate.
Contract Provisions and Subcontracting
Contracts with our customers are primarily “fixed unit price” or “fixed price.” Under fixed unit price contracts, we are committed to providing materials or services at fixed unit prices (for example, dollars per cubic yard of concrete placed or cubic yard of earth excavated). While the fixed unit price contract shifts the risk of estimating the quantity of units required for a particular project to the customer, any increase in our unit cost over the expected unit cost in the bid, whether due to inflation, inefficiency, incorrect estimates or other factors, is borne by us unless otherwise provided in the contract. Fixed price contracts are priced on a lump-sum basis under which we bear the risk that we may not be able to perform the work for the specified contract amount. The percentage of fixed price contracts in our contract backlog was
63.8%
at December 31,
2016
compared with
67.2%
at December 31,
2015
. The percentage of fixed unit price contracts in our contract backlog was
30.8%
and
28.1%
at December 31,
2016
and
2015
, respectively. All other contract types represented
5.4%
and
4.7%
of our contract backlog at December 31,
2016
and
2015
, respectively.
With the exception of contract change orders and affirmative claims, which are typically sole-source, our construction contracts are primarily obtained through competitive bidding in response to solicitations by both public agencies and private parties and on a negotiated basis as a result of solicitations from private parties. Project owners use a variety of methods to make contractors aware of new projects, including posting bidding opportunities on agency websites, disclosing long-term infrastructure plans, advertising and other general solicitations. Our bidding activity is affected by such factors as the nature and volume of advertising and other solicitations, contract backlog, available personnel, current utilization of equipment and other resources and competitive considerations. Our contract review process includes identifying risks and opportunities during the bidding process and managing these risks through mitigation efforts such as contract negotiation, bid/no bid decisions, insurance and pricing. Contracts fitting certain criteria of size and complexity are reviewed by various levels of management and, in some cases, by the Executive Committee of our Board of Directors. Bidding activity, contract backlog and revenue resulting from the award of new contracts may vary significantly from period to period.
6
There are a number of factors that can create variability in contract performance as compared to the original bid. Such factors can positively or negatively impact costs and profitability, may cause higher than anticipated construction costs and can create additional liability to the contract owner. The most significant of these include:
|
•
|
the completeness and accuracy of the original bid;
|
|
•
|
costs associated with scope changes;
|
|
•
|
costs of labor and/or materials;
|
|
•
|
extended overhead and other costs due to owner, weather and other delays;
|
|
•
|
subcontractor performance issues;
|
|
•
|
changes in productivity expectations;
|
|
•
|
site conditions that differ from those assumed in the original bid (to the extent contract remedies are unavailable);
|
|
•
|
changes from original design on design-build projects;
|
|
•
|
the availability and skill level of workers in the geographic location of the project;
|
|
•
|
a change in the availability and proximity of equipment and materials;
|
|
•
|
our ability to fully and promptly recover on affirmative claims and back charges for additional contract costs; and
|
|
•
|
the customer’s ability to properly administer the contract.
|
The ability to realize improvements on project profitability at times is more limited than the risk of lower profitability. For example, design-build projects typically incur additional costs such as right-of-way and permit acquisition costs. In addition, design-build contracts carry additional risks such as those associated with design errors and estimating quantities and prices before the project design is completed. We manage this additional risk by including contingencies to our bid amounts, obtaining errors and omissions insurance and obtaining indemnifications from our design consultants where possible. However, there is no guarantee that these risk management strategies will always be successful.
Most of our contracts, including those with the government, provide for termination at the convenience of the contract owner, with provisions to pay us for work performed through the date of termination. We have not been materially adversely affected by these provisions in the past. Many of our contracts contain provisions that require us to pay liquidated damages if specified completion schedule requirements are not met, and these amounts could be significant.
We act as prime contractor on most of our construction projects. We complete the majority of our projects with our own resources and subcontract specialized activities such as electrical and mechanical work. As prime contractor, we are responsible for the performance of the entire contract, including subcontract work. Thus, we may be subject to increased costs associated with the failure of one or more subcontractors to perform as anticipated. Based on our analysis of their construction and financial capabilities, among other criteria, we typically require the subcontractor to furnish a bond or other type of security to guarantee their performance and/or we retain payments in accordance with contract terms until their performance is complete. Disadvantaged business enterprise regulations require us to use our good faith efforts to subcontract a specified portion of contract work done for governmental agencies to certain types of disadvantaged contractors or suppliers. As with all of our subcontractors, some may not be able to obtain surety bonds or other types of performance security.
Joint Ventures
We participate in various construction joint ventures of which we are a limited member (“joint ventures”) in order to share expertise, risk and resources for certain highly complex projects. Generally, each construction joint venture is formed as a partnership or limited liability company to accomplish a specific project and is jointly controlled by the joint venture partners. We select our joint venture partners (“partner(s)”) based on our analysis of their construction and financial capabilities, expertise in the type of work to be performed and past working relationships, among other criteria. The joint venture agreements typically provide that our interests in any profits and assets, and our respective share in any losses and liabilities, that may result from the performance of the contract are limited to our stated percentage interest in the project.
Under each joint venture agreement, one partner is designated as the sponsor. The sponsoring partner typically provides all administrative, accounting and most of the project management support for the project and generally receives a fee from the joint venture for these services. We have been designated as the sponsoring partner in certain of our current joint venture projects and are a non-sponsoring partner in others.
We consolidate joint ventures where we have determined that through our participation we have a variable interest and are the primary beneficiary as defined by Financial Accounting Standards Board (“FASB”) Accounting Standards Codification (“ASC”) Topic 810,
Consolidation
, and related standards. Where we have determined we are not the primary beneficiary of a joint venture, we account for our share of the operations of jointly controlled construction joint ventures on a pro rata basis in revenue and cost of revenue in the consolidated statements of operations and in equity in construction joint ventures in the consolidated balance sheets. We account for non-construction joint ventures under the equity method of accounting and include our share of the operations in equity in income of affiliates in the consolidated statements of operations and in investment in affiliates in the consolidated balance sheets. We have been divesting equity method investments in real estate affiliates as part of our 2010 Enterprise Improvement Plan.
7
We also participate in various “line item” joint venture agreements under which each partner is responsible for performing certain discrete items of the total scope of contracted work. The revenue for these discrete items is defined in the contract with the project owner and each joint venture partner bears the profitability risk associated only with its own work. There is not a single set of books and records for a line item joint venture. Each partner accounts for its items of work individually as it would for any self-performed contract. We account for our portion of these contracts as revenues and cost of revenue in the consolidated statements of operations and in relevant balances in the consolidated balance sheets.
The agreements with our partner(s) for both construction joint ventures and line item joint ventures define each partner’s management role and financial responsibility in the project. The amount of operational exposure is generally limited to our stated ownership interest. However, due to the joint and several nature of the performance obligations under the related owner contracts, if one of the partners fails to perform, we and the remaining partners, if any, would be responsible for performance of the outstanding work (i.e., we provide a performance guarantee). We estimate our liability for performance guarantees for our unconsolidated and line item joint ventures and include them in accrued expenses and other current liabilities with a corresponding increase in equity in construction joint ventures in the consolidated balance sheets. We reassess our liability when and if changes in circumstances occur. The liability and corresponding asset are removed from the consolidated balance sheets upon completion and customer acceptance of the project. Circumstances that could lead to a loss under these agreements beyond our stated ownership interest include the failure of a partner to contribute additional funds to the venture in the event the project incurs a loss or additional costs that we could incur should a partner fail to provide the services and resources that it had committed to provide in the agreement. We are not able to estimate amounts that may be required beyond the remaining cost of the work to be performed. These costs could be offset by billings to the customer or by proceeds from our partners’ corporate and/or other guarantees.
At December 31,
2016
, there was
$5.0 billion
of construction revenue to be recognized on unconsolidated and line item construction joint venture contracts, of which
$1.6 billion
represented our share and the remaining
$3.4 billion
represented our partners’ share. See Note 6 of “Notes to the Consolidated Financial Statements” for more information.
Insurance and Bonding
We maintain general and excess liability, construction equipment, workers’ compensation and medical insurance; all in amounts consistent with industry practice.
In connection with our business, we generally are required to provide various types of surety bonds that provide an additional measure of security for our performance under certain public and private sector contracts. Our ability to obtain surety bonds depends upon our capitalization, working capital, past performance, management expertise and external factors, including the capacity of the overall surety market. Surety companies consider such factors in light of the amount of our contract backlog that we have currently bonded and their current underwriting standards, which may change from time to time. The capacity of the surety market is subject to market-based fluctuations driven primarily by the level of surety industry losses and the degree of surety market consolidation. When the surety market capacity shrinks it results in higher premiums and increased difficulty obtaining bonding, in particular for larger, more complex projects throughout the market. In order to help mitigate this risk, we employ a co-surety structure involving three sureties. Although we do not believe that fluctuations in surety market capacity have significantly affected our ability to grow our business, there is no assurance that it will not significantly affect our ability to obtain new contracts in the future (see “Item 1A. Risk Factors”).
Environmental Regulations
Our operations are subject to various federal, state and local laws and regulations relating to the environment, including those relating to discharges to air, water and land, the handling and disposal of solid and hazardous waste, the handling of underground storage tanks and the cleanup of properties affected by hazardous substances. Certain environmental laws impose substantial penalties for non-compliance and others, such as the federal Comprehensive Environmental Response, Compensation and Liability Act, impose strict, retroactive, joint and several liability upon persons responsible for releases of hazardous substances. We continually evaluate whether we must take additional steps at our locations to ensure compliance with environmental laws. While compliance with applicable regulatory requirements has not materially adversely affected our operations in the past, there can be no assurance that these requirements will not change and that compliance will not adversely affect our operations in the future. In addition, our aggregate materials operations require operating permits granted by governmental agencies. We believe that tighter regulations for the protection of the environment and other factors will make it increasingly difficult to obtain new permits and renewal of existing permits may be subject to more restrictive conditions than currently exist.
8
In July 2007, the CARB approved a regulation that will require California equipment owners/operators to reduce diesel particulate and nitrogen oxide emissions from in-use off-road diesel equipment and to meet progressively more restrictive emission targets from 2010 to 2020. In December 2008, CARB approved a similar regulation for in-use on-road diesel equipment that includes more restrictive emission targets from 2010 to 2022. The emission targets require California off-road and on-road diesel equipment owners to retrofit equipment with diesel emission control devices or replace equipment with new engine technology as it becomes available, which has resulted and will result in higher equipment-related expenses. In December 2010, CARB amended both regulations to grant economic relief to affected fleets by extending initial compliance dates as well as adding additional compliance requirements. To-date, costs to prepare the Company for compliance have totaled
$24.5 million
and costs of compliance in 2017 are estimated to be
$0.8 million
. We will continue to manage compliance costs; however, it is not possible to determine the total future cost of compliance.
As is the case with other companies in our industry, some of our aggregate products contain varying amounts of crystalline silica, a common mineral. Also, some of our construction and material processing operations release, as dust, crystalline silica that is in the materials being handled. Excessive, prolonged inhalation of very small-sized particles of crystalline silica has allegedly been associated with respiratory disease (including Silicosis). During 2016, the Occupational Safety and Health Administration (“OSHA”) implemented new and more stringent occupational exposure thresholds for crystalline silica exposure as respirable dust. In addition, the Mine Safety and Health Administration is proposing the identical rule as implemented by OSHA. We have implemented dust control procedures to measure compliance with requisite thresholds and to verify that respiratory protective equipment is made available as necessary. We also communicate, through safety data sheets and other means, what we believe to be appropriate warnings and cautions to employees and customers about the risks associated with excessive, prolonged inhalation of mineral dust in general and crystalline silica in particular (see “Item 1A. Risk Factors”). The scope of new exposure limits indicates that additional engineering controls, beyond providing respirators will be required to reduce potential exposure in response to the reduced exposure limits. The OSHA crystalline silica rule is currently being challenged in the courts. These rule changes are being tracked and monitored to evaluate potential future compliance costs; however, it is not possible at this time to determine the future cost of compliance.
Website Access
Our website address is www.graniteconstruction.com. On our website we make available, free of charge, our Annual Report on Form 10-K, Quarterly Reports on Form 10-Q, current reports on Form 8-K, and all amendments to those reports as soon as reasonably practicable after such material is electronically filed with or furnished to the Securities and Exchange Commission (“SEC”). The information on our website is not incorporated into, and is not part of, this report. These reports, and any amendments to them, are also available at the website of the SEC, www.sec.gov.
9
Executive Officers of the Registrant
Information regarding our executive officers is set forth below.
|
Name
|
Age
|
Position
|
|
James H. Roberts
|
60
|
President and Chief Executive Officer
|
|
Christopher S. Miller
|
50
|
Executive Vice President and Chief Operating Officer
|
|
Laurel J. Krzeminski
|
62
|
Executive Vice President and Chief Financial Officer
|
|
Martin P. Matheson
|
55
|
Senior Vice President and Group Manager
|
|
James D. Richards
|
53
|
Senior Vice President and Group Manager
|
|
Dale Swanberg
|
54
|
Senior Vice President and Group Manager
|
Mr. Roberts joined Granite in 1981 and has served in various capacities, including President and Chief Executive Officer since September 2010. He also served as Executive Vice President and Chief Operating Officer from September 2009 through August 2010, Senior Vice President from May 2004 through September 2009, Granite West Manager from February 2007 through September 2009, Branch Division Manager from May 2004 through February 2007, Vice President and Assistant Branch Division Manager from 1999 to 2004, and Regional Manager of Nevada and Utah Operations from 1995 to 1999. Mr. Roberts served as Chairman of The National Asphalt Pavement Association in 2006. He received a B.S.C.E. in 1979 and an M.S.C.E. in 1980 from the University of California, Berkeley, and an M.B.A. from the University of Southern California in 1981. He also completed the Stanford Executive Program in 2009.
Mr. Miller has served as Granite’s Executive Vice President and Chief Operating Officer since August 2014. From June 2006 through July 2014, he served in various executive positions with CH2M HILL, including Managing Director, Global Operations; Managing Director, United Kingdom Ministry of Defense Programs; President, Government Facilities and Infrastructure Business Group; President, CH2M HILL Constructors, Inc. and Global Business Development and Planning Director. Prior to CH2M Hill, Mr. Miller served as Director of Federal Programs for Jacobs Engineering Group. From 1989 to 1995, Mr. Miller served in the United States Air Force in the Human Systems Division, Weapons System Program Office and the Air Force Center for Environmental Excellence. He received a B.A. in Biology from the University of Louisville and an M.S. in Civil Engineering from the University of Texas at San Antonio.
Ms. Krzeminski joined Granite in 2008 and has served as Chief Financial Officer since November 2010. She has served as Executive Vice President since December 2015, Senior Vice President from January 2013 through December 2015, Vice President from July 2008 through December 2012, Interim Chief Financial Officer from June 2010 to October 2010 and Corporate Controller from July 2008 through May 2010. From 1993 to 2007, she served in various corporate and operational finance positions with The Gillette Company (acquired by The Procter & Gamble Company in 2005), including Finance Director for the Duracell and Braun North American business units. Ms. Krzeminski also served as the Director of Gillette’s Sarbanes-Oxley Section 404 Compliance program and as Gillette’s Director of Corporate Financial Reporting. Ms. Krzeminski is currently a member of the board of directors of Terracon. Her experience also includes several years in public accounting with an international accounting firm. Ms. Krzeminski received a B.S. in Business Administration-Accounting from San Diego State University.
Mr. Matheson joined Granite in 1989 and has served as Senior Vice President and Group Manager since August 2013. He also served as Washington Region Manager from February 2007 through July 2013, Branch Division Construction Manager from 2006 through February 2007, Utah Operations Area/Operations Manager from 1999 to 2006 and in other positions at Granite’s Nevada Branch between 1989 and 1997. Prior to joining Granite, he worked at Kenny Construction Company. Mr. Matheson received a B.S. in Animal Science from University of Illinois in 1983.
Mr. Richards joined Granite in January 1992 and has served as Senior Vice President and Group Manager since January 2013. He also served as Arizona Region Manager from February 2006 through December 2012, Arizona Region Chief Estimator from January 2000 through January 2006 and in other positions at Granite’s Arizona Branch between 1992 and 2000. Prior to joining Granite, he served as a U.S. Army Officer. Mr. Richards received a B.S. in Civil Engineering from New Mexico State University in 1987.
Mr. Swanberg joined Granite in 2015 and has served as Senior Vice President and Group Manager since January 1, 2017 and as Vice President and Deputy Group Manager since April 2015. In 2013, Mr. Swanberg served as the Chief Operating Officer of Flatiron Construction. Prior to Flatiron Construction, he served in various positions for the Walsh Group from 1985 to 2012, including as the President of the Heavy Civil Group. Mr. Swanberg received a B.S. in Civil Engineering from Bradley University in 1984.
10
Set forth below and elsewhere in this report and in other documents we file with the SEC are various risks and uncertainties that could cause our actual results to differ materially from the results contemplated by the forward-looking statements contained in this report or otherwise adversely affect our business.
|
•
|
Unfavorable economic conditions may have an adverse impact on our business.
Volatility in the global financial system, deterioration in general economic activity, and fiscal, monetary and other policies that the U.S. government may enact, including infrastructure spending or Congress’ deficit reduction measures, may have an adverse impact on our business, financial position, results of operations, cash flows and liquidity. In particular, low tax revenues, budget deficits, financing constraints, including timing of long-term federal funding releases, and competing priorities could negatively impact the ability of government agencies to fund existing or new infrastructure projects in the public sector. In addition, these factors could have a material adverse effect on the financial market and economic conditions in the United States as well as throughout the world, which may limit our ability and the ability of our customers to obtain financing and/or could impair our ability to execute our acquisition strategy. In addition, levels of new commercial and residential construction projects could be adversely affected by oversupply of existing inventories of commercial and residential properties, low property values and a restrictive financing environment.
|
|
•
|
We work in a highly competitive marketplace.
We have multiple competitors in all of the areas in which we work, and some of our competitors are larger than we are and may have greater resources than we do. Government funding for public works projects is limited, thus contributing to competition for the limited number of public projects available. This increased competition may result in a decrease in new awards at acceptable profit margins. In addition, should downturns in residential and commercial construction activity occur, the competition for available public sector work would intensify, which could impact our revenue, contract backlog and profit margins.
|
|
•
|
Government contracts generally have strict regulatory requirements.
Approximately
83.7%
of our Construction and Large Project Construction revenue in
2016
was derived from contracts funded by federal, state and local government agencies and authorities. Government contracts are subject to specific procurement regulations, contract provisions and a variety of socioeconomic requirements relating to their formation, administration, performance and accounting and often include express or implied certifications of compliance. Claims for civil or criminal fraud may be brought for violations of regulations, requirements or statutes. We may also be subject to qui tam litigation brought by private individuals on behalf of the government under the Federal Civil False Claims Act, which could include claims for up to treble damages. Further, if we fail to comply with any of the regulations, requirements or statutes or if we have a substantial number of accumulated Occupational Safety and Health Administration, Mine Safety and Health Administration or other workplace safety violations, our existing government contracts could be terminated and we could be suspended from government contracting or subcontracting, including federally funded projects at the state level. Should one or more of these events occur, it could have a material adverse effect on our financial position, results of operations, cash flows and liquidity.
|
|
•
|
Government contractors are subject to suspension or debarment from government contracting.
Our substantial dependence on government contracts exposes us to a variety of risks that differ from those associated with private sector contracts. Various statutes to which our operations are subject, including the Davis-Bacon Act (which regulates wages and benefits), the Walsh-Healy Act (which prescribes a minimum wage and regulates overtime and working conditions), Executive Order 11246 (which establishes equal employment opportunity and affirmative action requirements) and the Drug-Free Workplace Act, provide for mandatory suspension and/or debarment of contractors in certain circumstances involving statutory violations. In addition, the Federal Acquisition Regulation and various state statutes provide for discretionary suspension and/or debarment in certain circumstances that might call into question a contractor’s willingness or ability to act responsibly, including as a result of being convicted of, or being found civilly liable for, fraud or a criminal offense in connection with obtaining, attempting to obtain or performing a public contract or subcontract. The scope and duration of any suspension or debarment may vary depending upon the facts and the statutory or regulatory grounds for debarment and could have a material adverse effect on our financial position, results of operations, cash flows and liquidity.
|
|
•
|
Our success depends on attracting and retaining qualified personnel, joint venture partners and subcontractors in a competitive environment.
The success of our business is dependent on our ability to attract, develop and retain qualified personnel, joint venture partners, advisors and subcontractors. Changes in general or local economic conditions and the resulting impact on the labor market and on our joint venture partners may make it difficult to attract or retain qualified individuals in the geographic areas where we perform our work. If we are unable to provide competitive compensation packages, high-quality training programs and attractive work environments or to establish and maintain successful partnerships, our ability to profitably execute our work could be adversely impacted.
|
11
|
•
|
Failure to maintain safe work sites could result in significant losses.
Construction and maintenance sites are potentially dangerous workplaces and often put our employees and others in close proximity with mechanized equipment, moving vehicles, chemical and manufacturing processes, and highly regulated materials. On many sites, we are responsible for safety and, accordingly, must implement safety procedures. If we fail to implement these procedures or if the procedures we implement are ineffective, we may suffer the loss of or injury to our employees, as well as expose ourselves to possible litigation. Our failure to maintain adequate safety standards through our safety programs could result in reduced profitability or the loss of projects or clients, and could have a material adverse impact on our financial position, results of operations, cash flows and liquidity.
|
|
•
|
An inability to obtain bonding could have a negative impact on our operations and results.
As more fully described in “Insurance and Bonding” under “Item 1. Business,” we generally are required to provide surety bonds securing our performance under the majority of our public and private sector contracts. Our inability to obtain reasonably priced surety bonds in the future could significantly affect our ability to be awarded new contracts, which could have a material adverse effect on our financial position, results of operations, cash flows and liquidity.
|
|
•
|
We may be unable to identify and contract with qualified Disadvantaged Business Enterprise (“DBE”) contractors to perform as subcontractors.
Certain of our government agency projects contain minimum DBE participation clauses. If we subsequently fail to complete these projects with the minimum DBE participation, we may be held responsible for breach of contract, which may include restrictions on our ability to bid on future projects as well as monetary damages. To the extent we are responsible for monetary damages, the total costs of the project could exceed our original estimates, we could experience reduced profits or a loss for that project and there could be a material adverse impact to our financial position, results of operations, cash flows and liquidity.
|
|
•
|
Fixed price and fixed unit price contracts subject us to the risk of increased project cost.
As more fully described in “Contract Provisions and Subcontracting” under “Item 1. Business,” the profitability of our fixed price and fixed unit price contracts can be adversely affected by a number of factors that can cause our actual costs to materially exceed the costs estimated at the time of our original bid. This could result in reduced profits or a loss for that project and there could be a material adverse impact to our financial position, results of operations, cash flows and liquidity.
|
|
•
|
Design-build contracts subject us to the risk of design errors and omissions.
Design-build is increasingly being used as a method of project delivery as it provides the owner with a single point of responsibility for both design and construction. We generally subcontract design responsibility to architectural and engineering firms. However, in the event of a design error or omission causing damages, there is risk that the subcontractor or their errors and omissions insurance would not be able to absorb the liability. In this case we may be responsible, resulting in a potentially material adverse effect on our financial position, results of operations, cash flows and liquidity.
|
|
•
|
Many of our contracts have penalties for late completion.
In some instances, including many of our fixed price contracts, we guarantee that we will complete a project by a certain date. If we subsequently fail to complete the project as scheduled we may be held responsible for costs resulting from the delay, generally in the form of contractually agreed-upon liquidated damages. To the extent these events occur, the total cost of the project could exceed our original estimate and we could experience reduced profits or a loss on that project and there could be a material adverse impact to our financial position, results of operations, cash flows and liquidity.
|
|
•
|
Strikes or work stoppages could have a negative impact on our operations and results.
We are party to collective bargaining agreements covering a portion of our craft workforce. Although strikes or work stoppages have not had a significant impact on our operations or results in the past, such labor actions could have a significant impact on our operations and results if they occur in the future.
|
|
•
|
Failure of our subcontractors to perform as anticipated could have a negative impact on our results.
As further described in “Contract Provisions and Subcontracting” under “Item 1. Business,” we subcontract portions of many of our contracts to specialty subcontractors, but we are ultimately responsible for the successful completion of their work. Although we seek to require bonding or other forms of guarantees, we are not always successful in obtaining those bonds or guarantees from our higher-risk subcontractors. In this case we may be responsible for the failures on the part of our subcontractors to perform as anticipated, resulting in a potentially adverse impact on our cash flows and liquidity. In addition, the total costs of a project could exceed our original estimates and we could experience reduced profits or a loss for that project, which could have an adverse impact on our financial position, results of operations, cash flows and liquidity.
|
12
|
•
|
Our joint venture contracts subject us to risks and uncertainties, some of which are outside of our control
.
As further described in Note 1 of “Notes to the Consolidated Financial Statements” and under “Item 1. Business; Joint Ventures,” we perform certain construction contracts as a limited member of joint ventures. Participating in these arrangements exposes us to risks and uncertainties, including the risk that if our partners fail to perform under joint and several liability contracts, we could be liable for completion of the entire contract. In addition, if our partners are not able or willing to provide their share of capital investment to fund the operations of the venture, there could be unanticipated costs to complete the projects, financial penalties or liquidated damages. These situations could have a material adverse effect on our financial position, results of operations, cash flows and liquidity.
|
To the extent we are not the controlling partner, we have limited control over many of the decisions made with respect to the related construction projects. These joint ventures may not be subject to the same compliance requirements, including those related to internal control over financial reporting. While we have controls to sufficiently mitigate the risks associated with reliance on their control environment and financial information, to the extent the controlling partner makes decisions that negatively impact the joint venture or internal control problems arise within the joint venture, it could have a material adverse impact on our business, financial position, results of operations, cash flows and liquidity.
|
•
|
Our failure to adequately recover on affirmative claims brought by us against project owners or other project participants (e.g., back charges against subcontractors) for additional contract costs could have a negative impact on our liquidity and future operations.
In certain circumstances, we assert affirmative claims against project owners, engineers, consultants, subcontractors or others involved in a project for additional costs exceeding the contract price or for amounts not included in the original contract price. These types of affirmative claims occur due to matters such as delays or changes from the initial project scope, both of which may result in additional costs. Often, these affirmative claims can be the subject of lengthy arbitration or litigation proceedings, and it is difficult to accurately predict when and on what terms they will be fully resolved. The potential gross profit impact of recoveries for affirmative claims may be material in future periods when they, or a portion of them, become probable and estimable or are settled. When these types of events occur, we use working capital to cover cost overruns pending the resolution of the relevant affirmative claims and may incur additional costs when pursuing such potential recoveries. A failure to recover on these types of affirmative claims promptly and fully could have a negative impact on our financial position, results of operations, cash flows and liquidity. In addition, while clients and subcontractors may be obligated to indemnify us against certain liabilities, such third parties may refuse or be unable to pay us.
|
|
•
|
Failure to remain in compliance with covenants under our debt and credit agreements, service our indebtedness, or fund our other liquidity needs could adversely impact our business.
Our debt and credit agreements and related restrictive and financial covenants are more fully described in Note 11 of “Notes to the Consolidated Financial Statements.” Our failure to comply with any of these covenants, or to pay principal, interest or other amounts when due thereunder, would constitute an event of default under the applicable agreements. Under certain circumstances, the occurrence of an event of default under one of our debt or credit agreements (or the acceleration of the maturity of the indebtedness under one of our agreements) may constitute an event of default under one or more of our other debt or credit agreements. Default under our debt and credit agreements could result in (i) us no longer being entitled to borrow under the agreements; (ii) termination of the agreements; (iii) the requirement that any letters of credit under the agreements be cash collateralized; (iv) acceleration of the maturity of outstanding indebtedness under the agreements; and/or (v) foreclosure on any collateral securing the obligations under the agreements. If we are unable to service our debt obligations or fund our other liquidity needs, we could be forced to curtail our operations, reorganize our capital structure (including through bankruptcy proceedings) or liquidate some or all of our assets in a manner that could cause holders of our securities to experience a partial or total loss of their investment in us.
|
|
•
|
Unavailability of insurance coverage could have a negative effect on our operations and results.
We maintain insurance coverage as part of our overall risk management strategy and pursuant to requirements to maintain specific coverage that are contained in our financing agreements and in most of our construction contracts. Although we have been able to obtain reasonably priced insurance coverage to meet our requirements in the past, there is no assurance that we will be able to do so in the future, and our inability to obtain such coverage could have an adverse impact on our ability to procure new work, which could have a material adverse effect on our financial position, results of operations, cash flows and liquidity.
|
13
|
•
|
Accounting for our revenues and costs involves significant estimates.
As further described in “Critical Accounting Policies and Estimates” under “Item 7. Management’s Discussion and Analysis of Financial Condition and Results of Operations,” accounting for our contract-related revenues and costs, as well as other expenses, requires management to make a variety of significant estimates and assumptions. Although we believe we have sufficient experience and processes to enable us to formulate appropriate assumptions and produce reasonably dependable estimates, these assumptions and estimates may change significantly in the future and could result in the reversal of previously recognized revenue and profit. Such changes could have a material adverse effect on our financial position and results of operations.
|
|
•
|
We use certain commodity products that are subject to significant price fluctuations.
Petroleum based products, such as fuels, lubricants, and liquid asphalt, are used to power or lubricate our equipment, operate our plants, and a significant ingredient in the asphaltic concrete we manufacture for sale to third parties and use in our asphalt paving construction projects. Although we are partially protected by asphalt or fuel price escalation clauses in some of our contracts, many contracts provide no such protection. We also use steel and other commodities in our construction projects that can be subject to significant price fluctuations. To mitigate these risks, we pre-purchase commodities, enter into supply agreements or enter into financial contracts to secure pricing. Although we have not been significantly adversely affected by price fluctuations in the past, there is no guarantee that we will not be in the future.
|
|
•
|
We are subject to environmental and other regulation.
As more fully described in “Environmental Regulations” under “Item 1. Business,” we are subject to a number of federal, state and local laws and regulations relating to the environment, workplace safety and a variety of socioeconomic requirements. Noncompliance with such laws and regulations can result in substantial penalties, or termination or suspension of government contracts as well as civil and criminal liability. In addition, some environmental laws and regulations impose liability and responsibility on present and former owners, operators or users of facilities and sites for contamination at such facilities and sites, without regard to causation or knowledge of contamination. We occasionally evaluate various alternatives with respect to our facilities, including possible dispositions or closures. Investigations undertaken in connection with these activities may lead to discoveries of contamination that must be remediated, and closures of facilities may trigger compliance requirements that are not applicable to operating facilities. While compliance with these laws and regulations has not materially adversely affected our operations in the past, there can be no assurance that these requirements will not change and that compliance will not adversely affect our operations in the future. Furthermore, we cannot provide assurance that existing or future circumstances or developments with respect to contamination will not require us to make significant remediation or restoration expenditures.
|
|
•
|
Weather can significantly affect our revenues and profitability.
Our ability to perform work is significantly affected by weather conditions such as precipitation and temperature. Changes in weather conditions can cause delays and otherwise significantly affect our project costs. The impact of weather conditions can result in variability in our quarterly revenues and profitability, particularly in the first and fourth quarters of the year.
|
|
•
|
Increasing restrictions on securing aggregate reserves could negatively affect our future operations and results.
Tighter regulations and the finite nature of property containing suitable aggregate reserves are making it increasingly challenging and costly to secure aggregate reserves. Although we have thus far been able to secure reserves to support our business, our financial position, results of operations, cash flows and liquidity may be adversely affected by an increasingly difficult permitting process.
|
|
•
|
We may be required to contribute cash to meet our unfunded pension obligations in certain multi-employer plans.
Four of our wholly-owned subsidiaries, Granite Construction Company, Granite Construction Northeast, Inc., Granite Industrial, Inc., and Kenny Construction Company, participate in various domestic multi-employer pension plans on behalf of union employees. Union employee benefits generally are based on a fixed amount for each year of service. We are required to make contributions to the plans in amounts established under collective bargaining agreements. Pension expense is recognized as contributions are made. The domestic pension plans are subject to the Employee Retirement Income Security Act of 1974 (“ERISA”). Under ERISA, a contributor to a multi-employer plan may be liable, upon termination or withdrawal from a plan, for its proportionate share of a plan’s unfunded vested liability. While we currently have no intention of withdrawing from a plan and unfunded pension obligations have not significantly affected our operations in the past, there can be no assurance that we will not be required to make material cash contributions to one or more of these plans to satisfy certain underfunded benefit obligations in the future.
|
14
|
•
|
Force majeure events, including natural disasters and terrorists’ actions, could negatively impact our business, which may affect our financial condition, results of operations or cash flows.
Force majeure or extraordinary events beyond the control of the contracting parties, such as natural and man-made disasters, as well as terrorist actions, could negatively impact the economies in which we operate. We typically negotiate contract language where we are allowed certain relief from force majeure events in private client contracts and review and attempt to mitigate force majeure events in both public and private client contracts. We remain obligated to perform our services after most extraordinary events subject to relief that may be available pursuant to a force majeure clause. If we are not able to react quickly to force majeure events, our operations may be affected, which could have a material adverse effect on our financial position, results of operations, cash flows and liquidity.
|
|
•
|
Changes to our outsourced software or infrastructure vendors as well as any sudden loss, breach of security, disruption or unexpected data or vendor loss associated with our information technology systems could have a material adverse effect on our business.
We rely on third-party software and infrastructure to run critical accounting, project management and financial information systems. If software or infrastructure vendors decide to discontinue further development, integration or long-term maintenance support for our information systems, or there is any system interruption, delay, breach of security, loss of data or loss of a vendor, we may need to migrate some or all of our accounting, project management and financial information to other systems. Despite business continuity plans, these disruptions could increase our operational expense as well as impact the management of our business operations, which could have a material adverse effect on our financial position, results of operations, cash flows and liquidity.
|
|
•
|
An inability to safeguard our information technology environment could result in business interruptions, remediation costs and/or legal claims
.
To protect confidential customer, vendor, financial and employee information, we employ information security measures that secure our information systems from cybersecurity attacks or breaches. Even with these measures, we may be subject to unauthorized access of digital data with the intent to misappropriate information, corrupt data or cause operational disruptions. If a failure of our safeguarding measures were to occur, it could have a negative impact to our business and result in business interruptions, remediation costs and/or legal claims, which could have a material adverse effect on our financial position, results of operations, cash flows and liquidity.
|
|
•
|
A change in tax laws or regulations of any federal, state or international jurisdiction in which we operate could increase our tax burden and otherwise adversely affect our financial position, results of operations, cash flows and liquidity.
We continue to assess the impact of various U.S. federal, state, local and international legislative proposals that could result in a material increase to our U.S. federal, state, local and/or international taxes. We cannot predict whether any specific legislation will be enacted or the terms of any such legislation. However, if such proposals were to be enacted, or if modifications were to be made to certain existing regulations, the consequences could have a material adverse impact on us, including increasing our tax burden, increasing our cost of tax compliance or otherwise adversely affecting our financial position, results of operations, cash flows and liquidity.
|
|
•
|
Our contract backlog is subject to unexpected adjustments and cancellations and could be an uncertain indicator of our future earnings.
We cannot guarantee that the revenues projected in our contract backlog will be realized or, if realized, will be profitable. Projects reflected in our contract backlog may be affected by project cancellations, scope adjustments, time extensions or other changes. Such changes may adversely affect the revenue and profit we ultimately realize on these projects.
|
|
•
|
Our business strategy includes growing our international operations in Canada and U.S. Territories, which are subject to a number of special risks.
As part of our strategic diversification efforts, we may enter into more construction contracts in Canada or U.S. Territories, which may subject us to a number of special risks unique to foreign countries and/or operations. Due to the special risks associated with non-U.S. operations, our exposure to such risks may not be proportionate to the percentage of our revenues attributable to such operations.
|
15
|
•
|
As a part of our growth strategy we have made and may make future acquisitions, and acquisitions involve many risks.
These risks include:
|
|
◦
|
difficulties integrating the operations and personnel of the acquired companies;
|
|
◦
|
diversion of management’s attention from ongoing operations;
|
|
◦
|
potential difficulties and increased costs associated with completion of any assumed construction projects;
|
|
◦
|
insufficient revenues to offset increased expenses associated with acquisitions and the potential loss of key employees or customers of the acquired companies;
|
|
◦
|
assumption of liabilities of an acquired business, including liabilities that were unknown at the time the acquisition was negotiated;
|
|
◦
|
difficulties relating to assimilating the personnel, services, and systems of an acquired business and to assimilating marketing and other operational capabilities;
|
|
◦
|
increased burdens on our staff and on our administrative, internal control and operating systems, which may hinder our legal and regulatory compliance activities;
|
|
◦
|
difficulties in applying and integrating our system of internal controls to an acquired business;
|
|
◦
|
if we issue additional equity securities, such issuances could have the effect of diluting our earnings per share as well as our existing shareholders’ individual ownership percentages in the Company;
|
|
◦
|
the recording of goodwill or other non-amortizable intangible assets that will be subject to subsequent impairment testing and potential impairment charges, as well as amortization expenses related to certain other intangible assets; and
|
|
◦
|
while we often obtain indemnification rights from the sellers of acquired businesses, such rights may be difficult to enforce, the losses may exceed any dedicated escrow funds, and the indemnitors may not have the ability to financially support the indemnity.
|
Failure to manage and successfully integrate acquisitions could harm our financial position, results of operations, cash flows and liquidity.
|
•
|
Rising inflation and/or interest rates could have an adverse effect on our business, financial condition and results of operations.
Economic factors, including inflation and fluctuations in interest rates, could have a negative impact on our business. If our costs were to become subject to significant inflationary pressures, we may not be able to fully offset such higher costs through price increases. Our inability or failure to do so could have a material adverse effect on our financial position, results of operations, cash flows and liquidity.
|
The foregoing list is not all-inclusive. There can be no assurance that we have correctly identified and appropriately assessed all factors affecting our business or that the publicly available and other information with respect to these matters is complete and correct. Additional risks and uncertainties not presently known to us or that we currently believe to be immaterial may also adversely affect us. These developments could have material adverse effects on our business, financial condition, results of operations and liquidity. For these reasons, the reader is cautioned not to place undue reliance on our forward-looking statements.
None.
16
Quarry Properties
As of
December 31, 2016
, we had
39
active and
26
inactive permitted quarry properties available for the extraction of sand and gravel and hard rock, all of which are located in the western United States. All of our quarries are open-pit and are primarily accessible by road. We process aggregates into construction materials for internal use and for sale to third parties. Our plant equipment is powered mostly by electricity provided by local utility companies. The following map shows the approximate locations of our permitted quarry properties as of
December 31, 2016
.
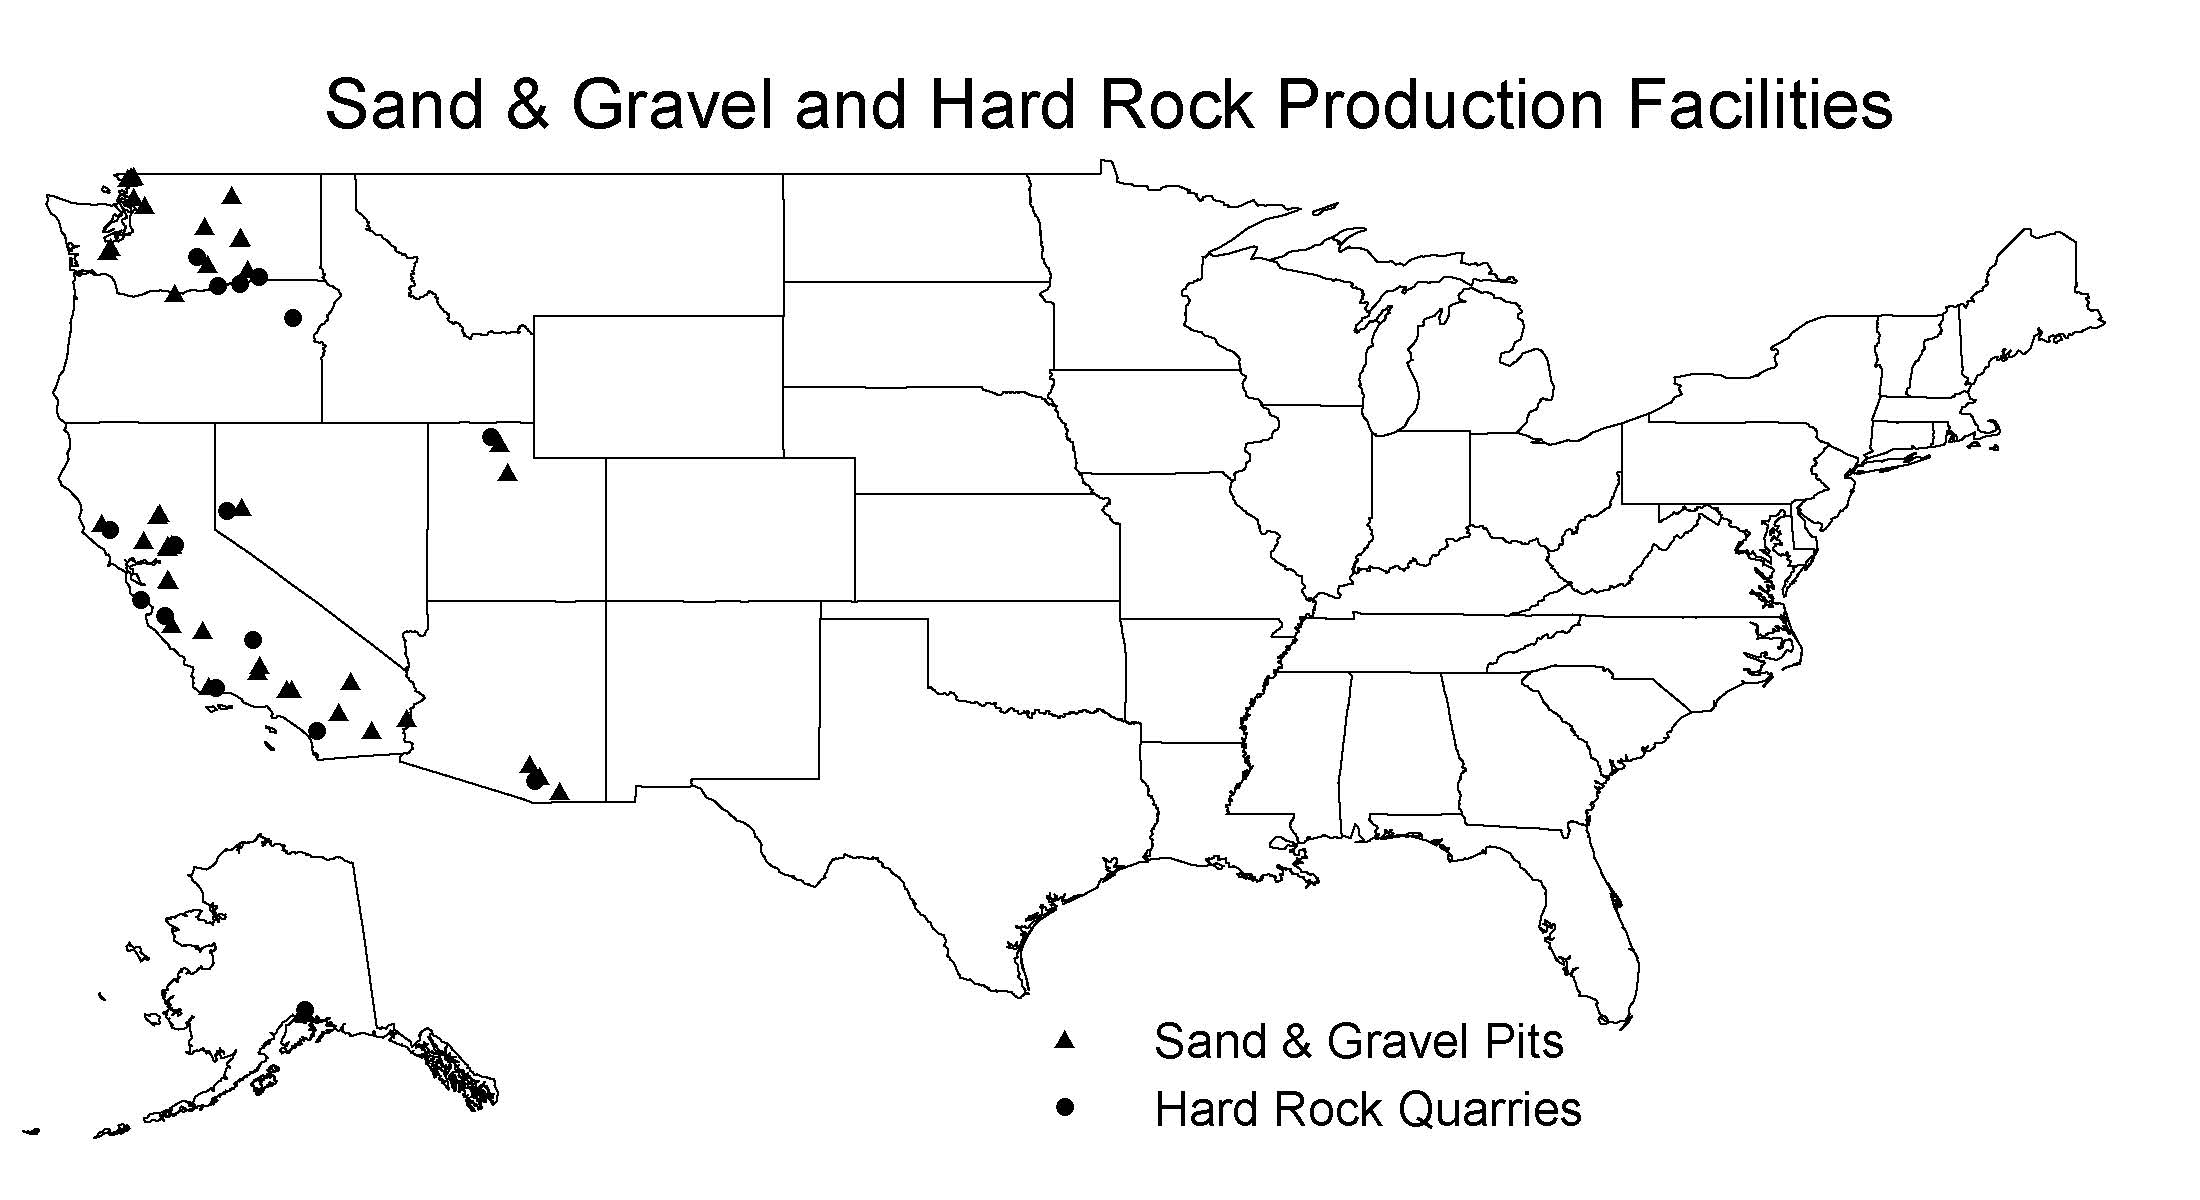
We estimate our permitted proven
1
and probable
2
aggregate reserves to be approximately
728.0 million
tons with an average permitted life of approximately
65
years at present operating levels. Present operating levels are determined based on a three-year annual average aggregate production rate of
11.2 million
tons. Reserve estimates were made by our geologists and engineers based primarily on drilling studies. Reserve estimates are based on various assumptions, and any material inaccuracies in these assumptions could have a material impact on the accuracy of our reserve estimates. These properties are primarily used by our Construction and Construction Materials segments.
1
Proven reserves are determined through the testing of samples obtained from closely spaced subsurface drilling and/or exposed pit faces. Proven reserves are sufficiently understood so that quantity, quality, and engineering conditions are known with sufficient accuracy to be mined without the need for any further subsurface work. Actual required spacing is based on geologic judgment about the predictability and continuity of each deposit.
2
Probable reserves are determined through the testing of samples obtained from subsurface drilling but the sample points are too widely spaced to allow detailed prediction of quantity, quality, and engineering conditions. Additional subsurface work may be needed prior to mining the reserve.
17
The following tables present information about our quarry properties as of
December 31, 2016
(tons in millions):
|
|
Type
|
|
||||
|
Quarry Properties
|
Sand & Gravel
|
Hard Rock
|
Permitted Aggregate Reserves (tons)
|
Unpermitted Aggregate Reserves (tons)
|
Three-Year Annual Average Production Rate (tons)
|
Average Reserve Life
|
|
Owned quarry properties
|
25
|
5
|
430.4
|
341.5
|
6.0
|
72
|
|
Leased quarry properties
1
|
23
|
12
|
297.4
|
41.6
|
5.2
|
57
|
1
Our leases have terms which range from month-to-month to
45
years with most including an option to renew.
|
|
|
Permitted Reserves
for Each Product Type (tons)
|
Percentage of Permitted Reserves Owned and Leased
|
||||
|
State
|
Number of Properties
|
Sand & Gravel
|
Hard Rock
|
Owned
|
Leased
|
||
|
California
|
28
|
249.0
|
246.8
|
58
|
%
|
42
|
%
|
|
Non-California
|
37
|
139.0
|
93.0
|
61
|
%
|
39
|
%
|
Plant Properties
We operate plants at our quarry sites to process aggregates into construction materials. Some of our sites may have more than one crushing, concrete or asphalt processing plant. In an effort to continuously increase efficiencies based on external and internal demands, we sold or otherwise disposed of several plants and the associated land in California during 2016 and 2015. These sales or dispositions resulted in gains during
2016
and
2015
of approximately $2.6 million and $0.2 million, respectively, that were recorded to gain on sales of property and equipment in the consolidated statements of operations. At
December 31, 2016
and
2015
, we owned the following plants:
|
December 31,
|
2016
|
2015
|
||
|
Aggregate crushing plants
|
30
|
|
32
|
|
|
Asphalt concrete plants
|
50
|
|
50
|
|
|
Cement concrete batch plants
|
7
|
|
8
|
|
|
Asphalt rubber plants
|
6
|
|
5
|
|
|
Lime slurry plants
|
8
|
|
9
|
|
These plants are primarily used by our Construction and Construction Materials segments.
Other Properties
The following table provides our estimate of certain information about other properties as of
December 31, 2016
:
|
|
Land Area (acres)
|
Building Square Feet
|
|
Office and shop space (owned and leased)
|
1,276
|
1,233,597
|
As of
December 31, 2016
, approximately
53%
of our office and shop space was attributable to our Construction segment,
8%
to our Large Project Construction segment and
4%
to our Construction Materials segment. The remainder is primarily attributable to administration.
18
In the ordinary course of business, we and our affiliates are involved in various legal proceedings alleging, among other things, liability issues or breach of contract or tortious conduct in connection with the performance of services and/or materials provided, the outcomes of which cannot be predicted with certainty. We and our affiliates are also subject to government inquiries in the ordinary course of business seeking information concerning our compliance with government construction contracting requirements and various laws and regulations, the outcomes of which cannot be predicted with certainty.
Some of the matters in which we or our joint ventures and affiliates are involved may involve compensatory, punitive, or other claims or sanctions that, if granted, could require us to pay damages or make other expenditures in amounts that are not probable to be incurred or cannot currently be reasonably estimated. In addition, in some circumstances our government contracts could be terminated, we could be suspended, debarred or incur other administrative penalties or sanctions, or payment of our costs could be disallowed. While any of our pending legal proceedings may be subject to early resolution as a result of our ongoing efforts to resolve the proceeding whether or when any legal proceeding will be resolved is neither predictable nor guaranteed.
Accordingly, it is possible that future developments in such proceedings and inquiries could require us to (i) adjust existing accruals, or (ii) record new accruals that we did not originally believe to be probable or that could not be reasonably estimated. Such changes could be material to our financial condition, results of operations and/or cash flows in any particular reporting period. In addition to matters that are considered probable for which the loss can be reasonably estimated, disclosure is also provided when it is reasonably possible and estimable that a loss will be incurred or when it is reasonably possible that the amount of a loss will exceed the amount recorded.
Liabilities relating to legal proceedings and government inquiries, to the extent that we have concluded such liabilities are probable and the amounts of such liabilities are reasonably estimable, are recorded in the consolidated balance sheets. The aggregate liabilities recorded as of
December 31, 2016
and
2015
related to these matters were approximately $
4.3 million
and $
5.2 million
, respectively, and were primarily included in accounts payable and accrued expenses and other current liabilities in our consolidated balance sheets. The aggregate range of possible loss related to (i) matters considered reasonably possible, and (ii) reasonably possible amounts in excess of accrued losses recorded for probable loss contingencies was immaterial, as of
December 31, 2016
. Our estimates of such matters could change in future periods.
The information concerning mine safety violations or other regulatory matters required by Section 1503(a) of the Dodd-Frank Wall Street Reform and Consumer Protection Act and Item 104 of Regulation S-K (17CFR 229.104) is included in Exhibit 95 to this Annual Report on Form 10-K.
19
Our common stock trades on the New York Stock Exchange under the ticker symbol GVA.
As of
February 15, 2017
, there were
39,624,986
shares of our common stock outstanding held by
767
shareholders of record.
We have paid quarterly cash dividends since the second quarter of 1990, and we expect to continue to do so. However, declaration and payment of dividends is within the sole discretion of our Board of Directors, subject to limitations imposed by Delaware law and compliance with our credit agreements (which allow us to pay dividends so long as we have at least $150 million in unencumbered cash and cash equivalents and marketable securities), and will depend on our earnings, capital requirements, financial condition and such other factors as the Board of Directors deems relevant. As of
December 31, 2016
, we had unencumbered cash, cash equivalents and marketable securities that exceeded the aforementioned limitations.
|
Market Price and Dividends of Common Stock
|
|
|
||||||||||
|
2016 Quarters Ended
|
December 31,
|
September 30,
|
June 30,
|
March 31,
|
||||||||
|
High
|
$
|
62.18
|
|
$
|
51.35
|
|
$
|
48.59
|
|
$
|
47.99
|
|
|
Low
|
42.59
|
|
44.35
|
|
40.16
|
|
35.69
|
|
||||
|
Dividends per share
|
0.13
|
|
0.13
|
|
0.13
|
|
0.13
|
|
||||
|
2015 Quarters Ended
|
December 31,
|
September 30,
|
June 30,
|
March 31,
|
||||||||
|
High
|
$
|
44.40
|
|
$
|
36.07
|
|
$
|
38.68
|
|
$
|
38.42
|
|
|
Low
|
28.45
|
|
28.94
|
|
33.85
|
|
31.54
|
|
||||
|
Dividends per share
|
0.13
|
|
0.13
|
|
0.13
|
|
0.13
|
|
||||
During the three months ended
December 31, 2016
, we did not sell any of our equity securities that were not registered under the Securities Act of 1933, as amended. The following table sets forth information regarding the repurchase of shares of our common stock during the three months ended
December 31, 2016
:
|
Period
|
Total Number of Shares Purchased
1
|
Average Price Paid per Share
|
Total Number of Shares Purchased as Part of Publicly Announced Plans or Programs
|
Approximate Dollar Value of Shares that May Yet be Purchased Under the Plans or Programs
2
|
|||||
|
October 1 through October 31, 2016
|
1,031
|
|
$
|
46.37
|
|
—
|
$
|
200,000,000
|
|
|
November 1 through November 30, 2016
|
704
|
|
$
|
59.60
|
|
—
|
$
|
200,000,000
|
|
|
December 1 through December 31, 2016
|
3,263
|
|
$
|
58.32
|
|
—
|
$
|
200,000,000
|
|
|
Total
|
4,998
|
|
$
|
56.04
|
|
—
|
|
||
1
The number of shares purchased is in connection with employee tax withholding for units vested under our 2012 Equity Incentive Plan.
2
On April 7, 2016, the Board of Directors authorized us to purchase up to $200.0 million of our common stock at management’s discretion, which replaced the former authorization including the amount available. We did not purchase shares under the share purchase plan in any of the periods presented. The specific timing and amount of any future purchases will vary based on market conditions, securities law limitations and other factors.
20
Performance Graph
The following graph compares the cumulative 5-year total return provided to shareholders on Granite Construction Incorporated’s common stock relative to the cumulative total returns of the S&P 500 index and the Dow Jones U.S. Heavy Construction index. The Dow Jones U.S. Heavy Construction index includes the following companies: AECOM, Chicago Bridge & Iron Co NV, EMCOR Group Inc., Fluor Corp., Jacobs Engineering Group Inc., KBR Inc., Quanta Services Inc., and
V
almont Industries Inc. Certain of these companies differ from Granite in that they derive revenue and profit from non-U.S. operations and have customers in different markets. The graph tracks the performance of a $100 investment in our common stock and in each index (with the reinvestment of all dividends) from
December 31, 2011
through
December 31, 2016
.
|
December 31,
|
2011
|
2012
|
2013
|
2014
|
2015
|
2016
|
||||||||||||
|
Granite Construction Incorporated
|
$
|
100.00
|
|
$
|
144.34
|
|
$
|
152.66
|
|
$
|
168.33
|
|
$
|
192.79
|
|
$
|
249.81
|
|
|
S&P 500
|
100.00
|
|
116.00
|
|
153.58
|
|
174.60
|
|
177.01
|
|
198.18
|
|
||||||
|
Dow Jones U.S. Heavy Construction
|
100.00
|
|
121.43
|
|
159.41
|
|
118.72
|
|
105.04
|
|
129.58
|
|
||||||
21
Other than contract backlog, the selected consolidated financial data set forth below have been derived from our consolidated financial statements. Refer to the consolidated financial statements for further information. These historical results are not necessarily indicative of the results of operations to be expected for any future period.
|
Selected Consolidated Financial Data
|
|||||||||||||||
|
Years Ended December 31,
|
2016
|
2015
|
2014
|
2013
|
2012
3
|
||||||||||
|
Operating Summary
|
(In Thousands, Except Per Share Data)
|
||||||||||||||
|
Revenue
|
$
|
2,514,617
|
|
$
|
2,371,029
|
|
$
|
2,275,270
|
|
$
|
2,266,901
|
|
$
|
2,083,037
|
|
|
Gross profit
1
|
301,370
|
|
299,836
|
|
239,741
|
|
177,177
|
|
225,895
|
|
|||||
|
As a percent of revenue
|
12.0
|
%
|
12.6
|
%
|
10.5
|
%
|
7.8
|
%
|
10.8
|
%
|
|||||
|
Selling, general and administrative expenses
1
|
219,299
|
|
203,817
|
|
193,256
|
|
191,860
|
|
176,235
|
|
|||||
|
As a percent of revenue
|
8.7
|
%
|
8.6
|
%
|
8.5
|
%
|
8.5
|
%
|
8.5
|
%
|
|||||
|
Restructuring and impairment (gains) charges, net
2
|
(1,925
|
)
|
(6,003
|
)
|
(2,643
|
)
|
52,139
|
|
(3,728
|
)
|
|||||
|
Net income (loss)
|
66,200
|
|
68,248
|
|
35,876
|
|
(44,766
|
)
|
59,920
|
|
|||||
|
Amount attributable to non-controlling interests
|
(9,078
|
)
|
(7,763
|
)
|
(10,530
|
)
|
8,343
|
|
(14,637
|
)
|
|||||
|
Net income (loss) attributable to Granite
|
57,122
|
|
60,485
|
|
25,346
|
|
(36,423
|
)
|
45,283
|
|
|||||
|
As a percent of revenue
|
2.3
|
%
|
2.6
|
%
|
1.1
|
%
|
(1.6
|
)%
|
2.2
|
%
|
|||||
|
Net income (loss) per share attributable to
common shareholders:
|
|
|
|
|
|
|
|
|
|
|
|||||
|
Basic
|
$
|
1.44
|
|
$
|
1.54
|
|
$
|
0.65
|
|
$
|
(0.94
|
)
|
$
|
1.17
|
|
|
Diluted
|
$
|
1.42
|
|
$
|
1.52
|
|
$
|
0.64
|
|
$
|
(0.94
|
)
|
$
|
1.15
|
|
|
Weighted average shares of common stock:
|
|
|
|
|
|
|
|
|
|
|
|||||
|
Basic
|
39,557
|
|
39,337
|
|
39,096
|
|
38,803
|
|
38,447
|
|
|||||
|
Diluted
|
40,225
|
|
39,868
|
|
39,795
|
|
38,803
|
|
39,076
|
|
|||||
|
Dividends per common share
|
$
|
0.52
|
|
$
|
0.52
|
|
$
|
0.52
|
|
$
|
0.52
|
|
$
|
0.52
|
|
|
|
|
|
|
|
|
|
|
|
|
|
|||||
|
Total assets
|
$
|
1,733,453
|
|
$
|
1,626,878
|
|
$
|
1,600,048
|
|
$
|
1,609,362
|
|
$
|
1,721,324
|
|
|
Cash, cash equivalents and marketable securities
|
317,105
|
|
358,531
|
|
358,028
|
|
346,323
|
|
433,420
|
|
|||||
|
Working capital
|
559,058
|
|
519,177
|
|
454,121
|
|
396,759
|
|
454,098
|
|
|||||
|
Current maturities of long-term debt
|
14,796
|
|
14,800
|
|
1,247
|
|
1,247
|
|
19,060
|
|
|||||
|
Long-term debt
|
229,498
|
|
244,323
|
|
275,621
|
|
276,868
|
|
271,070
|
|
|||||
|
Other long-term liabilities
|
51,430
|
|
46,613
|
|
44,495
|
|
48,580
|
|
47,124
|
|
|||||
|
Granite shareholders’ equity
|
885,988
|
|
839,237
|
|
794,385
|
|
781,940
|
|
829,953
|
|
|||||
|
Book value per share
|
22.36
|
|
21.29
|
|
20.27
|
|
20.09
|
|
21.43
|
|
|||||
|
Common shares outstanding
|
39,621
|
|
39,413
|
|
39,186
|
|
38,918
|
|
38,731
|
|
|||||
|
Contract backlog
|
$
|
3,484,405
|
|
$
|
2,908,438
|
|
$
|
2,718,873
|
|
$
|
2,526,751
|
|
$
|
1,708,761
|
|
1
Gross profit and selling, general and administrative expenses for the years ended December 31, 2015 and 2014 are approximately $3.5 million and $2.5 million, respectively, lower than the amounts previously reported in the 2015 Annual Report on Form 10-K due to reclassifications related to restricted stock amortization. See “Gross Profit” and “Selling, General and Administrative Expenses” under “Item 7. Management’s Discussion and Analysis of Financial Condition and Results of Operations” for additional information.
2
During the years ended December 31, 2016, 2015, 2014 and 2012 we recorded restructuring gains of
$1.9 million
,
$6.0 million
, $1.3 million and $3.7 million, respectively, related to our 2010 Enterprise Improvement Plan (“EIP”). In addition, during 2014, we recorded $1.3 million in impairment gains related to nonperforming quarry sites and during 2013, we recorded net restructuring charges of $49.0 million, including amounts attributable to non-controlling interests of $3.9 million, related to our EIP and $3.2 million in other impairment charges related to nonperforming quarry sites.
3
The acquisition of Kenny Construction Company (“Kenny”) was effective as of December 31, 2012; therefore, amounts related to Kenny are included in the consolidated statements of income commencing in the year ended December 31, 2013.
22
General
We are one of the largest diversified heavy civil contractors and construction materials producers in the United States, engaged in the construction and improvement of streets, roads, highways, mass transit facilities, airport infrastructure, bridges, trenchless and underground utilities, power-related facilities, water-related facilities, utilities, tunnels, dams and other infrastructure-related projects. We own aggregate reserves and plant facilities to produce construction materials for use in our construction business and for sale to third parties. Our permanent offices are located in Alaska, Arizona, California, Florida, Illinois, Nevada, New York, Texas, Utah and Washington. We have three reportable business segments: Construction, Large Project Construction and Construction Materials (see Note 18 of “Notes to the Consolidated Financial Statements”).
In addition to business segments, we review our business by operating groups and by public and private market sectors. Our operating groups are defined as follows: (i) California; (ii) Northwest, which primarily includes offices in Alaska, Arizona, Nevada, Utah and Washington; (iii) Heavy Civil, which primarily includes offices in California, Florida, New York and Texas; and (iv) Kenny, which primarily includes an office in Illinois. Each of these operating groups may include financial results from our Construction and Large Project Construction segments. A project’s results are reported in the operating group that is responsible for the project, not necessarily the geographic area where the work is located. In some cases, the operations of an operating group include the results of work performed outside of that geographic region. Our California and Northwest operating groups include financial results from our Construction Materials segment.
The four primary economic drivers of our business are (i) the overall health of the U.S. economy; (ii) federal, state and local public funding levels; (iii) population growth resulting in public and private development; and (iv) the need to replace or repair aging infrastructure. A stagnant or declining economy will generally result in reduced demand for construction and construction materials in the private sector. This reduced demand increases competition for private sector projects and will ultimately also increase competition in the public sector as companies migrate from bidding on scarce private sector work to projects in the public sector. In addition, a stagnant or declining economy tends to produce less tax revenue for public agencies, thereby decreasing a source of funds available for spending on public infrastructure improvements. Some funding sources that have been specifically earmarked for infrastructure spending, such as diesel and gasoline taxes, are not as directly affected by a stagnant or declining economy, unless actual consumption is reduced or gasoline sales tax revenues decline consistent with fuel prices. However, even these can be temporarily at risk as federal, state and local governments take actions to balance their budgets. Additionally, fuel prices and more fuel efficient vehicles can have a dampening effect on consumption, resulting in overall lower tax revenue. Conversely, increased levels of public funding as well as an expanding or robust economy will generally increase demand for our services and provide opportunities for revenue growth and margin improvement.
23
Critical Accounting Policies and Estimates
The financial statements included in “Item 8. Financial Statements and Supplementary Data” have been prepared in accordance with accounting principles generally accepted in the United States of America. The preparation of these financial statements requires management to make estimates that affect the reported amounts of assets and liabilities, revenue and expenses, and related disclosure of contingent assets and liabilities. Our estimates and related judgments and assumptions are continually evaluated based on available information and experiences; however, actual amounts could differ from those estimates.
The following are accounting policies and estimates that involve significant management judgment and can have significant effects on the Company’s reported results of operations. The Audit/Compliance Committee of our Board of Directors has reviewed our disclosure of critical accounting policies and estimates.
Revenue and Earnings Recognition for Construction Contracts
Revenue and earnings on construction contracts, including construction joint ventures, are recognized under the percentage of completion method using the ratio of costs incurred to estimated total costs.
Revenue from unapproved change orders is recognized to the extent the related costs have been incurred, the amount can be reliably estimated and recovery is probable.
Unresolved contract modifications and affirmative claims (“affirmative claims”) to recover additional costs to which the Company believes it is entitled under the terms of contracts with customers, subcontractors, vendors or others are pending or have been submitted on certain projects. The owners or their authorized representatives and/or other third parties may be in partial or full agreement with the modifications or affirmative claims, or may have rejected or disagree entirely or partially as to such entitlement.
Revenue related to affirmative claims with customers is recognized to the extent of costs incurred when it is probable that a claim settlement with a customer will result in additional revenue and the amount can be reasonably estimated. A reduction to costs related to affirmative claims with non-customers with whom we have a contractual arrangement (“back charges”) is recognized when the estimated recovery is probable and the amount can be reasonably estimated. Except for contractual back charges, a reduction to cost related to affirmative claims against non-customers is recognized when the claims are settled. Recognizing affirmative claims and back charge recoveries requires significant judgments of certain factors including, but not limited to, dispute resolution developments and outcomes, anticipated negotiation results, and the cost of resolving such matters and estimates.
Provisions are recognized in the consolidated statements of operations for the full amount of estimated losses on uncompleted contracts whenever evidence indicates that the estimated total cost of a contract exceeds its estimated total revenue. All contract costs, including those associated with affirmative claims, change orders and back charges, are recorded as incurred and revisions to estimated total costs are reflected as soon as the obligation to perform is determined. Contract costs consist of direct costs on contracts, including labor and materials, amounts payable to subcontractors, direct overhead costs and equipment expense (primarily depreciation, fuel, maintenance and repairs). All state and federal government contracts and many of our other contracts provide for termination of the contract at the convenience of the party contracting with us, with provisions to pay us for work performed through the date of termination. Pre-contract costs are expensed as incurred.
The accuracy of our revenue and profit recognition in a given period depends on the accuracy of our estimates of the cost to complete each project. Cost estimates for all of our significant projects use a detailed “bottom up” approach and we believe our experience allows us to create materially reliable estimates. There are a number of factors that can contribute to changes in estimates of contract cost and profitability. The most significant of these include:
|
•
|
the completeness and accuracy of the original bid;
|
|
•
|
costs associated with scope changes;
|
|
•
|
costs of labor and/or materials;
|
|
•
|
extended overhead and other costs due to owner, weather and other delays;
|
|
•
|
subcontractor performance issues;
|
|
•
|
changes in productivity expectations;
|
|
•
|
site conditions that differ from those assumed in the original bid (to the extent contract remedies are unavailable);
|
|
•
|
changes from original design on design-build projects;
|
|
•
|
the availability and skill level of workers in the geographic location of the project;
|
|
•
|
a change in the availability and proximity of equipment and materials;
|
|
•
|
our ability to fully and promptly recover on affirmative claims and back charges for additional contract costs; and
|
|
•
|
the customer’s ability to properly administer the contract.
|
The foregoing factors, as well as the stage of completion of contracts in process and the mix of contracts at different margins may cause fluctuations in gross profit between periods. Significant changes in cost estimates, particularly in our larger, more complex projects, have had, and can in future periods have, a significant effect on our profitability.
24
Goodwill
As of
December 31, 2016
and 2015, we had five reporting units in which goodwill was recorded as follows:
|
•
|
Kenny Group Construction
|
|
•
|
Kenny Group Large Project Construction
|
|
•
|
Northwest Group Construction
|
|
•
|
Northwest Group Construction Materials
|
|
•
|
California Construction
|
The most significant goodwill balances reside in the reporting units associated with the Kenny Group. See Note 9 of “Notes to the Consolidated Financial Statements” for balances by reportable segment.
We perform impairment tests annually as of November 1 and more frequently when events and circumstances occur that indicate a possible impairment of goodwill. In addition, we evaluate goodwill for impairment if events or circumstances change between annual tests indicating a possible impairment. Examples of such events or circumstances include the following:
|
•
|
a significant adverse change in legal factors or in the business climate;
|
|
•
|
an adverse action or assessment by a regulator;
|
|
•
|
a more likely than not expectation that a segment or a significant portion thereof will be sold; or
|
|
•
|
the testing for recoverability of a significant asset group within the segment.
|
In performing step one of the goodwill impairment tests, we calculate the estimated fair value of the reporting unit in which the goodwill is recorded using the discounted cash flows and market multiple methods. Judgments inherent in these methods include the determination of appropriate discount rates, the amount and timing of expected future cash flows and growth rates, and appropriate benchmark companies. The cash flows used in our 2016 discounted cash flow model were based on five-year financial forecasts, which in turn were based on the 2017-2019 operating plan developed internally by management adjusted for market participant-based assumptions. Our discount rate assumptions are based on an assessment of the equity cost of capital and appropriate capital structure for our reporting units. In assessing the reasonableness of our determined fair values of our reporting units, we evaluate the reasonableness of our results against our current market capitalization.
The estimated fair value is compared to the net book value of the reporting unit, including goodwill. If the net book value of a reporting unit exceeds its fair value, we measure and record the amount of the impairment loss by comparing the implied fair value of the reporting unit’s goodwill with the carrying amount of that goodwill.
The results of our annual goodwill impairment tests, performed in accordance with ASC Topic 350,
Intangibles - Goodwill and Other,
indicated that the estimated fair values of our reporting units exceeded their net book values (i.e., cushion) by at least 50% for the reporting units with goodwill. Out of the five reporting units with goodwill, the Kenny Large Project Construction business is the most susceptible to fluctuations in results depending on awarded work given the large size and limited frequency of awards. While we believe the current cushion for the reporting unit is adequate to absorb these fluctuations, a material decline in job win rates could have a material impact to this reporting unit’s estimated fair value.
25
Long-lived Assets
We review property and equipment and amortizable intangible assets for impairment at an asset group level whenever events or changes in circumstances indicate the net book value of an asset group may not be recoverable. Recoverability of these asset groups is measured by comparing their net book values to the future undiscounted cash flows the asset groups are expected to generate. If the asset groups are considered to be impaired, an impairment charge will be recognized equal to the amount by which the net book value of the asset group exceeds fair value. We group construction and plant equipment assets at a regional level, which represents the lowest level for which identifiable cash flows are largely independent of the cash flows of other groups of assets. When an individual asset or group of assets is determined to no longer contribute to the vertically integrated asset group, it is assessed for impairment independently.
Insurance Estimates
We carry insurance policies to cover various risks, primarily general liability, automobile liability, workers compensation and employee medical expenses under which we are liable to reimburse the insurance company for a portion of each claim paid. Payment for general liability and workers compensation claim amounts generally range from the first $0.5 million to $1.0 million per occurrence. We accrue for probable losses, both reported and unreported, that are reasonably estimable using actuarial methods based on historic trends, modified, if necessary, by recent events. Changes in our loss assumptions caused by changes in actual experience would affect our assessment of the ultimate liability and could have an effect on our operating results and financial position up to $1.0 million per occurrence for general liability and workers compensation or $0.3 million for medical insurance.
Asset Retirement and Reclamation Obligations
We account for the costs related to legal obligations to reclaim aggregate mining sites and other facilities by recording our estimated reclamation liability at fair value, capitalizing the estimated liability as part of the related asset’s carrying amount and allocating it to expense over the asset’s useful life. To determine the fair value of the obligation, we estimate the cost for a third-party to perform the legally required reclamation including a reasonable profit margin. This cost is then increased for future estimated inflation based on the estimated years to complete and discounted to fair value using present value techniques with a credit-adjusted, risk-free rate. In estimating the settlement date, we evaluate the current facts and conditions to determine the most likely settlement date.
We review reclamation obligations at least annually for a revision to the cost or a change in the estimated settlement date. Additionally, reclamation obligations are reviewed in the period that a triggering event occurs that would result in either a revision to the cost or a change in the estimated settlement date.
Contingencies
We are currently involved in various claims and legal proceedings. Loss contingency provisions are recorded if the potential loss from any asserted or unasserted claim or legal proceeding is considered probable and the amount can be reasonably estimated. If a potential loss is considered probable but only a range of loss can be determined, the low-end of the range is recorded. These accruals represent management’s best estimate of probable loss. Disclosure is also provided when it is reasonably possible and estimable that a loss will be incurred or when it is reasonably possible that the amount of a loss will exceed the amount recorded. Significant judgment is required in both the determination of probability of loss and the determination as to whether an exposure is reasonably estimable. Because of uncertainties related to these matters, accruals are based only on the best information available at the time. As additional information becomes available, we reassess the potential liability related to claims and litigation and may revise our estimates. See Note 17 of “Notes to the Consolidated Financial Statements” and “Item 3. Legal Proceedings” for additional information.
26
Current Economic Environment and Outlook
We finished the 2016 fiscal year with backlog of
$3.5 billion
, a year-end record. Overall demand remains steady in an environment of modest economic growth. Public and private markets remain highly competitive, with private market activity across geographies and end markets driving growth opportunities the past few years. We continue to anticipate notable near- and long-term growth opportunities for our Construction and Construction Materials segments, driven by a balance of private non-residential demand and an expected demand increase linked to public infrastructure spending trends in 2017 and beyond.
The federal budget remains funded by continuing resolution. As a result, incremental public spending has not started from the Fixing America’s Surface Transportation (“FAST”) Act, passed in December 2015. The five-year bill stabilized planning for state departments of transportation, but it is not yet a growth catalyst. Public investment continues to lag, though state and local infrastructure funding commitments across the country have gathered significant positive momentum over the past year. Voters across the country last November approved more than $200 billion of long-term infrastructure investment in the form of local measures, with the majority of this in California and Washington State. In California, state officials continue to make progress toward legislation on a long-term transportation bill, which could deliver much overdue investment beginning in late-2017.
The market for our Large Project Construction segment is expansive and highly competitive. The risk-return balance for many of our country’s large- and mega-sized infrastructure projects swung strongly in the favor of owners and concessionaires over the past three to five years. In prioritizing future North American work, our focus emphasizes managing and matching risk to appropriate returns in all of our bidding opportunities.
Results of Operations
|
Comparative Financial Summary
|
||||||||||||
|
Years Ended December 31,
|
2016
|
2015
|
2014
|
|||||||||
|
(in thousands)
|
||||||||||||
|
Total revenue
|
$
|
2,514,617
|
|
$
|
2,371,029
|
|
$
|
2,275,270
|
|
|||
|
Gross profit
|
301,370
|
|
299,836
|
|
239,741
|
|
||||||
|
Selling, general and administrative expenses
|
219,299
|
|
203,817
|
|
193,256
|
|
||||||
|
Operating income
|
92,354
|
|
110,308
|
|
65,100
|
|
||||||
|
Total other (income) expense
|
(4,008
|
)
|
6,881
|
|
9,503
|
|
||||||
|
Amount attributable to non-controlling interests
|
(9,078
|
)
|
(7,763
|
)
|
(10,530
|
)
|
||||||
|
Net income attributable to Granite Construction Incorporated
|
57,122
|
|
60,485
|
|
25,346
|
|
||||||
Revenue
|
Total Revenue by Segment
|
|||||||||||||||||||
|
Years Ended December 31,
|
2016
|
2015
|
2014
|
||||||||||||||||
|
(dollars in thousands)
|
|||||||||||||||||||
|
Construction
|
$
|
1,365,198
|
|
54.3
|
%
|
$
|
1,262,675
|
|
53.2
|
%
|
$
|
1,186,445
|
|
52.1
|
%
|
||||
|
Large Project Construction
|
888,193
|
|
35.3
|
|
812,720
|
|
34.3
|
|
825,044
|
|
36.3
|
|
|||||||
|
Construction Materials
|
261,226
|
|
10.4
|
|
295,634
|
|
12.5
|
|
263,781
|
|
11.6
|
|
|||||||
|
Total
|
$
|
2,514,617
|
|
100.0
|
%
|
$
|
2,371,029
|
|
100.0
|
%
|
$
|
2,275,270
|
|
100.0
|
%
|
||||
27
|
Construction Revenue
|
|||||||||||||||||||
|
Years Ended December 31,
|
2016
|
2015
|
2014
|
||||||||||||||||
|
(dollars in thousands)
|
|||||||||||||||||||
|
California:
|
|
|
|
|
|
|
|||||||||||||
|
Public sector
|
$
|
370,397
|
|
27.1
|
%
|
$
|
403,904
|
|
32.0
|
%
|
$
|
388,049
|
|
32.7
|
%
|
||||
|
Private sector
|
191,000
|
|
14.0
|
|
127,338
|
|
10.1
|
|
103,791
|
|
8.7
|
|
|||||||
|
Northwest:
|
|
|
|
||||||||||||||||
|
Public sector
|
462,529
|
|
34.0
|
|
415,787
|
|
32.9
|
|
396,919
|
|
33.5
|
|
|||||||
|
Private sector
|
93,830
|
|
6.9
|
|
109,682
|
|
8.7
|
|
133,271
|
|
11.2
|
|
|||||||
|
Heavy Civil:
|
|
|
|||||||||||||||||
|
Public sector
|
23,829
|
|
1.7
|
|
29,505
|
|
2.3
|
|
19,642
|
|
1.7
|
|
|||||||
|
Private sector
|
651
|
|
—
|
|
—
|
|
—
|
|
—
|
|
—
|
|
|||||||
|
Kenny:
|
|||||||||||||||||||
|
Public sector
|
166,454
|
|
12.2
|
|
98,526
|
|
7.8
|
|
93,291
|
|
7.9
|
|
|||||||
|
Private sector
|
56,508
|
|
4.1
|
|
77,933
|
|
6.2
|
|
51,482
|
|
4.3
|
|
|||||||
|
Total
|
$
|
1,365,198
|
|
100.0
|
%
|
$
|
1,262,675
|
|
100.0
|
%
|
$
|
1,186,445
|
|
100.0
|
%
|
||||
Construction revenue for the year ended
December 31, 2016
increased by
$102.5 million
, or
8.1%
, compared to the year ended December 31,
2015
primarily due to increased volumes from entering the year with greater contract backlog in the Northwest and Kenny public sectors, as well as from an improved success rate on bidding activity for solar work in the California private sector. The increases were partially offset by declines in the Northwest and Kenny private sectors as well as a decline in the California public sector from the completion of projects in 2016 coupled with lower beginning contract backlog and a decline in the volume of awarded work during 2016.
|
Large Project Construction Revenue
|
|||||||||||||||||||||
|
Years Ended December 31,
|
2016
|
2015
|
2014
|
||||||||||||||||||
|
(dollars in thousands)
|
|||||||||||||||||||||
|
California
1
|
$
|
42,770
|
|
4.8
|
%
|
$
|
23,461
|
|
2.9
|
%
|
$
|
57,229
|
|
6.9
|
%
|
||||||
|
Northwest
1
|
33,909
|
|
3.8
|
|
45,843
|
|
5.6
|
|
13,883
|
|
1.7
|
|
|||||||||
|
Heavy Civil
1
|
691,151
|
|
77.8
|
|
615,070
|
|
75.7
|
|
633,063
|
|
76.7
|
|
|||||||||
|
Kenny:
|
|
||||||||||||||||||||
|
Public sector
|
95,893
|
|
10.8
|
|
86,291
|
|
10.6
|
|
103,828
|
|
12.6
|
|
|||||||||
|
Private sector
|
24,470
|
|
2.8
|
|
42,055
|
|
5.2
|
|
17,041
|
|
2.1
|
|
|||||||||
|
Total
|
$
|
888,193
|
|
100.0
|
%
|
$
|
812,720
|
|
100.0
|
%
|
$
|
825,044
|
|
100.0
|
%
|
||||||
1
For the periods presented, this Large Project Construction revenue was earned from the public sector.
Large Project Construction revenue for the year ended
December 31, 2016
increased by
$75.5 million
, or
9.3%
, compared to the year ended December 31,
2015
, primarily due to progress on new projects in the California operating group, Heavy Civil operating group and Kenny public sector. These increases were partially offset by decreases in the Northwest operating group and Kenny private sector from completion of projects in late 2015 and early 2016 coupled with lower beginning contract backlog in the Kenny private sector.
|
Construction Materials Revenue
|
|||||||||||||||||||||
|
Years Ended December 31,
|
2016
|
2015
|
2014
|
||||||||||||||||||
|
(dollars in thousands)
|
|||||||||||||||||||||
|
California
|
$
|
148,778
|
|
57.0
|
%
|
$
|
191,605
|
|
64.8
|
%
|
$
|
152,959
|
|
58.0
|
%
|
||||||
|
Northwest
|
112,448
|
|
43.0
|
|
104,029
|
|
35.2
|
|
110,822
|
|
42.0
|
|
|||||||||
|
Total
|
$
|
261,226
|
|
100.0
|
%
|
$
|
295,634
|
|
100.0
|
%
|
$
|
263,781
|
|
100.0
|
%
|
||||||
Construction Materials revenue for the year ended
December 31, 2016
decreased
$34.4 million
, or
11.6%
, when compared to the year ended December 31,
2015
primarily due to a net decline in sales volume across most of our markets in California with demand shifting to increased internal (Construction segment) use in 2016.
28
Contract Backlog
Our contract backlog consists of the unearned revenue on awarded contracts, including 100% of our consolidated joint venture contracts and our proportionate share of unconsolidated joint venture contracts. We generally include a project in our contract backlog at the time it is awarded and to the extent we believe funding is probable. Certain government contracts where funding is appropriated on a periodic basis are included in contract backlog at the time of the award when it is probable the contract value will be funded and executed. Awarded contracts that include unexercised contract options and unissued task orders are included in contract backlog to the extent options are exercised or task order issuance is probable as further described in “Contract Backlog” under “Item 1. Business.” Substantially all of the contracts in our contract backlog may be canceled or modified at the election of the customer; however, we have not been materially adversely affected by contract cancellations or modifications in the past.
The following tables illustrate our contract backlog as of the respective dates:
|
Total Contract Backlog by Segment
|
|
|||||||||||||
|
December 31,
|
2016
|
2015
|
||||||||||||
|
(dollars in thousands)
|
||||||||||||||
|
Construction
|
$
|
1,030,487
|
|
29.6
|
%
|
$
|
860,657
|
|
29.6
|
%
|
||||
|
Large Project Construction
|
2,453,918
|
|
70.4
|
|
2,047,781
|
|
70.4
|
|
||||||
|
Total
|
$
|
3,484,405
|
|
100.0
|
%
|
$
|
2,908,438
|
|
100.0
|
%
|
||||
|
Construction Contract Backlog
|
|
|
||||||||||||
|
December 31,
|
2016
|
2015
|
||||||||||||
|
(dollars in thousands)
|
||||||||||||||
|
California:
|
|
|
|
|
||||||||||
|
Public sector
|
$
|
227,379
|
|
22.1
|
%
|
$
|
233,691
|
|
27.1
|
%
|
||||
|
Private sector
|
73,958
|
|
7.2
|
|
52,313
|
|
6.1
|
|
||||||
|
Northwest:
|
|
|
|
|
|
|||||||||
|
Public sector
|
311,382
|
|
30.2
|
|
285,331
|
|
33.2
|
|
||||||
|
Private sector
|
27,582
|
|
2.7
|
|
12,922
|
|
1.5
|
|
||||||
|
Heavy Civil:
|
|
|
|
|||||||||||
|
Public sector
|
92,214
|
|
8.9
|
|
81,931
|
|
9.5
|
|
||||||
|
Private sector
|
4,195
|
|
0.4
|
|
—
|
|
—
|
|
||||||
|
Kenny:
|
|
|||||||||||||
|
Public sector
|
235,298
|
|
22.8
|
|
143,386
|
|
16.7
|
|
||||||
|
Private sector
|
58,479
|
|
5.7
|
|
51,083
|
|
5.9
|
|
||||||
|
Total
|
$
|
1,030,487
|
|
100.0
|
%
|
$
|
860,657
|
|
100.0
|
%
|
||||
Construction contract backlog of
$1.0 billion
at
December 31, 2016
was
$169.8 million
, or
19.7%
, higher than at
December 31, 2015
. The increase was primarily due to an improved success rate of bidding activity in the Northwest, Heavy Civil and Kenny operating groups and in the private sector of the California operating group, partially offset by progress on existing projects in the public sector of the California operating group. Significant new awards during the fourth quarter of 2016 in the Northwest, Heavy Civil and Kenny operating groups included a $30.1 million project in Arizona, a $24.9 million project in Utah and a $23.3 million power project in New York.
29
|
Large Project Construction Contract Backlog
|
|
|
||||||||||||
|
December 31,
|
2016
|
2015
|
||||||||||||
|
(dollars in thousands)
|
||||||||||||||
|
Heavy Civil
1
|
$
|
1,746,915
|
|
71.3
|
%
|
$
|
1,623,832
|
|
79.3
|
%
|
||||
|
California
1
|
86,703
|
|
3.5
|
|
24,132
|
|
1.2
|
|
||||||
|
Northwest
1
|
91,894
|
|
3.7
|
|
66,920
|
|
3.3
|
|
||||||
|
Kenny:
|
|
|||||||||||||
|
Public sector
2
|
428,159
|
|
17.4
|
|
264,559
|
|
12.9
|
|
||||||
|
Private sector
|
100,247
|
|
4.1
|
|
68,338
|
|
3.3
|
|
||||||
|
Total
|
$
|
2,453,918
|
|
100.0
|
%
|
$
|
2,047,781
|
|
100.0
|
%
|
||||
1
For the periods presented, all Large Project Construction contract backlog is related to contracts with public agencies.
2
As of
December 31, 2016
and
2015
, $2.1 million and $13.8 million, respectively, of Kenny public sector contract backlog was translated from Canadian dollars to U.S. dollars at the spot rate in effect at the reporting date.
Large Project Construction contract backlog of
$2.5 billion
at
December 31, 2016
was
$406.1 million
, or
19.8%
, higher than
December 31, 2015
primarily due to new awards in all operating groups, including our $291.6 million share of a rail project in Hawaii, our $284.1 million share of the Loop 202 South Mountain Freeway Project in Arizona, a $279.4 million tunnel project in Connecticut, a $208.6 million highway project in Alabama and a $125.0 million highway project in California.
Non-controlling partners’ share of Large Project Construction contract backlog as of
December 31, 2016
and
2015
was
$141.5 million
and
$75.5 million
, respectively.
Gross Profit
The following table presents gross profit by business segment for the respective periods:
|
Years Ended December 31,
|
2016
|
2015
|
2014
|
|||||||||
|
(dollars in thousands)
|
||||||||||||
|
Construction
|
$
|
209,215
|
|
$
|
187,506
|
|
$
|
113,953
|
|
|||
|
Percent of segment revenue
|
15.3
|
%
|
14.8
|
%
|
9.6
|
%
|
||||||
|
Large Project Construction
|
64,137
|
|
79,467
|
|
107,097
|
|
||||||
|
Percent of segment revenue
|
7.2
|
|
9.8
|
|
13.0
|
|
||||||
|
Construction Materials
|
28,018
|
|
32,863
|
|
18,691
|
|
||||||
|
Percent of segment revenue
|
10.7
|
|
11.1
|
|
7.1
|
|
||||||
|
Total gross profit
1
|
$
|
301,370
|
|
$
|
299,836
|
|
$
|
239,741
|
|
|||
|
Percent of total revenue
|
12.0
|
%
|
12.6
|
%
|
10.5
|
%
|
||||||
1
Total gross profit for 2015 and 2014 is approximately $3.5 million and $2.5 million, respectively, lower than the amounts previously reported in the 2015 Annual Report on Form 10-K due to reclassifications of restricted stock amortization from general and administration expenses to cost of revenue to align it with the associated salaries.
Construction gross profit in
2016
increased
$21.7 million
, or
11.6%
, compared to
2015
. Construction gross margin as a percentage of segment revenue for
2016
increased to
15.3%
from
14.8%
in
2015
. The increases were primarily due to increased revenue volume from an increase in beginning backlog and margin improvement from increased private sector projects, increased margin on contract backlog at the beginning of 2016 compared to 2015 and reduced net revisions in estimates (see Note 2 of “Notes to the Consolidated Financial Statements” for more information on the reduced project write-downs).
Large Project Construction gross profit in
2016
decreased
$15.3 million
, or
19.3%
, compared to
2015
. Large Project Construction gross margin as a percentage of segment revenue for
2016
decreased to
7.2%
from
9.8%
in
2015
. The decreases were primarily due to net changes from revisions in estimates (see Note 2 of “Notes to the Consolidated Financial Statements”), including an increase to estimated costs to complete from outstanding affirmative claims, change orders and back charges.
Construction Materials gross profit in
2016
decreased
$4.8 million
, or
14.7%
, compared to
2015
. Construction Materials gross margin as a percentage of segment revenue for
2016
decreased to
10.7%
from
11.1%
in
2015
. The decreases were primarily due to declines in external sales volumes and sales prices partially offset by a decrease in variable costs from improved efficiency at certain asphalt plants.
30
Selling, General and Administrative Expenses
The following table presents the components of selling, general and administrative expenses for the respective periods:
|
Years Ended December 31,
|
2016
|
2015
|
2014
|
|||||||||
|
(dollars in thousands)
|
||||||||||||
|
Selling
|
|
|
|
|
|
|
||||||
|
Salaries and related expenses
|
$
|
46,015
|
|
$
|
43,193
|
|
$
|
42,334
|
|
|||
|
Incentive compensation
|
2,650
|
|
3,370
|
|
1,457
|
|
||||||
|
Restricted stock amortization
|
1,809
|
|
1,257
|
|
1,522
|
|
||||||
|
Other selling expenses
|
10,122
|
|
7,940
|
|
10,290
|
|
||||||
|
Total selling
|
60,596
|
|
55,760
|
|
55,603
|
|
||||||
|
General and administrative
|
|
|
|
|
|
|
||||||
|
Salaries and related expenses
|
71,032
|
|
67,939
|
|
61,022
|
|
||||||
|
Incentive compensation
|
9,345
|
|
8,653
|
|
976
|
|
||||||
|
Restricted stock amortization
|
9,670
|
|
4,611
|
|
8,247
|
|
||||||
|
Other general and administrative expenses
|
68,656
|
|
66,854
|
|
67,408
|
|
||||||
|
Total general and administrative
|
158,703
|
|
148,057
|
|
137,653
|
|
||||||
|
Total selling, general and administrative
1
|
$
|
219,299
|
|
$
|
203,817
|
|
$
|
193,256
|
|
|||
|
Percent of revenue
|
8.7
|
%
|
8.6
|
%
|
8.5
|
%
|
||||||
1
Selling, general and administrative expenses for 2015 and 2014 are approximately $3.5 million and $2.5 million, respectively, lower than the amounts previously reported in the 2015 Annual Report on Form 10-K due to reclassifications of restricted stock amortization from general and administration expenses to cost of revenue to align it with the associated salaries.
Selling, General and Administrative Expenses
Selling, general and administrative expenses include variable cash and restricted stock unit (“RSU”) performance-based incentives for select management personnel on which our compensation strategy heavily relies. The cash portion of these incentives is expensed when earned while the RSU portion is expensed as earned over the vesting period of the RSU award (generally three years; however, immediate vesting may apply to certain awards pursuant to the 2012 Equity Incentive Plan).
Selling Expenses
Selling expenses include the costs for estimating and bidding, business development and materials facility permits. Selling expenses can vary depending on the volume of projects in process and the number of employees assigned to estimating and bidding activities. As projects are completed or the volume of work slows down, we temporarily redeploy project employees to bid on new projects, moving their salaries and related costs from cost of revenue to selling expenses. Selling expenses for
2016
increased
$4.8 million
, or
8.7%
, compared to
2015
. The increases were primarily due to increases in salaries and related expenses and pre-bid costs, both from increased bidding activity.
General and Administrative Expenses
General and administrative expenses include costs related to our operational offices that are not allocated to direct contract costs and expenses related to our corporate functions. Other general and administrative expenses include travel and entertainment, outside services, information technology, depreciation, occupancy, training, office supplies, changes in the fair market value of our Non-Qualified Deferred Compensation plan liability and other miscellaneous expenses, none of which individually exceeded 10% of total general and administrative expenses. Total general and administrative expenses for
2016
increased
$10.6 million
, or
7.2%
, compared to
2015
, primarily due to an increase in restricted stock unit amortization from awards issued in the first quarter of 2016, a portion of which immediately vested. In addition, the increase in other general and administrative expense was due to a change in the fair market value of our Non-Qualified Deferred Compensation plan liability, which is offset in other (income) expense.
31
Other (Income) Expense
The following table presents the components of other (income) expense for the respective periods:
|
Years Ended December 31,
|
2016
|
2015
|
2014
|
|||||||||
|
(in thousands)
|
||||||||||||
|
Interest income
|
$
|
(3,225
|
)
|
$
|
(2,135
|
)
|
$
|
(1,872
|
)
|
|||
|
Interest expense
|
12,366
|
|
14,257
|
|
14,159
|
|
||||||
|
Equity in income of affiliates
|
(7,177
|
)
|
(3,210
|
)
|
(901
|
)
|
||||||
|
Other income, net
|
(5,972
|
)
|
(2,031
|
)
|
(1,883
|
)
|
||||||
|
Total other (income) expense
|
$
|
(4,008
|
)
|
$
|
6,881
|
|
$
|
9,503
|
|
|||
Interest expense for
2016
decreased
$1.9 million
when compared to
2015
primarily due to a reduction of the principal balance of our 2019 Notes (as defined in the Senior Notes Payable section below) from payments made in late 2015, partially offset by an increase in the effective interest rate. Equity in income of affiliates for
2016
increased
$4.0 million
when compared to
2015
primarily due to income in the normal course of business associated with an unconsolidated real estate affiliate and with our asphalt terminal business in Nevada. Other income, net for
2016
increased
$3.9 million
primarily due to a gain associated with a consolidated real estate entity as well as from changes in the fair market values of our Non-Qualified Deferred Compensation plan assets and our interest rate swap during 2016.
Income Taxes
The following table presents the provision for income taxes for the respective periods:
|
Years Ended December 31,
|
2016
|
|
2015
|
|
2014
|
|||||||
|
(dollars in thousands)
|
||||||||||||
|
Provision for income taxes
|
$
|
30,162
|
|
$
|
35,179
|
|
$
|
19,721
|
|
|||
|
Effective tax rate
|
31.3
|
%
|
34.0
|
%
|
35.5
|
%
|
||||||
Our 2016 tax rate decreased by 2.7% from
34.0%
to
31.3%
when compared to 2015 primarily due to an increase in non-controlling interests and an increase in the domestic production activities deduction.
Amount Attributable to Non-controlling Interests
The following table presents the amount attributable to non-controlling interests in consolidated subsidiaries for the respective periods:
|
Years Ended December 31,
|
2016
|
2015
|
2014
|
|||||||||
|
(in thousands)
|
||||||||||||
|
Amount attributable to non-controlling interests
|
$
|
(9,078
|
)
|
$
|
(7,763
|
)
|
$
|
(10,530
|
)
|
|||
The amount attributable to non-controlling interests represents the non-controlling owners’ share of the income or loss of our consolidated construction joint ventures and a real estate entity. The increase for 2016 when compared to 2015 was primarily due to a change in the estimated recovery from back charge claims in 2016 and income from consolidated construction joint ventures awarded in the third quarter of 2015.
32
Prior Years
Revenue
:
Construction revenue for the year ended December 31, 2015 increased by
$76.2 million
, or
6.4%
, compared to the year ended December 31, 2014 primarily due to increased volumes from entering the year with greater backlog in the California and Kenny private sectors and both sectors of the Northwest, as well as an improved success rate on bidding activity in the California, Heavy Civil and Kenny public sectors. The increases were partially offset by a decline in the Northwest private sector from completion of projects in 2015 that were not replaced.
Large Project Construction revenue for the year ended December 31, 2015 decreased by
$12.3 million
, or
1.5%
, compared to the year ended December 31, 2014, primarily due to decreases in the California operating group and Kenny public sector from completion of projects in late 2014 and early 2015 that were not replaced. In addition, there were decreases in the Heavy Civil operating group from a decline in settlements of outstanding issues with contract owners in 2015 relative to 2014, a decrease in the impact from jobs reaching a reasonably certain profit recognition threshold, as well as costs from outstanding affirmative claims and change orders. These decreases were partially offset by increases from estimated claim recoveries in the Heavy Civil operating group, entering 2015 with greater backlog than in 2014 in the Northwest operating group and the start-up of new jobs in the Kenny private sector.
Construction Materials revenue for the year ended December 31, 2015 increased
$31.9 million
, or
12.1%
, when compared to the year ended December 31, 2014 primarily due increased unit sales volumes from stronger economic drivers in most of the Western states where we operate our plant facilities, partially offset by volume decreases in other Western states.
Contract Backlog:
Construction contract backlog of
$860.7 million
at December 31, 2015 was
$147.7 million
, or
20.7%
, higher than at December 31, 2014. The increase was primarily due to an improved success rate of bidding activity in the Northwest, Heavy Civil and Kenny operating groups, partially offset by progress on existing projects in the California operating group without receiving new awards.
Large Project Construction contract backlog of
$2.0 billion
at December 31, 2015 was
$41.9 million
, or
2.1%
, higher than at December 31, 2014 primarily due to new awards in the Heavy Civil and Kenny operating groups offset by progress on existing projects.
Gross Profit:
Construction gross profit for the year ended December 31, 2015 increased
$73.6 million
, or
64.5%
, compared to the year ended December 31, 2014. Construction gross margin as a percentage of segment revenue for
2015
increased to
14.8%
from
9.6%
in
2014
. The increases were primarily due to improved safety, better project execution resulting in reduced net project write-downs, as well as gross profit from estimated cost recoveries on affirmative claims during 2015 for which the majority of related costs were recorded in prior periods.
Large Project Construction gross profit for the year ended December 31, 2015 decreased
$27.6 million
, or
25.8%
, compared to the year ended December 31, 2014. Large Project Construction gross margin as a percentage of segment revenue for
2015
decreased to
9.8%
from
13.0%
in
2014
. The decreases were primarily due to a decrease in year-over-year third-party claim recognition and a decrease in the impact from jobs reaching a reasonably certain profit recognition threshold, as well as costs from outstanding affirmative claims and change orders. These decreases were partially offset by job progression on jobs that were in the early stages of construction in the prior year, as well as gross profit from estimated cost recoveries on affirmative claims.
Construction Materials gross profit for the year ended December 31, 2015 increased
$14.2 million
, or
75.8%
, compared to the year ended December 31, 2014. Construction Materials gross margin as a percentage of segment revenue for
2015
increased to
11.1%
from
7.1%
in
2014
. The increases were primarily due to increased volumes from overall improvement in the economy relative to the fixed cost of operating our plants.
Selling, General and Administrative Expenses:
Selling, general and administrative expenses for 2015 increased
$10.6 million
, or
5.5%
, compared to 2014. Selling expenses for 2015 increased
$0.2 million
, or
0.3%
, compared to 2014. The increases were primarily due to an increase in incentive compensation, partially offset by a decrease related to stipends from owners to defray a portion of bidding expenses received in 2015 and not 2014 for large project opportunities. Total general and administrative expenses for 2015 increased
$10.4 million
, or
7.6%
, compared to 2014, primarily due to an increase in incentive compensation from an increase in net income partially offset by a decrease in restricted stock amortization due to decreases in prior year RSU awards.
Gain on Sales of Property and Equipment:
Gain on sales of property and equipment for 2015 decreased $7.7 million, or 48.1%, compared to 2014, primarily due to the sale in 2014 of underutilized quarry properties associated with our efforts to continuously optimize the asset base of our Construction Materials segment that did not reoccur in 2015.
Other Expense (Income):
Equity in income of affiliates for 2015 increased $2.3 million when compared to 2014 primarily due to an increase in income from our asphalt terminal business in Nevada.
33
Provision for Income Taxes:
Our 2015 tax rate decreased by 1.5% from 35.5% to 34.0% when compared to 2014. The 1.5% decrease included a 6.1% decrease related to state taxes, offset by a 4.6% increase primarily related to non-controlling interests. The decrease related to state taxes was driven by a state tax law change resulting in a revaluation of our net deferred tax assets in that jurisdiction in 2014.
Amount Attributable to Non-controlling Interests:
The decrease for 2015 when compared to 2014 was primarily due to the settlement of outstanding affirmative claims with contract owners in 2014 partially offset by an increase from the sale of our previously impaired consolidated real estate investment in 2015.
Liquidity and Capital Resources
The timing differences between our cash inflows and outflows require us to maintain adequate levels of working capital. We believe our cash and cash equivalents, short-term investments, available borrowing capacity and cash expected to be generated from operations will be sufficient to meet our expected working capital needs, capital expenditures, financial commitments, cash dividend payments, and other liquidity requirements associated with our existing operations for the next twelve months. We maintain a collateralized credit facility of
$295.0 million
, of which
$161.2 million
was available at
December 31, 2016
(see Credit Agreement discussion below), to provide capital needs to fund growth opportunities, either internal or generated through acquisitions or to pay installments on our 2019 Notes (see Senior Notes Payable discussion below). If we experience a prolonged change in our business operating results or make a significant acquisition, we may need additional sources of financing, which, if available, may be limited by the terms of our existing debt covenants, or may require the amendment of our existing debt agreements. There can be no assurance that sufficient capital will continue to be available in the future or that it will be available on terms acceptable to us.
Our revenue, gross profit and the resulting cash flows can differ significantly from period to period due to a variety of factors, including our projects’ progressions toward completion, outstanding contract change orders and affirmative claims and the payment terms of our contracts. We typically invoice our customers on a monthly basis. Our contracts frequently call for retention that is a specified percentage withheld from each payment until the contract is completed and the work accepted by the customer.
The following table presents our cash, cash equivalents and marketable securities, including amounts from our CCJVs, as of the respective dates:
|
December 31,
|
2016
|
2015
|
||||||
|
(in thousands)
|
||||||||
|
Cash and cash equivalents excluding consolidated joint ventures
|
$
|
116,211
|
|
$
|
206,626
|
|
||
|
Consolidated construction joint venture cash and cash equivalents
1
|
73,115
|
|
46,210
|
|
||||
|
Total consolidated cash and cash equivalents
|
189,326
|
|
252,836
|
|
||||
|
Short-term and long-term marketable securities
2
|
127,779
|
|
105,695
|
|
||||
|
Total cash, cash equivalents and marketable securities
|
$
|
317,105
|
|
$
|
358,531
|
|
||
1
The volume and stage of completion of contracts from our CCJVs may cause fluctuations in joint venture cash and cash equivalents between periods. These funds generally are not available for the working capital or other liquidity needs of Granite until distributed.
2
See Note 3 of “Notes to the Consolidated Financial Statements” for the composition of our marketable securities.
Our primary sources of liquidity are cash and cash equivalents, marketable securities and cash generated from operations. We may also from time to time access our Credit Agreement (defined below), issue and sell equity, debt or hybrid securities or engage in other capital markets transactions.
Our cash and cash equivalents consisted of deposits and money market funds held with established national financial institutions. Marketable securities consist of U.S. Government and agency obligations and commercial paper.
Total consolidated cash and cash equivalents decreased
$63.5 million
during 2016 due to a $90.4 million decrease in cash and cash equivalents excluding consolidated construction joint ventures, partially offset by a
$26.9 million
increase in consolidated construction joint venture cash and cash equivalents - see Cash Flows discussion below. Granite’s portion of consolidated construction joint venture cash and cash equivalents was
$44.7 million
and
$28.9 million
as of December 31,
2016
and
2015
, respectively. Granite’s portion of unconsolidated construction joint venture cash and cash equivalents was
$151.3 million
and
$127.8 million
as of December 31,
2016
and
2015
, respectively. The assets of each consolidated and unconsolidated construction joint venture relate solely to that joint venture. The decision to distribute joint venture assets must generally be made jointly by a majority of the members and, accordingly, these assets, including those associated with estimated cost recovery of customer affirmative claims and back charge claims, are generally not available for the working capital needs of Granite until distributed.
Our principal uses of liquidity are paying the costs and expenses associated with our operations, servicing outstanding indebtedness, making capital expenditures and paying dividends on our capital stock. We may also from time to time prepay or repurchase outstanding indebtedness and acquire assets or businesses that are complementary to our operations.
34
Cash Flows
|
Years Ended December 31,
|
2016
|
2015
|
2014
|
|||||||||
|
(in thousands)
|
||||||||||||
|
Net cash provided by (used in):
|
|
|
||||||||||
|
Operating activities
|
$
|
73,146
|
|
$
|
66,978
|
|
$
|
43,142
|
|
|||
|
Investing activities
|
(96,390
|
)
|
(30,707
|
)
|
780
|
|
||||||
|
Financing activities
|
(40,266
|
)
|
(39,396
|
)
|
(17,082
|
)
|
||||||
As a large construction and heavy civil contractor and construction materials producer, our operating cash flows are subject to seasonal cycles, as well as the cycles associated with winning, performing and closing projects. Additionally, operating cash flows are impacted by the timing related to funding construction joint ventures and the resolution of uncertainties inherent in the complex nature of the work that we perform, including affirmative claims settlements.
Cash provided by operating activities of
$73.1 million
during
2016
increased
$6.2 million
when compared to
2015
. The increase was primarily due to a
$23.5 million
increase in net distributions from unconsolidated joint ventures partially offset by a
$5.5 million
decrease in net income after adjusting for non-cash items and a
$22.9 million
decrease in cash from working capital primarily due to increases from CCJVs.
Cash used in investing activities of
$96.4 million
during
2016
represents a
$65.7 million
increase from the amount of cash used by investing activities in
2015
. The increase was primarily due to a
$47.0 million
increase in purchases, net of sales proceeds, of property and equipment (see Capital Expenditures discussion below) and a
$24.0 million
increase in purchases of marketable securities net of calls and maturities of investments.
Cash used in financing activities of
$40.3 million
during
2016
was in line with
2015
driven by dividend payments and net payments on outstanding indebtedness.
Capital Expenditures
During the year ended
December 31, 2016
, we had capital expenditures of
$91.0 million
compared to
$44.2 million
during
2015
. Major capital expenditures are typically for aggregate and asphalt production facilities, aggregate reserves, construction equipment, buildings and leasehold improvements and investments in our information technology systems. The timing and amount of such expenditures can vary based on the progress of planned capital projects, the type and size of construction projects, changes in business outlook and other factors. We currently anticipate
2017
capital expenditures to be consistent with 2016. The increase in 2016 was primarily due to purchases to replace aging fleet in both construction equipment and trucks as well as
$17.8 million
of job specific equipment for our Large Project Construction segment of which approximately
$9.4 million
is our CCJVs partners’ share.
Derivatives
We recognize derivative instruments as either assets or liabilities in the consolidated balance sheets at fair value using Level 2 inputs.
In January 2016, we entered into an interest rate swap designed to convert the interest rate on our term loan from a variable to fixed interest rate (see Credit Agreement section below).
In March 2014, we entered into an interest rate swap designed to convert the interest rate on our 2019 Notes (as defined below) from a fixed to variable interest rate, which we terminated in December 2016 due to the possibility of increasing interest rates (see Senior Notes Payable section below).
In March 2014, we entered into two diesel commodity swaps covering the periods from May 2014 to October 2014 and from May 2015 to October 2015 which represented roughly 25% of our forecasted purchases for diesel during these periods. In May 2014, we entered into two natural gas commodity swaps covering the periods from June 2014 to October 2014 and from May 2015 to October 2015 representing roughly 25% of our forecasted purchases of natural gas during these periods. These commodity swaps were settled in October 2015 and gains or losses, including net periodic settlement amounts, were recorded in other income, net in our consolidated statements of operations. During the years ended December 31,
2015
and 2014, we recorded net losses of
$0.4 million
and $2.0 million, respectively.
35
The following table summarizes our significant obligations outstanding as of December 31,
2016
:
|
|
Payments Due by Period
|
||||||||||||||
|
(in thousands)
|
Total
|
Less than 1 year
|
1-3 years
|
3-5 years
|
More than 5 years
|
||||||||||
|
Long-term debt – principal
1
|
$
|
245,081
|
|
$
|
15,025
|
|
$
|
96,306
|
|
$
|
133,750
|
|
$
|
—
|
|
|
Long-term debt – interest
2
|
29,909
|
|
11,075
|
|
15,654
|
|
3,180
|
|
—
|
|
|||||
|
Operating leases
3
|
48,293
|
|
10,451
|
|
15,045
|
|
9,571
|
|
13,226
|
|
|||||
|
Other purchase obligations
4
|
9,713
|
|
9,713
|
|
—
|
|
—
|
|
—
|
|
|||||
|
Deferred compensation obligations
5
|
21,475
|
|
2,037
|
|
2,900
|
|
1,348
|
|
15,190
|
|
|||||
|
Asset retirement obligations
6
|
21,935
|
|
1,897
|
|
5,453
|
|
4,015
|
|
10,570
|
|
|||||
|
Total
|
$
|
376,406
|
|
$
|
50,198
|
|
$
|
135,358
|
|
$
|
151,864
|
|
$
|
38,986
|
|
1
Included in the “3-5 years” category in the table above is $30.0 million related to the 2017 installment of the 2019 Notes (defined in Senior Notes Payable section below) that we have the intent and ability to refinance using our revolving credit facility. Debt issuance costs are excluded from the table.
2
Included in the total is $10.4 million in interest related to borrowings under our Credit Agreement, calculated using the fixed rate associated with the cash flow hedge of 1.47% plus the applicable margin in effect as of December 31,
2016
. The future payments were calculated using the applicable margin in effect as of December 31,
2016
and may differ from actual results. In addition, included in the total is $14.3 million in interest related to borrowings under the 2019 Notes, the terms of which include a
6.11%
per annum interest rate. See Note 11 of “Notes to the Consolidated Financial Statements.”
3
These obligations represent the minimum rental commitments and minimum royalty requirements under all noncancellable operating leases. See Note 16 of “Notes to the Consolidated Financial Statements.”
4
These obligations represent firm purchase commitments for equipment and other goods and services not connected with our construction contract backlog which are individually greater than $10,000 and have an expected fulfillment date after December 31, 2016.
5
The timing of expected payment of deferred compensation is based on estimated dates of retirement. Actual dates of retirement could be different and could cause the timing of payments to change.
6
Asset retirement obligations represent reclamation and other related costs associated with our owned and leased quarry properties, the majority of which have an estimated settlement date beyond five years. See Note 8 of “Notes to the Consolidated Financial Statements.”
In addition to the significant obligations described above, as of December 31,
2016
, we had approximately
$3.5 million
associated with uncertain tax positions filed on our tax returns which were excluded because we cannot make a reasonably reliable estimate of the timing of potential payments relative to such reserves.
Credit Agreement
As of December 31, 2016, we had a
$295.0 million
credit facility (the “Credit Agreement”), of which
$200.0 million
was a revolving credit facility and
$95.0 million
was a term loan that matures on October 28, 2020 (the “Maturity Date”). The Credit Agreement has a sublimit for letters of credit of
$100.0 million
.
Of the $100.0 million term loan outstanding as of December 31, 2015, we paid $5.0 million of the principal balance during 2016. Of the remaining
$95.0 million
, 1.25% of the original principal balance is due in seven quarterly installments beginning in March 2017, 2.50% of the original principal balance is due in eight quarterly installments beginning in December 2018 and the remaining balance is due on the Maturity Date. As of December 31, 2016,
$90.0 million
of the
$95.0 million
term loan was included in long-term debt and the remaining $5.0 million was included in current maturities of long-term debt in the consolidated balance sheets.
As of December 31, 2016, the total stated amount of all issued and outstanding letters of credit under the Credit Agreement was
$8.8 million
and $30.0 million had been drawn for the 2016 installment of the 2019 Notes (defined below). The total unused availability under the Credit Agreement was
$161.2 million
. The letters of credit will expire between
August 2017
and
October 2017
.
36
Borrowings under the Credit Agreement bear interest at LIBOR or a base rate (at our option), plus an applicable margin based on certain financial ratios calculated quarterly. LIBOR varies based on the applicable loan term, market conditions and other external factors. The applicable margin was
1.75%
for loans bearing interest based on LIBOR and
0.75%
for loans bearing interest at the base rate at
December 31, 2016
. Accordingly, the effective interest rate using three-month LIBOR and base rate was
2.75%
and
4.50%
, respectively, at
December 31, 2016
and we elected to use LIBOR. Borrowings at the base rate have no designated term and could be repaid without penalty any time prior to the Maturity Date. Borrowings bearing interest at a LIBOR rate have a term no less than one month and no greater than six months (or such longer period not to exceed 12 months if approved by all lenders). At the end of each term, such borrowings can be paid or continued at our discretion as either a borrowing at the base rate or a borrowing at a LIBOR rate with similar terms. Our obligations under the Credit Agreement are guaranteed by certain of our subsidiaries and are collateralized on an equivalent basis with the obligations under the 2019 Notes (defined below) by first priority liens (subject only to other permitted liens) on substantially all of the assets of the Company and our subsidiaries that are guarantors or borrowers under the Credit Agreement.
In January 2016, we entered into an interest rate swap designated as a cash flow hedge with an effective date of April 2016 and an initial notional amount of $98.8 million which matures in October 2020. The interest rate swap is designed to convert the interest rate on the term loan from a variable rate of interest of LIBOR plus an applicable margin to a fixed rate of 1.47% plus the same applicable margin. The interest rate swap is reported at fair value using Level 2 inputs in the consolidated balance sheets. Gains or losses on the effective portion are initially reported as a component of accumulated other comprehensive income (loss) and subsequently reclassified to interest expense in the consolidated statements of operations when the quarterly hedged interest payment is settled. As of
December 31, 2016
, the fair value of the cash flow hedge was
$0.8 million
and was included in other current assets in the consolidated balance sheets. During the year ended
December 31, 2016
, the unrealized gain, net of taxes, on the effective portion was
$0.2 million
and was reported as a component of accumulated other comprehensive income (loss). During the year ended
December 31, 2016
, there was no ineffective portion and the interest expense reclassified from accumulated other comprehensive loss was
$0.3 million
.
The Credit Agreement provides for the release of the liens securing the obligations, at our option and expense, so long as certain conditions as defined by the terms in the Credit Agreement are satisfied (“Collateral Release Period”). However, if subsequent to exercising the option, our Consolidated Fixed Charge Coverage Ratio is less than 1.25 or our Consolidated Leverage Ratio is greater than 2.50, then we would be required to promptly re-pledge substantially all of the assets of the Company and our subsidiaries that are guarantors or borrowers under the Credit Agreement. As of
December 31, 2016
, the conditions for the exercise of our right under the Credit Agreement to have liens released were not satisfied.
Senior Notes Payable
As of
December 31, 2016
and 2015, senior notes payable in the amount of
$120.0 million
and $160.0 million, respectively, were due to a group of institutional holders and had an interest rate of
6.11%
per annum (“2019 Notes”). As of
December 31, 2016
, three equal annual installments from 2017 through 2019 were remaining. As of
December 31, 2016
and 2015,
$110.0 million
and
$150.0 million
, respectively, of the outstanding balances were included in long-term debt in the consolidated balance sheets, including $30.0 million due for each the 2016 and 2017 installments as we have the ability and intent to pay these installments using borrowings under the Credit Agreement (defined above) or by obtaining other sources of financing. The remaining $10.0 million of both the 2016 and 2017 installments was included in current maturities of long-term debt as of
December 31, 2016
and 2015 in the consolidated balance sheets.
In March 2014, we entered into an interest rate swap with a notional amount of
$100.0 million
with a maturity date of June 2018 designed to convert the interest rate of our 2019 Notes from a fixed rate of
6.11%
to a variable rate of
4.15%
plus six-month LIBOR. We terminated the interest rate swap in December 2016 due to the possibility of increasing interest rates. The interest rate swap is reported at fair value using Level 2 inputs in the consolidated balance sheets. Gains or losses, including net periodic settlement amounts, are recorded in other income, net in our consolidated statements of operations. During the years ended
December 31, 2016
,
2015
and
2014
, we recorded net gains of
$0.3 million
,
$1.5 million
and $1.4 million, respectively. The associated balance was recorded in other current assets in the consolidated balance sheets and was
$0.6 million
as of December 31,
2015
.
Our obligations under the note purchase agreement governing the 2019 Notes (the “2019 NPA”) are guaranteed by certain of our subsidiaries and are collateralized on an equivalent basis with the Credit Agreement by liens on substantially all of the assets of the Company and subsidiaries that are guarantors or borrowers under the Credit Agreement. The 2019 NPA provides for the release of liens and re-pledge of collateral on substantially the same terms and conditions as those set forth in the Credit Agreement.
37
Surety Bonds and Real Estate Mortgages
We are generally required to provide various types of surety bonds that provide an additional measure of security under certain public and private sector contracts. At
December 31, 2016
, approximately
$3.2 billion
of our contract backlog was bonded. Performance bonds do not have stated expiration dates; rather, we are generally released from the bonds after the owner accepts the work performed under contract. The ability to maintain bonding capacity to support our current and future level of contracting requires that we maintain cash and working capital balances satisfactory to our sureties.
Our unconsolidated real estate held for development and sale is subject to mortgage indebtedness. This indebtedness is non-recourse to Granite but is recourse to the real estate entities. The terms of this indebtedness are typically renegotiated to reflect the evolving nature of the real estate projects as they progress through acquisition, entitlement and development. Modification of these terms may include changes in loan-to-value ratios requiring the real estate entity to repay portions of the debt. The debt associated with our unconsolidated real estate ventures is disclosed in Note 7 of “Notes to the Consolidated Financial Statements.”
Covenants and Events of Default
Our debt and credit agreements require us to comply with various affirmative, restrictive and financial covenants, including the financial covenants described below. Our failure to comply with any of these covenants, or to pay principal, interest or other amounts when due thereunder, would constitute an event of default under the applicable agreements. Under certain circumstances, the occurrence of an event of default under one of our debt or credit agreements (or the acceleration of the maturity of the indebtedness under one of our agreements) may constitute an event of default under one or more of our other debt or credit agreements. Default under our debt and credit agreements could result in (i) us no longer being entitled to borrow under the agreements; (ii) termination of the agreements; (iii) the requirement that any letters of credit under the agreements be cash collateralized; (iv) acceleration of the maturity of outstanding indebtedness under the agreements and/or (v) foreclosure on any collateral securing the obligations under the agreements.
The most significant financial covenants under the terms of our Credit Agreement and 2019 NPA require the maintenance of a minimum Consolidated Tangible Net Worth, a minimum Consolidated Interest Coverage Ratio and a maximum Consolidated Leverage Ratio.
As of
December 31, 2016
and pursuant to the definitions in the agreements, our Consolidated Tangible Net Worth was
$881.6 million
, which exceeded the minimum of
$697.3 million
, our Consolidated Leverage Ratio was
1.54
which did not exceed the maximum of
3.00
and our Consolidated Interest Coverage Ratio was
12.30
which exceeded the minimum of
4.00
.
As of
December 31, 2016
, we were in compliance with all covenants contained in the Credit Agreement and related to the 2019 NPA. We are not aware of any non-compliance by any of our unconsolidated real estate entities with the covenants contained in their debt agreements.
Share Purchase Program
On April 7, 2016, the Board of Directors authorized us to purchase up to $200.0 million of our common stock at management’s discretion, which replaced the former authorization including the amount available. We did not purchase shares under the share purchase program in any of the periods presented. The specific timing and amount of any future purchases will vary based on market conditions, securities law limitations and other factors.
38
Recently Issued Accounting Pronouncements
In May 2014, the FASB issued ASC Topic 606,
Revenue from Contracts with Customers
, and subsequently issued several related Accounting Standards Updates (“ASUs”) (“Topic 606”), which provide guidance for recognizing revenue from contracts with customers. The core principle of Topic 606 is that revenue will be recognized when promised goods or services are transferred to customers in an amount that reflects consideration for which entitlement is expected in exchange for those goods or services. Topic 606 will be effective commencing with our quarter ending March 31, 2018. We currently anticipate adopting Topic 606 using the modified retrospective transition approach that may result in a cumulative adjustment to beginning retained earnings as of January 1, 2018, which we will elect to only apply to contracts with customers that are not substantially complete as of January 1, 2018.
Although we are in the process of assessing the impact of Topic 606 on our consolidated financial statements and related footnotes, we do not expect Topic 606 to have a material impact on our Construction Materials segment’s revenue. While we continue to assess the impact to both our Large Project Construction and Construction segments, our Large Project Construction segment is more likely to be impacted than our Construction segment in the following areas:
|
•
|
Multiple performance obligations - In accordance with Topic 606, construction contracts with customers, including those related to contract modifications, will be reviewed to determine if there are multiple performance obligations. If separate performance obligations are identified, the timing of revenue recognition could be impacted. Based on our assessment to-date on currently active construction contracts with customers, there is the potential that a few construction contracts will have multiple performance obligations.
|
|
•
|
Mobilization costs - Mobilization costs generally consist of costs to mobilize equipment and labor to a job site. Mobilization costs are currently recorded as job costs as they are incurred. Topic 606 requires mobilization costs to be capitalized as an asset on the consolidated balance sheets and amortized to contract cost over the expected duration of the contract.
|
|
•
|
Significant permanent materials - Significant permanent materials are prefabricated custom components purchased from a third party that require no modification, only installation. Significant permanent materials are currently recorded as job costs with revenue including profit. While Topic 606 still requires significant permanent materials to be recorded as job cost, revenue will only be equal to cost.
|
In addition to the above, we are expecting to have certain reclassifications in the consolidated balance sheets as well as significant additional disclosures related to revenue.
In January 2016, the FASB issued ASU No. 2016-01,
Financial Instruments - Overall (Subtopic 825-10): Recognition and Measurement of Financial Assets and Financial Liabilities,
which, among other things, eliminates the requirement to disclose the method(s) and significant assumptions used to estimate the fair value that is required to be disclosed for financial instruments measured at amortized cost on the balance sheet. This ASU will be effective commencing with our quarter ending March 31, 2017. We do not expect the adoption of this ASU to have a material impact on our consolidated financial statements.
In February 2016, the FASB issued ASU No. 2016-02,
Leases
(Topic 842),
which requires lessees to recognize the following for all leases (with the exception of short-term leases) at the commencement date: (a) a lease liability, which is a lessee’s obligation to make lease payments arising from a lease, measured on a discounted basis; and (b) a right-of-use asset, which is an asset that represents the lessee’s right to use, or control the use of, a specified asset for the lease term. The ASU will be effective commencing with our quarter ending March 31, 2019. We are currently assessing the potential impact of this ASU on our consolidated financial statements.
In March 2016, the FASB issued ASU No. 2016-05,
Derivatives and Hedging (Topic 815): Effect of Derivative Contract Novations on Existing Hedge Accounting Relationships,
which
clarifies that a change in the counterparty to a derivative instrument that has been designated as a hedging instrument does not, in and of itself, require de-designation of that hedging relationship provided that all other hedge accounting criteria continue to be met. This ASU will be effective commencing with our quarter ending March 31, 2017. We do not expect any changes in the counterparty to our cash flow hedge and, therefore, do not expect the adoption of this ASU to have a material impact on our consolidated financial statements.
In June 2016, the FASB issued ASU No. 2016-13,
Financial Instruments - Credit Losses (Topic 326): Measurement of Credit Losses on Financial Instruments.
The ASU requires the measurement of all expected credit losses for financial assets held at the reporting date based on historical experience, current conditions, and reasonable and supportable forecasts. This ASU will be effective commencing with our quarter ending March 31, 2020. We do not expect the adoption of this ASU to have a material impact on our consolidated financial statements.
39
In August 2016, the FASB issued ASU No. 2016-15,
Statement of Cash Flows (Topic 230): Classification of Certain Cash Receipts and Cash Payments.
The amendments in this ASU clarify and provide specific guidance on eight cash flow classification issues that are not currently addressed by current accounting principles generally accepted in the United States of America. This ASU will be effective commencing with our quarter ending March 31, 2018. We do not expect the adoption of this ASU to have a material impact on our consolidated financial statements.
In October 2016, the FASB issued ASU No. 2016-16,
Intra-Entity Transfers of Assets Other Than Inventory.
The amendments in this ASU require the income tax consequences of an intra-entity transfer of an asset other than inventory to be recognized when the transfer occurs instead of when the asset is sold to an outside party. This ASU will be effective commencing with our quarter ending March 31, 2018. We are currently assessing the potential impact of this ASU on our consolidated financial statements.
Recently Adopted Accounting Pronouncements
In March 2016, the FASB issued ASU No. 2016-09,
Compensation - Stock Compensation (Topic 718): Improvements to Employe
e
Share-Based Payment Accounting
. This ASU identifies areas for simplification involving several aspects of accounting for share-based payment transactions, including the income tax consequences, classification of awards as either equity or liabilities, an option to recognize gross stock compensation expense with actual forfeitures recognized as they occur, as well as certain classifications on the statement of cash flows. During the quarter ended December 31, 2016, we elected to early adopt the ASU, effective January 1, 2016, which resulted in retrospective adjustments to the 2016 quarterly financial statements that are reflected in the “Quarterly Financial Data” section of this Form 10-K.
In August 2014, the FASB issued ASU No. 2014-15,
Disclosure of Uncertainties about an Entity’s Ability to Continue as a Going Concern,
which requires management to evaluate whether there are conditions or events that raise substantial doubt about the entity’s ability to continue as a going concern within one year after the date that the financial statements are issued. If conditions or events exist that raise substantial doubt about an entity’s ability to continue as a going concern, the guidance requires disclosure in the financial statements. The guidance was effective for our annual period ended December 31, 2016. During the year ended December 31, 2016, management assessed the Company’s ability to continue as a going concern as required and concluded there were no conditions that gave rise to substantial doubt about the ability to continue as a going concern; therefore, additional disclosures were not required.
We maintain an investment portfolio of various holdings, types and maturities. We purchase instruments that meet high credit quality standards, as specified in our investment policy. It also limits the amount of credit exposure to any one issue, issuer or type of instrument. The portfolio and accompanying cash balances are targeted to an average maturity of no more than one year from the date the purchase is settled. On an ongoing basis we monitor credit ratings, financial condition and other factors that could affect the carrying amount of our investment portfolio.
Marketable securities, consisting of U.S. government and agency obligations and commercial paper, are classified as held-to-maturity and are stated at cost, adjusted for amortization of premiums and discounts to maturity.
Given the short-term nature of certain investments, our investment income is subject to the general level of interest rates in the United States at the time of maturity and reinvestment. We have managed the financial market risks due largely to changes in interest rates primarily by managing the maturities in our investment portfolio. We do not have any material business transactions in foreign currencies.
The fair value of our short-term held-to-maturity investment portfolio and related income would not be significantly affected by changes in interest rates since the investment maturities are short and the interest rates are primarily fixed. The fair value of our long-term held-to-maturity investment portfolio may be affected by changes in interest rates.
We are exposed to various commodity price risks, including, but not limited to, diesel fuel, natural gas, propane, steel, cement and liquid asphalt arising from transactions that are entered into in the normal course of business. In order to manage or reduce commodity price risk, we monitor the costs of these commodities at the time of bid and price them into our contracts accordingly. Additionally, some of our contracts include commodity price escalation clauses which partially protect us from increasing prices. At times we enter into supply agreements or pre-purchase commodities to secure pricing and may use financial contracts to further manage price risk.
40
As of
December 31, 2016
,
$120.0 million
of senior notes payable were due to a group of institutional holders in three remaining equal installments from 2017 through 2019 and bear interest at
6.11%
per annum.
As of
December 31, 2016
, a
$95.0 million
term loan was outstanding under the Credit Agreement that had an effective interest rate of
2.75%
using three-month LIBOR and the applicable margin, that we converted under a swap arrangement to a fixed rate of 1.47% plus the same applicable margin. The applicable margin is based on certain financial ratios calculated quarterly and can vary in future periods. Each 25 basis point increase in the applicable margin would result in $0.2 million annually in additional interest expense.
As of
December 31, 2016
,
$30.0 million
had been drawn and was outstanding under the revolving portion of the Credit Agreement that had an effective interest rate of
2.52%
using one-month LIBOR and the applicable margin. We had the option of electing LIBOR or the base rate and we elected to use LIBOR. LIBOR is a variable rate subject to market changes over the life of the loan with no guarantees to fix as forecasted. Each 25 basis point increase in one-month LIBOR or in the applicable margin of the loan would result in an additional $0.1 million of annual interest expense.
See “Liquidity and Capital Resources” section above for further discussion on the senior notes payable and Credit Agreement.
The table below presents principal amounts due by year and related weighted average interest rates for our cash and cash equivalents, held-to-maturity investments and significant debt obligations as of
December 31, 2016
(dollars in thousands):
|
|
2017
|
2018
|
2019
|
2020
|
2021
|
Thereafter
|
Total
|
||||||||||||||
|
Assets
|
|
|
|
|
|
|
|
||||||||||||||
|
Cash, cash equivalents, held-to-maturity investments
|
$
|
254,211
|
|
$
|
17,906
|
|
$
|
24,988
|
|
$
|
20,000
|
|
$
|
—
|
|
$
|
—
|
|
$
|
317,105
|
|
|
Weighted average interest rate
|
0.79
|
%
|
1.21
|
%
|
1.33
|
%
|
1.45
|
%
|
—
|
%
|
—
|
%
|
0.90
|
%
|
|||||||
|
Liabilities
|
|||||||||||||||||||||
|
Fixed rate debt
|
|||||||||||||||||||||
|
Senior notes payable
1
|
$
|
10,000
|
|
$
|
40,000
|
|
$
|
40,000
|
|
$
|
—
|
|
$
|
—
|
|
$
|
—
|
|
$
|
90,000
|
|
|
Interest rate
|
6.11
|
%
|
6.11
|
%
|
6.11
|
%
|
—
|
%
|
—
|
%
|
—
|
%
|
6.11
|
%
|
|||||||
|
Variable rate debt
|
|||||||||||||||||||||
|
Credit Agreement - term loan
|
$
|
5,000
|
|
$
|
6,250
|
|
$
|
10,000
|
|
$
|
73,750
|
|
$
|
—
|
|
$
|
—
|
|
$
|
95,000
|
|
|
Effective interest rate
2
|
3.22
|
%
|
3.22
|
%
|
3.22
|
%
|
3.22
|
%
|
—
|
%
|
—
|
%
|
3.22
|
%
|
|||||||
|
Credit Agreement - revolving credit facility
1
|
$
|
—
|
|
$
|
—
|
|
$
|
—
|
|
$
|
60,000
|
|
$
|
—
|
|
$
|
—
|
|
$
|
60,000
|
|
|
Effective interest rate
3
|
—
|
%
|
—
|
%
|
—
|
%
|
2.52
|
%
|
—
|
%
|
—
|
%
|
2.52
|
%
|
|||||||
1
As of
December 31, 2016
, senior notes payable in the amount of
$120.0 million
were due to a group of institutional holders in three remaining installments from 2017 through 2019. We have the intent and ability to pay $30.0 million related to the 2017 installment using the revolving credit facility or other source of financing; therefore, it is included in the Credit Agreement - revolving credit facility amount.
2
The weighted average interest rate was calculated using the fixed rate associated with the cash flow hedge of 1.47% plus the applicable margin in effect as of December 31,
2016
.
3
The weighted average interest rate was calculated using one-month LIBOR rates and the applicable margin in effect as of December 31,
2016
and may differ from actual results.
The estimated fair value of our cash, cash equivalents and short-term held-to-maturity investments approximates the principal amounts reflected above based on the generally short maturities of these financial instruments. Based on the fixed borrowing rates currently available to us for bank loans with similar terms and average maturities, the fair value of the senior notes payable was approximately
$124.7 million
and
$165.7 million
as of as of December 31,
2016
and
2015
, respectively. The fair value of the term loan under the Credit Agreement was approximately
$94.0 million
and
$99.4 million
as of December 31,
2016
and
2015
, respectively. The fair value of the revolving credit facility under the Credit Agreement was approximately
$29.5 million
as of December 31,
2016
.
41
The following consolidated financial statements of Granite, the supplementary data and the independent registered public accounting firm’s report are incorporated by reference from Part IV, Item 15(1) and (2):
Report of Independent Registered Public Accounting Firm
Consolidated Balance Sheets - At December 31,
2016
and
2015
Consolidated Statements of Operations - Years Ended December 31,
2016
,
2015
and
2014
Consolidated Statements of Comprehensive Income - Years Ended December 31,
2016
,
2015
and
2014
Consolidated Statements of Shareholders’ Equity - Years Ended December 31,
2016
,
2015
and
2014
Consolidated Statements of Cash Flows - Years Ended December 31,
2016
,
2015
and
2014
Notes to the Consolidated Financial Statements
Quarterly Financial Data (unaudited)
Not applicable.
Evaluation of Disclosure Controls and Procedures
: Our management carried out, as of December 31,
2016
, with the participation of our Chief Executive Officer and our Chief Financial Officer, an evaluation of the effectiveness of our disclosure controls and procedures (as defined in Rules 13a-15(e) and 15d-15(e) under the Securities Exchange Act of 1934, as amended (the “Exchange Act”)). Based on that evaluation, our Chief Executive Officer and Chief Financial Officer concluded that, as of December 31,
2016
, our disclosure controls and procedures were effective to provide reasonable assurance that material information required to be disclosed by us in reports we file under the Exchange Act is recorded, processed, summarized and reported within the time periods specified in the SEC rules and forms and that information required to be disclosed by us in the reports we file or submit under the Exchange Act is accumulated and communicated to our management, including our Chief Executive Officer and Chief Financial Officer, as appropriate to allow timely decisions regarding required disclosure.
Changes in Internal Control Over Financial Reporting:
During the quarter ended
December 31, 2016
, there were no changes to our internal control over financial reporting that have materially affected, or are reasonably likely to materially affect, our internal control over financial reporting.
Management’s Report on Internal Control Over Financial Reporting:
Our management is responsible for establishing and maintaining adequate internal control over financial reporting, as such term is defined in Exchange Act Rules 13a-15(f) and 15d -15(f). Under the supervision and with the participation of our management, including our Chief Executive Officer and Chief Financial Officer, our management conducted an evaluation of the effectiveness of our internal control over financial reporting based on the framework in “Internal Control—Integrated Framework (2013)” issued by the Committee of Sponsoring Organizations of the Treadway Commission. Based on that evaluation, our management concluded that our internal control over financial reporting was effective as of December 31,
2016
.
Independent Registered Public Accounting Firm Report:
PricewaterhouseCoopers LLP, the independent registered public accounting firm that audited our consolidated financial statements included in this Annual Report on Form 10-K, has issued a report on the Company’s internal control over financial reporting as of December 31,
2016
. The report, which expresses an unqualified opinion on the effectiveness of the Company’s internal control over financial reporting as of December 31,
2016
, is included in “Item 15. Exhibits and Financial Statement Schedules” under the heading “Report of Independent Registered Public Accounting Firm.”
Not Applicable.
42
Certain information required by Part III is omitted from this report. We will file our definitive proxy statement for our Annual Meeting of Shareholders to be held on
June 8, 2017
(the “Proxy Statement”) pursuant to Regulation 14A not later than 120 days after the end of the fiscal year covered by this report, and certain information included therein is incorporated herein by reference.
For information regarding our Directors and compliance with Section 16(a) of the Securities Exchange Act of 1934, we direct you to the sections entitled “Proposal 1 - Election and Ratification of Directors” and “Section 16(a) Beneficial Ownership Reporting Compliance,” respectively, in the Proxy Statement. For information regarding our Audit/Compliance Committee and our Audit/Compliance Committee’s financial expert, we direct you to the section entitled “Information about the Board of Directors and Corporate Governance - Committees of the Board - Audit/Compliance Committee” in the Proxy Statement. For information regarding our Code of Conduct, we direct you to the section entitled “Information about the Board of Directors and Corporate Governance - Code of Conduct” in the Proxy Statement. Information regarding our executive officers is contained in the section entitled “Executive Officers of the Registrant,” in Part I, Item I of this report. This information is incorporated herein by reference.
For information regarding our Executive Compensation, we direct you to the section captioned “Executive and Director Compensation and Other Matters” in the Proxy Statement. This information is incorporated herein by reference.
This information is located in the sections captioned “Stock Ownership of Beneficial Owners and Certain Management” and “Equity Compensation Plan Information” in the Proxy Statement. This information is incorporated herein by reference.
You will find this information in the sections captioned “Transactions with Related Persons” and “Information about the Board of Directors and Corporate Governance - Director Independence” in the Proxy Statement. This information is incorporated herein by reference.
You will find this information in the section captioned “Independent Registered Public Accountants - Principal Accountant Fees and Services” in the Proxy Statement. This information is incorporated herein by reference.
43
The following documents are filed as part of this report:
1. Financial Statements.
The following consolidated financial statements and related documents are filed as part of this report:
|
Financial Statements
|
Page
|
|
Report of Independent Registered Public Accounting Firm
|
F-1
|
|
Consolidated Balance Sheets at December 31, 2016 and 2015
|
F-2
|
|
Consolidated Statements of Operations for the Years Ended December 31, 2016, 2015 and 2014
|
F-3
|
|
Consolidated Statements of Comprehensive Income for the Years Ended December 31, 2016, 2015 and 2014
|
F-4
|
|
Consolidated Statements of Shareholders’ Equity for the Years Ended December 31, 2016, 2015 and 2014
|
F-5
|
|
Consolidated Statements of Cash Flows for the Years Ended December 31, 2016, 2015 and 2014
|
F-6 to F-7
|
|
Notes to the Consolidated Financial Statements
|
F-8 to F-36
|
|
Quarterly Financial Data
|
F-37
|
2. Financial Statement Schedules.
Schedules are omitted because they are not required or applicable, or the required information is included in the Financial Statements or related notes.
3. Exhibits
. The Exhibits listed in the accompanying Exhibit Index, which is incorporated herein by reference, are filed or incorporated by reference as part of, or furnished with, this report.
44
REPORT OF INDEPENDENT REGISTERED PUBLIC ACCOUNTING FIRM
To the Board of Directors and Shareholders of Granite Construction Incorporated:
In our opinion, the consolidated financial statements listed in the index appearing under Item 15(1) present fairly, in all material respects, the financial position of Granite Construction Incorporated and its subsidiaries at December 31, 2016 and 2015, and the results of their operations and their cash flows for each of the three years in the period ended December 31, 2016 in conformity with accounting principles generally accepted in the United States of America. Also in our opinion, the Company maintained, in all material respects, effective internal control over financial reporting as of December 31, 2016, based on criteria established in
Internal Control - Integrated Framework (2013)
issued by the Committee of Sponsoring Organizations of the Treadway Commission (COSO). The Company’s management is responsible for these financial statements, for maintaining effective internal control over financial reporting and for its assessment of the effectiveness of internal control over financial reporting, included in Management’s Report on Internal Control over Financial Reporting appearing under Item 9A. Our responsibility is to express opinions on these financial statements and on the Company’s internal control over financial reporting based on our integrated audits. We conducted our audits in accordance with the standards of the Public Company Accounting Oversight Board (United States). Those standards require that we plan and perform the audits to obtain reasonable assurance about whether the financial statements are free of material misstatement and whether effective internal control over financial reporting was maintained in all material respects. Our audits of the financial statements included examining, on a test basis, evidence supporting the amounts and disclosures in the financial statements, assessing the accounting principles used and significant estimates made by management, and evaluating the overall financial statement presentation. Our audit of internal control over financial reporting included obtaining an understanding of internal control over financial reporting, assessing the risk that a material weakness exists, and testing and evaluating the design and operating effectiveness of internal control based on the assessed risk. Our audits also included performing such other procedures as we considered necessary in the circumstances. We believe that our audits provide a reasonable basis for our opinions.
A company’s internal control over financial reporting is a process designed to provide reasonable assurance regarding the reliability of financial reporting and the preparation of financial statements for external purposes in accordance with generally accepted accounting principles. A company’s internal control over financial reporting includes those policies and procedures that (i) pertain to the maintenance of records that, in reasonable detail, accurately and fairly reflect the transactions and dispositions of the assets of the company; (ii) provide reasonable assurance that transactions are recorded as necessary to permit preparation of financial statements in accordance with generally accepted accounting principles, and that receipts and expenditures of the company are being made only in accordance with authorizations of management and directors of the company; and (iii) provide reasonable assurance regarding prevention or timely detection of unauthorized acquisition, use, or disposition of the company’s assets that could have a material effect on the financial statements.
Because of its inherent limitations, internal control over financial reporting may not prevent or detect misstatements. Also, projections of any evaluation of effectiveness to future periods are subject to the risk that controls may become inadequate because of changes in conditions, or that the degree of compliance with the policies or procedures may deteriorate.
/s/ PricewaterhouseCoopers LLP
San Francisco, California
February 17, 2017
F- 1
|
GRANITE CONSTRUCTION INCORPORATED
|
|||||||||
|
CONSOLIDATED BALANCE SHEETS
|
|||||||||
|
(dollars in thousands, except share and per share data)
|
|||||||||
|
December 31,
|
2016
|
2015
|
|||||||
|
ASSETS
|
|
|
|||||||
|
Current assets
|
|
|
|||||||
|
Cash and cash equivalents ($73,115 and $46,210 related to consolidated construction joint ventures (“CCJVs”))
|
$
|
189,326
|
|
$
|
252,836
|
|
|||
|
Short-term marketable securities
|
64,884
|
|
25,043
|
|
|||||
|
Receivables, net ($52,613 and $45,734 related to CCJVs)
|
419,345
|
|
340,822
|
|
|||||
|
Costs and estimated earnings in excess of billings ($5,046 and $826 related to CCJVs)
|
73,102
|
|
59,070
|
|
|||||
|
Inventories
|
55,245
|
|
55,553
|
|
|||||
|
Equity in construction joint ventures
|
247,182
|
|
224,689
|
|
|||||
|
Other current assets ($7,500 and $4,037 related to CCJVs)
|
39,908
|
|
26,985
|
|
|||||
|
Total current assets
|
1,088,992
|
|
984,998
|
|
|||||
|
Property and equipment, net ($20,500 and $5,378 related to CCJVs)
|
406,650
|
|
385,129
|
|
|||||
|
Long-term marketable securities
|
62,895
|
|
80,652
|
|
|||||
|
Investments in affiliates
|
35,668
|
|
33,182
|
|
|||||
|
Goodwill
|
53,799
|
|
53,799
|
|
|||||
|
Deferred income taxes, net
|
—
|
|
4,329
|
|
|||||
|
Other noncurrent assets
|
85,449
|
|
84,789
|
|
|||||
|
Total assets
|
$
|
1,733,453
|
|
$
|
1,626,878
|
|
|||
|
LIABILITIES AND EQUITY
|
|
|
|
|
|||||
|
Current liabilities
|
|
|
|
|
|||||
|
Current maturities of long-term debt
|
$
|
14,796
|
|
$
|
14,800
|
|
|||
|
Accounts payable ($26,419 and $11,909 related to CCJVs)
|
199,029
|
|
157,571
|
|
|||||
|
Billings in excess of costs and estimated earnings ($33,704 and $15,768 related to CCJVs)
|
97,522
|
|
92,515
|
|
|||||
|
Accrued expenses and other current liabilities ($1,544 and $1,171 related to CCJVs)
|
218,587
|
|
200,935
|
|
|||||
|
Total current liabilities
|
529,934
|
|
465,821
|
|
|||||
|
Long-term debt
|
229,498
|
|
244,323
|
|
|||||
|
Deferred income taxes, net
|
5,441
|
|
—
|
|
|||||
|
Other long-term liabilities
|
45,989
|
|
46,613
|
|
|||||
|
Commitments and contingencies
|
|
|
|
|
|||||
|
Equity
|
|
|
|
|
|||||
|
Preferred stock, $0.01 par value, authorized 3,000,000 shares, none outstanding
|
—
|
|
—
|
|
|||||
|
Common stock, $0.01 par value, authorized 150,000,000 shares; issued and outstanding
39,621,140
shares as of December 31, 2016 and 39,412,877 shares as of December 31, 2015
|
396
|
|
394
|
|
|||||
|
Additional paid-in capital
|
150,337
|
|
140,912
|
|
|||||
|
Accumulated other comprehensive loss
|
(371
|
)
|
(1,500
|
)
|
|||||
|
Retained earnings
|
735,626
|
|
699,431
|
|
|||||
|
Total Granite Construction Incorporated shareholders’ equity
|
885,988
|
|
839,237
|
|
|||||
|
Non-controlling interests
|
36,603
|
|
30,884
|
|
|||||
|
Total equity
|
922,591
|
|
870,121
|
|
|||||
|
Total liabilities and equity
|
$
|
1,733,453
|
|
$
|
1,626,878
|
|
|||
The accompanying notes are an integral part of these consolidated financial statements.
F- 2
|
GRANITE CONSTRUCTION INCORPORATED
|
||||||||||||
|
|
||||||||||||
|
(in thousands, except per share data)
|
||||||||||||
|
Years Ended December 31,
|
2016
|
2015
|
2014
|
|||||||||
|
Revenue
|
|
|
||||||||||
|
Construction
|
$
|
1,365,198
|
|
$
|
1,262,675
|
|
$
|
1,186,445
|
|
|||
|
Large Project Construction
|
888,193
|
|
812,720
|
|
825,044
|
|
||||||
|
Construction Materials
|
261,226
|
|
295,634
|
|
263,781
|
|
||||||
|
Total revenue
|
2,514,617
|
|
2,371,029
|
|
2,275,270
|
|
||||||
|
Cost of revenue
|
|
|
|
|||||||||
|
Construction
|
1,155,983
|
|
1,075,169
|
|
1,072,492
|
|
||||||
|
Large Project Construction
|
824,056
|
|
733,253
|
|
717,947
|
|
||||||
|
Construction Materials
|
233,208
|
|
262,771
|
|
245,090
|
|
||||||
|
Total cost of revenue
|
2,213,247
|
|
2,071,193
|
|
2,035,529
|
|
||||||
|
Gross profit
|
301,370
|
|
299,836
|
|
239,741
|
|
||||||
|
Selling, general and administrative expenses
|
219,299
|
|
203,817
|
|
193,256
|
|
||||||
|
Restructuring and impairment gains
|
(1,925
|
)
|
(6,003
|
)
|
(2,643
|
)
|
||||||
|
Gain on sales of property and equipment
|
(8,358
|
)
|
(8,286
|
)
|
(15,972
|
)
|
||||||
|
Operating income
|
92,354
|
|
110,308
|
|
65,100
|
|
||||||
|
Other (income) expense
|
|
|
|
|||||||||
|
Interest income
|
(3,225
|
)
|
(2,135
|
)
|
(1,872
|
)
|
||||||
|
Interest expense
|
12,366
|
|
14,257
|
|
14,159
|
|
||||||
|
Equity in income of affiliates
|
(7,177
|
)
|
(3,210
|
)
|
(901
|
)
|
||||||
|
Other income, net
|
(5,972
|
)
|
(2,031
|
)
|
(1,883
|
)
|
||||||
|
Total other (income) expense
|
(4,008
|
)
|
6,881
|
|
9,503
|
|
||||||
|
Income before provision for income taxes
|
96,362
|
|
103,427
|
|
55,597
|
|
||||||
|
Provision for income taxes
|
30,162
|
|
35,179
|
|
19,721
|
|
||||||
|
Net income
|
66,200
|
|
68,248
|
|
35,876
|
|
||||||
|
Amount attributable to non-controlling interests
|
(9,078
|
)
|
(7,763
|
)
|
(10,530
|
)
|
||||||
|
Net income attributable to Granite Construction Incorporated
|
$
|
57,122
|
|
$
|
60,485
|
|
$
|
25,346
|
|
|||
|
Net income per share attributable to common shareholders
(see Note 14)
|
|
|
|
|||||||||
|
Basic
|
$
|
1.44
|
|
$
|
1.54
|
|
$
|
0.65
|
|
|||
|
Diluted
|
$
|
1.42
|
|
$
|
1.52
|
|
$
|
0.64
|
|
|||
|
Weighted average shares of common stock
|
|
|
|
|||||||||
|
Basic
|
39,557
|
|
39,337
|
|
39,096
|
|
||||||
|
Diluted
|
40,225
|
|
39,868
|
|
39,795
|
|
||||||
|
Dividends per common share
|
$
|
0.52
|
|
$
|
0.52
|
|
$
|
0.52
|
|
|||
The accompanying notes are an integral part of these consolidated financial statements.
F- 3
|
GRANITE CONSTRUCTION INCORPORATED
|
||||||||||||
|
CONSOLIDATED STATEMENTS OF COMPREHENSIVE INCOME
|
||||||||||||
|
(in thousands)
|
||||||||||||
|
Years Ended December 31,
|
2016
|
2015
|
2014
|
|||||||||
|
Net income
|
$
|
66,200
|
|
$
|
68,248
|
|
$
|
35,876
|
|
|||
|
Other comprehensive income (loss), net of tax:
|
||||||||||||
|
Net unrealized gain on derivatives
|
$
|
184
|
|
$
|
—
|
|
$
|
—
|
|
|||
|
Less: reclassification for net losses included in interest expense
|
319
|
|
—
|
|
—
|
|
||||||
|
Net change
|
$
|
503
|
|
$
|
—
|
|
$
|
—
|
|
|||
|
Foreign currency translation adjustments, net
|
626
|
|
(1,072
|
)
|
(433
|
)
|
||||||
|
Other comprehensive income (loss)
|
$
|
1,129
|
|
$
|
(1,072
|
)
|
$
|
(433
|
)
|
|||
|
Comprehensive income
|
$
|
67,329
|
|
$
|
67,176
|
|
$
|
35,443
|
|
|||
|
Non-controlling interests in comprehensive income
|
(9,078
|
)
|
(7,763
|
)
|
(10,530
|
)
|
||||||
|
Comprehensive income attributable to Granite
|
$
|
58,251
|
|
$
|
59,413
|
|
$
|
24,913
|
|
|||
The accompanying notes are an integral part of these consolidated financial statements.
F- 4
|
GRANITE CONSTRUCTION INCORPORATED
|
|||||||||||||||||||||||
|
CONSOLIDATED STATEMENTS OF SHAREHOLDERS’ EQUITY
|
|||||||||||||||||||||||
|
(in thousands, except share data)
|
|||||||||||||||||||||||
|
Outstanding Shares
|
Common Stock
|
Additional Paid-in Capital
|
Accumulated Other Comprehensive (Loss) Income
|
Retained Earnings
|
Total Granite Shareholders’ Equity
|
Non-controlling Interests
|
Total Equity
|
||||||||||||||||
|
Balances at December 31, 2013
|
38,917,728
|
|
$
|
389
|
|
$
|
126,444
|
|
$
|
5
|
|
$
|
655,102
|
|
$
|
781,940
|
|
$
|
4,404
|
|
$
|
786,344
|
|
|
Net income
|
—
|
|
—
|
|
—
|
|
—
|
|
25,346
|
|
25,346
|
|
10,530
|
|
35,876
|
|
|||||||
|
Other comprehensive loss
|
—
|
|
—
|
|
—
|
|
(433
|
)
|
—
|
|
(433
|
)
|
—
|
|
(433
|
)
|
|||||||
|
Stock units vested
|
378,027
|
|
4
|
|
—
|
|
—
|
|
—
|
|
4
|
|
—
|
|
4
|
|
|||||||
|
Amortized restricted stock units
|
—
|
|
—
|
|
11,160
|
|
—
|
|
—
|
|
11,160
|
|
—
|
|
11,160
|
|
|||||||
|
Purchase of common stock
|
(135,028
|
)
|
(1
|
)
|
(5,186
|
)
|
—
|
|
—
|
|
(5,187
|
)
|
—
|
|
(5,187
|
)
|
|||||||
|
Cash dividends on common stock
|
—
|
|
—
|
|
—
|
|
—
|
|
(20,354
|
)
|
(20,354
|
)
|
—
|
|
(20,354
|
)
|
|||||||
|
Net tax on stock-based compensation
|
—
|
|
—
|
|
1,080
|
|
—
|
|
—
|
|
1,080
|
|
—
|
|
1,080
|
|
|||||||
|
Transactions with non-controlling interests, net
|
—
|
|
—
|
|
—
|
|
—
|
|
—
|
|
—
|
|
7,787
|
|
7,787
|
|
|||||||
|
Employee Stock Purchase Plan (“ESPP”) and other
|
25,659
|
|
—
|
|
1,107
|
|
—
|
|
(278
|
)
|
829
|
|
—
|
|
829
|
|
|||||||
|
Balances at December 31, 2014
|
39,186,386
|
|
392
|
|
134,605
|
|
(428
|
)
|
659,816
|
|
794,385
|
|
22,721
|
|
817,106
|
|
|||||||
|
Net income
|
—
|
|
—
|
|
—
|
|
—
|
|
60,485
|
|
60,485
|
|
7,763
|
|
68,248
|
|
|||||||
|
Other comprehensive loss
|
—
|
|
—
|
|
—
|
|
(1,072
|
)
|
—
|
|
(1,072
|
)
|
—
|
|
(1,072
|
)
|
|||||||
|
Stock units vested
|
317,524
|
|
3
|
|
—
|
|
—
|
|
—
|
|
3
|
|
—
|
|
3
|
|
|||||||
|
Amortized restricted stock units
|
—
|
|
—
|
|
8,763
|
|
—
|
|
—
|
|
8,763
|
|
—
|
|
8,763
|
|
|||||||
|
Purchase of common stock
|
(114,969
|
)
|
(1
|
)
|
(3,855
|
)
|
—
|
|
—
|
|
(3,856
|
)
|
—
|
|
(3,856
|
)
|
|||||||
|
Cash dividends on common stock
|
—
|
|
—
|
|
—
|
|
—
|
|
(20,476
|
)
|
(20,476
|
)
|
—
|
|
(20,476
|
)
|
|||||||
|
Transactions with non-controlling interests, net
|
—
|
|
—
|
|
—
|
|
—
|
|
—
|
|
—
|
|
400
|
|
400
|
|
|||||||
|
ESPP and other
|
23,936
|
|
—
|
|
1,399
|
|
—
|
|
(394
|
)
|
1,005
|
|
—
|
|
1,005
|
|
|||||||
|
Balances at December 31, 2015
|
39,412,877
|
|
394
|
|
140,912
|
|
(1,500
|
)
|
699,431
|
|
839,237
|
|
30,884
|
|
870,121
|
|
|||||||
|
Net income
|
—
|
|
—
|
|
—
|
|
—
|
|
57,122
|
|
57,122
|
|
9,078
|
|
66,200
|
|
|||||||
|
Other comprehensive income
|
—
|
|
—
|
|
—
|
|
1,129
|
|
—
|
|
1,129
|
|
—
|
|
1,129
|
|
|||||||
|
Stock units vested
|
308,619
|
|
3
|
|
—
|
|
—
|
|
—
|
|
3
|
|
—
|
|
3
|
|
|||||||
|
Amortized restricted stock units
|
—
|
|
—
|
|
13,383
|
|
—
|
|
—
|
|
13,383
|
|
—
|
|
13,383
|
|
|||||||
|
Purchase of common stock
|
(116,355
|
)
|
(1
|
)
|
(5,226
|
)
|
—
|
|
—
|
|
(5,227
|
)
|
—
|
|
(5,227
|
)
|
|||||||
|
Cash dividends on common stock
|
—
|
|
—
|
|
—
|
|
—
|
|
(20,590
|
)
|
(20,590
|
)
|
—
|
|
(20,590
|
)
|
|||||||
|
Transactions with non-controlling interests, net
|
—
|
|
—
|
|
—
|
|
—
|
|
—
|
|
—
|
|
(3,359
|
)
|
(3,359
|
)
|
|||||||
|
ESPP and other
|
15,999
|
|
—
|
|
1,268
|
|
—
|
|
(337
|
)
|
931
|
|
—
|
|
931
|
|
|||||||
|
Balances at December 31, 2016
|
39,621,140
|
|
$
|
396
|
|
$
|
150,337
|
|
$
|
(371
|
)
|
$
|
735,626
|
|
$
|
885,988
|
|
$
|
36,603
|
|
$
|
922,591
|
|
The accompanying notes are an integral part of these consolidated financial statements.
F- 5
|
GRANITE CONSTRUCTION INCORPORATED
|
||||||||||||
|
|
||||||||||||
|
(
in thousands
)
|
||||||||||||
|
Years Ended December 31,
|
2016
|
2015
|
2014
|
|||||||||
|
Operating activities
|
|
|
||||||||||
|
Net income
|
$
|
66,200
|
|
$
|
68,248
|
|
$
|
35,876
|
|
|||
|
Adjustments to reconcile net income to net cash provided by operating activities:
|
|
|
||||||||||
|
Non-cash restructuring and impairment gains
|
(1,000
|
)
|
(1,044
|
)
|
(2,643
|
)
|
||||||
|
Depreciation, depletion and amortization
|
64,375
|
|
64,309
|
|
68,252
|
|
||||||
|
Gain on sales of property and equipment
|
(8,358
|
)
|
(8,286
|
)
|
(15,972
|
)
|
||||||
|
Change in deferred income taxes
|
9,842
|
|
28,258
|
|
14,907
|
|
||||||
|
Stock-based compensation
|
13,383
|
|
8,763
|
|
11,160
|
|
||||||
|
Equity in net income from unconsolidated joint ventures
|
(15,614
|
)
|
(43,374
|
)
|
(49,168
|
)
|
||||||
|
Gain on real estate entity
|
(2,452
|
)
|
—
|
|
—
|
|
||||||
|
Net income from affiliates
|
(7,177
|
)
|
(3,210
|
)
|
(901
|
)
|
||||||
|
Changes in assets and liabilities:
|
||||||||||||
|
Receivables
|
(75,756
|
)
|
(32,877
|
)
|
3,549
|
|
||||||
|
Costs and estimated earnings in excess of billings, net
|
2,100
|
|
(22,374
|
)
|
(13,856
|
)
|
||||||
|
Inventories
|
308
|
|
13,367
|
|
(6,446
|
)
|
||||||
|
Contributions to unconsolidated construction joint ventures
|
(11,795
|
)
|
(69,313
|
)
|
(37,097
|
)
|
||||||
|
Distributions from unconsolidated construction joint ventures
|
19,344
|
|
53,367
|
|
67,255
|
|
||||||
|
Prepaid and other assets, net
|
(11,421
|
)
|
(1,078
|
)
|
5,519
|
|
||||||
|
Accounts payable
|
37,731
|
|
8,363
|
|
(12,669
|
)
|
||||||
|
Accrued expenses and other current liabilities
|
(6,564
|
)
|
3,859
|
|
(24,624
|
)
|
||||||
|
Net cash provided by operating activities
|
73,146
|
|
66,978
|
|
43,142
|
|
||||||
|
Investing activities
|
|
|
|
|
||||||||
|
Purchases of marketable securities
|
(129,685
|
)
|
(104,971
|
)
|
(64,975
|
)
|
||||||
|
Maturities of marketable securities
|
50,000
|
|
29,260
|
|
45,000
|
|
||||||
|
Proceeds from called marketable securities
|
55,000
|
|
75,000
|
|
35,000
|
|
||||||
|
Purchases of property and equipment ($17.8 million, $0 and $3.6 million related to CCJVs)
|
(90,970
|
)
|
(44,179
|
)
|
(43,428
|
)
|
||||||
|
Proceeds from sales of property and equipment
|
12,946
|
|
13,148
|
|
28,614
|
|
||||||
|
Distributions from affiliates
|
2,233
|
|
305
|
|
494
|
|
||||||
|
Collection of notes receivable
|
4,331
|
|
943
|
|
468
|
|
||||||
|
Other investing activities, net
|
(245
|
)
|
(213
|
)
|
(393
|
)
|
||||||
|
Net cash (used in) provided by investing activities
|
(96,390
|
)
|
(30,707
|
)
|
780
|
|
||||||
|
Financing activities
|
|
|
|
|
||||||||
|
Proceeds from long-term debt
|
30,000
|
|
30,000
|
|
—
|
|
||||||
|
Debt principal payments
|
(45,025
|
)
|
(46,763
|
)
|
(1,226
|
)
|
||||||
|
Cash dividends paid
|
(20,563
|
)
|
(20,445
|
)
|
(20,319
|
)
|
||||||
|
Purchases of common stock
|
(5,227
|
)
|
(3,777
|
)
|
(5,124
|
)
|
||||||
|
Contributions from non-controlling partners
|
5,250
|
|
7,462
|
|
15,835
|
|
||||||
|
Distributions to non-controlling partners
|
(5,258
|
)
|
(6,992
|
)
|
(8,066
|
)
|
||||||
|
Other financing activities
|
557
|
|
1,119
|
|
1,818
|
|
||||||
|
Net cash used in financing activities
|
(40,266
|
)
|
(39,396
|
)
|
(17,082
|
)
|
||||||
|
(Decrease) increase in cash and cash equivalents
|
(63,510
|
)
|
(3,125
|
)
|
26,840
|
|
||||||
|
Cash and cash equivalents at beginning of year
|
252,836
|
|
255,961
|
|
229,121
|
|
||||||
|
Cash and cash equivalents at end of year
|
$
|
189,326
|
|
$
|
252,836
|
|
$
|
255,961
|
|
|||
The accompanying notes are an integral part of these consolidated financial statements.
F- 6
|
GRANITE CONSTRUCTION INCORPORATED
|
||||||||||||
|
CONSOLIDATED STATEMENTS OF CASH FLOWS - (Continued)
|
||||||||||||
|
(
in thousands
)
|
||||||||||||
|
Years Ended December 31,
|
2016
|
2015
|
2014
|
|||||||||
|
Supplementary Information
|
|
|
||||||||||
|
Cash paid during the period for:
|
|
|
||||||||||
|
Interest
|
$
|
13,392
|
|
$
|
14,601
|
|
$
|
14,666
|
|
|||
|
Income taxes
|
29,872
|
|
4,298
|
|
2,326
|
|
||||||
|
Other non-cash activities:
|
||||||||||||
|
Performance guarantees
|
17,596
|
|
(10,306
|
)
|
21,332
|
|
||||||
|
Non-cash investing and financing activities:
|
||||||||||||
|
Restricted stock units issued, net of forfeitures (See Note 13)
|
$
|
21,101
|
|
$
|
6,220
|
|
$
|
6,514
|
|
|||
|
Accrued cash dividends
|
5,151
|
|
5,124
|
|
5,094
|
|
||||||
|
Accrued equipment purchases
|
(3,865
|
)
|
2,891
|
|
(3,704
|
)
|
||||||
The accompanying notes are an integral part of these consolidated financial statements.
F- 7
1. Summary of Significant Accounting Policies
Description of Business
: Granite Construction Incorporated is one of the largest diversified heavy civil contractors and construction materials producers in the United States, engaged in the construction and improvement of streets, roads, highways, mass transit facilities, airport infrastructure, bridges, trenchless and underground utilities, power-related facilities, utilities, tunnels, dams and other infrastructure-related projects. We have permanent offices located in Alaska, Arizona, California, Florida, Illinois, Nevada, New York, Texas, Utah and Washington. Unless otherwise indicated, the terms “we,” “us,” “our,” “Company” and “Granite” refer to Granite Construction Incorporated and its consolidated subsidiaries.
Principles of Consolidation
: The consolidated financial statements include the accounts of Granite Construction Incorporated and its wholly owned and majority owned subsidiaries. All material inter-company transactions and accounts have been eliminated. Additionally, we participate in various joint ventures (“joint ventures”). We consolidate these joint ventures where we have determined that through our participation we have a variable interest and are the primary beneficiary as defined by Financial Accounting Standards Board (“FASB”) Accounting Standards Codification (“ASC”) Topic 810,
Consolidation
, and related standards. The factors we use to determine the primary beneficiary of a variable interest entity (“VIE”) may include the decision authority of each partner, which partner manages the day-to-day operations of the project and the amount of our equity investment in relation to that of our partners. If we determine that the power to direct the significant activities is shared equally by two or more joint venture parties, then there is no primary beneficiary and no party consolidates the VIE.
Where we have determined we are not the primary beneficiary of a joint venture but do exercise significant influence, we account for our share of the operations of jointly controlled construction joint ventures on a pro rata basis in revenue and cost of revenue in the consolidated statements of operations and in equity in construction joint ventures on the consolidated balance sheets. We account for non-construction joint ventures under the equity method of accounting and include our share of the operations in equity in income from affiliates in the consolidated statements of operations and in investment in affiliates in the consolidated balance sheets. We have been divesting equity method investments in real estate affiliates as part of our 2010 Enterprise Improvement Plan (“EIP”).
Use of Estimates in the Preparation of Financial Statements
: The financial statements have been prepared in accordance with accounting principles generally accepted in the United States of America (“U.S. GAAP”). The preparation of these financial statements requires management to make estimates that affect the reported amounts of assets and liabilities, revenue and expenses, and related disclosure of contingent assets and liabilities. Our estimates and related judgments and assumptions are continually evaluated based on available information and experiences; however, actual amounts could differ from those estimates.
Revenue Recognition - Construction Contracts:
Revenue and earnings on construction contracts, including construction joint ventures, are recognized under the percentage of completion method using the ratio of costs incurred to estimated total costs.
Revenue from unapproved change orders is recognized to the extent the related costs have been incurred, the amount can be reliably estimated and recovery is probable.
Unresolved contract modifications and claims (“affirmative claims”) to recover additional costs to which the Company believes it is entitled under the terms of contracts with customers, subcontractors, vendors or others are pending or have been submitted on certain projects. The owners or their authorized representatives and/or other third parties may be in partial or full agreement with the modifications or affirmative claims, or may have rejected or disagree entirely or partially as to such entitlement.
Revenue related to affirmative claims with customers is recognized to the extent of costs incurred when it is probable that a claim settlement with a customer will result in additional revenue and the amount can be reasonably estimated. A reduction to costs related to affirmative claims with non-customers with whom we have a contractual arrangement (“back charges”) is recognized when the estimated recovery is probable and the amount can be reasonably estimated. Except for contractual back charges, a reduction to cost related to affirmative claims against non-customers is recognized when the claims are settled. Recognizing affirmative claims and back charge recoveries requires significant judgments of certain factors including, but not limited to, dispute resolution developments and outcomes, anticipated negotiation results, and the cost of resolving such matters.
F- 8
GRANITE CONSTRUCTION INCORPORATED
NOTES TO THE CONSOLIDATED FINANCIAL STATEMENTS - (Continued)
Provisions are recognized in the consolidated statements of operations for the full amount of estimated losses on uncompleted contracts whenever evidence indicates that the estimated total cost of a contract exceeds its estimated total revenue. All contract costs, including those associated with affirmative claims, back charges and change orders, are recorded as incurred and revisions to estimated total costs are reflected as soon as the obligation to perform is determined. Contract costs consist of direct costs on contracts, including labor and materials, amounts payable to subcontractors, direct overhead costs and equipment expense (primarily depreciation, fuel, maintenance and repairs). All state and federal government contracts and many of our other contracts provide for termination of the contract at the convenience of the party contracting with us, with provisions to pay us for work performed through the date of termination. Pre-contract costs are expensed as incurred.
The accuracy of our revenue and profit recognition in a given period depends on the accuracy of our estimates of the cost to complete each project. Cost estimates for all of our significant projects use a detailed “bottom up” approach, and we believe our experience allows us to create materially reliable estimates. There are a number of factors that can contribute to changes in estimates of contract cost and profitability. The most significant of these include:
|
•
|
the completeness and accuracy of the original bid;
|
|
•
|
costs associated with scope changes;
|
|
•
|
costs of labor and/or materials;
|
|
•
|
extended overhead and other costs due to owner, weather and other delays;
|
|
•
|
subcontractor performance issues;
|
|
•
|
changes in productivity expectations;
|
|
•
|
site conditions that differ from those assumed in the original bid (to the extent contract remedies are unavailable);
|
|
•
|
changes from original design on design-build projects;
|
|
•
|
the availability and skill level of workers in the geographic location of the project;
|
|
•
|
a change in the availability and proximity of equipment and materials;
|
|
•
|
our ability to fully and promptly recover on affirmative claims and back charges for additional contract costs; and
|
|
•
|
the customer’s ability to properly administer the contract.
|
The foregoing factors, as well as the stage of completion of contracts in process and the mix of contracts at different margins may cause fluctuations in gross profit between periods. Significant changes in cost estimates, particularly in our larger, more complex projects have had, and can in future periods have, a significant effect on our profitability.
Revenue Recognition - Materials:
Revenue from the sale of materials is recognized when delivery occurs and risk of ownership passes to the customer.
Balance Sheet Classifications:
Prepaid expenses and amounts receivable and payable under construction contracts (principally retentions) that may exist over the duration of the contract and could extend beyond one year are included in current assets and liabilities. A one-year time period is used as the basis for classifying all other current assets and liabilities.
Cash and Cash Equivalents
: Cash equivalents are securities having maturities of three months or less from the date of purchase. Included in cash and cash equivalents in the consolidated balance sheets as of
December 31, 2016
and
2015
, was
$73.1 million
and
$46.2 million
, respectively, related to our consolidated joint ventures. Our access to joint venture cash may be limited by the provisions of the venture agreements.
Costs and Estimated Earnings in Excess of Billings:
Costs and estimated earnings in excess of billings represent unbilled amounts earned and reimbursable under contracts. These amounts become billable according to the contract terms, which usually consider the passage of time, achievement of milestones or completion of the project. With the exception of customer affirmative claims, generally, such unbilled amounts will be billed and collected over the next twelve months. Settlement with the customer of outstanding affirmative claims is dependent on the claims resolution process and could extend beyond one year or the project operating cycle. Based on our historical experience, we generally consider the collection risk related to these amounts to be low. When events or conditions indicate that the amounts outstanding may become uncollectible, an allowance is estimated and recorded.
Marketable Securities
: We determine the classification of our marketable securities at the time of purchase and re-evaluate these determinations at each balance sheet date. Debt securities are classified as held-to-maturity when we have the positive intent and ability to hold the securities to maturity. Held-to-maturity investments are stated at amortized cost and are periodically assessed for other-than-temporary impairment. Amortized cost of debt securities is adjusted for amortization of premiums and accretion of discounts to maturity, and is included in interest income. The cost of securities redeemed or called is based on the specific identification method.
F- 9
GRANITE CONSTRUCTION INCORPORATED
NOTES TO THE CONSOLIDATED FINANCIAL STATEMENTS - (Continued)
Derivative Instruments:
We recognize derivative instruments as either assets or liabilities in the consolidated balance sheets at fair value using Level 2 inputs. To receive hedge accounting treatment, derivative instruments that are designated as cash flow hedges must be highly effective in offsetting changes to expected future cash flows on hedged transactions. The effective portion of the gain or loss on cash flow hedges is reported as a component of accumulated other comprehensive income (loss) and subsequently reclassified to interest expense in the consolidated statements of operations when the periodic hedged cash flows are settled. Adjustments to fair value on derivative instruments that do not qualify for hedge accounting treatment are reported through other (income) expense in the consolidated statements of operations. We do not enter into derivative instruments for speculative or trading purposes.
As further discussed in Note 4, in January 2016, we entered into an interest rate swap designed to convert the interest rate on borrowings under the Credit Agreement (defined in Note 11) from a variable to a fixed rate, which is designated as a cash flow hedge. In addition, in March 2014, we entered into an interest rate swap designed to convert the interest rate on our 2019 Notes (defined in Note 11) from a fixed rate to a variable rate that does not qualify for hedge accounting, which we terminated in December 2016 (see Note 4 for further discussion).
Fair Value of Financial Assets and Liabilities:
We measure and disclose certain financial assets and liabilities at fair value. ASC Topic 820,
Fair Value Measurements and Disclosures,
defines fair value as the exchange price that would be received for an asset or paid to transfer a liability (an exit price) in the principal or most advantageous market for the asset or liability in an orderly transaction between market participants on the measurement date. ASC Topic 820 also establishes a fair value hierarchy which requires an entity to maximize the use of observable inputs and minimize the use of unobservable inputs when measuring fair value. The standard describes three levels of inputs that may be used to measure fair value:
Level 1 - Quoted prices in active markets for identical assets or liabilities.
Level 2 - Observable inputs other than Level 1 prices such as quoted prices for similar assets or liabilities; quoted prices in markets that are not active; or other inputs that are observable or can be corroborated by observable market data for substantially the full term of the assets or liabilities.
Level 3 - Unobservable inputs that are supported by little or no market activity and that are significant to the fair value of the assets or liabilities.
We utilize the active market approach to measure fair value for our financial assets and liabilities. We report separately each class of assets and liabilities measured at fair value on a recurring basis and include assets and liabilities that are disclosed but not recorded at fair value in the fair value hierarchy.
The carrying value of marketable securities approximates their fair value as determined by market quotes. Rates currently available to us for debt with similar terms and remaining maturities are used to estimate the fair value of existing debt. The carrying value of receivables and other amounts arising out of normal contract activities, including retentions, which may be settled beyond one year, is estimated to approximate fair value.
Concentrations of Credit Risk and Other Risks:
Financial instruments, which potentially subject us to concentrations of credit risk, consist primarily of cash and cash equivalents, short-term and long-term marketable securities, and accounts receivable. We maintain our cash and cash equivalents and our marketable securities with several financial institutions. We invest with high credit quality financial institutions and, by policy, limit the amount of credit exposure to any one financial institution.
Our receivables are from customers concentrated in the United States, and we have no material receivables from foreign operations as of December 31, 2016 or 2015. We perform ongoing credit evaluations of our customers and generally do not require collateral, although the law provides us the ability to file mechanics’ liens on real property improved for private customers in the event of non-payment by such customers. We maintain an allowance for doubtful accounts which has historically been within management’s estimates.
Inventories:
Inventories consist primarily of quarry products valued at the lower of average cost or market. We write down the inventories based on estimated quantities of materials on hand in excess of approximately one year of demand. At December 31, 2016 and 2015, inventory also included materials specifically related to a project in our Kenny Large Project Construction operating group and was valued at cost.
Real Estate Held for Development and Sale:
Each real estate development project accounted for under the equity method of accounting is reviewed in accordance with ASC Topic 323,
Investments - Equity Method and Joint Ventures.
These projects are evaluated for impairment using the other-than-temporary impairment model, which requires an impairment charge to be recognized if our investment’s carrying amount exceeds its fair value, and the decline in fair value is deemed to be other than temporary.
F- 10
GRANITE CONSTRUCTION INCORPORATED
NOTES TO THE CONSOLIDATED FINANCIAL STATEMENTS - (Continued)
Events or changes in circumstances, which would cause us to review undiscounted future cash flows include, but are not limited to:
|
•
|
significant decreases in the market price of the asset;
|
|
•
|
significant adverse changes in legal factors or the business climate;
|
|
•
|
significant changes to the development or business plans of a project;
|
|
•
|
accumulation of costs significantly in excess of the amount originally expected for the acquisition, development or construction of the asset; and
|
|
•
|
current period cash flow or operating losses combined with a history of losses, or a forecast of continuing losses associated with the use of the asset.
|
Future undiscounted cash flows and fair value assessments are estimated based on entitlement status, market conditions, cost of construction, debt load, development schedules, status of joint venture partners and other factors applicable to the specific project. Fair value is estimated based on the expected future cash flows attributable to the asset or group of assets and on other assumptions that market participants would use in determining fair value, such as market discount rates, transaction prices for other comparable assets, and other market data. Our estimates of cash flows may differ from actual cash flows due to, among other things, fluctuations in interest rates, decisions made by jurisdictional agencies, economic conditions, or changes to our business operations.
Property and Equipment
: Property and equipment are stated at cost. Depreciation for construction and other equipment is primarily provided using accelerated methods over lives ranging from
three
to
seven
years, and the straight-line method over lives from
three
to
twenty
years for the remaining depreciable assets. We believe that accelerated methods best approximate the service provided by the construction and other equipment. Depletion of quarry property is based on the usage of depletable reserves. We frequently sell property and equipment that has reached the end of its useful life or no longer meets our needs, including depleted quarry property. At the time that an asset or an asset group meets the held-for-sale criteria as defined by ASC Topic 360,
Property, Plant, and Equipment,
we write it down to fair value, if the fair value is below the carrying value. Fair value is estimated by a variety of factors including, but not limited to, market comparative data, historical sales prices, broker quotes and third party valuations. If material, such property is separately disclosed, otherwise it is held in property and equipment until sold. The cost and accumulated depreciation or depletion of property sold or retired is removed from the balance sheet and the resulting gains or losses, if any, are reflected in operating income (loss) for the period. In the case that we abandon an asset, an amount equal to the carrying amount of the asset, less salvage value, if any, will be recognized as expense in the period that the asset was abandoned. Repairs and maintenance are charged to operations as incurred.
Costs related to the development of internal-use software during the preliminary project and post-implementation stages are expensed as incurred. Costs incurred during the application development stage are capitalized. These costs consist primarily of software, hardware and consulting fees, as well as salaries and related costs. Amounts capitalized are reported as a component of office furniture and equipment within property and equipment. Capitalized software costs are depreciated using the straight-line method over the estimated useful life of the related software, which range from
three
to
seven
years. During the years ended
December 31,
2016
,
2015
and
2014
, we capitalized
$6.6 million
,
$2.3 million
and
$4.1 million
, respectively, of internal-use software development and related hardware costs.
Long-lived Assets:
We review property and equipment and amortizable intangible assets for impairment at an asset group level whenever events or changes in circumstances indicate the net book value of an asset group may not be recoverable. Recoverability of these asset groups is measured by comparison of their net book values to the future undiscounted cash flows the asset groups are expected to generate. If the asset groups are considered to be impaired, an impairment charge will be recognized equal to the amount by which the net book value of the asset groups exceed their fair value. We group construction and plant equipment assets at a regional level, which represents the lowest level for which identifiable cash flows are largely independent of the cash flows of other groups of assets. When an individual asset or group of assets is determined to no longer contribute to the vertically integrated asset group, it is assessed for impairment independently.
Amortizable intangible assets include covenants not to compete, acquired backlog, permits, trade names and customer lists which are being amortized on a straight-line basis over terms from one to thirty years.
F- 11
GRANITE CONSTRUCTION INCORPORATED
NOTES TO THE CONSOLIDATED FINANCIAL STATEMENTS - (Continued)
Capitalized Interest:
Interest, to the extent it is incurred in connection with the construction of certain self-constructed assets and real estate development projects, is capitalized and recorded as part of the asset to which it relates. Capitalized interest on self-constructed assets is amortized over their estimated useful lives and is expensed on real estate projects as they are sold.
Goodwill:
As of
December 31, 2016
and 2015, we had five reporting units in which goodwill was recorded as follows:
|
•
|
Kenny Group Construction
|
|
•
|
Kenny Group Large Project Construction
|
|
•
|
Northwest Group Construction
|
|
•
|
Northwest Group Construction Materials
|
|
•
|
California Construction
|
The most significant goodwill balances reside in the reporting units associated with the Kenny Group. See Note 9 for balances by reportable segment.
We perform impairment tests annually as of November 1 and more frequently when events and circumstances occur that indicate a possible impairment of goodwill. In addition, we evaluate goodwill for impairment if events or circumstances change between annual tests indicating a possible impairment. Examples of such events or circumstances include the following:
|
•
|
a significant adverse change in legal factors or in the business climate;
|
|
•
|
an adverse action or assessment by a regulator;
|
|
•
|
a more likely than not expectation that a segment or a significant portion thereof will be sold; or
|
|
•
|
the testing for recoverability of a significant asset group within the segment.
|
In performing step one of the goodwill impairment tests, we calculate the estimated fair value of the reporting unit in which the goodwill is recorded using the discounted cash flows and market multiple methods. Judgments inherent in these methods include the determination of appropriate discount rates, the amount and timing of expected future cash flows and growth rates, and appropriate benchmark companies. The cash flows used in our 2016 discounted cash flow model were based on five-year financial forecasts, which in turn were based on the 2017-2019 operating plan developed internally by management adjusted for market participant based assumptions. Our discount rate assumptions are based on an assessment of the equity cost of capital and appropriate capital structure for our reporting units. In assessing the reasonableness of our determined fair values of our reporting units, we evaluate the reasonableness of our results against our current market capitalization.
The estimated fair value is compared to the net book value of the reporting unit, including goodwill. If the net book value of a reporting unit exceeds its fair value, we measure and record the amount of the impairment loss by comparing the implied fair value of the reporting unit’s goodwill with the carrying amount of that goodwill.
The results of our annual goodwill impairment tests, performed in accordance with ASC 350,
Intangibles - Goodwill and Other,
indicated that the estimated fair values of our reporting units exceeded their net book values (i.e., cushion) by at least 50% for the reporting units with goodwill. Out of the five reporting units with goodwill, the Kenny Large Project Construction business is the most susceptible to fluctuations in results depending on awarded work given the large size and limited frequency of awards. While we believe the current cushion for the reporting unit is adequate to absorb these fluctuations, a material decline in job win rates could have a material impact to this reporting unit’s estimated fair value.
Billings in Excess of Costs and Estimated Earnings:
Billings in excess of costs and estimated earnings is comprised of cash collected from customers and billings to customers on contracts in advance of work performed, including advance payments negotiated as a contract condition. Generally, unearned project-related costs will be earned over the next twelve months.
F- 12
GRANITE CONSTRUCTION INCORPORATED
NOTES TO THE CONSOLIDATED FINANCIAL STATEMENTS - (Continued)
Asset Retirement and Reclamation Obligations:
We account for the costs related to legal obligations to reclaim aggregate mining sites and other facilities by recording our estimated reclamation liability at fair value, capitalizing the estimated liability as part of the related asset’s carrying amount and allocating it to expense over the asset’s useful life. To determine the fair value of the obligation, we estimate the cost for a third-party to perform the legally required reclamation including a reasonable profit margin. This cost is then increased for future estimated inflation based on the estimated years to complete and discounted to fair value using present value techniques with a credit-adjusted, risk-free rate. In estimating the settlement date, we evaluate the current facts and conditions to determine the most likely settlement date.
We review reclamation obligations at least annually for a revision to the cost or a change in the estimated settlement date. Additionally, reclamation obligations are reviewed in the period that a triggering event occurs that would result in either a revision to the cost or a change in the estimated settlement date.
Warranties:
Many of our construction contracts contain warranty provisions covering defects in equipment, materials, design or workmanship that generally run from six months to one year after our customer accepts the contract. Because of the nature of our projects, including contract owner inspections of the work both during construction and prior to acceptance, we have not experienced material warranty costs for these short-term warranties and, therefore, do not believe an accrual for these costs is necessary. Certain construction contracts carry longer warranty periods, ranging from two to ten years, for which we have accrued an estimate of warranty cost. The warranty liability is estimated based on our experience with the type of work and any known risks relative to the project and was not material as of December 31,
2016
and
2015
.
Accrued Insurance Costs:
We carry insurance policies to cover various risks, primarily general liability, automobile liability, workers compensation and employee medical expenses, under which we are liable to reimburse the insurance company for a portion of each claim paid. The amounts for which we are liable for general liability and workers compensation generally range from the first
$0.5 million
to
$1.0 million
per occurrence. We accrue for probable losses, both reported and unreported, that are reasonably estimable using actuarial methods based on historic trends modified, if necessary, by recent events. Changes in our loss assumptions caused by changes in actual experience would affect our assessment of the ultimate liability and could have an effect on our operating results and financial position up to
$1.0 million
per occurrence for general liability and workers compensation or
$0.3 million
for medical insurance.
Performance Guarantees:
Agreements with our joint venture partners (“partner(s)”) for both construction joint ventures and line item joint ventures define each partner’s management role and financial responsibility in the project. The amount of operational exposure is generally limited to our stated ownership interest. However, due to the joint and several nature of the performance obligations under the related owner contracts, if one of the partners fails to perform, we and the remaining partners, if any, would be responsible for performance of the outstanding work (i.e., we provide a performance guarantee). We estimate our liability for performance guarantees for our unconsolidated construction joint ventures and line item joint ventures using estimated partner bond rates and include them in accrued expenses and other current liabilities (see Note 10) with a corresponding increase in equity in construction joint ventures in the consolidated balance sheets. We reassess our liability when and if changes in circumstances occur. The liability and corresponding asset are removed from the consolidated balance sheets upon customer acceptance of the project. Circumstances that could lead to a loss under these agreements beyond our stated ownership interest include the failure of a partner to contribute additional funds to the venture in the event the project incurs a loss or additional costs that we could incur should a partner fail to provide the services and resources that it had committed to provide in the agreement.
Contingencies:
We are currently involved in various claims and legal proceedings. Loss contingency provisions are recorded if the potential loss from any asserted or unasserted claim or legal proceeding is considered probable and the amount can be reasonably estimated. If a potential loss is considered probable but only a range of loss can be determined, the low-end of the range is recorded. These accruals represent management’s best estimate of probable loss. Disclosure is also provided when it is reasonably possible that a loss will be incurred or when it is reasonably possible that the amount of a loss will exceed the amount recorded. Significant judgment is required in both the determination of probability of loss and the determination as to whether an exposure is reasonably estimable. Because of uncertainties related to these matters, accruals are based only on the best information available at the time. As additional information becomes available, we reassess the potential liability related to claims and litigation and may revise our estimates. See Note 17 of “Notes to the Consolidated Financial Statements” and “Item 3. Legal Proceedings” for additional information.
Stock-Based Compensation:
We measure and recognize compensation expense, net of estimated forfeitures, over the requisite vesting periods for all stock-based payment awards made. Stock-based compensation is included in selling, general and administrative expenses and cost of revenue on our consolidated statements of operations.
F- 13
GRANITE CONSTRUCTION INCORPORATED
NOTES TO THE CONSOLIDATED FINANCIAL STATEMENTS - (Continued)
Restructuring and Impairment (Gains) Charges:
Pursuant to an approved plan, we record severance costs when an employee has been notified, unless the employee provides future service, in which case severance costs are expensed ratably over the future service period. Other restructuring costs are recognized when the liability is incurred. Costs associated with terminating a lease contract are recorded at the contract termination date, in accordance with contract terms, or on the cease-use date, net of estimated sublease income, if applicable. In determining the amount related to termination of a lease, various assumptions are used including the time period over which facilities will be vacant, expected sublease term and sublease rates. These assumptions may be adjusted upon the occurrence of future events. Asset impairment analyses resulting from restructuring events are performed in accordance with ASC subtopic 360-10,
Property, Plant and Equipment
. See the
Property and Equipment and Long-lived Assets
accounting policies above for further information on asset impairment charges. During the years ended
December 31, 2016
, 2015 and 2014 we recorded net restructuring and impairment gains of
$1.9 million
,
$6.0 million
(including amounts attributable to non-controlling interests of
$3.3 million
) and
$1.3 million
, respectively, related to our EIP. In addition, during the year ended December 31, 2014, we recorded a
$1.3 million
impairment gain associated with the sale of a previously impaired quarry site.
Income Taxes
: Deferred taxes are provided on a liability method whereby deferred tax assets are recognized for deductible temporary differences and operating loss carry-forwards and deferred tax liabilities are recognized for taxable temporary differences. Temporary differences are the differences between the reported amounts of assets and liabilities in the consolidated financial statements and their respective tax bases. Deferred tax assets are reduced by a valuation allowance when, in the opinion of management, it is more likely than not that some or all of the deferred tax assets will not be realized. Deferred tax assets and liabilities are adjusted for the effects of changes in tax laws and rates on the date of enactment.
We report a liability in other long-term liabilities in the consolidated balance sheets for unrecognized tax benefits resulting from uncertain tax positions taken or expected to be taken in a tax return. We recognize interest and penalties, if any, related to unrecognized tax benefits in other expense (income) in the consolidated statements of operations.
Computation of Earnings Per Share
: Basic net income per share is computed using the weighted-average number of common shares outstanding during the period. Diluted net income per share is computed using the weighted-average number of common shares and dilutive potential common shares outstanding during the period. Potential common shares include stock options and restricted stock units, under the 2012 Equity Incentive Plan.
Reclassifications
: Certain reclassifications of prior period amounts have been made to conform to the current period presentation. These reclassifications included
$3.5 million
and
$2.5 million
during the years ended December 31, 2015 and 2014, respectively, of restricted stock unit amortization from general and administration expenses to cost of revenue to align it with the associated salaries.
Recently Issued Accounting Pronouncements:
In May 2014, the FASB issued ASC Topic 606,
Revenue from Contracts with Customers
, and subsequently issued several related Accounting Standards Updates (“ASUs”) (“Topic 606”), which provide guidance for recognizing revenue from contracts with customers. The core principle of Topic 606 is that revenue will be recognized when promised goods or services are transferred to customers in an amount that reflects consideration for which entitlement is expected in exchange for those goods or services. Topic 606 will be effective commencing with our quarter ending March 31, 2018. We currently anticipate adopting Topic 606 using the modified retrospective transition approach that may result in a cumulative adjustment to beginning retained earnings as of January 1, 2018, which we will elect to only apply to contracts with customers that are not substantially complete as of January 1, 2018.
F- 14
GRANITE CONSTRUCTION INCORPORATED
NOTES TO THE CONSOLIDATED FINANCIAL STATEMENTS - (Continued)
Although we are in the process of assessing the impact of Topic 606 on our consolidated financial statements and related footnotes, we do not expect Topic 606 to have a material impact on our Construction Materials segment’s revenue. While we continue to assess the impact to both our Large Project Construction and Construction segments, our Large Project Construction segment is more likely to be impacted than our Construction segment in the following areas:
|
•
|
Multiple performance obligations - In accordance with Topic 606, construction contracts with customers, including those related to contract modifications, will be reviewed to determine if there are multiple performance obligations. If separate performance obligations are identified, the timing of revenue recognition could be impacted. Based on our assessment to-date on currently active construction contracts with customers, there is the potential that a few construction contracts will have multiple performance obligations.
|
|
•
|
Mobilization costs - Mobilization costs generally consist of costs to mobilize equipment and labor to a job site. Mobilization costs are currently recorded as job costs as they are incurred. Topic 606 requires mobilization costs to be capitalized as an asset on the consolidated balance sheets and amortized to contract cost over the expected duration of the contract.
|
|
•
|
Significant permanent materials - Significant permanent materials are prefabricated custom components purchased from a third party that require no modification, only installation. Significant permanent materials are currently recorded as job costs with revenue including profit. While Topic 606 still requires significant permanent materials to be recorded as job cost, revenue will only be equal to cost.
|
In addition to the above, we are expecting to have certain reclassifications in the consolidated balance sheets as well as significant additional disclosures related to revenue.
In January 2016, the FASB issued ASU No. 2016-01,
Financial Instruments - Overall (Subtopic 825-10): Recognition and Measurement of Financial Assets and Financial Liabilities,
which, among other things, eliminates the requirement to disclose the method(s) and significant assumptions used to estimate the fair value that is required to be disclosed for financial instruments measured at amortized cost on the balance sheet. This ASU will be effective commencing with our quarter ending March 31, 2017. We do not expect the adoption of this ASU to have a material impact on our consolidated financial statements.
In February 2016, the FASB issued ASU No. 2016-02,
Leases
(Topic 842),
which requires lessees to recognize the following for all leases (with the exception of short-term leases) at the commencement date: (a) a lease liability, which is a lessee’s obligation to make lease payments arising from a lease, measured on a discounted basis; and (b) a right-of-use asset, which is an asset that represents the lessee’s right to use, or control the use of, a specified asset for the lease term. The ASU will be effective commencing with our quarter ending March 31, 2019. We are currently assessing the potential impact of this ASU on our consolidated financial statements.
In March 2016, the FASB issued ASU No. 2016-05,
Derivatives and Hedging (Topic 815): Effect of Derivative Contract Novations on Existing Hedge Accounting Relationships,
which
clarifies that a change in the counterparty to a derivative instrument that has been designated as a hedging instrument does not, in and of itself, require de-designation of that hedging relationship provided that all other hedge accounting criteria continue to be met. This ASU will be effective commencing with our quarter ending March 31, 2017. We do not expect any changes in the counterparty to our cash flow hedge and, therefore, do not expect the adoption of this ASU to have a material impact on our consolidated financial statements.
In June 2016, the FASB issued ASU No. 2016-13,
Financial Instruments - Credit Losses (Topic 326): Measurement of Credit Losses on Financial Instruments.
The ASU requires the measurement of all expected credit losses for financial assets held at the reporting date based on historical experience, current conditions, and reasonable and supportable forecasts. This ASU will be effective commencing with our quarter ending March 31, 2020. We do not expect the adoption of this ASU to have a material impact on our consolidated financial statements.
In August 2016, the FASB issued ASU No. 2016-15,
Statement of Cash Flows (Topic 230): Classification of Certain Cash Receipts and Cash Payments.
The amendments in this ASU clarify and provide specific guidance on eight cash flow classification issues that are not currently addressed by current U.S. GAAP. This ASU will be effective commencing with our quarter ending March 31, 2018. We do not expect the adoption of this ASU to have a material impact on our consolidated financial statements.
In October 2016, the FASB issued ASU No. 2016-16,
Intra-Entity Transfers of Assets Other Than Inventory.
The amendments in this ASU require the income tax consequences of an intra-entity transfer of an asset other than inventory to be recognized when the transfer occurs instead of when the asset is sold to an outside party. This ASU will be effective commencing with our quarter ending March 31, 2018. We are currently assessing the potential impact of this ASU on our consolidated financial statements.
F- 15
GRANITE CONSTRUCTION INCORPORATED
NOTES TO THE CONSOLIDATED FINANCIAL STATEMENTS - (Continued)
Recently Adopted Accounting Pronouncements:
In March 2016, the FASB issued ASU No. 2016-09,
Compensation - Stock Compensation (Topic 718): Improvements to Employe
e
Share-Based Payment Accounting
. This ASU identifies areas for simplification involving several aspects of accounting for share-based payment transactions, including the income tax consequences, classification of awards as either equity or liabilities, an option to recognize gross stock compensation expense with actual forfeitures recognized as they occur, as well as certain classifications on the statement of cash flows. During the quarter ended December 31, 2016, we elected to early adopt the ASU, effective January 1, 2016, which resulted in retrospective adjustments to the 2016 quarterly financial statements that are reflected in the “Quarterly Financial Data” section of this Form 10-K.
In August 2014, the FASB issued ASU No. 2014-15,
Disclosure of Uncertainties about an Entity’s Ability to Continue as a Going Concern,
which requires management to evaluate whether there are conditions or events that raise substantial doubt about the entity’s ability to continue as a going concern within one year after the date that the financial statements are issued. If conditions or events exist that raise substantial doubt about an entity’s ability to continue as a going concern, the guidance requires disclosure in the financial statements. The guidance was effective for our annual period ended December 31, 2016. During the year ended December 31, 2016, management assessed the Company’s ability to continue as a going concern as required and concluded there were no conditions that gave rise to substantial doubt about the ability to continue as a going concern; therefore, additional disclosures were not required.
2. Revisions in Estimates
Our profit recognition related to construction contracts is based on estimates of costs to complete each project. These estimates can vary significantly in the normal course of business as projects progress, circumstances develop and evolve, and uncertainties are resolved. When we experience significant changes in our estimates of costs to complete, we undergo a process that includes reviewing the nature of the changes to ensure that there are no material amounts that should have been recorded in a prior period rather than as revisions in estimates for the current period. In our review of these changes for the years ended
December 31, 2016
,
2015
and
2014
, we did not identify any material amounts that should have been recorded in a prior period. We use the cumulative catch-up method applicable to construction contract accounting to account for revisions in estimates. Under this method, revisions in estimates are accounted for in their entirety in the period of change. There can be no assurance that we will not experience further changes in circumstances or otherwise be required to revise our cost estimates in the future.
In the normal course of business, we have revisions in estimated costs associated with unresolved affirmative claims and back charges. The estimated or actual recovery related to these estimated costs may be recorded in future periods, which can cause fluctuations in the gross profit impact from revisions in estimates.
Revisions in estimates for the year ended December 31,
2016
and
2015
included increases in revenue of
$37.3 million
and
$48.5 million
, respectively, related to the estimated cost recovery of customer affirmative claims. Of these totals,
$25.4 million
and
$37.3 million
, were also affected by an increase in estimated contract costs that were in excess of the estimated recovery during the years ended December 31,
2016
and
2015
, respectively. For the remaining
$11.9 million
and
$11.2 million
, estimated contract costs in excess of estimated cost recovery were recorded in prior periods.
Revisions in estimates for the year ended December 31,
2016
and
2015
included reduction of cost of revenue of
$15.7 million
and
$7.0 million
, respectively, related to the estimated recovery of back charges. Of these totals,
$4.8 million
and
$0.5 million
were also affected by an increase in estimated contract costs that were in excess of the estimated recovery during the years ended December 31,
2016
and
2015
, respectively. For the remaining
$10.9 million
and
$6.5 million
, estimated contract costs in excess of estimated cost recovery were recorded in prior periods.
The impact to gross profit from significant revisions in estimates related to estimated and actual customer affirmative claims and recovery of back charges as well as the associated estimated contract costs are included in the tables below.
F- 16
GRANITE CONSTRUCTION INCORPORATED
NOTES TO THE CONSOLIDATED FINANCIAL STATEMENTS - (Continued)
Construction
The net changes in project profitability from revisions in estimates, both increases and decreases, which individually had an impact of $1.0 million or more on gross profit were net increases of
$1.3 million
and
$19.9 million
and a net decrease of
$7.3 million
for the years ended
December 31, 2016
,
2015
and
2014
, respectively. The projects are summarized as follows (dollars in millions):
Increases
|
Years Ended December 31,
|
2016
|
2015
|
2014
|
|||||||||
|
Number of projects with upward estimate changes
|
7
|
|
14
|
|
7
|
|
||||||
|
Range of increase in gross profit from each project, net
|
$
|
1.1 - 4.8
|
|
$
|
1.1 - 6.6
|
|
$
|
1.0 - 1.8
|
|
|||
|
Increase on project profitability
|
$
|
14.2
|
|
$
|
30.7
|
|
$
|
9.2
|
|
|||
The increases during the years ended
December 31, 2016
,
2015
and
2014
were due to lower costs and higher productivity than originally anticipated and owner directed scope changes. The 2016 and
2015
increases were also due to estimated cost recovery from affirmative claims and settlements of outstanding issues with contract owners in
2015
.
Decreases
|
Years Ended December 31,
|
2016
|
2015
|
2014
|
|||||||||
|
Number of projects with downward estimate changes
|
7
|
|
5
|
|
6
|
|
||||||
|
Range of reduction in gross profit from each project, net
|
$
|
1.0 - 3.9
|
|
$
|
1.0 - 3.3
|
|
$
|
1.6 - 4.1
|
|
|||
|
Decrease on project profitability
|
$
|
12.9
|
|
$
|
10.8
|
|
$
|
16.5
|
|
|||
The decreases during the years ended
December 31, 2016
, 2015 and 2014 were due to additional costs and lower productivity than originally anticipated. The
2014
decreases were also due to increases in estimated cost to complete from outstanding affirmative claims and change orders.
Large Project Construction
The net changes in project profitability from revisions in estimates, both increases and decreases, which individually had an impact of $1.0 million or more on gross profit were a net decrease of
$13.5 million
and net increases of
$7.6 million
and
$46.9 million
for the years ended
December 31, 2016
,
2015
and
2014
, respectively. Amounts attributable to non-controlling interests were
$4.3 million
of the net decrease,
$3.0 million
and
$9.5 million
of the net increases for the years ended
December 31, 2016
, and
2015
and
2014
, respectively. The projects are summarized as follows (dollars in millions):
Increases
|
Years Ended December 31,
|
2016
|
2015
|
2014
|
|||||||||
|
Number of projects with upward estimate changes
|
8
|
|
7
|
|
12
|
|
||||||
|
Range of increase in gross profit from each project, net
|
$
|
1.2 - 6.5
|
|
$
|
1.5 - 6.7
|
|
$
|
1.0 - 15.2
|
|
|||
|
Increase on project profitability
|
$
|
27.2
|
|
$
|
27.9
|
|
$
|
66.8
|
|
|||
The increases during the year ended
December 31, 2016
were due to higher productivity and lower costs than anticipated, as well as estimated cost recovery from and settlement of affirmative claims and back charges. The increases during the year ended
December 31, 2015
were due to owner-directed scope changes and lower costs than anticipated, as well as estimated cost recovery from affirmative claims. The increases during the year ended
December 31, 2014
were due to higher productivity than originally anticipated, owner-directed scope changes and the settlement of outstanding affirmative claims with contract owners.
Decreases
|
Years Ended December 31,
|
2016
|
2015
|
2014
|
|||||||||
|
Number of projects with downward estimate changes
|
5
|
|
6
|
|
3
|
|
||||||
|
Range of reduction in gross profit from each project, net
|
$
|
1.3 - 13.6
|
|
$
|
1.0 - 5.5
|
|
$
|
1.1 - 16.8
|
|
|||
|
Decrease on project profitability
|
$
|
40.7
|
|
$
|
20.3
|
|
$
|
19.9
|
|
|||
The decreases during the years ended December 31,
2016
,
2015
and
2014
were primarily due to additional owner, subcontractor and designer related costs and lower productivity than originally anticipated.
F- 17
GRANITE CONSTRUCTION INCORPORATED
NOTES TO THE CONSOLIDATED FINANCIAL STATEMENTS - (Continued)
3. Marketable Securities
All marketable securities were classified as held-to-maturity as of the dates presented and the carrying amounts of held-to-maturity securities were as follows (in thousands):
|
December 31,
|
2016
|
2015
|
||||||
|
U.S. Government and agency obligations
|
$
|
10,002
|
|
$
|
15,051
|
|
||
|
Commercial paper
|
54,882
|
|
9,992
|
|
||||
|
Total short-term marketable securities
|
64,884
|
|
25,043
|
|
||||
|
U.S. Government and agency obligations
|
62,895
|
|
80,652
|
|
||||
|
Total long-term marketable securities
|
62,895
|
|
80,652
|
|
||||
|
Total marketable securities
|
$
|
127,779
|
|
$
|
105,695
|
|
||
Scheduled maturities of held-to-maturity investments were as follows (in thousands):
|
December 31, 2016
|
|
||
|
Due within one year
|
$
|
64,884
|
|
|
Due in one to five years
|
62,895
|
|
|
|
Total
|
$
|
127,779
|
|
4. Fair Value Measurement
The following tables summarize significant assets and liabilities measured at fair value in the consolidated balance sheets on a recurring basis for each of the fair value levels (in thousands):
|
Fair Value Measurement at Reporting Date Using
|
||||||||||||||||
|
December 31, 2016
|
Level 1
|
Level 2
|
Level 3
|
Total
|
||||||||||||
|
Cash equivalents
|
|
|
|
|
|
|
|
|
||||||||
|
Money market funds
|
$
|
10,057
|
|
$
|
—
|
|
$
|
—
|
|
$
|
10,057
|
|
||||
|
Total assets
|
$
|
10,057
|
|
$
|
—
|
|
$
|
—
|
|
$
|
10,057
|
|
||||
|
Fair Value Measurement at Reporting Date Using
|
||||||||||||||||
|
December 31, 2015
|
Level 1
|
Level 2
|
Level 3
|
Total
|
||||||||||||
|
Cash equivalents
|
|
|
|
|
|
|
|
|
||||||||
|
Money market funds
|
$
|
62,024
|
|
$
|
—
|
|
$
|
—
|
|
$
|
62,024
|
|
||||
|
Total assets
|
$
|
62,024
|
|
$
|
—
|
|
$
|
—
|
|
$
|
62,024
|
|
||||
A reconciliation of cash equivalents to consolidated cash and cash equivalents is as follows (in thousands):
|
December 31,
|
2016
|
2015
|
||||||
|
Cash equivalents
|
$
|
10,057
|
|
$
|
62,024
|
|
||
|
Cash
|
|
179,269
|
|
|
190,812
|
|
||
|
Total cash and cash equivalents
|
$
|
189,326
|
|
$
|
252,836
|
|
||
F- 18
GRANITE CONSTRUCTION INCORPORATED
NOTES TO THE CONSOLIDATED FINANCIAL STATEMENTS - (Continued)
Derivatives
In March 2014, we entered into two diesel commodity swaps covering the periods from May 2014 to October 2014 and from May 2015 to October 2015 which represented roughly 25% of our forecasted purchases for diesel during these periods. In May 2014, we entered into two natural gas commodity swaps covering the periods from June 2014 to October 2014 and from May 2015 to October 2015 representing roughly 25% of our forecasted purchases of natural gas during these periods. These commodity swaps were settled in October 2015 and gains or losses, including net periodic settlement amounts, were recorded in other income, net in our consolidated statements of operations. During the years ended December 31,
2015
and 2014, we recorded net losses of
$0.4 million
and
$2.0 million
, respectively.
Interest Rate Swaps
In March 2014, we entered into an interest rate swap with a notional amount of
$100.0 million
with a maturity date of June 2018 designed to convert the interest rate of our 2019 Notes (defined in Note 11) from a fixed rate of
6.11%
to a variable rate of
4.15%
plus six-month LIBOR. We terminated the interest rate swap in December 2016 due to the possibility of increasing interest rates. The interest rate swap is reported at fair value using Level 2 inputs in the consolidated balance sheets. Gains or losses, including net periodic settlement amounts, are recorded in other income, net, in our consolidated statements of operations. During the years ended
December 31, 2016
,
2015
and
2014
, we recorded net gains of
$0.3 million
,
$1.5 million
and
$1.4 million
, respectively. The associated balance was recorded in other current assets in the consolidated balance sheets and was
$0.6 million
as of December 31,
2015
.
In January 2016, we entered into an interest rate swap designated as a cash flow hedge with an effective date of April 2016 and an initial notional amount of
$98.8 million
which matures in October 2020. The interest rate swap is designed to convert the interest rate on the term loan described in Note 11 from a variable rate of interest of LIBOR plus an applicable margin to a fixed rate of
1.47%
plus the same applicable margin. The interest rate swap is reported at fair value using Level 2 inputs in the consolidated balance sheets. Gains or losses on the effective portion are initially reported as a component of accumulated other comprehensive income (loss) and subsequently reclassified to interest expense in the consolidated statements of operations when the quarterly hedged interest payment is settled. As of
December 31, 2016
, the fair value of the cash flow hedge was
$0.8 million
and was included in other current assets in the consolidated balance sheets. During the year ended
December 31, 2016
, the unrealized gain, net of taxes, on the effective portion was
$0.2 million
and was reported as a component of accumulated other comprehensive income (loss). During the year ended
December 31, 2016
, there was no ineffective portion and the interest expense reclassified from accumulated other comprehensive loss was
$0.3 million
. We estimate
$0.3 million
to be reclassified from accumulated other comprehensive income into pre-tax earnings within the next twelve months.
The carrying values and estimated fair values of our financial instruments that are not required to be recorded at fair value in the consolidated balance sheets are as follows (in thousands):
|
December 31,
|
2016
|
2015
|
||||||||||||||||
|
Fair Value Hierarchy
|
Carrying Value
|
Fair Value
|
Carrying Value
|
Fair Value
|
||||||||||||||
|
Assets:
|
|
|
|
|
|
|||||||||||||
|
Held-to-maturity marketable securities
|
Level 1
|
$
|
127,779
|
|
$
|
127,365
|
|
$
|
105,695
|
|
$
|
105,336
|
|
|||||
|
Liabilities (including current maturities):
|
||||||||||||||||||
|
Senior notes payable
1
|
Level 3
|
$
|
120,000
|
|
$
|
124,654
|
|
$
|
160,000
|
|
$
|
165,731
|
|
|||||
|
Credit Agreement term loan
1
|
Level 3
|
$
|
95,000
|
|
$
|
93,991
|
|
$
|
100,000
|
|
$
|
99,375
|
|
|||||
|
Credit Agreement - revolving credit facility
1
|
Level 3
|
$
|
30,000
|
|
$
|
29,452
|
|
$
|
—
|
|
$
|
—
|
|
|||||
1
The fair values of the senior notes payable and Credit Agreement (defined in Note 11) loan are based on borrowing rates available to us for long-term loans with similar terms, average maturities, and credit risk.
We measure certain nonfinancial assets and liabilities at fair value on a nonrecurring basis, at least annually. As of
December 31, 2016
and
2015
, the nonfinancial assets and liabilities included our asset retirement and reclamation obligations, as well as assets and corresponding liabilities associated with performance guarantees.
F- 19
GRANITE CONSTRUCTION INCORPORATED
NOTES TO THE CONSOLIDATED FINANCIAL STATEMENTS - (Continued)
Fair value for the asset retirement and reclamation obligations were measured using Level 3 inputs and performance guarantees were measured using Level 2 inputs. Asset retirement and reclamation obligations were initially measured using internal discounted cash flow calculations based upon our estimates of future retirement costs - see Note 8 for details of the asset retirement balances and Note 1 for further discussion on fair value measurements. Performance guarantees were measured using estimated partner bond rates - see Note 10 for the liability balances and Note 1 for further discussion on performance guarantees.
During the years ended
December 31, 2016
,
2015
and
2014
, fair value adjustments to our nonfinancial assets and liabilities were related to our asset retirement and reclamation obligations, restructuring gains associated with our EIP and non-cash impairment gains separate from our EIP, and are detailed as follows:
|
•
|
Asset retirement obligations adjustments were
$2.1 million
,
$0.2 million
and
$3.0 million
, respectively. See Note 8 for further information.
|
|
•
|
Restructuring gains associated with our EIP were
$1.9 million
,
$6.0 million
and
$1.3 million
, during the years ended
December 31, 2016
, 2015 and 2014, respectively, primarily associated with the sale of a real estate asset related to our equity method investments, the sale of a previously impaired consolidated real estate asset and the release of lease obligations.
|
|
•
|
Non-cash impairment gains were
$1.3 million
during 2014 and were associated with the sale of a previously impaired quarry site.
|
5. Receivables, net (in thousands)
|
December 31,
|
2016
|
2015
|
||||||
|
Construction contracts:
|
|
|
||||||
|
Completed and in progress
|
$
|
288,160
|
|
$
|
206,756
|
|
||
|
Retentions
|
84,878
|
|
91,670
|
|
||||
|
Total construction contracts
|
373,038
|
|
298,426
|
|
||||
|
Construction material sales
|
29,357
|
|
28,727
|
|
||||
|
Other
|
17,523
|
|
14,033
|
|
||||
|
Total gross receivables
|
419,918
|
|
341,186
|
|
||||
|
Less: allowance for doubtful accounts
|
573
|
|
364
|
|
||||
|
Total net receivables
|
$
|
419,345
|
|
$
|
340,822
|
|
||
Receivables include amounts billed and billable to clients for services provided as of the end of the applicable period and except for escrow receivables, do not bear interest. To the extent costs are not contractually billable or have not been earned, such as claim recovery estimates, the associated revenue is included in costs and estimated earnings in excess of billings or billings
i
n excess of costs and estimated earnings, respectively, in the consolidated balance sheets. As of December 31, 2016 and 2015, the aggregate claim recovery estimates included in these balances were approximately
$12.3 million
and
$8.8 million
, respectively. Included in other receivables at
December 31, 2016
and
2015
were items such as estimated recovery from back charge claims, notes receivable, fuel tax refunds, receivables from vendors and income tax refunds. No such receivables individually exceeded 10% of total net receivables at any of these dates. As of
December 31, 2016
and
2015
, the estimated recovery from back charge claims included in Other receivables was
$0.3 million
and
$6.5 million
, respectively.
During the year ended
December 31, 2016
, our largest volume customer, including both prime and subcontractor arrangements, was the
California Department of Transportation
(“
Caltrans
”). Revenue recognized from contracts with
Caltrans
during
2016
represented
$222.4 million
(
8.8%
of our total revenue) of which
$173.4 million
(
12.7%
of segment revenue) was in the Construction segment and
$48.7 million
(
5.5%
of segment revenue) in the Large Project Construction segment. During the years ended
December 31, 2015
and
2014
, our largest volume customers, including both prime and subcontractor arrangements, were the
New York State Department of Transportation
(“
NYSDOT
”) and Caltrans, respectively. Revenue recognized from contracts with NYSDOT during
2015
represented
$199.0 million
(
8.4%
of total revenue), all of which was in the Large Project Construction segment (
24.5%
of segment revenue). Revenue recognized from contracts with Caltrans during
2014
totaled
$195.4 million
(
8.6%
of total revenue), of which
$178.7 million
(
15.1%
of segment revenue) was in the Construction segment and
$16.8 million
(
2.0%
of segment revenue) was in the Large Project Construction segment.
F- 20
GRANITE CONSTRUCTION INCORPORATED
NOTES TO THE CONSOLIDATED FINANCIAL STATEMENTS - (Continued)
We regularly review our accounts receivable, including past due amounts, to determine their probability of collection. If it is probable that an amount is uncollectible, it is charged to bad debt expense and a corresponding reserve is established in allowance for doubtful accounts. If it is deemed certain that an amount is uncollectible, the amount is written off.
Certain construction contracts include retainage provisions. The balances billed but not paid by customers pursuant to these provisions generally become due upon completion and acceptance of the project work or products by the owners. No retention receivable individually exceeded 10% of total net receivables at any of the presented dates. As of
December 31, 2016
, the majority of the retentions receivable are expected to be collected within one year. As of December 31, 2016 and 2015, there were no retention receivables determined to be uncollectible.
6. Construction Joint Ventures
We participate in various construction joint ventures (“joint ventures”).
Due to the joint and several nature of the performance obligations under the related owner contracts, if any of the partners fail to perform, we and the remaining partners, if any, would be responsible for performance of the outstanding work (i.e., we provide a performance guarantee). At
December 31, 2016
, there was
$5.0 billion
of construction revenue to be recognized on unconsolidated and line item construction joint venture contracts of which
$1.6 billion
represented our share and the remaining
$3.4 billion
represented our partners’ share. We are not able to estimate amounts that may be required beyond the remaining cost of the work to be performed. These costs could be offset by billings to the customer or by proceeds from our partners’ corporate and/or other guarantees. See Note 10 for disclosure of the performance guarantee amounts recorded in the consolidated balance sheets and Note 1 for additional discussion.
Generally, each construction joint venture is formed to accomplish a specific project and is jointly controlled by the joint venture partners. The joint venture agreements typically provide that our interests in any profits and assets, and our respective share in any losses and liabilities, that may result from the performance of the contracts are limited to our stated percentage interest in the project. Under our joint venture contractual arrangements, we provide capital to these joint ventures in return for an ownership interest. In addition, partners dedicate resources to the joint ventures necessary to complete the contracts and are reimbursed for their cost. The operational risks of each construction joint venture are passed along to the joint venture members. As we absorb our share of these risks, our investment in each venture is exposed to potential gains and losses.
We have determined that certain of these joint ventures are consolidated because they are VIEs and we are the primary beneficiary.
We continually evaluate whether there are changes in the status of the VIEs or changes to the primary beneficiary designation of the VIE. Based on our assessments during the years ended December 31,
2016
,
2015
and
2014
, we determined no change was required for existing construction joint ventures.
The volume and stage of completion of contracts from our consolidated and unconsolidated construction joint ventures may cause fluctuations in cash and cash equivalents and, for consolidated construction joint ventures, billings in excess of costs and estimated earnings, costs in excess of billings and estimated earnings and property and equipment between periods.
The assets and liabilities of each consolidated and unconsolidated construction joint venture relate solely to that joint venture. The decision to distribute joint venture assets must generally be made jointly by a majority of the members and, accordingly, these assets, including those associated with estimated cost recovery of customer affirmative claims and back charge claims, are generally not available for the working capital needs of Granite until distributed.
F- 21
GRANITE CONSTRUCTION INCORPORATED
NOTES TO THE CONSOLIDATED FINANCIAL STATEMENTS - (Continued)
Consolidated Construction Joint Ventures
At
December 31, 2016
, we were engaged in
five
active consolidated construction joint venture projects with total contract values ranging from
$47.6 million
to
$291.6 million
. Our share of revenue remaining to be recognized on these consolidated joint ventures ranged from
$3.4 million
to
$166.6 million
. Our proportionate share of the equity in these joint ventures was between
50.0%
and
65.0%
. During the years ended December 31,
2016
,
2015
and
2014
, total revenue from consolidated construction joint ventures was
$119.8 million
,
$54.4 million
and
$155.1 million
, respectively. During the years ended December 31,
2016
, 2015 and
2014
, consolidated construction joint ventures provided
$37.8 million
, used
$16.4 million
and provided
$22.5 million
of operating cash flows, respectively.
Unconsolidated Construction Joint Ventures
As of
December 31, 2016
, we were engaged in
eleven
active unconsolidated joint venture projects with total contract values ranging from
$78.8 million
to
$3.6 billion
. Our proportionate share of the equity in these unconsolidated joint ventures ranged from
20.0%
to
50.0%
. As of
December 31, 2016
, our share of the revenue remaining to be recognized on these unconsolidated joint ventures ranged from
$1.1 million
to
$507.4 million
.
As of December 31, 2016 and 2015, one of our unconsolidated construction joint ventures was located in Canada and, therefore, the associated disclosures throughout this footnote include amounts that were translated from Canadian dollars to U.S. dollars using the spot rate in effect as of the reporting date for balance sheet items, and the average rate in effect during the reporting period for the results of operations.
The following is summary financial information related to unconsolidated construction joint ventures (in thousands):
|
December 31,
|
2016
|
2015
|
||||||
|
Assets:
|
|
|
||||||
|
Cash, cash equivalents and marketable securities
|
$
|
537,991
|
|
$
|
439,871
|
|
||
|
Other current assets
1
|
644,809
|
|
666,478
|
|
||||
|
Noncurrent assets
|
207,240
|
|
193,271
|
|
||||
|
Less partners’ interest
|
935,615
|
|
881,183
|
|
||||
|
Granite’s interest
1,2
|
454,425
|
|
418,437
|
|
||||
|
Liabilities:
|
|
|||||||
|
Current liabilities
|
696,215
|
|
650,300
|
|
||||
|
Less partners’ interest and adjustments
3
|
472,324
|
|
447,926
|
|
||||
|
Granite’s interest
|
223,891
|
|
202,374
|
|
||||
|
Equity in construction joint ventures
4
|
$
|
230,534
|
|
$
|
216,063
|
|
||
1
Included in this balance and in accrued and other current liabilities on our consolidated balance sheets as of December 31, 2016 and 2015 was
$83.1 million
and
$65.5 million
, respectively, related to performance guarantees (see Note 10 of “Notes to the Consolidated Financial Statements”).
2
Included in this balance as of December 31, 2016 and 2015 was
$65.4 million
and
$39.7 million
, respectively, related to Granite’s share of estimated cost recovery of customer affirmative claims. In addition, this balance included
$5.6 million
related to Granite’s share of estimated recovery of back charge claims as of December 31, 2016. There was
no
estimated recovery of back charge claims as of December 31, 2015.
3
Partners’ interest and adjustments includes amounts to reconcile total liabilities as reported by our partners to Granite’s interest adjusted to reflect our accounting policies.
4
As of December 31, 2016 and 2015, this balance included
$16.6 million
and
$8.6 million
, respectively, of deficit in construction joint ventures that is included in accrued expenses and other current liabilities in the consolidated balance sheets.
F- 22
GRANITE CONSTRUCTION INCORPORATED
NOTES TO THE CONSOLIDATED FINANCIAL STATEMENTS - (Continued)
|
Years Ended December 31,
|
2016
|
2015
|
2014
|
|||||||||
|
Revenue:
|
|
|
|
|||||||||
|
Total
|
$
|
1,958,158
|
|
$
|
1,924,544
|
|
$
|
1,501,894
|
|
|||
|
Less partners’ interest and adjustments
1
|
1,387,532
|
|
1,341,334
|
|
1,048,514
|
|
||||||
|
Granite’s interest
|
570,626
|
|
583,210
|
|
453,380
|
|
||||||
|
Cost of revenue:
|
|
|
|
|||||||||
|
Total
|
1,915,376
|
|
1,819,257
|
|
1,386,577
|
|
||||||
|
Less partners’ interest and adjustments
1
|
1,360,459
|
|
1,279,954
|
|
984,062
|
|
||||||
|
Granite’s interest
|
554,917
|
|
539,303
|
|
402,515
|
|
||||||
|
Granite’s interest in gross profit
|
$
|
15,709
|
|
$
|
43,907
|
|
$
|
50,865
|
|
|||
1
Partners’ interest and adjustments includes amounts to reconcile total revenue and total cost of revenue as reported by our partners to Granite’s interest adjusted to reflect our accounting policies.
During the years ended December 31, 2016, 2015 and 2014, unconsolidated construction joint venture net income was
$41.8 million
,
$105.6 million
and
$116.8 million
, respectively, of which our share was
$15.6 million
,
$43.4 million
and
$49.2 million
, respectively. These joint venture net income amounts exclude our corporate overhead required to manage the joint ventures and include taxes only to the extent the applicable states have joint venture level taxes.
Line Item Joint Ventures
We participate in various “line item” joint venture agreements under which each partner is responsible for performing certain discrete items of the total scope of contracted work. The revenue for each line item joint venture partners’ discrete items of work is defined in the contract with the project owner and each joint venture partner bears the profitability risk associated with its own work. There is not a single set of books and records for a line item joint venture. Each partner accounts for its items of work individually as it would for any self-performed contract. We include only our portion of revenue and cost of revenue associated with these contracts in our consolidated financial statements. As of
December 31, 2016
, we had
three
active line item joint venture construction projects with total contract values ranging from
$66.1 million
to
$87.8 million
of which our portion ranged from
$29.1 million
to
$64.9 million
. As of
December 31, 2016
, our share of revenue remaining to be recognized on these line item joint ventures ranged from
$0.5 million
to
$17.2 million
. During the years ended December 31, 2016, 2015 and 2014, our portion of revenue from line item joint ventures was
$35.0 million
,
$26.0 million
and
$29.3 million
, respectively.
7. Investments in Affiliates
Our investments in affiliates balance is related to our investments in unconsolidated non-construction entities that we account for using the equity method of accounting, including investments in real estate entities and a non-real estate entity.
The real estate entities were formed to accomplish specific real estate development projects that our wholly-owned subsidiary, Granite Land Company (“GLC”), participates in with third-party partners. The non-real estate entity is a 50% interest in a limited liability company which owns and operates an asphalt terminal and operates an emulsion plant in Nevada.
We have determined that the real estate entities are not consolidated because although they are VIEs, we are not the primary beneficiary. We have determined that the non-real estate entity is not consolidated because it is not a VIE and we do not hold the majority voting interest. As such, this entity is accounted for using the equity method. We account for our share of the operating results of the equity method investments in other income in the consolidated statements of operations and as a single line item in the consolidated balance sheets as investments in affiliates
.
Our investments in affiliates balance consists of the following (in thousands):
|
December 31,
|
2016
|
2015
|
||||||
|
Equity method investments in real estate affiliates
|
$
|
25,911
|
|
$
|
24,103
|
|
||
|
Equity method investments in other affiliate
|
9,757
|
|
9,079
|
|
||||
|
Total investments in affiliates
|
$
|
35,668
|
|
$
|
33,182
|
|
||
F- 23
GRANITE CONSTRUCTION INCORPORATED
NOTES TO THE CONSOLIDATED FINANCIAL STATEMENTS - (Continued)
The following table provides summarized balance sheet information for our affiliates accounted for under the equity method on a combined basis (in thousands):
|
December 31,
|
2016
|
2015
|
||||||
|
Current assets
|
$
|
30,836
|
|
$
|
26,790
|
|
||
|
Noncurrent assets
|
124,670
|
|
148,687
|
|
||||
|
Total assets
|
155,506
|
|
175,477
|
|
||||
|
Current liabilities
|
18,485
|
|
25,840
|
|
||||
|
Long-term liabilities
1
|
37,217
|
|
45,267
|
|
||||
|
Total liabilities
|
55,702
|
|
71,107
|
|
||||
|
Net assets
|
$
|
99,804
|
|
$
|
104,370
|
|
||
|
Granite’s share of net assets
|
$
|
35,668
|
|
$
|
33,182
|
|
||
1
The balance primarily relates to debt associated with our real estate investments. See Note 11 for further discussion.
The equity method investments in real estate affiliates included
$20.8 million
and
$18.5 million
in residential real estate in Texas as of
December 31, 2016
and
2015
, respectively. The remaining balances were in commercial real estate in Texas. Of the
$155.5 million
in total assets as of
December 31, 2016
, real estate entities had total assets ranging from less than
$0.1 million
to
$63.0 million
and the non-real estate entity had total assets of
$26.2 million
.
The following table provides summarized statement of operations information for our affiliates accounted for under the equity method on a combined basis (in thousands):
|
Years Ended December 31,
|
2016
|
2015
|
2014
|
||||||
|
Revenue
|
$
|
56,127
|
|
$
|
47,457
|
|
$
|
46,597
|
|
|
Gross profit
|
22,398
|
|
19,117
|
|
10,315
|
|
|||
|
Income before taxes
|
19,117
|
|
8,446
|
|
3,647
|
|
|||
|
Net income
|
19,117
|
|
8,446
|
|
3,647
|
|
|||
|
Granite’s interest in affiliates’ net income
|
7,177
|
|
3,210
|
|
901
|
|
|||
8. Property and Equipment, net
Balances of major classes of assets and allowances for depreciation and depletion are included in property and equipment, net in the consolidated balance sheets as follows (in thousands):
|
December 31,
|
2016
|
2015
|
||||||
|
Equipment and vehicles
|
$
|
756,602
|
|
$
|
731,224
|
|
||
|
Quarry property
|
174,839
|
|
178,357
|
|
||||
|
Land and land improvements
|
110,999
|
|
110,294
|
|
||||
|
Buildings and leasehold improvements
|
82,762
|
|
82,871
|
|
||||
|
Office furniture and equipment
|
56,381
|
|
60,821
|
|
||||
|
Property and equipment
|
1,181,583
|
|
1,163,567
|
|
||||
|
Less: accumulated depreciation and depletion
|
774,933
|
|
778,438
|
|
||||
|
Property and equipment, net
|
$
|
406,650
|
|
$
|
385,129
|
|
||
Depreciation and depletion expense primarily included in cost of revenue in our consolidated statements of operations was
$61.0 million
for both years ended
December 31, 2016
and
2015
and was
$64.9 million
for the year ended December 31,
2014
. We capitalized interest costs of
$0.5 million
,
$0.4 million
and
$0.7 million
in
2016
,
2015
and
2014
, respectively, related to certain self-constructed assets, of which
$0.2 million
,
$0.4 million
and
$0.4 million
, respectively, were included in investments in affiliates and the remaining amounts were included in property and equipment in the consolidated balance sheets.
F- 24
GRANITE CONSTRUCTION INCORPORATED
NOTES TO THE CONSOLIDATED FINANCIAL STATEMENTS - (Continued)
We have recorded liabilities associated with our legally required obligations to reclaim owned and leased quarry property and related facilities. As of
December 31,
2016
and
2015
,
$1.9 million
and
$2.0 million
, respectively, of our asset retirement obligations were included in accrued expenses and other current liabilities and
$20.1 million
and
$24.6 million
, respectively, were included in other long-term liabilities in the consolidated balance sheets.
The following is a reconciliation of these asset retirement obligations (in thousands):
|
Years Ended December 31,
|
2016
|
2015
|
||||
|
Beginning balance
|
$
|
26,558
|
|
$
|
27,441
|
|
|
Revisions to estimates
|
(2,058
|
)
|
213
|
|
||
|
Liabilities settled
|
(3,806
|
)
|
(2,114
|
)
|
||
|
Accretion
|
1,242
|
|
1,018
|
|
||
|
Ending balance
|
$
|
21,936
|
|
$
|
26,558
|
|
9. Intangible Assets
Indefinite-lived Intangible Assets
Indefinite-lived intangible assets primarily consist of goodwill and use rights. Use rights of
$0.4 million
are included in other noncurrent assets in the consolidated balance sheets as of
December 31, 2016
and
2015
.
The following table presents the goodwill balance by reportable segment (in thousands):
|
December 31,
|
2016
|
2015
|
||||||
|
Construction
|
$
|
29,260
|
|
$
|
29,260
|
|
||
|
Large Project Construction
|
22,593
|
|
22,593
|
|
||||
|
Construction Materials
|
1,946
|
|
1,946
|
|
||||
|
Total goodwill
|
$
|
53,799
|
|
$
|
53,799
|
|
||
Amortized Intangible Assets
The following is the breakdown of our amortized intangible assets that are included in other noncurrent assets in the consolidated balance sheets (in thousands):
|
|
Accumulated
|
|
||||||||||
|
December 31, 2016
|
Gross Value
|
Amortization
|
Net Value
|
|||||||||
|
Permits
|
$
|
25,959
|
|
$
|
(11,514
|
)
|
$
|
14,445
|
|
|||
|
Acquired backlog
|
1,500
|
|
(1,472
|
)
|
28
|
|
||||||
|
Customer lists
|
2,200
|
|
(1,174
|
)
|
1,026
|
|
||||||
|
Trade name
|
4,100
|
|
(1,727
|
)
|
2,373
|
|
||||||
|
Covenants not to compete and other
|
50
|
|
(24
|
)
|
26
|
|
||||||
|
Total amortized intangible assets
|
$
|
33,809
|
|
$
|
(15,911
|
)
|
$
|
17,898
|
|
|||
|
December 31, 2015
|
|
|||||||||||
|
Permits
|
$
|
29,713
|
|
$
|
(14,239
|
)
|
$
|
15,474
|
|
|||
|
Acquired backlog
|
7,900
|
|
(7,594
|
)
|
306
|
|
||||||
|
Customer lists
|
4,398
|
|
(3,078
|
)
|
1,320
|
|
||||||
|
Trade name
|
4,100
|
|
(1,295
|
)
|
2,805
|
|
||||||
|
Covenants not to compete and other
|
2,459
|
|
(2,430
|
)
|
29
|
|
||||||
|
Total amortized intangible assets
|
$
|
48,570
|
|
$
|
(28,636
|
)
|
$
|
19,934
|
|
|||
Amortization expense related to amortized intangible assets for the years ended
December 31, 2016
,
2015
and
2014
was
$2.0 million
,
$2.2 million
and
$2.3 million
, respectively, and was primarily included in selling, general and administrative expenses in the consolidated statements of operations. In addition, the gross value and associated accumulated amortization was adjusted for fully amortized intangible assets that we no longer intend to use. Based on the amortized intangible assets balance at
December 31, 2016
, amortization expense expected to be recorded in the future is as follows:
$1.7 million
in 2017;
$1.7 million
in 2018;
$1.7 million
in 2019;
$1.6 million
in 2020; and
$11.1 million
thereafter.
F- 25
GRANITE CONSTRUCTION INCORPORATED
NOTES TO THE CONSOLIDATED FINANCIAL STATEMENTS - (Continued)
10. Accrued Expenses and Other Current Liabilities (in thousands)
:
|
December 31,
|
2016
|
2015
|
||||
|
Payroll and related employee benefits
|
$
|
53,802
|
|
$
|
56,860
|
|
|
Accrued insurance
|
44,471
|
|
41,154
|
|
||
|
Performance guarantees (see Note 1)
|
83,110
|
|
65,514
|
|
||
|
Other
|
37,204
|
|
37,407
|
|
||
|
Total
|
$
|
218,587
|
|
$
|
200,935
|
|
Other includes dividends payable, accrued legal reserves, warranty reserves, reclamation reserves, remediation reserves and other miscellaneous accruals, none of which are greater than 5% of total current liabilities.
11. Long-Term Debt and Credit Arrangements (in thousands):
|
December 31,
|
2016
|
2015
|
||||
|
Senior notes payable
|
$
|
120,000
|
|
$
|
160,000
|
|
|
Credit Agreement term loan
|
95,000
|
|
100,000
|
|
||
|
Credit Agreement revolving credit loan
|
30,000
|
|
—
|
|
||
|
Other notes payable and debt issuance costs
|
(706
|
)
|
(877
|
)
|
||
|
Total debt
|
244,294
|
|
259,123
|
|
||
|
Less current maturities
|
14,796
|
|
14,800
|
|
||
|
Total long-term debt
|
$
|
229,498
|
|
$
|
244,323
|
|
The aggregate minimum principal maturities of long-term debt, including current maturities, for each of the five years following
December 31, 2016
, after considering our intent and ability to pay
$30.0 million
of the 2017 installment on the 2019 Notes (defined below) using another source of financing as disclosed below, are as follows: 2017 -
$15.0 million
; 2018 -
$46.3 million
; 2019 -
$50.0 million
; and 2020 -
$133.8 million
.
Senior Notes Payable
As of
December 31, 2016
and 2015, senior notes payable in the amount of
$120.0 million
and
$160.0 million
, respectively, were due to a group of institutional holders and had an interest rate of
6.11%
per annum (“2019 Notes”). As of
December 31, 2016
, three equal annual installments from 2017 through 2019 were remaining. As of
December 31, 2016
and 2015,
$110.0 million
and
$150.0 million
, respectively, of the outstanding balances were included in long-term debt in the consolidated balance sheet, including
$30.0 million
due for each the 2016 and 2017 installments as we have the ability and intent to pay these installments using borrowings under the Credit Agreement (defined below) or by obtaining other sources of financing. The remaining
$10.0 million
of both the 2016 and 2017 installments was included in current maturities of long-term debt as of
December 31, 2016
and 2015 in the consolidated balance sheets. In March 2014, we entered into an interest rate swap designed to convert the interest rate from a fixed rate of
6.11%
to a variable rate of
4.15%
plus six-month LIBOR, which was early terminated in December 2016 (see Note 4 for details).
Our obligations under the note purchase agreement governing the 2019 Notes (the “2019 NPA”) are guaranteed by certain of our subsidiaries and are collateralized on an equivalent basis with the Credit Agreement discussed below by liens on substantially all of the assets of the Company and subsidiaries that are guarantors or borrowers under the Credit Agreement. The 2019 NPA provides for the release of liens and re-pledge of collateral on substantially the same terms and conditions as those set forth in the Credit Agreement.
Credit Agreement
As of December 31, 2016, we had a
$295.0 million
credit facility (the “Credit Agreement”), of which
$200.0 million
was a revolving credit facility and
$95.0 million
was a term loan that matures on October 28, 2020 (the “Maturity Date”). The Credit Agreement has a sublimit for letters of credit of
$100.0 million
.
Of the
$100.0 million
term loan outstanding as of December 31, 2015, we paid
$5.0 million
of the principal balance during 2016. Of the remaining
$95.0 million
,
1.25%
of the original principal balance is due in seven quarterly installments beginning in March 2017,
2.50%
of the original principal balance is due in eight quarterly installments beginning in December 2018 and the remaining balance is due on the Maturity Date. As of December 31, 2016,
$90.0 million
of the
$95.0 million
term loan was included in long-term debt and the remaining
$5.0 million
was included in current maturities of long-term debt in the consolidated balance sheets.
F- 26
GRANITE CONSTRUCTION INCORPORATED
NOTES TO THE CONSOLIDATED FINANCIAL STATEMENTS - (Continued)
As of December 31, 2016, the total stated amount of all issued and outstanding letters of credit under Credit Agreement was
$8.8 million
and
$30.0 million
had been drawn for the 2016 installment of the 2019 Notes. The total unused availability under the Credit Agreement was
$161.2 million
. The letters of credit will expire between
August 2017
and
October 2017
.
Borrowings under the Credit Agreement bear interest at LIBOR or a base rate (at our option), plus an applicable margin based on certain financial ratios calculated quarterly. LIBOR varies based on the applicable loan term, market conditions and other external factors. The applicable margin was
1.75%
for loans bearing interest based on LIBOR and
0.75%
for loans bearing interest at the base rate at
December 31, 2016
. Accordingly, the effective interest rates using three-month LIBOR and base rate were
2.75%
and
4.50%
, respectively, at
December 31, 2016
and we elected to use LIBOR. Borrowings at the base rate have no designated term and could be repaid without penalty any time prior to the Maturity Date. Borrowings bearing interest at a LIBOR rate have a term no less than one month and no greater than six months (or such longer period not to exceed 12 months if approved by all lenders). At the end of each term, such borrowings can be paid or continued at our discretion as either a borrowing at the base rate or a borrowing at a LIBOR rate with similar terms. Our obligations under the Credit Agreement are guaranteed by certain of our subsidiaries and are collateralized on an equivalent basis with the obligations under the 2019 Notes (defined above) by first priority liens (subject only to other permitted liens) on substantially all of the assets of the Company and our subsidiaries that are guarantors or borrowers under the Credit Agreement.
In January 2016, we entered into an interest rate swap designated as a cash flow hedge with an effective date of April 2016 and an initial notional amount of
$98.8 million
which matures in October 2020. The interest rate swap is designed to convert the interest rate on the term loan described above from a variable rate of interest of LIBOR plus an applicable margin to a fixed rate of 1.47% plus the same applicable margin (see Note 4 for details).
The Credit Agreement provides for the release of the liens securing the obligations, at our option and expense, so long as certain conditions as defined by the terms in the Credit Agreement are satisfied (“Collateral Release Period”). However, if subsequent to exercising the option, our Consolidated Fixed Charge Coverage Ratio is less than
1.25
or our Consolidated Leverage Ratio is greater than
2.50
, then we would be required to promptly re-pledge substantially all of the assets of the Company and our subsidiaries that are guarantors or borrowers under the Credit Agreement. As of
December 31, 2016
, the conditions for the exercise of our right under the Credit Agreement to have liens released were not satisfied.
Real Estate Indebtedness
Our unconsolidated real estate held for development and sale is subject to mortgage indebtedness. This indebtedness is non-recourse to Granite, but is recourse to the real estate entity. The terms of this indebtedness are typically renegotiated to reflect the evolving nature of the real estate project as it progresses through acquisition, entitlement and development. Modification of these terms may include changes in loan-to-value ratios requiring the real estate entity to repay portions of the debt. The debt associated with our unconsolidated real estate ventures is disclosed in Note 7.
Covenants and Events of Default
Our debt and credit agreements require us to comply with various affirmative, restrictive and financial covenants, including the financial covenants described below. Our failure to comply with any of these covenants, or to pay principal, interest or other amounts when due thereunder, would constitute an event of default under the applicable agreements. Under certain circumstances, the occurrence of an event of default under one of our debt or credit agreements (or the acceleration of the maturity of the indebtedness under one of our agreements) may constitute an event of default under one or more of our other debt or credit agreements. Default under our debt and credit agreements could result in (i) us no longer being entitled to borrow under the agreements; (ii) termination of the agreements; (iii) the requirement that any letters of credit under the agreements be cash collateralized; (iv) acceleration of the maturity of outstanding indebtedness under the agreements and/or (v) foreclosure on any collateral securing the obligations under the agreements.
The most significant financial covenants under the terms of our Credit Agreement and 2019 NPA require the maintenance of a minimum Consolidated Tangible Net Worth, a minimum Consolidated Interest Coverage Ratio and a maximum Consolidated Leverage Ratio.
As of
December 31, 2016
and pursuant to the definitions in the agreements, our Consolidated Tangible Net Worth was
$881.6 million
, which exceeded the minimum of
$697.3 million
, our Consolidated Leverage Ratio was
1.54
which did not exceed the maximum of
3.00
and our Consolidated Interest Coverage Ratio was
12.30
which exceeded the minimum of
4.00
.
As of
December 31, 2016
, we were in compliance with all covenants contained in the Credit Agreement and related to the 2019 NPA. We are not aware of any non-compliance by any of our unconsolidated real estate entities with the covenants contained in their debt agreements.
F- 27
GRANITE CONSTRUCTION INCORPORATED
NOTES TO THE CONSOLIDATED FINANCIAL STATEMENTS - (Continued)
12. Employee Benefit Plans
Profit Sharing and 401(k) Plan
: The Profit Sharing and 401(k) Plan (the “401(k) Plan”) is a defined contribution plan covering all employees except employees covered by collective bargaining agreements and employees of our consolidated construction joint ventures. Each employee’s combined pre-tax 401(k) and post-tax (Roth) contributions cannot exceed
50%
of their eligible pay or Internal Revenue Code annual contribution limits. Our 401(k) matching contributions can be up to
6%
of an employee’s gross pay at the discretion of the Board of Directors. Our 401(k) matching contributions to the 401(k) Plan for the years ended
December 31, 2016
,
2015
and
2014
were
$11.0 million
,
$5.4 million
and
$5.0 million
, respectively. Profit sharing contributions from the Company may be made to the 401(k) Plan in an amount determined by the Board of Directors. We made no profit sharing contributions during the years ended
December 31,
2016
,
2015
and
2014
.
Non-Qualified Deferred Compensation Plan
: We offer a Non-Qualified Deferred Compensation Plan (“NQDC Plan”) to a select group of our highly compensated employees. The NQDC Plan provides participants the opportunity to defer payment of certain compensation as defined in the NQDC Plan. In October 2008, a Rabbi Trust was established to fund our NQDC Plan obligation and was fully funded as of
December 31, 2016
. The assets held by the Rabbi Trust at
December 31, 2016
and
2015
are substantially in the form of Company-owned life insurance and are included in other noncurrent assets in the consolidated balance sheets. As of
December 31, 2016
, there were
58
active participants in the NQDC Plan. NQDC Plan obligations were
$21.5 million
and
$19.7 million
as of
December 31, 2016
and
2015
, respectively.
Multi-employer Pension Plans
: Four of our wholly-owned subsidiaries, Granite Construction Company, Granite Construction Northeast, Inc., Granite Industrial, Inc., and Kenny Construction Company contribute to various multi-employer pension plans on behalf of union employees. The risks of participating in these multiemployer plans are different from single-employer plans in the following aspects:
|
•
|
Assets contributed to the multi-employer plan by one employer may be used to provide benefits to employees of other participating employers.
|
|
•
|
If a participating employer stops contributing to the plan, the unfunded obligations of the plan may be borne by the remaining participating employers.
|
|
•
|
If we chose to stop participating in some of the multi-employer plans, we may be required to pay those plans an amount based on the underfunded status of the plan, referred to as a withdrawal liability.
|
F- 28
GRANITE CONSTRUCTION INCORPORATED
NOTES TO THE CONSOLIDATED FINANCIAL STATEMENTS - (Continued)
The following table presents our participation in these plans (dollars in thousands):
|
Pension Plan Employer Identification Number
|
Pension Protection Act (“PPA”) Certified Zone Status
1
|
FIP / RP Status Pending / Implemented
2
|
Contributions
|
Surcharge Imposed
|
Expiration Date of Collective Bargaining Agreement
3
|
||||||||||
|
Pension Trust Fund
|
2016
|
2015
|
2016
|
2015
|
2014
|
||||||||||
|
Locals 302 and 612 IUOE-Employers Construction Industry Retirement Plan
|
91-6028571
|
Green
|
Green
|
No
|
$
|
3,113
|
|
$
|
3,000
|
|
$
|
3,043
|
|
No
|
12/31/2017
5/31/2018 12/31/2019 |
|
Pension Trust Fund for Operating Engineers Pension Plan
|
94-6090764
|
Red
|
Red
|
Yes
|
9,266
|
|
9,070
|
|
9,590
|
|
No
|
5/15/2017
6/30/2017 1/31/2018 6/30/2019 6/15/2020 6/30/2020 9/30/2020 |
|||
|
Operating Engineers Pension Trust Fund
|
95-6032478
|
Red
|
Red
|
Yes
|
5,357
|
|
3,647
|
|
3,001
|
|
No
|
6/30/2019
|
|||
|
Laborers Pension Trust Fund for Northern California
|
94-6277608
|
Yellow
|
Yellow
|
Yes
|
2,215
|
|
2,403
|
|
2,682
|
|
No
|
6/30/2019
|
|||
|
Construction Laborers Pension Trust for Southern California
|
43-6159056
|
Green
|
Green
|
No
|
2,095
|
|
1,349
|
|
1,258
|
|
No
|
6/30/2018
|
|||
|
Laborers Pension Fund
|
36-2514514
|
Green
|
Green
|
No
|
2,328
|
|
1,919
|
|
2,230
|
|
No
|
5/31/2017
|
|||
|
All other funds (39 as of December 31, 2016)
|
8,708
|
|
7,171
|
|
7,618
|
|
|||||||||
|
Total Contributions:
|
$
|
33,082
|
|
$
|
28,559
|
|
$
|
29,422
|
|
||||||
1
The most recent PPA zone status available in
2016
and
2015
is for the plan’s year-end during
2015
and
2014
, respectively. The zone status is based on information that we received from the plan and is certified by the plan’s actuary. Among other factors, plans in the red zone are generally less than
65
percent funded, plans in the orange zone are less than
80
percent funded and have an Accumulated Funding Deficiency in the current year or projected into the next six years, plans in the yellow zone are less than
80 percent
funded, and plans in the green zone are at least
80 percent
funded.
2
The “FIP/RP Status Pending/Implemented” column indicates plans for which a financial improvement plan (“FIP”) or a rehabilitation plan (“RP”) is either pending or has been implemented.
3
Lists the expiration date(s) of the collective-bargaining agreement(s) to which the plans are subject. Pension trust funds with a range of expiration dates have various collective bargaining agreements.
Based upon the most recently available annual reports, the Company’s contribution to each of the individually significant plans listed in the table above was less than 5% of each plan’s total contributions. We currently have no intention of withdrawing from any of the multi-employer pension plans in which we participate that would result in a significant withdrawal liability. In addition, we do not have any significant future obligations or funding requirements related to these plans other than the ongoing contributions that are paid as hours are worked by plan participants.
F- 29
GRANITE CONSTRUCTION INCORPORATED
NOTES TO THE CONSOLIDATED FINANCIAL STATEMENTS - (Continued)
13. Shareholders’ Equity
Stock-based Compensation:
The 2012 Equity Incentive Plan provides for the issuance of restricted stock, restricted stock units (“RSUs”) and stock options to eligible employees and to members of our Board of Directors. A total of
1,829,436
shares of our common stock have been reserved for issuance of which
1,140,446
remained available as of
December 31, 2016
.
Restricted Stock:
As of December 31, 2016 and 2015 there was
no
restricted stock outstanding as all outstanding shares had either been forfeited or vested.
Stock Options:
No stock options were granted during the years ended December 31,
2016
,
2015
and 2014. As of
December 31, 2016
, there were
8,978
stock options outstanding all of which were fully vested as of June 30, 2013.
Restricted Stock Units:
RSUs are issued for services to be rendered and may not be sold, transferred or pledged for such a period as determined by our Compensation Committee. RSU stock compensation cost is measured at our common stock’s fair value based on the market price at the date of grant. We recognize compensation cost only for RSUs that we estimate will ultimately vest. We estimate the number of shares that will ultimately vest at each grant date based on our historical experience and adjust compensation cost based on changes in those estimates over time.
RSU compensation cost is recognized ratably over the shorter of the vesting period (generally three years) or the period from grant date to the first maturity date after the holder reaches age 62 and has completed certain specified years of service, when all RSUs become fully vested. Vesting of RSUs is not subject to any market or performance conditions and vesting provisions are at the discretion of the Compensation Committee. An employee may not sell or otherwise transfer unvested RSUs and, in the event employment is terminated prior to the end of the vesting period, any unvested RSUs are surrendered to us. We have no obligation to purchase these RSUs that are surrendered to us.
A summary of the changes in our RSUs during the years ended
December 31, 2016
,
2015
and
2014
is as follows (shares in thousands):
|
Years Ended December 31,
|
2016
|
2015
|
2014
|
||||||||||||
|
|
RSUs
|
Weighted-Average Grant-Date Fair Value per RSU
|
RSUs
|
Weighted-Average Grant-Date Fair Value per RSU
|
RSUs
|
Weighted-Average Grant-Date Fair Value per RSU
|
|||||||||
|
Outstanding, beginning balance
|
451
|
|
$
|
32.73
|
|
565
|
|
$
|
31.38
|
|
769
|
|
$
|
29.49
|
|
|
Granted
|
572
|
|
43.17
|
|
228
|
|
33.40
|
|
212
|
|
37.94
|
|
|||
|
Vested
|
(307
|
)
|
36.24
|
|
(300
|
)
|
31.50
|
|
(365
|
)
|
30.15
|
|
|||
|
Forfeited
|
(35
|
)
|
40.97
|
|
(42
|
)
|
33.38
|
|
(51
|
)
|
31.97
|
|
|||
|
Outstanding, ending balance
|
681
|
|
$
|
39.15
|
|
451
|
|
$
|
32.73
|
|
565
|
|
$
|
31.38
|
|
Compensation cost related to RSUs was
$13.4 million
(
$9.2 million
net of effective tax rate),
$8.8 million
(
$5.8 million
net of effective tax rate), and
$11.2 million
(
$7.2 million
net of effective tax rate) for the years ended
December 31, 2016
,
2015
and
2014
, respectively. The grant date fair value of RSUs vested during the years ended
December 31, 2016
,
2015
and
2014
was
$11.5 million
,
$10.3 million
and
$11.7 million
, respectively. As of
December 31, 2016
, there was
$14.2 million
of unrecognized compensation cost related to RSUs which will be recognized over a remaining weighted-average period of
1.4
years.
F- 30
GRANITE CONSTRUCTION INCORPORATED
NOTES TO THE CONSOLIDATED FINANCIAL STATEMENTS - (Continued)
401(k) Plan:
As of
December 31, 2016
, the 401(k) Plan owned
1,667,503
shares of our common stock. Dividends on shares held by the 401(k) Plan are charged to retained earnings and all shares held by the 401(k) Plan are treated as outstanding in computing our earnings per share.
Employee Stock Purchase Plan:
Our ESPP allows qualifying employees to purchase shares of our common stock through payroll deductions of up to
15%
of their compensation, subject to Internal Revenue Code limitations, at a price of
95%
of the fair market value as of the end of each of the six-month offering periods, which commence on May 15 and November 15 of each year. During the years ended December 31,
2016
,
2015
and
2014
, proceeds from the ESPP were
$0.8 million
,
$0.8 million
and
$0.7 million
for
16,717
,
22,567
and
21,433
shares, respectively.
Share Purchase Program:
On April 7, 2016, the Board of Directors authorized us to purchase up to
$200.0 million
of our common stock at management’s discretion, which replaced the former authorization including the amount available. We did not purchase shares under the share purchase program in any of the periods presented. The specific timing and amount of any future purchases will vary based on market conditions, securities law limitations and other factors.
14. Weighted Average Shares Outstanding and Net Income Per Share
The following table presents a reconciliation of the weighted average shares outstanding used in calculating basic and diluted net income per share as well as the calculation of basic and diluted net income per share (in thousands except per share amounts):
|
Years Ended December 31,
|
2016
|
2015
|
2014
|
|||||||||
|
Numerator (basic and diluted):
|
|
|
|
|
||||||||
|
Net income allocated to common shareholders for basic calculation
|
$
|
57,122
|
|
$
|
60,485
|
|
$
|
25,346
|
|
|||
|
Denominator:
|
|
|
|
|
||||||||
|
Weighted average common shares outstanding, basic
|
39,557
|
|
39,337
|
|
39,096
|
|
||||||
|
Dilutive effect of stock options and restricted stock units
|
668
|
|
531
|
|
699
|
|
||||||
|
Weighted average common shares outstanding, diluted
|
40,225
|
|
39,868
|
|
39,795
|
|
||||||
|
Net income per share, basic
|
$
|
1.44
|
|
$
|
1.54
|
|
$
|
0.65
|
|
|||
|
Net income per share, diluted
|
$
|
1.42
|
|
$
|
1.52
|
|
$
|
0.64
|
|
|||
F- 31
GRANITE CONSTRUCTION INCORPORATED
NOTES TO THE CONSOLIDATED FINANCIAL STATEMENTS - (Continued)
15. Income Taxes
Following is a summary of the provision for income taxes (in thousands):
|
Years Ended December 31,
|
2016
|
2015
|
2014
|
||||||
|
Federal:
|
|
|
|
||||||
|
Current
|
$
|
15,657
|
|
$
|
4,810
|
|
$
|
2,529
|
|
|
Deferred
|
9,919
|
|
25,955
|
|
11,142
|
|
|||
|
Total federal
|
25,576
|
|
30,765
|
|
13,671
|
|
|||
|
State:
|
|
|
|
|
|||||
|
Current
|
4,567
|
|
1,914
|
|
1,897
|
|
|||
|
Deferred
|
19
|
|
2,500
|
|
4,153
|
|
|||
|
Total state
|
4,586
|
|
4,414
|
|
6,050
|
|
|||
|
Total provision for income taxes
|
$
|
30,162
|
|
$
|
35,179
|
|
$
|
19,721
|
|
Following is a reconciliation of our provision for income taxes based on the Federal statutory tax rate to our effective tax rate (dollars in thousands):
|
Years Ended December 31,
|
2016
|
2015
|
2014
|
||||||||||||
|
Federal statutory tax
|
$
|
33,728
|
|
35.0
|
%
|
$
|
35,165
|
|
34.0
|
%
|
$
|
19,459
|
|
35.0
|
%
|
|
State taxes, net of federal tax benefit
|
2,990
|
|
3.1
|
|
3,769
|
|
3.6
|
|
5,420
|
|
9.7
|
|
|||
|
Percentage depletion deduction
|
(1,352
|
)
|
(1.4
|
)
|
(1,444
|
)
|
(1.4
|
)
|
(1,217
|
)
|
(2.2
|
)
|
|||
|
Domestic production activities deduction
|
(1,624
|
)
|
(1.7
|
)
|
(306
|
)
|
(0.3
|
)
|
(2
|
)
|
—
|
|
|||
|
Non-controlling interests
|
(3,177
|
)
|
(3.3
|
)
|
(2,639
|
)
|
(2.6
|
)
|
(3,686
|
)
|
(6.6
|
)
|
|||
|
Nondeductible expenses
|
1,094
|
|
1.1
|
|
219
|
|
0.2
|
|
275
|
|
0.5
|
|
|||
|
Other
|
(1,497
|
)
|
(1.5
|
)
|
415
|
|
0.5
|
|
(528
|
)
|
(0.9
|
)
|
|||
|
Total
|
$
|
30,162
|
|
31.3
|
%
|
$
|
35,179
|
|
34.0
|
%
|
$
|
19,721
|
|
35.5
|
%
|
Following is a summary of the deferred tax assets and liabilities (in thousands):
|
December 31,
|
2016
|
2015
|
||||
|
Long-term deferred tax assets:
|
|
|
|
|||
|
Receivables
|
$
|
573
|
|
$
|
332
|
|
|
Inventory
|
2,212
|
|
2,710
|
|
||
|
Insurance
|
12,524
|
|
10,427
|
|
||
|
Deferred compensation
|
12,740
|
|
11,139
|
|
||
|
Other accrued liabilities
|
2,294
|
|
3,405
|
|
||
|
Accrued compensation
|
11,031
|
|
12,639
|
|
||
|
Other
|
2,481
|
|
3,410
|
|
||
|
Net operating loss carryforwards
|
2,341
|
|
648
|
|
||
|
Valuation allowance
|
(2,153
|
)
|
(641
|
)
|
||
|
Total long-term deferred tax assets
|
44,043
|
|
44,069
|
|
||
|
Long-term deferred tax liabilities:
|
|
|||||
|
Property and equipment
|
29,400
|
|
30,285
|
|
||
|
Contract income recognition
|
20,084
|
|
9,455
|
|
||
|
Total long-term deferred tax liabilities
|
49,484
|
|
39,740
|
|
||
|
Net long-term deferred tax (liabilities) assets
|
$
|
(5,441
|
)
|
$
|
4,329
|
|
As of December 31, 2016, our deferred tax asset for net operating loss carryforwards relates to state and local net operating loss carryforwards with the significant carryforwards expiring beginning in 2035. We have provided a valuation allowance on the net deferred tax assets for certain state and local jurisdictions because we do not believe it is more likely than not that they will be realized.
F- 32
GRANITE CONSTRUCTION INCORPORATED
NOTES TO THE CONSOLIDATED FINANCIAL STATEMENTS - (Continued)
The following is a summary of the change in valuation allowance (in thousands):
|
December 31,
|
2016
|
2015
|
2014
|
||||||
|
Beginning balance
|
$
|
641
|
|
$
|
1,185
|
|
$
|
3,731
|
|
|
Additions (deductions), net
|
1,512
|
|
(544
|
)
|
(2,546
|
)
|
|||
|
Ending balance
|
$
|
2,153
|
|
$
|
641
|
|
$
|
1,185
|
|
The additions to the valuation allowance are related to the revaluation of our net deferred tax assets related to various state and local jurisdictions during the year ended
December 31, 2016
. Deductions to the valuation allowance are insignificant for the year ended
December 31, 2016
.
Uncertain tax positions:
We file income tax returns in the U.S. and various state and local jurisdictions. We are currently under examination by various state taxing authorities for various tax years. We do not anticipate that any of these audits will result in a material change in our financial position. We are no longer subject to U.S. federal examinations by tax authorities for years before 2011. With few exceptions, as of
December 31, 2016
, we are no longer subject to state examinations by taxing authorities for years before 2010.
We had approximately
$3.3 million
and
$1.6 million
of total gross unrecognized tax benefits as of
December 31, 2016
and
2015
, respectively. There were approximately
$3.2 million
and
$1.3 million
of unrecognized tax benefits that would affect the effective tax rate in any future period at
December 31, 2016
and
2015
, respectively. We do not anticipate a significant increase or decrease in our unrecognized tax benefits that will impact our effective tax rate in
2017
.
The following is a tabular reconciliation of unrecognized tax benefits (in thousands), the balance of which is included in other long-term liabilities in the consolidated balance sheets:
|
December 31,
|
2016
|
2015
|
2014
|
||||||
|
Beginning balance
|
$
|
1,578
|
|
$
|
887
|
|
$
|
2,231
|
|
|
Gross increases – current period tax positions
|
1,902
|
|
1,006
|
|
—
|
|
|||
|
Gross decreases – current period tax positions
|
(125
|
)
|
(156
|
)
|
(282
|
)
|
|||
|
Gross increases – prior period tax positions
|
2
|
|
—
|
|
—
|
|
|||
|
Gross decreases – prior period tax positions
|
(5
|
)
|
—
|
|
(2
|
)
|
|||
|
Settlements with taxing authorities/lapse of statute of limitations
|
(90
|
)
|
(159
|
)
|
(1,060
|
)
|
|||
|
Ending balance
|
$
|
3,262
|
|
$
|
1,578
|
|
$
|
887
|
|
We record interest on uncertain tax positions in interest expense in our consolidated statements of operations. During the years ended
December 31, 2016
,
2015
and
2014
, we recognized approximately
$0.1 million
interest expense,
$0.1 million
interest income and
$0.9 million
of interest income, respectively. Approximately
$0.2 million
and
$0.1 million
of accrued interest related to our uncertain tax position liability was included in other long-term liabilities in our consolidated balance sheets at
December 31, 2016
and
2015
, respectively.
16. Commitments, Contingencies and Guarantees
Leases:
Minimum rental commitments and minimum royalty requirements under all noncancellable operating leases, primarily quarry property, in effect at
December 31, 2016
were (in thousands):
|
Years Ending December 31,
|
|
|
|
|
2017
|
$
|
10,451
|
|
|
2018
|
8,896
|
|
|
|
2019
|
6,149
|
|
|
|
2020
|
5,316
|
|
|
|
2021
|
4,255
|
|
|
|
Later years (through 2046)
|
13,226
|
|
|
|
Total
|
$
|
48,293
|
|
Operating lease rental and royalty expense primarily included in cost of revenue in our consolidated statements of operations was
$18.2 million
,
$11.3 million
and
$10.6 million
in
2016
,
2015
and
2014
, respectively.
F- 33
GRANITE CONSTRUCTION INCORPORATED
NOTES TO THE CONSOLIDATED FINANCIAL STATEMENTS - (Continued)
Performance Guarantees
We participate in various joint ventures and line item joint ventures under which each partner is responsible for performing certain discrete items of the total scope of contracted work. See Note 1, Note 6 and Note 10 for further details.
Surety Bonds
We are generally required to provide various types of surety bonds that provide an additional measure of security under certain public and private sector contracts. At
December 31, 2016
,
$3.2 billion
of our contract backlog was bonded. Performance bonds do not have stated expiration dates; rather, we are generally released from the bonds after the owner accepts the work performed under contract. The ability to maintain bonding capacity to support our current and future level of contracting requires that we maintain cash and working capital balances satisfactory to our sureties.
17. Legal Proceedings
In the ordinary course of business, we and our affiliates are involved in various legal proceedings alleging, among other things, liability issues or breach of contract or tortious conduct in connection with the performance of services and/or materials provided, the various outcomes of which cannot be predicted with certainty. We and our affiliates are also subject to government inquiries in the ordinary course of business seeking information concerning our compliance with government construction contracting requirements and various laws and regulations, the outcomes of which cannot be predicted with certainty.
Some of the matters in which we or our joint ventures and affiliates are involved may involve compensatory, punitive, or other claims or sanctions that, if granted, could require us to pay damages or make other expenditures in amounts that are not probable to be incurred or cannot currently be reasonably estimated. In addition, in some circumstances our government contracts could be terminated, we could be suspended, debarred or incur other administrative penalties or sanctions, or payment of our costs could be disallowed. While any of our pending legal proceedings may be subject to early resolution as a result of our ongoing efforts to resolve the proceedings, whether or when any legal proceeding will be resolved is neither predictable nor guaranteed.
Accordingly, it is possible that future developments in such proceedings and inquiries could require us to (i) adjust existing accruals, or (ii) record new accruals that we did not originally believe to be probable or that could not be reasonably estimated. Such changes could be material to our financial condition, results of operations and/or cash flows in any particular reporting period. In addition to matters that are considered probable for which the loss can be reasonably estimated, disclosure is also provided when it is reasonably possible and estimable that a loss will be incurred or when it is reasonably possible that the amount of a loss will exceed the amount recorded.
Liabilities relating to legal proceedings and government inquiries, to the extent that we have concluded such liabilities are probable and the amounts of such liabilities are reasonably estimable, are recorded in the consolidated balance sheets. The aggregate liabilities recorded as of
December 31, 2016
and
2015
related to these matters were approximately
$4.3 million
and
$5.2 million
, respectively, and were primarily included in accounts payable and accrued expenses and other current liabilities in our consolidated balance sheets. The aggregate range of possible loss related to (i) matters considered reasonably possible, and (ii) reasonably possible amounts in excess of accrued losses recorded for probable loss contingencies, was immaterial as of
December 31, 2016
. Our estimates related to such matters could change in future periods.
F- 34
GRANITE CONSTRUCTION INCORPORATED
NOTES TO THE CONSOLIDATED FINANCIAL STATEMENTS - (Continued)
18. Business Segment Information
Our reportable segments are: Construction, Large Project Construction and Construction Materials.
In addition to business segments, we review our business by operating groups. Our operating groups are defined as follows: (i) California; (ii) Northwest, which primarily includes offices in Alaska, Arizona, Nevada, Utah and Washington; (iii) Heavy Civil, which primarily includes offices in California, Florida, New York and Texas; and (iv) Kenny, which primarily includes an office in Illinois. Each of these operating groups may include financial results from our Construction and Large Project Construction segments. Our California and Northwest operating groups include financial results from our Construction Materials segment.
The Construction segment performs various construction projects with a large portion of the work focused on new construction and improvement of streets, roads, highways, bridges, site work, underground, power-related facilities, utilities and other infrastructure projects. These projects are typically bid-build projects completed within two years with a contract value of less than
$75 million
.
The Large Project Construction segment focuses on large, complex infrastructure projects which typically have a longer duration than our Construction segment work. These projects include major highways, mass transit facilities, bridges, tunnels, waterway locks and dams, pipelines, canals, power-related facilities, utilities and airport infrastructure. This segment primarily includes bid-build, design-build, construction management/general contractor contracts, together with various contract methods relating to public-private partnerships, generally with contract values in excess of
$75 million
.
The Construction Materials segment mines and processes aggregates and operates plants that produce construction materials for internal use and for sale to third parties. In addition, the Construction Materials segment includes real estate investment activity that was not material for any of the periods presented.
The accounting policies of the segments are the same as those described in the Summary of Significant Accounting Policies (see Note 1). We evaluate segment performance based on gross profit or loss, and do not include selling, general and administrative expenses or non-operating income or expense. Segment assets include property and equipment, intangibles, goodwill, inventory and equity in construction joint ventures.
F- 35
GRANITE CONSTRUCTION INCORPORATED
NOTES TO THE CONSOLIDATED FINANCIAL STATEMENTS - (Continued)
Summarized segment information is as follows (in thousands):
|
Years Ended December 31,
|
Construction
|
Large Project Construction
|
Construction Materials
|
Total
|
||||||||||||
|
2016
|
|
|
|
|
|
|
||||||||||
|
Total revenue from reportable segments
|
$
|
1,365,198
|
|
$
|
888,193
|
|
$
|
425,029
|
|
$
|
2,678,420
|
|
||||
|
Elimination of intersegment revenue
|
—
|
|
—
|
|
(163,803
|
)
|
(163,803
|
)
|
||||||||
|
Revenue from external customers
|
1,365,198
|
|
888,193
|
|
261,226
|
|
2,514,617
|
|
||||||||
|
Gross profit
|
209,215
|
|
64,137
|
|
28,018
|
|
301,370
|
|
||||||||
|
Depreciation, depletion and amortization
|
22,816
|
|
6,796
|
|
23,437
|
|
53,049
|
|
||||||||
|
Segment assets
|
151,475
|
|
314,823
|
|
282,472
|
|
748,770
|
|
||||||||
|
2015
|
|
|
|
|||||||||||||
|
Total revenue from reportable segments
|
$
|
1,262,675
|
|
$
|
812,720
|
|
$
|
432,284
|
|
$
|
2,507,679
|
|
||||
|
Elimination of intersegment revenue
|
—
|
|
—
|
|
(136,650
|
)
|
(136,650
|
)
|
||||||||
|
Revenue from external customers
|
1,262,675
|
|
812,720
|
|
295,634
|
|
2,371,029
|
|
||||||||
|
Gross profit
|
187,506
|
|
79,467
|
|
32,863
|
|
299,836
|
|
||||||||
|
Depreciation, depletion and amortization
|
20,117
|
|
10,343
|
|
22,389
|
|
52,849
|
|
||||||||
|
Segment assets
|
139,399
|
|
274,975
|
|
288,900
|
|
703,274
|
|
||||||||
|
2014
|
|
|
||||||||||||||
|
Total revenue from reportable segments
|
$
|
1,186,445
|
|
$
|
825,044
|
|
$
|
385,392
|
|
$
|
2,396,881
|
|
||||
|
Elimination of intersegment revenue
|
—
|
|
—
|
|
(121,611
|
)
|
(121,611
|
)
|
||||||||
|
Revenue from external customers
|
1,186,445
|
|
825,044
|
|
263,781
|
|
2,275,270
|
|
||||||||
|
Gross profit
|
113,953
|
|
107,097
|
|
18,691
|
|
239,741
|
|
||||||||
|
Depreciation, depletion and amortization
|
19,141
|
|
16,197
|
|
21,976
|
|
57,314
|
|
||||||||
|
Segment assets
|
149,018
|
|
248,464
|
|
307,229
|
|
704,711
|
|
||||||||
A reconciliation of segment gross profit to consolidated income before provision for income taxes is as follows (in thousands):
|
Years Ended December 31,
|
2016
|
2015
|
2014
|
|||||||||
|
Total gross profit from reportable segments
|
$
|
301,370
|
|
$
|
299,836
|
|
$
|
239,741
|
|
|||
|
Selling, general and administrative expenses
|
219,299
|
|
203,817
|
|
193,256
|
|
||||||
|
Restructuring and impairment gains
|
(1,925
|
)
|
(6,003
|
)
|
(2,643
|
)
|
||||||
|
Gain on sales of property and equipment
|
(8,358
|
)
|
(8,286
|
)
|
(15,972
|
)
|
||||||
|
Total other (income) expense
|
(4,008
|
)
|
6,881
|
|
9,503
|
|
||||||
|
Income before provision for income taxes
|
$
|
96,362
|
|
$
|
103,427
|
|
$
|
55,597
|
|
|||
A reconciliation of segment assets to consolidated total assets is as follows (in thousands):
|
December 31,
|
2016
|
2015
|
2014
|
|||||||||
|
Total assets for reportable segments
|
$
|
748,770
|
|
$
|
703,274
|
|
$
|
704,711
|
|
|||
|
Assets not allocated to segments:
|
||||||||||||
|
Cash and cash equivalents
|
189,326
|
|
252,836
|
|
255,961
|
|
||||||
|
Short-term and long-term marketable securities
|
127,779
|
|
105,695
|
|
102,067
|
|
||||||
|
Receivables, net
|
419,345
|
|
340,822
|
|
310,934
|
|
||||||
|
Deferred income taxes, net
|
—
|
|
4,329
|
|
32,785
|
|
||||||
|
Other current assets, excluding segment assets
|
113,010
|
|
85,556
|
|
60,615
|
|
||||||
|
Property and equipment, net, excluding segment assets
|
32,397
|
|
36,721
|
|
45,188
|
|
||||||
|
Investments in affiliates
|
35,668
|
|
33,182
|
|
32,361
|
|
||||||
|
Other noncurrent assets, excluding segment assets
|
67,158
|
|
64,463
|
|
55,426
|
|
||||||
|
Consolidated total assets
|
$
|
1,733,453
|
|
$
|
1,626,878
|
|
$
|
1,600,048
|
|
|||
F- 36
None.
Quarterly Financial Data
The following table sets forth selected unaudited quarterly financial information for the years ended
December 31, 2016
and
2015
. This information has been prepared on the same basis as the audited consolidated financial statements and, in the opinion of management, contains all adjustments necessary for a fair statement thereof. Net income (loss) per share calculations are based on the weighted average common shares outstanding for each period presented. Accordingly, the sum of the quarterly net income (loss) per share amounts may not equal the per share amount reported for the year.
|
QUARTERLY FINANCIAL DATA
|
|
|
|
|
|
|
||||||
|
(unaudited - dollars in thousands, except per share data)
|
|
|
|
|
|
|
|
|
||||
|
2016 Quarters Ended
|
December 31,
|
September 30,
|
June 30,
|
March 31,
|
||||||||
|
Revenue
|
$
|
666,681
|
|
$
|
803,905
|
|
$
|
604,579
|
|
$
|
439,452
|
|
|
Gross profit
|
81,250
|
|
107,674
|
|
73,201
|
|
39,245
|
|
||||
|
As a percent of revenue
|
12.2
|
%
|
13.4
|
%
|
12.1
|
%
|
8.9
|
%
|
||||
|
Net income (loss)
2
|
$
|
19,264
|
|
$
|
38,172
|
|
$
|
18,526
|
|
$
|
(9,762
|
)
|
|
As a percent of revenue
|
2.9
|
%
|
4.7
|
%
|
3.1
|
%
|
(2.2
|
)%
|
||||
|
Net income (loss) attributable to Granite
3
|
$
|
16,173
|
|
$
|
37,190
|
|
$
|
14,199
|
|
$
|
(10,440
|
)
|
|
As a percent of revenue
|
2.4
|
%
|
4.6
|
%
|
2.3
|
%
|
(2.4
|
)%
|
||||
|
Net income (loss) per share attributable to
common shareholders:
|
|
|
|
|
||||||||
|
Basic
|
$
|
0.41
|
|
$
|
0.94
|
|
$
|
0.36
|
|
$
|
(0.27
|
)
|
|
Diluted
|
$
|
0.40
|
|
$
|
0.92
|
|
$
|
0.35
|
|
$
|
(0.27
|
)
|
|
2015 Quarters Ended
|
December 31,
|
September 30,
|
June 30,
|
March 31,
|
||||||||
|
Revenue
|
$
|
630,162
|
|
$
|
751,376
|
|
$
|
569,242
|
|
$
|
420,249
|
|
|
Gross profit
1
|
100,624
|
|
96,083
|
|
64,200
|
|
38,929
|
|
||||
|
As a percent of revenue
|
16.0
|
%
|
12.8
|
%
|
11.3
|
%
|
9.3
|
%
|
||||
|
Net income (loss)
2
|
$
|
35,139
|
|
$
|
32,180
|
|
$
|
9,539
|
|
$
|
(8,610
|
)
|
|
As a percent of revenue
|
5.6
|
%
|
4.3
|
%
|
1.7
|
%
|
(2.0
|
)%
|
||||
|
Net income (loss) attributable to Granite
|
$
|
28,673
|
|
$
|
30,759
|
|
$
|
9,613
|
|
$
|
(8,560
|
)
|
|
As a percent of revenue
|
4.6
|
%
|
4.1
|
%
|
1.7
|
%
|
(2.0
|
)%
|
||||
|
Net income (loss) per share attributable to
common shareholders:
|
|
|
|
|
||||||||
|
Basic
|
$
|
0.73
|
|
$
|
0.78
|
|
$
|
0.24
|
|
$
|
(0.22
|
)
|
|
Diluted
|
$
|
0.72
|
|
$
|
0.77
|
|
$
|
0.24
|
|
$
|
(0.22
|
)
|
1
Gross profit is higher than the amounts presented in the “Quarterly Financial Data” section previously reported in our Annual Report on Form 10-K for the year ended December 31, 2015 due to reclassification of restricted stock amortization from selling, general and administration expenses to cost of revenue. See “Gross Profit” and “Selling, General and Administrative Expenses” under “Item 7. Management’s Discussion and Analysis of Financial Condition and Results of Operations” for additional information.
2
During the third quarter of 2016, we recorded
$0.9 million
of restructuring gains resulting from sale of an underlying property in our equity method investment. During the fourth quarter of 2016, we recorded a
$1.0 million
restructuring gain resulting from the release of lease obligations During the fourth quarter of 2015, we recorded a restructuring gain of
$5.0 million
, which included amounts attributable to non-controlling interests of
$3.3 million
, associated with the sale of a previously impaired consolidated real estate investment and recorded a
$1.0 million
restructuring gain resulting from the sale of previously impaired non-performing quarry sites.
3
Net income (loss) attributable to Granite is higher than the amounts previously reported in our Quarterly Reports on Form 10-Q for the quarterly periods ended September 30, June 30 and March 31, 2016, due to $0.9 million reclassifications resulting from early adoption of ASU No. 2016-09,
Compensation - Stock Compensation (Topic 718): Improvements to Employe
e
Share-Based Payment Accounting
, of which $0.7 million was recorded in the first quarter of 2016 and the remaining $0.2 million was recorded in the second and third quarters of 2016 (see Note 1 of “Notes to the Consolidated Financial Statements”).
F- 37
SIGNATURES
Pursuant to the requirements of Section 13 or 15(d) of the Securities Exchange Act of 1934, the Registrant has duly caused this report to be signed on its behalf by the undersigned, thereunto duly authorized.
|
GRANITE CONSTRUCTION INCORPORATED
|
||
|
By: /s/ Laurel J. Krzeminski
|
||
|
Laurel J. Krzeminski
|
||
|
Executive Vice President and Chief Financial Officer
|
||
|
(Principal Financial and Accounting Officer)
|
||
Date:
February 17, 2017
Pursuant to the requirements of the Securities Exchange Act of 1934, this report has been signed below on
February 17, 2017
, by the following persons on behalf of the Registrant in the capacities indicated.
|
/s/ James H. Roberts
|
|
|
James H. Roberts, President and Chief Executive Officer
|
|
|
|
|
|
/s/ William H. Powell
|
|
|
William H. Powell, Chairman of the Board and Director
|
|
|
|
|
|
/s/ Claes G. Bjork
|
|
|
Claes G. Bjork, Director
|
|
|
|
|
|
/s/ James W. Bradford, Jr.
|
|
|
James W. Bradford, Jr., Director
|
|
|
|
|
|
/s/ William G. Dorey
|
|
|
William G. Dorey, Director
|
|
|
/s/ David H. Kelsey
|
|
|
David H. Kelsey, Director
|
|
|
/s/ Michael F. McNally
|
|
|
Michael F. McNally, Director
|
|
|
|
|
|
/s/ Gaddi H. Vasquez
|
|
|
Gaddi H. Vasquez, Director
|
|
|
/s/ David C. Darnell
|
|
|
David C. Darnell
|
|
|
/s/ Patricia D. Galloway
|
|
|
Patricia D. Galloway
|
|
|
/s/ Celeste B. Mastin
|
|
|
Celeste B. Mastin
|
|
INDEX TO 10-K EXHIBITS
|
Exhibit No.
|
|
Exhibit Description
|
|
2.1
|
*
|
Stock Purchase Agreement, dated December 28, 2012, by and between Granite Construction Incorporated and Kenny Industries, Inc. [Exhibit 2.1 to the Company’s Form 8-K filed on January 4, 2013]
|
|
3.1
|
*
|
Certificate of Incorporation of Granite Construction Incorporated, as amended [Exhibit 3.1.b to the Company’s Form 10-Q for quarter ended June 30, 2006]
|
|
3.2
|
*
|
Amended Bylaws of Granite Construction Incorporated [Exhibit 3.1 to the Company’s Form 8-K filed on November 15, 2011]
|
|
10.1
|
*
**
|
Key Management Deferred Compensation Plan II, as amended and restated [Exhibit 10.1 to the Company’s Form 10-Q for quarter ended March 31, 2010]
|
|
10.2
|
*
**
|
Granite Construction Incorporated Amended and Restated 1999 Equity Incentive Plan as Amended and Restated [Exhibit 10.1 to the Company’s Form 10-Q for quarter ended June 30, 2009]
|
|
10.2.a
|
*
**
|
Amendment No. 1 to the Granite Construction Incorporated Amended and Restated 1999 Equity Incentive Plan [Exhibit 10.2.a to the Company’s Form 10-K for year ended December 31, 2009]
|
|
10.7
|
*
|
Note Purchase Agreement between Granite Construction Incorporated and Certain Purchasers dated December 12, 2007 [Exhibit 10.1 to the Company’s Form 8-K filed January 31, 2008]
|
|
10.8
|
*
|
First Amendment to the Note Purchase Agreement, dated October 11, 2012, between Granite Construction Incorporated and the holders of the 2019 Notes party thereto. [Exhibit 10.7 to the Company’s Form 10-Q for the quarter ended September 30, 2012]
|
|
10.9
|
*
|
Subsidiary Guaranty Agreement from the Subsidiaries of Granite Construction Incorporated as Guarantors of the Guaranty of Notes and Note Agreement and the Guaranty of Payment and Performance dated December 12, 2007 [Exhibit 10.10 to the Company’s Form 10-K for year ended December 31, 2007]
|
|
10.11
|
*
**
|
Form of Amended and Restated Director and Officer Indemnification Agreement [Exhibit 10.10 to the Company’s Form 10-K for year ended December 31, 2002]
|
|
10.12
|
*
**
|
Executive Retention and Severance Plan II effective as of March 9, 2011 [Exhibit 10.1 to the Company’s Form 10-Q for the quarter ended March 31, 2011]
|
|
10.13
|
*
**
|
Form of Restricted Stock Agreement effective March 2010 [Exhibit 10.18 to the Company’s Form 10-K for the year ended December 31, 2010]
|
|
10.14
|
*
**
|
Form of Non-employee Director Stock Option Agreement as amended and effective April 7, 2006 [Exhibit 10.19 to the Company’s Form 10-K for the year ended December 31, 2010]
|
|
10.15
|
*
**
|
Form of Restricted Stock Units Agreement effective January 1, 2010 [Exhibit 10.20 to the Company’s Form 10-K for the year ended December 31, 2010]
|
|
10.16
|
*
**
|
Form of Non-employee Director Restricted Stock Units Agreement effective January 1, 2010 [Exhibit 10.21 to the Company’s Form 10-K for the year ended December 31, 2010]
|
|
10.17
|
*
**
|
Granite Construction Incorporated Annual Incentive Plan effective January 1, 2010, as amended [Exhibit 10.25 to the Company’s Form 10-K for the year ended December 31, 2011]
|
|
10.18
|
*
**
|
Amendment No. 2 to the Granite Construction Incorporated Annual Incentive Plan effective January 1, 2012 [Exhibit 10.25 to the Company’s Form 10-K for the year ended December 31, 2011]
|
|
10.19
|
*
**
|
Granite Construction Incorporated Long Term Incentive Plan effective January 1, 2010, as amended [Exhibit 10.25 to the Company’s Form 10-K for the year ended December 31, 2011]
|
|
10.20
|
*
**
|
Amendment No. 2 to the Granite Construction Incorporated Long Term Incentive Plan effective January 1, 2012 [Exhibit 10.25 to the Company’s Form 10-K for the year ended December 31, 2011]
|
|
10.21
|
*
**
|
Granite Construction Incorporated 2012 Equity Incentive Plan [Exhibit 10.1 to the Company’s Form 8-K filed on May 25, 2012]
|
|
10.22
|
*
**
|
Form of Non-Employee Director Restricted Stock Unit Agreement effective May 22, 2012 [Exhibit 10.2 to the Company’s Form 8-K filed on May 25, 2012]
|
|
10.23
|
*
**
|
Granite Construction Incorporated NEO LTIP Awards Form of Restricted Stock Unit Agreement (Vesting on Date of Grant) [Exhibit 10.30 to the Company's Form 10-K for the year ended December 31, 2012]
|
|
10.24
|
*
**
|
Granite Construction Incorporated NEO LTIP Awards Form of Restricted Stock Unit Agreement (3 Year Vesting Schedule) [Exhibit 10.31 to the Company's Form 10-K for the year ended December 31, 2012]
|
|
10.25
|
*
|
Second Amendment to Note Purchase Agreement, dated as of March 3, 2014 [Exhibit 10.32 to the Company's Form 10-K for the year ended December 31, 2013]
|
|
Exhibit No.
|
|
Exhibit Description
|
|
10.26
|
*
|
Second Amended and Restated Credit Agreement, dated October 28, 2015, by and among Granite Construction Incorporated, Granite Construction Company, GILC Incorporated, the lenders party thereto and Bank of America, N.A., as Administrative Agent, Collateral Agent, Swing Line Lender and L/C Issuer
|
|
10.27
|
*
|
Second Amended and Restated Guaranty Agreement, dated October 28, 2015, by and among Granite Construction Incorporated, the guarantors party thereto and Bank of America, N.A., as Administrative Agent
|
|
18.1
|
*
|
Preferability Letter from PricewaterhouseCoopers LLP [Exhibit 18 to the Company's Form 10-Q for quarter ended March 31, 2015]
|
|
21
|
†
|
|
|
23.1
|
†
|
|
|
31.1
|
†
|
|
|
31.2
|
†
|
|
|
32
|
††
|
|
|
95
|
†
|
|
|
101.INS
|
†
|
XBRL Instance Document
|
|
101.SCH
|
†
|
XBRL Taxonomy Extension Schema
|
|
101.CAL
|
†
|
XBRL Taxonomy Extension Calculation Linkbase
|
|
101.DEF
|
†
|
XBRL Taxonomy Extension Definition Linkbase
|
|
101.LAB
|
†
|
XBRL Taxonomy Extension Label Linkbase
|
|
101.PRE
|
†
|
XBRL Taxonomy Extension Presentation Linkbase
|
* Incorporated by reference
** Compensatory plan or management contract
† Filed herewith
†† Furnished herewith
TABLE OF CONTENTS
Part IItem 1. BusinessItem 1A. Risk FactorsItem 1B. Unresolved Staff CommentsItem 2. PropertiesItem 3. Legal ProceedingsItem 4. Mine Safety DisclosuresPart IIItem 5. Market For Registrant S Common Equity, Related Stockholder Matters and Issuer Purchases Of Equity SecuritiesItem 6. Selected Financial DataItem 7. Management S Discussion and Analysis Of Financial Condition and Results Of OperationsItem 7. Management S Discussion and Analysis Of Financial Condition andItem 7A. Quantitative and Qualitative Disclosures About Market RiskItem 8. Financial Statements and Supplementary DataItem 9. Changes in and Disagreements with Accountants on Accounting and Financial DisclosureItem 9A. Controls and ProceduresItem 9B. Other InformationPart IIIItem 10. Directors, Executive Officers and Corporate GovernanceItem 11. Executive CompensationItem 12. Security Ownership Of Certain Beneficial Owners and Management and Related Stockholder MattersItem 13. Certain Relationships and Related Transactions, and Director IndependenceItem 14. Principal Accountant Fees and ServicesPart IVItem 15. Exhibits, Financial Statement SchedulesItem 16. Form 10-k Summary