W.W. GRAINGER, INC.
10-Ks and 10-Qs
|
|
|
|
|
|
|
|
|
|
|
|
|
|
|
|
|
|
|
|
|
|
|
|
|
|
|
|
|
|
|
|
|
|
|
|
|
|
|
|
|
|
|
|
|
|
|
|
|
|
|
|
|
|
|
|
UNITED STATES
SECURITIES AND EXCHANGE COMMISSION
Washington, D.C. 20549
FORM 10-K
[X] ANNUAL REPORT PURSUANT TO SECTION 13 OR 15(d) OF THE SECURITIES EXCHANGE ACT OF 1934
For the fiscal year ended December 31, 2010
OR
[ ] TRANSITION REPORT PURSUANT TO SECTION 13 OR 15(d) OF THE SECURITIES EXCHANGE ACT OF 1934
For the transition period from
_______
to
_______
Commission File Number 1-5684
W.W. Grainger, Inc.
(Exact name of registrant as specified in its charter)
|
Illinois
|
36-1150280
|
|
|
(State or other jurisdiction of incorporation or organization)
|
(I.R.S. Employer Identification No.)
|
|
|
100 Grainger Parkway, Lake Forest, Illinois
|
60045-5201
|
|
|
(Address of principal executive offices)
|
(Zip Code)
|
|
|
(847) 535-1000
|
||
|
(Registrant’s telephone number including area code)
|
||
Securities registered pursuant to Section 12(b) of the Act:
Title of each class
Name of each exchange on which registered
Common Stock $0.50 par value New York Stock Exchange
Chicago Stock Exchange
Indicate by check mark if the registrant is a well-known seasoned issuer, as defined in Rule 405 of the Securities Act. Yes [X] No [ ]
Indicate by check mark if the registrant is not required to file reports pursuant to Section 13 or Section 15(d) of the Act. Yes [ ] No [X]
Indicate by check mark whether the registrant (1) has filed all reports required to be filed by Section 13 or 15(d) of the Securities Exchange Act of 1934 during the preceding 12 months (or for such shorter period that the registrant was required to file such reports), and (2) has been subject to such filing requirements for the past 90 days. Yes [X] No [ ]
Indicate by check mark whether the registrant has submitted electronically and posted on its corporate website, if any, every Interactive Data File required to be submitted and posted pursuant to Rule 405 of Regulation S-T (§232.405 of this chapter) during the preceding 12 months (or for such shorter period that the registrant was required to submit and post such files). Yes [X] No [ ]
Indicate by check mark if disclosure of delinquent filers pursuant to Item 405 of Regulation S-K is not contained herein, and will not be contained, to the best of registrant’s knowledge, in definitive proxy or information statements incorporated by reference in Part III of this Form 10-K or any amendment to this Form 10-K. [ ]
Indicate by check mark whether the registrant is a large accelerated filer, an accelerated filer, a non-accelerated filer, or a smaller reporting company. See the definitions of “large accelerated filer,” “accelerated filer” and “smaller reporting company” in Rule 12b-2 of the Exchange Act.
| Large accelerated filer [X] |
Accelerated filer [ ]
|
Non-accelerated filer [ ] |
Smaller reporting company [ ]
|
Indicate by check mark whether the registrant is a shell company (as defined in Rule 12b-2 of the Act). Yes [ ] No [X]
The aggregate market value of the voting common equity held by nonaffiliates of the registrant was $6,660,203,495 as of the close of trading as reported on the New York Stock Exchange on June 30, 2010. The Company does not have nonvoting common equity.
The registrant had 69,445,444 shares of common stock outstanding as of January 31, 2011.
DOCUMENTS INCORPORATED BY REFERENCE
Portions of the proxy statement relating to the annual meeting of shareholders of the registrant to be held on April 27, 2011, are incorporated by reference into Part III hereof.
1
TABLE OF CONTENTS
|
Page(s)
|
||||||
|
PART I
|
||||||
|
Item 1:
|
BUSINESS
|
3-5
|
||||
|
THE COMPANY
|
3
|
|||||
|
UNITED STATES
|
3-4
|
|||||
|
CANADA
|
4
|
|||||
|
OTHER BUSINESSES
|
4-5
|
|||||
|
SEASONALITY
|
5
|
|||||
|
COMPETITION
|
5
|
|||||
|
EMPLOYEES
|
5
|
|||||
|
WEBSITE ACCESS TO COMPANY REPORTS
|
5
|
|||||
|
Item 1A
:
|
RISK FACTORS
|
5-6
|
||||
|
Item 1B
:
|
UNRESOLVED STAFF COMMENTS
|
6
|
||||
|
Item 2:
|
PROPERTIES
|
7
|
||||
|
Item 3:
|
LEGAL PROCEEDINGS
|
7-8
|
||||
|
Item 4:
|
REMOVED AND RESERVED
|
8
|
||||
|
|
||||||
|
PART II
|
||||||
|
Item 5:
|
MARKET FOR REGISTRANT’S COMMON EQUITY, RELATED SHAREHOLDER
|
|||||
|
MATTERS AND ISSUER PURCHASES OF EQUITY SECURITIES
|
9-10
|
|||||
|
Item 6:
|
SELECTED FINANCIAL DATA
|
10
|
||||
|
Item 7:
|
MANAGEMENT’S DISCUSSION AND ANALYSIS OF FINANCIAL
|
|||||
|
CONDITION AND RESULTS OF OPERATIONS
|
11-20
|
|||||
|
Item 7A:
|
QUANTITATIVE AND QUALITATIVE DISCLOSURES ABOUT MARKET RISK
|
21
|
||||
|
Item 8:
|
FINANCIAL STATEMENTS AND SUPPLEMENTARY DATA
|
21
|
||||
|
Item 9:
|
CHANGES IN AND DISAGREEMENTS WITH ACCOUNTANTS
|
|||||
|
ON ACCOUNTING AND FINANCIAL DISCLOSURE
|
21
|
|||||
|
Item 9A:
|
CONTROLS AND PROCEDURES
|
21
|
||||
|
Item 9B:
|
OTHER INFORMATION
|
21
|
||||
|
PART III
|
||||||
|
Item 10:
|
DIRECTORS, EXECUTIVE OFFICERS AND CORPORATE GOVERNANCE
|
22
|
||||
|
Item 11:
|
EXECUTIVE COMPENSATION
|
23
|
||||
|
Item 12:
|
SECURITY OWNERSHIP OF CERTAIN BENEFICIAL OWNERS AND MANAGEMENT AND
|
|
||||
| RELATED STOCKHOLDER MATTERS | 23 | |||||
|
Item 13:
|
CERTAIN RELATIONSHIPS AND RELATED TRANSACTIONS, AND
|
|||||
|
DIRECTOR INDEPENDENCE
|
23
|
|||||
|
Item 14:
|
PRINCIPAL ACCOUNTING FEES AND SERVICES
|
23
|
||||
|
PART IV
|
||||||
|
Item 15:
|
EXHIBITS AND FINANCIAL STATEMENT SCHEDULES
|
23-25
|
||||
|
Signatures
|
60
|
|||||
|
|
||||||
2
The Company
W.W. Grainger, Inc., incorporated in the State of Illinois in 1928, is a broad-line distributor of maintenance, repair and operating supplies and other related products and services used by businesses and institutions primarily in the United States and Canada, with an expanding presence in Asia and Latin America. In this report, the words “Grainger” or “Company” mean W.W. Grainger, Inc. and its subsidiaries.
Grainger uses a multichannel business model to provide customers with a range of options for finding and purchasing products utilizing sales representatives, direct marketing materials and catalogs. Grainger serves approximately 2.0 million customers worldwide through a network of highly integrated branches, distribution centers, multiple websites and export services.
During 2010, Grainger acquired one business in the United States, three in Canada and an 80% ownership of a joint venture in Colombia. Their results are consolidated with Grainger from the respective acquisition dates.
Grainger’s two reportable segments are the United States and Canada. The United States segment reflects the results of Grainger’s U.S. business. The Canada segment reflects the results for Acklands – Grainger Inc., Grainger’s Canadian business. Other businesses include the following: MonotaRO Co., Ltd. (Japan), Grainger, S.A. de C.V. (Mexico), Grainger Industrial Supply India Private Limited (India), Grainger Caribe Inc. (Puerto Rico), Grainger China LLC (China), Grainger Colombia SAS (Colombia) and Grainger Panama S.A. (Panama). These businesses generate revenue through the distribution of maintenance, repair and operating supplies and products and provide related services. For segment and geographical information and consolidated net sales and operating earnings see
“Item 7: Management’s Discussion and Analysis of Financial Condition and Results of Operations”
and Note 19 to the Consolidated Financial Statements.
Grainger has centralized business support functions that provide coordination and guidance in the areas of accounting and finance, business development, communications and investor relations, compensation and benefits, information systems, health and safety, global supply chain functions, human resources, risk management, internal audit, legal, real estate, security, tax and treasury. These services are provided in varying degrees to all business units.
Grainger does not engage in product research and development activities. Items are regularly added to and deleted from Grainger’s product lines on the basis of customer demand, market research, recommendations of suppliers, sales volumes and other factors.
United States
The United States business offers a broad selection of maintenance, repair and operating supplies and other related products and services through local branches, catalogs and the Internet. In 2010, one business was acquired, SafetyCertified, Inc. (SafetyCertified), further broadening the offering of the United States business. SafetyCertified offers online programs and tools to assist organizations in their efforts to comply with various workplace safety requirements.
Grainger’s United States business offers a combination of product breadth, local availability, speed of delivery, detailed product information and competitively priced products and services. Products offered include material handling equipment, safety and security supplies, lighting and electrical products, power and hand tools, pumps and plumbing supplies, cleaning and maintenance supplies, forestry and agriculture equipment, building and home inspection supplies, vehicle and fleet components and many other items primarily focused on the facilities maintenance market. Services offered include inventory management and energy efficiency solutions.
The United States business operates more than 400 branches located in all 50 states. These branches are located in close proximity to the majority of U.S. businesses and serve the immediate needs of customers in their local markets by allowing them to pick up items directly from the branches. Branches range in size from small branches to large master branches. The branch network has approximately 5,000 employees who primarily fulfill counter and will-call product needs and provide customer service. An average branch is 22,000 square feet in size, has 12 employees and handles about 160 transactions per day. In the normal course of business, Grainger continually reviews the effectiveness of its branch network. In 2010, two branches were opened and 23 branches were closed.
The logistics network is comprised of a network of 14 distribution centers (DCs) of various sizes. Automated equipment and processes in the larger DCs allow them to handle the majority of the customer shipping for next day availability and replenish more than 400 branches that provide same day availability.
The business has a sales force of over 2,000 professionals who help businesses and institutions select the right products to find immediate solutions to maintenance problems and to reduce operating expenses and improve cash flows. Customers range from small and medium-sized businesses to large corporations, government entities and other institutions. They are primarily represented by purchasing managers or workers in facilities maintenance departments and service shops across a wide range of industries such as manufacturing, hospitality, transportation, government, retail, healthcare and education. Sales transactions during 2010 were made to approximately 1.7 million customers averaging 96,000 daily transactions. No single customer accounted for more than 5% of total sales.
3
The majority of the products sold by the United States business are well recognized national branded products, including private label items bearing Grainger’s registered trademarks, such as DAYTON® motors, SPEEDAIRE® air compressors, AIR HANDLER® air filtration equipment, DEM-KOTE® spray paints, WESTWARD® tools, CONDOR™ safety products and LUMAPRO® lighting products. Grainger has taken steps to protect these trademarks against infringement and believes that they will remain available for future use in its business.
The Grainger catalog, most recently issued in February 2011, offers approximately 350,000 facilities maintenance and other products and is used by customers, sales representatives and branch personnel to assist in customer product selection. Approximately 2.1 million copies of the catalog were produced. In addition, Grainger’s United States business issues targeted catalogs for its multiple branded products, as well as other marketing materials.
Customers can also purchase products through grainger.com. With access to more than 700,000 products, grainger.com serves as a prominent channel for the United States business. Grainger.com provides real-time price and product availability and detailed product information, and offers advanced features such as product search and compare capabilities. For customers with sophisticated electronic purchasing platforms, Grainger utilizes technology that allows these systems to communicate directly with grainger.com. Customers can also purchase products through several other branded websites.
The United States business purchases products for sale from more than 2,000 key suppliers, most of which are manufacturers. Through a global sourcing operation, the business procures competitively priced, high-quality products produced outside the United States from approximately 400 suppliers. Grainger sells these items primarily under private label brands. Products obtained through the global sourcing operation include DAYTON® motors, WESTWARD® tools, LUMAPRO® lighting products and CONDOR™ safety products, as well as products bearing other trademarks. No single supplier comprised more than 5% of total purchases and no significant difficulty has been encountered with respect to sources of supply.
Canada
Acklands – Grainger is Canada’s leading broad-line distributor of industrial and safety supplies. In 2010, Acklands – Grainger acquired three businesses, Ranson Industrial and Safety Supplies Inc., Solus Securite Inc. and Wolseley Industrial Products Group (Nova Scotia and New Brunswick).
The Canadian business serves customers through more than 170 branches and six DCs across Canada. Acklands – Grainger distributes tools, fasteners, safety supplies, instruments, welding and shop equipment, and many other items. During 2010, approximately 14,000 sales transactions were completed daily. A comprehensive catalog, printed in both English and French, showcases the product line to facilitate the customer’s product selection. The February 2011 catalog, with more than 106,000 products, is used by customers, sales account managers and branch personnel to assist in customer product selection. In addition, customers can purchase products through acklandsgrainger.com, a fully bilingual website.
Other Businesses
Included in the other businesses are the operations in Japan, Mexico, India, Puerto Rico, China, Colombia and Panama. The more significant businesses in this group are described below.
Japan
Grainger operates in Japan through a 53% interest in MonotaRO Co., Ltd. (MonotaRO). MonotaRO provides small and mid-sized domestic businesses with products that help them operate and maintain their facilities. MonotaRO is a catalog and a web-based direct marketer with approximately 70 percent of orders being conducted through the company’s website, monotaro.com.
Mexico
Grainger’s operations in Mexico provide local businesses with maintenance, repair and operating supplies and other related products primarily from Mexico and the United States. Mexico distributes products through a network of branches and one DC where customers have access to approximately 75,000 products through a Spanish-language catalog and through grainger.com.mx.
China
Grainger operates in China from a DC in Shanghai and a small regional warehouse in southern China. In addition, there are five sales offices in eastern China that allow sales representatives to work remotely and meet with customers. Customers have access to approximately 59,000 products through a Chinese-language catalog and through grainger.com.cn.
4
Colombia
In 2010, Grainger formed a joint venture with an affiliate of Torhefe S.A., THF International SAS (Colombia). Grainger owns an 80% majority position in the joint venture. Grainger’s operations in Colombia provide businesses with facilities maintenance supplies and other products, with an emphasis on fastener products. Customers have access to approximately 15,000 products through torhefe.com.
Seasonality
Grainger’s business in general is not seasonal, however, there are some products that typically sell more often during the winter or summer season. In any given month, unusual weather patterns, i.e., unusually hot or cold weather, could impact the sales volumes of these products, either positively or negatively.
Competition
Grainger faces competition in all markets it serves, from manufacturers (including some of its own suppliers) that sell directly to certain segments of the market, wholesale distributors, catalog houses, retail enterprises and Internet-based businesses.
Grainger provides local product availability, a broad product line, sales representatives, competitive pricing, catalogs (which include product descriptions and, in certain cases, extensive technical and application data), and electronic and Internet commerce technology. Other services such as inventory management and energy efficiency solutions to assist customers in lowering their total facilities maintenance costs are also offered. Grainger believes that it can effectively compete with manufacturers on small orders, but manufacturers may have an advantage in filling large orders.
Grainger serves a number of diverse markets. Based on available data, Grainger estimates the North American market for facilities maintenance and related products to be approximately $130 billion, of which Grainger’s share is approximately 5 percent. There are several large competitors, although the majority of the market is served by small local and regional competitors.
Employees
As of December 31, 2010, Grainger had approximately 18,500 employees, of whom approximately 17,000 were full-time and 1,500 were part-time or temporary. Grainger has never had a major work stoppage and considers employee relations to be good.
Website Access to Company Reports
Grainger makes available, through its website, free of charge, its Annual Report on Form 10-K, quarterly reports on Form 10-Q, current reports on Form 8-K, proxy statements and amendments to those reports, as soon as reasonably practicable after this material is electronically filed with or furnished to the Securities and Exchange Commission. This material may be accessed by visiting grainger.com/investor.
The following is a discussion of significant risk factors relevant to Grainger’s business that could adversely affect its financial position or results of operations.
Weakness in the economy could negatively impact Grainger’s sales growth.
Economic and industry trends affect Grainger’s business environments. Economic downturns can cause customers, both commercial and government, to idle or close facilities, delay purchases and otherwise reduce their ability to purchase Grainger’s products and services as well as their ability to make full and timely payments. Thus, a significant or prolonged slowdown in economic activity could negatively impact Grainger’s sales growth and results of operations.
The facilities maintenance industry is highly fragmented, and changes in competition could result in a decreased demand for Grainger’s products and services.
There are several large competitors in the industry, although most of the market is served by small local and regional competitors. Grainger faces competition in all markets it serves, from manufacturers (including some of its own suppliers) that sell directly to certain segments of the market, wholesale distributors, catalog houses, retail enterprises and Internet-based businesses. Competitive pressures could adversely affect Grainger’s sales and profitability.
Volatility in commodity prices may adversely affect operating margins.
Some of Grainger’s products contain significant amounts of commodity-priced materials, such as steel, copper, or oil, and are subject to price changes based upon fluctuations in the commodities market. Increases in the price of fuel could also drive up transportation costs. Grainger’s ability to pass on increases in costs depends on market conditions. The inability to pass along costs increases could result in lower operating margins. In addition, higher prices could impact demand for these products resulting in lower sales volumes.
5
Unexpected product shortages could negatively impact customer relationships, resulting in an adverse impact on results of operations.
Grainger’s competitive strengths include product selection and availability. Products are purchased from more than 3,000 key suppliers, no one of which accounted for more than 5% of total purchases. Historically, no significant difficulty has been encountered with respect to sources of supply; however, economic downturns can adversely affect a supplier’s ability to manufacture or deliver products. If Grainger were to experience difficulty in obtaining products, there could be a short-term adverse effect on results of operations and a longer-term adverse effect on customer relationships and Grainger’s reputation. In addition, Grainger has strategic relationships with key vendors. In the event Grainger was unable to maintain those relations, there might be a loss of competitive pricing advantages which could, in turn, adversely affect results of operations.
The addition of new product lines could impact future sales growth.
Grainger, from time to time, expands the breadth of its offerings by increasing the number of products it distributes. In 2006, Grainger launched a multiyear product line expansion program. The continued success of this program is expected to be a driver of growth in 2011 and beyond. Its success will depend on Grainger’s ability to accurately forecast market demand, obtain products from suppliers and effectively integrate these products into the supply chain. As such, there is a risk that the product line expansion program will not deliver the expected results which could negatively impact anticipated future sales growth.
Interruptions in the proper functioning of information systems or breaches of information systems security could disrupt operations and cause unanticipated increases in costs and/or decreases in revenues.
The proper functioning of Grainger’s information systems is critical to the successful operation of its business. Although Grainger’s information systems are protected with robust backup and security systems, including physical and software safeguards and remote processing capabilities, information systems are still vulnerable to natural disasters, power losses, unauthorized access, telecommunication failures and other problems. If critical information systems fail, are breached or are otherwise unavailable, Grainger’s ability to process orders, maintain proper levels of inventories, collect accounts receivable, pay expenses and maintain the security of Company, customer and employee data could be adversely affected.
In order to compete, Grainger must attract, retain and motivate key employees, and the failure to do so could have an adverse effect on results of operations.
In order to compete and have continued growth, Grainger must attract, retain and motivate executives and other key employees, including those in managerial, technical, sales, marketing and support positions. Grainger competes to hire employees and then must train them and develop their skills and competencies. Grainger’s operating results could be adversely affected by increased costs due to increased competition for employees, higher employee turnover or increased employee benefit costs.
Fluctuations in foreign currency have an effect on reported results of operations.
Foreign currency exchange rates and fluctuations have an impact on sales, costs and cash flows from international operations, and could affect reported financial performance.
Acquisitions involve a number of inherent risks, any of which could result in the benefits anticipated not being realized and have an adverse effect on results of operations.
Acquisitions, both foreign and domestic, involve various inherent risks, such as uncertainties in assessing the value, strengths, weaknesses, liabilities and potential profitability of acquired companies. There is a risk of potential losses of key employees of an acquired business and an ability to achieve identified operating and financial synergies anticipated to result from an acquisition. Additionally, problems could arise from the integration of the acquired business including unanticipated changes in the business or industry, or general economic conditions that affect the assumptions underlying the acquisition. Any one or more of these factors could cause Grainger not to realize the benefits anticipated to result from the acquisitions or have a negative impact on the fair value of the reporting units. Accordingly, goodwill and intangible assets recorded as a result of acquisitions could become impaired.
The Company’s business is subject to the risks of international operations.
Grainger derives a growing portion of its revenue and earnings from its international operations. Compliance with U.S. and foreign laws and regulations that apply to Grainger’s international operations, including without limitation import and export requirements, the Foreign Corrupt Practices Act, tax laws (including U.S. taxes on foreign subsidiaries), foreign exchange controls and cash repatriation restrictions, data privacy requirements, labor laws, and anti-competition regulations, increases the costs of doing business in foreign jurisdictions, and such costs may rise in the future as a result of changes in these laws and regulations or in their interpretation. Furthermore, Grainger has implemented policies and procedures designed to facilitate compliance with these laws and regulations, but there can be no assurance that employees, contractors, or agents will not violate such laws and regulations or Grainger’s policies. Any such violations could individually or in the aggregate materially adversely affect Grainger’s financial condition or operating results.
None.
6
As of December 31, 2010, Grainger’s owned and leased facilities totaled approximately 23.3 million square feet, an increase of approximately 4% from December 31, 2009. This increase is primarily the result of business acquisitions. The United States business and Acklands
–
Grainger
accounted for the majority of the total square footage. Branches in the United States range in size from approximately 1,400 to 109,000 square feet. Most are located in or near major metropolitan areas with many located in industrial parks. Typically, a branch is on one floor, consists primarily of warehouse space, sales areas and offices and has off-the-street parking for customers and employees. Distribution centers in the United States range in size from approximately 39,000 to 1,300,000 square feet. Grainger believes that its properties are generally in excellent condition and well maintained. Acklands
–
Grainger facilities are located throughout Canada.
A brief description of significant facilities follows:
|
Location
|
Facility and Use (6)
|
Size in Square
Feet (in 000’s)
|
|
United States (1)
|
402 United States branch locations
|
8,974
|
||
|
United States (2)
|
14 Distribution Centers
|
5,822
|
||
|
United States (3)
|
Other facilities
|
2,914
|
||
|
Canada (4)
|
185 Acklands – Grainger facilities
|
2,678
|
||
|
Other Businesses (5)
|
Other facilities
|
1,538
|
||
|
Chicago Area (2)
|
Headquarters and General Offices
|
1,327
|
||
|
Total Square Feet
|
23,253
|
|
(1)
|
United States branches consist of 277 owned and 125 leased properties. Most leases expire between 2011 and 2018.
|
|
(2)
|
These facilities are primarily owned.
|
|
(3)
|
These facilities include both owned and leased locations, consisting of storage facilities, office space, and idle properties including a one million square foot facility for a new distribution center in Illinois to be opened in 2012.
|
|
(4)
|
Acklands – Grainger facilities consist of general offices, distribution centers and branches, of which 62 are owned and 123 leased.
|
|
(5)
|
These facilities include owned and leased locations in Japan, Mexico, India, Puerto Rico, China, Colombia and Panama.
|
|
(6)
|
Owned facilities are not subject to any mortgages.
|
Grainger has been named, along with numerous other nonaffiliated companies, as a defendant in litigation in various states involving asbestos and/or silica. These lawsuits typically assert claims of personal injury arising from alleged exposure to asbestos and/or silica as a consequence of products purportedly distributed by Grainger. In 2010, Grainger was named in lawsuits relating to asbestos and/or silica involving approximately 190 new plaintiffs, and lawsuits relating to asbestos and/or silica involving approximately 150 plaintiffs were dismissed with respect to Grainger, typically based on the lack of product identification.
As of January 24, 2011, Grainger is named in cases filed on behalf of approximately 1,900 plaintiffs in which there is an allegation of exposure to asbestos and/or silica. Grainger has denied, or intends to deny, the allegations in all of the above-described lawsuits. If a specific product distributed by Grainger is identified in any of these lawsuits, Grainger would attempt to exercise indemnification remedies against the product manufacturer. In addition, Grainger believes that a substantial number of these claims are covered by insurance. Grainger has entered into agreements with its major insurance carriers relating to the scope, coverage and costs of defense of lawsuits involving claims of exposure to asbestos. While Grainger is unable to predict the outcome of these lawsuits, it believes that the ultimate resolution will not have, either individually or in the aggregate, a material adverse effect on Grainger’s consolidated financial position or results of operations.
Grainger is a party to a contract with the United States General Services Administration (the GSA) first entered into in 1999 and subsequently extended in 2004. The GSA contract had been the subject of an audit performed by the GSA’s Office of the Inspector General. In December 2007, the Company received a letter from the Commercial Litigation Branch of the Civil Division of the Department of Justice (the DOJ) regarding the GSA contract. The letter suggested that the Company had not complied with its disclosure obligations and the contract’s pricing provisions, and had potentially overcharged government customers under the contract.
7
Discussions relating to the Company’s compliance with its disclosure obligations and the contract’s pricing provisions are ongoing; the Company last met with the DOJ in December 2010. The timing and outcome of these discussions are uncertain and could include settlement or civil litigation by the DOJ to recover, among other amounts, treble damages and penalties under the False Claims Act. Due to the uncertainties surrounding this matter, an estimate of possible loss cannot be determined. While this matter is not expected to have a material adverse effect on the Company’s financial position, an unfavorable resolution could result in significant payments by the Company. The Company continues to believe that it has complied with the GSA contract in all material respects.
Grainger is a party to a contract with the United States Postal Service (the USPS) entered into in 2003 covering the sale of certain Maintenance Repair and Operating Supplies (the MRO Contract). The Company received a subpoena dated August 29, 2008, from the USPS Office of Inspector General seeking information about the Company’s pricing compliance under the MRO Contract. The Company has provided responsive information to the USPS and to the DOJ. The Company last met with the DOJ in December 2010.
Grainger is also a party to a contract with the USPS entered into in 2001 covering the sale of certain janitorial and custodial items (the Custodial Contract). The Company received a subpoena dated June 30, 2009, from the USPS Office of Inspector General seeking information about the Company’s pricing practices and compliance under the Custodial Contract. The Company has provided responsive information to the USPS and to the DOJ. The Company last met with the DOJ in December 2010.
The timing and outcome of the USPS investigations of the MRO Contract and the Custodial Contract are uncertain and could include settlement or civil litigation by the USPS to recover, among other amounts, treble damages and penalties under the False Claims Act. Due to the uncertainties surrounding these matters, an estimate of possible loss cannot be determined. While these matters are not expected to have a material adverse effect on the Company’s financial position, an unfavorable resolution could result in significant payments by the Company. The Company continues to believe that it has complied with each of the MRO Contract and the Custodial Contract in all material respects.
In addition to the foregoing, from time to time Grainger is involved in various other legal and administrative proceedings that are incidental to its business, including claims relating to product liability, premises liability, general negligence, environmental issues, employment, intellectual property and other matters. As a government contractor selling to federal, state and local governmental entities, Grainger is also subject to governmental or regulatory inquiries or audits or other proceedings, including those related to pricing compliance. It is not expected that the ultimate resolution of any of these matters will have, either individually or in the aggregate, a material adverse effect on Grainger’s consolidated financial position or results of operations.
8
Market Information and Dividends
Grainger’s common stock is listed on the New York Stock Exchange and the Chicago Stock Exchange, with the ticker symbol GWW. The high and low sales prices for the common stock and the dividends declared and paid for each calendar quarter during 2010 and 2009 are
shown below.
|
Prices
|
|||||||||||||
|
Quarters
|
High
|
Low
|
Dividends
|
||||||||||
|
2010
|
First
|
$ | 109.98 | $ | 96.13 | $ | 0.46 | ||||||
|
Second
|
116.07 | 96.50 | 0.54 | ||||||||||
|
Third
|
121.84 | 96.81 | 0.54 | ||||||||||
|
Fourth
|
139.09 | 117.25 | 0.54 | ||||||||||
|
Year
|
$ | 139.09 | $ | 96.13 | $ | 2.08 | |||||||
|
2009
|
First
|
$ | 81.18 | $ | 59.95 | $ | 0.40 | ||||||
|
Second
|
86.36 | 68.61 | 0.46 | ||||||||||
|
Third
|
91.55 | 77.67 | 0.46 | ||||||||||
|
Fourth
|
102.54 | 85.24 | 0.46 | ||||||||||
|
Year
|
$ | 102.54 | $ | 59.95 | $ | 1.78 | |||||||
Grainger expects that its practice of paying quarterly dividends on its common stock will continue, although the payment of future dividends is at the discretion of Grainger’s Board of Directors and will depend upon Grainger’s earnings, capital requirements, financial condition and other factors.
Holders
The approximate number of shareholders of record of Grainger’s common stock as of January 31, 2011, was 930 with approximately 69,000 additional shareholders holding stock through nominees.
Issuer Purchases of Equity Securities – Fourth Quarter
|
Period
|
Total Number
of Shares Purchased (A)
|
Average Price Paid per
Share (B)
|
Total Number of Shares Purchased as Part of Publicly Announced Plans or Programs (C)
|
Maximum Number of Shares That May
Yet Be Purchased Under the
Plans or Programs
|
|||||||||||||
|
Oct. 1 – Oct. 31
|
-
|
-
|
-
|
8,081,385
|
shares
|
||||||||||||
|
Nov. 1 – Nov. 30
|
-
|
-
|
-
|
8,081,385
|
shares
|
||||||||||||
|
Dec. 1 – Dec. 31
|
-
|
-
|
-
|
8,081,385
|
shares
|
||||||||||||
|
Total
|
-
|
-
|
-
|
||||||||||||||
|
(A)
|
There were no shares withheld to satisfy tax withholding obligations in connection with the vesting of employee restricted stock awards.
|
|
(B)
|
Average price paid per share includes any commissions paid and includes only those amounts related to purchases as part of publicly announced plans or programs.
|
|
(C)
|
Purchases were made pursuant to a share repurchase program approved by Grainger’s Board of Directors on July 28, 2010. Effective July 28, 2010, the Board of Directors granted authority to repurchase up to 10 million shares, which replaced the previous authorization of April 30, 2008. The program has no specified expiration date. Activity is reported on a trade date basis.
|
9
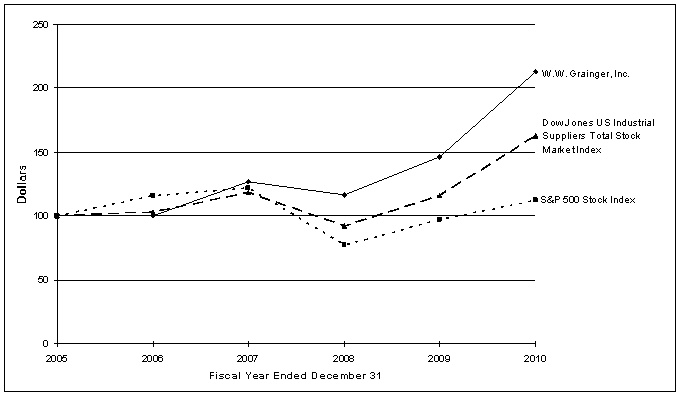
Company Performance
The following stock price performance graph compares the cumulative total return on an investment in Grainger common stock with the cumulative total return of an investment in each of the Dow Jones US Industrial Suppliers Total Stock Market Index and the S&P 500 Stock Index. It covers the period commencing December 31, 2005, and ending December 31, 2010. The graph assumes that the value for the investment in Grainger common stock and in each index was $100 on December 31, 2005, and that all dividends were reinvested.
|
December 31,
|
||||||||||||||||||||||||
|
2005
|
2006
|
2007
|
2008
|
2009
|
2010
|
|||||||||||||||||||
|
W.W. Grainger, Inc.
|
$ | 100 | $ | 100 | $ | 127 | $ | 117 | $ | 146 | $ | 213 | ||||||||||||
|
Dow Jones US Industrial Suppliers
Total Stock Market Index
|
100 | 103 | 118 | 92 | 116 | 163 | ||||||||||||||||||
|
S&P 500 Stock Index
|
100 | 116 | 122 | 77 | 97 | 112 | ||||||||||||||||||
|
2010
|
2009
|
2008
|
2007
|
2006
|
||||||||||||||||
|
(In thousands of dollars, except for per share amounts)
|
||||||||||||||||||||
|
Net sales
|
$ | 7,182,158 | $ | 6,221,991 | $ | 6,850,032 | $ | 6,418,014 | $ | 5,883,654 | ||||||||||
|
Net earnings attributable to W.W. Grainger, Inc.
|
510,865 | 430,466 | 475,355 | 420,120 | 383,399 | |||||||||||||||
|
Net earnings per basic share*
|
7.05 | 5.70 | 6.07 | 5.01 | 4.36 | |||||||||||||||
|
Net earnings per diluted share*
|
6.93 | 5.62 | 5.97 | 4.91 | 4.24 | |||||||||||||||
|
Total assets
|
3,904,377 | 3,726,332 | 3,515,417 | 3,094,028 | 3,046,088 | |||||||||||||||
|
Long-term debt (less current maturities)
|
420,446 | 437,500 | 488,228 | 4,895 | 4,895 | |||||||||||||||
|
Cash dividends paid per share
|
$ | 2.08 | $ | 1.78 | $ | 1.55 | $ | 1.34 | $ | 1.11 | ||||||||||
There were two unusual non-cash items included in 2010 earnings, a $0.28 per share benefit from a change to the paid time off policy and a $0.15 per share tax expense related to the tax treatment of retiree healthcare benefits following the passage of the Patient Protection and Affordable Care Act, which resulted in a net benefit of $0.13 per share. Results for 2009 included a $0.37 per share non-cash gain from the MonotaRO transaction in September 2009.
*In the first quarter of 2009, Grainger adopted authoritative guidance on “Determining Whether Instruments Granted in Share-Based Payment Transactions Are Participating Securities.” As a result, earnings per share were calculated under the new accounting guidance for 2009, and restated for 2008 and 2007. Earnings per share for 2006 were calculated using the treasury stock method and not restated because it was not practical and the impact is not considered material.
For further information see
“
Item 7: Management’s Discussion and Analysis of Financial Condition and Results of Operations
.”
10
Overview
General
.
Grainger is a broad-line distributor of maintenance, repair and operating supplies, and other related products and services used by businesses and institutions. Grainger’s operations are primarily in the United States and Canada, with an expanding presence in Asia and Latin America. Grainger uses a multichannel business model to provide customers with a range of options for finding and purchasing products utilizing sales representatives, direct marketing materials and catalogs. Grainger serves approximately 2.0 million customers worldwide through a network of highly integrated branches, distribution centers, multiple websites and export services.
Grainger’s two reportable segments are the United States and Canada. The United States segment reflects the results of Grainger’s U.S. operating segment. The Canada segment reflects the results for Acklands – Grainger Inc., Grainger’s Canadian operating segment. Other Businesses include the following operating segments which are not material individually and in the aggregate: MonotaRO Co., Ltd. (Japan), Grainger, S.A. de C.V. (Mexico), Grainger Industrial Supply India Private Limited (India), Grainger Caribe Inc. (Puerto Rico), Grainger China LLC (China), Grainger Colombia SAS (Colombia), and Grainger Panama S.A. (Panama).
Business Environment
.
Several economic factors and industry trends tend to shape Grainger’s business environment. The overall economy and leading economic indicators provide general insight into projecting Grainger’s growth. Historically, Grainger’s sales trends have tended to correlate with industrial production and non-farm payrolls. According to the Federal Reserve, overall industrial production increased 5.9% from December 2009 to December 2010. Both the United States’ and Canada’s GDP grew an estimated 2.9% in 2010. The improvement in the economy has positively affected Grainger’s sales growth for the twelve months of 2010.
In February 2011,
Consensus Forecasts-USA
projected 2011 Industrial Production and GDP growth for the United States of 4.6% and 3.2%, respectively, and GDP growth of 2.6% for Canada.
The light and heavy manufacturing customer sectors, which comprised approximately 25% of Grainger’s total 2010 sales, have historically correlated with manufacturing employment levels and manufacturing production. Manufacturing employment levels in the United States increased approximately 1.2% from December 2009 to December 2010, while manufacturing output increased 0.9% from December 2009 to December 2010. This increase in manufacturing employment and output contributed to an upper teen percent increase in the heavy manufacturing customer sector and a low double-digit percent increase in the light manufacturing customer sector for Grainger in 2010.
Outlook
.
Grainger intends to take advantage of its strong financial position by continuing to make investments in growth such as hiring additional sales representatives and on-site inventory services managers, and expanding product breadth and availability, and e-commerce capabilities, as well as the Company’s global presence. These investments should contribute to continued market share growth by helping businesses and institutions streamline their purchasing processes and reduce costs. As of January 25, 2011, Grainger forecasts 5 to 9 percent in sales growth and $7.15 to $7.90 of earnings per share for the full year of 2011.
The sales growth for 2011, while still strong, is expected to be at a lower rate than 2010 primarily due to more difficult comparisons. The 2010 results reflect the effect of economic recovery as well as a one percentage point contribution from sales of products used to assist in the oil spill cleanup that will not repeat in 2011.
Matters Affecting Comparability
.
There were 254 sales days in 2010, 255 in 2009 and 256 in 2008.
Grainger completed several acquisitions throughout 2010 and 2009, all of which were immaterial individually, and in the aggregate. Grainger’s operating results have included the results of each business acquired since the respective acquisition dates.
11
Results of Operations
The following table is included as an aid to understanding changes in Grainger’s Consolidated Statements of Earnings:
|
For the Years Ended December 31,
|
||||||||||||||||||||
|
As a Percent of Net Sales
|
Percent Increase/(Decrease) from Prior Year
|
|||||||||||||||||||
|
2010
|
2009
|
2008
|
2010
|
2009
|
||||||||||||||||
|
Net sales
|
100.0 | % | 100.0 | % | 100.0 | % | 15.4 | % | (9.2 | )% | ||||||||||
|
Cost of merchandise sold
|
58.2 | 58.2 | 59.0 | 15.3 | (10.4 | ) | ||||||||||||||
|
Gross profit
|
41.8 | 41.8 | 41.0 | 15.7 | (7.5 | ) | ||||||||||||||
|
Operating expenses
|
29.9 | 31.1 | 29.6 | 11.0 | (4.6 | ) | ||||||||||||||
|
Operating earnings
|
11.9 | 10.7 | 11.4 | 29.4 | (15.0 | ) | ||||||||||||||
|
Other income (expense)
|
(0.1 | ) | 0.7 | (0.1 | ) | (115.9 | ) | (545.5 | ) | |||||||||||
|
Income taxes
|
4.7 | 4.5 | 4.4 | 23.0 | (7.2 | ) | ||||||||||||||
|
Noncontrolling interest
|
0.0 | 0.0 | 0.0 | – | – | |||||||||||||||
|
Net earnings attributable to W.W. Grainger, Inc.
|
7.1 | % | 6.9 | % | 6.9 | % | 18.7 | % | (9.4 | )% | ||||||||||
2010 Compared to 2009
Grainger’s net sales of $7,182.2 million for 2010 increased 15.4% when compared with net sales of $6,222.0 million for 2009. There was one less selling day in 2010 versus 2009. Daily sales were up 15.9%. For 2010, approximately 10 percentage points of the sales growth came from an increase in volume, 4 percentage points came from business acquisitions, and 2 percentage points due to foreign exchange. Sales of products used to assist with the oil spill cleanup in the Gulf of Mexico and sales of seasonal products each contributed approximately 1 percentage point to the volume growth for 2010. Sales to all customer end-markets increased for 2010. The overall increase in net sales was led by a 30 percent increase to reseller customers, driven by sales of products used in the oil spill cleanup, a high teen percent increase to heavy manufacturing customers, followed by a low double-digit increase in light manufacturing. Refer to the
Segment Analysis
below for further details.
Gross profit of $3,005.7 million for 2010 increased 15.7%. The gross profit margin for 2010 was 41.8%, flat versus 2009. The gross profit margin was favorably affected by flat prices while product costs decreased, offset by faster sales growth from the lower margin international businesses and by an increase in sales to large customers which are generally at lower margins.
Operating expenses of $2,145.2 million for 2010 increased 11.0% from $1,933.3 million for 2009. Operating expenses increased primarily due to higher commissions, bonuses and profit sharing costs due to improved performance, partially offset by a $33.1 million benefit that resulted from a paid time off policy change, which reduced the related liability.
Operating earnings of $860.5 million for 2010 increased 29.4% from $665.2 million for 2009. The increase in operating earnings was primarily due to the strong sales growth and operating expenses which increased at a slower rate than sales.
Net earnings attributable to Grainger for 2010 increased by 18.7% to $510.9 million from $430.5 million in 2009. The increase in net earnings for 2010 primarily resulted from an increase in operating earnings. Diluted earnings per share of $6.93 in 2010 were 23.3% higher than $5.62 for 2009, due to increased net earnings and fewer shares outstanding. There were two unusual non-cash items included in 2010 earnings, a $0.28 per share benefit from a change to a paid time off policy and a $0.15 per share tax expense related to the tax treatment of retiree healthcare benefits following the passage of the Patient Protection and Affordable Care Act, which resulted in a net benefit of $0.13 per share. Results for 2009 included a $0.37 per share non-cash gain from the MonotaRO transaction in September 2009. Excluding these unusual items from both years, net earnings increased 29.4% and earnings per share increased 29.5% in 2010 versus 2009.
Segment Analysis
The following comments at the reportable segment and other business unit level include external and intersegment net sales and operating earnings. See Note 19 to the Consolidated Financial Statements.
United States
Net sales were $6,020.1 million for 2010, an increase of $574.7 million, or 10.6%, when compared with net sales of $5,445.4 million for 2009. Daily sales in the United States were up 11.0%. Approximately 9 percentage points of the sales growth came from an increase in volume. In addition, acquisitions and price each added 1 percentage point. Sales to all customer end-markets except contractor customers increased for 2010. The overall increase in net sales was led by a mid 20 percent increase to reseller customers driven by the sales of products used to assist in the oil spill cleanup, a high teen percent increase to heavy manufacturing customers and a low double-digit increase to light manufacturing customers.
12
The segment gross profit margin increased 0.6 percentage point in 2010 over 2009. The gross profit margin benefited from price increases exceeding product cost increases, partially offset by an increase in sales to large customers which are generally at lower margins.
Operating expenses were up 6.0% for 2010 versus 2009. Operating expenses increased primarily due to higher commissions, bonus expense and profit sharing costs due to improved performance, partially offset by a $29.7 million benefit that resulted from a paid time off policy change, which reduced the related liability.
For the segment, operating earnings of $920.2 million for 2010 increased 25.1% over $735.6 million in 2009. The improvement in operating earnings for 2010 was primarily due to an increase in net sales and gross profit margin, and operating expenses increasing at a slower rate than sales.
Canada
Net sales were $820.9 million for 2010, an increase of $169.7 million, or 26.1%, when compared with $651.2 million for 2009. Daily sales were up 26.6% and in local currency, daily sales increased 14.9% for 2010. Contributing to the sales growth was 3 percentage points for acquisitions. The increase in net sales was led by growth to oil and gas, construction, and agriculture and mining customers.
The gross profit margin increased 0.4 percentage point in 2010 over 2009, primarily driven by lower product costs including the positive effect of foreign currency exchange on buying products in U.S. dollars.
Operating expenses increased 32.0% in 2010. In local currency, operating expenses increased 19.7% primarily due to increased payroll and benefits costs including higher commissions and bonus expense, increased volume-related headcount and incremental costs for acquisitions made over the last year. Non-payroll related expenses also increased driven by higher travel, entertainment and advertising due to the sponsorship of the 2010 Winter Olympic Games, and increased occupancy and warehouse costs driven in part by the incremental costs for a distribution center opened in the 2010 second quarter.
Operating earnings of $46.8 million for 2010 were up $3.1 million, or 7.1%, versus 2009 due to the foreign exchange rate impact. In local currency, operating earnings decreased 1% primarily due to increased operating expenses as discussed above.
Other Businesses
Net sales for other businesses, which include Japan, Mexico, India, Puerto Rico, China, Colombia and Panama, were up 136.1% for 2010. Daily sales increased 137.0%. The increase in net sales was due primarily to the inclusion of a full year of results for Japan after obtaining controlling interest in September 2009 and Colombia, acquired in June 2010, along with strong growth from all the other international businesses. Operating earnings for other businesses were $11.7 million for 2010 compared to operating losses of $11.6 million for 2009.
Other Income and Expense
Other income and expense was $6.7 million of expense in 2010 compared with $42.1 million of income in 2009. The following table summarizes the components of other income and expense (in thousands of dollars):
|
For the Years Ended December 31,
|
||||||||
|
2010
|
2009
|
|||||||
|
Other income and (expense):
|
||||||||
|
Interest income (expense) – net
|
$ | (6,972 | ) | $ | (7,408 | ) | ||
|
Equity in net (loss) income of unconsolidated entities
|
(182 | ) | 1,497 | |||||
|
Gain on previously held equity interest – net
|
– | 47,343 | ||||||
|
Other non-operating income
|
1,608 | 964 | ||||||
|
Other non-operating expense
|
(1,151 | ) | (283 | ) | ||||
| $ | (6,697 | ) | $ | 42,113 | ||||
The change from net income to net expense was primarily attributable to the one-time non-cash gain of $47.4 million in 2009 from the step-up of the investment in MonotaRO after Grainger became a majority owner.
Income Taxes
Income taxes of $340.2 million in 2010 increased 23.0% as compared with $276.6 million in 2009. Grainger’s effective tax rates were 39.8% and 39.1% in 2010 and 2009, respectively. The increase in the tax rate in 2010 was primarily driven by a one-time tax expense related to the U.S. healthcare legislation passed in the first quarter of 2010. Excluding this one-time tax expense, the 2010 effective tax rate was 39.1%.
For 2011, Grainger is estimating its effective tax rate to be approximately 39.2%. The increase is primarily due to a higher income tax rate adopted in the state of Illinois in the first quarter of 2011.
13
2009 Compared to 2008
Grainger’s net sales of $6,222.0 million for 2009 decreased 9.2% when compared with net sales of $6,850.0 million for 2008. There was one less selling day in 2009 versus 2008. Daily sales were down 8.8%. Sales were negatively affected by a decline in volume of approximately 14 percentage points, partially offset by price increases of approximately 5 percentage points. In addition, sales were negatively affected by 1 percentage point due to foreign exchange, while sales from acquisitions contributed approximately 1 percentage point. The overall decrease in net sales was led by a mid 20 percent decline in the heavy manufacturing customer sector, followed by a low 20 percent decline in the reseller customer sector and a mid teen percent decline in the contractor customer sector. The government customer sector performed the strongest as sales were flat for 2009, followed by a mid single-digit decline in the commercial customer sector. Refer to the
Segment Analysis
below for further details.
Gross profit of $2,598.5 million for 2009 decreased 7.5%. The gross profit margin for 2009 increased 0.8 percentage point to 41.8% from 41.0% in 2008. The improvement in the gross profit margin was primarily driven by price increases exceeding product cost increases, partially offset by an increase in the mix of sales to large customers which are generally at lower margins.
Operating expenses of $1,933.3 million for 2009 decreased 4.6% from $2,025.6 million for 2008. Operating expenses decreased primarily due to lower payroll and benefits as a result of lower headcount, profit sharing and incentive compensation. Non-payroll related expenses also decreased due to cost containment efforts.
Operating earnings of $665.2 million for 2009 decreased 15.0% from $782.7 million for 2008. The decrease in operating earnings was primarily due to the decline in sales combined with operating expenses, which declined at a lower rate than sales. These declines were partially offset by an increase in gross profit margin.
Net earnings for 2009 decreased by 9.4% to $430.5 million from $475.4 million in 2008. The decline in net earnings for 2009 primarily resulted from the decline in operating earnings, partially offset by the one-time non-cash pretax gain of $47.4 million ($28 million after tax) from the step-up of the investment in MonotaRO after Grainger became a majority owner in September 2009. Diluted earnings per share of $5.62 in 2009 were 5.9% lower than $5.97 for 2008, primarily due to the decline in net earnings, partially offset by lower shares outstanding. In the first quarter of 2009, Grainger adopted authoritative guidance regarding “Determining Whether Instruments Granted in Share-Based Payment Transactions Are Participating Securities,” resulting in a seven cent reduction to the previously reported 2008 diluted earnings per share.
Segment Analysis
The following comments at the reportable segment and other business unit level include external and intersegment net sales and operating earnings. See Note 19 to the Consolidated Financial Statements.
United States
Net sales were $5,445.4 million for 2009, a decrease of $612.4 million, or 10.1%, when compared with net sales of $6,057.8 million for 2008. Daily sales in the United States were down 9.8%. All customer sectors were negatively impacted by economic conditions. The overall decrease in net sales was led by a mid 20 percent decline in the heavy manufacturing customer sector and in the reseller customer sector. The contractor and light manufacturing customer sectors declined in the mid teens and high single digits, respectively, while the government customer sector performed the strongest with flat sales for 2009.
Beginning in 2006, Grainger has added approximately 234,000 new products to supplement the plumbing, fastener, material handling and security product lines as part of the business’ ongoing product line expansion initiative. The catalog issued in February 2010 offered a total of 307,000 products, an increase of 70,000 products over the 2009 catalog.
The segment gross profit margin increased 1.3 percentage points in 2009 over 2008. The improvement in gross profit margin was primarily driven by price increases exceeding product cost increases, partially offset by an increase in the mix of lower margin sales to large customers.
Operating expenses in this segment were down 4.6% for 2009. Operating expenses decreased primarily due to lower payroll and benefits as a result of reduced headcount, lower profit sharing and no incentive compensation, partially offset by an increase in severance costs. Non-payroll related expenses also decreased due to cost containment efforts.
For the segment, operating earnings of $735.6 million for 2009 decreased 12.5% over $840.4 million for 2008. This decrease in operating earnings for 2009 was primarily due to the decline in net sales and operating expenses which declined at a lower rate than sales, partially offset by an increase in gross profit margin.
Canada
Net sales were $651.2 million for 2009, a decrease of $76.8 million, or 10.6%, when compared with $728.0 million for 2008. Daily sales were down 10.2% and in local currency, daily sales decreased 3.9% for 2009. The decrease in net sales was led by declines in the heavy manufacturing and contractor customer sectors driven by economic conditions. Partially offsetting these declines were strong sales to the utilities customer sector driven by special projects, and to higher sales to the government.
14
The gross profit margin decreased 1.1 percentage points in 2009 over 2008. The decline in the gross profit margin was primarily due to cost increases exceeding price increases and an increase in the mix of lower margin sales, particularly to large customers.
Operating expenses decreased 11.5% in 2009. In local currency, operating expenses decreased 5.6% primarily due to lower commissions and incentive compensation accruals, and non-payroll related expenses including lower travel and advertising costs. In addition, 2008 included expenses related to the bankruptcy of a provider of freight payment services.
Operating earnings of $43.7 million for 2009 were down $10.5 million, or 19.4%, versus 2008. In local currency, operating earnings decreased 15.6% primarily due to the decline in net sales and gross profit margin.
Other Businesses
Net sales for other businesses, which include Japan, Mexico, India, Puerto Rico, China and Panama, were up 47.7% for 2009. Daily sales increased 48.3%. The increase in net sales was due primarily to the inclusion of results from the acquisitions of the businesses in India and Japan, along with a positive contribution from China. Operating losses for other businesses were $11.6 million for 2009, a 1.6% improvement compared to operating losses of $11.8 million for 2008.
Other Income and Expense
Other income and expense was $42.1 million of income in 2009, an increase of $51.6 million as compared with $9.5 million of expense in 2008. The following table summarizes the components of other income and expense (in thousands of dollars):
|
For the Years Ended December 31,
|
||||||||
|
2009
|
2008
|
|||||||
|
Other income and (expense):
|
||||||||
|
Interest income (expense) – net
|
$ | (7,408 | ) | $ | (9,416 | ) | ||
|
Equity in net income of unconsolidated entities
|
1,497 | 3,642 | ||||||
|
Gain (write-off) of investment in unconsolidated entities
|
47,343 | (6,031 | ) | |||||
|
Other non-operating income
|
964 | 2,668 | ||||||
|
Other non-operating expense
|
(283 | ) | (317 | ) | ||||
| $ | 42,113 | $ | (9,454 | ) | ||||
The change from net expense to net income was primarily attributable to the one-time non-cash gain of $47.4 million from the step-up of the investment in MonotaRO after Grainger became a majority owner in September 2009. In addition, 2008 included the write-off of a joint venture investment in India as described in Note 6 to the Consolidated Financial Statements. Other operating income is lower primarily due to lower foreign currency transactions gains versus 2008.
Income Taxes
Income taxes of $276.6 million in 2009 decreased 7.2% as compared with $297.9 million in 2008. Grainger’s effective tax rates were 39.1% and 38.5% in 2009 and 2008, respectively. The increase in the tax rate in 2009 was primarily driven by increased U.S. state tax rates.
Financial Condition
Grainger expects its strong working capital position, cash flows from operations and borrowing capacity to continue, allowing it to fund its operations, including growth initiatives, capital expenditures, acquisitions and repurchase of shares, as well as to pay cash dividends.
Cash Flow
Fiscal year 2010 compared with fiscal year 2009
Cash from operating activities continues to serve as Grainger’s primary source of liquidity. Net cash flows from operations of $596.4 million in 2010 decreased $136.0 million from $732.4 million in 2009. Excluding business acquisitions, the decrease was primarily due to increases in accounts receivable of $127.8 million and inventories of $80.5 million, driven by the higher sales volumes. The decrease was partially offset by an increase in net earnings.
Net cash used in investing activities of $169.2 million in 2010 decreased $93.4 million versus $262.6 million in 2009. Net cash expended for property, buildings, equipment and software of $120.6 million decreased $20.1 million from $140.7 million in 2009. Additional information regarding capital spending is detailed in the
Capital Expenditures
section below. In addition, net cash paid for business acquisitions decreased $61.0 million versus 2009.
15
Net cash used in financing activities of $578.6 million in 2010 increased $165.1 million from $413.5 million in 2009. Grainger repaid $239.1 million of long-term debt in 2010 and issued $200.0 million of commercial paper, resulting in a net use of cash. Cash paid for treasury share purchases of $504.8 million was $132.1 million higher than $372.7 million in 2009. Grainger repurchased 4.6 million shares in 2010 compared to 4.5 million shares in 2009. In 2011, treasury share repurchases are expected to be $210 million to $265 million.
Fiscal year 2009 compared with fiscal year 2008
Net cash provided by operations of $732.4 million increased $202.3 million in 2009 versus $530.1 million in 2008. The increase was primarily driven by a decrease in inventories due to lower purchases in response to the slowdown in the economy and lower sales volumes. Partially offsetting the increase were lower net earnings of $44.6 million in 2009 versus 2008.
Net cash used in investing activities of $262.6 million in 2009 increased $59.9 million versus 2008. The increase was primarily due to $123.1 million paid for business acquisitions, net of cash acquired, $88.8 million higher than in 2008. Net cash expended for property, buildings, equipment and capitalized software was $140.7 million, $40.7 million lower than $181.4 million in 2008.
Net cash used in financing activities of $413.5 million in 2009 was $376.7 million higher than $36.8 million in 2008. Proceeds from a four-year bank term loan of $500.0 million were included in 2008 and used to pay off $95.9 million in commercial paper. Cash paid for treasury stock purchases of $372.7 million was $21.5 million lower than $394.2 million in 2008. Grainger repurchased 4.5 million shares in 2009 compared to 5.5 million shares in 2008.
Working Capital
Internally generated funds are the primary source of working capital and funds used in business expansion, supplemented by debt. In addition, funds are expended on facilities to support growth initiatives, as well as for business and systems development and other infrastructure improvements.
Working capital was $1,368.8 million at December 31, 2010, compared with $1,354.7 million at December 31, 2009 and $1,382.4 million at December 31, 2008. At these dates, the ratio of current assets to current liabilities was 2.6, 2.7 and 2.8. Working capital and the current ratio were essentially flat over this three-year period.
Capital Expenditures
In each of the past three years, a portion of operating cash flow has been used for additions to property, buildings, equipment and capitalized software as summarized in the following table (in thousands of dollars):
|
For the Years Ended December 31,
|
||||||||||||
|
2010
|
2009
|
2008
|
||||||||||
|
Land, buildings, structures and improvements
|
$ | 63,358 | $ | 67,917 | $ | 107,688 | ||||||
|
Furniture, fixtures, machinery and equipment
|
51,965 | 63,667 | 76,163 | |||||||||
|
Subtotal
|
115,323 | 131,584 | 183,851 | |||||||||
|
Capitalized software
|
16,217 | 8,367 | 12,297 | |||||||||
|
Total
|
$ | 131,540 | $ | 139,951 | $ | 196,148 | ||||||
In 2010 and 2009, significant capital expenditures included investments in the distribution center network in the U.S. and Canada. Additional expenditures were for normal recurring replacement of equipment.
In 2008, Grainger substantially completed its investments in the market expansion program in the United States that realigned branches in the top 25 major metropolitan areas. In addition, there was continued international investment, including branch expansion in Mexico, as well as the normal recurring replacement of equipment.
Capital expenditures are expected to range from $175 million to $200 million in 2011. Projected investments include continued investments in distribution centers, information technology, and the normal recurring replacement of equipment. Grainger expects to fund 2011 capital investments from operating cash flows.
Debt
Grainger maintains a debt ratio and liquidity position that provides flexibility in funding working capital needs and long-term cash requirements. In addition to internally generated funds, Grainger has various sources of financing available, including bank borrowings under lines of credit. A four-year bank term loan of $500.0 million obtained in May 2008 was partially prepaid by proceeds from $200.0 million of commercial paper issued in 2010. Grainger’s available lines of credit were $400.0 million at December 31, 2010 and $250.0 million at December 31, 2009 and 2008, respectively. Total debt as a percent of total capitalization was 17.8%, 19.1% and 20.7% as of the same dates. The reduction in total debt as a percent of total capitalization was primarily the result of the reduction in long-term debt. Grainger believes any circumstances that would trigger early payment or acceleration with respect to any outstanding debt obligations would not have a material impact on its results of operations or financial position.
16
Commitments and Other Contractual Obligations
At December 31, 2010, Grainger’s contractual obligations, including estimated payments due by period, are as follows (in thousands of dollars):
|
Payments Due by Period
|
||||||||||||||||||||
|
Total Amounts Committed
|
Less than 1 Year
|
1 – 3 Years
|
4 – 5 Years
|
More than 5 Years
|
||||||||||||||||
|
Long-term debt obligations
|
$ | 451,505 | $ | 31,059 | $ | 220,138 | $ | 200,055 | $ | 253 | ||||||||||
|
Interest on long-term debt
|
3,372 | 2,411 | 815 | 46 | 100 | |||||||||||||||
|
Operating lease obligations
|
201,563 | 45,461 | 72,787 | 48,471 | 34,844 | |||||||||||||||
|
Purchase obligations:
|
||||||||||||||||||||
|
Uncompleted additions to
property, buildings and equipment
|
54,323 | 53,923 | 192 | 208 | – | |||||||||||||||
|
Commitments to purchase inventory
|
272,052 | 271,720 | 332 | – | – | |||||||||||||||
|
Other purchase obligations
|
146,618 | 62,740 | 49,480 | 34,398 | – | |||||||||||||||
|
Other liabilities
|
346,540 | 154,009 | 19,091 | 21,405 | 152,035 | |||||||||||||||
|
Total
|
$ | 1,475,973 | $ | 621,323 | $ | 362,835 | $ | 304,583 | $ | 187,232 | ||||||||||
Purchase obligations for inventory are made in the normal course of business to meet operating needs. While purchase orders for both inventory purchases and non-inventory purchases are generally cancelable without penalty, certain vendor agreements provide for cancellation fees or penalties depending on the terms of the contract.
Other liabilities represent future benefit payments for postretirement benefit plans and postemployment disability medical benefits as determined by actuarial projections, and other employee benefit plans. Other employment-related benefits costs of $48.8 million have not been included in this table as the timing of benefit payments is not statistically predictable. See Note 11 to the Consolidated Financial Statements.
See also Notes 9 and 12 to the Consolidated Financial Statements for further detail related to the interest on long-term debt and operating lease obligations, respectively.
Grainger has recorded a noncurrent liability of $36.0 million for tax uncertainties and interest at December 31, 2010. This amount is excluded from the table above, as Grainger cannot make reliable estimates of these cash flows by period. See Note 17 to the Consolidated Financial Statements.
Off-Balance Sheet Arrangements
Grainger does not have any material exposures to off-balance sheet arrangements. Grainger does not have any variable interest entities or activities that include non-exchange-traded contracts accounted for at fair value.
Critical Accounting Estimates
The preparation of financial statements, in conformity with accounting principles generally accepted in the United States of America, requires management to make judgments, estimates and assumptions that affect the reported amounts of assets, liabilities, revenues and expenses in the financial statements. Management bases its estimates on historical experience and other assumptions, which it believes are reasonable. If actual amounts are ultimately different from these estimates, the revisions are included in Grainger’s results of operations for the period in which the actual amounts become known.
Accounting policies are considered critical when they require management to make assumptions about matters that are highly uncertain at the time the estimates are made and when there are different estimates that management reasonably could have made, which would have a material impact on the presentation of Grainger’s financial condition, changes in financial condition or results of operations.
Note 2 to the Consolidated Financial Statements describes the significant accounting policies used in the preparation of the Consolidated Financial Statements. The most significant areas involving management judgments and estimates follow. Actual results in these areas could differ materially from management’s estimates under different assumptions or conditions.
17
Allowance for Doubtful Accounts
.
Grainger considers several factors to estimate the allowance for uncollectible accounts receivable including the age of the receivables and the historical ratio of actual write-offs to the age of the receivables. The analyses performed also take into consideration economic conditions that may have an impact on a specific industry, group of customers or a specific customer. Based on analysis of actual historical write-offs of uncollectible accounts receivable, Grainger’s estimates and assumptions have been materially accurate in regards to the valuation of its allowance for doubtful accounts. However, write-offs could be materially different than the reserves established if business or economic conditions change or actual results deviate from historical trends, and Grainger’s estimates and assumptions may be revised as appropriate to reflect these changes. For years 2010, 2009 and 2008, actual results did not vary materially from estimated amounts.
Inventory Reserves
.
Grainger establishes inventory reserves for shrinkage and excess and obsolete inventory.
Provisions for inventory shrinkage are based on historical experience to account for unmeasured usage or loss. For fiscal years 2010, 2009 and 2008, actual results did not vary materially from estimated amounts.
Grainger regularly reviews inventory to evaluate continued demand and identify any obsolete or excess quantities. Grainger records provisions for the difference between excess and obsolete inventory and its estimated realizable value. Estimated realizable value is based on anticipated future product demand, market conditions and liquidation values. As Grainger’s inventory consists of approximately 800,000 stocked products, it is not practical to quantify the actual disposition of excess and obsolete inventory against estimated amounts at a SKU level and no individual SKU is material. There were no material differences noted between reserve levels compared to the level of write-offs historically. Grainger’s methodology for estimating reserves is continually evaluated based on current experience and the methodology provides for a materially accurate level of reserves at any reporting date. Actual results could differ materially from projections and require changes to reserves which could have a material effect on Grainger’s results of operations based on significant changes in product demand, market conditions or liquidation value. If business or economic conditions change, Grainger’s estimates and assumptions may be revised as appropriate. For fiscal years 2010, 2009 and 2008, actual results did not vary materially from estimated amounts.
Goodwill and Indefinite Lived Intangible Assets
.
Grainger’s business acquisitions typically result in the recording of goodwill and other intangible assets, which affect the amount of amortization expense and possibly impairment write-downs that Grainger may incur in future periods. Grainger annually reviews goodwill and intangible assets that have indefinite lives for impairment in the fourth quarter and when events or changes in circumstances indicate the carrying value of these assets might exceed their current fair values. Grainger tests for goodwill impairment at the reporting unit level. Grainger’s tests indicated that the fair values were substantially in excess of carrying values and thus did not fail step one of the goodwill impairment test. Grainger’s determination of fair value requires certain assumptions and estimates regarding future profitability and cash flows of acquired businesses and market conditions. However, due to the inherent uncertainties associated with using these assumptions, impairment charges could occur in future periods.
Stock Incentive Plans
.
Grainger maintains stock incentive plans under which a variety of incentive grants may be awarded to employees and directors. Grainger uses a binomial lattice option pricing model to estimate the value of stock option grants. The model requires projections of the risk-free interest rate, expected life, volatility, expected dividend yield and forfeiture rate of the stock option grants. The fair value of options granted in 2010, 2009 and 2008 used the following assumptions:
| For the Years Ended December 31 | ||||||||||||
| 2010 | 2009 | 2008 | ||||||||||
|
Risk-free interest rate
|
2.9 | % | 2.4 | % | 3.2 | % | ||||||
|
Expected life
|
6 years
|
6 years
|
6 years
|
|||||||||
|
Expected volatility
|
24.7 | % | 28.8 | % | 25.2 | % | ||||||
|
Expected dividend yield
|
2.0 | % | 2.3 | % | 1.8 | % | ||||||
The risk-free interest rate is selected based on yields from U.S. Treasury zero-coupon issues with a remaining term approximately equal to the expected term of the options being valued. The expected life selected for options granted during each year presented represents the period of time that the options are expected to be outstanding based on historical data of option holders’ exercise and termination behavior. Expected volatility is based upon implied and historical volatility of the closing price of Grainger’s stock over a period equal to the expected life of each option grant. Historical information is also the primary basis for selection of the expected dividend yield assumptions. Because stock option compensation expense is based on awards ultimately expected to vest, it has been reduced for estimated forfeitures, using historical forfeiture experience.
The amount of stock option compensation expense is significantly affected by the valuation model and these assumptions. If a different valuation model or different assumptions were used, the stock option compensation expense could be significantly different from what is recorded in the current period.
18
Compensation expense for other stock-based awards is based upon the closing market price on the last trading date preceding the date of the grant.
For additional information concerning stock incentive plans, see Note 13 to the Consolidated Financial Statements.
Postretirement Healthcare Benefits
.
Postretirement healthcare obligations and net periodic costs are dependent on assumptions and estimates used in calculating such amounts. The assumptions used include, among others, discount rates, assumed rates of return on plan assets and healthcare cost trend rates, and certain employee-related factors, such as turnover, retirement age and mortality rates. Changes in these and other assumptions (caused by conditions in equity markets or plan experience, for example) could have a material effect on Grainger’s postretirement benefit obligations and expense, and could affect its results of operations and financial condition. These changes in assumptions may also affect voluntary decisions to make additional contributions to the trust established for funding the postretirement benefit obligation.
The discount rate assumptions used by management reflect the rates available on high-quality fixed income debt instruments as of December 31, the measurement date, of each year. A lower discount rate increases the present value of benefit obligations and net periodic postretirement benefit costs. As of December 31, 2010, Grainger decreased the discount rate used in the calculation of
its postretirement plan obligation from 6.0% to 5.6% to reflect the decrease in market interest rates. Grainger estimates that this decrease in the discount rate will decrease 2011 pretax earnings by approximately $2.7 million, although other changes in assumptions may increase, decrease or eliminate this effect.
Grainger considers the long-term historical actual return on plan assets and the historical performance of the Standard & Poor’s 500 Index and, beginning in 2010, the Total International Composite Index, in developing its expected long-term return on plan assets. In 2010, Grainger maintained the expected long-term rate of return on plan assets of 6.0% (net of tax at 40%) based on the historical average of long-term rates of return.
A 1 percentage point change in assumed healthcare cost trend rates would have had the following effects on December 31, 2010 results (in thousands of dollars):
|
1 Percentage Point
|
||||||||
|
Increase
|
(Decrease)
|
|||||||
|
Effect on total of service and interest cost
|
$ | 6,638 | $ | (5,071 | ) | |||
|
Effect on accumulated postretirement benefit obligation
|
54,257 | (42,320 | ) | |||||
Grainger may terminate or modify the postretirement plan at any time, subject to the provisions of the Employee Retirement Income Security Act of 1974 (ERISA) and the Internal Revenue Code, as amended. In the event the postretirement plan is terminated, all assets of the Group Benefit Trust inure to the benefit of the participants. The foregoing assumptions are based on the presumption that the postretirement plan will continue. Were the postretirement plan to terminate, different actuarial assumptions and other factors might be applicable.
Grainger has used its best judgment in making assumptions and estimates and believes such assumptions and estimates used are appropriate. Changes to the assumptions may be required in future years as a result of actual experience or new trends and, therefore, may affect Grainger’s retirement plan obligations and future expense.
For additional information concerning postretirement healthcare benefits, see Note 11 to the Consolidated Financial Statements.
Insurance Reserves
.
Grainger retains a significant portion of the risk of certain losses related to workers’ compensation, general liability and property losses through the utilization of high deductibles and self-insured retentions. There are also certain other risk areas for which Grainger does not maintain insurance.
Grainger is responsible for establishing accounting policies on insurance reserves. Although it relies on outside parties to project future claims costs, it retains control over actuarial assumptions, including loss development factors and claim payment patterns. Grainger performs ongoing reviews of its insured and uninsured risks, which it uses to establish the appropriate reserve levels. In calculating the liability, historical trends, claims experience and loss development patterns are analyzed and appropriate loss development factors are applied to the incurred costs associated with the claims made.
The use of assumptions in the analysis leads to fluctuations in required reserves over time. Any change in the required reserve balance is reflected in the current period’s results of operations. Grainger believes its estimates are reasonable based on the information currently available and the methodology used to estimate these reserves has been consistently applied. There were no material adjustments based on Grainger’s historical experience in 2010, 2009 and 2008. If actual trends, including the nature, severity or frequency of claims differ from our estimates, or if business or economic conditions change, Grainger’s estimates and assumptions may be revised as appropriate and the results of operations could be materially impacted.
19
Income Taxes
.
Grainger recognizes deferred tax assets and liabilities for the expected future tax consequences of events that have been included in the financial statements or tax returns. Under this method, deferred tax assets and liabilities are determined based on the differences between the financial reporting and tax bases of assets and liabilities, using enacted tax rates in effect for the year in which the differences are expected to reverse. The tax balances and income tax expense recognized by Grainger are based on management’s interpretations of the tax laws of multiple jurisdictions. Income tax expense reflects Grainger’s best estimates and assumptions regarding, among other items, the level of future taxable income, interpretation of tax laws and tax planning opportunities and uncertain tax positions. Future rulings by tax authorities and future changes in tax laws and their interpretation, changes in projected levels of taxable income and future tax planning strategies could impact the actual effective tax rate and tax balances recorded by Grainger.
Other
.
Other significant accounting policies, not involving the same level of measurement uncertainties as those discussed above, are nevertheless important to an understanding of the financial statements. Policies such as revenue recognition, depreciation, intangibles, long-lived assets, fair value measurements and valuations, and warranties require judgments on complex matters that are often subject to multiple external sources of authoritative guidance such as the Financial Accounting Standards Board (FASB) and the Securities and Exchange Commission. Possible changes in estimates or assumptions associated with these policies are not expected to have a material effect on the financial condition or results of operations of Grainger. More information on these additional accounting policies can be found in Note 2 to the Consolidated Financial Statements.
Inflation
Inflation during the last three years has not had a significant effect on operations. The predominant use of the last-in, first-out (LIFO) method of accounting for inventories and accelerated depreciation methods for financial reporting and income tax purposes result in a substantial recognition of the effects of inflation in the financial statements.
Some of Grainger’s products contain significant amounts of commodity-priced materials, such as steel, copper or oil, and are subject to price changes based upon fluctuations in the commodities market. Grainger has been able to successfully pass on cost increases to its customers minimizing the effect of inflation on results of operations.
Grainger believes the most positive means to combat inflation and advance the interests of investors lie in the continued application of basic business principles, which include improving productivity, maintaining working capital turnover and offering products and services that can command appropriate prices in the marketplace.
Forward-Looking Statements
This Form 10-K contains statements that are not historical in nature but concern future results and business plans, strategies and objectives and other matters that may be deemed to be “forward-looking statements” under the federal securities laws. Grainger has generally identified such forward-looking statements by using words such as “anticipate, anticipated, assumed, assumes, assumption, assumptions, believe, believes, continue, continued, continues to believe it has complied, continuing, could, estimate, estimated, estimates, expectation, expected, expects, forecast, forecasts, intended, intends, may, might, plans, predict, predictable, presumption, project, projected, projecting, projection, projections, potential, potentially, reasonably likely, scheduled, should, tended, timing and outcome are uncertain, unanticipated, will, will be realized, and would” or similar expressions.
Grainger cannot guarantee that any forward-looking statement will be realized, although Grainger does believe that its assumptions underlying its forward-looking statements are reasonable. Achievement of future results is subject to risks and uncertainties that could cause Grainger’s results to differ materially from those which are presented.
Factors that could cause actual results to differ materially from those presented or implied in a forward-looking statement include, without limitation: higher product costs or other expenses; a major loss of customers; loss or disruption of source of supply; increased competitive pricing pressures; failure to develop or implement new technologies or business strategies; the outcome of pending and future litigation or governmental or regulatory proceedings; investigations, inquiries, audits and changes in laws and regulations; disruption of information technology or data security systems; general industry or market conditions; general global economic conditions; currency exchange rate fluctuations; market volatility; commodity price volatility; labor shortages; litigation involving appropriate payment for wages; facilities disruptions or shutdowns; higher fuel costs or disruptions in transportation services; natural and other catastrophes; unanticipated weather conditions; and the factors identified in Item 1A, Risk Factors.
Caution should be taken not to place undue reliance on Grainger’s forward-looking statements and Grainger undertakes no obligation to publicly update the forward-looking statements, whether as a result of new information, future events or otherwise.
20
Grainger is exposed to foreign currency exchange risk related to its transactions, and assets and liabilities denominated in foreign currencies. Grainger may use financial instruments to hedge certain exposures as part of its overall risk management strategy. In 2010, Grainger entered into a series of foreign currency forward contracts to minimize the foreign exchange rate effect on its net investment in its Canadian subsidiary. These foreign currency forward contracts are designated and qualify as a hedge of a net investment in a foreign subsidiary and therefore, the effective portion of the gain or loss is reported in other comprehensive income. Grainger does not enter into derivative financial instruments for trading or speculative purposes.
The net losses on Grainger’s net investment hedges reported in other comprehensive income were $3.6 million, net of tax effects, in 2010. See Notes 10 and 15 to the Consolidated Financial Statements for additional information on Grainger’s derivative activities.
For 2010, a uniform 10% strengthening of the U.S. dollar relative to foreign currencies that affect Grainger and its joint ventures would have resulted in a $2.7 million decrease in net earnings. Comparatively, in 2009 a uniform 10% strengthening of the U.S. dollar relative to foreign currencies that affect Grainger and its joint ventures would have resulted in a $0.9 million decrease in net earnings. A uniform 10% weakening of the U.S. dollar would have resulted in a $3.3 million increase in net earnings for 2010, as compared with an increase in net earnings of $1.1 million for 2009. This sensitivity analysis of the effects of changes in foreign currency exchange rates does not factor in potential changes in sales levels or local currency prices or costs.
Grainger is also exposed to interest rate risk in its debt portfolio. During 2010 and 2009, all of its long-term debt was variable rate debt. A 1 percentage point increase in interest rates paid by Grainger would have resulted in a decrease to net earnings of approximately $3.1 million for 2010 and $3.3 million for 2009. A 1 percentage point decrease in interest rates would have resulted in an increase to net earnings of approximately $3.1 million for 2010 and $3.3 million for 2009. This sensitivity analysis of the effects of changes in interest rates on long-term debt does not factor in potential changes in long-term debt levels.
Grainger has limited primary exposure to commodity price risk on certain products for resale, but does not purchase commodities directly.
The financial statements and supplementary data are included on pages 27 to 59. See the Index to Financial Statements and Supplementary Data on page 26.
|
|
None.
Disclosure Controls and Procedures
Grainger carried out an evaluation, under the supervision and with the participation of its management, including the Chief Executive Officer and the Chief Financial Officer, of the effectiveness of the design and operation of Grainger’s disclosure controls and procedures pursuant to Exchange Act Rule 13a-15. Based upon that evaluation, the Chief Executive Officer and the Chief Financial Officer concluded that Grainger’s disclosure controls and procedures were effective as of the end of the period covered by this report.
Internal Control Over Financial Reporting
|
(A)
|
Management’s Annual Report on Internal Control Over Financial Reporting
|
Management’s report on the Company’s internal control over financial reporting is included on page 27 of this Report under the heading Management’s Annual Report on Internal Control Over Financial Reporting.
|
(B)
|
Attestation Report of the Registered Public Accounting Firm
|
The report from Ernst & Young LLP on its audit of the effectiveness of Grainger’s internal control over financial reporting as of December 31, 2010, is included on page 28 of this Report under the heading Report of Independent Registered Public Accounting Firm.
|
(C)
|
Changes in Internal Control Over Financial Reporting
|
There have been no changes in Grainger’s internal control over financial reporting during the last fiscal quarter that have materially affected, or are reasonably likely to materially affect, Grainger’s internal control over financial reporting.
None.
21
The information required by this item is incorporated by reference to Grainger’s proxy statement relating to the annual meeting of shareholders to be held April 27, 2011, under the captions “Election of Directors,” “Board of Directors and Board Committees” and “Section 16(a) Beneficial Ownership Reporting Compliance.” Information required by this item regarding executive officers of Grainger is set forth below under the caption “Executive Officers.”
Grainger has adopted a code of ethics that applies to the principal executive officer, principal financial officer and principal accounting officer. This code of ethics is incorporated into Grainger’s business conduct guidelines for directors, officers and employees. Grainger intends to satisfy the disclosure requirement under Item 5.05 of Form 8-K relating to its code of ethics by posting such information on its website at
www.grainger.com/investor
. A copy of the code of ethics incorporated into Grainger’s business conduct guidelines is also available in print without charge to any person upon request to Grainger’s Corporate Secretary. Grainger has also adopted Operating Principles for the Board of Directors, which are available on its website and are available in print to any person who requests them.
Executive Officers
Following is information about the Executive Officers of Grainger including age as of February 25, 2011. Executive Officers of Grainger generally serve until the next annual election of officers, or until earlier resignation or removal.
|
Name and Age
|
Positions and Offices Held and Principal
Occupation and Employment During the Past Five Years
|
|
|
Laura D. Brown (47)
|
Senior Vice President, Communications and Investor Relations, a position assumed in 2010 after serving as Vice President, Global Business Communications, a position assumed in 2009 and Vice President, Investor Relations, a position assumed in 2008. Previously, Ms. Brown served as Vice President, Marketing, a position assumed in 2005. After joining Grainger in 2000, she served in various management positions including Vice President, Finance and Vice President, Internet Business Analysis and Supplier Management.
|
|
|
Court D. Carruthers (38)
|
President, Grainger International, a position assumed in 2009, and Senior Vice President of Grainger, a position assumed in 2007. Previously, Mr. Carruthers served as President of Acklands – Grainger Inc., a position assumed in 2006. Prior to assuming the last-mentioned position, he served as Vice President, National Accounts and Sales of Acklands – Grainger Inc., a position assumed in 2002 when he joined that company.
|
|
|
John L. Howard (53)
|
Senior Vice President and General Counsel, a position assumed in 2000.
|
|
|
Gregory S. Irving (52)
|
Vice President and Controller, a position assumed in 2008. Previously, Mr. Irving served as Vice President, Finance, for Acklands – Grainger Inc. since 2004. After joining Grainger in 1999 he served in various management positions including Vice President, Financial Services and Director, Internal Audit.
|
|
|
Ronald L. Jadin (50)
|
Senior Vice President and Chief Financial Officer, a position assumed in 2008. Previously, Mr. Jadin served as Vice President and Controller, a position assumed in 2006 after serving as Vice President, Finance. Upon joining Grainger in 1998, he served as Director, Financial Planning and Analysis.
|
|
|
Donald G. Macpherson (43)
|
Senior Vice President, Global Supply Chain, a position assumed in 2008. Mr. Macpherson joined Grainger in 2008 as Senior Vice President, Supply Chain. Before joining Grainger, he was Partner and Director of the Boston Consulting Group, a global management consulting firm and advisor on business strategy.
|
|
|
Michael A. Pulick (46)
|
Senior Vice President and President, Grainger U.S., a position assumed in 2008 after serving as Senior Vice President of Customer Service, a position assumed in 2006. After joining Grainger in 1999, Mr. Pulick has held a number of increasingly responsible positions in Grainger’s supplier and product management areas including Vice President, Product Management and Vice President, Merchandising.
|
|
|
James T. Ryan (52)
|
Chairman of the Board, President and Chief Executive Officer of Grainger, positions assumed in 2009, 2006 and 2008, respectively. Mr. Ryan became Chief Operating Officer and was appointed to Grainger’s Board of Directors in 2007. Prior to that, Mr. Ryan served as Group President, a position assumed in 2004. He has served Grainger in increasingly responsible roles since 1980, including Executive Vice President, Marketing, Sales and Service; Vice President, Information Services; President, Grainger.com; and President, Grainger Parts.
|
22
The information required by this item is incorporated by reference to Grainger’s proxy statement relating to the annual meeting of shareholders to be held April 27, 2011, under the captions “Board of Directors and Board Committees,” “Director Compensation,” “Report of the Compensation Committee of the Board” and “Compensation Discussion and Analysis.”
The information required by this item is incorporated by reference to Grainger’s proxy statement relating to the annual meeting of shareholders to be held April 27, 2011, under the captions “Ownership of Grainger Stock” and “Equity Compensation Plans.”
The information required by this item is incorporated by reference to Grainger’s proxy statement relating to the annual meeting of shareholders to be held April 27, 2011, under the captions "Election of Directors" and "Transactions with Related Persons."
The information required by this item is incorporated by reference to Grainger’s proxy statement relating to the annual meeting of shareholders to be held April 27, 2011, under the caption “Audit Fees and Audit Committee Pre-Approval Policies and Procedures.”
|
|
|
|
(a)
|
1.
|
Financial Statements. See Index to Financial Statements and Supplementary Data.
|
|
|
2.
|
Financial Statement Schedules. The schedules listed in Reg. 210.5-04 have been omitted because they are either not applicable or the required information is shown in the consolidated financial statements or notes thereto.
|
|
|
3.
|
Exhibits
|
|
|
(3)
|
(a)
|
Restated Articles of Incorporation, incorporated by reference to Exhibit 3(i) to Grainger’s Quarterly Report on Form 10-Q for the quarter ended June 30, 1998.
|
|
|
(b)
|
Bylaws, as amended February 17, 2010, incorporated by reference to Exhibit 3(b) to Grainger’s Annual Report on Form 10-K for the year ended December 31, 2009.
|
|
|
(4)
|
Instruments Defining the Rights of Security Holders, Including Indentures
|
|
|
(a)
|
No instruments which define the rights of holders of Grainger’s Industrial Development Revenue Bonds are filed herewith, pursuant to the exemption contained in Regulation S-K, Item 601(b)(4)(iii). Grainger hereby agrees to furnish to the Securities and Exchange Commission, upon request, a copy of any such instrument.
|
|
|
(10)
|
Material Contracts
|
|
|
(a)
|
(i)
|
A Credit Agreement with Wachovia Bank, National Association, as administrative agent, and other lenders, incorporated by reference to Exhibit 10 to Grainger's Quarterly Report on Form 10-Q for the quarter ended March 31, 2008.
|
|
|
(b)
|
Compensatory Plans or Arrangements
|
|
|
(i)
|
Director Stock Plan, as amended, incorporated by reference to Exhibit 10(c) to Grainger’s Quarterly Report on Form 10-Q for the quarter ended June 30, 2006.
|
|
|
(ii)
|
1990 Long-Term Stock Incentive Plan, as amended, incorporated by reference to Exhibit 10(a) to Grainger’s Quarterly Report on Form 10-Q for the quarter ended June 30, 2006.
|
|
|
(iii)
|
2001 Long-Term Stock Incentive Plan, as amended, incorporated by reference to Exhibit 10(b) to Grainger’s Quarterly Report on Form 10-Q for the quarter ended June 30, 2006.
|
|
|
(iv)
|
Form of Indemnification Agreement between Grainger and each of its directors and certain of its executive officers, incorporated by reference to Exhibit 10(b)(i) to Grainger’s Quarterly Report on Form 10-Q for the quarter ended March 31, 2009.
|
|
|
(v)
|
Executive Death Benefit Plan, as amended, incorporated by reference to Exhibit 10(b)(v) to Grainger's Annual Report on Form 10-K for the year ended December 31, 2007.
|
|
|
(1)
|
First amendment to the Executive Death Benefit Plan, incorporated by reference to Exhibit 10(b)(v)(1) to Grainger’s Annual Report on Form 10-K for the year ended December 31, 2008.
|
|
|
(2)
|
Second amendment to the Executive Death Benefit Plan, incorporated by reference to Exhibit 10(b)(iv)(2) to Grainger’s Annual Report on Form 10-K for the year ended December 31, 2009.
|
23
|
|
(vi)
|
Supplemental Profit Sharing Plan, as amended, incorporated by reference to Exhibit 10(viii) to Grainger’s Annual Report on Form 10-K for the year ended December 31, 2003.
|
|
|
(vii)
|
Supplemental Profit Sharing Plan II, as amended, incorporated by reference to Exhibit 10(b)(ix) to Grainger's Annual Report on Form 10-K for the year ended December 31, 2007.
|
|
|
(viii)
|
Voluntary Salary and Incentive Deferral Plan, as amended, incorporated by reference to Exhibit 10(b)(xi) to Grainger's Annual Report on Form 10-K for the year ended December 31, 2007.
|
|
|
(ix)
|
Summary Description of Directors Compensation Program effective April 29, 2009, incorporated by reference to Exhibit 10(b)(xiii) to Grainger’s Annual Report on Form10-K for the year ended December 31, 2008.
|
|
|
(x)
|
Summary Description of Directors Compensation Program effective April 28, 2010, incorporated by reference to Exhibit 10(b)(xii) to Grainger’s Annual Report on Form 10-K for the year ended December 31, 2009.
|
|
|
(xi)
|
Summary Description of Directors Compensation Program effective April 27, 2011.
|
|
|
(xii)
|
2005 Incentive Plan, as amended, incorporated by reference to Exhibit 10(d) to Grainger's Quarterly Report on Form 10-Q for the quarter ended June 30, 2006.
|
|
|
(xiii)
|
2010 Incentive Plan, incorporated by reference to Exhibit B of Grainger’s Proxy Statement dated March 12, 2010.
|
|
|
(xiv)
|
Form of Stock Option Award Agreement between Grainger and certain of its executive officers, incorporated by reference to Exhibit 10(xiv) to Grainger's Annual Report on Form 10-K for the year ended December 31, 2005.
|
|
|
(xv)
|
Form of Stock Option Award and Restricted Stock Unit Agreement between Grainger and certain of its executive officers, incorporated by reference to Exhibit 10(xv) to Grainger’s Annual Report on Form 10-K for the year ended December 31, 2005.
|
|
|
(xvi)
|
Form of Stock Option Award Agreement between Grainger and certain of its executive officers, incorporated by reference to Exhibit 10(b)(xvi) to Grainger’s Annual Report on Form 10-K for the year ended December 31, 2009.
|
|
|
(xvii)
|
Form of Stock Option and Restricted Stock Unit Agreement between Grainger and certain of its executive officers, incorporated by reference to Exhibit 10(b)(xvii) to Grainger's Annual Report on Form 10-K for the year ended December 31, 2009.
|
|
|
(xviii)
|
Form of Restricted Stock Unit Agreement between Grainger and certain of its executive officers.
|
|
|
(xix)
|
Form of Performance Share Award Agreement between Grainger and certain of its international executive officers, incorporated by reference to Exhibit 10(xvi) to Grainger's Annual Report on Form 10-K for the year ended December 31, 2005.
|
|
|
(xx)
|
Form of Performance Share Award Agreement (non-dividend equivalent) between Grainger and certain of its executive officers, incorporated by reference to Exhibit 10(b)(xviii) to Grainger's Annual Report on Form 10-K for the year ended December 31, 2008.
|
|
|
(xxi)
|
Form of Performance Share Award Agreement (non-dividend equivalent and recoupment) between Grainger and certain of its executive officers, incorporated by reference to Exhibit 10(b)(xx) to Grainger's Annual Report on Form 10-K for the year ended December 31, 2009.
|
|
|
(xxii)
|
Offer of Employment Letter to Mr. D.G. Macpherson dated December 14, 2007, incorporated by reference to Exhibit 10(b)(xxi) to Grainger’s Annual Report on Form 10-K for the year ended December 31, 2009.
|
|
|
(xxiii)
|
Summary Description of 2009 Management Incentive Program, incorporated by reference to Exhibit 10(b)(xxi) to Grainger’s Annual Report on Form 10-K for the year ended December 31, 2008.
|
|
|
(xxiv)
|
Summary Description of 2010 Management Incentive Program, incorporated by reference to Exhibit 10(b)(xxiv) to Grainger’s Annual Report on Form 10-K for the year ended December 31, 2009.
|
|
|
(xxv)
|
Summary Description of the 2011 Management Incentive Program.
|
|
|
(xxvi)
|
Incentive Program Recoupment Agreement, incorporated by reference to Exhibit 10(b)(xxv) to Grainger’s Annual Report on Form 10-K for the year ended December 31, 2009.
|
|
|
(xxvii)
|
Form of Change in Control Employment Agreement between Grainger and certain of its executive officers.
|
24
|
|
(21)
|
Subsidiaries of Grainger.
|
|
|
(23)
|
Consent of Independent Registered Public Accounting Firm.
|
|
|
(31)
|
Rule 13a – 14(a)/15d – 14(a) Certifications
|
|
|
(a)
|
Chief Executive Officer certification pursuant to Section 302 of the Sarbanes-Oxley Act of 2002.
|
|
|
(b)
|
Chief Financial Officer certification pursuant to Section 302 of the Sarbanes-Oxley Act of 2002.
|
|
|
(32)
|
Section 1350 Certifications
|
|
|
(a)
|
Chief Executive Officer certification pursuant to Section 906 of the Sarbanes-Oxley Act of 2002.
|
|
|
(b)
|
Chief Financial Officer certification pursuant to Section 906 of the Sarbanes-Oxley Act of 2002.
|
25
INDEX TO FINANCIAL STATEMENTS AND SUPPLEMENTARY DATA
December 31, 2010, 2009 and 2008
|
Page(s
)
|
|
|
MANAGEMENT’S ANNUAL REPORT ON INTERNAL CONTROL OVER FINANCIAL REPORTING
|
27
|
|
REPORTS OF INDEPENDENT REGISTERED PUBLIC ACCOUNTING FIRM
|
28-29
|
|
FINANCIAL STATEMENTS
|
|
|
CONSOLIDATED STATEMENTS OF EARNINGS
|
30
|
|
CONSOLIDATED STATEMENTS OF COMPREHENSIVE EARNINGS
|
31
|
|
CONSOLIDATED BALANCE SHEETS
|
32-33
|
|
CONSOLIDATED STATEMENTS OF CASH FLOWS
|
34-35
|
|
CONSOLIDATED STATEMENTS OF SHAREHOLDERS’ EQUITY
|
36
|
|
NOTES TO CONSOLIDATED FINANCIAL STATEMENTS
|
37-59
|
26
MANAGEMENT’S ANNUAL REPORT ON INTERNAL CONTROL OVER FINANCIAL REPORTING
The management of W.W. Grainger, Inc. (Grainger) is responsible for establishing and maintaining adequate internal control over financial reporting. Grainger’s internal control system was designed to provide reasonable assurance to Grainger’s management and Board of Directors regarding the reliability of financial reporting and the preparation of financial statements for external purposes in accordance with accounting principles generally accepted in the United States of America.
Because of its inherent limitations, internal control over financial reporting may not prevent or detect misstatements under all potential conditions. Therefore, effective internal control over financial reporting provides only reasonable, and not absolute, assurance with respect to the preparation and presentation of financial statements.
Grainger’s management assessed the effectiveness of Grainger’s internal control over financial reporting as of December 31, 2010, based on the framework set forth by the Committee of Sponsoring Organizations of the Treadway Commission in Internal Control – Integrated Framework.
Based on its assessment under that framework and the criteria established therein, Grainger’s management concluded that Grainger’s internal control over financial reporting was effective as of December 31, 2010.
Ernst & Young LLP, an independent registered public accounting firm, has audited Grainger’s internal control over financial reporting as of December 31, 2010, as stated in their report which is included herein.
27
REPORT OF INDEPENDENT REGISTERED PUBLIC ACCOUNTING FIRM
The Board of Directors and Shareholders
W.W. Grainger, Inc.
We have audited W.W. Grainger, Inc. and subsidiaries’ (the “Company”) internal control over financial reporting as of December 31, 2010 based on criteria established in Internal Control – Integrated Framework issued by the Committee of Sponsoring Organizations of the Treadway Commission (the COSO criteria). W.W. Grainger, Inc.’s management is responsible for maintaining effective internal control over financial reporting and for its assessment of the effectiveness of internal control over financial reporting included in the accompanying Management’s Annual Report on Internal Control Over Financial Reporting. Our responsibility is to express an opinion on the Company’s internal control over financial reporting based on our audit.
We conducted our audit in accordance with the standards of the Public Company Accounting Oversight Board (United States). Those standards require that we plan and perform the audit to obtain reasonable assurance about whether effective internal control over financial reporting was maintained in all material respects. Our audit included obtaining an understanding of internal control over financial reporting, assessing the risk that a material weakness exists, testing and evaluating the design and operating effectiveness of internal control based on the assessed risk, and performing such other procedures as we considered necessary in the circumstances. We believe that our audit provides a reasonable basis for our opinion.
A company’s internal control over financial reporting is a process designed to provide reasonable assurance regarding the reliability of financial reporting and the preparation of financial statements for external purposes in accordance with generally accepted accounting principles. A company’s internal control over financial reporting includes those policies and procedures that (1) pertain to the maintenance of records that, in reasonable detail, accurately and fairly reflect the transactions and dispositions of the assets of the company; (2) provide reasonable assurance that transactions are recorded as necessary to permit preparation of financial statements in accordance with generally accepted accounting principles, and that receipts and expenditures of the company are being made only in accordance with authorizations of management and directors of the company; and (3) provide reasonable assurance regarding prevention or timely detection of unauthorized acquisition, use, or disposition of the company’s assets that could have a material effect on the financial statements.
Because of its inherent limitations, internal control over financial reporting may not prevent or detect misstatements. Also, projections of any evaluation of effectiveness to future periods are subject to the risk that controls may become inadequate because of changes in conditions, or that the degree of compliance with the policies or procedures may deteriorate.
In our opinion, W.W. Grainger, Inc. and subsidiaries maintained, in all material respects, effective internal control over financial reporting as of December 31, 2010, based on the COSO criteria.
We also have audited, in accordance with the standards of the Public Company Accounting Oversight Board (United States), the consolidated balance sheets of W.W. Grainger, Inc. and subsidiaries as of December 31, 2010, 2009 and 2008 and the related consolidated statements of earnings, comprehensive earnings, shareholders’ equity, and cash flows for each of the three years in the period ended December 31, 2010 of W.W. Grainger, Inc. and subsidiaries and our report dated February 25, 2011 expressed an unqualified opinion thereon.
/s/ Ernst & Young LLP
Chicago, Illinois
February 25, 2011
28
REPORT OF INDEPENDENT REGISTERED PUBLIC ACCOUNTING FIRM
The Board of Directors and Shareholders
W.W. Grainger, Inc.
We have audited the accompanying consolidated balance sheets of W.W. Grainger, Inc. and subsidiaries as of December 31, 2010, 2009 and 2008, and the related consolidated statements of earnings, comprehensive earnings, shareholders’ equity, and cash flows for each of the three years in the period ended December 31, 2010. These financial statements are the responsibility of the Company’s management. Our responsibility is to express an opinion on these financial statements based on our audits.
We conducted our audits in accordance with the standards of the Public Company Accounting Oversight Board (United States). Those standards require that we plan and perform the audit to obtain reasonable assurance about whether the financial statements are free of material misstatement. An audit includes examining, on a test basis, evidence supporting the amounts and disclosures in the financial statements. An audit also includes assessing the accounting principles used and significant estimates made by management, as well as evaluating the overall financial statement presentation. We believe that our audits provide a reasonable basis for our opinion.
In our opinion, the financial statements referred to above present fairly, in all material respects, the consolidated financial position of W.W. Grainger, Inc. and subsidiaries at December 31, 2010, 2009, and 2008, and the consolidated results of their operations and their cash flows for each of the three years in the period ended December 31, 2010, in conformity with U.S. generally accepted accounting principles.
We also have audited, in accordance with the standards of the Public Company Accounting Oversight Board (United States), W.W. Grainger, Inc. and subsidiaries’ internal control over financial reporting as of December 31, 2010, based on criteria established in Internal Control-Integrated Framework issued by the Committee of Sponsoring Organizations of the Treadway Commission and our report dated February 25, 2011, expressed an unqualified opinion thereon.
/s/ Ernst & Young LLP
Chicago, Illinois
February 25, 2011
29
W.W. Grainger, Inc. and Subsidiaries
CONSOLIDATED STATEMENTS OF EARNINGS
(In thousands of dollars, except for per share amounts)
|
For the Years Ended December 31,
|
||||||||||||
|
2010
|
2009
|
2008
|
||||||||||
|
Net sales
|
$ | 7,182,158 | $ | 6,221,991 | $ | 6,850,032 | ||||||
|
Cost of merchandise sold
|
4,176,474 | 3,623,465 | 4,041,810 | |||||||||
|
Gross profit
|
3,005,684 | 2,598,526 | 2,808,222 | |||||||||
|
Warehousing, marketing and administrative
expenses
|
2,145,209 | 1,933,302 | 2,025,550 | |||||||||
|
Operating earnings
|
860,475 | 665,224 | 782,672 | |||||||||
|
Other income and (expense):
|
||||||||||||
|
Interest income
|
1,215 | 1,358 | 5,069 | |||||||||
|
Interest expense
|
(8,187 | ) | (8,766 | ) | (14,485 | ) | ||||||
|
Equity in net (loss) income of unconsolidated entities
|
(182 | ) | 1,497 | 3,642 | ||||||||
|
Gain (write-off) of investment in unconsolidated entities – net
|
– | 47,343 | (6,031 | ) | ||||||||
|
Other non-operating income
|
1,608 | 964 | 2,668 | |||||||||
|
Other non-operating expense
|
(1,151 | ) | (283 | ) | (317 | ) | ||||||
|
Total other income and (expense)
|
(6,697 | ) | 42,113 | (9,454 | ) | |||||||
|
Earnings before income taxes
|
853,778 | 707,337 | 773,218 | |||||||||
|
Income taxes
|
340,196 | 276,565 | 297,863 | |||||||||
|
Net earnings
|
513,582 | 430,772 | 475,355 | |||||||||
|
Less: Net earnings attributable to noncontrolling interest
|
2,717 | 306 | – | |||||||||
|
Net earnings attributable to W.W. Grainger, Inc.
|
$ | 510,865 | $ | 430,466 | $ | 475,355 | ||||||
|
Earnings per share:
|
||||||||||||
|
Basic
|
$ | 7.05 | $ | 5.70 | $ | 6.07 | ||||||
|
Diluted
|
$ | 6.93 | $ | 5.62 | $ | 5.97 | ||||||
|
Weighted average number of shares outstanding:
|
||||||||||||
|
Basic
|
70,836,945 | 73,786,346 | 76,579,856 | |||||||||
|
Diluted
|
72,138,858 | 74,891,852 | 77,887,620 | |||||||||
The accompanying notes are an integral part of these consolidated financial statements.
30
W.W. Grainger, Inc. and Subsidiaries
CONSOLIDATED STATEMENTS OF COMPREHENSIVE EARNINGS
(In thousands of dollars)
|
For the Years Ended December 31,
|
||||||||||||
|
2010
|
2009
|
2008
|
||||||||||
|
Net earnings
|
$ | 513,582 | $ | 430,772 | $ | 475,355 | ||||||
|
Other comprehensive earnings (losses):
|
||||||||||||
|
Foreign currency translation adjustments, net of
tax (expense)
benefit
of $(3,397), $(7,813) and $11,454, respectively
|
46,450 | 54,693 | (79,287 | ) | ||||||||
|
Derivative instruments, net of tax benefit of $2,257
|
(3,559 | ) | – | – | ||||||||
|
Reclassification of cumulative currency translation gain
|
– | (3,145 | ) | – | ||||||||
|
Defined postretirement benefit plan, net of tax
benefit
of $1,821, $984 and $19,368, respectively
|
(2,874 | ) | (1,552 | ) | (30,550 | ) | ||||||
|
Other employment-related benefit plans, net of tax
benefit
of $64, $205 and $544, respectively
|
(728 | ) | (554 | ) | (859 | ) | ||||||
|
Total other comprehensive earnings (losses)
|
39,289 | 49,442 | (110,696 | ) | ||||||||
|
Comprehensive earnings, net of tax
|
552,871 | 480,214 | 364,659 | |||||||||
|
Less: Comprehensive earnings attributable to noncontrolling interest:
|
||||||||||||
|
Net earnings
|
2,717 | 306 | – | |||||||||
|
Foreign currency translation adjustments
|
8,712 | (1,457 | ) | – | ||||||||
|
Comprehensive earnings attributable to W.W. Grainger, Inc.
|
$ | 541,442 | $ | 481,365 | $ | 364,659 | ||||||
The accompanying notes are an integral part of these consolidated financial statements.
31
W.W. Grainger, Inc. and Subsidiaries
CONSOLIDATED BALANCE SHEETS
(In thousands of dollars, except for per share amounts)
|
As of December 31,
|
||||||||||||
|
2010
|
2009
|
2008
|
||||||||||
|
ASSETS
|
||||||||||||
|
CURRENT ASSETS
|
||||||||||||
|
Cash and cash equivalents
|
$ | 313,454 | $ | 459,871 | $ | 396,290 | ||||||
|
Accounts receivable (less allowances for doubtful accounts
of $24,552, $25,850 and $26,481, respectively)
|
762,895 | 624,910 | 589,416 | |||||||||
|
Inventories – net
|
991,577 | 889,679 | 1,009,932 | |||||||||
|
Prepaid expenses and other assets
|
87,125 | 88,364 | 73,359 | |||||||||
|
Deferred income taxes
|
44,627 | 42,023 | 52,556 | |||||||||
|
Prepaid income taxes
|
38,393 | 26,668 | 22,556 | |||||||||
|
Total current assets
|
2,238,071 | 2,131,515 | 2,144,109 | |||||||||
|
PROPERTY, BUILDINGS AND EQUIPMENT
|
||||||||||||
|
Land
|
249,119 | 237,867 | 192,916 | |||||||||
|
Buildings, structures and improvements
|
1,133,392 | 1,078,439 | 1,048,440 | |||||||||
|
Furniture, fixtures, machinery and equipment
|
995,249 | 950,187 | 890,507 | |||||||||
| 2,377,760 | 2,266,493 | 2,131,863 | ||||||||||
|
Less accumulated depreciation and amortization
|
1,414,088 | 1,313,222 | 1,201,552 | |||||||||
|
Property, buildings and equipment – net
|
963,672 | 953,271 | 930,311 | |||||||||
|
DEFERRED INCOME TAXES
|
87,244 | 79,472 | 97,442 | |||||||||
|
INVESTMENTS IN UNCONSOLIDATED ENTITIES
|
3,461 | 3,508 | 20,830 | |||||||||
|
GOODWILL
|
387,232 | 351,182 | 213,159 | |||||||||
|
OTHER ASSETS AND INTANGIBLES – NET
|
224,697 | 207,384 | 109,566 | |||||||||
|
TOTAL ASSETS
|
$ | 3,904,377 | $ | 3,726,332 | $ | 3,515,417 | ||||||
32
W.W. Grainger, Inc. and Subsidiaries
CONSOLIDATED BALANCE SHEETS – CONTINUED
(In thousands of dollars, except for per share amounts)
|
As of December 31,
|
||||||||||||
|
2010
|
2009
|
2008
|
||||||||||
|
LIABILITIES AND SHAREHOLDERS’ EQUITY
|
||||||||||||
|
CURRENT LIABILITIES
|
||||||||||||
|
Short-term debt
|
$ | 42,769 | $ | 34,780 | $ | 19,960 | ||||||
|
Current maturities of long-term debt
|
31,059 | 53,128 | 21,257 | |||||||||
|
Trade accounts payable
|
344,295 | 300,791 | 290,802 | |||||||||
|
Accrued compensation and benefits
|
169,343 | 135,323 | 162,380 | |||||||||
|
Accrued contributions to employees’ profit sharing plans
|
145,119 | 121,895 | 146,922 | |||||||||
|
Accrued expenses
|
130,836 | 124,150 | 118,633 | |||||||||
|
Income taxes payable
|
5,882 | 6,732 | 1,780 | |||||||||
|
Total current liabilities
|
869,303 | 776,799 | 761,734 | |||||||||
|
LONG-TERM DEBT
(less current maturities)
|
420,446 | 437,500 | 488,228 | |||||||||
|
DEFERRED INCOME TAXES, TAX
UNCERTAINTIES AND DERIVATIVE
INSTRUMENTS
|
82,502 | 62,215 | 33,219 | |||||||||
|
ACCRUED EMPLOYMENT-RELATED
BENEFITS COSTS
|
244,456 | 222,619 | 198,431 | |||||||||
|
SHAREHOLDERS’ EQUITY
|
||||||||||||
|
Cumulative preferred stock –
$5 par value – 12,000,000 shares authorized;
none issued nor outstanding
|
– | – | – | |||||||||
|
Common stock – $0.50 par value –
300,000,000 shares authorized;
109,659,219 shares issued
|
54,830 | 54,830 | 54,830 | |||||||||
|
Additional contributed capital
|
637,686 | 596,358 | 564,728 | |||||||||
|
Retained earnings
|
4,326,761 | 3,966,508 | 3,670,726 | |||||||||
|
Accumulated other comprehensive earnings (losses)
|
42,951 | 12,374 | (38,525 | ) | ||||||||
|
Treasury stock, at cost –
40,281,417, 37,382,703 and
34,878,190 shares, respectively
|
(2,857,012 | ) | (2,466,350 | ) | (2,217,954 | ) | ||||||
|
Total W.W. Grainger, Inc. shareholders’ equity
|
2,205,216 | 2,163,720 | 2,033,805 | |||||||||
|
Noncontrolling interest
|
82,454 | 63,479 | – | |||||||||
|
Total shareholders’ equity
|
2,287,670 | 2,227,199 | 2,033,805 | |||||||||
|
TOTAL LIABILITIES AND SHAREHOLDERS’
EQUITY
|
$ | 3,904,377 | $ | 3,726,332 | $ | 3,515,417 | ||||||
The accompanying notes are an integral part of these consolidated financial statements.
33
W.W. Grainger, Inc. and Subsidiaries
CONSOLIDATED STATEMENTS OF CASH FLOWS
(In thousands of dollars)
|
For the Years Ended December 31,
|
||||||||||||
|
2010
|
2009
|
2008
|
||||||||||
|
CASH FLOWS FROM OPERATING ACTIVITIES:
|
||||||||||||
|
Net earnings
|
$ | 513,582 | $ | 430,772 | $ | 475,355 | ||||||
|
Provision for losses on accounts receivable
|
6,718 | 10,748 | 12,924 | |||||||||
|
Deferred income taxes and tax uncertainties
|
(5,553 | ) | 21,683 | 5,182 | ||||||||
|
Depreciation and amortization
|
149,678 | 147,531 | 139,570 | |||||||||
|
Stock-based compensation
|
49,796 | 43,301 | 47,870 | |||||||||
|
(Gain) write-off of unconsolidated entities
|
– | (47,343 | ) | 6,031 | ||||||||
|
Change in operating assets and liabilities –
net of business acquisitions:
|
||||||||||||
|
Accounts receivable
|
(127,790 | ) | 2,794 | (5,592 | ) | |||||||
|
Inventories
|
(80,545 | ) | 175,286 | (92,518 | ) | |||||||
|
Prepaid expenses
|
(8,806 | ) | (11,180 | ) | (33,629 | ) | ||||||
|
Trade accounts payable
|
36,219 | (16,736 | ) | (6,960 | ) | |||||||
|
Other current liabilities
|
49,576 | (52,944 | ) | 199 | ||||||||
|
Current income taxes payable
|
(1,503 | ) | 2,472 | (7,784 | ) | |||||||
|
Accrued employment-related benefits costs
|
18,128 | 22,080 | 3,216 | |||||||||
|
Other – net
|
(3,055 | ) | 3,932 | (13,798 | ) | |||||||
|
Net cash provided by operating activities
|
596,445 | 732,396 | 530,066 | |||||||||
|
CASH FLOWS FROM INVESTING ACTIVITIES:
|
||||||||||||
|
Additions to property, buildings and
equipment –
net of dispositions
|
(120,616 | ) | (140,730 | ) | (181,355 | ) | ||||||
|
Cash paid for business acquisitions, net of cash acquired
|
(62,072 | ) | (123,093 | ) | (34,290 | ) | ||||||
|
Other – net
|
13,529 | 1,260 | 13,010 | |||||||||
|
Net cash used in investing activities
|
$ | (169,159 | ) | $ | (262,563 | ) | $ | (202,635 | ) | |||
34
W.W. Grainger, Inc. and Subsidiaries
CONSOLIDATED STATEMENTS OF CASH FLOWS – CONTINUED
(In thousands of dollars)
|
For the Years Ended December 31,
|
||||||||||||
|
2010
|
2009
|
2008
|
||||||||||
|
CASH FLOWS FROM FINANCING ACTIVITIES:
|
||||||||||||
|
Net increase (decrease) in commercial paper
|
$ | 200,000 | $ | – | $ | (95,947 | ) | |||||
|
Borrowings under lines of credit
|
35,297 | 46,125 | 29,959 | |||||||||
|
Payments against lines of credit
|
(29,799 | ) | (43,583 | ) | (15,437 | ) | ||||||
|
Proceeds from issuance of long-term debt
|
– | – | 500,000 | |||||||||
|
Payments of long-term debt
|
(239,122 | ) | (18,856 | ) | – | |||||||
|
Proceeds from stock options exercised
|
86,528 | 91,165 | 46,833 | |||||||||
|
Excess tax benefits from stock-based compensation
|
25,650 | 19,030 | 13,533 | |||||||||
|
Purchase of treasury stock
|
(504,803 | ) | (372,727 | ) | (394,247 | ) | ||||||
|
Cash dividends paid
|
(152,338 | ) | (134,684 | ) | (121,504 | ) | ||||||
|
Net cash used in financing activities
|
(578,587 | ) | (413,530 | ) | (36,810 | ) | ||||||
|
Exchange rate effect on cash and cash equivalents
|
4,884 | 7,278 | (7,768 | ) | ||||||||
|
NET (DECREASE) INCREASE IN CASH AND CASH EQUIVALENTS
|
(146,417 | ) | 63,581 | 282,853 | ||||||||
|
Cash and cash equivalents at beginning of year
|
459,871 | 396,290 | 113,437 | |||||||||
|
Cash and cash equivalents at end of year
|
$ | 313,454 | $ | 459,871 | $ | 396,290 | ||||||
|
Supplemental cash flow information:
|
||||||||||||
|
Cash payments for interest (net of amounts capitalized)
|
$ | 8,188 | $ | 8,766 | $ | 14,508 | ||||||
|
Cash payments for income taxes
|
319,754 | 235,043 | 306,960 | |||||||||
The accompanying notes are an integral part of these consolidated financial statements.
35
W.W. Grainger, Inc. and Subsidiaries
CONSOLIDATED STATEMENTS OF SHAREHOLDERS’ EQUITY
(In thousands of dollars, except for per share amounts)
|
W.W. Grainger, Inc. Shareholders’ Equity
|
||||||||||||||||||||||||
|
Common Stock
|
Additional Contributed Capital
|
Retained Earnings
|
Accumulated Other Comprehensive Earnings (Losses)
|
Treasury Stock
|
Noncontrolling
Interest
|
|||||||||||||||||||
|
Balance at January 1, 2008
|
$ | 54,830 | $ | 475,350 | $ | 3,316,875 | $ | 72,171 | $ | (1,821,118 | ) | $ | – | |||||||||||
|
Exercise of stock options
|
– | (12,663 | ) | – | – | 59,460 | – | |||||||||||||||||
|
Tax benefits on stock-based
compensation awards
|
– | 15,458 | – | – | – | – | ||||||||||||||||||
|
Stock option expense
|
– | 19,868 | – | – | – | – | ||||||||||||||||||
|
Amortization of other stock-
based
compensation awards
|
– | 26,077 | – | – | – | – | ||||||||||||||||||
|
Settlement and vesting of other
stock-
based
compensation awards
|
– | (9,362 | ) | – | – | 4,792 | – | |||||||||||||||||
|
Purchase of treasury stock
|
– | 50,000 | – | – | (461,088 | ) | – | |||||||||||||||||
|
Net earnings
|
– | – | 475,355 | – | – | – | ||||||||||||||||||
|
Other comprehensive earnings
|
– | – | – | (110,696 | ) | – | – | |||||||||||||||||
|
Cash dividends paid
($1.55
per share)
|
– | – | (121,504 | ) | – | – | – | |||||||||||||||||
|
Balance at December 31, 2008
|
$ | 54,830 | $ | 564,728 | $ | 3,670,726 | $ | (38,525 | ) | $ | (2,217,954 | ) | $ | – | ||||||||||
|
Exercise of stock options
|
– | (15,614 | ) | – | – | 106,255 | 96 | |||||||||||||||||
|
Tax benefits on stock-based
compensation awards
|
– | 21,924 | – | – | – | – | ||||||||||||||||||
|
Stock option expense
|
– | 16,100 | – | – | – | 98 | ||||||||||||||||||
|
Amortization of other stock-
based
compensation awards
|
– | 24,307 | – | – | – | – | ||||||||||||||||||
|
Settlement and vesting of other stock-
based
compensation awards
|
– | (15,087 | ) | – | – | 7,599 | – | |||||||||||||||||
|
Purchase of treasury stock
|
– | – | – | – | (362,250 | ) | – | |||||||||||||||||
|
Net earnings
|
– | – | 430,466 | – | – | 306 | ||||||||||||||||||
|
Other comprehensive earnings
|
– | – | – | 50,899 | – | (1,457 | ) | |||||||||||||||||
|
Cash dividends paid
($1.78
per share)
|
– | – | (134,684 | ) | – | – | – | |||||||||||||||||
|
Fair value at acquisition
|
– | – | – | – | – | 64,436 | ||||||||||||||||||
|
Balance at December 31, 2009
|
$ | 54,830 | $ | 596,358 | $ | 3,966,508 | $ | 12,374 | $ | (2,466,350 | ) | $ | 63,479 |
|
Exercise of stock options
|
– | (11,211 | ) | – | – | 98,052 | 171 | |||||||||||||||||
|
Tax benefits on stock-based
compensation awards
|
– | 28,225 | – | – | – | – | ||||||||||||||||||
|
Stock option expense
|
– | 17,163 | – | – | – | 333 | ||||||||||||||||||
|
Amortization of other stock-
based
compensation awards
|
– | 29,725 | – | – | – | – | ||||||||||||||||||
|
Settlement and vesting of other stock-
based
compensation awards
|
– | (22,090 | ) | – | – | 9,297 | – | |||||||||||||||||
|
Purchase of treasury stock
|
– | (484 | ) | – | – | (498,011 | ) | (428 | ) | |||||||||||||||
|
Net earnings
|
– | – | 510,865 | – | – | 2,717 | ||||||||||||||||||
|
Other comprehensive earnings
|
– | – | – | 30,577 | – | 8,712 | ||||||||||||||||||
|
Cash dividends paid
($2.08
per share)
|
– | – | (150,612 | ) | – | – | (1,726 | ) | ||||||||||||||||
|
Fair value at acquisition
|
– | – | – | – | – | 9,196 | ||||||||||||||||||
|
Balance at December 31, 2010
|
$ | 54,830 | $ | 637,686 | $ | 4,326,761 | $ | 42,951 | $ | (2,857,012 | ) | $ | 82,454 |
The accompanying notes are an integral part of these consolidated financial statements.
36
W.W. Grainger, Inc. and Subsidiaries
NOTES TO CONSOLIDATED FINANCIAL STATEMENTS
December 31, 2010, 2009 and 2008
INDUSTRY INFORMATION
W.W. Grainger, Inc. is a broad-line distributor of maintenance, repair and operating supplies, and other related products and services used by businesses and institutions. In this report, the words “Company” or “Grainger” mean W.W. Grainger, Inc. and its subsidiaries.
PRINCIPLES OF CONSOLIDATION
The consolidated financial statements include the accounts of the Company and its subsidiaries. All significant intercompany transactions are eliminated from the consolidated financial statements.
INVESTMENTS IN UNCONSOLIDATED ENTITIES
For investments in which the Company owns or controls from 20% to 50% of the voting shares, the equity method of accounting is used. Changes in interest arising from the issuance of stock by an investee are accounted for as additional contributed capital. See Note 6 to the Consolidated Financial Statements.
MANAGEMENT ESTIMATES
In preparing financial statements in conformity with accounting principles generally accepted in the United States of America, management is required to make estimates and assumptions that affect the reported amounts of assets and liabilities, revenues and expenses, and the disclosure of contingent liabilities. Actual results could differ from those estimates.
FOREIGN CURRENCY TRANSLATION
The financial statements of the Company’s foreign subsidiaries are measured using the local currency as the functional currency. Net exchange gains or losses resulting from the translation of financial statements of foreign operations and related long-term debt are recorded as a separate component of other comprehensive earnings. See Notes 2 and 15 to the Consolidated Financial Statements.
RECLASSIFICATIONS
Certain amounts in the 2009 and 2008 financial statements, as previously reported, have been reclassified to conform to the 2010 presentation.
REVENUE RECOGNITION
Revenues recognized include product sales, billings for freight and handling charges and fees earned for services provided. The Company recognizes product sales and billings for freight and handling charges primarily on the date products are shipped to, or picked up by, the customer. The Company’s standard shipping terms are FOB shipping point. On occasion, the Company will negotiate FOB destination terms. These sales are recognized upon delivery to the customer. Fee revenues, which account for less than 1% of total revenues, are recognized after services are completed.
COST OF MERCHANDISE SOLD
Cost of merchandise sold includes product and product-related costs, vendor consideration, freight-out and handling costs. The Company defines handling costs as those costs incurred to fulfill a shipped sales order.
VENDOR CONSIDERATION
The Company receives rebates and allowances from its vendors to promote their products. The Company utilizes numerous advertising programs to promote its vendors’ products, including catalogs and other printed media, Internet and other marketing programs. Most of these programs relate to multiple vendors, which makes supporting the specific, identifiable and incremental criteria difficult, and would require numerous assumptions and judgments. Based on the inexact nature of trying to track reimbursements to the exact advertising expenditure for each vendor, the Company treats most vendor advertising allowances as a reduction of Cost of merchandise sold rather than a reduction of operating (advertising) expenses. Rebates earned from vendors that are based on product purchases are capitalized into inventory as part of product purchase price. These rebates are credited to Cost of merchandise sold based on sales. Vendor rebates that are earned based on products sold are credited directly to Cost of merchandise sold.
ADVERTISING
Advertising costs are expensed in the year the related advertisement is first presented. Advertising expense was $122.5 million, $114.6 million and $120.7 million for 2010, 2009 and 2008, respectively. Most vendor-provided allowances are classified as an offset to Cost of merchandise sold. For additional information see VENDOR CONSIDERATION above.
Catalog expense is amortized equally over the life of the catalog, beginning in the month of its distribution. Advertising costs for catalogs that have not been distributed by year-end are capitalized as Prepaid expenses. Amounts included in Prepaid expenses at December 31, 2010, 2009 and 2008 were $45.1 million, $48.1 million and $39.5 million, respectively.
37
WAREHOUSING, MARKETING AND ADMINISTRATIVE EXPENSES
Included in this category are purchasing, branch operations, information services, and marketing and selling expenses, as well as other types of general and administrative costs.
STOCK INCENTIVE PLANS
The Company measures all share-based payments using fair-value-based methods and records compensation expense related to these payments over the vesting period. See Note 13 to the Consolidated Financial Statements.
INCOME TAXES
Income taxes are recognized during the year in which transactions enter into the determination of financial statement income, with deferred taxes being provided for temporary differences between financial and tax reporting. The Company recognizes in the financial statements a provision for tax uncertainties, resulting from application of complex tax regulations in multiple tax jurisdictions. See Note 17 to the Consolidated Financial Statements.
OTHER COMPREHENSIVE EARNINGS (LOSSES)
The Company’s Other comprehensive earnings (losses) include foreign currency translation adjustments, changes in fair value of derivatives designated as hedges and unrecognized gains (losses) on postretirement and other employment-related benefit plans. See Note 15 to the Consolidated Financial Statements.
CASH AND MARKETABLE SECURITIES
The Company considers investments in highly liquid debt instruments, purchased with an original maturity of ninety days or less, to be cash equivalents.
CONCENTRATION OF CREDIT RISK
The Company places temporary cash investments with institutions of high credit quality and, by policy, limits the amount of credit exposure to any one institution.
The Company has a broad customer base representing many diverse industries doing business in all regions of the United States, Canada, Mexico, Panama, India, Japan, China and Colombia. Consequently, no significant concentration of credit risk is considered to exist.
ALLOWANCE FOR DOUBTFUL ACCOUNTS
The Company establishes reserves for customer accounts that are potentially uncollectible. The method used to estimate the allowances is based on several factors, including the age of the receivables and the historical ratio of actual write-offs to the age of the receivables. These analyses also take into consideration economic conditions that may have an impact on a specific industry, group of customers or a specific customer.
INVENTORIES
Inventories are valued at the lower of cost or market. Cost is determined primarily by the last-in, first-out (LIFO) method, which accounts for approximately 69% of total inventory. For the remaining inventory, cost is determined by the first-in, first-out (FIFO) method.
PROPERTY, BUILDINGS AND EQUIPMENT
Property, buildings and equipment are valued at cost. For financial statement purposes, depreciation and amortization are provided in amounts sufficient to relate the cost of depreciable assets to operations over their estimated service lives, principally on the declining-balance and sum-of-the-years-digits depreciation methods. The principal estimated useful lives for determining depreciation are as follows:
|
Buildings, structures and improvements
|
10 to 30 years
|
|
Furniture, fixtures, machinery and equipment
|
3 to 10 years
|
Improvements to leased property are amortized over the initial terms of the respective leases or the estimated service lives of the improvements, whichever is shorter.
The Company capitalized interest costs of $0.5 million, $0.5 million and $1.3 million in 2010, 2009 and 2008, respectively.
LONG-LIVED ASSETS
The carrying value of long-lived assets is evaluated whenever events or changes in circumstances indicate that the carrying value of the asset may be impaired. An impairment loss is recognized when estimated undiscounted future cash flows resulting from use of the asset, including disposition, are less than the carrying value of the asset. Impairment is measured as the amount by which the carrying amount exceeds the fair value.
The Company recognized impairment charges of $4.0 million and $9.0 million in 2010 and 2009, respectively, included in Warehousing, marketing and administrative expenses, to reduce the carrying value of certain long-lived assets to their estimated fair value pursuant to impairment indicators for property currently held for sale, lease terminations, idle assets, and branch closures.
GOODWILL AND OTHER INTANGIBLES
Goodwill is recognized as the excess cost of an acquired entity over the net amount assigned to assets acquired and liabilities assumed. Goodwill is not amortized, but rather tested for impairment on an annual basis and more often if circumstances require. Impairment losses are recognized whenever the implied fair value of goodwill is less than its carrying value.
38
The Company recognizes an acquired intangible apart from goodwill whenever the intangible arises from contractual or other legal rights, or whenever it can be separated or divided from the acquired entity and sold, transferred, licensed, rented or exchanged, either individually or in combination with a related contract, asset or liability. Such intangibles are amortized over their estimated useful lives unless the estimated useful life is determined to be indefinite. Amortizable intangible assets are being amortized over useful lives of one to 20 years. Impairment losses are recognized if the carrying amount of an intangible, subject to amortization, is not recoverable from expected future cash flows and its carrying amount exceeds its fair value.
The Company also maintains intangible assets with indefinite lives, which are not amortized. These intangibles are tested for impairment on an annual basis and more often if circumstances require. Impairment losses are recognized whenever the implied fair value of these assets is less than their carrying value. Included in Other assets and intangibles – net were intangibles of $145.3 million, $127.7 million and $20.8 million as of December 31, 2010, 2009 and 2008, respectively.
FAIR VALUE OF FINANCIAL INSTRUMENTS
The carrying amounts of cash and cash equivalents, receivables, and accounts payable approximate fair value due to the short-term nature of these financial instruments. The carrying value of long-term debt also approximates fair value due to the variable interest rates. The fair value of the Company’s qualifying derivative instruments is recorded in the Consolidated Balance Sheets and is discussed in more detail in Note 10.
DERIVATIVE INSTRUMENTS AND HEDGING
The Company recognizes its derivative instruments as either assets or liabilities in the balance sheet at their fair value. Changes in the fair value of derivatives are recognized in net earnings or other comprehensive earnings (losses) depending on whether the derivative is designated as part of a qualifying hedging relationship. The ineffective portion of a qualifying hedging derivative and derivatives not designated as a hedge are recognized immediately in earnings.
The Company uses foreign currency forward contracts to minimize the foreign exchange rate effect on its net investment in its Canadian subsidiary. These forward contracts are designated and qualify as a hedge of a net investment in a foreign subsidiary. The Company uses the forward method of assessing hedge effectiveness for derivatives designated as hedging instruments of a net investment in a foreign subsidiary and all changes in fair value of the derivatives are reported as a component of other comprehensive earnings (losses), net of tax effects, as long as specific hedge accounting criteria are met. The Company from time to time also enters into cash flow hedging instruments. The Company does not enter into derivative financial instruments for trading or speculative purposes. See Notes 10 and 15 to the Consolidated Financial Statements for additional information on the Company’s derivative activities.
INSURANCE RESERVES
The Company purchases insurance for catastrophic exposures and those risks required to be insured by law. It also retains a significant portion of the risk of certain losses related to workers’ compensation, general liability and property losses through the utilization of high deductibles and self-insured retentions. Reserves for these potential losses are based on an external analysis of the Company’s historical claims results and other actuarial assumptions.
WARRANTY RESERVES
The Company generally warrants the products it sells against defects for one year. For a significant portion of warranty claims, the manufacturer of the product is responsible for expenses. For warranty expenses not covered by the manufacturer, the Company provides a reserve for future costs based primarily on historical experience.
The reserve activity was as follows (in thousands of dollars):
|
For the Years Ended December 31,
|
||||||||||||
|
2010
|
2009
|
2008
|
||||||||||
|
Beginning balance
|
$ | 3,238 | $ | 3,218 | $ | 3,442 | ||||||
|
Returns
|
(10,692 | ) | (11,727 | ) | (12,917 | ) | ||||||
|
Provisions
|
10,625 | 11,747 | 12,693 | |||||||||
|
Ending balance
|
$ | 3,171 | $ | 3,238 | $ | 3,218 | ||||||
During 2010, the Company acquired four companies and obtained a majority ownership in one joint venture for approximately $62 million, less cash acquired. The total cost of the acquisitions has been allocated to the assets acquired and the liabilities assumed based upon their estimated fair values at the respective dates of acquisition. The estimated purchase price allocations are preliminary and subject to revisions based on additional valuation work related to intangibles. Purchased identifiable intangible assets totalled approximately $22 million and will be amortized on a straight-line basis over a weighted average life of 11 years (lives ranging from 1 to 15 years). Acquired intangibles primarily consist of customer relationships, non-compete agreements and proprietary software. The Company recorded approximately $46 million of goodwill and other intangibles associated with these acquisitions. The goodwill is partially deductible for tax purposes.
39
During 2009, the Company acquired three companies and obtained majority ownership in two joint ventures for approximately $123 million, net of cash acquired. See Note 6 to the Consolidated Financial Statements for additional information.
During 2008, the Company acquired two companies for approximately $34 million.
The results of these acquisitions are included in the Company’s consolidated results from the respective dates of acquisition. Due to the immaterial nature of these transactions, both individually and in the aggregate, disclosures of amounts assigned to the acquired assets and assumed liabilities and pro forma results of operations were not considered necessary.
The following table shows the activity in the allowance for doubtful accounts (in thousands of dollars):
|
For the Years Ended December 31,
|
||||||||||||
|
2010
|
2009
|
2008
|
||||||||||
|
Balance at beginning of period
|
$ | 25,850 | $ | 26,481 | $ | 25,830 | ||||||
|
Provision for uncollectible accounts
|
6,718 | 10,748 | 12,924 | |||||||||
|
Write-off of uncollectible accounts, net of
recoveries
|
(8,302 | ) | (12,254 | ) | (11,501 | ) | ||||||
|
Foreign currency translation impact
|
286 | 875 | (772 | ) | ||||||||
|
Balance at end of period
|
$ | 24,552 | $ | 25,850 | $ | 26,481 | ||||||
Inventories primarily consist of merchandise purchased for resale. Inventories would have been $336.8 million, $333.3 million and $317.0 million higher than reported at December 31, 2010, 2009 and 2008, respectively, if the FIFO method of inventory accounting had been used for all Company inventories. Net earnings would have increased by $2.1 million, $10.0 million and $18.1 million for the years ended December 31, 2010, 2009 and 2008, respectively, using the FIFO method of accounting. Inventory values using the FIFO method of accounting approximate replacement cost. The Company provides reserves for excess and obsolete inventory. The reserve balances were $112.6 million, $92.7 million and $74.2 million as of December 31, 2010, 2009 and 2008, respectively. The increases are due to higher excess inventory quantities primarily as a result of adding more stocked product to the Company’s inventory offering.
The table below summarizes the activity in the investments in unconsolidated entities (in thousands of dollars):
|
|
||||||||||||||||
|
Grainger
|
||||||||||||||||
|
Industrial
|
||||||||||||||||
|
MonotaRO
|
MRO Korea
|
Supply India
|
||||||||||||||
|
Co., Ltd.
|
Co., Ltd.
|
Private Ltd.
|
Total
|
|||||||||||||
|
Balance at January 1, 2008
|
$ | 10,513 | $ | 4,246 | $ | – | $ | 14,759 | ||||||||
|
Cash investments
|
– | – | 6,487 | 6,487 | ||||||||||||
|
Equity earnings (losses)
|
4,303 | (205 | ) | (456 | ) | 3,642 | ||||||||||
|
Write-off
|
– | – | (6,031 | ) | (6,031 | ) | ||||||||||
|
Foreign currency gain (loss)
|
3,008 | (1,035 | ) | – | 1,973 | |||||||||||
|
Balance at December 31, 2008
|
17,824 | 3,006 | – | 20,830 | ||||||||||||
|
Cash investments
|
4,013 | – | 1,194 | 5,207 | ||||||||||||
|
Equity earnings
|
1,249 | 248 | – | 1,497 | ||||||||||||
|
Dividends
|
(878 | ) | – | – | (878 | ) | ||||||||||
|
Foreign currency (loss) gain
|
(468 | ) | 254 | – | (214 | ) | ||||||||||
|
Gain (loss) on previously held equity interest
|
44,275 | – | (77 | ) | 44,198 | |||||||||||
|
Investment eliminated in consolidation
|
(66,015 | ) | – | (1,117 | ) | (67,132 | ) | |||||||||
|
Balance at December 31, 2009
|
– | 3,508 | – | 3,508 | ||||||||||||
|
Equity (losses)
|
– | (182 | ) | – | (182 | ) | ||||||||||
|
Foreign currency gain
|
– | 135 | – | 135 | ||||||||||||
|
Balance at December 31, 2010
|
$ | – | $ | 3,461 | $ | – | $ | 3,461 | ||||||||
At December 31, 2010, the Company’s ownership investment in MRO Korea Co., Ltd. was 49%. The Company accounts for this investment under the equity method.
40
In September 2009, the Company acquired 380,000 common shares of MonotaRO Co., Ltd. (MonotaRO) for approximately $4 million, increasing its interest from 48% to 53%. The results of MonotaRO are now included in the Company’s consolidated results from the date of obtaining a controlling voting interest. The Company previously accounted for its 48% interest in MonotaRO as an equity method investment. Upon obtaining the controlling interest, the previously held equity interest was remeasured to fair value, resulting in a pretax gain of $47 million ($28 million after-tax) reported in the Company’s consolidated statement of earnings. The gain includes $3 million reclassified from Accumulated other comprehensive earnings.
In July 2008, the Company acquired a 49.9% interest in Grainger Industrial Supply India Private Limited (Grainger India), formerly known as Asia Pacific Brands India Private Limited, from its sole shareholder for $5.4 million. In addition, the Company and the joint venture partner each made a $1.1 million capital infusion intended to help grow the business. In the fourth quarter of 2008, the Company wrote off its investment due to the economic slowdown in India and the loss of a major supplier that accounted for approximately 25% of the joint venture’s annual revenue. These conditions severely affected Grainger India’s ability to secure additional financing to meet its current obligations and continue as a going concern. The Company accounted for this investment using the equity method until it was written off. During 2009, Grainger India’s business improved. It was able to streamline its operations, strengthen its management and enhance its supplier base. As a result, the Company acquired the remaining 50.1% of this joint venture in June 2009 for $1.2 million. The results of Grainger India are now included in the Company’s consolidated results from the date of acquisition.
Amortization of capitalized software is on a straight-line basis over three and five years. Amortization begins when the software is available for its intended use. Amortization expense was $23.6 million, $22.7 million and $22.7 million for the years ended December 31, 2010, 2009 and 2008, respectively. The Company reviews the amounts capitalized for impairment whenever events or changes in circumstances indicate that the carrying amount of the assets may not be recoverable.
The following summarizes information concerning short-term debt (in thousands of dollars):
|
As of December 31,
|
||||||||||||
|
2010
|
2009
|
2008
|
||||||||||
|
Lines of Credit
|
||||||||||||
|
Outstanding at December 31
|
$ | 42,769 | $ | 34,780 | $ | 19,960 | ||||||
|
Maximum month-end balance during the year
|
$ | 42,769 | $ | 35,371 | $ | 19,960 | ||||||
|
Average amount outstanding during the year
|
$ | 38,369 | $ | 33,554 | $ | 13,022 | ||||||
|
Weighted average interest rate during the year
|
4.97 | % | 5.22 | % | 6.23 | % | ||||||
|
Weighted average interest rate at December 31
|
5.26 | % | 5.06 | % | 4.86 | % | ||||||
The Company had $112.3 million, $83.7 million and $29.2 million of uncommitted lines of credit denominated in foreign currencies at December 31, 2010, 2009 and 2008, respectively. At December 31, 2010, there was $42.8 million outstanding under these lines of credit relating to borrowings of foreign subsidiaries. The foreign subsidiaries utilize the lines of credit to meet business growth and operating needs.
The Company had $27.0 million, $19.1 million and $18.8 million of letters of credit at December 31, 2010, 2009 and 2008, respectively, primarily related to the Company’s insurance program. Letters of credit were also issued to facilitate the purchase of products. Issued amounts were $4.5 million, $5.6 million and $6.0 million at December 31, 2010, 2009 and 2008, respectively.
Long-term debt consisted of the following (in thousands of dollars):
|
As of December 31,
|
||||||||||||
|
2010
|
2009
|
2008
|
||||||||||
|
Bank term loan
|
$ | 248,311 | $ | 483,333 | $ | 500,000 | ||||||
|
Commercial paper
|
200,000 | – | – | |||||||||
|
Other
|
3,194 | 7,295 | 9,485 | |||||||||
|
Less current maturities
|
(31,059 | ) | (53,128 | ) | (21,257 | ) | ||||||
| $ | 420,446 | $ | 437,500 | $ | 488,228 | |||||||
41
In May 2008, the Company entered into a $500 million, unsecured four-year bank term loan. The Company, at its option, may prepay the term loan in whole or in part. On July 30, 2010, the Company issued $200 million of commercial paper and proceeds were used to make a partial prepayment of the term loan. The commercial paper carried a weighted average interest rate of approximately 0.26% and varying maturity dates no later than 90 days from the issue date. The weighted average interest rate paid on the term loan during 2010 was 1.03%. The commercial paper has been classified as long-term debt on the Consolidated Balance Sheet at December 31, 2010, as the Company currently has the intent and the ability to maintain this commercial paper on a long-term basis.
The Company had committed lines of credit of $400.0 million in 2010 and $250.0 million in 2009 and 2008 for which the Company paid a commitment fee of 0.10% in 2010, and 0.04% in 2009 and 2008. These lines of credit support the issuance of commercial paper. The current line is due to expire in July 2014. There were no borrowings under the committed lines of credit.
Other consists primarily of industrial development revenue and private activity bonds. These include various issues that bear interest at variable rates capped at 15%. The issues come due in various amounts from 2011 through 2021. The weighted average interest rate paid on the bonds during the year was 1.11%. Interest rates on some of the issues are subject to change at certain dates in the future. The bondholders may require the Company to redeem certain bonds concurrent with a change in interest rates and certain other bonds annually. In addition, these bonds had an unsecured liquidity facility available at December 31, 2010, for which the Company compensated a bank through a commitment fee of 0.07%. There were no borrowings related to this facility at December 31, 2010. The Company classified $1.5 million, $2.4 million and $4.6 million of bonds currently subject to redemption options in current maturities of long-term debt at December 31, 2010, 2009 and 2008, respectively.
The scheduled aggregate principal payments are due as follows (in thousands of dollars):
|
Year
|
Payment Amount
|
|||
|
2011
|
$ | 31,059 | ||
|
2012
|
220,039 | |||
|
2013
|
99 | |||
|
2014
|
200,033 | |||
|
2015
|
22 | |||
|
Thereafter
|
253 | |||
The Company’s debt instruments include only standard affirmative and negative covenants for debt instruments of similar amounts and structure. The Company’s debt instruments do not contain financial or performance covenants restrictive to the business of the Company, reflecting its strong financial position. The Company is in compliance with all debt covenants for the year ended December 31, 2010.
During the fourth quarter of 2010, the Company entered into multiple foreign currency forward contracts with a total notional value of Canadian Dollar (CAD) $160 million maturing in September 2014. At December 31, 2010, the fair value of these contracts included in Deferred income taxes, tax uncertainties and derivative instruments was $5.8 million. The fair value is based on quoted market forward rates (Level 2 input) and reflects the present value of the amount that the Company would pay for contracts involving the same notional amounts and maturity dates. See Note 2 to the Consolidated Financial Statements for a description of the Company’s accounting policy regarding derivative instruments. Forward contracts entered into by the Company’s Mexico subsidiary to hedge forecasted U.S. dollar-denominated lease obligations are not material.
Retirement Plans
A majority of the Company’s employees are covered by a noncontributory profit sharing plan. This plan provides for annual employer contributions based upon a formula related primarily to earnings before federal income taxes, limited to a percentage of the total eligible compensation paid to eligible employees. The annual contribution is limited to a minimum of 8% and a maximum of 18% of total eligible compensation paid to eligible employees. The Company also sponsors additional defined contribution plans, which cover most of the other employees. Provisions under all plans were $151.3 million, $128.1 million and $145.4 million for the years ended December 31, 2010, 2009 and 2008, respectively.
Postretirement Benefits
The Company has a postretirement healthcare benefits plan that provides coverage for a majority of its employees and their dependents should they elect to maintain such coverage upon retirement. Covered employees become eligible for participation when they qualify for retirement while working for the Company. Participation in the plan is voluntary and requires participants to make contributions toward the cost of the plan, as determined by the Company.
42
The Company’s accumulated postretirement benefit obligation (APBO) and net periodic benefit costs include the effect of the federal subsidy provided by the “Medicare Prescription Drug, Improvement and Modernization Act of 2003” (the Medicare Act). The Medicare Act provides a federal subsidy to retiree healthcare benefit plan sponsors that provide a prescription drug benefit that is at least actuarially equivalent to that provided by Medicare. As a result of the subsidy, the APBO has been reduced by $52.3 million, $43.0 million and $45.4 million as of December 31, 2010, 2009 and 2008, respectively. The subsidy has reduced net periodic benefits costs by approximately $6.3 million, $4.7 million and $5.2 million for the years ended December 31, 2010, 2009 and 2008, respectively.
The net periodic benefits costs charged to operating expenses, which were valued with a measurement date of January 1 for each year, consisted of the following components (in thousands of dollars):
|
For the Years Ended December 31,
|
||||||||||||
|
2010
|
2009
|
2008
|
||||||||||
|
Service cost
|
$ | 14,293 | $ | 12,305 | $ | 9,699 | ||||||
|
Interest cost
|
12,852 | 10,730 | 9,490 | |||||||||
|
Expected return on assets
|
(4,434 | ) | (3,402 | ) | (4,466 | ) | ||||||
|
Amortization of prior service credit
|
(495 | ) | (1,215 | ) | (1,215 | ) | ||||||
|
Amortization of transition asset
|
(143 | ) | (143 | ) | (143 | ) | ||||||
|
Amortization of unrecognized losses
|
3,649 | 4,135 | 1,312 | |||||||||
|
Net periodic benefits costs
|
$ | 25,722 | $ | 22,410 | $ | 14,677 | ||||||
The Company has elected to amortize the amount of net unrecognized losses over a period equal to the average remaining service period for active plan participants expected to retire and receive benefits of approximately 16.6 years for 2010.
Reconciliations of the beginning and ending balances of the APBO, which is calculated using a December 31 measurement date, the fair value of plan assets and the funded status of the benefit obligation follow (in thousands of dollars):
|
2010
|
2009
|
2008
|
||||||||||
|
Benefit obligation at beginning of year
|
$ | 222,117 | $ | 188,639 | $ | 150,910 | ||||||
|
Service cost
|
14,293 | 12,305 | 9,699 | |||||||||
|
Interest cost
|
12,852 | 10,730 | 9,490 | |||||||||
|
Plan participants’ contributions
|
1,862 | 1,797 | 1,751 | |||||||||
|
Amendments
|
– | 8,715 | – | |||||||||
|
Actuarial loss
|
12,288 | 4,892 | 21,443 | |||||||||
|
Benefits paid
|
(5,729 | ) | (5,277 | ) | (4,924 | ) | ||||||
|
Medicare Part D Subsidy received
|
295 | 316 | 270 | |||||||||
|
Benefit obligation at end of year
|
257,978 | 222,117 | 188,639 | |||||||||
|
Plan assets available for benefits at beginning of year
|
73,919 | 56,703 | 74,432 | |||||||||
|
Actual returns (losses) on plan assets
|
9,017 | 11,695 | (23,963 | ) | ||||||||
|
Employer’s contributions
|
17,438 | 9,001 | 9,407 | |||||||||
|
Plan participants’ contributions
|
1,862 | 1,797 | 1,751 | |||||||||
|
Benefits paid
|
(5,729 | ) | (5,277 | ) | (4,924 | ) | ||||||
|
Plan assets available for benefits at end of year
|
96,507 | 73,919 | 56,703 | |||||||||
|
Noncurrent postretirement benefit obligation
|
$ | 161,471 | $ | 148,198 | $ | 131,936 | ||||||
The amounts recognized in Accumulated other comprehensive earnings (AOCE) consisted of the following components (in thousands of dollars):
|
As of December 31,
|
||||||||||||
|
2010
|
2009
|
2008
|
||||||||||
|
Prior service credit (cost)
|
$ | (1,047 | ) | $ | (552 | ) | $ | 9,377 | ||||
|
Transition asset
|
571 | 714 | 857 | |||||||||
|
Unrecognized losses
|
(70,487 | ) | (66,430 | ) | (73,966 | ) | ||||||
|
Deferred tax asset
|
27,605 | 25,784 | 24,800 | |||||||||
|
Net losses
|
$ | (43,358 | ) | $ | (40,484 | ) | $ | (38,932 | ) | |||
43
The components of AOCE related to the postretirement benefit costs that will be amortized into net periodic postretirement benefit costs in 2011 are estimated as follows (in thousands of dollars):
|
2011
|
||||
|
Amortization of prior service credit
|
$ | (494 | ) | |
|
Amortization of transition asset
|
(143 | ) | ||
|
Amortization of unrecognized losses
|
4,246 | |||
|
Estimated amount to be amortized from AOCE into
net periodic
postretirement benefit costs
|
$ | 3,609 | ||
The benefit obligation was determined by applying the terms of the plan and actuarial models. These models include various actuarial assumptions, including discount rates, assumed rates of return on plan assets and healthcare cost trend rates. The actuarial assumptions also anticipate future cost-sharing changes to retiree contributions that will maintain the current cost-sharing ratio between the Company and the retirees. The Company evaluates its actuarial assumptions on an annual basis and considers changes in these long-term factors based upon market conditions and historical experience.
Effective January 1, 2010 (reflected in the 2009 valuation above), the plan was amended to extend its benefits to an additional group of employees and also include an in-network deductible, and increased out-of-pocket maximums and hospital co-payments.
The following assumptions were used to determine net periodic benefit costs at January 1:
|
For the Years Ended December 31,
|
||||||||||||
|
2010
|
2009
|
2008
|
||||||||||
|
Discount rate
|
6.00 | % | 5.90 | % | 6.50 | % | ||||||
|
Expected long-term rate of return on plan assets,
net of tax at 40%
|
6.00 | % | 6.00 | % | 6.00 | % | ||||||
|
Initial healthcare cost trend rate
|
9.50 | % | 10.00 | % | 10.00 | % | ||||||
|
Ultimate healthcare cost trend rate
|
5.00 | % | 5.00 | % | 5.00 | % | ||||||
|
Year ultimate healthcare cost trend rate reached
|
2019 | 2019 | 2018 | |||||||||
The following assumptions were used to determine benefit obligations at December 31:
|
2010
|
2009
|
2008
|
||||||||||
|
Discount rate
|
5.60 | % | 6.00 | % | 5.90 | % | ||||||
|
Expected long-term rate of return on plan assets,
net of tax at 40%
|
6.00 | % | 6.00 | % | 6.00 | % | ||||||
|
Initial healthcare cost trend rate
|
9.00 | % | 9.50 | % | 10.00 | % | ||||||
|
Ultimate healthcare cost trend rate
|
5.00 | % | 5.00 | % | 5.00 | % | ||||||
|
Year ultimate healthcare cost trend rate reached
|
2019 | 2019 | 2019 | |||||||||
The discount rate assumptions reflect the rates available on high-quality fixed income debt instruments. These rates have been selected due to their similarity to the projected cash flows of the postretirement healthcare benefit plan.
The Company reviews external data and its own historical trends for healthcare costs to determine the healthcare cost trend rates. Assumed healthcare cost trend rates have a significant effect on the amounts reported for the healthcare plans. A 1 percentage point change in assumed healthcare cost trend rates would have the following effects on 2010 results (in thousands of dollars):
|
1 Percentage Point
|
||||||||
|
Increase
|
(Decrease)
|
|||||||
|
Effect on total service and interest cost
|
$ | 6,638 | $ | (5,071 | ) | |||
|
Effect on APBO
|
54,257 | (42,320 | ) | |||||
44
The Company has established a Group Benefit Trust (Trust) to fund the plan obligations and process benefit payments. In December 2010, the Company began to transition the target allocation of the Trust assets from 100% U.S. equities to 50% U.S. equities and 50% non-U.S. equities. This investment strategy reflects the long-term nature of the plan obligation and seeks to take advantage of the earnings potential of equity securities in the global markets. As of December 31, 2010, the assets of the Trust are invested in funds designed to track to either the Standard & Poor’s 500 Index (S&P 500) or the Total International Composite Index. The Total International Composite Index tracks non-U.S. stocks within developed and emerging market economies. The plan’s assets are stated at fair value which represents the net asset value of shares held by the plan in the registered investment companies at the quoted market prices (Level 1 input) as of December 31, 2010 (in thousands of dollars):
|
2010
|
2009
|
2008
|
||||||||||
|
Fair value of invested assets (Level 1)
|
||||||||||||
|
Registered investment companies
|
||||||||||||
|
Fidelity Spartan U.S. Equity Index Fund
|
$ | 43,260 | $ | 37,624 | $ | 30,597 | ||||||
|
Vanguard 500 Index Fund
|
43,363 | 37,691 | 31,194 | |||||||||
|
Vanguard Total International Stock
|
13,215 | – | – | |||||||||
|
Total Assets
|
$ | 99,838 | $ | 75,315 | $ | 61,791 | ||||||
The Company uses the long-term historical return on the plan assets and the historical performance of the S&P 500 and, beginning in 2010, the Total International Composite Index to develop its expected return on plan assets. The required use of an expected long-term rate of return on plan assets may result in recognition of income that is greater or less than the actual return on plan assets in any given year. Over time, however, the expected long-term returns are designed to approximate the actual long-term returns and, therefore, result in a pattern of income recognition that more closely matches the pattern of the services provided by the employees.
The Company’s investment policies include periodic reviews by management and trustees at least annually concerning: (1) the allocation of assets among various asset classes (e.g., domestic stocks, international stocks, short-term bonds, long-term bonds, etc.); (2) the investment performance of the assets, including performance comparisons with appropriate benchmarks; (3) investment guidelines and other matters of investment policy; and (4) the hiring, dismissal, or retention of investment managers.
The funding of the trust is an estimated amount that is intended to allow the maximum deductible contribution under the Internal Revenue Code of 1986 (IRC), as amended, and was $17.4 million, $9.0 million and $9.4 million for the years ended December 31, 2010, 2009 and 2008, respectively. There are no minimum funding requirements and the Company intends to follow its practice of funding the maximum deductible contribution under the IRC.
The Company forecasts the following benefit payments (which include a projection for expected future employee service) and subsidy receipts for the next ten years (in thousands of dollars):
|
Estimated gross benefit payments
|
Estimated Medicare subsidy receipts
|
|||||||
|
2011
|
$ | 4,795 | $ | (393 | ) | |||
|
2012
|
5,522 | (474 | ) | |||||
|
2013
|
6,468 | (563 | ) | |||||
|
2014
|
7,591 | (668 | ) | |||||
|
2015
|
8,835 | (796 | ) | |||||
|
2016 – 2020
|
68,111 | (6,749 | ) | |||||
Executive Death Benefit Plan
The Executive Death Benefit Plan provides one of three potential benefits: a supplemental income benefit (SIB), an executive death benefit (EDB) or a postretirement payment. The SIB provides income continuation at 50% of total compensation, payable for ten years to the beneficiary of a participant if that participant dies while employed by the Company. Alternatively, the EDB provides an after-tax lump sum payment of one times final total compensation to the beneficiary of a participant who dies after retirement. In addition, a participant may elect to receive a reduced postretirement payment instead of the EDB. In 2008, new participants to the plan were not eligible for the reduced postretirement payment option. Effective January 1, 2010, there will be no new participants added to the plan. There are no plan assets and benefits are paid as they come due from the general assets of the Company.
The net periodic benefits costs charged to operating expenses, which were valued with a measurement date of January 1 for each year, consisted of the following components (in thousands of dollars):
|
For the Years Ended December 31,
|
||||||||||||
|
2010
|
2009
|
2008
|
||||||||||
|
Service cost
|
$ | 204 | $ | 234 | $ | 247 | ||||||
|
Interest cost
|
893 | 965 | 880 | |||||||||
|
Amortization of unrecognized gains
|
(35 | ) | (24 | ) | (153 | ) | ||||||
|
Net periodic benefits costs
|
$ | 1,062 | $ | 1,175 | $ | 974 | ||||||
45
Reconciliations of the beginning and ending balances of the projected benefit obligation, which are calculated using a December 31 measurement date, follow (in thousands of dollars):
|
2010
|
2009
|
2008
|
||||||||||
|
Benefit obligation at beginning of year
|
$ | 17,185 | $ | 16,088 | $ | 14,115 | ||||||
|
Service cost
|
204 | 234 | 247 | |||||||||
|
Interest cost
|
893 | 965 | 880 | |||||||||
|
Actuarial (gains) losses
|
(109 | ) | (102 | ) | 1,425 | |||||||
|
Benefits paid
|
(2,530 | ) | – | (579 | ) | |||||||
|
Benefit obligation at end of year
|
$ | 15,643 | $ | 17,185 | $ | 16,088 | ||||||
The amounts recognized as the current and long-term portions of the benefit obligation follow (in thousands of dollars):
|
As of December 31,
|
||||||||||||
|
2010
|
2009
|
2008
|
||||||||||
|
Current liabilities
|
$ | 896 | $ | 3,081 | $ | 552 | ||||||
|
Noncurrent liabilities
|
14,747 | 14,104 | 15,536 | |||||||||
|
Total amounts recognized
|
$ | 15,643 | $ | 17,185 | $ | 16,088 | ||||||
Net gains recognized in AOCE were $0.4 million, $0.4 million and $0.3 million as of December 31, 2010, 2009 and 2008, respectively.
The benefit obligation was determined by applying the terms of the plan and actuarial models. These models include various actuarial assumptions, including discount rates, mortality and salary progression. The Company evaluates its actuarial assumptions on an annual basis and considers changes in these long-term factors based upon market conditions and historical experience.
The following assumptions were used to determine benefit obligations at December 31:
|
2010
|
2009
|
2008
|
||||||||||
|
Discount rate used to determine net periodic benefit cost (January 1 valuation)
|
5.70 | % | 6.10 | % | 6.40 | % | ||||||
|
Discount rate used to determine benefit obligation
(December 31 valuation)
|
5.10 | % | 5.70 | % | 6.10 | % | ||||||
|
Compensation increase used to determine obligation
and cost
|
4.00 | % | 4.00 | % | 4.00 | % | ||||||
The discount rate assumptions reflect the rates available on high-quality fixed income debt instruments. These rates have been selected due to their similarity to the projected cash flows of the Executive Death Benefit Plan.
Actuarially projected future benefit payments for the next ten years are as follows (in thousands of dollars):
|
Benefit Payments
|
||||
|
2011
|
$ | 896 | ||
|
2012
|
682 | |||
|
2013
|
1,655 | |||
|
2014
|
1,064 | |||
|
2015
|
921 | |||
|
2016 – 2020
|
4,539 | |||
Other Employment-Related Benefit Plans
Certain of the Company’s non-U.S. subsidiaries provide limited non-pension benefits to retirees in addition to government-mandated programs. The cost of these programs is not significant to the Company. Most retirees outside the United States are covered by government-sponsored and administered programs.
46
The Company leases certain land, buildings and equipment under noncancellable operating leases that expire at various dates through 2036. The Company capitalizes all significant leases that qualify for capitalization. Many of the building leases obligate the Company to pay real estate taxes, insurance and certain maintenance costs, and contain multiple renewal provisions, exercisable at the Company’s option. Leases that contain predetermined fixed escalations of the minimum rentals are recognized in rental expense on a straight-line basis over the lease term. Cash or rent abatements received upon entering into certain operating leases are also recognized on a straight-line basis over the lease term.
At December 31, 2010, the approximate future minimum lease payments for all operating leases were as follows (in thousands of dollars):
|
Future Minimum Lease Payments
|
||||
|
2011
|
$ | 45,461 | ||
|
2012
|
39,341 | |||
|
2013
|
33,446 | |||
|
2014
|
26,510 | |||
|
2015
|
21,961 | |||
|
Thereafter
|
34,844 | |||
|
Total minimum payments required
|
201,563 | |||
|
Less amounts representing sublease income
|
(731 | ) | ||
| $ | 200,832 | |||
Rent expense, including items under lease and items rented on a month-to-month basis, was $53.4 million, $45.3 million and $44.8 million for 2010, 2009 and 2008, respectively. These amounts are net of sublease income of $0.9 million, $0.7 million and $0.6 million for 2010, 2009 and 2008, respectively.
The Company maintains stock incentive plans under which the Company may grant a variety of incentive awards to employees and directors. Shares of common stock were authorized for issuance under the plans in connection with awards of non-qualified stock options, stock appreciation rights, restricted stock, restricted stock units and other stock-based awards. As of December 31, 2010, restricted stock units, performance shares, stock units and non-qualified stock options have been granted.
In 2010, the shareholders of the Company approved the 2010 Incentive Plan (Plan), which replaced all prior active plans (Prior Plans). Awards previously granted under Prior Plans will remain outstanding in accordance with their terms. A total of 5.9 million shares of common stock have been reserved for issuance under the Plan. As of December 31, 2010, there were 4,468,959 shares available for grant under the Plan.
Pretax stock-based compensation expense was $47.4 million, $40.7 million, and $46.1 million in 2010, 2009 and 2008, respectively. Related income tax benefits recognized in earnings were $16.9 million, $14.1 million and $18.2 million in 2010, 2009 and 2008, respectively.
Options
In 2010, 2009 and 2008, the Company issued stock option grants to employees as part of their incentive compensation. Stock option grants were 689,450, 763,370 and 721,600 shares for the years 2010, 2009 and 2008, respectively.
In 2010, 2009 and 2008, the Company provided broad-based stock option grants covering 256,000, 181,100 and 161,400 shares, respectively, to those employees who reached major service milestones and were not participants in other stock option programs.
Option awards are granted with an exercise price equal to the closing market price of the Company’s stock on the last trading day preceding the date of grant. The options generally vest over three years, although accelerated vesting is provided in certain circumstances. Awards generally expire ten years from the grant date.
47
Transactions involving stock options are summarized as follows:
|
Shares Subject to Option
|
Weighted Average Price Per Share
|
Options Exercisable
|
||||||||||
|
Outstanding at January 1, 2008
|
6,527,986 | $ | 58.19 | 3,447,856 | ||||||||
|
Granted
|
883,000 | $ | 84.58 | |||||||||
|
Exercised
|
(953,199 | ) | $ | 50.07 | ||||||||
|
Canceled or expired
|
(103,920 | ) | $ | 73.14 | ||||||||
|
Outstanding at December 31, 2008
|
6,353,867 | $ | 62.95 | 3,633,612 | ||||||||
|
Granted
|
944,470 | $ | 79.69 | |||||||||
|
Exercised
|
(1,689,581 | ) | $ | 57.18 | ||||||||
|
Canceled or expired
|
(134,160 | ) | $ | 78.98 | ||||||||
|
Outstanding at December 31, 2009
|
5,474,596 | $ | 68.07 | 3,141,996 | ||||||||
|
Granted
|
945,450 | $ | 106.70 | |||||||||
|
Exercised
|
(1,444,898 | ) | $ | 64.39 | ||||||||
|
Canceled or expired
|
(93,900 | ) | $ | 84.02 | ||||||||
|
Outstanding at December 31, 2010
|
4,881,248 | $ | 77.61 | 2,486,478 | ||||||||
At December 31, 2010, there was $16.6 million of total unrecognized compensation expense related to nonvested option awards, which the Company expects to recognize over a weighted average period of 1.7 years.
The following table summarizes information about stock options exercised (in thousands of dollars):
|
For the years ended December 31,
|
||||||||||||
|
2010
|
2009
|
2008
|
||||||||||
|
Fair value of options exercised
|
$ | 22,665 | $ | 24,442 | $ | 12,752 | ||||||
|
Total intrinsic value of options exercised
|
75,204 | 57,702 | 35,095 | |||||||||
|
Fair value of options vested
|
17,974 | 23,303 | 15,510 | |||||||||
|
Settlements of options exercised
|
87,024 | 92,213 | 47,016 | |||||||||
Information about stock options outstanding and exercisable as of December 31, 2010, is as follows:
|
Options Outstanding
|
Options Exercisable
|
|||||||||||||||||||||||||||
|
Weighted Average
|
Weighted Average
|
|||||||||||||||||||||||||||
|
Range of
Exercise
Prices
|
Number
|
Remaining
Contractual
Life
|
Exercise
Price
|
Intrinsic
Value
(000’s)
|
Number
|
Remaining
Contractual
Life
|
Exercise
Price
|
Intrinsic
Value
(000’s)
|
||||||||||||||||||||
| $ | 37.50-$44.05 | 97,051 |
0.38 Years
|
$ | 40.59 | $ | 9,465 | 97,051 |
0.38 Years
|
$ | 40.59 | $ | 9,465 | |||||||||||||||
| $ | 45.50-$54.85 | 1,179,265 |
3.02 Years
|
$ | 50.98 | 102,753 | 1,179,265 |
3.02 Years
|
$ | 50.98 | 102,753 | |||||||||||||||||
| $ | 56.03-$70.67 | 51,522 |
4.13 Years
|
$ | 61.71 | 3,936 | 51,522 |
4.13 Years
|
$ | 61.71 | 3,936 | |||||||||||||||||
| $ | 71.21-$124.93 | 3,553,410 |
7.66 Years
|
$ | 87.70 | 179,141 | 1,158,640 |
6.09 Years
|
$ | 80.11 | 67,197 | |||||||||||||||||
| 4,881,248 |
6.35 Years
|
$ | 77.61 | $ | 295,295 | 2,486,478 |
4.37 Years
|
$ | 64.37 | $ | 183,351 | |||||||||||||||||
The Company uses a binomial lattice option pricing model for the valuation of stock options. The weighted average fair value of options granted in 2010, 2009 and 2008 was $24.53, $19.32 and $20.82, respectively. The fair value of each option granted in 2010, 2009 and 2008 used the following assumptions:
|
For the years ended December 31,
|
||||||||||||
|
2010
|
2009
|
2008
|
||||||||||
|
Risk-free interest rate
|
2.9 | % | 2.4 | % | 3.2 | % | ||||||
|
Expected life
|
6 years
|
6 years
|
6 years
|
|||||||||
|
Expected volatility
|
24.7 | % | 28.8 | % | 25.2 | % | ||||||
|
Expected dividend yield
|
2.0 | % | 2.3 | % | 1.8 | % | ||||||
48
The risk-free interest rate is selected based on yields from U.S. Treasury zero-coupon issues with a remaining term approximately equal to the expected term of the options being valued. The expected life selected for options granted during each year presented represents the period of time that the options are expected to be outstanding based on historical data of option holder exercise and termination behavior. Expected volatility is based upon implied and historical volatility of the closing price of the Company’s stock over a period equal to the expected life of each option grant. Historical company information is also the primary basis for selection of expected dividend yield assumptions.
Performance Shares
The Company awarded performance-based shares to certain executives. Receipt of Company stock is contingent upon the Company meeting sales growth and return on invested capital (ROIC) performance goals. Each participant is granted a base number of shares. At the end of the performance period, the number of shares granted will be increased, decreased or remain the same based upon actual Company-wide sales growth versus target sales growth. The shares, as determined at the end of the performance year, are issued at the end of the third year if the Company’s average target ROIC is achieved during the vesting period.
Performance share value is based upon closing market prices on the last trading day preceding the date of award less the net present value of the dividends throughout the vesting period and is charged to earnings on a straight-line basis over the three year period. Holders of the 2008 performance share awards are entitled to receive cash payments equivalent to cash dividends after the end of the first year performance period, whereas holders of the 2009, 2010, and subsequent performance share awards are not entitled to receive cash payments equivalent to cash dividends. If the performance shares vest, they will be settled by the issuance of Company common stock in exchange for the performance shares on a one-for-one basis.
The following table summarizes the transactions involving performance-based share awards:
|
2010
|
2009
|
2008
|
||||||||||||||||||||||
|
Shares
|
Weighted Average Price Per Share
|
Shares
|
Weighted Average Price Per Share
|
Shares
|
Weighted Average Price Per Share
|
|||||||||||||||||||
|
Beginning nonvested
shares outstanding
|
72,362 | $ | 80.01 | 117,896 | $ | 75.13 | 116,796 | $ | 69.49 | |||||||||||||||
|
Issued
|
140,400 | $ | 87.29 | 36,720 | $ | 73.17 | 38,360 | $ | 86.00 | |||||||||||||||
|
Cancelled
|
(1,069 | ) | $ | 86.00 | (3,319 | ) | $ | 83.40 | – | $ | – | |||||||||||||
|
Vested
|
(34,573 | ) | $ | 86.00 | (78,935 | ) | $ | 68.64 | (37,260 | ) | $ | 71.23 | ||||||||||||
|
Ending nonvested shares
outstanding
|
177,120 | $ | 84.74 | 72,362 | $ | 80.01 | 117,896 | $ | 75.13 | |||||||||||||||
At December 31, 2010, the unearned compensation related to performance-based share awards outstanding was $7.9 million, which the Company expects to recognize over a weighted average period of 1.8 years.
Restricted Stock
The plans authorize the granting of restricted stock, which is held by the Company pursuant to the terms and conditions related to the applicable grants. Except for the right of disposal, holders of restricted stock have full shareholders’ rights during the period of restriction, including voting rights and the right to receive dividends. Restricted stock grants have original vesting periods of six to ten years.
49
Compensation expense related to restricted stock awards is based upon the closing market price on the last trading day preceding the date of grant and is charged to earnings on a straight-line basis over the vesting period. The following table summarizes the transactions involving restricted stock granted to employees:
|
2010
|
2009
|
2008
|
||||||||||||||||||||||
|
Shares
|
Weighted Average Price Per Share
|
Shares
|
Weighted Average Price Per Share
|
Shares
|
Weighted Average Price Per Share
|
|||||||||||||||||||
|
Beginning nonvested
shares
outstanding
|
10,000 | $ | 47.81 | 50,000 | $ | 53.50 | 65,000 | $ | 52.37 | |||||||||||||||
|
Vested
|
(10,000 | ) | $ | 47.81 | (40,000 | ) | $ | 54.12 | (15,000 | ) | $ | 48.15 | ||||||||||||
|
Ending nonvested
shares outstanding
|
– | $ | 0.00 | 10,000 | $ | 47.81 | 50,000 | $ | 53.50 | |||||||||||||||
|
Fair value of shares
vested
|
$0.5 million
|
$2.1 million
|
$0.7 million
|
|||||||||||||||||||||
Restricted Stock Units (RSUs)
Awards of RSUs are provided for under the stock compensation plans. RSUs granted vest over periods from two to seven years from issuance, although accelerated vesting is provided in certain instances. Holders of RSUs are entitled to receive cash payments equivalent to cash dividends and other distributions paid with respect to common stock. At various times after vesting, RSUs will be settled by the issuance of stock evidencing the conversion of the RSUs into shares of the Company common stock on a one-for-one basis. Compensation expense related to RSUs is based upon the closing market price on the last trading day preceding the date of award and is charged to earnings on a straight-line basis over the vesting period.
The following table summarizes RSUs activity:
|
2010
|
2009
|
2008
|
||||||||||||||||||||||
|
Shares
|
Weighted
Average Price Per Share
|
Shares
|
Weighted
Average Price Per Share
|
Shares
|
Weighted
Average Price Per Share
|
|||||||||||||||||||
|
Beginning nonvested units
|
1,241,364 | $ | 80.96 | 1,237,246 | $ | 77.88 | 982,568 | $ | 72.91 | |||||||||||||||
|
Issued
|
274,740 | $ | 109.63 | 284,825 | $ | 83.10 | 460,423 | $ | 84.35 | |||||||||||||||
|
Cancelled
|
(61,745 | ) | $ | 82.59 | (81,572 | ) | $ | 78.47 | (33,490 | ) | $ | 78.72 | ||||||||||||
|
Vested
|
(248,572 | ) | $ | 77.37 | (199,135 | ) | $ | 63.57 | (172,255 | ) | $ | 64.37 | ||||||||||||
|
Ending nonvested units
|
1,205,787 | $ | 88.65 | 1,241,364 | $ | 80.96 | 1,237,246 | $ | 77.88 | |||||||||||||||
|
Fair value of shares vested
|
$19.2 million
|
$12.4 million
|
$11.1 million
|
|||||||||||||||||||||
At December 31, 2010, there was $50.2 million of total unrecognized compensation expense related to nonvested RSUs that the Company expects to recognize over a weighted average period of 2.5 years.
Director Stock Awards
The Company provides members of the Board of Directors with deferred stock unit grants. A stock unit is the economic equivalent of a share of common stock. Beginning in April 2010, the number of units covered by each grant is equal to $100,000 divided by the 200-day average stock price as of January 31
st
in the year of the grant. Prior to 2010, the number of units covered by each grant was equal to $100,000 divided by the fair market value of a share of common stock at the time of the grant. The Company also awards stock units in connection with elective deferrals of director fees and dividend equivalents on existing stock units. Deferred fees and dividend equivalents on existing stock units are converted into stock units on the basis of the market value of the stock at the relevant times. Payment of the value of stock units is scheduled to be made after termination of service as a director. As of December 31, 2010, 2009 and 2008, there were eleven nonemployee directors who held stock units. As of December 31, 2010, there was also one former nonemployee director who held stock units.
50
The Company recognizes (income) expense for the (depreciation) appreciation in value of equivalent stock units based on the market price of the Company’s common stock as of the balance sheet date. The following table summarizes activity for stock units related to deferred director fees (dollars in thousands):
|
2010
|
2009
|
2008
|
||||||||||||||||||||||
|
Units
|
Dollars
|
Units
|
Dollars
|
Units
|
Dollars
|
|||||||||||||||||||
|
Beginning balance
|
113,509 | $ | 10,991 | 93,221 | $ | 7,350 | 74,522 | $ | 6,522 | |||||||||||||||
|
Dividends
|
2,416 | 261 | 2,338 | 192 | 1,692 | 137 | ||||||||||||||||||
|
Deferred fees
|
14,452 | 1,563 | 17,950 | 1,463 | 17,007 | 1,460 | ||||||||||||||||||
|
Unit appreciation
(depreciation)
|
– | 5,191 | – | 1,986 | – | (769 | ) | |||||||||||||||||
|
Ending balance
|
130,377 | $ | 18,006 | 113,509 | $ | 10,991 | 93,221 | $ | 7,350 | |||||||||||||||
The Company had no shares of preferred stock outstanding as of December 31, 2010, 2009 and 2008. The activity related to outstanding common stock and common stock held in treasury was as follows:
|
2010
|
2009
|
2008
|
||||||||||||||||||||||
|
Outstanding Common Stock
|
Treasury Stock
|
Outstanding Common Stock
|
Treasury Stock
|
Outstanding Common Stock
|
Treasury Stock
|
|||||||||||||||||||
|
Balance at beginning of period
|
72,276,516 | 37,382,703 | 74,781,029 | 34,878,190 | 79,459,415 | 30,199,804 | ||||||||||||||||||
|
Exercise of stock options, net of 2,608, 17,050 and 2,725 shares swapped in stock-for-stock exchange, respectively
|
1,442,290 | (1,442,290 | ) | 1,672,531 | (1,672,531 | ) | 950,474 | (950,474 | ) | |||||||||||||||
|
Cancellation of shares related to tax withholdings on restricted stock vesting
|
(3,014 | ) | 3,014 | (12,531 | ) | 12,531 | (4,874 | ) | 4,874 | |||||||||||||||
|
Settlement of restricted stock units, net of 85,205, 67,382 and 48,488 shares retained, respectively
|
163,367 | (163,367 | ) | 131,753 | (131,753 | ) | 101,962 | (101,962 | ) | |||||||||||||||
|
Settlement of performance share units, net of 26,077 and 12,172 shares retained, respectively
|
52,858 | (52,858 | ) | 25,088 | (25,088 | ) | – | – | ||||||||||||||||
|
Purchase of treasury shares
|
(4,554,215 | ) | 4,554,215 | (4,321,354 | ) | 4,321,354 | (5,725,948 | ) | 5,725,948 | |||||||||||||||
|
Balance at end of period
|
69,377,802 | 40,281,417 | 72,276,516 | 37,382,703 | 74,781,029 | 34,878,190 | ||||||||||||||||||
The following table sets forth the components of Accumulated other comprehensive earnings (losses)
(in thousands of dollars)
:
|
As of December 31,
|
||||||||||||
|
2010
|
2009
|
2008
|
||||||||||
|
Foreign currency translation adjustments
|
$ | 113,151 | $ | 63,304 | $ | 3,943 | ||||||
|
Derivative instruments
|
(5,816 | ) | – | – | ||||||||
|
Postretirement benefit plan
|
(70,963 | ) | (66,268 | ) | (63,732 | ) | ||||||
|
Other employment-related benefit plans
|
(1,619 | ) | (827 | ) | (68 | ) | ||||||
|
Deferred tax asset
|
15,453 | 14,708 | 21,332 | |||||||||
|
Total accumulated other comprehensive earnings (losses)
|
50,206 | 10,917 | (38,525 | ) | ||||||||
|
Less: Foreign currency translation adjustments attributable to noncontrolling interest
|
7,255 | (1,457 | ) | – | ||||||||
|
Total accumulated other comprehensive earnings (losses) attributable to
W.W. Grainger, Inc.
|
$ | 42,951 | $ | 12,374 | $ | (38,525 | ) | |||||
51
Foreign currency translation adjustments result from the translation of assets and liabilities of foreign subsidiaries. The increase in foreign currency translation adjustments in 2010 and 2009 was primarily due to the weakening of the U.S. dollar versus the Canadian dollar, Japanese yen and Mexican peso.
The Company’s ownership interest in MonotaRO Co., Ltd. was approximately 53% as of December 31, 2010 and 2009. There were no changes to the Company’s 80% ownership interest of Grainger Colombia S.A.S. from the date of acquisition through December 31, 2010. The following table sets forth the effect on W.W. Grainger, Inc.’s equity resulting from changes in the Company’s ownership interest in MonotaRO Co., Ltd. (in thousands of dollars):
|
For the Years Ended December 31,
|
||||||||||||
|
2010
|
2009
|
2008
|
||||||||||
|
Net earnings attributable to W.W. Grainger, Inc.
|
$ | 510,865 | $ | 430,466 | $ | 475,355 | ||||||
|
Transfers from the noncontrolling interest:
|
||||||||||||
|
Increase in W.W. Grainger, Inc. additional contributed capital for MonotaRO Co.,
Ltd. stock option exercises
|
86 | 34 | – | |||||||||
|
Decrease in W.W. Grainger, Inc. additional contributed capital for MonotaRO Co.,
Ltd. treasury share purchases
|
(484 | ) | – | – | ||||||||
|
Change from net earnings attributable to W.W. Grainger, Inc. and transfer from noncontrolling interest
|
$ | 510,467 | $ | 430,500 | $ | 475,355 | ||||||
The Company recognizes deferred tax assets and liabilities for the expected future tax consequences of events that have been included in the financial statements or tax returns. Under this method, deferred tax assets and liabilities are determined based on the differences between the financial reporting and tax bases of assets and liabilities, using enacted tax rates in effect for the year in which the differences are expected to reverse.
Income tax expense consisted of the following (in thousands of dollars):
|
For the Years Ended December 31,
|
||||||||||||
|
2010
|
2009
|
2008
|
||||||||||
|
Current provision:
|
||||||||||||
|
Federal
|
$ | 283,481 | $ | 203,375 | $ | 246,731 | ||||||
|
State
|
48,241 | 36,078 | 39,673 | |||||||||
|
Foreign
|
21,235 | 15,860 | 18,044 | |||||||||
|
Total current
|
352,957 | 255,313 | 304,448 | |||||||||
|
Deferred tax provision (benefit):
|
||||||||||||
|
Federal
|
(7,875 | ) | 16,446 | (5,968 | ) | |||||||
|
State
|
(1,384 | ) | 2,894 | (1,049 | ) | |||||||
|
Foreign
|
(3,502 | ) | 1,912 | 432 | ||||||||
|
Total deferred
|
(12,761 | ) | 21,252 | (6,585 | ) | |||||||
|
Total provision
|
$ | 340,196 | $ | 276,565 | $ | 297,863 | ||||||
52
Net earnings before income taxes by geographical area consisted of the following (in thousands of dollars):
|
For the Years Ended December 31,
|
||||||||||||
|
2010
|
2009
|
2008
|
||||||||||
|
United States
|
$ | 802,135 | $ | 679,648 | $ | 731,315 | ||||||
|
Foreign
|
51,643 | 27,689 | 41,903 | |||||||||
| $ | 853,778 | $ | 707,337 | $ | 773,218 | |||||||
The income tax effects of temporary differences that gave rise to the net deferred tax asset were (in thousands of dollars):
|
As of December 31,
|
||||||||||||
|
2010
|
2009
|
2008
|
||||||||||
|
Deferred tax assets:
|
||||||||||||
|
Inventory
|
$ | 32,438 | $ | 11,554 | $ | 22,674 | ||||||
|
Accrued expenses
|
31,116 | 29,262 | 29,966 | |||||||||
|
Accrued employment-related benefits
|
145,440 | 163,333 | 144,125 | |||||||||
|
Foreign operating loss carryforwards
|
13,117 | 12,547 | 10,833 | |||||||||
|
Property, buildings and equipment
|
2,072 | – | 921 | |||||||||
|
Other
|
19,274 | 13,947 | 11,352 | |||||||||
|
Deferred tax assets
|
243,457 | 230,643 | 219,871 | |||||||||
|
Less valuation allowance
|
(20,087 | ) | (20,810 | ) | (15,977 | ) | ||||||
|
Deferred tax assets, net of valuation allowance
|
$ | 223,370 | $ | 209,833 | $ | 203,894 | ||||||
|
Deferred tax liabilities:
|
||||||||||||
|
Purchased tax benefits
|
$ | (4,570 | ) | $ | (5,178 | ) | $ | (5,812 | ) | |||
|
Property, buildings and equipment
|
- | (7,318 | ) | – | ||||||||
|
Intangibles
|
(80,055 | ) | (67,821 | ) | (17,083 | ) | ||||||
|
Software
|
(4,419 | ) | (8,835 | ) | (12,774 | ) | ||||||
|
Prepaids
|
(28,897 | ) | (22,889 | ) | (21,893 | ) | ||||||
|
Other
|
(13,590 | ) | (10,020 | ) | (2,206 | ) | ||||||
|
Deferred tax liabilities
|
(131,531 | ) | (122,061 | ) | (59,768 | ) | ||||||
|
Net deferred tax asset
|
$ | 91,839 | $ | 87,772 | $ | 144,126 | ||||||
|
The net deferred tax asset is classified as follows:
|
||||||||||||
|
Current assets
|
$ | 44,627 | $ | 42,023 | $ | 52,556 | ||||||
|
Noncurrent assets
|
87,244 | 79,472 | 97,442 | |||||||||
|
Noncurrent liabilities (foreign)
|
(40,032 | ) | (33,723 | ) | (5,872 | ) | ||||||
|
Net deferred tax asset
|
$ | 91,839 | $ | 87,772 | $ | 144,126 | ||||||
At December 31, 2010, the Company had $54.6 million of operating loss carryforwards related primarily to foreign operations, some of which will expire at various dates through 2020. The valuation allowance represents a provision for uncertainty as to the realization of the tax benefits of these carryforwards. In addition, the Company recorded a valuation allowance to reflect the estimated amount of deferred tax assets that may not be realized.
The changes in the valuation allowance were as follows (in thousands of dollars):
|
For the Years Ended December 31,
|
||||||||||||
|
2010
|
2009
|
2008
|
||||||||||
|
Beginning balance
|
$ | 20,810 | $ | 15,977 | $ | 13,551 | ||||||
|
(Decrease) increase related to foreign net operating
loss carryforwards
|
(723 | ) | 4,833 | 86 | ||||||||
|
Increase related to capital losses and other
|
– | – | 2,340 | |||||||||
|
Ending balance
|
$ | 20,087 | $ | 20,810 | $ | 15,977 | ||||||
53
A reconciliation of income tax expense with federal income taxes at the statutory rate follows (in thousands of dollars):
|
For the Years Ended December 31,
|
||||||||||||
|
2010
|
2009
|
2008
|
||||||||||
|
Federal income tax at the 35% statutory rate
|
$ | 298,822 | $ | 247,568 | $ | 270,626 | ||||||
|
State income taxes, net of federal income
tax benefit
|
30,457 | 25,332 | 25,105 | |||||||||
|
Other – net
|
10,917 | 3,665 | 2,132 | |||||||||
|
Income tax expense
|
$ | 340,196 | $ | 276,565 | $ | 297,863 | ||||||
|
Effective tax rate
|
39.8 | % | 39.1 | % | 38.5 | % | ||||||
Included in other – net is the impact of a one-time tax expense related to the U.S. healthcare legislation passed in the first quarter of 2010.
Undistributed earnings of foreign subsidiaries at December 31, 2010, amounted to $83.3 million. No provision for deferred U.S. income taxes has been made for these subsidiaries because the Company intends to permanently reinvest such earnings in those foreign operations.
The changes in the liability for tax uncertainties, excluding interest, are as follows (in thousands of dollars):
|
2010
|
2009
|
2008
|
||||||||||
|
Balance at beginning of year
|
$ | 26,540 | $ | 24,364 | $ | 13,568 | ||||||
|
Additions to tax positions related to the current year
|
8,304 | 6,743 | 13,016 | |||||||||
|
Additions for tax positions of prior years
|
3,815 | 362 | 735 | |||||||||
|
Reductions for tax positions of prior years
|
(2,062 | ) | (2,856 | ) | (2,900 | ) | ||||||
|
Reductions due to statute lapse
|
(2,413 | ) | (1,961 | ) | – | |||||||
|
Settlements (audit payments) refunds – net
|
(124 | ) | (112 | ) | (55 | ) | ||||||
|
Balance at end of year
|
$ | 34,060 | $ | 26,540 | $ | 24,364 | ||||||
The Company classifies the liability for tax uncertainties in Deferred income taxes, tax uncertainties and derivative instruments. Included in this amount are $11.9 million, $8.1 million and $7.4 million at December 31, 2010, 2009 and 2008, respectively, of tax positions for which the ultimate deductibility is highly certain but for which there is uncertainty about the timing of such deductibility. Any changes in the timing of deductibility of these items would not affect the annual effective tax rate but would accelerate the payment of cash to the taxing authorities to an earlier period.
The Company regularly undergoes examination of its federal income tax returns by the Internal Revenue Service (IRS). The Company’s federal tax returns for 2007 and 2008 are currently under the IRS audit, and tax years 2009 and 2010 are open. The Company is also subject to state, local and foreign jurisdiction tax audits. The Company’s tax years 2002 – 2010 remain subject to state and local audits and tax years 2006 – 2010 remain open to foreign audits. Two of the Company’s foreign subsidiaries are currently under audits in their respective jurisdictions. The estimated amount of liability associated with the Company’s uncertain tax positions may change within the next twelve months due to the pending audit activity, expiring statutes or tax payments.
The Company recognizes interest expense in the provision for income taxes. During 2010 and 2008, the Company recognized an expense of $0.5 million and $0.8 million, respectively. During 2009, the Company recognized a net benefit of $0.5 million primarily due to a statute lapse. As of December 31, 2010, 2009 and 2008, the Company accrued $1.9 million, $1.4 million and $1.9 million for interest, respectively.
In June 2008, the FASB issued authoritative guidance which states that unvested share-based payment awards that contain nonforfeitable rights to dividends or dividend equivalents (whether paid or unpaid) are participating securities and shall be included in the computation of earnings per share pursuant to the two-class method.
Effective January 1, 2009, the Company adopted the authoritative guidance. The Company’s unvested share-based payment awards, such as certain Performance Shares, Restricted Stock and Restricted Stock Units that contain nonforfeitable rights to dividends, meet the criteria of a participating security. The adoption changed the methodology of computing the Company’s earnings per share to the two-class method from the treasury stock method. As a result, the Company restated previously reported earnings per share. This change did not affect previously reported consolidated net earnings or net cash flows from operations. Under the two-class method, earnings are allocated between common stock and participating securities. The presentation of basic and diluted earnings per share is required only for each class of common stock and not for participating securities. As such, the Company presents basic and diluted earnings per share for its one class of common stock.
54
The two-class method includes an earnings allocation formula that determines earnings per share for each class of common stock according to dividends declared and undistributed earnings for the period. The Company’s reported net earnings is reduced by the amount allocated to participating securities to arrive at the earnings allocated to common stock shareholders for purposes of calculating earnings per share.
The dilutive effect of participating securities is calculated using the more dilutive of the treasury stock or the two-class method. The Company has determined the two-class method to be the more dilutive. As such, the earnings allocated to common stock shareholders in the basic earnings per share calculation is adjusted for the reallocation of undistributed earnings to participating securities to arrive at the earnings allocated to common stock shareholders for calculating the diluted earnings per share.
The Company had additional outstanding stock options of 2.6 million for the year ended December 31, 2008, that were excluded from the computation of diluted earnings per share because the options’ exercise price was greater than the average market price of the common stock.
The following table sets forth the computation of basic and diluted earnings per share under the two-class method (in thousands of dollars, except for share and per share amounts):
|
For the Years Ended December 31,
|
||||||||||||
|
2010
|
2009
|
2008
|
||||||||||
|
Net earnings attributable to W.W. Grainger, Inc. as reported
|
$ | 510,865 | $ | 430,466 | $ | 475,355 | ||||||
|
Less: Distributed earnings available to participating securities
|
(3,086 | ) | (2,990 | ) | (2,560 | ) | ||||||
|
Less: Undistributed earnings available to participating securities
|
(8,355 | ) | (7,059 | ) | (7,935 | ) | ||||||
|
Numerator for basic earnings per share –
Undistributed and
distributed earnings available to common shareholders
|
499,424 | 420,417 | 464,860 | |||||||||
|
Add: Undistributed earnings allocated to participating securities
|
8,355 | 7,059 | 7,935 | |||||||||
|
Less: Undistributed earnings reallocated to participating securities
|
(8,208 | ) | (6,957 | ) | (7,804 | ) | ||||||
|
Numerator for diluted earnings per share –
Undistributed and
distributed earnings available to common shareholders
|
$ | 499,571 | $ | 420,519 | $ | 464,991 | ||||||
|
Denominator for basic earnings per share – weighted average shares
|
70,836,945 | 73,786,346 | 76,579,856 | |||||||||
|
Effect of dilutive securities
|
1,301,913 | 1,105,506 | 1,307,764 | |||||||||
|
Denominator for diluted earnings per share –
weighted average shares adjusted for dilutive securities
|
72,138,858 | 74,891,852 | 77,887,620 | |||||||||
|
Earnings per share two-class method
|
||||||||||||
|
Basic
|
$ | 7.05 | $ | 5.70 | $ | 6.07 | ||||||
|
Diluted
|
$ | 6.93 | $ | 5.62 | $ | 5.97 | ||||||
The Company has two reportable segments: the United States and Canada. The United States segment reflects the results of Grainger’s U.S. operating segment. The Canada segment reflects the results for Acklands – Grainger Inc., the Company’s Canadian operating segment. Other Businesses include the following operating segments which are not material individually and in the aggregate: MonotaRO Co., Ltd. (Japan), Grainger, S.A. de C.V. (Mexico), Grainger Industrial Supply India Private Limited (India), Grainger Caribe Inc. (Puerto Rico), Grainger China LLC (China), Grainger Colombia SAS (Colombia) and Grainger Panama S.A. (Panama). Operating segments generate revenue almost exclusively through the distribution of maintenance, repair and operating supplies as service revenues account for less than 1% of total revenues for each operating segment.
The accounting policies of the segments are the same as those described in the summary of significant accounting policies. Intersegment transfer prices are established at external selling prices, less costs not incurred due to a related party sale. The segment results include certain centrally incurred costs for shared services that are charged to the segments based upon the relative level of service used by each operating segment.
55
Following is a summary of segment results (in thousands of dollars):
|
2010
|
||||||||||||||||
|
United States
|
Canada
|
Other Businesses
|
Total
|
|||||||||||||
|
Total net sales
|
$ | 6,020,069 | $ | 820,941 | $ | 389,621 | $ | 7,230,631 | ||||||||
|
Intersegment net sales
|
(47,913 | ) | (137 | ) | (423 | ) | (48,473 | ) | ||||||||
|
Net sales to external customers
|
5,972,156 | 820,804 | 389,198 | 7,182,158 | ||||||||||||
|
Segment operating earnings (losses)
|
920,222 | 46,836 | 11,661 | 978,719 | ||||||||||||
|
Segment assets
|
2,365,532 | 605,023 | 446,216 | 3,416,771 | ||||||||||||
|
Depreciation and amortization
|
105,478 | 12,407 | 7,809 | 125,694 | ||||||||||||
|
Additions to long-lived assets
|
$ | 100,194 | $ | 20,745 | $ | 5,660 | $ | 126,599 | ||||||||
|
2009
|
||||||||||||||||
|
United States
|
Canada
|
Other Businesses
|
Total
|
|||||||||||||
|
Total net sales
|
$ | 5,445,390 | $ | 651,166 | $ | 165,051 | $ | 6,261,607 | ||||||||
|
Intersegment net sales
|
(39,057 | ) | (154 | ) | (405 | ) | (39,616 | ) | ||||||||
|
Net sales to external customers
|
5,406,333 | 651,012 | 164,646 | 6,221,991 | ||||||||||||
|
Segment operating earnings (losses)
|
735,586 | 43,742 | (11,634 | ) | 767,694 | |||||||||||
|
Segment assets
|
2,281,731 | 545,866 | 333,955 | 3,161,552 | ||||||||||||
|
Depreciation and amortization
|
111,922 | 10,718 | 5,991 | 128,631 | ||||||||||||
|
Additions to long-lived assets
|
$ | 111,816 | $ | 14,828 | $ | 10,690 | $ | 137,334 | ||||||||
|
2008
|
||||||||||||||||
|
United States
|
Canada
|
Other Businesses
|
Total
|
|||||||||||||
|
Total net sales
|
$ | 6,057,828 | $ | 727,989 | $ | 111,732 | $ | 6,897,549 | ||||||||
|
Intersegment net sales
|
(46,992 | ) | (127 | ) | (398 | ) | (47,517 | ) | ||||||||
|
Net sales to external customers
|
6,010,836 | 727,862 | 111,334 | 6,850,032 | ||||||||||||
|
Segment operating earnings (losses)
|
840,408 | 54,263 | (11,827 | ) | 882,844 | |||||||||||
|
Segment assets
|
2,310,484 | 448,660 | 133,111 | 2,892,255 | ||||||||||||
|
Depreciation and amortization
|
107,709 | 10,488 | 4,574 | 122,771 | ||||||||||||
|
Additions to long-lived assets
|
$ | 136,338 | $ | 19,833 | $ | 32,469 | $ | 188,640 | ||||||||
Following are reconciliations of the segment information with the consolidated totals per the financial statements (in thousands of dollars):
|
2010
|
2009
|
2008
|
||||||||||
|
Operating earnings:
|
||||||||||||
|
Total operating earnings for reportable
segments
|
$ | 978,719 | $ | 767,694 | $ | 882,844 | ||||||
|
Unallocated expenses
|
(118,244 | ) | (102,470 | ) | (100,172 | ) | ||||||
|
Total consolidated operating earnings
|
$ | 860,475 | $ | 665,224 | $ | 782,672 | ||||||
|
Assets:
|
||||||||||||
|
Total assets for reportable segments
|
$ | 3,416,771 | $ | 3,161,552 | $ | 2,892,255 | ||||||
|
Unallocated assets
|
487,606 | 564,780 | 623,162 | |||||||||
|
Total consolidated assets
|
$ | 3,904,377 | $ | 3,726,332 | $ | 3,515,417 | ||||||
56
|
2010
|
||||||||||||
|
Segment
Totals
|
Unallocated
|
Consolidated Total
|
||||||||||
|
Other significant items:
|
||||||||||||
|
Depreciation and amortization
|
$ | 125,694 | $ | 12,099 | $ | 137,793 | ||||||
|
Additions to long-lived assets
|
$ | 126,599 | $ | 4,941 | $ | 131,540 | ||||||
|
Revenues
|
Long-lived Assets
|
|||||||||||
|
Geographic information:
|
||||||||||||
|
United States
|
$ | 5,922,668 | $ | 845,008 | ||||||||
|
Canada
|
823,220 | 87,325 | ||||||||||
|
Other foreign countries
|
436,270 | 64,900 | ||||||||||
| $ | 7,182,158 | $ | 997,233 | |||||||||
|
2009
|
||||||||||||
|
Segment
Totals
|
Unallocated
|
Consolidated Total
|
||||||||||
|
Other significant items:
|
||||||||||||
|
Depreciation and amortization
|
$ | 128,631 | $ | 12,343 | $ | 140,974 | ||||||
|
Additions to long-lived assets
|
$ | 137,334 | $ | 2,618 | $ | 139,952 | ||||||
|
Revenues
|
Long-lived Assets
|
|||||||||||
|
Geographic information:
|
||||||||||||
|
United States
|
$ | 5,362,729 | $ | 864,586 | ||||||||
|
Canada
|
653,984 | 74,515 | ||||||||||
|
Other foreign countries
|
205,278 | 53,543 | ||||||||||
| $ | 6,221,991 | $ | 992,644 | |||||||||
|
2008
|
||||||||||||
|
Segment
Totals
|
Unallocated
|
Consolidated Total
|
||||||||||
|
Other significant items:
|
||||||||||||
|
Depreciation and amortization
|
$ | 122,771 | $ | 12,366 | $ | 135,137 | ||||||
|
Additions to long-lived assets
|
$ | 188,640 | $ | 7,508 | $ | 196,148 | ||||||
|
Revenues
|
Long-lived Assets
|
|||||||||||
|
Geographic information:
|
||||||||||||
|
United States
|
$ | 5,953,205 | $ | 878,624 | ||||||||
|
Canada
|
731,131 | 60,755 | ||||||||||
|
Other foreign countries
|
165,696 | 42,481 | ||||||||||
| $ | 6,850,032 | $ | 981,860 | |||||||||
Long-lived assets consist of property, buildings, equipment and capitalized software.
Revenues are attributed to countries based on the ship-to location of the customer.
Unallocated expenses and unallocated assets primarily relate to the Company headquarters’ support services, which are not part of any business segment, as well as intercompany eliminations. Unallocated expenses include payroll and benefits, depreciation and other costs associated with headquarters-related support services. Unallocated assets include non-operating cash and cash equivalents, certain prepaid expenses and property, buildings and equipment – net.
57
The change in the carrying amount of goodwill by segment from January 1, 2008 to December 31, 2010, is as follows (in thousands of dollars):
|
United States
|
Canada
|
Other Businesses
|
Total
|
|||||||||||||
|
Balance at January 1, 2008
|
$ | 91,696 | $ | 141,332 | $ | – | $ | 233,028 | ||||||||
|
Acquisition
|
2,372 | 4,381 | – | 6,753 | ||||||||||||
|
Translation
|
– | (26,622 | ) | – | (26,622 | ) | ||||||||||
|
Balance at December 31, 2008
|
94,068 | 119,091 | – | 213,159 | ||||||||||||
|
Acquisitions
|
62,361 | 67 | 58,191 | 120,619 | ||||||||||||
|
Translation
|
– | 18,748 | (1,344 | ) | 17,404 | |||||||||||
|
Balance at December 31, 2009
|
156,429 | 137,906 | 56,847 | 351,182 | ||||||||||||
|
Acquisitions
|
1,012 | 8,592 | 14,531 | 24,135 | ||||||||||||
|
Purchase price adjustments
|
(6,221 | ) | – | 2,286 | (3,935 | ) | ||||||||||
|
Translation
|
– | 7,424 | 8,426 | 15,850 | ||||||||||||
|
Balance at December 31, 2010
|
$ | 151,220 | $ | 153,922 | $ | 82,090 | $ | 387,232 | ||||||||
A summary of selected quarterly information for 2010 and 2009 is as follows (in thousands of dollars, except for per share amounts):
|
2010 Quarter Ended
|
||||||||||||||||||||
|
March 31
|
June 30
|
September 30
|
December 31
|
Total
|
||||||||||||||||
|
Net sales
|
$ | 1,672,354 | $ | 1,783,696 | $ | 1,899,412 | $ | 1,826,696 | $ | 7,182,158 | ||||||||||
|
Cost of merchandise sold
|
966,612 | 1,036,610 | 1,109,688 | 1,063,564 | 4,176,474 | |||||||||||||||
|
Gross profit
|
705,742 | 747,086 | 789,724 | 763,132 | 3,005,684 | |||||||||||||||
|
Warehousing, marketing and
administrative expenses
|
522,857 | 532,171 | 538,451 | 551,730 | 2,145,209 | |||||||||||||||
|
Operating earnings
|
182,885 | 214,915 | 251,273 | 211,402 | 860,475 | |||||||||||||||
|
Net earnings attributable to W.W. Grainger, Inc.
|
99,173 | 129,077 | 150,405 | 132,210 | 510,865 | |||||||||||||||
|
Earnings per share - basic
|
1.34 | 1.76 | 2.10 | 1.87 | 7.05 | |||||||||||||||
|
Earnings per share - diluted
|
$ | 1.31 | $ | 1.73 | $ | 2.06 | $ | 1.83 | $ | 6.93 | ||||||||||
|
2009 Quarter Ended
|
||||||||||||||||||||
|
March 31
|
June 30
|
September 30
|
December 31
|
Total
|
||||||||||||||||
|
Net sales
|
$ | 1,465,248 | $ | 1,533,263 | $ | 1,589,665 | $ | 1,633,815 | $ | 6,221,991 | ||||||||||
|
Cost of merchandise sold
|
835,833 | 908,295 | 929,720 | 949,617 | 3,623,465 | |||||||||||||||
|
Gross profit
|
629,415 | 624,968 | 659,945 | 684,198 | 2,598,526 | |||||||||||||||
|
Warehousing, marketing and
administrative expenses
|
470,201 | 471,039 | 473,225 | 518,837 | 1,933,302 | |||||||||||||||
|
Operating earnings
|
159,214 | 153,929 | 186,720 | 165,361 | 665,224 | |||||||||||||||
|
Net earnings attributable to W.W. Grainger, Inc.
|
96,378 | 92,466 | 144,564 | 97,058 | 430,466 | |||||||||||||||
|
Earnings per share - basic
|
1.27 | 1.23 | 1.91 | 1.29 | 5.70 | |||||||||||||||
|
Earnings per share - diluted
|
$ | 1.25 | $ | 1.21 | $ | 1.88 | $ | 1.27 | $ | 5.62 | ||||||||||
58
Grainger has been named, along with numerous other nonaffiliated companies, as a defendant in litigation in various states involving asbestos and/or silica. These lawsuits typically assert claims of personal injury arising from alleged exposure to asbestos and/or silica as a consequence of products purportedly distributed by Grainger. In 2010, Grainger was named in lawsuits relating to asbestos and/or silica involving approximately 190 new plaintiffs, and lawsuits relating to asbestos and/or silica involving approximately 150 plaintiffs were dismissed with respect to Grainger, typically based on the lack of product identification.
As of January 24, 2011, Grainger is named in cases filed on behalf of approximately 1,900 plaintiffs in which there is an allegation of exposure to asbestos and/or silica. Grainger has denied, or intends to deny, the allegations in all of the above-described lawsuits. If a specific product distributed by Grainger is identified in any of these lawsuits, Grainger would attempt to exercise indemnification remedies against the product manufacturer. In addition, Grainger believes that a substantial number of these claims are covered by insurance. Grainger has entered into agreements with its major insurance carriers relating to the scope, coverage and costs of defense of lawsuits involving claims of exposure to asbestos. While Grainger is unable to predict the outcome of these lawsuits, it believes that the ultimate resolution will not have, either individually or in the aggregate, a material adverse effect on Grainger’s consolidated financial position or results of operations.
Grainger is a party to a contract with the United States General Services Administration (the GSA) first entered into in 1999 and subsequently extended in 2004. The GSA contract had been the subject of an audit performed by the GSA’s Office of the Inspector General. In December 2007, the Company received a letter from the Commercial Litigation Branch of the Civil Division of the Department of Justice (the DOJ) regarding the GSA contract. The letter suggested that the Company had not complied with its disclosure obligations and the contract’s pricing provisions, and had potentially overcharged government customers under the contract.
Discussions relating to the Company’s compliance with its disclosure obligations and the contract’s pricing provisions are ongoing; the Company last met with the DOJ in December 2010. The timing and outcome of these discussions are uncertain and could include settlement or civil litigation by the DOJ to recover, among other amounts, treble damages and penalties under the False Claims Act. Due to the uncertainties surrounding this matter, an estimate of possible loss cannot be determined. While this matter is not expected to have a material adverse effect on the Company’s financial position, an unfavorable resolution could result in significant payments by the Company. The Company continues to believe that it has complied with the GSA contract in all material respects.
Grainger is a party to a contract with the United States Postal Service (the USPS) entered into in 2003 covering the sale of certain Maintenance Repair and Operating Supplies (the MRO Contract). The Company received a subpoena dated August 29, 2008, from the USPS Office of Inspector General seeking information about the Company’s pricing compliance under the MRO Contract. The Company has provided responsive information to the USPS and to the DOJ. The Company last met with the DOJ in December 2010.
Grainger is also a party to a contract with the USPS entered into in 2001 covering the sale of certain janitorial and custodial items (the Custodial Contract). The Company received a subpoena dated June 30, 2009, from the USPS Office of Inspector General seeking information about the Company’s pricing practices and compliance under the Custodial Contract. The Company has provided responsive information to the USPS and to the DOJ. The Company last met with the DOJ in December 2010.
The timing and outcome of the USPS investigations of the MRO Contract and the Custodial Contract are uncertain and could include settlement or civil litigation by the USPS to recover, among other amounts, treble damages and penalties under the False Claims Act. Due to the uncertainties surrounding these matters, an estimate of possible loss cannot be determined. While these matters are not expected to have a material adverse effect on the Company’s financial position, an unfavorable resolution could result in significant payments by the Company. The Company continues to believe that it has complied with each of the MRO Contract and the Custodial Contract in all material respects.
In addition to the foregoing, from time to time Grainger is involved in various other legal and administrative proceedings that are incidental to its business, including claims relating to product liability, premises liability, general negligence, environmental issues, employment, intellectual property and other matters. As a government contractor selling to federal, state and local governmental entities, Grainger is also subject to governmental or regulatory inquiries or audits or other proceedings, including those related to pricing compliance. It is not expected that the ultimate resolution of any of these matters will have, either individually or in the aggregate, a material adverse effect on Grainger’s consolidated financial position or results of operations.
59
SIGNATURES
Pursuant to the requirements of Section 13 of the Securities Exchange Act of 1934, Grainger has duly issued this report to be signed on its behalf by the undersigned, thereunto duly authorized.
DATE: February 25, 2011
|
W.W. GRAINGER, INC.
|
|
|
By:
|
/s/ James T. Ryan
|
|
James T. Ryan
Chairman, President and Chief Executive Officer
|
|
Pursuant to the requirements of the Securities and Exchange Act of 1934, this report has been signed below by the following persons on behalf of Grainger on February 25, 2011, in the capacities indicated.
|
/s/ James T. Ryan
|
/s/ Stuart L. Levenick
|
|
|
James T. Ryan
|
Stuart L. Levenick
|
|
|
Chairman, President and Chief Executive Officer
|
Director
|
|
|
(Principal Executive Officer and Director)
|
||
|
/s/ John W. McCarter, Jr.
|
||
|
/s/ Ronald L. Jadin
|
John W. McCarter, Jr.
|
|
|
Ronald L. Jadin
|
Director
|
|
|
Senior Vice President
|
||
|
and Chief Financial Officer
|
/s/ Neil S. Novich
|
|
|
(Principal Financial Officer)
|
Neil S. Novich
|
|
|
Director
|
||
|
/s/ Gregory S. Irving
|
||
|
Gregory S. Irving
|
/s/ Michael J. Roberts
|
|
|
Vice President and Controller
|
Michael J. Roberts
|
|
|
(Principal Accounting Officer)
|
Director
|
|
|
/s/ Brian P. Anderson
|
/s/ Gary L. Rogers
|
|
|
Brian P. Anderson
|
Gary L. Rogers
|
|
|
Director
|
Director
|
|
|
/s/ Wilbur H. Gantz
|
/s/ E. Scott Santi
|
|
|
Wilbur H. Gantz
|
E. Scott Santi
|
|
|
Director
|
Director
|
|
|
/s/ V. Ann Hailey
|
/s/ James D. Slavik
|
|
|
V. Ann Hailey
|
James D. Slavik
|
|
|
Director
|
Director
|
|
|
/s/ William K. Hall
|
||
|
William K. Hall
|
||
|
Director
|
||
60
TABLE OF CONTENTS
Part IItem 1: BusinessItem 1A: Risk FactorsItem 1B: Unresolved Staff CommentsItem 2: PropertiesItem 3: Legal ProceedingsItem 4: [removed and Reserved]Part IIItem 5: Market For Registrant S Common Equity, Related Shareholder Matters and Issuer Purchases Of Equity SecuritiesItem 6: Selected Financial DataItem 7: Management S Discussion and Analysis Of Financial Condition and Results Of OperationsItem 7A: Quantitative and Qualitative Disclosures About Market RiskItem 8: Financial Statements and Supplementary DataItem 9: Changes in and Disagreements with Accountants on Accounting and Financial DisclosureItem 9A: Controls and ProceduresItem 9B: Other InformationPart IIIItem 10: Directors, Executive Officers and Corporate GovernanceItem 11: Executive CompensationItem 12: Security Ownership Of Certain Beneficial Owners and Management and Related Stockholder MattersItem 13: Certain Relationships and Related Transactions, and Director IndependenceItem 14: Principal Accounting Fees and ServicesPart IVItem 15: Exhibits and Financial Statement SchedulesNote 1 Background and Basis Of PresentationNote 2 Summary Of Significant Accounting PoliciesNote 3 Business AcquisitionsNote 4 Allowance For Doubtful AccountsNote 5 InventoriesNote 6 Investments in Unconsolidated EntitiesNote 7 Capitalized SoftwareNote 8 Short-term DebtNote 9 Long-term DebtNote 10 Derivative InstrumentsNote 11 Employee BenefitsNote 12 LeasesNote 13 Stock Incentive PlansNote 14 Capital StockNote 15 Accumulated Other Comprehensive EarningsNote 16 Noncontrolling InterestNote 17 Income TaxesNote 18 Earnings Per ShareNote 19 Segment InformationNote 20 Selected Quarterly Financial Data (unaudited)Note 21 Contingencies and Legal Matters