W.W. GRAINGER, INC.
10-Ks and 10-Qs
|
|
|
|
|
|
|
|
|
|
|
|
|
|
|
|
|
|
|
|
|
|
|
|
|
|
|
|
|
|
|
|
|
|
|
|
|
|
|
|
|
|
|
|
|
|
|
|
|
|
|
|
|
|
|
|
UNITED STATES
SECURITIES AND EXCHANGE COMMISSION
Washington, D.C. 20549
FORM 10-K
(Mark One)
[X] ANNUAL REPORT PURSUANT TO SECTION 13 OR 15(d) OF
THE SECURITIES EXCHANGE ACT OF 1934
For the fiscal year ended
December 31, 2017
OR
[ ] TRANSITION REPORT PURSUANT TO SECTION 13 OR 15(d) OF
THE SECURITIES EXCHANGE ACT OF 1934
For the transition period from ______ to _______
Commission file number 1-5684
W.W. Grainger, Inc.
(Exact name of registrant as specified in its charter)
|
Illinois
|
|
36-1150280
|
|
(State or other jurisdiction of incorporation or organization)
|
|
(I.R.S. Employer Identification No.)
|
|
100 Grainger Parkway, Lake Forest, Illinois
|
|
60045-5201
|
|
(Address of principal executive offices)
|
|
(Zip Code)
|
|
(847) 535-1000
|
||
|
(Registrant’s telephone number including area code)
|
||
|
Securities registered pursuant to Section 12(b) of the Act:
|
||
|
Title of each class
|
Name of each exchange on which registered
|
|
|
Common Stock $0.50 par value
|
New York Stock Exchange
|
|
Indicate by check mark if the registrant is a well-known seasoned issuer, as defined in Rule 405 of the Securities Act. Yes [X] No [ ]
Indicate by check mark if the registrant is not required to file reports pursuant to Section 13 or Section 15(d) of the Act. Yes [ ] No [X]
Indicate by check mark whether the registrant (1) has filed all reports required to be filed by Section 13 or 15(d) of the Securities Exchange Act of 1934 during the preceding 12 months (or for such shorter period that the registrant was required to file such reports), and (2) has been subject to such filing requirements for the past 90 days. Yes [X] No [ ]
Indicate by check mark whether the registrant has submitted electronically and posted on its corporate website, if any, every Interactive Data File required to be submitted and posted pursuant to Rule 405 of Regulation S-T (§232.405 of this chapter) during the preceding 12 months (or for such shorter period that the registrant was required to submit and post such files). Yes [X] No [ ]
Indicate by check mark if disclosure of delinquent filers pursuant to Item 405 of Regulation S-K is not contained herein, and will not be contained, to the best of registrant’s knowledge, in definitive proxy or information statements incorporated by reference in Part III of this Form 10-K or any amendment to this Form 10-K. [ ]
Indicate by check mark whether the registrant is a large accelerated filer, an accelerated filer, a non-accelerated filer, or a smaller reporting company. See the definitions of “large accelerated filer,” “accelerated filer” and “smaller reporting company” in Rule 12b-2 of the Exchange Act.
|
Large accelerated filer [X]
|
Accelerated filer [ ]
|
Non-accelerated filer [ ]
|
Smaller reporting company [ ]
|
Indicate by check mark whether the registrant is a shell company (as defined in Rule 12b-2 of the Act). Yes [ ] No [X]
The aggregate market value of the voting common equity held by nonaffiliates of the registrant was $
9,747,864,843
as of the close of trading as reported on the New York Stock Exchange on
June 30, 2017
. The Company does not have nonvoting common equity.
The registrant had
56,105,411
shares of the Company’s Common Stock outstanding as of
January 31, 2018
.
DOCUMENTS INCORPORATED BY REFERENCE
Portions of the registrant's definitive proxy statement to be filed in connection with the annual meeting of shareholders to be held on
April 25, 2018
, are incorporated by reference into Part III hereof of this Form 10-K where indicated the definitive 2018 proxy statement will be filed on or about March 15, 2018.
1
|
TABLE OF CONTENTS
|
Page(s)
|
|||||
|
PART I
|
||||||
|
Item 1:
|
BUSINESS
|
|||||
|
Item 1A:
|
RISK FACTORS
|
|||||
|
Item 1B:
|
UNRESOLVED STAFF COMMENTS
|
|||||
|
Item 2:
|
PROPERTIES
|
|||||
|
Item 3:
|
LEGAL PROCEEDINGS
|
|||||
|
Item 4:
|
MINE SAFETY DISCLOSURES
|
|||||
|
Item 4A:
|
EXECUTIVE OFFICERS OF THE REGISTRANT
|
|||||
|
PART II
|
||||||
|
Item 5:
|
MARKET FOR REGISTRANT'S COMMON EQUITY, RELATED SHAREHOLDER
|
|||||
|
MATTERS AND ISSUER PURCHASES OF EQUITY SECURITIES
|
||||||
|
Item 6:
|
SELECTED FINANCIAL DATA
|
|||||
|
Item 7:
|
MANAGEMENT'S DISCUSSION AND ANALYSIS OF FINANCIAL
|
|||||
|
CONDITION AND RESULTS OF OPERATIONS
|
||||||
|
Item 7A:
|
QUANTITATIVE AND QUALITATIVE DISCLOSURES ABOUT MARKET RISK
|
|||||
|
Item 8:
|
FINANCIAL STATEMENTS AND SUPPLEMENTARY DATA
|
|||||
|
Item 9:
|
CHANGES IN AND DISAGREEMENTS WITH ACCOUNTANTS
|
|||||
|
ON ACCOUNTING AND FINANCIAL DISCLOSURE
|
||||||
|
Item 9A:
|
CONTROLS AND PROCEDURES
|
|||||
|
Item 9B:
|
INFORMATION REQUIRED TO BE DISCLOSED IN A FORM 8-K
|
|||||
|
PART III
|
||||||
|
Item 10:
|
DIRECTORS, EXECUTIVE OFFICERS AND CORPORATE GOVERNANCE
|
|||||
|
Item 11:
|
EXECUTIVE COMPENSATION
|
|||||
|
Item 12:
|
DIRECTORS AND EXECUTIVE OFFICERS
|
|||||
|
Item 13:
|
CERTAIN RELATIONSHIPS AND RELATED TRANSACTIONS
|
|||||
|
Item 14:
|
PRINCIPAL ACCOUNTANT FEES AND SERVICES
|
|||||
|
PART IV
|
||||||
|
Item 15:
|
EXHIBITS AND FINANCIAL STATEMENT SCHEDULES
|
|||||
|
Signatures
|
||||||
2
The Company
W.W. Grainger, Inc., incorporated in the State of Illinois in 1928, is a broad line, business-to-business distributor of maintenance, repair and operating (MRO) supplies and other related products and services. W.W. Grainger, Inc.'s operations are primarily in the United States (U.S.) and Canada, with a presence in Europe, Asia and Latin America. In this report, the words “Grainger” or “Company” mean W.W. Grainger, Inc. and its subsidiaries.
Grainger uses a combination of multichannel and single channel online business models to provide customers, primarily businesses, with a range of options for finding and purchasing MRO products, utilizing sales representatives, contact centers, catalogs, inventory management solutions and eCommerce technology. Grainger serves more than
3
million customers worldwide through a network of highly integrated distribution centers, websites, branches and inventory management solutions.
Products are regularly added to and removed from Grainger's product lines on the basis of customer demand, market research, suppliers' recommendations, sales volumes and other factors.
Grainger's centralized business support functions provide coordination and guidance in the areas of supply chain, product management, accounting and finance, strategy, communications and investor relations, human resources, compensation and benefits, information systems, health and safety, procurement, risk management, internal audit, legal, real estate, security, tax and treasury. These services are provided in varying degrees to all business units.
Grainger’s two reportable segments are the U.S. and Canada, and they are described further below. Other businesses include the single channel online businesses Zoro Tools, Inc. (Zoro) in the U.S. and MonotaRO Co., Ltd. (MonotaRO) in Japan and operations in Europe, Asia and Latin America. These businesses generate revenue through the distribution of MRO supplies and products and related services. For segment and geographical information and consolidated net sales and operating earnings, see “Item 7: Management’s Discussion and Analysis of Financial Condition and Results of Operations” and Note 16 to the Consolidated Financial Statements.
United States
The U.S. business offers a broad selection of MRO supplies and other related products and services through sales representatives, catalogs, eCommerce and local branches. A combination of product breadth, local availability, speed of delivery, detailed product information and competitively priced products and services is provided by this business. Products offered include material handling equipment, safety and security supplies, lighting and electrical products, power and hand tools, pumps and plumbing supplies, cleaning and maintenance supplies and metalworking tools. Services offered primarily relate to inventory management solutions.
The majority of products sold by the U.S. business are nationally branded products. In addition, 22% of
2017
sales were private label MRO items bearing Grainger’s registered trademarks, including DAYTON®, SPEEDAIRE®, AIR HANDLER®, TOUGH GUY®, WESTWARD®, CONDOR® and LUMAPRO®. Grainger has taken steps to protect these trademarks against infringement and believes that they will remain available for future use in its business. The U.S. business purchases products for sale from more than
2,600
suppliers, most of which are manufacturers. Through a global sourcing operation, the business procures competitively priced, high-quality products produced outside the U.S. from approximately
400
suppliers. No single supplier comprised more than
5%
of total purchases and no significant barriers thus far exist with respect to sources of supply.
3
The U.S. business operates and fulfills orders in all 50 states and exports to a select number of countries through a network of distribution centers (DCs), branches and contact centers. Customers range from small and mid-sized businesses to large corporations, government entities and other institutions. They are primarily represented by purchasing managers or employees in facilities maintenance departments and service shops across a wide range of industries such as manufacturing, hospitality, transportation, government, retail, healthcare and natural resources. Sales in
2017
were made to approximately
1 million
customers averaging
113,000
daily transactions. No single customer accounted for more than
4%
of total sales.
Macro trends are changing the way Grainger's customers behave. Customers want highly tailored solutions with real-time access to information and just-in-time delivery of products and services. Demands for transparency are also increasing as access to information expands. These changes in behaviors are reflected in how customers do business with the U.S. business as demonstrated in the following chart:
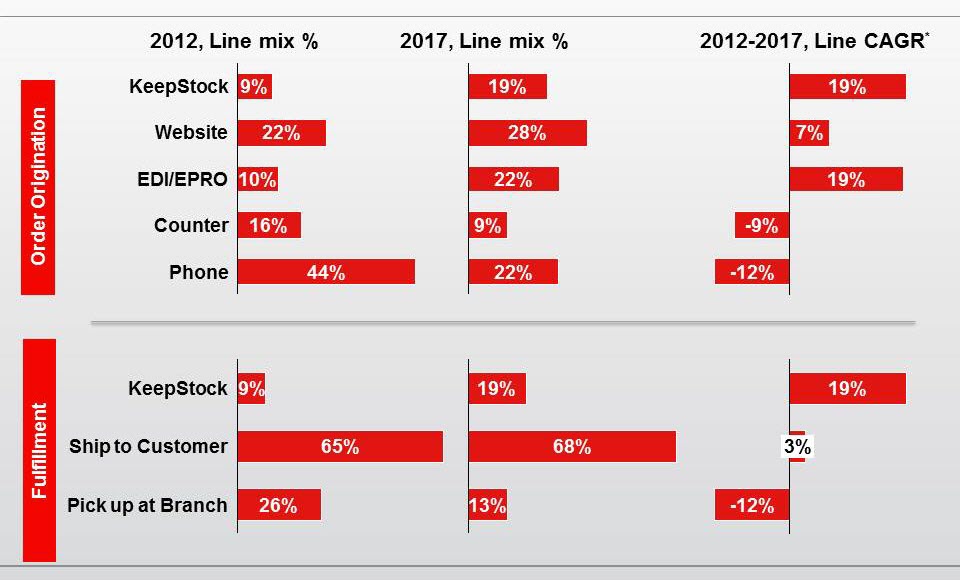
*CAGR is defined as compound annual growth rate.
Customers continue to migrate to web platforms and electronic purchasing platforms such as EDI, eProcurement and KeepStock®, the electronic inventory management offering. Through Grainger.com and other branded websites, which serve as prominent channels in the U.S. business, customers have access to approximately 2.4 million products. Grainger.com provides real-time price and product availability and detailed product information and offers features such as product search and compare capabilities. For customers with sophisticated electronic purchasing platforms, the U.S. business utilizes technology that allows these systems to communicate directly with Grainger.com.
Inventory management services is another area where the U.S. business helps customers be more productive. KeepStock® inventory solutions is a comprehensive program that includes vendor-managed inventory, customer-managed inventory and onsite vending machines. The U.S. business KeepStock® program currently provides services to nearly
20,000
customers and, in 2017, facilitated approximately
9,000
installations.
As of December 31, 2017
, there were approximately
65,000
total installations.
As of December 31, 2017
, the U.S. business had 284 branches (251 stand alone, 31 onsite and 2 will-call express locations), 16 DCs, 3 national contact centers and 37 regional contact centers, which are located within branches. DCs in the U.S. business range in size from approximately 45,000 square feet to 1.3 million square feet, the largest of which can accommodate more than 500,000 in-stock products. Automated equipment and processes allow DCs to handle the majority of the customer shipping for next-day product availability and replenish branches that provide
4
same-day availability. The DC network fulfills a large portion of customer orders, especially as customers migrate to website and electronic purchasing.
Branches in the U.S. business serve the immediate needs of customers in their local markets by allowing them to directly pick up items. In addition, branches support local KeepStock® operations. The branch network has approximately
1,700
employees who primarily fulfill counter and will-call product purchases and provide customer service. Branch network sales volume has continued to grow throughout 2017.
Grainger's contact center network in the U.S. business consists of approximately 1,900 employees who handle about 70,000 customer interactions per day including approximately 20,000 orders via phone, e-mail and fax. To enable improved customer service, team member engagement and efficiencies, the 37 regional contact centers are currently being consolidated to 3 national contact centers with expanded work-from-home arrangements.
The U.S. business has a sales force of approximately
3,500
professionals who help customers select the right products to find immediate solutions to their needs and reduce costs by utilizing Grainger as a consistent source of supply. In 2017, the U.S. business continued to focus its outside sales force on facilitating growth with large customers who typically have more complex purchasing requirements than small and mid-sized customers. The U.S. business primarily utilizes a network of inside sellers and digital channels to meet the needs of small and mid-sized customers.
The Grainger catalog, most recently issued in
February 2018
, offers approximately
365,000
MRO products and is used by customers to assist in product selection. The
2018
catalog includes almost
24,000
new items and approximately
1
million copies of the catalog were produced.
Grainger estimates the U.S. market for MRO products to be approximately $127 billion in
2017
, of which the U.S. business share is approximately 6%.
Canada
Acklands – Grainger Inc. and its subsidiaries (the Canada business) is Canada’s leading broad line MRO distributor. This business provides a combination of product breadth, local availability, speed of delivery, detailed product information and competitively priced products and services.
The Canada business serves customers through branches, sales and service representatives and DCs across Canada.
As of December 31, 2017
, the Canada business had
91
branches and
6
DCs. Approximately
13,000
sales transactions are completed daily. Customers have access to more than
131,000
stocked products through a comprehensive catalog. In addition, customers can purchase products through various fully bilingual websites. Grainger estimates the
2017
Canada market for MRO products was approximately $11 billion, of which the Canada business share is approximately 7%.
Other businesses
Other businesses include Zoro in the U.S., MonotaRO in Japan and operations in Europe, Asia and Latin America. The businesses in this group with revenues of more than $100 million in
2017
are described below.
Zoro
Zoro is an online MRO distributor primarily serving U.S. customers through its website, Zoro.com. Zoro offers a broad selection of more than 1 million products. Zoro has no branches or sales force, and customer orders are primarily fulfilled through the U.S. business supply chain.
MonotaRO
Grainger operates in Japan and other Asian countries primarily through its majority interest in MonotaRO. MonotaRO provides customers with MRO products primarily through its catalogs and websites. A majority of orders are conducted through Monotaro.com, through which customers have access to approximately 13 million products. MonotaRO fulfills the majority of orders from three DCs. Grainger estimates the Japanese market for MRO products was approximately $42 billion in
2017
, of which MonotaRO’s share is approximately 2%.
Cromwell
Cromwell is a broad line MRO distributor in the United Kingdom (U.K.) serving approximately 130,000 customers. Headquartered in Leicester, England, as of December 31, 2017, Cromwell had 45 U.K. branches, 10 international branches in 10 countries and one DC. Customers have access to approximately 170,000 MRO products through a catalog and through Cromwell.co.uk. Grainger estimates the U.K. market for MRO products was approximately $15 billion in
2017
, of which Cromwell's share is approximately 2%. In November 2017, Cromwell launched a new brand and website Zoro.co.uk and its customer orders are primarily fulfilled through the Cromwell business supply chain.
5
Fabory
Fabory is a European specialty distributor of fasteners and MRO products. Fabory is headquartered in Tilburg, the Netherlands.
As of December 31, 2017
, Fabory had
44
branches in
13
countries and two DCs. Customers have access to more than
250,000
products through a catalog and Fabory.com. Grainger estimates the European market (in which Fabory has its primary operations) for MRO products, including fasteners, was approximately $37 billion in
2017
, of which Fabory’s share is approximately 1%.
Grainger Mexico
Grainger’s operations in Mexico provide local businesses with MRO supplies and other related products primarily from Mexico and the U.S. As of December 31, 2017, the business in Mexico distributes products through a network of 19 branches and two DCs. Customers have access to approximately
330,000
products through a Spanish-language catalog and through Grainger.com.mx. Grainger estimates the Mexican market for MRO products was approximately $10 billion in
2017
, of which Grainger Mexico’s share is approximately 1%.
Seasonality
Grainger’s business in general is not seasonal, however, there are some products that typically sell more often during the winter or summer seasons. In any given month, unusual weather patterns, that is, unusually hot or cold weather, could positively or negatively impact the sales volumes of these products.
Competition
Grainger faces competition in each market from manufacturers (including some of its own suppliers) that sell directly to certain segments of the market, to wholesale distributors, catalog houses, retail enterprises and Internet-based businesses. Grainger differentiates itself by providing local product availability, a broad product line, sales representatives, competitive pricing, catalogs (which include product descriptions and, in certain cases, extensive technical and application data) and electronic and eCommerce technology. Grainger also offers other services, such as inventory management. Grainger has several large competitors and continues to be highly competitive against the predominant number of small local and regional competitors.
Employees
As of December 31, 2017
, Grainger had approximately
25,700
employees, of whom approximately
24,400
were full-time and
1,300
were part-time or temporary. Grainger has never had a major work stoppage and considers employee relations to be good.
Website Access to Company Reports
Grainger makes available free of charge, through its website, www.Grainger.com/investor, its Annual Report on Form 10-K, quarterly reports on Form 10-Q, current reports on Form 8-K, proxy statements and amendments to those reports if any, as soon as reasonably practicable after these materials are electronically filed with or furnished to the U.S. Securities and Exchange Commission (SEC).
In addition, the public may read and copy any materials the Company files with the SEC at the SEC's Public Reference Room at 100 F Street, NE, Washington D.C. 20549. The public may obtain information on the operation of the Public Reference Room by calling the SEC at (800) SEC-0330. The SEC maintains a website that contains reports, proxy and information statements and other information regarding issuers that file electronically with the SEC and the address of that site is http://www.sec.gov.
6
The following is a discussion of significant risk factors relevant to Grainger’s business that could adversely affect its financial condition, results of operations and cash flows. The risk factors discussed in this section should be considered together with information included elsewhere in this Annual Report on Form 10-K and should not be considered the only risks to which the Company is exposed.
Weakness in the economy, market trends and other conditions affecting the profitability and financial stability of Grainger’s customers could negatively impact Grainger’s sales growth and results of operations.
Economic and industry trends affect Grainger’s business environments. Grainger serves several industries in which the demand for its products and services is sensitive to the production activity, capital spending and demand for products and services of Grainger’s customers. Many of these customers operate in markets that are subject to cyclical fluctuations resulting from market uncertainty, costs of goods sold, currency exchange rates, foreign competition, offshoring of production, oil and natural gas prices, geopolitical developments and a variety of other factors beyond Grainger’s control. Any of these factors could cause customers to idle or close facilities, delay purchases, reduce production levels or experience reductions in the demand for their own products or services.
Any of these events could impair the ability of Grainger’s customers to make full and timely payments or reduce the volume of products and services these customers purchase from Grainger and could cause increased pressure on Grainger’s selling prices and terms of sale. Accordingly, a significant or prolonged slowdown in activity in the U.S., Canada or any other major world economy, or a segment of any such economy, could negatively impact Grainger’s sales growth and results of operations.
The facilities maintenance industry is highly competitive, and changes in competition could result in decreased demand for Grainger’s products and services.
There are several large competitors in the industry, although most of the market is served by small local and regional competitors. Grainger faces competition in all markets it serves, from manufacturers (including some of its own suppliers) that sell directly to certain segments of the market, wholesale distributors, catalog houses, retail enterprises and online businesses that compete with price transparency.
To remain competitive, the Company must be willing and able to respond to market pressures, including pricing, whether widely available or negotiated under a contract, delivery and services. These pressures, and the implementation, timing and results of our strategic pricing and other responses, could have a material effect on Grainger's sales and profitability. If the Company is unable to grow sales or reduce costs, among other actions, to wholly or partially offset the effect on profitability of our pricing actions, the Company's results of operations and financial condition may be adversely affected.
The industry is also consolidating as customers are increasingly aware of the total costs of fulfillment and of the need to have consistent sources of supply at multiple locations. This consolidation could cause the industry to become more competitive as greater economies of scale are achieved by competitors, or as competitors with a new lower cost business models are able to operate with lower prices.
Changes in inflation may adversely affect gross margins.
Inflation impacts the costs at which Grainger can procure product and the ability to increase prices to customers over time. Prolonged periods of deflation could adversely affect the degree to which Grainger is able to increase sales through price increases.
Volatility in commodity prices may adversely affect gross margins.
Some of Grainger’s products contain significant amounts of commodity-priced materials, such as steel, copper, petroleum derivatives or rare earth minerals, and are subject to price changes based upon fluctuations in the commodities market. Fluctuations in the price of fuel could affect transportation costs. Grainger’s ability to pass on such increases in costs in a timely manner depends on market conditions. The inability to pass along cost increases could result in lower gross margins. In addition, higher prices could impact demand for these products, resulting in lower sales volumes.
7
Unexpected product shortages could negatively impact customer relationships, resulting in an adverse impact on results of operations.
Grainger’s competitive strengths include product selection and availability. Products are purchased from approximately 5,200 suppliers located in various countries around the world, not one of which accounted for more than 5% of total purchases. Historically, no significant difficulty has been encountered with respect to sources of supply; however, disruptions could occur due to factors beyond Grainger’s control, including economic downturns, geopolitical unrest, port slowdowns, trade issues and other factors, any of which could adversely affect a supplier’s ability to manufacture or deliver products. As Grainger continues to source lower cost products from Asia and other areas of the world, the risk for disruptions has increased due to the additional lead time required and distances involved. If Grainger was to experience difficulty in obtaining products, there could be a short-term adverse effect on results of operations and a longer-term adverse effect on customer relationships and Grainger’s reputation. In addition, Grainger has strategic relationships with a number of vendors. In the event Grainger was unable to maintain those relations, there might be a loss of competitive pricing advantages which could, in turn, adversely affect results of operations.
Changes in customer or product mix could cause the gross margin percentage to decline.
From time to time, Grainger experiences changes in customer and product mix that affect gross margin. Changes in customer and product mix result primarily from business acquisitions, changes in customer demand, customer acquisitions, selling and marketing activities and competition. If rapid growth with larger, lower margin customers continues, Grainger will face pressure to maintain current gross margins, as these customers receive more discounted pricing due to their higher sales volume. There can be no assurance that Grainger will be able to maintain historical gross margins in the future.
Disruptions in Grainger’s supply chain could result in an adverse impact on results of operations.
A disruption within Grainger’s logistics or supply chain network, including damage, destruction, extreme weather and other events, which could cause one or more of Grainger’s distribution centers to become non-operational, could adversely affect Grainger’s ability to obtain or deliver inventory in a timely manner, impair Grainger’s ability to meet customer demand for products and result in lost sales or damage to Grainger’s reputation. Grainger’s ability to provide same-day shipping and next-day delivery is an integral component of Grainger’s business strategy and any such disruption could adversely impact results of operations.
Interruptions in the proper functioning of information systems could disrupt operations and cause unanticipated increases in costs and/or decreases in revenues.
The proper functioning of Grainger’s information systems is critical to the successful operation of its business. Grainger continues to invest in software, hardware and network infrastructures in order to effectively manage its information systems. Although Grainger’s information systems are protected with robust backup and security systems, including physical and software safeguards and remote processing capabilities, information systems are still vulnerable to natural disasters, power losses, computer viruses, telecommunication failures and other problems. If critical information systems fail or otherwise become unavailable, among other things, Grainger’s ability to process orders, maintain proper levels of inventories, collect accounts receivable and disburse funds could be adversely affected. Any such interruption of Grainger’s information systems could also subject Grainger to additional costs.
Breaches of information systems security could damage Grainger’s reputation, disrupt operations, increase costs and/or decrease revenues.
Through Grainger’s sales and eCommerce channels, Grainger collects and stores personally identifiable, confidential, proprietary and other information from customers so that they may, among other things, purchase products or services, enroll in promotional programs, register on Grainger’s websites or otherwise communicate or interact with the Company. Moreover, Grainger’s operations routinely involve receiving, storing, processing and transmitting sensitive information pertaining to its business, customers, suppliers and employees, and other sensitive matters.
While Grainger has instituted safeguards for the protection of such information, during the normal course of business, Grainger has experienced and expects to continue to experience attempts to breach the Company’s information systems, and Grainger may be unable to protect sensitive data and/or the integrity of the Company’s information systems. A cybersecurity incident could be caused by malicious outsiders using sophisticated methods to circumvent firewalls, encryption and other security defenses. Because techniques used to obtain unauthorized access or to
8
sabotage systems change frequently and generally are not recognized until they are launched against a target, Grainger may be unable to anticipate these techniques or implement adequate preventative measures.
Moreover, from time to time, Grainger may share information with vendors and other third parties that assist with certain aspects of the business. While Grainger requires assurances that these vendors and other parties will protect confidential information, there is a risk that the confidentiality of data held or accessed by them may be compromised. If successful, those attempting to penetrate Grainger’s or its vendors’ information systems may misappropriate personally identifiable, credit card, confidential, proprietary or other sensitive customer, supplier, employee or business information.
In addition, a Grainger employee, contractor or other third party with whom Grainger does business may attempt to circumvent security measures in order to obtain such information or inadvertently cause a breach involving such information. Further, Grainger’s systems are integrated with customer systems in certain cases, and a breach of the Company’s information systems could be used to gain illicit access to customer systems and information.
Loss of customer, supplier, employee or other business information could disrupt operations, damage Grainger’s reputation and expose Grainger to claims from customers, suppliers, financial institutions, regulators, payment card associations, employees and others, any of which could have a material adverse effect on Grainger, its financial condition and results of operations.
Fluctuations in foreign currency have an effect on reported results of operations
.
Grainger’s exposure to fluctuations in foreign currency rates results primarily from the translation exposure associated with the preparation of the Consolidated Financial Statements, as well as from transaction exposure associated with transactions in currencies other than an entity’s functional currency. While the Consolidated Financial Statements are reported in U.S. dollars, the financial statements of Grainger’s subsidiaries outside the U.S. are prepared using the local currency as the functional currency and translated into U.S. dollars. In addition, Grainger is exposed to foreign currency exchange rate risk with respect to the U.S. dollar relative to the local currencies of Grainger’s international subsidiaries, primarily the Canadian dollar, euro, pound sterling, Mexican peso, renminbi and yen, arising from transactions in the normal course of business, such as sales and loans to wholly owned subsidiaries, sales to third-party customers, purchases from suppliers and bank loans and lines of credit denominated in foreign currencies. Grainger also has foreign currency exposure to the extent receipts and expenditures are not denominated in the subsidiary’s functional currency and that could have an impact on sales, costs and cash flows. These fluctuations in foreign currency exchange rates could affect Grainger’s results of operations and impact reported net sales and net earnings.
Changes in Grainger’s credit ratings and outlook may reduce access to capital and increase borrowing costs.
Grainger’s credit ratings are based on a number of factors, including Grainger’s financial strength and factors outside of Grainger’s control, such as conditions affecting Grainger’s industry generally or the introduction of new rating practices and methodologies. Grainger cannot provide assurances that Grainger’s current credit ratings will remain in effect or that the ratings will not be lowered, suspended or withdrawn entirely by the rating agencies. If rating agencies lower, suspend or withdraw the ratings, the market price or marketability of Grainger’s securities may be adversely affected. In addition, any change in ratings could make it more difficult for Grainger to raise capital on acceptable terms, impact the ability to obtain adequate financing and result in higher interest costs for Grainger’s existing credit facilities or on future financings.
Acquisitions, partnerships, joint ventures and other business combination transactions involve a number of inherent risks, any of which could result in the benefits anticipated not being realized and could have an adverse effect on results of operations.
Acquisitions, partnerships, joint ventures and other business combination transactions, both foreign and domestic, involve various inherent risks, such as uncertainties in assessing value, strengths, weaknesses, liabilities and potential profitability. There is also risk relating to Grainger’s ability to achieve identified operating and financial synergies anticipated to result from the transactions. Additionally, problems could arise from the integration of acquired businesses, including unanticipated changes in the business or industry or general economic conditions that affect the assumptions underlying the acquisition. Any one or more of these factors could cause Grainger to not realize the benefits anticipated or have a negative impact on the fair value of the reporting units. Accordingly, goodwill and intangible assets recorded as a result of acquisitions could become impaired.
9
In order to compete, Grainger must attract, retain and motivate key employees, and the failure to do so could have an adverse effect on results of operations.
In order to compete and have continued growth, Grainger must attract, retain and motivate executives and other key employees, including those in managerial, technical, sales, marketing and support positions. Grainger competes to hire employees and then must train them and develop their skills and competencies. Grainger’s results of operations could be adversely affected by increased costs due to increased competition for employees, higher employee turnover or increased employee benefit costs.
Grainger’s continued success is substantially dependent on positive perceptions of Grainger’s reputation.
One of the reasons why customers choose to do business with Grainger and why employees choose Grainger as a place of employment is the reputation that Grainger has built over many years. To be successful in the future, Grainger must continue to preserve, grow and leverage the value of Grainger’s brand. Reputational value is based in large part on perceptions of subjective qualities. Even an isolated incident, or the aggregate effect of individually insignificant incidents, can erode trust and confidence, particularly if they result in adverse publicity, governmental investigations or litigation, and as a result, could tarnish Grainger’s brand and lead to adverse effects on Grainger’s business.
Grainger is subject to various domestic and foreign laws, regulations and standards. Failure to comply or unforeseen developments in related contingencies such as litigation could adversely affect Grainger’s financial condition, results of operations and cash flows.
Grainger’s business is subject to a wide array of laws, regulations and standards in every domestic and foreign jurisdiction where it operates, including advertising and marketing regulations, anti-bribery and corruption laws, anti-competition regulations, data protection (including payment card industry data security standards), data privacy (including in the U.S. and the European Union, which has traditionally imposed strict obligations under data privacy laws and regulations that vary from country to country) and cybersecurity requirements (including protection of information and incident responses), environmental protection laws, foreign exchange controls and cash repatriation restrictions, government business regulations applicable to Grainger as a government contractor selling to federal, state and local government entities, health and safety laws, import and export requirements, intellectual property laws, labor laws, product compliance laws, supplier regulations regarding the sources of supplies or products, tax laws (including as to U.S. taxes on foreign subsidiaries), unclaimed property laws and laws, regulations and standards applicable to other commercial matters. Moreover, Grainger is also subject to audits and inquiries in the normal course of business.
Failure to comply with any of these laws, regulations and standards could result in civil, criminal, monetary and non-monetary penalties as well as potential damage to the Company’s reputation. Changes in these laws, regulations and standards, or in their interpretation, could increase the cost of doing business, including, among other factors, as a result of increased investments in technology and the development of new operational processes. Furthermore, while Grainger has implemented policies and procedures designed to facilitate compliance with these laws, regulations and standards, there can be no assurance that employees, contractors or agents will not violate such laws, regulations and standards or Grainger’s policies. Any such failure to comply or violation could individually or in the aggregate materially adversely affect Grainger’s financial condition, results of operations and cash flows.
Grainger also is, and from time to time may become, party to a number of legal proceedings incidental to Grainger’s business involving alleged damages or injuries arising out of the use of Grainger’s products and services or violations of these laws, regulations or standards. The defense of these proceedings may require significant expenses and divert management’s time and attention, and Grainger may be required to pay damages that could individually or in the aggregate materially adversely affect its financial condition, results of operations and cash flows. In addition, any insurance or indemnification rights that Grainger may have with respect to such matters may be insufficient or unavailable to protect the Company against potential loss exposures.
Tax changes could affect Grainger’s effective tax rate and future profitability.
Grainger’s future results could be adversely affected by changes in the effective tax rate as a result of changes in Grainger’s overall profitability and changes in the mix of earnings in countries with differing statutory tax rates, changes in tax legislation, the results of the examination of previously filed tax returns and continuing assessment of the Company’s tax exposures.
10
None.
As of December 31, 2017
, Grainger’s owned and leased facilities totaled approximately
28.2
million square feet. The U.S. and Canada businesses accounted for the majority of the total square footage. Grainger believes that its properties are generally in excellent condition, well maintained and suitable for the conduct of business.
A brief description of significant facilities follows:
|
Location
|
Facility and Use (6)
|
Size in Square Feet (in 000s)
|
|||
|
U.S. (1)
|
284 U.S. branch locations
|
6,367
|
|
||
|
U.S. (2)
|
16 distribution centers
|
8,169
|
|
||
|
U.S. (3)
|
Other facilities
|
3,685
|
|
||
|
Canada (4)
|
139 facilities
|
3,147
|
|
||
|
Other businesses (5)
|
Other facilities
|
5,624
|
|
||
|
Chicago area (2)
|
Headquarters and general offices
|
1,188
|
|
||
|
Total Square Feet
|
28,180
|
|
|||
|
(1)
|
Consists of 204 owned and 80 leased properties located throughout the U.S. ranging in size from approximately 500 to 109,000 square feet.
|
|
(2)
|
These facilities are primarily owned and range in size from approximately 45,000 square feet to 1.3 million square feet.
|
|
(3)
|
These facilities include both owned and leased locations, primarily consisting of storage facilities, office space, call centers and other properties.
|
|
(4)
|
Consists of general offices, distribution centers and branches located throughout Canada, of which 58 are owned and 81 leased.
|
|
(5)
|
These facilities include owned and leased locations in Europe, Asia, Latin America and other U.S. operations.
|
|
(6)
|
Owned facilities are not subject to any mortgages.
|
Grainger continues to evaluate its physical footprint and announced throughout 2017 the intention to close 113 branches in the Canada business.
For a description of legal proceedings, see the disclosure contained in Note 17 to the Consolidated Financial Statements included in "Part II, Item 8: Financial Statements and Supplementary Data" of this report, which is incorporated herein by reference.
Not applicable.
11
Following is information about the Executive Officers of Grainger including age as of February 26,
2018
. Executive Officers of Grainger generally serve until the next annual election of officers, or until earlier resignation or removal.
|
Name and Age
|
Positions and Offices Held and Principal Occupation and Employment During the Past Five Years
|
|
Laura D. Brown (54)
|
Senior Vice President, Communications and Investor Relations, a position assumed in 2010 after serving as Vice President, Global Business Communications, a position assumed in 2009 and Vice President, Investor Relations, a position assumed in 2008.
|
|
Joseph C. High (63)
|
Senior Vice President and Chief People Officer, a position assumed in June 2011. Prior to joining Grainger, Mr. High was the Senior Vice President of Human Resources at Owens Corning in Toledo, Ohio, a position assumed in 2004.
|
|
John L. Howard (60)
|
Senior Vice President and General Counsel, a position assumed in 2000.
|
|
Ronald L. Jadin (57)
|
Senior Vice President and Chief Financial Officer, a position assumed in 2008. Previously, Mr. Jadin served as Vice President and Controller, a position assumed in 2006 after serving as Vice President, Finance. On July 19, 2017, Mr. Jadin announced that he planned to retire from the Company at the end of 2017. Mr. Jadin has agreed to continue serving the Company in his current position as Senior Vice President and Chief Financial Officer until the transition to his successor is completed later in 2018.
|
|
D.G. Macpherson (50)
|
Chairman of the Board, a position assumed in October 2017, and Chief Executive Officer, a position assumed in October 2016 at which time he was also appointed to the Board of Directors. Previously, Mr. Macpherson served as Chief Operating Officer, a position assumed in 2015; Senior Vice President and Group President, Global Supply Chain and International, a position assumed in 2013; Senior Vice President and President, Global Supply Chain and Corporate Strategy, a position assumed in 2012, and Senior Vice President, Global Supply Chain, a position assumed in 2008.
|
|
Paige K. Robbins (49)
|
Senior Vice President, Grainger Chief Digital Officer, a position assumed in September 2017. Previously, Ms. Robbins served as Senior Vice President, Global Supply Chain, Branch Network, Contact Centers and Corporate Strategy, a position assumed in 2016. Since joining Grainger in September 2010, Ms. Robbins has held various positions as a Vice President, including in the areas of Global Supply Chain and Logistics.
|
|
Eric R. Tapia (41)
|
Vice President and Controller, a position assumed in 2016. Previously, Mr. Tapia served as Vice President, Internal Audit from 2010 to 2016. Mr. Tapia is a Certified Public Accountant (CPA) and before joining Grainger in 2010 was an audit partner with KPMG.
|
12
Market Information and Dividends
Grainger's common stock is listed and traded on the New York Stock Exchange, under the symbol GWW. The high and low sales prices for the common stock and the dividends declared and paid per share for each calendar quarter during
2017
and
2016
are shown below.
|
Market Price Per Share
|
||||||||||||
|
Quarters
|
High
|
Low
|
Dividends
|
|||||||||
|
2017
|
First
|
$
|
262.72
|
|
|
$
|
229.05
|
|
$
|
1.22
|
|
|
|
|
Second
|
234.66
|
|
|
168.58
|
|
1.28
|
|
||||
|
|
Third
|
185.82
|
|
|
155.00
|
|
1.28
|
|
||||
|
|
Fourth
|
240.49
|
|
|
166.46
|
|
1.28
|
|
||||
|
|
Year
|
$
|
262.72
|
|
|
$
|
155.00
|
|
$
|
5.06
|
|
|
|
2016
|
First
|
$
|
234.77
|
|
|
$
|
176.85
|
|
$
|
1.17
|
|
|
|
|
Second
|
239.95
|
|
|
212.64
|
|
1.22
|
|
||||
|
|
Third
|
235.53
|
|
|
212.54
|
|
1.22
|
|
||||
|
|
Fourth
|
240.74
|
|
|
201.94
|
|
1.22
|
|
||||
|
|
Year
|
$
|
240.74
|
|
|
$
|
176.85
|
|
$
|
4.83
|
|
|
Grainger expects that its practice of paying quarterly dividends on its common stock will continue, although the payment of future dividends is at the discretion of Grainger’s Board of Directors and will depend upon Grainger’s earnings, capital requirements, financial condition and other factors.
Holders
The approximate number of shareholders of record of Grainger’s common stock as of February 7, 2018, was
688
with approximately
150,934
additional shareholders holding stock through nominees.
Issuer Purchases of Equity Securities - Fourth Quarter
|
Period
|
Total Number of Shares Purchased (A)
|
Average Price Paid Per Share (B)
|
Total Number of Shares Purchased as Part of Publicly Announced Plans or Programs (C)
|
Maximum Number of
Shares That May Yet be Purchased Under the Plans or Programs |
||
|
Oct. 1 – Oct. 31
|
206,586
|
$185.37
|
206,586
|
3,506,481
|
|
shares
|
|
Nov. 1 – Nov. 30
|
237,397
|
$199.91
|
237,397
|
3,269,084
|
|
shares
|
|
Dec. 1 – Dec. 31
|
410,679
|
$227.94
|
410,679
|
2,858,405
|
|
shares
|
|
Total
|
854,662
|
$209.86
|
854,662
|
|
|
|
|
(A)
|
85 shares were withheld to satisfy tax withholding obligations in connection with the vesting of employee restricted stock awards.
|
|
(B)
|
Average price paid per share includes any commissions paid and includes only those amounts related to purchases as part of publicly announced plans or programs.
|
|
(C)
|
Purchases were made pursuant to a share repurchase program approved by Grainger's Board of Directors. This plan was announced on April 16, 2015, for 15 million shares with no expiration date. Activity is reported on a trade date basis.
|
13
Company Performance
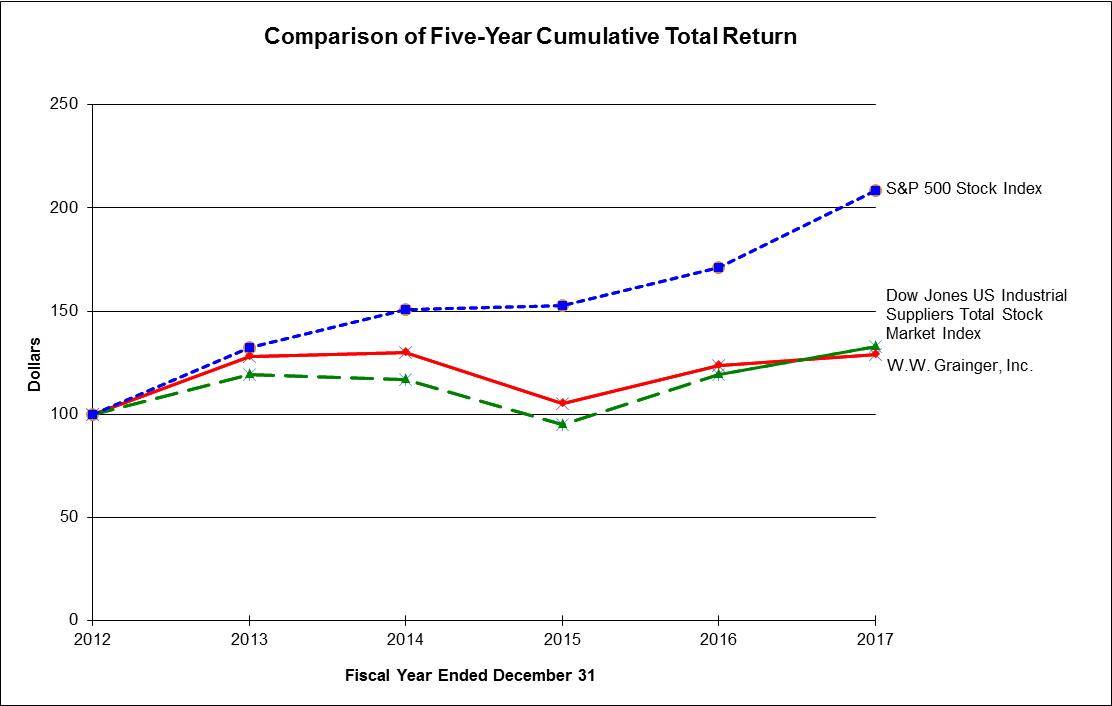
The following stock price performance graph compares the cumulative total return on an investment in Grainger common stock with the cumulative total return of an investment in each of the Dow Jones US Industrial Suppliers Total Stock Market Index and the S&P 500 Stock Index. It covers the period commencing
December 31, 2012
, and ending
December 31, 2017
. The graph assumes that the value for the investment in Grainger common stock and in each index was $100 on
December 31, 2012
, and that all dividends were reinvested.
|
December 31,
|
||||||||||||||||||
|
2012
|
2013
|
2014
|
2015
|
2016
|
2017
|
|||||||||||||
|
W.W. Grainger, Inc.
|
$
|
100
|
|
$
|
128
|
|
$
|
130
|
|
$
|
105
|
|
$
|
124
|
|
$
|
129
|
|
|
Dow Jones US Industrial Suppliers Total Stock Market Index
|
100
|
|
119
|
|
117
|
|
95
|
|
119
|
|
133
|
|
||||||
|
S&P 500 Stock Index
|
100
|
|
132
|
|
151
|
|
153
|
|
171
|
|
208
|
|
||||||
14
|
2017
|
2016
|
2015
|
2014
|
2013
|
|||||||||||||||
|
(In thousands of dollars, except for per share amounts)
|
|||||||||||||||||||
|
Net sales
|
$
|
10,424,858
|
|
|
$
|
10,137,204
|
|
$
|
9,973,384
|
|
$
|
9,964,953
|
|
$
|
9,437,758
|
|
|||
|
Net earnings attributable to W.W. Grainger, Inc. (herein referred to as Net earnings)
|
585,730
|
|
|
605,928
|
|
768,996
|
|
801,729
|
|
797,036
|
|
||||||||
|
Net earnings per basic share
|
10.07
|
|
|
9.94
|
|
11.69
|
|
11.59
|
|
11.31
|
|
||||||||
|
Net earnings per diluted share
|
10.02
|
|
|
9.87
|
|
11.58
|
|
11.45
|
|
11.13
|
|
||||||||
|
Total assets
|
5,804,254
|
|
|
5,694,307
|
|
5,857,755
|
|
5,283,049
|
|
5,266,328
|
|
||||||||
|
Long-term debt (less current maturities) and other long-term liabilities
|
2,469,860
|
|
2,159,602
|
|
1,716,507
|
|
737,232
|
|
743,702
|
|
|||||||||
|
Total shareholders' equity
|
$
|
1,827,733
|
|
$
|
1,905,768
|
|
$
|
2,352,714
|
|
$
|
3,284,101
|
|
$
|
3,326,836
|
|
||||
|
Cash dividends paid per share
|
$
|
5.06
|
|
|
$
|
4.83
|
|
$
|
4.59
|
|
$
|
4.17
|
|
$
|
3.59
|
|
|||
The items discussed below are considered to materially affect the comparability of the information reflected in the selected financial data. For further information see
“Part II, Item 7: Management's Discussion and Analysis of Financial Condition and Results of Operations” of this report, which is incorporated herein by reference.
Net earnings for 2017 included a net expense of $84 million primarily consisting of a net charge of $102 million related to restructuring and other charges primarily consisting of branch closures in the U.S. and Canada businesses, net of gains on sale of branch real estate in the U.S., the consolidation of the contact center network in the U.S. and the wind-down of operations in Colombia, which is part of other businesses. This was partially offset by the net benefit of $15 million related to U.S. tax legislation and other discrete tax items and a net benefit of $3 million related to General Services Administrative (GSA) and unclaimed property reserves.
Net earnings for 2016 included a net expense of $105 million primarily consisting of the following:
|
•
|
Restructuring: A net charge of $26 million related to restructuring actions. These actions primarily included branch closures, net of gains on sale of branch real estate in the U.S. and Canada businesses.
|
|
•
|
Goodwill and intangible impairments: An impairment charge of $52 million related to goodwill and intangible impairments in other businesses.
|
|
•
|
Unclaimed property contingency: A charge of $23 million related to an adjustment for unclaimed property in the U.S. business primarily related to activity from 2008 through 2012.
|
|
•
|
GSA contingency: A charge of $6 million to increase the U.S. business reserve for certain tax, freight and miscellaneous billing issues in connection with the audit of government contracts with the GSA first entered in 1999.
|
|
•
|
Inventory adjustment: A charge of $7 million related to an inventory adjustment in the Canada business to reflect an updated reserve methodology and better visibility to inventory performance provided by the conversion to the U.S. ERP system.
|
|
•
|
Discrete tax items: A net benefit of $9 million related to the conclusion of the federal income tax audit for the years 2009 through 2012 in the U.S. business and other discrete tax items.
|
Net earnings for 2015 included a net charge of $30 million primarily composed of a $25 million net charge related to the reorganization in the U.S. and Canada businesses and a $5 million charge for restructuring in other businesses.
Net earnings for 2014 included a net charge of $56 million primarily composed of a $28 million charge related to closing of the business in Brazil, a $10 million charge due to the retirement plan transition in Europe, a $10 million charge related to restructuring of the business in Europe and a $8 million charge related to a goodwill impairment charge in other businesses.
Net earnings for 2013 included a net charge of $28 million primarily composed of $21 million in impairment charges in other businesses primarily for goodwill and a $7 million charge related to restructuring the businesses in Europe and China.
Grainger completed several acquisitions in the years 2013 through 2015, all of which were immaterial individually and in the aggregate. Operating results have included the results of each business acquired since the respective acquisition dates.
15
General
W.W. Grainger, Inc. (Grainger) is a broad line, business-to-business distributor of maintenance, repair and operating (MRO) supplies and other related products and services with operations primarily in the U.S. and Canada, with a presence in Europe, Asia and Latin America. More than
3
million customers worldwide rely on Grainger for products such as safety, gloves, ladders, motors and janitorial supplies, along with services like inventory management and technical support. These customers represent a broad collection of industries including commercial, government, healthcare and manufacturing. They place orders online, on mobile devices, through sales representatives, over the phone and at local branches. Approximately 5,200 suppliers provide Grainger with approximately 1.7 million products stocked in Grainger's distribution centers (DCs) and branches worldwide.
Grainger’s two reportable segments are the U.S. and Canada. The U.S. operating segment reflects the results of Grainger’s U.S. businesses. The Canada operating segment reflects the results for Acklands – Grainger Inc. and its subsidiaries. Other businesses include the single channel online businesses (Zoro in the U.S. and MonotaRO in Japan) and operations in Europe, Asia and Latin America.
Business Environment
Given Grainger's large number of customers and the diverse industries it serves, several economic factors and industry trends tend to shape Grainger’s business environment. The overall economy and leading economic indicators provide general insight into projecting Grainger's growth. Grainger’s sales in the U.S. and Canada tend to positively correlate with Business Investment, Business Inventory, Exports and Industrial Production. In the U.S., sales tend to positively correlate with Gross Domestic Product (GDP). In Canada, sales tend to positively correlate with oil prices. The table below provides these estimated indicators for
2017
and
2018
:
|
U.S.
|
Canada
|
||||||||||
|
Estimated 2017
|
Forecasted 2018
|
Estimated 2017
|
Forecasted 2018
|
||||||||
|
Business Investment
|
5.1
|
%
|
7.9
|
%
|
2.3
|
%
|
3.5
|
%
|
|||
|
Business Inventory
|
0.8
|
%
|
2.1
|
%
|
—
|
|
—
|
|
|||
|
Exports
|
3.4
|
%
|
5.3
|
%
|
1.1
|
%
|
1.8
|
%
|
|||
|
Industrial Production
|
1.9
|
%
|
3.3
|
%
|
5.2
|
%
|
0.1
|
%
|
|||
|
GDP
|
2.2
|
%
|
2.7
|
%
|
3.0
|
%
|
2.4
|
%
|
|||
|
Oil Prices
|
—
|
|
—
|
|
$51/barrel
|
|
$54/barrel
|
|
|||
|
Source: Global Insight (January 2018)
|
|||||||||||
In the U.S., Business Investment and Exports are two major indicators of MRO spending. Per the Global Insight January
2018
forecast, Business Investment is likely to remain on a strong growth path during 2018, supported by expanding global markets, lower capital costs and an improving regulatory climate. Additionally on December 22, 2017, the Tax Cuts and Jobs Act was signed into law, which significantly lowered U.S. corporate income tax rates and introduced accelerated expensing of qualified capital investments, among other changes. These changes to U.S. tax laws may increase capital spending in the U.S. and attract incremental foreign capital to the U.S., which is expected to support export growth.
Per the Global Insight January
2018
forecast, Canada's GDP and industrial production are forecast slow in 2018, while exports and business nonresidental investment (a component of Business Investment) are expected to improve.
Outlook
Grainger’s portfolio consists of its U.S. business, its Canada business and other businesses. Grainger’s imperative to create unique value is focused on: (i) continuing to grow its share of business with large and mid-size customers in the U.S. by executing its high-value sales and service model, building an advantaged digital capability and completing its pricing strategy; (ii) executing a complete business model reset in Canada; (iii) driving profitable growth in its international portfolio and (iv) continuing the strong growth of its single channel businesses by expanding its assortment and innovation around customer acquisition. Grainger is also focused on improving the end-to-end customer experience by making investments in its eCommerce and digital capabilities and executing continuous improvement initiatives within its supply chain, such that customers have a positive experience with Grainger from order to delivery. Grainger intends to continue to reduce its cost base while ensuring that it delivers an effortless customer experience.
16
On
January 24, 2018
, Grainger updated its
2018
earnings per share guidance to reflect the 2017 actual results, lower corporate tax rate, lower tax benefit from clean energy, incremental investment in digital and higher share repurchases. The prior earnings per share guidance issued on November 10, 2017 for 2018 was $10.60 to $11.80. The Company still expects 3 to 7 percent sales growth and now expects earnings per share of $12.95 to $14.15 for
2018
.
Matters Affecting Comparability
There were 254 sales days in the full year
2017
and 255 sales days in the full years
2016
and
2015
. Grainger completed one divestiture in 2017 and one acquisition in 2015, which were immaterial individually and in the aggregate. Grainger’s operating results have included the results of each business acquired since the respective acquisition dates.
Results of Operations
The following table is included as an aid to understanding changes in Grainger's Consolidated Statements of Earnings (in millions of dollars):
|
For the Years Ended December 31,
|
|||||||||||||||||
|
Percent Increase/(Decrease) from Prior Year
|
As a Percent of Net Sales
|
||||||||||||||||
|
2017 (A)
|
2016 (A)
|
2017
|
2017
|
2016
|
|||||||||||||
|
Net sales
|
$
|
10,425
|
|
$
|
10,137
|
|
3
|
%
|
100.0
|
%
|
100.0
|
%
|
|||||
|
Cost of merchandise sold
|
6,327
|
|
6,023
|
|
5
|
%
|
60.7
|
|
59.4
|
|
|||||||
|
Gross profit
|
4,098
|
|
4,115
|
|
—
|
%
|
39.3
|
|
40.6
|
|
|||||||
|
Warehousing, marketing and administrative expenses
|
3,049
|
|
2,995
|
|
2
|
%
|
29.3
|
|
29.6
|
|
|||||||
|
Operating earnings
|
1,049
|
|
1,119
|
|
(6
|
)%
|
10.1
|
|
11.0
|
|
|||||||
|
Other expense, net
|
113
|
|
100
|
|
13
|
%
|
1.1
|
|
1.0
|
|
|||||||
|
Income taxes
|
313
|
|
386
|
|
(19
|
)%
|
3.0
|
|
3.8
|
|
|||||||
|
Net earnings
|
622
|
|
633
|
|
(2
|
)%
|
6.0
|
|
|
6.2
|
|
||||||
|
Noncontrolling interest
|
37
|
|
27
|
|
36
|
%
|
0.4
|
|
0.3
|
|
|||||||
|
Net earnings attributable to W.W. Grainger, Inc.
|
$
|
586
|
|
$
|
606
|
|
(3
|
)%
|
5.6
|
%
|
6.0
|
%
|
|||||
(A) May not sum due to rounding
2017
Compared to
2016
Grainger's net sales were $
10,425 million
for
2017
, an increase of 3%, when compared with net sales of
$10,137 million
for the comparable
2016
period. On a daily basis, the 3% increase for the year consisted of the following:
|
Percent Increase/ (Decrease)
|
|
|
Volume
|
8
|
|
Divestiture
|
(1)
|
|
Price
|
(4)
|
|
Total
|
3%
|
The increase in net sales was primarily driven by the single channel online businesses in the U.S. and Japan, as well as volume increases in the U.S. business as a result of the pricing actions. The U.S. business pricing actions were primarily implemented in the first and third quarters of 2017 and included adjusting list price and introducing new lower web prices on the entire business assortment, which drove faster growth in 2017 through share gains with existing customers and acquisition of new customers. Refer to the
Segment Analysis
below for further details.
In
2017
, eCommerce sales for Grainger were $5,283 million, an increase of 11% over the prior year. Total eCommerce sales represented 51% and 47% of total sales for
2017
and
2016
, respectively. The increase was primarily driven by Grainger.com and other electronic purchasing platforms in the U.S. and across all single channel online businesses.
17
If the Company included KeepStock®, total eCommerce and KeepStock® sales would represent 56% and 53% of total sales for
2017
and
2016
, respectively. Refer to the
Segment Analysis
below for further details.
Gross profit of $
4,098 million
for
2017
was down $17 million compared with $
4,115 million
for
2016
. The gross profit margin for
2017
was
39.3%
, down
1.3
percentage points versus
2016
, driven primarily by the pricing actions in the U.S. business.
Operating expenses of $
3,049 million
for
2017
increased 2% from $
2,995 million
for
2016
. Excluding restructuring costs, gains on the sale of assets and other charges in both periods as noted below, operating expenses increased 3%, driven primarily by higher employee related costs.
Operating earnings of $
1,049 million
for
2017
decreased 6% from $
1,119 million
for
2016
. Excluding restructuring costs, gains on the sale of assets and other charges in both periods as noted below, operating earnings decreased 8% or $107 million, driven primarily by lower gross profit and higher operating expenses.
Other expense, net was $113 million in
2017
compared to $100 million of expense in
2016
. The increase in expense was primarily due to incremental interest expense on $400 million in long-term debt issued in May 2016 and $400 million in long-term debt issued in May 2017, as well as higher operating losses from the Company's clean energy investments.
Income taxes of $
313 million
in
2017
decreased 19% compared with $
386 million
in
2016
. Grainger's effective tax rates were
33.5%
and
37.9%
in
2017
and
2016
, respectively. The lower rate versus the prior year is due to discrete tax items and U.S. tax legislation.
On December 22, 2017, the Tax Cuts and Jobs Act (the Tax Act) was signed into law, which significantly revised the U.S. corporate income tax system by lowering corporate income tax rates from 35% to 21% effective January 1, 2018, allowing accelerated expensing of qualified capital investments for a specific period, limiting net interest expense deductions and transitioning U.S. international taxation from a worldwide to a territorial tax system, among other changes. Grainger recognized a net provisional tax benefit of $3.2 million for the year ended December 31, 2017, related to the estimated impact of the Tax Act. See Note 14 to the Consolidated Financial Statements for additional information.
Grainger projects a tax rate of 23% to 26% for 2018, which includes the impact of the Tax Act.
The table below reconciles reported net earnings determined in accordance with U.S. generally accepted accounting principles (GAAP) to adjusted net earnings, a non-GAAP measure. Management believes adjusted net earnings is an important indicator of operations because it excludes items that may not be indicative of core operating results. Because non-GAAP financial measures are not standardized, it may not be possible to compare this financial measure with other companies' non-GAAP financial measures having the same or similar names. (In thousands of dollars):
18
|
Twelve Months Ended
|
|||||||||
|
December 31,
|
|||||||||
|
2017
|
2016
|
%
|
|||||||
|
Net earnings reported
|
$
|
585,730
|
|
$
|
605,928
|
|
(3
|
)%
|
|
|
Restructuring (U.S.)
|
30,352
|
|
21,234
|
|
|||||
|
Branch gains (U.S.)
|
(20,620
|
)
|
(11,421
|
)
|
|||||
|
Other (gains) charges (U.S.)
|
(2,830
|
)
|
28,531
|
|
|||||
|
Restructuring (Canada)
|
30,390
|
|
11,085
|
|
|||||
|
Inventory reserve adjustment (Canada)
|
—
|
|
7,278
|
|
|||||
|
Restructuring (Other businesses)
|
55,324
|
|
—
|
|
|||||
|
Other charges (Other businesses)
|
—
|
|
52,318
|
|
|||||
|
Restructuring (Unallocated expense)
|
6,647
|
|
5,603
|
|
|||||
|
U.S. tax legislation
|
(3,250
|
)
|
—
|
|
|||||
|
Discrete tax items
|
(12,123
|
)
|
(9,378
|
)
|
|||||
|
Subtotal
|
83,890
|
|
105,250
|
|
|||||
|
Net earnings adjusted
|
$
|
669,620
|
|
$
|
711,178
|
|
(6
|
)%
|
|
Net earnings attributable to W.W. Grainger, Inc. for
2017
decreased by 3% to $
586 million
from $
606 million
in
2016
. The decrease in net earnings primarily resulted from lower operating earnings, partially offset by lower income taxes. Excluding the net charges from both years mentioned above and discrete tax items, net earnings decreased 6%.
Diluted earnings per share of
$10.02
in
2017
were 2% higher than
$9.87
for
2016
, due to lower average shares outstanding partially offset by lower earnings. Excluding the charges mentioned above, diluted earnings per share would have been $11.46 compared to $11.58 in
2016
, a decrease of 1%.
2016
Compared to
2015
The following table is included as an aid to understanding changes in Grainger's Consolidated Statements of Earnings (in millions of dollars):
|
For the Years Ended December 31,
|
|||||||||||||||||
|
Percent Increase/(Decrease) from Prior Year
|
As a Percent of Net Sales
|
||||||||||||||||
|
2016 (A)
|
2015 (A)
|
2016
|
2016
|
2015
|
|||||||||||||
|
Net sales
|
$
|
10,137
|
|
$
|
9,973
|
|
2
|
%
|
100.0
|
%
|
100.0
|
%
|
|||||
|
Cost of merchandise sold
|
6,023
|
|
5,742
|
|
5
|
%
|
59.4
|
|
57.6
|
|
|||||||
|
Gross profit
|
4,115
|
|
4,231
|
|
(3
|
)%
|
40.6
|
|
42.4
|
|
|||||||
|
Warehousing, marketing and administrative expenses
|
2,995
|
|
2,931
|
|
2
|
%
|
29.6
|
|
29.4
|
|
|||||||
|
Operating earnings
|
1,119
|
|
1,300
|
|
(14
|
)%
|
11.0
|
|
13.0
|
|
|||||||
|
Other expense, net
|
100
|
|
50
|
|
102
|
%
|
1.0
|
|
0.5
|
|
|||||||
|
Income taxes
|
386
|
|
466
|
|
(17
|
)%
|
3.8
|
|
4.7
|
|
|||||||
|
Net earnings
|
633
|
|
785
|
|
(19
|
)%
|
6.2
|
|
7.9
|
|
|||||||
|
Noncontrolling interest
|
27
|
|
16
|
|
66
|
%
|
0.3
|
|
0.2
|
|
|||||||
|
Net earnings attributable to W.W. Grainger, Inc.
|
$
|
606
|
|
$
|
769
|
|
(21
|
)%
|
6.0
|
%
|
7.7
|
%
|
|||||
(A) May not sum due to rounding
19
Grainger's net sales were $10,137 million for 2016, an increase of 2% when compared with net sales of $9,973 million for the comparable 2015 period. The 2% increase for the year consisted of the following:
|
Percent Increase/ (Decrease)
|
|
|
Cromwell acquisition
|
3
|
|
Volume
|
1
|
|
Price
|
(2)
|
|
Total
|
2%
|
In the U.S. business, sales growth to government, retail and light manufacturing customers were offset by a decline in sales to natural resource customers, resellers, contractors and heavy manufacturing customers. The increase in sales in 2016 was also due to the acquisition of Cromwell on September 1, 2015.
In 2016, eCommerce sales for Grainger were $4,757 million, an increase of 15% over the prior year and represented 47% of total sales. The increase was primarily driven by an increase in sales via EDI and electronic purchasing platforms in the U.S. and Japan businesses. If the Company included KeepStock®, total eCommerce and KeepStock® sales would represent 53% of total sales. Refer to the
Segment Analysis
below for further details.
Gross profit of $4,115 million for 2016 decreased 3%. The gross profit margin for 2016 was 40.6%, down 1.8 percentage points versus 2015, primarily due to price deflation exceeding cost deflation and unfavorable customer mix.
Operating expenses of $2,995 million for 2016 increased 2% from $2,931 million for 2015. Excluding the charges from both years mentioned above, operating expenses decreased 1% primarily due to lower employee benefit costs.
Operating earnings of $1,119 million for 2016 decreased 14% from $1,300 million for 2015. The decrease in operating earnings was driven by lower gross profit margin and higher restructuring costs and other charges. Operating earnings included the charges noted above. Excluding these charges from both years, operating earnings decreased 6%.
Other expense, net was $100 million in 2016 compared to $50 million of expense in 2015. The following table summarizes the components of other income and expense (in thousands of dollars):
|
For the Years Ended December 31,
|
|||||||
|
2016
|
2015
|
||||||
|
Interest income (expense) - net
|
$
|
(65,615
|
)
|
$
|
(32,405
|
)
|
|
|
Loss from equity method investment
|
(31,193
|
)
|
(11,740
|
)
|
|||
|
Other non-operating income
|
1,300
|
|
1,102
|
|
|||
|
Other non-operating expense
|
(4,931
|
)
|
(6,572
|
)
|
|||
|
Total
|
$
|
(100,439
|
)
|
$
|
(49,615
|
)
|
|
The increase in expense was driven by higher interest expense from the $1 billion in long-term debt issued in June 2015 and $400 million in long-term debt issued in May 2016, as well as higher operating losses from the Company's clean energy investments.
Income taxes of $386 million in 2016 decreased 17% compared with $466 million in 2015. Grainger's effective tax rates were 37.9% and 37.2% in 2016 and 2015, respectively. The year-over-year increase in the tax rate was primarily due to a larger proportion of earnings from higher tax rate jurisdictions, partially offset by a higher benefit from the Company’s clean energy investments. The twelve months ended December 31, 2016, included a benefit from the conclusion of the federal income tax audit for the years 2009 through 2012 and other discrete items. Excluding the discrete tax benefits and nondeductible intangible write-downs, the Company’s effective tax rate was 37.1%. The Company's clean energy investment generated $0.15 per share of earnings for the year ended December 31, 2016.
The table below reconciles reported net earnings determined in accordance with U.S. generally accepted accounting principles (GAAP) to adjusted net earnings, a non-GAAP measure. Management believes adjusted net earnings is an important indicator of operations because it excludes items that may not be indicative of core operating results. Because
20
non-GAAP financial measures are not standardized, it may not be possible to compare this financial measure with other companies' non-GAAP financial measures having the same or similar names. (In thousands of dollars):
|
Twelve Months Ended
|
|||||||||
|
December 31,
|
|||||||||
|
2016
|
2015
|
%
|
|||||||
|
Net earnings reported
|
$
|
605,928
|
|
$
|
768,996
|
|
(21
|
)%
|
|
|
Restructuring (U.S.)
|
21,234
|
|
22,231
|
|
|||||
|
Branch gains (U.S.)
|
(11,421
|
)
|
—
|
|
|||||
|
Other charges (U.S.)
|
28,531
|
|
—
|
|
|||||
|
Restructuring (Canada)
|
11,085
|
|
3,090
|
|
|||||
|
Inventory reserve adjustment (Canada)
|
7,278
|
|
—
|
|
|||||
|
Restructuring (Other businesses)
|
—
|
|
4,814
|
|
|||||
|
Other charges (Other businesses)
|
52,318
|
|
—
|
|
|||||
|
Restructuring (Unallocated expense)
|
5,603
|
|
(24
|
)
|
|||||
|
Discrete tax items
|
(9,378
|
)
|
(5,984
|
)
|
|||||
|
Subtotal
|
105,250
|
|
24,127
|
|
|||||
|
Net earnings adjusted
|
$
|
711,178
|
|
$
|
793,123
|
|
(10
|
)%
|
|
Net earnings attributable to W.W. Grainger, Inc. for 2016 decreased by 21% to $606 million from $769 million in 2015. The decrease in net earnings primarily resulted from lower operating earnings, partially offset by lower income taxes. Excluding the charges from both years mentioned above and discrete tax items, net earnings decreased 10%.
Diluted earnings per share of $9.87 in 2016 were 15% lower than $11.58 for 2015, due to lower earnings, partially offset by lower average shares outstanding as a result of share repurchases. Excluding the charges mentioned above, diluted earnings per share would have been $11.58, compared to $11.94 in 2015, a decrease of 3%.
Segment Analysis - 2017 Compared to 2016
The following comments at the reportable segment and other business unit level include external and intersegment net sales and operating earnings. See Note 16 to the Consolidated Financial Statements.
United States
Net sales were $
7,960 million
for
2017
, an increase of $
90 million
, or 1% when compared with net sales of $
7,870 million
for
2016
. On a daily basis, the 2% increase consisted of the following:
|
Percent Increase/(Decrease)
|
|
|
Volume
|
7
|
|
Intercompany sales to Zoro
|
1
|
|
Divestiture
|
(1)
|
|
Price
|
(5)
|
|
Total
|
2%
|
Sales to customers in natural resources, resellers and retail end markets increased mid-single digits, while heavy manufacturing and government increased low single digits. The sales growth was partially offset by declines in contractors and commercial services. Volume increased year over year, primarily driven by the pricing actions.
In
2017
, eCommerce sales for the U.S. business were $3,909 million, an increase of 7% over the prior year. Total eCommerce sales represented 49% and 46% of total sales for
2017
and
2016
, respectively. The increase was primarily driven by Grainger.com and other electronic purchasing platforms. If the U.S. business included KeepStock®, total eCommerce and KeepStock® sales would represent 55% and 53% of total sales for
2017
and
2016
, respectively.
21
Gross profit margin decreased
1.7
percentage points in
2017
compared to
2016
, primarily driven by price deflation exceeding higher volume in response to pricing actions.
Operating expenses of $1,994 were down
2%
for
2017
versus
2016
. Excluding restructuring costs, net gains on the sale of assets and other charges in both periods mentioned above, operating expenses increased 1% or $19 million, driven by higher employee related costs. See Note 6 to the Consolidated Financial Statements.
Operating earnings of $
1,213 million
for
2017
decreased
5%
versus $
1,275 million
in
2016
. Excluding restructuring costs, gains on the sale of assets and other charges in both periods mentioned above, operating earnings decreased 9% or $116 million, driven primarily by price deflation. See Note 6 to the Consolidated Financial Statements.
Canada
Net sales were $
753 million
for
2017
, an increase of $
19 million
, or
3%
, when compared with $
734 million
for
2016
. On a daily basis, the
3%
increase consisted of volume across all end segments.
In
2017
, eCommerce sales for the Canada business were $135 million, an increase of 38% over the prior year. Total eCommerce sales represented 18% and 13% of total sales for
2017
and
2016
, respectively. If the Canada business included KeepStock®, total eCommerce and KeepStock® sales would represent 32% and 26% of total sales for
2017
and
2016
, respectively.
Gross profit margin increased
1.0
percentage point in
2017
versus
2016
, primarily due to a favorable comparison to an inventory adjustment in the second quarter of 2016 that did not repeat in 2017, partially offset by price deflation, cost inflation and higher freight costs from an increase in shipping directly to customers in 2017.
Operating expenses decreased
9%
in
2017
versus
2016
. Excluding restructuring costs in both periods, operating expenses would have increased 3%, primarily related to higher professional service fees related to the business transformation.
Operating losses of $77 million for
2017
increased versus operating losses of $65 million in
2016
. Excluding the restructuring costs and the inventory adjustment, operating losses would have been $37 million compared to $41 million in the prior year.
Other businesses
Net sales for other businesses were $2,120 million for
2017
, an increase of $235 million, or 12%, when compared to $1,885 million for
2016
. The net sales increase was primarily due to incremental sales at Zoro and MonotaRO. On a daily basis, the 13% increase consisted of the following:
|
Percent Increase/(Decrease)
|
|
|
Volume
|
15
|
|
Foreign exchange
|
(2)
|
|
Total
|
13%
|
Operating earnings for other businesses were $
56 million
for
2017
compared to $
41 million
for
2016
. Excluding restructuring charges in 2017 and the goodwill and intangible impairment charges of $52 million in the Fabory and Colombia businesses in the prior year, operating earnings increased $18 million or 19%, due to strong performance from the single channel online businesses.
Segment Analysis - 2016 Compared to 2015
United States
Net sales were $7,870 million for 2016, a decrease of $93 million, or 1% when compared with net sales of $7,963 million for 2015. The 1% decrease consisted of the following:
22
|
Percent Increase/(Decrease)
|
|
|
Intercompany sales to Zoro
|
1
|
|
Volume
|
(1)
|
|
Price
|
(1)
|
|
Total
|
(1)%
|
Mid-single-digit sales growth to government and retail customers and low single-digit growth to light manufacturing were offset by mid-teen declines in sales to natural resource and reseller customers and mid-single-digit declines to heavy manufacturing customers and contractors.
In 2016, eCommerce sales for the U.S. business were $3,660 million, an increase of 12% over the prior year and represented 46% of total sales. The increase was primarily driven by an increase in sales via EDI and electronic purchasing platforms. If the U.S. business included KeepStock®, the electronic inventory management offering, total eCommerce and KeepStock® sales would represent 53% of total sales.
Gross profit margin decreased 1.3 percentage points in 2016 compared to 2015, driven by price deflation exceeding cost deflation and stronger sales growth to lower margin customers.
Operating expenses were down 2% for 2016 versus 2015. The decrease in operating expenses was driven by lower employees benefit costs, partially offset by higher restructuring costs and other charges discussed above. Excluding the restructuring and other charges in both periods, operating expenses would have been down 4%.
Operating earnings of $1,275 million for 2016 decreased 7% versus $1,372 million in 2015. The decline in operating earnings for 2016 was primarily driven by lower sales and gross profit margin, partially offset by lower operating expenses. Excluding the restructuring costs and other charges in both periods, operating earnings decreased 5%.
Canada
Net sales were $734 million for 2016, a decrease of $157 million, or 18%, when compared with $891 million for 2015. In local currency, sales decreased 15% for 2015. The 18% decrease consisted of the following:
|
Percent Decrease
|
|
|
Volume
|
(10)
|
|
Foreign exchange
|
(3)
|
|
Price
|
(2)
|
|
ERP implementation
|
(2)
|
|
Wildfire impact
|
(1)
|
|
Total
|
(18)%
|
Sales performance in the Canada business was primarily driven by declines within the oil and gas sector in Alberta, combined with declines in all other end markets across the country. The Alberta region, which represents about one-third of the sales in the Canada business, decreased 23% versus prior year, as it was negatively impacted by oil prices. Sales growth for the remaining regions in aggregate was down 10% in local currency. In addition, the Canada business implemented the U.S. ERP system in February 2016, which negatively impacted sales as employees transitioned to operating with the new system.
In 2016, eCommerce sales for the Canada business were $98 million, a decrease of 8% over the prior year and represented 13% of total sales. The decrease was primarily driven by lower sales volume. If the Canada business included KeepStock®, total eCommerce and KeepStock® sales would represent 26% of total sales.
Gross profit margin decreased 7.8 percentage points in 2016 versus 2015, due to an inventory adjustment of $10 million in the second quarter of 2016, along with price deflation versus cost inflation and higher freight costs from an increase in shipping directly to customers. As a result of service issues due to the ERP system implementation, the business did not increase prices to customers during 2016.
23
Operating expenses decreased 8% in 2016 versus 2015. The decrease was due to the benefit of a $7 million gain from the sale of the former Toronto DC in the first quarter of 2016 and lower ERP system project costs, partially offset by higher restructuring costs. Excluding the restructuring costs from both periods, operating expenses decreased 11%.
Operating losses were $65 million for 2016 versus operating earnings of $27 million in 2015, a decrease of $92 million. Excluding the restructuring costs mentioned above, the operating losses would have been $41 million due to lower sales and gross profit margin and operating expenses declining at a slower rate than sales when compared to the prior period.
Other businesses
Net sales for other businesses were $1,885 million for 2016, an increase of $479 million, or 34%, when compared to $1,406 million for 2015. The net sales increase was primarily due to the September 1, 2015 Cromwell acquisition and incremental sales at Zoro and MonotaRO. The 34% increase consisted of the following:
|
Percent Increase
|
|
|
Cromwell acquisition
|
18
|
|
Volume
|
15
|
|
Foreign exchange
|
1
|
|
Total
|
34%
|
Operating earnings for other businesses were $41 million for 2016 compared to $48 million for 2015. Excluding goodwill and intangible impairment charges of $52 million in the Fabory and Colombia businesses and other restructuring charges in the prior year, operating earnings for other business increased by $39 million driven by strong performance from MonotaRO, Zoro and the earnings contribution from Cromwell.
Financial Condition
Grainger expects its strong working capital position, cash flows from operations and borrowing capacity to continue, allowing it to fund its operations, growth initiatives and capital expenditures as well as pay cash dividends, repurchase shares and repay its long-term debt obligations while maintaining an adequate credit rating.
Cash and Cash Equivalents
At
December 31, 2017, 2016 and 2015
, Grainger had cash and cash equivalents of $327 million, $274 million and $290 million, respectively. Approximately 64%, 72% and 76% were outside the U.S. business as of December 31, 2017, 2016 and 2015, respectively. Grainger has no material limits or restrictions on its ability to use or access these foreign liquid assets.
Cash Flow
2017
Compared to
2016
Net cash provided by operating activities was $
1,057 million
and $
1,024 million
for the twelve months ended December 31,
2017
and
2016
, respectively. The increase in cash provided by operating activities is primarily the result of lower payments related to employee benefits, partially offset by lower earnings and higher working capital.
Net cash used in investing activities was $
146 million
and $
262 million
for the twelve months ended December 31,
2017
and
2016
, respectively. The decrease in net cash used in investing activities was driven by lower additions to property, buildings and equipment compared to the prior year and higher proceeds primarily from the sales of branch real estate assets in the U.S. and a U.S. business divestiture when compared to the prior year.
Net cash used in financing activities was $
867 million
and $
776 million
in the twelve months ended December 31,
2017
and
2016
, respectively. The increase in net cash used in financing activities was primarily driven by lower proceeds of long-term debt and higher net payments of commercial paper, offset by lower stock repurchases in 2017 compared to 2016 and lower payments of long-term debt.
2016
Compared to
2015
Net cash provided by operating activities was $1,024 million and $1,036 million for the twelve months ended December 31, 2016 and 2015, respectively. Net cash provided had been reported as $1,003 million and $990 million in 2016 and 2015, respectively. The $1,024 million and $1,036 million reflects the adoption of ASU 2016-09,
Stock Based Compensation: Improvement to Employee Shared-Based Payment Accounting
, which required retrospective
24
reclassification of $21 million and $46 million from operating activities to financing activities for 2016 and 2015, respectively. The reclassification relates to employee taxes paid as part of the exercise of stock options.
Net cash used in investing activities was $262 million and $843 million for the twelve months ended December 31, 2016 and 2015, respectively. The higher use of cash in 2015 was driven by the Cromwell acquisition in September 2015. In 2016, lower additions to property, buildings and equipment compared to the prior year and higher proceeds from the sale of branch real estate assets contributed to the reduction in cash used in investing activities.
Net cash used in financing activities was $776 million and $109 million in the twelve months ended December 31, 2016 and 2015, respectively. The change in financing activities was primarily driven by the issuance of $400 million in Senior Notes in 2016 compared to the issuance of $1 billion in Senior Notes in 2015 and significantly lower stock repurchases in 2016 compared to 2015.
Working Capital
Internally generated funds are the primary source of working capital and funds used for growth initiatives and capital expenditures. Grainger's working capital is not impacted by significant seasonality trends throughout the year.
Working capital consists of current assets (less non-operating cash) and current liabilities (less short-term debt and current maturities of long-term debt). Working capital was
$1,669 million
at
December 31, 2017
, compared with
$1,722 million
at
December 31, 2016
, primarily due to an increase in accounts receivable offset by increases in current liabilities. At these dates, the ratio of current assets to current liabilities was
2.2
and
2.4
, respectively.
Capital Expenditures
In each of the past three years, a portion of the Company's net cash flows has been used for additions to property, buildings, equipment and capitalized software (presented in Intangibles - net on the Consolidated Balance Sheet) as summarized in the following table (in thousands of dollars):
|
For the Years Ended December 31,
|
|||||||||||
|
2017
|
2016
|
2015
|
|||||||||
|
Land, buildings, structures and improvements
|
$
|
108,753
|
|
$
|
70,942
|
|
$
|
86,082
|
|
||
|
Furniture, fixtures, machinery and equipment
|
65,996
|
|
139,474
|
|
202,137
|
|
|||||
|
Subtotal
|
174,749
|
|
210,416
|
|
288,219
|
|
|||||
|
Capitalized software
|
62,534
|
|
73,833
|
|
85,649
|
|
|||||
|
Total
|
$
|
237,283
|
|
$
|
284,249
|
|
$
|
373,868
|
|
||
In 2017, the Company continued to invest in its worldwide distribution network (e.g. new or expanding existing facilities and technology), digital platforms (e.g. eCommerce websites and inventory management solutions), capital maintenance of its existing branch networks across the enterprise and other supporting information technology assets.
In 2016, the Company continued to invest in the North America distribution network, as well as the distribution network in other businesses and sales productivity initiatives. Other significant investments in 2016 included the eCommerce platform, sustaining capital investments in branches and distribution centers and other technology infrastructure.
In 2015, the Company invested in the North America distribution center network and the completion of the common ERP platform for North America and made investments in support of sales initiatives. Other significant investments included the eCommerce platform, sustaining capital investments for Grainger's branches and distribution centers and other technology infrastructure.
In 2018, capital expenditures are expected to range from $290 million to $330 million. Projected spending includes continued investments in the supply chain, eCommerce/digital and inventory management solutions. Grainger expects to fund
2018
capital spending primarily from operating cash flows.
Debt
Grainger maintains a debt ratio and liquidity position that provides flexibility in funding working capital needs and long-term cash requirements. In addition to internally generated funds, Grainger has various sources of financing available, including bank borrowings under lines of credit. Total debt, which is defined as total interest-bearing debt (short-term current and long-term) as a percent of total capitalization was
56.2%
and
54.1%
, as of
December 31, 2017
and
2016
, respectively.
25
Over the last three years, Grainger issued $1.8 billion in long-term debt to partially fund the repurchase of $2.8 billion in shares of the total $3 billion previously announced. The remaining amount was funded from internally generated cash. Debt was issued as follows:
|
•
|
In June 2015, $1.0 billion payable in 30 years and carries a 4.60% interest rate, payable semiannually.
|
|
•
|
In May 2016, $400 million payable in 30 years and carries a 3.75% interest rate, payable semiannually.
|
|
•
|
In May 2017, $400 million payable in 30 years and carries a 4.20% interest rate, payable semiannually.
|
Refer to Note 7 and Note 8 to the Consolidated Financial Statements included in Item 8.
The Company ended 2017 with a Debt/EBITDA ratio of 1.8x EBITDA, which is defined as Earnings before Interest, Taxes, Depreciation and Amortization, is a non-GAAP measure and may not be defined and calculated by other companies in the same manner.
Commitments and Other Contractual Obligations
At December 31, 2017,
Grainger's contractual obligations, including estimated payments due by period, are as follows (in thousands of dollars):
|
Payments Due by Period
|
|||||||||||||||||||
|
|
Total Amounts Committed
|
Less than 1 Year
|
1 - 3 Years
|
4 - 5 Years
|
More than 5 Years
|
||||||||||||||
|
Debt obligations
|
$
|
2,365,795
|
|
$
|
94,312
|
|
$
|
334,930
|
|
$
|
136,553
|
|
$
|
1,800,000
|
|
||||
|
Interest on debt
|
2,197,909
|
|
83,002
|
|
161,853
|
|
156,604
|
|
1,796,450
|
|
|||||||||
|
Operating lease obligations
|
196,544
|
|
63,625
|
|
82,594
|
|
34,446
|
|
15,879
|
|
|||||||||
|
Purchase obligations:
|
|||||||||||||||||||
|
Uncompleted additions to
property, buildings and equipment
|
68,806
|
|
68,287
|
|
346
|
|
173
|
|
—
|
|
|||||||||
|
Commitments to purchase
inventory
|
541,834
|
|
541,834
|
|
—
|
|
—
|
|
—
|
|
|||||||||
|
Other goods and services
|
141,883
|
|
98,843
|
|
36,481
|
|
6,474
|
|
85
|
|
|||||||||
|
Other liabilities
|
130,256
|
|
91,879
|
|
9,703
|
|
6,569
|
|
22,105
|
|
|||||||||
|
Total
|
$
|
5,643,027
|
|
$
|
1,041,782
|
|
$
|
625,907
|
|
$
|
340,819
|
|
$
|
3,634,519
|
|
||||
See Notes 7, 8 and 10 to the Consolidated Financial Statements for further detail related to debt, interest on debt and operating lease obligations.
Purchase obligations are made in the normal course of business to meet operating needs. While purchase orders for both inventory purchases and non-inventory purchases are generally cancelable without penalty, certain vendor agreements provide for cancellation fees or penalties depending on the terms of the contract.
Other liabilities represent future payments for profit sharing and other employee benefit plans.
The Company’s obligation for the postretirement healthcare benefits plan, as determined by actuarial projections, is $208 million at December 31, 2017. The Company has established a Group Benefit Trust (Trust) to fund the plan obligations. The Trust assets available for benefits payments are $189 million at December 31, 2017. The Company has no minimum funding requirements and the timing and amounts of the Company’s additional contributions into the Trust have not been determined. Other employment-related benefits obligations of $65 million have also not been included in this table as the timing of benefit payments is not predictable. See Note 9 to the Consolidated Financial Statements for further detail.
Grainger has recorded a noncurrent liability of approximately $45 million for tax uncertainties and interest at
December 31, 2017
. This amount is excluded from the table above, as Grainger cannot predict the timing of these cash payments by period. See Note 14 to the Consolidated Financial Statements.
26
Off-Balance Sheet Arrangements
Grainger does not have any material exposures to off-balance sheet arrangements. All significant contractual obligations are recorded on the Company's Consolidated Balance Sheet or disclosed in the notes to Grainger's Consolidated Financial Statements.
Critical Accounting Estimates
Note 1 to the Consolidated Financial Statements describes the significant accounting policies used in the preparation of the Consolidated Financial Statements. As discussed in Note 1, the preparation of financial statements, in conformity with Generally Accepted Accounting Principles (GAAP) in the United States of America, requires management to make judgments, estimates and assumptions about future events that affect the amounts reported in the financial statements and accompanying notes.
Accounting policies and estimates are considered critical when they require management to make subjective and complex judgments, estimates and assumptions about matters that have a material impact on Grainger's financial statements and accompanying notes.
The Company believes that the following discussion addresses Grainger’s most critical accounting policies and estimates.
Allowance for Doubtful Accounts
Grainger considers several factors to estimate the allowance for uncollectible accounts receivable including the age of the receivables, the percent past due and the historical ratio of actual write-offs to the age of the receivables. The analyses performed also take into consideration economic conditions that may have an impact on a specific industry, group of customers or a specific customer.
Based on analysis of actual historical write-offs of uncollectible accounts receivable, Grainger's estimates and assumptions have been materially accurate in regards to the valuation of its allowance for doubtful accounts. However, write-offs could be materially different than the reserves established if business or economic conditions change or actual results deviate from historical trends, and Grainger's estimates and assumptions may be revised as appropriate to reflect these changes. For fiscal years
2017, 2016 and 2015
, actual results did not vary materially from estimated amounts.
Inventory Reserves
Grainger establishes inventory reserves for excess and obsolete inventory. Grainger regularly reviews inventory to evaluate continued demand and identify any obsolete or excess quantities. Grainger records provisions for the difference between excess and obsolete inventory cost and its estimated realizable value. Estimated realizable value is based on anticipated future product demand, market conditions and liquidation values. As Grainger's inventory consists of approximately 1.7 million stocked products, it is not practical to quantify the actual disposition of excess and obsolete inventory against estimated amounts at a stock keeping unit (SKU) level and no individual SKU is material. There were no material differences noted between reserve levels compared to the level of write-offs historically.
Grainger's methodology for estimating reserves is continually evaluated based on current experience and the methodology provides for a materially accurate level of reserves at any reporting date. Actual results could differ materially from projections and require changes to reserves that could have a material effect on Grainger's results of operations, based on significant changes in product demand, market conditions or liquidation value. If business or economic conditions change, Grainger's estimates and assumptions may be revised as appropriate. For fiscal years
2017, 2016 and 2015
, actual results did not vary materially from estimated amounts.
Goodwill and Indefinite Lived Intangible Assets
Business acquisitions result in the recording of goodwill and identified intangible assets that affect the amount of amortization expense and possible impairment write-downs that may occur in future periods. Grainger tests reporting units’ goodwill and intangible assets for impairment annually during the fourth quarter and more frequently if impairment indicators exist. Grainger periodically performs qualitative assessments of significant events and circumstances such as reporting units' historical and current results, assumptions regarding future performance, strategic initiatives and overall economic factors to determine the existence of impairment indicators and assess if it is more likely than not that the fair value of the reporting unit or indefinite-lived intangible assets is less than its carrying value and if a quantitative impairment test is necessary. In the quantitative test, Grainger compares the carrying value of the reporting unit or an indefinite-lived intangible asset with its fair value. Any excess of the carrying value over fair value is recorded as an impairment charge.
27
The fair value of reporting units is calculated primarily using the discounted cash flow (DCF) method and utilizing value indicators from a market approach to evaluate the reasonableness of the resulting fair values. The DCF method incorporates various assumptions including the amount and timing of future expected cash flows, including revenues, gross margins, operating expenses, capital expenditures and working capital based on operational budgets, long-range strategic plans and other estimates. The terminal value growth rate is used to calculate the value of cash flows beyond the last projected period and reflects management’s best estimates for perpetual growth for the reporting units. Estimates of market-participant risk-adjusted weighted average cost of capital are used as a basis for determining the discount rates to apply to the reporting units’ future expected cash flows and terminal value.
Grainger’s indefinite-lived intangibles are primarily trade names. The fair value of trade names is calculated primarily using the relief from royalty method, which estimates the expected royalty savings attributable to the ownership of the trade name asset. The key assumptions when valuing a trade name are the revenue base, the royalty rate and the discount rate.
The Company performed its annual tests of goodwill and indefinite-lived intangible assets for impairment, including qualitative assessments of all of its reporting units’ goodwill and intangible assets with indefinite lives. Quantitative tests of the Company’s reporting unit in Canada and the Cromwell reporting unit in other businesses were also performed due to lower-than-expected operating performance and lowered short-term forecasts. Based on the results of the quantitative tests performed, the fair values of these reporting units exceeded their carrying values by approximately 31 percent for the Canada reporting unit and 15 percent for the Cromwell reporting unit.
The Company performed sensitivity analyses on the reporting units’ fair values utilizing alternate assumptions that reflect reasonably possible changes to future assumptions. Holding all other assumptions constant, the impact of a 100 basis point increase in discount rates or a 100 basis point decrease in terminal growth rates would have not resulted in the reporting units failing the quantitative tests.
While the Company’s impairment test and respective sensitivity analyses supported no impairment of goodwill and intangibles, the risk of potential failure of quantitative tests in future reporting periods is highly dependent upon key assumptions included in the determination of reporting unit or intangible fair values. Changes in assumptions regarding future performance and the ability to execute on growth initiatives and productivity improvements may have a significant impact on future cash flows. Likewise, changes in terminal value and discount rate assumptions, unfavorable economic environment or market conditions and other factors may result in future impairments of goodwill and intangible assets. The Company will continue to monitor results and projected cash flows to assess whether goodwill or intangible impairments may be necessary.
Postretirement Healthcare Benefits
The postretirement healthcare obligation and net periodic cost are dependent on assumptions and estimates used in calculating such amounts. The assumptions used include, among others, discount rates, assumed rates of return on plan assets and healthcare cost trend rates and certain employee-related factors, such as turnover, retirement age and mortality rates. Changes in these and other assumptions (caused by conditions in equity markets or plan experience, for example) could have a material effect on Grainger's postretirement benefit obligation and expense and could affect its results of operations and financial condition. These changes in assumptions may also affect voluntary decisions to make additional contributions to the trust established for funding the postretirement benefit obligation.
During the third quarter of 2017, the Company implemented plan design changes effective January 1, 2018, for the post-65 age group. This plan change will move all post-65 Medicare eligible retirees to healthcare exchanges and provide them a subsidy to purchase insurance. The amount of the subsidy will be based on years of service. The plan obligation was remeasured as a result of this plan design change. The Company has elected to amortize the amount of net unrecognized gains over a period equal to the average remaining service period for active plan participants expected to retire and receive benefits. Grainger estimates that this plan change could increase 2018 pretax earnings by approximately $5.3 million. However, other changes in assumptions may increase, decrease or eliminate this effect.
The discount rate assumptions used by management reflect the rates available on high-quality fixed income debt instruments as of December 31, the measurement date, of each year.
A higher discount rate reduces the present value of benefit obligations and net periodic benefit costs.
As of
December 31, 2017
, Grainger decreased the discount rate used in the calculation of the postretirement plan obligation from 4.00% to 3.44% to reflect the decrease in market interest rates.
Grainger estimates that this decrease could decrease
2018
pretax earnings by approximately $2.0 million.
However, other changes in assumptions may increase, decrease or eliminate this effect.
28
A 1 percentage point change in assumed healthcare cost trend rates would have had the following effects on
December 31, 2017
results (in thousands of dollars):
|
1 Percentage Point
|
|||||||
|
Increase
|
(Decrease)
|
||||||
|
Effect on total of service and interest cost
|
$
|
1,269
|
|
$
|
(1,053
|
)
|
|
|
Effect on postretirement benefit obligation
|
5,516
|
|
(5,095
|
)
|
|||
Grainger used Mortality Table RPH-2014 and changed the mortality improvement scale used to project mortality rates into the future from Mortality Improvement Scale MP-2016 to Mortality Improvement Scale MP-2017 at December 31, 2017. Mortality Table RPH-2014 is a headcount-weighted table that is more appropriate for the measurement of other postretirement employee benefit plans. Scale MP-2017, published by the Society of Actuaries, reflects the most recent data for mortality improvement. Grainger estimates this change could increase 2018 pretax earnings by approximately $0.2 million.
Grainger updated the 2017 census for involuntary terminations that occurred in 2017. Grainger estimates this change could increase 2018 pretax earnings by approximately $0.9 million.
When assumptions are selected, expected results can vary from actual results. Grainger's expected results varied from actual results for both expected return on plan assets and benefit payments. Grainger estimates this impact could increase 2018 pretax earnings by approximately $2.9 million.
Grainger may terminate or modify the postretirement plan at any time, subject to the provisions of the Employee Retirement Income Security Act of 1974 (ERISA) and the Internal Revenue Code, as amended. In the event the postretirement plan is terminated, all assets of the Group Benefit Trust inure to the benefit of the participants. The foregoing assumptions are based on the presumption that the postretirement plan will continue. Were the postretirement plan to terminate, different actuarial assumptions and other factors might be applicable.
Grainger has used its best judgment in making assumptions and estimates and believes such assumptions and estimates used are appropriate. Changes to the assumptions may be required in future years as a result of actual experience or new trends or plan changes and, therefore, may affect Grainger's retirement plan obligations and future expense. For additional information concerning postretirement healthcare benefits, see Note 9 to the Consolidated Financial Statements.
Income Taxes
The tax balances and income tax expense recognized by Grainger are based on management's interpretations of the tax laws of multiple jurisdictions. Income tax expense reflects Grainger's best estimates and assumptions regarding, among other items, the level of future taxable income, interpretation of tax laws and tax planning opportunities, plans for reinvestment of cash overseas and uncertain tax positions. On December 22, 2017, the Tax Cuts and Jobs Act was signed into law, which significantly revised the U.S. corporate income tax system including lowering the corporate income tax rates from 35% to 21% effective January 1, 2018. See Note 14 to the Consolidated Financial Statements for additional information.
Future rulings by tax authorities and future changes in tax laws and their interpretation, changes in projected levels of taxable income, changes in planned need for cash overseas and future tax planning strategies could impact the actual effective tax rate and tax balances recorded by Grainger.
Contingent Liabilities
At any time, Grainger may be subject to investigations, legal proceedings or claims related to the ongoing operation of its business, including claims both by and against Grainger. Such proceedings typically involve claims related to product liability, general negligence, contract disputes, environmental issues, unclaimed property, wage and hour laws, intellectual property, employment practices, regulatory compliance or other matters and actions brought by employees, customers, competitors, suppliers or governmental entities. As a government contractor selling to federal, state and local governmental entities, the Company is also subject to governmental or regulatory inquiries or audits or other proceedings, including those related to contract administration or to pricing compliance. Grainger retains a significant portion of the risk of certain losses related to workers' compensation, auto liability, general liability and property losses through the utilization of high deductibles and self-insured retentions. Grainger routinely assesses the likelihood of
29
any adverse outcomes related to these matters on a case by case basis, as well as the potential ranges of losses and fees. Grainger establishes accruals for its potential exposures, as appropriate, for claims against Grainger when losses become probable and the financial impact of an adverse outcome is reasonably estimable. Legal fees are recognized as incurred and are not included in accruals for contingencies. Where Grainger is able to reasonably estimate a range of potential losses, Grainger records the amount within that range that constitutes Grainger's best estimate. Grainger also discloses the nature of and range of loss for claims against Grainger when losses are reasonably possible and the exposure is considered material to Grainger's Consolidated Financial Statements. These accruals and disclosures are determined based on the facts and circumstances related to the individual cases and require estimates and judgments regarding the interpretation of facts and laws, as well as the effectiveness of strategies or other factors beyond Grainger's control. If the assessment of any of these factors changes, the estimates may change. Predicting the outcome of claims and litigation, and estimating related costs and exposure, involves substantial uncertainties that could cause actual costs to vary materially from estimates and accruals.
Other
Other significant accounting policies, not involving the same level of measurement uncertainties as those discussed above, are nevertheless important to an understanding of the financial statements. Policies such as revenue recognition, depreciation, intangibles, long-lived assets, fair value measurements and valuations and warranties require judgments on complex matters that are often subject to multiple external sources of authoritative guidance such as the Financial Accounting Standards Board and the Securities and Exchange Commission. Possible changes in estimates or assumptions associated with these policies are not expected to have a material effect on the financial condition or results of operations of Grainger. More information on these additional accounting policies can be found in
Note 1
to the Consolidated Financial Statements.
Effects of Inflation and Changing Prices
Grainger is affected by inflation through increased product and operating costs, and the ability to pass on cost increases to customers over time is dependent upon market conditions. The ability to achieve sales growth through increased prices is also subject to inflation and normal competitive conditions. The predominant use of the last-in, first-out (LIFO) method of accounting for inventories and accelerated depreciation methods for financial reporting and income tax purposes result in a substantial recognition of the effects of inflation in the financial statements.
Some of Grainger's products contain significant amounts of commodity-priced materials, such as steel, copper, petroleum derivatives or rare earth minerals, and are subject to price changes based upon fluctuations in the commodities market.
Grainger believes the most positive means to combat inflation and advance the interests of investors lie in the continued application of basic business principles, which include improving productivity, maintaining working capital turnover and offering products and services that can command appropriate prices in the marketplace.
Forward-Looking Statements
From time to time, in this Annual Report on Form 10-K, as well as in other written reports, communications and verbal statements, Grainger makes forward-looking statements that are not historical in nature but concern forecasts of future results, business plans, analyses, prospects, strategies, objectives and other matters that may be deemed to be “forward-looking statements” under the federal securities laws. Such forward-looking statements are identified by words such as “anticipate,” “estimate,” “believe,” “expect,” “could,” “forecast,” “may,” “intend,” “plan,” “predict,” “project” and similar terms and expressions.
Grainger cannot guarantee that any forward-looking statement will be realized, although Grainger does believe that its assumptions underlying its forward-looking statements are reasonable. Achievement of future results is subject to risks and uncertainties, many of which are beyond the Company's control, which could cause Grainger's results to differ materially from those that are presented.
Important factors that could cause actual results to differ materially from those presented or implied in a forward-looking statement include, without limitation: higher product costs or other expenses; a major loss of customers; loss or disruption of source of supply; increased competitive pricing pressures; failure to develop or implement new technologies or business strategies; the implementation, timing and results of the Company's strategic pricing initiatives and other responses to market pressures; the outcome of pending and future litigation or governmental or regulatory proceedings, including with respect to wage and hour, anti-bribery and corruption, environmental,
30
advertising, privacy and cybersecurity matters; investigations, inquiries, audits and changes in laws and regulations; disruption of information technology or data security systems; general industry or market conditions; general global economic conditions; currency exchange rate fluctuations; market volatility; commodity price volatility; labor shortages; facilities disruptions or shutdowns; higher fuel costs or disruptions in transportation services; natural and other catastrophes; unanticipated weather conditions; loss of key members of management; the Company's ability to operate, integrate and leverage acquired businesses; changes in credit ratings; changes in effective tax rates and other factors identified under Item 1A: Risk Factors and elsewhere in this Form 10-K.
Caution should be taken not to place undue reliance on Grainger's forward-looking statements and Grainger undertakes no obligation to publicly update any of its forward-looking statements, whether as a result of new information, future events or otherwise.
Grainger may use financial instruments to reduce its exposure to adverse fluctuations in foreign currency exchange rates and interest rates as part of its overall risk management strategy. The derivative positions reduce risk by hedging certain underlying economic exposures. Because of the high correlation between the hedging instrument and the underlying exposure, fluctuations in the value of the instruments are generally offset by reciprocal changes in the value of the underlying exposure. Grainger does not enter into derivative financial instruments for trading or speculative purposes.
Foreign Currency Exchange Rates
Grainger’s financial results, including the value of assets and liabilities, are exposed to foreign currency exchange rate risk when the financial statements of the business units, as stated in their local currencies, are translated into U.S. dollars. While it is difficult to quantify any particular impact of changes in exchange rates, a uniform 10% strengthening in the U.S. dollar (whereby all other variables are held constant and unusual expense items described in "Item 7: Management's Discussion and Analysis of Financial Condition and Results of Operations" are excluded) would have resulted in an increase in net earnings of $1 million for the year ended
December 31, 2017
, and an increase in net earnings of $2 million for the year ended
December 31, 2016
. Comparatively, a 10% weakening of the U.S. dollar would have resulted in a decrease in net earnings of $2 million for the year ended
December 31, 2017
, and a decrease in net earnings of $2 million for the year ended
December 31, 2016
. This sensitivity analysis of the effects of changes in foreign currency exchange rates does not factor in future potential changes in sales levels or local currency prices or costs.
Commodity Price Risk
Grainger has limited primary exposure to commodity price risk on certain products for resale, but does not purchase commodities directly.
The financial statements and supplementary data are included on pages 37 to 77. See the Index to Financial Statements and Supplementary Data on page 36.
None.
31
Disclosure Controls and Procedures
Grainger carried out an evaluation, under the supervision and with the participation of its management, including the Chief Executive Officer and the Chief Financial Officer, of the effectiveness of the design and operation of Grainger's disclosure controls and procedures pursuant to Exchange Act Rule 13a-15. Based upon that evaluation, the Chief Executive Officer and the Chief Financial Officer concluded that Grainger's disclosure controls and procedures were effective as of the end of the period covered by this report.
Internal Control Over Financial Reporting
|
(A)
|
Management's Annual Report on Internal Control Over Financial Reporting
|
Management's report on Grainger's internal control over financial reporting is included on page 37 of this Report under the heading Management's Annual Report on Internal Control Over Financial Reporting.
|
(B)
|
Attestation Report of the Registered Public Accounting Firm
|
The report from Ernst & Young LLP on its audit of the effectiveness of Grainger's internal control over financial reporting as of
December 31, 2017
, is included on page 38 of this Report under the heading Report of Independent Registered Public Accounting Firm.
|
(C)
|
Changes in Internal Control Over Financial Reporting
|
There have been no changes in Grainger's internal control over financial reporting during the last fiscal quarter that have materially affected, or are reasonably likely to materially affect, Grainger's internal control over financial reporting.
None.
32
The information required by this item is incorporated by reference to Grainger's proxy statement relating to the annual meeting of shareholders to be held
April 25, 2018
, under the captions “Directors,” “Board of Directors and Board Committees” and “Section 16(a) Beneficial Ownership Reporting Compliance.” Information required by this item regarding executive officers of Grainger is set forth below under the caption “Executive Officers.”
Grainger has adopted a code of ethics that applies to its principal executive officer, principal financial officer and principal accounting officer and controller. This code of ethics is part of Grainger’s Business Conduct Guidelines for directors, officers and employees, which is available free of charge through Grainger’s website at
www.grainger.com/investor
. A copy of the Business Conduct Guidelines is also available in print without charge to any person upon request to Grainger's Corporate Secretary. Grainger intends to disclose on its website any amendment to any provision of the Business Conduct Guidelines that relates to any element of the definition of “code of ethics” enumerated in Item 406(b) of Regulation S-K under the Exchange Act and any waiver from any such provision granted to Grainger’s principal executive officer, principal financial officer, principal accounting officer and controller or persons performing similar functions. Grainger has also adopted Operating Principles for the Board of Directors, which are available on its website and are available in print to any person who requests them.
The information required by this item is incorporated by reference to Grainger's proxy statement relating to the annual meeting of shareholders to be held
April 25, 2018
, under the captions “Board of Directors and Board Committees,” “Director Compensation,” “Report of the Compensation Committee of the Board” and “Compensation Discussion and Analysis.”
The information required by this item is incorporated by reference to Grainger's proxy statement relating to the annual meeting of shareholders to be held
April 25, 2018
, under the captions “Ownership of Grainger Stock” and “Equity Compensation Plans.”
The information required by this item is incorporated by reference to Grainger's proxy statement relating to the annual meeting of shareholders to be held
April 25, 2018
, under the captions "Election of Directors" and "Transactions with Related Persons."
The information required by this item is incorporated by reference to Grainger's proxy statement relating to the annual meeting of shareholders to be held
April 25, 2018
, under the caption “Audit Fees and Audit Committee Pre-Approval Policies and Procedures.”
33
(a) Documents filed as part of the Form 10-K
|
(1)
|
Financial Statements: see "Item 8: Financial Statements and Supplementary Data," on page 36 hereof, for a list of financial statements. Management's Annual Report on Internal Control Over Financial Reporting.
|
|
(2)
|
Financial Statement Schedules: the schedules listed in Rule 5-04 of Regulation S-X have been omitted because they are either not applicable or the required information is shown in the consolidated financial statements or notes thereto.
|
|
(3)
|
Exhibits Required by Item 601 of Regulation S-K: the information required by this Item 15(a)(3) of Form 10-K is set forth on the Exhibit Index that follows the Signatures page 77 of the Form 10-K.
|
34
INDEX TO FINANCIAL STATEMENTS AND SUPPLEMENTARY DATA
December 31, 2017, 2016 and 2015
|
Page(s)
|
|
|
MANAGEMENT'S ANNUAL REPORT ON INTERNAL CONTROL OVER FINANCIAL REPORTING
|
|
|
REPORTS OF INDEPENDENT REGISTERED PUBLIC ACCOUNTING FIRM
|
|
|
FINANCIAL STATEMENTS
|
|
|
CONSOLIDATED STATEMENTS OF EARNINGS
|
|
|
CONSOLIDATED STATEMENTS OF COMPREHENSIVE EARNINGS
|
|
|
CONSOLIDATED BALANCE SHEETS
|
|
|
CONSOLIDATED STATEMENTS OF CASH FLOWS
|
|
|
CONSOLIDATED STATEMENTS OF SHAREHOLDERS' EQUITY
|
|
|
NOTES TO CONSOLIDATED FINANCIAL STATEMENTS
|
|
35
MANAGEMENT'S ANNUAL REPORT ON INTERNAL CONTROL OVER FINANCIAL REPORTING
The management of W.W. Grainger, Inc. (Grainger) is responsible for establishing and maintaining adequate internal control over financial reporting. Grainger's internal control system was designed to provide reasonable assurance to Grainger's management and Board of Directors regarding the reliability of financial reporting and the preparation of financial statements for external purposes in accordance with accounting principles generally accepted in the United States of America.
Because of its inherent limitations, internal control over financial reporting may not prevent or detect misstatements under all potential conditions. Therefore, effective internal control over financial reporting provides only reasonable, and not absolute, assurance with respect to the preparation and presentation of financial statements.
Grainger's management assessed the effectiveness of Grainger's internal control over financial reporting as of
December 31, 2017
, based on criteria established in Internal Control - Integrated Framework issued by the Committee of Sponsoring Organizations of the Treadway Commission (2013 framework) (the COSO criteria). Based on its assessment under that framework and the criteria established therein, Grainger's management concluded that Grainger's internal control over financial reporting was effective as of
December 31, 2017
.
Ernst & Young LLP, an independent registered public accounting firm, has audited Grainger's internal control over financial reporting as of
December 31, 2017
, as stated in their report, which is included herein.
36
Report of Independent Registered Public Accounting Firm
To the Shareholders and the Board of Directors of
W.W. Grainger, Inc. and Subsidiaries
Opinion on the Financial Statements
We have audited the accompanying consolidated balance sheets of W.W. Grainger, Inc. and subsidiaries (the Company) as of December 31, 2017 and 2016, the related consolidated statements of earnings, comprehensive earnings, and shareholders’ equity and cash flows for each of the three years in the period ended December 31, 2017, and the related notes (collectively referred to as the “consolidated financial statements”). In our opinion, the consolidated financial statements present fairly, in all material respects, the financial position of the Company at December 31, 2017 and 2016, and the consolidated results of its operations and its cash flows for each of the three years in the period ended December 31, 2017, in conformity with U.S. generally accepted accounting principles.
We also have audited, in accordance with the standards of the Public Company Accounting Oversight Board (United States) (PCAOB), the Company’s internal control over financial reporting as of December 31, 2017, based on criteria established in Internal Control-Integrated Framework issued by the Committee of Sponsoring Organizations of the Treadway Commission (2013 framework) and our report dated February 26, 2018 expressed an unqualified opinion thereon.
Basis for Opinion
These financial statements are the responsibility of the Company’s management. Our responsibility is to express an opinion on the Company’s financial statements based on our audits. We are a public accounting firm registered with the PCAOB and are required to be independent with respect to the Company in accordance with the U.S. federal securities laws and the applicable rules and regulations of the Securities and Exchange Commission and the PCAOB.
We conducted our audits in accordance with the standards of the PCAOB. Those standards require that we plan and perform the audit to obtain reasonable assurance about whether the financial statements are free of material misstatement, whether due to error or fraud. Our audits included performing procedures to assess the risks of material misstatement of the financial statements, whether due to error or fraud, and performing procedures that respond to those risks. Such procedures included examining, on a test basis, evidence regarding the amounts and disclosures in the financial statements. Our audits also included evaluating the accounting principles used and significant estimates made by management, as well as evaluating the overall presentation of the financial statements. We believe that our audits provide a reasonable basis for our opinion.
/s/ Ernst & Young LLP
We have served as the Company’s auditor since 2005.
Chicago, Illinois
February 26, 2018
37
Report of Independent Registered Public Accounting Firm
To the Shareholders and the Board of Directors of
W.W. Grainger, Inc. and Subsidiaries
Opinion on Internal Control over Financial Reporting
We have audited W.W. Grainger, Inc. and subsidiaries’ internal control over financial reporting as of December 31, 2017, based on criteria established in Internal Control-Integrated Framework issued by the Committee of Sponsoring Organizations of the Treadway Commission (2013 Framework) (the COSO Criteria). In our opinion, W.W Grainger, Inc. and subsidiaries (the Company) maintained, in all material respects, effective internal control over financial reporting as of December 31, 2017, based on the COSO criteria.
We also have audited, in accordance with the standards of the Public Company Accounting Oversight Board (United States) (PCAOB), the consolidated balance sheets of the Company as of December 31, 2017 and 2016, and the related consolidated statements of earnings, comprehensive earnings, and shareholders’ equity and cash flows for each of the three years in the period ended December 31, 2017 and the related notes and our report dated February 26, 2018 expressed an unqualified opinion thereon.
Basis for Opinion
The Company’s management is responsible for maintaining effective internal control over financial reporting and for its assessment of effectiveness of the internal control over financial reporting included in the accompanying Management’s Annual Report on Internal Controls over Financial Reporting. Our responsibility is to express an opinion on the Company’s internal control over financial reporting based on our audit. We are a public accounting firm registered with the PCAOB and are required to be independent with respect to the Company in accordance with the U.S. federal securities laws and the applicable rules and regulations of the Securities and Exchange Commission and the PCAOB.
We conducted our audit in accordance with the standards of the PCAOB. Those standards require that we plan and perform the audit to obtain reasonable assurance about whether effective internal control over financial reporting was maintained in all material respects.
Our audit included obtaining an understanding of internal control over financial reporting, assessing the risk that a material weakness exists, testing and evaluating the design and operating effectiveness of internal control based on the assessed risk, and performing such other procedures as we considered necessary in the circumstances. We believe that our audit provides a reasonable basis for our opinion.
Definition and Limitations of Internal Control Over Financial Reporting
A company’s internal control over financial reporting is a process designed to provide reasonable assurance regarding the reliability of financial reporting and the preparation of financial statements for external purposes in accordance with generally accepted accounting principles. A company’s internal control over financial reporting includes those policies and procedures that (1) pertain to the maintenance of records that, in reasonable detail, accurately and fairly reflect the transactions and dispositions of the assets of the company; (2) provide reasonable assurance that transactions are recorded as necessary to permit preparation of financial statements in accordance with generally accepted accounting principles, and that receipts and expenditures of the company are being made only in accordance with authorizations of management and directors of the company; and (3) provide reasonable assurance regarding prevention or timely detection of unauthorized acquisition, use, or disposition of the company’s assets that could have a material effect on the financial statements.
Because of its inherent limitations, internal control over financial reporting may not prevent or detect misstatements. Also, projections of any evaluation of effectiveness to future periods are subject to the risk that controls may become inadequate because of changes in conditions, or that the degree of compliance with the policies or procedures may deteriorate.
/s/ Ernst & Young LLP
Chicago, Illinois
February 26, 2018
38
W.W. Grainger, Inc. and Subsidiaries
(In thousands of dollars, except for share and per share amounts)
|
For the Years Ended December 31,
|
|||||||||||
|
|
2017
|
2016
|
2015
|
||||||||
|
Net sales
|
$
|
10,424,858
|
|
$
|
10,137,204
|
|
$
|
9,973,384
|
|
||
|
Cost of merchandise sold
|
6,327,301
|
|
6,022,647
|
|
5,741,956
|
|
|||||
|
Gross profit
|
4,097,557
|
|
4,114,557
|
|
4,231,428
|
|
|||||
|
Warehousing, marketing and administrative expenses
|
3,048,895
|
|
2,995,060
|
|
2,931,108
|
|
|||||
|
Operating earnings
|
1,048,662
|
|
1,119,497
|
|
1,300,320
|
|
|||||
|
Other income and (expense):
|
|
|
|
|
|||||||
|
Interest income
|
2,570
|
|
717
|
|
1,166
|
|
|||||
|
Interest expense
|
(80,458
|
)
|
(66,332
|
)
|
(33,571
|
)
|
|||||
|
Loss from equity method investment
|
(37,771
|
)
|
(31,193
|
)
|
(11,740
|
)
|
|||||
|
Other, net
|
2,321
|
|
(3,631
|
)
|
(5,470
|
)
|
|||||
|
Total other expense
|
(113,338
|
)
|
(100,439
|
)
|
(49,615
|
)
|
|||||
|
Earnings before income taxes
|
935,324
|
|
1,019,058
|
|
1,250,705
|
|
|||||
|
Income taxes
|
312,881
|
|
386,220
|
|
465,531
|
|
|||||
|
Net earnings
|
622,443
|
|
632,838
|
|
785,174
|
|
|||||
|
Less: Net earnings attributable to noncontrolling interest
|
36,713
|
|
26,910
|
|
16,178
|
|
|||||
|
Net earnings attributable to W.W. Grainger, Inc.
|
$
|
585,730
|
|
$
|
605,928
|
|
$
|
768,996
|
|
||
|
Earnings per share:
|
|
|
|
|
|||||||
|
Basic
|
$
|
10.07
|
|
$
|
9.94
|
|
$
|
11.69
|
|
||
|
Diluted
|
$
|
10.02
|
|
$
|
9.87
|
|
$
|
11.58
|
|
||
|
Weighted average number of shares outstanding:
|
|
|
|
|
|
|
|||||
|
Basic
|
57,674,977
|
|
60,430,892
|
|
65,156,864
|
|
|||||
|
Diluted
|
57,983,167
|
|
60,839,930
|
|
65,765,121
|
|
|||||
The accompanying notes are an integral part of these consolidated financial statements.
39
W.W. Grainger, Inc. and Subsidiaries
CONSOLIDATED STATEMENTS OF COMPREHENSIVE EARNINGS
(In thousands of dollars)
|
For the Years Ended December 31,
|
|||||||||||
|
2017
|
2016
|
2015
|
|||||||||
|
Net earnings
|
$
|
622,443
|
|
|
$
|
632,838
|
|
|
$
|
785,174
|
|
|
Other comprehensive earnings:
|
|
|
|
|
|
|
|
|
|||
|
Foreign currency translation adjustments, net of
reclassification (see Note 6 and Note 13)
|
92,711
|
|
|
(38,729
|
)
|
|
(154,096
|
)
|
|||
|
Postretirement benefit plan remeasurement, net of tax expense $29,172 (see Note 9 and Note 13)
|
46,543
|
|
|
—
|
|
|
—
|
|
|||
|
Postretirement benefit plan reclassification, net of tax (expense) benefit of $(1,017), $6,991 and $(17,013)
|
2,043
|
|
(12,453
|
)
|
27,846
|
|
|||||
|
Other
|
—
|
|
885
|
|
1,300
|
|
|||||
|
Comprehensive earnings, net of tax
|
763,740
|
|
582,541
|
|
660,224
|
|
|||||
|
Less: Comprehensive earnings attributable to noncontrolling interest:
|
|
|
|
|
|
|
|||||
|
Net earnings
|
36,713
|
|
|
26,910
|
|
|
16,178
|
|
|||
|
Foreign currency translation adjustments
|
3,677
|
|
|
906
|
|
|
(532
|
)
|
|||
|
Comprehensive earnings attributable to W.W. Grainger, Inc.
|
$
|
723,350
|
|
$
|
554,725
|
|
$
|
644,578
|
|
||
The accompanying notes are an integral part of these consolidated financial statements.
40
W.W. Grainger, Inc. and Subsidiaries
(In thousands of dollars, except for share and per share amounts)
|
As of December 31,
|
|||||||
|
ASSETS
|
2017
|
2016
|
|||||
|
CURRENT ASSETS
|
|
|
|||||
|
Cash and cash equivalents
|
$
|
326,876
|
|
$
|
274,146
|
|
|
|
Accounts receivable - net
|
1,325,186
|
|
1,223,096
|
|
|||
|
Inventories – net
|
1,429,199
|
|
1,406,470
|
|
|||
|
Prepaid expenses and other assets
|
86,667
|
|
81,766
|
|
|||
|
Prepaid income taxes
|
38,061
|
|
34,751
|
|
|||
|
Total current assets
|
3,205,989
|
|
3,020,229
|
|
|||
|
PROPERTY, BUILDINGS AND EQUIPMENT
|
3,444,660
|
|
3,411,502
|
|
|||
|
Less: Accumulated depreciation and amortization
|
2,052,693
|
|
1,990,611
|
|
|||
|
Property, buildings and equipment – net
|
1,391,967
|
|
1,420,891
|
|
|||
|
DEFERRED INCOME TAXES
|
22,362
|
|
64,775
|
|
|||
|
GOODWILL
|
543,903
|
|
527,150
|
|
|||
|
INTANGIBLES – NET
|
569,115
|
|
586,126
|
|
|||
|
OTHER ASSETS
|
70,918
|
|
75,136
|
|
|||
|
TOTAL ASSETS
|
$
|
5,804,254
|
|
$
|
5,694,307
|
|
|
|
LIABILITIES AND SHAREHOLDERS' EQUITY
|
|||||||
|
CURRENT LIABILITIES
|
|||||||
|
Short-term debt
|
$
|
55,603
|
|
$
|
386,140
|
|
|
|
Current maturities of long-term debt
|
38,709
|
|
19,966
|
|
|||
|
Trade accounts payable
|
731,582
|
|
650,092
|
|
|||
|
Accrued compensation and benefits
|
254,560
|
|
212,525
|
|
|||
|
Accrued contributions to employees’ profit-sharing plans
|
92,682
|
|
54,948
|
|
|||
|
Accrued expenses
|
313,766
|
|
290,207
|
|
|||
|
Income taxes payable
|
19,759
|
|
15,059
|
|
|||
|
Total current liabilities
|
1,506,661
|
|
1,628,937
|
|
|||
|
LONG-TERM DEBT (less current maturities)
|
2,248,036
|
|
1,840,946
|
|
|||
|
DEFERRED INCOME TAXES AND TAX UNCERTAINTIES
|
111,710
|
|
126,101
|
|
|||
|
EMPLOYMENT-RELATED AND OTHER NONCURRENT LIABILITIES
|
110,114
|
|
192,555
|
|
|||
|
SHAREHOLDERS' EQUITY
|
|
|
|
|
|||
|
Cumulative preferred stock – $5 par value – 12,000,000 shares authorized; none issued or outstanding
|
—
|
|
—
|
|
|||
|
Common stock – $0.50 par value – 300,000,000 shares authorized;
issued 109,659,219 shares
|
54,830
|
|
54,830
|
|
|||
|
Additional contributed capital
|
1,040,493
|
|
1,030,256
|
|
|||
|
Retained earnings
|
7,405,192
|
|
7,113,559
|
|
|||
|
Accumulated other comprehensive losses
|
(134,674
|
)
|
(272,294
|
)
|
|||
|
Treasury stock, at cost – 53,330,356 and 50,854,905 shares, respectively
|
(6,675,709
|
)
|
(6,128,416
|
)
|
|||
|
Total W.W. Grainger, Inc. shareholders’ equity
|
1,690,132
|
|
1,797,935
|
|
|||
|
Noncontrolling interest
|
137,601
|
|
107,833
|
|
|||
|
Total shareholders' equity
|
1,827,733
|
|
1,905,768
|
|
|||
|
TOTAL LIABILITIES AND SHAREHOLDERS' EQUITY
|
$
|
5,804,254
|
|
$
|
5,694,307
|
|
|
The accompanying notes are an integral part of these consolidated financial statements.
41
W.W. Grainger, Inc. and Subsidiaries
(In thousands of dollars)
|
For the Years Ended December 31,
|
|||||||||||
|
|
2017
|
2016
|
2015
|
||||||||
|
CASH FLOWS FROM OPERATING ACTIVITIES:
|
|
|
|||||||||
|
Net earnings
|
$
|
622,443
|
|
$
|
632,838
|
|
$
|
785,174
|
|
||
|
Provision for losses on accounts receivable
|
16,376
|
|
16,216
|
|
10,181
|
|
|||||
|
Deferred income taxes and tax uncertainties
|
(5,048
|
)
|
(5,884
|
)
|
4,076
|
|
|||||
|
Depreciation and amortization
|
264,064
|
|
248,857
|
|
227,967
|
|
|||||
|
Impairment of goodwill, intangible and other assets
|
28,186
|
|
52,318
|
|
—
|
|
|||||
|
Net (gains) losses from sales of assets and business divestitures
|
(8,795
|
)
|
(18,521
|
)
|
2,765
|
|
|||||
|
Stock-based compensation
|
32,661
|
|
35,735
|
|
46,861
|
|
|||||
|
Losses from equity method investment
|
37,771
|
|
31,193
|
|
11,740
|
|
|||||
|
Change in assets and liabilities – net of business acquisitions and divestitures:
|
|
|
|
|
|
|
|||||
|
Accounts receivable
|
(103,126
|
)
|
(45,600
|
)
|
(3,085
|
)
|
|||||
|
Inventories
|
(4,915
|
)
|
(4,403
|
)
|
(37,737
|
)
|
|||||
|
Prepaid expenses and other assets
|
(5,024
|
)
|
18,641
|
|
15,788
|
|
|||||
|
Trade accounts payable
|
72,332
|
|
72,882
|
|
23,130
|
|
|||||
|
Other current liabilities
|
112,445
|
|
(3,937
|
)
|
(24,101
|
)
|
|||||
|
Current income taxes payable
|
3,967
|
|
(3,513
|
)
|
6,943
|
|
|||||
|
Accrued employment-related benefits cost
|
(6,380
|
)
|
7,542
|
|
(27,721
|
)
|
|||||
|
Other – net
|
(400
|
)
|
(10,281
|
)
|
(5,872
|
)
|
|||||
|
Net cash provided by operating activities
|
1,056,557
|
|
1,024,083
|
|
1,036,109
|
|
|||||
|
CASH FLOWS FROM INVESTING ACTIVITIES:
|
|
|
|
|
|||||||
|
Additions to property, buildings and equipment and intangibles
|
(237,283
|
)
|
(284,249
|
)
|
(373,868
|
)
|
|||||
|
Proceeds from sales of assets and business divestitures
|
120,228
|
|
55,023
|
|
14,857
|
|
|||||
|
Equity method investment
|
(34,754
|
)
|
(34,103
|
)
|
(20,382
|
)
|
|||||
|
Cash paid for business acquisitions
|
—
|
|
(159
|
)
|
(464,431
|
)
|
|||||
|
Other – net
|
5,726
|
|
1,224
|
|
466
|
|
|||||
|
Net cash used in investing activities
|
(146,083
|
)
|
(262,264
|
)
|
(843,358
|
)
|
|||||
|
CASH FLOWS FROM FINANCING ACTIVITIES:
|
|
|
|
|
|||||||
|
Net (decrease) increase in commercial paper
|
(369,766
|
)
|
39,748
|
|
325,000
|
|
|||||
|
Borrowings under lines of credit
|
73,781
|
|
36,055
|
|
54,770
|
|
|||||
|
Payments against lines of credit
|
(43,256
|
)
|
(37,358
|
)
|
(78,559
|
)
|
|||||
|
Proceeds from issuance of long-term debt
|
401,764
|
|
515,985
|
|
1,307,183
|
|
|||||
|
Payments of long-term debt
|
(39,301
|
)
|
(262,248
|
)
|
(52,838
|
)
|
|||||
|
Proceeds from stock options exercised
|
47,418
|
|
34,125
|
|
60,885
|
|
|||||
|
Payments for employee taxes withheld from stock awards
|
(27,884
|
)
|
(21,107
|
)
|
(46,205
|
)
|
|||||
|
Excess tax benefits from stock-based compensation
|
—
|
|
11,905
|
|
27,553
|
|
|||||
|
Purchase of treasury stock
|
(605,431
|
)
|
(789,773
|
)
|
(1,400,071
|
)
|
|||||
|
Cash dividends paid
|
(304,473
|
)
|
(302,971
|
)
|
(306,474
|
)
|
|||||
|
Net cash used in financing activities
|
(867,148
|
)
|
(775,639
|
)
|
(108,756
|
)
|
|||||
|
Exchange rate effect on cash and cash equivalents
|
9,404
|
|
(2,170
|
)
|
(20,503
|
)
|
|||||
|
NET CHANGE IN CASH AND CASH EQUIVALENTS:
|
52,730
|
|
(15,990
|
)
|
63,492
|
|
|||||
|
Cash and cash equivalents at beginning of year
|
274,146
|
|
290,136
|
|
226,644
|
|
|||||
|
Cash and cash equivalents at end of year
|
$
|
326,876
|
|
$
|
274,146
|
|
$
|
290,136
|
|
||
|
Supplemental cash flow information:
|
|||||||||||
|
Cash payments for interest (net of amounts capitalized)
|
$
|
78,043
|
|
$
|
63,143
|
|
$
|
31,591
|
|
||
|
Cash payments for income taxes
|
$
|
334,647
|
|
$
|
359,506
|
|
$
|
442,486
|
|
||
The accompanying notes are an integral part of these consolidated financial statements.
42
W.W. Grainger, Inc. and Subsidiaries
CONSOLIDATED STATEMENTS OF SHAREHOLDERS' EQUITY
(In thousands of dollars, except for per share amounts)
|
Common Stock
|
Additional Contributed Capital
|
Retained Earnings
|
Accumulated Other Comprehensive Earnings (Losses)
|
Treasury Stock
|
Noncontrolling
Interest
|
||||||||||||||
|
Balance at January 1, 2015
|
$
|
54,830
|
|
$
|
948,340
|
|
$
|
6,335,990
|
|
$
|
(96,673
|
)
|
$
|
(4,032,615
|
)
|
$
|
74,229
|
|
|
|
Exercise, settlement and vesting of stock based compensation awards
|
—
|
|
(22,781
|
)
|
—
|
|
—
|
|
62,835
|
|
460
|
|
|||||||
|
Stock based compensation expense
|
—
|
|
42,643
|
|
—
|
|
—
|
|
—
|
|
163
|
|
|||||||
|
Tax benefits on stock-based compensation awards
|
—
|
|
31,614
|
|
—
|
|
—
|
|
—
|
|
—
|
|
|||||||
|
Purchase of treasury stock
|
—
|
|
—
|
|
—
|
|
—
|
|
(1,399,931
|
)
|
(140
|
)
|
|||||||
|
Net earnings
|
—
|
|
—
|
|
768,996
|
|
—
|
|
—
|
|
16,178
|
|
|||||||
|
Other comprehensive losses
|
—
|
|
—
|
|
—
|
|
(124,418
|
)
|
—
|
|
(532
|
)
|
|||||||
|
Cash dividends paid ($4.59 per share)
|
—
|
|
660
|
|
(302,856
|
)
|
—
|
|
—
|
|
(4,278
|
)
|
|||||||
|
Balance at December 31, 2015
|
$
|
54,830
|
|
$
|
1,000,476
|
|
$
|
6,802,130
|
|
$
|
(221,091
|
)
|
$
|
(5,369,711
|
)
|
$
|
86,080
|
|
|
|
Exercise, settlement and vesting of stock based compensation awards
|
—
|
|
(18,137
|
)
|
—
|
|
—
|
|
41,307
|
|
58
|
|
|||||||
|
Stock based compensation expense
|
—
|
|
34,915
|
|
—
|
|
—
|
|
—
|
|
441
|
|
|||||||
|
Tax benefits on stock-based compensation awards
|
—
|
|
12,284
|
|
—
|
|
—
|
|
—
|
|
—
|
|
|||||||
|
Purchase of treasury stock
|
—
|
|
—
|
|
—
|
|
—
|
|
(800,012
|
)
|
(130
|
)
|
|||||||
|
Net earnings
|
—
|
|
—
|
|
605,928
|
|
—
|
|
—
|
|
26,910
|
|
|||||||
|
Other comprehensive (losses) earnings
|
—
|
|
—
|
|
—
|
|
(51,203
|
)
|
—
|
|
3,664
|
|
|||||||
|
Cash dividends paid ($4.83 per share)
|
—
|
|
718
|
|
(294,499
|
)
|
—
|
|
—
|
|
(9,190
|
)
|
|||||||
|
Balance at December 31, 2016
|
$
|
54,830
|
|
$
|
1,030,256
|
|
$
|
7,113,559
|
|
$
|
(272,294
|
)
|
$
|
(6,128,416
|
)
|
$
|
107,833
|
|
|
|
Exercise, settlement and vesting of stock based compensation awards
|
—
|
|
(22,906
|
)
|
—
|
|
—
|
|
60,273
|
|
206
|
|
|||||||
|
Stock based compensation expense
|
—
|
|
32,514
|
|
—
|
|
—
|
|
—
|
|
137
|
|
|||||||
|
Purchase of treasury stock
|
—
|
|
—
|
|
—
|
|
—
|
|
(607,566
|
)
|
(114
|
)
|
|||||||
|
Net earnings
|
—
|
|
—
|
|
585,730
|
|
—
|
|
—
|
|
36,713
|
|
|||||||
|
Other comprehensive (losses) earnings
|
—
|
|
—
|
|
—
|
|
137,620
|
|
—
|
|
3,831
|
|
|||||||
|
Cash dividends paid ($5.06 per share)
|
—
|
|
629
|
|
(294,097
|
)
|
—
|
|
—
|
|
(11,005
|
)
|
|||||||
|
Balance at December 31, 2017
|
$
|
54,830
|
|
$
|
1,040,493
|
|
$
|
7,405,192
|
|
$
|
(134,674
|
)
|
$
|
(6,675,709
|
)
|
$
|
137,601
|
|
|
The accompanying notes are an integral part of these consolidated financial statements.
43
COMPANY BACKGROUND
W.W. Grainger, Inc. is a broad line, business-to-business distributor of maintenance, repair and operating (MRO) supplies and other related products and services. W.W. Grainger, Inc.'s operations are primarily in the United States (U.S.) and Canada, with a presence in Europe, Asia and Latin America. In this report, the words “Company” or “Grainger” mean W.W. Grainger, Inc. and its subsidiaries.
PRINCIPLES OF CONSOLIDATION
The Consolidated Financial Statements include the accounts of the Company and its subsidiaries over which the Company exercises control. All significant intercompany transactions are eliminated from the consolidated financial statements. The Company has a controlling ownership interest in MonotaRO Co., Ltd. (MonotaRO), the single channel online business in Japan, with the residual representing the noncontrolling interest.
USE OF ESTIMATES
The preparation of financial statements in conformity with accounting principles generally accepted in the United States of America requires management to make estimates and assumptions that affect the reported amounts of assets and liabilities, revenues and expenses, and the disclosure of contingent liabilities. Actual results could differ from those estimates.
FOREIGN CURRENCY TRANSLATION
The U.S. dollar is the reporting currency for all periods presented. The financial statements of the Company’s foreign operating subsidiaries are measured using the local currency as the functional currency. Assets and liabilities of the Company’s foreign operating subsidiaries are translated into U.S. dollars at the exchange rate in effect at the balance sheet date. Revenues and expenses are translated at average rates in effect during the period. Net exchange gains or losses resulting from the translation of financial statements of foreign operations and related long-term debt are recorded as a separate component of other comprehensive earnings. See Note 13 to the Consolidated Financial Statements. Foreign currency transaction gains and losses are included in the Consolidated Statement of Earnings.
RECLASSIFICATIONS
Certain amounts in the 2016 and 2015 financial statements, as previously reported, have been reclassified to conform to the 2017 presentation. In March 2016, the Financial Accounting Standards Board (FASB) issued Accounting Standards Update (ASU) 2016-09,
Stock Based Compensation: Improvements to Employee Share-Based Payment Accounting
, which became effective January 1, 2017. As a result, the Company reclassified
$21 million
in 2016 and
$46 million
in 2015 of employee taxes paid from cash flows from operating activities to cash flows from financing activities in the Consolidated Statements of Cash Flows. These changes did not have a material impact on the Consolidated Financial Statements.
REVENUE RECOGNITION
Revenues recognized include product sales, billings for freight and handling charges and fees earned for services provided. The Company recognizes product sales and billings for freight and handling charges primarily on the date products are shipped to, or picked up by, the customer. In cases where the product is shipped directly to the customer, the Company recognizes revenue at the time of shipment primarily on a gross basis. The Company's standard shipping terms are FOB shipping point. On occasion, the Company will negotiate FOB destination terms. These sales are recognized upon delivery to the customer. eCommerce revenues, which accounted for
51%
of total
2017
revenues, are recognized on the same terms as revenues through other channels. Service revenues, which accounted for approximately
1%
of total
2017
revenues, are recognized after services are completed, including related service costs. Taxes collected from customers and remitted to governmental authorities are presented on a net basis and are not included in revenue.
Grainger offers sales incentives to customers primarily consisting of volume rebates. Volume rebates are generally based on annual targets and accruals are established throughout the year based on contract terms, Grainger’s historical payout experience and estimations of customer participation and performance levels. Sales incentives are primarily accounted for as a reduction of revenue. Contract terms for most of Grainger’s incentive arrangements do not exceed a year. Total accrued sales incentives were
$45 million
and
$36 million
as of December 31, 2017 and 2016, respectively, and are reflected in Accrued expenses in the Consolidated Balance Sheet.
44
COST OF MERCHANDISE SOLD
Cost of merchandise sold includes product and product-related costs, vendor consideration, freight and handling costs. The Company defines handling costs as those costs incurred to fulfill a shipped sales order.
VENDOR CONSIDERATION
The Company receives rebates and allowances from its vendors to promote their products. The Company utilizes numerous advertising programs to promote its vendors' products, including catalogs and other printed media, Internet, radio and other marketing programs. Most of these programs relate to multiple vendors, which makes supporting the specific, identifiable and incremental criteria difficult, and would require numerous assumptions and judgments. Based on the inexact nature of trying to track reimbursements to the advertising expenditure for each vendor, the Company treats most vendor advertising allowances as a reduction to product purchase price and is reflected in Cost of merchandise sold rather than a reduction of operating (advertising) expenses.
Vendor funds that are determined to be reimbursement of specific, incremental and identifiable costs incurred to promote vendors' products are recorded as an offset to the related expenses in Warehouse, marketing and administrative expenses.
Rebates earned from vendors that are based on product purchases are capitalized into inventory as part of product purchase price. These rebates are credited to Cost of merchandise sold based on sales. Vendor rebates that are earned based on products sold are credited directly to Cost of merchandise sold.
ADVERTISING
Advertising costs are expensed in the year the related advertisement is first presented. Advertising expense was $
187 million
,
$
180 million
and $
180 million
for
2017, 2016 and 2015
, respectively. Most vendor-provided allowances are classified as a reduction to product purchase price and are reflected in Cost of merchandise sold. For additional information see VENDOR CONSIDERATION above.
Catalog expense is amortized equally over the life of the catalog, beginning in the month of its distribution. Advertising costs for catalogs that have not been distributed by year-end are capitalized as Prepaid expenses. Amounts included in Prepaid expenses at December 31,
2017 and 2016
, were $
10 million
and $
12 million
, respectively.
WAREHOUSING, MARKETING AND ADMINISTRATIVE EXPENSES
Included in this category are purchasing, branch operations, information services and marketing and selling expenses, as well as other types of general and administrative costs.
STOCK INCENTIVE PLANS
The Company measures all share-based payments using fair-value-based methods and records compensation expense related to these payments over the vesting period. See Note 11 to the Consolidated Financial Statements.
INCOME TAXES
Income taxes are recognized during the year in which transactions enter into the determination of financial statement income, with deferred taxes being provided for temporary differences between financial and tax reporting. The Company recognizes in the financial statements a provision for tax uncertainties, resulting from application of complex tax regulations in multiple tax jurisdictions. The Company evaluates deferred income taxes to determine if valuation allowances are required using a “more likely than not” standard. This assessment considers the nature, frequency and amount of book and taxable income and losses, the duration of statutory carryback and forward periods, future reversals of existing taxable temporary differences and tax planning strategies, among other matters. On December 22, 2017, The Tax Cuts and Jobs Act of 2017 was enacted. See Note 14 to the Consolidated Financial Statements.
OTHER COMPREHENSIVE EARNINGS (LOSSES)
The Company's Other comprehensive earnings (losses) include foreign currency translation adjustments, changes in fair value of derivatives designated as hedges and unrecognized gains (losses) on postretirement and other employment-related benefit plans. Accumulated other comprehensive earnings (losses) (AOCE) are presented separately as part of shareholders' equity. See Note 13 to the Consolidated Financial Statements.
CASH AND CASH EQUIVALENTS
The Company considers investments in highly liquid debt instruments, purchased with an original maturity of
90
days or less, to be cash equivalents.
45
CONCENTRATION OF CREDIT RISK
The Company places temporary cash investments with institutions of high credit quality and, by policy, limits the amount of credit exposure to any one institution.
The Company has a broad customer base representing many diverse industries doing business in all regions of the United States, Canada, Europe, Asia and Latin America. Consequently, no significant concentration of credit risk is considered to exist.
ACCOUNTS RECEIVABLE AND ALLOWANCE FOR DOUBTFUL ACCOUNTS
Accounts receivable are stated at their estimated net realizable value. The Company establishes reserves for customer accounts that are potentially uncollectible. The method used to estimate the allowances is based on several factors, including the age of the receivables and the historical ratio of actual write-offs to the age of the receivables. These analyses also take into consideration economic conditions that may have an impact on a specific industry, group of customers or a specific customer. See Note 4 to the Consolidated Financial Statements.
INVENTORIES
Inventories are valued at the lower of cost or net realizable value. Cost is determined primarily by the last-in, first-out (LIFO) method, which accounts for approximately
64%
of total inventory. Grainger uses LIFO method to better match inventory cost and revenue. For the remaining inventory, cost is determined by the first-in, first-out (FIFO) method.
Grainger regularly reviews inventory to evaluate continued demand and identify any obsolete or excess quantities. Grainger records provisions for the difference between excess and obsolete inventory cost and its estimated realizable value. See Note 5 of the Consolidated Financial Statements.
PROPERTY, BUILDINGS AND EQUIPMENT
Property, buildings and equipment are valued at cost. For financial statement purposes, depreciation and amortization are recorded in amounts sufficient to relate the cost of depreciable assets to operations over their estimated service lives, principally on the declining-balance and sum-of-the-years-digits depreciation methods. The Company's international businesses record depreciation expense primarily on a straight-line basis. The principal estimated useful lives for determining depreciation are as follows:
|
Buildings, structures and improvements
|
10 to 30 years
|
|
Furniture, fixtures, machinery and equipment
|
3 to 10 years
|
Depreciation expense was
$170 million
,
$166 million
and
$162 million
for the years ended December 31,
2017, 2016 and 2015
, respectively.
Improvements to leased property are amortized over the initial terms of the respective leases or the estimated service lives of the improvements, whichever is shorter.
The Company capitalized interest costs of $
2 million
, $
2 million
and $
4 million
for the years ended December 31,
2017, 2016 and 2015
, respectively.
LONG-LIVED ASSETS
The carrying value of long-lived assets, primarily property, buildings and equipment and amortizable intangibles, is evaluated whenever events or changes in circumstances indicate that the carrying value of the asset may be impaired. An impairment loss is recognized when estimated undiscounted future cash flows resulting from use of the asset, including disposition, are less than the carrying value of the asset. Impairment is measured as the amount by which the asset's carrying amount exceeds the fair value.
GOODWILL AND OTHER INTANGIBLE ASSETS
Goodwill is recognized as the excess cost of an acquired entity over the net amount assigned to assets acquired and liabilities assumed. Goodwill is not amortized, but rather tested for impairment on an annual basis and more often if circumstances require. Impairment losses are recognized whenever the carrying value of a reporting unit exceeds its fair value. See Note 3 to the Consolidated Financial Statements.
46
The Company recognizes an acquired intangible apart from goodwill whenever the intangible arises from contractual or other legal rights, or whenever it can be separated or divided from the acquired entity and sold, transferred, licensed, rented or exchanged, either individually or in combination with a related contract, asset or liability. Such intangibles are amortized over their estimated useful lives
(approximately 7 to 22 years)
unless the estimated useful life is determined to be indefinite. The straight-line method of amortization is used as it has been determined to approximate the use pattern of the asset. The Company also maintains intangible assets with indefinite lives that are not amortized. These intangibles are tested for impairment on an annual basis and more often if circumstances require. An impairment loss is recognized whenever the estimated fair value of the asset is less than its carrying value. See
Note 3
to the Consolidated Financial Statements.
The Company capitalizes certain costs related to the purchase and development of internal-use software. Amortization of capitalized software is on a straight-line basis over
three
or
five
years.
FAIR VALUE OF FINANCIAL INSTRUMENTS
The carrying amounts of cash and cash equivalents, receivables and accounts payable approximate fair value due to the short-term nature of these financial instruments. See Note 8 to the Consolidated Financial Statements for fair value of long-term debt.
WARRANTY RESERVES
The Company generally warrants the products it sells against defects for
one
year. For a significant portion of warranty claims, the manufacturer of the product is responsible for expenses. For warranty expenses not covered by the manufacturer, the Company provides a reserve for future costs based primarily on historical experience. Warranty reserves were
$2 million
and
$3 million
at December 31,
2017 and 2016
, respectively.
CONTINGENCIES
The Company accrues for costs relating to litigation claims and other contingent matters, when it is probable that a liability has been incurred and the amount of the assessment can be reasonably estimated.
NEW ACCOUNTING STANDARDS
In January 2016, the FASB issued ASU 2016-01,
Financial Instruments: Recognition and Measurement of Financial Assets and Financial Liabilities
. This change to the financial instrument model primarily affects the accounting for equity investments, financial liabilities under the fair value options and the presentation and disclosure requirements for financial instruments. The effective date of this ASU is for fiscal years and interim periods beginning after December 15, 2017. This ASU is not expected to have a material impact on the Company's Consolidated Financial Statements.
In February 2016, the FASB issued ASU 2016-02,
Leases.
This ASU improves transparency and comparability related to the accounting and reporting of leasing arrangements. The guidance will require balance sheet recognition for assets and liabilities associated with rights and obligations created by leases with terms greater than twelve months. The effective date of this ASU is for fiscal years and interim periods beginning after December 15, 2018 and early adoption is permitted. The Company is evaluating the impact of this ASU.
In August 2016, the FASB issued ASU 2016-15,
Statement of Cash Flows - Classification of Certain Cash Receipts and Cash Payments.
This ASU addresses eight specific cash flow issues with the objective of reducing the existing diversity in practice. The effective date of this ASU is for fiscal years and interim periods beginning after December 15, 2017. This ASU is not expected to have a material impact on the Company's Consolidated Financial Statements.
In January 2017, the FASB issued ASU 2017-01,
Business Combinations (Topic 805): Clarifying the Definition of a Business.
This ASU clarifies the definition of a business with the objective of adding guidance to assist entities with evaluating whether transactions should be accounted for as acquisitions (or disposals) of assets or businesses. The definition of a business affects many areas of accounting including acquisitions, disposals, goodwill and consolidation. The effective date of this ASU is for fiscal years and interim periods beginning after December 15, 2017. This ASU should be applied prospectively on or after the effective date. No disclosures are required at transition. This ASU is not expected to have a material impact on the Company's Consolidated Financial Statements.
In January 2017, the FASB issued ASU No. 2017-04,
Intangibles-Goodwill and Other (Topic 350) Simplifying the Test for Goodwill Impairment
. ASU 2017-04 simplifies the subsequent measurement of goodwill by eliminating the Step 2 procedure from the goodwill impairment test. Under ASU 2017-04, an entity should perform its annual or interim goodwill impairment test by comparing the fair value of a reporting unit with its carrying amount. An entity should recognize an
47
impairment charge for the amount by which the carrying amount exceeds the reporting unit’s fair value; however, the loss recognized should not exceed the total amount of goodwill allocated to that reporting unit. The amendments of this ASU are effective for annual or any interim goodwill impairment tests beginning after December 15, 2019, and early adoption is permitted for annual and interim goodwill impairment testing dates after January 1, 2017. The Company early adopted this ASU during the third quarter of 2017 and there was no impact to the financial statements.
In March 2017, the FASB issued ASU 2017-07,
Compensation Retirement Benefits (Topic 715): Improving the Presentation of Net Periodic Pension Cost and Net Periodic Postretirement Benefit Cost.
This ASU improves the presentation of net periodic pension cost and net periodic postretirement benefit cost. The amendments in this ASU are effective for public entities for fiscal years and interim periods beginning after December 15, 2017. The amendments in this ASU should be applied retrospectively for the presentation of the net periodic postretirement cost components in the income statement and prospectively, on and after the effective date, for the capitalization of the service cost component of net periodic pension cost and net periodic postretirement benefit in assets. The Company is evaluating the impact of this ASU.
In May 2017, the FASB issued ASU 2017-09,
Compensation - Stock Compensation (Topic 718): Scope of Modification Accounting.
This ASU provides clarity and reduces both (1) diversity in practice and (2) cost and complexity when applying the guidance in Topic 718, Compensation-Stock Compensation, to a change to the terms or conditions of a share-based payment award. The amendments in this ASU are effective for public entities for fiscal years and interim periods beginning after December 15, 2017. The ASU should be applied prospectively on and after the effective date. This ASU is not expected to have a material impact on the Company's Consolidated Financial Statements.
REVENUE RECOGNITION STANDARDS
In May 2014, the FASB issued ASU 2014-09,
Revenue from Contracts with Customers (Topic 606)
as modified by subsequently issued ASUs 2015-14, 2016-08, 2016-10, 2016-12 and 2016-20 (collectively “new revenue standard”). The core principle of the ASU, among other changes, is that an entity should recognize revenue when it transfers promised goods or services to customers in an amount that reflects the consideration to which the entity expects to be entitled in exchange for those goods or services. The Company has elected the modified retrospective method and will adopt the new revenue guidance effective January 1, 2018, with an immaterial impact to the opening retained earnings.
The analysis of contracts with customers under the new revenue recognition standard was consistent with the Company’s current revenue recognition model, whereby revenue is recognized primarily on the date products are shipped to, or picked up by, the customer.
Adoption of the new standard will primarily result in reclassification of certain service related costs from Warehousing, marketing and administrative expenses to Cost of merchandise sold. The ASU also requires expanded qualitative and quantitative disclosures about the nature, amount, timing and uncertainty of revenue and cash flows arising from contracts with customers, significant judgments and accounting policy.
Adoption of the new standard will not have an ongoing material impact on the Company's Consolidated Financial Statements.
48
On September 1, 2015, the Company acquired all of the issued share capital of Cromwell Group (Holdings) Limited (Cromwell). With sales of
£285 million
(
$437 million
) for fiscal year ending August 31, 2015, prior to the acquisition, Cromwell was the largest independent MRO distributor in the United Kingdom. This acquisition brought together Cromwell's product strength and customer relationships with Grainger's expertise in supply chain and eCommerce to accelerate growth in the core and online Cromwell business. The Company paid
£310 million
(
$464 million
), subject to customary adjustments, for the Cromwell acquisition. The acquisition was partially funded with newly issued debt in the United Kingdom. The goodwill recorded in the acquisition totaled approximately
$123 million
. The goodwill is not deductible for tax purposes. The intangibles recorded in the acquisition consisted primarily of trade name (approximately
$84 million
) and customer relationships (approximately
$132 million
). The trade name is deemed to have an indefinite life and the customer relationship are amortized over
15
years. The purchase price allocation was finalized in 2016 and the impact to the consolidated financial statements was not material. Disclosure of pro forma results was not required.
Grainger had approximately
$1.1 billion
of goodwill and intangible assets as of December 31,
2017
and
2016
, or
19%
and
20%
of total assets, respectively. Grainger tests reporting units’ goodwill and intangible assets for impairment annually during the fourth quarter and more frequently if impairment indicators exist. Grainger periodically performs qualitative assessments of significant events and circumstances such as reporting units' historical and current results, assumptions regarding future performance, strategic initiatives and overall economic factors to determine the existence of impairment indicators and assess if it is more likely than not that the fair value of the reporting unit or indefinite-lived intangible assets is less than its carrying value and if a quantitative impairment test is necessary. In the quantitative test, Grainger compares the carrying value of the reporting unit or an indefinite-lived intangible asset with its fair value. Any excess of the carrying value over fair value is recorded as an impairment charge.
The fair value of reporting units is calculated primarily using the discounted cash flow (DCF) method and utilizing value indicators from a market approach to evaluate the reasonableness of the resulting fair values. The DCF method incorporates various assumptions including the amount and timing of future expected cash flows, including revenues, gross margins, operating expenses, capital expenditures and working capital based on operational budgets, long-range strategic plans and other estimates. The terminal value growth rate is used to calculate the value of cash flows beyond the last projected period and reflects management’s best estimates for perpetual growth for the reporting units. Estimates of market-participant risk-adjusted weighted average cost of capital are used as a basis for determining the discount rates to apply to the reporting units’ future expected cash flows and terminal value.
Grainger’s indefinite-lived intangibles are primarily trade names. The fair value of trade names is calculated primarily using the relief from royalty method, which estimates the expected royalty savings attributable to the ownership of the trade name asset. The key assumptions when valuing a trade name are the revenue base, the royalty rate and the discount rate.
During the quarter ended September 30, 2017, the Company performed qualitative assessments of its reporting units’ goodwill and intangible assets. Quantitative tests on
two
of its reporting units were performed due to lower than expected operating performance and lowered short-term forecasts. Based on the results of the quantitative tests performed, the Company concluded that there was
no
impairment of goodwill or indefinite-lived intangible assets for the
two
reporting units as of September 30, 2017. The fair values of the reporting units exceeded their carrying values by approximately
31 percent
for the Canada reporting unit and
15 percent
for the Cromwell reporting unit included in other businesses.
Grainger completed its annual goodwill impairment testing in the fourth quarter. The testing included qualitative assessment of each reporting units’ goodwill and intangible assets. The Company concluded that for each of its reporting units, including the
two
reporting units for which quantitative tests were performed during the third quarter, it was not more likely than not that the fair value of the reporting unit or indefinite-lived intangible assets is less than their carrying value.
The risk of potential failure of future impairment tests is highly dependent upon a number of assumptions. Changes in assumptions regarding discount rate and future performance, as well as the ability to execute on growth initiatives and productivity improvements, may have a significant impact on future cash flows. Likewise, unfavorable economic environment and changes in market conditions or other factors may result in future impairments of the goodwill and intangible assets.
49
The balances and changes in the carrying amount of Goodwill by segment are as follows (in thousands of dollars):
|
United States
|
Canada
|
Other businesses
|
Total
|
|||||||||||||
|
Balance at January 1, 2016
|
|
$
|
202,020
|
|
|
$
|
118,529
|
|
|
$
|
261,787
|
|
|
$
|
582,336
|
|
|
Purchase Price Adjustments
|
—
|
|
—
|
|
8,362
|
|
8,362
|
|
||||||||
|
Impairment
|
—
|
|
—
|
|
(47,244
|
)
|
(47,244
|
)
|
||||||||
|
Translation
|
—
|
|
3,611
|
|
(19,915
|
)
|
(16,304
|
)
|
||||||||
|
Balance at December 31, 2016
|
202,020
|
|
122,140
|
|
202,990
|
|
527,150
|
|
||||||||
|
Divestiture
|
(3,316
|
)
|
—
|
|
—
|
|
(3,316
|
)
|
||||||||
|
Impairment
|
(7,169
|
)
|
—
|
|
—
|
|
(7,169
|
)
|
||||||||
|
Translation
|
—
|
|
8,282
|
|
18,956
|
|
27,238
|
|
||||||||
|
Balance at December 31, 2017
|
$
|
191,535
|
|
$
|
130,422
|
|
$
|
221,946
|
|
$
|
543,903
|
|
||||
|
Cumulative goodwill impairment charges, January 1, 2017
|
$
|
17,038
|
|
$
|
32,265
|
|
$
|
70,299
|
|
$
|
119,602
|
|
||||
|
Impairment
|
7,169
|
|
—
|
|
—
|
|
7,169
|
|
||||||||
|
Cumulative goodwill impairment charges, December 31, 2017
|
$
|
24,207
|
|
$
|
32,265
|
|
$
|
70,299
|
|
$
|
126,771
|
|
||||
The balances and changes in Intangible assets - net are as follows (in thousands of dollars):
|
As of December 31,
|
|||||||||||||||||||||||||
|
2017
|
2016
|
||||||||||||||||||||||||
|
Weighted average life
|
Gross carrying amount
|
Accumulated amortization
|
Net carrying amount
|
Gross carrying amount
|
Accumulated amortization
|
Net carrying amount
|
|||||||||||||||||||
|
Customer lists and relationships
|
13.8 years
|
$
|
430,026
|
|
$
|
195,842
|
|
$
|
234,184
|
|
$
|
424,405
|
|
$
|
175,112
|
|
$
|
249,293
|
|
||||||
|
Trademarks, trade names and other
|
13.5 years
|
25,886
|
|
16,054
|
|
9,832
|
|
25,353
|
|
14,262
|
|
11,091
|
|
||||||||||||
|
Non-amortized trade names and other
|
137,491
|
|
—
|
|
137,491
|
|
128,282
|
|
—
|
|
128,282
|
|
|||||||||||||
|
Capitalized software
|
4.1 years
|
632,431
|
|
444,823
|
|
187,608
|
|
571,978
|
|
374,518
|
|
197,460
|
|
||||||||||||
|
Total intangible assets
|
8.2 years
|
$
|
1,225,834
|
|
$
|
656,719
|
|
$
|
569,115
|
|
$
|
1,150,018
|
|
$
|
563,892
|
|
$
|
586,126
|
|
||||||
Amortization expense recognized on intangible assets was $
89 million
, $
82 million
and $
65 million
for the years ended December 31,
2017
,
2016
and
2015
, respectively, and is included in Warehousing, marketing and administrative expenses on the Consolidated Statement of Earnings.
50
Estimated amortization expense for future periods is as follows (in thousands of dollars):
|
Year
|
Expense
|
||||||
|
2018
|
$
|
91,178
|
|||||
|
2019
|
73,995
|
||||||
|
2020
|
52,409
|
||||||
|
2021
|
40,315
|
||||||
|
2022
|
28,468
|
||||||
|
Thereafter
|
145,259
|
||||||
The following table shows the activity in the allowance for doubtful accounts (in thousands of dollars):
|
For the Years Ended December 31,
|
|||||||
|
2017
|
2016
|
||||||
|
Balance at beginning of period
|
$
|
26,690
|
|
$
|
22,288
|
|
|
|
Provision for uncollectible accounts
|
16,376
|
|
16,216
|
|
|||
|
Write-off of uncollectible accounts, net of recoveries
|
(16,597
|
)
|
(11,248
|
)
|
|||
|
Foreign currency and other
|
2,798
|
|
(566
|
)
|
|||
|
Balance at end of period
|
$
|
29,267
|
|
$
|
26,690
|
|
|
Inventories primarily consist of merchandise purchased for resale. Inventories would have been $
382 million
higher than reported at December 31, 2017 and December 31, 2016, if the FIFO method of inventory accounting had been used for all the Company inventories. Net earnings would have decreased by $
1
million, $
3
million and $
1 million
for the years ended
December 31, 2017, 2016 and 2015, respectively
, using the FIFO method of accounting. Inventory values using the FIFO method of accounting approximate replacement cost. The Company records provisions for the difference between excess and obsolete inventory cost and its estimated realizable value.
The following table shows the activity in the reserves for excess and obsolete inventory (in thousands of dollars):
|
For the Years Ended December 31,
|
|||||||
|
2017
|
2016
|
||||||
|
Balance at beginning of period
|
$
|
(191,514
|
)
|
$
|
(168,105
|
)
|
|
|
Provision for excess and obsolete inventory
|
(24,829
|
)
|
(58,485
|
)
|
|||
|
Disposal of unsaleable inventory
|
29,442
|
|
30,161
|
|
|||
|
Other
|
(6,547
|
)
|
4,915
|
|
|||
|
Balance at end of period
|
$
|
(193,448
|
)
|
$
|
(191,514
|
)
|
|
The Company continues to evaluate performance and take restructuring actions such as the consolidation of the contact center network in the U.S. business, branch closures in the U.S. and Canada businesses and disposition of underperforming assets and businesses in the U.S., Canada and other businesses. The purpose of these initiatives is to reduce costs in the U.S. business and at the Company level (unallocated expense) and streamline and focus on profitability in the Canada and other businesses.
51
Restructuring costs, net of gains, for the years ended
December 31, 2017, 2016 and 2015
are as follows (in thousands of dollars):
|
For the Year Ended December 31, 2017
|
||||||||||||||||
|
Cost of merchandise sold
|
Warehousing, marketing and administrative expenses
|
Total
|
||||||||||||||
|
Involuntary employee termination costs
|
Other charges (gains)
|
|||||||||||||||
|
United States
|
$
|
1,379
|
|
$
|
32,134
|
|
$
|
(22,255
|
)
|
$
|
11,258
|
|
||||
|
Canada
|
8,310
|
|
15,001
|
|
15,976
|
|
39,287
|
|
||||||||
|
Other businesses
|
3,861
|
|
11,724
|
|
39,435
|
|
55,020
|
|
||||||||
|
Unallocated expense
|
—
|
|
—
|
|
10,593
|
|
10,593
|
|
||||||||
|
Total
|
$
|
13,550
|
|
$
|
58,859
|
|
$
|
43,749
|
|
$
|
116,158
|
|
||||
|
For the Year Ended December 31, 2016
|
||||||||||||||||
|
Cost of merchandise sold
|
Warehousing, marketing and administrative expenses
|
Total
|
||||||||||||||
|
Involuntary employee termination costs
|
Other charges (gains)
|
|||||||||||||||
|
United States
|
$
|
3,100
|
|
$
|
21,151
|
|
$
|
(8,583
|
)
|
$
|
15,668
|
|
||||
|
Canada
|
1,605
|
|
12,536
|
|
857
|
|
14,998
|
|
||||||||
|
Unallocated expense
|
—
|
|
—
|
|
8,947
|
|
8,947
|
|
||||||||
|
Total
|
$
|
4,705
|
|
$
|
33,687
|
|
$
|
1,221
|
|
$
|
39,613
|
|
||||
|
For the Year Ended December 31, 2015
|
||||||||||||||||
|
Cost of merchandise sold
|
Warehousing, marketing and administrative expenses
|
Total
|
||||||||||||||
|
Involuntary employee termination costs
|
Other charges (gains)
|
|||||||||||||||
|
United States
|
$
|
1,194
|
|
$
|
21,524
|
|
$
|
12,754
|
|
$
|
35,472
|
|
||||
|
Canada
|
—
|
|
4,183
|
|
—
|
|
4,183
|
|
||||||||
|
Other businesses
|
—
|
|
—
|
|
5,696
|
|
5,696
|
|
||||||||
|
Total
|
$
|
1,194
|
|
$
|
25,707
|
|
$
|
18,450
|
|
$
|
45,351
|
|
||||
Other charges (gains) for all three years primarily include asset impairments and write-down losses in the U.S., Canada and at the Company level (unallocated expense) and other exit-related costs. The charges in the U.S. and Canada businesses are partially offset by gains from the sales of branches in those segments. Included in other charges (gains) is also approximately
$18 million
of accumulated foreign currency translations losses reclassified from Accumulated other comprehensive losses to earnings in other businesses primarily related to the wind-down of Colombia during 2017.
52
Restructuring reserves are primarily recorded as part of Accrued compensation and benefits and Accrued expenses. The following summarizes the restructuring reserve activity for the years ended
December 31, 2017 and 2016
(in thousands of dollars):
|
Current assets write-downs
|
Fixed assets write-downs and disposals
|
Involuntary employee termination costs
|
Lease termination costs
|
Other costs
|
Total
|
||||||||||||||||||
|
Reserves as of January 1, 2016
|
$
|
—
|
|
$
|
—
|
|
$
|
29,516
|
|
$
|
5,070
|
|
$
|
—
|
|
$
|
34,586
|
|
|||||
|
Restructuring costs, net of (gains)
|
4,684
|
|
(9,289
|
)
|
33,687
|
|
3,432
|
|
7,099
|
|
39,613
|
|
|||||||||||
|
Cash (paid) received
|
(2,933
|
)
|
18,235
|
|
(38,193
|
)
|
(5,377
|
)
|
(5,710
|
)
|
(33,978
|
)
|
|||||||||||
|
Non-cash, translation and others
|
$
|
(1,584
|
)
|
$
|
(8,946
|
)
|
$
|
(469
|
)
|
$
|
—
|
|
$
|
(878
|
)
|
$
|
(11,877
|
)
|
|||||
|
Reserves as of December 31, 2016
|
$
|
167
|
|
$
|
—
|
|
$
|
24,541
|
|
$
|
3,125
|
|
$
|
511
|
|
$
|
28,344
|
|
|||||
|
Restructuring costs, net of (gains)
|
13,892
|
|
511
|
|
58,859
|
|
5,572
|
|
37,324
|
|
116,158
|
|
|||||||||||
|
Cash (paid) received
|
(898
|
)
|
23,624
|
|
(34,066
|
)
|
(3,770
|
)
|
(7,639
|
)
|
(22,749
|
)
|
|||||||||||
|
Non-cash, translation and others
|
(60
|
)
|
(23,394
|
)
|
955
|
|
(34
|
)
|
(17,432
|
)
|
(39,965
|
)
|
|||||||||||
|
Reserves as of December 31, 2017
|
$
|
13,101
|
|
$
|
741
|
|
$
|
50,289
|
|
$
|
4,893
|
|
$
|
12,764
|
|
$
|
81,788
|
|
|||||
The cumulative amounts incurred to date and expected (excluding results of sales of real estate) in connection with the Company's restructuring actions for active programs are as follows (in thousands of dollars):
|
Cumulative amount incurred to date
|
Additional amount expected
|
||||||
|
United States
|
$
|
62,398
|
|
$
|
5,075
|
|
|
|
Canada
|
58,468
|
|
11,428
|
|
|||
|
Other businesses
|
60,716
|
|
135
|
|
|||
|
Unallocated expense
|
19,540
|
|
—
|
|
|||
|
Total
|
$
|
201,122
|
|
$
|
16,638
|
|
|
53
Short-term debt consisted of the following (in thousands of dollars):
|
As of December 31,
|
|||||||
|
2017
|
2016
|
||||||
|
Lines of Credit
|
|||||||
|
Outstanding at December 31
|
$
|
55,603
|
|
$
|
16,392
|
|
|
|
Maximum month-end balance during the year
|
$
|
55,621
|
|
$
|
24,722
|
|
|
|
Weighted average interest rate during the year
|
2.41
|
%
|
4.04
|
%
|
|||
|
Weighted average interest rate at December 31
|
2.01
|
%
|
5.13
|
%
|
|||
|
Commercial Paper
|
|||||||
|
Outstanding at December 31
|
$
|
—
|
|
$
|
369,748
|
|
|
|
Maximum month-end balance during the year
|
$
|
454,696
|
|
$
|
629,712
|
|
|
|
Weighted average interest rate during the year
|
0.83
|
%
|
0.50
|
%
|
|||
|
Weighted average interest rate at December 31
|
—
|
%
|
0.69
|
%
|
|||
Lines of Credit
In October 2017, the Company replaced its U.S.
$900 million
unsecured revolving line of credit with a new
five
-year
$750 million
unsecured revolving line of credit, with the option to extend the line to up to
$1.1 billion
. The terms of the new line of credit are customary for transactions of this type and do not contain any financial performance covenants. The primary purpose of this credit facility is to provide support to the Company's commercial paper program and for general corporate purposes. There were
no
borrowings outstanding under these lines of credit as of December 31, 2017 and 2016. The Company paid a commitment fee of
0.06%
and
0.07%
in 2017 and 2016, respectively.
Foreign subsidiaries utilize lines of credit for working capital purposes and other operating needs, primarily British Pound (£) and Euro (€) revolving credit facilities with
£20 million
and
€12.5 million
outstanding at December 31, 2017, respectively, and
no
outstanding balance at December 31, 2016. The British Pound revolving credit facility bears interest at London Interbank Offered Rate (LIBOR) plus a margin of
75 basis points
(
1.22%
at December 31, 2017) and a commitment fee of
0.26%
as of December 31, 2017. The Euro revolving credit facility bears interest at Euro Interbank Offered Rate (EURIBOR) plus a margin of
35 basis points
(
0.35%
at December 31, 2017) and a commitment fee of
0.12%
as of December 31, 2017.
Uncommitted Lines of Credit
The Company had
$71 million
and
$88 million
of uncommitted lines of credit at December 31, 2017 and 2016, respectively.
Commercial Paper
The Company issued commercial paper for general working capital needs. A portion of the proceeds from the May 2017 bond issuance (see Note 8 to the Consolidated Financial Statements) was used to pay outstanding commercial paper. At December 31, 2017, there was
no
ne outstanding.
Letters of Credit
The Company's U.S. business had
$33 million
and
$30 million
of letters of credit at December 31, 2017 and 2016, respectively, primarily related to the Company's insurance program. Letters of credit were also issued to facilitate purchases of products. These issued amounts were
$1 million
and
$5 million
at December 31, 2017 and 2016, respectively. Letters of credit issued by the Company's international businesses were immaterial.
54
Long-term debt consisted of the following (in thousands of dollars):
|
As of December 31,
|
|||||||
|
|
2017
|
2016
|
|||||
|
4.60% senior notes due 2045
|
$
|
1,000,000
|
|
$
|
1,000,000
|
|
|
|
3.75% senior notes due 2046
|
400,000
|
|
400,000
|
|
|||
|
4.20% senior notes due 2047
|
400,000
|
|
—
|
|
|||
|
British pound term loan
|
194,574
|
|
187,506
|
|
|||
|
Euro term loan
|
131,956
|
|
120,900
|
|
|||
|
Canadian dollar revolving credit facility
|
99,388
|
|
100,521
|
|
|||
|
Capital lease obligations and other
|
84,274
|
|
71,109
|
|
|||
|
2,310,192
|
|
1,880,036
|
|
||||
|
Less current maturities
|
(38,709
|
)
|
(19,966
|
)
|
|||
|
Debt issuance costs and discounts
|
(23,447
|
)
|
(19,124
|
)
|
|||
|
$
|
2,248,036
|
|
$
|
1,840,946
|
|
||
Senior Notes
In
May 2017
, the Company issued
$400 million
of unsecured
4.20%
Senior Notes (
4.20%
Notes) that mature on May 15, 2047. The
4.20%
Notes require no principal payments until the maturity date and interest is payable semi-annually on
May 15
and
November 15
, beginning on
November 15, 2017
. Prior to
November 15, 2046
, the Company may redeem the
4.20%
Notes in whole at any time or in part from time to time at a “make-whole” redemption price. This redemption price is calculated by reference to the then-current yield on a U.S. treasury security with a maturity comparable to the remaining term of the
4.20%
Notes plus
20 basis points
, together with accrued and unpaid interest, if any, at the redemption date. Additionally, if the Company experiences specific kinds of changes in control, it will be required to make an offer to purchase the
4.20%
Notes at
101%
of their principal amount plus accrued and unpaid interest, if any, at the date of purchase. On or after
November 15, 2046
, the Company may redeem the
4.20%
Notes in whole at any time or in part from time to time at
100%
of their principal amount, together with accrued and unpaid interest, if any, to the redemption date. Costs and discounts of approximately
$5.8 million
associated with the issuance of the
4.20%
Notes, representing underwriting fees and other expenses, have been recorded as a contra-liability within Long-term debt and is being amortized to interest expense over the term of the
4.20%
Notes. The fair value of the
4.20%
Notes was approximately
$411 million
as of December 31, 2017.
In
May 2016
, the Company issued
$400 million
of unsecured
3.75%
Senior Notes (
3.75%
Notes) that mature on May 15, 2046. The
3.75%
Notes require no principal payments until the maturity date and interest is payable semi-annually on
May 15
and
November 15
, beginning on
November 15, 2016
. Prior to
November 15, 2045
, the Company may redeem the
3.75%
Notes in whole at any time or in part from time to time at a “make-whole” redemption price. This redemption price is calculated by reference to the then-current yield on a U.S. treasury security with a maturity comparable to the remaining term of the
3.75%
Notes plus
20 basis points
, together with accrued and unpaid interest, if any, to the redemption date. Additionally, if the Company experiences specific kinds of changes in control, it will be required to make an offer to purchase the
3.75%
Notes at
101%
of their principal amount plus accrued and unpaid interest, if any, to the date of purchase. On or after
November 15, 2045
, the Company may redeem the
3.75%
Notes in whole at any time or in part from time to time at
100%
of their principal amount, together with accrued and unpaid interest, if any, to the redemption date. Costs and discounts of approximately
$7 million
associated with the issuance of the
3.75%
Notes, representing underwriting fees and other expenses, have been recorded as a contra-liability within Long-term debt and is being amortized to interest expense over the term of the
3.75%
Notes. The fair value of the
3.75%
Notes was approximately
$384 million
and
$371 million
as of December 31, 2017 and 2016, respectively.
In
June 2015
, the Company issued
$1 billion
of unsecured
4.60%
Senior Notes (
4.60%
Notes) that mature on
June 15, 2045
. The
4.60%
Notes require no principal payments until the maturity date and interest is payable semi-annually on
June 15
and
December 15
, beginning on
December 31, 2015
. Prior to
December 15, 2044
, the Company may redeem the
4.60%
Notes in whole at any time or in part from time to time at a “make-whole” redemption price. This redemption price is calculated by reference to the then-current yield on a U.S. treasury security with a maturity comparable to the remaining term of the
4.60%
Notes plus
25 basis points
, together with accrued and unpaid interest, if any, to the
55
redemption date. Additionally, if the Company experiences specific kinds of changes in control, it will be required to make an offer to purchase the
4.60%
Notes at
101%
of their principal amount plus accrued and unpaid interest, if any, to the date of purchase. On or after
December 15, 2044
, the Company may redeem the
4.60%
Notes in whole at any time or in part from time to time at
100%
of their principal amount, together with accrued and unpaid interest, if any, to the redemption date. Costs and discounts of approximately
$11 million
associated with the issuance of the
4.60%
Notes, representing underwriting fees and other expenses, have been recorded as a contra-liability within Long-term debt and is beingamortized to interest expense over the term of the
4.60%
Notes. The fair value of the
4.60%
Notes was approximately
$1.1 billion
as of December 31, 2017 and 2016.
The estimated fair values of the Company’s Senior Notes were based on available external pricing data and current market rates for similar debt instruments, among other factors, which are classified as level 2 inputs within the fair value hierarchy.
British Pound Term Loan
In
August 2015
, the Company entered into an unsecured credit facilities agreement providing for a
five
-year term loan of
£160 million
and revolving credit facility of up to
£20 million
(see Note 7 to the Consolidated Financial Statements). Proceeds of the term loan were used to partially fund the acquisition of Cromwell and to pay certain costs related to the acquisition. Under the agreement, the principal amount of the term loan will be repaid semiannually in installments of
£4 million
beginning
February 2016
through
February 2020
with the remaining outstanding amount due August 2020. At the election of the Company, the term loan bears interest at the LIBOR Rate plus a margin of
75 basis points
, as defined within the term loan agreement. At December 31, 2017, the Company had elected a one-month LIBOR interest period. The weighted average interest rate was
1.04%
and
1.17%
for the years ended December 31, 2017 and 2016, respectively. The carrying value of the British Pound term loan approximates fair value due to the variable interest rate.
Euro Term Loan
On
August 31, 2016
, the Company entered into an agreement for a
five
-year term loan of
€110 million
and a revolving credit facility of up to
€20 million
(see Note 7 to the Consolidated Financial Statements). The proceeds from the term loan were used to pay in full
€102.5 million
of a term loan that matured in
August 2016
. Under the agreement, no principal amount of the loan will be required to be paid until the loan becomes due on
August 31, 2021
, at which time the loan will be required to be paid in full. The Company, at its option, may prepay this term loan in whole or in part at the end of any interest period without penalty. The loan bears interest at the EURIBOR plus a margin of
45 basis points
, as defined within the term loan agreement. If EURIBOR is less than zero, then EURIBOR will be deemed to be zero. The interest rate at December 31, 2017, was
0.45%
. The carrying value of the Euro term loan approximates fair value due to the variable interest rate.
Canadian Dollar Revolving Credit Facility
In
September 2014
, the Company entered into an unsecured revolving credit facility with a maximum availability of
C$175 million
. Pursuant to the credit agreement, there is a commitment fee of
0.07%
as of December 31, 2017, and the facility matures on
September 24, 2019
. The amounts outstanding were
C$125 million
and
C$135 million
as of December 31, 2017 and 2016, respectively. The loan bears interest at the Canadian Dollar Offered Rate (CDOR) plus a margin of
70 basis points
, as defined within the loan agreement. The weighted average interest rate during the year on this outstanding amount was
1.78%
. No principal payments are required on the credit facility until the maturity date. Accordingly, the amount outstanding is included in long-term debt as of December 31, 2017. The carrying value of the Canadian Dollar revolving credit facility approximates fair value due to the variable interest rate.
The scheduled aggregate principal payments related to capital lease obligations and long-term debt, excluding debt issuance costs, are due as follows (in thousands of dollars):
|
Year
|
Payment Amount
|
|
||
|
2018
|
$
|
38,709
|
|
|
|
2019
|
144,156
|
|
||
|
2020
|
190,774
|
|
||
|
2021
|
136,543
|
|
||
|
2022
|
10
|
|
||
|
Thereafter
|
1,800,000
|
|
||
|
Total
|
$
|
2,310,192
|
|
|
56
The Company's debt instruments include affirmative and negative covenants that are usual and customary for companies with similar credit ratings.
The Company was in compliance with all debt covenants as
December 31, 2017
.
The Company provides various retirement benefits to eligible employees, including contributions to defined contribution plans, pension benefits associated with defined benefit plans, postretirement medical benefits and other benefits. Eligibility requirements and benefit levels vary depending on employee location. Various foreign benefit plans cover employees in accordance with local legal requirements.
Defined Contribution Plans
A majority of the Company's U.S. employees are covered by a noncontributory profit-sharing plan. Effective January 1, 2016, the plan was amended to better align Company contributions to Company performance and now includes two components, a variable annual contribution based on a rate of return on invested capital and an automatic contribution equal to
3%
of total eligible compensation. In addition, employees covered by the plan are also able to make personal contributions. The total Company contribution will be maintained at a minimum of
8%
and a maximum of
18%
of total eligible compensation paid to eligible employees. The total profit-sharing plan expense was $
120 million
, $
84 million
and $
121 million
for
2017, 2016 and 2015
, respectively.
The Company sponsors additional defined contribution plans available to certain U.S. and foreign employees for which contributions are paid by the Company and participating employees. The expense associated with these defined contribution plans totaled
$18 million
,
$12 million
and
$11 million
for 2017, 2016 and
2015
, respectively.
Defined Benefit Plans and Other Retirement Plans
The Company sponsors defined benefit plans available to certain foreign employees. The cost of these programs is not significant to the Company. In certain countries, pension contributions are made to government-sponsored social security pension plans in accordance with local legal requirements. For these plans, the Company has no continuing obligations other than the payment of contributions.
Postretirement Healthcare Benefits Plans
The Company has a postretirement healthcare benefits plan that provides coverage for a majority of its U.S. employees hired prior to January 1, 2013, and their dependents should they elect to maintain such coverage upon retirement. Covered employees become eligible for participation when they qualify for retirement while working for the Company. Participation in the plan is voluntary and requires participants to make contributions toward the cost of the plan, as determined by the Company.
During the third quarter of 2017, the Company implemented plan design changes effective January 1, 2018, for the post-65 age group. This plan change will move all post-65 Medicare eligible retirees to healthcare exchanges and provide them a subsidy to purchase insurance. The amount of the subsidy will be based on years of service. As of August 31, 2017, as a result of the plan change, the plan obligation was remeasured. The remeasurement resulted in a decrease in the postretirement benefit obligation of
$75.7 million
and a corresponding unrecognized gain recorded in Other comprehensive earnings net of tax of
$29.2 million
.
The net periodic benefits costs charged to operating expenses, which were valued with a measurement date of January 1 for each year and August 31, 2017 remeasurement date, consisted of the following components (in thousands of dollars):
|
For the Years Ended December 31,
|
|||||||||||
|
2017
|
|
2016
|
|
2015
|
|||||||
|
Service cost
|
$
|
7,423
|
|
$
|
8,238
|
|
$
|
10,128
|
|
||
|
Interest cost
|
8,103
|
|
9,855
|
|
9,649
|
|
|||||
|
Expected return on assets
|
(11,826
|
)
|
(10,113
|
)
|
(10,375
|
)
|
|||||
|
Amortization of prior service credit
|
(7,570
|
)
|
(6,688
|
)
|
(6,801
|
)
|
|||||
|
Amortization of unrecognized (gains) losses
|
(2,437
|
)
|
129
|
|
1,512
|
|
|||||
|
Net periodic (benefits) costs
|
$
|
(6,307
|
)
|
$
|
1,421
|
|
$
|
4,113
|
|
||
57
Reconciliations of the beginning and ending balances of the postretirement benefit obligation, which is calculated as of December 31 measurement date, the fair value of plan assets available for benefits and the funded status of the benefit obligation follow (in thousands of dollars):
|
2017
|
|
2016
|
|||||
|
Benefit obligation at beginning of year
|
$
|
265,028
|
|
$
|
239,348
|
|
|
|
Service cost
|
7,423
|
|
8,238
|
|
|||
|
Interest cost
|
8,103
|
|
9,855
|
|
|||
|
Plan participants' contributions
|
3,346
|
|
2,943
|
|
|||
|
Actuarial (gains) losses
|
(34,236
|
)
|
13,218
|
|
|||
|
Plan amendment
|
(34,182
|
)
|
—
|
|
|||
|
Benefits paid
|
(8,631
|
)
|
(9,439
|
)
|
|||
|
Prescription drug rebates
|
1,499
|
|
865
|
|
|||
|
Benefit obligation at end of year
|
208,350
|
|
265,028
|
|
|||
|
|
|
|
|
||||
|
Plan assets available for benefits at beginning of year
|
163,545
|
|
155,611
|
|
|||
|
Actual returns on plan assets
|
29,477
|
|
13,557
|
|
|||
|
Plan participants' contributions
|
3,266
|
|
2,774
|
|
|||
|
Benefits paid
|
(8,295
|
)
|
(9,262
|
)
|
|||
|
Prescription drug rebates
|
1,499
|
|
865
|
|
|||
|
Plan assets available for benefits at end of year
|
189,492
|
|
163,545
|
|
|||
|
Noncurrent postretirement benefit obligation
|
$
|
18,858
|
|
$
|
101,483
|
|
|
The amounts recognized in Accumulated other comprehensive earnings (AOCE) consisted of the following (in thousands of dollars):
|
As of December 31,
|
|||||||
|
2017
|
|
2016
|
|||||
|
Prior service credit
|
$
|
80,426
|
|
$
|
53,814
|
|
|
|
Unrecognized gains (losses)
|
36,794
|
|
(12,656
|
)
|
|||
|
Deferred tax (liability)
|
(43,793
|
)
|
(15,861
|
)
|
|||
|
Net accumulated gains
|
$
|
73,427
|
|
$
|
25,297
|
|
|
The
$49 million
increase in unrecognized gain was primarily driven by the plan amendment and a change in census, claims costs and other actuarial assumptions offset by a decrease in the discount rate.
The components of AOCE related to unrecognized gains that will be amortized into net periodic postretirement benefit costs in
2018
are estimated as follows (in thousands of dollars):
|
2018
|
|||
|
Amortization of prior service credit
|
$
|
(9,696
|
)
|
|
Amortization of unrecognized gains
|
(2,787
|
)
|
|
|
Estimated amount to be amortized from AOCE into net periodic postretirement benefit costs
|
$
|
(12,483
|
)
|
The Company has elected to amortize the amount of net unrecognized gains over a period equal to the average remaining service period for active plan participants expected to retire and receive benefits of approximately
13.2
years for
2017
.
The benefit obligation was determined by applying the terms of the plan and actuarial models. These models include various actuarial assumptions, including discount rates, long-term rates of return on plan assets, healthcare cost trend rate and cost-sharing between the Company and the retirees. The Company evaluates its actuarial assumptions on an annual basis and considers changes in these long-term factors based upon market conditions and historical experience.
58
The following assumptions were used to determine net periodic benefit costs at January 1 of each year (excluding the August 31, 2017 remeasurement date):
|
For the Years Ended December 31,
|
||||||||
|
2017
|
|
2016
|
|
2015
|
||||
|
Discount rate
|
4.00
|
%
|
4.20
|
%
|
3.89
|
%
|
||
|
Long-term rate of return on plan assets, net of tax
|
7.13
|
%
|
6.65
|
%
|
6.65
|
%
|
||
|
Initial healthcare cost trend rate - pre age 65
|
6.81
|
%
|
7.00
|
%
|
7.25
|
%
|
||
|
Initial healthcare cost trend rate - post age 65
|
9.36
|
%
|
7.00
|
%
|
7.25
|
%
|
||
|
Ultimate healthcare cost trend rate
|
4.50
|
%
|
4.50
|
%
|
4.50
|
%
|
||
|
Year ultimate healthcare cost trend rate reached
|
2026
|
|
2026
|
|
2026
|
|
||
The following assumptions were used to determine benefit obligations at December 31:
|
2017
|
|
2016
|
|
2015
|
||||
|
Discount rate
|
3.44
|
%
|
4.00
|
%
|
4.20
|
%
|
||
|
Expected long-term rate of return on plan assets, net of tax
|
7.13
|
%
|
7.13
|
%
|
6.65
|
%
|
||
|
Initial healthcare cost trend rate - pre age 65
|
6.56
|
%
|
6.81
|
%
|
7.00
|
%
|
||
|
Initial healthcare cost trend rate - post age 65
|
N/A
|
|
9.36
|
%
|
7.00
|
%
|
||
|
Catastrophic drug benefit
|
12.50
|
%
|
N/A
|
|
N/A
|
|
||
|
Ultimate healthcare cost trend rate
|
4.50
|
%
|
4.50
|
%
|
4.50
|
%
|
||
|
Year ultimate healthcare cost trend rate reached
|
2026
|
|
2026
|
|
2026
|
|
||
|
HRA credit inflation index for grandfathered retirees
|
2.50
|
%
|
N/A
|
|
N/A
|
|
||
The discount rate assumptions reflect the rates available on high-quality fixed income debt instruments as of December 31, the measurement date of each year. These rates have been selected due to their similarity to the duration of the projected cash flows of the postretirement healthcare benefit plan. As of
December 31, 2017
, the Company decreased the discount rate from
4.00%
to
3.44%
to reflect the decrease in the market interest rates, which offset the unrealized actuarial gain at
December 31, 2017
. As of December 31, 2017, the Company changed the mortality improvement table used to project mortality rates into the future from Mortality Table RPH-2014 with Mortality Improvement Scale MP 2016 to Mortality Table RPH-2014 with Mortality Improvement Scale MP 2017, which was published by the Society of Actuaries and reflects the most recent updates to life expectancies. RPH-2014 Table is a headcount weighted table, which is also more appropriate for a postretirement healthcare benefit plan. The Company reviews external data and its own historical trends for healthcare costs to determine the healthcare cost trend rates. As of December 31, 2016, Grainger adopted a new healthcare trend rate to include a pre and post age 65 trend rates. Post age 65, prescription drug costs, primarily specialty drugs, are expected to increase the cost of healthcare more significantly than medical expenses. The alternative trend rates allow for a better estimate of expected costs for this plan. As of
December 31, 2017
, the initial healthcare cost trend rate was
6.56%
for pre age 65. The healthcare costs trend rates decline each year until reaching the ultimate trend rate of
4.50%
. The plan amendment adopted in 2017 moves all post age 65 Medicare eligible retirees to an exchange and provides a subsidy to those retirees to purchase insurance. The amount of the subsidy is based on years of service and is indexed at
2.50%
for grandfathered employees. Assumed healthcare cost trend rates have a significant effect on the amounts reported for the healthcare plans. A 1 percentage point change in assumed healthcare cost trend rates would have the following effects on
2017
results (in thousands of dollars):
|
1 Percentage Point
|
|||||||
|
Increase
|
(Decrease)
|
||||||
|
Effect on total service and interest cost
|
$
|
1,269
|
|
$
|
(1,053
|
)
|
|
|
Effect on postretirement benefit obligation
|
5,516
|
|
(5,095
|
)
|
|||
The Company has established a Group Benefit Trust (Trust) to fund the plan obligations and process benefit payments. All assets of the Trust are invested in equity funds designed to track to either the Standard & Poor's 500 Index (S&P 500) or the Total International Composite Index. The Total International Composite Index tracks non-U.S. stocks within developed and emerging market economies. This investment strategy reflects the long-term nature of the plan obligation and seeks to take advantage of the earnings potential of equity securities in the global markets and intends to reach a balanced allocation between U.S. and non-U.S. equities. The plan's assets are stated at fair value, which represents
59
the net asset value of shares held by the plan in the registered investment companies at the quoted market prices (Level 1 input). The plan assets available for benefits are net of Trust liabilities, primarily related to deferred income taxes and taxes payable at December 31 (in thousands of dollars):
|
2017
|
|
2016
|
|||||
|
Registered investment companies:
|
|||||||
|
Fidelity Spartan U.S. Equity Index Fund
|
$
|
83,238
|
|
$
|
70,950
|
|
|
|
Vanguard 500 Index Fund
|
103,706
|
|
87,587
|
|
|||
|
Vanguard Total International Stock
|
30,684
|
|
24,056
|
|
|||
|
Plan Assets
|
217,628
|
|
182,593
|
|
|||
|
Trust liabilities
|
(28,136
|
)
|
(19,048
|
)
|
|||
|
Plan assets available for benefits
|
$
|
189,492
|
|
$
|
163,545
|
|
|
The Company uses the long-term historical return on the plan assets and the historical performance of the S&P 500 and the Total International Composite Index to develop its expected return on plan assets. The after-tax expected long-term rates of return on plan assets of
7.13%
at
December 31, 2017
is based on the historical average of long-term rates of return and an estimated tax rate. The required use of an expected long-term rate of return on plan assets may result in recognition of income that is greater or less than the actual return on plan assets in any given year. Over time, however, the expected long-term returns are designed to approximate the actual long-term returns and, therefore, result in a pattern of income recognition that more closely matches the pattern of the services provided by the employees.
The Company's investment policies include periodic reviews by management and trustees at least annually concerning: (1) the allocation of assets among various asset classes (e.g., domestic stocks, international stocks, short-term bonds, long-term bonds, etc.); (2) the investment performance of the assets, including performance comparisons with appropriate benchmarks; (3) investment guidelines and other matters of investment policy and (4) the hiring, dismissal or retention of investment managers.
The funding of the Trust is an estimated amount that is intended to allow the maximum deductible contribution under the Internal Revenue Code of 1986 (IRC), as amended. There are no minimum funding requirements and the Company intends to follow its practice of funding the maximum deductible contribution under the IRC.
The Company forecasts the following benefit payments related to postretirement (which include a projection for expected future employee service) for the next ten years (in thousands of dollars):
|
Year
|
Estimated Gross Benefit Payments
|
|||
|
2018
|
$
|
7,365
|
|
|
|
2019
|
8,956
|
|
||
|
2020
|
10,029
|
|
||
|
2021
|
11,025
|
|
||
|
2022
|
12,077
|
|
||
|
2023-2027
|
67,760
|
|
||
60
The Company leases certain land, buildings, equipment and vehicles under noncancelable operating leases that expire at various dates through
2036
. Many of the building leases obligate the Company to pay real estate taxes, insurance and certain maintenance costs and contain multiple renewal provisions, exercisable at the Company's option. Leases that contain predetermined fixed escalations of the minimum rentals are recognized in rental expense on a straight-line basis over the lease term. Cash or rent abatements received upon entering into certain operating leases are also recognized on a straight-line basis over the lease term.
At December 31, 2017,
the approximate future minimum lease payments for operating leases were as follows (in thousands of dollars):
|
Year
|
Future Minimum Lease Payments
|
|||
|
2018
|
$
|
63,625
|
|
|
|
2019
|
50,610
|
|
||
|
2020
|
31,984
|
|
||
|
2021
|
20,891
|
|
||
|
2022
|
13,555
|
|
||
|
Thereafter
|
15,879
|
|
||
|
Total minimum payments required
|
196,544
|
|
||
|
Less amounts representing sublease income
|
(4,125
|
)
|
||
|
$
|
192,419
|
|
||
The expected reduction of future minimum lease payments is the result of the decreasing branch network across the U.S. and Canada business.
Rent expense was
$76 million
,
$81 million
and
$77 million
for
2017
,
2016
and
2015
, respectively. These amounts are net of sublease income of
$2 million
for each
2017
,
2016
and
2015
.
Capital leases as of
December 31, 2017
are not considered material. Capital lease obligations are reported in long-term debt.
61
The Company maintains stock incentive plans under which the Company may grant a variety of incentive awards to employees and directors. Non-qualified stock options, performance shares, restricted stock units and deferred stock units have been granted and are outstanding under these plans. In 2015, the Company approved the 2015 Incentive Plan, which replaced all prior active plans.
As of December 31, 2017
, there were
2.7 million
shares available for grant under the plans. When options are exercised, shares of the Company’s treasury stock are issued.
Pretax stock-based compensation expense was $
31 million
, $
35 million
and $
43 million
in
2017, 2016 and 2015
, respectively, and is included in Warehousing, marketing and administrative expenses. Related income tax benefits recognized in earnings were
$25 million
, $
11 million
and
$13 million
in
2017, 2016 and 2015
, respectively.
Options
The Company issues stock option grants to certain employees as part of their incentive compensation. Option awards are granted with an exercise price equal to the closing market price of the Company's stock on the day of the grant. The options generally vest over
three
years, although accelerated vesting is provided in certain circumstances. Awards generally expire
10
years from the grant date. Transactions involving stock options are summarized as follows:
|
Shares Subject to Option
|
Weighted Average Price Per Share
|
Options Exercisable
|
|||||||
|
Outstanding at January 1, 2015
|
2,582,804
|
|
$
|
149.01
|
|
1,647,903
|
|
||
|
Granted
|
294,522
|
|
$
|
232.20
|
|
|
|
||
|
Exercised
|
(587,441
|
)
|
$
|
105.08
|
|
|
|
||
|
Canceled or expired
|
(63,599
|
)
|
$
|
216.76
|
|
|
|
||
|
Outstanding at December 31, 2015
|
2,226,286
|
|
$
|
169.96
|
|
1,411,460
|
|
||
|
Granted
|
294,874
|
|
$
|
234.25
|
|
|
|
||
|
Exercised
|
(317,110
|
)
|
$
|
108.28
|
|
|
|
||
|
Canceled or expired
|
(80,014
|
)
|
$
|
210.01
|
|
|
|
||
|
Outstanding at December 31, 2016
|
2,124,036
|
|
$
|
186.59
|
|
1,346,707
|
|
||
|
Granted
|
306,206
|
|
$
|
230.97
|
|
|
|
||
|
Exercised
|
(409,269
|
)
|
$
|
115.35
|
|
|
|
||
|
Canceled or expired
|
(87,260
|
)
|
$
|
222.00
|
|
|
|
||
|
Outstanding at December 31, 2017
|
1,933,713
|
|
$
|
207.10
|
|
1,375,844
|
|
||
At December 31, 2017,
there was $
8.9 million
of total unrecognized compensation expense related to nonvested option awards, which the Company expects to recognize over a weighted average period of
1.8
years.
The following table summarizes information about stock options (in thousands of dollars):
|
For the years ended December 31,
|
||||||||||||
|
2017
|
2016
|
2015
|
||||||||||
|
Fair value of options exercised
|
$
|
10,816
|
|
$
|
8,086
|
|
$
|
14,423
|
|
|||
|
Total intrinsic value of options exercised
|
47,332
|
|
35,800
|
|
73,671
|
|
||||||
|
Fair value of options vested
|
23,503
|
|
14,535
|
|
16,047
|
|
||||||
|
Settlements of options exercised
|
47,181
|
|
34,573
|
|
61,863
|
|
||||||
62
Information about stock options outstanding and exercisable as of
December 31, 2017
, is as follows:
|
Options Outstanding
|
Options Exercisable
|
|||||||||||||||||||||||||
|
Weighted Average
|
Weighted Average
|
|||||||||||||||||||||||||
|
Range of
Exercise
Prices
|
Number
|
Remaining
Contractual
Life
|
Exercise
Price
|
Intrinsic
Value
(000s)
|
Number
|
Remaining
Contractual
Life
|
Exercise
Price
|
Intrinsic
Value
(000s)
|
||||||||||||||||||
|
$72.14 - $85.82
|
84,831
|
|
0.87 years
|
$
|
80.11
|
|
$
|
13,246
|
|
84,831
|
|
0.87 years
|
$
|
80.11
|
|
$
|
13,246
|
|
||||||||
|
$102.26 - $196.31
|
363,820
|
|
2.96 years
|
$
|
133.79
|
|
37,275
|
|
362,677
|
|
2.94 years
|
$
|
133.68
|
|
37,199
|
|
||||||||||
|
$204.01 - $262.14
|
1,485,062
|
|
6.96 years
|
$
|
232.31
|
|
5,853
|
|
928,336
|
|
6.16 years
|
$
|
232.16
|
|
3,797
|
|
||||||||||
|
1,933,713
|
|
5.94 years
|
$
|
207.10
|
|
$
|
56,374
|
|
1,375,844
|
|
4.98 years
|
$
|
196.83
|
|
$
|
54,242
|
|
|||||||||
The Company uses a binomial lattice option pricing model for the valuation of stock options. The weighted average fair value of options granted in
2017, 2016 and 2015
was $
45.09
, $
44.94
and $
46.67
, respectively. The fair value of options granted in
2017, 2016 and 2015
used the following assumptions:
|
For the years ended December 31,
|
||||||
|
2017
|
2016
|
2015
|
||||
|
Risk-free interest rate
|
2.0%
|
1.4%
|
1.5%
|
|||
|
Expected life
|
6 years
|
6 years
|
6 years
|
|||
|
Expected volatility
|
23.9%
|
24.5%
|
24.9%
|
|||
|
Expected dividend yield
|
2.1%
|
2.0%
|
1.9%
|
|||
The risk-free interest rate is selected based on yields from U.S. Treasury zero-coupon issues with a remaining term approximately equal to the expected term of the options being valued. The expected life selected for options granted during each year presented represents the period of time that the options are expected to be outstanding based on historical data of option holder exercise and termination behavior. Expected volatility is based upon implied and historical volatility of the Company's closing stock price over a period equal to the expected life of each option grant. Historical Company information is the primary basis for selection of expected dividend yield assumptions.
Performance Shares
The Company awards performance-based shares to certain executives. Receipt of Company stock is contingent upon the Company meeting sales growth and/or return on invested capital (ROIC) goals. Each participant is granted a target number of shares; however the number of shares actually awarded at the end of the performance period can fluctuate from the target award, based upon achievement of the sales or ROIC goals.
Performance share value is based upon closing market prices on the last trading day preceding the date of award and is charged to earnings on a ratable basis over the vesting period, primarily
three
, and up to
seven
years for certain awards, based on the number of shares expected to vest. Holders of performance share awards are not entitled to receive cash payments equivalent to cash dividends. If the performance shares vest, they will be settled by the Company's issuance of common stock in exchange for the performance shares on a
one
-for-one basis.
63
The following table summarizes the transactions involving performance-based share awards:
|
2017
|
2016
|
2015
|
||||||||||||||||||
|
Shares
|
Weighted Average Price Per Share
|
Shares
|
Weighted Average Price Per Share
|
Shares
|
Weighted Average Price Per Share
|
|||||||||||||||
|
Beginning nonvested
shares outstanding
|
98,340
|
|
$
|
203.91
|
|
73,160
|
|
$
|
232.72
|
|
57,236
|
|
$
|
220.00
|
|
|||||
|
Issued
|
52,371
|
|
$
|
216.99
|
|
60,414
|
|
$
|
191.38
|
|
47,264
|
|
$
|
227.26
|
|
|||||
|
Canceled
|
(66,579
|
)
|
$
|
201.84
|
|
(11,724
|
)
|
$
|
241.41
|
|
(13,108
|
)
|
$
|
215.01
|
|
|||||
|
Vested
|
—
|
|
$
|
—
|
|
(23,510
|
)
|
$
|
242.65
|
|
(18,232
|
)
|
$
|
191.36
|
|
|||||
|
Ending nonvested shares
outstanding
|
84,132
|
|
$
|
213.69
|
|
98,340
|
|
$
|
203.91
|
|
73,160
|
|
$
|
232.72
|
|
|||||
At December 31, 2017,
there was $
11.4 million
of total unrecognized compensation expense related to performance-based share awards that the Company expects to recognize over a weighted average period of
2.7
years.
Restricted Stock Units (RSUs)
The Company awards restricted stock units (RSUs) to certain employees and executives. RSUs granted vest over periods from
three
to
seven
years from issuance, although accelerated vesting is provided in certain instances. Holders of RSUs are entitled to receive nonforfeitable cash payments equivalent to cash dividends and other distributions paid with respect to common stock. RSUs are settled by the issuance of the Company's common stock on a
one
-for-one basis. Compensation expense related to RSUs is based upon the closing market price on the last trading day preceding the date of award and is charged to earnings on a straight-line basis over the vesting period. The following table summarizes RSU activity:
|
2017
|
2016
|
2015
|
|||||||||||||||
|
Shares
|
Weighted
Average Price Per Share
|
Shares
|
Weighted
Average Price Per Share
|
Shares
|
Weighted
Average Price Per Share
|
||||||||||||
|
Beginning nonvested units
|
373,403
|
|
$
|
221.77
|
|
432,783
|
|
$
|
213.45
|
|
560,351
|
|
$
|
182.40
|
|
||
|
Issued
|
129,378
|
|
$
|
222.53
|
|
113,909
|
|
$
|
230.36
|
|
104,220
|
|
$
|
234.21
|
|
||
|
Canceled
|
(47,488
|
)
|
$
|
229.36
|
|
(62,869
|
)
|
$
|
229.70
|
|
(38,124
|
)
|
$
|
219.74
|
|
||
|
Vested
|
(102,374
|
)
|
$
|
203.51
|
|
(110,420
|
)
|
$
|
193.51
|
|
(193,664
|
)
|
$
|
133.56
|
|
||
|
Ending nonvested units
|
352,919
|
|
$
|
226.31
|
|
373,403
|
|
$
|
221.77
|
|
432,783
|
|
$
|
213.45
|
|
||
|
Fair value of shares vested
|
$20,834
|
$21,367
|
$25,865
|
||||||||||||||
At December 31, 2017,
there was $
45 million
of total unrecognized compensation expense related to nonvested RSUs that the Company expects to recognize over a weighted average period of
3.0
years.
64
The Company had no shares of preferred stock outstanding as of
December 31, 2017 and 2016
. The activity related to outstanding common stock and common stock held in treasury was as follows:
|
2017
|
2016
|
2015
|
||||||||||||
|
Outstanding Common Stock
|
Treasury Stock
|
Outstanding Common Stock
|
Treasury Stock
|
Outstanding Common Stock
|
Treasury Stock
|
|||||||||
|
Balance at beginning of period
|
58,804,314
|
|
50,854,905
|
|
62,028,708
|
|
47,630,511
|
|
67,432,041
|
|
42,227,178
|
|
||
|
Exercise of stock options
|
407,542
|
|
(407,542
|
)
|
315,171
|
|
(315,171
|
)
|
580,947
|
|
(580,947
|
)
|
||
|
Settlement of restricted stock units, net of 36,585, 41,128 and 73,496 shares retained, respectively
|
103,331
|
|
(103,331
|
)
|
78,310
|
|
(78,310
|
)
|
145,757
|
|
(145,757
|
)
|
||
|
Settlement of performance share units, net of 9,334, 6,765 and 9,971 shares retained, respectively
|
13,978
|
|
(13,978
|
)
|
11,806
|
|
(11,806
|
)
|
15,956
|
|
(15,956
|
)
|
||
|
Purchase of treasury shares
|
(3,000,302
|
)
|
3,000,302
|
|
(3,629,681
|
)
|
3,629,681
|
|
(6,145,993
|
)
|
6,145,993
|
|
||
|
Balance at end of period
|
56,328,863
|
|
53,330,356
|
|
58,804,314
|
|
50,854,905
|
|
62,028,708
|
|
47,630,511
|
|
||
65
The components of AOCE consisted of the following (in thousands of dollars):
|
Foreign Currency Translation
|
Defined Postretirement Benefit Plan
|
Other Employment-related Benefit Plans
|
Other
|
Total
|
Foreign Currency Translation Attributable to Noncontrolling Interests
|
AOCE Attributable to W.W. Grainger, Inc.
|
|||||||||||||||
|
Balance at January 1, 2015, net of tax
|
$
|
(122,320
|
)
|
$
|
8,148
|
|
$
|
(3,302
|
)
|
$
|
(2,185
|
)
|
$
|
(119,659
|
)
|
$
|
(22,986
|
)
|
$
|
(96,673
|
)
|
|
Other comprehensive earnings (loss) before reclassifications, net of tax
|
(154,096
|
)
|
30,451
|
|
641
|
|
1,300
|
|
(121,704
|
)
|
(532
|
)
|
(121,172
|
)
|
|||||||
|
Amounts reclassified to Warehousing, marketing and administrative expenses
|
—
|
|
(5,289
|
)
|
—
|
|
—
|
|
(5,289
|
)
|
—
|
|
(5,289
|
)
|
|||||||
|
Amounts reclassified to Income Taxes
|
—
|
|
2,043
|
|
—
|
|
—
|
|
2,043
|
|
—
|
|
2,043
|
|
|||||||
|
Net current period activity
|
$
|
(154,096
|
)
|
$
|
27,205
|
|
$
|
641
|
|
$
|
1,300
|
|
$
|
(124,950
|
)
|
$
|
(532
|
)
|
$
|
(124,418
|
)
|
|
Balance at December 31, 2015, net of tax
|
$
|
(276,416
|
)
|
$
|
35,353
|
|
$
|
(2,661
|
)
|
$
|
(885
|
)
|
$
|
(244,609
|
)
|
$
|
(23,518
|
)
|
$
|
(221,091
|
)
|
|
Other comprehensive earnings (loss) before reclassifications, net of tax
|
(38,729
|
)
|
(6,022
|
)
|
(2,397
|
)
|
885
|
|
(46,263
|
)
|
906
|
|
(47,169
|
)
|
|||||||
|
Amounts reclassified to Warehousing, marketing and administrative expenses
|
—
|
|
(6,559
|
)
|
—
|
|
—
|
|
(6,559
|
)
|
—
|
|
(6,559
|
)
|
|||||||
|
Amounts reclassified to Income Taxes
|
—
|
|
2,525
|
|
—
|
|
—
|
|
2,525
|
|
—
|
|
2,525
|
|
|||||||
|
Net current period activity
|
$
|
(38,729
|
)
|
$
|
(10,056
|
)
|
$
|
(2,397
|
)
|
$
|
885
|
|
$
|
(50,297
|
)
|
$
|
906
|
|
$
|
(51,203
|
)
|
|
Balance at December 31, 2016, net of tax
|
$
|
(315,145
|
)
|
$
|
25,297
|
|
$
|
(5,058
|
)
|
$
|
—
|
|
$
|
(294,906
|
)
|
$
|
(22,612
|
)
|
$
|
(272,294
|
)
|
|
Other comprehensive earnings (loss) before reclassifications, net of tax
|
75,193
|
|
86,069
|
|
456
|
|
—
|
|
161,718
|
|
3,677
|
|
158,041
|
|
|||||||
|
Amounts reclassified to Warehousing, marketing and administrative expenses
|
17,518
|
|
(10,007
|
)
|
—
|
|
—
|
|
7,511
|
|
—
|
|
7,511
|
|
|||||||
|
Amounts reclassified to Income Taxes
|
—
|
|
(27,932
|
)
|
—
|
|
—
|
|
(27,932
|
)
|
—
|
|
(27,932
|
)
|
|||||||
|
Net current period activity
|
92,711
|
|
48,130
|
|
456
|
|
—
|
|
141,297
|
|
3,677
|
|
137,620
|
|
|||||||
|
Balance at December 31, 2017, net of tax
|
$
|
(222,434
|
)
|
$
|
73,427
|
|
$
|
(4,602
|
)
|
$
|
—
|
|
$
|
(153,609
|
)
|
$
|
(18,935
|
)
|
$
|
(134,674
|
)
|
66
Income tax expense (benefit) consisted of the following (in thousands of dollars):
|
For the Years Ended December 31,
|
|||||||||||
|
2017
|
2016
|
2015
|
|||||||||
|
Current provision:
|
|||||||||||
|
U.S. Federal
|
$
|
248,090
|
|
|
$
|
310,582
|
|
|
$
|
412,545
|
|
|
U.S. State
|
28,693
|
|
|
38,249
|
|
|
49,894
|
|
|||
|
Foreign
|
22,057
|
|
|
25,076
|
|
|
24,087
|
|
|||
|
Total current
|
298,840
|
|
373,907
|
|
486,526
|
|
|||||
|
Deferred tax provision (benefit)
|
14,041
|
|
12,313
|
|
(20,995
|
)
|
|||||
|
Total provision
|
$
|
312,881
|
|
$
|
386,220
|
|
$
|
465,531
|
|
||
Earnings (losses) before income taxes by geographical area consisted of the following (in thousands of dollars):
|
For the Years Ended December 31,
|
|||||||||||
|
2017
|
2016
|
2015
|
|||||||||
|
U.S.
|
$
|
970,892
|
|
|
$
|
1,073,879
|
|
|
$
|
1,203,880
|
|
|
Foreign
|
(35,568
|
)
|
|
(54,821
|
)
|
|
46,825
|
|
|||
|
$
|
935,324
|
|
$
|
1,019,058
|
|
$
|
1,250,705
|
|
|||
67
The income tax effects of temporary differences that gave rise to the net deferred tax (liability) asset as of December 31,
2017 and 2016
were (in thousands of dollars):
|
As of December 31,
|
|||||||
|
2017
|
2016
|
||||||
|
Deferred tax assets:
|
|||||||
|
Inventory
|
$
|
13,641
|
|
$
|
30,030
|
|
|
|
Accrued expenses
|
43,889
|
|
70,021
|
|
|||
|
Accrued employment-related benefits
|
63,029
|
|
124,556
|
|
|||
|
Foreign operating loss carryforwards
|
72,197
|
|
67,350
|
|
|||
|
Tax credit carryforward
|
20,201
|
|
8,625
|
|
|||
|
Other
|
8,350
|
|
13,631
|
|
|||
|
Deferred tax assets
|
221,307
|
|
314,213
|
|
|||
|
Less valuation allowance
|
(83,847
|
)
|
(72,705
|
)
|
|||
|
Deferred tax assets, net of valuation allowance
|
$
|
137,460
|
|
$
|
241,508
|
|
|
|
Deferred tax liabilities:
|
|||||||
|
Property, buildings and equipment
|
(33,342
|
)
|
(75,690
|
)
|
|||
|
Intangibles
|
(119,302
|
)
|
(127,292
|
)
|
|||
|
Software
|
(19,903
|
)
|
(25,431
|
)
|
|||
|
Prepaids
|
(6,109
|
)
|
(11,959
|
)
|
|||
|
Other
|
(3,521
|
)
|
(1,067
|
)
|
|||
|
Deferred tax liabilities
|
(182,177
|
)
|
(241,439
|
)
|
|||
|
Net deferred tax (liability) asset
|
$
|
(44,717
|
)
|
$
|
69
|
|
|
|
The net deferred tax (liability) asset is classified as follows:
|
|||||||
|
Noncurrent assets
|
$
|
22,362
|
|
$
|
64,775
|
|
|
|
Noncurrent liabilities (foreign)
|
(67,079
|
)
|
(64,706
|
)
|
|||
|
Net deferred tax (liability) asset
|
$
|
(44,717
|
)
|
$
|
69
|
|
|
At December 31, 2017,
the Company had $
285
million of net operating loss (NOLs) carryforwards related primarily to foreign operations. Some of the operating loss carryforwards may expire at various dates through 2037. The Company has recorded a valuation allowance, which represents a provision for uncertainty as to the realization of the tax benefits of these carryforwards and deferred tax assets that may not be realized. The Company's valuation allowance changed as follows (in thousands of dollars):
|
For the Years Ended December 31,
|
|||||||
|
2017
|
2016
|
||||||
|
Balance at beginning of period
|
$
|
72,705
|
|
$
|
62,333
|
|
|
|
Increases primarily related to foreign NOLs
|
12,861
|
|
12,174
|
|
|||
|
Releases related to foreign NOLs
|
(8,035
|
)
|
(3,870
|
)
|
|||
|
Other changes, net
|
(4,703
|
)
|
(6,557
|
)
|
|||
|
Increase related to U.S. foreign tax credits
|
11,019
|
|
8,625
|
|
|||
|
Balance at end of period
|
$
|
83,847
|
|
$
|
72,705
|
|
|
68
A reconciliation of income tax expense with federal income taxes at the statutory rate follows (in thousands of dollars):
|
For the Years Ended December 31,
|
|||||||||||
|
2017
|
2016
|
2015
|
|||||||||
|
Federal income tax
|
$
|
327,363
|
|
|
$
|
356,670
|
|
|
$
|
437,746
|
|
|
State income taxes, net of federal income tax benefit
|
19,850
|
|
|
25,993
|
|
|
29,507
|
|
|||
|
Clean energy credit
|
(37,138
|
)
|
(28,670
|
)
|
(13,358
|
)
|
|||||
|
Foreign rate difference
|
9,371
|
|
21,077
|
|
12,041
|
|
|||||
|
U.S. tax legislation impact (see note below)
|
(3,164
|
)
|
—
|
|
—
|
|
|||||
|
Other - net
|
(3,401
|
)
|
|
11,150
|
|
|
(405
|
)
|
|||
|
Income tax expense
|
$
|
312,881
|
|
$
|
386,220
|
|
$
|
465,531
|
|
||
|
Effective tax rate
|
33.5
|
%
|
|
37.9
|
%
|
|
37.2
|
%
|
|||
Clean Energy Credit
In 2015 and 2016, the Company acquired noncontrolling interests in limited liability companies established to produce refined coal. The production and sale of refined coal that results in required emission reductions is eligible for tax credits under Section 45 of the Internal Revenue Code. The Company receives tax credits in proportion to its equity interest. The income tax credits from the investment resulted in a
4.0
,
2.8
and a
1.0
percentage point reduction to the overall effective tax rate for
2017, 2016 and 2015
, respectively.
U.S. Tax Legislation
On
December 22, 2017
, the Tax Cuts and Jobs Act (the Tax Act) was signed into law, which significantly revised the U.S. corporate income tax system by lowering corporate income tax rates from
35%
to
21%
effective January 1, 2018, allowing accelerated expensing of qualified capital investments for a specific period, limiting net interest expense deductions and transitioning the U.S. international taxation from a worldwide to a territorial tax system that requires a one-time transition tax on unremitted earnings of certain foreign subsidiaries that were previously tax deferred, among other changes.
As of December 31, 2017, the Company has not fully completed the accounting for the impact from the Tax Act. However, the Company determined a reasonable estimate of such impact per the guidance in Staff Accounting Bulletin (SAB) 118 issued by the Securities and Exchange Commission (SEC) on December 22, 2017 and recognized a net provisional benefit amount of
$3.2 million
included as a component of income tax expense for the year ended December 31, 2017 and primarily related to deferred tax balances revaluations and one-time transition tax.
The Company remeasured deferred assets and liabilities based on the rates at which they are expected to reverse in the future in consideration of the reduced income tax rates and recognized a net provisional benefit of
$5.2 million
for the year ended December 31, 2017. Certain aspects of the Tax Act cannot be fully completed at this time, mainly the full determination of assets placed in service in September 2017 or after for tax expensing purposes, the comprehensive evaluation of executive compensation contracts for tax deductibility purposes and the understanding of state tax implications. The Company expects to complete this analysis in 2018, which may potentially affect the remeasurement of the related deferred tax amounts.
The Company estimated the one-time transition tax and recognized a net provisional expense of
$2 million
for the year ended December 31, 2017. The one-time transition tax calculation includes a
$47 million
estimated tax obligation related to the Company’s estimated total gross post-1986 earnings and profits (E&P) of
$472 million
that were previously deferred from U.S. income taxes, net of estimated foreign tax credits of
$45 million
. As of December 31, 2017, the Company has not completed its final calculation of the total post-1986 E&P for all foreign subsidiaries and any state tax impact. The amounts may change when the Company finalizes these calculations in 2018.
Foreign Undistributed Earnings
Estimated gross undistributed earnings of foreign subsidiaries at December 31, 2017, amounted to
$472 million
. These gross earnings are included in the U.S. one-time transition tax calculation in 2017 as aforementioned. The Company considers these undistributed earnings permanently reinvested in its foreign operations and is not recording a deferred tax liability for any foreign withholding taxes on such amounts. If at some future date the Company ceases to be
69
permanently reinvested in its foreign subsidiaries, the Company may be subject to foreign withholding and other taxes on these undistributed earnings and may need to record a deferred tax liability for any outside basis difference in its investments in its foreign subsidiaries.
Tax Uncertainties
The Company recognizes in the financial statements a provision for tax uncertainties, resulting from application of complex tax regulations in multiple tax jurisdictions. The changes in the liability for tax uncertainties, excluding interest, are as follows (in thousands of dollars):
|
For the Years Ended December 31,
|
|||||||||||
|
2017
|
2016
|
2015
|
|||||||||
|
Balance at beginning of year
|
$
|
58,681
|
|
$
|
60,576
|
|
$
|
45,126
|
|
||
|
Additions for tax positions related to the current year
|
3,930
|
|
14,119
|
|
14,916
|
|
|||||
|
Additions for tax positions of prior years
|
4,786
|
|
13,215
|
|
2,653
|
|
|||||
|
Reductions for tax positions of prior years
|
(12,417
|
)
|
(14,774
|
)
|
(1,616
|
)
|
|||||
|
Reductions due to statute lapse
|
(5,098
|
)
|
(1,527
|
)
|
(402
|
)
|
|||||
|
Settlements, audit payments, refunds - net
|
(5,215
|
)
|
(12,928
|
)
|
(101
|
)
|
|||||
|
Balance at end of year
|
$
|
44,667
|
|
$
|
58,681
|
|
$
|
60,576
|
|
||
The Company classifies the liability for tax uncertainties in deferred income taxes and tax uncertainties. Included in this amount are $
21 million
and $
22 million
at
December 31, 2017 and 2016, respectively,
of tax positions for which the ultimate deductibility is highly certain but for which there is uncertainty about the timing of such deductibility. Any changes in the timing of deductibility of these items would not affect the annual effective tax rate but would accelerate the payment of cash to the taxing authorities to an earlier period. Excluding the timing items, the remaining amounts would affect the annual tax rate. The changes to tax positions of prior years in
2017
related generally to the impact of expiring statutes, conclusion of audits and audit settlements. The changes to tax positions of prior years in 2016 related generally to the impact of conclusion of audits and audit settlements.
The Company regularly undergoes examination of its federal income tax returns by the Internal Revenue Service (IRS). In 2017, the Company settled the 2011 and 2012 federal audits with the IRS Appeals Office. The statute of limitations expired for the Company's 2013 federal tax return. The tax years 2014 through 2017 are open. The Company is also subject to audit by state, local and foreign taxing authorities.
Tax years 2002-2017 remain subject to state and local audits and 2006-2017 remain subject to foreign audits.
The amount of liability associated with the Company's tax uncertainties may change within the next 12 months due to the pending audit activity, expiring statutes or tax payments. A reasonable estimate of such change cannot be made.
The Company recognizes interest expense and penalties related to its tax uncertainties in the provision for income taxes. For the years ended December 31,
2017, 2016 and 2015
, the Company recognized an expense of approximately
$1 million
for each year. Total accrued interest and penalties related to tax uncertainties as of
December 31, 2017, 2016 and 2015
, were approximately $
5 million
, $
4 million
and $
5 million
, respectively.
70
Certain of the Company’s stock incentive plans grant stock awards that contain nonforfeitable rights to dividends meet the criteria of a participating security. Under the two-class method, earnings are allocated between common stock and participating securities. The presentation of basic and diluted earnings per share is required only for each class of common stock and not for participating securities. As such, the Company presents basic and diluted earnings per share for its one class of common stock.
The two-class method includes an earnings allocation formula that determines earnings per share for each class of common stock according to dividends declared and undistributed earnings for the period. The Company’s reported net earnings are reduced by the amount allocated to participating securities to arrive at the earnings allocated to common stock shareholders for purposes of calculating earnings per share.
The dilutive effect of participating securities is calculated using the more dilutive of the treasury stock or the two-class method. The Company has determined the two-class method to be the more dilutive. As such, the earnings allocated to common stock shareholders in the basic earnings per share calculation is adjusted for the reallocation of undistributed earnings to participating securities to arrive at the earnings allocated to common stock shareholders for calculating the diluted earnings per share.
The following table sets forth the computation of basic and diluted earnings per share under the two-class method (in thousands of dollars, except for share and per share amounts):
|
For the Years Ended December 31,
|
|||||||||||
|
|
2017
|
2016
|
2015
|
||||||||
|
Net earnings attributable to W.W. Grainger, Inc. as reported
|
$
|
585,730
|
|
$
|
605,928
|
|
$
|
768,996
|
|
||
|
Distributed earnings available to participating securities
|
(2,005
|
)
|
(2,383
|
)
|
(2,823
|
)
|
|||||
|
Undistributed earnings available to participating securities
|
(2,678
|
)
|
(3,044
|
)
|
(4,735
|
)
|
|||||
|
Numerator for basic earnings per share - Undistributed and distributed earnings available to common shareholders
|
581,047
|
|
600,501
|
|
761,438
|
|
|||||
|
Undistributed earnings allocated to participating securities
|
2,678
|
|
3,044
|
|
4,735
|
|
|||||
|
Undistributed earnings reallocated to participating securities
|
(2,663
|
)
|
(3,023
|
)
|
(4,692
|
)
|
|||||
|
Numerator for diluted earnings per share - Undistributed and distributed earnings available to common shareholders
|
$
|
581,062
|
|
$
|
600,522
|
|
$
|
761,481
|
|
||
|
Denominator for basic earnings per share – weighted average shares
|
57,674,977
|
|
60,430,892
|
|
65,156,864
|
|
|||||
|
Effect of dilutive securities
|
308,190
|
|
409,038
|
|
608,257
|
|
|||||
|
Denominator for diluted earnings per share – weighted average shares adjusted for dilutive securities
|
57,983,167
|
|
60,839,930
|
|
65,765,121
|
|
|||||
|
Earnings per share two-class method
|
|
|
|
|
|||||||
|
Basic
|
$
|
10.07
|
|
$
|
9.94
|
|
$
|
11.69
|
|
||
|
Diluted
|
$
|
10.02
|
|
$
|
9.87
|
|
$
|
11.58
|
|
||
71
Grainger’s
two
reportable segments are the U.S. and Canada. The U.S. operating segment reflects the results of Grainger's U.S. businesses. The Canada operating segment reflects the results for Acklands-Grainger, Inc. and its subsidiaries. Other businesses include Zoro Tools, Inc. (Zoro), the single channel online business in the U.S., MonotaRO Co. (MonotaRO) in Japan and operations in Europe, Asia and Latin America. These businesses individually do not meet the criteria of a reportable segment. Operating segments generate revenue almost exclusively through the distribution of MRO supplies, as service revenues account for approximately
1%
of total revenues for each operating segment.
The accounting policies of the segments are the same as those described in the summary of significant accounting policies. Intersegment transfer prices are established at external selling prices, less costs not incurred due to a related party sale. The segment results include certain centrally incurred costs for shared services that are charged to the segments based upon the relative level of service used by each operating segment.
Following is a summary of segment results (in thousands of dollars):
|
2017
|
|||||||||||||||
|
United States
|
Canada
|
Other businesses
|
Total
|
||||||||||||
|
Total net sales
|
$
|
7,960,075
|
|
|
$
|
752,900
|
|
|
$
|
2,120,303
|
|
$
|
10,833,278
|
|
|
|
Intersegment net sales
|
(403,824
|
)
|
|
(35
|
)
|
|
(4,561
|
)
|
(408,420
|
)
|
|||||
|
Net sales to external customers
|
7,556,251
|
|
752,865
|
|
2,115,742
|
|
10,424,858
|
|
|||||||
|
Segment operating earnings
|
1,213,138
|
|
|
(76,538
|
)
|
|
55,633
|
|
1,192,233
|
|
|||||
|
|
|
|
|
|
|
|
|
||||||||
|
Segment assets
|
2,309,734
|
|
|
278,633
|
|
|
605,452
|
|
3,193,819
|
|
|||||
|
Depreciation and amortization
|
168,862
|
|
|
18,965
|
|
|
31,016
|
|
218,843
|
|
|||||
|
Additions to long-lived assets
|
$
|
187,384
|
|
|
$
|
7,594
|
|
|
$
|
61,735
|
|
$
|
256,713
|
|
|
|
2016
|
|||||||||||||||
|
United States
|
Canada
|
Other businesses
|
Total
|
||||||||||||
|
Total net sales
|
$
|
7,870,105
|
|
|
$
|
733,829
|
|
|
$
|
1,884,963
|
|
|
$
|
10,488,897
|
|
|
Intersegment net sales
|
(347,468
|
)
|
|
(110
|
)
|
|
(4,115
|
)
|
|
(351,693
|
)
|
||||
|
Net sales to external customers
|
7,522,637
|
|
|
733,719
|
|
|
1,880,848
|
|
|
10,137,204
|
|
||||
|
|
|
|
|
|
|
|
|
|
|
|
|||||
|
Segment operating earnings
|
1,274,851
|
|
|
(65,362
|
)
|
|
40,684
|
|
|
1,250,173
|
|
||||
|
|
|
|
|
|
|
|
|
|
|
|
|||||
|
Segment assets
|
2,275,009
|
|
|
286,035
|
|
|
494,067
|
|
|
3,055,111
|
|
||||
|
Depreciation and amortization
|
159,334
|
|
|
18,050
|
|
|
23,792
|
|
|
201,176
|
|
||||
|
Additions to long-lived assets
|
$
|
153,556
|
|
|
$
|
12,275
|
|
|
$
|
95,288
|
|
|
$
|
261,119
|
|
|
2015
|
|||||||||||||||
|
United States
|
Canada
|
Other businesses
|
Total
|
||||||||||||
|
Total net sales
|
$
|
7,963,416
|
|
|
$
|
890,530
|
|
|
$
|
1,405,750
|
|
|
$
|
10,259,696
|
|
|
Intersegment net sales
|
(282,305
|
)
|
|
(105
|
)
|
|
(3,902
|
)
|
|
(286,312
|
)
|
||||
|
Net sales to external customers
|
7,681,111
|
|
|
890,425
|
|
|
1,401,848
|
|
|
9,973,384
|
|
||||
|
|
|
|
|
|
|
|
|
|
|
|
|||||
|
Segment operating earnings
|
1,371,626
|
|
|
27,368
|
|
|
48,051
|
|
|
1,447,045
|
|
||||
|
|
|
|
|
|
|
|
|
|
|
|
|||||
|
Segment assets
|
2,191,045
|
|
|
317,504
|
|
|
507,116
|
|
|
3,015,665
|
|
||||
|
Depreciation and amortization
|
150,654
|
|
|
17,334
|
|
|
19,999
|
|
|
187,987
|
|
||||
|
Additions to long-lived assets
|
$
|
302,316
|
|
|
$
|
20,464
|
|
|
$
|
21,135
|
|
|
$
|
343,915
|
|
72
Following are reconciliations of the segment information with the consolidated totals per the financial statements (in thousands of dollars):
|
2017
|
2016
|
2015
|
|||||||||
|
Operating earnings:
|
|||||||||||
|
Total operating earnings for reportable segments
|
$
|
1,192,233
|
|
|
$
|
1,250,173
|
|
|
$
|
1,447,045
|
|
|
Unallocated expenses
|
(143,571
|
)
|
|
(130,676
|
)
|
|
(146,725
|
)
|
|||
|
Total consolidated operating earnings
|
$
|
1,048,662
|
|
|
$
|
1,119,497
|
|
|
$
|
1,300,320
|
|
|
Assets:
|
|
|
|
|
|
|
|
|
|||
|
Assets for reportable segments
|
$
|
3,193,819
|
|
|
$
|
3,055,111
|
|
|
$
|
3,015,665
|
|
|
Other current and noncurrent assets
|
2,428,074
|
|
|
2,464,656
|
|
|
2,624,966
|
|
|||
|
Unallocated assets
|
182,361
|
|
|
174,540
|
|
|
217,124
|
|
|||
|
Total consolidated assets
|
$
|
5,804,254
|
|
|
$
|
5,694,307
|
|
|
$
|
5,857,755
|
|
|
2017
|
|||||||||||
|
Segment
Totals
|
Unallocated
|
Consolidated Total
|
|||||||||
|
Other significant items:
|
|||||||||||
|
Depreciation and amortization
|
$
|
218,843
|
|
|
$
|
21,819
|
|
|
$
|
240,662
|
|
|
Additions to long-lived assets
|
$
|
256,713
|
|
|
$
|
5,283
|
|
|
$
|
261,996
|
|
|
Revenues
|
Long-Lived Assets
|
||||||||||
|
Geographic information:
|
|||||||||||
|
United States
|
$
|
7,948,291
|
|
|
$
|
1,097,543
|
|
||||
|
Canada
|
761,065
|
|
|
199,660
|
|
||||||
|
Other foreign countries
|
1,715,502
|
|
|
246,700
|
|
||||||
|
$
|
10,424,858
|
|
|
$
|
1,543,903
|
|
|||||
|
2016
|
|||||||||||
|
Segment
Totals
|
Unallocated
|
Consolidated Total
|
|||||||||
|
Other significant items:
|
|||||||||||
|
Depreciation and amortization
|
$
|
201,176
|
|
|
$
|
21,469
|
|
|
$
|
222,645
|
|
|
Additions to long-lived assets
|
$
|
261,119
|
|
|
$
|
10,542
|
|
|
$
|
271,661
|
|
|
Revenues
|
Long-Lived Assets
|
||||||||||
|
Geographic information:
|
|||||||||||
|
United States
|
$
|
7,834,361
|
|
|
$
|
1,134,817
|
|
||||
|
Canada
|
739,687
|
|
|
210,931
|
|
||||||
|
Other foreign countries
|
1,563,156
|
|
|
210,605
|
|
||||||
|
$
|
10,137,204
|
|
|
$
|
1,556,353
|
|
|||||
73
|
2015
|
|||||||||||
|
Segment
Totals
|
Unallocated
|
Consolidated Total
|
|||||||||
|
Other significant items:
|
|||||||||||
|
Depreciation and amortization
|
$
|
187,987
|
|
|
$
|
18,854
|
|
|
$
|
206,841
|
|
|
Additions to long-lived assets
|
$
|
343,915
|
|
|
$
|
16,912
|
|
|
$
|
360,827
|
|
|
Revenues
|
Long-Lived Assets
|
||||||||||
|
Geographic information:
|
|||||||||||
|
United States
|
$
|
7,866,300
|
|
|
$
|
1,231,083
|
|
||||
|
Canada
|
897,431
|
|
|
215,202
|
|
||||||
|
Other foreign countries
|
1,209,653
|
|
|
153,508
|
|
||||||
|
$
|
9,973,384
|
|
|
$
|
1,599,793
|
|
|||||
Revenues are attributed to countries based on the ship-to location of the customer.
Unallocated expenses and unallocated assets primarily relate to the Company headquarters' support services, which are not part of any business segment, as well as intercompany eliminations. Unallocated expenses include payroll and benefits, depreciation and other costs associated with headquarters-related support services. Unallocated assets include non-operating cash and cash equivalents, certain prepaid expenses and property, buildings and equipment-net.
Assets for reportable segments include net accounts receivable and first-in, first-out inventory, which are reported to the Company's Chief Operating Decision Maker. Long-lived assets consist of property, buildings, equipment and capitalized software.
Depreciation and amortization presented above includes depreciation of long-lived assets and amortization of capitalized software.
From time to time the Company is involved in various legal and administrative proceedings that are incidental to its business, including claims related to product liability, general negligence, contract disputes, environmental issues, unclaimed property, wage and hour laws, intellectual property, employment practices, regulatory compliance or other matters and actions brought by employees, consumers, competitors, suppliers or governmental entities. As a government contractor selling to federal, state and local governmental entities, the Company is also subject to governmental or regulatory inquiries or audits or other proceedings, including those related to contract administration or to pricing compliance. It is not expected that the ultimate resolution of any of these matters will have, either individually or in the aggregate, a material adverse effect on the Company's consolidated financial position or results of operations.
From time to time, the Company has also been named, along with numerous other nonaffiliated companies, as a defendant in litigation in various states involving asbestos and/or silica. These lawsuits typically assert claims of personal injury arising from alleged exposure to asbestos and/or silica as a consequence of products manufactured by third parties purportedly distributed by the Company. While several lawsuits have been dismissed in the past based on the lack of product identification, if a specific product distributed by the Company is identified in any pending or future lawsuits, the Company will seek to exercise indemnification remedies against the product manufacturer to the extent available. In addition, the Company believes that a substantial number of these claims are covered by insurance. The Company has entered into agreements with its major insurance carriers relating to the scope and coverage, and the costs of defense, of lawsuits involving claims of exposure to asbestos.
The Company believes it has strong legal and factual defenses and intends to continue defending itself vigorously in these lawsuits. While the Company is unable to predict the outcome of these proceedings, it believes that the ultimate resolution will not have, either individually or in the aggregate, a material adverse effect on the Company’s consolidated financial position or results of operations.
74
A summary of selected quarterly information for
2017 and 2016
is as follows (in thousands of dollars, except for per share amounts):
|
2017 Quarter Ended
|
||||||||||||||||||||
|
March 31
|
June 30
|
September 30
|
|
December 31
|
|
Total
|
||||||||||||||
|
Net sales
|
$
|
2,541,129
|
|
$
|
2,615,269
|
|
$
|
2,635,999
|
|
$
|
2,632,461
|
|
$
|
10,424,858
|
|
|||||
|
Cost of merchandise sold
|
1,521,937
|
|
1,575,313
|
|
1,618,819
|
|
1,611,232
|
|
6,327,301
|
|
||||||||||
|
Gross profit
|
1,019,192
|
|
1,039,956
|
|
1,017,180
|
|
1,021,229
|
|
4,097,557
|
|
||||||||||
|
Warehousing, marketing and
administrative expenses
|
723,704
|
|
807,891
|
|
736,010
|
|
781,290
|
|
3,048,895
|
|
||||||||||
|
Operating earnings
|
295,488
|
|
232,065
|
|
281,170
|
|
239,939
|
|
1,048,662
|
|
||||||||||
|
Net earnings attributable to W.W. Grainger, Inc.
|
174,744
|
|
97,921
|
|
162,006
|
|
151,059
|
|
585,730
|
|
||||||||||
|
Earnings per share - basic
|
2.95
|
|
1.68
|
|
2.80
|
|
2.64
|
|
10.07
|
|
||||||||||
|
Earnings per share - diluted
|
$
|
2.93
|
|
$
|
1.67
|
|
$
|
2.79
|
|
$
|
2.63
|
|
$
|
10.02
|
|
|||||
|
2016 Quarter Ended
|
||||||||||||||||||||
|
March 31
|
June 30
|
September 30
|
December 31
|
Total
|
||||||||||||||||
|
Net sales
|
$
|
2,506,538
|
|
$
|
2,563,668
|
|
$
|
2,596,288
|
|
$
|
2,470,710
|
|
$
|
10,137,204
|
|
|||||
|
Cost of merchandise sold
|
1,461,485
|
|
1,523,609
|
|
1,556,536
|
|
1,481,017
|
|
6,022,647
|
|
||||||||||
|
Gross profit
|
1,045,053
|
|
1,040,059
|
|
1,039,752
|
|
989,693
|
|
4,114,557
|
|
||||||||||
|
Warehousing, marketing and
administrative expenses
|
727,961
|
|
734,470
|
|
717,165
|
|
815,464
|
|
2,995,060
|
|
||||||||||
|
Operating earnings
|
317,092
|
|
305,589
|
|
322,587
|
|
174,229
|
|
1,119,497
|
|
||||||||||
|
Net earnings attributable to W.W. Grainger, Inc.
|
186,713
|
|
172,676
|
|
185,873
|
|
60,666
|
|
605,928
|
|
||||||||||
|
Earnings per share - basic
|
3.00
|
|
2.81
|
|
3.07
|
|
1.02
|
|
9.94
|
|
||||||||||
|
Earnings per share - diluted
|
$
|
2.98
|
|
$
|
2.79
|
|
$
|
3.05
|
|
$
|
1.01
|
|
$
|
9.87
|
|
|||||
75
SIGNATURES
Pursuant to the requirements of Section 13 or 15(d) of the Securities Exchange Act of 1934, the registrant has duly caused this report to be signed on its behalf by the undersigned, thereunto duly authorized.
DATE: February 26, 2018
|
W.W. GRAINGER, INC.
|
|
|
By:
|
/s/ D.G. Macpherson
|
|
D.G. Macpherson
|
|
|
Chairman and Chief Executive Officer
|
|
Pursuant to the requirements of the Securities Exchange Act of 1934, this report has been signed below by the following persons on behalf of Grainger on February 26, 2018, in the capacities indicated.
|
/s/ D.G. Macpherson
|
/s/ Brian P. Anderson
|
|
|
D.G. Macpherson
|
Brian P. Anderson
|
|
|
Chairman and Chief Executive Officer, Director
|
Director
|
|
|
(Principal Executive Officer)
|
||
|
/s/ V. Ann Hailey
|
||
|
/s/ Ronald L. Jadin
|
V. Ann Hailey
|
|
|
Ronald L. Jadin
|
Director
|
|
|
Senior Vice President
|
||
|
and Chief Financial Officer
|
/s/ Neil S. Novich
|
|
|
(Principal Financial Officer)
|
Neil S. Novich
|
|
|
Director
|
||
|
/s/ Eric R. Tapia
|
||
|
Eric R. Tapia
|
/s/ E. Scott Santi
|
|
|
Vice President and Controller
|
E. Scott Santi
|
|
|
(Principal Accounting Officer)
|
Director
|
|
|
/s/ Lucas E. Watson
|
||
|
Lucas E. Watson
|
||
|
Director
|
||
76
|
EXHIBIT INDEX (1)
|
||
|
EXHIBIT NO.
|
DESCRIPTION
|
|
|
Underwriting Agreement, dated as of May 15, 2017, among W.W. Grainger, Inc. and Morgan Stanley & Co. LLC, J.P. Morgan Securities LLC and U.S. Bancorp Investments, Inc., as representatives of the underwriters named therein, incorporated by reference to Exhibit 1.1 to W.W. Grainger, Inc.’s Current Report on Form 8-K dated May 22, 2017.
|
||
|
Share Purchase Agreement, dated as of July 30, 2015, by and among Grainger, GWW UK Holdings Limited, Gregory Family Office Limited and Michael Gregory, incorporated by reference to Exhibit 2.1 to W.W. Grainger, Inc.’s Current Report on Form 8-K dated July 31, 2015.
|
||
|
Restated Articles of Incorporation, incorporated by reference to Exhibit 3(i) to W.W. Grainger, Inc.’s Quarterly Report on Form 10-Q for the quarter ended June 30, 1998.
|
||
|
By-laws, as amended on March 9, 2017, incorporated by reference to Exhibit 3.1.1 to W.W. Grainger, Inc.’s Current Report on Form 8-K dated March 9, 2017.
|
||
|
4.1
|
No instruments which define the rights of holders of W.W. Grainger, Inc.’s Industrial Development Revenue Bonds are filed herewith, pursuant to the exemption contained in Regulation S-K, Item 601(b)(4)(iii). W.W. Grainger, Inc. hereby agrees to furnish to the Securities and Exchange Commission, upon request, a copy of any such instrument.
|
|
|
Indenture, dated as of June 11, 2015, between W.W. Grainger, Inc. and U.S. Bank National Association, as trustee, incorporated by reference to Exhibit 4.1 to W.W. Grainger, Inc.’s Current Report on Form 8-K dated June 11, 2015.
|
||
|
First Supplemental Indenture, dated as of June 11, 2015, between W.W. Grainger, Inc. and U.S. Bank National Association, as trustee, and Form of 4.60% Senior Notes due 2045, incorporated by reference to Exhibit 4.2 to W.W. Grainger, Inc.’s Current Report on Form 8-K dated June 11, 2015.
|
||
|
Second Supplemental Indenture, dated as of May 16, 2016, between W.W. Grainger, Inc., and U.S. Bank National Association, as trustee, incorporated by reference to Exhibit 4.1 to W.W. Grainger, Inc.’s Current Report on Form 8-K dated May 16, 2016.
|
||
|
Third Supplemental Indenture, dated as of May 22, 2017, between W.W. Grainger, Inc., and U.S. Bank National Association, as trustee, incorporated by reference to Exhibit 4.1 to W.W. Grainger, Inc.’s Current Report on Form 8-K dated May 22, 2017.
|
||
|
Form of 3.75% Senior Notes due 2046 (included in Exhibit 4.4), incorporated by reference to Exhibit 4.2 to W.W. Grainger, Inc.’s Current Report on Form 8-K dated May 16, 2016.
|
||
|
Form of 4.20% Senior Notes due 2047 (included in Exhibit 4.5), incorporated by reference to Exhibit 4.2 to W.W. Grainger, Inc.’s Current Report on Form 8-K dated May 22, 2017.
|
||
|
1990 Long-Term Stock Incentive Plan, as amended, incorporated by reference to Exhibit 10(a) to W.W. Grainger, Inc.’s Quarterly Report on Form 10-Q for the quarter ended June 30, 2006.*
|
||
|
Form of Indemnification Agreement between W.W. Grainger, Inc. and each of its directors and certain of its executive officers, incorporated by reference to Exhibit 10(b)(i) to W.W. Grainger, Inc.’s Quarterly Report on Form 10-Q for the quarter ended March 31, 2009.*
|
||
|
Frozen Executive Death Benefit Plan, as amended, incorporated by reference to Exhibit 10(b)(v) to W.W. Grainger, Inc.’s Annual Report on Form 10-K for the year ended December 31, 2007.*
|
||
|
First amendment to the Frozen Executive Death Benefit Plan, incorporated by reference to Exhibit 10(b)(v)(1) to W.W. Grainger, Inc.’s Annual Report on Form 10-K for the year ended December 31, 2008.*
|
||
|
Second amendment to the Frozen Executive Death Benefit Plan, incorporated by reference to Exhibit 10(b)(iv)(2) to W.W. Grainger, Inc.’s Annual Report on Form 10-K for the year ended December 31, 2009.*
|
||
|
Supplemental Profit Sharing Plan, as amended, incorporated by reference to Exhibit 10(viii) to W.W. Grainger, Inc.’s Annual Report on Form 10-K for the year ended December 31, 2003.*
|
||
|
Supplemental Profit Sharing Plan II, as amended, incorporated by reference to Exhibit 10(b)(ix) to W.W. Grainger, Inc.’s Annual Report on Form 10-K for the year ended December 31, 2007.*
|
||
|
Voluntary Salary and Incentive Deferral Plan, as amended, incorporated by reference to Exhibit 10(b)(xi) to W.W. Grainger, Inc.’s Annual Report on Form 10-K for the year ended December 31, 2007.*
|
||
|
Summary Description of the 2016 Directors Compensation Program incorporated by reference to Exhibit 10.12 to W.W. Grainger, Inc.'s Annual Report on Form 10-K for the year ended December 31, 2016.*
|
||
77
|
2005 Incentive Plan, as amended, incorporated by reference to Exhibit 10(d) to W.W. Grainger, Inc.’s Quarterly Report on Form 10-Q for the quarter ended June 30, 2006.*
|
||
|
2010 Incentive Plan, incorporated by reference to Exhibit B of W.W. Grainger, Inc.’s Proxy Statement dated March 12, 2010.*
|
||
|
Form of Stock Option Award Agreement between W.W. Grainger, Inc. and certain of its executive officers, incorporated by reference to Exhibit 10(xiv) to W.W. Grainger, Inc.’s Annual Report on Form 10-K for the year ended December 31, 2005.*
|
||
|
Form of Stock Option Award and Restricted Stock Unit Agreement between W.W. Grainger, Inc. and certain of its executive officers, incorporated by reference to Exhibit 10(xv) to W.W. Grainger, Inc.’s Annual Report on Form 10-K for the year ended December 31, 2005.*
|
||
|
Form of Stock Option Award Agreement between W.W. Grainger, Inc. and certain of its executive officers, incorporated by reference to Exhibit 10(b)(xvi) to W.W. Grainger, Inc.’s Annual Report on Form 10-K for the year ended December 31, 2009.*
|
||
|
Form of Stock Option Award and Restricted Stock Unit Agreement between W.W. Grainger, Inc. and certain of its executive officers, incorporated by reference to Exhibit 10(b)(xvii) to W.W. Grainger, Inc.’s Annual Report on Form 10-K for the year ended December 31, 2009.*
|
||
|
Form of Restricted Stock Unit Agreement between W.W. Grainger, Inc. and certain of its executive officers, incorporated by reference to Exhibit 10(b)(xviii) to W.W. Grainger, Inc.’s Annual Report on Form 10-K for the year ended December 31, 2010.*
|
||
|
Form of 2012 Performance Share Award Agreement between W.W. Grainger, Inc. and certain of its executive officers, incorporated by reference to Exhibit 10(b)(xix) to W.W. Grainger, Inc.’s Annual Report on Form 10-K for the year ended December 31, 2012.*
|
||
|
Summary Description of the 2018 Management Incentive Program.*
|
||
|
Incentive Program Recoupment Agreement, incorporated by reference to Exhibit 10(b)(xxv) to W.W. Grainger, Inc.’s Annual Report on Form 10-K for the year ended December 31, 2009.*
|
||
|
Form of Change in Control Employment Agreement between W.W. Grainger, Inc. and certain of its executive officers, incorporated by reference to Exhibit 10(b)(xxvii) to W.W. Grainger, Inc.’s Annual Report on Form 10-K for the year ended December 31, 2010.*
|
||
|
Form of 2013 Performance Share Award Agreement between Grainger and certain of its executive officers, incorporated by reference to Exhibit 10(b)(xxiii) to Grainger's Annual Report on Form 10-K for the year ended December 31, 2013.*
|
||
|
Form of 2014 Performance Share Award Agreement between W.W. Grainger, Inc. and certain of its executive officers, incorporated by reference to Exhibit 10(b)(xxiv) to Grainger's Annual Report on Form 10-K for the year ended December 31, 2014.*
|
||
|
Form of 2015 Performance Share Award Agreement between W.W. Grainger, Inc. and certain of its executive officers, incorporated by reference to Exhibit 10.28 to W.W. Grainger, Inc.'s Annual Report on Form 10-K for the year ended December 31, 2015.*
|
||
|
W.W. Grainger, Inc. 2015 Incentive Plan, incorporated by reference to Exhibit B of W.W. Grainger, Inc.’s Proxy Statement dated March 13, 2015.*
|
||
|
First Amendment to the W.W. Grainger, Inc. 2015 Incentive Plan, incorporated by reference to 10.1 of W.W. Grainger, Inc.’s Quarterly Report on Form 10-Q for the quarter ended March 31, 2017.*
|
||
|
Separation Agreement and General Release by and between W.W. Grainger, Inc. and Court Carruthers dated July 22, 2015, incorporated by reference to Exhibit 10(b)(i) to W.W. Grainger, Inc.’s Quarterly Report on Form 10-Q for the quarter ended June 30, 2015.*
|
||
|
£180,000,000 Facilities Agreement, dated as of August 26, 2015, by and among GWW UK Holdings Ltd, W.W. Grainger, Inc., the lender parties thereto, Lloyds Bank PLC and Lloyds Securities Inc., as Arrangers, and Lloyds Bank PLC, as Agent, incorporated by reference to W.W. Grainger, Inc.’s Current Report on Form 8-K dated September 1, 2015.
|
||
|
Form of Stock Option Award Agreement between W.W. Grainger, Inc. and certain of its executive officers, incorporated by reference to Exhibit 10.1 to W.W. Grainger, Inc.’s Quarterly Report on Form 10-Q for the quarter ended June 30, 2016.*
|
||
|
Form of Restricted Stock Unit Award Agreement between W.W. Grainger, Inc. and certain of its executive officers, incorporated by reference to Exhibit 10.2 to W.W. Grainger, Inc.’s Quarterly Report on Form 10-Q for the quarter ended June 30, 2016.*
|
||
|
Form of 2016 Performance Share Award Agreement between W.W. Grainger, Inc. and certain of its executive officers, incorporated by reference to Exhibit 10.3 to W.W. Grainger, Inc.’s Quarterly Report on Form 10-Q for the quarter ended June 30, 2016.*
|
||
|
Form of Stock Option Award Agreement between W.W. Grainger, Inc. and certain of its executive officers, incorporated by reference to Exhibit 10.2 to W.W. Grainger, Inc.’s Quarterly Report on Form 10-Q for the quarter ended March 31, 2017.*
|
||
78
|
Form of Restricted Stock Unit Award Agreement between W.W. Grainger, Inc. and certain of its executive officers, incorporated by reference to Exhibit 10.3 to W.W. Grainger, Inc.’s Quarterly Report on Form 10-Q for the quarter ended March 31, 2017.*
|
||
|
Form of 2017 Performance Share Award Agreement between W.W. Grainger, Inc. and certain of its executive officers, incorporated by reference to Exhibit 10.4 to W.W. Grainger, Inc.’s Quarterly Report on Form 10-Q for the quarter ended March 31, 2017.*
|
||
|
Credit Agreement dated as of October 6, 2017, by and among W.W. Grainger, Inc., the lenders parties thereto, and U.S. Bank National Association, as Administrative Agent, incorporated by reference to Exhibit 10.1 to W.W. Grainger, Inc.’s Current Report on Form 8-K dated October 6, 2017.
|
||
|
Subsidiaries of Grainger.
|
||
|
Consent of Independent Registered Public Accounting Firm.
|
||
|
Certification of Principal Executive Officer pursuant to Section 302 of the Sarbanes-Oxley Act of 2002.
|
||
|
Certification of Principal Financial Officer pursuant to Section 302 of the Sarbanes-Oxley Act of 2002.
|
||
|
Certification of Principal Executive Officer and Principal Financial Officer pursuant to 18 U.S.C. Section 1350, as adopted pursuant to Section 906 of the Sarbanes-Oxley Act of 2002.
|
||
|
101.INS
|
XBRL Instance Document.
|
|
|
101.SCH
|
XBRL Taxonomy Extension Schema Document.
|
|
|
101.CAL
|
XBRL Taxonomy Extension Calculation Linkbase Document.
|
|
|
101.DEF
|
XBRL Taxonomy Extension Definition Linkbase Document.
|
|
|
101.LAB
|
XBRL Taxonomy Extension Label Linkbase Document.
|
|
|
101.PRE
|
XBRL Taxonomy Extension Presentation Linkbase Document.
|
|
|
(*) Management contract or compensatory plan or arrangement.
|
||
|
(1) Certain instruments defining the rights of holders of long-term debt securities of the Registrant are omitted pursuant to Item 601(b)(4)(iii) of Regulation S-K. The Registrant hereby undertakes to furnish to the SEC, upon request, copies of any such instruments.
|
||
79
TABLE OF CONTENTS
Part IItem 1: BusinessItem 1A: Risk FactorsItem 1B: Unresolved Staff CommentsItem 2: PropertiesItem 3: Legal ProceedingsItem 4: Mine Safety DisclosuresItem 4A: Executive Officers Of The RegistrantPart IIItem 5: Market For Registrant S Common Equity, Related Shareholder Matters and Issuer Purchases Of Equity SecuritiesItem 6: Selected Financial DataItem 7: Management S Discussion and Analysis Of Financial Condition and Results Of OperationsItem 7A: Quantitative and Qualitative Disclosures About Market RiskItem 8: Financial Statements and Supplementary DataItem 9: Changes in and Disagreements with Accountants on Accounting and Financial DisclosureItem 9A: Controls and ProceduresItem 9B: Information Required To Be Disclosed in A Form 8-kPart IIIItem 10: Directors, Executive Officers and Corporate GovernanceItem 11: Executive CompensationItem 12: Directors and Executive OfficersItem 13: Certain Relationships and Related TransactionsItem 14: Principal Accountant Fees and ServicesPart IVItem 15: Exhibits and Financial Statements SchedulesNote 1 - Summary Of Significant Accounting PoliciesNote 2 - Business AcquisitionsNote 3 - Goodwill and Other Intangible AssetsNote 4 - Allowance For Doubtful AccountsNote 5 - InventoriesNote 6 - Restructuring ReservesNote 7 - Short-term DebtNote 8 - Long-term DebtNote 9 - Employee BenefitsNote 10 - LeasesNote 11 - Stock Incentive PlansNote 12 - Capital StockNote 13 - Accumulated Other Comprehensive Earnings (losses) (aoce)Note 14 - Income TaxesNote 15 - Earnings Per ShareNote 16 - Segment InformationNote 17 - Contingencies and Legal MattersNote 18 - Selected Quarterly Financial Data (unaudited)