HYATT HOTELS CORP
10-Ks and 10-Qs
|
|
|
|
|
|
|
|
|
|
|
|
|
|
|
|
|
|
|
|
|
|
|
|
|
|
|
|
|
|
|
|
|
|
|
|
|
|
|
|
|
|
|
|
|
|
|
|
|
|
|
|
|
|
|
|
UNITED STATES
SECURITIES AND EXCHANGE COMMISSION
Washington, DC 20549
Form 10-K
(Mark One)
|
þ
|
ANNUAL REPORT PURSUANT TO SECTION 13 OR 15(d) OF THE SECURITIES EXCHANGE ACT OF 1934
|
For the fiscal year ended
December 31, 2016
|
¨
|
TRANSITION REPORT PURSUANT TO SECTION 13 OR 15(d) OF THE SECURITIES EXCHANGE ACT OF 1934
|
For the transition period from to
Commission File No. 001-34521
HYATT HOTELS CORPORATION
(Exact Name of Registrant as Specified in Its Charter)
|
Delaware
|
20-1480589
|
|
(State or Other Jurisdiction of
Incorporation or Organization)
|
(IRS Employer
Identification No.)
|
|
71 South Wacker Drive,
12th Floor, Chicago, Illinois
|
60606
|
|
(Address of Principal Executive Offices)
|
(Zip Code)
|
Securities registered pursuant to Section 12(b) of the Act:
|
Title of Each Class
|
Name of Each Exchange on Which Registered
|
|
Class A Common Stock, $0.01 par value
|
New York Stock Exchange
|
Securities registered pursuant to Section 12(g) of the Act: None
Indicate by check mark if the registrant is a well-known seasoned issuer, as defined in Rule 405 of the Securities Act. Yes
þ
No
¨
Indicate by check mark if the registrant is not required to file reports pursuant to Section 13 or Section 15(d) of the Act. Yes
¨
No
þ
Indicate by check mark whether the registrant: (1) has filed all reports required to be filed by Section 13 or 15(d) of the Securities Exchange Act of 1934 during the preceding 12 months (or for such shorter period that the registrant was required to file such reports), and (2) has been subject to such filing requirements for the past 90 days. Yes
þ
No
¨
Indicate by check mark whether the registrant has submitted electronically and posted on its corporate Web site, if any, every Interactive Data File required to be submitted and posted pursuant to Rule 405 of Regulation S-T (§ 232.405 of this chapter) during the preceding 12 months (or for such shorter period that the registrant was required to submit and post such files). Yes
þ
No
¨
Indicate by check mark if disclosure of delinquent filers pursuant to Item 405 of Regulation S-K is not contained herein, and will not be contained, to the best of the registrant's knowledge, in definitive proxy or information statements incorporated by reference in Part III of this Form 10-K or any amendment to this Form 10-K.
¨
Indicate by check mark whether the registrant is a large accelerated filer, an accelerated filer, a non-accelerated filer, or a smaller reporting company. See definitions of "large accelerated filer," "accelerated filer" and "smaller reporting company" in Rule 12b-2 of the Exchange Act
|
Large accelerated filer
þ
|
Accelerated filer
¨
|
|
Non-accelerated filer
¨
|
Smaller reporting company
¨
|
Indicate by check mark whether the registrant is a shell company (as defined in Rule 12b-2 of the Act). Yes
¨
No
þ
As of
June 30, 2016
, the aggregate market value of the registrant's Class A common stock, $0.01 par value, held by non-affiliates of the registrant was approximately
$1,123.1 million
(based upon the closing sale price of the Class A common stock on
June 30, 2016
on The New York Stock Exchange). The market value of the registrant's Class B common stock is not included in the above value as there is no active market for such stock.
As of
January 31, 2017
, there were
39,707,321
shares of the registrant's Class A common stock, $0.01 par value, outstanding and
90,863,209
shares of the registrant's Class B common stock, $0.01 par value, outstanding.
DOCUMENTS INCORPORATED BY REFERENCE
Part III of this Annual Report on Form 10-K incorporates by reference portions of the registrant's Proxy Statement for its 2017 Annual Meeting of Stockholders to be held on May 17, 2017.
HYATT HOTELS CORPORATION
TABLE OF CONTENTS
FISCAL YEAR ENDED
DECEMBER 31, 2016
|
|
PART I
|
|
|
|
|
|||
|
Item 1.
|
|||
|
Item 1A.
|
|||
|
Item 1B.
|
|||
|
Item 2.
|
|||
|
Item 3.
|
|||
|
Item 4.
|
|||
|
|
|||
|
|
PART II
|
|
|
|
Item 5.
|
|||
|
Item 6.
|
|||
|
Item 7.
|
|||
|
Item 7A.
|
|||
|
Item 8.
|
|||
|
Item 9.
|
|||
|
Item 9A.
|
|||
|
Item 9B.
|
|||
|
|
PART III
|
|
|
|
Item 10.
|
|||
|
Item 11.
|
|||
|
Item 12.
|
|||
|
Item 13.
|
|||
|
Item 14.
|
|||
|
|
PART IV
|
||
|
Item 15.
|
|||
|
Item 16.
|
|||
Disclosure Regarding Forward-Looking Statements
This annual report contains "forward-looking statements" within the meaning of the Private Securities Litigation Reform Act of 1995. These statements include statements about the Company's plans, strategies, financial performance, prospects or future events and involve known and unknown risks that are difficult to predict. As a result, our actual results, performance or achievements may differ materially from those expressed or implied by these forward-looking statements. In some cases, you can identify forward-looking statements by the use of words such as "may," "could," "expect," "intend," "plan," "seek," "anticipate," "believe," "estimate," "predict," "potential," "continue," "likely," "will," "would" and variations of these terms and similar expressions, or the negative of these terms or similar expressions. Such forward-looking statements are necessarily based upon estimates and assumptions that, while considered reasonable by us and our management, are inherently uncertain. Factors that may cause actual results to differ materially from current expectations include, but are not limited to:
|
•
|
the factors discussed in this annual report set forth under the sections titled "Risk Factors" in Part I, Item 1A, and "Management's Discussion and Analysis of Financial Condition and Results of Operations" in Part II, Item 7;
|
|
•
|
general economic uncertainty in key global markets and a worsening of global economic conditions or low levels of economic growth;
|
|
•
|
the rate and the pace of economic recovery following economic downturns;
|
|
•
|
levels of spending in business and leisure segments as well as consumer confidence;
|
|
•
|
declines in occupancy and average daily rate ("ADR");
|
|
•
|
limited visibility with respect to future bookings;
|
|
•
|
loss of key personnel;
|
|
•
|
hostilities, or fear of hostilities, including future terrorist attacks, that affect travel;
|
|
•
|
travel-related accidents;
|
|
•
|
natural or man-made disasters such as earthquakes, tsunamis, tornados, hurricanes, floods, oil spills, nuclear incidents and global outbreaks of pandemics or contagious diseases or fear of such outbreaks;
|
|
•
|
our ability to successfully achieve certain levels of operating profits at hotels that have performance guarantees in favor of our third-party owners;
|
|
•
|
the impact of hotel renovations;
|
|
•
|
risks associated with our capital allocation plans and common stock repurchase program, including the risk that our common stock repurchase program could increase volatility and fail to enhance stockholder value;
|
|
•
|
the seasonal and cyclical nature of the real estate and hospitality businesses;
|
|
•
|
changes in distribution arrangements, such as through internet travel intermediaries;
|
|
•
|
changes in the tastes and preferences of our customers;
|
|
•
|
relationships with colleagues and labor unions and changes in labor laws;
|
|
•
|
the financial condition of, and our relationships with, third-party property owners, franchisees and hospitality venture partners;
|
|
•
|
the possible inability of third-party owners, franchisees or development partners to access capital necessary to fund current operations or implement our plans for growth;
|
|
•
|
risks associated with potential acquisitions and dispositions and the introduction of new brand concepts;
|
|
•
|
the timing of acquisitions and dispositions;
|
|
•
|
failure to successfully complete proposed transactions (including the failure to satisfy closing conditions or obtain required approvals);
|
|
•
|
unforeseen terminations of our management or franchise agreements;
|
|
•
|
changes in federal, state, local or foreign tax law;
|
|
•
|
increases in interest rates and operating costs;
|
|
•
|
foreign exchange rate fluctuations or currency restructurings;
|
|
•
|
lack of acceptance of new brands or innovation;
|
|
•
|
general volatility of the capital markets and our ability to access such markets;
|
|
•
|
changes in the competitive environment in our industry, including as a result of industry consolidation, and the markets where we operate;
|
|
•
|
our ability to successfully implement our new global loyalty program, World of Hyatt, and the level of acceptance of the new program by our guests;
|
1
|
•
|
cyber incidents and information technology failures;
|
|
•
|
outcomes of legal or administrative proceedings; and
|
|
•
|
violations of regulations or laws related to our franchising business.
|
These factors are not necessarily all of the important factors that could cause our actual results, performance or achievements to differ materially from those expressed in or implied by any of our forward-looking statements. Other unknown or unpredictable factors also could harm our business, financial condition, results of operations or cash flows. All forward-looking statements attributable to us or persons acting on our behalf are expressly qualified in their entirety by the cautionary statements set forth above. Forward-looking statements speak only as of the date they are made, and we do not undertake or assume any obligation to update publicly any of these forward-looking statements to reflect actual results, new information or future events, changes in assumptions or changes in other factors affecting forward-looking statements, except to the extent required by applicable law. If we update one or more forward-looking statements, no inference should be drawn that we will make additional updates with respect to those or other forward-looking statements.
2
Terms Used in this Annual Report
Unless otherwise specified or the context otherwise requires, references in this annual report to "we," "our," "us," "Hyatt," and the "Company" refer to Hyatt Hotels Corporation and its consolidated subsidiaries.
As used in this annual report, the term "Pritzker family business interests" means (1) various lineal descendants of Nicholas J. Pritzker (deceased) and spouses and adopted children of such descendants; (2) various trusts for the benefit of the individuals described in clause (1) and trustees thereof; and (3) various entities owned and/or controlled, directly and/or indirectly, by the individuals and trusts described in (1) and (2).
As used in this annual report, the term "properties" refers to hotels and residential and vacation ownership units that we develop, own, operate, manage, franchise, or to which we provide services or license our trademarks. "Hyatt portfolio of properties" or "portfolio of properties" refers to hotels and other properties that we develop, own, operate, manage, franchise, license, or provide services to, including under our Park Hyatt, Grand Hyatt, Hyatt Regency, Hyatt, Andaz, Hyatt Centric, The Unbound Collection by Hyatt, Hyatt Place, Hyatt House, Hyatt Ziva and Hyatt Zilara brands. Residential ownership units refers to residential units that we manage, own, or to which we provide services or license our trademarks (such as serviced apartments and Hyatt-branded residential units) that are typically part of a mixed-use project and located adjacent to a full service hotel that is a member of the Hyatt portfolio of properties. "Vacation ownership units" refer to the fractional and timeshare vacation ownership properties with respect to which we license our trademarks and that are part of the Hyatt Residence Club. "Hospitality ventures" refers to entities in which we own less than a 100% equity interest.
As used in this annual report, the term "colleagues" refers to the more than
110,000
individuals working at our corporate and regional offices and our managed, franchised and owned properties in
56
countries around the world. We directly employ approximately
45,000
of these colleagues. The remaining colleagues are employed by third-party owners and franchisees of our hotels.
Hyatt
®
, Park Hyatt
®
, Miraval
®
, Grand Hyatt
®
, Hyatt Regency
®
, Andaz
®
, Hyatt Centric
®
, The Unbound Collection by Hyatt™, Hyatt Place
®
, Hyatt House
®
, Hyatt Ziva™, Hyatt Zilara™,
,
Hyatt Residence Club
®
, Hyatt Residences
®
,
Hyatt Gold Passport
®
, Hyatt Resorts™ and related trademarks, logos, trade names and service marks appearing in this annual report are the property of Hyatt Corporation, or another wholly owned subsidiary of Hyatt Hotels Corporation. All other trademarks, trade names or service marks appearing in this annual report are the property of their respective owners.
3
Item 1.
Business.
Our History
Hyatt was founded by Jay Pritzker in 1957 when he purchased the Hyatt House motel adjacent to the Los Angeles International Airport. In 2004 substantially all of the hospitality assets owned by Pritzker family business interests, including Hyatt Corporation and Hyatt International Corporation, were consolidated under a single entity whose name was subsequently changed to Global Hyatt Corporation. On June 30, 2009, Global Hyatt Corporation changed its name to Hyatt Hotels Corporation. We completed our initial public offering of our Class A common stock on November 10, 2009.
Overview
Hyatt Hotels Corporation is a global hospitality company with widely recognized, industry leading brands and a tradition of innovation developed over our nearly sixty-year history. We develop, own, operate, manage, franchise, license or provide services to a portfolio of properties, consisting of full service hotels, select service hotels, resorts and other properties, including timeshare, fractional and other forms of residential and vacation properties. At
December 31, 2016
, our worldwide hotel portfolio consisted of
657
hotels (
171,133
rooms). See Part II, Item 7, "Management's Discussion and Analysis of Financial Condition and Results of Operations—Overview" for a categorized breakdown of our portfolio.
Our full service hotels and resorts operate under seven established brands: Park Hyatt, Grand Hyatt, Hyatt Regency, Hyatt, Andaz, Hyatt Centric and The Unbound Collection by Hyatt, which launched in 2016. In January 2017, we announced the acquisition of Miraval Group, forming a distinct wellness category within our portfolio of brands. Our two select service brands are Hyatt Place and Hyatt House, an extended stay brand. Our all inclusive resort brands are Hyatt Ziva and Hyatt Zilara. We also manage, provide services to or license our trademarks with respect to residential ownership units that are often adjacent to a Hyatt-branded full service hotel. We consult with third parties in the design and development of such mixed-use projects. We license our trademarks with respect to vacation ownership units, which are part of the Hyatt Residence Club. In 2014, we sold our vacation ownership business to an affiliate of Interval Leisure Group ("ILG") and entered into a long-term license agreement.
Substantially all of our hotel general managers are trained professionals in the hospitality industry with extensive hospitality experience in their local markets and host countries. The general managers of our managed properties are empowered to operate their properties on an independent basis using their market knowledge, management experience and understanding of our brands. Our colleagues and hotel general managers are supported by our regional management teams located in cities around the world and our executive management team, headquartered in Chicago.
We primarily derive our revenues from hotel operations, management and franchise fees and other revenues from managed properties. For the years ended
December 31, 2016
and December 31,
2015
, revenues totaled
$4.4 billion
and
$4.3 billion
, respectively, net income attributable to Hyatt Hotels Corporation totaled
$204 million
and
$124 million
, respectively, and Adjusted EBITDA totaled
$785 million
and
$750 million
, respectively. See Part II, Item 7, "Management's Discussion and Analysis of Financial Condition and Results of Operations—Key Business Metrics Evaluated by Management—Adjusted Earnings Before Interest Expense, Taxes, Depreciation, and Amortization ("Adjusted EBITDA") and EBITDA" for our definition of Adjusted EBITDA, why we present it, and for a reconciliation of our net income attributable to Hyatt Hotels Corporation to consolidated Adjusted EBITDA for the periods presented.
Our Purpose, Goal and Values
Our Purpose
To care for people so they can be their best.
Our Goal
To become the most preferred hospitality brand—loved and respected by colleagues, guests, owners, operators, community members and shareholders.
Our Values
Respect, integrity, humility, empathy, creativity and fun are our shared core values.
Our purpose, goal and values are brought to life by our colleagues, whom we refer to as the Hyatt family. We believe our colleagues embody our purpose of caring for people, including each other, our guests and ultimately our owners. This
4
commitment to genuine service and care is what differentiates us and drives guest preference. The management teams at each of our managed properties lead by example, and we provide them with the appropriate autonomy to make operational decisions in the best interest of the hotel and brand. We believe the managers of our franchised properties are experienced operators with high standards who have demonstrated commitment to our values and our approach to caring for guests to enhance guest satisfaction. High levels of guest satisfaction lead to increased guest preference for our brands, which we believe results in a strengthened revenue base over the long term. We also believe engaged colleagues will enhance efficient operation of our properties, resulting in improved financial results for our owners. Sustained adherence to these principles is a basis for our brand reputation and is one of the principal factors behind the decisions of our diverse group of owners and developers to invest in the Hyatt portfolio of properties around the world. We work with existing and prospective owners and developers to increase our presence around the world, which we expect will lead to guest satisfaction, brand preference and new channels for professional growth for our colleagues.
Our Competitive Strengths
We have significant competitive strengths that support our goal of being the most preferred brand for our colleagues, guests, owners, operators, community members and shareholders.
World Class Brands.
We believe our widely recognized, industry-leading brands provide us with a competitive advantage in attracting and driving preference. We have consistently received top rankings, awards and accolades for service and guest experience from independent publications and surveys, including Condé Nast Traveler, Travel and Leisure, Forbes and AAA. Our brand recognition and strength is key to our ability to drive preference.
Global Platform with Compelling Growth Potential.
Our existing global presence is widely distributed, and our hotels operate in 20 of the 25 most populous urban centers around the globe. We believe our existing hotels provide us with a strong platform from which to selectively pursue new growth opportunities in markets where our brands are under-represented. Our dedicated global development executives in offices around the world apply their experience, judgment and knowledge to ensure the Hyatt portfolio of properties enhances preference for our brands. An important aspect of our compelling growth potential is our strong brand presence in higher growth markets such as India, China and the Middle East. The combination of our existing locations and brands, experienced development team, established third-party relationships and significant access to capital provides us with a strong foundation for future growth and long-term value creation.
Deep Culture and Experienced Management Teams.
Hyatt has a strong culture rooted in values that have supported our past success and form the foundation for our future. The members of the Hyatt family are united by shared values, a single purpose and a common goal. Our colleagues at Hyatt properties are led by an experienced group of general managers. For example, the general managers at our full service managed hotels have an average tenure of more than 22 years. Regional management teams located around the world support our hotel general managers by providing resources, mentorship and coaching, owner support and other assistance. Senior operating management has an average of approximately 30 years of experience in the industry. Our seasoned executive management team sets overall policies for our Company, supports our regional teams and our colleagues around the world, provides strategic direction and leads our global growth initiatives.
Strong Capital Base and Disciplined Financial Approach.
Our approach is to maintain appropriate levels of financial leverage through industry cycles and economic downturns. At
December 31, 2016
, we had cash and cash equivalents and short-term investments of
$538 million
and available borrowing capacity of
$1.4 billion
. We believe that as a result of our balance sheet strength, we are uniquely positioned to take advantage of strategic opportunities to develop or acquire properties and brands. We adhere to a formal investment process in evaluating such opportunities with input from various groups within our global organization.
Diverse Exposure to Hotel Management, Franchising, Ownership and Development.
We believe that our experience as a multi-brand manager, franchisor, owner and developer of hotels makes us one of the best positioned hospitality companies in the world. Our mix of managed, franchised and owned hotels provides a broad and diverse base of revenues, profits and cash flows and gives us flexibility to evaluate growth opportunities across these three lines of business.
High Quality Owned Hotels Located in Desirable Markets.
At
December 31, 2016
, our portfolio of properties consisted of luxury and upper-upscale full service hotels and resorts, upscale select service hotels and all inclusive resorts in key markets and totaled
35
owned properties and
35
managed or franchised properties that are owned or leased by unconsolidated hospitality ventures. Our owned full service hotels are located primarily in key markets, including major business centers and leisure destinations with strong growth potential, such as Chicago, London, Mexico City, New York, Paris, San Francisco, Seoul and Zurich. Our unconsolidated hospitality ventures include 50% ownership interests in properties in Mumbai and São Paulo. A number of our owned hotels and unconsolidated hospitality venture properties are unique assets with high brand recognition and a strong position in their local
5
markets. For example, in 2016, we opened Grand Hyatt Rio de Janeiro, the second Grand Hyatt hotel in Brazil and a significant addition to our growing South America portfolio. In 2014, we opened Park Hyatt New York, the flagship hotel of the globally recognized Park Hyatt brand, giving the brand representation in an additional key market. In 2013, we acquired Hyatt Regency Orlando, adding to our portfolio a high quality hotel located adjacent to one of the largest convention facilities in the United States. As a significant owner of hotel assets, we expect earnings growth from owned properties to outpace revenue growth at managed properties during periods of increasing demand and room rates due to the operating leverage inherent in owned properties. This benefit can be achieved through increased earnings from our owned assets and through value realized from selected asset sales.
Our Business Strategy
Our strategy for reaching our goal to become the most preferred hospitality brand is based on differentiating Hyatt through powerful brands and innovation and generating long-term, sustainable growth for the company that will create shareholder value and career development opportunities for colleagues. We implement our strategy through a focus on four strategic priorities:
Cultivate the Best People and Evolve the Culture
Cultivating the best people and evolving the culture focuses on attracting, developing, rewarding and retaining individuals who distinguish Hyatt from our competitors and provide a unique experience to our guests. We recognize our people and our culture are our greatest assets and the core of our strategy. Our goal is to develop a strong pipeline of diverse and talented colleagues and to provide them with opportunities to fulfill their personal potential and development while helping to make Hyatt successful.
Our brands are defined, in large part, by the commitment to genuine service and care that our colleagues deliver to our guests. We believe that while a great product is necessary for success, a service model that promotes genuine care for our guests and that is focused on their particular needs is the key to a sustainable long-term advantage. Therefore, we strive to involve our colleagues in deciding how we care for our guests and identifying what we can do to improve guest satisfaction. We rely on our hotel general managers to lead by example and foster colleague engagement. In addition, we are focused on providing colleagues with the tools and technology needed to perform their jobs more effectively and efficiently to allow for further engagement with guests. We believe colleague engagement results in higher levels of customer satisfaction and improves the performance of our properties. To assist in this process, we aim to ensure talented management teams are in place worldwide and to reward those teams that achieve higher levels of colleague engagement, guest satisfaction and hotel financial performance.
Our reputation is a reflection of how we conduct ourselves and our business in the communities in which we live and work. One of our principal tools to enhance Hyatt's reputation is Hyatt Thrive, our global corporate responsibility program. Through Hyatt Thrive initiatives we volunteer in our communities, support organizations that work in our communities, and work to reduce our waste and carbon footprint to make the communities in which we operate places where we want to live, where guests want to visit and where our owners want to invest.
Build and Deliver Brand-Led Experiences
In support of our goal to become the most preferred hospitality brand and to foster quality growth, we have focused on creating a meaningful portfolio of brands that deliver unique experiences for the high-end traveler. Our objective is to differentiate our brands both from one another, and from our competitors. Each of our brands provides a distinct experience for different traveler mindsets, while all of our hotels strive to deliver genuine care. We have developed a personality and identity for each brand that results in a distinct look and reflects experiences and attributes unique to that particular brand.
Successful innovation has been a hallmark of Hyatt since its founding, with a commitment to impactful architectural design of hotels in both the large-scale convention and smaller leisure markets. We continuously probe deeper and uncover new opportunities for enhancing the guest experience in each of our brands. We have a long track record of creative approaches to food and beverage at our hotels throughout the world, and we have created profitable and sought-after venues that create and enhance demand for our hotel properties.
We develop loyalty by fostering personal relationships and creating emotional connections that inspire brand preference. We believe true loyalty is built by deep interpersonal connections, authenticity, care and trust. Our loyalty program is designed to attract new guests and to demonstrate our loyalty to our existing guests. In
2016
, our Hyatt Gold Passport loyalty program won two Freddie Awards, best elite travel program in the Americas and best elite travel program
6
in the Middle East/Asia/Oceania. The Hyatt Credit Card, a co-branded Visa credit card between Hyatt and Chase Card Services, continued to show strong growth in card member acquisitions and member engagement.
Operate with Excellence
A key component of our strategy is to maximize revenues and manage costs at our managed hotel properties. We strive to optimize revenues by focusing on revenue management and establishing and increasing guest loyalty to our brands. We work to expand Hyatt's share of room revenue by continuously striving to provide genuine guest service and delivering value to our guests. Our existing customer base is diverse with different needs and preferences. We aim to provide differentiated service and product offerings targeted at each customer segment within each of our brands, including meeting planners and convention guests, leisure guests and business travelers, in order to satisfy our customers' specific needs.
We manage costs by setting performance goals for our hotel management teams, and granting our general managers operational autonomy. We support these cost management efforts by providing our general managers with tools and analytics from our regional and corporate offices and by compensating our hotel management teams based on property performance. In addition to managing hotel level costs, we strive to keep corporate costs aligned with growth through efficient resource allocation, which we expect will generate savings supporting our ability to fund additional growth and further invest in our brands.
Grow With Intent
We are focused on creating long-term shareholder value, and on where and how we invest to expand our presence in key locations. We believe the scale of our presence around the world is small relative to the recognition of our brands and our excellent reputation for service and, therefore, we have a unique opportunity to grow.
|
o
|
Increase Market Presence.
We focus our expansion efforts on under-penetrated markets where we already have an established presence and on locations where our guests are traveling but where we do not have a presence. We intend to expand our presence by increasing the number of hotels in the Hyatt portfolio, primarily by entering into new management and franchise agreements. We believe our intense focus on each customer group that we serve and our understanding of how we can serve them in new locations will result in quality growth. Over the past few years, we have made significant progress in expanding our presence through development of new hotels and conversion of existing hotels. In addition to existing asset base expansion, we are focused on continued growth of our development pipeline. We have expanded our pipeline by an average of 12% per year since the time of our IPO in 2009. Since 2009 we have also entered 143 new markets and 14 new countries. Expansion in dynamic markets like China and India is central to our growth strategy as representation in key cities and resort destinations provides us with the opportunity to drive preference for our brands as we serve a broader base of guests in these high growth and under-penetrated markets. At
December 31, 2016
, there were approximately 100 hotels open or under development in China in markets such as Beijing, Hong Kong, Shanghai and Shenzhen. In India, the total number of hotels open or under development was approximately 40 properties at
December 31, 2016
. In addition to China and India, we have also announced further expansion plans into diverse international markets including Australia, Germany, Indonesia, Japan, Jordan, Kuwait, New Zealand, Republic of Georgia, Saudi Arabia, Singapore and Thailand.
|
|
o
|
Expand Select Service Presence
. We continue to expand the Hyatt Place and Hyatt House brands, which we believe will support our overall growth and enhance the performance of all of our brands. We intend to grow our select service presence through third-party construction of new franchised properties, conversion and renovation of existing non-Hyatt properties, and in certain cases, participation in the development of new managed properties. We believe that the opportunity for properties that provide a select offering of services at a lower price point than full service hotels is particularly compelling in certain markets, including India, China and the Middle East, where there is a large and growing middle class along with a meaningful number of local business travelers. At
December 31, 2016
, we had 28 Hyatt Place hotels operating outside of the United States in 16 countries, throughout Asia, Europe, Africa and Latin America. In addition to these hotels, we have announced new management agreements for select service properties currently under development in Australia, Brazil, China, Germany, India, Malaysia, Mexico, Thailand, Saudi Arabia and Switzerland.
|
|
o
|
Increase Focus on Franchising.
We continue to increase our franchised hotel presence, primarily in the United States. By increasing our focus on franchising, we believe that we will gain access to capital from developers and property owners that specifically target franchise business opportunities. We have an
|
7
internal team dedicated to supporting our franchise owners and to driving the expansion of our franchised hotel presence. We plan to expand existing relationships and develop new relationships with franchisees who demonstrate an ability to provide excellent customer service and maintain our brand standards. In support of our strategy, over the past several years we sold a number of individual full service hotels and portfolios of select service hotels subject to long-term franchise agreements with the purchasers.
|
o
|
Utilize our Capital and Asset Base for Targeted Growth.
The combination of our significant liquidity and strong capital position coupled with our large, high quality asset base provides a unique platform to support our growth strategy. We take a comprehensive approach to our efforts to recycle hotel real estate assets and to manage capital deployment in furtherance of our expansion plans. Capital deployment will continue with an objective to maximize long-term shareholder value and we assess and balance liquidity, value and strategic importance in each instance. We also plan to continue to commit capital to fund the renovation of certain assets in our owned portfolio. While we selectively dispose of hotel properties, we expect to maintain ownership of hotel properties over time given our focus and expertise as an owner. Asset sales are consistent with the Company’s asset recycling strategy—selling certain hotels, maintaining presence in markets by entering into new management or franchise agreements, and re-investing sale proceeds into new hotels and other growth opportunities, including investments in hospitality ventures. This asset recycling strategy has allowed us to grow and build our brands while improving the quality of our owned portfolio over time. Currently approximately 80% of our owned and leased portfolio consists of full-service hotels in our top markets. We expect to continue to evolve our owned and leased portfolio to include primarily luxury and upper upscale properties in international key gateway cities and resort destinations.
|
|
o
|
Pursue Strategic Acquisitions and Alliances.
We expect to continue to evaluate potential acquisitions of other brands or hospitality management or franchising companies as a part of our efforts to expand our presence. These acquisitions may include hotel real estate. We expect to focus on acquisitions that complement our ability to serve our existing customer base and enhance customer preference by providing a greater selection of locations, properties and services. Furthermore, we may pursue these opportunities in alliance with existing or prospective owners of managed or franchised properties to strengthen our brand presence.
|
|
o
|
Extend the Hyatt Brand Beyond Traditional Hotel Stays.
In January 2017, we announced the acquisition of Miraval Group, the renowned provider of wellness and mindfulness experiences. The Miraval acquisition extends the Hyatt brand beyond traditional hotel stays, which is core to our global growth strategy, and reflects our commitment to finding new ways to understand and care for our guests, particularly the high-end traveler. By adding Miraval to the Hyatt portfolio, we continue our commitment to a holistic health and wellness strategy as an extension of our purpose. Miraval forms a distinct new wellness category within the Hyatt portfolio of brands, therefore creating an opportunity to expand the Miraval brand while building a greater depth of expertise in wellness and mindfulness that can be extended to our hotel business.
|
Description of Our Brands
|
Brand
|
Segment
|
Customer Base
|
December 31, 2016 Rooms/Units (1)
|
Primary Selected
Competitors |
Key Locations
|
|||||||||||
|
% of our
Total Portfolio |
Americas Region
|
ASPAC Region
|
EAME/SW Asia Region
|
|||||||||||||
|
Full
Service/
Luxury
|
Individual business and leisure travelers; small meetings
|
4%
|
1,838
|
3,123
|
2,626
|
Four Seasons,
Ritz-Carlton,
Peninsula,
St. Regis,
Mandarin Oriental
|
Buenos Aires, Dubai,
New York, Paris, Shanghai, Sydney,
Washington D.C.
|
||||||||
|
Full
Service/ Luxury |
Individual business and leisure travelers; large and small meetings, social events
|
14%
|
9,774
|
12,263
|
3,485
|
Mandarin Oriental,
Shangri-La, InterContinental, Fairmont |
Beijing,
Berlin, Dubai, Hong Kong, New York, Rio de Janeiro, Tokyo |
||||||||
8
|
Brand
|
Segment
|
Customer Base
|
December 31, 2016 Rooms/Units (1)
|
Primary Selected
Competitors
|
Key Locations
|
|||||||||||
|
% of our
Total Portfolio
|
Americas Region
|
ASPAC Region
|
EAME/SW Asia Region
|
|||||||||||||
|
Full
Service/ Upper-Upscale |
Conventions, business and leisure travelers; large and small meetings, social events; associations
|
45%
|
55,065
|
12,737
|
11,119
|
Marriott, Sheraton,
Hilton, Renaissance, Westin |
Boston,
Delhi, London, Los Angeles, Mexico City, Orlando, San Francisco |
||||||||
|
Full
Service/ Upper-Upscale |
Business and leisure travelers; small meetings
|
2%
|
2,255
|
362
|
1,322
|
Marriott,
Hilton, InterContinental, Westin, independent and boutique hotels |
Abu Dhabi, New York,
Seattle |
||||||||
|
Full
Service/ Luxury |
Individual business and leisure travelers; small meetings
|
2%
|
2,195
|
470
|
790
|
W, Mondrian,
The Standard
|
Amsterdam, London,
Los Angeles, Maui, New York,
Shanghai, Tokyo
|
||||||||
|
Full
Service/ Upper-Upscale |
Business and leisure travelers; small meetings
|
2%
|
2,801
|
—
|
—
|
Canopy, Kimpton, Renaissance, Joie de Vivre, independent and boutique hotels
|
Chicago, Long Beach, Miami, Montevideo,
New York, Park City
|
||||||||
|
Full
Service/ Upper-Upscale |
Individual business and leisure travelers; small meetings
|
1%
|
715
|
—
|
177
|
Autograph Collection
Luxury Collection
Curio
Tribute Portfolio
|
Austin, Carmelo, Miami Beach, Paris, Phoenix
|
||||||||
|
Select
Service/
Upscale
|
Individual business and leisure travelers; small meetings
|
21%
|
34,920
|
714
|
2,084
|
Courtyard by
Marriott, Hilton
Garden Inn
|
Atlanta, Chicago, Dallas,
Dubai, Houston,
Miami, Phoenix, Santiago
|
||||||||
|
Select
Service/
Upscale
|
Extended stay guests; individual business and leisure travelers;
families; small
meetings/trainings
|
6%
|
10,186
|
112
|
—
|
Residence Inn
by Marriott,
Homewood
Suites
|
Austin, Boston,
Dallas, Miami,
San Francisco
|
||||||||

|
All Inclusive
|
Leisure travelers; families; small meetings
|
1%
|
1,860
|
—
|
—
|
Club Med, Sandals, Beaches
|
Cancun, Puerto Vallarta, Rose Hall, San Jose del Cabo
|
||||||||

|
All Inclusive
|
Leisure travelers; adult-only; small meetings
|
<1%
|
541
|
—
|
—
|
Club Med, Sandals, Beaches
|
Cancun, Rose Hall
|
||||||||
|
Vacation
Ownership/
Branded
Residential
|
Owners of
vacation units, repeat Hyatt business and leisure guests
|
2%
|
1,185
|
470
|
1,929
|
Hilton Vacation
Club, Marriott
Vacation Club,
Starwood Vacation
Ownership
|
Aspen, Beaver Creek, Beijing, Carmel, Danang,
Dubai, Key West, Maui, Park City
|
||||||||
(1) Rooms/Units count includes owned, leased, managed, franchised, branded residential, hospitality ventures and vacation ownership properties licensed under the Hyatt Residence Club brand.
9
Park Hyatt
Park Hyatt hotels provide discerning, affluent business and leisure guests with elegant and luxurious accommodations. Guests of Park Hyatt hotels receive gracious service and enjoy rare and intimate experiences in a thoughtfully designed contemporary environment. Located in many of the world’s premier destinations, each Park Hyatt hotel is custom designed to combine sophistication with distinctive regional character. Park Hyatt hotels feature well-appointed guestrooms, meeting and special event spaces for smaller groups, critically acclaimed food, wine and art programs and signature restaurants featuring award-winning chefs.
Grand Hyatt
Grand Hyatt hotels are distinctive hotels in major gateway cities and resort destinations. With presence around the world and critical mass in Asia, Grand Hyatt hotels provide sophisticated business and leisure travelers with elegant accommodations, extraordinary restaurants, bars, spas and fitness centers, as well as comprehensive business and meeting facilities. Signature elements of Grand Hyatt hotels include dramatic architecture, state of the art technology and facilities for an array of business or social gatherings of all sizes.
Hyatt Regency
Hyatt Regency hotels offer a full range of services and facilities tailored to serve the needs of meeting planners, business travelers and leisure guests. Hyatt Regency convention hotels feature meeting and conference facilities of all sizes designed to provide a productive, connected environment. Hyatt Regency hotels in resort locations cater to couples seeking a getaway, families enjoying a vacation together and corporate groups seeking an atmosphere in which to conduct business and meetings.
Hyatt
Hyatt hotels are smaller-sized properties conveniently located in diverse business and leisure areas. Regardless of the reason for a guest's stay, our Hyatt hotels provide guests with a home base as they discover and explore our neighborhoods. Hyatt hotels accommodate business and leisure travelers, as well as smaller scale business meetings and social gatherings.
Andaz
Each Andaz hotel brings the local destination to life for its guests. The hotels are designed to reflect their surroundings and feature a unique and innovative service model that creates a barrier-free and non-traditional environment. Guests will experience personalized and unscripted service where they can become inspired by the spirit of the local community. Signature elements include Andaz Lounges, which are open, communal settings replacing the traditional lobby, Andaz Studios, which are creative and inspiring spaces for small meetings and gatherings, and Andaz Hosts, who are local experts that can assist guests with everything from check-in to recommending the best and most authentic spot in town for dinner.
Hyatt Centric
Hyatt Centric hotels are full service lifestyle hotels created for millennial-minded guests who view their hotel as more than a place to stay. Hyatt Centric hotels are centrally located. This means guests can be both "in the middle of the action" and "in the know" so both leisure and business travelers can easily explore the destination and get a feel for the local flavor. A staff of knowledgeable colleagues is on hand to aid guests in their discovery of their surroundings.
The Unbound Collection by Hyatt
The Unbound Collection by Hyatt is designed to provide a portfolio of new and existing upper-upscale properties ranging from historic urban gems and striking new build hotels to boutique properties and resorts. Each hotel offers story-worthy and authentic experiences for our guests. The philosophy behind The Unbound Collection by Hyatt is to attract owners and developers who want their properties to maintain a distinct character and brand name but gain the power of Hyatt’s robust operational and marketing resources, award winning customer loyalty program and trusted brand name and reputation.
Hyatt Place
Hyatt Place hotels create a modern, comfortable and seamless experience, combining style and innovation to create a casual simple hotel environment for today's multi-tasking traveler. Modern spacious guestrooms feature a Cozy Corner sofa sleeper, the Hyatt Grand Bed
TM
and 42" HDTV. Hyatt Place hotels also offer the 24/7 Gallery Menu and the Coffee to Cocktails Bar, which features specialty coffees, premium beer, wine and spirits. Properties typically have 125 to 200 rooms and are located in urban, airport and suburban areas. Hyatt Place hotels cater to business travelers, as well as leisure guests and families. Hyatt Place hotels are also well suited to serve small meetings and events.
10
Hyatt House
Hyatt House hotels are designed to welcome guests as extended stay residents and offer services, amenities, communal spaces and a casual, comfortable environment that reminds guests of home. Apartment-style Kitchen Suites with fully equipped kitchens, comfortable living rooms and spacious bedrooms provide guests with the spaces that fit their needs. Guests can enjoy the complimentary hot breakfast, the Morning Spread, and the H BAR with a Sip+Savor Menu and full bar. Located in urban, airport and suburban areas, Hyatt House hotels cater to extended stay business travelers, as well as leisure travelers and families. Hyatt House hotels are also well suited to serve small meetings and events.
Hyatt Ziva
Hyatt Ziva all inclusive resorts are designed for vacationing guests of all ages and offer a variety of on-site activities and opportunities to explore the unique destinations in which the properties are located. Hyatt Ziva resorts feature a wide array of food and beverage outlets with an emphasis on authentic cuisine and are able to cater to social or business groups with varied and well-appointed meeting facilities.
Hyatt Zilara
Hyatt Zilara adult-only all inclusive resorts are located in sought after, unique resort destinations. They offer a wide array of food and beverage services with a focus on authentic and often locally-sourced ingredients. The resorts offer many social activities and live entertainment, as well as a variety of meeting spaces. The resorts are designed so couples or small groups can enjoy intimate, sophisticated surroundings.
Hyatt Residence Club
Hyatt Residence Club provides members with vacation ownership opportunities in regionally inspired and designed residential-style properties with the quality of the Hyatt brand. Members pre-purchase time at a Hyatt Residence Club property and have the flexibility of usage, exchange and rental. Hyatt Residence Club members can choose to occupy their vacation home, exchange time among
16
Hyatt Residence Club locations, trade their time for Hyatt Gold Passport points or travel within the Hyatt system. Alternatively, members can exchange their intervals for stays at other properties participating within Interval International’s program, which has over 3,000 resorts in its exchange network worldwide.
Residential Ownership Units
Residential ownership units refer to residential units that we manage, or to which we provide services or license our trademarks, such as serviced apartments and Hyatt-branded residential units. Many locations are near or adjacent to full service hotels that are members of the Hyatt portfolio of properties, while others are in unique leisure locations. Studio units feature kitchenettes, while one, two and three bedroom units contain fully equipped kitchens, dining areas and living rooms. Residents in some locations are able to utilize various nearby Hyatt hotel services.
Our Commitment to Corporate Responsibility
Hyatt Thrive is an integral part of our business and we recognize when our people, communities and planet thrive, so does our business. Hyatt Thrive is focused on environmental stewardship, strengthening our community impact through volunteerism, philanthropy and disaster relief and ensuring responsible business practices govern our operations. By setting goals, measuring progress, and harnessing the power of our colleagues around the world, we strive to make a tangible impact within and beyond the walls of our hotels.
Business Segment, Revenues and Geographical Information
We manage our business within four reportable segments as described below:
|
•
|
Owned and leased hotels, which consists of our owned and leased full service and select service hotels and, for purposes of segment Adjusted EBITDA, our pro rata share of the Adjusted EBITDA of our unconsolidated hospitality ventures, based on our ownership percentage of each venture.
|
|
•
|
Americas management and franchising ("Americas"), which consists of our management and franchising of properties located in the United States, Latin America, Canada and the Caribbean.
|
|
•
|
ASPAC management and franchising ("ASPAC"), which consists of our management and franchising of properties located in Southeast Asia, as well as greater China, Australia, South Korea, Japan and Micronesia.
|
|
•
|
EAME/SW Asia management and franchising ("EAME/SW Asia"), which consists of our management and franchising of properties located primarily in Europe, Africa, the Middle East, India, Central Asia and Nepal.
|
11
The results of our unallocated corporate overhead, our co-branded credit card, license fees related to Hyatt Residence Club, and our vacation ownership business prior to the sale in the fourth quarter of 2014 are reported within corporate and other. For information regarding our four reportable business segments, revenues and geographical information, see Part IV, Item 15, "Exhibits and Financial Statement Schedule—Note
18
to the Consolidated Financial Statements."
Management Agreements
We manage hotels and residential properties worldwide pursuant to management agreements.
Fees
Our management agreements typically provide for a two-tiered fee structure that compensates us both for the volume of business we generate for the property as well as for the profitability of hotel operations. In these two-tier fee structures, our base compensation is a base fee that is usually an agreed upon percentage of gross revenues from hotel operations. In addition, we are incentivized to improve hotel profitability through an incentive fee that is typically calculated as a percentage of a hotel profitability measure, such as gross operating profit, adjusted profit or the amount by which gross operating profit or adjusted profit exceeds a specified threshold. Outside of the United States our fees are often more dependent on hotel profitability measures either through a single management fee structure where the entire fee is based on a profitability measure, or because our two-tier fee structure is more heavily weighted toward the incentive fee than the base fee.
Terms and Renewals
The approximate average remaining term of our management agreements with third-party owners and unconsolidated hospitality ventures for full service hotels and select service hotels (other than those currently under development) is as follows:
|
Assuming no renewal options are exercised by either party:
|
Including exercise of extension options that are in Hyatt's sole discretion:
|
||
|
Full service management agreements:
|
|||
|
Americas
|
13 years
|
21 years
|
|
|
EAME/SW Asia
|
14 years
|
21 years
|
|
|
ASPAC
|
14 years
|
16 years
|
|
|
Select service management agreements:
|
|||
|
Americas
|
14 years
|
29 years
|
|
|
EAME/SW Asia
|
22 years
|
38 years
|
|
|
ASPAC
|
20 years
|
29 years
|
|
Some of our management agreements grant early termination rights to hotel owners upon the occurrence of a stated event, such as the sale of the hotel or our failure to meet a specified performance test (any such event a "termination event"). In the case of a termination event, some of our management agreements grant hotel owners the right to terminate the management agreement and convert the hotel to a Hyatt franchise. Generally, termination rights under performance tests are based upon the property's individual performance or its performance when compared to a specified set of competitive hotels branded by other hotel operators or both. These termination rights are usually triggered if we do not meet the performance tests over multiple years. We generally have the option to cure performance failures by paying an amount equal to the shortfall, but in some cases our cure rights may be limited and the result of our failure to meet a performance test may be the termination of our management agreement.
Many of our management agreements are subordinated to mortgages or other secured indebtedness of the owners. In the United States, most lenders have agreed to recognize our right to continue to manage the hotels under the terms set forth in the management agreements if the lenders take possession of the hotel property through foreclosure or similar means.
12
Franchise Agreements
Our franchise agreements grant our franchisees the limited right to use our name, marks and system in the operation of franchised Hyatt Regency, Hyatt, Hyatt Centric, Hyatt Place, Hyatt House, Hyatt Ziva and Hyatt Zilara properties and franchised properties operated under distinct tradenames and affiliated with "The Unbound Collection by Hyatt". We do not participate in the management of our franchised hotels; however, franchisees are required to operate franchised hotels consistent with our brand standards. We approve the plans for, and the location of, franchised hotels and review the operation of these hotels to ensure our standards are maintained.
Fees
In general, our franchisees pay us an initial application fee and ongoing royalty fees, the amount of which depends on whether the franchised property is a select service hotel or full service hotel. We franchise full service hotels under the Hyatt Regency, Hyatt Centric and Hyatt brands, all inclusive resorts under the Hyatt Ziva and Hyatt Zilara brands and full service hotels under distinct tradenames and affiliated with "The Unbound Collection by Hyatt". We franchise select service hotels under the Hyatt Place and Hyatt House brands. Application fees are typically $60,000 for our Hyatt Place hotels and our Hyatt House hotels and the greater of $100,000 or $300 per guest room for our full service hotels and all inclusive resorts. Select service franchisees pay continuing franchise fees calculated as a percentage of gross room revenues, which typically are 3% in the first year of operations, 4% in the second year and 5% through the remainder of the term. Our Hyatt Regency and Hyatt franchisees typically pay us franchise fees calculated as 6% of gross room revenues and 3% of gross food and beverage revenues. Our Hyatt Centric and The Unbound Collection by Hyatt franchisees typically pay us franchise fees calculated as 5% of gross room revenues. In some circumstances, we have negotiated other fee arrangements. Our all inclusive franchisees typically pay us franchise fees calculated as 2.75% of gross revenues.
In addition to our franchise fees, we charge full service hotel and all inclusive resort franchisees for certain services arranged and provided by us. These activities include centralized reservation functions, certain sales functions, technology, national advertising, marketing and promotional services, as well as various revenue management services. We charge select service franchisees for marketing, central reservations and technology services.
Terms and Renewals
The standard term of our franchise agreements is typically 20 years, with one 10 year renewal option exercisable by the franchisee, assuming the franchisee has complied with franchise agreement requirements and standards. Certain of our franchise agreements have renewal options at Hyatt's option, generally triggered if the franchisee has failed to exercise its renewal option. We have the right to terminate franchise agreements upon specified events of default, including non-payment of fees and non-compliance with brand standards. In the event of early termination for any reason, our franchise agreements set forth liquidated damages our franchisees must pay to us upon termination. The bankruptcy of a franchisee or lender foreclosure could result in the termination of the franchise agreement. The average remaining base term of our franchise agreements for our select service and full service hotels (other than those currently under development) is approximately 16 years, assuming no renewal options are exercised by either party. Including exercise of extension options in Hyatt’s discretion, the average remaining term of our franchise agreements for our select service hotels and full service hotels (other than those currently under development) is approximately 18 years.
Sales, Marketing and Reservations
Sales
We deploy a global sales team as well as regional sales teams in our Americas, ASPAC and EAME/SW Asia regions. The global team is responsible for our largest and most significant accounts doing business in all three regions. The regional teams are responsible for large accounts that typically do business within one region but at multiple hotels within the region. The global and regional sales teams coordinate efforts with the hotel sales teams. The in-house sales colleagues are focused on local and regional business opportunities, as well as securing the business generated from our key global and regional accounts.
Our corporate sales organizations are focused on growing market share with key accounts, identifying new business opportunities and maximizing our local customer base. Our key accounts consist of: major corporations; national, state and regional associations; specialty market accounts (social, government, military, educational, religious and fraternal); travel agency and luxury organizations; and a broad and diverse group of individual consumers. Our global and regional sales teams target multiple brands to key customer accounts within these groups. No one customer is material to our business. Our global and regional teams consist of over 200 colleagues at global and regional sales offices around the world, who are focused on group business, business and leisure traveler accounts and travel agencies.
13
Sales colleagues at our regional offices and at many of our full service hotels use our proprietary sales tool to manage the group rooms forecast, maintain an inventory of definite and tentative group rooms booked each day, streamline the process of checking guest room availability and rate quotes, and determine meeting room availability.
We seek to maximize revenues in each hotel through a team of revenue management professionals. Our revenue management leaders use a proprietary technology tool to help set appropriate pricing in each hotel. The goal of revenue management is to secure the right customers, on the right date, at the right price. Business opportunities are reviewed and agreed upon by the hotel's management team.
Marketing
We are focused on the high-end traveler, positioning our brands at the top of each segment in which we operate. Our marketing strategy is designed to drive loyalty and community, while meeting the specific business needs of hotel operations. Building and differentiating each of our brands is critical to increasing Hyatt's brand preference. We are focused on targeting the distinct guest segments that each of our brands serves and supporting the needs of the hotels by thorough analysis and application of data and analytics. Our loyalty program and Hyatt.com are also key components of building loyalty and driving revenue. Our loyalty program focuses on driving guest satisfaction, recognition and differential services for our most loyal guests. Hyatt.com is our primary online distribution channel providing customers with an efficient source of information about our hotels and an effective booking experience. With a combined focus on increasing brand awareness, building a community of loyalists and enhancing digital engagement, our marketing is aimed at Hyatt becoming the most preferred hospitality brand.
Reservations
We have a central reservation system that provides a comprehensive view of inventory, while allowing for local management of rates based on demand. Through this system, we are able to allow bookings by hotels directly, via telephone and correspondence through our contact centers, by travel agents, by corporate clients and online through Hyatt.com.
We have nine global contact centers that service our global guest base 24 hours per day, seven days per week and provide reservation services in over 20 languages. While we continue to provide full reservation services via telephone through our global contact centers, we have made significant investments in internet booking capabilities on Hyatt.com web and mobile platforms.
In addition, some of the rooms at hotels and resorts we manage or franchise are booked through internet travel intermediaries, partners or online travel service providers. We also engage third-party intermediaries who collect fees by charging our hotels and resorts a commission on room revenues, including travel agencies and meeting and event management companies.
Hyatt Gold Passport
We operate Hyatt Gold Passport, a loyalty program that generates substantial repeat guest business by rewarding frequent stays with points toward free hotel nights and other rewards. Our new global loyalty program, World of Hyatt, will launch on March 1, 2017, and will replace the Hyatt Gold Passport program. Inspired by our purpose, World of Hyatt is about building community and engagement with high-end travelers. In the new World of Hyatt program, members will enjoy additional rewards as they advance through the three elite tiers based on qualifying nights or base points in a calendar year.
Hyatt Gold Passport members earn points based on their spend at our properties or in connection with spend on the Hyatt co-branded credit card. World of Hyatt members will earn base points based on their eligible spend at our properties or bonus points in connection with spend on the Hyatt co-branded credit card. Loyalty program points can be redeemed at properties across the majority of our brands and can also be converted into airline miles with numerous participating airlines and redeemed with other third parties.
Our loyalty program is primarily funded through contributions from eligible revenues generated from loyalty program members. These funds are applied to reimburse hotels for room nights when members redeem loyalty program points and pay for administrative expenses and marketing initiatives to support the loyalty program.
At
December 31, 2016
, Hyatt Gold Passport had over 8 million active members, and during
2016
, represented 32% of total room nights systemwide.
14
Competition
There is intense competition in all areas of the hospitality industry. Competition exists for hotel guests, management and franchise agreements, and sales of vacation ownership properties and branded residential properties. Our principal competitors are other operators of full service, select service, all inclusive and extended stay properties, including other major hospitality chains with well-established and recognized brands. We also compete against small chains and independent and local owners and operators. Increasingly, we also face competition from new channels of distribution in the travel industry. Additional sources of competition include large companies that offer online travel services as part of their business model, such as Alibaba, search engines such as Google, and peer-to-peer inventory sources that allow travelers to book stays on websites that facilitate the short-term rental of homes and apartments from owners, thereby providing an alternative to hotel rooms, such as Airbnb and HomeAway.
We compete for guests based primarily on brand name recognition and reputation, location, customer satisfaction, room rates, quality of service, amenities, quality of accommodations, security and the ability to earn and redeem loyalty program points.
We compete for management agreements based primarily on the value and quality of our management services, our brand name recognition and reputation, our ability and willingness to invest our capital in third-party owned or hospitality venture projects, the level of our management fees and the economic advantages to the property owner of retaining our management services and using our brand name. We compete for franchise agreements based primarily on brand name recognition and reputation, the room rate that can be realized and total revenues we can deliver to the properties. Other competitive factors for management and franchise agreements include relationships with property owners and investors, including institutional owners of multiple properties, marketing support, reservation and e-commerce system capacity and efficiency, and the ability to make investments that may be necessary to obtain management and franchise agreements.
The number of branded lodging operators with a global reach and depth of product and offerings similar to us is limited. We believe our strong customer base, prominent brand recognition, strategic property locations and global development team enable us to compete effectively. For additional information, see Part I, Item 1A, "Risk Factors—Risks Related to Our Business—Because we operate in a highly competitive industry, our revenues, profits or market share could be harmed if we are unable to compete effectively, and new distribution channels, alternatives to traditional hotels and industry consolidation among our competitors may negatively impact our business."
Seasonality
The hospitality industry is seasonal in nature. The periods during which our lodging properties experience higher revenues vary from property to property, depending principally upon location and the customer base served. Based upon historical results, our properties in the Americas typically generate the highest revenues in the second quarter and the lowest in the first quarter. In both ASPAC and in EAME/SW Asia, the highest revenues typically are generated in the fourth quarter with the next highest revenues generated in the second quarter.
Cyclicality
The hospitality industry is cyclical and generally follows, on a lagged basis, the overall economy. There is a history of increases and decreases in demand for hotel rooms, in occupancy levels and in rates realized by owners of hotels through economic cycles. Variability of results through some of the cycles in the past has been more severe due to changes in the supply of hotel rooms in given markets or in given categories of hotels. The combination of changes in economic conditions and in the supply of hotel rooms can result in significant volatility in results for owners, managers and franchisors of hotel properties. The costs of running a hotel tend to be more fixed than variable. Because of this, in an environment of declining revenues the rate of decline in earnings will be higher than the rate of decline in revenues. Conversely, in an environment of increasing demand and room rates, the rate of increase in earnings is typically higher than the rate of increase in revenues.
Intellectual Property
In the highly competitive hospitality industry in which we operate, trademarks, service marks, trade names and logos are very important in the sales and marketing of our hotels, residential and vacation ownership properties and services. We have a significant number of trademarks, service marks, trade names, logos and pending registrations, and significant resources are expended each year on surveillance, registration and protection of our trademarks, service marks, trade names and logos, which we believe have become synonymous in the hospitality industry with a reputation for excellence in service and care. For additional information, see Part I, Item 1A, "Risk Factors—Risks Related to Our Business—Any failure to protect our trademarks and intellectual property could reduce the value of our brand names and harm our business."
15
Government Regulation
We are subject to numerous foreign, federal, state and local government laws and regulations, including those relating to the preparation and sale of food and beverages, building and zoning requirements, data privacy and general business license and permit requirements, in the various jurisdictions in which we manage, franchise, license and own properties. Our ability to develop new hotel properties and to remodel, refurbish or add to existing properties is also dependent on obtaining permits from local authorities. We are also subject to laws governing our relationships with employees, including minimum wage requirements, overtime, working conditions, hiring and firing, non-discrimination for disabilities and other individual characteristics, work permits and benefit offerings. Federal, state and provincial laws and regulations require certain registration, disclosure statements, compliance with specific standards of conduct and other practices with respect to the franchising of hotels. Compliance with these various laws and regulations can affect the revenues and profits of properties managed, franchised, licensed or owned and of the vacation ownership business and could adversely affect our operations. We believe our businesses are conducted in substantial compliance with applicable laws and regulations.
We manage and own hotels with casino gaming operations as part of or adjacent to the hotels. However, with the exception of the Hyatt Regency Aruba Resort Spa and Casino, third parties manage and operate the casinos. We hold and maintain the casino gaming license and manage the casino located at the Hyatt Regency Aruba Resort Spa and Casino and employ third-party compliance consultants and service providers. As a result, our business operations at the Hyatt Regency Aruba Resort Spa and Casino are subject to the licensing and regulatory control of the
Departamento pa Asuntonan di Casino
(D.A.C.), the regulatory agency responsible for gaming licenses and operations in Aruba.
Employees
At
December 31, 2016
, we had approximately
45,000
employees at our corporate offices, regional offices, owned and managed hotels and residential properties. Approximately
25%
of those employees were either represented by a labor union or had terms of employment that were determined under a labor agreement. Some of our colleagues are employed by certain third-party owners and franchisees of our hotels and are not included in the
45,000
employees above because we do not directly employ them. We believe relations with our employees and colleagues are good.
Environmental Matters
In connection with our ownership and management of hotels and development of properties, we are subject to various foreign, federal, state and local laws, ordinances and regulations relating to environmental protection. Under some of these laws, a current or former owner or operator of real property may be held liable for the costs of investigating or remediating hazardous or toxic substances or wastes on, under or in such real property, as well as third-party sites where the owner or operator sent wastes for disposal. Such laws may impose liability without regard to whether the owner or operator knew, or was at fault in connection with, the presence or release of such hazardous substances or wastes. Although we are not aware of any current material obligations for investigating or remediating hazardous substances or wastes at our owned properties, the future discovery of substances or wastes at any of our owned properties, or the failure to remediate such contaminated property properly, could adversely affect our ability to develop or sell such real estate, or to borrow using such real estate as collateral. In addition, the costs of investigating or remediating contamination at our properties or at properties where we sent substances or wastes for disposal, may be substantial.
We are also subject to various requirements, including those contained in environmental permits required for our operations, governing air emissions, effluent discharges, the use, management and disposal of hazardous substances and wastes and health and safety. From time to time, we may be required to manage, abate or remove mold, lead or asbestos-containing materials at our properties. We believe our properties and operations are in compliance, in all material respects, with all foreign, federal, state and local environmental laws and ordinances. However, additional operating costs and capital expenditures could be incurred if additional or more stringent requirements are enacted in the future.
Insurance
Properties that the Company owns outright or through hospitality ventures, manages, franchises and licenses are insured under different insurance programs depending on whether the property participates in our insurance programs or in the insurance programs of the owner (including hospitality ventures), franchisee or licensee. We maintain insurance coverage for hotels owned by the Company under our insurance programs for liability, property, workers compensation and other risks with respect to our business. Our liability insurance provides coverage for most claims, including terrorism, resulting from our operations, goods and services and automobiles. Our property insurance provides coverage for all risks to our properties including fire, windstorm, flood, earthquake and terrorism. Property insurance also includes business interruption coverage. Our workers compensation insurance provides coverage for employee injuries in the course and scope of employment. Hotels owned by hospitality ventures or hotels managed by the Company are permitted to participate in our insurance programs by
16
mutual agreement with our hospitality venture partners or third-party hotel owners. The majority of hotels owned by hospitality ventures and managed hotels owned by third parties participate in our insurance programs. Our hospitality venture agreements and management agreements require hotels owned by hospitality ventures and managed hotels owned by third parties that do not participate in our insurance programs to be insured at coverage levels generally consistent with the coverage levels under our insurance programs, including liability, property, business interruption, workers compensation and other insurance. We are typically covered under these insurance policies to the extent necessary and reasonable. Our franchise and license agreements require our franchisees and licensees to maintain liability, property, business interruption, workers compensation and other insurance at our franchised or licensed properties. We are typically covered under these insurance policies to the extent necessary and reasonable. We also maintain cyber risk insurance for systems and data controlled by the Company. Cyber risk insurance generally covers all Company-controlled systems and data in properties that the Company owns, outright or through hospitality ventures, manages, franchises and licenses. We believe the Company's insurance policies, as well as those maintained by third-party owners, including hospitality ventures, are adequate for foreseeable losses and on terms and conditions that are reasonable and customary with solvent insurance carriers. We also self-insure some of our risks generally through the use of deductibles and retentions. We believe these deductibles and retentions are reasonable and customary for our industry and our size. We use U.S. based and licensed captive insurance companies that are wholly owned subsidiaries of Hyatt to generally insure our deductibles and retentions.
Stockholder Agreements
The following is a summary of the provisions of the Amended and Restated Global Hyatt Agreement, the Amended and Restated Foreign Global Hyatt Agreement and the Global Hyatt Corporation 2007 Stockholders' Agreement (the "2007 Stockholders' Agreement"). The following descriptions of these agreements do not purport to be complete and are subject to, and qualified in their entirety by, the Amended and Restated Global Hyatt Agreement, Amended and Restated Foreign Global Hyatt Agreement and 2007 Stockholders' Agreement, copies of which have been filed with the Securities and Exchange Commission ("SEC") and are incorporated by reference herein. For additional information regarding these agreements, please also refer to Part I, Item 1A, "Risk Factors—Risks Related to Share Ownership and Other Stockholder Matters."
Amended and Restated Global Hyatt Agreement
The trustees of the U.S. situs trusts for the benefit of certain lineal descendants of Nicholas J. Pritzker, deceased, that own, directly or indirectly, shares of our common stock, and the adult beneficiaries of such trusts, including Mr. Thomas J. Pritzker, our executive chairman, and Mr. Jason Pritzker, one of our directors, and any of their successors that own,
directly or indirectly, shares of our common stock, have entered into the Amended and Restated Global Hyatt Agreement pursuant to which they have agreed to, among other things, certain voting agreements and limitations on the sale of shares of our common stock. At January 31, 2017, Pritzker family business interests own, directly or indirectly,
75,963,294
shares, or
58.2%
, of our total outstanding common stock and control approximately
80.1%
of our total voting power. Specifically, such parties have agreed that until the date upon which more than 75% of the Company's fully diluted shares of common stock is owned by persons other than Pritzker family members and spouses (including any U.S. or non-U.S. situs trusts for the current or future, direct or indirect, vested or contingent, benefit of Pritzker family members and spouses), all Pritzkers (and their successors in interest, if applicable), but not the transferees by sale (other than Pritzkers who purchase directly from other Pritzkers), will vote all of their voting securities consistent with the recommendations of our board of directors with respect to all matters assuming agreement as to any such matter by a majority of a minimum of three independent directors (excluding for such purposes any Pritzker) or, in the case of transactions involving us and an affiliate, assuming agreement of all of such minimum of three independent directors (excluding for such purposes any Pritzker). All Pritzkers have agreed to cast and submit by proxy to us their votes in a manner consistent with the foregoing voting agreement at least five business days prior to the scheduled date of any annual or special meeting of stockholders.
In addition, such parties have agreed that until the date upon which more than 75% of the Company's fully diluted shares of common stock is owned by persons other than Pritzker family members and spouses (including any U.S. or non-U.S. situs trusts for the current or future, direct or indirect, vested or contingent, benefit of any Pritzker family members and spouses), all Pritzker family members and spouses (including U.S. and non-U.S. situs trusts for the current or future, direct or indirect, vested or contingent, benefit of any Pritzker family members and spouses or affiliates of any thereof) in a "beneficiary group" (including trusts only to the extent of the then current benefit of members of such beneficiary group) may sell up to 25% of their aggregate holdings of our common stock, measured as of November 4, 2009, the date of effectiveness of the registration statement on Form S-1 (File No. 333-161068) relating to our initial public offering of our Class A common stock, in each 12-month period following the date of effectiveness of such registration statement (without carry-overs), and shall not sell more than such amount during any such period. Upon the unanimous affirmative vote of our independent directors (excluding for such purposes any Pritzker), such 25% limitation may, with respect to each such 12 month period, be increased to a higher percentage or waived entirely. Sales of our common stock, including Class A common stock and Class B common
17
stock, between and among Pritzkers is permitted without regard to the sale restrictions described above and such sales are not counted against the 25% sale limitation.
All shares of our common stock owned by each beneficiary group (including trusts only to the extent of the then current benefit of members of such beneficiary group) are freely pledgeable to an institutional lender and such institutional lender will not be subject to the sale restrictions described above upon default and foreclosure.
The Amended and Restated Global Hyatt Agreement may be amended, modified, supplemented or restated by the written agreement of the successors to Mr. Thomas J. Pritzker, Mr. Marshall E. Eisenberg and Mr. Karl J. Breyer, solely in their capacity as co-trustees of the Pritzker family U.S. situs trusts, 75% of the adult beneficiaries named below and a majority of the other adult beneficiaries party to the agreement. Each of Thomas J. Pritzker, Nicholas J. Pritzker, Jennifer N. Pritzker, John A. Pritzker, Linda Pritzker, Karen L. Pritzker, Penny Pritzker, Daniel F. Pritzker, Anthony N. Pritzker, Gigi Pritzker Pucker and Jay Robert Pritzker, and their respective lineal descendants and current spouse, if relevant, make up a "beneficiary group."
Disputes that relate to the subject matter of the Amended and Restated Global Hyatt Agreement are subject to arbitration pursuant to the terms of the agreement. The exclusive requirement to arbitrate under the Amended and Restated Global Hyatt Agreement shall not apply with respect to the manner in which Hyatt's operations are conducted to the extent the parties (in their capacities as stockholders) and non-Pritzker public stockholders are affected comparably; provided, however, that a party may participate in and benefit from any shareholder litigation initiated by a non-party to the agreement. A party to the agreement may not solicit others to initiate or be a named plaintiff in such litigation (i) unless two thirds of the independent directors (excluding for such purposes any Pritzker) of a board of directors having at least three independent directors (excluding for such purposes any Pritzker) do not vote in favor of the matter that is the subject of the litigation or (ii) in the case of affiliated transactions reviewed by our board of directors, unless at least one independent director (excluding for such purposes any Pritzker) did not approve the transaction.
Amended and Restated Foreign Global Hyatt Agreement
The trustees of the non-U.S. situs trusts for the benefit of certain lineal descendants of Nicholas J. Pritzker, deceased, that own, directly or indirectly, shares of our common stock, and the adult beneficiaries of such trusts, including Mr. Thomas J. Pritzker and Mr. Jason Pritzker, and any of their successors that own, directly or indirectly, shares of our common stock, have entered into the Amended and Restated Foreign Global Hyatt Agreement pursuant to which they have agreed to, among other things, certain voting agreements and limitations on the sale of shares of our common stock. At January 31, 2017, Pritzker family business interests own, directly or indirectly,
75,963,294
shares, or
58.2%
, of our total outstanding common stock and control approximately
80.1%
of our total voting power. Specifically, such parties have agreed that until the date upon which more than 75% of the Company's fully diluted shares of common stock is owned by persons other than Pritzker family members and spouses (including any U.S. or non-U.S. situs trusts for the current or future, direct or indirect, vested or contingent, benefit of any Pritzker family members and spouses), all Pritzkers (and their successors in interest, if applicable), but not the transferees by sale (other than Pritzkers who purchase directly from other Pritzkers), will vote (or cause to be voted) all of the voting securities held directly or indirectly by them consistent with the recommendations of our board of directors with respect to all matters assuming agreement as to any such matter by a majority of a minimum of three independent directors (excluding for such purposes any Pritzker) or, in the case of transactions involving us and an affiliate, assuming agreement of all of such minimum of three independent directors (excluding for such purposes any Pritzker). All Pritzkers have agreed to cast and submit by proxy to us their votes in a manner consistent with the foregoing voting agreement at least five business days prior to the scheduled date of any annual or special meeting of stockholders.
In addition, such parties have agreed that until the date upon which more than 75% of the Company's fully diluted shares of common stock is owned by persons other than Pritzker family members and spouses (including any U.S. or non-U.S. situs trusts for the current or future, direct or indirect, vested or contingent, benefit of any Pritzker family members and spouses), all Pritzker family members and spouses (including U.S. and non-U.S. situs trusts for the current or future, direct or indirect, vested or contingent, benefit of any Pritzker family members and spouses and/or affiliates of any thereof) in a "beneficiary group" (including trusts only to the extent of the then current benefit of members of such beneficiary group) may sell up to 25% of their aggregate holdings of our common stock, measured as of November 4, 2009, the date of effectiveness of the registration statement on Form S-1 (File No. 333-161068) relating to our initial public offering of our Class A common stock, in each 12-month period following the date of effectiveness of such registration statement (without carry-overs), and shall not sell more than such amount during any such period. Upon the unanimous affirmative vote of our independent directors (excluding for such purposes any Pritzker), such 25% limitation may, with respect to each such 12 month period, be increased to a higher percentage or waived entirely. Sales of our common stock, including Class A common stock and Class B common stock, between and among Pritzkers is permitted without regard to the sale restrictions described above and such sales are not counted against the 25% sale limitation.
18
All shares of our common stock owned directly or indirectly by each beneficiary group (including trusts only to the extent of the then current benefit of members of such beneficiary group) are freely pledgeable to an institutional lender and such institutional lender will not be subject to the sale restrictions described above upon default and foreclosure.
The Amended and Restated Foreign Global Hyatt Agreement may be amended, modified, supplemented or restated by the written agreement of 75% of the adult beneficiaries named below and a majority of the other adult beneficiaries party to the agreement. Each of Thomas J. Pritzker, Nicholas J. Pritzker, Jennifer N. Pritzker, John A. Pritzker, Linda Pritzker, Karen L. Pritzker, Penny Pritzker, Daniel F. Pritzker, Anthony N. Pritzker, Gigi Pritzker Pucker and Jay Robert Pritzker, and their respective lineal descendants and current spouse, if relevant, make up a "beneficiary group."
Disputes that relate to the subject matter of the Amended and Restated Foreign Global Hyatt Agreement are subject to arbitration pursuant to the terms of the agreement. The exclusive requirement to arbitrate under the Amended and Restated Foreign Global Hyatt Agreement shall not apply with respect to the manner in which Hyatt's operations are conducted to the extent the parties (in their capacities as stockholders) and non-Pritzker public stockholders are affected comparably; provided, however, that a party may participate in and benefit from any shareholder litigation initiated by a non-party to the agreement. A party to the agreement may not solicit others to initiate or be a named plaintiff in such litigation (i) unless two thirds of the independent directors (excluding for such purposes any Pritzker) of a board of directors having at least three independent directors (excluding for such purposes any Pritzker) do not vote in favor of the matter that is the subject of the litigation or (ii) in the case of affiliated transactions reviewed by our board of directors, unless at least one independent director (excluding for such purposes any Pritzker) did not approve the transaction.
2007 Stockholders' Agreement
In connection with the issuance and sale of 100,000 shares of our Series A Convertible Preferred Stock to GS Sunray Holdings, L.L.C. ("GSSH") and GS Sunray Holdings Parallel, L.L.C. ("GSSHP" and collectively with GSSH, the "Goldman Sachs Funds"), affiliates of Goldman, Sachs & Co., and the execution of a Subscription Agreement in August 2007, we entered into the 2007 Stockholders' Agreement with Madrone GHC, LLC and affiliates (collectively, "Madrone"), the Goldman Sachs Funds and an additional investor that provides for certain rights and obligations of these stockholders, as described below:
In May 2009, the shares of our Series A Convertible Preferred Stock held by the Goldman Sachs Funds were converted into shares of common stock. Such shares of common stock, along with shares of common stock purchased by the Goldman Sachs Funds and Madrone in May 2009 pursuant to the Subscription Agreement and in the May 2009 private placement transaction, and any other shares of common stock held by the parties to the 2007 Stockholders’ Agreement prior to our initial public offering, were reclassified into shares of our Class B common stock upon the filing of our Amended and Restated Certificate of Incorporation on November 4, 2009, the date of our initial public offering. On November 4, 2016, Madrone elected to convert its 10,187,641 shares of Class B common stock into an equal number of shares of Class A common stock (the "November 2016 Conversion") and subsequently began selling such shares of Class A common stock into the public market subject to applicable securities laws. At January 31, 2017, Madrone held 1,977,434 shares of Class A common stock.
Transfer Restrictions
No stockholder party to the 2007 Stockholders' Agreement may transfer (1) the legal or beneficial ownership of any common stock held by such stockholder unless such acquiring person's ownership of common stock is not reasonably likely to jeopardize any licensing from a governmental authority, as determined by our board of directors in its reasonable discretion, (2) any common stock to an aggregator (meaning a person who is required to file a Schedule 13D under the Exchange Act disclosing an interest other than for investment), (3) any common stock to a competitor of ours engaged in one or more of the hospitality, lodging and/or gaming industries or (4) any common stock that would cause a stockholder to violate any provision of the agreement. Such restrictions are qualified by the "actual knowledge" of the transferring stockholder in the case of transfers pursuant to an underwritten public offering or a broad distribution sale.
All other transfer restrictions set forth in the 2007 Stockholders' Agreement expired in May 2015. However, all shares held by such stockholders remain subject to the rights of first refusal (except as described below with respect to shares held by Madrone) and "drag along" rights described below.
19
Right of First Refusal
In the event that the number of shares of common stock proposed to be transferred by a stockholder party to the 2007 Stockholders' Agreement and its affiliates together with any shares of common stock then proposed to be transferred by the other stockholders party to the 2007 Stockholders' Agreement and their affiliates exceeds 2% of the then outstanding shares of common stock, then prior to consummating the sale of common stock to a third-party purchaser, such stockholder or stockholders shall offer to transfer the common stock to us at the applicable market value (as defined in the 2007 Stockholders' Agreement). If we do not accept the offer within a specified period of time, such stockholder or stockholders may transfer the shares of common stock to the third-party purchaser as long as such transfer occurs within the time periods specified in the 2007 Stockholders' Agreement and on terms and conditions no more favorable in the aggregate than those offered to us. We waived all rights of first refusal with respect to shares held by Madrone in connection with the November 2016 Conversion.
"Drag-Along" Right
In connection with a "change of control" (as defined in the 2007 Stockholders' Agreement) transaction, we have the right to require each stockholder party to the 2007 Stockholders' Agreement to participate in such change of control transaction on the same terms, conditions and price per share of common stock as those applicable to the other holders of our common stock. In addition, upon our request, the stockholders party to the 2007 Stockholders' Agreement have agreed to vote in favor of such change of control transaction or similar transaction, and we have the right to require each stockholder party to the 2007 Stockholders' Agreement to vote for, consent to and raise no objection to any such transaction.
"Tag-Along" Right
Subject to the fiduciary duties of our board of directors, we have agreed that we will not agree to consummate a change of control transaction with respect to which the stockholders party to the 2007 Stockholders' Agreement are not given the right to participate on the same terms, conditions and price per share of common stock as those applicable to the other holders of our common stock.
Preemptive Rights
Each stockholder party to the 2007 Stockholders' Agreement has the right to purchase such stockholder's pro rata share of any new shares of common stock, or any other equity securities, that we may propose to sell and issue on comparable terms by making an election within the time periods specified in the 2007 Stockholders' Agreement, subject to certain excluded securities issuances described in the 2007 Stockholders' Agreement, including shares issued pursuant to equity compensation plans adopted by our board of directors and the issuance of shares of our common stock in a public offering. If not all stockholders elect to purchase their full preemptive allocation of new securities, then we will notify the fully-participating stockholders and offer them the right to purchase the unsubscribed new securities.
Voting Agreement
Until the date that Mr. Thomas J. Pritzker is no longer our chairman, each stockholder party to the 2007 Stockholders' Agreement has agreed to vote all of their shares of common stock consistent with the recommendations of a majority of our board of directors with respect to all matters. At January 31, 2017, the stockholders party to the 2007 Stockholders' Agreement own in the aggregate 14,924,445 shares of Class B common stock and 1,977,434 shares of Class A common stock, or approximately
16.4%
of our Class B common stock, approximately 5.0% of our Class A common stock, approximately 12.9% of the total outstanding shares of our common stock and approximately
15.9%
of the total voting power of our outstanding common stock.
Access to Information
For so long as GSSHP owns any shares of common stock, we have agreed that GS Capital Partners VI Parallel, L.P. or its representatives may examine our books and records and visit and inspect our facilities and may reasonably request information at reasonable time and intervals concerning the general status of our financial condition and operations. Additionally, on reasonable prior notice, GS Capital Partners VI Parallel, L.P. or its representatives may discuss our business operations, properties and financial and other conditions with our management, independent accountants and investment bankers. In no event shall we be required to provide access to any information that we reasonably believe would constitute attorney/client privileged communications or would violate any securities laws.
20
Standstill
Under the 2007 Stockholders' Agreement, each stockholder party to the 2007 Stockholders' Agreement agreed that, subject to certain limited exceptions, so long as such stockholder owns shares of common stock, neither such stockholder nor any of its related persons will in any manner, directly or indirectly:
|
•
|
effect or seek, offer or propose (whether publicly or otherwise) to effect, or announce any intention to effect or cause or participate in or in any way assist, facilitate or encourage any other person to effect or seek, offer or propose (whether publicly or otherwise) to effect or participate in, (a) any acquisition of any of our or our subsidiaries' securities (or beneficial ownership thereof) (except through the proper exercise of preemptive rights granted under the 2007 Stockholders' Agreement), or rights or options to acquire any of our or our subsidiaries' securities (or beneficial ownership thereof), or any of our or our subsidiaries' or affiliates' assets, indebtedness or businesses, (b) any tender or exchange offer, merger or other business combination involving us or any of our subsidiaries or affiliates or any assets constituting a significant portion of our consolidated assets, (c) any recapitalization, restructuring, liquidation, dissolution or other extraordinary transaction with respect to us or any of our subsidiaries or affiliates, or (d) any "solicitation" of "proxies" (as such terms are used in the proxy rules under the Exchange Act) or written consents with respect to any of our or our affiliates' voting securities. For this purpose, the term "affiliates" means our affiliates primarily engaged in the hospitality, lodging and/or gaming industries;
|
|
•
|
form, join or in any way participate in a "group" (within the meaning of Section 13(d) of the Exchange Act) with respect to us where such group seeks to acquire any of our equity securities;
|
|
•
|
otherwise act, alone or in concert with others, to seek representation on or to control or influence our or our subsidiaries' management, board of directors or policies;
|
|
•
|
take any action which would or would reasonably be expected to force us to make a public announcement regarding any of the types of matters set forth in the first bullet point above;
|
|
•
|
own more than 12% of the issued and outstanding common stock, unless such ownership arises as a result of any action not taken by or on behalf of such stockholder or a related person of such stockholder; or
|
|
•
|
request that we or any of our representatives, directly or indirectly, amend or waive any of the foregoing provisions.
|
Each stockholder party to the 2007 Stockholders' Agreement has also agreed that, if at any time during the period such stockholder is subject to the foregoing provisions, such stockholder is approached by any third party concerning its participation in any transaction or proposed transaction involving the acquisition of all or any portion of the assets, indebtedness or securities of, or any business of, ours or any of our subsidiaries, such stockholder will promptly inform us of the nature of such transaction and the parties involved.
Termination
The 2007 Stockholders' Agreement terminates (1) with respect to any individual stockholder, on the first date when such stockholder no longer holds any shares of common stock and (2) in its entirety, upon the first to occur of all of our equity securities being owned by a single person or the agreement in writing by us and each stockholder party to the 2007 Stockholders' Agreement.
Our Website and Availability of SEC Reports and Other Information
The Company maintains a website at the following address:
www.hyatt.com
. The information on the Company’s website is not incorporated by reference in this annual report.
We make available on or through our website certain reports and amendments to those reports we file with or furnish to the SEC pursuant to Section 13(a) or 15(d) of the Exchange Act. These include our annual reports on Form 10-K, our quarterly reports on Form 10-Q and our current reports on Form 8-K. We make this information available on our website free of charge as soon as reasonably practicable after we electronically file the information with, or furnish it to, the SEC.
21
Item 1A.
Risk Factors.
In addition to the other information set forth in this annual report, you should consider carefully the risks and uncertainties described below, which could materially adversely affect our business, financial condition, results of operations and cash flows.
Risks Related to the Hospitality Industry
We are subject to macroeconomic and other factors beyond our control as well as the business, financial, operating and other risks of the hospitality industry, all of which may adversely affect our financial results and growth.
Macroeconomic and other factors beyond our control as well as the business, financial, operating and other risks of the hospitality industry can adversely affect demand for hospitality products and services. This includes demand for rooms at properties that we develop, own, operate, manage, franchise, and license. These factors include:
|
•
|
changes and volatility in general economic conditions, including the severity and duration of any downturn in the U.S., Europe or global economy and financial markets;
|
|
•
|
war, civil unrest, terrorist activities or threats and heightened travel security measures instituted in response to these events;
|
|
•
|
fear of outbreaks or outbreaks of pandemic or contagious diseases;
|
|
•
|
climate change and resource scarcity, such as water and energy scarcity;
|
|
•
|
natural or man-made disasters, such as earthquakes, tsunamis, tornados, hurricanes, floods, oil spills and nuclear incidents;
|
|
•
|
changes in the desirability of particular locations or travel patterns of customers;
|
|
•
|
decreased corporate budgets and spending and cancellations, deferrals or renegotiations of group business;
|
|
•
|
low consumer confidence, high levels of unemployment and depressed housing prices;
|
|
•
|
the financial condition of the airline, automotive and other transportation-related industries and its impact on travel;
|
|
•
|
decreased airline capacities and routes;
|
|
•
|
travel-related accidents;
|
|
•
|
oil prices and travel costs;
|
|
•
|
statements, actions or interventions by governmental officials related to travel and corporate travel-related activities, and the resulting negative public perception of such travel and activities;
|
|
•
|
domestic and international political and geo-political conditions, including changes in trade policy;
|
|
•
|
changes in taxes and governmental regulations that influence or set wages, prices, interest rates or construction and maintenance procedures and costs;
|
|
•
|
the costs and administrative burdens associated with compliance with applicable laws and regulations;
|
|
•
|
changes in operating costs, including, but not limited to, labor (including minimum wage increases), energy, food, workers' compensation, benefits, insurance and unanticipated costs resulting from force majeure events;
|
|
•
|
significant increases in cost for healthcare coverage for employees and potential government regulation with respect to health coverage;
|
|
•
|
the lack of availability, or increase in the cost, of capital for us or our existing and potential owners;
|
|
•
|
the attractiveness of our properties to consumers and potential owners and competition from other hotels and alternative lodging marketplaces, including online accommodation search and/or reservation services;
|
|
•
|
cyclical over-building in the hotel, all inclusive and vacation ownership industries; and
|
|
•
|
organized labor activities, which could cause a diversion of business from hotels involved in labor negotiations and loss of group business for our hotels generally as a result of certain labor tactics.
|
These factors, and the reputational repercussions of these factors, can adversely affect, and from time to time have adversely affected, individual properties, particular regions or our business as a whole. How we manage any one or more of these factors, or any crisis, could limit or reduce demand, or the rates our properties are able to charge for rooms or services,
22
which could adversely affect our financial results and growth. These factors can also increase our costs or affect our ability to develop new properties or maintain and operate our existing properties.
The hospitality industry is cyclical and a worsening of global economic conditions or low levels of economic growth could adversely affect our revenues and profitability as well as cause a decline in or limitation of our future growth.
Consumer demand for our products and services is closely linked to the performance of the general economy and is sensitive to business and personal discretionary spending levels. Declines in consumer demand due to adverse general economic conditions, risks affecting or reducing travel patterns, lower consumer confidence and high unemployment or adverse political conditions can lower the revenues and profitability of our owned properties and the amount of management and franchise fee revenues we are able to generate from our managed and franchised properties. In addition, expenses associated with managing, franchising, licensing, or owning hotels and residential and vacation ownership properties are relatively fixed. These costs include personnel costs, interest, rent, property taxes, insurance and utilities, all of which may increase at a greater rate than our revenues and/or may not be able to be reduced at the same rate as declining revenues. Where cost-cutting efforts are insufficient to offset declines in revenues, we could experience a material decline in margins and reduced or negative cash flows. If we are unable to decrease costs significantly or rapidly when demand for our hotels and other properties decreases, the decline in our revenues could have a particularly adverse impact on our net cash flows and profits. This effect can be especially pronounced during periods of economic contraction or slow economic growth. Economic downturns generally affect the results derived from owned properties more significantly than those derived from managed and franchised properties given the greater exposure owners have to the properties' performance. Our proportion of owned and leased properties, compared to the number of properties we manage or franchise for third-party owners, is larger than that of some of our competitors and, as a result, an economic downturn could have a greater adverse effect on our results of operations. As a result, changes in consumer demand and general business cycles can subject and have subjected our revenues, earnings and results of operations to significant volatility.
Uncertainty regarding the future rate and pace of economic growth in different regions of the world makes it difficult to predict future profitability levels. Additionally, if economic weakness were to affect any particular regions of the world, it could have an adverse impact on our revenues and negatively affect our profitability.
Because we derive a portion of our revenues from operations outside the United States, the risks of doing business internationally could lower our revenues, increase our costs, reduce our profits or disrupt our business.
We currently manage, franchise or own hotels and resorts in
56
countries around the world. Our operations outside the United States represented approximately
19%
of our revenues for the year ended
December 31, 2016
. We expect revenues from our international operations may account for an increasing portion of our total revenues in the future.
As a result, we are subject to the risks of doing business outside the United States, including:
|
•
|
the laws, regulations and policies (including taxation policies) of foreign governments relating to investments and operations, the costs or desirability of complying with local practices and customs, and the impact of various anti-corruption and other laws affecting the activities of U.S. companies abroad;
|
|
•
|
currency exchange rate fluctuations or currency restructurings;
|
|
•
|
limitations/penalties on the repatriation of non-U.S. earnings;
|
|
•
|
import and export licensing requirements and regulations, as well as unforeseen changes in regulatory requirements, including imposition of tariffs or embargoes, export regulations and controls and other trade restrictions;
|
|
•
|
political and economic instability;
|
|
•
|
the difficulty of managing an organization doing business in many jurisdictions;
|
|
•
|
uncertainties as to local laws and enforcement of contract and intellectual property rights and occasional requirements for onerous contract clauses; and
|
|
•
|
rapid changes in government, economic and political policies, political or civil unrest, acts of terrorism or the threat of international boycotts or U.S. anti-boycott legislation.
|
While these factors and the impact of these factors are difficult to predict, any one or more of them could lower our revenues, increase our costs, reduce our profits or disrupt our business. In addition, conducting business in currencies other than U.S. dollars subjects us to fluctuations in currency exchange rates, currency devaluations or restructurings that could have a negative impact on our financial results. Our exposure to foreign currency exchange rate fluctuations or currency restructurings will continue to grow if the relative contribution of our operations outside the United States increases.
23
We occasionally enter into foreign exchange hedging agreements with financial institutions to reduce certain of our exposures to fluctuations in currency exchange rates. However, these hedging agreements may not eliminate foreign currency risk entirely and involve costs and risks of their own, such as ongoing management time and expertise and external costs related to executing hedging agreements.
Risks Related to Our Business
Because we operate in a highly competitive industry, our revenues, profits or market share could be harmed if we are unable to compete effectively, and new distribution channels, alternatives to traditional hotels and industry consolidation among our competitors may negatively impact our business.
The segments of the hospitality industry in which we operate are subject to intense competition. Our principal competitors are other operators of full service and select service properties, including other major hospitality chains with well-established and recognized brands. Some of these major hospitality chains are larger than we are based on the number of properties or rooms they manage, franchise or own or based on the number of geographic locations in which they operate. Some of our competitors also have significantly more members participating in their loyalty programs which may enable them to attract more customers and more effectively retain such guests. Our competitors may also have greater financial and marketing resources than we do, which could allow them to improve their properties and expand and improve their marketing efforts in ways that could adversely affect our ability to compete for guests effectively. In addition to these competitors, we also compete against smaller hotel chains and independent and local hotel owners and operators.
Increasingly, we also face competition from new channels of distribution in the travel industry. Additional sources of competition include large companies that offer online travel services as part of their business model, such as Alibaba, search engines such as Google, and peer-to-peer inventory sources that allow travelers to book stays on websites that facilitate the short-term rental of homes and apartments from owners, thereby providing an alternative to hotel rooms, such as Airbnb and HomeAway.
The hospitality industry has experienced and is continuing to experience significant consolidation and we expect this trend may continue as companies attempt to strengthen or hold their market positions in a highly competitive and evolving industry. Consolidation by our competitors will give them increased scale and may enhance their capacity, abilities and resources and lower their cost structure, causing us to be at a competitive disadvantage. If we lose market share or are not able to successfully attract third-party hotel owners to our brands as a result of this consolidation, our results of operations, cash flow, business and overall financial condition could be materially adversely affected.
If the volume of sales made through third-party internet travel intermediaries increases significantly, consumer loyalty to our brand could decrease and our revenues could fall.
We expect to derive most of our business from traditional channels of distribution and our website. However, consumers are increasingly using internet travel intermediaries to book travel. Some of these intermediaries are attempting to increase the importance of generic quality indicators (such as "four-star downtown hotel") at the expense of brand identification. These intermediaries hope that consumers will eventually develop brand loyalties to their reservation system rather than to our brands. Some of these intermediaries have launched their own loyalty programs to further develop loyalties to their reservation system. If the volume of sales made through internet travel intermediaries increases significantly and consumers develop stronger loyalties to these intermediaries rather than to our brands, our distribution costs could increase significantly and our business and revenues could be harmed.
If we are unable to establish and maintain key distribution arrangements for our properties, the demand for our rooms and our revenues could fall.
Increasingly, the rooms at hotels and resorts that we manage, franchise or own are booked through third-party internet travel intermediaries and online travel service providers. We also engage third-party intermediaries, including travel agencies and meeting and event management companies, who collect fees by charging our hotels and resorts a commission on room revenues. A failure by our distributors to attract or retain their customer bases could lower demand for hotel rooms and, in turn, reduce our revenues.
If bookings by these third-party intermediaries increase, these intermediaries typically obtain higher commissions or other potentially significant contract concessions, increasing the overall cost of these third-party distribution channels. Some of our distribution agreements are not exclusive, have a short term, are terminable at will or are subject to early termination provisions. The loss of distributors, increased distribution costs, or the renewal of distribution agreements on less favorable terms could adversely impact our business.
24
Competition for Guests
We compete for guests at our hotels and our all inclusive resorts based primarily on brand name recognition and reputation, location, customer satisfaction, room rates, quality of service, amenities, quality of accommodations, security and the ability to earn and redeem loyalty program points. In addition to competing with other hotel and resort properties, Hyatt-branded vacation ownership properties compete with national and independent vacation ownership club operators as well as with owners reselling their interests in these properties.
Competition for Management and Franchise Agreements
We compete for management agreements based primarily on the value and quality of our management services, our brand name recognition and reputation, our ability and willingness to invest our capital in third-party owned or hospitality venture projects, the level of our management fees, the terms of our management agreements (including compared to the terms our competitors offer), and the economic advantages to the property owner of retaining our management services and using our brand name. We compete for franchise agreements based primarily on brand name recognition and reputation, the room rate that can be realized and royalty fees charged. Other competitive factors for management and franchise agreements are relationships with property owners and investors, availability and affordability of financing, marketing support, reservation and e-commerce system capacity and efficiency, limitations on the expansion of one or more of our brands in certain geographic areas due to restrictions previously agreed to in order to secure management and franchise opportunities, and the ability to make investments that may be necessary to obtain management and franchise agreements.
Competition for Sales of Hyatt-Branded Vacation Ownership Properties
Under a master license agreement with us, ILG is the exclusive worldwide developer, marketer, seller, and manager of vacation ownership and related products under the Hyatt brand. We receive license fees under the licensing agreement, including fees based on sales of vacation ownership units. ILG competes for sales of Hyatt-branded vacation ownership properties based principally on location, quality of accommodations, price, financing terms, quality of service, terms of property use, opportunity to exchange for time at other vacation properties and brand name recognition and reputation. In addition to competing with other hotel and resort properties, Hyatt-branded vacation ownership properties compete with national and independent vacation ownership club operators as well as with owners reselling their interests in these properties, which could reduce demand or prices for new vacation ownership properties. ILG’s ability to attract and retain qualified purchasers of Hyatt-branded vacation ownership properties depends on ILG’s success in distinguishing the quality and value of Hyatt-branded vacation ownership products and services from those offered by others. If ILG is unable to do so, its ability to compete effectively for sales of vacation ownership properties could be adversely affected and our licensing fees could be adversely impacted.
Vacation ownership license agreement with ILG
With the sale of our vacation ownership business, we no longer develop, operate or manage the vacation ownership resorts. Hyatt is also no longer involved in the sale and marketing of vacation ownership interests. ILG or approved third parties conduct these activities using the Hyatt brand. Affiliates of ILG or approved third parties are required to conduct these activities pursuant to operational and performance requirements set forth in the license agreement, but we are exposed to the risks of ILG defaulting under the license agreement. If we are unable to maintain a good relationship with ILG and/or the licensing agreement terminates due to a default by ILG, our revenues could decrease and we may be unable to maintain or expand our presence in the vacation ownership segment. Contractual and other disagreements could expose us to liability or result in litigation costs or other expenses, which could lower our profits.
Adverse incidents at or adverse publicity concerning our properties or our corporate responsibilities could harm our brands and reputation as well as reduce our revenues and lower our profits.
Our brands and our reputation are among our most important assets. Our ability to attract and retain guests depends, in part, upon the external perceptions of Hyatt, the quality of our hotels and services and our corporate and management integrity. An incident involving the potential safety or security of our colleagues or our guests, or adverse publicity regarding safety or security at our competitors' properties or in respect of our third-party vendors or owners and the industry, and any media coverage resulting therefrom, may harm our brands and reputation, cause a loss of consumer confidence in Hyatt and the industry, and negatively impact our results of operations. Additionally, our reputation could be harmed if we fail to act responsibly or are perceived as not acting responsibly or fail to or are perceived to not comply with regulatory requirements in a number of areas such as safety and security, data security, sustainability, responsible tourism, environmental management, human rights and support for local communities. The continued expansion in the use of social media over recent years has compounded the potential scope of the negative publicity that could be generated and could increase our costs, lead to litigation or result in negative publicity that could damage our reputation. Adverse incidents have occurred in the past and may occur in the future.
25
If we are unable to maintain good relationships with third-party property owners and franchisees and/or if we terminate agreements with defaulting third-party property owners and franchisees, our revenues could decrease and we may be unable to maintain or expand our presence.
We earn fees for managing and franchising hotels and other properties. The viability of our management and franchising business depends on our ability to establish and maintain good relationships with third-party property owners and franchisees. Third-party developers, property owners and franchisees are focused on maximizing the value of their investment and working with a management company or franchisor that can help them be successful. The effectiveness of our management, the value of our brands and the rapport we maintain with our third-party property owners and franchisees impact renewals of existing agreements and are also important factors for existing or new third-party property owners or franchisees considering doing business with us. Our relationships with these third parties generate additional property development opportunities that support our growth. In addition, if third-party property owners or franchisees breach the terms of our agreements with them, we may elect to exercise our termination rights, which would eliminate our revenues from these properties and cause us to incur expenses related to terminating these relationships. These risks become more pronounced during economic downturns.
Contractual and other disagreements with third-party property owners or franchisees could make us liable to them or result in litigation costs or other expenses, which could lower our profits.
Our management and franchise agreements require us and third-party property owners or franchisees to comply with operational and performance conditions that are subject to interpretation and could result in disagreements. Additionally, some courts have applied principles of agency law and related fiduciary standards to managers of third-party hotel properties like us, which means, among other things, that property owners may assert the right to terminate management agreements even where the agreements do not expressly provide for termination. In the event of any such termination, we may need to negotiate or enforce our right to damages that may not equal expected profitability over the term of the agreement.
We generally seek to resolve any disagreements with our third-party property owners or franchisees amicably. Formal dispute resolution occurs through arbitration, if provided under the applicable management or franchise agreement, or through litigation. We cannot predict the outcome of any such arbitration or litigation, the effect of any adverse judgment of a court or arbitrator against us or the amount of any settlement we may enter into with any third party.
If our management or franchise agreements terminate prematurely or we elect to make cure payments due to failures to meet performance tests, at the request of third parties or upon the occurrence of other stated events, our revenues could decrease and our costs could increase.
Our management and franchise agreements may terminate prematurely in certain cases. Some of our management agreements provide early termination rights to owners of the hotels we manage upon the occurrence of a stated event, such as the sale of the hotel or our failure to meet a specified performance test.
Generally, termination rights under performance tests are based upon the property's individual performance, its performance when compared to a specified set of competitive hotels branded by other hotel operators, or both. Some agreements require a failure of one test, and other agreements require a failure of more than one test, before termination rights are triggered. These termination rights are usually triggered if we do not meet the performance tests over multiple years. Generally, we have the option to cure performance failures by making an agreed upon cure payment. However, our cure rights may be limited in some cases and the failure to meet the performance tests may result in the termination of our management agreement. In the past we have (1) failed performance tests, received notices of termination and elected to make cure payments and (2) failed performance tests and negotiated an alternative resolution. When any termination notice is received, we evaluate all relevant facts and circumstances at the time in deciding whether to cure. See Part IV, Item 15, "Exhibits and Financial Statement Schedule—Note
14
to the Consolidated Financial Statements" for more information related to performance test payments. In addition, some of our management agreements give third-party property owners the right to terminate upon payment of a termination fee to us after a certain period of time, upon sale of the property or another stated event. Our franchise agreements typically require franchisees to pay a fee to us before terminating. In addition, if an owner files for bankruptcy, our management and franchise agreements may be terminable under applicable law. If a management or franchise agreement terminates, we could lose the revenues we derive from that agreement or incur costs related to ending our relationship with the third party and exiting the property.
26
Certain of our contractual arrangements with third-party owners require us to guarantee payments to the owners if specified levels of operating profit are not achieved by their hotels.
The terms of certain guarantees to hotel owners may require us to fund shortfalls if the hotels do not attain specified levels of operating profit. This guaranteed funding to hotel owners may not be recoverable to us and could lower our profits and reduce our cash flows. As an example, in 2013, we entered into management agreements for four hotels in France and a related performance guarantee for the first seven years of the management agreements. At inception, the performance guarantee stipulated a maximum performance guarantee commitment of
€377 million
, which is reduced by annual payments made under the guarantee. While neither payments to date nor expected payments under this or other guarantees have been or are expected to be significant to our liquidity, future payments under these performance guarantees may adversely affect our financial performance and results of operations.
We are exposed to the risks resulting from significant investments in owned and leased real estate, which could increase our costs, reduce our profits, limit our ability to respond to market conditions or restrict our growth strategy.
Our proportion of owned and leased properties, compared to the number of properties that we manage or franchise for third-party owners, is larger than that of some of our competitors. Real estate ownership and leasing is subject to risks not applicable to managed or franchised properties which could adversely affect our results of operations, cash flow, business and overall financial condition, including:
|
•
|
governmental regulations relating to real estate ownership;
|
|
•
|
real estate, insurance, zoning, tax, environmental and eminent domain laws;
|
|
•
|
the ongoing need for owner funded capital improvements and expenditures to maintain or upgrade properties;
|
|
•
|
risks associated with mortgage debt, including the possibility of default, fluctuating interest rate levels and the availability of replacement financing;
|
|
•
|
risks associated with the possibility that cost increases will outpace revenue increases and that in the event of an economic slowdown, the high proportion of fixed costs will make it difficult to reduce costs to the extent required to offset declining revenues;
|
|
•
|
fluctuations in real estate values or potential impairments in the value of our assets; and
|
|
•
|
the relative illiquidity of real estate compared to some other assets.
|
Cyber risk and the failure to maintain the integrity of customer, colleague or company data could result in faulty business decisions, harm to our reputation and result in a loss of business and/or subject us to costs, fines, investigations, enforcement actions or lawsuits.
We are required to collect, use, and retain large volumes of customer data, including credit card numbers and other personally identifiable information for business, marketing, and other purposes, and our various information technology systems enter, process, summarize and report such data. We also maintain personally identifiable information about our colleagues. We store and process such customer, colleague and company data both at onsite facilities and at third-party owned facilities including, for example, in third-party hosted cloud environments. The integrity and protection of customer, colleague and company data, as well as the continuous operation of our systems, is critical to our business. Our customers and colleagues expect we will adequately protect their personal information. The regulations and contractual obligations applicable to security and privacy are increasingly demanding, both in the United States and in other jurisdictions where we operate, and cyber-criminals regularly target the hospitality industry. In the past, our payment card system was subject to a cyber attack, and we may, in the future, be subjected to cyber threats including attempts to breach our systems and other similar incidents. Because of the scope and complexity of our information technology structure, our reliance on third parties to support and protect our structure and data, and the constantly evolving cyber-threat landscape, our systems may be vulnerable to disruptions, failures, unauthorized access, cyber-terrorism, employee error, negligence, fraud or other misuse. These or similar occurrences, whether accidental or intentional, could result in theft, unauthorized access or disclosure, loss, fraudulent or unlawful use of customer, colleague or company data which could harm our reputation or result in a loss of business, as well as remedial and other costs, fines, investigations, enforcement actions or lawsuits. In order to address these risks, we continue to evolve a risk management framework pursuant to which we place a high priority on cyber security and implement key technologies such as payment card tokenization and point to point encryption, advanced endpoint detection, network segmentation, and secure web and email gateways to continuously reduce the potential impact of a severe cyber attack. We continuously evaluate our security posture throughout the enterprise and continue to make appropriate changes to our operating processes and improve our defenses. We maintain what we believe to be adequate and collectible insurance in the event of the theft, loss, fraudulent or unlawful use of customer, colleague or company data, but the foregoing occurrences or future occurrences could result in costs which may not be covered or may be in excess of any available insurance that we may have procured. As a result, future incidents could have a material impact on our business and adversely affect our financial condition and results of operations.
27
Economic and other conditions may adversely impact the valuation of our assets resulting in impairment charges that could have a material adverse impact on our results of operations and earnings.
We hold significant amounts of goodwill, intangible assets, property and equipment and investments. On a regular basis, we evaluate our assets for impairment based on various triggers, including actual operating losses and trends of projected revenues and profitability, as described in Part II, Item 7, "Management's Discussion and Analysis of Financial Condition and Results of Operations—Critical Accounting Policies and Estimates." During times of economic distress, declining demand and declining earnings often result in declining asset values. As a result, we have incurred and we may incur future impairment charges, which could be material and may adversely affect our results of operations.
We have a limited ability to manage third-party risks associated with our hospitality venture investments, which could reduce our revenues, increase our costs, lower our profits and increase our liabilities.
We participate in numerous hospitality ventures with third parties. In the future, we may also buy and develop properties in hospitality ventures with the sellers of the properties, affiliates of the sellers, developers or other third parties. Our hospitality venture partners may have shared or majority control over the operations of our hospitality ventures. As a result, our investments in hospitality ventures involve risks that are different from the risks involved in investing in real estate independently. These risks include the possibility that our hospitality ventures or our partners:
|
•
|
go bankrupt or otherwise are unable to meet their capital contribution obligations;
|
|
•
|
have economic or business interests or goals that are or become inconsistent with our business interests or goals;
|
|
•
|
are in a position to take action contrary to our instructions, our requests, our policies, our objectives or applicable laws;
|
|
•
|
subject the property to liabilities exceeding those contemplated;
|
|
•
|
take actions that reduce our return on investment; or
|
|
•
|
take actions that harm our reputation or restrict our ability to run our business.
|
For these and other reasons, it could be more difficult for us to sell our interest in any hospitality venture or to pursue the venture's activities, which could reduce our ability to address any problems we may have with those properties or respond to market conditions in the future and could lead to impairments of such investments. As a result, our investments in hospitality ventures could lead to impasses with our partners or situations that could harm the hospitality venture, which could reduce our revenues, increase our costs and lower our profits.
In addition, in conjunction with financing obtained for our hospitality ventures, we may provide debt repayment guarantees, standard indemnifications to lenders for loss, liability or damage occurring as a result of our actions or actions of the other hospitality venture owners.
If our hospitality ventures fail to provide accurate and/or timely information that is required to be included
in our financial statements, we may be unable to accurately report our financial results.
Preparing our financial statements requires us to have access to information regarding the results of operations, financial position and cash flows of our hospitality ventures. Any deficiencies in our hospitality ventures' internal controls over financial reporting may affect our ability to report our financial results accurately or prevent fraud. Such deficiencies could also result in restatements of, or other adjustments to, our previously reported or announced operating results, which could diminish investor confidence and reduce the market price for our shares. Additionally, if our hospitality ventures are unable to provide this information for any meaningful period or fail to meet expected deadlines, we may be unable to satisfy our financial reporting obligations or file our periodic reports in a timely manner.
Cash distributions from our hospitality ventures could be limited by factors outside our control that could reduce our return on investment and our ability to generate liquidity from these hospitality ventures.
Although our hospitality ventures may generate positive cash flow, in some cases these hospitality ventures may be unable to distribute that cash to the hospitality venture partners. Additionally, in some cases our hospitality venture partners control distributions, and may choose to leave capital in the hospitality venture rather than distribute it. Because our ability to generate liquidity from our hospitality ventures depends on the hospitality ventures' ability to distribute capital to us, tax considerations or decisions of our hospitality venture partners could reduce our return on these investments. We include our pro rata share of Adjusted EBITDA attributable to our unconsolidated hospitality ventures in our owned and leased hotels segment Adjusted EBITDA and our consolidated Adjusted EBITDA regardless of whether the cash flow of those ventures is, or can be, distributed to us.
28
We may seek to expand through acquisitions of and investments in other businesses and properties, or through alliances, and we may also seek to divest some of our properties and other assets; these acquisition and disposition activities may be unsuccessful or divert our management's attention.
We consider strategic and complementary acquisitions of and investments in other businesses, properties, brands or other assets as part of our growth strategy. For example, in January 2017 we acquired Miraval Group, which forms a distinct new wellness category within our portfolio of brands and extends the Hyatt brand beyond traditional hotel stays. We may pursue opportunities in alliance with existing or prospective owners of managed or franchised properties. In many cases, we will be competing for these opportunities with third parties that may have substantially greater financial resources than we do. Acquisitions or investments in hospitality companies, businesses, properties, brands or assets, as well as these alliances, are subject to risks that could affect our business, including risks related to:
|
•
|
issuing shares of stock that could dilute the interests of our existing stockholders;
|
|
•
|
spending cash and incurring debt;
|
|
•
|
assuming contingent liabilities;
|
|
•
|
contributing properties or related assets to hospitality ventures that could result in recognition of losses; or
|
|
•
|
creating additional expenses.
|
We cannot assure you that we will be able to identify opportunities or complete transactions on commercially reasonable terms or at all, or that we will actually realize any anticipated benefits from such acquisitions, investments or alliances. There may be high barriers to entry in many key markets and scarcity of available development and investment opportunities in desirable locations. Similarly, we cannot assure you that we will be able to obtain financing for acquisitions or investments on attractive terms or at all, or that the ability to obtain financing will not be restricted by the terms of our revolving credit facility or other indebtedness we may incur.
The success of any such acquisitions or investments, including the acquisition of Miraval Group, will also depend, in part, on our ability to integrate the acquisition or investment with our existing operations. We may experience difficulty with integrating acquired businesses, properties or other assets, including difficulties relating to:
|
•
|
coordinating sales, distribution and marketing functions;
|
|
•
|
integrating technology information systems; and
|
|
•
|
preserving the important licensing, distribution, marketing, customer, labor and other relationships of the acquired assets.
|
Additionally, we regularly review our business to identify properties or other assets we believe are in markets or of a property type that may not benefit us as much as other markets or property types. One of our strategies is to selectively dispose of hotel properties and use sale proceeds to fund our growth in markets and with properties that will enhance and expand our brand presence. For example, in 2016 we sold Andaz 5th Avenue. We cannot assure you that we will be able to consummate any such sales on commercially reasonable terms or at all, or that we will actually realize any anticipated benefits from such sales. Dispositions of real estate assets can be particularly difficult in a challenging economic environment, as financing alternatives are often limited for potential buyers. Our inability to sell assets, or to sell such assets at attractive prices, could have an adverse impact on our ability to realize proceeds for reinvestment and hinder our ability to expand our business. In addition, even if we are successful in consummating sales of selected properties, such dispositions may result in losses.
Any such acquisitions, investments, dispositions or alliances could also demand significant attention from our management that would otherwise be available for our regular business operations, which could harm our business.
Timing, budgeting and other risks could result in delays or cancellations of our efforts to develop, redevelop or renovate the properties that we own, or make these activities more expensive, which could reduce our profits or impair our ability to compete effectively.
We must maintain and renovate the properties that we own in order to remain competitive, maintain the value and brand standards of our properties and comply with applicable laws and regulations. We also selectively undertake ground-up construction of properties. Often these projects include hospitality venture partners. These efforts are subject to a number of risks, including:
|
•
|
construction delays or cost overruns (including labor and materials) that may increase project costs;
|
|
•
|
obtaining zoning, occupancy and other required permits or authorizations;
|
|
•
|
changes in economic conditions that may result in weakened or lack of demand or negative project returns;
|
29
|
•
|
governmental restrictions on the size or kind of development;
|
|
•
|
force majeure events, including earthquakes, tornados, hurricanes, floods or tsunamis; and
|
|
•
|
design defects that could increase costs.
|
Additionally, developing new properties typically involves lengthy development periods during which significant amounts of capital must be funded before the properties begin to operate and generate revenue. If the cost of funding new development exceeds budgeted amounts, and/or the time period for development is longer than initially anticipated, our profits could be reduced. Further, due to the lengthy development cycle, intervening adverse economic conditions may alter or impede our development plans, thereby resulting in incremental costs to us or potential impairment charges. Moreover, during the early stages of operations, charges related to interest expense and depreciation may substantially detract from, or even outweigh, the profitability of certain new property investments.
Similarly, the cost of funding renovations and capital improvements may exceed budgeted amounts. Additionally, the timing of renovations and capital improvements can affect, and historically has affected, property performance, including occupancy and average daily rate, particularly if we need to close a significant number of rooms or other facilities, such as ballrooms, meeting spaces or restaurants. Moreover, the investments that we make may fail to improve the performance of the properties in the manner that we expect.
Some of our existing development pipeline may not be developed into new hotels, which could materially adversely affect our growth prospects.
As of
December 31, 2016
, our executed contract base consisted of approximately 305 hotels, or approximately 66,000 rooms. The commitments of owners and developers with whom we have agreements are subject to numerous conditions, and the eventual development and construction of our pipeline not currently under construction is subject to numerous risks, including, in certain cases, obtaining governmental and regulatory approvals and adequate financing. As a result, we cannot assure you that our entire development pipeline will be completed and developed into new hotels.
If our third-party property owners, including our hospitality venture partners, are unable to repay or refinance loans secured by the mortgaged properties, our revenues, profits and capital resources could be reduced and our business could be harmed.
Many of the properties that our third-party property owners and our hospitality venture partners own are pledged as collateral for mortgage loans entered into when such properties were purchased or refinanced. If our third-party property owners or our hospitality venture partners are unable to repay or refinance maturing indebtedness on favorable terms or at all, the lenders could declare a default, accelerate the related debt and repossess the property. Any sales or repossessions could, in certain cases, result in the termination of our management agreements and eliminate anticipated income and cash flows, which could negatively affect our results of operations.
If we or our third-party owners, franchisees or development partners are unable to access the capital necessary to fund current operations or implement our plans for growth, our profits could be reduced and our ability to compete effectively could be diminished.
The hospitality industry is a capital intensive business that requires significant capital expenditures to develop, operate, maintain and renovate properties. Access to the capital that we or our third-party owners, franchisees or development partners need to finance the construction of new properties or to maintain and renovate existing properties is critical to the continued growth of our business and our revenues.
The availability of capital or the conditions under which we or our third-party owners, franchisees or development partners can obtain capital can have a significant impact on the overall level, cost and pace of future development and therefore the ability to grow our revenues. The most recent economic downturn caused credit markets to experience significant disruption severely reducing liquidity and credit availability. Such disruptions may diminish the ability and desire of existing and potential development partners to access capital necessary to develop properties. Our ability to access additional capital could also be limited by the terms of our revolving credit facility, which restricts our ability to incur debt under certain circumstances. Additionally, if one or more of the financial institutions that support our revolving credit facility fails, we may not be able to find a replacement, which would reduce the availability of funds that we can borrow under the facility.
If we are forced to spend larger amounts of cash from operating activities than anticipated to operate, maintain or renovate existing properties, then our ability to use cash for other purposes, including acquisition or development of other businesses, properties, brands or other assets could be limited and our profits could be reduced. Similarly, if we cannot access
30
the capital we need to fund our operations or implement our growth strategy, we may need to postpone or cancel planned renovations or developments, which could impair our ability to compete effectively and harm our business.
If we become liable for losses related to loans we have provided or guaranteed to third parties, our profits could be reduced.
At times, we make loans for hotel development expenditures when we enter into management or franchise agreements with third parties, including hospitality ventures. In certain circumstances we may also provide senior secured financing or subordinated forms of financing (also referred to as mezzanine financing) to third-party owners. We could suffer losses if third-party property owners or franchisees default on loans that we provide. Additionally, we may provide third-party lenders financial guarantees related to the timely repayment of all or a portion of the associated debt of certain of our hospitality ventures and managed hotels. The guarantees may be for the full amount of the debt or may be limited to a portion of the debt. We typically obtain reimbursement agreements from our partner(s) or other third parties with the intent to limit our exposure to our share of the debt. See Part IV, Item 15, "Exhibits and Financial Statement Schedule—Note
6
to the Consolidated Financial Statements" for more information related to our loans and other financing arrangements and "Exhibits and Financial Statement Schedule—Note
14
to the Consolidated Financial Statements" for more information related to our guarantees.
Our debt service obligations may adversely affect our cash flow and reduce our operational flexibility.
The terms of the indenture governing our Senior Notes (as defined in Part IV, Item 15, "Exhibits and Financial Statement Schedule—Note
9
to the Consolidated Financial Statements") and those of our revolving credit facility subject us to the following:
|
•
|
a risk that cash flow from operations will be insufficient to meet required payments of principal and interest;
|
|
•
|
restrictive covenants, including covenants related to certain financial ratios. See Part II, Item 7, "Management's Discussion and Analysis of Financial Condition and Results of Operations—Liquidity and Capital Resources" for further information related to restrictions under our financial covenants; and
|
|
•
|
the risk that any increase in the interest rate applicable to any borrowings under our revolving credit facility could reduce our cash flows available for other corporate purposes, including investments in our portfolio, could limit our ability to refinance existing debt when it matures or could increase interest costs on any debt that is refinanced.
|
Although we anticipate we will be able to repay or refinance our existing indebtedness when it matures, there can be no assurance we will be able to do so, or that the terms of such refinancing will be favorable.
A substantial decrease in operating cash flow, consolidated EBITDA (as defined in our revolving credit facility) or a substantial increase in our expenses may make it difficult for us to meet our existing debt service requirements and restrictive covenants. As a result, we could be forced to sell assets and/or modify our operations. Our existing leverage may also impair our ability to obtain additional financing for acquisitions, working capital, capital expenditures or other purposes, if necessary, or require us to accept terms otherwise unfavorable to us.
Rating agency downgrades may increase our cost of capital.
The interest rate on borrowings and the facility fee under our revolving credit facility are determined by a pricing grid, which is dependent in part on our credit ratings by Standard & Poor's Financial Services, LLC, a subsidiary of McGraw Hill Financial, Inc. ("S&P"), and Moody's Investors Service, Inc. ("Moody's"). Lower ratings result in a higher cost of funds. Therefore, subject to any adjustments to the interest rate based on our leverage ratio, if these independent rating agencies were to downgrade our credit ratings or if we no longer have a credit rating from either agency, the cost of our borrowing and the amount of the facility fee under our revolving credit facility will increase as specified in the pricing grid. Additionally, any future downgrade of our credit ratings by the rating agencies could reduce or limit our access to capital and increase our cost of capital.
If we or our third-party owners are not able to maintain our current brand standards or develop new initiatives, including new brands, successfully, our business and profitability could be harmed.
We manage and franchise properties owned by third parties under the terms of management and franchise agreements. Substantially all of these agreements require third-party property owners or franchisees to comply with standards that are essential to maintaining our brand integrity and reputation. We depend on third-party property owners or franchisees to comply with these requirements by maintaining and improving properties through investments, including investments in furniture, fixtures, amenities and personnel. If our third-party property owners or franchisees fail to make investments necessary to maintain or improve the properties we manage or franchise, our brand preference and reputation could suffer. Moreover, third-party owners or franchisees may be unwilling or unable to incur the cost of complying with brand standards for new and
31
existing brands as such brands may evolve from time to time. As a result, we may be forced to absorb such costs to ensure that brand standards come to market in a timely fashion.
In addition, we are continually developing and launching new initiatives, including new brands or marketing programs, which can be a time-consuming and expensive process. For example, in January 2017 we acquired Miraval Group, which extended the Hyatt brand beyond traditional hotel stays. We have invested capital and resources in owned real estate, property development, brand development and brand promotion. If such initiatives are not well received by our colleagues, guests and owners, they may not have the intended effect. We may not be able to recover the costs incurred in developing and launching new brands or other initiatives or to realize their intended or projected benefits, which could lower our profits.
We are dependent on our global loyalty program to build loyalty for our brands and drive revenue and our business could be negatively impacted if we are unable to successfully implement our new global loyalty program, World of Hyatt.
We rely on our loyalty program as a platform for engagement with our most loyal guests, providing increased benefits and recognition as they continue to engage with Hyatt. We believe World of Hyatt will develop loyalty by fostering personal relationships and creating emotional connections that inspire brand preference. The success of our business depends in part on attracting new customers and on the continued participation of loyalty members in our new World of Hyatt program. If guests do not accept our new program or if we are unable to implement the program successfully, our business could be adversely impacted.
Labor shortages could restrict our ability to operate our properties or grow our business or result in increased labor costs that could reduce our profits.
Our success depends in large part on our ability to attract, retain, train, manage and engage our colleagues. Our properties are staffed 24 hours a day, seven days a week by thousands of colleagues around the world. If we and our franchisees are unable to attract, retain, train and engage skilled colleagues, our ability to manage and staff our properties adequately could be impaired, which could reduce customer satisfaction. Staffing shortages could also hinder our ability to grow and expand our business. Because payroll costs are a major component of the operating expenses at our properties, a shortage of skilled labor could also require higher wages that would increase our labor costs, which could reduce our profits and the profits of our third-party owners.
Negotiations of collective bargaining agreements, attempts by labor organizations to organize additional groups of our colleagues or changes in labor laws could disrupt our operations, increase our labor costs or interfere with the ability of our management to focus on executing our business strategies.
Certain of our properties are subject to collective bargaining agreements, similar agreements or regulations enforced by governmental authorities. If relationships with our colleagues, other field personnel or the unions that represent them become adverse, the properties we manage, franchise or own could experience labor disruptions such as strikes, lockouts and public demonstrations. Labor disruptions, which are generally more likely when collective bargaining agreements are being renegotiated, could harm our relationship with our colleagues or cause us to lose guests. Further, adverse publicity in the marketplace related to union messaging could further harm our reputation and reduce customer demand for our services. Labor regulation, including minimum wage legislation, could lead to higher wage and benefit costs, changes in work rules that raise operating expenses, legal costs, and limitations on our ability or the ability of our third-party property owners and franchisees to take cost saving measures during economic downturns. We do not have the ability to control the negotiations of collective bargaining agreements covering unionized labor employed by third-party property owners and franchisees.
We and our third-party property owners and franchisees may also become subject to additional collective bargaining agreements in the future. Potential changes in the federal regulatory scheme could make it easier for unions to organize groups of our colleagues. If such changes take effect, more of our colleagues or other field personnel could be subject to increased organizational efforts, which could potentially lead to disruptions or require more of our management's time to address unionization issues. These or similar agreements, legislation or changes in regulations could disrupt our operations, hinder our ability to cross-train and cross-promote our colleagues due to prescribed work rules and job classifications, reduce our profitability or interfere with the ability of our management to focus on executing our business strategies.
32
The loss of our senior executives or key field personnel, such as our general managers, could significantly harm our business.
Our ability to maintain our competitive position is dependent to a large degree on the efforts and skills of our senior executives. We have entered into employment letter agreements with certain of our senior executives. However, we cannot guarantee that these individuals will remain with us. Finding suitable replacements for our senior executives could be difficult. We currently do not have a life insurance policy or key person insurance policy with respect to any of our senior executives. Losing the services of one or more of these senior executives could adversely affect our strategic relationships, including relationships with our third-party property owners, franchisees, hospitality venture partners and vendors, and limit our ability to execute our business strategies.
We also rely on the general managers at each of our managed properties to run daily operations and oversee our colleagues. These general managers are trained professionals in the hospitality industry and have extensive experience in many markets worldwide. The failure to retain, train or successfully manage our general managers for our properties could negatively affect our operations.
Our failure to comply with applicable laws and regulations may increase our costs, reduce our profits or limit our growth.
Our business, properties and colleagues are subject to a variety of laws and regulations. Generally, these laws and regulations address our sales and marketing and advertising efforts, our handling of privacy issues and customer data, our anti-corruption efforts, our ability to obtain licenses for business operations such as sales of food and liquor, and matters relating to immigration, the environment, health and safety, health care, gaming, competition and trade, among other things.
Our franchising and licensing businesses and our operations outside the United States are also subject to laws and regulations affecting those businesses.
Franchising
Our franchising business is subject to various state laws, as well as to regulations enacted by the Federal Trade Commission ("FTC"). A number of states require franchisors to register with the state or to make extensive disclosures to potential franchisees in connection with offers and sales in those states. The FTC also regulates the manner and substance of our disclosures to prospective franchisees. In addition, several states have "franchise relationship laws" or "business opportunity laws" that limit the ability of franchisors to terminate franchise agreements or to withhold consent to the renewal or transfer of those agreements.
Vacation Ownership
Our licensed vacation ownership properties are subject to extensive state regulation in both the state in which the property is located and the states in which the property is marketed and sold. Marketing for these properties is also subject to federal regulation of certain marketing practices, including federal telemarketing regulations.
International Operations
Our business operations in countries outside the United States are subject to a number of U.S. federal laws and regulations, including restrictions imposed by the Foreign Corrupt Practices Act ("FCPA") as well as trade sanctions administered by the Office of Foreign Assets Control ("OFAC") and the Commerce Department. The FCPA is intended to prohibit bribery of foreign officials or parties and requires public companies in the United States to keep books and records that accurately and fairly reflect those companies' transactions. OFAC and the Commerce Department administer and enforce economic and trade sanctions based on U.S. foreign policy and national security goals against targeted foreign states, organizations and individuals. Some of our business operations are also subject to the laws and regulations of non-U.S. jurisdictions, including the U.K. Bribery Act and anti-corruption legislation in the countries in which we conduct operations.
If we, or our hospitality ventures, fail to comply with these laws and regulations, we could be exposed to claims for damages, financial penalties, reputational harm, incarceration of our colleagues or restrictions on our operation or ownership of hotels and other properties, including the termination of our management, franchise and ownership rights. These restrictions could increase our costs of operations, reduce our profits or cause us to forgo development opportunities that would otherwise support our growth.
33
The Iran Threat Reduction and Syria Human Rights Act of 2012 could result in investigations by the U.S. Government against our Company and could
harm our reputation and brands.
The Iran Threat Reduction and Syria Human Rights Act of 2012 ("ITRSHR Act") expanded sanctions against Iran and Syria. In addition, the ITRSHR Act instituted disclosure requirements in annual and quarterly reports for public companies engaged in, or affiliated with an entity engaged in, specified activities under the ITRSHR Act. A company subject to Section 219 of the ITRSHR Act must make detailed disclosures about certain activities knowingly conducted by it or any of its affiliates. No activities in 2016 required any disclosure. In the event Hyatt were to engage in certain activities that are subject to disclosure pursuant to Section 219 of the ITRSHR Act and Section 13(r) of the Exchange Act, we would be required to separately file, concurrently with any ITRSHR Act disclosure, a notice that such activities were disclosed in our quarterly or annual report filings, which notice must also contain the information required by Section 13(r) of the Exchange Act. The SEC is required to post this notice of disclosure on its website and send the report to the President and certain Congressional committees. The President thereafter is required to initiate an investigation and, within 180 days of initiating such an investigation, to determine whether sanctions should be imposed on the Company. Disclosure of such activities, even if they are not subject to sanctions under applicable law, and any sanction actually imposed on us or our affiliates as a result of these activities, could harm our reputation and brands and have a negative impact on our results of operations.
Adverse judgments or settlements resulting from legal proceedings in which we may be involved in the normal course of our business could reduce our profits or limit our ability to operate our business.
In the normal course of our business, we are often involved in various legal proceedings. The outcome of these proceedings cannot be predicted. If any of these proceedings were to be determined adversely to us or a settlement involving a payment of a material sum of money were to occur, there could be a material adverse effect on our financial condition and results of operations. Additionally, we could become the subject of future claims by third parties, including current or former third-party property owners or franchisees, guests who use our properties, our employees, our investors or regulators. Any significant adverse judgments or settlements would reduce our profits and could limit our ability to operate our business. Further, we may incur costs related to claims for which we have appropriate third-party indemnity if such third parties fail to fulfill their contractual obligations.
The extensive environmental requirements to which we are subject could increase our environmental costs and liabilities, reduce our profits or limit our ability to run our business.
Our operations and the properties we develop, own and manage are subject to extensive environmental laws and regulations of various federal, state, local and foreign governments, including requirements addressing:
|
•
|
health and safety;
|
|
•
|
the use, management and disposal of hazardous substances and wastes;
|
|
•
|
discharges of waste materials into the environment, such as refuse or sewage; and
|
|
•
|
air emissions.
|
We could be subject to liability under some of these laws for the costs of investigating or remediating hazardous substances or wastes on, under, or in real property we currently or formerly manage, own or develop, or third-party sites where we sent hazardous substances or wastes for disposal. We could be held liable under these laws regardless of whether we knew of, or were at fault in connection with, the presence or release of any such hazardous or toxic substances or wastes. Some of these laws make each covered person responsible for all of the costs involved, even if more than one person may have been responsible for the contamination. Furthermore, a person who arranges for hazardous substances or wastes to be transported, disposed of or treated offsite, such as at disposal or treatment facilities, may be liable for the costs of removal or remediation if those substances are released into the environment by third parties at such disposal or treatment facilities. The presence or release of hazardous or toxic substances or wastes, or the failure to properly clean up such materials, could cause us to incur significant costs, or jeopardize our ability to develop, use, sell or rent real property we own or operate or to borrow using such property as collateral.
Other laws and regulations require us to manage, abate or remove materials containing hazardous substances such as mold, lead or asbestos during demolitions, renovations or remodeling at properties that we develop, own or manage or to obtain permits for certain of our equipment or operations. The costs of such management, abatement, removal or permitting could be substantial. Complying with these laws and regulations, or addressing violations arising under them, could increase our environmental costs and liabilities, reduce our profits or limit our ability to run our business. Existing environmental laws and regulations may be revised or new laws and regulations related to global climate change, air quality, or other environmental and health concerns may be adopted or become applicable to us. The identification of new areas of contamination, a change in the
34
extent or known scope of contamination or changes in cleanup requirements, or the adoption of new requirements governing our operations could have a material adverse effect on our results or operations, financial condition and business.
If the insurance that we, our owners, hospitality ventures or franchisees carry does not sufficiently cover damage or other potential losses or liabilities involving properties that we own, manage or franchise, our profits could be reduced.
We, our owners, hospitality ventures, and our franchisees carry insurance from solvent insurance carriers that we believe is adequate for foreseeable losses and with terms and conditions that are reasonable and customary. Nevertheless, market forces beyond our control could limit the scope of the insurance coverage that we, our owners, hospitality ventures or our franchisees can obtain or restrict our ability, our owners' ability or our franchisees' ability to buy insurance coverage at reasonable rates. In the event of a substantial loss, the insurance coverage that we carry, our owners, hospitality ventures or franchisees carry may not be sufficient to pay the full value of our financial obligations, our liabilities or the replacement cost of any lost investment or property loss. In addition, there are other risks that may fall outside of the general coverage limits of our policies, may be uninsurable, or with respect to which the cost of insurance is too expensive to justify. In some cases, these factors could result in certain losses being completely uninsured. As a result, we could lose some or all of the capital we have invested in a property, as well as the anticipated future revenues, profits, management fees or incentive income from the property, we could remain obligated for performance guarantees in favor of third-party property owners or for their debt or other financial obligations, suffer an uninsured or underinsured property loss or we may not have sufficient insurance to cover awards of damages resulting from our liabilities. If the insurance that we carry, our owners, hospitality ventures or franchisees carry does not sufficiently cover damages or other losses or liabilities, our profits could be adversely affected.
Any failure to protect our trademarks and intellectual property could reduce the value of our brand names and harm our business.
The reputation and perception of our brands are critical to our success in the hospitality industry. We regularly apply to register our trademarks in the United States and other countries. However, we cannot assure you that those trademark registrations will be granted or that the steps we take to protect our trademarks or intellectual property in the United States and other countries will be adequate to prevent others, including third parties or former colleagues, from copying or using our trademarks or intellectual property without authorization. Our intellectual property is also vulnerable to unauthorized use in some countries outside the United States, where we may not be adequately protected by local law. If our trademarks or intellectual property are copied or used without authorization, the value of our brands, their reputation, our competitive advantages and our goodwill could be harmed.
Monitoring the unauthorized use of our intellectual property is difficult. We may need to resort to litigation to enforce our intellectual property rights. Litigation of this type could be costly, force us to divert our resources, lead to counterclaims or other claims against us or otherwise harm our business.
Third-party claims that we infringe their intellectual property rights could subject us to damages and other costs and expenses.
Third parties may make claims against us for infringing their intellectual property rights. Any such claims, even those without merit, could:
|
•
|
be expensive and time consuming to defend;
|
|
•
|
force us to stop providing products or services that use the intellectual property that is being challenged;
|
|
•
|
force us to redesign or rebrand our products or services;
|
|
•
|
divert our management's attention and resources;
|
|
•
|
force us to enter into royalty or licensing agreements to obtain the right to use a third-party's intellectual property; or
|
|
•
|
force us to pay significant damages.
|
In addition, we may be required to indemnify third-party owners of the hotels we manage or franchise for any losses they incur as a result of any such infringement claims. Any necessary royalty or licensing agreements may not be available to us on acceptable terms. Any costs, lost revenues, changes to our business or management attention related to intellectual property claims against us, whether successful or not, could impact our business.
35
Information technology system failures, delays in the operation of our information technology systems or system enhancement failures could reduce our revenues and profits and harm the reputation of our brands and our business.
Our success depends on the efficient and uninterrupted operation of our information technology systems. For example, we depend on our central reservation system, which allows bookings by hotels directly, via telephone through our call centers, by travel agents, online through our website
www.hyatt.com
, and through our online reservations partners. In addition, we depend on information technology to run our day-to-day operations, including, among others, hotel services and amenities such as guest check-in and check-out, housekeeping and room service and systems for tracking and reporting our financial results and the financial results of our hotels.
Our information technology systems are vulnerable to damage or interruption from fire, floods, hurricanes, power loss, telecommunications failures, computer viruses, break-ins and similar events. The occurrence of any of these natural disasters or unanticipated problems at any of our information technology facilities or any of our call centers could cause interruptions or delays in our business or loss of data, or render us unable to process reservations.
In addition, if our information technology systems are unable to provide the information communications capacity that we need, or if our information technology systems suffer problems caused by installing system enhancements, we could experience similar failures or interruptions. If our information technology systems fail and our redundant systems or disaster recovery plans are not adequate to address such failures, or if our property and business interruption insurance does not sufficiently compensate us for any losses that we may incur, our revenues and profits could be reduced and the reputation of our brands and our business could be harmed.
If we fail to stay current with developments in technology necessary for our business, our operations could be harmed and our ability to compete effectively could be diminished.
Sophisticated information technology and other systems are instrumental for the hospitality industry, including systems used for our central reservations, revenue management, property management and global loyalty program, as well as technology systems that we make available to our guests. These information technology and other systems must be refined, updated or replaced with more advanced systems on a regular basis. Developing and maintaining these systems may require significant capital. If we are unable to replace or introduce information technology and other systems as quickly as our competitors or within budgeted costs or schedules when these systems become outdated or need replacing, or if we are unable to achieve the intended benefits of any new information technology or other systems, our operations could be harmed and our ability to compete effectively could be diminished.
Changes in federal, state, local or foreign tax law, interpretations of existing tax law or agreements or disputes with tax authorities could affect our profitability and financial condition by increasing our tax costs.
Our global operations subject us to income and non-income based taxes such as sales, use, value added, goods and services, payroll, property and franchise taxes in numerous jurisdictions. Our future tax expenses and liabilities could be affected by changes in tax laws or the interpretation of the tax laws, as well as changes in our business operations. Our future tax expense could be affected by changes in the composition of earnings in jurisdictions with differing tax rates, changes in the valuation of our deferred tax assets and liabilities, or changes in determinations regarding the jurisdictions in which we are subject to tax. From time to time the U.S. federal, state, local and foreign governments make substantive changes to tax rules and the application thereof, such as current proposals for U.S. tax reform and the Base Erosion and Profit Shifting project ("BEPS") being undertaken by the Organization for Economic Cooperation and Development. Although we believe our transfer pricing policy implemented in 2015 is in alignment with BEPS and we have filed a request to obtain certainty regarding our transfer pricing policy by filing for an Advanced Pricing Agreement, legislative changes and the interpretation thereof could result in materially higher corporate taxes than would be incurred under existing tax law or interpretation and could adversely impact profitability. State and local tax authorities have also increased their efforts to increase revenues through changes in tax law and audits. Such changes and proposals, if enacted, could increase our future effective income tax rates.
We are subject to on-going and periodic audits by the Internal Revenue Service ("IRS") and various state, local and foreign tax authorities and currently are engaged in disputes with certain of such tax authorities. We believe we have established adequate reserves for potential tax liabilities, but the final amount of taxes assessed and paid could exceed the amount of such reserves, which could reduce our profits and cash position. We are a party to certain agreements with foreign tax authorities that reduce or defer the amount of tax we pay. The expiration of such agreements, or changes in circumstances or in interpretation of such agreements, could increase our tax costs.
36
We are exposed to counterparty and credit risk and fluctuations in the market values of our investment portfolio.
All of our cash that is not required to fund our daily operating activities is invested in interest bearing investments with a greater focus placed on capital preservation than on investment return. The majority of our cash and cash equivalent balances are held on deposit with high quality financial institutions that hold long-term ratings of at least BBB or Baa from S&P or Moody's, respectively, and in AAA-rated money market funds. As such, we are exposed to counterparty risk on our cash and cash equivalent balances at
December 31, 2016
. We also have established investment accounts for purposes of investing portions of our cash resources for our loyalty program, certain benefit programs and captive insurance company. Although we have not recognized any significant losses to date on these investments, any significant declines in their market values could materially adversely affect our financial condition and operating results. Credit ratings and pricing of these investments can be negatively affected by liquidity, credit deterioration, financial results, economic risk, political risk, sovereign risk or other factors. As a result, the value and liquidity of our investments could decline and result in impairments, which could materially adversely affect our financial condition and operating results.
Risks Related to Share Ownership and Other Stockholder Matters
As a public company, we incur significant costs which may adversely affect our operating results and financial condition.
As a public company, we have incurred and will continue to incur significant legal, accounting and other expenses, including costs associated with public company reporting requirements. The expenses incurred by public companies generally for reporting and corporate governance purposes have been increasing. We invest in resources to comply with evolving laws and regulations, and this investment may result in increased general and administrative expenses and a diversion of management's time and attention from revenue-generating activities to compliance activities. These laws and regulations could also make it more difficult or costly for us to obtain certain types of insurance, including director and officer liability insurance, and we may be forced to accept reduced policy limits and coverage or incur substantially higher costs to obtain the same or similar coverage. These laws and regulations could also make it more difficult for us to attract and retain qualified persons to serve on our board of directors, our board committees or as our executive officers.
Our stock price has been and is likely to continue to be volatile, and you may not be able to resell shares of your Class A common stock at or above the price you paid.
The stock market in general, and hospitality companies in particular, including us, have experienced price and volume fluctuations that have often been unrelated or disproportionate to the operating performance of the underlying businesses. This market volatility, as well as general economic, market or political conditions, could reduce the market price of shares of our Class A common stock in spite of our operating performance. In addition, companies that own or lease a greater proportion of properties have recently experienced disproportionate volatility and price and volume fluctuations and we expect this trend to continue. These broad market and industry factors may seriously harm the market price of our Class A common stock, regardless of our actual operating performance.
In addition to the risks described in this section, several factors that could cause the price of our Class A common stock in the public market to fluctuate significantly include, among others, the following:
|
•
|
quarterly variations in our operating results compared to market expectations;
|
|
•
|
annual variations in our operating results compared to our guidance;
|
|
•
|
announcements of acquisitions of or investments in other businesses and properties or dispositions;
|
|
•
|
announcements of new services or products or significant price reductions by us or our competitors;
|
|
•
|
size of our public float;
|
|
•
|
future conversions to and sales of our Class A common stock by current holders of Class B common stock in the public market, or the perception in the market that the holders of a large number of shares of Class B common stock intend to sell shares;
|
|
•
|
stock price performance of our competitors;
|
|
•
|
fluctuations in stock market prices and volumes in the U.S. and abroad;
|
|
•
|
low investor confidence;
|
|
•
|
default on our indebtedness or foreclosure of our properties;
|
|
•
|
changes in senior management or key personnel;
|
37
|
•
|
downgrades or changes in financial estimates by securities analysts or negative reports published by securities analysts about our business or the hospitality industry in general;
|
|
•
|
negative earnings or other announcements by us or other hospitality companies;
|
|
•
|
downgrades in our credit ratings or the credit ratings of our competitors;
|
|
•
|
issuances or repurchases of equity or debt securities;
|
|
•
|
a decision to pay or not to pay dividends;
|
|
•
|
terrorist activities or threats of such activities, civil or political unrest or war; and
|
|
•
|
global economic, legal and regulatory factors unrelated to our performance.
|
Volatility in the market price of our Class A common stock may prevent investors from being able to sell their Class A common stock at or above the price at which they purchased the stock. As a result, investors may suffer a loss on their investment.
Securities class action litigation has often been instituted against companies following periods of volatility in the overall market and in the market price of a company's securities. This litigation, if instituted against us, could result in substantial costs, reduce our profits, divert our management's attention and resources and harm our business.
Reports published by securities or industry analysts, including projections in those reports that exceed our actual results, could adversely affect our stock price and trading volume.
Securities research analysts have established and publish their own quarterly projections for our business. These projections may vary widely from one another and may not accurately predict the results we actually achieve. Our stock price may decline if our actual results do not match securities research analysts' projections. Similarly, if one or more of the analysts who writes reports on us downgrades our stock or publishes inaccurate or unfavorable research about our business, or the hospitality industry in general, our stock price could decline. If one or more of these analysts ceases coverage of our company or fails to publish reports on us regularly, our stock price or trading volume could decline.
Anti-takeover provisions in our organizational documents and Delaware law, as well as agreements with our major stockholders, may discourage or prevent a change of control, even if a sale of Hyatt would be beneficial to our stockholders, which could cause our stock price to decline and prevent attempts by our stockholders to replace or remove our current board of directors or management.
Our amended and restated certificate of incorporation and bylaws, as well as agreements with our major stockholders, contain provisions that may make it difficult to remove our board of directors and management and may discourage or delay "change of control" transactions that certain stockholders may view as beneficial or could involve the payment of a premium over prevailing market prices for our Class A common stock. These provisions include, among others:
|
•
|
Our amended and restated certificate of incorporation provides for a dual class ownership structure, in which our Class B common stock is entitled to ten votes per share and our Class A common stock is entitled to one vote per share. As a result of this structure, our major stockholders have significant influence or actual control over matters requiring stockholder approval.
|
|
•
|
Voting agreements entered into with or among our major stockholders require these stockholders to vote their shares consistent with the recommendation of our board of directors, assuming in certain instances that a majority of a minimum of three independent directors (excluding for such purposes any Pritzker) or, in the case of transactions involving us and an affiliate, all of such minimum of three independent directors (excluding for such purposes any Pritzker) agree with the recommendation. While the voting agreements are in effect, they may provide our board of directors with effective control over matters requiring stockholder approval.
|
|
•
|
Lock-up agreements entered into with stockholders party to our 2007 Stockholders' Agreement limit the ability of these stockholders to sell their shares to any person who would be required to file a Schedule 13D with the SEC disclosing an intent to acquire the shares other than for investment purposes and, in certain instances, to competitors of ours in the hospitality, lodging or gaming industries.
|
|
•
|
Stockholders party to our 2007 Stockholders' Agreement have agreed, subject to certain limited exceptions, to "standstill" provisions that prevent the stockholders from acquiring additional shares of our common stock, making or participating in acquisition proposals for us or soliciting proxies in connection with meetings of our stockholders, unless the stockholders are invited to do so by our board of directors.
|
38
|
•
|
Our board of directors is divided into three classes, with each class serving for a staggered three-year term, which prevents stockholders from electing an entirely new board of directors at an annual meeting.
|
|
•
|
Our directors may be removed only for cause, which prevents stockholders from being able to remove directors without cause other than those directors who are being elected at an annual meeting.
|
|
•
|
Our amended and restated certificate of incorporation does not provide for cumulative voting in the election of directors. As a result, holders of our Class B common stock will control the election of directors and the ability of holders of our Class A common stock to elect director candidates will be limited.
|
|
•
|
Vacancies on our board of directors, and any newly created director positions created by the expansion of the board of directors, may be filled only by a majority of remaining directors then in office.
|
|
•
|
Actions to be taken by our stockholders may only be effected at an annual or special meeting of our stockholders and not by written consent.
|
|
•
|
Special meetings of our stockholders can be called only by the Chairman of the Board or by our corporate secretary at the direction of our board of directors.
|
|
•
|
Advance notice procedures that stockholders must comply with in order to nominate candidates to our board of directors and propose matters to be brought before an annual meeting of our stockholders may discourage or deter a potential acquirer from conducting a solicitation of proxies to elect the acquirer's own slate of directors or otherwise attempting to obtain control of our company.
|
|
•
|
Our board of directors may, without stockholder approval, issue series of preferred stock, or rights to acquire preferred stock, that could dilute the interest of, or impair the voting power of, holders of our common stock or could also be used as a method of discouraging, delaying or preventing a change of control.
|
|
•
|
An affirmative vote of the holders of at least 80% of the voting power of our outstanding capital stock entitled to vote is required to amend any provision of our certificate of incorporation or bylaws.
|
Pritzker family business interests have substantial control over us and have the ability to control the election of directors and other matters submitted to stockholders for approval, which will limit your ability to influence corporate matters or result in actions that you do not believe to be in our interests or your interests.
Our Class B common stock is entitled to ten votes per share and our Class A common stock is entitled to one vote per share. At January 31, 2017, Pritzker family business interests beneficially own, in the aggregate, 75,938,764 shares, or approximately 83.6%, of our Class B common stock, and 24,530 shares, or less than 0.1%, of Class A common stock, representing approximately
58.2%
of the outstanding shares of our common stock and approximately
80.1%
of the total voting power of our outstanding common stock. As a result, consistent with the voting agreements contained in the Amended and Restated Global Hyatt Agreement and the Amended and Restated Foreign Global Hyatt Agreement, Pritzker family business interests will be able to exert a significant degree of influence or actual control over our management and affairs and over matters requiring stockholder approval, including the election of directors, a merger, consolidation or sale of all or substantially all of our assets and any other significant transaction. While the voting agreements are in effect, they may provide our board of directors with the effective control over matters requiring stockholder approval. Because of our dual class ownership structure, Pritzker family business interests will continue to exert a significant degree of influence or actual control over matters requiring stockholder approval, even if they own less than 50% of the outstanding shares of our common stock. This concentrated control will limit your ability to influence corporate matters, and the interests of Pritzker family business interests may not coincide with our interests or your interests. As a result, we may take actions that you do not believe to be in our interests or your interests and that could depress our stock price. See also "—Voting agreements entered into with or among our major stockholders, including Pritzker family business interests, will result in a substantial number of our shares being voted consistent with the recommendation of our board of directors, and may limit your ability to influence the election of directors and other matters submitted to stockholders for approval."
In addition, the difference in the voting rights between our Class A common stock and Class B common stock could diminish the value of the Class A common stock to the extent that investors or any potential future purchasers of our common stock ascribe value to the superior voting rights of the Class B common stock.
39
Disputes among Pritzker family members and among Pritzker family members and the trustees of the Pritzker family trusts may result in significant distractions to our management, disrupt our business, have a negative effect on the trading price of our Class A common stock and/or generate negative publicity about Hyatt and the Pritzker family.
In the past, disputes have arisen between and among certain Pritzker family members, and between and among beneficiaries of the Pritzker family trusts and the trustees of such trusts, with respect to, among other things, the ownership, operation, governance and management of certain Pritzker family business interests. In connection with certain of these disputes, claims were alleged, and in certain cases, proceedings were initiated, against certain Pritzker family members, including Thomas J. Pritzker, our executive chairman, and other Pritzker family members, some of whom have been or are our directors, and against the trustees, including Thomas J. Pritzker in his former capacity as a co-trustee of the Pritzker family U.S. situs trusts. Such past allegations related to, among others, trust management and administration and violations of certain trustee duties, including fiduciary duties. Some of these disputes led to significant negative publicity for the Pritzker family. These disputes were resolved with no admissions or finding of any misconduct.
Disputes among Pritzker family members, and between and among beneficiaries of the Pritzker family trusts and the trustees of such trusts, including with respect to Hyatt, may arise or continue in the future. If such disputes occur, they may result in significant distractions to our management, disrupt our business, have a negative effect on the trading price of our Class A common stock and/or generate negative publicity about Hyatt and Pritzker family members, including Pritzker family members involved with Hyatt.
Voting agreements entered into with or among our major stockholders, including Pritzker family business interests, will result in a substantial number of our shares being voted consistent with the recommendation of our board of directors, and may limit your ability to influence the election of directors and other matters submitted to stockholders for approval.
Pritzker family business interests, which beneficially own at January 31, 2017, directly or indirectly,
75,963,294
shares, or
58.2%
of our total outstanding common stock and control approximately
80.1%
of our total voting power, have entered into a voting agreement with respect to all shares of common stock beneficially owned by Pritzker family business interests. During the term of the voting agreement, which expires on the date upon which more than 75% of the Company's fully diluted shares of common stock is owned by non-Pritzker family business interests, Pritzker family business interests have agreed to vote their shares of our common stock consistent with the recommendation of our board of directors with respect to all matters (assuming agreement as to any such matter by a majority of a minimum of three independent directors (excluding for such purposes any Pritzker)) or, in the case of transactions involving us and an affiliate, assuming agreement of all of such minimum of three independent directors (excluding for such purposes any Pritzker). In addition, at January 31, 2017, the stockholders party to the 2007 Stockholder's Agreement beneficially own, in the aggregate, approximately 16.4% of our outstanding Class B common stock, and approximately 5.0% of our Class A common stock, representing approximately 15.9% of the total voting power of our outstanding common stock. Pursuant to the 2007 Stockholder's Agreement, the stockholders party thereto have entered into a voting agreement with us, with respect to the shares of common stock that they beneficially own, and have agreed to vote their shares of common stock consistent with the recommendation of our board of directors, without any separate requirement that our independent directors agree with the recommendation. These voting agreements expire on the date that Thomas J. Pritzker is no longer chairman of our board of directors. See Part I, Item 1, "Business—Stockholder Agreements."
While the voting agreements are in effect, they may provide our board of directors with effective control over matters requiring stockholder approval, including the election of directors, a merger, consolidation or sale of all or substantially all of our assets and any other significant transaction. This is because the number of our shares that are required by the voting agreements to be voted consistent with the recommendation of our board of directors will be sufficient to determine the outcome of the election of directors and other matters submitted to stockholders for approval. This will limit your ability to influence the election of directors and other matters submitted to stockholders for approval, even if you do not believe those actions to be in our interests or your interests. For instance, the voting agreements may have the effect of delaying or preventing a transaction that would result in a change of control, if our board of directors does not recommend that our stockholders vote in favor of the transaction, even if you or some or all of our major stockholders believe that the transaction is in our interests or your interests. On the other hand, the voting agreements may result in our stockholders approving a transaction that would result in a change of control, if our board of directors recommends that our stockholders vote in favor of the transaction, even if you or some or all of our major stockholders believe that the transaction is not in our interests or your interests.
40
A significant number of shares of Class A common stock issuable upon conversion of Class B common stock could be sold into the market, which could depress our stock price even if our business is doing well.
Future sales in the public market of Class A common stock issuable upon conversion of Class B common stock, or the perception in the market that the holders of a large number of shares of Class B common stock intend to sell shares, could reduce the market price of our Class A common stock. As of January 31, 2017, we had
39,707,321
shares of Class A common stock outstanding and
90,863,209
shares of Class B common stock outstanding.
At January 31, 2017, 37,715,684 shares of Class A common stock are freely tradable in the public market without restriction or further registration under the Securities Act of 1933, as amended (the "Securities Act") unless these shares are held by any of our "affiliates," as that term is defined in Rule 144 under the Securities Act ("Rule 144"). The remaining 1,991,637 outstanding shares of Class A common stock and
90,863,209
outstanding shares of Class B common stock are deemed "restricted securities," as that term is defined in Rule 144. Restricted securities may be sold in the public market only if they are registered under the Securities Act or they qualify for an exemption from registration under Rule 144 or Rule 701 under the Securities Act ("Rule 701"). Of these restricted securities, 14,924,445 shares of Class B common stock and 1,977,434 shares of Class A common stock are held by shareholders party to the 2007 Stockholders' Agreement and are otherwise eligible to be sold at any time, subject to the applicable rights of first refusal, "drag along" rights and other restrictions contained in the 2007 Stockholders' Agreement. See Part I, Item 1, "Business—Stockholder Agreements—2007 Stockholders' Agreement." Another 14,203 shares of Class A common stock that are deemed restricted securities are otherwise eligible to be sold at any time.
The rest of the restricted securities, consisting of 75,938,764 shares of Class B common stock, together with 24,530 shares of Class A common stock previously registered, are subject to contractual lock-up and certain other restrictions contained in the Amended and Restated Global Hyatt Agreement and the Amended and Restated Foreign Global Hyatt Agreement as described in Part I, Item 1, "Business—Stockholder Agreements." These contractual restrictions may be amended, waived or terminated by the parties to those agreements in accordance with the terms of such agreements without our consent and without notice; the 25% limitation on sales of our common stock may, with respect to each 12 month period, be increased to a higher percentage or waived entirely by the unanimous affirmative vote of our independent directors (excluding for such purposes any Pritzker). All such shares of Class A common stock, including shares of Class A common stock issuable upon conversion of shares of Class B common stock, will be eligible for resale in compliance with Rule 144 or Rule 701 to the extent the lock-up restrictions contained in the Amended and Restated Global Hyatt Agreement or the Amended and Restated Foreign Global Hyatt Agreement, as applicable, are waived or terminated with respect to such shares.
Assuming the lock-up restrictions contained in the Amended and Restated Global Hyatt Agreement and the Amended and Restated Foreign Global Hyatt Agreement are not amended, waived or terminated and that there are no transfers of shares amongst Pritzker family stockholders, and further assuming the parties to these agreements sell the maximum amount permitted to be sold during the first time period that such shares are eligible to be sold as set forth below, and subject to any applicable restrictions contained in such agreements and the provisions of Rule 144 and/or Rule 701 under the Securities Act, the securities eligible to be sold by Pritzker family stockholders under the Amended and Restated Global Hyatt Agreement and the Amended and Restated Foreign Global Hyatt Agreement will be available for sale in the public market as follows:
|
Time Period
|
Number of Shares*
|
|
During the 12 month period from November 5, 2016 through November 4, 2017
|
20,662,849
|
|
During the 12 month period from November 5, 2017 through November 4, 2018
|
19,241,046
|
|
During the 12 month period from November 5, 2018 through November 4, 2019
|
13,449,973
|
|
During the 12 month period from November 5, 2019 through November 4, 2020
|
6,916,287
|
|
During the 12 month period from November 5, 2020 through November 4, 2021
|
6,419,886
|
|
During the 12 month period from November 5, 2021 through November 4, 2022
|
6,271,290
|
|
During the 12 month period from November 5, 2022 through November 4, 2023
|
3,001,963
|
*The foregoing numbers are based on information as of January 31, 2017 and assume that the maximum number of shares permitted to be sold during each period set forth above are, in fact, sold during each such period. To the extent any shares are not sold during the first time period that such shares are eligible to be sold as described above, the number of shares that may be sold in subsequent time periods may change.
In addition, at
December 31, 2016
,
4,628,349
shares of our Class A common stock were reserved for issuance under the Third Amended and Restated Hyatt Hotels Corporation Long-Term Incentive Plan (the "LTIP"). These shares of Class A common stock will become eligible for sale in the public market once those shares are issued or awarded under our LTIP, subject to provisions of various award agreements and Rule 144, as applicable. In addition,
549,733
shares of our Class A
41
common stock were reserved for issuance under the Hyatt Hotels Corporation Employee Stock Purchase Plan (the "ESPP"),
1,169,195
shares of our Class A common stock remained available for issuance pursuant to the Amended and Restated Hyatt Corporation Deferred Compensation Plan (the "DCP") and
300,000
shares of Class A common stock remained available for issuance pursuant to the Hyatt International Hotels Retirement Plan (commonly known as the Field Retirement Plan) (the "FRP").
If any of these holders causes a large number of securities to be sold in the public market, the sales could reduce the trading price of our Class A common stock. These sales also could impede our ability to raise future capital. See also "—If holders of shares of our Class B common stock convert their shares of Class B common stock into shares of Class A common stock and exercise their registration rights, a significant number of shares of our Class A common stock could be sold into the market, which could reduce the trading price of our Class A common stock and impede our ability to raise future capital."
We also may issue shares of our Class A common stock from time to time as consideration for future acquisitions and investments. If any such acquisition or investment is significant, the number of shares that we may issue may in turn be significant.
If holders of shares of our Class B common stock convert their shares of Class B common stock into shares of Class A common stock and exercise their registration rights, a significant number of shares of our Class A common stock could be sold into the market, which could reduce the trading price of our Class A common stock and impede our ability to raise future capital.
Holders of 90,863,209 shares of our Class B common stock (or 69.6% of our total outstanding shares of common stock at January 31, 2017), including Pritzker family business interests and entities affiliated with Goldman, Sachs & Co., have rights, subject to certain conditions, to require us to file registration statements registering sales of shares of Class A common stock acquired upon conversion of such Class B common stock or to include sales of such shares of Class A common stock in registration statements that we may file for ourselves or for other stockholders. In order to exercise such registration rights, the holder must be permitted to sell shares of its common stock under applicable lock-up restrictions. See "—A significant number of shares of Class A common stock issuable upon conversion of Class B common stock could be sold into the market, which could depress our stock price even if our business is doing well" and Part I, Item 1, "Business—Stockholder Agreements" for additional information with respect to these lock-up provisions. Subject to compliance with applicable lock-up agreements, shares of Class A common stock sold under the registration statements can be freely sold in the public market. In the event such registration rights are exercised and a large number of shares of Class A common stock issuable upon conversion of shares of Class B common stock are sold in the public market, such sales could reduce the trading price of our Class A common stock. These sales also could impede our ability to raise future capital. Additionally, we will bear all expenses in connection with any such registrations (other than underwriting discounts).
During 2014, certain Pritzker family stockholders exercised their rights to require the Company to register an aggregate of 15,141,517 shares of Class A common stock issuable upon conversion of such stockholders' shares of Class B common stock on a shelf registration statement on Form S-3 pursuant to Rule 415 of the Securities Act. In accordance with the terms of the Registration Rights Agreement, dated as of October 12, 2009, on May 29, 2014, the Company filed an automatic effective shelf registration statement with the SEC to register the resale of such 15,141,517 shares. In connection with such registration, all other holders of registration rights, including trustees of trusts for the benefit of Thomas J. Pritzker and his lineal descendants (including Jason Pritzker), the Goldman Sachs Funds and Madrone, elected not to exercise their piggyback registration rights.
On September 19, 2016, a trust for the benefit of Anthony N. Pritzker and/or certain of his lineal descendants and a trust for the benefit of Jay Robert Pritzker and/or certain of his lineal descendants each sold 250,000 shares of Class A common stock issuable upon conversion of shares of Class B common stock pursuant to the May 2014 shelf registration statement. Additionally, in November and December 2016, such trusts sold into the public market pursuant to Rule 144 an aggregate of 3,165,905 shares and 3,030,571 shares, respectively, of Class A common stock issuable upon conversion of Class B common stock. After giving effect to these November and December 2016 sale transactions, as of the date of this filing, 8,945,041 shares of the 15,141,517 shares originally registered for resale on the shelf registration statement continue to be eligible to be sold pursuant to the shelf registration statement during the 12 month period commencing November 5, 2016 through November 4, 2017 under the lock-up restrictions contained in the Amended and Restated Global Hyatt Agreement and the Amended and Restated Foreign Global Hyatt Agreement. Furthermore, as a result of these and other sale transactions subsequent to the filing of the May 2014 shelf registration statement, trusts and other entities in the Anthony N. Pritzker and Jay Robert Pritzker beneficiary groups currently hold fewer shares than are registered for such groups for resale on the shelf registration statement. Subsequent to November 4, 2017, and assuming no further sales, 12,205,958 shares of the 15,141,517 shares originally registered for resale on the shelf registration statement will continue to be eligible to be sold pursuant to the shelf registration statement. Additional shares may be registered on the shelf registration statement in the future as such shares are eligible to be sold in accordance with the registration rights agreements and lock-up restrictions. See "—A significant number of shares of
42
Class A common stock issuable upon conversion of Class B common stock could be sold into the market, which could depress our stock price even if our business is doing well"
for additional information with respect to the lock-up provisions.
The sale of shares registered under the registration statement in the public market, or the perception that such sales may occur could reduce the trading price of our Class A common stock or impede our ability to raise future capital.
Non-U.S. holders who own more than 5% of our Class A common stock or substantial amounts of our Class B common stock may be subject to U.S. federal income tax on gain realized on the disposition of such stock.
Because we have significant U.S. real estate holdings, we may be a "United States real property holding corporation" ("USRPHC") for U.S. federal income tax purposes, but we have made no determination to that effect. There can be no assurance that we do not currently constitute or will not become a USRPHC. As a result, a "non-U.S. holder" may be subject to U.S. federal income tax on gain realized on a disposition of our Class A common stock if such non-U.S. holder has owned, actually or constructively (through certain family members, related entities and options), more than 5% of our Class A common stock at any time during the shorter of (a) the five-year period ending on the date of disposition and (b) the non-U.S. holder's holding period in such stock.
If we were or were to become a USRPHC, a non-U.S. holder may be subject to U.S. federal income tax on gain realized on the disposition of our Class B common stock. Such tax would apply if on the date such non-U.S. holder actually or constructively acquired Class B common stock, and on any date on which such non-U.S. holder acquires additional Class B common stock, the aggregate fair market of the Class B common stock it actually and constructively owns is greater than 5% of the fair market value of our Class A common stock on such date. Certain dispositions of substantial amounts of Class B common stock by non-U.S. holders may also be subject to withholding under section 1445 of the Internal Revenue Code.
Item 1B.
Unresolved Staff Comments.
None.
43
Item 2.
Properties.
The following table sets forth a description of each owned or leased property in the Hyatt portfolio of properties at
December 31, 2016
.
|
Hotel Property
|
Location
|
Rooms
|
# of Hotels
|
Ownership (1)
|
|||||||
|
Owned and Leased Properties
|
|||||||||||
|
Full Service
|
|||||||||||
|
Americas Owned:
|
|||||||||||
|
Park Hyatt Chicago
|
Chicago, IL
|
198
|
|
100
|
%
|
||||||
|
Park Hyatt New York
|
New York, NY
|
210
|
|
100
|
%
|
||||||
|
Grand Hyatt New York (4)
|
New York, NY
|
1,306
|
|
100
|
%
|
||||||
|
Grand Hyatt Rio de Janeiro
|
Rio de Janeiro, Brazil
|
436
|
|
100
|
%
|
||||||
|
Grand Hyatt San Antonio (4)
|
San Antonio, TX
|
1,003
|
|
100
|
%
|
||||||
|
Grand Hyatt San Francisco
|
San Francisco, CA
|
660
|
|
100
|
%
|
||||||
|
Hyatt Regency Aruba Resort Spa and Casino (4)
|
Palm Beach, Aruba, Dutch Caribbean
|
357
|
|
100
|
%
|
||||||
|
Hyatt Regency Atlanta
|
Atlanta, GA
|
1,260
|
|
100
|
%
|
||||||
|
Hyatt Regency Baltimore Inner Harbor (4)
|
Baltimore, MD
|
488
|
|
100
|
%
|
||||||
|
Hyatt Regency Coconut Point Resort and Spa
|
Bonita Springs, FL
|
454
|
|
100
|
%
|
||||||
|
Hyatt Regency Grand Cypress
|
Orlando, FL
|
815
|
|
100
|
%
|
||||||
|
Hyatt Regency Green Bay
|
Green Bay, WI
|
241
|
|
100
|
%
|
||||||
|
Hyatt Regency Greenwich
|
Old Greenwich, CT
|
373
|
|
100
|
%
|
||||||
|
Hyatt Regency Lake Tahoe Resort, Spa and Casino
|
Incline Village, NV
|
422
|
|
100
|
%
|
||||||
|
Hyatt Regency Long Beach (4)
|
Long Beach, CA
|
528
|
|
100
|
%
|
||||||
|
Hyatt Regency Lost Pines Resort and Spa
|
Lost Pines, TX
|
491
|
|
100
|
%
|
||||||
|
Hyatt Regency Louisville
|
Louisville, KY
|
393
|
|
100
|
%
|
||||||
|
Hyatt Regency Mexico City
|
Mexico City, Mexico
|
755
|
|
100
|
%
|
||||||
|
Hyatt Regency Miami (4)
|
Miami, FL
|
612
|
|
100
|
%
|
||||||
|
Hyatt Regency Monterey Hotel and Spa on Del Monte Golf Course (4)
|
Monterey, CA
|
550
|
|
100
|
%
|
||||||
|
Hyatt Regency O'Hare
|
Rosemont, IL
|
1,095
|
|
100
|
%
|
||||||
|
Hyatt Regency Orlando
|
Orlando, FL
|
1,639
|
|
100
|
%
|
||||||
|
Hyatt Regency San Antonio Riverwalk (4)
|
San Antonio, TX
|
629
|
|
100
|
%
|
||||||
|
Hyatt Regency Scottsdale Resort and Spa at Gainey Ranch
|
Scottsdale, AZ
|
493
|
|
100
|
%
|
||||||
|
Andaz Maui at Wailea Resort
|
Wailea, HI
|
300
|
|
100
|
%
|
||||||
|
Hyatt Centric The Pike Long Beach (4)
|
Long Beach, CA
|
138
|
|
100
|
%
|
||||||
|
The Confidante Miami Beach
|
Miami Beach, FL
|
363
|
|
100
|
%
|
||||||
|
The Driskill (4)
|
Austin, TX
|
189
|
|
100
|
%
|
||||||
|
Royal Palms Resort and Spa
|
Phoenix, AZ
|
119
|
|
100
|
%
|
||||||
|
Americas Owned
|
16,517
|
|
29
|
|
|||||||
44
|
Hotel Property
|
Location
|
Rooms
|
# of Hotels
|
Ownership (1)
|
|||||||
|
Americas Leased:
|
|||||||||||
|
Hyatt Regency San Francisco (3)
|
San Francisco, CA
|
804
|
|
—
|
%
|
||||||
|
Andaz West Hollywood (3)
|
West Hollywood, CA
|
239
|
|
—
|
%
|
||||||
|
Americas Leased
|
1,043
|
|
2
|
|
|||||||
|
Total Americas Owned and Leased Properties
|
17,560
|
|
31
|
|
|||||||
|
EAME/SW Asia Owned:
|
|||||||||||
|
Park Hyatt Paris - Vendôme
|
Paris, France
|
153
|
|
100
|
%
|
||||||
|
Park Hyatt Zurich (4)
|
Zurich, Switzerland
|
138
|
|
100
|
%
|
||||||
|
Hyatt Regency Baku
|
Baku, Azerbaijan
|
159
|
|
100
|
%
|
||||||
|
Hyatt Regency Bishkek (4)
|
Bishkek, Kyrgyz Republic
|
178
|
|
98
|
%
|
||||||
|
Andaz London Liverpool Street (7)
|
London, England
|
267
|
|
100
|
%
|
||||||
|
EAME/SW Asia Owned
|
895
|
|
5
|
|
|||||||
|
EAME/SW Asia Leased:
|
|||||||||||
|
Grand Hyatt Berlin (3) (6)
|
Berlin, Germany
|
342
|
|
—
|
%
|
||||||
|
Hyatt Regency Cologne (3) (6)
|
Cologne, Germany
|
306
|
|
—
|
%
|
||||||
|
Hyatt Regency Mainz (3) (6)
|
Mainz, Germany
|
268
|
|
—
|
%
|
||||||
|
Andaz Amsterdam, Prinsengracht (3) (6)
|
Amsterdam, The Netherlands
|
122
|
|
—
|
%
|
||||||
|
EAME/SW Asia Leased
|
1,038
|
|
4
|
|
|||||||
|
Total EAME/SW Asia Owned and Leased Properties
|
1,933
|
|
9
|
|
|||||||
|
ASPAC Owned:
|
|||||||||||
|
Grand Hyatt Seoul
|
Seoul, South Korea
|
601
|
|
100
|
%
|
||||||
|
ASPAC Owned
|
601
|
|
1
|
|
|||||||
|
Total Full Service Owned and Leased Properties
|
20,094
|
|
41
|
|
|||||||
45
|
Hotel Property
|
Location
|
Rooms
|
# of Hotels
|
Ownership (1)
|
|||||||
|
Select Service
|
|||||||||||
|
Leased:
|
|||||||||||
|
Hyatt Place Amsterdam Airport (3) (6)
|
Amsterdam, The Netherlands
|
330
|
|
—
|
%
|
||||||
|
Hyatt Place Atlanta/Buckhead (2)
|
Atlanta, GA
|
171
|
|
—
|
%
|
||||||
|
Select Service Leased:
|
501
|
|
2
|
|
|||||||
|
Total Select Service Owned and Leased Properties
|
501
|
|
2
|
|
|||||||
|
Unconsolidated Hospitality Venture Properties
|
|||||||||||
|
Full Service
|
|||||||||||
|
Americas Unconsolidated Hospitality Ventures:
|
|||||||||||
|
Grand Hyatt São Paulo
|
São Paulo, Brazil
|
466
|
|
50
|
%
|
||||||
|
Hyatt Regency Columbus (4)
|
Columbus, OH
|
633
|
|
24
|
%
|
||||||
|
Hyatt Regency Crystal City at Reagan National Airport
|
Arlington, VA
|
686
|
|
50
|
%
|
||||||
|
Hyatt Regency Huntington Beach Resort and Spa
|
Huntington Beach, CA
|
517
|
|
40
|
%
|
||||||
|
Hyatt Regency Jersey City on the Hudson
|
Jersey City, NJ
|
351
|
|
50
|
%
|
||||||
|
Hyatt Regency Minneapolis
|
Minneapolis, MN
|
645
|
|
50
|
%
|
||||||
|
Hyatt at The Bellevue
|
Philadelphia, PA
|
172
|
|
50
|
%
|
||||||
|
Andaz Mayakoba Resort Riviera Maya
|
Cancun, Mexico
|
214
|
|
40
|
%
|
||||||
|
Americas Unconsolidated Hospitality Ventures
|
3,684
|
|
8
|
|
|||||||
|
EAME/SW Asia Unconsolidated Hospitality Ventures:
|
|||||||||||
|
Park Hyatt Hamburg (3) (5)
|
Hamburg, Germany
|
252
|
|
—
|
%
|
||||||
|
Park Hyatt Milan
|
Milan, Italy
|
106
|
|
30
|
%
|
||||||
|
Grand Hyatt Mumbai
|
Mumbai, India
|
547
|
|
50
|
%
|
||||||
|
Hyatt Regency Ahmedabad
|
Ahmedabad, India
|
210
|
|
50
|
%
|
||||||
|
Andaz Delhi
|
New Delhi, India
|
401
|
|
50
|
%
|
||||||
|
EAME/SW Asia Unconsolidated Hospitality Ventures
|
1,516
|
|
5
|
|
|||||||
|
ASPAC Unconsolidated Hospitality Ventures:
|
|||||||||||
|
Grand Hyatt Bali
|
Bali, Indonesia
|
636
|
|
10
|
%
|
||||||
|
ASPAC Unconsolidated Hospitality Ventures
|
636
|
|
1
|
|
|||||||
|
Full Service Unconsolidated Hospitality Ventures
|
5,836
|
|
14
|
|
|||||||
46
|
Hotel Property
|
Location
|
Rooms
|
# of Hotels
|
Ownership (1)
|
|||||||
|
Select Service Unconsolidated Hospitality Ventures
|
|||||||||||
|
Hyatt Place Celaya
|
Celaya, Mexico
|
145
|
|
50
|
%
|
||||||
|
Hyatt Place Ciudad del Carmen
|
Ciudad del Carmen, Mexico
|
140
|
|
50
|
%
|
||||||
|
Hyatt Place Denver/Downtown
|
Denver, CO
|
248
|
|
50
|
%
|
||||||
|
Hyatt Place Fair Lawn/Paramus
|
Fair Lawn, NJ
|
143
|
|
40
|
%
|
||||||
|
Hyatt Place La Paz
|
La Paz, Mexico
|
151
|
|
50
|
%
|
||||||
|
Hyatt Place Los Cabos
|
San Jose del Cabo, Mexico
|
157
|
|
50
|
%
|
||||||
|
Hyatt Place Minneapolis/Eden Prairie
|
Eden Prairie, MN
|
126
|
|
40
|
%
|
||||||
|
Hyatt Place Panama City/Downtown
|
Panama City, Panama
|
165
|
|
29
|
%
|
||||||
|
Hyatt Place Phoenix/Gilbert
|
Gilbert, AZ
|
127
|
|
50
|
%
|
||||||
|
Hyatt Place São José do Rio Preto
|
São José do Rio Preto, Brazil
|
152
|
|
70
|
%
|
||||||
|
Hyatt Place San Juan/City Center
|
San Juan, Puerto Rico
|
149
|
|
50
|
%
|
||||||
|
Hyatt Place Tijuana
|
Tijuana, Mexico
|
145
|
|
50
|
%
|
||||||
|
Hyatt Place Washington DC/Georgetown/West End
|
Washington, D.C.
|
168
|
|
33
|
%
|
||||||
|
Hyatt House Boston/Waltham
|
Waltham, MA
|
135
|
|
40
|
%
|
||||||
|
Hyatt House Denver/Downtown
|
Denver, CO
|
113
|
|
50
|
%
|
||||||
|
Select Service Unconsolidated Hospitality Ventures
|
2,264
|
|
15
|
|
|||||||
|
All Inclusive Unconsolidated Hospitality Ventures
|
|||||||||||
|
Hyatt Ziva Cancun
|
Cancun, Mexico
|
547
|
|
24
|
%
|
||||||
|
Hyatt Ziva Los Cabos
|
San Jose del Cabo, Mexico
|
591
|
|
24
|
%
|
||||||
|
Hyatt Ziva Puerto Vallarta
|
Puerto Vallarta, Mexico
|
335
|
|
24
|
%
|
||||||
|
Hyatt Ziva Rose Hall
|
Montego Bay, Jamaica
|
387
|
|
24
|
%
|
||||||
|
Hyatt Zilara Cancun
|
Cancun, Mexico
|
307
|
|
24
|
%
|
||||||
|
Hyatt Zilara Rose Hall
|
Montego Bay, Jamaica
|
234
|
|
24
|
%
|
||||||
|
All Inclusive Unconsolidated Hospitality Ventures
|
2,401
|
|
6
|
|
|||||||
|
Total Unconsolidated Hospitality Ventures
|
10,501
|
|
35
|
|
|||||||
|
(1)
|
Unless otherwise indicated, ownership percentages include both the property and the underlying land.
|
|
(2)
|
Property is accounted for as a capital lease.
|
|
(3)
|
Property is accounted for as an operating lease.
|
|
(4)
|
Our ownership interest in the property is subject to a third-party ground lease on the land.
|
|
(5)
|
We own a 50% interest in the entity that is the operating lessee and it is an unconsolidated hospitality venture.
|
|
(6)
|
We own a 100% interest in the entity that is the operating lessee.
|
|
(7)
|
Our ownership interest is derived through a long leasehold interest in the hotel building, with a nominal annual rental payment.
|
47
Below is a summary of our Hyatt managed, franchised and owned and leased hotels by segment for all periods presented.
|
|
December 31, 2016
|
December 31, 2015
|
December 31, 2014
|
||||||||||||||
|
Properties
|
Rooms/Units
|
Properties
|
Rooms/Units
|
Properties
|
Rooms/Units
|
||||||||||||
|
Americas Management and Franchising
|
|||||||||||||||||
|
Full Service Hotels
|
|||||||||||||||||
|
Managed
|
120
|
|
60,806
|
|
115
|
|
60,388
|
|
117
|
|
61,277
|
|
|||||
|
Franchised
|
46
|
|
13,837
|
|
40
|
|
12,191
|
|
34
|
|
10,416
|
|
|||||
|
Full Service Managed and Franchised
|
166
|
|
74,643
|
|
155
|
|
72,579
|
|
151
|
|
71,693
|
|
|||||
|
Select Service Hotels
|
|||||||||||||||||
|
Managed
|
65
|
|
9,237
|
|
59
|
|
8,329
|
|
57
|
|
7,995
|
|
|||||
|
Franchised
|
260
|
|
35,869
|
|
236
|
|
32,126
|
|
212
|
|
28,573
|
|
|||||
|
Select Service Managed and Franchised
|
325
|
|
45,106
|
|
295
|
|
40,455
|
|
269
|
|
36,568
|
|
|||||
|
ASPAC Management and Franchising
|
|||||||||||||||||
|
Full Service Hotels
|
|||||||||||||||||
|
Managed
|
75
|
|
27,669
|
|
68
|
|
24,848
|
|
64
|
|
23,954
|
|
|||||
|
Franchised
|
3
|
|
1,286
|
|
3
|
|
1,284
|
|
2
|
|
988
|
|
|||||
|
Full Service Managed and Franchised
|
78
|
|
28,955
|
|
71
|
|
26,132
|
|
66
|
|
24,942
|
|
|||||
|
Select Service Hotels
|
|||||||||||||||||
|
Managed
|
5
|
|
826
|
|
1
|
|
144
|
|
1
|
|
144
|
|
|||||
|
Select Service Managed
|
5
|
|
826
|
|
1
|
|
144
|
|
1
|
|
144
|
|
|||||
|
EAME/SW Asia Management and Franchising
|
|||||||||||||||||
|
Full Service Hotels
|
|||||||||||||||||
|
Managed
|
71
|
|
19,519
|
|
67
|
|
18,466
|
|
63
|
|
16,832
|
|
|||||
|
Select Service Hotels
|
|||||||||||||||||
|
Managed
|
11
|
|
1,726
|
|
10
|
|
1,560
|
|
5
|
|
926
|
|
|||||
|
Franchised
|
1
|
|
358
|
|
—
|
|
—
|
|
—
|
|
—
|
|
|||||
|
Select Service Managed and Franchised
|
12
|
|
2,084
|
|
10
|
|
1,560
|
|
5
|
|
926
|
|
|||||
|
Total Managed and Franchised
|
657
|
|
171,133
|
|
599
|
|
159,336
|
|
555
|
|
151,105
|
|
|||||
Included in the summary above are the following owned and leased hotels:
|
|
December 31, 2016
|
December 31, 2015
|
December 31, 2014
|
||||||||||||||
|
Properties
|
Rooms
|
Properties
|
Rooms
|
Properties
|
Rooms
|
||||||||||||
|
Owned and Leased Hotels
|
|||||||||||||||||
|
Full Service hotels
|
|||||||||||||||||
|
United States
|
28
|
|
16,012
|
|
26
|
|
15,415
|
|
27
|
|
15,914
|
|
|||||
|
Other Americas
|
3
|
|
1,548
|
|
2
|
|
1,112
|
|
2
|
|
1,112
|
|
|||||
|
ASPAC
|
1
|
|
601
|
|
1
|
|
601
|
|
1
|
|
601
|
|
|||||
|
EAME/SW Asia
|
9
|
|
1,933
|
|
10
|
|
2,252
|
|
10
|
|
2,256
|
|
|||||
|
Select Service hotels
|
|||||||||||||||||
|
United States
|
1
|
|
171
|
|
1
|
|
171
|
|
2
|
|
329
|
|
|||||
|
EAME/SW Asia
|
1
|
|
330
|
|
1
|
|
330
|
|
1
|
|
330
|
|
|||||
|
Total Owned and Leased Hotels
|
43
|
|
20,595
|
|
41
|
|
19,881
|
|
43
|
|
20,542
|
|
|||||
48
Corporate Headquarters and Regional Offices
Our corporate headquarters are located at 71 South Wacker Drive, 12th Floor, Chicago, Illinois. At
December 31, 2016
, these offices consist of approximately 219,900 square feet (net of subleased space). During 2015, we entered into various agreements, whereby we will reduce our leased premises to 214,069 square feet (net of subleased space) by December 31, 2017. The lease for the remaining premises expires on February 29, 2020. At
December 31, 2016
, we also lease 56,238 square feet of office space at 200 West Monroe Street, Chicago, Illinois. The lease for this property expires on December 31, 2017. In anticipation of the expiration of these leases, we entered into a new lease for a term of 17 years for initial premises of approximately 264,106 square feet of space at 150 N. Riverside Plaza, Chicago, Illinois.
In addition to our corporate headquarters, we lease space for our regional offices, service centers and sales offices in multiple locations, including Amsterdam, The Netherlands; Atlanta, Georgia; Beijing, Hong Kong, Shanghai and Shenzhen, People's Republic of China; Cairo, Egypt; Coral Gables, Florida; Dallas, Texas; Dubai, United Arab Emirates; Gurgaon and Mumbai, India; Jakarta, Indonesia; Jeddah, Saudi Arabia; London, United Kingdom; Mainz, Germany; Marion, Illinois; Melbourne, Australia; Moscow, Russia; Moore, Oklahoma; Nairobi, Kenya; New York, New York; Omaha, Nebraska; Paris, France; Opfikon, Switzerland; San Francisco, California; São Paulo, Brazil; Scottsdale, Arizona; Seoul, South Korea; Singapore; Tokyo, Japan; and Washington, D.C.
We believe our existing office properties are in good condition and are sufficient and suitable for the conduct of our business. In the event we need to expand our operations, we believe suitable space will be available on commercially reasonable terms.
Item 3.
Legal Proceedings.
We are involved in various claims and lawsuits arising in the normal course of business, including proceedings involving tort and other general liability claims, workers' compensation and other employee claims, intellectual property claims and claims related to our management of certain hotel properties. Most occurrences involving liability, claims of negligence and employees are covered by insurance with solvent insurance carriers. We recognize a liability when we believe the loss is probable and reasonably estimable. We currently believe that the ultimate outcome of such lawsuits and proceedings will not, individually or in the aggregate, have a material effect on our consolidated financial position, results of operations or liquidity.
Item 4.
Mine Safety Disclosures.
Not Applicable.
49
Executive Officers of the Registrant.
The following chart names each of the Company's executive officers and their ages and positions at
February 16, 2017
. Also included below is biographical information relating to each of the Company's executive officers. Each of the executive officers is elected by and serves at the pleasure of the board of directors.
|
Name
|
Age
|
Position
|
||
|
Thomas J. Pritzker
|
66
|
Executive Chairman of the Board
|
||
|
Mark S. Hoplamazian
|
53
|
President, Chief Executive Officer and Director (Principal Executive Officer)
|
||
|
Patrick J. Grismer
|
55
|
Executive Vice President, Chief Financial Officer (Principal Financial Officer)
|
||
|
Stephen G. Haggerty
|
49
|
Executive Vice President, Global Head of Capital Strategy, Franchising and Select Service
|
||
|
H. Charles Floyd
|
57
|
Executive Vice President, Global President of Operations
|
||
|
Peter J. Sears
|
52
|
Executive Vice President, Group President—Americas
|
||
|
David Udell
|
56
|
Executive Vice President, Group President—ASPAC
|
||
|
Peter Fulton
|
59
|
Executive Vice President, Group President—EAME/SW Asia
|
||
|
Rena Hozore Reiss
|
57
|
Executive Vice President, General Counsel and Secretary
|
||
|
Maryam Banikarim
|
48
|
Executive Vice President, Global Chief Marketing Officer
|
||
|
Anne-Marie Law
|
49
|
Executive Vice President, Chief Human Resources Officer
|
||
Thomas J. Pritzker
has been a member of our board of directors since August 2004 and our Executive Chairman since August 2004. Mr. Pritzker served as our Chief Executive Officer from August 2004 to December 2006. Mr. Pritzker was appointed President of Hyatt Corporation in 1980 and served as Chairman and Chief Executive Officer of Hyatt Corporation from 1999 to December 2006. Mr. Pritzker is Chairman and Chief Executive Officer of The Pritzker Organization, LLC ("TPO"), the principal financial and investment advisor to certain Pritzker family business interests. Mr. Pritzker also serves as a Director of Royal Caribbean Cruises Ltd. He served as a Director of TransUnion Corp., a credit reporting service company, until June 2010 and as Chairman of Marmon Holdings, Inc. until March 2014. Mr. Pritzker is Chairman of the Board of Trustees of the Center for Strategic & International Studies; Director and Vice President of The Pritzker Foundation, a charitable foundation; Director and President of the Pritzker Family Philanthropic Fund, a charitable organization; and Director, Chairman and President of The Hyatt Foundation, a charitable foundation which established The Pritzker Architecture Prize.
Mark S. Hoplamazian
was appointed to the Board of Directors in November 2006 and named President and Chief Executive Officer of Hyatt Hotels Corporation in December 2006. Prior to being appointed to his present position, Mr. Hoplamazian served as President of TPO. During his 17 year tenure with TPO he served as advisor to various Pritzker family-owned companies, including Hyatt Hotels Corporation and its predecessors. He previously worked in international mergers and acquisitions at The First Boston Corporation in New York. Mr. Hoplamazian was appointed to the VF Corporation Board of Directors in February 2015, and serves on the Advisory Board of Facing History and Ourselves, the Council on the University of Chicago Booth School of Business, the Executive Committee of the Board of Directors of World Business Chicago, the Board of Directors of New Schools for Chicago and of the Chicago Council on Global Affairs, and the Board of Trustees of the Aspen Institute and of the Latin School of Chicago. Mr. Hoplamazian is a member of the World Travel & Tourism Council and the Commercial Club of Chicago and is a member of the Discovery Class of the Henry Crown Fellowship.
Patrick J. Grismer
was appointed as Executive Vice President, Chief Financial Officer in March 2016. In this role, Mr. Grismer is responsible for the global finance function, including financial reporting, planning, treasury, tax, investor relations, internal audit, and procurement. Mr. Grismer joined Hyatt from his post as Chief Financial Officer at Yum! Brands, where he previously held a number of roles including Chief Planning and Control Officer and Chief Financial Officer for Yum! Restaurants International. Prior to Yum!, he worked at The Walt Disney Company where he served in roles that included Vice President, Business Planning and Development for The Disneyland Resort and Chief Financial Officer for the Disney Vacation Club. Mr. Grismer began his career with Price Waterhouse. He earned CPA certification in the State of California.
Stephen G. Haggerty
was appointed Executive Vice President, Global Head of Capital Strategy, Franchising and Select Service in August 2014. In this role, Mr. Haggerty is responsible for implementing our overall capital and franchising strategy and overseeing our select service business. Prior to assuming his current role, Mr. Haggerty was the Executive Vice President, Global Head of Real Estate and Capital Strategy from October 2012. In that role, Mr. Haggerty was responsible for implementing our capital strategy, managing our hotel asset base and providing support to our development professionals around the world. Prior to October 2012, Mr. Haggerty was responsible for our global development team, our global feasibility and development finance team, our corporate transactions group, and our global asset management team that oversees all of our
50
owned hotel properties and development of hotels and vacation ownership properties in which we have ownership. Before joining us, Mr. Haggerty spent 13 years serving in several positions of increasing responsibility with Marriott International, Inc., a lodging company, most recently in London as Senior Vice President, International Project Finance and Asset Management for Europe, Africa and the Middle East from 2005 to 2007. Prior to this position, from 2003 to 2005, Mr. Haggerty served as Marriott's Senior Vice President of Global Asset Management and Development Finance and previously lived in Asia for nine years holding a variety of roles relating to development at Marriott.
H. Charles Floyd
was appointed Executive Vice President, Global President of Operations in August 2014. In this role, Mr. Floyd leads and develops Hyatt’s shared operation services organization known as the GOC and is responsible for the successful operation of Hyatt’s hotels globally. Mr. Floyd is also responsible for ensuring operating efficiency in the roll-out of new innovations, unifying the Company's global operations, and overseeing the Company’s information technology resources, worldwide sales organization and call centers. The Group Presidents for each of Hyatt’s three regions report to Mr. Floyd. Prior to his current role, Mr. Floyd was Executive Vice President, Group President—Global Operations Center from October 2012. Mr. Floyd has been with us since 1981. Mr. Floyd served as our Chief Operating Officer—North America from January 2006. In this role he was responsible for management of our full service hotels and resorts as well as the Hyatt Place and the Hyatt House brands in the United States, Canada and the Caribbean. In addition, he oversaw Hyatt Residential Group, Inc. (formerly known as Hyatt Vacation Ownership, Inc.) and the Franchise Owner Relations Group, which supports both full service and select service and extended stay franchisees. He also oversaw various corporate functions for North America, including sales, human resources, product and design, rooms, food and beverage and engineering. Since joining Hyatt, Mr. Floyd served in a number of senior positions, including Executive Vice President—North America Operations and Senior Vice President of Sales, as well as various managing director and general manager roles.
Peter J. Sears
was appointed Executive Vice President, Group President—Americas in September 2014. Mr. Sears is responsible for the growth and successful operation of Hyatt’s portfolio in the United States, Canada, Latin America and the Caribbean. Prior to his current role, he was the Senior Vice President, Operations for Asia Pacific. Mr. Sears began his career with Hyatt as a corporate trainee at Hyatt Regency San Antonio in 1987, and went on to hold numerous positions of increasing operational responsibility. These positions included serving as general manager of five full service hotels in North America at properties located in San Francisco, Orange County, and Lake Tahoe. In 2006, he became Senior Vice President of Field Operations for the Central Region, and in 2009, became Senior Vice President, Operations for North America.
David Udell
was appointed as Executive Vice President, Group President—ASPAC in July 2014. Mr. Udell is responsible for overseeing hotels in Southeast Asia, Greater China, Australia, South Korea, Japan and Micronesia. Prior to his current role, Mr. Udell was the Senior Vice President, Operations for the GOC. Mr. Udell has also served as Senior Vice President—Operations, Asia Pacific, where he was responsible for overseeing the operation of 55 hotels within the region. Over the last 32 years, Mr. Udell has held senior management positions in Hyatt properties in Bangkok, Seoul, Hong Kong and Tokyo. In 1992, he was appointed opening General Manager of Park Hyatt Tokyo and in 1996, General Manager of Grand Hyatt Hong Kong. Mr. Udell is a 1982 graduate of the Cornell School of Hotel Administration in Ithaca, N.Y. He began his career with Hyatt as a Corporate Management Trainee at Hyatt Regency Singapore in 1982.
Peter Fulton
was appointed Executive Vice President, Group President—EAME/SW Asia in October 2012. Mr. Fulton is responsible for overseeing hotels in Europe, Africa, the Middle East, India, Central Asia and Nepal. In 1983, Mr. Fulton embarked on his career with Hyatt International as Food & Beverage Manager at Hyatt Regency Auckland. For the next nine years, he filled senior food and beverage positions at Hyatt properties in Dubai, Canberra and Macau before receiving his first appointment as Manager at Hyatt Regency Acapulco. In 1994, Mr. Fulton was appointed General Manager of the same hotel. Three years later, Mr. Fulton was appointed General Manager at Hyatt Regency Delhi, where he remained until assuming the position of General Manager of Grand Hyatt Dubai. From 2001 until February 2008, Mr. Fulton oversaw Grand Hyatt Dubai, the largest 5-star hotel in the region, which opened in March 2003. From February 2008 until October 2012, Mr. Fulton was the Managing Director South West Asia. Prior to Hyatt, Mr. Fulton worked for Travelodge in Christchurch and Auckland, New Zealand, Claridges Hotel in London, and Le Beau Rivage Palace Hotel in Lausanne, Switzerland.
Rena Hozore Reiss
has served as our Executive Vice President, General Counsel and Secretary since August 2010. Ms. Reiss joined Hyatt after spending 10 years at Marriott International, Inc. where she most recently served as Senior Vice President and Associate General Counsel, overseeing a legal team responsible for supporting that company's development activities in the Americas. From 2000 to 2007, Ms. Reiss held a series of increasingly responsible positions at Marriott, including serving as Senior Counsel and Vice President and Assistant General Counsel. Prior to entering the hospitality industry, Ms. Reiss practiced law at Thomson Muraro Razook & Hart in Miami, Florida, served as an Associate General Counsel for the Miami Herald Publishing Company, and was a Partner with Counts & Kanne, Chartered in Washington, DC.
Maryam Banikarim
was appointed as Executive Vice President, Global Chief Marketing Officer in January 2015. Ms. Banikarim is responsible for driving the company's individual brands and the experiences they offer online and offline while
51
working across the organization to facilitate innovation around the guest experience. Ms. Banikarim joined Hyatt with more than 20 years of marketing expertise across multiple industries. In her most recent prior role from 2011 to January 2015, she was Gannett’s first ever Chief Marketing Officer and also served as Senior Vice President. Before Gannett, Ms. Banikarim served as Senior Vice President at NBC Universal from 2009 to 2011, Chief Marketing Officer for Univision Communications, Inc. from 2002 to 2009, and founded a strategy firm that consulted for such clients as Deutsche Bank, Bacardi and Time-Warner. She also worked at Turner Broadcasting, MacMillan Publishing, and was a lead team member for the launch of CitySearch, an early Internet start-up. Ms. Banikarim began her career at Young & Rubicam.
Anne-Marie Law
was appointed as Executive Vice President, Chief Human Resources Officer in October 2016, bringing more than 25 years of human resources and organizational transformation experience. In her role, she is responsible for the strategy to support Hyatt’s most critical asset - its more than
110,000
colleagues worldwide - as well as global diversity, learning and development, corporate social responsibility, talent management, compensation and benefits. Prior to joining Hyatt, Ms. Law served as Executive Vice President and Head of Human Resources for Baxalta Incorporated. Before Baxalta, she held various senior human resources positions at McKesson Corporation and VeriSign. Prior to joining VeriSign, Ms. Law spent approximately eight years in human resources leadership positions with Xilinx, Inc.
Pursuant to our employment letter with Mr. Thomas J. Pritzker, we have agreed that so long as he is a member of our board of directors we will use our commercially reasonable efforts to appoint him as our executive chairman as long as he is willing and able to serve in that office. If he is not re-appointed as executive chairman, he will be entitled to terminate his employment with the rights and entitlements available to him under our severance policies as if his employment was terminated by us without cause.
Pursuant to our employment letter with Mr. Mark S. Hoplamazian, we have agreed that so long as he is the president and chief executive officer of Hyatt, we will use our commercially reasonable efforts to nominate him for re-election as a director prior to the end of his term. If he is not re-elected to the board of directors, he will be entitled to terminate his employment with the rights and entitlements available to him under our severance policies as if his employment was terminated by us without cause.
52
|
Item 5.
|
Market for Registrant's Common Equity, Related Stockholder Matters and Issuer Purchases of Equity Securities.
|
Market Information
Our Class A common stock began trading publicly on the New York Stock Exchange under the symbol "H" on November 5, 2009. Prior to that time, there was no public market for our Class A common stock. At January 31, 2017, our Class A common stock was held by approximately 32 shareholders of record and there were
39,707,321
shares of Class A common stock outstanding. This stockholder figure does not include a substantially greater number of "street name" holders or beneficial holders of our Class A common stock whose shares are held of record by banks, brokers and other financial institutions. The following table sets forth, for the period indicated, the high and low sale prices of our Class A common stock as reported by the New York Stock Exchange for the two most recent fiscal years.
|
Fiscal Year end December 31, 2016
|
High
|
Low
|
|
|
First Quarter
|
$49.82
|
$34.06
|
|
|
Second Quarter
|
$50.94
|
$44.30
|
|
|
Third Quarter
|
$54.82
|
$47.85
|
|
|
Fourth Quarter
|
$58.05
|
$47.96
|
|
|
Fiscal Year end December 31, 2015
|
|
||
|
First Quarter
|
$61.99
|
$55.03
|
|
|
Second Quarter
|
$60.35
|
$56.00
|
|
|
Third Quarter
|
$59.94
|
$45.71
|
|
|
Fourth Quarter
|
$54.00
|
$46.64
|
|
On February 10, 2017, the closing stock price of our Class A common stock was $56.15.
There is no established public trading market for our Class B common stock. At January 31, 2017, our Class B common stock was held by 101 shareholders and there were
90,863,209
shares of Class B common stock outstanding.
Dividends
We have never declared or paid cash dividends on our common stock. In addition, we must comply with the covenants in our revolving credit facility if we want to pay cash dividends. We currently intend to retain our future earnings, if any, to finance the further development and expansion of our business and engage in share repurchase activity. Any future determination to pay dividends will be at the discretion of our board of directors and will depend on our financial condition, capital requirements, restrictions contained in current or future financing instruments and such other factors as our board of directors deems relevant.
53
Performance Graph
The following performance graph and related information shall not be deemed "soliciting material" or to be "filed" with the SEC, nor shall such information be incorporated by reference into any future filing under the Securities Act or Exchange Act, except to the extent we specifically incorporate it by reference into such filing.
The following graph compares the cumulative total stockholder return since December 31, 2011, with the S&P 500 Index ("S&P 500") and the Russell 1000 Hotel/Motel Index (the "Russell 1000 Hotel"). The graph assumes the value of the investment in our Class A common stock and each index was $100 at December 31, 2011 and all dividends and other distributions were reinvested.
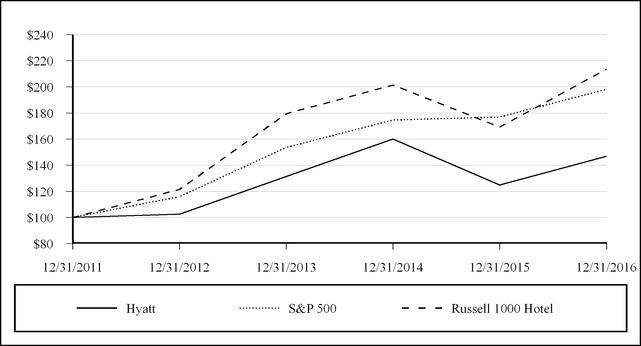
|
12/31/2011
|
12/31/2012
|
12/31/2013
|
12/31/2014
|
12/31/2015
|
12/31/2016
|
|
|
Hyatt Hotels Corporation
|
100.0
|
102.5
|
131.4
|
160.0
|
124.9
|
146.8
|
|
S&P 500
|
100.0
|
116.0
|
153.5
|
174.5
|
176.9
|
198.0
|
|
Russell 1000 Hotel
|
100.0
|
121.5
|
179.4
|
201.4
|
169.2
|
213.6
|
Recent Sales of Unregistered Securities
None.
Use of Proceeds from Registered Securities
None.
54
Purchases of Equity Securities by the Issuer and Affiliated Purchasers
Issuer Purchases of Equity Securities
The following table sets forth information regarding the Company's purchases of shares of Class A common stock during the quarter ended
December 31, 2016
:
|
Total Number of Shares Purchased (1)
|
Weighted Average Price Paid per Share
|
Total Number of Shares Purchased as Part of Publicly Announced Plans
|
Maximum Number (or Approximate Dollar Value) of Shares that May Yet Be Purchased under the Program
|
||||||||||||
|
October 1 to October 31, 2016
|
—
|
|
$
|
—
|
|
—
|
|
$
|
110,972,257
|
|
|||||
|
November 1 to November 30, 2016
|
—
|
|
—
|
|
—
|
|
$
|
110,972,257
|
|
||||||
|
December 1 to December 31, 2016
|
75,133
|
|
56.64
|
|
75,133
|
|
$
|
356,716,753
|
|
||||||
|
Total
|
75,133
|
|
$
|
56.64
|
|
75,133
|
|
||||||||
(
1) On each of February 18, 2016 and December 13, 2016, we announced the approvals of expansions of our share repurchase program pursuant to which we are authorized to purchase up to an additional $250 million of Class A and Class B common stock in the open market, in privately negotiated transactions, or otherwise, including pursuant to a Rule 10b5-1 plan. The repurchase program does not have an expiration date. At
December 31, 2016
, the Company had approximately
$357 million
remaining under the share repurchase authorization.
55
Item 6.
Selected Financial Data.
We derived the selected
consolidated statements of income
data for the years ended
December 31, 2016
,
December 31, 2015
and
December 31, 2014
and the selected consolidated balance sheet data at
December 31, 2016
and
December 31, 2015
from our audited consolidated financial statements included in this annual report. We derived the selected
consolidated statements of income
data for the years ended
December 31, 2013
and
December 31, 2012
and the selected consolidated balance sheet data at
December 31, 2014
,
December 31, 2013
and
December 31, 2012
from our previously audited consolidated financial statements which are not included in this annual report. Our selected consolidated balance sheet data for all prior periods has been restated for the adoption of Accounting Standards Update No. 2015-03 ("ASU 2015-03"),
Interest - Imputation of Interest (Subtopic 835-30): Simplifying the Presentation of Debt Issuance Costs
. Our historical results are not necessarily indicative of the results expected for any future period.
The selected historical financial data should be read together with the consolidated financial statements and related notes appearing in this annual report, as well as Part II, Item 7, "Management’s Discussion and Analysis of Financial Condition and Results of Operations" and the other financial information included elsewhere in this annual report.
|
Year Ended December 31,
|
|||||||||||||||||||
|
2016
|
2015
|
2014
|
2013
|
2012
|
|||||||||||||||
|
Consolidated statements of income data:
|
|||||||||||||||||||
|
Owned and leased hotels
|
$
|
2,108
|
|
$
|
2,079
|
|
$
|
2,246
|
|
$
|
2,142
|
|
$
|
2,021
|
|
||||
|
Management and franchise fees
|
448
|
|
427
|
|
387
|
|
342
|
|
307
|
|
|||||||||
|
Other revenues
|
40
|
|
36
|
|
75
|
|
78
|
|
78
|
|
|||||||||
|
Other revenues from managed properties (1)
|
1,833
|
|
1,786
|
|
1,707
|
|
1,622
|
|
1,543
|
|
|||||||||
|
Total revenues
|
4,429
|
|
4,328
|
|
4,415
|
|
4,184
|
|
3,949
|
|
|||||||||
|
Direct and selling, general, and administrative expenses
|
4,130
|
|
4,005
|
|
4,136
|
|
3,951
|
|
3,790
|
|
|||||||||
|
Income from continuing operations
|
204
|
|
124
|
|
346
|
|
205
|
|
87
|
|
|||||||||
|
Net (income) loss attributable to noncontrolling interests
|
—
|
|
—
|
|
(2
|
)
|
2
|
|
1
|
|
|||||||||
|
Net income attributable to Hyatt Hotels Corporation
|
204
|
|
124
|
|
344
|
|
207
|
|
88
|
|
|||||||||
|
Income from continuing operations per common share - basic
|
$
|
1.53
|
|
|
$
|
0.87
|
|
|
$
|
2.26
|
|
|
$
|
1.29
|
|
|
$
|
0.53
|
|
|
Income from continuing operations per common share - diluted
|
$
|
1.52
|
|
$
|
0.86
|
|
$
|
2.24
|
|
$
|
1.29
|
|
$
|
0.53
|
|
||||
|
At December 31,
|
|||||||||||||||||||
|
2016
|
2015
|
2014
|
2013
|
2012
|
|||||||||||||||
|
Consolidated balance sheet data:
|
|||||||||||||||||||
|
Cash and cash equivalents
|
$
|
482
|
|
$
|
457
|
|
$
|
685
|
|
$
|
454
|
|
$
|
413
|
|
||||
|
Total current assets
|
1,139
|
|
1,124
|
|
1,709
|
|
1,163
|
|
1,758
|
|
|||||||||
|
Property and equipment, net
|
4,270
|
|
4,031
|
|
4,186
|
|
4,671
|
|
4,139
|
|
|||||||||
|
Intangibles, net
|
599
|
|
547
|
|
552
|
|
591
|
|
388
|
|
|||||||||
|
Total assets
|
7,749
|
|
7,591
|
|
8,137
|
|
8,170
|
|
7,624
|
|
|||||||||
|
Total current liabilities
|
924
|
|
1,107
|
|
730
|
|
871
|
|
618
|
|
|||||||||
|
Long-term debt
|
1,445
|
|
1,042
|
|
1,375
|
|
1,282
|
|
1,223
|
|
|||||||||
|
Other long-term liabilities
|
1,472
|
|
1,447
|
|
1,401
|
|
1,240
|
|
962
|
|
|||||||||
|
Total liabilities
|
3,841
|
|
3,596
|
|
3,506
|
|
3,393
|
|
2,803
|
|
|||||||||
|
Total stockholders’ equity
|
3,903
|
|
3,991
|
|
4,627
|
|
4,769
|
|
4,811
|
|
|||||||||
|
Total liabilities and equity
|
$
|
7,749
|
|
$
|
7,591
|
|
$
|
8,137
|
|
$
|
8,170
|
|
$
|
7,624
|
|
||||
|
(1)
|
Represents revenues we receive from third-party property owners who reimburse us for costs we incur on their behalf, with no added margin. These costs relate primarily to payroll at managed properties where we are the employer, as well as reservations, marketing and technology costs. As a result, these revenues have no effect on our profit, although they do increase our total revenues and the corresponding costs increase our total expenses.
|
56
Item 7.
Management’s Discussion and Analysis of Financial Condition and Results of Operations.
The following discussion and analysis of our financial condition and results of operations should be read in conjunction with Part II, Item 6, "Selected Financial Data" and Part IV, Item 15, "Exhibits and Financial Statement Schedule
—
Consolidated Financial Statements." In addition to historical data, this discussion contains forward-looking statements about our business, operations and financial performance based on current expectations that involve risks, uncertainties and assumptions. Our actual results may differ materially from those discussed in the forward-looking statements as a result of various factors, including but not limited to those discussed in "Disclosure Regarding Forward-Looking Statements" and Part I, Item 1A, "Risk Factors" included elsewhere in this annual report.
Overview
At
December 31, 2016
, our worldwide hotel portfolio consisted of
657
hotels (
171,133
rooms), including:
|
•
|
281
managed properties (
92,021
rooms), all of which we operate under management agreements with third-party property owners;
|
|
•
|
304
franchised properties (
50,417
rooms), all of which are owned by third parties that have franchise agreements with us and are operated by third parties;
|
|
•
|
35
owned properties (
18,013
rooms) (including
1
consolidated hospitality venture),
1
capital leased property (
171
rooms) and
7
operating leased properties (
2,411
rooms), all of which we manage; and
|
|
•
|
23
managed properties and
6
franchised properties owned or leased by unconsolidated hospitality ventures (
8,100
rooms).
|
Our worldwide property portfolio also includes:
|
•
|
6
all inclusive resorts (
2,401
rooms), all of which are owned and operated by an unconsolidated hospitality venture that has franchise agreements with us;
|
|
•
|
16
vacation ownership properties (
1,038
units), all of which are licensed by ILG under the Hyatt Residence Club brand and operated by third parties, including ILG and its affiliates; and
|
|
•
|
19
residential properties (
2,546
units), which consist of branded residences and serviced apartments. We manage all of the serviced apartments and those branded residential units that participate in a rental program with an adjacent Hyatt-branded hotel.
|
We believe our business model allows us to pursue more diversified revenue and income streams that balance both the advantages and risks associated with these lines of business. Our expertise and experience in each of these areas gives us the flexibility to evaluate growth opportunities across these lines of business. Growth in the number of management and franchise agreements and earnings therefrom typically results in higher overall returns on invested capital because the capital investment under a typical management or franchise agreement is not significant. The capital required to build and maintain hotels we manage or franchise for third-party owners is typically provided by the owner of the respective property with minimal capital required by us as the manager or franchisor. During periods of increasing demand we do not share fully in the incremental profits of hotel operations for hotels we manage for third-party owners as our fee arrangements generally include a base amount calculated using the revenue from the subject hotel and an incentive fee that is, typically, a percentage of hotel profits that is usually less than 20%, with certain financial thresholds to be satisfied, with the actual level depending on the structure and terms of the management agreement. We do not share in the benefits of increases in profits from franchised properties because franchisees pay us an initial application fee and ongoing royalty fees that are calculated as a percentage of gross room revenues, and also at times as a percentage of food and beverage revenues, with no fees based on profits. Disputes or disruptions may arise with third-party owners of hotels we manage, franchise or license and these disputes can result in termination of the relevant agreement.
With respect to property ownership, we believe ownership of selected hotels in key markets enhances our ability to control our brand presence in these markets. Ownership of hotels allows us to capture the full benefit of increases in operating profits during periods of increasing demand and room rates. The cost structure of a typical hotel is more fixed than variable, so as demand and room rates increase over time, the pace of increase in operating profits typically is higher than the pace of increase of revenues. Hotel ownership is, however, more capital intensive than managing hotels for third-party owners, as we are responsible for the costs and all capital expenditures for our owned hotels. The profits realized in our owned and leased hotels segment are generally more significantly affected by economic downturns and declines in revenues than the results of our management and franchising segments. This is because we absorb the full impact of declining profits for our owned and leased hotels whereas our management and franchise fees do not have the same level of downside exposure to declining hotel profitability. See also "—Principal Factors Affecting Our Results of Operations—Expenses—Factors Affecting Our Costs and Expenses—Fixed nature of expenses." and Part I, Item 1A, "Risk Factors—Risks Related to Our Business—We are exposed to
57
the risks resulting from significant investments in owned and leased real estate, which could increase our costs, reduce our profits, limit our ability to respond to market conditions or restrict our growth strategy."
For the years ended
December 31, 2016
,
December 31, 2015
and
December 31, 2014
,
80.6%
,
80.7%
, and
78.7%
of our revenues were derived from operations in the United States, respectively. At
December 31, 2016
and
December 31, 2015
,
78.4%
and
75.7%
of our long-lived assets were located in the United States, respectively.
We report our consolidated operations in U.S. dollars. Amounts are reported in millions, unless otherwise noted. Constant currency disclosures throughout Management's Discussion and Analysis of Financial Condition and Results of Operations are non-GAAP measures. See "—Key Business Metrics Evaluated by Management—Constant dollar currency" below for further discussion of constant currency disclosures. We manage our business within four reportable segments, see Part IV, Item 15, "Exhibits and Financial Statement Schedule—Note
18
to the Consolidated Financial Statements."
Key Business Metrics Evaluated by Management
Revenues
We primarily derive our revenues from hotel operations, management and franchise fees, other revenues from managed properties and license fees from vacation ownership properties. Management uses revenues to assess the overall performance of our business and analyze trends such as consumer demand, brand preference and competition. For a detailed discussion of the factors that affect our revenues, see "—Principal Factors Affecting Our Results of Operations—Revenues."
Net Income Attributable to Hyatt Hotels Corporation
Net income attributable to Hyatt Hotels Corporation represents the total earnings or profits generated by our business. Management uses net income to analyze the performance of our business on a consolidated basis.
Adjusted Earnings Before Interest Expense, Taxes, Depreciation, and Amortization ("Adjusted EBITDA") and EBITDA
We use the terms Adjusted EBITDA and EBITDA throughout this annual report. Adjusted EBITDA and EBITDA, as we define them, are non-GAAP measures (as defined below). We define consolidated Adjusted EBITDA as net income attributable to Hyatt Hotels Corporation plus our pro rata share of unconsolidated hospitality ventures Adjusted EBITDA based on our ownership percentage of each venture, adjusted to exclude the following items:
|
•
|
interest expense;
|
|
•
|
provision for income taxes;
|
|
•
|
depreciation and amortization;
|
|
•
|
equity earnings (losses) from unconsolidated hospitality ventures;
|
|
•
|
stock-based compensation expense;
|
|
•
|
gains (losses) on sales of real estate and other;
|
|
•
|
asset impairments;
|
|
•
|
other income (loss), net; and
|
|
•
|
net income attributable to noncontrolling interests.
|
Effective January 1, 2016, our definitions of Adjusted EBITDA and Adjusted selling, general, and administrative expenses, as defined below, have been updated to exclude stock-based compensation expense, to facilitate comparison with our competitors. We have applied this change in the definition of Adjusted EBITDA to 2015 and 2014 historical results to allow for comparability between the periods presented.
We calculate consolidated Adjusted EBITDA by adding the Adjusted EBITDA of each of our reportable segments to corporate and other Adjusted EBITDA. See "—Results of Operations."
Our board of directors and executive management team focus on Adjusted EBITDA as a key performance and compensation measure both on a segment and on a consolidated basis. Adjusted EBITDA assists us in comparing our performance over various reporting periods on a consistent basis because it removes from our operating results the impact of items that do not reflect our core operations both on a segment and on a consolidated basis. Our President and Chief Executive Officer, who is our chief operating decision maker, also evaluates the performance of each of our reportable segments and determines how to allocate resources to those segments, in significant part, by assessing the Adjusted EBITDA of each segment. In addition, the compensation committee of our board of directors determines the annual variable compensation for
58
certain members of our management based in part on consolidated Adjusted EBITDA, segment Adjusted EBITDA or some combination of both.
We believe Adjusted EBITDA is useful to investors because it provides investors the same information we use internally for purposes of assessing our operating performance and making selected compensation decisions.
Adjusted EBITDA and EBITDA are not substitutes for net income attributable to Hyatt Hotels Corporation, net income or any other measure prescribed by accounting principles generally accepted in the United States of America (GAAP). There are limitations to using non-GAAP measures such as Adjusted EBITDA and EBITDA. Although we believe Adjusted EBITDA can make an evaluation of our operating performance more consistent because it removes items that do not reflect our core operations, other companies in our industry may define Adjusted EBITDA differently than we do. As a result, it may be difficult to use Adjusted EBITDA or similarly named non-GAAP measures that other companies may use to compare the performance of those companies to our performance. Because of these limitations, Adjusted EBITDA should not be considered as a measure of the income generated by our business. Our management compensates for these limitations by reference to our GAAP results and using Adjusted EBITDA supplementally. See our
consolidated statements of income
in our consolidated financial statements included in Part IV, Item 15, "Exhibits and Financial Statement Schedule—Consolidated Financial Statements".
For a reconciliation of net income attributable to Hyatt Hotels Corporation to EBITDA and a reconciliation of EBITDA to consolidated Adjusted EBITDA, see "—Results of Operations."
Adjusted selling, general, and administrative expenses
Adjusted selling, general, and administrative expenses, as we define it, is a non-GAAP measure. Adjusted selling, general, and administrative expenses excludes the impact of expenses related to benefit programs funded through rabbi trusts and stock-based compensation expense. Adjusted selling, general, and administrative expenses assist us in comparing our performance over various reporting periods on a consistent basis since it removes from our operating results the impact of items that do not reflect our core operations, both on a segment and consolidated basis. See "—Results of Operations" for a reconciliation of selling, general, and administrative expenses to Adjusted selling, general, and administrative expenses.
Constant dollar currency
We report the results of our operations both on an as reported basis, as well as on a constant dollar basis. Constant dollar currency, which is a non-GAAP measure, excludes the effects of movements in foreign currency exchange rates between comparative periods. We believe constant dollar analysis provides valuable information regarding our results as it removes currency fluctuations from our operating results. We calculate constant dollar currency by restating prior-period local currency financial results at the current period’s exchange rates. These adjusted amounts are then compared to our current period reported amounts to provide operationally driven variances in our results.
Revenue per Available Room (RevPAR)
RevPAR is the product of ADR and the average daily occupancy percentage. RevPAR does not include non-room revenues, which consist of ancillary revenues generated by a hotel property, such as food and beverage, parking, telephone and other guest service revenues. Our management uses RevPAR to identify trend information with respect to room revenues from comparable properties and to evaluate hotel performance on a regional and segment basis. RevPAR is a commonly used performance measure in the industry.
RevPAR changes driven predominantly by changes in occupancy have different implications for overall revenue levels and incremental profitability than do changes driven predominantly by changes in average room rates. For example, increases in occupancy at a hotel would lead to increases in room revenues and additional variable operating costs (including housekeeping services, utilities and room amenity costs), and could also result in increased ancillary revenues (including food and beverage). In contrast, changes in average room rates typically have a greater impact on margins and profitability as there is no substantial effect on variable costs.
Average Daily Rate
ADR represents hotel room revenues, divided by the total number of rooms sold in a given period. ADR measures average room price attained by a hotel and ADR trends provide useful information concerning the pricing environment and the nature of the customer base of a hotel or group of hotels. ADR is a commonly used performance measure in the industry, and we use ADR to assess the pricing levels we are able to generate by customer group, as changes in rates have a different effect on overall revenues and incremental profitability than changes in occupancy, as described above.
59
Occupancy
Occupancy represents the total number of rooms sold divided by the total number of rooms available at a hotel or group of hotels. Occupancy measures the utilization of our hotels' available capacity. Management uses occupancy to gauge demand at a specific hotel or group of hotels in a given period. Occupancy levels also help us determine achievable ADR levels as demand for hotel rooms increases or decreases.
Comparable Hotels
"Comparable systemwide hotels" represents all properties we manage or franchise (including owned and leased properties) and that are operated for the entirety of the periods being compared and that have not sustained substantial damage, business interruption or undergone large scale renovations during the periods being compared or for which comparable results are not available. We may use variations of comparable systemwide hotels to specifically refer to comparable systemwide Americas full service or select service hotels for those properties that we manage or franchise within the Americas management and franchising segment, comparable systemwide ASPAC full service hotels for those properties that we manage or franchise within the ASPAC management and franchising segment, or comparable systemwide EAME/SW Asia full service or select service hotels for those properties that we manage or franchise within the EAME/SW Asia management and franchising segment. "Comparable operated hotels" is defined the same as "comparable systemwide hotels" with the exception that it is limited to only those hotels we manage or operate and excludes hotels we franchise. "Comparable owned and leased hotels" represents all properties we own or lease and that are operated and consolidated for the entirety of the periods being compared and have not sustained substantial damage, business interruption or undergone large scale renovations during the periods being compared or for which comparable results are not available. Comparable systemwide hotels and comparable owned and leased hotels are commonly used as a basis of measurement in the industry. "Non-comparable systemwide hotels" or "Non-comparable owned and leased hotels" represent all hotels that do not meet the respective definition of "comparable" as defined above.
Principal Factors Affecting Our Results of Operations
Revenues
Principal Components
We primarily derive our revenues from the following sources:
Revenues from hotel operations.
Represents revenues derived from hotel operations, including room rentals and food and beverage sales, and other ancillary revenues at our owned and leased properties. Revenues from the majority of our hotel operations depend heavily on demand from group and transient travelers, as discussed below. Revenues from our owned and leased hotels segment are primarily derived from hotel operations.
Revenues from room rentals and ancillary revenues are primarily derived from three categories of customers: transient, group and contract. Transient guests are individual travelers who are traveling for business or leisure. Our group guests are traveling for group events that reserve a minimum of 10 rooms for meetings or social functions sponsored by associations, corporate, social, military, educational, religious or other organizations. Group business usually includes a block of room accommodations as well as other ancillary services, such as catering and banquet services. Our contract guests are traveling under a contract negotiated for a block of rooms for more than 30 days in duration at agreed-upon rates. Airline crews are typical generators of contract demand for our hotels.
Management and franchise fees.
Represents revenues derived from fees earned from hotels and residential properties managed worldwide (usually under long-term management agreements), franchise fees received in connection with the franchising of our brands (usually under long-term franchise agreements), termination fees, the amortization of deferred gains related to sold properties for which we have significant continuing involvement and license fees received in connection with vacation ownership properties. For a detailed discussion of our management and franchise fees, see Part I, Item 1, "Business—Management Agreements—Fees" and Part I, Item 1, "Business—Franchise Agreements—Fees."
Other revenues from managed properties.
Represents revenues related primarily to payroll costs, as well as reservations, marketing and technology costs at managed properties where we are the employer and are fully reimbursed by the third-party property owner based on the costs incurred, with no added margin. As a result, these revenues have no effect on our profit, although they do increase our total revenues and the corresponding costs increase our total expenses. We record these revenues in "Other revenues from managed properties" and the corresponding costs in "Other costs from managed properties" in our
consolidated statements of income
.
60
Intersegment eliminations.
We evaluate our reportable segments with intersegment revenues and expenses included in their results. These intersegment revenues and expenses represent management fee revenues and expenses related to our owned and leased hotels and promotional award redemption revenues and expenses related to our co-branded credit card, which are eliminated in consolidation.
Factors Affecting Our Revenues
For other factors affecting our revenues, see Part I, Item 1A, "Risk Factors—Risks Related to Our Business."
Consumer demand and global economic conditions
. Consumer demand for our products and services is closely linked to the performance of the general economy and is sensitive to business and personal discretionary spending levels. Declines in consumer demand due to adverse general economic conditions, risks affecting or reducing travel patterns, lower consumer confidence, adverse political conditions, currency volatility, impacts of terrorism and declining oil prices can lower the revenues and profitability of our owned hotel operations and the amount of management and franchising fee revenues we are able to generate from our managed and franchised properties. Also, declines in hotel profitability during an economic downturn directly impact the incentive portion of our management fees, since it is based on hotel profit measures. As a result, changes in consumer demand and general business cycles can subject and have subjected our revenues to significant volatility. See Part I, Item 1A, "Risk Factors—Risks Related to the Hospitality Industry."
For the year ended December 31, 2016 compared to the year ended December 31, 2015, RevPAR improvements for our Americas full service and select service hotels, comparable owned and leased hotels and ASPAC full service hotels were partially offset by RevPAR declines for our EAME/SW Asia full service hotels. During 2016, the industry experienced lower RevPAR growth rates than those seen over the past several years due to reduced demand and pricing power in certain markets. We expect these industry conditions to persist into 2017 and result in another year of moderate year over year RevPAR growth.
In the Americas management and franchising segment, transient demand and ADR growth at our full service hotels contributed to RevPAR increases during 2016 compared to 2015. Group ADR growth at our full service hotels was offset by lower group demand, resulting in limited group revenue growth during 2016 compared to 2015. Short-term group revenue booked in 2016 for stays in 2016 were lower compared to 2015. Long-term bookings in 2016 for stays in future years increased compared to 2015, despite a slow-down in long-term bookings during the fourth quarter as compared to the fourth quarter of 2015.
ASPAC management and franchising segment RevPAR increased during 2016 compared to 2015 driven by strong transient demand across the region, particularly in mainland China. Our hotels in South Korea experienced increased demand as the tourism industry has recovered after the country was negatively impacted by the MERS outbreak in 2015. While Hong Kong, Taiwan and Macau experienced lower visitor arrivals in 2016, Hong Kong group business remained strong despite the difficult market conditions.
EAME/SW Asia management and franchising segment RevPAR declined in 2016 compared to 2015 driven by lower ADR and occupancy in the Middle East, France, Switzerland and Turkey. The Middle East continued to experience pressure from new supply and reduced corporate business as a result of lower oil prices. The hotels in France and Turkey experienced lower demand due to security concerns and terrorism in the region. The RevPAR decreases in this segment were partially offset by strong rate and occupancy growth across Southwest Asia as the segment benefited from an improved business environment in India.
Competition.
The global lodging industry is highly competitive. While lodging demand has continued to grow over the last several years, we have also seen an increase in supply, particularly in certain key markets. This increased supply can put significant pressure on ADR levels at our properties as well as those of our competitors. Despite this increased supply, our systemwide RevPAR levels have increased each year since 2009. We also face competition from new channels of distribution in the travel industry, including online travel services and peer-to-peer inventory sources, as well as industry consolidation. We believe our brand strength and ability to manage our operations in an efficient manner will help us to continue competing successfully within the global hospitality industry.
Agreements with third-party owners and franchisees and relationships with developers
. We depend on our long-term management and franchise agreements with third-party owners and franchisees for a significant portion of our management and franchising fee revenues. The success and sustainability of our management and franchising business depends on our ability to perform under our management and franchising agreements and maintain good relationships with third-party owners and franchisees. Our relationships with these third parties also generate new relationships with developers and opportunities for property development that can support our growth. We believe we have good relationships with our third-party owners, franchisees and developers in all of our segments and are committed to the continued growth and development of these
61
relationships. These relationships exist with a diverse group of owners, franchisees and developers and are not heavily concentrated with any particular third party.
Access to capital
. The hospitality industry is a capital intensive business that requires significant amounts of capital expenditures to develop, maintain and renovate properties. Third-party owners are required to fund these capital expenditures for the properties they own in accordance with the terms of the applicable management or franchise agreement. Access to the capital that we or our third-party owners, franchisees or development partners need to finance the construction of new properties or to maintain and renovate existing properties is critical to the continued growth of our business and our revenues. The availability of capital or the conditions under which we or our third-party owners, franchisees or development partners can obtain capital can have a significant impact on the overall level and pace of future development and therefore the ability to grow our revenues.
Expenses
Principal Components
We primarily incur the following expenses:
Owned and leased hotels expenses.
Owned and leased hotels expenses reflect the expenses of our consolidated owned and leased hotels. Expenses to operate our hotels include room expense, food and beverage costs, other support costs and property expenses. Room expense includes compensation costs for housekeeping, laundry and front desk staff and supply costs for guest room amenities and laundry. Food and beverage costs include costs for wait and kitchen staff and food and beverage products. Other support expenses consist of costs associated with property-level management (including deferred compensation plans for certain employees that are funded through contributions to rabbi trusts), utilities, sales and marketing, operating hotel spas, telephones, parking and other guest recreation, entertainment and services. Property expenses include property taxes, repairs and maintenance, rent and insurance.
Depreciation and amortization expenses.
These are non-cash expenses that primarily consist of depreciation of fixed assets such as buildings, furniture, fixtures and equipment at our consolidated owned and leased hotels. Amortization expense primarily consists of amortization of management and franchise agreement intangibles and lease related intangibles.
Selling, general, and administrative expenses.
Selling, general, and administrative expenses consist primarily of compensation expense, including deferred compensation plans for certain employees that are funded through contributions to rabbi trusts, for our corporate staff and personnel supporting our business segments (including regional offices that support our management and franchising segments), professional fees (including consulting, audit and legal fees), travel and entertainment expenses, sales and marketing expenses, bad debt expenses and office administrative and related expenses.
Other costs from managed properties.
Represents costs related primarily to payroll expenses, as well as reservations, marketing and technology costs at managed properties where we are the employer. These costs are reimbursed to us with no added margin. As a result, these costs have no effect on our profit, although they do increase our total expenses and the corresponding reimbursements increase our total revenues.
Factors Affecting Our Costs and Expenses
For other factors affecting our costs and expenses, see Part I, Item 1A, "Risk Factors—Risks Related to Our Business."
Fixed nature of expenses.
Many of the expenses associated with developing, owning, operating, managing, franchising and licensing hotels and residential and vacation ownership properties are relatively fixed. These expenses include personnel costs, rent, property taxes, insurance and utilities. If we are unable to decrease these costs significantly or rapidly when demand for our hotels and other properties decreases, the resulting decline in our revenues can have a particularly adverse effect on our net cash flow, margins and profits. This effect can be especially pronounced during periods of economic contraction or slow economic growth. Economic downturns generally affect the results of our owned and leased hotels segment more significantly than the results of our management and franchising segments due to the high fixed costs associated with operating an owned or leased property. The effectiveness of any cost-cutting efforts is limited by the fixed-cost nature of our business. As a result, we may not always be able to offset reductions in revenue through cost cutting. Employees at some of our owned hotels are parties to collective bargaining agreements that may also limit our ability to make timely staffing or labor changes in response to declining revenues. In addition, efforts to reduce costs, or to defer or cancel capital improvements, could adversely affect the economic value of our properties and brands. We intend to manage our cost structure at levels appropriate for the degree of demand and revenue generated at our hotels.
Changes in depreciation expenses.
Changes in depreciation expenses may be driven by renovations of existing properties, acquisition or development of new properties or the disposition of existing properties through sale or closure. We intend to consider strategic and complementary acquisitions of and investments in businesses, properties or other assets. If we
62
consummate such acquisitions in businesses, properties or other assets, we would likely add depreciable assets, which would result in an increase in depreciation expenses.
Other Items
Asset impairments
We hold significant amounts of goodwill, intangible assets, property and equipment and investments. We evaluate these assets on a quarterly basis for impairment as further discussed in "—Critical Accounting Policies and Estimates." These evaluations have, in the past, resulted in impairment charges for certain of these assets based on the specific facts and circumstances surrounding those assets. We may be required to take additional impairment charges to reflect further declines in our asset and/or investment values.
Acquisitions, investments, divestitures and significant renovations
We routinely acquire, divest, make investments in or undertake large scale renovations of hotel properties. The results of operations derived from these properties do not, therefore, meet the definition of "comparable hotels" as defined in "—Key Business Metrics Evaluated by Management." The results of operations from these properties, however, may have a material effect on our results from period to period and are, therefore, addressed separately in our discussion on results of operations when material.
In 2016, we entered into the following key transactions:
|
•
|
acquired Thompson Miami Beach for a purchase price of approximately
$238 million
. The hotel was subsequently rebranded as The Confidante Miami Beach, and added to The Unbound Collection by Hyatt;
|
|
•
|
acquired our partners' share in Andaz Maui at Wailea Resort and villas for a net purchase price of approximately
$136 million
. We accounted for the transaction as a step acquisition and recorded a gain through equity earnings (losses) from unconsolidated hospitality ventures of
$14 million
. Additionally, prior to the acquisition the unconsolidated hospitality venture repaid $121 million of third-party debt;
|
|
•
|
acquired Royal Palms Resort and Spa in Phoenix, Arizona for a net purchase price of approximately $86 million and added the hotel to The Unbound Collection by Hyatt;
|
|
•
|
sold Andaz 5th Avenue for a net sales price of
$240 million
and entered into a long-term management agreement with the purchaser of the hotel;
|
|
•
|
sold the shares of the company that owns Hyatt Regency Birmingham (U.K.) for a net sales price of approximately
$49 million
and entered into a long-term management agreement with the purchaser of the hotel; and
|
|
•
|
two unconsolidated hospitality ventures in which we hold or held an ownership interest and that are classified as equity method investments sold five Hyatt Place hotels for which we received combined proceeds of
$15 million
.
|
In 2015, we entered into the following key transactions:
|
•
|
sold Hyatt Regency Indianapolis for a net sales price of $69 million and entered into a long-term franchise agreement with the purchaser of the hotel;
|
|
•
|
two unconsolidated hospitality ventures in which we hold or held an ownership interest and are classified as equity method investments sold two Hyatt House hotels for which we received combined proceeds of $16 million;
|
|
•
|
sold a Hyatt House hotel for a net sales price of $5 million; and
|
|
•
|
sold an entity which held an interest in one of our foreign currency denominated equity method investments, for which we received proceeds of $3 million. In connection with the sale, we released $21 million of accumulated foreign currency translation losses.
|
In 2014, we entered into the following key transactions:
|
•
|
sold 38 select service properties for approximately $581 million and entered into long-term franchise agreements with the purchaser of the hotels;
|
|
•
|
sold the Hyatt Residential Group for $220 million, net of working capital adjustments, which includes an interest in an unconsolidated hospitality venture that owns a vacation ownership property in Maui, Hawaii, as well as a full service hotel. We entered into a master license agreement and receive ongoing license fees under this agreement. The Hyatt Residence Club and the vacation ownership resorts retained the Hyatt Residence Club brand;
|
|
•
|
sold nine select service properties and one full service property for a combined $311 million. The properties remain Hyatt-branded hotels under long-term agreements;
|
63
|
•
|
acquired Park Hyatt New York for a purchase price of approximately $392 million;
|
|
•
|
acquired Hyatt Regency Lost Pines Resort and Spa and adjacent land from an unconsolidated hospitality venture for a net purchase price of approximately $164 million. We accounted for the transaction as a step acquisition and recorded a gain through equity earnings (losses) from unconsolidated hospitality ventures of
$12 million
. As part of the acquisition, we recorded debt of approximately $69 million, inclusive of a $3 million debt premium;
|
|
•
|
sold Hyatt Regency Vancouver for approximately $116 million and entered into a long-term management agreement with the purchaser of the hotel;
|
|
•
|
sold Park Hyatt Washington for approximately $97 million and entered into a long-term management agreement with the purchaser of the hotel;
|
|
•
|
sold Park Hyatt Toronto for approximately $88 million and entered into a long-term management agreement with the purchaser of the hotel;
|
|
•
|
sold five Hyatt Place hotels for a total of $51 million, net of closing costs, and entered into long-term franchise agreements with the purchasers of the hotels;
|
|
•
|
four unconsolidated hospitality ventures in which we held an ownership interest each sold a hotel to a third party. The hotels remain Hyatt-branded hotels under long-term management or franchise agreements; and
|
|
•
|
acquired Hyatt Regency Grand Cypress for
$191 million
after exercising our purchase option under a capital lease.
|
Effect of foreign currency exchange rate fluctuations
A significant portion of our operations are conducted in functional currencies other than our reporting currency which is the U.S. dollar. As a result, we are required to translate those results from the functional currency into U.S. dollars at market based average exchange rates during the period reported. When comparing our results of operations between periods, there may be material portions of the changes in our revenues or expenses that are derived from fluctuations in exchange rates experienced between those periods. See Part I, Item 1A, "Risk Factors—Risks Related to the Hospitality Industry—Because we derive a portion of our revenues from operations outside the United States, the risks of doing business internationally could lower our revenues, increase our costs, reduce our profits or disrupt our business."
64
Results of Operations
Years Ended
December 31, 2016
,
December 31, 2015
and
December 31, 2014
Discussion on Consolidated Results
For additional information regarding our consolidated results, please also refer to our consolidated statements of income included in Part IV, Item 15, "Exhibits and Financial Statement Schedule—Consolidated Financial Statements". The impact from our investments in marketable securities held to fund operating programs, including securities held to fund our benefit programs funded through a rabbi trust and securities held to fund our Hyatt Gold Passport program, were recorded on the various financial statement line items discussed below and have no impact on net income.
Owned and leased hotels revenues
.
2016 compared to 2015
|
Year Ended December 31,
|
||||||||||||||||||
|
2016
|
2015
|
Better / (Worse)
|
Currency Impact
|
|||||||||||||||
|
Comparable owned and leased hotels revenues
|
$
|
2,018
|
|
$
|
2,017
|
|
$
|
1
|
|
—
|
%
|
$
|
(23
|
)
|
||||
|
Non-comparable owned and leased hotels revenues
|
90
|
|
62
|
|
28
|
|
45.2
|
%
|
(2
|
)
|
||||||||
|
Total owned and leased hotels revenues
|
$
|
2,108
|
|
$
|
2,079
|
|
$
|
29
|
|
1.4
|
%
|
$
|
(25
|
)
|
||||
The increase in comparable owned and leased hotels revenues for the year ended December 31, 2016 compared to the year ended December 31, 2015 was primarily driven by full service hotels in the United States and Mexico, largely offset by decreases at certain of our international hotels which were primarily driven by market weakness in France, rate and occupancy declines in Switzerland and unfavorable net currency impact. The increase in non-comparable owned and leased hotels revenues was driven by acquisitions and openings in 2016, partially offset by hotels sold in 2015 and 2016.
2015 compared to 2014
|
Year Ended December 31,
|
||||||||||||||||||
|
2015
|
2014
|
Better / (Worse)
|
Currency Impact
|
|||||||||||||||
|
Comparable owned and leased hotels revenues
|
$
|
1,938
|
|
$
|
1,888
|
|
$
|
50
|
|
2.6
|
%
|
$
|
(56
|
)
|
||||
|
Non-comparable owned and leased hotels revenues
|
141
|
|
358
|
|
(217
|
)
|
(60.6
|
)%
|
(10
|
)
|
||||||||
|
Total owned and leased hotels revenues
|
$
|
2,079
|
|
$
|
2,246
|
|
$
|
(167
|
)
|
(7.4
|
)%
|
$
|
(66
|
)
|
||||
The increase in comparable owned and leased hotels revenues for the year ended December 31, 2015 compared to the year ended December 31, 2014 was primarily driven by full service hotels in the United States, partially offset by decreases at certain of our international hotels which were primarily driven by net unfavorable currency impact. The decrease in non-comparable owned and leased hotels revenues was driven by dispositions partially offset by openings and acquisitions during 2014 and 2015.
See "— Segment Results" for further discussion of owned and leased hotels revenues.
Management and franchise fee revenues.
|
Year Ended December 31,
|
|||||||||||||||||||||||||
|
2016
|
2015
|
2014
|
Better / (Worse)
2016 vs 2015
|
Better / (Worse)
2015 vs 2014
|
|||||||||||||||||||||
|
Base management fees
|
$
|
190
|
|
$
|
187
|
|
$
|
180
|
|
$
|
3
|
|
1.6
|
%
|
$
|
7
|
|
3.9
|
%
|
||||||
|
Incentive management fees
|
117
|
|
113
|
|
111
|
|
4
|
|
3.5
|
%
|
2
|
|
1.8
|
%
|
|||||||||||
|
Franchise fees
|
104
|
|
88
|
|
65
|
|
16
|
|
18.2
|
%
|
23
|
|
35.4
|
%
|
|||||||||||
|
Other fee revenues
|
37
|
|
39
|
|
31
|
|
(2
|
)
|
(5.1
|
)%
|
8
|
|
25.8
|
%
|
|||||||||||
|
Total management and franchise fees
|
$
|
448
|
|
$
|
427
|
|
$
|
387
|
|
$
|
21
|
|
4.9
|
%
|
$
|
40
|
|
10.3
|
%
|
||||||
The increase in management and franchise fee revenues included net unfavorable currency impact of
$3 million
for the year ended
December 31, 2016
compared to the same period in
2015
. The increase in franchise fees was driven by new and converted hotels and improved performance at existing hotels in the Americas. The increases in management fees were
65
primarily driven by improved performance at full service and select service properties in the Americas and full service properties in ASPAC, partially offset by decreased performance in Europe.
The increase in management and franchise fee revenues for the year ended December 31, 2015 compared to the same period in 2014, included a net unfavorable currency impact of $15 million. The increases in management fees were primarily driven by improved performance at full service properties in the Americas, partially offset by unfavorable currency impact on fees in Europe and decreased performance at certain properties in the Middle East. The increase in franchise fees was driven by new and converted hotels and improved performance at existing hotels in the Americas. The increase in other fee revenues was primarily driven by a $9 million increase in the amortization of deferred gains from hotels sold subject to long-term management agreements.
Other revenues.
Other revenues related to our co-branded credit card increased
$4 million
during the year ended
December 31, 2016
compared to the year ended
December 31, 2015
driven by program growth.
Other revenues decreased $39 million during the year ended December 31, 2015 compared to the year ended December 31, 2014 due to our sale of our vacation ownership business, partially offset by increased revenues related to our co-branded credit card driven by program growth.
Other revenues from managed properties.
|
Year Ended December 31,
|
|||||||||||||||||||||||||
|
2016
|
2015
|
2014
|
Better / (Worse)
2016 vs 2015 |
Better / (Worse)
2015 vs 2014 |
|||||||||||||||||||||
|
Other revenues from managed properties excluding rabbi trust impact
|
$
|
1,825
|
|
$
|
1,785
|
|
$
|
1,698
|
|
$
|
40
|
|
2.2
|
%
|
$
|
87
|
|
5.1
|
%
|
||||||
|
Rabbi trust impact
|
8
|
|
1
|
|
9
|
|
7
|
|
700.0
|
%
|
(8
|
)
|
(88.9
|
)%
|
|||||||||||
|
Other revenues from managed properties
|
$
|
1,833
|
|
$
|
1,786
|
|
$
|
1,707
|
|
$
|
47
|
|
2.6
|
%
|
$
|
79
|
|
4.6
|
%
|
||||||
Excluding the impact of rabbi trust, other revenues from managed properties increased in the year ended
December 31, 2016
compared to the year ended
December 31, 2015
due to a higher volume of reimbursements paid to us by our managed properties for increased member participation in our Hyatt Gold Passport program, increased technology and reservation costs and increased select service payroll and related costs, partially offset by a decrease in full service payroll and related costs driven by hotel conversions and a hotel that left the chain.
Excluding the impact of rabbi trust, other revenues from managed properties increased during the year ended December 31, 2015 compared to the year ended December 31, 2014 due to a higher volume of reimbursements paid to us by our managed properties for increased member participation in our Hyatt Gold Passport program, increased payroll and related costs and increased marketing costs, which was driven in part by new hotel openings and owned hotels sold subject to long-term management agreements. These increases were partially offset by decreases of $30 million in reimbursements due to the sale of our vacation ownership business.
Owned and leased hotels expense
.
|
Year Ended December 31,
|
||||||||||||||
|
2016
|
2015
|
Better / (Worse)
|
||||||||||||
|
Comparable owned and leased hotels expense
|
$
|
1,520
|
|
$
|
1,512
|
|
$
|
(8
|
)
|
(0.5
|
)%
|
|||
|
Non-comparable owned and leased hotels expense
|
87
|
|
49
|
|
(38
|
)
|
(77.6
|
)%
|
||||||
|
Rabbi trust impact
|
3
|
|
1
|
|
(2
|
)
|
(200.0
|
)%
|
||||||
|
Total owned and leased hotels expense
|
$
|
1,610
|
|
$
|
1,562
|
|
$
|
(48
|
)
|
(3.1
|
)%
|
|||
Comparable owned and leased hotels expense included
$15 million
net favorable currency impact in the year ended
December 31, 2016
compared to the year ended
December 31, 2015
. The increase in the year ended
December 31, 2016
compared to the year ended
December 31, 2015
was primarily driven by increased payroll and related costs, partially offset by a decrease in utilities expenses due to lower gas and oil prices. Non-comparable owned and leased hotels expense increased in the year ended
December 31, 2016
compared to the year ended
December 31, 2015
driven by the acquisitions and openings in 2016, partially offset by hotels sold in 2015 and 2016. See "— Segment Results" for a discussion of the non-comparable owned and leased hotels activity in 2016 and 2015. Additionally, expenses recognized with respect to our employee benefit programs funded through rabbi trusts increased driven by the performance of the underlying invested assets during the year ended
December 31, 2016
compared to the year ended
December 31, 2015
.
66
|
Year Ended December 31,
|
||||||||||||||
|
2015
|
2014
|
Better / (Worse)
|
||||||||||||
|
Comparable owned and leased hotels expense
|
$
|
1,447
|
|
$
|
1,423
|
|
$
|
(24
|
)
|
(1.7
|
)%
|
|||
|
Non-comparable owned and leased hotels expense
|
114
|
|
265
|
|
151
|
|
57.0
|
%
|
||||||
|
Rabbi trust impact
|
1
|
|
3
|
|
2
|
|
66.7
|
%
|
||||||
|
Total owned and leased hotels expense
|
$
|
1,562
|
|
$
|
1,691
|
|
$
|
129
|
|
7.6
|
%
|
|||
Comparable owned and leased hotels expense included $46 million net favorable currency impact in the year ended December 31, 2015 compared to the year ended December 31, 2014. The increase in comparable owned and leased hotels expense for the year ended December 31, 2015 compared to the year ended December 31, 2014 was primarily driven by increased property taxes, labor costs, and rent expense at certain properties and higher commissions across the portfolio due to increased group and transient business. Non-comparable owned and leased hotels expense included a $10 million net favorable currency impact in the year ended December 31, 2015 compared to the year ended December 31, 2014. The decrease in the year ended December 31, 2015 compared to the year ended December 31, 2014 was driven by the sale of four full service hotels and 52 select service hotels in 2014 and the sale of one full service hotel in 2015. See "— Segment Results" for a discussion of the non-comparable owned and leased hotels activity in 2015 and 2014. Additionally, expenses recognized with respect to our employee benefit programs funded through rabbi trusts decreased due to the performance of the underlying invested assets during the year ended December 31, 2015 compared to the year ended December 31, 2014.
Depreciation and amortization expense
. Depreciation and amortization expense increased
$22 million
in the year ended
December 31, 2016
compared to the year ended
December 31, 2015
primarily driven by depreciation for assets placed in service in 2015 and 2016 related to technology projects, acquisitions and hotel openings, partially offset by decreased depreciation related to the sale of Andaz 5th Avenue in the second quarter of 2016. A portion of the depreciation related to technology assets is recovered from our managed and franchised hotels and the corresponding recovery is included in other income (loss), net.
Depreciation and amortization expense decreased $34 million in the year ended December 31, 2015 compared to the year ended December 31, 2014 driven by non-comparable hotels sold during 2015 and 2014, partially offset by recently acquired and newly opened hotels.
Other direct costs
. Other direct costs increased
$1 million
in the year ended
December 31, 2016
compared to the year ended
December 31, 2015
. Other direct costs decreased $6 million in the year ended December 31, 2015 compared to the year ended December 31, 2014, driven by $14 million due to the sale of our vacation ownership business, which was partially offset by an increase of $8 million in direct costs of our co-branded credit card primarily due to program growth during 2015.
Selling, general, and administrative expenses
.
|
Year Ended December 31,
|
|||||||||||||||||||||||||
|
2016
|
2015
|
2014
|
Change
2016 vs 2015 |
Change
2015 vs 2014 |
|||||||||||||||||||||
|
Selling, general, and administrative expenses
|
$
|
315
|
|
$
|
308
|
|
$
|
349
|
|
$
|
7
|
|
2.3
|
%
|
$
|
(41
|
)
|
(11.7
|
)%
|
||||||
|
Less: rabbi trust impact
|
(14
|
)
|
(2
|
)
|
(9
|
)
|
(12
|
)
|
(600.0
|
)%
|
7
|
|
77.8
|
%
|
|||||||||||
|
Less: stock-based compensation expense
|
(25
|
)
|
(23
|
)
|
(49
|
)
|
(2
|
)
|
(8.7
|
)%
|
26
|
|
53.1
|
%
|
|||||||||||
|
Adjusted selling, general, and administrative expenses
|
276
|
|
283
|
|
291
|
|
(7
|
)
|
(2.5
|
)%
|
(8
|
)
|
(2.7
|
)%
|
|||||||||||
|
Less: vacation ownership business
|
—
|
|
—
|
|
(24
|
)
|
—
|
|
—
|
%
|
24
|
|
100.0
|
%
|
|||||||||||
|
Adjusted selling, general, and administrative expenses excluding impact of sale of vacation ownership business
|
$
|
276
|
|
$
|
283
|
|
$
|
267
|
|
$
|
(7
|
)
|
(2.5
|
)%
|
$
|
16
|
|
6.0
|
%
|
||||||
Adjusted selling, general, and administrative expenses decreased
$7 million
for the year ended
December 31, 2016
compared to the same period in
2015
, primarily driven by a $10 million decrease in professional fees related to certain initiatives completed in 2015, partially offset by a $5 million increase in payroll and related costs.
Adjusted selling, general, and administrative expenses, excluding vacation ownership, increased $16 million for the year ended December 31, 2015 compared to the same period in 2014, primarily driven by a $10 million increase in professional fees. The increase in professional fees was primarily due to certain initiatives completed during the year.
67
Net gains and interest income from marketable securities held to fund operating programs
.
|
Year Ended December 31,
|
|||||||||||||||||||||||||
|
2016
|
2015
|
2014
|
Better / (Worse)
2016 vs 2015 |
Better / (Worse)
2015 vs 2014 |
|||||||||||||||||||||
|
Rabbi trust impact allocated to selling, general, and administrative expenses
|
$
|
14
|
|
$
|
2
|
|
$
|
9
|
|
$
|
12
|
|
600.0
|
%
|
$
|
(7
|
)
|
(77.8
|
)%
|
||||||
|
Rabbi trust impact allocated to owned and leased hotels expense
|
3
|
|
1
|
|
3
|
|
2
|
|
200.0
|
%
|
(2
|
)
|
(66.7
|
)%
|
|||||||||||
|
Net gains and interest income from marketable securities held to fund our Hyatt Gold Passport program allocated to owned and leased hotels revenues
|
2
|
|
1
|
|
3
|
|
1
|
|
100.0
|
%
|
(2
|
)
|
(66.7
|
)%
|
|||||||||||
|
Net gains and interest income from marketable securities held to fund operating programs
|
$
|
19
|
|
$
|
4
|
|
$
|
15
|
|
$
|
15
|
|
375.0
|
%
|
$
|
(11
|
)
|
(73.3
|
)%
|
||||||
Equity earnings (losses) from unconsolidated hospitality ventures.
|
Year Ended December 31,
|
|||||||||||||||||||||||||
|
2016
|
2015
|
2014
|
Better / (Worse)
2016 vs 2015 |
Better / (Worse)
2015 vs 2014 |
|||||||||||||||||||||
|
Equity earnings (losses) from unconsolidated hospitality ventures
|
$
|
68
|
|
$
|
(64
|
)
|
$
|
25
|
|
$
|
132
|
|
206.3
|
%
|
$
|
(89
|
)
|
(356.0
|
)%
|
||||||
The
$132 million
increase during the year ended
December 31, 2016
compared to the year ended
December 31, 2015
, was attributable to the following:
|
•
|
$42 million increase in earnings from distributions from three of our unconsolidated hospitality ventures, related to debt refinancings;
|
|
•
|
$35 million increase due to foreign currency volatility at one of our unconsolidated hospitality ventures which holds loans denominated in a currency other than its functional currency. During the year ended December 31, 2016, we recognized foreign currency gains of $7 million compared to the year ended December 31, 2015 in which we recognized foreign currency losses of $28 million. A portion of the loan balance was refinanced at the end of 2015 and therefore we anticipate decreased exposure in future periods as compared to 2015;
|
|
•
|
$14 million gain related to the 2016 acquisition of our partners' share in Andaz Maui at Wailea Resort and villas that was recorded as a step acquisition;
|
|
•
|
$21 million increase as a result of losses recognized during the year ended December 31, 2015 related to the sale of an entity that held an interest in one of our foreign currency denominated unconsolidated hospitality ventures and the release of accumulated foreign currency translation losses upon sale;
|
|
•
|
$13 million increase primarily attributable to expenses recognized in the year ended December 31, 2015 related to debt repayment guarantees entered into by our unconsolidated hospitality ventures; and
|
|
•
|
$9 million decrease related to impairment charges recorded related to four unconsolidated hospitality ventures during the year ended December 31, 2016.
|
The $89 million decrease during the year ended December 31, 2015 compared to the year ended December 31, 2014 was attributable to the following:
|
•
|
$23 million increase in foreign currency losses at one of our unconsolidated hospitality ventures which holds loans denominated in a currency other than its functional currency, resulting in losses due to currency volatility during the period;
|
|
•
|
$21 million decrease related to gains on sales of hotels by unconsolidated hospitality ventures in which we held an interest. During the year ended December 31, 2015 we recognized gains of $13 million compared to the year ended December 31, 2014 in which we recognized gains of $37 million;
|
68
|
•
|
$21 million decrease attributable to the release of accumulated foreign currency translation losses related to the aforementioned sale of an entity that held an interest in one of our foreign currency denominated unconsolidated hospitality ventures during the year ended December 31, 2015;
|
|
•
|
$16 million decrease related to timing of recognition of expenses due to debt repayment guarantees entered into during 2015 related to three of our unconsolidated hospitality ventures; and
|
|
•
|
$11 million decrease attributable to operating and non-operating losses related to one of our unconsolidated hospitality ventures which was driven primarily by interest, tax, and other nonrecurring expenses recorded during the period.
|
Interest expense
. Interest expense increased
$8 million
in the year ended
December 31, 2016
compared to the year ended
December 31, 2015
driven by increased interest expense related to the 2026 notes issued in the first quarter of 2016, partially offset by decreased interest expense related to the 2016 notes which were redeemed during the second quarter of 2016.
Interest expense decreased $3 million in the year ended December 31, 2015 compared to the year ended December 31, 2014 primarily due to a reduction in interest expense for Hyatt Regency Grand Cypress as we exercised our purchase option during 2014.
Gains (losses) on sales of real estate and other.
During the year ended
December 31, 2016
, we sold Andaz 5th Avenue resulting in a pre-tax loss of $23 million. During the year ended December 31, 2015, we sold Hyatt Regency Indianapolis and a Hyatt House hotel resulting in a $9 million pre-tax gain. During the year ended December 31, 2014, we sold a portfolio of 38 select service properties, a portfolio of nine select service properties and one full service property, and five Hyatt Place hotels resulting in pre-tax gains of $231 million and our vacation ownership business resulting in a gain of $80 million. See Part IV, Item 15, "Exhibits and Financial Statement Schedule—Note
7
to the Consolidated Financial Statements" for additional information regarding the above transactions.
Asset impairments.
We recorded no asset impairments during the year ended
December 31, 2016
. During the year ended December 31, 2015, we recognized $5 million in asset impairment charges related to property and equipment within our owned and leased hotels segment. During the year ended December 31, 2014, we recognized a $17 million impairment charge, $13 million related to property and equipment and $2 million related to goodwill recorded within our owned and leased hotels segment and $2 million related to intangibles within our Americas management and franchising segment.
Other income (loss), net
. Other income (loss), net increased
$7 million
in the year ended
December 31, 2016
compared to the year ended
December 31, 2015
. See Part IV, Item 15, "Exhibits and Financial Statement Schedule—Note
20
to the Consolidated Financial Statements" for additional information. The increase was attributable to the following:
•
$22 million increase in performance guarantee liability amortization income recognized primarily related to the four managed hotels in France that are subject to a performance guarantee ("the four managed hotels in France"). See Part IV, Item 15, "Exhibits and Financial Statement Schedule—Note
14
to the Consolidated Financial Statements" for further detail;
•
$15 million increase primarily due to foreign currency volatility of the Brazilian real largely related to a construction loan for Grand Hyatt Rio de Janeiro;
•
$13 million increase in depreciation recovery related to expense recovered from our managed and franchised hotels;
•
$12 million of interest income related to the early redemption of a portion of our Playa Hotels & Resorts B.V. ("Playa") preferred shares. We also recognized a $6 million realized loss in conjunction with the redemption. In connection with Playa's potential business combination with Pace Holdings Corporation ("Pace") or potential future initial public offering ("Playa IPO") as discussed in Part IV, Item 15, "Exhibits and Financial Statement Schedule—Note
4
to the Consolidated Financial Statements", we anticipate a full or partial redemption of our remaining Playa preferred shares. In the event of a full redemption in the latter half of the first quarter of 2017, we would receive approximately $290 million of cash proceeds. Assuming such a redemption we would recognize interest income of approximately $93 million and realized losses of approximately $40 million in other income (loss), net on our consolidated statements of income. In the event of a partial redemption or change in timing of a redemption our cash proceeds and financial statement impacts described above would change; and
69
•
$36 million increase in performance guarantee expense, net. We recognized expense of $64 million and $28 million during the years ended December 31, 2016 and December 31, 2015, respectively, related to the performance guarantee for the four managed hotels in France. When we are above a specified operating profit threshold, we record incentive fees in our management and franchise revenues. When we are below the operating profit threshold, we record performance guarantee expense. See Part IV, Item 15, "Exhibits and Financial Statement Schedule—Note
14
to the Consolidated Financial Statements" for further detail. Due to ongoing renovations and declines in the market, we expect the expense in 2017 related to this guarantee could be approximately $80 million. We expect 2017 to be the peak year for this expense due to the timing of extensive hotel renovations and persistent market softness.
During the third quarter of 2017 we plan to move into our new corporate headquarters at 150 N. Riverside Plaza, Chicago, Illinois, prior to the expiration of our current leases. Our new headquarters facility will enable us to bring together all of our Chicago-based colleagues in one location with an enhanced work environment and a more efficient utilization of space. As a result, we expect to record a cease-use liability of approximately $25 million in the third quarter of 2017 which will be recorded to other income (loss), net within our consolidated statements of income. This expense represents the fair value of our remaining contractual obligations under the current leases, offset by estimated market sublease rentals that could be reasonably obtained, discounted using Hyatt’s credit-adjusted risk free rate.
Other income (loss), net increased $12 million in the year ended December 31, 2015 compared to the year ended December 31, 2014, primarily attributable to the following:
•
$13 million increase related to realignment and transaction costs recorded in the year ended December 31, 2014 that did not recur in 2015;
•
$10 million increase in depreciation recovery related to expense recovered from our managed and franchised hotels; and
•
$11 million decrease primarily due to foreign currency volatility of the Brazilian real related to a construction loan for Grand Hyatt Rio de Janeiro.
Provision for income taxes
.
|
Year Ended December 31,
|
|||||||||||||||||||
|
2016
|
2015
|
2014
|
Better / (Worse)
2016 vs 2015 |
Better / (Worse)
2015 vs 2014 |
|||||||||||||||
|
Income before income taxes
|
$
|
289
|
|
$
|
194
|
|
$
|
525
|
|
$
|
95
|
|
$
|
(331
|
)
|
||||
|
Income tax expense
|
(85
|
)
|
(70
|
)
|
(179
|
)
|
(15
|
)
|
109
|
|
|||||||||
|
Effective tax rate
|
29.5
|
%
|
36.2
|
%
|
34.1
|
%
|
6.7
|
%
|
(2.1
|
)%
|
|||||||||
The decreased effective tax rate as of the year ended December 31, 2016 compared to the year ended December 31, 2015 was primarily driven by a 5 percentage point favorable impact of certain one-time items related to the reversal of uncertain tax positions and a nonrecurring foreign tax credit benefit of 3 percentage points related to a foreign unconsolidated hospitality venture.
Income tax expense decreased
$109 million
in the year ended
December 31, 2015
compared to the year ended
December 31, 2014
due to a decrease in pre-tax income in 2015 compared to 2014, driven by gains on sales of real estate recorded in 2014. The increased effective tax rate was primarily driven by a 9 percentage point impact of certain foreign unconsolidated hospitality venture pre-tax losses that were not benefited for tax and one-time tax items recorded year over year, such as changes in tax contingencies and deferred tax adjustments. The aforementioned items were partially offset by a net 10 percentage point decrease in the effective tax rate recorded related to global transfer pricing changes implemented during the year to better align our transfer pricing policy with our global business operating model.
See Part IV, Item 15, "Exhibits and Financial Statement Schedule—Note
13
to the Consolidated Financial Statements" for further detail.
70
Segment Results
We evaluate segment operating performance using segment revenue and segment Adjusted EBITDA, as described in Part IV, Item 15, "Exhibits and Financial Statement Schedule—Note
18
to the Consolidated Financial Statements." See "—Key Business Metrics Evaluated by Management" for a discussion of our definition of Adjusted EBITDA, how we use it, why we present it and material limitations on its usefulness. The charts below illustrate revenues by segment excluding other revenues from managed properties which are presented before intersegment eliminations.

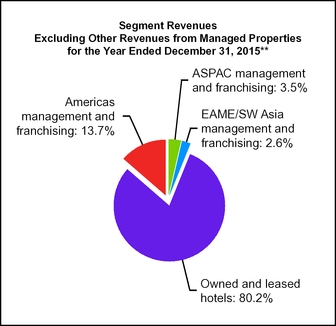 *Consolidated revenues for the year ended
December 31, 2016
included corporate and other revenues of
$43 million
, eliminations of
$98 million
and other revenues from managed properties of $
1,833 million
.
*Consolidated revenues for the year ended
December 31, 2016
included corporate and other revenues of
$43 million
, eliminations of
$98 million
and other revenues from managed properties of $
1,833 million
.
**Consolidated revenues for the year ended
December 31, 2015
included corporate and other revenues of
$40 million
, eliminations of
$89 million
and other revenues from managed properties of
$1,786 million
.
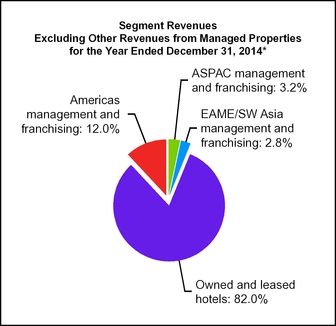
*Consolidated revenues for the year ended December 31, 2014 included corporate and other revenues of $75 million, eliminations of $105 million and other revenues from managed properties of $1,707 million.
71
Owned and leased hotels revenues
.
2016 compared to 2015
|
Year Ended December 31,
|
||||||||||||||||||
|
2016
|
2015
|
Better / (Worse)
|
Currency Impact
|
|||||||||||||||
|
Comparable owned and leased hotels revenues
|
$
|
2,029
|
|
$
|
2,017
|
|
$
|
12
|
|
0.6
|
%
|
$
|
(23
|
)
|
||||
|
Non-comparable owned and leased hotels revenues
|
90
|
|
62
|
|
28
|
|
45.2
|
%
|
(2
|
)
|
||||||||
|
Total owned and leased hotels revenues
|
$
|
2,119
|
|
$
|
2,079
|
|
$
|
40
|
|
1.9
|
%
|
$
|
(25
|
)
|
||||
The increase in comparable owned and leased hotels revenues during the year ended
December 31, 2016
compared to the year ended
December 31, 2015
was largely driven by increases of
$36 million
at our hotels in the United States and
$4 million
at our owned hotel in Mexico, including a net unfavorable currency impact of
$8 million
, partially offset by decreases of
$28 million
at our other international hotels. For the year ended
December 31, 2016
, revenue growth at our comparable hotels in the United States and Mexico was a result of improved transient business and group ADR as well as food and beverage revenues. The decrease in comparable international hotels was driven by net unfavorable currency impact of
$15 million
and decreased performance at our owned hotels in EAME/SW Asia.
|
|
Year Ended December 31,
|
|||||||||||||||||||||||||||||||||||
|
|
RevPAR
|
Occupancy
|
ADR
|
|||||||||||||||||||||||||||||||||
|
2016
|
2015
|
Better /
(Worse) |
Better / (Worse) Constant $
|
2016
|
2015
|
Change in
Occ % pts
|
2016
|
2015
|
Better /
(Worse)
|
Better / (Worse) Constant $
|
||||||||||||||||||||||||||
|
Comparable owned and leased hotels
|
$
|
170
|
|
$
|
168
|
|
1.2
|
%
|
2.2
|
%
|
76.7
|
%
|
76.1
|
%
|
0.6
|
%
|
$
|
222
|
|
$
|
221
|
|
0.3
|
%
|
1.4
|
%
|
||||||||||
The increase in non-comparable owned and leased hotels revenues was driven by the following activity, in order of significance:
|
•
|
the opening of Grand Hyatt Rio de Janeiro in 2016;
|
•
the acquisitions of The Confidante Miami Beach and Royal Palms Resort and Spa in 2016; and
•
the acquisition of our partners' interest in Andaz Maui at Wailea Resort and villas in 2016.
The increase in revenues was partially offset by the following activity:
|
•
|
the dispositions of Andaz 5th Avenue and Hyatt Regency Birmingham (U.K.) in 2016.
|
During the year ended
December 31, 2016
, we removed two full service properties that were sold in the period from the comparable owned and leased hotels results.
2015 compared to 2014
|
Year Ended December 31,
|
||||||||||||||||||
|
2015
|
2014
|
Better / (Worse)
|
Currency Impact
|
|||||||||||||||
|
Comparable owned and leased hotels revenues
|
$
|
1,938
|
|
$
|
1,888
|
|
$
|
50
|
|
2.6
|
%
|
$
|
(56
|
)
|
||||
|
Non-comparable owned and leased hotels revenues
|
141
|
|
358
|
|
(217
|
)
|
(60.6
|
)%
|
(10
|
)
|
||||||||
|
Total owned and leased hotels revenues
|
$
|
2,079
|
|
$
|
2,246
|
|
$
|
(167
|
)
|
(7.4
|
)%
|
$
|
(66
|
)
|
||||
The increase in comparable owned and leased hotels revenues during the year ended December 31, 2015 compared to the year ended December 31, 2014 was largely driven by increases of $94 million at our comparable hotels in the United States, partially offset by decreases of $44 million at our comparable international hotels. For the year ended December 31, 2015, revenue growth at our United States comparable hotels was a result of improved group and transient ADR and demand as well as food and beverage revenues. The decrease in comparable international hotels was driven by net unfavorable currency impact of $56 million and decreased performance at our owned hotel in South Korea primarily due to the MERS outbreak, partially offset by improvements at our owned hotel in Mexico driven by group business.
72
|
|
Year Ended December 31,
|
|||||||||||||||||||||||||||||||||||
|
|
RevPAR
|
Occupancy
|
ADR
|
|||||||||||||||||||||||||||||||||
|
2015
|
2014
|
Better /
(Worse)
|
Better / (Worse) Constant $
|
2015
|
2014
|
Change in
Occ % pts
|
2015
|
2014
|
Better /
(Worse)
|
Better / (Worse) Constant $
|
||||||||||||||||||||||||||
|
Comparable owned and leased hotels
|
$
|
167
|
|
$
|
163
|
|
2.4
|
%
|
5.4
|
%
|
76.6
|
%
|
76.0
|
%
|
0.6
|
%
|
$
|
218
|
|
$
|
214
|
|
1.6
|
%
|
4.6
|
%
|
||||||||||
The decrease in non-comparable owned and leased hotels revenues was driven by the following activity, in order of significance:
|
•
|
the sale of Park Hyatt Toronto, Hyatt Regency Vancouver, Park Hyatt Washington and one additional full service hotel and 52 select service hotels in 2014; and
|
•
the sale of Hyatt Regency Indianapolis in 2015.
The decrease in revenues was partially offset by the following activity, in order of significance:
|
•
|
the acquisition of Hyatt Regency Lost Pines Resort and Spa from an unconsolidated hospitality venture in 2014; and
|
|
•
|
the acquisition of Park Hyatt New York and the opening of one select service hotel in 2014.
|
During the year ended
December 31, 2015
, we removed one full service property and one select service property that were sold in the period from the comparable owned and leased hotels results.
Owned and leased hotels segment Adjusted EBITDA
.
|
Year Ended December 31,
|
|||||||||||||||||||||||||
|
2016
|
2015
|
2014
|
Better / (Worse)
2016 vs 2015
|
Better / (Worse)
2015 vs 2014 |
|||||||||||||||||||||
|
Owned and leased hotels Adjusted EBITDA
|
$
|
416
|
|
$
|
413
|
|
$
|
443
|
|
$
|
3
|
|
0.7
|
%
|
$
|
(30
|
)
|
(6.8
|
)%
|
||||||
|
Pro rata share of unconsolidated hospitality ventures Adjusted EBITDA
|
100
|
|
80
|
|
80
|
|
20
|
|
25.0
|
%
|
—
|
|
—
|
%
|
|||||||||||
|
Segment Adjusted EBITDA
|
$
|
516
|
|
$
|
493
|
|
$
|
523
|
|
$
|
23
|
|
4.7
|
%
|
$
|
(30
|
)
|
(5.7
|
)%
|
||||||
Owned and leased hotels Adjusted EBITDA
. Adjusted EBITDA at our comparable owned and leased hotels increased
$13 million
in the year ended
December 31, 2016
compared to the same period in
2015
, which included
$7 million
net unfavorable currency impact. The increase was largely due to improved transient business and group ADR at our full service hotels in the United States and Mexico. Partially offsetting the revenue growth were increased payroll and related costs, partially offset by a decrease in utilities expense due to lower gas and oil prices in 2016. Adjusted EBITDA at our non-comparable hotels decreased
$10 million
in the year ended
December 31, 2016
compared to the prior year, primarily attributable to the following 2016 activity:
•
the dispositions of Andaz 5th Avenue and Hyatt Regency Birmingham (U.K.);
•
the opening of Grand Hyatt Rio de Janeiro; and
•
the acquisition of The Confidante Miami Beach; partially offset by
•
the acquisition of Andaz Maui at Wailea Resort and villas.
Adjusted EBITDA at our comparable owned and leased hotels increased $21 million in the period ended
December 31, 2015
compared to the same period in 2014, which included $10 million net unfavorable currency impact. The increase was largely due to improved group and transient ADR and demand as well as food and beverage revenues at our full service hotels in the United States and Mexico. Partially offsetting the revenue growth were increased property taxes, labor costs and rent expense at certain properties and higher commissions across the portfolio due to increased group and transient business. Adjusted EBITDA at our non-comparable hotels decreased $51 million in the year ended
December 31, 2015
compared to the prior year, primarily due to dispositions, partially offset by openings and acquisitions during 2014 and 2015. See "—Owned and Leased Hotels Revenues" for a discussion of the non-comparable owned and leased hotels 2015 and 2014 activity.
73
Pro rata share of unconsolidated hospitality ventures Adjusted EBITDA
. Our pro rata share of Adjusted EBITDA from our unconsolidated hospitality ventures increased
$20 million
in the year ended
December 31, 2016
, compared to the year ended
December 31, 2015
, which included an insignificant net unfavorable currency impact. The increase was primarily driven by hotel openings and improved performance at hotels within the Playa unconsolidated hospitality venture and Wailea Hotel Holdings, L.L.C unconsolidated hospitality venture, prior to our acquisition of the latter in the fourth quarter of 2016.
In connection with Playa's potential business combination with Pace or a potential future Playa IPO as discussed in Part IV, Item 15, "Exhibits and Financial Statement Schedule—Note
4
to the Consolidated Financial Statements", our common stock investment in Playa may be recharacterized as a marketable securities investment. Depending on the amount of our common stock ownership subsequent to the Pace business combination or potential future Playa IPO, we may no longer account for our investment under the equity method of accounting. In this situation, our share of Playa’s results, which comprised approximately one third of the pro rata share of unconsolidated hospitality ventures Adjusted EBITDA for the year ended
December 31, 2016
, would no longer be included in our pro rata share of unconsolidated hospitality ventures Adjusted EBITDA.
Our pro rata share of Adjusted EBITDA from our unconsolidated hospitality ventures was flat in the year ended
December 31, 2015
, compared to the year ended December 31, 2014, which included a $4 million net unfavorable currency impact.
Americas management and franchising segment revenues
.
|
Year Ended December 31,
|
|||||||||||||||||||||||||
|
2016
|
2015
|
2014
|
Better / (Worse)
2016 vs 2015
|
Better / (Worse)
2015 vs 2014
|
|||||||||||||||||||||
|
Segment revenues
|
|||||||||||||||||||||||||
|
Management, franchise and other fees
|
$
|
371
|
|
$
|
354
|
|
$
|
327
|
|
$
|
17
|
|
4.8
|
%
|
$
|
27
|
|
8.3
|
%
|
||||||
|
Other revenues from managed properties
|
1,670
|
|
1,641
|
|
1,550
|
|
29
|
|
1.8
|
%
|
91
|
|
5.9
|
%
|
|||||||||||
|
Total segment revenues
|
$
|
2,041
|
|
$
|
1,995
|
|
$
|
1,877
|
|
$
|
46
|
|
2.3
|
%
|
$
|
118
|
|
6.3
|
%
|
||||||
Americas management and franchising revenues included
$1 million
net unfavorable currency impact in the year ended
December 31, 2016
compared to the year ended
December 31, 2015
. The increase in management, franchise and other fees was driven by a
$15 million
increase in franchise fees, primarily due to new and converted hotels and improved performance at existing select service hotels and all inclusive resorts. Base fees increased
$3 million
, primarily driven by strong RevPAR growth at select service properties. Incentive fees increased
$2 million
driven by full service properties in North America. Other fee revenues decreased
$3 million
as 2015 included $3 million of termination fees.
The increase in other revenues from managed properties in the year ended
December 31, 2016
compared to the year ended
December 31, 2015
was due to a higher volume of reimbursements paid to us by our managed properties. The increased activity related to increased member participation in our Hyatt Gold Passport program, and increased select service payroll and related costs due to new hotels, partially offset by a decrease in full service payroll and related costs due to hotel conversions and one hotel that left the chain. Additionally, the changes in the value of the underlying assets for our benefit programs funded through rabbi trusts resulted in a $7 million increase in the year ended
December 31, 2016
compared to the year ended
December 31, 2015
.
|
(Comparable Systemwide Hotels)
|
Year Ended December 31,
|
|||||||||||||||||||||||||||||||||||
|
RevPAR
|
Occupancy
|
ADR
|
||||||||||||||||||||||||||||||||||
|
2016
|
2015
|
Better /
(Worse)
|
Better / (Worse) Constant $
|
2016
|
2015
|
Change in
Occ % pts
|
2016
|
2015
|
Better /
(Worse)
|
Better / (Worse) Constant $
|
||||||||||||||||||||||||||
|
Americas full service
|
$
|
151
|
|
$
|
148
|
|
2.3
|
%
|
2.8
|
%
|
75.3
|
%
|
75.5
|
%
|
(0.2
|
)%
|
$
|
200
|
|
$
|
195
|
|
2.5
|
%
|
3.1
|
%
|
||||||||||
|
Americas select service
|
104
|
|
99
|
|
5.3
|
%
|
5.4
|
%
|
78.1
|
%
|
76.7
|
%
|
1.4
|
%
|
134
|
|
129
|
|
3.4
|
%
|
3.4
|
%
|
||||||||||||||
Our comparable full service hotels RevPAR improved in the year ended
December 31, 2016
compared to the year ended
December 31, 2015
, primarily driven by improved transient business and group ADR. RevPAR at our select service hotels in the year ended
December 31, 2016
increased compared to the year ended
December 31, 2015
, driven primarily by transient business.
74
During the year ended
December 31, 2016
, one property that left the chain was removed from the comparable Americas full service systemwide hotels. During the year ended
December 31, 2016
, one property was removed from the comparable Americas select service systemwide hotels as a result of hurricane damage closing the hotel for an extended period.
Americas management and franchising revenues included $3 million net unfavorable currency impact in the year ended December 31, 2015 compared to the year ended December 31, 2014. The increase in management, franchise and other fees was driven by a $23 million increase in franchise fees, primarily due to new and converted hotels and improved performance at existing hotels. Incentive fees increased $3 million driven by full service properties in North America due to increased hotel profits. Other fee revenues increased $5 million, primarily due to amortization of deferred gains of $9 million from hotels sold subject to long-term management agreements, partially offset by decreased termination fees of $2 million. Base fees decreased $4 million primarily driven by select service properties in North America due to the sale and conversion of hotels to franchised hotels, partially offset by full service hotel fee growth and increased RevPAR.
The increase in other revenues from managed properties in the year ended December 31, 2015 compared to the year ended December 31, 2014 was due to a higher volume of reimbursements paid to us by our managed properties for increased member participation in our Hyatt Gold Passport program, increased payroll and related costs and increased marketing costs, which was driven in part by new hotel openings, and owned hotels that were sold subject to long-term management agreements. These increases were partially offset by a decrease from the changes in the value of the underlying assets for our benefit programs funded through rabbi trusts for the year ended December 31, 2015 compared to the year ended December 31, 2014.
|
(Comparable Systemwide Hotels)
|
Year Ended December 31,
|
|||||||||||||||||||||||||||||||||||
|
RevPAR
|
Occupancy
|
ADR
|
||||||||||||||||||||||||||||||||||
|
2015
|
2014
|
Better /
(Worse)
|
Better / (Worse) Constant $
|
2015
|
2014
|
Change in
Occ % pts
|
2015
|
2014
|
Better /
(Worse)
|
Better / (Worse) Constant $
|
||||||||||||||||||||||||||
|
Americas full service
|
$
|
147
|
|
$
|
140
|
|
5.5
|
%
|
6.6
|
%
|
75.6
|
%
|
74.7
|
%
|
0.9
|
%
|
$
|
195
|
|
$
|
187
|
|
4.1
|
%
|
5.2
|
%
|
||||||||||
|
Americas select service
|
100
|
|
93
|
|
7.7
|
%
|
7.7
|
%
|
77.7
|
%
|
76.5
|
%
|
1.2
|
%
|
128
|
|
121
|
|
6.0
|
%
|
6.0
|
%
|
||||||||||||||
Excluding the net unfavorable currency impact, our comparable full service hotels RevPAR increased in the year ended December 31, 2015 compared to the year ended December 31, 2014, primarily driven by improved group and transient ADR. We also experienced slight growth in occupancy from group and transient business. RevPAR at our select service hotels increased in the year ended December 31, 2015 compared to the year ended December 31, 2014, primarily driven by transient rate growth.
During the year ended December 31, 2015, two properties that left the chain were removed from the comparable Americas full service systemwide hotels. During the year ended December 31, 2015, one property that left the chain was removed from the comparable Americas select service systemwide hotels.
Americas management and franchising segment Adjusted EBITDA
.
|
Year Ended December 31,
|
|||||||||||||||||||||||||
|
2016
|
2015
|
2014
|
Better / (Worse)
2016 vs 2015
|
Better / (Worse)
2015 vs 2014
|
|||||||||||||||||||||
|
Segment Adjusted EBITDA
|
$
|
318
|
|
$
|
300
|
|
$
|
265
|
|
$
|
18
|
|
6.0
|
%
|
$
|
35
|
|
13.2
|
%
|
||||||
Adjusted EBITDA increased in the year ended
December 31, 2016
compared to the year ended
December 31, 2015
, which included
$1 million
net unfavorable currency impact. The increase was primarily due to the aforementioned
$17 million
increase in management, franchise and other fees and a
$1 million
decrease in adjusted selling, general, and administrative expenses, primarily due to a $5 million decrease in professional fees, partially offset by a $2 million increase in bad debt reserves, $1 million increase in payroll and related costs and a $1 million increase in brand conversion expenses.
Adjusted EBITDA increased in the year ended December 31, 2015 compared to the year ended December 31, 2014, which included $3 million net unfavorable currency impact. The increase was primarily due to the aforementioned $27 million increase in management, franchise and other fees. Additionally, adjusted selling, general, and administrative expenses decreased $8 million during the same period primarily driven by $5 million in settlement fees in 2014.
75
ASPAC management and franchising segment revenues.
|
Year Ended December 31,
|
|||||||||||||||||||||||||
|
2016
|
2015
|
2014
|
Better / (Worse)
2016 vs 2015
|
Better / (Worse)
2015 vs 2014
|
|||||||||||||||||||||
|
Segment revenues
|
|||||||||||||||||||||||||
|
Management, franchise and other fees
|
$
|
96
|
|
$
|
91
|
|
$
|
88
|
|
$
|
5
|
|
5.5
|
%
|
$
|
3
|
|
3.4
|
%
|
||||||
|
Other revenues from managed properties
|
98
|
|
87
|
|
74
|
|
11
|
|
12.6
|
%
|
13
|
|
17.6
|
%
|
|||||||||||
|
Total segment revenues
|
$
|
194
|
|
$
|
178
|
|
$
|
162
|
|
$
|
16
|
|
9.0
|
%
|
$
|
16
|
|
9.9
|
%
|
||||||
ASPAC management and franchising revenues included
$1 million
net unfavorable currency impact in the year ended
December 31, 2016
compared to the year ended
December 31, 2015
. The increase in management, franchise and other fees during the year ended
December 31, 2016
was primarily driven by increased base fees due to hotels opened in China during 2015 and 2016 and increased incentive fees at certain properties in China and Southeast Asia, partially offset by decreased fees in Macau.
The
$11 million
increase in other revenues from managed properties in the year ended
December 31, 2016
compared to the year ended
December 31, 2015
was due a higher volume of reimbursements paid to us by our managed properties for increased reservation and technology expenses as well as increased member participation in our Hyatt Gold Passport program.
|
(Comparable Systemwide Hotels)
|
Year Ended December 31,
|
|||||||||||||||||||||||||||||||||||
|
RevPAR
|
Occupancy
|
ADR
|
||||||||||||||||||||||||||||||||||
|
2016
|
2015
|
Better /
(Worse)
|
Better / (Worse) Constant $
|
2016
|
2015
|
Change in
Occ % pts
|
2016
|
2015
|
Better /
(Worse)
|
Better / (Worse) Constant $
|
||||||||||||||||||||||||||
|
ASPAC full service
|
$
|
147
|
|
$
|
145
|
|
1.9
|
%
|
2.2
|
%
|
70.8
|
%
|
67.9
|
%
|
2.9
|
%
|
$
|
208
|
|
$
|
213
|
|
(2.3
|
)%
|
(2.0
|
)%
|
||||||||||
Excluding the net unfavorable currency impact, the increase in RevPAR for the year ended
December 31, 2016
compared to year ended
December 31, 2015
was driven by increased occupancy in China, South Korea and Southeast Asia. These increases were partially offset by decreased ADR spread across the region, primarily in China and Southeast Asia.
During the year ended
December 31, 2016
, we removed two properties from the comparable ASPAC full service systemwide hotels, one as a result of a significant renovation and one that left the chain.
ASPAC management and franchising revenues included $5 million net unfavorable currency impact in the year ended December 31, 2015 compared to the year ended December 31, 2014. The increase in management, franchise and other fees during the year ended December 31, 2015 was primarily driven by increased incentive fees at certain properties in Japan and China, partially offset by declines at certain properties in South Korea, largely due to the MERS outbreak.
The increase in other revenues from managed properties in the year ended December 31, 2015 compared to the year ended December 31, 2014 was due to a higher volume of reimbursements paid to us by our managed properties for increased member participation in our Hyatt Gold Passport program.
|
(Comparable Systemwide Hotels)
|
Year Ended December 31,
|
|||||||||||||||||||||||||||||||||||
|
RevPAR
|
Occupancy
|
ADR
|
||||||||||||||||||||||||||||||||||
|
2015
|
2014
|
Better /
(Worse)
|
Better / (Worse) Constant $
|
2015
|
2014
|
Change in
Occ % pts
|
2015
|
2014
|
Better /
(Worse)
|
Better / (Worse) Constant $
|
||||||||||||||||||||||||||
|
ASPAC full service
|
$
|
151
|
|
$
|
157
|
|
(3.5
|
)%
|
3.3
|
%
|
70.3
|
%
|
68.2
|
%
|
2.1
|
%
|
$
|
215
|
|
$
|
230
|
|
(6.3
|
)%
|
0.3
|
%
|
||||||||||
Excluding the net unfavorable currency impact, the increase in comparable full service RevPAR for the year ended December 31, 2015 compared to the year ended December 31, 2014 was driven by increased occupancy in parts of China and improved ADR and occupancy in Japan. These increases were partially offset by decreased RevPAR in South Korea, primarily driven by the MERS outbreak.
During the year ended December 31, 2015, we removed three properties from the comparable ASPAC full service systemwide hotels, as a result of one property that left the chain and two properties that were undergoing significant renovation.
76
ASPAC management and franchising segment Adjusted EBITDA.
|
Year Ended December 31,
|
|||||||||||||||||||||||||
|
2016
|
2015
|
2014
|
Better / (Worse)
2016 vs 2015
|
Better / (Worse)
2015 vs 2014
|
|||||||||||||||||||||
|
Segment Adjusted EBITDA
|
$
|
57
|
|
$
|
55
|
|
$
|
49
|
|
$
|
2
|
|
3.6
|
%
|
$
|
6
|
|
12.2
|
%
|
||||||
Adjusted EBITDA included
$1 million
net unfavorable currency impact in the year ended
December 31, 2016
compared to the year ended
December 31, 2015
. The aforementioned increase in management, franchise and other fees was partially offset by an increase in adjusted selling, general, and administrative expenses of
$3 million
. The increase in adjusted selling, general, and administrative expenses was driven by a $2 million increase in payroll and related costs and a $1 million increase in professional fees related to development expenses incurred during the year.
Adjusted EBITDA increased in the year ended December 31, 2015 compared to the year ended December 31, 2014, which included $4 million net unfavorable currency impact. The increase was driven by the aforementioned increase in management, franchise and other fees and a decrease in adjusted selling, general, and administrative expenses of
$3 million
as 2014 included $3 million of owner accommodation costs.
EAME/SW Asia management and franchising segment revenues.
|
Year Ended December 31,
|
|||||||||||||||||||||||||
|
2016
|
2015
|
2014
|
Better / (Worse)
2016 vs 2015
|
Better / (Worse)
2015 vs 2014
|
|||||||||||||||||||||
|
Segment revenues
|
|||||||||||||||||||||||||
|
Management, franchise and other fees
|
$
|
65
|
|
$
|
67
|
|
$
|
77
|
|
$
|
(2
|
)
|
(3.0
|
)%
|
$
|
(10
|
)
|
(13.0
|
)%
|
||||||
|
Other revenues from managed properties
|
65
|
|
58
|
|
53
|
|
7
|
|
12.1
|
%
|
5
|
|
9.4
|
%
|
|||||||||||
|
Total segment revenues
|
$
|
130
|
|
$
|
125
|
|
$
|
130
|
|
$
|
5
|
|
4.0
|
%
|
$
|
(5
|
)
|
(3.8
|
)%
|
||||||
EAME/SW Asia management and franchising revenues included
$2 million
net unfavorable currency impact in the year ended
December 31, 2016
compared to the year ended
December 31, 2015
. The decrease in management, franchise and other fees was primarily due to a
$2 million
decrease in incentive fees, primarily driven by decreased performance at properties in Europe and the Middle East, partially offset by increases from properties in India and ramping of hotels opened in 2015.
The increase in other revenues from managed properties in the year ended
December 31, 2016
compared to the year ended
December 31, 2015
was due to a higher volume of reimbursements paid to us by our managed properties for reservation and technology costs as well as increased member participation in our Hyatt Gold Passport program.
|
(Comparable Systemwide Hotels)
|
Year Ended December 31,
|
|||||||||||||||||||||||||||||||||||
|
RevPAR
|
Occupancy
|
ADR
|
||||||||||||||||||||||||||||||||||
|
2016
|
2015
|
Better /
(Worse)
|
Better / (Worse) Constant $
|
2016
|
2015
|
Change in
Occ % pts
|
2016
|
2015
|
Better /
(Worse)
|
Better / (Worse) Constant $
|
||||||||||||||||||||||||||
|
EAME/SW Asia full service
|
$
|
119
|
|
$
|
129
|
|
(7.6
|
)%
|
(4.6
|
)%
|
63.4
|
%
|
63.5
|
%
|
(0.1
|
)%
|
$
|
188
|
|
$
|
203
|
|
(7.5
|
)%
|
(4.4
|
)%
|
||||||||||
|
EAME/SW Asia select service
|
$
|
70
|
|
$
|
65
|
|
8.6
|
%
|
9.4
|
%
|
71.9
|
%
|
64.3
|
%
|
7.6
|
%
|
$
|
98
|
|
$
|
100
|
|
(2.8
|
)%
|
(2.1
|
)%
|
||||||||||
Excluding the net unfavorable currency impact, the decrease in comparable full service RevPAR in the year ended
December 31, 2016
compared to the year ended
December 31, 2015
was primarily driven by decreased ADR and occupancy in France, Switzerland, Turkey and the Middle East. These decreases were partially offset by increased ADR and occupancy in Eastern Europe and India.
During the year ended
December 31, 2016
, three properties were removed from the comparable EAME/SW Asia full service systemwide hotel results as a result of significant renovations and no properties were removed from the comparable EAME/SW Asia select service systemwide hotel results.
EAME/SW Asia management and franchising revenues included $8 million net unfavorable currency impact in the year ended December 31, 2015 compared to the year ended December 31, 2014. The decrease in management, franchise and other fees was primarily due to an $8 million decrease in incentive fees and a $3 million decrease in base fees, primarily driven by
77
properties in Europe due to impacts from the stronger U.S. dollar and decreased performance at certain properties in the Middle East, partially offset by increased base fees at newly opened hotels.
|
(Comparable Systemwide Hotels)
|
Year Ended December 31,
|
|||||||||||||||||||||||||||||||||||
|
RevPAR
|
Occupancy
|
ADR
|
||||||||||||||||||||||||||||||||||
|
2015
|
2014
|
Better /
(Worse)
|
Better / (Worse) Constant $
|
2015
|
2014
|
Change in
Occ % pts
|
2015
|
2014
|
Better /
(Worse)
|
Better / (Worse) Constant $
|
||||||||||||||||||||||||||
|
EAME/SW Asia full service
|
$
|
136
|
|
$
|
152
|
|
(10.3
|
)%
|
0.8
|
%
|
65.6
|
%
|
65.4
|
%
|
0.2
|
%
|
$
|
207
|
|
$
|
231
|
|
(10.6
|
)%
|
0.5
|
%
|
||||||||||
Excluding the net unfavorable currency impact, the increase in comparable systemwide EAME/SW Asia full service RevPAR in the year ended December 31, 2015 compared to the same period in 2014 was driven by increased ADR across most areas of the region, partially offset by decreased ADR in the Middle East.
During the year ended December 31, 2015, we removed one property that experienced a partial closure from the comparable EAME/SW Asia full service systemwide hotel results.
EAME/SW Asia management and franchising segment Adjusted EBITDA.
|
Year Ended December 31,
|
|||||||||||||||||||||||||
|
2016
|
2015
|
2014
|
Better / (Worse)
2016 vs 2015
|
Better / (Worse)
2015 vs 2014
|
|||||||||||||||||||||
|
Segment Adjusted EBITDA
|
$
|
33
|
|
$
|
33
|
|
$
|
43
|
|
$
|
—
|
|
—
|
%
|
$
|
(10
|
)
|
(23.3
|
)%
|
||||||
Adjusted EBITDA included
$1 million
net unfavorable currency impact in the year ended
December 31, 2016
compared to the year ended
December 31, 2015
. The
$2 million
decrease in management, franchise and other fees was offset by a
$2 million
decrease in adjusted selling, general, and administrative expenses, due to lower payroll and related costs during the year ended
December 31, 2016
compared to the year ended
December 31, 2015
.
Adjusted EBITDA decreased in the year ended December 31, 2015 compared to the year ended December 31, 2014, which included $5 million net unfavorable currency impact. The decrease was driven by the aforementioned $10 million decrease in management and other fees during the year ended December 31, 2015 compared to the year ended December 31, 2014.
Corporate and other.
|
Year Ended December 31,
|
|||||||||||||||||||||||||
|
2016
|
2015
|
2014
|
Better / (Worse)
2016 vs 2015
|
Better / (Worse)
2015 vs 2014
|
|||||||||||||||||||||
|
Corporate and other revenues
|
$
|
43
|
|
$
|
40
|
|
$
|
105
|
|
$
|
3
|
|
7.5
|
%
|
$
|
(65
|
)
|
(61.9
|
)%
|
||||||
|
Corporate and other Adjusted EBITDA
|
$
|
(139
|
)
|
$
|
(131
|
)
|
$
|
(103
|
)
|
$
|
(8
|
)
|
(6.1
|
)%
|
$
|
(28
|
)
|
(27.2
|
)%
|
||||||
Revenues increased in the year ended
December 31, 2016
compared to the year ended
December 31, 2015
driven by a
$4 million
increase related to our co-branded credit card, partially offset by a
$1 million
decrease in Hyatt Residence Club license fees.
As a result of the sale of our vacation ownership business, other revenues decreased $48 million and other revenues from managed properties decreased $30 million during the year ended December 31, 2015 compared to the year ended December 31, 2014. These decreases were partially offset by an increase of $9 million during the year ended December 31, 2015 compared to the year ended December 31, 2014 due to growth of our co-branded credit card. We recorded $4 million in Hyatt Residence Club license fees during the year ended December 31, 2015.
The decrease in Adjusted EBITDA in the year ended
December 31, 2016
compared to the year ended
December 31, 2015
was driven by a
$12 million
increase in promotional reward redemption expense as a result of increased costs related to our co-branded credit card, partially offset by the aforementioned
$3 million
increase in revenues and a
$1 million
decrease in adjusted selling, general, and administrative expenses. The decrease in adjusted selling, general, and administrative expenses was driven by a $10 million decrease in professional fees related to certain initiatives completed in 2015, partially offset by a $4 million increase in marketing expenses and a $3 million increase in payroll and related costs.
Adjusted EBITDA decreased in the year ended December 31, 2015 compared to the year ended December 31, 2014 driven by the aforementioned $65 million decrease in revenues which was partially offset by a decrease in other costs from
78
managed properties, and other direct costs. The decrease in expenses was primarily driven by the sale of our vacation ownership business. Excluding the impact of the sale of our vacation ownership business, adjusted selling, general, and administrative costs increased $23 million in the year ended December 31, 2015 compared to the year ended December 31, 2014 due to a $12 million increase related to professional fees and technology costs, primarily due to certain initiatives completed during the year. Direct costs increased $8 million in the year ended December 31, 2015 compared to the year ended December 31, 2014 from our co-branded credit card driven by program growth.
79
Non-GAAP Measure Reconciliation
The following charts illustrate Adjusted EBITDA by segment. For a discussion of our definition of Adjusted EBITDA, how we use it, why we present it and material limitations on its usefulness, see "—Key Business Metrics Evaluated by Management."
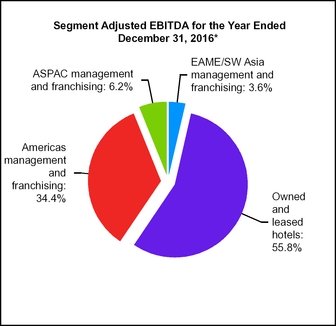
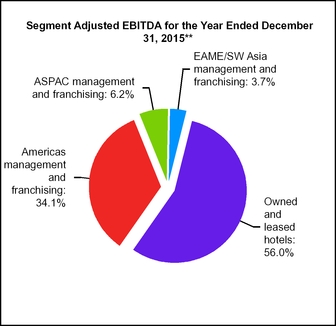
*Consolidated Adjusted EBITDA for the year ended
December 31, 2016
included Corporate and other Adjusted EBITDA of
$(139) million
**Consolidated Adjusted EBITDA for the year ended
December 31, 2015
included Corporate and other Adjusted EBITDA of $
(131) million
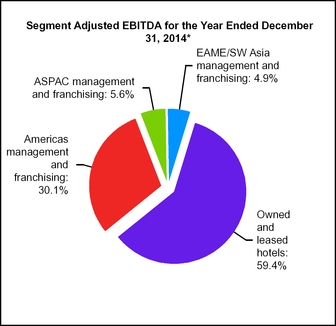
*Consolidated Adjusted EBITDA for the year ended December 31, 2014 included Corporate and other Adjusted EBITDA of $(103) million
80
The table below provides a reconciliation of our net income attributable to Hyatt Hotels Corporation to EBITDA and a reconciliation of EBITDA to consolidated Adjusted EBITDA:
|
Year Ended December 31,
|
|||||||||||||||||||||||||
|
2016
|
2015
|
2014
|
Change
2016 vs 2015 |
Change
2015 vs 2014 |
|||||||||||||||||||||
|
Net income attributable to Hyatt Hotels Corporation
|
$
|
204
|
|
$
|
124
|
|
$
|
344
|
|
$
|
80
|
|
64.5
|
%
|
$
|
(220
|
)
|
(64.0
|
)%
|
||||||
|
Interest expense
|
76
|
|
68
|
|
71
|
|
8
|
|
11.8
|
%
|
(3
|
)
|
(4.2
|
)%
|
|||||||||||
|
Provision for income taxes
|
85
|
|
70
|
|
179
|
|
15
|
|
21.4
|
%
|
(109
|
)
|
(60.9
|
)%
|
|||||||||||
|
Depreciation and amortization
|
342
|
|
320
|
|
354
|
|
22
|
|
6.9
|
%
|
(34
|
)
|
(9.6
|
)%
|
|||||||||||
|
EBITDA
|
707
|
|
582
|
|
948
|
|
125
|
|
21.5
|
%
|
(366
|
)
|
(38.6
|
)%
|
|||||||||||
|
Equity (earnings) losses from unconsolidated hospitality ventures
|
(68
|
)
|
64
|
|
(25
|
)
|
(132
|
)
|
(206.3
|
)%
|
89
|
|
356.0
|
%
|
|||||||||||
|
Stock-based compensation expense
|
25
|
|
23
|
|
49
|
|
2
|
|
8.7
|
%
|
(26
|
)
|
(53.1
|
)%
|
|||||||||||
|
(Gains) losses on sales of real estate and other
|
23
|
|
(9
|
)
|
(311
|
)
|
32
|
|
355.6
|
%
|
302
|
|
97.1
|
%
|
|||||||||||
|
Asset impairments
|
—
|
|
5
|
|
17
|
|
(5
|
)
|
(100.0
|
)%
|
(12
|
)
|
(70.6
|
)%
|
|||||||||||
|
Other (income) loss, net
|
(2
|
)
|
5
|
|
17
|
|
(7
|
)
|
(140.0
|
)%
|
(12
|
)
|
(70.6
|
)%
|
|||||||||||
|
Net income attributable to noncontrolling interests
|
—
|
|
—
|
|
2
|
|
—
|
|
—
|
%
|
(2
|
)
|
(100.0
|
)%
|
|||||||||||
|
Pro rata share of unconsolidated hospitality ventures Adjusted EBITDA
|
100
|
|
80
|
|
80
|
|
20
|
|
25.0
|
%
|
—
|
|
—
|
%
|
|||||||||||
|
Adjusted EBITDA
|
$
|
785
|
|
$
|
750
|
|
$
|
777
|
|
$
|
35
|
|
4.7
|
%
|
$
|
(27
|
)
|
(3.5
|
)%
|
||||||
Inflation
We do not believe inflation had a material effect on our business in
2016
,
2015
or
2014
.
Liquidity and Capital Resources
Overview
We finance our business primarily with existing cash, short-term investments and cash generated from our operations. As part of our business strategy, we also recycle capital by using net proceeds from dispositions to support our acquisitions and new investment opportunities. When appropriate, we borrow cash under our revolving credit facility or from other third-party sources, and may also raise funds by issuing debt or equity securities as necessary. We maintain a cash investment policy that emphasizes preservation of capital. At
December 31, 2016
and December 31,
2015
, we had cash and cash equivalents and short-term investments of
$538 million
and
$503 million
, respectively. We believe our cash position, short-term investments and cash from operations, together with borrowing capacity under our revolving credit facility and our access to the capital markets, will be adequate to meet all of our funding requirements and capital deployment objectives for the foreseeable future.
We may, from time to time, seek to retire or purchase additional amounts of our outstanding equity and/or debt securities through cash purchases and/or exchanges for other securities, in open market purchases, privately negotiated transactions or otherwise, including pursuant to a Rule 10b5-1 plan. Such repurchases or exchanges, if any, will depend on prevailing market conditions, our liquidity requirements, contractual restrictions and other factors. The amounts involved may be material.
Recent Transactions Affecting Our Liquidity and Capital Resources
During the years ended
December 31, 2016
,
December 31, 2015
, and
December 31, 2014
several transactions impacted our liquidity. See "—Sources and Uses of Cash."
81
Sources and Uses of Cash
|
|
Year Ended December 31,
|
||||||||||
|
2016
|
2015
|
2014
|
|||||||||
|
Cash provided by (used in):
|
|||||||||||
|
Operating activities
|
$
|
489
|
|
$
|
538
|
|
$
|
473
|
|
||
|
Investing activities
|
(380
|
)
|
(47
|
)
|
373
|
|
|||||
|
Financing activities
|
(96
|
)
|
(715
|
)
|
(607
|
)
|
|||||
|
Effect of exchange rate changes on cash
|
12
|
|
(4
|
)
|
(8
|
)
|
|||||
|
Net increase (decrease) in cash and cash equivalents
|
$
|
25
|
|
$
|
(228
|
)
|
$
|
231
|
|
||
At
December 31, 2016
, we had certain foreign subsidiaries with undistributed net earnings of
$504 million
that are indefinitely reinvested in jurisdictions outside the United States. Consistent with our capital redeployment strategy, we have expected foreign capital investment needs in excess of foreign cash available for redeployment at
December 31, 2016
. Additionally, we did not repatriate any significant amounts of foreign earnings during the year ended
December 31, 2016
. These earnings, to the extent of available cash, could become subject to additional taxes if remitted as dividends, loaned to a U.S. affiliate, or if we sold our interest in the affiliates; the resulting U.S. income tax liabilities could be offset, in whole or in part, by credits allowable for taxes paid to foreign jurisdictions. See Part IV, Item 15, "Exhibits and Financial Statement Schedule—Note
13
to the Consolidated Financial Statements" for further detail.
Cash Flows from Operating Activities
Cash provided by operating activities decreased
$49 million
in the year ended
December 31, 2016
compared to the year ended
December 31, 2015
, as 2015 included the release of $82 million of restricted cash from one of our captive insurance companies which was invested in marketable securities. Additionally, the timing of certain accruals contributed to the decrease, which was partially offset by a decrease in income tax payments and the timing of insurance payments received from managed hotels.
Cash provided by operating activities increased $65 million for the year ended
December 31, 2015
compared to the year ended
December 31, 2014
. The increase was driven by restricted cash released from our captive insurance company and the timing of prepaid income tax payments, which was partially offset by the timing of certain accruals.
Cash Flows from Investing Activities
2016
Activity:
|
•
|
We acquired Thompson Miami Beach for approximately
$238 million
.
|
|
•
|
Capital expenditures were $
211 million
(see "—Capital Expenditures" below).
|
|
•
|
We purchased our partners' interest in Andaz Maui at Wailea Resort and villas for
$136 million
, net of cash acquired. Additionally, prior to the acquisition we contributed $71 million to the unconsolidated hospitality venture and provided $37 million of financing receivables to our partners to repay the venture's third-party debt. Our partners repaid the financing receivables during 2016.
|
|
•
|
We invested
$33 million
in unconsolidated hospitality ventures, excluding our contribution to Andaz Maui at Wailea Resort and villas discussed above.
|
|
•
|
We acquired Royal Palms Resort and Spa for a net purchase price of approximately
$86 million
.
|
|
•
|
We acquired land for
$25 million
for future development in Philadelphia.
|
|
•
|
We sold Andaz 5th Avenue for approximately
$240 million
, net of closing costs and proration adjustments.
|
|
•
|
We received distributions of
$132 million
from unconsolidated hospitality ventures.
|
|
•
|
We sold the shares of the company that owns Hyatt Regency Birmingham (U.K.) for approximately
$49 million
, net of closing costs and proration adjustments.
|
|
•
|
We released $29 million from restricted cash related to the finalization from the Canada Revenue Agency in connection with the 2014 disposition of Park Hyatt Toronto.
|
2015
Activity:
|
•
|
Capital expenditures were
$269 million
(see "—Capital Expenditures" below).
|
82
|
•
|
We had net purchases of $121 million of marketable securities and short-term investments related to Hyatt Gold Passport and our captive insurance companies.
|
|
•
|
We invested a total of $37 million in investments which includes $35 million in unconsolidated hospitality ventures.
|
|
•
|
We released
$143 million
from escrow to cash and cash equivalents related to release of proceeds from like-kind exchanges.
|
|
•
|
We received net proceeds of $100 million from the maturity of time deposits.
|
|
•
|
We sold Hyatt Regency Indianapolis for approximately $69 million.
|
|
•
|
We received proceeds of $28 million from financing receivables.
|
|
•
|
We released $19 million from restricted cash related to the development of a hotel in Brazil.
|
|
•
|
Two unconsolidated hospitality ventures in which we hold or held ownership interests and are classified as equity method investments sold two select service properties to third parties for total proceeds of $16 million.
|
|
•
|
We sold land and construction in progress for approximately $14 million.
|
|
•
|
We sold a Hyatt House hotel for approximately $5 million.
|
2014
Activity:
|
•
|
We sold a portfolio of 38 select service properties for approximately $581 million.
|
|
•
|
We sold nine select service properties and one full service property for $310 million, net of closing costs and cash transferred.
|
|
•
|
We sold Hyatt Residential Group for net proceeds of $220 million, which includes an interest in a joint venture that owns a vacation ownership property in Maui, Hawaii, as well as a full service hotel.
|
|
•
|
We sold two full service properties in Canada for a net total of $204 million, of which $87 million was classified as restricted cash pending clearance from the Canada Revenue Agency pursuant to Withholding Tax Escrow Agreements.
|
|
•
|
We sold Park Hyatt Washington for approximately $97 million.
|
|
•
|
We released $74 million from restricted cash in conjunction with the 2013 sale of Hyatt Key West.
|
|
•
|
We received proceeds of $56 million, which primarily related to two mezzanine loan receivables.
|
|
•
|
We sold five Hyatt Place properties for $51 million.
|
|
•
|
Four unconsolidated hospitality ventures in which we held ownership interests and that are classified as equity method investments sold four properties to third parties for $64 million, of which $30 million related to investing activities.
|
|
•
|
We acquired Park Hyatt New York for $391 million, net of acquired cash of $1 million.
|
|
•
|
Capital expenditures were
$253 million
(see "—Capital Expenditures" below).
|
|
•
|
We acquired Hyatt Regency Lost Pines Resort and Spa and adjacent land from an unconsolidated hospitality venture in which we hold an 8.2% interest for
$157 million
, net of acquired cash and cash equivalents of
$7 million
.
|
|
•
|
We purchased a net total of $101 million of marketable securities and short-term investments.
|
|
•
|
We invested a total of $114 million in investments which includes $98 million in unconsolidated hospitality ventures.
|
Cash Flows from Financing Activities
During the years ended
December 31, 2016
,
December 31, 2015
and
December 31, 2014
, we repurchased
5,631,557
,
13,199,811
and 7,693,326 shares of common stock for an aggregate purchase price of
$272 million
,
$715 million
and $445 million, respectively.
During the year ended
December 31, 2016
, we issued our 2026 Notes and received net proceeds of
$396 million
, after deducting discounts and offering expenses of approximately
$4 million
. During the year ended
December 31, 2016
, all of our outstanding
2016
Notes were redeemed for $250 million. No notes were issued or redeemed in the years ended December 31, 2015 and December 31, 2014.
83
During the year ended
December 31, 2016
, we repaid the senior secured term loan of
$64 million
related to Hyatt Regency Lost Pines Resort and Spa.
During the year ended
December 31, 2016
, we drew $210 million and subsequently repaid $110 million on our revolving credit facility. During the year ended December 31, 2015, we did not draw on our revolving credit facility. During 2014, we drew and subsequently repaid
$205 million
on our revolving credit facility.
During 2014, the Company exercised our purchase option to acquire Hyatt Regency Grand Cypress for $191 million.
During the years ended
December 31, 2016
,
December 31, 2015
and
December 31, 2014
, we drew $13 million, $12 million and $44 million, respectively, excluding the effects of currency, on a construction loan for the development of Grand Hyatt Rio de Janeiro.
We define net debt as total debt less the total of cash and cash equivalents and short-term investments. We consider net debt and its components to be an important indicator of liquidity and a guiding measure of capital structure strategy. Net debt is a non-GAAP measure and may not be computed the same as similarly titled measures used by other companies. The following table provides a summary of our debt to capital ratios:
|
December 31, 2016
|
December 31, 2015
|
||||||
|
Consolidated debt (1)
|
$
|
1,564
|
|
$
|
1,370
|
|
|
|
Stockholders’ equity
|
3,903
|
|
3,991
|
|
|||
|
Total capital
|
5,467
|
|
5,361
|
|
|||
|
Total debt to total capital
|
28.6
|
%
|
25.6
|
%
|
|||
|
Consolidated debt (1)
|
1,564
|
|
1,370
|
|
|||
|
Less: Cash and cash equivalents and short-term investments
|
538
|
|
503
|
|
|||
|
Net consolidated debt
|
1,026
|
|
867
|
|
|||
|
Net debt to total capital
|
18.8
|
%
|
16.2
|
%
|
|||
|
(1)
|
Excludes approximately
$745 million
and $692 million of our share of unconsolidated hospitality venture indebtedness at
December 31, 2016
and
December 31, 2015
, respectively, substantially all of which is non-recourse to us and a portion of which we guarantee pursuant to separate agreements. In the event our investment in Playa is no longer accounted for under the equity method as discussed in Part II, Item 7, "Management's Discussion and Analysis of Financial Condition and Results of Operations—Results of Operations" our share of unconsolidated hospitality venture indebtedness would decrease by approximately $200 million.
|
Capital Expenditures
We routinely make capital expenditures to enhance our business. We classify our capital expenditures into maintenance, enhancements to existing properties and investment in new properties under development or recently opened. We have been and will continue to be prudent with respect to our capital spending, taking into account our cash flows from operations.
The following is a summary of our capital expenditures:
|
|
Year Ended December 31,
|
||||||||||
|
2016
|
2015
|
2014
|
|||||||||
|
Maintenance
|
$
|
68
|
|
$
|
110
|
|
$
|
102
|
|
||
|
Enhancements to existing properties
|
72
|
|
59
|
|
72
|
|
|||||
|
Investment in new properties
|
71
|
|
100
|
|
79
|
|
|||||
|
Total capital expenditures
|
$
|
211
|
|
$
|
269
|
|
$
|
253
|
|
||
The decrease in maintenance expenditures in 2016 compared to 2015 is driven by decreased technology spending and decreased spending at domestic full service properties. The increase in enhancements to existing properties is driven by increased renovation activity at domestic and international full service properties and expenditures related to our new corporate office. Expenditures related to new properties under development are primarily driven by construction spending related to Grand Hyatt Rio de Janeiro, which opened in early 2016, and two new select service hotels under development in the United States.
The increase in maintenance expenditures in 2015 compared to 2014 is driven by increased spending at domestic and international full service properties partially offset by decreased spending related to owned select service hotels driven by dispositions during 2014. Expenditures related to investments in new properties in 2015 and 2014 were primarily driven by
84
construction spending on our development of Grand Hyatt Rio de Janeiro. Expenditures in 2014 also included spending related to owned select service hotels which were subsequently sold during 2014. The decrease in enhancements to existing properties from 2014 to 2015 was primarily driven by decreased renovation spending at owned international full service hotels and decreased spending at owned select service hotels driven by dispositions during 2014, partially offset by increased spending at certain full service properties in the United States.
Capital expenditures are expected to be approximately $430 million in 2017. The increase from capital expenditures in 2016 is attributable to the following: approximately $55 million related to the redevelopment and repositioning of Miraval Group assets; approximately $65 million related to new corporate development projects which will be recycled over time; approximately $50 million related to our new corporate headquarters; and approximately $50 million related to increased levels of reinvestment in our existing owned and leased portfolio due to the timing of property renovations.
Senior Notes
The following table sets forth the principal, maturity and interest rate of our outstanding senior unsecured notes described below (collectively, the "Senior Notes"). Interest on the Senior Notes is payable semi-annually.
|
Description
|
Principal
Amount
|
|||
|
6.875% Senior Notes due 2019
|
$
|
196
|
|
|
|
5.375% Senior Notes due 2021
|
250
|
|
||
|
3.375% Senior Notes due 2023
|
350
|
|
||
|
4.850% Senior Notes due 2026
|
400
|
|
||
|
Total
|
$
|
1,196
|
|
|
In the indenture that governs the Senior Notes, we agreed not to:
|
•
|
create any liens on our principal properties, or on the capital stock or debt of our subsidiaries that own or lease principal properties, to secure debt without also effectively providing that the Senior Notes are secured equally and ratably with such debt for so long as such debt is so secured; or
|
|
•
|
enter into any sale and leaseback transactions with respect to our principal properties.
|
These limitations are subject to significant exceptions.
The indenture also limits our ability to enter into mergers or consolidations or transfer all or substantially all of our assets unless certain conditions are satisfied.
If a change of control triggering event occurs, as defined in the indenture governing the Senior Notes, we will be required to offer to purchase the Senior Notes at a price equal to 101% of their principal amount, together with accrued and unpaid interest, if any, to the date of purchase. We may also redeem some or all of the Senior Notes at any time prior to their maturity at a redemption price equal to 100% of the principal amount of the Senior Notes redeemed plus accrued and unpaid interest, if any, to the date of redemption plus a make-whole amount.
We are in compliance with all applicable covenants under the indenture governing our Senior Notes at
December 31, 2016
.
Revolving Credit Facility
On January 6, 2014, we entered into a Second Amended and Restated Credit Agreement with a syndicate of lenders that amended and restated our prior revolving credit facility to extend the facility's expiration from September 9, 2016 to January 4, 2019. The revolving credit facility is intended to provide financing for working capital and general corporate purposes, including commercial paper back-up and permitted investments and acquisitions.
We had no outstanding undrawn letters of credit issued under our revolving credit facility (which would reduce the availability thereunder) at
December 31, 2016
and
December 31, 2015
, respectively. At
December 31, 2016
, we had available borrowing capacity of
$1.4 billion
under our revolving credit facility, net of the outstanding revolver balance.
All of our borrowings under our revolving credit facility are guaranteed by substantially all of our material domestic subsidiaries, as defined in the revolving credit facility. All guarantees are guarantees of payment and performance and not of collection. Hotel Investors I, Inc. is an additional borrower under our revolving credit facility.
85
Interest rates on outstanding borrowings are either LIBOR-based or based on an alternate base rate, with margins in each case based on our credit rating or, in certain circumstances, our credit rating and leverage ratio. At
December 31, 2016
, the interest rate for a one month LIBOR borrowing under our revolving credit facility would have been
1.872%
, or LIBOR of
0.772%
plus
1.100%
.
Borrowings under our revolving credit facility bear interest, at our option, at either one-, two-, three- or six-month LIBOR plus a margin ranging from 0.900% to 1.500% per annum (plus any mandatory costs, if applicable) or the alternative base rate plus a margin ranging from 0.000% to 0.500% per annum, in each case depending on our credit rating by either S&P or Moody’s or, in certain circumstances, our credit rating and leverage ratio. Borrowings under our swingline subfacility will bear interest at a per annum rate equal to the alternate base rate plus the applicable percentage for revolving loans that are alternate base rate loans. We are also required to pay letter of credit fees with respect to each letter of credit equal to the applicable margin for LIBOR on the face amount of each letter of credit. In addition, we must pay a fronting fee to the issuer of each letter of credit of 0.10% per annum on the face amount of such letter of credit.
The revolving credit facility also provides for a facility fee ranging from 0.100% to 0.250% of the total commitment of the lenders under the revolving credit facility (depending on our credit rating by either S&P or Moody’s). The facility fee is charged regardless of the level of borrowings.
In the event we no longer have a credit rating from either S&P or Moody’s or our rating falls at or below BBB-/Baa3, with respect to borrowings under our revolving credit facility (a) such borrowings will bear interest at either LIBOR plus 1.300% or 1.500% per annum or the alternative base rate referenced above plus 0.300% or 0.500% per annum, in each case, depending on our leverage ratio and (b) the facility fee will be 0.200% or 0.250%.
Our revolving credit facility contains a number of affirmative and restrictive covenants including limitations on the ability to place liens on our or our direct or indirect subsidiaries’ assets; to merge, consolidate and dissolve; to sell assets; to engage in transactions with affiliates; to change our or our direct or indirect subsidiaries’ fiscal year or organizational documents; and to make restricted payments.
Our revolving credit facility also requires us to meet Leverage Ratio and Secured Funded Debt Ratio financial covenants in each case measured quarterly as defined in our revolving credit facility.
The revolving credit facility contains certain covenants, including financial covenants that limit our maximum leverage (consisting of the ratio of Adjusted Total Debt to Consolidated EBITDA, each as defined in the revolving credit facility) to not more than 4.5 to 1, and limit our Secured Funded Debt Ratio (consisting of the ratio of Secured Funded Debt to Property and Equipment, each as defined in the revolving credit facility), to not more than 0.30 to 1. Our outstanding Senior Notes do not contain a corresponding financial covenant or a requirement that we maintain certain financial ratios. We currently satisfy all the covenants in our revolving credit facility and Senior Notes, and do not expect the covenants will restrict our ability to meet our anticipated borrowing and guarantee levels, or increase those levels should we decide to do so in the future.
Letters of Credit
We issue letters of credit either under the revolving credit facility or directly with financial institutions. We had a total of
$230 million
and
$228 million
in letters of credit issued directly with financial institutions outstanding at
December 31, 2016
and
December 31, 2015
, respectively. These letters of credit had weighted average fees of
98
basis points and a range of maturity of up to
five
years at
December 31, 2016
.
Excluding the
$1,196 million
of Senior Notes, all other third-party indebtedness at
December 31, 2016
was
$368 million
.
At
December 31, 2016
,
$119 million
of our outstanding debt will mature in the following twelve months. We believe we will have adequate liquidity, including our capacity to borrow under our revolving credit facility, and/or the ability to execute on refinancing or new issuances of debt to meet requirements for scheduled maturities.
86
Contractual Obligations
The following table summarizes our contractual obligations at
December 31, 2016
:
|
|
Payments Due by Period
|
||||||||||||||||||||||||||
|
Total
|
2017
|
2018
|
2019
|
2020
|
2021
|
Thereafter
|
|||||||||||||||||||||
|
Debt (1)
|
$
|
2,101
|
|
$
|
191
|
|
$
|
90
|
|
$
|
285
|
|
$
|
74
|
|
$
|
323
|
|
$
|
1,138
|
|
||||||
|
Capital lease obligations (1)
|
20
|
|
2
|
|
3
|
|
3
|
|
2
|
|
2
|
|
8
|
|
|||||||||||||
|
Operating lease obligations
|
614
|
|
41
|
|
35
|
|
39
|
|
29
|
|
26
|
|
444
|
|
|||||||||||||
|
Purchase obligations
|
79
|
|
79
|
|
—
|
|
—
|
|
—
|
|
—
|
|
—
|
|
|||||||||||||
|
Other long-term liabilities (2)
|
375
|
|
2
|
|
2
|
|
1
|
|
1
|
|
1
|
|
368
|
|
|||||||||||||
|
Total contractual obligations
|
$
|
3,189
|
|
$
|
315
|
|
$
|
130
|
|
$
|
328
|
|
$
|
106
|
|
$
|
352
|
|
$
|
1,958
|
|
||||||
|
(1)
|
Includes principal as well as interest payments. Assumes constant foreign exchange rates at
December 31, 2016
for floating rate debt and international debt.
|
|
(2)
|
Primarily consists of deferred compensation plan liabilities. Excludes
$100 million
in long-term tax positions due to the uncertainty related to the timing of the reversal of those positions.
|
Guarantee Commitments
The following table summarizes our guarantee commitments at
December 31, 2016
:
|
|
Amount of Guarantee Commitments Expiration by Period
|
||||||||||||||||||||||||||
|
Total Amounts Committed
|
2017
|
2018
|
2019
|
2020
|
2021
|
Thereafter
|
|||||||||||||||||||||
|
Performance guarantees (1)
|
$
|
346
|
|
$
|
84
|
|
$
|
—
|
|
$
|
—
|
|
$
|
234
|
|
$
|
—
|
|
$
|
28
|
|
||||||
|
Debt repayment guarantees (2)
|
576
|
|
33
|
|
—
|
|
25
|
|
493
|
|
25
|
|
—
|
|
|||||||||||||
|
Total guarantee commitments
|
$
|
922
|
|
$
|
117
|
|
$
|
—
|
|
$
|
25
|
|
$
|
727
|
|
$
|
25
|
|
$
|
28
|
|
||||||
|
(1)
|
Consists of contractual agreements with third-party owners which require us to guarantee payments to the owners if specified levels of operating profit are not achieved by their hotels.
|
|
(2)
|
Consists of various debt repayment guarantees related to our unconsolidated hospitality ventures and certain managed hotels. Certain of these underlying debt agreements have extension periods which are not reflected in the table above. With respect to certain of these debt repayment guarantees we have agreements with either our unconsolidated hospitality venture partner, the respective hotel owners or other third parties which reduce our maximum guarantee which are not reflected in the table above.
|
See Part IV, Item 15, "Exhibits and Financial Statement Schedule—Note
14
to the Consolidated Financial Statements."
Investment Commitments
The following table summarizes our investment commitments, which represent our commitment to fund contract acquisition costs and other investments such as unconsolidated hospitality ventures, at
December 31, 2016
:
|
|
Amount of Investment Commitments Expected Funding by Period
|
||||||||||||||||||||||||||
|
Total Amounts Committed
|
2017
|
2018
|
2019
|
2020
|
2021
|
Thereafter
|
|||||||||||||||||||||
|
Investment commitments
|
$
|
378
|
|
$
|
137
|
|
$
|
194
|
|
$
|
29
|
|
$
|
1
|
|
$
|
1
|
|
$
|
16
|
|
||||||
Off-Balance Sheet Arrangements
Our off-balance sheet arrangements at
December 31, 2016
included purchase obligations of
$79 million
, letters of credit of
$230 million
and surety bonds of
$25 million
. These amounts are discussed in "—Sources and Uses of Cash—Revolving Credit Facility and —Letters of Credit", "—Contractual Obligations" and Part IV, Item 15, "Exhibits and Financial Statement Schedule—Note
14
to the Consolidated Financial Statements."
87
Critical Accounting Policies and Estimates
Preparing financial statements in conformity with GAAP requires management to make estimates and assumptions that affect the reported amounts of assets and liabilities as of the date of the financial statements, the reported amounts of revenues and expenses during the reporting periods and the related disclosures in our consolidated financial statements and accompanying notes.
A number of our accounting policies, which are described in Part IV, Item 15, "Exhibits and Financial Statement Schedule—Note
2
to the Consolidated Financial Statements", are critical due to the fact they involve a higher degree of judgment and estimates. Those accounting policies and other critical estimates are included below. As a result, these accounting policies could materially affect our financial position and results of operations. While we have used our best estimates based on the facts and circumstances available to us at the time, different estimates reasonably could have been used in the current period. In addition, changes in the accounting estimates that we use are reasonably likely to occur from period to period, which may have a material impact on the presentation of our financial condition and results of operations. Although we believe our estimates, assumptions and judgments are reasonable, they are based upon information presently available. Actual results may differ significantly from these estimates under different assumptions, judgments or conditions. Management has discussed the development and selection of these critical accounting policies and estimates with the audit committee of the board of directors.
Guarantees
We enter into performance guarantees related to certain hotels we manage. We also enter into debt repayment guarantees with respect to our unconsolidated hospitality ventures and certain managed or franchised hotels. Upon inception of the guarantee, we record a stand ready to perform liability that is measured at fair value. In order to estimate fair value we use a Monte Carlo simulation to model the probability of possible outcomes. Determination of fair value requires we make certain assumptions and judgments based on our knowledge of the hospitality industry, market conditions, location of the property and specific information available at the time of the valuation.
Goodwill
We evaluate goodwill for impairment on an annual basis during the fourth quarter using balances at October 1 and at an interim date if indications of impairment exist. The Company has six reporting units on which we have a goodwill balance at
December 31, 2016
.
Determining whether or not indications of impairment exist requires us to apply judgment. The final determination of the occurrence of a triggering event is based on our knowledge of the hospitality industry, historical experience, location of the property, market conditions and specific information available at the time of the assessment. We realize, however, that the results of our analysis could vary from period to period depending on how our judgment is applied and the facts and circumstances available at the time of the analysis.
Historically, changes in estimates used in the goodwill impairment evaluations have not resulted in impairment charges in subsequent periods as a result of changes in those estimates. However, changes in the economic and operating conditions impacting the assumptions and estimates could result in an impairment charge which could be material to our earnings. In the current period, a change in our assumptions and estimates that could reduce the fair value for one of our reporting units at December 31, 2016 by 4% would result in an impairment charge of up to $17 million. For all other reporting units, a change in our assumptions and estimates that could reduce the fair value of each reporting unit at December 31, 2016 by 10% would not result in an impairment charge.
Business Combinations
Assets acquired and liabilities assumed in a business combination are recorded at fair value as of the acquisition date. We use judgment to determine the fair value of the property acquired and to determine the amount of value to allocate to each identifiable asset or liability. Typically, tangible assets acquired include property, plant and equipment, and intangible assets may include a management agreement intangible, an indefinite-lived brand intangible, advanced bookings or goodwill. Changes to the significant assumptions or factors used to determine fair value could affect the measurement and allocation of fair value.
88
Property and Equipment and Definite-Lived Intangibles
We evaluate property and equipment and definite-lived intangibles for impairment on a quarterly basis. If we determine there are indications of potential impairment, we perform a recoverability analysis comparing the projected undiscounted future cash flows of the assets to the net book value of the assets. If the projected undiscounted future cash flows are less than the net book value of the assets, a fair value analysis is prepared and the excess of the net book value over the estimated fair value is charged to asset impairments within our consolidated statements of income. When determining fair value, we use internally developed discounted future cash flow models, third-party appraisals and, if appropriate, current estimated net sales proceeds from pending offers.
As part of the process detailed above we use judgment to determine whether indications of impairment exist. The determination of the occurrence of a triggering event is based on our knowledge of the hospitality industry, historical experience, location of the property, market conditions and property-specific information available at the time of the assessment. We realize, however, that the results of our analysis could vary from period to period depending on how our judgment is applied and the facts and circumstances available at the time of the analysis.
Changes in economic and operating conditions impacting the judgments used could result in impairments to our long-lived assets in future periods, which could be material to our earnings. Historically, changes in estimates used in the property and equipment and definite-lived intangibles impairment assessment process have not resulted in impairment charges in subsequent periods as a result of changes made to those estimates.
Available-for-Sale Debt Securities ("AFS")
See Part IV, Item 15, "Exhibits and Financial Statement Schedule—Note
4
to the Consolidated Financial Statements" for our assessment process and further information regarding our estimates used in determining the fair value of AFS debt securities.
Unconsolidated Hospitality Ventures
We assess investments in unconsolidated hospitality ventures for impairment quarterly. We use judgment to determine whether or not there is an indication that a loss in value has occurred and whether a decline is deemed to be other than temporary. The determination of whether a loss in value has occurred is based on our knowledge of the hospitality industry, historical experience, location of the underlying venture property, market conditions and venture-specific information available at the time of the assessment.
Changes in economic and operating conditions impacting these estimates and judgments could result in impairments to our investments in unconsolidated hospitality ventures in future periods. Historically, changes in estimates used in the unconsolidated hospitality ventures impairment assessment process have not resulted in impairment charges in subsequent periods as a result of changes made to those estimates.
Income Taxes
The objectives of accounting for income taxes are to recognize the amount of taxes payable or refundable for the current year and deferred tax liabilities and assets for the future tax consequences of events that have been recognized in our financial statements or tax returns. Judgment is required in addressing the future tax consequences of events that have been recognized in our consolidated financial statements or tax returns (e.g., realization of deferred tax assets, changes in tax laws or interpretations thereof). In addition, we are subject to examination of our income tax returns by the IRS and other tax authorities. A change in the assessment of the outcomes of such matters could materially impact our consolidated financial statements.
We evaluate tax positions taken or expected to be taken in a tax return to determine whether they are "more likely than not" of being sustained assuming that its tax reporting positions will be examined by taxing authorities with full knowledge of all relevant information prior to recording the related tax benefit in the financial statements. If the position drops below the "more likely than not" standard, the benefit can no longer be recognized. Assumptions, judgment and the use of estimates are required in determining if the "more likely than not" standard has been met when developing the provision for income taxes. A change in the assessment of the "more likely than not" standard could materially impact our consolidated financial statements.
Insurance
Our insurance reserves are accrued based on estimates of the ultimate cost of claims that occurred during the covered period, which includes claims incurred but not reported, for which we will be responsible. These estimates are prepared with
89
the assistance of outside actuaries and consultants. Actual cost of claims may differ from our original estimates and could result in a material change to our liability.
Hyatt Gold Passport Future Redemption Obligation
We utilize an actuary to assist with our estimate of our future redemption obligation related to the Hyatt Gold Passport Program ("the Program"). Changes in the estimates used in the determination of the future redemption obligation, including the estimate of the "breakage" for points that will never be redeemed, could result in a material change to our future redemption obligation.
At
December 31, 2016
, the redemption liability related to the Program was
$446 million
. A 10% decrease in the breakage assumption would have resulted in an increase in the redemption liability of approximately $45 million at December 31, 2016.
Future Adoption of Accounting Standards
In May 2014, the FASB released Accounting Standards Update No. 2014-09 ("ASU 2014-09"),
Revenue from Contracts with Customers (Topic 606)
. ASU 2014-09 supersedes the revenue recognition requirements in Topic 605, Revenue Recognition, and provides a single, comprehensive revenue recognition model for contracts with customers. In August 2015, the FASB released Accounting Standards Update No. 2015-14 ("ASU 2015-14"),
Revenue from Contracts with Customers (Topic 606): Deferral of the Effective Date
. ASU 2015-14 delays the effective date of ASU 2014-09 by one year, making it effective for interim periods and fiscal years beginning after December 15, 2017, with early adoption permitted as of the original effective date under ASU 2014-09. See Part IV, Item 15, "Exhibits and Financial Statement Schedule—Note
2
to the Consolidated Financial Statements" for the Company’s current evaluation of the impact of adopting ASU 2014-09.
Item 7A.
Quantitative and Qualitative Disclosures About Market Risk.
We are exposed to market risk primarily from changes in interest rates and foreign currency exchange rates. In certain situations, we seek to reduce earnings and cash flow volatility associated with changes in interest rates and foreign currency exchange rates by entering into financial arrangements to provide a hedge against a portion of the risks associated with such volatility. We continue to have exposure to such risks to the extent they are not hedged. We enter into derivative financial arrangements to the extent they meet the objectives described above, and we do not use derivatives for trading or speculative purposes. At
December 31, 2016
, we were a party to hedging transactions including the use of derivative financial instruments, as discussed below.
Interest Rate Risk
In the normal course of business, we are exposed to the impact of interest rate changes due to our borrowing activities. Our objective is to manage the risk of interest rate changes on the results of operations, cash flows, and the market value of our debt by creating an appropriate balance between our fixed and floating-rate debt. We enter into interest rate derivative transactions from time to time, including interest rate swaps, in order to maintain a level of exposure to interest rate variability that we deem acceptable. At
December 31, 2016
and December 31, 2015 we did not hold any interest rate swap contracts.
The following table sets forth the contractual maturities and the total fair values at
December 31, 2016
for our financial instruments materially affected by interest rate risk:
|
Maturities by Period
|
|||||||||||||||||||||||||||||||
|
2017
|
2018
|
2019
|
2020
|
2021
|
Thereafter
|
Total Carrying Amount
|
Total Fair Value
|
||||||||||||||||||||||||
|
Fixed-rate debt (1)
|
$
|
4
|
|
$
|
4
|
|
$
|
200
|
|
$
|
5
|
|
$
|
255
|
|
$
|
918
|
|
$
|
1,386
|
|
$
|
1,450
|
|
|||||||
|
Average interest rate (2)
|
4.89
|
%
|
|||||||||||||||||||||||||||||
|
Floating-rate debt (3)
|
$
|
113
|
|
$
|
13
|
|
$
|
13
|
|
$
|
13
|
|
$
|
13
|
|
$
|
14
|
|
$
|
179
|
|
$
|
192
|
|
|||||||
|
Average interest rate (2)
|
4.95
|
%
|
|||||||||||||||||||||||||||||
(1) Excludes capital lease obligations of $15 million and unamortized discounts and deferred financing fees of $16 million.
(2) Average interest rate as of
December 31, 2016
.
(3) Includes the Grand Hyatt Rio de Janeiro construction loan which had a 9.00% interest rate at
December 31, 2016
. For additional information on floating-rate debt, see Part IV, Item 15, "Exhibits and Financial Statement Schedule—Note
9
to the Consolidated Financial Statements."
90
Foreign Currency Exposures and Exchange Rate Instruments
We transact business in various foreign currencies and utilize foreign currency forward contracts to offset our exposure associated with the fluctuations of certain foreign currencies. These foreign currency exposures typically arise from third-party debt, debt repayment guarantees and intercompany transactions. The U.S. dollar equivalent of the notional amount of the outstanding forward contracts, the majority of which relate to intercompany transactions, with terms of less than one year, were as follows:
|
December 31, 2016
|
December 31, 2015
|
||||||
|
Pound sterling
|
$
|
122
|
|
$
|
170
|
|
|
|
Korean won
|
35
|
|
33
|
|
|||
|
Canadian dollar
|
32
|
|
61
|
|
|||
|
Swiss franc
|
15
|
|
9
|
|
|||
|
Indian rupee
|
—
|
|
27
|
|
|||
|
Brazilian real
|
—
|
|
4
|
|
|||
|
Total notional amount of forward contracts
|
$
|
204
|
|
$
|
304
|
|
|
We intend to offset the gains and losses related to our third-party debt, debt repayment guarantees and intercompany transactions with gains or losses on our foreign currency forward contracts such that there is a negligible effect on net income. At December 31, 2016, a hypothetical 10% change in foreign currency exchange rates would result in an immaterial change in the fair value of the hedging instrument.
For the years ended
December 31, 2016
,
December 31, 2015
and
December 31, 2014
, the effects of these derivative instruments within other income (loss), net on our consolidated financial statements resulted in gains of $25 million, $22 million and $10 million, respectively. We offset the gains and losses on our foreign currency forward contracts with gains and losses related to our intercompany loans and transactions, such that there is a negligible effect to net income.
Item 8.
Financial Statements and Supplementary Data.
The consolidated financial statements and supplementary data required by Item 8 are contained in Item 15 of this annual report and are incorporated herein by reference.
Item 9.
Changes in and Disagreements with Accountants on Accounting and Financial Disclosure.
None.
Item 9A.
Controls and Procedures.
Disclosure Controls and Procedures
The Company maintains a set of disclosure controls and procedures designed to provide reasonable assurance that information required to be disclosed by the Company in reports that it files or submits under the Exchange Act, is recorded, processed, summarized and reported within the time periods specified in SEC rules and forms. In accordance with Rule 13a-15(b) of the Exchange Act, as of the end of the period covered by this annual report, an evaluation was carried out under the supervision and with the participation of the Company's management, including its Principal Executive Officer and Principal Financial Officer, of the effectiveness of its disclosure controls and procedures. Based on that evaluation, the Company's Principal Executive Officer and Principal Financial Officer concluded that the Company's disclosure controls and procedures, as of the end of the period covered by this annual report, were effective to provide reasonable assurance that information required to be disclosed by the Company in reports that it files or submits under the Exchange Act is recorded, processed, summarized and reported within the time periods specified in SEC rules and forms and is accumulated and communicated to the Company's management, including the Principal Executive Officer and Principal Financial Officer, as appropriate to allow timely decisions regarding required disclosure.
Internal Control over Financial Reporting
Management's Report on Internal Control Over Financial Reporting.
Management's Report on Internal Control Over Financial Reporting is included in Part IV, Item 15 of this annual report.
Attestation Report of Independent Registered Public Accounting Firm.
91
The Attestation Report of Independent Registered Public Accounting Firm is included in Part IV, Item 15 of this annual report.
Changes in Internal Control
There has been no change in the Company's internal control over financial reporting during the Company's most recent fiscal quarter that has materially affected, or is reasonably likely to materially affect, the Company's internal control over financial reporting.
Item 9B.
Other Information.
None.
92
|
Item 10.
|
Directors, Executive Officers and Corporate Governance.
|
The information required by this Item 10 is incorporated by reference to the information set forth in the Company's definitive proxy statement, to be filed with the SEC within 120 days after the end of the Company's fiscal year ended
December 31, 2016
pursuant to Regulation 14A under the Exchange Act in connection with our
2017 Annual Meeting of Stockholders
.
Information required by this Item 10 appears under the captions: "CORPORATE GOVERNANCE—PROPOSAL 1— ELECTION OF DIRECTORS," "CORPORATE GOVERNANCE—OUR BOARD OF DIRECTORS," "CORPORATE GOVERNANCE," "CORPORATE GOVERNANCE—COMMITTEES OF THE BOARD OF DIRECTORS—Nominating and Corporate Governance Committee," "STOCK—SECTION 16(a) BENEFICIAL OWNERSHIP REPORTING COMPLIANCE" and "CORPORATE GOVERNANCE—COMMITTEES OF THE BOARD OF DIRECTORS—Audit Committee" in the definitive proxy statement. See Part I, "Executive Officers of the Registrant" of this annual report for information regarding executive officers of the Company.
Code of Business Conduct and Ethics
The Company has adopted the Hyatt Hotels Corporation Code of Business Conduct and Ethics (the "Code of Ethics"), which is applicable to all of the Hyatt directors, officers and colleagues, including the Company's President and Chief Executive Officer, Chief Financial Officer, Principal Accounting Officer or Controller and other senior financial officers performing similar functions. The Code of Ethics is posted on the Company's website at http://www.hyatt.com. The Company will furnish a copy of the Code of Ethics to any person, without charge, upon written request directed to: Treasurer and Senior Vice President, Investor Relations and Corporate Finance, Hyatt Hotels Corporation, 71 South Wacker Drive, Chicago, Illinois 60606. In the event that the Company amends or waives any of the provisions of the Code of Ethics that applies to the Company's Chief Executive Officer, Chief Financial Officer, Principal Accounting Officer or Controller and other senior financial officers performing similar functions, the Company intends to disclose the subsequent information on its website.
|
Item 11.
|
Executive Compensation.
|
The information required by this Item 11 is incorporated by reference to the information set forth in the Company's definitive proxy statement, to be filed with the SEC within 120 days after the end of the Company's fiscal year ended
December 31, 2016
pursuant to Regulation 14A under the Exchange Act in connection with our
2017 Annual Meeting of Stockholders
.
Information related to this Item 11 appears under the captions: "EXECUTIVE COMPENSATION," "CORPORATE GOVERNANCE—COMPENSATION COMMITTEE INTERLOCKS AND INSIDER PARTICIPATION," "CORPORATE GOVERNANCE—COMPENSATION OF DIRECTORS," "CORPORATE GOVERNANCE—COMPENSATION COMMITTEE REPORT" and "CORPORATE GOVERNANCE—COMMITTEES OF THE BOARD OF DIRECTORS— Compensation Committee—Compensation Risk Considerations" in the definitive proxy statement.
|
Item 12.
|
Security Ownership of Certain Beneficial Owners and Management and Related Stockholder Matters.
|
The information required by this Item 12 is incorporated by reference to the information set forth in the Company's definitive proxy statement, to be filed with the SEC within 120 days after the end of the Company's fiscal year ended
December 31, 2016
pursuant to Regulation 14A under the Exchange Act in connection with our
2017 Annual Meeting of Stockholders
.
Information related to this Item 12 appears under the caption: "STOCK—SECURITY OWNERSHIP OF CERTAIN BENEFICIAL OWNERS AND MANAGEMENT" in the definitive proxy statement.
93
Securities Authorized for Issuance Under Equity Compensation Plans
The following table provides certain information at
December 31, 2016
about Class A common stock that may be issued under our existing equity compensation plans:
|
Plan Category
|
Number of Securities to be Issued Upon Exercise of Outstanding Options, Warrants and Rights
|
Weighted Average Exercise Price of Outstanding Options
|
Number of Securities Remaining Available for Future Issuance Under Equity Compensation Plans (Excluding Securities Reflected in the First Column)
|
|||||||||
|
Equity Compensation Plans Approved by Security Holders
|
6,050,863
|
|
(1)
|
$47.82
|
(2)
|
5,178,082
|
|
(3)
|
||||
|
Equity Compensation Plans Not Approved by Security Holders
|
—
|
|
—
|
|
1,469,195
|
|
(4)
|
|||||
|
Total
|
6,050,863
|
|
$47.82
|
6,647,277
|
|
|||||||
(1) Includes (a) Stock Appreciation Rights ("SARs") to purchase 4,679,347 shares of Class A common stock issued under the LTIP with a weighted average exercise price of $47.82 (calculated on a one-for-one basis), (b) 1,354,485 shares of Class A common stock to be issued or retained, as applicable, upon the vesting of Restricted Stock Units ("RSUs") and Performance Share Units ("PSUs") issued under the LTIP for which no exercise price will be paid (assuming maximum payout of PSU awards) and (c) 17,031 shares of Class A common stock issued pursuant to the ESPP in connection with the October 2016 to December 2016 purchase period (which shares will be issued in January 2017).
(2) The calculation of weighted average exercise price only includes outstanding SARs.
(3) Includes (a)
4,628,349
shares of Class A common stock that remain available for issuance under the LTIP and (b)
549,733
shares of Class A common stock that remain available for issuance pursuant to the ESPP.
(4) Includes (a)
1,169,195
shares of Class A common stock that remain available for issuance pursuant to the DCP and (b)
300,000
shares of Class A common stock that remain available for issuance pursuant to the FRP.
The DCP provides eligible participants employed in the United States with the opportunity to defer a portion of their compensation and receive employer contributions. Compensation deferred under the DCP as well as employer contributions, if any, are credited to a participant’s account under the DCP and are held in a rabbi trust on behalf of the participants. A participant may direct the investment of funds in such participant’s account in certain investment funds. In 2010, certain participants were offered a one-time election to have up to 15% of certain fully vested and nonforfeitable accounts invested in Class A common stock (with the account balances calculated as of June 1, 2010). In connection with such elections, 30,805 shares of Class A common stock were issued to the trustee of the DCP. The number of shares of Class A common stock to be allocated to each electing participant’s account was determined by dividing the dollar amount of such participant’s elected percentage of such participant's account balance by the closing price of Class A common stock on June 2, 2010. The shares of Class A common stock held in such accounts are held in the trust on behalf of the participant until distributed upon termination of employment. Participants’ accounts under the DCP generally are distributed in cash. However, the portion of the participant’s account invested in Class A common stock will be distributed in shares of Class A common stock. The material terms of the FRP are the same as the material terms of the DCP. Participants in the FRP are employees located outside of the United States. Participants in the FRP have not been given an election to invest their accounts in Class A common stock due to international securities law considerations. However, the board of directors has reserved 300,000 shares of Class A common stock for issuance under the FRP in the event that participants in the FRP are given such an election in the future.
Item 13.
Certain Relationships and Related Transactions, and Director Independence.
The information required by this Item 13 is incorporated by reference to the information set forth in the Company's definitive proxy statement, to be filed with the SEC within 120 days after the end of the Company's fiscal year ended
December 31, 2016
pursuant to Regulation 14A under the Exchange Act in connection with our
2017 Annual Meeting of Stockholders
.
Information related to this Item 13 appears under the captions: "CERTAIN RELATIONSHIPS AND RELATED PARTY TRANSACTIONS" and "CORPORATE GOVERNANCE—DIRECTOR INDEPENDENCE" in the definitive proxy statement.
94
|
Item 14.
|
Principal Accountant Fees and Services.
|
The information required by this Item 14 is incorporated by reference to the information set forth in the Company's definitive proxy statement, to be filed with the SEC within 120 days after the end of the Company's fiscal year ended
December 31, 2016
pursuant to Regulation 14A under the Exchange Act in connection with our
2017 Annual Meeting of Stockholders
.
Information related to this Item 14 appears under the caption "INDEPENDENT REGISTERED PUBLIC ACCOUNTING FIRM" in the definitive proxy statement.
95
|
Item 15.
|
Exhibits and Financial Statement Schedule.
|
The following documents are filed as part of this annual report.
|
(a)
|
Financial Statements
|
The following consolidated financial statements are included in this annual report on the pages indicated:
|
|
Page
|
|
F- 1
|
|
|
F- 2
|
|
|
F- 3
|
|
|
F- 4
|
|
|
F- 5
|
|
|
F- 6
|
|
|
F- 7
|
|
|
F- 9
|
|
|
F- 10
|
|
|
(b)
|
Financial Statement Schedule
|
The following financial statement schedule is included in this annual report on the page indicated:
|
(c)
|
Exhibits
|
The Exhibit Index follows Schedule II - Valuation and Qualifying Accounts for the Years Ended
December 31, 2016
,
December 31, 2015
and
December 31, 2014
and is incorporated herein by reference.
|
Item 16.
|
Form 10-K Summary.
|
Omitted at registrant’s option.
96
SIGNATURES
Pursuant to the requirements of Section 13 or 15(d) of the Securities Exchange Act of 1934, the registrant has duly caused this report to be signed on its behalf by the undersigned, thereunto duly authorized.
|
HYATT HOTELS CORPORATION
|
||
|
By:
|
/s/ Mark S. Hoplamazian
|
|
|
|
Mark S. Hoplamazian
|
|
|
President and Chief Executive Officer
|
||
|
Date: February 16, 2017
|
||
Pursuant to the requirements of the Securities Exchange Act of 1934, this report has been signed below by the following persons, on behalf of the registrant and in the capacities and on the dates indicated.
|
Signature
|
Titles
|
Date
|
|
/s/ Mark S. Hoplamazian
|
President, Chief Executive Officer and Director (Principal Executive Officer)
|
February 16, 2017
|
|
Mark S. Hoplamazian
|
||
|
/s/ Patrick J. Grismer
|
Executive Vice President, Chief Financial Officer (Principal Financial Officer)
|
February 16, 2017
|
|
Patrick J. Grismer
|
||
|
/s/ Bradley O'Bryan
|
Senior Vice President, Corporate Controller (Principal Accounting Officer)
|
February 16, 2017
|
|
Bradley O'Bryan
|
||
|
/s/ Thomas J. Pritzker
|
Executive Chairman of the Board
|
February 16, 2017
|
|
Thomas J. Pritzker
|
||
|
/s/ Richard A. Friedman
|
Director
|
February 16, 2017
|
|
Richard A. Friedman
|
||
|
/s/ Susan D. Kronick
|
Director
|
February 16, 2017
|
|
Susan D. Kronick
|
||
|
/s/ Mackey J. McDonald
|
Director
|
February 16, 2017
|
|
Mackey J. McDonald
|
||
|
/s/ Cary D. McMillan
|
Director
|
February 16, 2017
|
|
Cary D. McMillan
|
||
|
/s/ Pamela M. Nicholson
|
Director
|
February 16, 2017
|
|
Pamela M. Nicholson
|
||
|
/s/ Jason Pritzker
|
Director
|
February 16, 2017
|
|
Jason Pritzker
|
||
|
/s/ Michael A. Rocca
|
Director
|
February 16, 2017
|
|
Michael A. Rocca
|
||
|
/s/ Richard C. Tuttle
|
Director
|
February 16, 2017
|
|
Richard C. Tuttle
|
||
|
/s/ James H. Wooten, Jr.
|
Director
|
February 16, 2017
|
|
James H. Wooten, Jr.
|
||
|
/s/ William Wrigley, Jr.
|
Director
|
February 16, 2017
|
|
William Wrigley, Jr.
|
||
97
MANAGEMENT’S REPORT ON
INTERNAL CONTROL OVER FINANCIAL REPORTING
The management of Hyatt Hotels Corporation is responsible for establishing and maintaining adequate internal control over financial reporting as such term is defined in Rules 13a-15(f) and 15d-15(f) under the Securities Exchange Act of 1934, as amended. Hyatt Hotels Corporation’s internal control over financial reporting is designed to provide reasonable assurance regarding the reliability of financial reporting and the preparation of financial statements for external purposes in accordance with generally accepted accounting principles in the United States of America. Our internal control over financial reporting includes those policies and procedures that (1) pertain to the maintenance of records that, in reasonable detail, accurately and fairly reflect the transactions and dispositions of the assets of Hyatt Hotels Corporation; (2) provide reasonable assurance that transactions are recorded as necessary to permit preparation of financial statements in accordance with generally accepted accounting principles, and that receipts and expenditures of Hyatt Hotels Corporation are being made only in accordance with authorizations of Hyatt Hotels Corporation’s management and directors; and (3) provide reasonable assurance regarding prevention or timely detection of unauthorized acquisition, use or disposition of assets of Hyatt Hotels Corporation that could have a material effect on the financial statements.
Because of its inherent limitations, internal control over financial reporting may not prevent or detect misstatements. Also, projections of any evaluation of effectiveness to future periods are subject to the risk that controls may become inadequate because of changes in conditions, or that the degree of compliance with the policies or procedures may deteriorate.
Management assessed the effectiveness of Hyatt Hotels Corporation’s internal control over financial reporting as of
December 31, 2016
. In making this assessment, management used the criteria set forth by the Committee of Sponsoring Organizations of the Treadway Commission (COSO) in
Internal Control—Integrated Framework (2013)
. Based on this assessment, management determined that Hyatt Hotels Corporation maintained effective internal control over financial reporting as of
December 31, 2016
.
Deloitte & Touche LLP, the independent registered public accounting firm that has audited the consolidated financial statements included in this Annual Report on Form 10-K, has issued an attestation report on Hyatt Hotels Corporation’s internal control over financial reporting as of
December 31, 2016
. That report is included in Item 15 of this Annual Report on Form 10-K.
|
/s/ Mark S. Hoplamazian
|
|
Mark S. Hoplamazian
President & Chief Executive Officer
|
|
/s/ Patrick J. Grismer
|
|
Patrick J. Grismer
Executive Vice President, Chief Financial Officer
|
F- 1
REPORT OF INDEPENDENT REGISTERED PUBLIC ACCOUNTING FIRM
To the Board of Directors and Stockholders of
Hyatt Hotels Corporation
Chicago, Illinois
We have audited the accompanying consolidated balance sheets of Hyatt Hotels Corporation and subsidiaries (the "Company") as of December 31, 2016 and 2015, and the related consolidated statements of income, comprehensive income, stockholders’ equity, and cash flows for each of the three years in the period ended December 31, 2016. Our audits also included the financial statement schedule listed in the Index at Item 15. These financial statements and financial statement schedule are the responsibility of the Company’s management. Our responsibility is to express an opinion on the financial statements and financial statement schedule based on our audits.
We conducted our audits in accordance with the standards of the Public Company Accounting Oversight Board (United States). Those standards require that we plan and perform the audit to obtain reasonable assurance about whether the financial statements are free of material misstatement. An audit includes examining, on a test basis, evidence supporting the amounts and disclosures in the financial statements. An audit also includes assessing the accounting principles used and significant estimates made by management, as well as evaluating the overall financial statement presentation. We believe that our audits provide a reasonable basis for our opinion.
In our opinion, such consolidated financial statements present fairly, in all material respects, the financial position of Hyatt Hotels Corporation and subsidiaries as of December 31, 2016 and 2015, and the results of their operations and their cash flows for each of the three years in the period ended December 31, 2016, in conformity with accounting principles generally accepted in the United States of America. Also, in our opinion, such financial statement schedule, when considered in relation to the basic consolidated financial statements taken as a whole, presents fairly, in all material respects, the information set forth therein.
We have also audited, in accordance with the standards of the Public Company Accounting Oversight Board (United States), the Company’s internal control over financial reporting as of December 31, 2016, based on the criteria established in
Internal Control—Integrated Framework (2013)
issued by the Committee of Sponsoring Organizations of the Treadway Commission and our report dated February 16, 2017 expressed an unqualified opinion on the Company’s internal control over financial reporting.
/s/ Deloitte & Touche LLP
Chicago, Illinois
February 16, 2017
F- 2
REPORT OF INDEPENDENT REGISTERED PUBLIC ACCOUNTING FIRM
To the Board of Directors and Stockholders of
Hyatt Hotels Corporation
Chicago, Illinois
We have audited the internal control over financial reporting of Hyatt Hotels Corporation and subsidiaries (the "Company") as of December 31, 2016, based on criteria established in
Internal Control—Integrated Framework (2013)
issued by the Committee of Sponsoring Organizations of the Treadway Commission. The Company’s management is responsible for maintaining effective internal control over financial reporting and for its assessment of the effectiveness of internal control over financial reporting, included in the accompanying Management’s Report on Internal Control Over Financial Reporting. Our responsibility is to express an opinion on the Company’s internal control over financial reporting based on our audit.
We conducted our audit in accordance with the standards of the Public Company Accounting Oversight Board (United States). Those standards require that we plan and perform the audit to obtain reasonable assurance about whether effective internal control over financial reporting was maintained in all material respects. Our audit included obtaining an understanding of internal control over financial reporting, assessing the risk that a material weakness exists, testing and evaluating the design and operating effectiveness of internal control based on the assessed risk, and performing such other procedures as we considered necessary in the circumstances. We believe that our audit provides a reasonable basis for our opinion.
A company’s internal control over financial reporting is a process designed by, or under the supervision of, the company’s principal executive and principal financial officers, or persons performing similar functions, and effected by the company’s board of directors, management, and other personnel to provide reasonable assurance regarding the reliability of financial reporting and the preparation of financial statements for external purposes in accordance with generally accepted accounting principles. A company’s internal control over financial reporting includes those policies and procedures that (1) pertain to the maintenance of records that, in reasonable detail, accurately and fairly reflect the transactions and dispositions of the assets of the company; (2) provide reasonable assurance that transactions are recorded as necessary to permit preparation of financial statements in accordance with generally accepted accounting principles, and that receipts and expenditures of the company are being made only in accordance with authorizations of management and directors of the company; and (3) provide reasonable assurance regarding prevention or timely detection of unauthorized acquisition, use, or disposition of the company’s assets that could have a material effect on the financial statements.
Because of the inherent limitations of internal control over financial reporting, including the possibility of collusion or improper management override of controls, material misstatements due to error or fraud may not be prevented or detected on a timely basis. Also, projections of any evaluation of the effectiveness of the internal control over financial reporting to future periods are subject to the risk that the controls may become inadequate because of changes in conditions, or that the degree of compliance with the policies or procedures may deteriorate.
In our opinion, the Company maintained, in all material respects, effective internal control over financial reporting as of December 31, 2016, based on the criteria established in
Internal Control—Integrated Framework (2013)
issued by the Committee of Sponsoring Organizations of the Treadway Commission.
We have also audited, in accordance with the standards of the Public Company Accounting Oversight Board (United States), the consolidated financial statements and financial statement schedule as of and for the year ended December 31, 2016 of the Company and our report dated February 16, 2017 expressed an unqualified opinion on those consolidated financial statements and financial statement schedule.
/s/ Deloitte & Touche LLP
Chicago, Illinois
February 16, 2017
F- 3
HYATT HOTELS CORPORATION AND SUBSIDIARIES
For the Years Ended
December 31, 2016
,
December 31, 2015
, and
December 31, 2014
(In millions of dollars, except per share amounts)
|
2016
|
2015
|
2014
|
|||||||||
|
REVENUES:
|
|||||||||||
|
Owned and leased hotels
|
$
|
2,108
|
|
$
|
2,079
|
|
$
|
2,246
|
|
||
|
Management and franchise fees
|
448
|
|
427
|
|
387
|
|
|||||
|
Other revenues
|
40
|
|
36
|
|
75
|
|
|||||
|
Other revenues from managed properties
|
1,833
|
|
1,786
|
|
1,707
|
|
|||||
|
Total revenues
|
4,429
|
|
4,328
|
|
4,415
|
|
|||||
|
DIRECT AND SELLING, GENERAL, AND ADMINISTRATIVE EXPENSES:
|
|||||||||||
|
Owned and leased hotels
|
1,610
|
|
1,562
|
|
1,691
|
|
|||||
|
Depreciation and amortization
|
342
|
|
320
|
|
354
|
|
|||||
|
Other direct costs
|
30
|
|
29
|
|
35
|
|
|||||
|
Selling, general, and administrative
|
315
|
|
308
|
|
349
|
|
|||||
|
Other costs from managed properties
|
1,833
|
|
1,786
|
|
1,707
|
|
|||||
|
Direct and selling, general, and administrative expenses
|
4,130
|
|
4,005
|
|
4,136
|
|
|||||
|
Net gains and interest income from marketable securities held to fund operating programs
|
19
|
|
4
|
|
15
|
|
|||||
|
Equity earnings (losses) from unconsolidated hospitality ventures
|
68
|
|
(64
|
)
|
25
|
|
|||||
|
Interest expense
|
(76
|
)
|
(68
|
)
|
(71
|
)
|
|||||
|
Gains (losses) on sales of real estate and other
|
(23
|
)
|
9
|
|
311
|
|
|||||
|
Asset impairments
|
—
|
|
(5
|
)
|
(17
|
)
|
|||||
|
Other income (loss), net
|
2
|
|
(5
|
)
|
(17
|
)
|
|||||
|
INCOME BEFORE INCOME TAXES
|
289
|
|
194
|
|
525
|
|
|||||
|
PROVISION FOR INCOME TAXES
|
(85
|
)
|
(70
|
)
|
(179
|
)
|
|||||
|
NET INCOME
|
204
|
|
124
|
|
346
|
|
|||||
|
NET INCOME ATTRIBUTABLE TO NONCONTROLLING INTERESTS
|
—
|
|
—
|
|
(2
|
)
|
|||||
|
NET INCOME ATTRIBUTABLE TO HYATT HOTELS CORPORATION
|
$
|
204
|
|
$
|
124
|
|
$
|
344
|
|
||
|
EARNINGS PER SHARE—Basic
|
|||||||||||
|
Net income
|
$
|
1.53
|
|
$
|
0.87
|
|
$
|
2.26
|
|
||
|
Net income attributable to Hyatt Hotels Corporation
|
$
|
1.53
|
|
$
|
0.87
|
|
$
|
2.25
|
|
||
|
EARNINGS PER SHARE—Diluted
|
|||||||||||
|
Net income
|
$
|
1.52
|
|
$
|
0.86
|
|
$
|
2.24
|
|
||
|
Net income attributable to Hyatt Hotels Corporation
|
$
|
1.52
|
|
$
|
0.86
|
|
$
|
2.23
|
|
||
See accompanying Notes to consolidated financial statements.
F- 4
HYATT HOTELS CORPORATION AND SUBSIDIARIES
CONSOLIDATED STATEMENTS OF COMPREHENSIVE INCOME
For the Years Ended
December 31, 2016
,
December 31, 2015
, and
December 31, 2014
(In millions of dollars)
|
2016
|
2015
|
2014
|
|||||||||
|
Net income
|
$
|
204
|
|
$
|
124
|
|
$
|
346
|
|
||
|
Other comprehensive income (loss), net of taxes:
|
|||||||||||
|
Foreign currency translation adjustments, net of tax (benefit) expense of $-, $(2), and $1 for the years ended December 31, 2016, December 31, 2015, and December 31, 2014, respectively
|
(42
|
)
|
(102
|
)
|
(93
|
)
|
|||||
|
Unrealized gains (losses) on available-for-sale securities, net of tax (benefit) expense of $(4), $21, and $2 for the years ended December 31, 2016, December 31, 2015, and December 31, 2014, respectively
|
(6
|
)
|
33
|
|
—
|
|
|||||
|
Unrecognized pension cost, net of tax benefit of $-, $-, and $(1) for the years ended December 31, 2016, December 31, 2015, and December 31, 2014, respectively
|
—
|
|
(2
|
)
|
—
|
|
|||||
|
Unrealized gains on derivative activity, net of tax expense of $1, $1, and $1 for the years ended December 31, 2016, December 31, 2015, and December 31, 2014, respectively
|
1
|
|
1
|
|
1
|
|
|||||
|
Other comprehensive loss
|
(47
|
)
|
(70
|
)
|
(92
|
)
|
|||||
|
COMPREHENSIVE INCOME
|
157
|
|
54
|
|
254
|
|
|||||
|
COMPREHENSIVE INCOME ATTRIBUTABLE TO NONCONTROLLING INTERESTS
|
—
|
|
—
|
|
(2
|
)
|
|||||
|
COMPREHENSIVE INCOME ATTRIBUTABLE TO HYATT HOTELS CORPORATION
|
$
|
157
|
|
$
|
54
|
|
$
|
252
|
|
||
See accompanying Notes to consolidated financial statements.
F- 5
HYATT HOTELS CORPORATION AND SUBSIDIARIES
As of
December 31, 2016
and
December 31, 2015
(In millions of dollars, except share and per share amounts)
|
2016
|
2015
|
||||||
|
ASSETS
|
|||||||
|
CURRENT ASSETS:
|
|||||||
|
Cash and cash equivalents
|
$
|
482
|
|
$
|
457
|
|
|
|
Restricted cash
|
76
|
|
96
|
|
|||
|
Short-term investments
|
56
|
|
46
|
|
|||
|
Receivables, net of allowances of $18 and $15 at December 31, 2016 and December 31, 2015, respectively
|
304
|
|
298
|
|
|||
|
Inventories
|
28
|
|
12
|
|
|||
|
Prepaids and other assets
|
153
|
|
152
|
|
|||
|
Prepaid income taxes
|
40
|
|
63
|
|
|||
|
Total current assets
|
1,139
|
|
1,124
|
|
|||
|
Investments
|
186
|
|
327
|
|
|||
|
Property and equipment, net
|
4,270
|
|
4,031
|
|
|||
|
Financing receivables, net of allowances
|
19
|
|
20
|
|
|||
|
Goodwill
|
125
|
|
129
|
|
|||
|
Intangibles, net
|
599
|
|
547
|
|
|||
|
Deferred tax assets
|
313
|
|
301
|
|
|||
|
Other assets
|
1,098
|
|
1,112
|
|
|||
|
TOTAL ASSETS
|
$
|
7,749
|
|
$
|
7,591
|
|
|
|
LIABILITIES AND EQUITY
|
|||||||
|
CURRENT LIABILITIES:
|
|||||||
|
Current maturities of long-term debt
|
$
|
119
|
|
$
|
328
|
|
|
|
Accounts payable
|
162
|
|
141
|
|
|||
|
Accrued expenses and other current liabilities
|
514
|
|
516
|
|
|||
|
Accrued compensation and benefits
|
129
|
|
122
|
|
|||
|
Total current liabilities
|
924
|
|
1,107
|
|
|||
|
Long-term debt
|
1,445
|
|
1,042
|
|
|||
|
Other long-term liabilities
|
1,472
|
|
1,447
|
|
|||
|
Total liabilities
|
3,841
|
|
3,596
|
|
|||
|
Commitments and contingencies (see Note 14)
|
|
|
|||||
|
EQUITY:
|
|||||||
|
Preferred stock, $0.01 par value per share, 10,000,000 shares authorized and none outstanding as of December 31, 2016 and December 31, 2015
|
—
|
|
—
|
|
|||
|
Class A common stock, $0.01 par value per share, 1,000,000,000 shares authorized, 39,952,061 issued and outstanding at December 31, 2016, Class B common stock, $0.01 par value per share, 422,857,621 shares authorized, 90,863,209 shares issued and outstanding at December 31, 2016. Class A common stock, $0.01 par value per share, 1,000,000,000 shares authorized, 26,604,687 issued and outstanding at December 31, 2015, Class B common stock, $0.01 par value per share, 441,623,374 shares authorized, 109,628,962 shares issued and outstanding at December 31, 2015
|
1
|
|
1
|
|
|||
|
Additional paid-in capital
|
1,686
|
|
1,931
|
|
|||
|
Retained earnings
|
2,493
|
|
2,289
|
|
|||
|
Accumulated other comprehensive loss
|
(277
|
)
|
(230
|
)
|
|||
|
Total stockholders’ equity
|
3,903
|
|
3,991
|
|
|||
|
Noncontrolling interests in consolidated subsidiaries
|
5
|
|
4
|
|
|||
|
Total equity
|
3,908
|
|
3,995
|
|
|||
|
TOTAL LIABILITIES AND EQUITY
|
$
|
7,749
|
|
$
|
7,591
|
|
|
See accompanying Notes to consolidated financial statements.
F- 6
HYATT HOTELS CORPORATION AND SUBSIDIARIES
For the Years Ended
December 31, 2016
,
December 31, 2015
, and
December 31, 2014
(In millions of dollars)
|
2016
|
2015
|
2014
|
|||||||||
|
CASH FLOWS FROM OPERATING ACTIVITIES:
|
|||||||||||
|
Net income
|
$
|
204
|
|
$
|
124
|
|
$
|
346
|
|
||
|
Adjustments to reconcile net income to net cash provided by operating activities:
|
|||||||||||
|
Depreciation and amortization
|
342
|
|
320
|
|
354
|
|
|||||
|
Amortization of share awards
|
26
|
|
26
|
|
52
|
|
|||||
|
Deferred income taxes
|
(3
|
)
|
(103
|
)
|
(28
|
)
|
|||||
|
Equity (earnings) losses from unconsolidated hospitality ventures and distributions received
|
(33
|
)
|
100
|
|
54
|
|
|||||
|
(Gains) losses on sales of real estate and other
|
23
|
|
(9
|
)
|
(311
|
)
|
|||||
|
Other
|
(38
|
)
|
55
|
|
(18
|
)
|
|||||
|
Increase (decrease) in cash attributable to changes in assets and liabilities:
|
|
|
|
||||||||
|
Restricted cash
|
(4
|
)
|
78
|
|
(18
|
)
|
|||||
|
Receivables, net
|
(14
|
)
|
29
|
|
(28
|
)
|
|||||
|
Inventories
|
2
|
|
1
|
|
8
|
|
|||||
|
Prepaid income taxes
|
21
|
|
(16
|
)
|
(53
|
)
|
|||||
|
Accounts payable, accrued expenses and other current liabilities
|
7
|
|
(7
|
)
|
186
|
|
|||||
|
Accrued compensation and benefits
|
7
|
|
5
|
|
(9
|
)
|
|||||
|
Other long-term liabilities
|
10
|
|
1
|
|
(19
|
)
|
|||||
|
Other, net
|
(61
|
)
|
(66
|
)
|
(43
|
)
|
|||||
|
Net cash provided by operating activities
|
489
|
|
538
|
|
473
|
|
|||||
(Continued)
See accompanying Notes to consolidated financial statements.
F- 7
HYATT HOTELS CORPORATION AND SUBSIDIARIES
CONSOLIDATED STATEMENTS OF CASH FLOWS
For the Years Ended
December 31, 2016
,
December 31, 2015
, and
December 31, 2014
(In millions of dollars)
|
2016
|
2015
|
2014
|
||||||||||
|
CASH FLOWS FROM INVESTING ACTIVITIES:
|
||||||||||||
|
Purchases of marketable securities and short-term investments
|
$
|
(464
|
)
|
$
|
(530
|
)
|
$
|
(421
|
)
|
|||
|
Proceeds from marketable securities and short-term investments
|
457
|
|
521
|
|
320
|
|
||||||
|
Contributions to investments
|
(107
|
)
|
(37
|
)
|
(114
|
)
|
||||||
|
Return of investments
|
132
|
|
19
|
|
57
|
|
||||||
|
Acquisitions, net of cash acquired
|
(492
|
)
|
(3
|
)
|
(548
|
)
|
||||||
|
Capital expenditures
|
(211
|
)
|
(269
|
)
|
(253
|
)
|
||||||
|
Issuance of financing receivables
|
(38
|
)
|
(8
|
)
|
(5
|
)
|
||||||
|
Proceeds from financing receivables
|
38
|
|
28
|
|
56
|
|
||||||
|
Proceeds from sales of real estate and other, net of cash disposed
|
289
|
|
88
|
|
1,467
|
|
||||||
|
Sales proceeds transferred to escrow as restricted cash
|
—
|
|
—
|
|
(870
|
)
|
||||||
|
Sales proceeds transferred from escrow to cash and cash equivalents
|
29
|
|
143
|
|
714
|
|
||||||
|
(Increase) decrease in restricted cash
|
(6
|
)
|
19
|
|
(8
|
)
|
||||||
|
Other investing activities
|
(7
|
)
|
(18
|
)
|
(22
|
)
|
||||||
|
Net cash (used in) provided by investing activities
|
(380
|
)
|
(47
|
)
|
373
|
|
||||||
|
CASH FLOWS FROM FINANCING ACTIVITIES:
|
||||||||||||
|
Proceeds from long-term debt, net of issuance costs of $4, $-, and $-, respectively
|
620
|
|
12
|
|
249
|
|
||||||
|
Repayments of long-term debt
|
(438
|
)
|
(5
|
)
|
(208
|
)
|
||||||
|
Repurchase of common stock
|
(272
|
)
|
(715
|
)
|
(443
|
)
|
||||||
|
Repayment of capital lease obligation
|
—
|
|
—
|
|
(191
|
)
|
||||||
|
Other financing activities
|
(6
|
)
|
(7
|
)
|
(14
|
)
|
||||||
|
Net cash used in financing activities
|
(96
|
)
|
(715
|
)
|
(607
|
)
|
||||||
|
EFFECT OF EXCHANGE RATE CHANGES ON CASH AND CASH EQUIVALENTS
|
12
|
|
(4
|
)
|
(8
|
)
|
||||||
|
NET INCREASE (DECREASE) IN CASH AND CASH EQUIVALENTS
|
25
|
|
(228
|
)
|
231
|
|
||||||
|
CASH AND CASH EQUIVALENTS—BEGINNING OF YEAR
|
457
|
|
685
|
|
454
|
|
||||||
|
CASH AND CASH EQUIVALENTS—END OF PERIOD
|
$
|
482
|
|
$
|
457
|
|
$
|
685
|
|
|||
|
SUPPLEMENTAL DISCLOSURE OF CASH FLOW INFORMATION:
|
||||||||||||
|
Cash paid during the period for interest
|
$
|
75
|
|
$
|
69
|
|
$
|
71
|
|
|||
|
Cash paid during the period for income taxes
|
$
|
95
|
|
$
|
145
|
|
$
|
267
|
|
|||
|
Non-cash investing and financing activities are as follows:
|
||||||||||||
|
Non-cash contributions to investments
|
$
|
13
|
|
$
|
17
|
|
$
|
—
|
|
|||
|
Non-cash management and franchise agreement intangibles
|
$
|
47
|
|
$
|
3
|
|
$
|
—
|
|
|||
|
Change in accrued capital expenditures
|
$
|
2
|
|
$
|
6
|
|
$
|
4
|
|
|||
(Concluded)
See accompanying Notes to consolidated financial statements.
F- 8
HYATT HOTELS CORPORATION AND SUBSIDIARIES
CONSOLIDATED STATEMENTS OF CHANGES IN STOCKHOLDERS’ EQUITY
For the Years Ended
December 31, 2016
,
December 31, 2015
, and
December 31, 2014
(In millions of dollars)
|
Total
|
Common Stock Amount
|
Additional Paid-in Capital
|
Retained Earnings
|
Treasury Stock Amount
|
Accumulated Other Comprehensive Loss
|
Noncontrolling Interests in Consolidated Subsidiaries
|
|||||||||||||||||||||
|
BALANCE—January 1, 2014
|
$
|
4,777
|
|
$
|
2
|
|
$
|
3,015
|
|
$
|
1,821
|
|
$
|
(1
|
)
|
$
|
(68
|
)
|
$
|
8
|
|
||||||
|
Total comprehensive income
|
254
|
|
—
|
|
—
|
|
344
|
|
—
|
|
(92
|
)
|
2
|
|
|||||||||||||
|
Disposals of shares in noncontrolling interests
|
(4
|
)
|
—
|
|
—
|
|
—
|
|
—
|
|
—
|
|
(4
|
)
|
|||||||||||||
|
Repurchase of common stock
|
(445
|
)
|
—
|
|
(445
|
)
|
—
|
|
—
|
|
—
|
|
—
|
|
|||||||||||||
|
Directors compensation
|
2
|
|
—
|
|
2
|
|
—
|
|
—
|
|
—
|
|
—
|
|
|||||||||||||
|
Employee stock plan issuance
|
3
|
|
—
|
|
3
|
|
—
|
|
—
|
|
—
|
|
—
|
|
|||||||||||||
|
Share-based payment activity
|
45
|
|
—
|
|
45
|
|
—
|
|
—
|
|
—
|
|
—
|
|
|||||||||||||
|
Other
|
(1
|
)
|
1
|
|
(2
|
)
|
|||||||||||||||||||||
|
BALANCE—December 31, 2014
|
$
|
4,631
|
|
$
|
2
|
|
$
|
2,621
|
|
$
|
2,165
|
|
$
|
(1
|
)
|
$
|
(160
|
)
|
$
|
4
|
|
||||||
|
Total comprehensive income
|
54
|
|
—
|
|
—
|
|
124
|
|
—
|
|
(70
|
)
|
—
|
|
|||||||||||||
|
Repurchase of common stock
|
(715
|
)
|
(1
|
)
|
(714
|
)
|
—
|
|
—
|
|
—
|
|
—
|
|
|||||||||||||
|
Directors compensation
|
2
|
|
—
|
|
2
|
|
—
|
|
—
|
|
—
|
|
—
|
|
|||||||||||||
|
Employee stock plan issuance
|
3
|
|
—
|
|
3
|
|
—
|
|
—
|
|
—
|
|
—
|
|
|||||||||||||
|
Share-based payment activity
|
20
|
|
—
|
|
19
|
|
—
|
|
1
|
|
—
|
|
—
|
|
|||||||||||||
|
BALANCE—December 31, 2015
|
$
|
3,995
|
|
$
|
1
|
|
$
|
1,931
|
|
$
|
2,289
|
|
$
|
—
|
|
$
|
(230
|
)
|
$
|
4
|
|
||||||
|
Total comprehensive income
|
157
|
|
—
|
|
—
|
|
204
|
|
—
|
|
(47
|
)
|
—
|
|
|||||||||||||
|
Contributions from noncontrolling interests
|
1
|
|
—
|
|
—
|
|
—
|
|
—
|
|
—
|
|
1
|
|
|||||||||||||
|
Repurchase of common stock
|
(272
|
)
|
—
|
|
(272
|
)
|
—
|
|
—
|
|
—
|
|
—
|
|
|||||||||||||
|
Directors compensation
|
2
|
|
—
|
|
2
|
|
—
|
|
—
|
|
—
|
|
—
|
|
|||||||||||||
|
Employee stock plan issuance
|
3
|
|
—
|
|
3
|
|
—
|
|
—
|
|
—
|
|
—
|
|
|||||||||||||
|
Share-based payment activity
|
22
|
|
—
|
|
22
|
|
—
|
|
—
|
|
—
|
|
—
|
|
|||||||||||||
|
BALANCE—December 31, 2016
|
$
|
3,908
|
|
$
|
1
|
|
$
|
1,686
|
|
$
|
2,493
|
|
$
|
—
|
|
$
|
(277
|
)
|
$
|
5
|
|
||||||
See accompanying Notes to consolidated financial statements.
F- 9
HYATT HOTELS CORPORATION AND SUBSIDIARIES
NOTES TO CONSOLIDATED FINANCIAL STATEMENTS
(amounts in millions, unless otherwise indicated)
1
. ORGANIZATION
Hyatt Hotels Corporation, a Delaware corporation, and its consolidated subsidiaries (collectively "Hyatt Hotels Corporation") provide hospitality services on a worldwide basis through the development, ownership, operation, management, franchising, and licensing of hospitality related businesses. We develop, own, operate, manage, franchise, license or provide services to a portfolio of properties consisting of full service hotels, select service hotels, resorts and other properties, including timeshare, fractional and other forms of residential or vacation properties. At
December 31, 2016
, (i) we operated or franchised
315
full service hotels, comprising
123,117
rooms throughout the world, (ii) we operated or franchised
342
select service hotels, comprising
48,016
rooms, of which
313
hotels are located in the United States, and (iii) our portfolio of properties included
6
franchised all inclusive Hyatt-branded resorts, comprising
2,401
rooms. At
December 31, 2016
our portfolio of properties operated in
56
countries around the world.
As used in these Notes, the terms "Company," "we," "us," or "our" mean Hyatt Hotels Corporation and its consolidated subsidiaries.
As used in these Notes, the term "Pritzker family business interests" means (1) various lineal descendants of Nicholas J. Pritzker (deceased) and spouses and adopted children of such descendants; (2) various trusts for the benefit of the individuals described in clause (1) and trustees thereof; and (3) various entities owned and/or controlled, directly and/or indirectly, by the individuals and trusts described in (1) and (2).
2
. SUMMARY OF SIGNIFICANT ACCOUNTING POLICIES
Principles of Consolidation
—The consolidated financial statements present the results of operations, financial position, and cash flows of Hyatt Hotels Corporation and its majority owned and controlled subsidiaries. All intercompany accounts and transactions have been eliminated in consolidation.
Use of Estimates
—We are required to make estimates and assumptions that affect the amounts reported in the consolidated financial statements and accompanying Notes. Actual results could differ materially from such estimated amounts.
Revenue Recognition
—Our revenues are primarily derived from the following sources and are generally recognized when services have been rendered:
|
•
|
Owned and leased hotels revenues are derived from room rentals and services provided at our owned and leased properties and are recorded when rooms are occupied and services have been rendered. Sales and occupancy taxes are recorded on a net basis in the
consolidated statements of income
.
|
|
•
|
Management and franchise fees earned from hotels managed and franchised worldwide:
|
|
–
|
Management fees primarily consist of a base fee, which is generally computed as a percentage of gross revenues, and an incentive fee, which is generally computed based on a hotel profitability measure. Base fee revenues are recognized when earned in accordance with the terms of the contract. We recognize incentive fees that would be due as if the contract were to terminate at that date, exclusive of any termination fees payable or receivable by us.
|
|
–
|
Realized gains from the sale of hotel real estate assets where we maintain substantial continuing involvement in the form of a
long-
term management contract are deferred and recognized as management fee revenue over the term of the underlying management contract.
|
|
–
|
Franchise fees consist of an initial application fee and continuing royalty fees calculated based on a percentage of gross room revenues and in certain circumstances, food and beverage revenues and are recognized as the fees are earned and become due from the franchisee and when all material services or conditions relating to the sale have been substantially performed or satisfied by the franchisor.
|
|
•
|
Other revenues:
|
|
–
|
Other revenues include revenues from our co-branded credit card. We recognize revenue from our co-branded credit card upon: (1) the sale of points to our third-party partner and (2) the fulfillment or expiration of a card member's promotional awards. We receive fees from our third-party partner upon activation of each credit card once the card member reaches a specified level of spend, which we defer until the associated promotional nights awarded are redeemed or expired.
|
F- 10
|
–
|
Other revenues also include revenues from our vacation ownership business, earned through the date of the sale of the business in the fourth quarter of 2014. Prior to the sale, we recognized vacation ownership revenue when a minimum of 10% of the purchase price for the interval had been received, the period of cancellation with refund had expired, and receivables were deemed collectible. For sales that did not qualify for full revenue recognition, as the project had progressed beyond the preliminary stages, but had not yet reached completion, all revenue and associated direct expenses were initially deferred and recognized in earnings through the
percentage-
of-
completion method. In periods subsequent to the sale of the business, we earn license fees that are recorded to management and franchise fees on our consolidated statements of income.
|
|
•
|
Other revenues from managed properties represent the reimbursement of costs incurred on behalf of the owners of hotel properties we manage. These costs relate primarily to payroll costs at managed properties where we are the employer, as well as reservations, marketing and technology costs. Since the reimbursements are made based upon the costs incurred with no added margin, these revenues and corresponding expenses have no effect on our net income.
|
Cash Equivalents
—We consider all highly liquid investments purchased with an original maturity of three months or less at the date of purchase to be cash equivalents.
Restricted Cash
—We had restricted cash of
$76 million
and
$96 million
at
December 31, 2016
and
December 31, 2015
, respectively, which includes:
|
•
|
$40 million
and
$70 million
, respectively, related to sales proceeds from the 2014 dispositions of two Canadian hotels, as the Canadian tax regulations require a portion of the proceeds be classified as restricted until completion of regulatory review (see Note
7
);
|
|
•
|
$14 million
and
$13 million
, respectively, related to debt service on bonds acquired in connection with the acquisition of the entity that owned Grand Hyatt San Antonio (see Note
9
); in addition, we have
$11 million
and
$10 million
, respectively, recorded in other assets; and
|
|
•
|
$9 million
and
$7 million
, respectively, related to our captive insurance subsidiary for minimum capital and surplus requirements in accordance with local insurance regulations (see Note
14
).
|
The remaining restricted cash balances of
$13 million
and
$6 million
at December 31,
2016
and
December 31, 2015
, respectively, relate to escrow deposits on construction projects and other arrangements. These amounts are invested in
interest-
bearing accounts.
Investments
—We have investments in unconsolidated hospitality ventures recorded under the equity and cost methods. These investments are an integral part of our business and are strategically and operationally important to our overall results. We assess investments in unconsolidated hospitality ventures for impairment quarterly. When there is indication a loss in value has occurred, we evaluate the carrying value in comparison to the estimated fair value of the investment. Fair value is based upon internally developed discounted cash flow models, third-party appraisals, and if appropriate, current estimated net sales proceeds from pending offers. The principal factors used in the discounted cash flow analysis requiring judgment are the projected future cash flows, the discount rates and the capitalization rate assumptions. Our estimates of projected future cash flows are based on historical data, various internal estimates and a variety of external sources, and are developed as part of our routine, long-term planning process. If the estimated fair value is less than carrying value, we use our judgment to determine if the decline in value is other than temporary. In determining this, we consider factors including, but not limited to, the length of time and extent of the decline, loss of value as a percentage of the cost, financial condition and near-term financial projections, our intent and ability to recover the lost value and current economic conditions. Impairments deemed other than temporary are charged to equity earnings (losses) from unconsolidated hospitality ventures or other income (loss), net on our consolidated statements of income. For additional information about investments, see Note
3
.
Marketable Securities
—Our investments in marketable securities consist of various types of mutual funds, preferred shares, time deposits, common stock and fixed income securities, including U.S. government obligations, obligations of other government agencies, corporate debt, mortgage-backed and asset-backed securities and municipal and provincial notes and bonds and are classified as either trading, AFS or held-to-maturity ("HTM").
|
•
|
Trading securities—recorded at fair value based on listed market prices or dealer price quotations where available. Realized gains and losses on trading securities are reflected in net gains and interest income from marketable securities held to fund operating programs on our consolidated statements of income.
|
|
•
|
AFS securities—recorded at fair value as described in Note 4. Unrealized gains and losses on AFS securities are reported as part of accumulated other comprehensive loss on the consolidated balance sheets. Realized gains and losses on AFS securities are recognized in
other income (loss), net
on our consolidated statements of income.
|
F- 11
|
•
|
HTM securities—debt security investments which we have the ability to hold until maturity and are recorded at amortized cost.
|
AFS and HTM securities are assessed for impairment quarterly. To determine if an impairment is other than temporary, we consider the duration and severity of the loss position, the strength of the underlying collateral, the term to maturity, credit rating and our intent to sell. For debt securities that are deemed other than temporarily impaired and there is no intent to sell, impairments are separated into the amount related to the credit loss, which is typically recorded in
other income (loss), net
on our
consolidated statements of income
and the amount related to all other factors, which is recorded in accumulated other comprehensive loss on our consolidated balance sheets. For debt securities that are deemed other than temporarily impaired and there is intent to sell, impairments in their entirety are recorded on our
consolidated statements of income
. For additional information about marketable securities, see Note
4
.
Foreign Currency
—The functional currency of our consolidated entities located outside the United States of America is generally the local currency. The assets and liabilities of these entities are translated into U.S. dollars at
year-
end exchange rates, and the related gains and losses, net of applicable deferred income taxes, are reflected in accumulated other comprehensive loss on the consolidated balance sheets. Gains and losses from foreign currency transactions are included in earnings. Gains and losses from foreign exchange rate changes related to intercompany receivables and payables of a
long-
term nature are generally included in accumulated other comprehensive loss. Gains and losses from foreign exchange rate movement related to intercompany receivables and payables that are not
long-
term are included in earnings.
Financing Receivables
—Financing arrangements represent contractual rights to receive money either on demand or on fixed or determinable dates and are recognized on our consolidated balance sheets at amortized cost in current and
long-
term receivables. We recognize interest income as earned and provide an allowance for cancellations and defaults. Our financing receivables are composed of individual unsecured loans and other types of unsecured financing arrangements provided to hotel owners. These financing receivables have stated maturities and interest rates, however, the repayment terms vary and may be dependent upon future cash flows of the hotel.
On an ongoing basis, we monitor the credit quality of our financing receivables based on payment activity. We determine our financing to hotel owners to be non-performing if interest or principal is greater than 90 days past due based on the contractual terms of the individual financing receivables, if an impairment charge is recorded for a loan, or if a provision is established for our other financing arrangements. If we consider a financing receivable to be non-performing, we place the financing receivable on non-accrual status.
We individually assess all loans within financing receivables for impairment quarterly. This assessment is based on an analysis of several factors including current economic conditions and industry trends, as well as the specific risk characteristics of these loans including capital structure, loan performance, market factors, and the underlying hotel performance. When it is probable that we will be unable to collect all amounts due in accordance with the contractual terms of the individual loan agreement or if projected future cash flows available for repayment of unsecured receivables indicate there is a collection risk, we measure the impairment based on the present value of projected future cash flows discounted at the loan’s effective interest rate. For impaired loans, we establish a specific loan loss reserve for the difference between the recorded investment in the loan and the estimated fair value.
In addition to loans, we include other types of financing arrangements in unsecured financing to hotel owners which we do not assess individually for impairment. We regularly evaluate our reserves for these other financing arrangements.
We write off financing to hotel owners when we determine the receivables are uncollectible and when all commercially reasonable means of recovering the receivable balances have been exhausted.
We recognize interest income when received for impaired loans and financing receivables on non-accrual status which is recorded to other income (loss), net in the accompanying consolidated statements of income. Accrual of interest income is resumed when the receivable becomes contractually current and collection doubts are removed. For additional information about financing receivables, see Note
6
.
Accounts Receivable
—Our accounts receivable primarily consist of trade receivables due from guests for services rendered at our owned and leased properties and from hotel owners with whom we have management and franchise agreements for services rendered and for reimbursements of costs incurred on behalf of managed and franchised properties. We record an accounts receivable reserve when losses are probable, based on an assessment of past collection activity and current business conditions.
Inventories
—Inventories are comprised of operating supplies and equipment that have a period of consumption of two years or less, and food and beverage items at our owned and leased hotels which are generally valued at the lower of cost (
first-
F- 12
in,
first-
out) or market. Inventories also include residential inventories, which include two building structures containing luxury villas and the associated land. Inventories are carried at the lower of cost or net realizable value.
Property and Equipment and
Definite-
Lived Intangibles
—Property and equipment and definite-lived intangibles are stated at cost, including interest incurred during development and construction periods, less accumulated depreciation and amortization. Depreciation and amortization are recognized over the estimated useful lives of the assets, primarily on the
straight-
line method.
Useful lives assigned to property and equipment are as follows:
|
Buildings and improvements
|
10-50 years
|
|
Leasehold improvements
|
The shorter of the lease term or useful life of asset
|
|
Furniture and equipment
|
3-20 years
|
|
Computers
|
3-7 years
|
Useful lives assigned to definite-lived intangibles are as follows:
|
Management and franchise agreement intangibles
|
Initial term of management or franchise agreement
|
|
Lease related intangibles
|
Lease term
|
|
Advanced booking intangibles
|
Period of the advanced bookings
|
We assess property and equipment and definite-lived intangibles for impairment quarterly. When events or circumstances indicate the carrying amount may not be recoverable, we evaluate the net book value of the assets for impairment by comparison to the projected undiscounted future cash flows of the assets. The principal factor used in the undiscounted cash flow analysis requiring judgment is the projected future operating cash flows, which are based on historical data, various internal estimates and a variety of external resources, and are developed as part of our routine, long-term planning process.
If the projected undiscounted future cash flows are less than the net book value of the assets, the fair value is determined based upon internally developed discounted cash flows of the assets, third-party appraisals, and if appropriate, current estimated net sales proceeds from pending offers. The principal factors used in the discounted cash flow analysis requiring judgment are the projected future cash flows, the discount rates and the capitalization rate assumptions. The excess of the net book value over the estimated fair value is charged to asset impairments within our consolidated statements of income.
We evaluate the carrying value of our property and equipment and definite-lived intangibles based on our plans, at the time, for such assets and consider qualitative factors such as future development in the surrounding area, status of local competition and any significant adverse changes in the business climate. Changes to our plans, including a decision to dispose of or change the intended use of an asset, may have a material impact on the carrying value of the asset.
For additional information about property and equipment and definite-lived intangibles, see Notes
5
and
8
, respectively.
Acquisitions
—Assets acquired and liabilities assumed in business combinations are recorded on our consolidated balance sheets as of the respective acquisition dates based upon their estimated fair values, see Note
7
. The results of operations of businesses acquired by us have been included in the consolidated statements of income since their respective dates of acquisition. In certain circumstances, the purchase price allocations are based upon preliminary estimates and assumptions. Accordingly, the allocations are subject to revision when we receive final information, including appraisals and other analyses.
Under the supervision of management, independent third-party valuation specialists estimate the fair value of our properties acquired using various recognized valuation methods including the income approach, the cost approach, and the sales comparison approach, which are primarily based on Level Three assumptions. Assumptions utilized in determining the fair value under these approaches include, but are not limited to, historical financial results when applicable, projected cash flows, discount rates, capitalization rates, current market conditions and comparable transactions. The fair value is then allocated to tangible and intangibles assets with any remaining value assigned to goodwill, if applicable. Various assumptions are used when determining the value to allocate to each identifiable asset, including, discount rates, royalty rates, timing of future cash flows and a variety of external sources. When we acquire the remaining ownership interest in or the property from an unconsolidated hospitality venture in a step acquisition, we estimate the fair value of our equity interest using the assumed cash proceeds we would receive from sale to a third party at a market sales price, which is determined using the aforementioned fair value methodologies and assumptions.
F- 13
Guarantees
—We enter into performance guarantees related to certain hotels we manage. We also enter into debt repayment guarantees with respect to certain hotels we manage or franchise, typically in which we also hold an equity investment. We record a liability for the fair value of these performance and debt repayment guarantees at their inception date. In order to estimate fair value we use a Monte Carlo simulation to model the probability of possible outcomes. The valuation methodology requires that we make certain assumptions and judgments regarding: discount rates, volatility, hotel operating results and hotel property sales prices. The fair value is not re-valued due to future changes in assumptions. The corresponding offset depends on the circumstances in which the guarantee was issued and is recorded to investments, intangibles or expense. We amortize the liability for the fair value of a guarantee into income over the term of the guarantee using a systematic and rational, risk-based approach. Performance guarantees and debt repayment guarantees related to our managed or franchised hotels are amortized into income in other income (loss), net in the consolidated statements of income and debt repayment guarantees that relate to our unconsolidated hospitality ventures are amortized into equity earnings (losses) from unconsolidated hospitality ventures in the consolidated statements of income. On a quarterly basis, we evaluate the likelihood of funding under a guarantee. To the extent we determine an obligation to fund under a guarantee is both probable and estimable based upon performance during the period, we record a separate contingent liability in other income (loss), net or equity earnings (losses) from unconsolidated hospitality ventures. For additional information about guarantees, see Note
14
.
Goodwill
—Goodwill represents the future economic benefits arising from other assets acquired in a business combination that are not individually identified and separately recognized. As required, we evaluate goodwill for impairment on an annual basis, and do so during the fourth quarter of each year using balances as of October 1 and at an interim date if indications of impairment exist. Goodwill impairment is determined by comparing the fair value of a reporting unit to its carrying amount. This is done either by performing a qualitative assessment or proceeding to the two-step process, with an impairment being recognized only where the fair value of the reporting unit is less than its carrying value. In any given year we can elect to perform a qualitative assessment to determine whether it is more likely than not that the fair value of a reporting unit is in excess of its carrying value. If it is not more likely than not that the fair value is in excess of the carrying value, or we elect to bypass the qualitative assessment, we proceed to the two-step process.
When determining fair value, we utilize internally developed discounted future cash flow models, third-party appraisals and, if appropriate, current estimated net sales proceeds from pending offers. Under the discounted cash flow approach we utilize various assumptions requiring judgment, including projected future cash flows, discount rates and capitalization rates. Our estimates of projected future cash flows are based on historical data, various internal estimates and a variety of external sources, and are developed as part of our routine,
long-
term planning process. We then compare the estimated fair value to our carrying value. If the carrying value is in excess of the fair value, we must determine our implied fair value of goodwill to measure if any impairment charge is necessary. The determination of our implied fair value of goodwill requires the allocation of the reporting unit’s estimated fair value to the individual assets and liabilities of the reporting unit as if we had completed a business combination. We perform the allocation based on our knowledge of the reporting unit, the market in which they operate, and our overall knowledge of the hospitality industry. Changes in our allocation approach could result in different measures of implied fair value and impact the final impairment charge, if any. The excess of the carrying value over the implied fair value is recorded to asset impairments within our consolidated statements of income. For additional information about goodwill, see Note
8
.
Income Taxes
—We account for income taxes to recognize the amount of taxes payable or refundable for the current year and the amount of deferred tax assets and liabilities resulting from the future tax consequences of differences between the financial statements and tax basis of the respective assets and liabilities. We recognize the financial statement effect of a tax position when, based on the technical merits of the uncertain tax position, it is more likely than not to be sustained on a review by taxing authorities. These estimates are based on judgments made with currently available information. We review these estimates and make changes to recorded amounts of uncertain tax positions as facts and circumstances warrant. For additional information about income taxes, see Note
13
.
Fair Value
—We apply the provisions of fair value measurement to various financial instruments, which we measure at fair value on a recurring basis, and to various financial and nonfinancial assets and liabilities, which we measure at fair value on a nonrecurring basis. We disclose the fair value of our financial assets and liabilities based on observable market information where available, or on market participant assumptions. These assumptions are subjective in nature, involve matters of judgment, and, therefore, fair values cannot always be determined with precision. When determining fair value, we maximize the use of observable inputs and minimize the use of unobservable inputs. The three levels of the hierarchy are as follows:
Level One—Fair values based on unadjusted quoted prices in active markets for identical assets and liabilities;
Level Two—Fair values based on quoted market prices for similar assets and liabilities in active markets, quoted prices in inactive markets for identical assets and liabilities, and inputs other than quoted market prices that are observable for the asset or liability; and
F- 14
Level Three—Fair values based on inputs that cannot be corroborated by observable market data and reflect the use of significant management judgment. Valuation techniques could include the use of discounted cash flow models and similar techniques.
We typically utilize the market approach and income approach for valuing our financial instruments. The market approach utilizes prices and information generated by market transactions involving identical or similar assets and liabilities and the income approach uses valuation techniques to convert future amounts (for example, cash flows or earnings) to a single present amount (discounted). For instances in which the inputs used to measure fair value fall into different levels of the fair value hierarchy, the fair value measurement has been determined based on the lowest level input that is significant to the fair value measurement in its entirety. Our assessment of the significance of a particular input to the fair value measurement requires judgment and may affect the classification of fair value assets and liabilities within the fair value hierarchy.
The carrying values of cash and cash equivalents, accounts receivable and accounts payable approximate fair value due to the
short-
term nature of these items and their close proximity to maturity. The carrying value of restricted cash approximates fair value. The fair value of marketable securities is discussed in Note
4
; the fair value of financing receivables is discussed in Note
6
; the fair value of our business combinations is discussed in Note
7
; the fair value of
long-
term debt is discussed in Note
9
; and the fair value of our guarantee liabilities is discussed in Note
14
.
Stock-Based Compensation
—As part of our LTIP, we award SARs, RSUs, PSs and PSUs to certain employees and directors:
|
•
|
SARs
—Each vested SAR gives the holder the right to the difference between the value of one share of our Class A common stock at the exercise date and the value of one share of our Class A common stock at the grant date. Vested SARs can be exercised over their life as determined in accordance with the LTIP. All SARs have a 10-year contractual term, are settled in shares of our Class A common stock and are accounted for as equity instruments.
|
We record the compensation expense for SARs on a straight-line basis from the date of grant. The exercise price of these SARs is the fair value of our common stock at the grant date, based on a valuation of the Company prior to the IPO, or the closing share price on the date of grant (as applicable).
|
•
|
RSUs
—Each vested RSU will be settled by delivery of a single share of our Class A common stock with the exception of insignificant portions of the March 2016, March 2015, February 2014, March 2013, and June 2013 awards which will be settled in cash. The value of the RSUs is based upon the fair value of our common stock at the grant date, based upon a valuation of the Company prior to IPO, or the closing stock price of our Class A common stock for the December 2009 award and all subsequent awards. Awards issued prior to our November 2009 IPO are deferred in nature and will be settled once all tranches of the award have fully vested or otherwise as provided in the relevant agreements, while all awards issued in December 2009 and later will be settled as each individual tranche vests under the relevant agreements.
|
We record compensation expense over the requisite service period of the individual grantee. In certain situations we also grant cash-settled RSUs which are recorded as a liability instrument.
|
•
|
PSs
—The Company has granted PSs to certain executive officers. The number of PSs that will ultimately vest with no further restrictions on transfer depends upon the performance of the Company at the end of the applicable three year performance period relative to the applicable performance target. The PSs vest in full if the maximum performance metric is achieved, and generally subject to continued employment through the applicable performance period. At the end of the performance period, the PSs that do not vest will be forfeited. The PSs will vest at the end of the performance period only if the performance threshold is met and continued service requirements are satisfied; there is no interim performance metric except in the case of certain change in control transactions.
|
|
•
|
PSUs
—The Company has granted PSUs to certain executive officers. PSUs vest and are settled in Class A common stock based upon the performance of the Company through the end of the applicable three year performance period relative to the applicable performance target, and generally subject to continued employment through the applicable performance period. The PSUs will vest at the end of the performance period only if the performance threshold is met and continued service requirements are satisfied; there is no interim performance metric except in the case of certain change in control transactions.
|
For additional information about stock-based compensation, see Note 16.
Hyatt Gold Passport
—We operate the Program through the Hyatt Gold Passport Fund (the "Fund") for the benefit of the Hyatt portfolio of properties owned, operated, managed, licensed or franchised by us during the period of their participation in the Program. The Fund has been established to provide for the payment of operating expenses and redemption of member awards associated with the Program.
F- 15
We charge the cost of operating the Program, including the estimated cost of award redemption, to the properties based on members’ qualified expenditures. Due to the requirements under the Program that the properties reimburse us for the Program’s operating costs, we recognize this revenue from properties at the time such costs are incurred and expensed. We defer revenue received from the properties equal to the actuarially determined estimate of our future redemption obligation. Upon the redemption of points, we recognize the previously deferred revenue and recognize the corresponding expense relating to the cost of the awards redeemed. Revenue is recognized by the properties when the points are redeemed, and expenses are recognized when the points are earned by the members.
We actuarially determine the estimate of the future redemption obligation based on statistical formulas that project the timing of future point redemption based on historical experience, including an estimate of the breakage for points that will never be redeemed, and an estimate of the points that will eventually be redeemed. Actual expenditures for the Program may differ from the actuarially determined liability.
The Fund is financed by payments from the properties and returns on marketable securities. The Fund invests amounts received from the properties in marketable securities which are included in other current and noncurrent assets (see Note
4
). The noncurrent liabilities of the Fund are included in other long-term liabilities (see Note
12
). Assets and liabilities of the Fund are as follows:
|
December 31, 2016
|
December 31, 2015
|
||||||
|
Current Assets
|
$
|
150
|
|
$
|
179
|
|
|
|
Noncurrent Assets
|
296
|
|
280
|
|
|||
|
Total Assets
|
$
|
446
|
|
$
|
459
|
|
|
|
Current Liabilities
|
$
|
150
|
|
$
|
179
|
|
|
|
Noncurrent Liabilities
|
296
|
|
280
|
|
|||
|
Total Liabilities
|
$
|
446
|
|
$
|
459
|
|
|
The current liabilities include
$139 million
and
$166 million
recorded in accrued expenses and other current liabilities on the consolidated balance sheets at
December 31, 2016
and
December 31, 2015
, respectively.
Recently Issued Accounting Pronouncements
Adopted Accounting Standards
In April 2015, the Financial Accounting Standards Board ("FASB") released ASU 2015-03, which requires debt issuance costs related to a recognized debt liability be presented in the balance sheet as a direct deduction from the carrying amount of the debt liability, consistent with debt discounts. The provisions of ASU 2015-03 are effective for interim periods and fiscal years beginning after December 15, 2015. We adopted the standard on January 1, 2016, and as a result we reclassified
$5 million
of debt issuance costs previously included in other assets to long-term debt on our consolidated balance sheets as of December 31, 2015.
Future Adoption of Accounting Standards
In May 2014, the FASB released ASU 2014-09, which supersedes the revenue recognition requirements in
Topic 605, Revenue Recognition
, and provides a single, comprehensive revenue recognition model for contracts with customers. In August 2015, the FASB released Accounting Standards Update No. 2015-14 ("ASU 2015-14"),
Revenue from Contracts with Customers (Topic 606): Deferral of the Effective Date
. ASU 2015-14 delays the effective date of ASU 2014-09 by one year, making it effective for interim periods and fiscal years beginning after December 15, 2017, with early adoption permitted as of the original effective date under ASU 2014-09.
The standard permits the use of either the retrospective or modified retrospective (cumulative effect) transition method and we have not yet selected which transition method we will apply. While we continue to evaluate possible impacts on our consolidated financial statements, ASU 2014-09 is expected to impact either the amount or timing of revenue recognition as follows:
|
•
|
Under existing guidance, gains on sales of real estate when we maintain substantial continuing involvement are deferred and amortized into management and franchise fee revenues. Upon adoption of ASU 2014-09, gains on sales of real estate assets will be recognized when control of the property transfers to the buyer. We expect any remaining unamortized deferred gains as of our date of adoption will be included as an adjustment to equity. For the
|
F- 16
year ended December 31, 2016, Hyatt recognized
$21 million
of management fee revenue related to the amortization of deferred gains.
|
•
|
Under existing guidance, amortization of management and franchise agreement intangibles is recorded within depreciation and amortization on our consolidated statements of income. Upon adoption of ASU 2014-09, management and franchise agreement intangibles may meet the definition of consideration paid to a customer and therefore, could be recorded as contra-revenue within management and franchise fees on our consolidated statements of income.
|
|
•
|
Under existing guidance, incentive fees are recognized in the amount that would be due as if the contract were to terminate at that date. Under ASU 2014-09, variable consideration is included in the transaction price only if it is probable that a significant reversal in the cumulative amount of revenue recognized would not occur when the uncertainty associated with the variable consideration is subsequently resolved. This may result in a different pattern of recognition for incentive fees for certain contracts.
|
|
•
|
Under existing guidance, franchise application fees are recognized at a point in time. Upon adoption of ASU 2014-09, initial franchise application fees will be recognized over time.
|
We do not expect the standard to materially affect the amount or timing of revenue recognition for royalty fees from our franchised properties or base management fees from our managed properties. We are continuing to evaluate other possible impacts to our consolidated financial statements, including the impact related to Hyatt Gold Passport.
In January 2016, the FASB released Accounting Standards Update No. 2016-01 ("ASU 2016-01"),
Financial Instruments - Overall (Subtopic 825-10): Recognition and Measurement of Financial Assets and Financial Liabilities
. ASU 2016-01 revises the accounting for equity investments and financial liabilities under the fair value option and the presentation and disclosure requirements for financial instruments. The provisions of ASU 2016-01 are effective for interim periods and fiscal years beginning after December 15, 2017. We are currently evaluating the impact of adopting ASU 2016-01.
In February 2016, the FASB released Accounting Standards Update No. 2016-02 ("ASU 2016-02"),
Leases (Topic 842)
. ASU 2016-02 requires lessees to record lease contracts on the balance sheet by recognizing a right-of-use asset and lease liability. The provisions of ASU 2016-02 are effective for interim periods and fiscal years beginning after December 15, 2018, with early adoption permitted. We are currently evaluating the impact of adopting ASU 2016-02.
In June 2016, the FASB released Accounting Standards Update No. 2016-13 ("ASU 2016-13"),
Financial Instruments - Credit Losses (Topic 326): Measurement of Credit Losses on Financial Instruments
. ASU 2016-13 replaces the existing impairment model for most financial assets from an incurred loss impairment model to a current expected credit loss model, which requires an entity to recognize an impairment allowance equal to its current estimate of all contractual cash flows the entity does not expect to collect. ASU 2016-13 also requires credit losses relating to AFS debt securities to be recorded through an allowance for credit losses. The provisions of ASU 2016-13 are effective for interim periods and fiscal years beginning after December 15, 2019, with early adoption permitted. We are currently evaluating the impact of adopting ASU 2016-13.
In October 2016, the FASB released Accounting Standards Update No. 2016-16 ("ASU 2016-16"),
Income Taxes (Topic 740): Intra-Entity Transfers of Assets Other Than Inventory
. ASU 2016-16 requires an entity to recognize the income tax consequences of an intra-entity transfer of an asset other than inventory when the transfer occurs. The provisions of ASU 2016-16 are effective for interim periods and fiscal years beginning after December 15, 2017, with early adoption permitted. We are currently evaluating the impact of adopting ASU 2016-16.
3
. EQUITY AND COST METHOD INVESTMENTS
|
December 31, 2016
|
December 31, 2015
|
||||||
|
Equity method investments
|
$
|
180
|
|
$
|
304
|
|
|
|
Cost method investments
|
6
|
|
23
|
|
|||
|
Total investments
|
$
|
186
|
|
$
|
327
|
|
|
Of our total investment balance at
December 31, 2016
and
December 31, 2015
,
$186 million
and
$311 million
, respectively, was recorded in our owned and leased hotels segment.
F- 17
The carrying values and ownership percentages of our unconsolidated investments in hospitality ventures accounted for under the equity method were as follows:
|
|
Ownership Interests
|
Investment Balance
|
||||||||
|
December 31, 2016
|
December 31, 2015
|
|||||||||
|
Juniper Hotels Private Limited
|
50.0
|
%
|
$
|
37
|
|
$
|
44
|
|
||
|
Playa Hotels & Resorts B.V.
|
23.7
|
%
|
23
|
|
28
|
|
||||
|
San Jose Hotel Partners, L.L.C.
|
40.0
|
%
|
15
|
|
12
|
|
||||
|
Four One Five, L.L.C.
|
49.0
|
%
|
15
|
|
5
|
|
||||
|
Rio Preto Partners SARL
|
70.0
|
%
|
14
|
|
7
|
|
||||
|
Desarrolladora Hotel Acueducto S. de R.L. de C.V.
|
50.0
|
%
|
13
|
|
15
|
|
||||
|
Hotel Hoyo Uno, S. de R.L. de C.V.
|
40.0
|
%
|
13
|
|
14
|
|
||||
|
Hotel Am Belvedere GmbH & Co KG
|
50.0
|
%
|
12
|
|
—
|
|
||||
|
Wailea Hotel Holdings, L.L.C. (See Note 7)
|
—
|
%
|
—
|
|
125
|
|
||||
|
Other
|
38
|
|
54
|
|
||||||
|
Total
|
$
|
180
|
|
$
|
304
|
|
||||
The following tables present summarized financial information for all unconsolidated hospitality ventures in which we hold an investment accounted for under the equity method.
|
|
Years Ended December 31,
|
||||||||||
|
2016
|
2015
|
2014
|
|||||||||
|
Total revenues
|
$
|
1,229
|
|
$
|
1,079
|
|
$
|
1,192
|
|
||
|
Gross operating profit
|
398
|
|
312
|
|
329
|
|
|||||
|
Income from continuing operations
|
160
|
|
33
|
|
31
|
|
|||||
|
Net income
|
160
|
|
33
|
|
31
|
|
|||||
|
December 31, 2016
|
December 31, 2015
|
||||||
|
Current Assets
|
$
|
443
|
|
$
|
472
|
|
|
|
Noncurrent Assets
|
2,701
|
|
2,877
|
|
|||
|
Total Assets
|
$
|
3,144
|
|
$
|
3,349
|
|
|
|
Current Liabilities
|
$
|
385
|
|
$
|
625
|
|
|
|
Noncurrent Liabilities
|
2,037
|
|
1,752
|
|
|||
|
Total Liabilities
|
$
|
2,422
|
|
$
|
2,377
|
|
|
During 2016, we had the following activity:
|
•
|
We purchased our partners' interests in Andaz Maui at Wailea Resort and villas. The transaction was accounted for as a step acquisition and we recorded a gain of
$14 million
in equity earnings (losses) from unconsolidated hospitality ventures on our consolidated statements of income in our owned and leased hotels segment. See Note
7
for further discussion of our acquisition.
|
|
•
|
We sold our ownership interest in an equity method investment within our owned and leased hotels segment for which we received proceeds of
$4 million
. We recorded a gain of
$3 million
in equity earnings (losses) from unconsolidated hospitality ventures on our consolidated statements of income.
|
|
•
|
Two unconsolidated hospitality ventures in which we hold or held an ownership interest and which are classified as equity method investments within our owned and leased hotels segment, sold
five
Hyatt Place hotels, for which we received combined proceeds of
$15 million
. We recorded gains of
$7 million
in equity earnings (losses) from unconsolidated hospitality ventures on our consolidated statements of income.
|
F- 18
During 2015, we had the following activity:
|
•
|
Unconsolidated hospitality ventures in which we hold or held an ownership interest, which are classified as equity method investments within our owned and leased hotels segment sold
two
Hyatt Place hotels for which we received proceeds of
$16 million
. We recorded gains of
$13 million
in equity earnings (losses) from unconsolidated hospitality ventures on our consolidated statements of income.
|
|
•
|
We sold an entity which held an interest in one of our foreign currency denominated equity method investments within our owned and leased hotels segment, for which we received proceeds of
$3 million
. In connection with the sale, we released
$21 million
of accumulated foreign currency translation losses, which was recorded to equity earnings (losses) from unconsolidated hospitality ventures on our consolidated statements of income.
|
During 2014, we had the following activity:
|
•
|
We purchased Hyatt Regency Lost Pines Resort and Spa and adjacent land from an unconsolidated hospitality venture in which we held an
8.2%
interest, for a net purchase price of approximately
$164 million
. This transaction was accounted for as a step acquisition and we recorded a gain of
$12 million
in equity earnings (losses) from unconsolidated hospitality ventures on our consolidated statements of income in our owned and leased hotels segment. See Note
7
for further discussion of our acquisition.
|
|
•
|
Unconsolidated hospitality ventures in which we held an ownership interest and which were classified as equity method investments within our owned and leased hotels segment, sold the following hotels to third parties, resulting in deferred gains that are being amortized over the term of the management agreements in management and franchise fees within the Americas management and franchising segment:
|
|
•
|
A Hyatt Place hotel, for which we received proceeds of
$12 million
and recorded a deferred gain of
$10 million
; and
|
|
•
|
Hyatt Regency DFW International Airport and another building, for which we received proceeds of
$19 million
and recorded a deferred gain of
$18 million
.
|
|
•
|
Unconsolidated hospitality ventures in which we held an ownership interest and which were classified as equity method investments within our owned and leased hotels segment, sold
two
Hyatt Place hotels, for which we received proceeds of
$33 million
. We recorded gains of
$22 million
in equity earnings (losses) from unconsolidated hospitality ventures on our consolidated statements of income.
|
During
2016
,
2015
and
2014
we recorded
$9 million
,
$0
and
$3 million
, respectively, in impairment charges in equity earnings (losses) from unconsolidated hospitality ventures. The impairment charges in 2016 relate to four unconsolidated hospitality ventures which are accounted for as equity method investments.
4
. MARKETABLE SECURITIES
We hold marketable securities to fund certain operating programs and for investment purposes. We periodically transfer cash and cash equivalents to time deposits, highly liquid and transparent commercial paper, corporate notes and bonds, and U.S. government obligations and obligations of other government agencies for investment purposes.
Marketable Securities Held to Fund Operating Programs
—Marketable securities held to fund operating programs, which are recorded at fair value and included on the consolidated balance sheets, were as follows:
|
December 31, 2016
|
December 31, 2015
|
||||||
|
Marketable securities held by Hyatt Gold Passport Fund (Note 2)
|
$
|
394
|
|
$
|
384
|
|
|
|
Marketable securities held to fund deferred compensation plans held in rabbi trusts (Note 11)
|
352
|
|
333
|
|
|||
|
Marketable securities held to fund our captive insurance companies
|
65
|
|
82
|
|
|||
|
Total marketable securities held to fund operating programs
|
$
|
811
|
|
$
|
799
|
|
|
|
Less current portion of marketable securities held to fund operating programs included in cash and cash equivalents, short-term investments, and prepaids and other assets
|
(109
|
)
|
(121
|
)
|
|||
|
Marketable securities held to fund operating programs included in other assets
|
$
|
702
|
|
$
|
678
|
|
|
F- 19
Net gains and interest income from marketable securities held to fund operating programs on the
consolidated statements of income
included realized and unrealized gains and losses and interest income related to the following:
|
Years Ended December 31,
|
|||||||||||
|
2016
|
2015
|
2014
|
|||||||||
|
Hyatt Gold Passport Fund
|
$
|
2
|
|
$
|
1
|
|
$
|
3
|
|
||
|
Deferred compensation plans held in rabbi trusts
|
17
|
|
3
|
|
12
|
|
|||||
|
Total net gains and interest income from marketable securities held to fund operating programs
|
$
|
19
|
|
$
|
4
|
|
$
|
15
|
|
||
Our captive insurance companies hold marketable securities which are classified as AFS and are invested in U.S. government agencies, time deposits and corporate debt securities. We classify these investments as current or long-term, based on their contractual maturity dates, which range from 2017 through 2021.
Marketable Securities Held for Investment Purposes
—Marketable securities held for investment purposes, which are recorded at fair value and included on the consolidated balance sheets, were as follows:
|
December 31, 2016
|
December 31, 2015
|
||||||
|
Interest bearing money market funds
|
$
|
106
|
|
$
|
5
|
|
|
|
Time deposits
|
45
|
|
30
|
|
|||
|
Preferred shares
|
290
|
|
335
|
|
|||
|
Total marketable securities held for investment purposes
|
$
|
441
|
|
$
|
370
|
|
|
|
Less current portion of marketable securities held for investment purposes included in cash and cash equivalents and short-term investments
|
(151
|
)
|
(35
|
)
|
|||
|
Marketable securities held for investment purposes included in other assets
|
$
|
290
|
|
$
|
335
|
|
|
Fair Value
—We measured the following financial assets at fair value on a recurring basis:
|
December 31, 2016
|
Cash and Cash Equivalents
|
Short-term Investments
|
Prepaids and Other Assets
|
Other Assets
|
|||||||||||||||
|
Level One - Quoted Prices in Active Markets for Identical Assets
|
|||||||||||||||||||
|
Interest bearing money market funds
|
$
|
114
|
|
$
|
114
|
|
$
|
—
|
|
$
|
—
|
|
$
|
—
|
|
||||
|
Mutual funds
|
352
|
|
—
|
|
—
|
|
—
|
|
352
|
|
|||||||||
|
Level Two - Significant Other Observable Inputs
|
|||||||||||||||||||
|
Time deposits
|
59
|
|
—
|
|
46
|
|
—
|
|
13
|
|
|||||||||
|
U.S. government obligations
|
142
|
|
—
|
|
—
|
|
33
|
|
109
|
|
|||||||||
|
U.S. government agencies
|
53
|
|
—
|
|
9
|
|
8
|
|
36
|
|
|||||||||
|
Corporate debt securities
|
181
|
|
—
|
|
1
|
|
35
|
|
145
|
|
|||||||||
|
Mortgage-backed securities
|
22
|
|
—
|
|
—
|
|
5
|
|
17
|
|
|||||||||
|
Asset-backed securities
|
34
|
|
—
|
|
—
|
|
8
|
|
26
|
|
|||||||||
|
Municipal and provincial notes and bonds
|
5
|
|
—
|
|
—
|
|
1
|
|
4
|
|
|||||||||
|
Level Three - Significant Unobservable Inputs
|
|||||||||||||||||||
|
Preferred Shares
|
290
|
|
—
|
|
—
|
|
—
|
|
290
|
|
|||||||||
|
Total
|
$
|
1,252
|
|
$
|
114
|
|
$
|
56
|
|
$
|
90
|
|
$
|
992
|
|
||||
F- 20
|
December 31, 2015
|
Cash and Cash Equivalents
|
Short-term Investments
|
Prepaids and Other Assets
|
Other Assets
|
|||||||||||||||
|
Level One - Quoted Prices in Active Markets for Identical Assets
|
|||||||||||||||||||
|
Interest bearing money market funds
|
$
|
18
|
|
$
|
18
|
|
$
|
—
|
|
$
|
—
|
|
$
|
—
|
|
||||
|
Mutual funds
|
333
|
|
—
|
|
—
|
|
—
|
|
333
|
|
|||||||||
|
Level Two - Significant Other Observable Inputs
|
|||||||||||||||||||
|
Time deposits
|
45
|
|
—
|
|
38
|
|
—
|
|
7
|
|
|||||||||
|
U.S. government obligations
|
131
|
|
—
|
|
—
|
|
32
|
|
99
|
|
|||||||||
|
U.S. government agencies
|
83
|
|
—
|
|
6
|
|
10
|
|
67
|
|
|||||||||
|
Corporate debt securities
|
168
|
|
—
|
|
2
|
|
36
|
|
130
|
|
|||||||||
|
Mortgage-backed securities
|
26
|
|
—
|
|
—
|
|
6
|
|
20
|
|
|||||||||
|
Asset-backed securities
|
27
|
|
—
|
|
—
|
|
7
|
|
20
|
|
|||||||||
|
Municipal and provincial notes and bonds
|
3
|
|
—
|
|
—
|
|
1
|
|
2
|
|
|||||||||
|
Level Three - Significant Unobservable Inputs
|
|||||||||||||||||||
|
Preferred shares
|
335
|
|
—
|
|
—
|
|
—
|
|
335
|
|
|||||||||
|
Total
|
$
|
1,169
|
|
$
|
18
|
|
$
|
46
|
|
$
|
92
|
|
$
|
1,013
|
|
||||
During the years ended
December 31, 2016
and
December 31, 2015
, there were no transfers between levels of the fair value hierarchy. Our policy is to recognize transfers in and transfers out as of the end of each quarterly reporting period. We currently do not have
non-
financial assets or
non-
financial liabilities required to be measured at fair value on a recurring basis.
We invest a portion of our cash into
short-
term interest bearing money market funds that have a maturity of less than 90 days. Consequently, the balances are recorded in cash and cash equivalents. The funds are held with
open-
ended registered investment companies, and the fair value of the funds is classified as Level One as we are able to obtain market available pricing information on an ongoing basis. The fair value of our mutual funds is classified as Level One as they trade with sufficient frequency and volume to enable us to obtain pricing information on an ongoing basis. Time deposits are recorded at par value, which approximates fair value and are classified as Level Two. The remaining securities, other than our investment in preferred shares, are classified as Level Two due to the use and weighting of multiple market inputs being considered in the final price of the security. Market inputs include quoted market prices from active markets for identical securities, quoted market prices for identical securities in inactive markets, and quoted market prices in active and inactive markets for similar securities.
Preferred shares—
During the year ended December 31, 2013, we invested
$271 million
in Playa for redeemable, convertible preferred shares. We have the option to convert our preferred shares and any accrued and unpaid paid in kind ("PIK") dividends thereon into shares of common stock at any time through the later of the second anniversary of the closing of our investment or upon an initial public offering by Playa. The preferred investment is redeemable at our option in August 2021. In the event of a potential future Playa IPO or other equity issuance by Playa, we have the option to request that Playa redeem up to
$125 million
of preferred shares at par plus any accrued and unpaid PIK dividends thereon. As a result, we have classified the preferred investment as an AFS debt security, which is re-measured quarterly at fair value through other comprehensive loss on the consolidated balance sheets. The fair value of the preferred shares was:
|
|
2016
|
2015
|
|||||
|
Fair value at January 1
|
$
|
335
|
|
$
|
280
|
|
|
|
Gross unrealized gains
|
19
|
|
55
|
|
|||
|
Gross unrealized losses
|
(29
|
)
|
—
|
|
|||
|
Realized losses
|
(6
|
)
|
—
|
|
|||
|
Interest income
|
12
|
|
—
|
|
|||
|
Cash redemption
|
(41
|
)
|
—
|
|
|||
|
Fair value at December 31
|
$
|
290
|
|
$
|
335
|
|
|
F- 21
In October 2016, Playa redeemed
3,458,530
of our preferred shares plus accrued and unpaid PIK dividends thereon for
$41 million
. In conjunction with the redemption, we recorded
$12 million
of interest income and
$6 million
of realized losses in other income (loss), net on our consolidated statements of income. The realized losses were the result of a difference between the fair value of the initial investment and the contractual redemption price of
$8.40
per share.
On December 13, 2016, Playa announced that it entered into a definitive business combination agreement with Pace, a special-purpose acquisition company. Prior to announcing the Pace business combination, Playa publicly filed a Registration Statement on Form S-1 with the SEC in conjunction with its proposed IPO of common shares. In connection with the Pace business combination or potential future Playa IPO, we expect a portion of the cash proceeds would be used for a partial or full redemption of Playa's preferred shares. There is no assurance Playa will complete the Pace business combination or a potential future IPO.
Due to the lack of availability of market data, the preferred shares are classified as Level Three. At December 31, 2015, we estimated the fair value of the Playa preferred shares using an option-pricing model. As a result of Playa's potential Pace business combination or potential future Playa IPO, we revised our valuation approach to utilize a hybrid of the option-pricing model and the probability-weighted expected return method, to estimate the fair value of Playa's preferred shares. The hybrid model includes various scenarios, such as the successful completion of the Pace business combination, potential future Playa IPO with assumptions around conversion and redemption, as well as a scenario using the option-pricing model. We assigned a probability to each scenario to arrive at the estimated fair value at
December 31, 2016
. Our scenarios include assumptions regarding (i) the successful completion of the Pace business combination, (ii) a potential range of IPO prices and size of the offering, and (iii) conversion of up to
$50 million
of our preferred shares into common shares of Playa. The option-pricing model scenario includes assumptions regarding the expected term, risk-free interest rate over the expected term, volatility, dividend yield and enterprise value. Financial forecasts were used in the computation of the enterprise value using the income approach, based on assumed revenue growth rates and operating margin levels. The risks associated with achieving these forecasts were assessed in selecting the appropriate weighted-average cost of capital.
The option-pricing scenarios include variations of the expected term, risk-free interest rate, volatility, and dividend yield assumptions as follows:
|
December 31, 2016
|
December 31, 2015
|
||||
|
Expected term
|
1 year
|
|
0.75 years
|
|
|
|
Risk-free Interest Rate
|
0.85
|
%
|
0.57
|
%
|
|
|
Volatility
|
46.5
|
%
|
46.0
|
%
|
|
|
Dividend Yield
|
12.0
|
%
|
12.0
|
%
|
|
There is inherent uncertainty in our assumptions and fluctuations in these assumptions or the probabilities assigned to each scenario may result in different estimates of fair value. At
December 31, 2016
, the assumption which most significantly impacted the fair value of the preferred shares is the assignment of probabilities to each potential scenario. A change to the assigned probabilities may cause the fair value to decrease up to
$4 million
and increase up to
$64 million
, representing the difference between the low and high end of the range of fair values based on each scenario.
HTM Debt Securities
—At
December 31, 2016
and
December 31, 2015
, we had investments in HTM debt securities of
$27 million
and
$25 million
, respectively, which are investments in third-party entities that own certain of our hotels. The amortized cost of our investments approximates fair value. The securities are mandatorily redeemable between 2020 and 2025.
F- 22
5
. PROPERTY AND EQUIPMENT, NET
|
December 31, 2016
|
December 31, 2015
|
||||||
|
Land
|
$
|
901
|
|
$
|
674
|
|
|
|
Buildings
|
4,125
|
|
3,898
|
|
|||
|
Leasehold improvements
|
202
|
|
220
|
|
|||
|
Furniture, equipment and computers
|
1,316
|
|
1,209
|
|
|||
|
Construction in progress
|
90
|
|
251
|
|
|||
|
6,634
|
|
6,252
|
|
||||
|
Accumulated depreciation
|
(2,364
|
)
|
(2,221
|
)
|
|||
|
Total property and equipment, net
|
$
|
4,270
|
|
$
|
4,031
|
|
|
Depreciation expense was as follows:
|
|
Years Ended December 31,
|
||||||||||
|
2016
|
2015
|
2014
|
|||||||||
|
Depreciation expense
|
$
|
315
|
|
$
|
289
|
|
$
|
324
|
|
||
The net book value of capital leased assets at
December 31, 2016
and
December 31, 2015
was
$12 million
and
$13 million
, respectively, which is net of accumulated depreciation of
$10 million
and
$8 million
, respectively.
Interest capitalized as a cost of property and equipment was
$3 million
,
$6 million
and
$7 million
for the years ended
December 31, 2016
,
December 31, 2015
and
December 31, 2014
, respectively, and was recorded net in interest expense. The years ended
December 31, 2016
,
December 31, 2015
and
December 31, 2014
included
$0
,
$5 million
and
$13 million
respectively, of asset impairments on the consolidated statements of income in our owned and leased hotels segment.
6
. FINANCING RECEIVABLES
|
December 31, 2016
|
December 31, 2015
|
||||||
|
Unsecured financing to hotel owners
|
119
|
|
120
|
|
|||
|
Less allowance for losses
|
(100
|
)
|
(98
|
)
|
|||
|
Less current portion included in receivables, net
|
—
|
|
(2
|
)
|
|||
|
Total long-term financing receivables, net
|
$
|
19
|
|
$
|
20
|
|
|
During the year ended
December 31, 2015
, all of our outstanding secured financing receivables to hotel owners were settled. We received net cash proceeds of
$26 million
, an unsecured financing receivable of
$6 million
, and preferred equity investments of
$7 million
. The preferred equity investments include a
$6 million
HTM debt security, which is recorded in Americas management and franchising segment, and a
$1 million
cost method investment. The settlements of the secured financing receivables resulted in a net recovery of
$8 million
, which was recognized in other income (loss), net on our consolidated statements of income during the year ended
December 31, 2015
.
F- 23
Allowance for Losses and Impairments
—
The following tables summarize the activity in our financing receivables allowance:
|
Secured Financing
|
Unsecured Financing
|
Total
|
|||||||||
|
Allowance at January 1, 2016
|
$
|
—
|
|
$
|
98
|
|
$
|
98
|
|
||
|
Provisions
|
—
|
|
10
|
|
10
|
|
|||||
|
Write-offs
|
—
|
|
(8
|
)
|
(8
|
)
|
|||||
|
Allowance at December 31, 2016
|
$
|
—
|
|
$
|
100
|
|
$
|
100
|
|
||
|
Secured Financing
|
Unsecured Financing
|
Total
|
|||||||||
|
Allowance at January 1, 2015
|
$
|
13
|
|
$
|
87
|
|
$
|
100
|
|
||
|
Provisions
|
3
|
|
7
|
|
10
|
|
|||||
|
Write-offs
|
(1
|
)
|
—
|
|
(1
|
)
|
|||||
|
Recoveries
|
(9
|
)
|
—
|
|
(9
|
)
|
|||||
|
Other adjustments
|
(6
|
)
|
4
|
|
(2
|
)
|
|||||
|
Allowance at December 31, 2015
|
$
|
—
|
|
$
|
98
|
|
$
|
98
|
|
||
During the year ended
December 31, 2014
, we recorded insignificant provisions for secured financing to hotel owners and provisions of
$6 million
for unsecured financing to hotel owners.
Credit Monitoring
—
Our unsecured financing receivables were as follows:
|
December 31, 2016
|
|||||||||||||||
|
|
Gross Loan Balance (Principal and Interest)
|
Related Allowance
|
Net Financing Receivables
|
Gross Receivables on Non-Accrual Status
|
|||||||||||
|
Loans
|
$
|
13
|
|
$
|
—
|
|
$
|
13
|
|
$
|
—
|
|
|||
|
Impaired loans (1)
|
56
|
|
(56
|
)
|
—
|
|
56
|
|
|||||||
|
Total loans
|
69
|
|
(56
|
)
|
13
|
|
56
|
|
|||||||
|
Other financing arrangements
|
50
|
|
(44
|
)
|
6
|
|
44
|
|
|||||||
|
Total unsecured financing receivables
|
$
|
119
|
|
$
|
(100
|
)
|
$
|
19
|
|
$
|
100
|
|
|||
(1) The unpaid principal balance was
$43 million
and the average recorded loan balance was
$57 million
at
December 31, 2016
.
|
December 31, 2015
|
|||||||||||||||
|
|
Gross Loan Balance (Principal and Interest)
|
Related Allowance
|
Net Financing Receivables
|
Gross Receivables on Non-Accrual Status
|
|||||||||||
|
Loans
|
$
|
15
|
|
$
|
—
|
|
$
|
15
|
|
$
|
—
|
|
|||
|
Impaired loans (2)
|
58
|
|
(58
|
)
|
—
|
|
58
|
|
|||||||
|
Total loans
|
73
|
|
(58
|
)
|
15
|
|
58
|
|
|||||||
|
Other financing arrangements
|
47
|
|
(40
|
)
|
7
|
|
40
|
|
|||||||
|
Total unsecured financing receivables
|
$
|
120
|
|
$
|
(98
|
)
|
$
|
22
|
|
$
|
98
|
|
|||
Fair Value
—
We estimated the fair value of financing receivables which are classified as Level Three in the fair value hierarchy to be approximately
$19 million
and
$22 million
at
December 31, 2016
and
December 31, 2015
, respectively.
F- 24
7
. ACQUISITIONS AND DISPOSITIONS
Acquisitions
Andaz Maui at Wailea Resort
—We previously held a
65.7%
interest and had a
$180 million
investment in the entities that own Andaz Maui at Wailea Resort and villas prior to acquisition. Accordingly, we accounted for the investment as an unconsolidated hospitality venture under the equity method. During the year ended
December 31, 2016
, we purchased the remaining
34.3%
for a net purchase price of approximately
$136 million
, net of
$12 million
of cash acquired. This transaction was accounted for as a step acquisition and we recorded a gain of
$14 million
in equity earnings (losses) from unconsolidated hospitality ventures on our consolidated statements of income. The purchase of the remaining
34.3%
interest was structured and identified as replacement property in a potential reverse like-kind exchange. In conjunction with the acquisition, the outstanding debt at the unconsolidated hospitality venture was repaid in full and we were released from our debt repayment guarantee obligation, see Note
14
.
The following table summarizes the fair value of the identifiable assets acquired and liabilities assumed, which are recorded in our owned and leased hotels segment at the date of acquisition:
|
Cash and cash equivalents
|
$
|
12
|
|
|
Receivables
|
3
|
|
|
|
Inventories
|
13
|
|
|
|
Prepaids and other assets
|
1
|
|
|
|
Property and equipment
|
323
|
|
|
|
Total assets
|
$
|
352
|
|
|
Current liabilities
|
10
|
|
|
|
Total liabilities
|
$
|
10
|
|
|
Total net assets acquired
|
$
|
342
|
|
Land Held for Development
—During the year ended
December 31, 2016
, we acquired land of
$25 million
from an unrelated third party with the intent to develop a hotel in Philadelphia.
Royal Palms Resort and Spa
—During the year ended
December 31, 2016
, we acquired Royal Palms Resort and Spa in Phoenix, Arizona, from an unrelated third party for a net purchase price of approximately
$86 million
, net of
$2 million
of proration adjustments. Due to the iconic nature of the hotel, we retained the Royal Palms Resort and Spa name and added the hotel to The Unbound Collection by Hyatt. Of the
$88 million
purchase price, assets acquired and recorded in our owned and leased hotels segment consist of
$75 million
of property and equipment,
$9 million
of indefinite-lived brand intangibles, and
$1 million
of advanced bookings intangibles. We also recorded
$3 million
of management agreement intangibles in our Americas management and franchising segment, which are being amortized over a useful life of
20
years. The purchase of Royal Palms Resort and Spa was structured and identified as replacement property in a potential reverse like-kind exchange agreement.
The Confidante Miami Beach
—During the year ended
December 31, 2016
, we acquired Thompson Miami Beach for a purchase price of approximately
$238 million
, from a seller indirectly owned by a limited partnership affiliated with the brother of our Executive Chairman. Of the
$238 million
purchase price, assets acquired consist of
$228 million
of property and equipment, which was recorded in our owned and leased hotels segment, and
$10 million
of management agreement intangibles, which were recorded in our Americas management and franchising segment and are being amortized over a useful life of
20
years. We rebranded this hotel as The Confidante Miami Beach and added the hotel to The Unbound Collection by Hyatt. The purchase of The Confidante Miami Beach was structured and identified as replacement property in a potential reverse like-kind exchange agreement, but the allowable period to complete the exchange expired during the fourth quarter of 2016.
Hyatt Regency Lost Pines Resort and Spa
—We previously held an
8.2%
interest in the entity which owned Hyatt Regency Lost Pines Resort and Spa and adjacent land. Accordingly, we accounted for the investment as an unconsolidated hospitality venture under the equity method. During the year ended
December 31, 2014
, we purchased the hotel and adjacent land from the unconsolidated hospitality venture for a net purchase price of approximately
$164 million
. As part of the acquisition, we assumed debt of
$69 million
, which included a
$3 million
debt premium (see Note
9
). This transaction was accounted for as a step acquisition and we recorded a gain of
$12 million
in equity earnings (losses) from unconsolidated hospitality ventures on our consolidated statements of income.
F- 25
The following table summarizes the fair value of the identifiable assets acquired and liabilities assumed, which are recorded in our owned and leased hotels segment at the date of acquisition:
|
Cash and cash equivalents
|
$
|
7
|
|
|
Receivables
|
4
|
|
|
|
Inventories
|
1
|
|
|
|
Property and equipment
|
207
|
|
|
|
Goodwill
|
17
|
|
|
|
Intangibles
|
4
|
|
|
|
Deferred tax assets
|
1
|
|
|
|
Total assets
|
$
|
241
|
|
|
Current portion of long-term debt
|
$
|
4
|
|
|
Current liabilities
|
8
|
|
|
|
Long-term debt
|
65
|
|
|
|
Total liabilities
|
77
|
|
|
|
Total net assets acquired
|
$
|
164
|
|
The purchase price allocation for this acquisition created goodwill of
$17 million
at the date of acquisition, of which
$15 million
is deductible for tax purposes. The goodwill is attributable to securing Hyatt's long-term presence in this strategic property. The definite-lived intangibles relate to
$4 million
of advanced bookings, which were amortized over a useful life of
14 months
. See "Like-Kind Exchange Agreements" below, as the purchase of Hyatt Regency Lost Pines Resort and Spa was designated as replacement property in a like-kind exchange.
Park Hyatt New York
—During the
year
ended
December 31, 2014
, we acquired Park Hyatt New York for a purchase price of approximately
$392 million
, including
$1 million
of cash. Of the
$391 million
net purchase price, assets acquired include
$386 million
of property and equipment,
$3 million
of inventories, and
$2 million
of prepaids and other assets, which were recorded in our owned and leased hotels segment. See "Like-Kind Exchange Agreements" below, as the purchase of Park Hyatt New York was designated as replacement property in a like-kind exchange.
Non-recurring Fair Value Measurement
—Significant unobservable Level Three inputs used to fair value the 2016 acquisitions include:
|
2016
|
|
|
Discount rate
|
7.25% - 9.00%
|
|
Terminal capitalization rate (1)
|
5.50% - 7.75%
|
(1) Reflects the risk profile of the individual markets where the assets are located and are not necessarily indicative of our hotel portfolio as a whole.
Dispositions
Hyatt Regency Birmingham (U.K.)
—During the
year
ended
December 31, 2016
, we sold the shares of the company that owns Hyatt Regency Birmingham (U.K.) to an unrelated third party for approximately
$49 million
, net of closing costs and proration adjustments and entered into a long-term management agreement with the owner of the property. The sale resulted in a
$17 million
pre-tax gain which was deferred and is being recognized in management and franchise fees over the term of the management agreement, within our EAME/SW Asia management and franchising segment. The operating results and financial position of this hotel prior to the sale remain within our owned and leased hotels segment.
Andaz 5th Avenue
—During the
year
ended
December 31, 2016
, we sold Andaz 5th Avenue to an unrelated third party for
$240 million
, net of
$10 million
of closing costs and proration adjustments and entered into a long-term management agreement with the owner of the property. The sale resulted in a
$23 million
pre-tax loss which was recognized in gains (losses) on sales of real estate and other on our consolidated statements of income during the
year
ended
December 31, 2016
. The operating results and financial position of this hotel prior to the sale remain within our owned and leased hotels segment.
Hyatt Regency Indianapolis
—During the
year
ended
December 31, 2015
, we sold Hyatt Regency Indianapolis for
$69 million
, net of closing costs, to an unrelated third party, and entered into a long-term franchise agreement with the owner of the
F- 26
property. The sale resulted in a pre-tax gain of
$8 million
, which was recognized in gains (losses) on sales of real estate and other on our consolidated statements of income during the year ended
December 31, 2015
. The operating results and financial position of this hotel prior to the sale remain within our owned and leased hotels segment.
Land Held for Development
—During the
year
ended
December 31, 2015
, we sold land and construction in progress for
$14 million
to an unconsolidated hospitality venture in which Hyatt has a
40%
ownership interest.
A Hyatt House Hotel
—During the
year
ended
December 31, 2015
, we sold a select service property for
$5 million
, net of closing costs, to an unrelated third party resulting in a
$1 million
pre-tax gain which was recognized in gains (losses) on sales of real estate and other on our consolidated statements of income during the year ended
December 31, 2015
. The operating results and financial position of this hotel prior to the sale remain within our owned and leased hotels segment.
Hyatt Place 2014
—During the year ended
December 31, 2014
, we sold
five
Hyatt Place properties located in Texas and North and South Carolina for a total of
$51 million
, net of closing costs, to unrelated third parties. These transactions resulted in pre-tax gains of approximately
$13 million
. The Company entered into long-term franchise agreements with the purchasers of the hotels. The gains were recognized in gains (losses) on sales of real estate and other on our consolidated statements of income during the year ended
December 31, 2014
. The operating results and financial position of these hotels prior to the sale remain within our owned and leased hotels segment. See "Like-Kind Exchange Agreements" below, as proceeds from the sale were held as restricted for use in a potential like-kind exchange.
Park Hyatt Toronto
—During the year ended
December 31, 2014
, we sold Park Hyatt Toronto for
$88 million
, net of closing costs, to an unrelated third party, resulting in a pre-tax gain of
$49 million
. The Company entered into a long-term management agreement with the purchaser of the hotel. The gain on sale was deferred and is being recognized in management and franchise fees over the term of the management contract, within our Americas management and franchising segment. The operating results and financial position of this hotel prior to the sale remain within our owned and leased hotels segment.
Hyatt Regency Vancouver
—During the year ended
December 31, 2014
, we sold Hyatt Regency Vancouver for
$116 million
, net of closing costs, to an unrelated third party, resulting in a pre-tax gain of
$64 million
. The Company entered into a long-term management agreement with the purchaser of the hotel. The gain on sale was deferred and is being recognized in management and franchise fees over the term of the management contract, within our Americas management and franchising segment. The operating results and financial position of this hotel prior to the sale remain within our owned and leased hotels segment.
Hyatt Place, Hyatt House 2014
—During the year ended
December 31, 2014
, we sold
38
select service properties for a total of
$581 million
, net of closing costs, to an unrelated third party. This transaction resulted in a pre-tax gain of approximately
$153 million
. The Company entered into long-term franchise agreements with the purchaser of the hotels. The gain was recognized in gains (losses) on sales of real estate and other on our consolidated statements of income during the year ended
December 31, 2014
. The operating results and financial position of these hotels prior to the sale remain within our owned and leased hotels segment. See "Like-Kind Exchange Agreements" below, as the proceeds from the sale of
21
of the hotels have been used in a like-kind exchange and proceeds from the sale of
six
of the hotels were held as restricted for use in a potential like-kind exchange.
Park Hyatt Washington
—During the year ended
December 31, 2014
, we sold Park Hyatt Washington for
$97 million
, net of closing costs, to an unrelated third party, resulting in a pre-tax gain of
$57 million
. The Company entered into a long-term management agreement with the purchaser of the hotel. The gain on sale was deferred and is being recognized in management and franchise fees over the term of the management contract, within our Americas management and franchising segment. The operating results and financial position of this hotel prior to the sale remain within our owned and leased hotels segment. See "Like-Kind Exchange Agreements" below, as proceeds from the sale have been used in a like-kind exchange.
Hyatt Residential Group
—During the year ended
December 31, 2014
, we sold our vacation ownership business, which included an interest in a joint venture that owns a vacation ownership property in Maui, Hawaii, as well as a full service hotel, to an unrelated third party for approximately
$220 million
, net of working capital adjustments, resulting in a pre-tax gain of
$80 million
. The gain was recognized in gains (losses) on sales of real estate and other on our consolidated statements of income during the year ended
December 31, 2014
. We entered into a master license agreement with the purchaser and receive recurring annual license fees under this agreement, which are recorded in management and franchise fees within our corporate and other segment on our consolidated statements of income. The operating results and financial position of Hyatt Residential Group prior to the sale remain primarily within our corporate and other segment.
Hyatt, Hyatt Place, Hyatt House 2014
—During the
year
ended
December 31, 2014
, we sold
nine
select service properties and
one
full service property for a total of
$311 million
, net of closing costs, to an unrelated third party. In connection with the sale, we transferred net cash and cash equivalents of
$1 million
, resulting in a net sales price of
$310 million
. We recorded a
F- 27
pre-tax gain of approximately
$65 million
for the
year
ended
December 31, 2014
. The properties will remain Hyatt-branded hotels for a minimum of
25 years
under long-term agreements. The gain was recognized in gains (losses) on sales of real estate and other on our consolidated statements of income during the year ended
December 31, 2014
. The operating results and financial position of these hotels prior to the sales remain within our owned and leased hotels segment. See "Like-Kind Exchange Agreements" below, as proceeds from the sales have been used in a like-kind exchange.
As a result of certain dispositions, we have agreed to provide customary indemnifications to
third-
party purchasers for certain liabilities incurred prior to sale and for breach of certain representations and warranties made during the sales process, such as representations of valid title, authority, and environmental issues that may not be limited by a contractual monetary amount. These indemnification agreements survive until the applicable statutes of limitation expire or until the agreed upon contract terms expire.
Like-
Kind Exchange Agreements
Periodically, we enter into like-kind exchange agreements upon the disposition or acquisition of certain hotels. Pursuant to the terms of these agreements, the proceeds from the sales are placed into an escrow account administered by a qualified intermediary. The proceeds are recorded to restricted cash on our consolidated balance sheets and released once they are utilized as part of a like-kind exchange agreement or when a like-kind exchange agreement is not completed within the allowable time period.
In conjunction with the sale of
five
Hyatt Place properties during the
year
ended
December 31, 2014
, we entered into like-kind exchange agreements with a qualified intermediary. Pursuant to the like-kind exchange agreements, the combined net proceeds of
$51 million
from the sales of these hotels were placed into an escrow account administered by a qualified intermediary. During the
year
ended
December 31, 2015
, we released the net proceeds because the identified replacement property was not acquired in order to complete the exchange.
In conjunction with the sale of
38
select service properties during the year ended
December 31, 2014
, we entered into like-kind exchange agreements with a qualified intermediary for
27
of the select service hotels. In the fourth quarter of 2014, we classified net proceeds of
$403 million
from the sale of these
27
properties as restricted cash. Of this total, we released net proceeds of
$311 million
related to
21
of the select service hotels from restricted cash as they were utilized as part of the like-kind exchange agreement to acquire Park Hyatt New York. During the
year
ended
December 31, 2015
, we released
$92 million
of net proceeds related to the remaining
six
hotels from restricted cash, as the intermediary distributed these funds from escrow to complete the reverse like-kind exchange transaction in connection with the acquisition of Hyatt Regency Lost Pines Resort and Spa.
In conjunction with the 2014 sale of Park Hyatt Washington, we entered into a like-kind exchange agreement with an intermediary. Pursuant to the like-kind exchange agreement, the net proceeds of
$97 million
from the sale of this hotel were placed into an escrow account administered by a qualified intermediary. During the year ended December 31, 2014, these net proceeds were utilized as part of the
like-
kind exchange agreement to acquire Hyatt Regency Grand Cypress (see Note
9
).
In conjunction with the sale of
nine
select service properties and
one
full service property during the
year
ended
December 31, 2014
, we entered into a like-kind exchange agreement with a qualified intermediary for
seven
of the select service hotels. During the year ended
December 31, 2014
, we recorded and released net proceeds of
$232 million
from restricted cash as they were utilized as part of the like-kind exchange agreement to acquire Hyatt Regency Orlando.
In conjunction with the 2013 sale of Hyatt Key West, we entered into a like-kind exchange agreement with a qualified intermediary. Pursuant to the like-kind exchange agreement, the net proceeds of
$74 million
from the sale of this hotel were placed into an escrow account administered by a qualified intermediary. During the year ended
December 31, 2014
, the net proceeds were released from restricted cash as they were utilized as part of the like-kind exchange agreement to acquire Hyatt Regency Orlando.
F- 28
8
. GOODWILL AND INTANGIBLE ASSETS, NET
|
Owned and Leased Hotels
|
Americas Management and Franchising
|
Total
|
|||||||||
|
Balance at January 1, 2015
|
|||||||||||
|
Goodwill
|
$
|
195
|
|
$
|
33
|
|
$
|
228
|
|
||
|
Accumulated impairment losses
|
(95
|
)
|
—
|
|
(95
|
)
|
|||||
|
Goodwill, net
|
$
|
100
|
|
$
|
33
|
|
$
|
133
|
|
||
|
Activity during the year
|
|||||||||||
|
Foreign exchange*
|
(4
|
)
|
—
|
|
(4
|
)
|
|||||
|
Balance at December 31, 2015
|
|||||||||||
|
Goodwill
|
191
|
|
33
|
|
224
|
|
|||||
|
Accumulated impairment losses
|
(95
|
)
|
—
|
|
(95
|
)
|
|||||
|
Goodwill, net
|
$
|
96
|
|
$
|
33
|
|
$
|
129
|
|
||
|
Activity during the year
|
|||||||||||
|
Foreign exchange*
|
(4
|
)
|
—
|
|
(4
|
)
|
|||||
|
Balance at December 31, 2016
|
|||||||||||
|
Goodwill
|
187
|
|
33
|
|
220
|
|
|||||
|
Accumulated impairment losses
|
(95
|
)
|
—
|
|
(95
|
)
|
|||||
|
Goodwill, net
|
$
|
92
|
|
$
|
33
|
|
$
|
125
|
|
||
* Foreign exchange translation adjustments related to the goodwill associated with Hyatt Regency Mexico City.
The following is a summary of intangible assets:
|
December 31, 2016
|
Weighted Average Useful Lives
|
December 31, 2015
|
||||||||
|
Management and franchise agreement intangibles
|
$
|
589
|
|
25
|
|
$
|
535
|
|
||
|
Lease related intangibles
|
115
|
|
111
|
|
136
|
|
||||
|
Brand intangibles
|
16
|
|
—
|
|
7
|
|
||||
|
Advanced booking intangibles
|
11
|
|
6
|
|
12
|
|
||||
|
Other
|
6
|
|
14
|
|
8
|
|
||||
|
737
|
|
698
|
|
|||||||
|
Accumulated amortization
|
(138
|
)
|
(151
|
)
|
||||||
|
Intangibles, net
|
$
|
599
|
|
$
|
547
|
|
||||
Amortization expense relating to intangible assets was as follows:
|
|
Years Ended December 31,
|
||||||||||
|
|
2016
|
2015
|
2014
|
||||||||
|
Amortization expense
|
$
|
27
|
|
$
|
31
|
|
$
|
30
|
|
||
We estimate amortization expense for definite-lived intangibles as follows:
|
Years Ending December 31,
|
|
||
|
2017
|
$
|
32
|
|
|
2018
|
30
|
|
|
|
2019
|
30
|
|
|
|
2020
|
30
|
|
|
|
2021
|
29
|
|
|
During the years ended
December 31, 2016
and
December 31, 2015
we recorded
no
impairment charges. During the year ended
December 31, 2014
, we recognized
$2 million
of goodwill impairment within our owned and leased hotels segment and
F- 29
a
$2 million
impairment of management and franchise agreement intangibles which was recorded within our Americas management and franchising segment.
9
. DEBT
|
December 31, 2016
|
December 31, 2015
|
||||||
|
$250 million senior unsecured notes maturing in 2016—3.875%
|
$
|
—
|
|
$
|
250
|
|
|
|
$196 million senior unsecured notes maturing in 2019—6.875%
|
196
|
|
196
|
|
|||
|
$250 million senior unsecured notes maturing in 2021—5.375%
|
250
|
|
250
|
|
|||
|
$350 million senior unsecured notes maturing in 2023—3.375%
|
350
|
|
350
|
|
|||
|
$400 million senior unsecured notes maturing in 2026—4.850%
|
400
|
|
—
|
|
|||
|
Tax-Exempt Contract Revenue Empowerment Zone Bonds, Series 2005A
|
130
|
|
130
|
|
|||
|
Contract Revenue Bonds, Senior Taxable Series 2005B
|
59
|
|
63
|
|
|||
|
Floating average rate construction loan
|
79
|
|
65
|
|
|||
|
Senior secured term loan
|
—
|
|
64
|
|
|||
|
Revolving credit facility
|
100
|
|
—
|
|
|||
|
Other
|
1
|
|
—
|
|
|||
|
Long-term debt before capital lease obligations
|
1,565
|
|
1,368
|
|
|||
|
Capital lease obligations
|
15
|
|
16
|
|
|||
|
Total long-term debt
|
1,580
|
|
1,384
|
|
|||
|
Less current maturities
|
(119
|
)
|
(328
|
)
|
|||
|
Less unamortized discounts and deferred financing fees
|
(16
|
)
|
(14
|
)
|
|||
|
Total long-term debt, net of current maturities
|
$
|
1,445
|
|
$
|
1,042
|
|
|
Under existing agreements, maturities of debt for the next five years and thereafter are as follows:
|
Years Ending December 31,
|
|||
|
2017
|
$
|
119
|
|
|
2018
|
19
|
|
|
|
2019
|
215
|
|
|
|
2020
|
19
|
|
|
|
2021
|
269
|
|
|
|
Thereafter
|
939
|
|
|
|
Total
|
$
|
1,580
|
|
Senior Notes
—At
December 31, 2016
and
December 31, 2015
, we had various series of senior unsecured notes, as further defined below, (the "Senior Notes"). Interest on the Senior Notes is payable semi-annually. We may redeem all or a portion of the Senior Notes at any time at
100%
of the principal amount of the Senior Notes redeemed together with the accrued and unpaid interest, plus a
make-
whole amount, if any. The amount of any
make-
whole payment depends, in part, on the yield of U.S. Treasury securities with a comparable maturity to the Senior Notes at the date of redemption. A summary of the terms of the Senior Notes, by year of issuance, is as follows:
|
•
|
In 2009, we issued
$250 million
of
6.875%
senior notes due 2019, at an issue price of
99.864%
(the "2019 Notes"). During the year ended December 31, 2013, we purchased
$54 million
aggregate principal amount of 2019 Notes in a cash tender offer at a purchase price of
$66 million
, which included premiums payable in connection with the cash tender offer. Following the cash tender offer,
$196 million
aggregate principal amount of 2019 Notes remains outstanding.
|
|
•
|
In 2011, we issued
$250 million
of
3.875%
senior notes due 2016, at an issue price of
99.571%
(the "2016 Notes"), and
$250 million
of
5.375%
senior notes due 2021, at an issue price of
99.846%
(the "2021 Notes"). During the year ended
December 31, 2016
, we redeemed all of our outstanding 2016 Notes, of which an aggregate principal amount of
$250 million
was outstanding. The redemption price, which was calculated in accordance with the terms of the 2016 Notes and included principal and accrued interest plus a make-whole premium, was
$254 million
. The make-whole premium was recorded within other income (loss), net on our consolidated statements of income, see Note
20
.
|
F- 30
|
•
|
In 2013, we issued
$350 million
of
3.375%
senior notes due 2023 at an issue price of
99.498%
(the "2023 Notes").
|
|
•
|
In 2016, we issued
$400 million
of
4.850%
senior notes due 2026, at an issue price of
99.920%
(the "2026 Notes" and together with the 2016 Notes, the 2019 Notes, 2021 Notes and the 2023 Notes, the "Senior Notes"). We received net proceeds of
$396 million
from the sale of the 2026 Notes, after deducting discounts and offering expenses of approximately
$4 million
. We used a portion of the net proceeds to pay for the redemption of the 2016 Notes (as described above), with the remaining proceeds intended to be used for general corporate purposes.
|
Senior Secured Term Loan
— During the year ended
December 31, 2016
, we repaid
$64 million
of the senior secured term loan related to Hyatt Regency Lost Pines Resort and Spa, which we acquired during 2014 from an unconsolidated hospitality venture.
Capital Lease Obligation
—During the year ended
December 31, 2014
, we acquired Hyatt Regency Grand Cypress for
$191 million
after exercising our purchase option which reduced our capital lease obligation. The purchase of Hyatt Regency Grand Cypress was used as a replacement property in a like-kind exchange (see Note
7
).
Tax-Exempt Contract Revenue Empowerment Zone Bonds, Series 2005A and Contract Revenue Bonds, Senior Taxable Series 2005B
—During the year ended
December 31, 2013
, we acquired our partner's interest in the entity that owned Grand Hyatt San Antonio, and as a result, we consolidated
$198 million
of bonds, net of the
$9 million
bond discount, which is being amortized over the life of the bonds. The construction was financed in part by The City of San Antonio, Texas Convention Center Hotel Finance Corporation ("Texas Corporation"), a non-profit local government corporation created by the City of San Antonio, Texas for the purpose of providing financing for a portion of the costs of constructing the hotel. On June 8, 2005, the Texas Corporation issued
$130 million
of original principal amount Tax-Exempt Contract Revenue Empowerment Zone Bonds, Series 2005A ("Series 2005A Bonds") and
$78 million
of original principal amount Contract Revenue Bonds, Senior Taxable Series 2005B ("Series 2005B Bonds"). The Series 2005A Bonds mature between 2034 and 2039, with interest ranging from
4.75%
to
5.00%
and the remaining Series 2005B Bonds mature between 2020 and 2028, with interest ranging from
5.1%
to
5.31%
. The loan payments are required to be funded solely from net operating revenues of Grand Hyatt San Antonio and in the event that net operating revenues are not sufficient to pay debt service, the Texas Corporation under certain circumstances will be required to provide certain tax revenue to pay debt service on the 2005 Series bonds. The indenture allows for optional early redemption of the Series 2005B bonds subject to make-whole payments at any time with consent from the Texas Corporation and beginning in 2015 for the Series 2005A Bonds. Interest is payable semiannually.
Floating Average Rate Construction Loan
—During the year ended
December 31, 2012
, we obtained a secured construction loan with Banco Nacional de Desenvolvimento Econômico e Social - BNDES ("BNDES") in order to develop Grand Hyatt Rio de Janeiro. The loan is split into
four
separate sub-loans with different interest rates for each such sub-loan. All
four
sub-loans mature in 2023, with options to extend the maturity up to 2031 for sub-loan (a) and (b), subject to the fulfillment of certain conditions. Borrowings under the
four
sub-loans bear interest at the following rates, depending on the applicable sub-loan (a) the variable rate published by BNDES plus
2.92%
, (b) the Brazilian Long Term Interest Rate - TJLP plus
3.92%
, (c)
2.5%
and (d) the Brazilian Long Term Interest Rate - TJLP, with the interest rates referred to in sub-loans (a) and (b) subject to reduction upon the delivery of certain certifications. On sub-loans (b) and (d), when the TJLP rate exceeds
6%
, the amount corresponding to the TJLP portion above
6%
is required to be capitalized daily. At
December 31, 2016
, the weighted average interest rates for the sub-loans we have drawn upon is
9.00%
. The outstanding balance of the sub-loan subject to the interest rate described in (a) above is subject to adjustment on a daily basis based on BNDES’s calculation of the weighted average of exchange rate variations related to foreign currency funds raised by BNDES in foreign currency. At
December 31, 2016
, we borrowed Brazilian Real ("BRL")
258 million
, or
$79 million
. At
December 31, 2015
, we borrowed BRL
260 million
, or
$65 million
.
Revolving Credit Facility
—At January 6, 2014, we entered into a Second Amended and Restated Credit Agreement with a syndicate of lenders that amended and restated our prior revolving credit facility and provides for a
$1.5 billion
senior unsecured revolving credit facility that matures in January 2019. Interest rates on outstanding borrowings are either
LIBOR-
based or based on an alternate base rate, with margins in each case based on our credit rating or, in certain circumstances, our credit rating and leverage ratio. During the year ended
December 31, 2016
, we had borrowings of
$210 million
and repayments of
$110 million
, resulting in an outstanding balance of
$100 million
at
December 31, 2016
. The weighted average interest rate on these borrowings was
1.63%
at
December 31, 2016
. There was
no
outstanding balance on this revolving credit facility at
December 31, 2015
. At
December 31, 2016
and
December 31, 2015
, we entered into various letter of credit agreements that did not reduce our available capacity under the revolving credit facility. The available line of credit on our revolving credit facility at
December 31, 2016
was
$1.4 billion
.
The Company had
$230 million
and
$228 million
of letters of credit issued through additional banks at
December 31, 2016
and
December 31, 2015
, respectively.
F- 31
Fair Value
—We estimated the fair value of debt, excluding capital leases, which consists of our Senior Notes and other long-term debt. Our Senior Notes and bonds are classified as Level Two due to the use and weighting of multiple market inputs in the final price of the security. We estimated the fair value of our other
long-
term debt instruments using discounted cash flow analysis based on current market inputs for similar types of arrangements. Based upon the lack of availability of market data, we have classified our other long-term debt as Level Three. The primary sensitivity in these calculations is based on the selection of appropriate discount rates. Fluctuations in these assumptions will result in different estimates of fair value.
We had the following debt balances, excluding capital lease obligations, as described above:
|
December 31, 2016
|
|||||||||||||||||||
|
Carrying Value
|
Fair Value
|
Quoted Prices in Active Markets for Identical Assets (Level One)
|
Significant Other Observable Inputs (Level Two)
|
Significant Unobservable Inputs (Level Three)
|
|||||||||||||||
|
Debt, excluding capital lease obligations
|
$
|
1,549
|
|
$
|
1,642
|
|
$
|
—
|
|
$
|
1,450
|
|
$
|
192
|
|
||||
|
December 31, 2015
|
|||||||||||||||||||
|
Carrying Value
|
Fair Value
|
Quoted Prices in Active Markets for Identical Assets (Level One)
|
Significant Other Observable Inputs (Level Two)
|
Significant Unobservable Inputs (Level Three)
|
|||||||||||||||
|
Debt, excluding capital lease obligations
|
$
|
1,354
|
|
$
|
1,421
|
|
$
|
—
|
|
$
|
1,277
|
|
$
|
144
|
|
||||
10
. LEASES
We lease hotels and equipment under a combination of capital and operating leases, which generally require us to pay taxes, maintenance, and insurance. Most of the leases contain renewal options, which enable us to retain use of the facilities in desirable operating areas.
The operating leases for the majority of our leased hotels require the calculation of rental payments to be based on a percentage of the operating profit of the hotel, as defined by contract. As a result, future lease payments related to these leases are contingent upon operating results and are not included in the table below.
Corporate Office Space
— We have sublease agreements with certain related parties at the Hyatt Center, see Note
17
for further discussion on related-party lease agreements.
The leases for our corporate headquarters expire in 2017 and 2020. In anticipation of the expiration of these leases, we entered into a new lease within a recently constructed office building for a term of
17 years
. The future lease payments related to this new lease are included in the future minimum operating lease payments shown below.
The future minimum lease payments for our corporate office space and leased hotels due in each of the next five years and thereafter are as follows:
|
Years Ending December 31,
|
Operating Leases
|
Capital Leases
|
|||||
|
2017
|
$
|
41
|
|
$
|
2
|
|
|
|
2018
|
35
|
|
3
|
|
|||
|
2019
|
39
|
|
3
|
|
|||
|
2020
|
29
|
|
2
|
|
|||
|
2021
|
26
|
|
2
|
|
|||
|
Thereafter
|
444
|
|
8
|
|
|||
|
Total minimum lease payments
|
$
|
614
|
|
$
|
20
|
|
|
|
Less amount representing interest
|
5
|
|
|||||
|
Present value of minimum lease payments
|
$
|
15
|
|
||||
F- 32
A summary of rent expense from continuing operations for all operating leases is as follows:
|
Years Ended December 31,
|
|||||||||||
|
2016
|
2015
|
2014
|
|||||||||
|
Minimum rentals
|
$
|
37
|
|
$
|
34
|
|
$
|
35
|
|
||
|
Contingent rentals
|
53
|
|
53
|
|
49
|
|
|||||
|
Total
|
$
|
90
|
|
$
|
87
|
|
$
|
84
|
|
||
The Company leases retail space at its owned hotel locations under operating leases. We recorded rental income of
$25 million
,
$28 million
, and
$28 million
within owned and leased hotels revenues on our consolidated statements of income for the years ended December 31, 2016, December 31, 2015 and December 31, 2014, respectively. The future minimum lease receipts scheduled to be received in each of the next five years and thereafter are as follows:
|
Years Ending December 31,
|
|||
|
2017
|
$
|
22
|
|
|
2018
|
17
|
|
|
|
2019
|
13
|
|
|
|
2020
|
12
|
|
|
|
2021
|
11
|
|
|
|
Thereafter
|
58
|
|
|
|
Total minimum lease receipts
|
$
|
133
|
|
11
. EMPLOYEE BENEFIT PLANS
Defined Benefit Plans
—We sponsor supplemental executive retirement plans consisting of funded and unfunded defined benefit plans for certain former executives. Retirement benefits are based primarily on the former employees’ salary, as defined, and are payable upon satisfaction of certain service and age requirements as defined by the plans. The accumulated benefit obligation related to the unfunded U.S. plan was
$21 million
at
December 31, 2016
and
December 31, 2015
, of which
$20 million
was classified as a long-term liability, see Note
12
. At
December 31, 2016
, we expect benefits of
$1 million
to be paid annually over the next
10
years.
Defined Contribution Plans
—We provide retirement benefits to certain eligible employees under the Retirement Savings Plan (a qualified plan under Internal Revenue Code Section 401(k)), the FRP, and other similar plans. For the years ended
December 31, 2016
,
December 31, 2015
, and December 31, 2014, we recorded expenses of
$36 million
,
$35 million
, and
$35 million
, respectively, related to the Retirement Savings Plan based on a percentage of eligible employee contributions on stipulated amounts. The majority of these contributions relate to hotel property level employees, which are reimbursable to us and are included in the other revenues from managed properties and other costs from managed properties on our consolidated statements of income.
Deferred Compensation Plans
—We provide nonqualified deferred compensation for certain employees through the DCP. Contributions and investment elections are determined by the employees, and the Company provides contributions to certain eligible employees according to pre-established formulas. The DCP is fully funded through a rabbi trust, therefore changes in the underlying securities impact the deferred compensation liability, which is recorded in other long-term liabilities (see Note
12
) and the corresponding marketable securities assets (see Note
4
).
Employee Stock Purchase Program
—We provide the Hyatt Hotels Corporation ESPP, which qualifies under Section 423 of the Internal Revenue Code. The ESPP provides eligible employees the opportunity to purchase shares of the Company’s common stock on a quarterly basis through payroll deductions at a price equal to
95%
of the fair value on the last trading day of each quarter. Approximately
76,000
shares and
69,000
shares were issued under the ESPP during
2016
and
2015
, respectively.
F- 33
12
. OTHER LONG-TERM LIABILITIES
Other
long-
term liabilities consisted of the following:
|
December 31, 2016
|
December 31, 2015
|
||||||
|
Deferred gains on sales of hotel properties
|
$
|
363
|
|
$
|
367
|
|
|
|
Deferred compensation plans (see Note 11)
|
352
|
|
333
|
|
|||
|
Hyatt Gold Passport Fund (see Note 2)
|
296
|
|
280
|
|
|||
|
Guarantee liabilities (see Note 14)
|
124
|
|
120
|
|
|||
|
Other accrued income taxes (see Note 13)
|
100
|
|
127
|
|
|||
|
Deferred income taxes (see Note 13)
|
57
|
|
59
|
|
|||
|
Defined benefit plans (see Note 11)
|
20
|
|
20
|
|
|||
|
Other
|
160
|
|
141
|
|
|||
|
Total
|
$
|
1,472
|
|
$
|
1,447
|
|
|
13
. INCOME TAXES
Our tax provision includes federal, state, local, and foreign income taxes. The domestic and foreign components of income before income taxes are as follows:
|
Years Ended December 31,
|
|||||||||||
|
2016
|
2015
|
2014
|
|||||||||
|
U.S. income before tax
|
$
|
180
|
|
$
|
119
|
|
$
|
493
|
|
||
|
Foreign income before tax
|
109
|
|
75
|
|
32
|
|
|||||
|
Income before income taxes
|
$
|
289
|
|
$
|
194
|
|
$
|
525
|
|
||
The provision (benefit) for income taxes from continuing operations is comprised of the following:
|
Years Ended December 31,
|
|||||||||||
|
2016
|
2015
|
2014
|
|||||||||
|
Current:
|
|||||||||||
|
Federal
|
$
|
66
|
|
$
|
134
|
|
$
|
164
|
|
||
|
State
|
15
|
|
18
|
|
7
|
|
|||||
|
Foreign
|
7
|
|
21
|
|
36
|
|
|||||
|
Total Current
|
$
|
88
|
|
$
|
173
|
|
$
|
207
|
|
||
|
Deferred:
|
|||||||||||
|
Federal
|
$
|
(12
|
)
|
$
|
(78
|
)
|
$
|
(10
|
)
|
||
|
State
|
(2
|
)
|
(20
|
)
|
(6
|
)
|
|||||
|
Foreign
|
11
|
|
(5
|
)
|
(12
|
)
|
|||||
|
Total Deferred
|
$
|
(3
|
)
|
$
|
(103
|
)
|
$
|
(28
|
)
|
||
|
Total
|
$
|
85
|
|
$
|
70
|
|
$
|
179
|
|
||
F- 34
The following is a reconciliation of the statutory federal income tax rate to the effective tax rate from continuing operations:
|
Years Ended December 31,
|
||||||||
|
2016
|
2015
|
2014
|
||||||
|
Statutory U.S. federal income tax rate
|
35.0
|
%
|
35.0
|
%
|
35.0
|
%
|
||
|
State income taxes—net of federal tax benefit
|
3.4
|
|
3.5
|
|
3.4
|
|
||
|
Impact of foreign operations (excluding unconsolidated hospitality ventures losses)
|
(5.4
|
)
|
(13.8
|
)
|
0.9
|
|
||
|
Foreign unconsolidated hospitality ventures
|
1.2
|
|
10.0
|
|
0.8
|
|
||
|
Playa foreign tax credit benefit
|
(2.6
|
)
|
—
|
|
—
|
|
||
|
Tax contingencies
|
(5.2
|
)
|
(1.5
|
)
|
(2.6
|
)
|
||
|
Change in valuation allowances
|
3.6
|
|
3.1
|
|
(1.0
|
)
|
||
|
General business credits
|
(0.8
|
)
|
(1.9
|
)
|
(0.4
|
)
|
||
|
Equity based compensation
|
0.4
|
|
(0.5
|
)
|
0.4
|
|
||
|
Other
|
(0.1
|
)
|
2.3
|
|
(2.4
|
)
|
||
|
Effective income tax rate
|
29.5
|
%
|
36.2
|
%
|
34.1
|
%
|
||
Significant items affecting the 2016 effective tax rate include benefits related to the rate differential of foreign operations, foreign tax credit benefits associated with the Playa foreign unconsolidated hospitality venture and a
$15 million
benefit (including
$4 million
of interest and penalties) primarily related to the reversal of uncertain tax positions for certain foreign filing positions. These benefits are partially offset by the impact of certain foreign net operating losses generated in the current year that are not expected to be utilized in the future.
Significant items affecting the 2015 effective tax rate include a benefit related to the impact of global transfer pricing changes implemented during 2015 to better align the Company’s transfer pricing with the Company’s global business operating model. This benefit is offset by the effect of certain foreign unconsolidated hospitality venture losses that are not fully benefited. The impact of tax contingencies includes a benefit of
$10 million
(including
$5 million
of interest and penalties) due to statute expirations with respect to state and foreign tax filing positions and an expense of
$7 million
due to an uncertain tax position recorded during 2015 related to transfer pricing positions.
For 2014, significant items affecting the effective tax rate include a benefit of
$14 million
related to tax contingencies and an
$8 million
benefit for an adjustment to certain deferred tax assets. The
$14 million
benefit related to tax contingencies is derived primarily from a benefit of
$13 million
(including
$7 million
of interest and penalties) due to statute expiration on state tax filing positions, an expense of
$5 million
due to an uncertain tax position recorded during 2014 related to an accrual of a position taken on a prior year tax return and a benefit of
$4 million
related to the expiration of statutes in foreign jurisdictions.
F- 35
The components of the net deferred tax assets and deferred tax liabilities are comprised of the following:
|
December 31, 2016
|
December 31, 2015
|
||||||
|
Deferred tax assets related to:
|
|||||||
|
Employee benefits
|
$
|
202
|
|
$
|
196
|
|
|
|
Foreign and state net operating losses and credit carryforwards
|
46
|
|
34
|
|
|||
|
Investments
|
55
|
|
70
|
|
|||
|
Allowance for uncollectible assets
|
36
|
|
36
|
|
|||
|
Intangibles
|
—
|
|
4
|
|
|||
|
Deferred gains on sales of hotel properties
|
134
|
|
142
|
|
|||
|
Hyatt Gold Passport Fund
|
81
|
|
81
|
|
|||
|
Interest and state benefits
|
2
|
|
2
|
|
|||
|
Unrealized losses
|
5
|
|
5
|
|
|||
|
Other
|
54
|
|
50
|
|
|||
|
Valuation allowance
|
(27
|
)
|
(17
|
)
|
|||
|
Total deferred tax asset
|
$
|
588
|
|
$
|
603
|
|
|
|
Deferred tax liabilities related to:
|
|||||||
|
Property and equipment
|
$
|
(224
|
)
|
$
|
(258
|
)
|
|
|
Investments
|
(28
|
)
|
(33
|
)
|
|||
|
Intangibles
|
(14
|
)
|
—
|
|
|||
|
Unrealized gains
|
(39
|
)
|
(45
|
)
|
|||
|
Prepaid expenses
|
(12
|
)
|
(13
|
)
|
|||
|
Other
|
(15
|
)
|
(12
|
)
|
|||
|
Total deferred tax liabilities
|
$
|
(332
|
)
|
$
|
(361
|
)
|
|
|
Net deferred tax assets
|
$
|
256
|
|
$
|
242
|
|
|
|
Recognized in the balance sheet as:
|
|||||||
|
Deferred tax assets—noncurrent
|
$
|
313
|
|
$
|
301
|
|
|
|
Deferred tax liabilities—noncurrent
|
(57
|
)
|
(59
|
)
|
|||
|
Total
|
$
|
256
|
|
$
|
242
|
|
|
Significant changes to our deferred tax assets and liabilities during 2016 include a decreased property and equipment deferred tax liability of
$34 million
as a result of book depreciation in excess of tax depreciation and an
$18 million
decrease of intangible deferred tax assets, due to amortization.
Significant changes to our deferred tax assets and liabilities during 2015 includes an increase of
$60 million
due to a deferred tax asset recorded in conjunction with an uncertain tax position accrual related to the U.S. tax treatment of the Hyatt Gold Passport Fund and book depreciation in excess of tax depreciation related to property and equipment of
$54 million
. This is partially offset by an increase in unrealized gains related to our preferred investment recorded to other comprehensive income (loss). Additional significant changes relate to the recording of employee benefit costs that are not currently deductible.
At
December 31, 2016
, we have determined that undistributed net earnings of
$504 million
o
f certain foreign subsidiaries are indefinitely reinvested in jurisdictions outside the United States. These earnings are being used to fund our development pipeline and any recurring capital expenditures related to jurisdictions outside the United States. These earnings could become subject to additional taxes if remitted as dividends, loaned to a U.S. affiliate, or if we sold our interest in the affiliates; the resulting U.S. income tax liabilities could be offset, in whole or in part, by credits allowable for taxes paid to foreign jurisdictions. The actual tax costs would depend on the income tax laws and circumstances at the time of the realization events; determination of the potential net liability is not practicable due to the complexities of the hypothetical calculation.
At
December 31, 2016
, we have
$164 million
gross (
$36 million
deferred tax asset) of future tax benefits related to foreign and state net operating losses and
$10 million
of benefits related to federal and state credits. A portion of these operating losses expire in 2017; the remainder will expire over time through 2036. However,
$51 million
of these gross net operating losses (
$11 million
deferred tax asset), which are primarily foreign, have no expiration date and may be carried forward indefinitely. A valuation allowance of
$27 million
is recorded for certain deferred tax assets related to net operating losses and credits that we do not believe are more likely than not to be realized.
F- 36
Total unrecognized tax benefits at
December 31, 2016
and
December 31, 2015
were
$86 million
and
$110 million
, respectively, of which
$5 million
and
$21 million
, respectively, would impact the effective tax rate if recognized. It is reasonably possible that a reduction of up to
$3 million
of unrecognized tax benefits could occur within 12 months resulting from the expiration of certain tax statutes of limitations.
A reconciliation of the beginning and ending amount of unrecognized tax benefits is as follows:
|
2016
|
2015
|
||||||
|
Unrecognized tax benefits—beginning balance
|
$
|
110
|
|
$
|
40
|
|
|
|
Total increases—current period tax positions
|
2
|
|
13
|
|
|||
|
Total (decreases) increases—prior period tax positions
|
(21
|
)
|
69
|
|
|||
|
Lapse of statute of limitations
|
(5
|
)
|
(8
|
)
|
|||
|
Foreign currency fluctuation
|
—
|
|
(4
|
)
|
|||
|
Unrecognized tax benefits—ending balance
|
$
|
86
|
|
$
|
110
|
|
|
For 2016, the net decrease in uncertain tax positions was
$24 million
. The decrease in prior period tax positions primarily related to the reversal of uncertain tax positions for certain filing positions in foreign jurisdictions. The lapse of statute limitations was due to various state and foreign tax filing positions.
For 2015, the net increase in uncertain tax positions was
$70 million
. The current period increase of
$13 million
was primarily driven by a
$7 million
accrual related to transfer pricing positions taken in the current year. The increase in prior period tax positions of
$69 million
primarily related to an accrual of
$60 million
for the U.S. tax treatment of the Hyatt Gold Passport Program, as well as recording a long-term receivable related to a cross jurisdictional tax contingency. The aforementioned increases were partially offset by a decrease of
$8 million
due to statute expirations on various state and foreign tax filing positions.
We recognize accrued interest and penalties related to unrecognized tax benefits as a component of income tax expense. Total gross accrued interest and penalties were
$14 million
and
$19 million
at
December 31, 2016
and
December 31, 2015
, respectively.
The amount of interest and penalties recognized as a component of income tax expense in 2016 was a benefit of
$4 million
. This amount is comprised of a benefit of
$9 million
resulting from the release of interest and penalties related to certain foreign tax positions and an additional interest and penalty accrual of
$5 million
on federal, state and foreign tax matters.
The amount of interest and penalties recognized as a component of income tax expense in 2015 was a benefit of
$2 million
. This amount is comprised of a benefit of
$5 million
resulting from the release of interest and penalties due to state and foreign tax statute expirations and an additional interest and penalty accrual of
$3 million
on federal, state and foreign tax matters.
We are subject to audits by federal, state and foreign tax authorities. U.S. tax years 2012, 2013 and 2014 are currently under field examination by the IRS. Our 2009, 2010, and 2011 federal income tax returns are currently at IRS appeals level. We received a Notice of Proposed Adjustment ("NOPA") during the third quarter of 2015 related to the tax treatment of the Hyatt Gold Passport Fund. We disagree with the proposed adjustment, but if the NOPA is sustained, it would result in an additional current tax liability of
$140 million
(including interest of
$41 million
) that would be primarily offset by a deferred tax asset and, therefore, only a portion of the related interest would have an impact on the effective tax rate if recognized. The statute of limitations for U.S. tax years 2005, 2006, 2007 and 2008 remain open for the computational impacts of net operating losses and general business credit carrybacks to those years which could be impacted by the final resolution of tax years 2009-2011.
We have several state and foreign audits pending. State income tax returns are generally subject to examination for a period of three to five years after filing of the return. However, the state impact of any federal changes remains subject to examination by various states for a period generally up to one year after formal notification to the states of the federal changes. The statute of limitations for the foreign jurisdictions ranges from three to ten years after filing the applicable tax return.
14
. COMMITMENTS AND CONTINGENCIES
In the ordinary course of business, we enter into various commitments, guarantees, surety bonds, and letter of credit agreements, which are discussed below:
Commitments
—At
December 31, 2016
, we are committed, under certain conditions, to lend or invest up to
$378 million
, net of any related letters of credit, in various business ventures.
F- 37
During the year ended
December 31, 2016
, we entered into a commitment to fund up to
$50 million
of preferred equity into a third-party entity which is developing a hotel in Seattle, Washington, for which we also provided a debt repayment guarantee. During the year ended
December 31, 2016
, we also entered into a commitment to purchase land and a to-be-constructed hotel located in Portland, Oregon from the developer for a purchase price of approximately
$160 million
upon substantial completion of construction.
Performance Guarantees
—Certain of our contractual agreements with third-party owners require us to guarantee payments to the owners if specified levels of operating profit are not achieved by their hotels, see Note
2
.
Our most significant performance guarantee relates to four managed hotels in France that we began managing in the second quarter of 2013 ("the four managed hotels in France"), which has a term of
7 years
, with approximately
3.5
years remaining, and does not have an annual cap. The remaining maximum exposure related to our performance guarantees at
December 31, 2016
was
$346 million
, of which
€293 million
(
$308 million
using exchange rates at
December 31, 2016
) related to the four managed hotels in France.
We had total net performance guarantee liabilities of
$79 million
and
$97 million
at
December 31, 2016
and
December 31, 2015
, respectively, which included
$55 million
and
$81 million
recorded in other long-term liabilities and
$24 million
and
$16 million
in accrued expenses and other current liabilities on our consolidated balance sheets, respectively. Our total performance guarantee liabilities are comprised of the fair value of the guarantee obligation liabilities recorded upon inception, net of amortization and any separate contingent liabilities, net of cash payments. Performance guarantee expense or income and income from amortization of the guarantee obligation liabilities are recorded in
other income (loss), net
on the consolidated statements of income, see Note
20
.
|
The Four Managed Hotels in France
|
Other Performance Guarantees
|
Total
|
||||||||||||||||||||||
|
2016
|
2015
|
2016
|
2015
|
2016
|
2015
|
|||||||||||||||||||
|
Beginning balance, January 1
|
$
|
93
|
|
$
|
106
|
|
$
|
4
|
|
$
|
5
|
|
$
|
97
|
|
$
|
111
|
|
||||||
|
Initial guarantee obligation liability
|
—
|
|
—
|
|
9
|
|
—
|
|
9
|
|
—
|
|
||||||||||||
|
Amortization of initial guarantee obligation liability into income
|
(33
|
)
|
(10
|
)
|
(1
|
)
|
(2
|
)
|
(34
|
)
|
(12
|
)
|
||||||||||||
|
Performance guarantee expense (income), net
|
64
|
|
28
|
|
(1
|
)
|
(1
|
)
|
63
|
|
27
|
|
||||||||||||
|
Net (payments) receipts during the year
|
(57
|
)
|
(20
|
)
|
2
|
|
2
|
|
(55
|
)
|
(18
|
)
|
||||||||||||
|
Foreign currency exchange, net
|
(1
|
)
|
(11
|
)
|
—
|
|
—
|
|
(1
|
)
|
(11
|
)
|
||||||||||||
|
Ending balance, December 31
|
$
|
66
|
|
$
|
93
|
|
$
|
13
|
|
$
|
4
|
|
$
|
79
|
|
$
|
97
|
|
||||||
Additionally, we enter into certain management contracts where we have the right, but not an obligation, to make payments to certain hotel owners if their hotels do not achieve specified levels of operating profit. If we choose not to fund the shortfall, the hotel owner has the option to terminate the management contract. At
December 31, 2016
and
December 31, 2015
, there were
no
amounts recorded on our consolidated balance sheets related to these performance test clauses.
F- 38
Debt Repayment Guarantees
—We have entered into various debt repayment guarantees related to our unconsolidated hospitality venture investments and certain managed or franchised hotels. Typically, we enter into debt repayment guarantees in order to assist hotel owners in obtaining third-party financing or to obtain more favorable borrowing terms. Included within debt repayment guarantees are the following:
|
Property Description
|
Maximum Potential Future Payments
|
Maximum Exposure Net of Recoverability from Third Parties
|
Amount Recorded at December 31, 2016
|
Amount Recorded at December 31, 2015
|
Year of Guarantee Expiration
|
|||||||||||||
|
Hotel property in Washington
(1), (3), (4), (5)
|
$
|
215
|
|
$
|
—
|
|
$
|
35
|
|
$
|
—
|
|
2020
|
|||||
|
Hotel properties in India (2), (3)
|
177
|
|
177
|
|
21
|
|
27
|
|
2020
|
|||||||||
|
Hotel property in Brazil (1)
|
80
|
|
40
|
|
3
|
|
4
|
|
2020
|
|||||||||
|
Hotel property in Minnesota
|
25
|
|
25
|
|
2
|
|
2
|
|
2021
|
|||||||||
|
Hotel property in Arizona (1), (4)
|
25
|
|
—
|
|
2
|
|
3
|
|
2019
|
|||||||||
|
Hotel properties in California (1)
|
21
|
|
8
|
|
6
|
|
—
|
|
2020
|
|||||||||
|
Hotel property in Colorado
|
8
|
|
8
|
|
—
|
|
—
|
|
2017
|
|||||||||
|
Other (1)
|
25
|
|
1
|
|
—
|
|
3
|
|
various, through 2017
|
|||||||||
|
Total
|
$
|
576
|
|
$
|
259
|
|
$
|
69
|
|
$
|
39
|
|
||||||
(1) We have agreements with either our unconsolidated hospitality venture partner, the respective hotel owners or other third parties to recover certain amounts funded under the debt repayment guarantee; the recoverability mechanism may be in the form of cash, financing receivable, or HTM debt securities.
(2) We have the contractual right to recover amounts funded from the unconsolidated hospitality venture, which is a related party. We expect our maximum exposure to be
$89 million
, taking into account our partner’s
50%
ownership interest in the unconsolidated hospitality venture.
(3) Under certain events or conditions, we have the right to force the sale of the property(ies) in order to recover amounts funded.
(4) If certain funding thresholds are met or if certain events occur, we have the ability to assume control of the property.
(5) We are subject to a completion guarantee whereby the parties agree to substantially complete the construction of the project by a specified date. In the event of default, we are obligated to complete construction using the funds available from the outstanding loan. Any additional funds paid by us are subject to recovery through a HTM debt security.
At
December 31, 2016
, the hotel owners are current on their debt service obligations.
Guarantee Liabilities Fair Value
—We estimated the fair value of our guarantees to be
$231 million
and
$179 million
at
December 31, 2016
and
December 31, 2015
, respectively. Due to the lack of readily available market data, our fair value estimates utilize the following Level Three unobservable inputs:
|
2016
|
2015
|
||
|
Discount rates
|
10.6% - 12.6%
|
9.5% - 12.6%
|
|
|
Stabilized growth rates
|
1.8% - 4.8%
|
1.8% - 4.8%
|
|
|
Capitalization rates (1)
|
7.0% - 10.0%
|
6.5% - 10.0%
|
|
|
Term
|
0.2 - 7.0 years
|
0.3 - 5.0 years
|
|
(1) Reflects the risk profile of the individual markets where the assets are located and are not necessarily indicative of our portfolio as a whole.
Insurance
—We obtain commercial insurance for potential losses for general liability, workers' compensation, automobile liability, employment practices, crime, property and other miscellaneous coverages. A portion of the risk is retained on a self insurance basis primarily through U.S. based and licensed captive insurance companies that are wholly owned subsidiaries of Hyatt and that generally insure our deductibles and retentions. Reserve requirements are established based on actuarial projections of ultimate losses. Losses estimated to be paid within
twelve
months are
$30 million
and
$35 million
at
F- 39
December 31, 2016
and
December 31, 2015
, respectively, and are classified within accrued expenses and other current liabilities on our consolidated balance sheets, while losses expected to be payable in future periods are
$62 million
and
$57 million
at
December 31, 2016
and
December 31, 2015
, respectively, and are included in other long-term liabilities on the consolidated balance sheets. At
December 31, 2016
, standby letters of credit of
$7 million
were issued to provide collateral for the estimated claims, which are guaranteed by us. For further discussion, see the "—Letters of Credit" section of this footnote.
Collective Bargaining Agreements
—At
December 31, 2016
, approximately
25%
of our U.S. based employees were covered by various collective bargaining agreements, generally providing for basic pay rates, working hours, other conditions of employment and orderly settlement of labor disputes. Certain employees are covered by union sponsored multi-employer pension and health plans pursuant to agreements between us and various unions. Our contributions to these multi-employer pension and health plans are based on a percentage of all union employee wages as dictated by the collective bargaining agreements, which expire at various dates between August 31, 2018 and June 30, 2026. Generally, labor relations have been maintained in a normal and satisfactory manner, and we believe our employee relations are good.
Surety Bonds
—Surety bonds issued on our behalf were
$25 million
at
December 31, 2016
and primarily relate to workers’ compensation, taxes, licenses and utilities related to our lodging operations.
Letters of Credit
—Letters of credit outstanding on our behalf at
December 31, 2016
were
$230 million
, which relate to our ongoing operations and securitization of our performance under our debt repayment guarantee associated with the hotel properties in India, which is only called upon if we default on our guarantee. The letters of credit outstanding do not reduce the available capacity under our revolving credit facility (see Note
9
).
Capital Expenditures
—As part of our ongoing business operations, significant expenditures are required to complete renovation projects that have been approved.
Other—
We act as general partner of various partnerships owning hotel properties that are subject to mortgage indebtedness. These mortgage agreements generally limit the lender’s recourse to security interests in assets financed and/or other assets of the partnership(s) and/or the general partner(s) thereof.
In conjunction with financing obtained for our unconsolidated hospitality ventures and certain managed hotels, we may provide standard indemnifications to the lender for loss, liability or damage occurring as a result of our actions or actions of the other unconsolidated hospitality venture owners.
We are subject, from time to time, to various claims and contingencies related to lawsuits, taxes, and environmental matters, as well as commitments under contractual obligations. Many of these claims are covered under the current insurance programs, subject to deductibles. We recognize a liability associated with commitments and contingencies when a loss is probable and reasonably estimable. Although the ultimate liability for these matters cannot be determined at this point, based on information currently available, we do not expect the ultimate resolution of such claims and litigation will have a material effect on our consolidated financial statements.
F- 40
15
. STOCKHOLDERS’ EQUITY AND COMPREHENSIVE LOSS
Common Stock—
At
December 31, 2016
, Pritzker family business interests beneficially owned, in the aggregate, approximately
83.6%
of our Class B common stock and less than
0.1%
of our Class A common stock, representing approximately
58.1%
of the outstanding shares of our common stock and approximately
80.1%
of the total voting power of our outstanding common stock. As a result, consistent with the voting agreements contained in the Amended and Restated Global Hyatt Agreement and Amended and Restated Foreign Global Hyatt Agreement, Pritzker family business interests are able to exert a significant degree of influence or actual control over our management and affairs and over matters requiring stockholder approval, including the election of directors and other significant corporate transactions. While the voting agreements are in effect, they may provide our board of directors with effective control over matters requiring stockholder approval. Because of our dual class ownership structure, Pritzker family business interests will continue to exert a significant degree of influence or actual control over matters requiring stockholder approval, even if they own less than 50% of the outstanding shares of our common stock. Pursuant to the Amended and Restated Global Hyatt Agreement and Amended and Restated Foreign Global Hyatt Agreement, the Pritzker family business interests have agreed to certain voting agreements and to certain limitations with respect to the sale of shares of our common stock. In addition, other stockholders, including entities affiliated with Goldman, Sachs & Co. and Madrone GHC, LLC, beneficially own, in the aggregate, approximately
16.4%
of our outstanding Class B common stock and approximately
7.9%
of our outstanding Class A common stock, representing approximately
13.8%
of the outstanding shares of our common stock and approximately
16.1%
of the total voting power of our outstanding common stock. Pursuant to the 2007 Stockholders’ Agreement, these entities have also agreed to certain voting agreements and to certain limitations with respect to the sale of shares of our common stock.
Share Repurchase
— During 2016, 2015 and 2014, our board of directors authorized the repurchase of up to $
500 million
, $
400 million
and $
700 million
, respectively, of our common stock. These repurchases may be made from time to time in the open market, in privately negotiated transactions, or otherwise, including pursuant to a Rule 10b5-1 plan, at prices that we deem appropriate and subject to market conditions, applicable law and other factors deemed relevant in our sole discretion. The common stock repurchase program applies to our Class A common stock and/or our Class B common stock. The common stock repurchase program does not obligate us to repurchase any dollar amount or number of shares of common stock and the program may be suspended or discontinued at any time.
During 2016 and 2015, we repurchased
5,631,557
and
13,199,811
shares of common stock, respectively. These shares of common stock were repurchased at a weighted average price of
$48.37
and
$54.17
per share, respectively, for an aggregate purchase price of
$272 million
and
$715 million
, respectively, excluding related insignificant expenses in both periods. The shares repurchased during 2016 represented approximately
4%
of our total shares of common stock outstanding at December 31, 2015. The shares repurchased during 2015 represented approximately
9%
of our total shares of common stock outstanding at December 31, 2014. The shares of Class A common stock repurchased on the open market were retired and returned to the status of authorized and unissued while the shares of Class B common stock repurchased were retired and the total number of authorized Class B shares was reduced by the number of shares repurchased. At
December 31, 2016
, we had
$357 million
remaining under the current share repurchase authorization.
Treasury Stock Retirement
— During 2015, we retired
195,423
shares of treasury stock. These shares were retired at a weighted average price of
$43.41
resulting in an
$8 million
reduction in treasury stock. The retired shares of treasury stock were returned to the status of authorized and unissued.
F- 41
Accumulated Other Comprehensive Loss—
The following tables detail the accumulated other comprehensive loss activity for the years ended
December 31, 2016
and December 31,
2015
, respectively.
|
Balance at
January 1, 2016
|
Current period other comprehensive income (loss) before reclassification
|
Amount reclassified from accumulated other comprehensive loss (a)
|
Balance at
December 31, 2016
|
||||||||||||
|
Foreign currency translation adjustments
|
$
|
(257
|
)
|
$
|
(45
|
)
|
$
|
3
|
|
$
|
(299
|
)
|
|||
|
Unrealized gains (losses) on AFS securities
|
39
|
|
(6
|
)
|
—
|
|
33
|
|
|||||||
|
Unrecognized pension cost
|
(7
|
)
|
—
|
|
—
|
|
(7
|
)
|
|||||||
|
Unrealized gains (losses) on derivative instruments
|
(5
|
)
|
1
|
|
—
|
|
(4
|
)
|
|||||||
|
Accumulated other comprehensive income (loss)
|
$
|
(230
|
)
|
$
|
(50
|
)
|
$
|
3
|
|
$
|
(277
|
)
|
|||
|
(a) The amount reclassified from accumulated other comprehensive loss related to the sale of the shares of the company that owns Hyatt Regency Birmingham (U.K.) and was recorded within other long-term liabilities on our consolidated balance sheets.
|
|||||||||||||||
|
Balance at
January 1, 2015
|
Current period other comprehensive income (loss) before reclassification
|
Amount reclassified from accumulated other comprehensive loss (b)
|
Balance at
December 31, 2015
|
||||||||||||
|
Foreign currency translation adjustments
|
$
|
(155
|
)
|
$
|
(123
|
)
|
$
|
21
|
|
$
|
(257
|
)
|
|||
|
Unrealized gains on AFS securities
|
6
|
|
33
|
|
—
|
|
39
|
|
|||||||
|
Unrecognized pension cost
|
(5
|
)
|
(2
|
)
|
—
|
|
(7
|
)
|
|||||||
|
Unrealized gains (losses) on derivative instruments
|
(6
|
)
|
1
|
|
—
|
|
(5
|
)
|
|||||||
|
Accumulated other comprehensive income (loss)
|
$
|
(160
|
)
|
$
|
(91
|
)
|
$
|
21
|
|
$
|
(230
|
)
|
|||
|
(b) The amount reclassified from accumulated other comprehensive loss was recognized within equity earnings (losses) from unconsolidated hospitality ventures on our consolidated statements of income.
|
|||||||||||||||
16
. STOCK-BASED COMPENSATION
As part of our LTIP, we award SARs, RSUs, PSUs and PSs to certain employees, see Note 2. Compensation expense and unearned compensation presented below exclude amounts related to employees of our managed hotels and other employees whose payroll is reimbursed, as this expense has been and will continue to be reimbursed by our third-party hotel owners and is recorded within other revenues from managed properties and other costs from managed properties on our consolidated statements of income. Stock-based compensation expense (income) primarily included in selling, general, and administration expense on our consolidated statements of income related to these awards was as follows:
|
|
Years Ended December 31,
|
||||||||||
|
|
2016
|
2015
|
2014
|
||||||||
|
SARs
|
$
|
10
|
|
$
|
9
|
|
$
|
19
|
|
||
|
RSUs
|
15
|
|
17
|
|
31
|
|
|||||
|
PSUs and PSs
|
—
|
|
(3
|
)
|
4
|
|
|||||
The years ended December 31, 2016 and December 31, 2015 include a reversal of previously recorded compensation expense based on our current assessment of expected achievement relative to the applicable performance target related to certain PS awards.
The year ended December 31, 2014 includes a nonrecurring expense of
$23 million
, a portion of which relates to prior periods for grants made to certain individuals. The nonrecurring expense for SARs and RSUs shown in the table above for the year ended December 31, 2014 amounted to
$10 million
and
$13 million
, respectively, of which
$22 million
is recorded in selling, general, and administrative expenses on our consolidated statements of income.
F- 42
The expected income tax benefit to be realized at the time of vest related to these awards for the years ended
December 31, 2016
,
December 31, 2015
and
December 31, 2014
was as follows:
|
|
Years Ended December 31,
|
||||||||||
|
|
2016
|
2015
|
2014
|
||||||||
|
SARs
|
$
|
4
|
|
$
|
3
|
|
$
|
7
|
|
||
|
RSUs
|
5
|
|
5
|
|
8
|
|
|||||
|
PSUs and PSs
|
—
|
|
(1
|
)
|
2
|
|
|||||
SARs
—The following table sets forth a summary of the SAR grants in
2016
,
2015
, and
2014
:
|
Grant Date
|
SARs Granted
|
Value at Date of Grant
|
Vesting Period
|
Vesting Start Month
|
||||||||
|
March 2016
|
45,710
|
|
$
|
14.22
|
|
33
|
% annually
|
March 2017
|
||||
|
March 2016
|
878,714
|
|
14.54
|
|
25
|
% annually
|
March 2017
|
|||||
|
March 2015
|
380,604
|
|
20.64
|
|
25
|
% annually
|
March 2016
|
|||||
|
March 2015
|
41,373
|
|
24.17
|
|
50
|
% annually
|
March 2018
|
|||||
|
February 2015
|
39,401
|
|
25.38
|
|
100
|
% at vest
|
March 2018
|
|||||
|
February 2014
|
327,307
|
|
22.57
|
|
25
|
% annually
|
March 2015
|
|||||
The weighted average grant date fair value for the awards granted in
2016
,
2015
and
2014
was
$14.52
,
$21.36
, and
$22.57
, respectively.
The fair value of each SAR was estimated based on the date of grant using the
Black-
Scholes-
Merton
option-
pricing model with the following weighted average assumptions:
|
2016
|
2015
|
2014
|
|||||||||
|
Exercise Price
|
$
|
47.36
|
|
$
|
56.57
|
|
$
|
49.39
|
|
||
|
Expected Life in Years
|
6.227
|
|
6.309
|
|
6.290
|
|
|||||
|
Risk-free Interest Rate
|
1.55
|
%
|
1.63
|
%
|
1.93
|
%
|
|||||
|
Expected Volatility
|
27.72
|
%
|
35.39
|
%
|
44.32
|
%
|
|||||
|
Annual Dividend Yield
|
—
|
%
|
—
|
%
|
—
|
%
|
|||||
At
December 31, 2016
we used an estimated forfeiture rate of
0%
because only a small group of executives received these grants and we have limited data on which to base these estimates. Due to a lack of historical exercise information the expected life was estimated based on the midpoint between the vesting period and the contractual life of each SAR. The risk-free interest rate was based on U.S. Treasury instruments with similar expected life. We calculate volatility using a blend of our trading history and an average historical volatility of our peer group over a time period consistent with our expected term assumption.
A summary of employee SAR activity is presented below:
|
SAR Units
|
Weighted Average Exercise Price (in whole dollars)
|
Weighted Average Contractual Term
|
||||||
|
Outstanding at December 31, 2015:
|
3,876,937
|
|
$
|
47.63
|
|
5.03
|
||
|
Granted
|
924,424
|
|
47.36
|
|
9.22
|
|||
|
Exercised
|
(325,339
|
)
|
43.09
|
|
2.08
|
|||
|
Forfeited or canceled
|
(22,035
|
)
|
53.32
|
|
5.04
|
|||
|
Outstanding at December 31, 2016:
|
4,453,987
|
|
$
|
47.88
|
|
5.25
|
||
|
Exercisable at December 31, 2016:
|
2,855,153
|
|
$
|
47.09
|
|
3.44
|
||
The total intrinsic value of SARs outstanding at
December 31, 2016
was
$39 million
and the total intrinsic value for exercisable SARs was
$29 million
at
December 31, 2016
.
RSUs
—The following table sets forth a summary of the employee RSU grants:
F- 43
|
Grant Date
|
RSUs
|
Value
|
Total Value (in millions)
|
Vesting Period
|
|||||||||
|
December 2016
|
40,633
|
|
$
|
56.60
|
|
$
|
2
|
|
4 years
|
||||
|
March 2016
|
444,629
|
|
47.36
|
|
21
|
|
4 years
|
||||||
|
December 2015
|
4,089
|
|
48.90
|
|
—
|
|
4 years
|
||||||
|
September 2015
|
3,898
|
|
51.30
|
|
—
|
|
3 years
|
||||||
|
September 2015
|
8,576
|
|
51.30
|
|
—
|
|
4 years
|
||||||
|
May 2015
|
23,746
|
|
58.95
|
|
1
|
|
4 years
|
||||||
|
March 2015
|
380,939
|
|
56.27
|
|
21
|
|
4 years
|
||||||
|
February 2015
|
29,278
|
|
59.77
|
|
2
|
|
4 years
|
||||||
|
September 2014
|
2,452
|
|
61.17
|
|
—
|
|
4 years
|
||||||
|
February 2014
|
376,328
|
|
49.39
|
|
19
|
|
4 years
|
||||||
The liability and related expense for granted
cash-
settled RSUs are
insignificant
as of and for the year ended
December 31, 2016
.
A summary of the status of the nonvested employee restricted stock unit awards outstanding under the LTIP is presented below:
|
Restricted Stock
Units
|
Weighted Average Grant Date Fair Value (in whole dollars)
|
|||||
|
Nonvested at December 31, 2015:
|
1,014,574
|
|
$
|
50.02
|
|
|
|
Granted
|
485,262
|
|
48.13
|
|
||
|
Vested
|
(394,087
|
)
|
47.42
|
|
||
|
Forfeited or canceled
|
(89,572
|
)
|
49.78
|
|
||
|
Nonvested at December 31, 2016:
|
1,016,177
|
|
$
|
50.15
|
|
|
Our estimated forfeiture rate is approximately
3%
. The total intrinsic value of nonvested RSUs at
December 31, 2016
was
$56 million
.
PSUs and PSs
—The following table sets forth a summary of PSU and PS grants:
|
Year Granted
|
PSUs and PSs Granted
|
Weighted Average Grant Date Fair Value (in whole dollars)
|
Performance Period
|
Performance Period Start Date
|
|||||||
|
2016 PSUs
|
111,620
|
|
$
|
47.36
|
|
3 years
|
January 1, 2016
|
||||
|
2015 PSs
|
146,902
|
|
$
|
56.27
|
|
3 years
|
January 1, 2015
|
||||
|
2014 PSs
|
162,906
|
|
$
|
49.39
|
|
3 years
|
January 1, 2014
|
||||
There were
$8 million
in forfeitures for the year ended
December 31, 2016
. At
December 31, 2016
the total intrinsic value of nonvested PSs and PSUs if target performance is achieved was
$6 million
.
Unearned Compensation
—Our total unearned compensation for our
stock-
based compensation programs at
December 31, 2016
was
$6 million
for SARs,
$15 million
for RSUs and
$4 million
for PSUs and PSs, which is expected to be recorded to compensation expense as follows:
|
2017
|
2018
|
2019
|
2020
|
Total
|
|||||||||||||||
|
SARs
|
$
|
3
|
|
$
|
2
|
|
$
|
1
|
|
$
|
—
|
|
$
|
6
|
|
||||
|
RSUs
|
7
|
|
4
|
|
3
|
|
1
|
|
15
|
|
|||||||||
|
PSUs and PSs
|
2
|
|
2
|
|
—
|
|
—
|
|
4
|
|
|||||||||
|
Total
|
$
|
12
|
|
$
|
8
|
|
$
|
4
|
|
$
|
1
|
|
$
|
25
|
|
||||
F- 44
17
. RELATED-PARTY TRANSACTIONS
In addition to those included elsewhere in the Notes to the consolidated financial statements,
related-
party transactions entered into by us are summarized as follows:
Leases
—Our corporate headquarters have been located at the Hyatt Center in Chicago, Illinois since 2005. A subsidiary of the Company holds a master lease for a portion of the Hyatt Center and has entered into sublease agreements with certain related parties. Future expected sublease income for this space from related parties is
$4 million
.
Legal Services
—A partner in a law firm that provided services to us throughout
2016
,
2015
, and
2014
is the
brother-
in-
law of our Executive Chairman. We incurred legal fees with this firm of
$2 million
,
$6 million
and
$3 million
for each of the years ended
December 31, 2016
,
December 31, 2015
, and
December 31, 2014
, respectively. Legal fees, when expensed, are included in selling, general, and administrative expenses. At
December 31, 2016
and
December 31, 2015
, we had insignificant amounts due to the law firm.
Equity Method Investments
—We have equity method investments in entities that own properties for which we provide management or franchise services and receive fees. We recorded fees of
$30 million
,
$26 million
, and
$29 million
for the years ended
December 31, 2016
,
December 31, 2015
, and
December 31, 2014
, respectively. At
December 31, 2016
and
December 31, 2015
, we had receivables due from these properties of
$7 million
and
$6 million
, respectively. In addition, in some cases we provide loans (see Note
6
) or guarantees (see Note
14
) to these entities. During the years ended
December 31, 2016
,
December 31, 2015
, and
December 31, 2014
, we recorded fees related to these guarantees of
$5 million
,
$2 million
, and
$2 million
, respectively. Our ownership interest in these unconsolidated hospitality ventures varies from
24%
to
70%
. See Note
3
for further details regarding these investments.
Class B Share Repurchase
—During
2016
, we repurchased
1,881,636
shares of Class B common stock for a weighted average price of
$53.15
per share, for an aggregate purchase price of approximately
$100 million
. The shares repurchased represented approximately
1%
of our total shares of common stock outstanding prior to the repurchase. During
2015
, we repurchased
1,776,501
shares of Class B common stock at a weighted average price of
$58.91
per share, for an aggregate purchase price of approximately
$105 million
. The shares repurchased represented approximately
1%
of our total shares of common stock outstanding prior to the repurchase. The shares of Class B common stock were repurchased in privately negotiated transactions from trusts for the benefit of certain Pritzker family members and limited partnerships owned indirectly by trusts for the benefit of certain Pritzker family members and were retired, thereby reducing the total number of shares outstanding and reducing the shares of Class B common stock authorized and outstanding by the repurchased share amount.
Class B Share Conversion
—During the year ended
December 31, 2016
,
16,884,117
shares of Class B common stock were converted on a share-for-share basis into shares of our Class A common stock,
$0.01
par value per share. The shares of Class B common stock that were converted into shares of Class A common stock have been retired, thereby reducing the shares of Class B common stock authorized and outstanding.
18
. SEGMENT AND GEOGRAPHIC INFORMATION
Our reportable segments are components of the business which are managed discretely and for which discrete financial information is reviewed regularly by the chief operating decision maker to assess performance and make decisions regarding the allocation of resources. Our chief operating decision maker is the President and Chief Executive Officer. We define our reportable segments as follows:
|
•
|
Owned and leased hotels
—This segment derives its earnings from owned and leased hotel properties located predominantly in the United States, but also in certain international locations and for purposes of segment Adjusted EBITDA, includes our pro rata share of the Adjusted EBITDA of our unconsolidated hospitality ventures, based on our ownership percentage of each venture. Adjusted EBITDA includes intercompany expenses related to management fees paid to the Company's management and franchising segments, which are eliminated in consolidation. Intersegment revenues relate to promotional award redemptions earned by our owned and leased hotels related to our co-branded credit card, which are eliminated in consolidation.
|
|
•
|
Americas management and franchising
—This segment derives its earnings primarily from a combination of hotel management and licensing of our portfolio of brands to franchisees located in the United States, Latin America, Canada and the Caribbean. This segment’s revenues also include the reimbursement of costs incurred on behalf of managed hotel property owners and franchisees with no added margin. These costs relate primarily to payroll costs at managed properties where the Company is the employer. These revenues and costs are recorded within other revenues
|
F- 45
from managed properties and other costs from managed properties, respectively. The intersegment revenues relate to management fees collected from the Company’s owned hotels, which are eliminated in consolidation.
|
•
|
ASPAC management and franchising
—This segment derives its earnings primarily from a combination of hotel management and licensing of our portfolio of brands to franchisees located in Southeast Asia, as well as Greater China, Australia, South Korea, Japan and Micronesia. This segment’s revenues also include the reimbursement of costs incurred on behalf of managed hotel property owners and franchisees with no added margin. These costs relate primarily to reservations, marketing and technology costs. These revenues and costs are recorded within other revenues from managed properties and other costs from managed properties, respectively. The intersegment revenues relate to management fees collected from the Company’s owned hotels, which are eliminated in consolidation.
|
|
•
|
EAME/SW Asia management and franchising
—This segment derives its earnings primarily from a combination of hotel management and licensing of our portfolio of brands to franchisees located primarily in Europe, Africa, the Middle East, India, Central Asia and Nepal. This segment’s revenues also include the reimbursement of costs incurred on behalf of managed hotel property owners and franchisees with no added margin. These costs relate primarily to reservations, marketing and technology costs. These revenues and costs are recorded within other revenues from managed properties and other costs from managed properties, respectively. The intersegment revenues relate to management fees collected from the Company’s owned hotels, which are eliminated in consolidation.
|
Our chief operating decision maker evaluates performance based on each segment’s revenue and Adjusted EBITDA. Adjusted EBITDA, as we define it, is a non-GAAP measure. We define Adjusted EBITDA as net income attributable to Hyatt Hotels Corporation plus our pro rata share of unconsolidated hospitality ventures Adjusted EBITDA based on our ownership percentage of each venture, adjusted to exclude interest expense; provision for income taxes; depreciation and amortization; equity earnings (losses) from unconsolidated hospitality ventures; stock-based compensation expense; gains (losses) on sales of real estate and other; asset impairments; other (income) loss, net; and net income attributable to noncontrolling interests.
Effective January 1, 2016, our definition of Adjusted EBITDA has been updated to exclude stock-based compensation expense to facilitate comparison with our competitors. We have applied this change in the definition of Adjusted EBITDA to 2015 and 2014 historical results to allow for comparability between the periods presented.
F- 46
The table below shows summarized consolidated financial information by segment. Included within corporate and other are unallocated corporate expenses, license fees related to Hyatt Residence Club, our
co-
branded credit card and our vacation ownership business prior to the sale in the fourth quarter of 2014.
|
Years Ended December 31,
|
|||||||||||
|
2016
|
2015
|
2014
|
|||||||||
|
Owned and leased hotels
|
|||||||||||
|
Owned and leased hotels revenues
|
$
|
2,119
|
|
$
|
2,079
|
|
$
|
2,246
|
|
||
|
Intersegment revenues (a)
|
11
|
|
—
|
|
—
|
|
|||||
|
Adjusted EBITDA
|
516
|
|
493
|
|
523
|
|
|||||
|
Depreciation and amortization
|
285
|
|
277
|
|
322
|
|
|||||
|
Capital expenditures
|
200
|
|
225
|
|
208
|
|
|||||
|
Americas management and franchising
|
|||||||||||
|
Management and franchise fees revenues
|
371
|
|
354
|
|
327
|
|
|||||
|
Other revenues from managed properties
|
1,670
|
|
1,641
|
|
1,550
|
|
|||||
|
Intersegment revenues (a)
|
75
|
|
74
|
|
88
|
|
|||||
|
Adjusted EBITDA
|
318
|
|
300
|
|
265
|
|
|||||
|
Depreciation and amortization
|
18
|
|
19
|
|
18
|
|
|||||
|
Capital expenditures
|
—
|
|
—
|
|
1
|
|
|||||
|
ASPAC management and franchising
|
|||||||||||
|
Management and franchise fees revenues
|
96
|
|
91
|
|
88
|
|
|||||
|
Other revenues from managed properties
|
98
|
|
87
|
|
74
|
|
|||||
|
Intersegment revenues (a)
|
2
|
|
2
|
|
2
|
|
|||||
|
Adjusted EBITDA
|
57
|
|
55
|
|
49
|
|
|||||
|
Depreciation and amortization
|
1
|
|
1
|
|
1
|
|
|||||
|
Capital expenditures
|
1
|
|
1
|
|
1
|
|
|||||
|
EAME/SW Asia management and franchising
|
|||||||||||
|
Management and franchise fees revenues
|
65
|
|
67
|
|
77
|
|
|||||
|
Other revenues from managed properties
|
65
|
|
58
|
|
53
|
|
|||||
|
Intersegment revenues (a)
|
10
|
|
13
|
|
15
|
|
|||||
|
Adjusted EBITDA
|
33
|
|
33
|
|
43
|
|
|||||
|
Depreciation and amortization
|
5
|
|
5
|
|
6
|
|
|||||
|
Capital expenditures
|
1
|
|
—
|
|
—
|
|
|||||
|
Corporate and other
|
|||||||||||
|
Revenues
|
43
|
|
40
|
|
75
|
|
|||||
|
Other revenues from managed properties
|
—
|
|
—
|
|
30
|
|
|||||
|
Adjusted EBITDA
|
(139
|
)
|
(131
|
)
|
(103
|
)
|
|||||
|
Depreciation and amortization
|
33
|
|
18
|
|
7
|
|
|||||
|
Capital expenditures
|
9
|
|
43
|
|
43
|
|
|||||
|
Eliminations (a)
|
|||||||||||
|
Revenues
|
(98
|
)
|
(89
|
)
|
(105
|
)
|
|||||
|
Adjusted EBITDA
|
—
|
|
—
|
|
—
|
|
|||||
|
Depreciation and amortization
|
—
|
|
—
|
|
—
|
|
|||||
|
Capital expenditures
|
—
|
|
—
|
|
—
|
|
|||||
|
TOTAL
|
|||||||||||
|
Revenues
|
$
|
4,429
|
|
$
|
4,328
|
|
$
|
4,415
|
|
||
|
Adjusted EBITDA
|
785
|
|
750
|
|
777
|
|
|||||
|
Depreciation and amortization
|
342
|
|
320
|
|
354
|
|
|||||
|
Capital expenditures
|
211
|
|
269
|
|
253
|
|
|||||
|
(a)
|
Intersegment revenues are included in the management and franchise fees revenues and owned and leased hotels revenues and eliminated in Eliminations.
|
F- 47
The table below presents summarized consolidated balance sheet information by segment:
Total Assets
|
December 31, 2016
|
December 31, 2015
|
||||||
|
Owned and leased hotels
|
$
|
5,393
|
|
$
|
5,281
|
|
|
|
Americas management and franchising
|
564
|
|
464
|
|
|||
|
ASPAC management and franchising
|
128
|
|
131
|
|
|||
|
EAME/SW Asia management and franchising
|
186
|
|
234
|
|
|||
|
Corporate and other
|
1,478
|
|
1,481
|
|
|||
|
TOTAL
|
$
|
7,749
|
|
$
|
7,591
|
|
|
The following tables present revenues and property and equipment, net, intangibles, net and goodwill by geographical region:
|
Years Ended December 31,
|
|||||||||||
|
2016
|
2015
|
2014
|
|||||||||
|
Revenues:
|
|||||||||||
|
United States
|
$
|
3,571
|
|
$
|
3,494
|
|
$
|
3,476
|
|
||
|
All Foreign
|
858
|
|
834
|
|
939
|
|
|||||
|
Total
|
$
|
4,429
|
|
$
|
4,328
|
|
$
|
4,415
|
|
||
|
|
December 31, 2016
|
December 31, 2015
|
|
||||||||
|
Property and equipment, net, Intangibles, net and Goodwill:
|
|||||||||||
|
United States
|
$
|
3,915
|
|
$
|
3,562
|
|
|||||
|
All Foreign
|
1,079
|
|
1,145
|
|
|||||||
|
Total
|
$
|
4,994
|
|
$
|
4,707
|
|
|||||
The table below provides a reconciliation of our net income attributable to Hyatt Hotels Corporation to EBITDA and a reconciliation of EBITDA to our consolidated Adjusted EBITDA
:
|
|
Years Ended December 31,
|
||||||||||
|
2016
|
2015
|
2014
|
|||||||||
|
Net income attributable to Hyatt Hotels Corporation
|
$
|
204
|
|
$
|
124
|
|
$
|
344
|
|
||
|
Interest expense
|
76
|
|
68
|
|
71
|
|
|||||
|
Provision for income taxes
|
85
|
|
70
|
|
179
|
|
|||||
|
Depreciation and amortization
|
342
|
|
320
|
|
354
|
|
|||||
|
EBITDA
|
707
|
|
582
|
|
948
|
|
|||||
|
Equity (earnings) losses from unconsolidated hospitality ventures
|
(68
|
)
|
64
|
|
(25
|
)
|
|||||
|
Stock-based compensation expense
|
25
|
|
23
|
|
49
|
|
|||||
|
(Gains) losses on sales of real estate and other
|
23
|
|
(9
|
)
|
(311
|
)
|
|||||
|
Asset impairments
|
—
|
|
5
|
|
17
|
|
|||||
|
Other (income) loss, net
|
(2
|
)
|
5
|
|
17
|
|
|||||
|
Net income attributable to noncontrolling interests
|
—
|
|
—
|
|
2
|
|
|||||
|
Pro rata share of unconsolidated hospitality ventures Adjusted EBITDA
|
100
|
|
80
|
|
80
|
|
|||||
|
Adjusted EBITDA
|
$
|
785
|
|
$
|
750
|
|
$
|
777
|
|
||
F- 48
19
. EARNINGS PER SHARE
The calculation of basic and diluted earnings per share, including a reconciliation of the numerator and denominator, are as follows:
|
|
Years Ended December 31,
|
||||||||||
|
2016
|
2015
|
2014
|
|||||||||
|
Numerator:
|
|||||||||||
|
Net income
|
$
|
204
|
|
$
|
124
|
|
$
|
346
|
|
||
|
Net (income) loss attributable to noncontrolling interests
|
—
|
|
—
|
|
(2
|
)
|
|||||
|
Net income attributable to Hyatt Hotels Corporation
|
$
|
204
|
|
$
|
124
|
|
$
|
344
|
|
||
|
Denominator:
|
|||||||||||
|
Basic weighted average shares outstanding
|
132,930,578
|
|
142,814,868
|
|
153,136,511
|
|
|||||
|
Share-based compensation
|
1,008,753
|
|
1,184,455
|
|
1,213,941
|
|
|||||
|
Diluted weighted average shares outstanding
|
133,939,331
|
|
143,999,323
|
|
154,350,452
|
|
|||||
|
Basic Earnings Per Share:
|
|||||||||||
|
Net income
|
$
|
1.53
|
|
$
|
0.87
|
|
$
|
2.26
|
|
||
|
Net (income) loss attributable to noncontrolling interests
|
—
|
|
—
|
|
(0.01
|
)
|
|||||
|
Net income attributable to Hyatt Hotels Corporation
|
$
|
1.53
|
|
$
|
0.87
|
|
$
|
2.25
|
|
||
|
Diluted Earnings Per Share:
|
|||||||||||
|
Net income
|
$
|
1.52
|
|
$
|
0.86
|
|
$
|
2.24
|
|
||
|
Net (income) loss attributable to noncontrolling interests
|
—
|
|
—
|
|
(0.01
|
)
|
|||||
|
Net income attributable to Hyatt Hotels Corporation
|
$
|
1.52
|
|
$
|
0.86
|
|
$
|
2.23
|
|
||
The computations of diluted net income per share for the years ended
December 31, 2016
,
December 31, 2015
and
December 31, 2014
do not include the following shares of Class A common stock assumed to be issued as
stock-
settled SARs and RSUs because they are
anti-
dilutive.
|
Years Ended December 31,
|
||||||||
|
2016
|
2015
|
2014
|
||||||
|
SARs
|
74,500
|
|
1,500
|
|
5,200
|
|
||
|
RSUs
|
900
|
|
—
|
|
|
—
|
|
|
20
. OTHER INCOME (LOSS), NET
|
For the years ended December 31,
|
|||||||||||
|
2016
|
2015
|
2014
|
|||||||||
|
Performance guarantee liability amortization (Note 14)
|
34
|
|
12
|
|
7
|
|
|||||
|
Depreciation recovery
|
25
|
|
12
|
|
2
|
|
|||||
|
Interest income
|
19
|
|
8
|
|
11
|
|
|||||
|
Foreign currency gains (losses), net
|
1
|
|
(14
|
)
|
(3
|
)
|
|||||
|
Realized losses (Note 4)
|
(6
|
)
|
—
|
|
—
|
|
|||||
|
Performance guarantee expense, net (Note 14)
|
(63
|
)
|
(27
|
)
|
(23
|
)
|
|||||
|
Other
|
(8
|
)
|
4
|
|
(11
|
)
|
|||||
|
Other income (loss), net
|
$
|
2
|
|
$
|
(5
|
)
|
$
|
(17
|
)
|
||
21
. SUBSEQUENT EVENT
On January 17, 2017, we acquired Miraval Group from an unrelated third party for approximately
$215 million
. The transaction included the Miraval Life in Balance Spa brand, Miraval Arizona Resort & Spa, the Travaasa Resort and the option to acquire the Cranwell Spa & Golf Resort. On January 26, 2017, we acquired the Cranwell Spa & Golf Resort for approximately
$20 million
.
F- 49
22
. QUARTERLY FINANCIAL INFORMATION (UNAUDITED)
The following table sets forth the historical unaudited quarterly financial data. The information for each of these periods has been prepared on the same basis as the audited consolidated financial statements and, in our opinion, reflects all adjustments necessary to present fairly our financial results. Operating results for previous periods do not necessarily indicate results that may be achieved in any future period.
|
|
For the three months ended
|
||||||||||||||||||||||||||||||
|
December 31, 2016
|
September 30, 2016
|
June 30, 2016
|
March 31, 2016
|
December 31, 2015
|
September 30, 2015
|
June 30, 2015
|
March 31, 2015
|
||||||||||||||||||||||||
|
Consolidated statements of income data:
|
|||||||||||||||||||||||||||||||
|
Owned and leased hotels
|
$
|
514
|
|
$
|
519
|
|
$
|
559
|
|
$
|
516
|
|
$
|
530
|
|
$
|
500
|
|
$
|
540
|
|
$
|
509
|
|
|||||||
|
Management and franchise fees
|
116
|
|
110
|
|
115
|
|
107
|
|
107
|
|
103
|
|
112
|
|
105
|
|
|||||||||||||||
|
Other revenues
|
9
|
|
11
|
|
11
|
|
9
|
|
10
|
|
10
|
|
9
|
|
7
|
|
|||||||||||||||
|
Other revenues from managed properties
|
448
|
|
448
|
|
480
|
|
457
|
|
462
|
|
440
|
|
451
|
|
433
|
|
|||||||||||||||
|
Total revenues
|
1,087
|
|
1,088
|
|
1,165
|
|
1,089
|
|
1,109
|
|
1,053
|
|
1,112
|
|
1,054
|
|
|||||||||||||||
|
Direct and selling, general, and administrative expenses
|
1,027
|
|
1,019
|
|
1,063
|
|
1,021
|
|
1,047
|
|
965
|
|
998
|
|
995
|
|
|||||||||||||||
|
Net income
|
41
|
|
62
|
|
67
|
|
34
|
|
37
|
|
25
|
|
40
|
|
22
|
|
|||||||||||||||
|
Net income attributable to Hyatt Hotels Corporation
|
41
|
|
62
|
|
67
|
|
34
|
|
37
|
|
25
|
|
40
|
|
22
|
|
|||||||||||||||
|
Net income per common share, basic
|
$
|
0.31
|
|
$
|
0.48
|
|
$
|
0.50
|
|
$
|
0.25
|
|
$
|
0.26
|
|
$
|
0.18
|
|
$
|
0.28
|
|
$
|
0.15
|
|
|||||||
|
Net income per common share, diluted
|
$
|
0.31
|
|
$
|
0.47
|
|
$
|
0.49
|
|
$
|
0.25
|
|
$
|
0.26
|
|
$
|
0.18
|
|
$
|
0.27
|
|
$
|
0.15
|
|
|||||||
F- 50
HYATT HOTELS CORPORATION AND SUBSIDIARIES
SCHEDULE II—VALUATION AND QUALIFYING ACCOUNTS
For the Years Ended
December 31, 2016
,
December 31, 2015
, and
December 31, 2014
(In millions of dollars)
|
Column A
|
Column B
|
Column C
|
Column D
|
Column E
|
||||||||||||||||
|
Description
|
Balance at Beginning of Period
|
Additions Charged to Revenues, Costs and Expenses
|
Additions Charged to Other Accounts
|
Deductions
|
Balance at End of Period
|
|||||||||||||||
|
Year Ended December 31, 2016:
|
||||||||||||||||||||
|
Trade receivables—allowance for doubtful accounts
|
$
|
15
|
|
$
|
6
|
|
$
|
—
|
|
$
|
(3
|
)
|
$
|
18
|
|
|||||
|
Financing receivables—allowance for losses
|
98
|
|
10
|
|
—
|
|
(8
|
)
|
100
|
|
||||||||||
|
Deferred tax assets—valuation allowance
|
17
|
|
10
|
|
—
|
|
—
|
|
27
|
|
||||||||||
|
Year Ended December 31, 2015:
|
||||||||||||||||||||
|
Trade receivables—allowance for doubtful accounts
|
13
|
|
5
|
|
—
|
|
(3
|
)
|
15
|
|
||||||||||
|
Financing receivables—allowance for losses
|
100
|
|
10
|
|
(2
|
)
|
A
|
(10
|
)
|
98
|
|
|||||||||
|
Deferred tax assets—valuation allowance
|
15
|
|
2
|
|
—
|
|
—
|
|
17
|
|
||||||||||
|
Year Ended December 31, 2014:
|
||||||||||||||||||||
|
Trade receivables—allowance for doubtful accounts
|
11
|
|
5
|
|
—
|
|
(3
|
)
|
13
|
|
||||||||||
|
Financing receivables—allowance for losses
|
103
|
|
7
|
|
(9
|
)
|
A, C
|
(1
|
)
|
100
|
|
|||||||||
|
Deferred tax assets—valuation allowance
|
21
|
|
—
|
|
—
|
|
(6
|
)
|
B
|
15
|
|
|||||||||
A
—This amount represents currency translation on foreign currency denominated notes receivable.
B
—This amount represents the release of certain foreign net operating losses.
C
—This amount includes removal of the allowance recorded in connection with the sale of our vacation ownership business.
SCHII-1
EXHIBIT INDEX
|
Exhibit Number
|
Exhibit Description
|
|
|
3.1
|
Amended and Restated Certificate of Incorporation of Hyatt Hotels Corporation
|
|
|
3.2
|
Amended and Restated Bylaws of Hyatt Hotels Corporation (incorporated by reference to Exhibit 3.2 to the Company's Current Report on Form 8-K (File No. 001-34521) filed with the Securities and Exchange Commission on September 11, 2014)
|
|
|
4.1
|
Specimen Class A Common Stock Certificate (incorporated by reference to Exhibit 4.1 to the Company's Registration Statement on Form S-1 (File No. 333-161068) filed with the Securities and Exchange Commission on October 1, 2009)
|
|
|
4.2
|
Registration Rights Agreement, dated as of August 28, 2007, as amended, by and among Global Hyatt Corporation, Madrone GHC, LLC, Lake GHC, LLC, Shimoda GHC, LLC, GS Sunray Holdings, L.L.C., GS Sunray Holdings Subco I, L.L.C., GS Sunray Holdings Subco II, L.L.C., GS Sunray Holdings Parallel, L.L.C., GS Sunray Holdings Parallel Subco, L.L.C., Mori Building Capital Investment LLC and others party thereto (incorporated by reference to Exhibit 4.2 to the Company's Registration Statement on Form S-1 (File No. 333-161068) filed with the Securities and Exchange Commission on August 5, 2009)
|
|
|
4.3
|
Joinder Agreement to Registration Rights Agreement, dated as of January 26, 2010, by and among Hyatt Hotels Corporation and Mori Building Co., Ltd. (incorporated by reference to Exhibit 4.3 to the Company's Annual Report on Form 10-K for the fiscal year ended December 31, 2009 (File No. 001-34521) filed with the Securities and Exchange Commission on February 25, 2010)
|
|
|
4.4
|
Indenture, dated as of August 14, 2009, as amended, between Hyatt Hotels Corporation and Wells Fargo Bank, National Association, as trustee (incorporated by reference to Exhibit 4.3 to the Company's Registration Statement on Form S-1 (File No. 333-161068) filed with the Securities and Exchange Commission on September 9, 2009)
|
|
|
4.5
|
First Supplemental Indenture, dated as of August 14, 2009, between Hyatt Hotels Corporation and Wells Fargo Bank, National Association, as trustee (incorporated by reference to Exhibit 4.4 to the Company's Registration Statement on Form S-1 (File No. 333-161068) filed with the Securities and Exchange Commission on September 9, 2009)
|
|
|
4.6
|
Second Supplemental Indenture, dated as of August 4, 2011, between the Company and Wells Fargo, National Association, as trustee (incorporated by reference to Exhibit 4.2 to the Company's Registration Statement on Form S-3 (File No. 333-176038) filed with the Securities and Exchange Commission on August 4, 2011)
|
|
|
4.7
|
Third Supplemental Indenture, dated as of August 9, 2011, between the Company and Wells Fargo, National Association, as trustee (incorporated by reference to Exhibit 4.2 to the Company's Current Report on Form 8-K (File No. 001-34521) filed with the Securities and Exchange Commission on August 9, 2011)
|
|
|
4.8
|
Fourth Supplemental Indenture, dated May 10, 2013, between Hyatt Hotels Corporation and Wells Fargo Bank, National Association, as trustee (incorporated by reference to Exhibit 4.1 to the Company's Current Report on Form 8-K (File No. 001-34521) filed with the Securities and Exchange Commission on May 10, 2013)
|
|
|
4.9
|
Fifth Supplemental Indenture, dated May 10, 2013 between Hyatt Hotels Corporation and Wells Fargo Bank, National Association, as trustee (incorporated by reference to Exhibit 4.2 to the Company's Current Report on Form 8-K (File No. 001-34521) filed with the Securities and Exchange Commission on May 10, 2013)
|
|
E- 1
|
Exhibit Number
|
Exhibit Description
|
|
|
4.10
|
Sixth Supplemental Indenture, dated March 7, 2016, between Hyatt Hotels Corporation and Wells Fargo Bank, National Association, as trustee (incorporated by reference to Exhibit 4.1 to the Company's Current Report on Form 8-K (File No. 001-34521) filed with the Securities and Exchange Commission on March 8, 2016)
|
|
|
4.11
|
Form of 6.875% Senior Notes due 2019 (included as part of Exhibit 4.5 above) (incorporated by reference to Exhibit 4.4 to the Company’s Registration Statement on Form S-1 (File No. 333-161068) filed with the Securities and Exchange Commission on September 9, 2009)
|
|
|
4.12
|
Form of 5.375% Senior Notes due 2021 (included as part of Exhibit 4.7 above) (incorporated by reference to Exhibit 4.2 to the Company's Current Report on Form 8-K (File No. 001-34521) filed with the Securities and Exchange Commission on August 9, 2011)
|
|
|
4.13
|
Form of 3.375% Senior Notes due 2023 (included as part of Exhibit 4.9 above ) (incorporated by reference to Exhibit 4.2 to the Company's Current Report on Form 8-K (File No. 001-34521) filed with the Securities and Exchange Commission on May 10, 2013)
|
|
|
4.14
|
Form of 4.850% Senior Note due 2026 (included as part of Exhibit 4.1 above) (incorporated by reference to Exhibit 4.2 to the Company's Current Report on Form 8-K (File No. 001-34521) filed with the Securities and Exchange Commission on March 8, 2016)
|
|
|
4.15
|
Registration Rights Agreement, dated as of October 12, 2009, by and among Hyatt Hotels Corporation and Thomas J. Pritzker, Marshall E. Eisenberg and Karl J. Breyer, solely in their capacity as co-trustees (incorporated by reference to Exhibit 4.5 to the Company's Registration Statement on Form S-1 (File No. 333-161068) filed with the Securities and Exchange Commission on October 15, 2009)
|
|
|
10.1
|
2007 Stockholders' Agreement, dated as of August 28, 2007, as amended, by and among Hyatt Hotels Corporation, Madrone GHC, LLC, Lake GHC, LLC, Shimoda GHC, LLC, GS Sunray Holdings, L.L.C., GS Sunray Holdings Subco I, L.L.C., GS Sunray Holdings Subco II, L.L.C., GS Sunray Holdings Parallel, L.L.C., GS Sunray Holdings Parallel Subco, L.L.C., Mori Building Capital Investment LLC and others party thereto (incorporated by reference to Exhibit 10.1 to the Company's Registration Statement on Form S-1 (File No. 333-161068) filed with the Securities and Exchange Commission on August 5, 2009)
|
|
|
10.2
|
Joinder Agreement to 2007 Stockholders' Agreement, dated as of January 26, 2010, by and among Hyatt Hotels Corporation and Mori Building Co., Ltd. (incorporated by reference to Exhibit 10.2 to the Company's Annual Report on Form 10-K for the fiscal year ended December 31, 2009 (File No. 001-34521) filed with the SEC on February 25, 2010)
|
|
|
10.3
|
Joinder Agreement to 2007 Stockholders' Agreement, dated as of March 12, 2014, by and among Hyatt Hotels Corporation and Gregory B. Penner (incorporated by reference to Exhibit 10.3 to the Company's Annual Report on Form 10-K for the fiscal year ended December 31, 2015 (File No. 001-34521) filed with the Securities and Exchange Commission on February 18, 2015)
|
|
|
+10.4
|
Third Amended and Restated Hyatt Hotels Corporation Long-Term Incentive Plan (incorporated by reference to Exhibit 10.4 to the Company's Annual Report on Form 10-K for the fiscal year ended December 31, 2015 (File No. 001-34521) filed with the SEC on February 18, 2016)
|
|
|
+10.5
|
Form of Non-Employee Director Restricted Stock Unit Award Agreement (incorporated by reference to Exhibit 10.3 to the Company's Registration Statement on Form S-1 (File No. 333-161068) filed with the Securities and Exchange Commission on August 5, 2009)
|
|
|
+10.6
|
Amendment to Hyatt Hotels Corporation Non-Employee Director Restricted Stock Unit Award Agreements (incorporated by reference to Exhibit 10.2 to the Company's Quarterly Report on Form 10-Q for the quarter ended September 30, 2010 (File No. 001-34521) filed with the Securities and Exchange Commission on November 3, 2010)
|
|
E- 2
|
Exhibit Number
|
Exhibit Description
|
|
|
+10.7
|
Form of Non-Employee Director Restricted Stock Award Agreement (incorporated by reference to Exhibit 10.4 to the Company's Registration Statement on Form S-1 (File No. 333-161068) filed with the Securities and Exchange Commission on August 5, 2009)
|
|
|
+10.8
|
Form of Restricted Stock Award Agreement (incorporated by reference to Exhibit 10.1 to the Company's Current Report on Form 8-K/A (File No. 001-34521) filed with the Securities and Exchange Commission on April 13, 2012)
|
|
|
+10.9
|
Second Amendment to Hyatt Hotels Corporation Special Restricted Stock Unit Award Agreements (incorporated by reference to Exhibit 10.4 to the Company's Quarterly Report on Form 10-Q for the quarter ended September 30, 2010 (File No. 001-34521) filed with the Securities and Exchange Commission on November 3, 2010)
|
|
|
+10.10
|
Amendment to Hyatt Hotels Corporation 2008 and 2009 Restricted Stock Unit Award Agreements, dated December 17, 2010 (incorporated by reference to Exhibit 10.17 to the Company's Annual Report on Form 10-K for the fiscal year ended December 31, 2010 (File No. 001-34521) filed with the SEC on February 17, 2011)
|
|
|
+10.11
|
Form of 2006 Stock Appreciation Rights Award Agreement under Long-Term Incentive Plan (incorporated by reference to Exhibit 10.12 to the Company's Registration Statement on Form S-1 (File No. 333-161068) filed with the Securities and Exchange Commission on August 5, 2009)
|
|
|
+10.12
|
Form of 2007 Stock Appreciation Rights Award Agreement under Long-Term Incentive Plan (incorporated by reference to Exhibit 10.11 to the Company's Registration Statement on Form S-1 (File No. 333-161068) filed with the Securities and Exchange Commission on August 5, 2009)
|
|
|
+10.13
|
Form of 2008 Stock Appreciation Rights Award Agreement under Long-Term Incentive Plan (incorporated by reference to Exhibit 10.10 to the Company's Registration Statement on Form S-1 (File No. 333-161068) filed with the Securities and Exchange Commission on August 5, 2009)
|
|
|
+10.14
|
Form of 2009 Stock Appreciation Rights Award Agreement under Long-Term Incentive Plan (incorporated by reference to Exhibit 10.13 to the Company's Registration Statement on Form S-1 (File No. 333-161068) filed with the Securities and Exchange Commission on August 5, 2009)
|
|
|
+10.15
|
Form of Stock Appreciation Rights Award Agreement under Long-Term Incentive Plan (incorporated by reference to Exhibit 10.57 to the Company's Annual Report on Form 10-K for the fiscal year ended December 31, 2009 (File No. 001-34521) filed with the Securities and Exchange Commission on February 25, 2010)
|
|
|
+10.16
|
Form of Performance Share Unit Agreement (incorporated by reference to Exhibit 10.1 to the Company's Current Report on Form 8-K (File No. 001-34521) filed with the Securities and Exchange Commission on March 25, 2016)
|
|
|
+10.17
|
Form of Restricted Stock Agreement (incorporated by reference to Exhibit 10.1 to Amendment No. 1 to the Company's Current Report on Form 8-K/A (File No. 001-34521) filed with the Securities and Exchange Commission on April 13, 2012)
|
|
|
+10.18
|
Form of Restricted Stock Agreement (incorporated by reference to Exhibit 10.22 to the Company's Annual Report on Form 10-K for the fiscal year ended December 31, 2013 (File No. 001-34521) filed with the Securities and Exchange Commission on February 18, 2014)
|
|
|
+10.19
|
Amended and Restated Hyatt Hotels Corporation Deferred Compensation Plan for Directors, dated as of December 8, 2016
|
|
E- 3
|
Exhibit Number
|
Exhibit Description
|
|
|
+10.20
|
Hyatt Hotels Corporation Amended and Restated Summary of Non-Employee Director Compensation (January 1, 2017)
|
|
|
+10.21
|
Employment Letter, dated as of December 12, 2012, between Hyatt Hotels Corporation and Mark S. Hoplamazian (incorporated by reference to Exhibit 10.2 to the Company's Current Report on Form 8-K (File No. 001-34521) filed with the Securities and Exchange Commission on December 14, 2012)
|
|
|
+10.22
|
Employment Letter, dated as of January 7, 2015, between Hyatt Hotels Corporation and Maryam Banikarim (incorporated by reference to Exhibit 10.1 to the Company's Quarterly Report on Form 10-Q for the quarter ended March 31, 2015 (File No. 001-34521) filed with the Securities and Exchange Commission on May 5, 2015)
|
|
|
+10.23
|
Employment Letter, dated as of December 12, 2012, between Hyatt Hotels Corporation and Thomas J. Pritzker (incorporated by reference to Exhibit 10.1 to the Company's Current Report on Form 8-K (File No. 001-34521) filed with the Securities and Exchange Commission on December 14, 2012)
|
|
|
+10.24
|
Employment Letter, dated as of May 3, 2007, between Hyatt Hotels Corporation and Stephen Haggerty (incorporated by reference to Exhibit 10.3 to the Company's Quarterly Report on Form 10-Q for the quarter ended June 30, 2010 (File No. 001-34521) filed with the Securities and Exchange Commission on August 5, 2010)
|
|
|
+10.25
|
Letter Agreement, dated as of December 28, 2012, between Hyatt Hotels Corporation and Stephen Haggerty (incorporated by reference to Exhibit 10.33 to the Company's Annual Report on Form 10-K for the fiscal year ended December 31, 2012 (File No. 001-34521) filed with the Securities and Exchange Commission on February 13, 2013)
|
|
|
+10.26
|
Employment Letter, dated as of February 10, 2016, between Hyatt Corporation and Patrick J. Grismer (incorporated by reference to Exhibit 10.1 to the Company's Current Report on Form 8-K (File No. 001-34521) filed with the Securities and Exchange Commission on February 11, 2016)
|
|
|
+10.27
|
Employment Letter, dated as of September 19, 2016, between Hyatt Corporation and Anne-Marie Law
|
|
|
+10.28
|
Hyatt Hotels Corporation Executive Officer Change in Control Plan and Summary Plan Description (incorporated by reference to Exhibit 10.47 to the Company's Registration Statement on Form S-1 (File No. 333-161068) filed with the Securities and Exchange Commission on September 9, 2009)
|
|
|
+10.29
|
First Amendment to the Hyatt Hotels Corporation Executive Change in Control Plan, dated December 17, 2010 (incorporated by reference to Exhibit 10.32 to the Company's Annual Report on Form 10-K for the fiscal year ended December 31, 2010 (File No. 001-34521) filed with the Securities and Exchange Commission on February 17, 2011)
|
|
|
+10.30
|
Hyatt Hotels Corporation Corporate Office Severance Plan and Summary Plan Description (incorporated by reference to Exhibit 10.48 to the Company's Registration Statement on Form S-1 (File No. 333-161068) filed with the Securities and Exchange Commission on September 9, 2009)
|
|
|
+10.31
|
First Amendment to the Hyatt Hotels Corporation Corporate Office Severance Plan, dated December 17, 2010 (incorporated by reference to Exhibit 10.34 to the Company's Annual Report on Form 10-K for the fiscal year ended December 31, 2010 (File No. 001-34521) filed with the Securities and Exchange Commission on February 17, 2011)
|
|
|
+10.32
|
Amended and Restated Hyatt Hotels Corporation Executive Incentive Plan (incorporated by reference to Appendix B to the Company's Definitive Proxy Statement or Schedule 14A (File No. 001-34521) filed with the Securities and Exchange Commission on April 22, 2013)
|
|
E- 4
|
Exhibit Number
|
Exhibit Description
|
|
|
+10.33
|
Hyatt International Hotels Retirement Plan (incorporated by reference to Exhibit 10.55 to the Company's Registration Statement on Form S-1 (File No. 333-161068) filed with the Securities and Exchange Commission on November 2, 2009)
|
|
|
+10.34
|
Amended and Restated Hyatt Corporation Deferred Compensation Plan, effective May 3, 2010 (incorporated by reference to Exhibit 4.5 to the Company's Registration Statement on Form S-8 (File No. 333-165384) filed with the Securities and Exchange Commission on March 10, 2010)
|
|
|
+10.35
|
First Amendment to the Amended and Restated Hyatt Corporation Deferred Compensation Plan, effective May 3, 2010 (incorporated by reference to Exhibit 10.2 to the Company's Quarterly Report on Form 10-Q for the quarter ended March 31, 2010 (File No. 001-34521) filed with the Securities and Exchange Commission on May 6, 2010)
|
|
|
+10.36
|
Second Amendment to the Amended and Restated Hyatt Corporation Deferred Compensation Plan, effective September 30, 2010 (incorporated by reference to Exhibit 10.41 to the Company's Annual Report on Form 10-K for the fiscal year ended December 31, 2011 (File No. 001-34521) filed with the Securities and Exchange Commission on February, 16, 2012)
|
|
|
+10.37
|
Hyatt Hotels Corporation Employee Stock Purchase Plan (incorporated by reference to Appendix A to the Company's Definitive Proxy Statement on Schedule 14A (File No. 001-34521) filed with the Securities and Exchange Commission on April 21, 2010)
|
|
|
+10.38
|
First Amendment to the Hyatt Hotels Corporation Employee Stock Purchase Plan, dated March 19, 2012 (incorporated by reference to Exhibit 10.1 to the Company's Quarterly Report on Form 10-Q for the quarter ended March 31, 2012 (File No. 001-34521) filed with the Securities and Exchange Commission on May 3, 2012)
|
|
|
10.39
|
Amended and Restated Office Lease, dated as of June 15, 2004, as amended, between Hyatt Corporation and FrankMon LLC (as of December 20, 2010, FrankMon LLC transferred ownership interest to 71 South Wacker Drive LLC) (incorporated by reference to Exhibit 10.21 to the Company's Registration Statement on Form S-1 (File No. 333-161068) filed with the Securities and Exchange Commission on August 5, 2009)
|
|
|
10.40
|
Sublease Agreement, dated as of June 15, 2004, as amended, between Hyatt Corporation and The Pritzker Organization, L.L.C. (incorporated by reference to Exhibit 10.23 to the Company's Registration Statement on Form S-1 (File No. 333-161068) filed with the Securities and Exchange Commission on August 5, 2009)
|
|
|
10.41
|
Fifth Amendment to Sublease, dated as of November 2, 2011, between Hyatt Corporation and The Pritzker Organization, L.L.C. (incorporated by reference to Exhibit 10.46 to the Company's Annual Report on Form 10-K for the fiscal year ended December 31, 2011 (File No. 001-34521) filed with the Securities and Exchange Commission on February 16, 2012)
|
|
|
10.42
|
Sixth Amendment to Sublease, dated as of June 12, 2012, between Hyatt Corporation and The Pritzker Organization, L.L.C. (incorporated by reference to Exhibit 10.1 to the Company's Quarterly Report on Form 10-Q for the quarter ended June 30, 2012 (File No. 001-34521) filed with the Securities and Exchange Commission on August 1, 2012)
|
|
|
10.43
|
Sublease Agreement, dated as of June 15, 2004, as amended, between Hyatt Corporation and CC-Development Group, Inc. (incorporated by reference to Exhibit 10.25 to the Company's Registration Statement on Form S-1 (File No. 333-161068) filed with the Securities and Exchange Commission on August 5, 2009)
|
|
|
10.44
|
Third Amendment to Sublease, dated as of February 22, 2012, between Hyatt Corporation and CC-Development Group, Inc. (incorporated by reference to Exhibit 10.2 to the Company's Quarterly Report on Form 10-Q for the quarter ended March 31, 2012 (File No. 001-34521) filed with the Securities and Exchange Commission on May 3, 2012)
|
|
E- 5
|
Exhibit Number
|
Exhibit Description
|
|
|
10.45
|
Agreement Regarding Allocation of Certain Office Costs Relating to Thomas J. Pritzker in his role as Executive Chairman of Hyatt Hotels Corporation, dated as of February 14, 2012, between Hyatt Corporation and The Pritzker Organization, L.L.C. (incorporated by reference to Exhibit 10.49 to the Company's Annual Report on Form 10-K for the fiscal year ended December 31, 2011 (File No. 001-34521) filed with the Securities and Exchange Commission on February, 16, 2012)
|
|
|
10.46
|
Omnibus Office Services Agreement, dated as of August 3, 2006, between Global Hyatt Corporation, Pritzker Realty Group, L.P., CC-Development Group, H Group Holding, Inc., The Pritzker Organization, L.L.C., Pritzker Family Office, L.L.C. and Pritzker Realty Group, L.P. and others party thereto (incorporated by reference to Exhibit 10.27 to the Company's Registration Statement on Form S-1 (File No. 333-161068) filed with the Securities and Exchange Commission on August 5, 2009)
|
|
|
10.47
|
Master (Permanent) Non-Gaming Services Agreement, dated as of July 19, 2002, between Hyatt Corporation and Falls Management Company (incorporated by reference to Exhibit 10.34 to the Company's Registration Statement on Form S-1 (File No. 333-161068) filed with the Securities and Exchange Commission on September 9, 2009)
|
|
|
10.48
|
Letter regarding Termination of Omnibus Office Services Agreement, dated as of January 12, 2012, by Pritzker Realty Group, L.P. (incorporated by reference to Exhibit 10.59 to the Company's Annual Report on Form 10-K for the fiscal year ended December 31, 2011 (File No. 001-34521) filed with the Securities and Exchange Commission on February 16, 2012)
|
|
|
10.49
|
Letter regarding employee benefit administration dated as of February 12, 2008, by Hyatt Gaming Management, Inc. (incorporated by reference to Exhibit 10.38 to the Company's Registration Statement on Form S-1 (File No. 333-161068) filed with the Securities and Exchange Commission on August 5, 2009)
|
|
|
10.50
|
Employee Benefits and Other Employment Matters Allocation and Separation Agreement, dated as of July 1, 2004, among Hyatt Corporation, Hyatt Gaming Management, Inc., H Group Holding, Inc., HCC Corporation and Grand Victoria Casino & Resort, L.P. (incorporated by reference to Exhibit 10.39 to the Company's Registration Statement on Form S-1 (File No. 333-161068) filed with the Securities and Exchange Commission on August 5, 2009)
|
|
|
10.51
|
Tax Separation Agreement, dated as of June 30, 2004, as amended, among H Group Holding, Inc., Hyatt Corporation, CC-Development Group, Inc. and each of their respective direct and indirect Subsidiaries (incorporated by reference to Exhibit 10.42 to the Company's Registration Statement on Form S-1 (File No. 333-161068) filed with the Securities and Exchange Commission on October 1, 2009)
|
|
|
10.52
|
Second Amended and Restated Credit Agreement, dated as of January 6, 2014, among Hyatt Hotels Corporation and Hotel Investors I, Inc., as Borrowers, certain subsidiaries of Hyatt Hotels Corporation, as Guarantors, various Lenders, Wells Fargo Bank, National Association, as Administrative Agent, Bank of America, N.A., as Syndication Agent, Wells Fargo Securities, LLC, Merrill Lynch, Pierce, Fenner & Smith Incorporated, J.P. Morgan Securities LLC and Deutsche Bank Securities, Inc., as Joint Book Runners and Co-Lead Arrangers, and JPMorgan Chase Bank, N.A., Deutsche Bank Securities, Inc. and SunTrust Bank, as Co-Documentation Agents (incorporated by reference to Exhibit 10.1 to the Company's Current Report on Form 8-K (File No. 001-34521) filed with the Securities and Exchange Commission on January 6, 2014)
|
|
|
10.53
|
Form of Franchise Agreement with Hyatt Place Franchising, L.L.C., as amended (incorporated by reference to Exhibit 10.46 to the Company's Registration Statement on Form S-1 (File No. 333- 161068) filed with the Securities and Exchange Commission on August 5, 2009)
|
|
|
12.1
|
Statement Regarding Computation of Ratio of Earnings to Fixed Charges
|
|
|
14.1
|
Code of Business Conduct and Ethics
|
|
E- 6
|
Exhibit Number
|
Exhibit Description
|
|
|
21.1
|
List of Subsidiaries
|
|
|
23.1
|
Consent of Deloitte & Touche LLP
|
|
|
31.1
|
Certification of the Chief Executive Officer pursuant to Rules 13a-14(a) and 15d-14(a) of the Securities Exchange Act of 1934, as amended, as adopted pursuant to Section 302 of the Sarbanes-Oxley Act of 2002
|
|
|
31.2
|
Certification of the Chief Financial Officer pursuant to Rules 13a-14(a) and 15d-14(a) of the Securities Exchange Act of 1934, as amended, as adopted pursuant to Section 302 of the Sarbanes-Oxley Act of 2002
|
|
|
32.1
|
Certification of the Chief Executive Officer pursuant to 18 U.S.C. Section 1350, as adopted pursuant to Section 906 of the Sarbanes-Oxley Act of 2002
|
|
|
32.2
|
Certification of the Chief Financial Officer pursuant to 18 U.S.C. Section 1350, as adopted pursuant to Section 906 of the Sarbanes-Oxley Act of 2002
|
|
|
99.1
|
Amended and Restated Global Hyatt Agreement, dated as of October 1, 2009, by and among Thomas J. Pritzker, Marshall E. Eisenberg and Karl J. Breyer, solely in their capacity as co-trustees, and each signatory thereto
|
|
|
99.2
|
Amended and Restated Foreign Global Hyatt Agreement, dated as of October 1, 2009, by and among each signatory thereto
|
|
|
101.INS
|
XBRL Instance Document
|
|
|
101.SCH
|
XBRL Taxonomy Extension Schema Document
|
|
|
101.CAL
|
XBRL Taxonomy Extension Calculation Linkbase Document
|
|
|
101.DEF
|
XBRL Taxonomy Extension Definition Linkbase Document
|
|
|
101.LAB
|
XBRL Taxonomy Extension Label Linkbase Document
|
|
|
101.PRE
|
XBRL Taxonomy Extension Presentation Linkbase Document
|
|
|
+
|
Management contract or compensatory plan or arrangement.
|
E- 7
TABLE OF CONTENTS
Part IItem 1. BusinessItem 1A. Risk FactorsItem 1B. Unresolved Staff CommentsItem 2. PropertiesItem 3. Legal ProceedingsItem 4. Mine Safety DisclosuresPart IIItem 5. Market For Registrant's Common Equity, Related Stockholder Matters and Issuer Purchases Of Equity SecuritiesItem 6. Selected Financial DataItem 7. Management S Discussion and Analysis Of Financial Condition and Results Of OperationsItem 7A. Quantitative and Qualitative Disclosures About Market RiskItem 8. Financial Statements and Supplementary DataItem 9. Changes in and Disagreements with Accountants on Accounting and Financial DisclosureItem 9A. Controls and ProceduresItem 9B. Other InformationPart IIIItem 10. Directors, Executive Officers and Corporate GovernanceItem 11. Executive CompensationItem 12. Security Ownership Of Certain Beneficial Owners and Management and Related Stockholder MattersItem 13. Certain Relationships and Related Transactions, and Director IndependenceItem 14. Principal Accountant Fees and ServicesPart IVItem 15. Exhibits and Financial Statement ScheduleItem 16. Form 10-k Summary