HYATT HOTELS CORP
10-Ks and 10-Qs
|
|
|
|
|
|
|
|
|
|
|
|
|
|
|
|
|
|
|
|
|
|
|
|
|
|
|
|
|
|
|
|
|
|
|
|
|
|
|
|
|
|
|
|
|
|
|
|
|
|
|
|
|
|
|
|
UNITED STATES
SECURITIES AND EXCHANGE COMMISSION
Washington, DC 20549
Form 10-Q
(Mark One)
|
x
|
QUARTERLY REPORT PURSUANT TO SECTION 13 OR 15(d) OF THE SECURITIES EXCHANGE ACT OF 1934
|
For the quarterly period ended
September 30, 2018
OR
|
¨
|
TRANSITION REPORT PURSUANT TO SECTION 13 OR 15(d) OF THE SECURITIES EXCHANGE ACT OF 1934
|
For the transition period from to
Commission File No. 001-34521
HYATT HOTELS CORPORATION
(Exact Name of Registrant as Specified in Its Charter)
|
Delaware
|
|
20-1480589
|
|
(State or Other Jurisdiction of
Incorporation or Organization)
|
|
(I.R.S. Employer
Identification No.)
|
|
150 North Riverside Plaza 8th Floor, Chicago, Illinois
|
|
60606
|
|
(Address of Principal Executive Offices)
|
|
(Zip Code)
|
(312) 750-1234
(Registrant’s Telephone Number, Including Area Code)
Indicate by check mark whether the registrant: (1) has filed all reports required to be filed by Section 13 or 15(d) of the Securities Exchange Act of 1934 during the preceding 12 months (or for such shorter period that the registrant was required to file such reports), and (2) has been subject to such filing requirements for the past 90 days. Yes
x
No
¨
Indicate by check mark whether the registrant has submitted electronically every Interactive Data File required to be submitted pursuant to Rule 405 of Regulation S-T (§ 232.405 of this chapter) during the preceding 12 months (or for such shorter period that the registrant was required to submit and post such files). Yes
x
No
¨
Indicate by check mark whether the registrant is a large accelerated filer, an accelerated filer, a non-accelerated filer, a smaller reporting company, or an emerging growth company. See the definitions of "large accelerated filer," "accelerated filer," "smaller reporting company," and "emerging growth company" in Rule 12b-2 of the Exchange Act. (Check One):
|
Large accelerated filer
|
x
|
Accelerated filer
|
¨
|
||
|
Non-accelerated filer
|
¨
|
Smaller reporting company
|
¨
|
||
|
Emerging growth company
|
¨
|
||||
If an emerging growth company, indicate by check mark if the registrant has elected not to use the extended transition period for complying with any new or revised financial accounting standards provided pursuant to Section 13(a) of the Exchange Act.
¨
Indicate by check mark whether the registrant is a shell company (as defined in Rule 12b-2 of the Exchange Act). Yes
¨
No
x
At October 26, 2018, there were
42,768,452
shares of the registrant’s Class A common stock, $0.01 par value, outstanding and
67,119,482
shares of the registrant’s Class B common stock, $0.01 par value, outstanding.
HYATT HOTELS CORPORATION
QUARTERLY REPORT ON FORM 10-Q
FOR THE PERIOD ENDED
SEPTEMBER 30, 2018
TABLE OF CONTENTS
|
PART I – FINANCIAL INFORMATION
|
||
|
Item 1.
|
||
|
Item 2.
|
||
|
Item 3.
|
||
|
Item 4.
|
||
|
PART II – OTHER INFORMATION
|
||
|
Item 1.
|
||
|
Item 1A.
|
||
|
Item 2.
|
||
|
Item 3.
|
||
|
Item 4.
|
||
|
Item 5.
|
||
|
Item 6.
|
||
Item 1.
Financial Statements.
HYATT HOTELS CORPORATION AND SUBSIDIARIES
(In millions of dollars, except per share amounts)
(Unaudited)
|
Three Months Ended
|
Nine Months Ended
|
||||||||||||||
|
September 30, 2018
|
September 30, 2017
|
September 30, 2018
|
September 30, 2017
|
||||||||||||
|
REVENUES:
|
|||||||||||||||
|
Owned and leased hotels
|
$
|
450
|
|
$
|
516
|
|
$
|
1,450
|
|
$
|
1,661
|
|
|||
|
Management, franchise, and other fees
|
133
|
|
123
|
|
407
|
|
367
|
|
|||||||
|
Amortization of management and franchise agreement assets constituting payments to customers
|
(5
|
)
|
(4
|
)
|
(15
|
)
|
(13
|
)
|
|||||||
|
Net management, franchise, and other fees
|
128
|
|
119
|
|
392
|
|
354
|
|
|||||||
|
Other revenues
|
7
|
|
6
|
|
27
|
|
28
|
|
|||||||
|
Revenues for the reimbursement of costs incurred on behalf of managed and franchised properties
|
489
|
|
429
|
|
1,447
|
|
1,302
|
|
|||||||
|
Total revenues
|
1,074
|
|
1,070
|
|
3,316
|
|
3,345
|
|
|||||||
|
DIRECT AND SELLING, GENERAL, AND ADMINISTRATIVE EXPENSES:
|
|||||||||||||||
|
Owned and leased hotels
|
354
|
|
406
|
|
1,095
|
|
1,258
|
|
|||||||
|
Depreciation and amortization
|
81
|
|
88
|
|
243
|
|
261
|
|
|||||||
|
Other direct costs
|
8
|
|
3
|
|
23
|
|
20
|
|
|||||||
|
Selling, general, and administrative
|
82
|
|
89
|
|
260
|
|
278
|
|
|||||||
|
Costs incurred on behalf of managed and franchised properties
|
487
|
|
425
|
|
1,447
|
|
1,313
|
|
|||||||
|
Direct and selling, general, and administrative expenses
|
1,012
|
|
1,011
|
|
3,068
|
|
3,130
|
|
|||||||
|
Net gains and interest income from marketable securities held to fund rabbi trusts
|
10
|
|
11
|
|
19
|
|
35
|
|
|||||||
|
Equity earnings (losses) from unconsolidated hospitality ventures
|
(6
|
)
|
1
|
|
(17
|
)
|
(1
|
)
|
|||||||
|
Interest expense
|
(19
|
)
|
(20
|
)
|
(57
|
)
|
(61
|
)
|
|||||||
|
Gains on sales of real estate
|
239
|
|
—
|
|
769
|
|
60
|
|
|||||||
|
Asset impairments
|
(21
|
)
|
—
|
|
(21
|
)
|
—
|
|
|||||||
|
Other income (loss), net
|
(9
|
)
|
(16
|
)
|
(22
|
)
|
32
|
|
|||||||
|
INCOME BEFORE INCOME TAXES
|
256
|
|
35
|
|
919
|
|
280
|
|
|||||||
|
PROVISION FOR INCOME TAXES
|
(19
|
)
|
(16
|
)
|
(194
|
)
|
(103
|
)
|
|||||||
|
NET INCOME
|
237
|
|
19
|
|
725
|
|
177
|
|
|||||||
|
NET INCOME AND ACCRETION ATTRIBUTABLE TO NONCONTROLLING INTERESTS
|
—
|
|
(1
|
)
|
—
|
|
(1
|
)
|
|||||||
|
NET INCOME ATTRIBUTABLE TO HYATT HOTELS CORPORATION
|
$
|
237
|
|
$
|
18
|
|
$
|
725
|
|
$
|
176
|
|
|||
|
EARNINGS PER SHARE
—
Basic
|
|||||||||||||||
|
Net income
|
$
|
2.12
|
|
$
|
0.15
|
|
$
|
6.31
|
|
$
|
1.40
|
|
|||
|
Net income attributable to Hyatt Hotels Corporation
|
$
|
2.12
|
|
$
|
0.14
|
|
$
|
6.31
|
|
$
|
1.39
|
|
|||
|
EARNINGS PER SHARE
—
Diluted
|
|
||||||||||||||
|
Net income
|
$
|
2.09
|
|
$
|
0.15
|
|
$
|
6.21
|
|
$
|
1.39
|
|
|||
|
Net income attributable to Hyatt Hotels Corporation
|
$
|
2.09
|
|
$
|
0.14
|
|
$
|
6.21
|
|
$
|
1.38
|
|
|||
|
CASH DIVIDENDS DECLARED PER SHARE
|
$
|
0.15
|
|
|
$
|
—
|
|
$
|
0.45
|
|
$
|
—
|
|
||
See accompanying Notes to condensed consolidated financial statements.
1
HYATT HOTELS CORPORATION AND SUBSIDIARIES
CONDENSED CONSOLIDATED STATEMENTS OF COMPREHENSIVE INCOME
(In millions of dollars)
(Unaudited)
|
Three Months Ended
|
Nine Months Ended
|
||||||||||||||
|
September 30, 2018
|
September 30, 2017
|
September 30, 2018
|
September 30, 2017
|
||||||||||||
|
Net income
|
$
|
237
|
|
$
|
19
|
|
$
|
725
|
|
$
|
177
|
|
|||
|
Other comprehensive income (loss), net of taxes:
|
|||||||||||||||
|
Foreign currency translation adjustments, net of tax (benefit) of $- and $(1) for the three and nine months ended September 30, 2018 and $- for the three and nine months ended September 30, 2017
|
71
|
|
11
|
|
48
|
|
71
|
|
|||||||
|
Unrealized gains on available-for-sale debt securities, net of tax expense of $- for the three and nine months ended September 30, 2018 and September 30, 2017, and unrealized (losses) gains on available-for-sale equity securities, net of tax (benefit) expense of $(7) and $21 for the three and nine months ended September 30, 2017
|
—
|
|
(12
|
)
|
—
|
|
33
|
|
|||||||
|
Unrealized gains on derivative activity, net of tax expense of $1 for the three and nine months ended September 30, 2018 and $- for the three and nine months ended September 30, 2017
|
3
|
|
1
|
|
3
|
|
1
|
|
|||||||
|
Other comprehensive income
|
74
|
|
—
|
|
51
|
|
105
|
|
|||||||
|
COMPREHENSIVE INCOME
|
311
|
|
19
|
|
776
|
|
282
|
|
|||||||
|
COMPREHENSIVE INCOME ATTRIBUTABLE TO NONCONTROLLING INTERESTS
|
—
|
|
(1
|
)
|
—
|
|
(1
|
)
|
|||||||
|
COMPREHENSIVE INCOME ATTRIBUTABLE TO HYATT HOTELS CORPORATION
|
$
|
311
|
|
$
|
18
|
|
$
|
776
|
|
$
|
281
|
|
|||
See accompanying Notes to condensed consolidated financial statements.
2
HYATT HOTELS CORPORATION AND SUBSIDIARIES
(In millions of dollars, except share and per share amounts)
(Unaudited)
|
September 30, 2018
|
December 31, 2017
|
||||||
|
ASSETS
|
|||||||
|
CURRENT ASSETS:
|
|||||||
|
Cash and cash equivalents
|
$
|
1,014
|
|
$
|
503
|
|
|
|
Restricted cash
|
23
|
|
234
|
|
|||
|
Short-term investments
|
217
|
|
49
|
|
|||
|
Receivables, net of allowances of $25 and $21 at September 30, 2018 and December 31, 2017, respectively
|
436
|
|
350
|
|
|||
|
Inventories
|
13
|
|
14
|
|
|||
|
Prepaids and other assets
|
140
|
|
153
|
|
|||
|
Prepaid income taxes
|
56
|
|
24
|
|
|||
|
Assets held for sale
|
44
|
|
—
|
|
|||
|
Total current assets
|
1,943
|
|
1,327
|
|
|||
|
Investments
|
225
|
|
212
|
|
|||
|
Property and equipment, net
|
3,570
|
|
4,034
|
|
|||
|
Financing receivables, net of allowances
|
14
|
|
19
|
|
|||
|
Goodwill
|
132
|
|
150
|
|
|||
|
Intangibles, net
|
296
|
|
305
|
|
|||
|
Deferred tax assets
|
149
|
|
141
|
|
|||
|
Other assets
|
1,395
|
|
1,384
|
|
|||
|
TOTAL ASSETS
|
$
|
7,724
|
|
$
|
7,572
|
|
|
|
LIABILITIES, REDEEMABLE NONCONTROLLING INTEREST, AND EQUITY
|
|||||||
|
CURRENT LIABILITIES:
|
|||||||
|
Current maturities of long-term debt
|
$
|
11
|
|
$
|
11
|
|
|
|
Accounts payable
|
127
|
|
136
|
|
|||
|
Accrued expenses and other current liabilities
|
296
|
|
352
|
|
|||
|
Current contract liabilities
|
332
|
|
|
348
|
|
||
|
Accrued compensation and benefits
|
130
|
|
145
|
|
|||
|
Liabilities held for sale
|
1
|
|
—
|
|
|||
|
Total current liabilities
|
897
|
|
992
|
|
|||
|
Long-term debt
|
1,622
|
|
1,440
|
|
|||
|
Long-term contract liabilities
|
433
|
|
|
424
|
|
||
|
Other long-term liabilities
|
837
|
|
863
|
|
|||
|
Total liabilities
|
3,789
|
|
3,719
|
|
|||
|
Commitments and contingencies (see Note 12)
|
|
|
|
|
|||
|
Redeemable noncontrolling interest in preferred shares of a subsidiary
|
—
|
|
10
|
|
|||
|
EQUITY:
|
|||||||
|
Preferred stock, $0.01 par value per share, 10,000,000 shares authorized and none outstanding at September 30, 2018 and December 31, 2017
|
—
|
|
—
|
|
|||
|
Class A common stock, $0.01 par value per share, 1,000,000,000 shares authorized, 43,625,629 issued and outstanding at September 30, 2018, and Class B common stock, $0.01 par value per share, 400,064,055 shares authorized, 67,119,482 shares issued and outstanding at September 30, 2018. Class A common stock, $0.01 par value per share, 1,000,000,000 shares authorized, 48,231,149 issued and outstanding at December 31, 2017, and Class B common stock, $0.01 par value per share, 402,748,249 shares authorized, 70,753,837 shares issued and outstanding at December 31, 2017
|
1
|
|
1
|
|
|||
|
Additional paid-in capital
|
339
|
|
967
|
|
|||
|
Retained earnings
|
3,791
|
|
3,054
|
|
|||
|
Accumulated other comprehensive loss
|
(202
|
)
|
(185
|
)
|
|||
|
Total stockholders’ equity
|
3,929
|
|
3,837
|
|
|||
|
Noncontrolling interests in consolidated subsidiaries
|
6
|
|
6
|
|
|||
|
Total equity
|
3,935
|
|
3,843
|
|
|||
|
TOTAL LIABILITIES, REDEEMABLE NONCONTROLLING INTEREST, AND EQUITY
|
$
|
7,724
|
|
$
|
7,572
|
|
|
See accompanying Notes to condensed consolidated financial statements.
3
HYATT HOTELS CORPORATION AND SUBSIDIARIES
(In millions of dollars)
(Unaudited)
|
|
Nine Months Ended
|
||||||
|
|
September 30, 2018
|
September 30, 2017
|
|||||
|
CASH FLOWS FROM OPERATING ACTIVITIES:
|
|||||||
|
Net income
|
$
|
725
|
|
$
|
177
|
|
|
|
Adjustments to reconcile net income to net cash provided by operating activities:
|
|||||||
|
Gains on sales of real estate
|
(769
|
)
|
(60
|
)
|
|||
|
Depreciation and amortization
|
243
|
|
261
|
|
|||
|
Deferred income taxes
|
(7
|
)
|
(9
|
)
|
|||
|
Impairment of assets
|
43
|
|
—
|
|
|||
|
Equity losses from unconsolidated hospitality ventures
|
17
|
|
1
|
|
|||
|
Amortization of management and franchise agreement assets constituting payments to customers
|
15
|
|
13
|
|
|||
|
Realized losses
|
2
|
|
41
|
|
|||
|
Distributions from unconsolidated hospitality ventures
|
10
|
|
26
|
|
|||
|
Working capital changes and other
|
(147
|
)
|
(22
|
)
|
|||
|
Net cash provided by operating activities
|
132
|
|
428
|
|
|||
|
CASH FLOWS FROM INVESTING ACTIVITIES:
|
|||||||
|
Purchases of marketable securities and short-term investments
|
(572
|
)
|
(365
|
)
|
|||
|
Proceeds from marketable securities and short-term investments
|
426
|
|
364
|
|
|||
|
Contributions to equity method and other investments
|
(52
|
)
|
(67
|
)
|
|||
|
Return of equity method and other investments
|
24
|
|
200
|
|
|||
|
Acquisitions, net of cash acquired
|
(263
|
)
|
(259
|
)
|
|||
|
Capital expenditures
|
(195
|
)
|
(212
|
)
|
|||
|
Proceeds from sales of real estate, net of cash disposed
|
1,334
|
|
296
|
|
|||
|
Other investing activities
|
10
|
|
(11
|
)
|
|||
|
Net cash provided by (used in) investing activities
|
712
|
|
(54
|
)
|
|||
|
CASH FLOWS FROM FINANCING ACTIVITIES:
|
|||||||
|
Proceeds from debt, net of issuance costs of $4 and $-, respectively
|
416
|
|
620
|
|
|||
|
Repayments of debt
|
(230
|
)
|
(391
|
)
|
|||
|
Repurchases of common stock
|
(654
|
)
|
(555
|
)
|
|||
|
Proceeds from redeemable noncontrolling interest in preferred shares in a subsidiary
|
—
|
|
9
|
|
|||
|
Repayments of redeemable noncontrolling interest in preferred shares in a subsidiary
|
(10
|
)
|
—
|
|
|||
|
Dividends paid
|
(52
|
)
|
—
|
|
|||
|
Other financing activities
|
(13
|
)
|
(7
|
)
|
|||
|
Net cash used in financing activities
|
(543
|
)
|
(324
|
)
|
|||
|
EFFECT OF EXCHANGE RATE CHANGES ON CASH
|
3
|
|
—
|
|
|||
|
NET INCREASE IN CASH, CASH EQUIVALENTS, AND RESTRICTED CASH
|
304
|
|
50
|
|
|||
|
CASH, CASH EQUIVALENTS, AND RESTRICTED CASH—BEGINNING OF YEAR
|
752
|
|
573
|
|
|||
|
CASH, CASH EQUIVALENTS, AND RESTRICTED CASH—END OF PERIOD
|
$
|
1,056
|
|
$
|
623
|
|
|
See accompanying Notes to condensed consolidated financial statements.
Supplemental disclosure of cash flow information:
|
|
September 30, 2018
|
|
September 30, 2017
|
||||
|
Cash and cash equivalents
|
$
|
1,014
|
|
|
$
|
383
|
|
|
Restricted cash (1)
|
23
|
|
|
224
|
|
||
|
Restricted cash included in other assets (1)
|
19
|
|
|
16
|
|
||
|
Total cash, cash equivalents, and restricted cash
|
$
|
1,056
|
|
|
$
|
623
|
|
|
|
|
|
|
|
|
||
|
(1) Restricted cash generally represents sales proceeds pursuant to like-kind exchanges, captive insurance subsidiary requirements, debt service on bonds, escrow deposits, and other arrangements.
|
|||||||
|
|
Nine Months Ended September 30,
|
||||||
|
|
2018
|
|
2017
|
||||
|
Cash paid during the period for interest
|
$
|
72
|
|
|
$
|
77
|
|
|
Cash paid during the period for income taxes
|
$
|
267
|
|
|
$
|
125
|
|
|
Non-cash investing and financing activities are as follows:
|
|
|
|
|
|
||
|
Non-cash contributions to equity method investments (see Note 6, Note 12)
|
$
|
53
|
|
|
$
|
4
|
|
|
Non-cash issuance of financing receivables (see Note 5, Note 6)
|
$
|
45
|
|
$
|
—
|
|
|
|
Change in accrued capital expenditures
|
$
|
7
|
|
|
$
|
19
|
|
|
Non-cash management and franchise agreement assets constituting payments to customers
|
$
|
—
|
|
|
$
|
3
|
|
|
|
|
|
|
|
|
||
See accompanying Notes to condensed consolidated financial statements.
4
HYATT HOTELS CORPORATION AND SUBSIDIARIES
NOTES TO CONDENSED CONSOLIDATED FINANCIAL STATEMENTS
(amounts in millions of dollars, unless otherwise indicated)
(Unaudited)
1
. ORGANIZATION
Hyatt Hotels Corporation, a Delaware corporation, and its consolidated subsidiaries (collectively "Hyatt Hotels Corporation") provide hospitality and other services on a worldwide basis through the development, ownership, operation, management, franchising, and licensing of hospitality and wellness-related businesses. We develop, own, operate, manage, franchise, license, or provide services to a portfolio of properties consisting of full service hotels, select service hotels, resorts, and other properties, including branded spas and fitness studios, and timeshare, fractional, and other forms of residential or vacation properties. At
September 30, 2018
, (i) we operated or franchised
347
full service hotels, comprising
133,402
rooms throughout the world, (ii) we operated or franchised
407
select service hotels, comprising
57,576
rooms, of which
358
hotels are located in the United States, and (iii) our portfolio included
6
franchised all-inclusive Hyatt-branded resorts, comprising
2,401
rooms, and
3
destination wellness resorts, comprising
399
rooms. At
September 30, 2018
, our portfolio of properties operated in
59
countries around the world. Additionally, through strategic relationships, we provide certain reservation and/or loyalty program services to hotels that are unaffiliated with our hotel portfolio and which operate under other tradenames or marks owned by such hotel or licensed by third parties.
As used in these Notes and throughout this Quarterly Report on Form
10-Q
, (i) the terms "Hyatt," "Company," "we," "us," or "our" mean Hyatt Hotels Corporation and its consolidated subsidiaries and (ii) the term "portfolio of properties" refers to hotels and other properties, including branded spas and fitness studios and residential vacation ownership units, that we develop, own, operate, manage, franchise, license, or provide services to, including under our Park Hyatt, Miraval, Grand Hyatt, Hyatt Regency, Hyatt, Andaz, Hyatt Centric, The Unbound Collection by Hyatt, Hyatt Place, Hyatt House, Hyatt Ziva, Hyatt Zilara, exhale, and Hyatt Residence Club brands.
The accompanying unaudited condensed consolidated financial statements have been prepared in accordance with accounting principles generally accepted in the United States of America ("GAAP") for interim financial information, the instructions to Form
10-Q
and Article 10 of Regulation S-X. Accordingly, they do not include all information or footnotes required by GAAP for complete annual financial statements. As a result, this Quarterly Report on Form
10-Q
should be read in conjunction with the Consolidated Financial Statements and accompanying Notes in our Annual Report on Form
10-K
for the fiscal year ended
December 31, 2017
(the "
2017
Form
10-K
").
We have eliminated all intercompany accounts and transactions in our condensed consolidated financial statements. We consolidate entities under our control, including entities where we are deemed to be the primary beneficiary.
Management believes the accompanying condensed consolidated financial statements reflect all adjustments, which are all of a normal recurring nature, considered necessary for a fair presentation of the interim periods.
2
. RECENTLY ISSUED ACCOUNTING PRONOUNCEMENTS
Summary of Significant Accounting Policies
Our significant accounting policies are detailed in Part IV, Item 15, "Exhibits and Financial Statement Schedule—Note 2 to our Consolidated Financial Statements" within the 2017 Form 10-K. Upon adoption of Accounting Standards Update No. 2014-09 ("ASU 2014-09"),
Revenue from Contracts with Customers (Topic 606)
and
Accounting Standards Update No. 2016-01 ("ASU 2016-01"),
Financial Instruments - Overall (Subtopic 825-10): Recognition and Measurement of Financial Assets and Financial Liabilities
, our accounting policies have been revised as follows:
Revenue Recognition
—Our revenues are primarily derived from the following products and services and are generally recognized when control of the product or service has transferred to the customer:
|
•
|
Owned and leased hotels revenues:
|
|
•
|
Owned and leased hotels revenues are derived from room rentals and services provided at our owned and leased properties and are recognized over time as rooms are occupied and when
|
5
services are rendered. We present revenues net of sales, occupancy, and other taxes. Taxes collected on behalf of and remitted to governmental taxing authorities are excluded from the transaction price of the underlying products and services. In relation to the loyalty program, a portion of our owned and leased hotels revenues is deferred upon initial stay as points are earned by program members at an owned or leased hotel, and revenues are recognized upon redemption at an owned or leased hotel.
|
•
|
Management, franchise, and other fees:
|
|
•
|
Management fees primarily consist of a base fee, which is generally calculated as a percentage of gross revenues, and an incentive fee, which is generally computed based on a hotel profitability measure. Management fees are recognized over time as services are performed. Additionally, included within our management fees are royalty fees that we recognize as owners derive value from access to Hyatt's intellectual property ("IP"), including our brand names. Incentive fees may be subject to minimum profitability thresholds, and we recognize incentive fee revenues over time as services are rendered only to the extent that a significant reversal is not probable.
|
|
•
|
Franchise fees consist of an initial fee and ongoing royalty fees computed as a percentage of gross room revenues and, as applicable, food and beverage revenues. Royalty fees are recognized over time as franchisees derive value from the license to Hyatt's IP. Initial fees are deferred and recognized over the expected customer life, which is typically the initial term of the franchise agreement.
|
|
•
|
Management, franchise, and other fees include license fee revenues associated with the licensing of the Hyatt brand names through our co-branded credit card program. License fee revenues are recognized over time as the licensee derives value from access to Hyatt's brand names.
|
|
•
|
Net management, franchise, and other fees are reduced by the amortization of management and franchise agreement assets constituting payments to customers ("Contra revenue"). Consideration provided to customers is recognized in other assets and amortized over the expected customer life, which is typically the initial term of the management or franchise agreement.
|
|
•
|
Other revenues:
|
|
•
|
Other revenues include revenues from the sale of promotional awards through our co-branded credit card and spa and fitness revenues from exhale. We recognize the revenue from our co-branded credit card upon the fulfillment or expiration of a card member's promotional awards. Revenue is recognized net of expenses incurred to fulfill the promotional award as we are deemed the agent in the transaction. Spa and fitness revenues are recognized at the point in time the products or services are provided to the customer.
|
|
•
|
Revenues for the reimbursement of costs incurred on behalf of managed and franchised properties:
|
|
•
|
Revenues for the reimbursement of costs incurred on behalf of managed and franchised properties represent the reimbursement of costs incurred on behalf of the owners of properties. These costs relate primarily to payroll costs at managed properties where we are the employer, as well as costs associated with reservations, sales, marketing, technology (collectively, "system-wide services"), and the loyalty program operated on behalf of owners. Hyatt is reimbursed for costs incurred based on the terms of the contracts, and revenue is recognized as the underlying performance obligations are satisfied.
|
Revenue is adjusted for the effects of a significant financing component when the period between the transfer of the promised goods or services to the customer and payment by the customer exceeds one year.
Gains on Sales of Real Estate
—Gains on sales of real estate are generally recognized when control of the property transfers to the buyer.
Equity Method Investments
—We have investments in unconsolidated hospitality ventures accounted for under the equity method. These investments are an integral part of our business and are strategically and operationally important to our overall results. When we receive a distribution from an investment, we determine whether it is a return on our investment or a return of our investment based on the underlying nature of the distribution. We assess investments in unconsolidated hospitality ventures for impairment quarterly.
6
|
•
|
Equity securities consist of interest-bearing money market funds, mutual funds, common shares, and preferred shares. Equity securities with a readily determinable fair value are recorded at fair value on our condensed consolidated balance sheets based on listed market prices or dealer quotations where available. Equity securities without a readily determinable fair value are recognized at cost less any impairment, plus or minus changes resulting from observable price changes in orderly transactions for the identical or similar investment of the same issuer.
|
|
•
|
Debt securities consist of various types including preferred shares, time deposits, and fixed income securities, including U.S. government obligations, obligations of other government agencies, corporate debt, mortgage-backed and asset-backed securities, and municipal and provincial notes and bonds. Debt securities are classified as either trading, available-for-sale ("AFS"), or held-to-maturity ("HTM").
|
|
•
|
Trading securities—recognized at fair value based on listed market prices or dealer price quotations, where available. Net gains and losses, both realized and unrealized, on trading securities are reflected in net gains and interest income from marketable securities held to fund rabbi trusts or other income (loss), net, depending on the nature of the investment, on our condensed consolidated statements of income.
|
|
•
|
AFS securities—recognized at fair value based on listed market prices or dealer price quotations, where available. Unrealized gains and losses on AFS debt securities are recognized in accumulated other comprehensive loss on our condensed consolidated balance sheets. Realized gains and losses on debt securities are recognized in other income (loss), net on our condensed consolidated statements of income.
|
|
•
|
HTM securities—debt security investments which we have the ability to hold until maturity and are recorded at amortized cost.
|
AFS and HTM debt securities are assessed for impairment quarterly.
Loyalty Program
—We administer the loyalty program for the benefit of Hyatt's portfolio of properties during the period of their participation in the loyalty program. The loyalty program is primarily funded through contributions based on eligible revenues from loyalty program members, and the funds are used for the redemption of member awards and payment of operating expenses.
The costs of operating the loyalty program, including the estimated cost of award redemption, are charged to the participating properties based on members' qualified expenditures. The revenues received from the properties are deferred, and revenues are recognized as loyalty points are redeemed, net of redemption expense, through revenues for the reimbursement of costs incurred on behalf of managed and franchised properties. Operating costs are expensed as incurred through costs incurred on behalf of managed and franchised properties.
We actuarially determine the amount to recognize as revenue based on statistical formulas that estimate the timing of future point redemptions based on historical experience, including an estimate of breakage for points that will not be redeemed, and an estimate of the points that will eventually be redeemed. Any revenues in excess of the anticipated future redemptions are used to fund the operational expenses of the program.
The loyalty program is funded by payments from the properties and returns on marketable securities. The program invests amounts received from the properties in marketable securities which are included in other current and noncurrent assets (see Note 4). The current and noncurrent deferred revenue liabilities of the loyalty program are classified as contract liabilities (see Note 3).
Adopted Accounting Standards
Revenue from Contracts with Customers
—In May 2014, the Financial Accounting Standards Board ("FASB") released ASU 2014-09. ASU 2014-09 supersedes the requirements in Topic 605,
Revenue Recognition
, and provides a single, comprehensive revenue recognition model for contracts with customers. Subsequently, the FASB issued several related ASUs which further clarified the application of the standard including ASU 2015-14,
Revenue from Contracts with Customers (Topic 606): Deferral of the Effective Date,
which delayed the effective date by one year making it effective for interim and fiscal years beginning after December 14, 2017.
7
We adopted ASU 2014-09, and all related ASUs, utilizing the full retrospective transition method on January 1, 2018, which required us to adjust each prior reporting period presented. The adoption of ASU 2014-09 impacts the timing of the recognition of gains on sales of real estate subject to a long-term management agreement, and the associated impact to deferred tax assets (see Note 11), the classification of Contra revenue, and the timing of revenue recognition related to incentive fees. However, we do not expect the new standard to have a significant impact on incentive fee revenue on a full-year basis. The adoption of ASU 2014-09 also impacts the timing of revenue recognition related to the loyalty program and as a result of the change, we recognized a
$116 million
increase to the contract liability related to the loyalty program at January 1, 2018. Upon adoption of ASU 2014-09, we recognized a cumulative effect of a change in accounting principle through retained earnings, including a
$523 million
reclassification related to deferred gains at January 1, 2018. We also reclassified certain management and franchise agreement assets from intangibles, net to other assets and certain current and long-term liabilities to current and long-term contract liabilities.
Financial Instruments - Recognition, Measurement, Presentation, and Disclosure
—In January 2016, the FASB released ASU 2016-01
.
ASU 2016-01 revised the accounting for equity investments, excluding those accounted for under the equity method, and the presentation and disclosure requirements for financial instruments. ASU 2016-01 superseded the guidance to classify equity securities with readily determinable fair values into different categories (i.e., trading versus AFS) and requires all equity securities to be measured at fair value on a recurring basis unless an equity security does not have a readily determinable fair value. Equity securities without a readily determinable fair value are remeasured at fair value only in periods in which an observable price change is available or upon identification of an impairment. All changes in fair value are recognized in net income on our condensed consolidated statements of income.
On January 1, 2018, we adopted the provisions of ASU 2016-01 on a modified retrospective basis through a cumulative-effect adjustment to our opening condensed consolidated balance sheet. Upon adoption,
$68 million
of unrealized gains, net of tax, were reclassified from accumulated other comprehensive loss to opening retained earnings.
Accounting for Income Taxes - Intra-Entity Asset Transfers
—In October 2016, the FASB released Accounting Standards Update No. 2016-16 ("ASU 2016-16"),
Income Taxes (Topic 740): Intra-Entity Transfers of Assets Other Than Inventory
. ASU 2016-16 requires an entity to recognize the income tax consequences of an intra-entity transfer of an asset other than inventory when the transfer occurs. We adopted ASU 2016-16 on January 1, 2018 on a modified retrospective basis resulting in a
$4 million
decrease to retained earnings.
Statement of Cash Flows - Restricted Cash
—In November 2016, the FASB released Accounting Standards Update No. 2016-18 ("ASU 2016-18"),
Statement of Cash Flows (Topic 230): Restricted Cash (a consensus of the FASB Emerging Issues Task Force)
. ASU 2016-18 requires amounts generally described as restricted cash to be included within cash and cash equivalents when reconciling the total beginning and ending amounts for the periods shown on the condensed consolidated statements of cash flows. We adopted the provisions of ASU 2016-18 on January 1, 2018 on a retrospective basis. Upon adoption of ASU 2016-18, restricted cash of
$249 million
, including
$15 million
which is recognized within other assets on our condensed consolidated balance sheet at December 31, 2017, is included within the beginning balance of cash, cash equivalents, and restricted cash on our condensed consolidated statements of cash flows for the
nine months ended
September 30, 2018
. The table below summarizes the changes on our condensed consolidated statements of cash flows for the
nine months ended
September 30, 2017
:
|
Nine Months Ended September 30,
|
|||
|
2017
|
|||
|
Operating activities
|
$
|
(11
|
)
|
|
Investing activities
|
163
|
|
|
|
Financing activities
|
(3
|
)
|
|
|
Cash, cash equivalents, and restricted cash - beginning of year
|
91
|
|
|
|
Cash, cash equivalents, and restricted cash - end of period
|
$
|
240
|
|
Business Combinations - Definition of a Business
—In January 2017, the FASB released Accounting Standards Update No. 2017-01 ("ASU 2017-01"),
Business Combinations (Topic 805): Clarifying the Definition of a Business
. ASU 2017-01 clarifies the definition of a business to assist entities with evaluating whether transactions should be accounted for as acquisitions or dispositions of assets or businesses. Generally, our acquisitions and dispositions of
8
individual hotels were previously accounted for as business combinations, however, upon adoption of ASU 2017-01, there is an increased likelihood that certain acquisitions and dispositions of individual hotels will be accounted for as asset transactions. We adopted ASU 2017-01 on January 1, 2018 on a prospective basis and evaluate the impact of the standard on acquisitions and dispositions based on the relevant facts and circumstances.
Derivatives and Hedging - Accounting for Hedging Activities
—In August 2017, the FASB released Accounting Standards Update No. 2017-12 ("ASU 2017-12"),
Derivatives and Hedging (Topic 815): Targeted Improvements to Accounting for Hedging Activities
. ASU 2017-12 improves the financial reporting of hedging relationships to better portray the economic results by making improvements to simplify the application of the hedge accounting guidance in current GAAP. ASU 2017-12 is effective for interim periods and fiscal years beginning after December 15, 2018, with early adoption permitted. We early adopted ASU 2017-12 on April 1, 2018 on a modified retrospective basis, which did not impact our condensed consolidated financial statements upon adoption.
9
The impact of the changes made to our condensed consolidated financial statements as a result of the adoption of ASU 2014-09, ASU 2016-01, and ASU 2016-16 were as follows:
|
Three Months Ended September 30, 2017
|
Nine Months Ended September 30, 2017
|
||||||||||||||||||||||
|
As Reported
|
Effect of the adoption of
ASU 2014-09 |
As Adjusted
|
As Reported
|
Effect of the adoption of
ASU 2014-09 |
As Adjusted
|
||||||||||||||||||
|
REVENUES:
|
|||||||||||||||||||||||
|
Owned and leased hotels
|
$
|
518
|
|
$
|
(2
|
)
|
$
|
516
|
|
$
|
1,667
|
|
$
|
(6
|
)
|
$
|
1,661
|
|
|||||
|
Management, franchise, and other fees
|
122
|
|
1
|
|
123
|
|
374
|
|
(7
|
)
|
367
|
|
|||||||||||
|
Amortization of management and franchise agreement assets constituting payments to customers
|
—
|
|
(4
|
)
|
(4
|
)
|
—
|
|
(13
|
)
|
(13
|
)
|
|||||||||||
|
Net management, franchise, and other fees
|
122
|
|
(3
|
)
|
119
|
|
374
|
|
(20
|
)
|
354
|
|
|||||||||||
|
Other revenues
|
16
|
|
(10
|
)
|
6
|
|
53
|
|
(25
|
)
|
28
|
|
|||||||||||
|
Revenues for the reimbursement of costs incurred on behalf of managed and franchised properties
|
463
|
|
(34
|
)
|
429
|
|
1,407
|
|
(105
|
)
|
1,302
|
|
|||||||||||
|
Total revenues
|
1,119
|
|
(49
|
)
|
1,070
|
|
3,501
|
|
(156
|
)
|
3,345
|
|
|||||||||||
|
DIRECT AND SELLING, GENERAL, AND ADMINISTRATIVE EXPENSES:
|
|||||||||||||||||||||||
|
Owned and leased hotels
|
409
|
|
(3
|
)
|
406
|
|
1,266
|
|
(8
|
)
|
1,258
|
|
|||||||||||
|
Depreciation and amortization
|
92
|
|
(4
|
)
|
88
|
|
274
|
|
(13
|
)
|
261
|
|
|||||||||||
|
Other direct costs
|
9
|
|
(6
|
)
|
3
|
|
34
|
|
(14
|
)
|
20
|
|
|||||||||||
|
Selling, general, and administrative
|
89
|
|
—
|
|
89
|
|
278
|
|
—
|
|
278
|
|
|||||||||||
|
Costs incurred on behalf of managed and franchised properties
|
463
|
|
(38
|
)
|
425
|
|
1,407
|
|
(94
|
)
|
1,313
|
|
|||||||||||
|
Direct and selling, general, and administrative expenses
|
1,062
|
|
(51
|
)
|
1,011
|
|
3,259
|
|
(129
|
)
|
3,130
|
|
|||||||||||
|
Net gains and interest income from marketable securities held to fund rabbi trusts
|
12
|
|
(1
|
)
|
11
|
|
37
|
|
(2
|
)
|
35
|
|
|||||||||||
|
Equity earnings (losses) from unconsolidated hospitality ventures
|
1
|
|
—
|
|
1
|
|
(1
|
)
|
—
|
|
(1
|
)
|
|||||||||||
|
Interest expense
|
(20
|
)
|
—
|
|
(20
|
)
|
(61
|
)
|
—
|
|
(61
|
)
|
|||||||||||
|
Gains on sales of real estate
|
—
|
|
—
|
|
—
|
|
34
|
|
26
|
|
60
|
|
|||||||||||
|
Other income (loss), net
|
(19
|
)
|
3
|
|
(16
|
)
|
23
|
|
9
|
|
32
|
|
|||||||||||
|
INCOME BEFORE INCOME TAXES
|
31
|
|
4
|
|
35
|
|
274
|
|
6
|
|
280
|
|
|||||||||||
|
PROVISION FOR INCOME TAXES
|
(14
|
)
|
(2
|
)
|
(16
|
)
|
(100
|
)
|
(3
|
)
|
(103
|
)
|
|||||||||||
|
NET INCOME
|
17
|
|
2
|
|
19
|
|
174
|
|
3
|
|
177
|
|
|||||||||||
|
NET INCOME AND ACCRETION ATTRIBUTABLE TO NONCONTROLLING INTERESTS
|
(1
|
)
|
—
|
|
(1
|
)
|
(1
|
)
|
—
|
|
(1
|
)
|
|||||||||||
|
NET INCOME ATTRIBUTABLE TO HYATT HOTELS CORPORATION
|
$
|
16
|
|
$
|
2
|
|
$
|
18
|
|
$
|
173
|
|
$
|
3
|
|
$
|
176
|
|
|||||
|
EARNINGS PER SHARE—Basic
|
|||||||||||||||||||||||
|
Net income
|
$
|
0.14
|
|
$
|
0.01
|
|
$
|
0.15
|
|
$
|
1.38
|
|
$
|
0.02
|
|
$
|
1.40
|
|
|||||
|
Net income attributable to Hyatt Hotels Corporation
|
$
|
0.13
|
|
$
|
0.01
|
|
$
|
0.14
|
|
$
|
1.37
|
|
$
|
0.02
|
|
$
|
1.39
|
|
|||||
|
EARNINGS PER SHARE—Diluted
|
|||||||||||||||||||||||
|
Net income
|
$
|
0.14
|
|
$
|
0.01
|
|
$
|
0.15
|
|
$
|
1.37
|
|
$
|
0.02
|
|
$
|
1.39
|
|
|||||
|
Net income attributable to Hyatt Hotels Corporation
|
$
|
0.13
|
|
$
|
0.01
|
|
$
|
0.14
|
|
$
|
1.36
|
|
$
|
0.02
|
|
$
|
1.38
|
|
|||||
10
|
December 31, 2017
|
January 1, 2018
|
||||||||||||||||||
|
As Reported
|
Effect of the adoption of
ASU 2014-09 |
As Adjusted
|
Effect of the adoption of ASU 2016-01 and ASU 2016-16
|
As Adjusted
|
|||||||||||||||
|
ASSETS
|
|||||||||||||||||||
|
Investments
|
$
|
211
|
|
$
|
1
|
|
$
|
212
|
|
$
|
(27
|
)
|
$
|
185
|
|
||||
|
Intangibles, net
|
683
|
|
(378
|
)
|
305
|
|
—
|
|
305
|
|
|||||||||
|
Deferred tax assets
|
242
|
|
(101
|
)
|
141
|
|
1
|
|
142
|
|
|||||||||
|
Other assets
|
1,006
|
|
378
|
|
1,384
|
|
22
|
|
1,406
|
|
|||||||||
|
TOTAL ASSETS
|
7,672
|
|
(100
|
)
|
7,572
|
|
(4
|
)
|
7,568
|
|
|||||||||
|
LIABILITIES, REDEEMABLE NONCONTROLLING INTEREST, AND EQUITY
|
|
||||||||||||||||||
|
Accounts payable
|
$
|
175
|
|
$
|
(39
|
)
|
$
|
136
|
|
$
|
—
|
|
$
|
136
|
|
||||
|
Accrued expenses and other current liabilities
|
635
|
|
(283
|
)
|
352
|
|
—
|
|
352
|
|
|||||||||
|
Current contract liabilities
|
—
|
|
348
|
|
348
|
|
—
|
|
348
|
|
|||||||||
|
Long-term contract liabilities
|
—
|
|
424
|
|
424
|
|
—
|
|
424
|
|
|||||||||
|
Other long-term liabilities
|
1,725
|
|
(862
|
)
|
863
|
|
—
|
|
863
|
|
|||||||||
|
Total liabilities
|
4,131
|
|
(412
|
)
|
3,719
|
|
—
|
|
3,719
|
|
|||||||||
|
Retained earnings
|
2,742
|
|
312
|
|
3,054
|
|
64
|
|
3,118
|
|
|||||||||
|
Accumulated other comprehensive loss
|
(185
|
)
|
—
|
|
(185
|
)
|
(68
|
)
|
(253
|
)
|
|||||||||
|
Total equity
|
3,531
|
|
312
|
|
3,843
|
|
(4
|
)
|
3,839
|
|
|||||||||
|
TOTAL LIABILITIES, REDEEMABLE NONCONTROLLING INTEREST, AND EQUITY
|
7,672
|
|
(100
|
)
|
7,572
|
|
(4
|
)
|
7,568
|
|
|||||||||
The adoption of ASU 2014-09 resulted in an
$11 million
reclassification from investing into operating activities during the nine months ended September 30, 2017 related to cash outflows representing payments to customers. There were
no
impacts to cash provided by or used in financing activities on our condensed consolidated statements of cash flows.
Future Adoption of Accounting Standards
Leases
—In February 2016, the FASB released Accounting Standards Update No. 2016-02 ("ASU 2016-02"),
Leases (Topic 842)
. ASU 2016-02 requires lessees to record lease contracts on the balance sheet by recognizing a right-of-use asset and lease liability with certain practical expedients available. The accounting for lessors remains largely unchanged. In July 2018, the FASB released Accounting Standards Update No. 2018-11 ("ASU 2018-11"),
Leases (Topic 842): Targeted Improvements,
providing entities with an additional optional transition method. The provisions of ASU 2016-02, and all related ASUs, are effective for interim periods and fiscal years beginning after December 15, 2018, with early adoption permitted. The real estate leases for a majority of our owned and leased hotels include contingent lease payments, which will be excluded from the impact of ASU 2016-02. We expect to adopt ASU 2016-02 utilizing the optional transition approach allowed under ASU 2018-11 and applying the package of practical expedients beginning January 1, 2019. We continue to evaluate the impact of adopting ASU 2016-02 and expect this ASU may have a material effect to our condensed consolidated financial statements.
Financial Instruments - Credit Losses
—In June 2016, the FASB released Accounting Standards Update No. 2016-13 ("ASU 2016-13"),
Financial Instruments - Credit Losses (Topic 326): Measurement of Credit Losses on Financial Instruments
. ASU 2016-13 replaces the existing impairment model for most financial assets from an incurred loss impairment model to a current expected credit loss model, which requires an entity to recognize an impairment allowance equal to its current estimate of all contractual cash flows the entity does not expect to collect. ASU 2016-13 also requires credit losses relating to AFS debt securities to be recognized through an allowance for credit losses. The provisions of ASU 2016-13 are to be applied using a modified retrospective approach and are effective for interim periods and fiscal years beginning after December 15, 2019, with early adoption permitted. We are currently evaluating the impact of adopting ASU 2016-13.
11
Fair Value Measurement
—In August 2018, the FASB released Accounting Standards Update No. 2018-13 ("ASU 2018-13"),
Fair Value Measurement (Topic 820): Disclosure Framework-Changes to the Disclosure Requirements for Fair Value Measurement
. ASU 2018-13 modifies the disclosure requirements on fair value measurements. The provisions of ASU 2018-13 are to be applied using a prospective or retrospective approach, depending on the amendment, and are effective for interim periods and fiscal years beginning after December 15, 2019, with early adoption permitted. We are currently evaluating the impact of adopting ASU 2018-13.
Intangibles - Goodwill and Other - Internal-Use Software
—In August 2018, the FASB released Accounting Standards Update No. 2018-15 ("ASU 2018-15"),
Intangibles - Goodwill and Other - Internal-Use Software (Subtopic 350-40): Customer’s Accounting for Implementation Costs Incurred in a Cloud Computing Arrangement That Is a Service Contract
. ASU 2018-15 aligns the requirements for capitalizing implementation costs incurred in a hosting arrangement that is a service contract with the requirements for capitalizing implementation costs incurred to develop or obtain internal-use software. The provisions of ASU 2018-15 are to be applied using a prospective or retrospective approach and are effective for interim periods and fiscal years beginning after December 15, 2019, with early adoption permitted. We are currently evaluating the impact of adopting ASU 2018-15.
3
. REVENUE FROM CONTRACTS WITH CUSTOMERS
Performance Obligations
We provide products and services to our customers including third-party hotel owners, guests at owned and leased hotels and spa and fitness centers, and a third-party partner through our co-branded credit card program. The products and services offered are comprised of the following performance obligations:
|
•
|
Management and Franchise Agreements:
|
|
•
|
License to Hyatt's IP, including the Hyatt brand names
—We receive variable consideration from third-party hotel owners in exchange for providing access to our IP, including the Hyatt brand names. The license represents a license of symbolic IP and in exchange for providing the license, Hyatt receives sales-based royalty fees. Royalty fees are generally determined based on a percentage of gross revenues for managed hotels and are generally included in the hotel management fee. Royalty fees for franchised hotels are based on a percentage of gross room revenues and, as applicable, food and beverage revenues. Fees generally are payable on a monthly basis as the third-party hotel owners derive value from access to our IP. Royalty fees are recognized over time through management, franchise, and other fees as services are rendered. Under our franchise agreements, we also receive initial fees from third-party hotel owners. The initial fees do not represent a distinct performance obligation and, therefore, are combined with the royalty fees and recognized through management, franchise, and other fees over the expected customer life.
|
|
•
|
System-wide services
—We provide sales, reservations, technology, and marketing services on behalf of owners of managed and franchised properties. The promise to provide system-wide services is not a distinct performance obligation because it is attendant to the license of our IP. Therefore, the promise to provide system-wide services is combined with the license of our IP to form a single performance obligation. We have two accounting models depending on the terms of the agreements:
|
|
•
|
Cost reimbursement model
—Third-party hotel owners are required to reimburse us for all costs incurred to operate the system-wide programs with no added margin. The reimbursements are recognized over time within revenues for the reimbursement of costs incurred on behalf of managed and franchised properties. We have discretion over how we spend program revenues and, therefore, we are the principal with respect to the promise to provide system-wide services. Expenses incurred related to the system-wide programs are recognized within costs incurred on behalf of managed and franchised properties. The reimbursement of system-wide services is billed on a monthly basis based upon an annual estimate of costs to be incurred and is recognized as revenue commensurate with incurring the cost. To the extent that actual costs vary from estimated costs, a true-up billing or refund is issued to the hotels. Any amounts collected and not yet recognized as revenues are deferred and classified as contract liabilities. Any costs incurred in excess of revenues collected are classified as receivables.
|
12
|
•
|
Fund model
—Third-party hotel owners are invoiced a system-wide assessment fee primarily based on a percentage of hotel revenues on a monthly basis. We recognize the revenues over time as services are provided through revenues for the reimbursement of costs incurred on behalf of managed and franchised properties. We have discretion over how we spend program revenues and, therefore, we are the principal with respect to system-wide services. Expenses related to the system-wide programs are recognized as incurred through costs incurred on behalf of managed and franchised properties. Over time, we manage the system-wide programs to break-even, but the timing of the revenue received from the owners may not align with the timing of the expenses to operate the programs. Therefore, the difference between the revenues and expenses may impact our net income.
|
|
•
|
Hotel management agreement services
—We provide hotel management agreement services, which form a single performance obligation that qualifies as a series, under the terms of our management agreements. In exchange for providing these services, we receive variable consideration in the form of management fees, which are comprised of base and incentive fees. Incentive fees are typically subject to the achievement of certain profitability targets, and therefore, we apply judgment in determining the amount of incentive fees recognized each period. Incentive fees revenue is recognized to the extent it is probable that we will not reverse a significant portion of the fees in a subsequent period. We rely on internal financial forecasts and historical trends to estimate the amount of incentive fees revenue recognized and the probability that incentive fees will reverse in the future. Generally, base management fees are due and payable on a monthly basis as services are provided, and incentive fees are due and payable based on the terms of the agreement, but at a minimum, incentive fees are billed and collected annually. Revenue is recognized over time through management, franchise, and other fees.
|
Under the terms of certain management agreements, primarily within the United States, we are the employer of hotel employees. When we are the employer, we are reimbursed for costs incurred related to the employee management services with no added margin, and the reimbursements are recognized over time as services are rendered within revenues for the reimbursement of costs incurred on behalf of managed and franchised properties. In jurisdictions in which we are the employer, we have discretion over how employee management services are provided and, therefore, we are the principal and revenues are recognized on a gross basis.
|
•
|
Loyalty program administration
—We administer the loyalty program for the benefit of the Hyatt portfolio of properties. Under the program, members earn loyalty points that can be redeemed for future products and services. Points earned by loyalty program members represent a material right to free or discounted goods or services in the future.
|
The loyalty program has one performance obligation that consists of marketing and managing the program and arranging for award redemptions by members. The costs of operating the loyalty program are charged to the properties through an assessment fee based on members’ qualified expenditures. The assessment fee is billed and collected monthly, and the revenue received by the program is deferred until a member redeems points. Upon redemption of points at managed and franchised properties, we recognize the previously deferred revenue through revenues for the reimbursement of costs incurred on behalf of managed and franchised properties, net of redemption expense paid to managed and franchised hotels. We are responsible for arranging for the redemption of promotional awards, but we do not directly fulfill the award night obligation except at owned and leased hotels. Therefore, we are the agent with respect to this performance obligation for managed and franchised hotels, and we are the principal with respect to owned and leased hotels. When loyalty points are redeemed at owned and leased hotels, we recognize revenue through owned and leased hotels revenues.
The revenue recognized each period includes an estimate of breakage for the loyalty points that will not be redeemed. Determining breakage involves significant judgment, and we engage third-party actuaries to estimate the ultimate redemption ratios used in the breakage calculations and the amount of revenue recognized upon redemption. Changes to the expected ultimate redemption assumptions are reflected in the current period.
13
|
•
|
Room rentals and other services provided at owned and leased hotels
—We provide room rentals and other services to our guests, including but not limited to spa, laundry, and parking. These products and services each represent individual performance obligations and, in exchange for these services, we receive fixed amounts based on published rates or negotiated contracts. Payment is due in full at the time the services are rendered or the goods are provided. If a guest enters into a package including multiple goods or services, the fixed price is allocated to each distinct good or service based on the stand-alone selling price for each item. Revenue is recognized over time within owned and leased hotels revenues when we transfer control of the good or service to the customer. Room rental revenue is recognized on a daily basis as the guest occupies the room, and revenue related to other products and services is recognized when the product or service is provided to the guest.
|
Hotels commonly enter into arrangements with online travel agencies, trade associations, and other entities. As part of these arrangements, Hyatt may pay the other party a commission or rebate based on the revenue generated through that channel. The determination of whether to recognize revenues gross or net of rebates and commission is made based on the terms of each contract.
|
•
|
Spa and fitness services
—Exhale spa and fitness studios provide guests with spa and fitness services as well as retail products in exchange for fixed consideration. Each spa and fitness service represents an individual performance obligation. Payment is due in full and revenue is recognized at the point in time the services are rendered or the products are delivered. If a guest purchases a spa or fitness package, the fixed price is allocated to each distinct product or service based on the published stand-alone selling price for each item, and revenues are recognized as the services are rendered.
|
|
•
|
Co-branded credit card
—We have a co-branded credit card agreement with a third party and under the terms of the agreement, we have various performance obligations: granting a license to the Hyatt name, arranging for the fulfillment of points issued to cardholders through the loyalty program, and awarding cardholders with free room nights upon achievement of certain program milestones. The loyalty points and free room nights represent material rights that can be redeemed for free or discounted services in the future.
|
In exchange for the products and services provided, we receive fixed and variable consideration which is allocated between the performance obligations based upon the relative stand-alone selling prices. Significant judgment is involved in determining the relative stand-alone selling prices, and therefore, we engaged a third-party valuation specialist to assist us. We utilize a relief from royalty method to determine the revenue allocated to the license, which is recognized over time. We utilize observable transaction prices and adjusted market assumptions to determine the stand-alone selling price of a loyalty point, and we utilize a cost plus margin approach to determine the stand-alone selling price of the free room nights. The revenues allocated to loyalty program points and free night awards are deferred and recognized upon redemption, net of redemption expense, as we are deemed to be the agent in the transaction. We are responsible for arranging for the redemption of promotional awards, but we do not directly fulfill the award night obligation except at owned and leased hotels. Therefore, we are the agent for managed and franchised hotels, and we are the principal with respect to owned and leased hotels. When loyalty points and free nights are redeemed at owned and leased hotels, we recognize revenue through owned and leased hotels revenues.
We satisfy the following performance obligations over time: the license of Hyatt's symbolic IP, hotel management agreement services, administration of the loyalty program, and the license to our brand name through our co-branded credit card agreement. Each of these performance obligations is considered a sales-based royalty or a series of distinct services, and although the activities to fulfill each of these promises may vary from day to day, the nature of each promise is the same and the customer benefits from the services every day.
For each performance obligation satisfied over time, we recognize revenue using an output method based on the value transferred to the customer. Revenue is recognized based on the transaction price and the observable outputs related to each performance obligation. We deem the following to be a faithful depiction of our progress in satisfying these performance obligations:
|
•
|
revenues and operating profits earned by the hotels during the reporting period for access to Hyatt's IP, as it is indicative of the value third-party owners derive;
|
|
•
|
underlying revenues and operating profits of the hotels for the promise to provide management agreement services to the hotels;
|
14
|
•
|
award night redemptions for the administration of the loyalty program performance obligation; and
|
|
•
|
cardholder spend for the license to the Hyatt name through our co-branded credit card, as it is indicative of the value our partner derives from the use of our name.
|
Within our management agreements, we have two performance obligations: providing a license to Hyatt's IP and providing management agreement services. Although these constitute two separate performance obligations, both obligations represent services that are satisfied over time, and Hyatt recognizes revenue using an output method based on the performance of the hotel. Therefore, we have not allocated the transaction price between these two performance obligations as the allocation would result in the same pattern of revenue recognition.
15
Disaggregated Revenues
The following tables present our revenues disaggregated by the nature of the product or service:
|
Three months ended September 30, 2018
|
|||||||||||||||||||||
|
Disaggregated revenue stream
|
Owned and leased hotels
|
Americas management and franchising
|
ASPAC management and franchising
|
EAME/SW Asia management and franchising
|
Corporate and other
|
Eliminations
|
Total
|
||||||||||||||
|
Rooms revenues
|
$
|
276
|
|
$
|
—
|
|
$
|
—
|
|
$
|
—
|
|
$
|
5
|
|
$
|
(7
|
)
|
$
|
274
|
|
|
Food and beverage
|
133
|
|
—
|
|
—
|
|
—
|
|
2
|
|
—
|
|
135
|
|
|||||||
|
Other
|
34
|
|
—
|
|
—
|
|
—
|
|
7
|
|
—
|
|
41
|
|
|||||||
|
Owned and leased hotels
|
443
|
|
—
|
|
—
|
|
—
|
|
14
|
|
(7
|
)
|
450
|
|
|||||||
|
Base management fees
|
—
|
|
48
|
|
11
|
|
9
|
|
—
|
|
(13
|
)
|
55
|
|
|||||||
|
Incentive management fees
|
—
|
|
14
|
|
16
|
|
10
|
|
—
|
|
(7
|
)
|
33
|
|
|||||||
|
Franchise fees
|
—
|
|
32
|
|
1
|
|
—
|
|
—
|
|
—
|
|
33
|
|
|||||||
|
Other fees
|
—
|
|
1
|
|
2
|
|
2
|
|
2
|
|
—
|
|
7
|
|
|||||||
|
License fees
|
—
|
|
—
|
|
—
|
|
—
|
|
5
|
|
—
|
|
5
|
|
|||||||
|
Management, franchise, and other fees
|
—
|
|
95
|
|
30
|
|
21
|
|
7
|
|
(20
|
)
|
133
|
|
|||||||
|
Contra revenue
|
—
|
|
(4
|
)
|
—
|
|
(1
|
)
|
—
|
|
—
|
|
(5
|
)
|
|||||||
|
Net management, franchise, and other fees
|
—
|
|
91
|
|
30
|
|
20
|
|
7
|
|
(20
|
)
|
128
|
|
|||||||
|
Other revenues
|
—
|
|
—
|
|
—
|
|
—
|
|
5
|
|
2
|
|
7
|
|
|||||||
|
Revenues for the reimbursement of costs incurred on behalf of managed and franchised properties
|
—
|
|
447
|
|
24
|
|
16
|
|
2
|
|
—
|
|
489
|
|
|||||||
|
Total
|
$
|
443
|
|
$
|
538
|
|
$
|
54
|
|
$
|
36
|
|
$
|
28
|
|
$
|
(25
|
)
|
$
|
1,074
|
|
16
|
Nine months ended September 30, 2018
|
|||||||||||||||||||||
|
Disaggregated revenue stream
|
Owned and leased hotels
|
Americas management and franchising
|
ASPAC management and franchising
|
EAME/SW Asia management and franchising
|
Corporate and other
|
Eliminations
|
Total
|
||||||||||||||
|
Rooms revenues
|
$
|
848
|
|
$
|
—
|
|
$
|
—
|
|
$
|
—
|
|
$
|
18
|
|
$
|
(26
|
)
|
$
|
840
|
|
|
Food and beverage
|
474
|
|
—
|
|
—
|
|
—
|
|
7
|
|
—
|
|
481
|
|
|||||||
|
Other
|
106
|
|
—
|
|
—
|
|
—
|
|
23
|
|
—
|
|
129
|
|
|||||||
|
Owned and leased hotels
|
1,428
|
|
—
|
|
—
|
|
—
|
|
48
|
|
(26
|
)
|
1,450
|
|
|||||||
|
Base management fees
|
—
|
|
150
|
|
32
|
|
25
|
|
—
|
|
(40
|
)
|
167
|
|
|||||||
|
Incentive management fees
|
—
|
|
47
|
|
50
|
|
29
|
|
—
|
|
(21
|
)
|
105
|
|
|||||||
|
Franchise fees
|
—
|
|
94
|
|
2
|
|
—
|
|
—
|
|
—
|
|
96
|
|
|||||||
|
Other fees
|
—
|
|
10
|
|
6
|
|
4
|
|
4
|
|
—
|
|
24
|
|
|||||||
|
License fees
|
—
|
|
—
|
|
—
|
|
—
|
|
15
|
|
—
|
|
15
|
|
|||||||
|
Management, franchise, and other fees
|
—
|
|
301
|
|
90
|
|
58
|
|
19
|
|
(61
|
)
|
407
|
|
|||||||
|
Contra revenue
|
—
|
|
(10
|
)
|
(1
|
)
|
(4
|
)
|
—
|
|
—
|
|
(15
|
)
|
|||||||
|
Net management, franchise, and other fees
|
—
|
|
291
|
|
89
|
|
54
|
|
19
|
|
(61
|
)
|
392
|
|
|||||||
|
Other revenues
|
—
|
|
—
|
|
—
|
|
—
|
|
22
|
|
5
|
|
27
|
|
|||||||
|
Revenues for the reimbursement of costs incurred on behalf of managed and franchised properties
|
—
|
|
1,328
|
|
67
|
|
49
|
|
3
|
|
—
|
|
1,447
|
|
|||||||
|
Total
|
$
|
1,428
|
|
$
|
1,619
|
|
$
|
156
|
|
$
|
103
|
|
$
|
92
|
|
$
|
(82
|
)
|
$
|
3,316
|
|
17
|
Three months ended September 30, 2017
|
|||||||||||||||||||||
|
Disaggregated revenue stream
|
Owned and leased hotels
|
Americas management and franchising
|
ASPAC management and franchising
|
EAME/SW Asia management and franchising
|
Corporate and other
|
Eliminations
|
Total
|
||||||||||||||
|
Rooms revenues
|
$
|
312
|
|
$
|
—
|
|
$
|
—
|
|
$
|
—
|
|
$
|
6
|
|
$
|
(10
|
)
|
$
|
308
|
|
|
Food and beverage
|
152
|
|
—
|
|
—
|
|
—
|
|
3
|
|
—
|
|
155
|
|
|||||||
|
Other
|
46
|
|
—
|
|
—
|
|
—
|
|
7
|
|
—
|
|
53
|
|
|||||||
|
Owned and leased hotels
|
510
|
|
—
|
|
—
|
|
—
|
|
16
|
|
(10
|
)
|
516
|
|
|||||||
|
Base management fees
|
—
|
|
47
|
|
10
|
|
8
|
|
—
|
|
(14
|
)
|
51
|
|
|||||||
|
Incentive management fees
|
—
|
|
15
|
|
15
|
|
8
|
|
—
|
|
(7
|
)
|
31
|
|
|||||||
|
Franchise fees
|
—
|
|
30
|
|
—
|
|
—
|
|
—
|
|
—
|
|
30
|
|
|||||||
|
Other fees
|
—
|
|
2
|
|
2
|
|
1
|
|
1
|
|
—
|
|
6
|
|
|||||||
|
License fees
|
—
|
|
—
|
|
—
|
|
—
|
|
5
|
|
—
|
|
5
|
|
|||||||
|
Management, franchise, and other fees
|
—
|
|
94
|
|
27
|
|
17
|
|
6
|
|
(21
|
)
|
123
|
|
|||||||
|
Contra revenue
|
—
|
|
(3
|
)
|
—
|
|
(1
|
)
|
—
|
|
—
|
|
(4
|
)
|
|||||||
|
Net management, franchise, and other fees
|
—
|
|
91
|
|
27
|
|
16
|
|
6
|
|
(21
|
)
|
119
|
|
|||||||
|
Other revenues
|
—
|
|
—
|
|
—
|
|
—
|
|
3
|
|
3
|
|
6
|
|
|||||||
|
Revenues for the reimbursement of costs incurred on behalf of managed and franchised properties
|
—
|
|
395
|
|
19
|
|
15
|
|
—
|
|
—
|
|
429
|
|
|||||||
|
Total
|
$
|
510
|
|
$
|
486
|
|
$
|
46
|
|
$
|
31
|
|
$
|
25
|
|
$
|
(28
|
)
|
$
|
1,070
|
|
18
|
Nine months ended September 30, 2017
|
|||||||||||||||||||||
|
Disaggregated revenue stream
|
Owned and leased hotels
|
Americas management and franchising
|
ASPAC management and franchising
|
EAME/SW Asia management and franchising
|
Corporate and other
|
Eliminations
|
Total
|
||||||||||||||
|
Rooms revenues
|
$
|
969
|
|
$
|
—
|
|
$
|
—
|
|
$
|
—
|
|
$
|
18
|
|
$
|
(29
|
)
|
$
|
958
|
|
|
Food and beverage
|
544
|
|
—
|
|
—
|
|
—
|
|
9
|
|
—
|
|
553
|
|
|||||||
|
Other
|
128
|
|
—
|
|
—
|
|
—
|
|
22
|
|
—
|
|
150
|
|
|||||||
|
Owned and leased hotels
|
1,641
|
|
—
|
|
—
|
|
—
|
|
49
|
|
(29
|
)
|
1,661
|
|
|||||||
|
Base management fees
|
—
|
|
147
|
|
28
|
|
22
|
|
—
|
|
(47
|
)
|
150
|
|
|||||||
|
Incentive management fees
|
—
|
|
46
|
|
44
|
|
24
|
|
—
|
|
(19
|
)
|
95
|
|
|||||||
|
Franchise fees
|
—
|
|
84
|
|
2
|
|
—
|
|
—
|
|
—
|
|
86
|
|
|||||||
|
Other fees
|
—
|
|
12
|
|
5
|
|
3
|
|
2
|
|
—
|
|
22
|
|
|||||||
|
License fees
|
—
|
|
—
|
|
—
|
|
—
|
|
14
|
|
—
|
|
14
|
|
|||||||
|
Management, franchise, and other fees
|
—
|
|
289
|
|
79
|
|
49
|
|
16
|
|
(66
|
)
|
367
|
|
|||||||
|
Contra revenue
|
—
|
|
(9
|
)
|
(1
|
)
|
(3
|
)
|
—
|
|
—
|
|
(13
|
)
|
|||||||
|
Net management, franchise, and other fees
|
—
|
|
280
|
|
78
|
|
46
|
|
16
|
|
(66
|
)
|
354
|
|
|||||||
|
Other revenues
|
13
|
|
—
|
|
—
|
|
—
|
|
8
|
|
7
|
|
28
|
|
|||||||
|
Revenues for the reimbursement of costs incurred on behalf of managed and franchised properties
|
—
|
|
1,205
|
|
56
|
|
41
|
|
—
|
|
—
|
|
1,302
|
|
|||||||
|
Total
|
$
|
1,654
|
|
$
|
1,485
|
|
$
|
134
|
|
$
|
87
|
|
$
|
73
|
|
$
|
(88
|
)
|
$
|
3,345
|
|
Contract Balances
Our payments from customers are based on the billing terms established in our contracts. Customer billings are classified as accounts receivable when our right to consideration is unconditional. If our right to consideration is conditional on future performance under the contract, the balance is classified as a contract asset. Under the terms of our management agreements, we earn incentive management fees based on a percentage of hotel profitability. The incentive fee may be contingent on the hotel achieving certain profitability targets. We recognize an incentive fee receivable each month to the extent it is probable that we will not reverse a significant portion of the fees in a subsequent period. However, due to the profitability hurdles in the contract, incentive fees are considered contract assets until the risk related to the achievement of the profitability metric no longer exists. Once the profitability hurdle has been met, the incentive fee receivable balance will be reflected within accounts receivable.
Our contract assets were
$1 million
and insignificant at
September 30, 2018
and
December 31, 2017
, respectively. At
September 30, 2018
, the contract assets were included in receivables, net. As our profitability hurdles are generally calculated on a full-year basis, we expect our contract asset balance to be insignificant at year end.
19
Payments received in advance of performance under the contract are classified as contract liabilities and recognized as revenue as we perform under the contract.
|
|
September 30, 2018
|
|
December 31, 2017
|
|
$ Change
|
|
% Change
|
|||||||
|
Current contract liabilities
|
$
|
332
|
|
|
$
|
348
|
|
|
$
|
(16
|
)
|
|
(4.6
|
)%
|
|
Long-term contract liabilities
|
433
|
|
|
424
|
|
|
9
|
|
|
2.4
|
%
|
|||
|
Total contract liabilities
|
$
|
765
|
|
$
|
772
|
|
$
|
(7
|
)
|
(0.8
|
)%
|
|||
The contract liabilities balances above are comprised of the following:
|
September 30, 2018
|
December 31, 2017
|
||||||
|
Advanced deposits
|
$
|
55
|
|
$
|
59
|
|
|
|
Deferred revenue related to the loyalty program
|
584
|
|
561
|
|
|||
|
Deferred revenue related to system-wide services
|
14
|
|
9
|
|
|||
|
Initial fees received from franchise owners
|
33
|
|
27
|
|
|||
|
Other deferred revenue
|
79
|
|
116
|
|
|||
|
Total contract liabilities
|
$
|
765
|
|
$
|
772
|
|
|
Revenue recognized during the three months ended
September 30, 2018
and
September 30, 2017
included in the contract liability balance at the beginning of each year was
$222 million
and
$216 million
, respectively. Revenue recognized during the
nine months ended
September 30, 2018
and
September 30, 2017
included in the contract liability balance at the beginning of each year was
$663 million
and
$639 million
, respectively. This revenue was primarily related to advanced deposits and the loyalty program, which is recognized net of redemption reimbursements paid to third parties.
Revenue Allocated to Remaining Performance Obligations
Revenue allocated to remaining performance obligations represents contracted revenue that has not yet been recognized, which includes deferred revenue and amounts that will be invoiced and recognized as revenue in future periods. Contracted revenue expected to be recognized in future periods was approximately
$110 million
at
September 30, 2018
, of which we expect to recognize approximately
20%
as revenue over the next 12 months and the remainder thereafter.
We did not estimate revenues expected to be recognized related to our unsatisfied performance obligations for the following:
|
•
|
Deferred revenue related to the loyalty program and revenue from base and incentive management fees as the revenue is allocated to a wholly unperformed performance obligation in a series;
|
|
•
|
Revenues related to royalty fees as they are considered sales-based royalty fees;
|
|
•
|
Revenues received for free nights granted through our co-branded credit card as the awards are required to be redeemed within 12 months; and
|
|
•
|
Revenues related to advanced bookings at owned and leased hotels as each stay has a duration of 12 months or less.
|
We elected to apply the practical expedient that permits the omission of prior-period information about revenue allocated to future performance obligations under ASU 2014-09.
4
. DEBT AND EQUITY SECURITIES
We make investments in debt and equity securities that we believe are strategically and operationally important to our business. These investments take the form of (i) equity method investments where we have the ability to significantly influence the operations of the entity, (ii) marketable securities held to fund operating programs and for investment purposes, and (iii) other types of investments.
20
Equity Method Investments
|
September 30, 2018
|
December 31, 2017
|
||||||
|
Equity method investments
|
$
|
225
|
|
$
|
185
|
|
|
During the
three and nine months ended
September 30, 2018
, we recognized
$1 million
and
$11 million
, respectively, of net gains in equity earnings (losses) from unconsolidated hospitality ventures on our condensed consolidated statements of income resulting from sales activity related to certain equity method investments within our owned and leased hotels segment. During the
three and nine months ended
September 30, 2018
, we received $
7 million
and
$17 million
, respectively, of related sales proceeds.
During the
nine months ended
September 30, 2018
, we completed an asset acquisition of our partner's interest in certain unconsolidated hospitality ventures in Brazil for a net purchase price of approximately
$4 million
. During the
nine months ended
September 30, 2018
, we recognized
$16 million
of impairment charges related to these investments in equity earnings (losses) from unconsolidated hospitality ventures on our condensed consolidated statements of income as the carrying value was in excess of fair value. The fair value was determined to be a Level Three fair value measure, and the impairment was deemed other-than-temporary.
During the
nine months ended
September 30, 2017
, an unconsolidated hospitality venture within our owned and leased hotels segment sold a hotel. We received
$4 million
of proceeds and recognized a
$2 million
gain in equity earnings (losses) from unconsolidated hospitality ventures on our condensed consolidated statements of income.
During the three and
nine months ended
September 30, 2017
, we recognized
$3 million
of impairment charges in equity earnings (losses) from unconsolidated hospitality ventures on our condensed consolidated statements of income.
The following table presents summarized financial information for all unconsolidated hospitality ventures in which we hold an investment accounted for under the equity method:
|
|
Three Months Ended September 30,
|
Nine Months Ended September 30,
|
|||||||||||||
|
|
2018
|
2017
|
2018
|
2017
|
|||||||||||
|
Total revenues
|
$
|
135
|
|
$
|
196
|
|
$
|
399
|
|
$
|
649
|
|
|||
|
Gross operating profit
|
53
|
|
80
|
|
141
|
|
225
|
|
|||||||
|
Income (loss) from continuing operations
|
(12
|
)
|
38
|
|
(15
|
)
|
36
|
|
|||||||
|
Net income (loss)
|
(12
|
)
|
38
|
|
(15
|
)
|
36
|
|
|||||||
Marketable Securities
We hold marketable securities with readily determinable fair values to fund certain operating programs and for investment purposes. Additionally, we periodically transfer available cash and cash equivalents to purchase marketable securities for investment purposes.
Marketable Securities Held to Fund Operating Programs
—Marketable securities held to fund operating programs, which are recorded at fair value and included on our condensed consolidated balance sheets, were as follows:
|
September 30, 2018
|
December 31, 2017
|
||||||
|
Deferred compensation plans held in rabbi trusts (Note 8 and 10)
|
$
|
413
|
|
$
|
402
|
|
|
|
Loyalty program
|
391
|
|
403
|
|
|||
|
Captive insurance companies
|
114
|
|
111
|
|
|||
|
Total marketable securities held to fund operating programs
|
$
|
918
|
|
$
|
916
|
|
|
|
Less: current portion of marketable securities held to fund operating programs included in cash and cash equivalents, short-term investments, and prepaids and other assets
|
(157
|
)
|
(156
|
)
|
|||
|
Marketable securities held to fund operating programs included in other assets
|
$
|
761
|
|
$
|
760
|
|
|
21
Net realized and unrealized gains (losses) and interest income from marketable securities held to fund the loyalty program are recognized in other income (loss), net on our condensed consolidated statements of income:
|
Three Months Ended September 30,
|
Nine Months Ended September 30,
|
||||||||||||||
|
2018
|
2017
|
2018
|
2017
|
||||||||||||
|
Loyalty program (Note 18)
|
$
|
1
|
|
$
|
2
|
|
$
|
(2
|
)
|
$
|
9
|
|
|||
Net realized and unrealized gains and interest income from marketable securities held to fund rabbi trusts are recognized in net gains and interest income from marketable securities held to fund rabbi trusts on our condensed consolidated statements of income:
|
|
Three Months Ended September 30,
|
Nine Months Ended September 30,
|
|||||||||||||
|
2018
|
2017
|
2018
|
2017
|
||||||||||||
|
Unrealized gains
|
$
|
5
|
|
$
|
8
|
|
$
|
7
|
|
$
|
24
|
|
|||
|
Realized gains
|
5
|
|
3
|
|
12
|
|
11
|
|
|||||||
|
Net gains and interest income from marketable securities held to fund rabbi trusts
|
$
|
10
|
|
$
|
11
|
|
$
|
19
|
|
$
|
35
|
|
|||
Our captive insurance companies hold marketable securities which are classified as AFS debt securities and are invested in U.S. government agencies, time deposits, and corporate debt securities. We classify these investments as current or long-term, based on their contractual maturity dates, which range from 2018 through 2023.
Marketable Securities Held for Investment Purposes
—Marketable securities held for investment purposes, which are recorded at fair value and included on our condensed consolidated balance sheets, were as follows:
|
September 30, 2018
|
December 31, 2017
|
||||||
|
Interest-bearing money market funds
|
$
|
38
|
|
$
|
26
|
|
|
|
Time deposits
|
200
|
|
37
|
|
|||
|
Common shares
|
117
|
|
131
|
|
|||
|
Total marketable securities held for investment purposes
|
$
|
355
|
|
$
|
194
|
|
|
|
Less: current portion of marketable securities held for investment purposes included in cash and cash equivalents and short-term investments
|
(238
|
)
|
(63
|
)
|
|||
|
Marketable securities held for investment purposes included in other assets
|
$
|
117
|
|
$
|
131
|
|
|
During 2013, we invested in the common shares of Playa Hotels & Resorts B.V. ("Playa"), and we accounted for our common share investment as an equity method investment. In March 2017, Playa completed a business combination, and Playa Hotels & Resorts N.V. ("Playa N.V.") is now publicly traded on the NASDAQ. Our investment is accounted for as an equity security with a readily determinable fair value as we do not have the ability to significantly influence the operations of the entity. The fair value of the common shares is classified as Level One in the fair value hierarchy as we are able to obtain market available pricing information. The remeasurement of our investment at fair value resulted in
$14 million
of unrealized losses recognized in other income (loss), net on our condensed consolidated statements of income for the
three and nine months ended
September 30, 2018
, respectively (see Note 18). We did
not
sell any shares of common stock during the
nine months ended
September 30, 2018
.
22
Other Investments
Preferred shares
—During 2013, we also invested
$271 million
in Playa for convertible redeemable preferred shares which were classified as an AFS debt security. The fair value of the preferred shares was:
|
2017
|
||||
|
Fair value at January 1
|
$
|
290
|
|
|
|
Gross unrealized losses
|
(54
|
)
|
||
|
Realized losses (1) (Note 18)
|
(40
|
)
|
||
|
Interest income (Note 18)
|
94
|
|
||
|
Cash redemption
|
(290
|
)
|
||
|
Fair value at September 30
|
$
|
—
|
|
|
|
(1) The realized losses were the result of a difference between the fair value of the initial investment and the contractual redemption price of $8.40 per share.
|
||||
HTM Debt Securities
—At
September 30, 2018
and
December 31, 2017
, we held
$48 million
and
$47 million
, respectively, of investments in HTM debt securities, which are investments in third-party entities that own certain of our hotels and are recorded within other assets in our condensed consolidated balance sheets. The securities are mandatorily redeemable between 2020 and 2025. The amortized cost of our investments approximate fair value. We estimated the fair value of our investments using internally developed discounted cash flow models based on current market inputs for similar types of arrangements. Based upon the lack of available market data, our investments are classified as Level Three within the fair value hierarchy. The primary sensitivity in these calculations is based on the selection of appropriate discount rates. Fluctuations in these assumptions could result in different estimates of fair value.
Equity Securities Without a Readily Determinable Fair Value
—At
September 30, 2018
and
December 31, 2017
, we had
$9 million
and
$27 million
, respectively, of investments in equity securities without a readily determinable fair value, which represent investments in entities where we do not have the ability to significantly influence the operations of the entity. At December 31, 2017, the securities were included in investments on our condensed consolidated balance sheets. As a result of the adoption of ASU 2016-01 on January 1, 2018, we have reclassified these investments to other assets on our condensed consolidated balance sheet at
September 30, 2018
.
Due to ongoing operating cash flow shortfalls in the business underlying an equity security during the
nine months ended
September 30, 2018
, we recognized a
$22 million
impairment charge of our full investment balance in other income (loss), net on our condensed consolidated statements of income (see Note 18) as we deemed that the carrying value was in excess of the fair value. The fair value was determined to be a Level Three fair value measure. During the three months ended September 30, 2018, the entity in which we hold our investment disposed of its assets and is in the process of winding down.
23
Fair Value
—We measured the following financial assets at fair value on a recurring basis:
|
September 30, 2018
|
Cash and cash equivalents
|
Short-term investments
|
Prepaids and other assets
|
Other assets
|
|||||||||||||||
|
Level One - Quoted Prices in Active Markets for Identical Assets
|
|||||||||||||||||||
|
Interest-bearing money market funds
|
$
|
88
|
|
$
|
88
|
|
$
|
—
|
|
$
|
—
|
|
$
|
—
|
|
||||
|
Mutual funds
|
413
|
|
—
|
|
—
|
|
—
|
|
413
|
|
|||||||||
|
Common shares
|
117
|
|
—
|
|
—
|
|
—
|
|
117
|
|
|||||||||
|
Level Two - Significant Other Observable Inputs
|
|||||||||||||||||||
|
Time deposits
|
212
|
|
—
|
|
204
|
|
—
|
|
8
|
|
|||||||||
|
U.S. government obligations
|
158
|
|
—
|
|
—
|
|
37
|
|
121
|
|
|||||||||
|
U.S. government agencies
|
46
|
|
—
|
|
1
|
|
6
|
|
39
|
|
|||||||||
|
Corporate debt securities
|
168
|
|
—
|
|
12
|
|
30
|
|
126
|
|
|||||||||
|
Mortgage-backed securities
|
22
|
|
—
|
|
—
|
|
5
|
|
17
|
|
|||||||||
|
Asset-backed securities
|
46
|
|
—
|
|
—
|
|
11
|
|
35
|
|
|||||||||
|
Municipal and provincial notes and bonds
|
3
|
|
—
|
|
—
|
|
1
|
|
2
|
|
|||||||||
|
Total
|
$
|
1,273
|
|
$
|
88
|
|
$
|
217
|
|
$
|
90
|
|
$
|
878
|
|
||||
|
December 31, 2017
|
Cash and cash equivalents
|
Short-term investments
|
Prepaids and other assets
|
Other assets
|
|||||||||||||||
|
Level One - Quoted Prices in Active Markets for Identical Assets
|
|||||||||||||||||||
|
Interest-bearing money market funds
|
$
|
75
|
|
$
|
75
|
|
$
|
—
|
|
$
|
—
|
|
$
|
—
|
|
||||
|
Mutual funds
|
402
|
|
—
|
|
—
|
|
—
|
|
402
|
|
|||||||||
|
Common shares
|
131
|
|
—
|
|
—
|
|
—
|
|
131
|
|
|||||||||
|
Level Two - Significant Other Observable Inputs
|
|||||||||||||||||||
|
Time deposits
|
50
|
|
—
|
|
39
|
|
—
|
|
11
|
|
|||||||||
|
U.S. government obligations
|
158
|
|
—
|
|
—
|
|
38
|
|
120
|
|
|||||||||
|
U.S. government agencies
|
47
|
|
—
|
|
2
|
|
7
|
|
38
|
|
|||||||||
|
Corporate debt securities
|
179
|
|
—
|
|
8
|
|
33
|
|
138
|
|
|||||||||
|
Mortgage-backed securities
|
25
|
|
—
|
|
—
|
|
6
|
|
19
|
|
|||||||||
|
Asset-backed securities
|
40
|
|
—
|
|
—
|
|
10
|
|
30
|
|
|||||||||
|
Municipal and provincial notes and bonds
|
3
|
|
—
|
|
—
|
|
1
|
|
2
|
|
|||||||||
|
Total
|
$
|
1,110
|
|
$
|
75
|
|
$
|
49
|
|
$
|
95
|
|
$
|
891
|
|
||||
During the
three and nine months ended
September 30, 2018
and
September 30, 2017
, there were no transfers between levels of the fair value hierarchy. We do not have non-financial assets or non-financial liabilities required to be measured at fair value on a recurring basis.
24
5
. FINANCING RECEIVABLES
|
September 30, 2018
|
December 31, 2017
|
||||||
|
Unsecured financing to hotel owners
|
$
|
158
|
|
$
|
127
|
|
|
|
Less: current portion of financing receivables, included in receivables, net
|
(45
|
)
|
—
|
|
|||
|
Less: allowance for losses
|
(99
|
)
|
(108
|
)
|
|||
|
Total long-term financing receivables, net of allowances
|
$
|
14
|
|
$
|
19
|
|
|
Allowance for Losses and Impairments
—The following table summarizes the activity in our unsecured financing receivables allowance:
|
2018
|
2017
|
||||||
|
Allowance at January 1
|
$
|
108
|
|
$
|
100
|
|
|
|
Provisions
|
3
|
|
4
|
|
|||
|
Other adjustments
|
(2
|
)
|
1
|
|
|||
|
Allowance at June 30
|
$
|
109
|
|
$
|
105
|
|
|
|
Provisions
|
2
|
|
1
|
|
|||
|
Write-offs
|
(12
|
)
|
—
|
|
|||
|
Other adjustments
|
—
|
|
1
|
|
|||
|
Allowance at September 30
|
$
|
99
|
|
$
|
107
|
|
|
Credit Monitoring
—Our unsecured financing receivables were as follows:
|
September 30, 2018
|
|||||||||||||||
|
|
Gross loan balance (principal and interest)
|
Related allowance
|
Net financing receivables
|
Gross receivables on non-accrual status
|
|||||||||||
|
Loans
|
$
|
58
|
|
$
|
—
|
|
$
|
58
|
|
$
|
—
|
|
|||
|
Impaired loans (1)
|
50
|
|
(50
|
)
|
—
|
|
50
|
|
|||||||
|
Total loans
|
108
|
|
(50
|
)
|
58
|
|
50
|
|
|||||||
|
Other financing arrangements
|
50
|
|
(49
|
)
|
1
|
|
49
|
|
|||||||
|
Total unsecured financing receivables
|
$
|
158
|
|
$
|
(99
|
)
|
$
|
59
|
|
$
|
99
|
|
|||
(1) The unpaid principal balance was
$36 million
and the average recorded loan balance was
$54 million
at
September 30, 2018
.
|
December 31, 2017
|
|||||||||||||||
|
|
Gross loan balance (principal and interest)
|
Related allowance
|
Net financing receivables
|
Gross receivables on non-accrual status
|
|||||||||||
|
Loans
|
$
|
13
|
|
$
|
—
|
|
$
|
13
|
|
$
|
—
|
|
|||
|
Impaired loans (2)
|
59
|
|
(59
|
)
|
—
|
|
59
|
|
|||||||
|
Total loans
|
72
|
|
(59
|
)
|
13
|
|
59
|
|
|||||||
|
Other financing arrangements
|
55
|
|
(49
|
)
|
6
|
|
49
|
|
|||||||
|
Total unsecured financing receivables
|
$
|
127
|
|
$
|
(108
|
)
|
$
|
19
|
|
$
|
108
|
|
|||
Fair Value
—We estimated the fair value of financing receivables, which are classified as Level Three in the fair value hierarchy, to be
$60 million
at
September 30, 2018
and
$20 million
at
December 31, 2017
.
25
6
. ACQUISITIONS AND DISPOSITIONS
Acquisitions
Hyatt Regency Phoenix
—During the
three months ended
September 30, 2018
, we completed an asset acquisition of Hyatt Regency Phoenix from an unrelated third party for a purchase price of approximately
$139 million
, net of
$1 million
of proration adjustments. Assets acquired and recorded in our owned and leased hotels segment consist primarily of
$136 million
of property and equipment. The purchase of Hyatt Regency Phoenix was designated as replacement property in a like-kind exchange (see "Like-Kind Exchange Agreements" below).
Hyatt Regency Indian Wells Resort & Spa
—During the
three months ended
September 30, 2018
, we completed an asset acquisition of Hyatt Regency Indian Wells Resort & Spa from an unrelated third party for a net purchase price of approximately
$120 million
. Assets acquired and recorded in our owned and leased hotels segment consist primarily of
$119 million
of property and equipment. The purchase of Hyatt Regency Indian Wells Resort & Spa was designated as replacement property in a like-kind exchange (see "Like-Kind Exchange Agreements" below).
Exhale
—During the
nine
months ended September 30, 2017, we acquired the equity of Exhale Enterprises, Inc. ("exhale") from an unrelated third party for a purchase price of
$16 million
, net of
$1 million
cash acquired. Assets acquired and recorded within corporate and other primarily include a
$9 million
brand indefinite-lived intangible and
$4 million
of goodwill, of which
$3 million
is deductible for tax purposes.
Miraval
—During the
nine
months ended
September 30, 2017
, we acquired Miraval Group ("Miraval") from an unrelated third party. The transaction included the Miraval Life in Balance Spa brand, Miraval Arizona Resort & Spa in Tucson, Arizona, Travaasa Resort in Austin, Texas, and the option to acquire Cranwell Spa & Golf Resort ("Cranwell") in Lenox, Massachusetts. We subsequently exercised our option and acquired the majority of Cranwell during the
nine
months ended
September 30, 2017
. Total cash consideration for Miraval was
$237 million
.
The following table summarizes the fair value of the identifiable net assets acquired in the acquisition of Miraval, which is recorded within corporate and other:
|
Current assets, net of cash acquired
|
$
|
1
|
|
|
Property and equipment
|
172
|
|
|
|
Indefinite-lived intangibles (1)
|
37
|
|
|
|
Management agreement intangibles (2)
|
14
|
|
|
|
Goodwill (3)
|
21
|
|
|
|
Other definite-lived intangibles (4)
|
7
|
|
|
|
Total assets
|
$
|
252
|
|
|
Current liabilities
|
$
|
13
|
|
|
Deferred tax liabilities
|
3
|
|
|
|
Total liabilities
|
16
|
|
|
|
Total net assets acquired attributable to Hyatt Hotels Corporation
|
236
|
|
|
|
Total net assets acquired attributable to noncontrolling interests
|
1
|
|
|
|
Total net assets acquired
|
$
|
237
|
|
(1) Includes an intangible attributable to the Miraval brand.
(2) Amortized over a
20
year useful life.
(3) The goodwill, of which
$10 million
is deductible for tax purposes, is attributable to Miraval's reputation as a renowned provider of wellness and mindfulness experiences, the extension of the Hyatt brand beyond traditional hotel stays, and the establishment of deferred tax liabilities.
(4) Amortized over useful lives ranging from
two
to
seven
years.
In conjunction with the acquisition of Miraval, a consolidated hospitality venture for which we are the managing partner (the "Miraval Venture") issued
$9 million
of redeemable preferred shares to unrelated third-party investors. The preferred shares were non-voting, except as required by applicable law and certain contractual approval rights, and had liquidation preference over all other classes of securities within the Miraval Venture. The redeemable
26
preferred shares earned a return of
12%
. The shares were classified as a redeemable noncontrolling interest in preferred shares of a subsidiary, which were presented between liabilities and equity on our condensed consolidated balance sheets and carried at the redemption value. During the nine months ended
September 30, 2018
, the preferred shares were redeemed for
$10 million
.
Dispositions
Hyatt Regency Mexico City
—During the
three months ended
September 30, 2018
, we sold the shares of the entity which owns Hyatt Regency Mexico City, an investment in an unconsolidated hospitality venture, and adjacent land, a portion of which will be developed as Park Hyatt Mexico City, ("HRMC transaction") to an unrelated third party for approximately
$405 million
and accounted for the transaction as an asset disposition. We entered into long-term management agreements for the properties upon sale. We received
$360 million
of proceeds and issued a
$45 million
unsecured financing receivable with a maturity date of less than one year (see Note 5). The sale resulted in a pre-tax gain of approximately
$240 million
which was recognized in gains on sales of real estate on our condensed consolidated statements of income during the
three and nine months ended
September 30, 2018
. In connection with the disposition, we recognized a
$21 million
goodwill impairment charge in asset impairments on our condensed consolidated statements of income during the
three and nine months ended
September 30, 2018
. As we disposed of the assets within the reporting unit, there were no future cash flows to support the related goodwill which was therefore impaired. The operating results and financial position prior to the sale remain within our owned and leased hotels segment. At June 30, 2018, we classified the assets and liabilities as held for sale on our condensed consolidated balance sheets.
Grand Hyatt San Francisco, Andaz Maui at Wailea Resort, and Hyatt Regency Coconut Point Resort and Spa
—During the
nine
months ended
September 30, 2018
, we sold Grand Hyatt San Francisco, Andaz Maui at Wailea Resort together with adjacent land, and Hyatt Regency Coconut Point Resort and Spa to an unrelated third party as a portfolio for approximately
$992 million
, net of closing costs and proration adjustments, and entered into long-term management agreements for the properties upon sale. The sale resulted in a
$531 million
pre-tax gain which was recognized in gains on sales of real estate on our condensed consolidated statements of income during the
nine
months ended
September 30, 2018
. The operating results and financial position of these hotels prior to the sale remain within our owned and leased hotels segment. Although we concluded the disposal of these properties does not qualify as discontinued operations, the disposal is considered to be material. Pre-tax net income attributable to the three properties was
$15 million
during the nine months ended
September 30, 2018
and
$5 million
and
$20 million
during the three and nine months ended September 30, 2017, respectively.
Land Held for Development—
A wholly owned subsidiary held undeveloped land in Los Cabos, Mexico. During the
nine
months ended
September 30, 2018
, an unrelated third party invested in the subsidiary in exchange for a
50%
ownership interest resulting in derecognition of the subsidiary. Our remaining interest was recorded at a fair value of
$45 million
as an equity method investment.
Hyatt Regency Grand Cypress—
During the nine months ended September 30, 2017, we sold Hyatt Regency Grand Cypress to an unrelated third party for
$202 million
, net of closing costs and proration adjustments, and entered into a long-term management agreement with the owner of the property. The sale resulted in a
$26 million
pre-tax gain which was recognized in gains on sales of real estate on our condensed consolidated statements of income during the nine months ended September 30, 2017. The operating results and financial position of this hotel prior to the sale remain within our owned and leased hotels segment.
Hyatt Regency Louisville
—During the nine months ended September 30, 2017, we sold Hyatt Regency Louisville to an unrelated third party for
$65 million
, net of closing costs and proration adjustments, and entered into a long-term franchise agreement with the owner of the property. The sale resulted in a
$35 million
pre-tax gain which was recognized in gains on sales of real estate on our condensed consolidated statements of income during the nine months ended September 30, 2017. The operating results and financial position of this hotel prior to the sale remain within our owned and leased hotels segment.
Land Held for Development—
During the nine months ended September 30, 2017, we sold land and construction in progress for
$29 million
to an unconsolidated hospitality venture in which we have a
50%
ownership interest, with the intent to complete the development of a hotel in Glendale, California.
27
Like-Kind Exchange Agreements
Periodically, we enter into like-kind exchange agreements upon the disposition or acquisition of certain properties. Pursuant to the terms of these agreements, the proceeds from the sales are placed into an escrow account administered by a qualified intermediary. The proceeds are recognized as restricted cash on our condensed consolidated balance sheets and released (i) if they are utilized as part of a like-kind exchange agreement, (ii) if we do not identify a suitable replacement property within
45 days
after the agreement date, or (iii) when a like-kind exchange agreement is not completed within the remaining allowable time period.
In conjunction with the sale of Hyatt Regency Coconut Point Resort and Spa during the
nine
months ended
September 30, 2018
, proceeds of
$221 million
were held as restricted for use in a potential like-kind exchange. During the
three
months ended
September 30, 2018
,
$198 million
of these proceeds were utilized to acquire Hyatt Regency Phoenix and Hyatt Regency Indian Wells Resort & Spa and the remaining
$23 million
were released.
In conjunction with the sale of Hyatt Regency Scottsdale Resort & Spa at Gainey Ranch during the year ended December 31, 2017, proceeds of
$207 million
were initially held as restricted for use in a potential like-kind exchange. However, we did
not
acquire an identified replacement property within the specified 180 day period and the proceeds were released during the nine months ended September 30, 2018.
Assets Held For Sale
During the
nine
months ended
September 30, 2018
, we signed a purchase and sale agreement to sell a Hyatt House hotel. The assets and liabilities are classified as held for sale and related operating results remain within our owned and leased hotels segment at
September 30, 2018
. Assets held for sale primarily consist of
$44 million
of property and equipment, net, and liabilities held for sale are insignificant. In October 2018, we sold the hotel (see Note 19).
7
. INTANGIBLES, NET
|
September 30, 2018
|
Weighted-
average useful
lives in years
|
December 31, 2017
|
||||||||
|
Management and franchise agreement intangibles
|
$
|
178
|
|
23
|
|
$
|
178
|
|
||
|
Lease related intangibles
|
123
|
|
110
|
|
127
|
|
||||
|
Brand and other indefinite-lived intangibles
|
53
|
|
—
|
|
53
|
|
||||
|
Advanced bookings intangibles
|
15
|
|
5
|
|
9
|
|
||||
|
Other definite-lived intangibles
|
8
|
|
6
|
|
9
|
|
||||
|
377
|
|
376
|
|
|||||||
|
Accumulated amortization
|
(81
|
)
|
(71
|
)
|
||||||
|
Intangibles, net
|
$
|
296
|
|
$
|
305
|
|
||||
|
|
Three Months Ended September 30,
|
Nine Months Ended September 30,
|
|||||||||||||
|
|
2018
|
2017
|
2018
|
2017
|
|||||||||||
|
Amortization expense
|
$
|
3
|
|
$
|
3
|
|
$
|
10
|
|
$
|
10
|
|
|||
28
8
. OTHER ASSETS
|
September 30, 2018
|
December 31, 2017
|
||||||
|
Marketable securities held to fund rabbi trusts (Note 4)
|
$
|
413
|
|
$
|
402
|
|
|
|
Management and franchise agreement assets constituting payments to customers
(1)
|
385
|
|
378
|
|
|||
|
Loyalty program marketable securities (Note 4)
|
293
|
|
298
|
|
|||
|
Common shares of Playa N.V. (Note 4)
|
117
|
|
131
|
|
|||
|
Long-term investments
|
112
|
|
109
|
|
|||
|
Other
|
75
|
|
66
|
|
|||
|
Total other assets
|
$
|
1,395
|
|
$
|
1,384
|
|
|
|
(1) Includes cash consideration as well as other forms of consideration provided, such as debt repayment or performance guarantees.
|
|||||||
9
. DEBT
Long-term debt, net of current maturities was
$1,622 million
and $
1,440 million
at
September 30, 2018
and
December 31, 2017
, respectively.
Senior Notes
—During the
three months ended
September 30, 2018
, we issued
$400 million
of
4.375%
senior notes due 2028, at an issue price of
99.866%
(the "2028 Notes"). We received
$396 million
of net proceeds from the sale of the
2028
Notes, after deducting
$4 million
of underwriting discounts and other offering expenses. We used a portion of the proceeds from the issuance of the 2028 Notes to redeem our
6.875%
senior notes due 2019 (the "2019 Notes") and intend to use the remainder for general corporate purposes. Interest on the 2028 Notes is payable semi-annually on March 15 and September 15 of each year, beginning on March 15, 2019.
The 2019 Notes and 2028 Notes, together with our
$250 million
of
5.375%
senior notes due
2021
(the "2021 Notes"),
$350 million
of
3.375%
senior notes due
2023
(the "2023 Notes"), and
$400 million
of
4.850%
senior notes due
2026
(the "2026 Notes"), are collectively referred to as the "Senior Notes."
Debt Redemption
—During the
three months ended
September 30, 2018
, we redeemed all of our outstanding
2019
Notes, of which there was
$196 million
of aggregate principal outstanding, at a redemption price of approximately
$203 million
, which was calculated in accordance with the terms of the 2019 Notes and included principal and accrued interest plus a make-whole premium. The
$7 million
loss on extinguishment of debt was recognized in other income (loss), net on our condensed consolidated statements of income (see Note 18).
Revolving Credit Facility
—During the
nine months ended
September 30, 2018
, we refinanced our
$1.5 billion
senior unsecured revolving credit facility with a syndicate of lenders, extending the maturity of the facility to January 2023. During the
nine months ended
September 30, 2018
, we had
$20 million
of borrowings and repayments on our revolving credit facility, resulting in
no
outstanding balance and an available line of credit of
$1.5 billion
at
September 30, 2018
. The weighted-average interest rate on these borrowings was
4.85%
at
September 30, 2018
. At
December 31, 2017
, we had
no
outstanding balance.
Fair Value
—We estimated the fair value of debt, excluding capital leases, which consists of our Senior Notes, bonds, and other long-term debt. Our Senior Notes and bonds are classified as Level Two due to the use and weighting of multiple market inputs in the final price of the security. We estimated the fair value of other debt instruments using a discounted cash flow analysis based on current market inputs for similar types of arrangements. Based upon the lack of available market data, we have classified our revolving credit facility and other debt instruments as Level Three. The primary sensitivity in these calculations is based on the selection of appropriate discount rates. Fluctuations in these assumptions will result in different estimates of fair value.
29
|
September 30, 2018
|
|||||||||||||||||||
|
Carrying value
|
Fair value
|
Quoted prices in active markets for identical assets (level one)
|
Significant other observable inputs (level two)
|
Significant unobservable inputs (level three)
|
|||||||||||||||
|
Debt (1)
|
$
|
1,636
|
|
$
|
1,656
|
|
$
|
—
|
|
$
|
1,591
|
|
$
|
65
|
|
||||
(1) Excludes
$13 million
of capital lease obligations and
$16 million
of unamortized discounts and deferred financing fees.
|
December 31, 2017
|
|||||||||||||||||||
|
Carrying value
|
Fair value
|
Quoted prices in active markets for identical assets (level one)
|
Significant other observable inputs (level two)
|
Significant unobservable inputs (level three)
|
|||||||||||||||
|
Debt (2)
|
$
|
1,452
|
|
$
|
1,546
|
|
$
|
—
|
|
$
|
1,459
|
|
$
|
87
|
|
||||
Interest Rate Locks
—During the
nine months ended
September 30, 2018
, we entered into
two
interest rate locks with a
$425 million
total notional value and mandatory settlement dates in 2019 and 2021. The interest rate locks hedge a portion of the risk of changes in the benchmark interest rate associated with long-term debt we anticipate issuing in the future. These derivative instruments were designated as cash flow hedges and deemed highly effective at inception.
During the
three months ended
September 30, 2018
, we settled
one
of the aforementioned interest rate locks with a
$225 million
notional value upon issuance of the 2028 Notes. The outstanding interest rate lock with a
$200 million
notional value remains highly effective at
September 30, 2018
.
10
. OTHER LONG-TERM LIABILITIES
|
September 30, 2018
|
December 31, 2017
|
||||||
|
Deferred compensation plans held to fund rabbi trusts (Note 4)
|
$
|
413
|
|
$
|
402
|
|
|
|
Guarantee liabilities (Note 12)
|
79
|
|
104
|
|
|||
|
Self-insurance liabilities (Note 12)
|
76
|
|
69
|
|
|||
|
Deferred income taxes
|
42
|
|
62
|
|
|||
|
Other
|
227
|
|
226
|
|
|||
|
Total other long-term liabilities
|
$
|
837
|
|
$
|
863
|
|
|
11
. INCOME TAXES
The effective income tax rates for the three months ended September 30, 2018 and September 30, 2017 were
7.7%
and
45.2%
, respectively. The effective income tax rates for the nine months ended September 30, 2018 and September 30, 2017 were
21.2%
and
36.7%
, respectively. Our effective tax rate decreased for the three and nine months ended September 30, 2018, compared to the three and nine months ended September 30, 2017, primarily due to the Tax Cuts and Jobs Act ("Tax Act") enacted on December 22, 2017, which reduced the U.S. corporate income tax rate from 35% to 21% effective January 1, 2018, as well as a low effective tax rate on the HRMC transaction during the three months ended September 30, 2018.
During the three months ended September 30, 2018, we substantially completed our 2017 U.S. Federal Consolidated Income Tax Return. As such, we have refined our initial provisional amounts in relation to Staff Accounting Bulletin No. 118 ("SAB 118"),
Income Tax Accounting Implications of the Tax Cuts and Jobs Act
, and recognized measurement period adjustments during the three months ended September 30, 2018 related to our net deferred tax revaluation, deemed repatriation tax, and valuation allowance on certain foreign tax credits. We have not changed our indefinite reinvestment assertion, nor have we made a policy election with respect to our global intangible low-tax income. We continue to evaluate new guidance and legislation as it is issued, as well as the impact of state taxes on our provisional amounts upon completion of the 2017 state tax returns during the remainder of 2018. Our accounting for the Tax Act is incomplete, however, we expect to complete our accounting within the measurement period prescribed by SAB 118. During the three months ended September 30, 2018, we revised our provisional amounts and recognized adjustments as follows:
|
•
|
We recognized a
$1 million
decrease to our provisional expense related to our net deferred tax revaluation. During the year ended December 31, 2017, we recognized a provisional expense of
$97 million
;
|
30
|
•
|
We recognized an additional
$2 million
of provisional deemed repatriation tax expense, including state tax impacts. During the year ended December 31, 2017, we recorded a provisional expense of
$13 million
; and
|
|
•
|
We recognized a
$2 million
decrease to our provisional valuation allowance related to foreign tax credits that are not expected to be utilized in the future. During the year ended December 31, 2017, we recorded a provisional valuation allowance of
$15 million
.
|
As a result of the adoption of ASU 2014-09, our deferred tax asset related to deferred gains on sales of real estate was no longer required. The reversal of this deferred tax asset was recognized through opening equity resulting in a
$52 million
reduction in deferred tax expense on our full-year 2017 adjusted financial statements originally recognized as a result of the Tax Act.
Unrecognized tax benefits were
$93 million
at September 30, 2018 and
$94 million
at December 31, 2017, of which
$33 million
would impact the effective tax rate, if recognized in either period.
During the first quarter of 2017, the Internal Revenue Service ("IRS") issued a "Notice of Deficiency" for our 2009 through 2011 tax years. We disagree with the IRS' assessment related to the inclusion of loyalty program contributions as taxable income to the Company. In the second quarter of 2017, we filed a petition with the U.S. Tax Court for redetermination of the tax liability asserted by the IRS related to the loyalty program. During the three months ended September 30, 2018, the IRS issued a Revenue Agent’s Report for the subsequent audit period covering tax years 2012 through 2014, which reflected the carryover effect of the issue described above currently in U.S. Tax Court. We filed a formal protest with the IRS in October of 2018. If the IRS' position is upheld, it would result in an income tax payment of
$177 million
(including
$33 million
of estimated interest, net of federal tax benefit) for all assessed years that would be partially offset by a deferred tax asset. Future tax benefits will be recognized at the reduced U.S. corporate income tax rate, therefore,
$59 million
of the payment and related interest would have an impact on the effective tax rate, if recognized. We believe we have an adequate uncertain tax position recorded in connection with this matter.
12
. COMMITMENTS AND CONTINGENCIES
In the ordinary course of business, we enter into various commitments, guarantees, surety bonds, and letter of credit agreements, which are discussed below:
Commitments
—At
September 30, 2018
, we are committed, under certain conditions, to lend or invest up to
$370 million
, net of any related letters of credit, in various business ventures.
Performance Guarantees
—Certain of our contractual agreements with third-party hotel owners require us to guarantee payments to the owners if specified levels of operating profit are not achieved by their hotels.
Our most significant performance guarantee relates to
four
managed hotels in France that we began managing in the second quarter of 2013 ("the four managed hotels in France"), which has a term of
seven years
and approximately one and three-quarter years remaining. This guarantee has a maximum cap, but does not have an annual cap. The remaining maximum exposure related to our performance guarantees at
September 30, 2018
was
$319 million
, of which
€231 million
(
$268 million
using exchange rates at
September 30, 2018
) related to the
four
managed hotels in France.
We had
$37 million
and
$71 million
of total net performance guarantee liabilities at
September 30, 2018
and
December 31, 2017
, respectively, which included
$30 million
and
$45 million
recorded in other long-term liabilities,
$7 million
and
$26 million
in accrued expenses and other current liabilities, and insignificant receivables on our condensed consolidated balance sheets, respectively.
31
|
The four managed hotels in France
|
Other performance guarantees
|
All performance guarantees
|
||||||||||||||||||||||
|
2018
|
2017
|
2018
|
2017
|
2018
|
2017
|
|||||||||||||||||||
|
Beginning balance, January 1
|
$
|
58
|
|
$
|
66
|
|
$
|
13
|
|
$
|
13
|
|
$
|
71
|
|
$
|
79
|
|
||||||
|
Initial guarantee obligation liability
|
—
|
|
—
|
|
—
|
|
3
|
|
—
|
|
3
|
|
||||||||||||
|
Amortization of initial guarantee obligation liability into income
|
(8
|
)
|
(7
|
)
|
(2
|
)
|
(2
|
)
|
(10
|
)
|
(9
|
)
|
||||||||||||
|
Performance guarantee expense (income), net
|
36
|
|
41
|
|
(1
|
)
|
(1
|
)
|
35
|
|
40
|
|
||||||||||||
|
Net payments during the period
|
(50
|
)
|
(49
|
)
|
(5
|
)
|
(1
|
)
|
(55
|
)
|
(50
|
)
|
||||||||||||
|
Foreign currency exchange, net
|
—
|
|
6
|
|
—
|
|
—
|
|
—
|
|
6
|
|
||||||||||||
|
Ending balance, June 30
|
$
|
36
|
|
$
|
57
|
|
$
|
5
|
|
$
|
12
|
|
$
|
41
|
|
$
|
69
|
|
||||||
|
Amortization of initial guarantee obligation liability into income
|
(3
|
)
|
(4
|
)
|
(1
|
)
|
(1
|
)
|
(4
|
)
|
(5
|
)
|
||||||||||||
|
Performance guarantee expense
|
3
|
|
13
|
|
3
|
|
1
|
|
6
|
|
14
|
|
||||||||||||
|
Net (payments) receipts during the period
|
(9
|
)
|
(16
|
)
|
2
|
|
1
|
|
(7
|
)
|
(15
|
)
|
||||||||||||
|
Foreign currency exchange, net
|
1
|
|
3
|
|
—
|
|
—
|
|
1
|
|
3
|
|
||||||||||||
|
Ending balance, September 30
|
$
|
28
|
|
$
|
53
|
|
$
|
9
|
|
$
|
13
|
|
$
|
37
|
|
$
|
66
|
|
||||||
Additionally, we enter into certain management contracts where we have the right, but not an obligation, to make payments to certain hotel owners if their hotels do not achieve specified levels of operating profit. If we choose not to fund the shortfall, the hotel owner has the option to terminate the management contract. At
September 30, 2018
and
December 31, 2017
, there were
no
amounts recognized on our condensed consolidated balance sheets related to these performance test clauses.
Debt Repayment and Other Guarantees
—We enter into various debt repayment and other guarantees in order to assist property owners in obtaining third-party financing or to obtain more favorable borrowing terms. Included within debt repayment and other guarantees are the following:
|
Property description
|
Maximum potential future payments
|
Maximum exposure net of recoverability from third parties
|
Other long-term liabilities recorded at September 30, 2018
|
Other long-term liabilities recorded at December 31, 2017
|
Year of guarantee expiration
|
|||||||||||||
|
Hotel property in Washington State
(1), (3), (4), (5)
|
$
|
215
|
|
$
|
—
|
|
$
|
19
|
|
$
|
26
|
|
2020
|
|||||
|
Hotel properties in India (2), (3)
|
166
|
|
166
|
|
11
|
|
17
|
|
2020
|
|||||||||
|
Hotel property in Massachusetts (6)
|
102
|
|
102
|
|
1
|
|
1
|
|
2020
|
|||||||||
|
Hotel and residential properties in Brazil (1), (4)
|
95
|
|
40
|
|
3
|
|
4
|
|
various, through 2021
|
|||||||||
|
Hotel property in Oregon (1), (5)
|
61
|
|
10
|
|
4
|
|
—
|
|
various, through 2022
|
|||||||||
|
Hotel properties in California (1)
|
31
|
|
13
|
|
4
|
|
6
|
|
various, through 2021
|
|||||||||
|
Hotel property in Minnesota
|
25
|
|
25
|
|
1
|
|
2
|
|
2021
|
|||||||||
|
Hotel property in Arizona (1), (4)
|
25
|
|
—
|
|
1
|
|
1
|
|
2019
|
|||||||||
|
Other (1)
|
30
|
|
19
|
|
5
|
|
2
|
|
various, through 2022
|
|||||||||
|
Total
|
$
|
750
|
|
$
|
375
|
|
$
|
49
|
|
$
|
59
|
|
||||||
(1) We have agreements with our unconsolidated hospitality venture partners, the respective hotel owners, or other third parties to recover certain amounts funded under the debt repayment guarantee; the recoverability mechanism may be in the form of cash, financing receivable, or HTM debt security.
(2) Debt repayment guarantee is denominated in Indian rupees and translated using exchange rates at
September 30, 2018
. We have the contractual right to recover amounts funded from the unconsolidated hospitality venture, which is a related party. We expect our maximum exposure to be
$83 million
, taking into account our partner's
50%
ownership interest in the unconsolidated hospitality venture.
32
(3) Under certain events or conditions, we have the right to force the sale of the property(ies) in order to recover amounts funded.
(4) If certain funding thresholds are met or if certain events occur, we have the ability to assume control of the property
.
With respect to properties in Brazil, this right only exists for the residential property.
(5) We are subject to a completion guarantee whereby the parties agree to substantially complete the construction of the project by a specified date. In the event of default, we are obligated to complete construction using the funds available from the outstanding loan. Any additional funds paid by us are subject to partial recovery in the form of cash or HTM debt security. At
September 30, 2018
, the maximum potential future payments and maximum exposure net of recoverability from third parties under the completion guarantees are
$45 million
and
$4 million
, respectively.
(6) We are subject to a completion guarantee whereby the parties agree to substantially complete the construction of the project by a specified date. In the event of default, we are obligated to complete construction and any additional funds paid by us are not recoverable.
At
September 30, 2018
, we are not aware of, nor have we received notification that hotel owners are not current on their debt service obligations where we have provided a debt repayment guarantee.
Guarantee Liabilities Fair Value
—We estimated the fair value of our guarantees to be
$151 million
and
$177 million
at
September 30, 2018
and
December 31, 2017
, respectively. Based upon the lack of available market data, we have classified our guarantees as Level Three in the fair value hierarchy.
Insurance
—We obtain commercial insurance for potential losses for general liability, workers' compensation, automobile liability, employment practices, crime, property, cyber risk, and other miscellaneous coverages. A portion of the risk is retained on a self-insurance basis primarily through U.S.-based and licensed captive insurance companies that are wholly owned subsidiaries of Hyatt and generally insure our deductibles and retentions. Reserve requirements are established based on actuarial projections of ultimate losses. Losses estimated to be paid within 12 months are
$37 million
and
$32 million
at
September 30, 2018
and
December 31, 2017
, respectively, and are classified within accrued expenses and other current liabilities on our condensed consolidated balance sheets, while losses expected to be payable in future periods are
$76 million
and
$69 million
at
September 30, 2018
and
December 31, 2017
, respectively, and are included in other long-term liabilities on our condensed consolidated balance sheets. At
September 30, 2018
,
$9 million
of standby letters of credit were issued to provide collateral for the estimated claims, which are guaranteed by us.
Collective Bargaining Agreements
—At
September 30, 2018
, approximately
24%
of our U.S.-based employees were covered by various collective bargaining agreements, generally providing for basic pay rates, working hours, other conditions of employment, and orderly settlement of labor disputes. Certain employees are covered by union-sponsored, multi-employer pension and health plans pursuant to agreements between us and various unions. Generally, labor relations have been maintained in a normal and satisfactory manner, and we believe our employee relations are good.
Surety Bonds
—Surety bonds issued on our behalf were
$26 million
at
September 30, 2018
and primarily relate to workers’ compensation, taxes, licenses, and utilities related to our lodging operations.
Letters of Credit
—Letters of credit outstanding on our behalf at
September 30, 2018
were
$297 million
, which relate to our ongoing operations, hotel properties under development in the U.S., including one unconsolidated hospitality venture, collateral for estimated insurance claims, and securitization of our performance under our debt repayment guarantees associated with the hotel properties in India and the residential property in Brazil, which are only called upon if we default on our guarantees. The letters of credit outstanding do not reduce the available capacity under our revolving credit facility (see Note
9
).
Capital Expenditures
—As part of our ongoing business operations, significant expenditures are required to complete renovation projects that have been approved.
Other
—We act as general partner of various partnerships owning hotel properties that are subject to mortgage indebtedness. These mortgage agreements generally limit the lender's recourse to security interests in assets financed and/or other assets of the partnership(s) and/or the general partner(s) thereof.
In conjunction with financing obtained for our unconsolidated hospitality ventures, certain managed hotels, and other properties, we may provide standard indemnifications to the lender for loss, liability, or damage occurring as a result of our actions or actions of the other unconsolidated hospitality venture partners, respective hotel owners, or other third parties.
33
As a result of certain dispositions, we have agreed to provide customary indemnifications to third-party purchasers for certain liabilities incurred prior to sale and for breach of certain representations and warranties made during the sales process, such as representations of valid title, authority, and environmental issues that may not be limited by a contractual monetary amount. These indemnification agreements survive until the applicable statutes of limitation expire or until the agreed upon contract terms expire.
We are subject, from time to time, to various claims and contingencies related to lawsuits, taxes, and environmental matters, as well as commitments under contractual obligations. Many of these claims are covered under our current insurance programs, subject to deductibles. Although the ultimate liability for these matters cannot be determined at this point, based on information currently available, we do not expect the ultimate resolution of such claims and litigation to have a material effect on our condensed consolidated financial statements.
During the nine months ended September 30, 2018, we received a notice from the Indian tax authorities assessing additional service tax on our operations in India. We appealed this decision and do not believe a loss is probable, and therefore, we have not recognized a liability in connection with this matter. Our maximum exposure is not expected to exceed
$17 million
.
13
. EQUITY
|
Stockholders'
equity
|
Noncontrolling interests
in consolidated
subsidiaries
|
Total equity
|
|||||||||
|
Balance at January 1, 2018
|
$
|
3,833
|
|
$
|
6
|
|
$
|
3,839
|
|
||
|
Net income attributable to Hyatt Hotels Corporation
|
725
|
|
—
|
|
725
|
|
|||||
|
Other comprehensive income
|
51
|
|
—
|
|
51
|
|
|||||
|
Repurchase of common stock
|
(654
|
)
|
—
|
|
(654
|
)
|
|||||
|
Dividends
|
(52
|
)
|
—
|
|
(52
|
)
|
|||||
|
Directors compensation
|
2
|
|
—
|
|
2
|
|
|||||
|
Employee stock plan issuance
|
3
|
|
—
|
|
3
|
|
|||||
|
Share-based payment activity
|
21
|
|
—
|
|
21
|
|
|||||
|
Balance at September 30, 2018
|
$
|
3,929
|
|
$
|
6
|
|
$
|
3,935
|
|
||
|
Stockholders'
equity |
Noncontrolling interests
in consolidated subsidiaries |
Total equity
|
|||||||||
|
Balance at January 1, 2017 (a)
|
$
|
4,075
|
|
$
|
5
|
|
$
|
4,080
|
|
||
|
Net income attributable to Hyatt Hotels Corporation
|
176
|
|
—
|
|
176
|
|
|||||
|
Other comprehensive income
|
105
|
|
—
|
|
105
|
|
|||||
|
Contributions from noncontrolling interests
|
—
|
|
1
|
|
1
|
|
|||||
|
Repurchase of common stock
|
(555
|
)
|
—
|
|
(555
|
)
|
|||||
|
Directors compensation
|
2
|
|
—
|
|
2
|
|
|||||
|
Employee stock plan issuance
|
3
|
|
—
|
|
3
|
|
|||||
|
Share-based payment activity
|
20
|
|
—
|
|
20
|
|
|||||
|
Balance at September 30, 2017
|
$
|
3,826
|
|
$
|
6
|
|
$
|
3,832
|
|
||
|
(a) Balances have been adjusted for the adoption of ASU 2014-09 with an opening adjustment to retained earnings of $172 million.
|
|||||||||||
34
Accumulated Other Comprehensive Loss
|
Balance at
July 1, 2018 |
Current period other comprehensive income (loss) before reclassification
|
Amount reclassified from accumulated other comprehensive loss (a)
|
Balance at September 30, 2018
|
||||||||||||
|
Foreign currency translation adjustments
|
$
|
(266
|
)
|
$
|
9
|
|
$
|
62
|
|
$
|
(195
|
)
|
|||
|
Unrecognized pension cost
|
(7
|
)
|
—
|
|
—
|
|
(7
|
)
|
|||||||
|
Unrealized losses on derivative instruments
|
(3
|
)
|
3
|
|
—
|
|
—
|
|
|||||||
|
Accumulated other comprehensive loss
|
$
|
(276
|
)
|
$
|
12
|
|
$
|
62
|
|
$
|
(202
|
)
|
|||
|
(a) The amounts reclassified from accumulated other comprehensive loss include the gain recognized in gains on sales of real estate related to the HRMC transaction (see Note 6).
|
|||||||||||||||
|
Balance at
January 1, 2018 |
Current period other comprehensive income (loss) before reclassification
|
Amount reclassified from accumulated other comprehensive loss (b)
|
Balance at September 30, 2018
|
||||||||||||
|
Foreign currency translation adjustments
|
$
|
(243
|
)
|
$
|
(29
|
)
|
$
|
77
|
|
$
|
(195
|
)
|
|||
|
Unrecognized pension cost
|
(7
|
)
|
—
|
|
—
|
|
(7
|
)
|
|||||||
|
Unrealized losses on derivative instruments
|
(3
|
)
|
3
|
|
—
|
|
—
|
|
|||||||
|
Accumulated other comprehensive loss
|
$
|
(253
|
)
|
$
|
(26
|
)
|
$
|
77
|
|
$
|
(202
|
)
|
|||
|
(b) The amounts reclassified from accumulated other comprehensive loss include the net gain recognized in gains on sales of real estate related to the derecognition of a wholly owned subsidiary and the HRMC transaction (see Note 6).
|
|||||||||||||||
|
Balance at
July 1, 2017 |
Current period other comprehensive income (loss) before reclassification
|
Amount reclassified from accumulated other comprehensive loss
|
Balance at
September 30, 2017 |
||||||||||||
|
Foreign currency translation adjustments
|
$
|
(239
|
)
|
$
|
11
|
|
$
|
—
|
|
$
|
(228
|
)
|
|||
|
Unrealized gains on AFS securities
|
78
|
|
(12
|
)
|
—
|
|
66
|
|
|||||||
|
Unrecognized pension cost
|
(7
|
)
|
—
|
|
—
|
|
(7
|
)
|
|||||||
|
Unrealized losses on derivative instruments
|
(4
|
)
|
1
|
|
—
|
|
(3
|
)
|
|||||||
|
Accumulated other comprehensive loss
|
$
|
(172
|
)
|
$
|
—
|
|
$
|
—
|
|
$
|
(172
|
)
|
|||
|
Balance at
January 1, 2017 |
Current period other comprehensive income (loss) before reclassification
|
Amount reclassified from accumulated other comprehensive loss
|
Balance at
September 30, 2017 |
||||||||||||
|
Foreign currency translation adjustments
|
$
|
(299
|
)
|
$
|
71
|
|
$
|
—
|
|
$
|
(228
|
)
|
|||
|
Unrealized gains on AFS securities
(c)
|
33
|
|
8
|
|
25
|
|
66
|
|
|||||||
|
Unrecognized pension cost
|
(7
|
)
|
—
|
|
—
|
|
(7
|
)
|
|||||||
|
Unrealized losses on derivative instruments
|
(4
|
)
|
1
|
|
—
|
|
(3
|
)
|
|||||||
|
Accumulated other comprehensive loss
|
$
|
(277
|
)
|
$
|
80
|
|
$
|
25
|
|
$
|
(172
|
)
|
|||
|
(c) The presentation above was revised to reflect the gross impact of the redemption of certain Playa securities (see Note 4), which was previously presented on a net basis within current period other comprehensive income (loss) before reclassification. The revised presentation above reflects the $40 million realized loss ($25 million net of tax) recognized in other income (loss), net (see Note 18) in the period of redemption as an amount reclassified from accumulated other comprehensive loss.
|
|||||||||||||||
Share Repurchase
—
During 2017 and 2016, our board of directors authorized the repurchase of up to
$1,250 million
and
$500 million
, respectively, of our common stock. In October 2018, our board of directors authorized the additional repurchase of up to
$750 million
of our common stock (see Note 19). These repurchases may be made
35
from time to time in the open market, in privately negotiated transactions, or otherwise, including pursuant to a Rule 10b5-1 plan or an accelerated share repurchase transaction, at prices we deem appropriate and subject to market conditions, applicable law, and other factors deemed relevant in our sole discretion. The common stock repurchase program applies to our Class A common stock and our Class B common stock. The common stock repurchase program does not obligate us to repurchase any dollar amount or number of shares of common stock and the program may be suspended or discontinued at any time.
We entered into the following accelerated share repurchase ("ASR") programs with third-party financial institutions to repurchase Class A shares:
|
Total number of shares repurchased (1)
|
Weighted-average price per share
|
Total cash paid
|
||||||||
|
May 2018 ASR
|
2,481,341
|
|
$
|
80.60
|
|
$
|
200
|
|
||
|
August 2017 ASR (2) (3)
|
1,401,787
|
|
$
|
57.07
|
|
$
|
100
|
|
||
|
March 2017 ASR (2)
|
5,393,669
|
|
$
|
55.62
|
|
$
|
300
|
|
||
(1) The delivery of shares resulted in a reduction in weighted-average common shares outstanding for basic and diluted earnings per share.
(2) The August 2017 ASR and the March 2017 ASR are collectively referred to as the "2017 ASR Agreements."
(3) At September 30, 2017, the remaining yet to be delivered shares totaled
$20 million
and were accounted for as an equity-classified forward contract. The August 2017 ASR was settled subsequent to the nine months ended September 30, 2017 for
264,697
shares. Overall, we repurchased
1,666,484
shares at a weighted-average price per share of
$60.01
.
During the
nine
months ended
September 30, 2018
, we repurchased
8,560,012
shares of common stock, including settlement of the May 2018 ASR and
244,260
shares representing the settlement of an ASR program entered into during the fourth quarter of 2017 ("November 2017 ASR"). The shares of common stock were repurchased at a weighted-average price of
$78.42
per share and an aggregate purchase price of
$674 million
, excluding related insignificant expenses. The aggregate purchase price includes
$20 million
of shares delivered in the settlement of the November 2017 ASR in 2018, for which payment was made during 2017. Total shares repurchased during the
nine
months ended
September 30, 2018
represented approximately
7%
of our total shares of common stock outstanding at
December 31, 2017
.
During the
nine
months ended
September 30, 2017
, we repurchased
9,492,729
shares of common stock, including shares repurchased pursuant to the 2017 ASR Agreements. The shares of common stock were repurchased at a weighted-average price of
$56.37
per share for an aggregate purchase price of
$535 million
, excluding related insignificant expenses. The shares repurchased during the
nine
months ended
September 30, 2017
represented approximately
7%
of our total shares of common stock outstanding at
December 31, 2016
.
The shares of Class A common stock repurchased on the open market were retired and returned to the status of authorized and unissued shares, while the shares of Class B common stock repurchased were retired and the total number of authorized Class B shares was reduced by the number of shares retired during the three months ended
September 30, 2018
(see Note 15). At
September 30, 2018
, we had
$210 million
remaining under the share repurchase authorization.
Dividend
—
During the
nine
months ended
September 30, 2018
, we paid cash dividends to Class A and Class B shareholders of record as follows:
|
Date Declared
|
Dividend per share amount
|
Date of record
|
Date paid
|
|||||
|
February 14, 2018
|
$
|
0.15
|
|
March 22, 2018
|
March 29, 2018
|
|||
|
May 16, 2018
|
$
|
0.15
|
|
June 19, 2018
|
June 28, 2018
|
|||
|
July 31, 2018
|
$
|
0.15
|
|
September 6, 2018
|
September 20, 2018
|
|||
36
14
. STOCK-BASED COMPENSATION
As part of our
Long-
Term Incentive Plan, we award Stock Appreciation Rights ("SARs"), Restricted Stock Units ("RSUs"), and Performance Share Units ("PSUs") to certain employees. Compensation expense and unearned compensation presented below exclude amounts related to employees of our managed hotels and other employees whose payroll is reimbursed, as this expense has been and will continue to be reimbursed by our third-party hotel owners and is recognized within revenues for the reimbursement of costs incurred on behalf of managed and franchised properties and costs incurred on behalf of managed and franchised properties on our condensed consolidated statements of income. Stock-based compensation expense included in selling, general, and administrative expense on our condensed consolidated statements of income related to these awards was as follows:
|
Three Months Ended September 30,
|
Nine Months Ended September 30,
|
||||||||||||||
|
2018
|
2017
|
2018
|
2017
|
||||||||||||
|
SARs
|
$
|
1
|
|
$
|
1
|
|
$
|
10
|
|
$
|
10
|
|
|||
|
RSUs
|
2
|
|
3
|
|
14
|
|
14
|
|
|||||||
|
PSUs
|
2
|
|
1
|
|
4
|
|
2
|
|
|||||||
|
Total
|
$
|
5
|
|
$
|
5
|
|
$
|
28
|
|
$
|
26
|
|
|||
SARs
—During the
nine
months ended
September 30, 2018
, we granted
504,760
SARs to employees with a weighted-average grant date fair value of
$21.18
. During the nine months ended
September 30, 2017
, we granted
625,740
SARs to employees with a weighted-average grant date fair value of
$16.42
.
RSUs
— During the
nine
months ended
September 30, 2018
, we granted
272,549
RSUs to employees with a weighted-average grant date fair value of
$79.90
. During the nine months ended
September 30, 2017
, we granted
483,302
RSUs to employees with a weighted-average grant date fair value of $
53.77
.
PSUs
—During the
nine
months ended
September 30, 2018
, we granted
89,441
PSUs to our executive officers, with a weighted-average grant date fair value of
$82.10
. The performance period applicable to such PSUs is a
three
year period beginning January 1, 2018 and ending December 31, 2020. During the nine months ended
September 30, 2017
, we granted
102,115
PSUs to our executive officers, with a weighted-average grant date fair value of
$52.65
.
Our total unearned compensation for our
stock-
based compensation programs at
September 30, 2018
was
$5 million
for SARs,
$17 million
for RSUs, and
$7 million
for PSUs, which will primarily be recognized in stock-based compensation expense over a weighted-average period of
three years
with respect to SARs and RSUs, and
two years
with respect to PSUs.
15
. RELATED-PARTY TRANSACTIONS
In addition to those included elsewhere in the Notes to our condensed consolidated financial statements,
related-
party transactions entered into by us are summarized as follows:
Legal Services
—A partner in a law firm that provided services to us throughout the
nine months ended
September 30, 2018
and
September 30, 2017
is the brother-in-law of our Executive Chairman. We incurred $
2 million
of legal fees with this firm during each of the
three months ended
September 30, 2018
and
September 30, 2017
. We incurred
$5 million
and $
3 million
of legal fees with this firm during the
nine months ended
September 30, 2018
and
September 30, 2017
, respectively. At
September 30, 2018
and
December 31, 2017
, we had
$2 million
and insignificant amounts due to the law firm, respectively.
Equity Method Investments
—We have equity method investments in entities that own properties for which we receive management or franchise fees. We recognized
$5 million
and $
6 million
of fees for the
three
months ended
September 30, 2018
and
September 30, 2017
, respectively. We recognized $
15 million
and $
18 million
of fees for the
nine
months ended
September 30, 2018
and
September 30, 2017
, respectively. In addition, in some cases we provide loans (see Note
5
) or guarantees (see Note
12
) to these entities. During the
three
months ended
September 30, 2018
and
September 30, 2017
, we recognized
$2 million
and $
1 million
, respectively, of income related to these guarantees. During the
nine
months ended
September 30, 2018
and
September 30, 2017
, we recognized $
5 million
and $
4 million
, respectively, of income related to these guarantees. At
September 30, 2018
and
December 31, 2017
, we had $
14 million
and $
11 million
, respectively, of receivables due from these properties.
37
At September 30, 2018, our ownership interest in these unconsolidated hospitality ventures varies from
24%
to
50%
. See Note 4 for further details regarding these investments.
Class B Share Conversion
—During the three and nine months ended
September 30, 2018
,
950,161
shares and
1,207,355
shares of Class B common stock, respectively, were converted on a share-for-share basis into shares of our Class A common stock,
$0.01
par value per share. During the three and nine months ended
September 30, 2017
,
10,154,050
shares and
14,926,420
shares of Class B common stock, respectively, were converted on a share-for-share basis into shares of our Class A common stock,
$0.01
par value per share. Of the shares of Class B common stock that were converted into shares of Class A common stock,
257,194
shares have been retired. The retirements thereby reduce the shares of Class B common stock authorized and outstanding. The remaining
950,161
shares of Class B common stock were retired subsequent to September 30, 2018.
Class B Share Repurchase
—During the nine months ended
September 30, 2018
, we repurchased
2,427,000
shares of Class B common stock for a weighted average price of $
78.11
per share, for an aggregate purchase price of approximately $
190 million
. The shares repurchased represented approximately
2%
of our total shares of common stock outstanding prior to the repurchase. During the three and nine months ended
September 30, 2017
, we repurchased
1,813,459
shares of Class B common stock for a weighted average price of $
59.29
per share, for an aggregate purchase price of approximately $
107 million
. The shares repurchased represented approximately
2%
of our total shares of common stock outstanding prior to the repurchase. The shares of Class B common stock were repurchased in privately negotiated transactions from trusts for the benefit of certain Pritzker family members and limited partnerships owned indirectly by trusts for the benefit of certain Pritzker family members and were retired, thereby reducing the shares of Class B common stock authorized and outstanding by the repurchased share amount.
16
. SEGMENT INFORMATION
Our reportable segments are components of the business which are managed discretely and for which discrete financial information is reviewed regularly by the chief operating decision maker ("CODM") to assess performance and make decisions regarding the allocation of resources. Our CODM is our President and Chief Executive Officer. We define our reportable segments as follows:
|
•
|
Owned and leased hotels
—This segment derives its earnings from owned and leased hotel properties located predominantly in the United States but also in certain international locations and for purposes of segment Adjusted EBITDA, includes our pro rata share of the Adjusted EBITDA of our unconsolidated hospitality ventures, based on our ownership percentage of each venture. Adjusted EBITDA includes intercompany expenses related to management fees paid to the Company's management and franchising segments, which are eliminated in consolidation. Intersegment revenues relate to promotional award redemptions earned by our owned and leased hotels related to our co-branded credit card and revenues earned under the loyalty program for stays at our owned and leased hotels and are eliminated in consolidation.
|
|
•
|
Americas management and franchising
—This segment derives its earnings primarily from a combination of hotel management and licensing of our portfolio of brands to franchisees located in the United States, Latin America, Canada, and the Caribbean. This segment's revenues also include the reimbursement of costs incurred on behalf of managed and franchised properties. These costs relate primarily to payroll costs at managed properties where the Company is the employer, as well as costs associated with reservations, sales, marketing, technology, and the loyalty program operated on behalf of owners of managed and franchised properties. The intersegment revenues relate to management fees earned from the Company's owned and leased hotels and are eliminated in consolidation.
|
|
•
|
ASPAC management and franchising
—This segment derives its earnings primarily from a combination of hotel management and licensing of our portfolio of brands to franchisees located in Southeast Asia, Greater China, Australia, South Korea, Japan, and Micronesia. This segment's revenues also include the reimbursement of costs incurred on behalf of managed and franchised properties. These costs relate primarily to reservations, sales, marketing, technology, and the loyalty program operated on behalf of owners of managed and franchised properties. The intersegment revenues relate to management fees earned from the Company's owned hotel and are eliminated in consolidation.
|
|
•
|
EAME/SW Asia management and franchising
—This segment derives its earnings primarily from a combination of hotel management and licensing of our portfolio of brands to franchisees located in Europe, Africa, the Middle East, India, Central Asia, and Nepal. This segment's revenues also include the
|
38
reimbursement of costs incurred on behalf of managed and franchised properties. These costs relate primarily to reservations, sales, marketing, technology, and the loyalty program operated on behalf of owners of managed and franchised properties. The intersegment revenues relate to management fees earned from the Company's owned and leased hotels and are eliminated in consolidation.
Our CODM evaluates performance based on owned and leased hotels revenues, management, franchise, and other fees revenues, and Adjusted EBITDA. Adjusted EBITDA, as we define it, is a non-GAAP measure.
We define Adjusted EBITDA as net income attributable to Hyatt Hotels Corporation plus our pro rata share of unconsolidated hospitality ventures Adjusted EBITDA based on our ownership percentage of each venture, adjusted to exclude interest expense; provision for income taxes; depreciation and amortization; Contra revenue; revenues for the reimbursement of costs incurred on behalf of managed and franchised properties; costs incurred on behalf of managed and franchised properties; equity earnings (losses) from unconsolidated hospitality ventures; stock-based compensation expense; gains (losses) on sales of real estate; asset impairments; and other income (loss), net.
Effective January 1, 2018, we made two modifications to our definition of Adjusted EBITDA with the implementation of ASU 2014-09. Our definition has been updated to exclude Contra revenue which was previously recognized as amortization expense. As this is strictly a matter of financial presentation, we have excluded Contra revenue in order to be consistent with our prior treatment and to reflect the way in which we manage our business. We have also excluded revenues for the reimbursement of costs incurred on behalf of managed and franchised properties and costs incurred on behalf of managed and franchised properties. These revenues and costs previously netted to zero within Adjusted EBITDA. Under ASU 2014-09, the recognition of certain revenue differs from the recognition of related costs, creating timing differences that would otherwise impact Adjusted EBITDA. We have not changed our management of these revenues or expenses, nor do we consider these timing differences to be reflective of our core operations. These changes reflect how our CODM evaluates each segment's performance and also facilitate comparison with our competitors. We have applied this change to 2017 historical results to allow for comparability between the periods presented.
39
The table below shows summarized consolidated financial information by segment. Included within corporate and other are the results of Miraval, exhale, Hyatt Residence Club license fees, results related to our
co-
branded credit card, and unallocated corporate expenses.
|
Three Months Ended September 30,
|
Nine Months Ended September 30,
|
||||||||||||||
|
2018
|
2017
|
2018
|
2017
|
||||||||||||
|
Owned and leased hotels
|
|||||||||||||||
|
Owned and leased hotels revenues
|
$
|
443
|
|
$
|
510
|
|
$
|
1,428
|
|
$
|
1,641
|
|
|||
|
Other revenues
|
—
|
|
—
|
|
—
|
|
13
|
|
|||||||
|
Intersegment revenues (a)
|
7
|
|
10
|
|
26
|
|
29
|
|
|||||||
|
Adjusted EBITDA
|
91
|
|
|
104
|
|
|
324
|
|
|
382
|
|
||||
|
Depreciation and amortization
|
65
|
|
75
|
|
197
|
|
222
|
|
|||||||
|
Americas management and franchising
|
|||||||||||||||
|
Management, franchise, and other fees revenues
|
95
|
|
94
|
|
301
|
|
289
|
|
|||||||
|
Contra revenue
|
(4
|
)
|
(3
|
)
|
(10
|
)
|
(9
|
)
|
|||||||
|
Revenues for the reimbursement of costs incurred on behalf of managed and franchised properties
|
447
|
|
395
|
|
1,328
|
|
1,205
|
|
|||||||
|
Intersegment revenues (a)
|
16
|
|
18
|
|
52
|
|
58
|
|
|||||||
|
Adjusted EBITDA
|
83
|
|
81
|
|
266
|
|
250
|
|
|||||||
|
Depreciation and amortization
|
2
|
|
2
|
|
6
|
|
6
|
|
|||||||
|
ASPAC management and franchising
|
|||||||||||||||
|
Management, franchise, and other fees revenues
|
30
|
|
27
|
|
90
|
|
79
|
|
|||||||
|
Contra revenue
|
—
|
|
—
|
|
(1
|
)
|
(1
|
)
|
|||||||
|
Revenues for the reimbursement of costs incurred on behalf of managed and franchised properties
|
24
|
|
19
|
|
67
|
|
56
|
|
|||||||
|
Intersegment revenues (a)
|
1
|
|
—
|
|
1
|
|
1
|
|
|||||||
|
Adjusted EBITDA
|
19
|
|
17
|
|
55
|
|
48
|
|
|||||||
|
Depreciation and amortization
|
1
|
|
—
|
|
1
|
|
—
|
|
|||||||
|
EAME/SW Asia management and franchising
|
|||||||||||||||
|
Management, franchise, and other fees revenues
|
21
|
|
17
|
|
58
|
|
49
|
|
|||||||
|
Contra revenue
|
(1
|
)
|
(1
|
)
|
(4
|
)
|
(3
|
)
|
|||||||
|
Revenues for the reimbursement of costs incurred on behalf of managed and franchised properties
|
16
|
|
15
|
|
49
|
|
41
|
|
|||||||
|
Intersegment revenues (a)
|
3
|
|
3
|
|
8
|
|
7
|
|
|||||||
|
Adjusted EBITDA
|
12
|
|
10
|
|
33
|
|
26
|
|
|||||||
|
Depreciation and amortization
|
—
|
|
—
|
|
—
|
|
—
|
|
|||||||
|
Corporate and other
|
|||||||||||||||
|
Revenues
|
26
|
|
25
|
|
89
|
|
73
|
|
|||||||
|
Revenues for the reimbursement of costs incurred on behalf of managed and franchised properties
|
2
|
|
—
|
|
3
|
|
—
|
|
|||||||
|
Intersegment revenues (a)
|
(2
|
)
|
(3
|
)
|
(5
|
)
|
(7
|
)
|
|||||||
|
Adjusted EBITDA
|
(29
|
)
|
(33
|
)
|
(85
|
)
|
(90
|
)
|
|||||||
|
Depreciation and amortization
|
13
|
|
11
|
|
39
|
|
33
|
|
|||||||
|
Eliminations
|
|||||||||||||||
|
Revenues (a)
|
(25
|
)
|
(28
|
)
|
(82
|
)
|
(88
|
)
|
|||||||
|
Adjusted EBITDA
|
(1
|
)
|
(2
|
)
|
2
|
|
3
|
|
|||||||
|
TOTAL
|
|||||||||||||||
|
Revenues
|
$
|
1,074
|
|
$
|
1,070
|
|
$
|
3,316
|
|
$
|
3,345
|
|
|||
|
Adjusted EBITDA
|
175
|
|
177
|
|
595
|
|
619
|
|
|||||||
|
Depreciation and amortization
|
81
|
|
88
|
|
243
|
|
261
|
|
|||||||
|
(a)
|
Intersegment revenues are included in management, franchise, and other fees revenues, owned and leased hotels revenues, and other revenues and eliminated in Eliminations.
|
40
The table below provides a reconciliation of our net income attributable to Hyatt Hotels Corporation to EBITDA and a reconciliation of EBITDA to our consolidated Adjusted EBITDA:
|
Three Months Ended September 30,
|
Nine Months Ended September 30,
|
||||||||||||||
|
2018
|
2017
|
2018
|
2017
|
||||||||||||
|
Net income attributable to Hyatt Hotels Corporation
|
$
|
237
|
|
$
|
18
|
|
$
|
725
|
|
$
|
176
|
|
|||
|
Interest expense
|
19
|
|
20
|
|
57
|
|
61
|
|
|||||||
|
Provision for income taxes
|
19
|
|
16
|
|
194
|
|
103
|
|
|||||||
|
Depreciation and amortization
|
81
|
|
88
|
|
243
|
|
261
|
|
|||||||
|
EBITDA
|
356
|
|
142
|
|
1,219
|
|
601
|
|
|||||||
|
Contra revenue
|
5
|
|
4
|
|
15
|
|
13
|
|
|||||||
|
Revenues for the reimbursement of costs incurred on behalf of managed and franchised properties
|
(489
|
)
|
(429
|
)
|
(1,447
|
)
|
(1,302
|
)
|
|||||||
|
Costs incurred on behalf of managed and franchised properties
|
487
|
|
425
|
|
1,447
|
|
1,313
|
|
|||||||
|
Equity (earnings) losses from unconsolidated hospitality ventures
|
6
|
|
(1
|
)
|
17
|
|
1
|
|
|||||||
|
Stock-based compensation expense (Note 14)
|
5
|
|
5
|
|
28
|
|
26
|
|
|||||||
|
Gains on sales of real estate (Note 6)
|
(239
|
)
|
—
|
|
(769
|
)
|
(60
|
)
|
|||||||
|
Asset impairments
|
21
|
|
—
|
|
21
|
|
—
|
|
|||||||
|
Other (income) loss, net (Note 18)
|
9
|
|
16
|
|
22
|
|
(32
|
)
|
|||||||
|
Pro rata share of unconsolidated hospitality ventures Adjusted EBITDA
|
14
|
|
15
|
|
42
|
|
59
|
|
|||||||
|
Adjusted EBITDA
|
$
|
175
|
|
$
|
177
|
|
$
|
595
|
|
$
|
619
|
|
|||
41
17
. EARNINGS PER SHARE
The calculation of basic and diluted earnings per share, including a reconciliation of the numerator and denominator, are as follows:
|
Three Months Ended September 30,
|
Nine Months Ended September 30,
|
||||||||||||||
|
2018
|
2017
|
2018
|
2017
|
||||||||||||
|
Numerator:
|
|||||||||||||||
|
Net income
|
$
|
237
|
|
$
|
19
|
|
$
|
725
|
|
$
|
177
|
|
|||
|
Net income and accretion attributable to noncontrolling interests
|
—
|
|
(1
|
)
|
—
|
|
(1
|
)
|
|||||||
|
Net income attributable to Hyatt Hotels Corporation
|
$
|
237
|
|
$
|
18
|
|
$
|
725
|
|
$
|
176
|
|
|||
|
Denominator:
|
|||||||||||||||
|
Basic weighted average shares outstanding
|
111,356,759
|
|
124,010,961
|
|
114,829,210
|
|
126,399,472
|
|
|||||||
|
Share-based compensation and equity-classified forward contract
|
1,867,226
|
|
1,396,922
|
|
1,954,863
|
|
1,315,462
|
|
|||||||
|
Diluted weighted average shares outstanding
|
113,223,985
|
|
125,407,883
|
|
116,784,073
|
|
127,714,934
|
|
|||||||
|
Basic Earnings Per Share:
|
|||||||||||||||
|
Net income
|
$
|
2.12
|
|
$
|
0.15
|
|
$
|
6.31
|
|
$
|
1.40
|
|
|||
|
Net income and accretion attributable to noncontrolling interests
|
—
|
|
(0.01
|
)
|
—
|
|
(0.01
|
)
|
|||||||
|
Net income attributable to Hyatt Hotels Corporation
|
$
|
2.12
|
|
$
|
0.14
|
|
$
|
6.31
|
|
$
|
1.39
|
|
|||
|
Diluted Earnings Per Share:
|
|||||||||||||||
|
Net income
|
$
|
2.09
|
|
$
|
0.15
|
|
$
|
6.21
|
|
$
|
1.39
|
|
|||
|
Net income and accretion attributable to noncontrolling interests
|
—
|
|
(0.01
|
)
|
—
|
|
(0.01
|
)
|
|||||||
|
Net income attributable to Hyatt Hotels Corporation
|
$
|
2.09
|
|
$
|
0.14
|
|
$
|
6.21
|
|
$
|
1.38
|
|
|||
The computations of diluted net income per share for the
three and nine
months ended
September 30, 2018
and
September 30, 2017
do not include the following shares of Class A common stock assumed to be issued as
stock-
settled SARs and RSUs because they are
anti-
dilutive.
|
Three Months Ended September 30,
|
Nine Months Ended September 30,
|
||||||||||
|
2018
|
2017
|
2018
|
2017
|
||||||||
|
SARs
|
—
|
|
29,100
|
|
—
|
|
32,300
|
|
|||
|
RSUs
|
—
|
|
400
|
|
—
|
|
200
|
|
|||
42
18
.
OTHER INCOME (LOSS), NET
|
Three Months Ended September 30,
|
Nine Months Ended September 30,
|
||||||||||||||
|
2018
|
2017
|
2018
|
2017
|
||||||||||||
|
Interest income (Note 4)
|
$
|
7
|
|
$
|
5
|
|
$
|
19
|
|
$
|
106
|
|
|||
|
Depreciation recovery
|
5
|
|
7
|
|
16
|
|
19
|
|
|||||||
|
Performance guarantee liability amortization (Note 12)
|
4
|
|
5
|
|
14
|
|
14
|
|
|||||||
|
Debt repayment guarantee liability amortization (Note 12)
|
2
|
|
3
|
|
8
|
|
8
|
|
|||||||
|
Cease use liability
|
—
|
|
(21
|
)
|
—
|
|
(21
|
)
|
|||||||
|
Realized losses (Note 4)
|
—
|
|
—
|
|
(2
|
)
|
(41
|
)
|
|||||||
|
Impairment of an equity security without a readily determinable fair value (Note 4)
|
—
|
|
—
|
|
(22
|
)
|
—
|
|
|||||||
|
Performance guarantee expense, net (Note 12)
|
(6
|
)
|
(14
|
)
|
(41
|
)
|
(54
|
)
|
|||||||
|
Loss on extinguishment of debt (Note 9)
|
(7
|
)
|
—
|
|
(7
|
)
|
—
|
|
|||||||
|
Unrealized (losses) gains (Note 4)
|
(15
|
)
|
—
|
|
(21
|
)
|
3
|
|
|||||||
|
Other, net
|
1
|
|
(1
|
)
|
14
|
|
(2
|
)
|
|||||||
|
Other income (loss), net
|
$
|
(9
|
)
|
$
|
(16
|
)
|
$
|
(22
|
)
|
$
|
32
|
|
|||
During the year ended December 31, 2017, we relocated our corporate headquarters and recognized a
$21 million
cease use liability.
19
. SUBSEQUENT EVENTS
On October 6, 2018, we entered into a Membership Interest Purchase Agreement ("Purchase Agreement") to acquire the outstanding equity interests of Two Roads Hospitality LLC for a purchase price of approximately
$480 million
, subject to adjustments, and variable consideration of up to an additional
$120 million
. Our Executive Chairman is the brother of the Co-Chairman of Two Roads Hospitality LLC and Founding Partner and Director of Geolo Capital LP, which is an affiliate of one of the sellers. The transaction is subject to closing conditions as detailed in the Purchase Agreement and is expected to close in the fourth quarter of 2018.
On October 9, 2018, we sold a Hyatt House hotel to an unrelated third party for approximately
$48 million
and entered into a long-term management agreement with the owner upon sale.
On October 30, 2018, our board of directors authorized the repurchase of up to an additional
$750 million
of our common stock. These repurchases may be made from time to time in the open market, in privately negotiated transactions, or otherwise, including pursuant to a Rule 10b5-1 plan or an accelerated share repurchase transaction, at prices we deem appropriate and subject to market conditions, applicable law and other factors deemed relevant in our sole discretion. The common stock repurchase program applies to our Class A common stock and/or our Class B common stock. The common stock repurchase program does not obligate us to repurchase any dollar amount or number of shares of common stock and the program may be suspended or discontinued at any time.
43
Item 2.
Management's Discussion and Analysis of Financial Condition and Results of Operations.
This quarterly report contains "forward-looking statements" within the meaning of the Private Securities Litigation Reform Act of 1995. These statements include statements about the Company's plans, strategies, financial performance, the amount by which the Company intends to reduce its real estate asset base, and the anticipated time frame for such asset dispositions, prospects, or future events and involve known and unknown risks that are difficult to predict. As a result, our actual results, performance, or achievements may differ materially from those expressed or implied by these forward-looking statements. In some cases, you can identify forward-looking statements by the use of words such as "may," "could," "expect," "intend," "plan," "seek," "anticipate," "believe," "estimate," "predict," "potential," "continue," "likely," "will," "would," and variations of these terms and similar expressions, or the negative of these terms or similar expressions. Such forward-looking statements are necessarily based upon estimates and assumptions that, while considered reasonable by us and our management, are inherently uncertain. Factors that may cause actual results to differ materially from current expectations include, but are not limited to: the factors discussed in our filings with the SEC, including our Annual Report on Form 10-K; general economic uncertainty in key global markets and a worsening of global economic conditions or low levels of economic growth; the rate and the pace of economic recovery following economic downturns; levels of spending in business and leisure segments as well as consumer confidence; declines in occupancy and average daily rate; limited visibility with respect to future bookings; loss of key personnel; hostilities, or fear of hostilities, including future terrorist attacks, that affect travel; travel-related accidents; natural or man-made disasters such as earthquakes, tsunamis, tornadoes, hurricanes, floods, wildfires, oil spills, nuclear incidents, and global outbreaks of pandemics or contagious diseases or fear of such outbreaks; our ability to successfully achieve certain levels of operating profits at hotels that have performance guarantees in favor of our third-party owners; the impact of hotel renovations and redevelopments; risks associated with our capital allocation plans and common stock repurchase program and other forms of shareholder capital returns, including the risk that our common stock repurchase program could increase volatility and fail to enhance shareholder value; our intention to pay a quarterly cash dividend and the amounts thereof, if any; the seasonal and cyclical nature of the real estate and hospitality businesses; changes in distribution arrangements, such as through internet travel intermediaries; changes in the tastes and preferences of our customers, including the entry of new competitors in the lodging business; relationships with colleagues and labor unions and changes in labor laws; the financial condition of, and our relationships with, third-party property owners, franchisees, and hospitality venture partners; the possible inability of our third-party owners, franchisees, or development partners to access capital necessary to fund current operations or implement our plans for growth; risks associated with potential acquisitions and dispositions and the introduction of new brand concepts; the timing of acquisitions and dispositions; failure to successfully complete proposed transactions (including the failure to satisfy closing conditions or obtain required approvals); our ability to successfully execute on our strategy to reduce our real estate asset base within targeted timeframes and at expected values, and to expand the growth of our management and franchising business; declines in the value of our real estate assets; unforeseen terminations of our management or franchise agreements; changes in federal, state, local, or foreign tax law; the impact of changes in the tax code as a result of recent U.S. federal income tax reform and uncertainty as to how some of those changes may be applied; increases in interest rates and operating costs; foreign exchange rate fluctuations or currency restructurings; lack of acceptance of new brands or innovation; general volatility of the capital markets and our ability to access such markets; changes in the competitive environment in our industry, including as a result of industry consolidation, and the markets where we operate; our ability to successfully grow the World of Hyatt loyalty platform and the level of acceptance of the program by our guests; cyber incidents and information technology failures; outcomes of legal or administrative proceedings; and violations of regulations or laws related to our franchising business. These factors are not necessarily all of the important factors that could cause our actual results, performance, or achievements to differ materially from those expressed in or implied by any of our forward-looking statements. Other unknown or unpredictable factors also could harm our business, financial condition, results of operations, or cash flows. All forward-looking statements attributable to us or persons acting on our behalf are expressly qualified in their entirety by the cautionary statements set forth above. Forward-looking statements speak only as of the date they are made, and we do not undertake or assume any obligation to update publicly any of these forward-looking statements to reflect actual results, new information or future events, changes in assumptions, or changes in other factors affecting forward-looking statements, except to the extent required by applicable law. If we update one or more forward-looking statements, no inference should be drawn that we will make additional updates with respect to those or other forward-looking statements.
The following discussion should be read in conjunction with the Company's condensed consolidated financial statements and accompanying Notes, which appear elsewhere in this Quarterly Report on Form 10-Q.
44
Executive Overview
We provide hospitality and other services on a worldwide basis through the development, ownership, operation, management, franchising, and licensing of hospitality and wellness-related businesses. We develop, own, operate, manage, franchise, license, or provide services to a portfolio of properties consisting of full service hotels, select service hotels, resorts, and other properties, including branded spas and fitness studios, and timeshare, fractional, and other forms of residential or vacation properties.
At
September 30, 2018
, our worldwide hotel portfolio consisted of
754
full and select service hotels (
190,978
rooms), including:
|
•
|
318
managed properties (
103,233
rooms), all of which we operate under management and hotel services agreements with third-party property owners;
|
|
•
|
377
franchised properties (
63,290
rooms), all of which are owned by third parties that have franchise agreements with us and are operated by third parties;
|
|
•
|
31
owned properties (
15,142
rooms) (including
1
consolidated hospitality venture),
1
capital leased property (
171
rooms), and
6
operating leased properties (
2,069
rooms), all of which we manage; and
|
|
•
|
19
managed properties and
2
franchised properties owned or leased by unconsolidated hospitality ventures (
7,073
rooms).
|
Our worldwide property portfolio also included:
|
•
|
3
destination wellness resorts (
399
rooms), all of which we own and operate (including
1
consolidated hospitality venture);
|
|
•
|
6
all-inclusive resorts (
2,401
rooms), all of which are owned by a third party in which we hold common shares and which operates the resorts under franchise agreements with us;
|
|
•
|
16
vacation ownership properties under the Hyatt Residence Club brand and operated by third parties; and
|
|
•
|
21
residential properties, which consist of branded residences and serviced apartments. We manage all of the serviced apartments and those branded residential units that participate in a rental program with an adjacent Hyatt-branded hotel.
|
Our worldwide property portfolio also included branded spas and fitness studios, comprised of leased and managed locations. Additionally, through strategic relationships, we provide certain reservation and/or loyalty program services to hotels that are unaffiliated with our hotel portfolio and which operate under other tradenames or marks owned by such hotel or licensed by third parties.
We report our consolidated operations in U.S. dollars. Amounts are reported in millions, unless otherwise noted. Percentages may not recompute due to rounding, and percentage changes that are not meaningful are presented as "NM". Constant currency disclosures throughout Management's Discussion and Analysis of Financial Condition and Results of Operations are non-GAAP measures. See "—Non-GAAP Measures" for further discussion of constant currency disclosures. We manage our business within four reportable segments as described below:
|
•
|
Owned and leased hotels, which consists of our owned and leased full service and select service hotels, and for purposes of segment Adjusted EBITDA, our pro rata share of the Adjusted EBITDA of our unconsolidated hospitality ventures, based on our ownership percentage of each venture;
|
|
•
|
Americas management and franchising, which consists of our management and franchising of properties located in the United States, Latin America, Canada, and the Caribbean;
|
|
•
|
ASPAC management and franchising, which consists of our management and franchising of properties located in Southeast Asia, Greater China, Australia, South Korea, Japan, and Micronesia; and
|
|
•
|
EAME/SW Asia management and franchising, which consists of our management and franchising of properties located in Europe, Africa, the Middle East, India, Central Asia, and Nepal.
|
Within corporate and other, we include the results of Miraval and exhale, Hyatt Residence Club license fees, results from our
co-
branded credit card, and unallocated corporate expenses. The results of our owned Miraval
45
resorts are reported in owned and leased hotels revenues and owned and leased hotels expenses on our condensed consolidated statements of income. See Part I, Item 1 "Financial Statements—Note
16
to the Condensed Consolidated Financial Statements" for further discussion of our segment structure.
During the quarter ended
September 30, 2018
, we returned capital to our shareholders of $66 million through share repurchases and $17 million through our quarterly dividend payment.
Our financial performance for the quarter ended
September 30, 2018
reflects an
increase
in net income attributable to Hyatt Hotels Corporation of
$219 million
, compared to the quarter ended
September 30, 2017
, driven primarily by the gain on the HRMC transaction in 2018. Consolidated revenues
increase
d
$4 million
, or
0.5%
(
$8 million
or
0.8%
, excluding the impact of currency), during the quarter ended
September 30, 2018
compared to the quarter ended
September 30, 2017
, driven by the growth of our third-party owned managed and franchised portfolio, partially offset by a decrease in owned and leased hotels revenues due to the disposition of hotel properties in 2018 and 2017.
Owned and leased hotels revenues for the quarter ended
September 30, 2018
decrease
d
$66 million
, compared to the quarter ended
September 30, 2017
, driven primarily by disposition activity in 2018 and 2017, partially offset by performance at our comparable properties.
Our management, franchise, and other fees for the quarter ended
September 30, 2018
increase
d
$10 million
, compared to the quarter ended
September 30, 2017
, which was spread across our reportable segments and included a net unfavorable currency impact of
$1 million
.
Our consolidated Adjusted EBITDA for the quarter ended
September 30, 2018
decrease
d
$2 million
, compared to the
third
quarter of
2017
, which included
$2 million
net unfavorable currency impact. The
decrease
was driven primarily by our owned and leased hotels segment which
decrease
d
$13 million
due to transactional activity in 2018 and 2017, partially offset by increases across our three remaining segments. See "—Non-GAAP Measures" for an explanation of how we utilize Adjusted EBITDA, why we present it, and material limitations on its usefulness, as well as a reconciliation of our net income attributable to Hyatt Hotels Corporation to EBITDA and a reconciliation of EBITDA to consolidated Adjusted EBITDA.
Hotel Chain Revenue per Available Room ("RevPAR") Statistics.
|
RevPAR
|
||||||||||||||||
|
Three Months Ended September 30,
|
||||||||||||||||
|
(Comparable locations)
|
Number of comparable hotels (1)
|
2018
|
2017
|
Change
|
Change (in constant $)
|
|||||||||||
|
System-wide hotels
|
645
|
$
|
140
|
|
$
|
138
|
|
1.7
|
%
|
2.8
|
%
|
|||||
|
Owned and leased hotels
|
33
|
$
|
179
|
|
$
|
171
|
|
4.9
|
%
|
5.3
|
%
|
|||||
|
Americas full service hotels
|
161
|
$
|
159
|
|
$
|
156
|
|
2.3
|
%
|
3.0
|
%
|
|||||
|
Americas select service hotels
|
323
|
$
|
112
|
|
$
|
113
|
|
(0.8
|
)%
|
(0.7
|
)%
|
|||||
|
ASPAC full service hotels
|
76
|
$
|
151
|
|
$
|
150
|
|
0.7
|
%
|
2.5
|
%
|
|||||
|
ASPAC select service hotels
|
5
|
$
|
52
|
|
$
|
55
|
|
(5.2
|
)%
|
(3.7
|
)%
|
|||||
|
EAME/SW Asia full service hotels
|
69
|
$
|
127
|
|
$
|
120
|
|
6.4
|
%
|
11.0
|
%
|
|||||
|
EAME/SW Asia select service hotels
|
11
|
$
|
74
|
|
$
|
73
|
|
1.2
|
%
|
2.8
|
%
|
|||||
(1) The number of comparable hotels presented above includes owned and leased hotels.
System-wide RevPAR increased 2.8% in constant currency during the three months ended September 30, 2018, compared to the three months ended September 30, 2017, driven by improved transient average daily rate ("ADR") across each of our segments, as well as increased group ADR and demand in the Americas and EAME/SW Asia. System-wide group revenue improved compared to 2017 as a result of higher demand in the United States. Group revenue booked in the third quarter of 2018 for stays in 2018 was higher as compared to 2017. Group revenue booked in the third quarter of 2018 for stays in future years was lower as compared to 2017. RevPAR related to owned and leased hotels improved due to increased transient demand in the United States and Europe. See "—Segment Results" for discussion of RevPAR by segment.
46
Results of Operations
Three and Nine Months Ended
September 30, 2018
Compared with
Three and Nine Months Ended
September 30, 2017
Discussion on Consolidated Results
For additional information regarding our consolidated results, please also refer to our condensed consolidated statements of income included in this quarterly report. The impact from our investments in marketable securities held to fund our deferred compensation plans through rabbi trusts was recorded on the various financial statement line items discussed below and had no impact on net income. Please refer to the section below entitled Net gains and interest income from marketable securities held to fund rabbi trusts for the allocation of the impact to the various financial statement line items.
Owned and leased hotels revenues.
|
Three Months Ended September 30,
|
||||||||||||||||||
|
2018
|
2017
|
Better / (Worse)
|
Currency Impact
|
|||||||||||||||
|
Comparable owned and leased hotels revenues
|
$
|
411
|
|
$
|
397
|
|
$
|
14
|
|
3.4
|
%
|
$
|
(2
|
)
|
||||
|
Non-comparable owned and leased hotels revenues
|
39
|
|
119
|
|
(80
|
)
|
(67.5
|
)%
|
(1
|
)
|
||||||||
|
Total owned and leased hotels revenues
|
$
|
450
|
|
$
|
516
|
|
$
|
(66
|
)
|
(12.9
|
)%
|
$
|
(3
|
)
|
||||
|
Nine Months Ended September 30,
|
||||||||||||||||||
|
2018
|
2017
|
Better / (Worse)
|
Currency Impact
|
|||||||||||||||
|
Comparable owned and leased hotels revenues
|
$
|
1,277
|
|
$
|
1,220
|
|
$
|
57
|
|
4.6
|
%
|
$
|
9
|
|
||||
|
Non-comparable owned and leased hotels revenues
|
173
|
|
441
|
|
(268
|
)
|
(60.7
|
)%
|
1
|
|
||||||||
|
Total owned and leased hotels revenues
|
$
|
1,450
|
|
$
|
1,661
|
|
$
|
(211
|
)
|
(12.7
|
)%
|
$
|
10
|
|
||||
Owned and leased hotels revenues decreased during the
three and nine months ended
September 30, 2018
, compared to the same periods in prior year, driven by non-comparable owned and leased hotels revenues related to dispositions, partially offset by increased operating results of certain comparable owned and leased hotels, particularly in the United States. See "—Segment Results" for further discussion of owned and leased hotels revenues.
47
Management, franchise, and other fees revenues
.
|
Three Months Ended September 30,
|
||||||||||||||
|
2018
|
|
2017
|
Better / (Worse)
|
|||||||||||
|
Base management fees
|
$
|
55
|
|
$
|
51
|
|
$
|
4
|
|
8.8
|
%
|
|||
|
Incentive management fees
|
33
|
|
31
|
|
2
|
|
6.4
|
%
|
||||||
|
Franchise fees
|
33
|
|
30
|
|
3
|
|
7.8
|
%
|
||||||
|
Other fee revenues
|
12
|
|
11
|
|
1
|
|
4.5
|
%
|
||||||
|
Management, franchise, and other fees
|
$
|
133
|
|
|
$
|
123
|
|
$
|
10
|
|
7.6
|
%
|
||
|
Three Months Ended September 30,
|
||||||||||||||
|
2018
|
2017
|
Better / (Worse)
|
||||||||||||
|
Management, franchise, and other fees
|
$
|
133
|
|
$
|
123
|
|
$
|
10
|
|
7.6
|
%
|
|||
|
Contra revenue
|
(5
|
)
|
(4
|
)
|
(1
|
)
|
(8.6
|
)%
|
||||||
|
Net management, franchise, and other fees
|
$
|
128
|
|
$
|
119
|
|
$
|
9
|
|
7.5
|
%
|
|||
|
Nine Months Ended September 30,
|
||||||||||||||
|
2018
|
2017
|
Better / (Worse)
|
||||||||||||
|
Base management fees
|
$
|
167
|
|
$
|
150
|
|
$
|
17
|
|
11.5
|
%
|
|||
|
Incentive management fees
|
105
|
|
95
|
|
10
|
|
10.7
|
%
|
||||||
|
Franchise fees
|
96
|
|
86
|
|
10
|
|
11.1
|
%
|
||||||
|
Other fee revenues
|
39
|
|
36
|
|
3
|
|
7.6
|
%
|
||||||
|
Management, franchise, and other fees
|
$
|
407
|
|
$
|
367
|
|
$
|
40
|
|
10.8
|
%
|
|||
|
Nine Months Ended September 30,
|
||||||||||||||
|
2018
|
2017
|
Better / (Worse)
|
||||||||||||
|
Management, franchise, and other fees
|
$
|
407
|
|
$
|
367
|
|
$
|
40
|
|
10.8
|
%
|
|||
|
Contra revenue
|
(15
|
)
|
(13
|
)
|
(2
|
)
|
(13.0
|
)%
|
||||||
|
Net management, franchise, and other fees
|
$
|
392
|
|
$
|
354
|
|
$
|
38
|
|
10.7
|
%
|
|||
The increases in management, franchise, and other fees, which included a
$1 million
net unfavorable and a $
2 million
net favorable currency impact for the
three and nine
months ended
September 30, 2018
, respectively, compared to the same periods in the prior year, were driven primarily by increases in management fees across all reportable segments, including increased fees due to hotel conversions from owned to managed in the Americas management and franchising segment. Additionally, the increases in franchise fees were driven primarily by higher fees in the Americas management and franchising segment. See "—Segment Results" for further discussion.
48
Revenues for the reimbursement of costs incurred on behalf of managed and franchised properties.
|
Three Months Ended September 30,
|
||||||||||||||
|
2018
|
2017
|
Change
|
||||||||||||
|
Revenues for the reimbursement of costs incurred on behalf of managed and franchised properties
|
$
|
489
|
|
$
|
429
|
|
$
|
60
|
|
14.1
|
%
|
|||
|
Less: rabbi trust impact
|
(5
|
)
|
(5
|
)
|
—
|
|
11.2
|
%
|
||||||
|
Revenues for the reimbursement of costs incurred on behalf of managed and franchised properties excluding rabbi trust impact
|
$
|
484
|
|
$
|
424
|
|
$
|
60
|
|
14.5
|
%
|
|||
|
Nine Months Ended September 30,
|
||||||||||||||
|
2018
|
2017
|
Change
|
||||||||||||
|
Revenues for the reimbursement of costs incurred on behalf of managed and franchised properties
|
$
|
1,447
|
|
$
|
1,302
|
|
$
|
145
|
|
11.2
|
%
|
|||
|
Less: rabbi trust impact
|
(10
|
)
|
(17
|
)
|
7
|
|
43.6
|
%
|
||||||
|
Revenues for the reimbursement of costs incurred on behalf of managed and franchised properties excluding rabbi trust impact
|
$
|
1,437
|
|
$
|
1,285
|
|
$
|
152
|
|
11.9
|
%
|
|||
Excluding the impact of rabbi trust, revenues for the reimbursement of costs incurred on behalf of managed and franchised properties
increase
d during the
three and nine
months ended
September 30, 2018
, compared to the
three and nine
months ended
September 30, 2017
, driven by the growth of our third-party owned full and select service managed and franchised portfolio and higher reimbursements for payroll and related costs, primarily due to sales of owned and leased properties during 2017 and 2018. Additionally, revenues increased due to higher redemptions related to the loyalty program.
Owned and leased hotels expense.
|
Three Months Ended September 30,
|
||||||||||||||
|
2018
|
2017
|
Better / (Worse)
|
||||||||||||
|
Comparable owned and leased hotels expense
|
$
|
321
|
|
$
|
313
|
|
$
|
(8
|
)
|
(2.5
|
)%
|
|||
|
Non-comparable owned and leased hotels expense
|
31
|
|
91
|
|
60
|
|
66.3
|
%
|
||||||
|
Rabbi trust impact
|
2
|
|
2
|
|
—
|
|
11.2
|
%
|
||||||
|
Total owned and leased hotels expense
|
$
|
354
|
|
$
|
406
|
|
$
|
52
|
|
13.0
|
%
|
|||
|
Nine Months Ended September 30,
|
||||||||||||||
|
2018
|
2017
|
Better / (Worse)
|
||||||||||||
|
Comparable owned and leased hotels expense
|
$
|
973
|
|
$
|
942
|
|
$
|
(31
|
)
|
(3.2
|
)%
|
|||
|
Non-comparable owned and leased hotels expense
|
119
|
|
310
|
|
191
|
|
61.8
|
%
|
||||||
|
Rabbi trust impact
|
3
|
|
6
|
|
3
|
|
43.6
|
%
|
||||||
|
Total owned and leased hotels expense
|
$
|
1,095
|
|
$
|
1,258
|
|
$
|
163
|
|
13.0
|
%
|
|||
The decreases in owned and leased hotels expense, which included a
$3 million
net favorable and a $
9 million
net unfavorable currency impact, during the
three and nine months ended
September 30, 2018
, respectively, compared to the same periods in the prior year, were driven primarily by non-comparable owned and leased hotel dispositions. The decreases were partially offset by increases in comparable owned and leased hotels expense driven primarily by increased payroll and related costs.
Depreciation and amortization expense
. Depreciation and amortization
decrease
d
$7 million
and
$18 million
during the
three and nine months ended
September 30, 2018
, respectively, compared to the same periods in the prior year, driven primarily by dispositions in 2017 and 2018. The decreases were partially offset by accelerated depreciation related to renovations at certain of our owned hotels. A portion of the depreciation related primarily to technology projects is recovered from our managed and franchised hotels and the corresponding recovery is included in other income (loss), net on our condensed consolidated statements of income.
49
Selling, general, and administrative expenses.
|
Three Months Ended September 30,
|
||||||||||||||
|
2018
|
2017
|
Change
|
||||||||||||
|
Selling, general, and administrative expenses
|
$
|
82
|
|
$
|
89
|
|
$
|
(7
|
)
|
(7.7
|
)%
|
|||
|
Less: rabbi trust impact
|
(8
|
)
|
(9
|
)
|
1
|
|
10.8
|
%
|
||||||
|
Less: stock-based compensation expense
|
(5
|
)
|
(5
|
)
|
—
|
|
4.3
|
%
|
||||||
|
Adjusted selling, general, and administrative expenses
|
$
|
69
|
|
$
|
75
|
|
$
|
(6
|
)
|
(7.6
|
)%
|
|||
|
Nine Months Ended September 30,
|
||||||||||||||
|
2018
|
2017
|
Change
|
||||||||||||
|
Selling, general, and administrative expenses
|
$
|
260
|
|
$
|
278
|
|
$
|
(18
|
)
|
(6.1
|
)%
|
|||
|
Less: rabbi trust impact
|
(16
|
)
|
(29
|
)
|
13
|
|
45.6
|
%
|
||||||
|
Less: stock-based compensation expense
|
(28
|
)
|
(26
|
)
|
(2
|
)
|
(8.6
|
)%
|
||||||
|
Adjusted selling, general, and administrative expenses
|
$
|
216
|
|
$
|
223
|
|
$
|
(7
|
)
|
(2.7
|
)%
|
|||
Adjusted selling, general, and administrative expenses exclude the impact of expenses related to deferred compensation plans funded through rabbi trusts and stock-based compensation expense. Adjusted selling, general, and administrative expenses, as we define it, is a non-GAAP measure. See "—Non-GAAP Measures" for further discussion of Adjusted selling, general, and administrative expenses.
Adjusted selling, general, and administrative expenses decreased during the
three and nine months ended
September 30, 2018
, compared to the same periods in 2017, due to marketing initiatives completed during 2017, including master brand marketing expenses to support the launch of the World of Hyatt loyalty platform. The decrease during the three months ended
September 30, 2018
also included a $3 million decrease in payroll and related costs due to severance in 2017. The decrease during the
nine
months ended
September 30, 2018
was partially offset by a $4 million increase in payroll and related costs, primarily due to the acquisition of exhale in the third quarter of 2017.
Costs incurred on behalf of managed and franchised properties.
|
Three Months Ended September 30,
|
||||||||||||||
|
2018
|
2017
|
Change
|
||||||||||||
|
Costs incurred on behalf of managed and franchised properties
|
$
|
487
|
|
$
|
425
|
|
$
|
62
|
|
14.9
|
%
|
|||
|
Less: rabbi trust impact
|
(5
|
)
|
(5
|
)
|
—
|
|
11.2
|
%
|
||||||
|
Costs incurred on behalf of managed and franchised properties excluding rabbi trust impact
|
$
|
482
|
|
$
|
420
|
|
$
|
62
|
|
15.2
|
%
|
|||
|
Nine Months Ended September 30,
|
||||||||||||||
|
2018
|
2017
|
Change
|
||||||||||||
|
Costs incurred on behalf of managed and franchised properties
|
$
|
1,447
|
|
$
|
1,313
|
|
$
|
134
|
|
10.3
|
%
|
|||
|
Less: rabbi trust impact
|
(10
|
)
|
(17
|
)
|
7
|
|
43.6
|
%
|
||||||
|
Costs incurred on behalf of managed and franchised properties excluding rabbi trust impact
|
$
|
1,437
|
|
$
|
1,296
|
|
$
|
141
|
|
11.0
|
%
|
|||
Excluding the impact of rabbi trust, costs incurred on behalf of managed and franchised properties
increase
d during the
three and nine
months ended
September 30, 2018
, compared to the
three and nine
months ended
September 30, 2017
, driven by the growth of our third-party owned full and select service managed and franchised portfolio and higher reimbursements for payroll and related costs, primarily due to sales of owned and leased properties during 2017 and 2018.
50
Net gains and interest income from marketable securities held to fund rabbi trusts.
|
Three Months Ended September 30,
|
||||||||||||||
|
2018
|
2017
|
Better / (Worse)
|
||||||||||||
|
Rabbi trust impact allocated to selling, general, and administrative expenses
|
$
|
8
|
|
$
|
9
|
|
$
|
(1
|
)
|
(10.8
|
)%
|
|||
|
Rabbi trust impact allocated to owned and leased hotels expense
|
2
|
|
2
|
|
—
|
|
(11.2
|
)%
|
||||||
|
Net gains and interest income from marketable securities held to fund rabbi trusts
|
$
|
10
|
|
$
|
11
|
|
$
|
(1
|
)
|
(10.9
|
)%
|
|||
|
Nine Months Ended September 30,
|
||||||||||||||
|
2018
|
2017
|
Better / (Worse)
|
||||||||||||
|
Rabbi trust impact allocated to selling, general, and administrative expenses
|
$
|
16
|
|
$
|
29
|
|
$
|
(13
|
)
|
(45.6
|
)%
|
|||
|
Rabbi trust impact allocated to owned and leased hotels expense
|
3
|
|
6
|
|
(3
|
)
|
(43.6
|
)%
|
||||||
|
Net gains and interest income from marketable securities held to fund rabbi trusts
|
$
|
19
|
|
$
|
35
|
|
$
|
(16
|
)
|
(45.2
|
)%
|
|||
Equity earnings (losses) from unconsolidated hospitality ventures.
|
Three Months Ended September 30,
|
||||||||||||||
|
2018
|
2017
|
Better / (Worse)
|
||||||||||||
|
Equity earnings (losses) from unconsolidated hospitality ventures
|
$
|
(6
|
)
|
$
|
1
|
|
$
|
(7
|
)
|
(909.6
|
)%
|
|||
|
Nine Months Ended September 30,
|
|||||||||||||
|
2018
|
2017
|
Better / (Worse)
|
|||||||||||
|
Equity earnings (losses) from unconsolidated hospitality ventures
|
$
|
(17
|
)
|
$
|
(1
|
)
|
$
|
(16
|
)
|
NM
|
|||
The increase in equity losses during the
three and nine months ended
September 30, 2018
, compared to the
three and nine months ended
September 30, 2017
, was primarily attributable to the following:
|
•
|
$6 million and $10 million, respectively, of increased foreign currency losses at one of our unconsolidated hospitality ventures which holds loans denominated in a currency other than its functional currency; and
|
|
•
|
$2 million of historical foreign currency translation losses recognized upon the sale of our interests in two of our foreign currency denominated unconsolidated hospitality ventures during the three months ended
September 30, 2018
.
|
The increase in losses during the nine months ended
September 30, 2018
was also attributable to a $16 million impairment charge related to unconsolidated hospitality ventures in Brazil, which were acquired during the second quarter of 2018. See Part I, Item 1 "Financial Statements—Note 4 to the Condensed Consolidated Financial Statements." The increase in losses during the nine months ended
September 30, 2018
was partially offset by $13 million of gains recognized from sales activity related to certain unconsolidated hospitality ventures.
Gains on sales of real estate.
During the
three and nine months ended
September 30, 2018
, we recognized a pre-tax gain of approximately
$240 million
associated with the HRMC transaction. During the
nine
months ended, we recognized a
$531 million
pre-tax gain related to the sales of Grand Hyatt San Francisco, Andaz Maui at Wailea Resort, and Hyatt Regency Coconut Point Resort and Spa. During the
nine
months ended
September 30, 2017
, we sold Hyatt Regency Louisville and Hyatt Regency Grand Cypress resulting in pre-tax gains of
$35 million
and
$26 million
, respectively.
Asset impairments.
During the
three and nine months ended
September 30, 2018
, we recognized a $21 million asset impairment charge related to goodwill associated with the HRMC transaction. See Part I, Item 1 "Financial Statements—Note 6 to the Condensed Consolidated Financial Statements" for further details.
51
Other income (loss), net
.
Other income (loss), net
increase
d
$7 million
and
decrease
d
$54 million
during the three and nine months ended
September 30, 2018
, respectively, compared to the same periods in prior year. See Part I, Item 1 "Financial Statements—Note 18 to the Condensed Consolidated Financial Statements" for further details. Effective January 1, 2018, we recognize unrealized gains and losses on equity securities from changes in the fair value of the underlying securities within other income (loss), net, as a result of the adoption of ASU 2016-01.
Provision for income taxes.
|
Three Months Ended September 30,
|
||||||||||||||
|
2018
|
2017
|
Better / (Worse)
|
||||||||||||
|
Income before income taxes
|
$
|
256
|
|
$
|
35
|
|
$
|
221
|
|
653.6
|
%
|
|||
|
Provision for income taxes
|
(19
|
)
|
(16
|
)
|
(3
|
)
|
(28.9
|
)%
|
||||||
|
Effective tax rate
|
7.7
|
%
|
45.2
|
%
|
|
|
37.5
|
%
|
||||||
|
Nine Months Ended September 30,
|
||||||||||||||
|
2018
|
2017
|
Better / (Worse)
|
||||||||||||
|
Income before income taxes
|
$
|
919
|
|
$
|
280
|
|
$
|
639
|
|
228.8
|
%
|
|||
|
Provision for income taxes
|
(194
|
)
|
(103
|
)
|
(91
|
)
|
(89.7
|
)%
|
||||||
|
Effective tax rate
|
21.2
|
%
|
36.7
|
%
|
15.5
|
%
|
||||||||
The decrease in the effective tax rate during the
three and nine months ended
September 30, 2018, compared to the
three and nine months ended
September 30, 2017, was driven primarily by the reduction in the U.S. corporate income tax rate from 35% to 21% as a result of the Tax Act. The decrease was also driven by a low effective tax rate on the HRMC transaction, which is based on the local country tax laws unique to the transaction.
Income tax expense increased during the
nine months ended
September 30, 2018, compared to the
nine months ended
September 30, 2017, primarily due to an increase in income before taxes driven by the portfolio sale of Grand Hyatt San Francisco, Andaz Maui at Wailea Resort, and Hyatt Regency Coconut Point Resort and Spa, and the HRMC transaction.
52
Segment Results
We evaluate segment operating performance using owned and leased hotels revenues, management, franchise, and other fees revenues, and Adjusted EBITDA, as described in Part I, Item 1 "Financial Statements—Note
16
to the Condensed Consolidated Financial Statements."
Owned and leased hotels segment revenues
.
|
Three Months Ended September 30,
|
||||||||||||||||||
|
2018
|
2017
|
Better / (Worse)
|
Currency Impact
|
|||||||||||||||
|
Comparable owned and leased hotels revenues
|
$
|
418
|
|
$
|
407
|
|
$
|
11
|
|
2.6
|
%
|
$
|
(2
|
)
|
||||
|
Non-comparable owned and leased hotels revenues
|
25
|
|
103
|
|
(78
|
)
|
(76.2
|
)%
|
(1
|
)
|
||||||||
|
Total segment revenues
|
$
|
443
|
|
$
|
510
|
|
$
|
(67
|
)
|
(13.3
|
)%
|
$
|
(3
|
)
|
||||
|
Nine Months Ended September 30,
|
||||||||||||||||||
|
2018
|
2017
|
Better / (Worse)
|
Currency Impact
|
|||||||||||||||
|
Comparable owned and leased hotels revenues
|
$
|
1,303
|
|
$
|
1,249
|
|
$
|
54
|
|
4.3
|
%
|
$
|
9
|
|
||||
|
Non-comparable owned and leased hotels revenues
|
125
|
|
392
|
|
(267
|
)
|
(68.2
|
)%
|
1
|
|
||||||||
|
Total owned and leased hotels revenues
|
1,428
|
|
1,641
|
|
(213
|
)
|
(13.0
|
)%
|
10
|
|
||||||||
|
Other revenues
|
—
|
|
13
|
|
(13
|
)
|
NM
|
|
—
|
|
||||||||
|
Total segment revenues
|
$
|
1,428
|
|
$
|
1,654
|
|
$
|
(226
|
)
|
(13.7
|
)%
|
$
|
10
|
|
||||
The
increase
in comparable owned and leased hotels revenues during the three months ended
September 30, 2018
, compared to the three months ended
September 30, 2017
, was driven by an
increase
of
$6 million
at our hotels in the United States due to improved performance at convention hotels and an
increase
of $
5 million
at our international hotels due to improved transient business at properties in Europe and Asia.
The
decrease
in non-comparable owned and leased hotels revenues for the three months ended
September 30, 2018
, compared to the same period in 2017, was driven by the following dispositions:
|
•
|
Grand Hyatt San Francisco, Andaz Maui at Wailea Resort, and Hyatt Regency Coconut Point Resort and Spa in 2018; and
|
|
•
|
Hyatt Regency Monterey Hotel & Spa on Del Monte Golf Course, Hyatt Regency Scottsdale Resort & Spa at Gainey Ranch, and Royal Palms Resort and Spa in 2017.
|
The
increase
in comparable owned and leased hotels revenues during the
nine
months ended
September 30, 2018
, compared to the
nine
months ended
September 30, 2017
, was driven by an
increase
of
$39 million
at our hotels in the United States and an
increase
of $
15 million
at our international hotels. The increase in the United States was driven primarily by improved transient, group, and banquet revenues in major markets. The
increase
at our international hotels was driven primarily by a net favorable currency impact of
$9 million
and improved transient business at properties in Europe and Asia.
The
decrease
in non-comparable owned and leased hotels revenues for the
nine
months ended
September 30, 2018
, compared to the same period in 2017, was driven by the aforementioned dispositions, as well as the dispositions of Hyatt Regency Grand Cypress and Hyatt Regency Louisville during the first half of 2017.
|
Three Months Ended September 30,
|
||||||||||||||||||||||||||||||||||||
|
RevPAR
|
Occupancy
|
ADR
|
||||||||||||||||||||||||||||||||||
|
2018
|
2017
|
Better /
(Worse) |
Better / (Worse) Constant $
|
2018
|
2017
|
Change in
% pts |
2018
|
2017
|
Better /
(Worse) |
Better / (Worse) Constant $
|
||||||||||||||||||||||||||
|
Comparable owned and leased hotels
|
$
|
179
|
|
$
|
171
|
|
4.9
|
%
|
5.3
|
%
|
79.2
|
%
|
77.3
|
%
|
1.9
|
%
|
$
|
226
|
|
$
|
221
|
|
2.4
|
%
|
2.8
|
%
|
||||||||||
53
|
Nine Months Ended September 30,
|
||||||||||||||||||||||||||||||||||||
|
RevPAR
|
Occupancy
|
ADR
|
||||||||||||||||||||||||||||||||||
|
2018
|
2017
|
Better /
(Worse) |
Better / (Worse) Constant $
|
2018
|
2017
|
Change in
Occ % pts |
2018
|
2017
|
Better /
(Worse) |
Better / (Worse) Constant $
|
||||||||||||||||||||||||||
|
Comparable owned and leased hotels
|
$
|
178
|
|
$
|
170
|
|
4.5
|
%
|
3.8
|
%
|
77.7
|
%
|
76.6
|
%
|
1.1
|
%
|
$
|
229
|
|
$
|
223
|
|
3.0
|
%
|
2.3
|
%
|
||||||||||
Excluding the currency impact, the increases in comparable RevPAR at our owned and leased hotels during the three and nine months ended
September 30, 2018
, compared to the three and nine months ended
September 30, 2017
, was driven primarily by increased group and transient business at our full service hotels.
During the three months ended
September 30, 2018
, we removed one property from the comparable owned and leased hotels results as the hotel was sold. During the
nine
months ended
September 30, 2018
, we removed four properties from the comparable owned and leased hotels results as three hotels were sold and one converted from leased to managed.
Owned and leased hotels segment Adjusted EBITDA
.
|
Three Months Ended September 30,
|
||||||||||||||
|
2018
|
2017
|
Better / (Worse)
|
||||||||||||
|
Owned and leased hotels Adjusted EBITDA
|
$
|
77
|
|
$
|
89
|
|
$
|
(12
|
)
|
(13.9
|
)%
|
|||
|
Pro rata share of unconsolidated hospitality ventures Adjusted EBITDA
|
14
|
|
15
|
|
(1
|
)
|
(3.8
|
)%
|
||||||
|
Segment Adjusted EBITDA
|
$
|
91
|
|
$
|
104
|
|
$
|
(13
|
)
|
(12.5
|
)%
|
|||
|
Nine Months Ended September 30,
|
||||||||||||||
|
2018
|
2017
|
Better / (Worse)
|
||||||||||||
|
Owned and leased hotels Adjusted EBITDA
|
$
|
282
|
|
$
|
323
|
|
$
|
(41
|
)
|
(13.0
|
)%
|
|||
|
Pro rata share of unconsolidated hospitality ventures Adjusted EBITDA
|
42
|
|
59
|
|
(17
|
)
|
(28.6
|
)%
|
||||||
|
Segment Adjusted EBITDA
|
$
|
324
|
|
$
|
382
|
|
$
|
(58
|
)
|
(15.4
|
)%
|
|||
Owned and leased hotels Adjusted EBITDA
. Adjusted EBITDA at our owned and leased hotels decreased during the
three and nine
months ended
September 30, 2018
, compared to the same periods in
2017
, including an insignificant net unfavorable and a
$1 million
net favorable currency impact, respectively. Adjusted EBITDA at our non-comparable owned and leased hotels decreased
$17 million
and
$65 million
, respectively, due to the aforementioned dispositions. These decreases were partially offset by increases of
$5 million
and
$24 million
, respectively, at our comparable owned and leased hotels driven by the aforementioned increases in revenues as well as improved operating margins.
Pro rata share of unconsolidated hospitality ventures Adjusted EBITDA
. Our pro rata share of Adjusted EBITDA from our unconsolidated hospitality ventures included an insignificant net unfavorable currency impact during both the
three and nine
months ended
September 30, 2018
, respectively, compared to the same periods in
2017
. The decrease during the nine months ended
September 30, 2018
, compared to the same period in
2017
, was driven primarily by Playa's business combination during the first quarter of 2017. See Part I, Item 1 "Financial Statements—Note 4 to the Condensed Consolidated Financial Statements."
54
Americas management and franchising segment revenues
.
|
Three Months Ended September 30,
|
||||||||||||||
|
2018
|
2017
|
Better / (Worse)
|
||||||||||||
|
Segment revenues
|
||||||||||||||
|
Management, franchise, and other fees
|
$
|
95
|
|
$
|
94
|
|
$
|
1
|
|
0.4
|
%
|
|||
|
Contra revenue
|
(4
|
)
|
(3
|
)
|
(1
|
)
|
(6.1
|
)%
|
||||||
|
Revenues for the reimbursement of costs incurred on behalf of managed and franchised properties
|
447
|
|
395
|
|
52
|
|
13.3
|
%
|
||||||
|
Total segment revenues
|
$
|
538
|
|
$
|
486
|
|
$
|
52
|
|
10.9
|
%
|
|||
|
Nine Months Ended September 30,
|
||||||||||||||
|
2018
|
2017
|
Better / (Worse)
|
||||||||||||
|
Segment revenues
|
||||||||||||||
|
Management, franchise, and other fees
|
$
|
301
|
|
$
|
289
|
|
$
|
12
|
|
4.0
|
%
|
|||
|
Contra revenue
|
(10
|
)
|
(9
|
)
|
(1
|
)
|
(10.2
|
)%
|
||||||
|
Revenues for the reimbursement of costs incurred on behalf of managed and franchised properties
|
1,328
|
|
1,205
|
|
123
|
|
10.2
|
%
|
||||||
|
Total segment revenues
|
$
|
1,619
|
|
$
|
1,485
|
|
$
|
134
|
|
9.0
|
%
|
|||
Americas management and franchising revenues included an insignificant net unfavorable currency impact during both the
three and nine
months ended
September 30, 2018
compared to the same periods in 2017.
The
increase
in management, franchise, and other fees during the
nine
months ended
September 30, 2018
, compared to the
nine
months ended
September 30, 2017
, was primarily due to a $10 million increase in franchise fees and $4 million increase in management fees primarily from new hotels and improved performance across the segment and $8 million of proceeds from a legal settlement related to a franchise agreement termination for an unopened property. These increases were partially offset by $10 million of termination fees recognized in 2017 for two hotels that left the chain and a hotel that converted from managed to franchised.
The
increase
in revenues for the reimbursement of costs incurred on behalf of managed and franchised properties during the
three and nine
months ended
September 30, 2018
, compared to the same periods in the prior year, was driven by increased reimbursements for payroll and related costs primarily due to sales of owned and leased properties during 2017 and 2018, the overall growth of our third-party owned full and select service portfolio, and increased redemptions related to the loyalty program.
|
Three Months Ended September 30,
|
||||||||||||||||||||||||||||||||||||
|
RevPAR
|
Occupancy
|
ADR
|
||||||||||||||||||||||||||||||||||
|
(Comparable System-wide Hotels)
|
2018
|
2017
|
Better /
(Worse) |
Better / (Worse) Constant $
|
2018
|
2017
|
Change in
% pts |
2018
|
2017
|
Better /
(Worse) |
Better / (Worse) Constant $
|
|||||||||||||||||||||||||
|
Americas Full Service
|
$
|
159
|
|
$
|
156
|
|
2.3
|
%
|
3.0
|
%
|
78.4
|
%
|
78.6
|
%
|
(0.2
|
)%
|
$
|
203
|
|
$
|
198
|
|
2.6
|
%
|
3.2
|
%
|
||||||||||
|
Americas Select Service
|
$
|
112
|
|
$
|
113
|
|
(0.8
|
)%
|
(0.7
|
)%
|
80.1
|
%
|
81.9
|
%
|
(1.8
|
)%
|
$
|
140
|
|
$
|
138
|
|
1.4
|
%
|
1.5
|
%
|
||||||||||
55
|
Nine Months Ended September 30,
|
||||||||||||||||||||||||||||||||||||
|
RevPAR
|
Occupancy
|
ADR
|
||||||||||||||||||||||||||||||||||
|
(Comparable System-wide Hotels)
|
2018
|
2017
|
Better /
(Worse) |
Better / (Worse) Constant $
|
2018
|
2017
|
Change in
Occ % pts |
2018
|
2017
|
Better /
(Worse) |
Better / (Worse) Constant $
|
|||||||||||||||||||||||||
|
Americas Full Service
|
$
|
161
|
|
$
|
156
|
|
3.1
|
%
|
3.4
|
%
|
77.2
|
%
|
76.5
|
%
|
0.7
|
%
|
$
|
208
|
|
$
|
204
|
|
2.2
|
%
|
2.4
|
%
|
||||||||||
|
Americas Select Service
|
$
|
111
|
|
$
|
109
|
|
1.7
|
%
|
1.7
|
%
|
78.8
|
%
|
78.9
|
%
|
(0.1
|
)%
|
$
|
141
|
|
$
|
139
|
|
1.7
|
%
|
1.8
|
%
|
||||||||||
Excluding the net unfavorable currency impact, comparable full service hotels RevPAR
increase
d during the three and nine months ended
September 30, 2018
. The increase during the three and nine months ended
September 30, 2018
, compared to the same periods in the prior year, was driven by increased group revenue due to improved demand and ADR in a majority of our top markets and lesser impact of natural disasters in 2018 as compared to 2017. The increase during the
nine
months ended
September 30, 2018
, compared to the same period in the prior year, also benefited from strong transient ADR throughout the segment.
Excluding the net unfavorable currency impact, comparable select service hotels RevPAR decreased during the three months ended September 30, 2018 as supply growth in the United States outpaced demand as compared to the same period in the prior year. The increase during the nine months ended September 30, 2018, compared to the same period in the prior year, was driven by improved ADR.
During the three and nine months ended
September 30, 2018
, one property was removed from the comparable Americas full service system-wide hotel results that converted from franchised to managed and we removed one property from the comparable Americas select service system-wide hotel results that left the chain.
Americas management and franchising segment Adjusted EBITDA
.
|
Three Months Ended September 30,
|
||||||||||||||
|
2018
|
2017
|
Better / (Worse)
|
||||||||||||
|
Segment Adjusted EBITDA
|
$
|
83
|
|
$
|
81
|
|
$
|
2
|
|
1.0
|
%
|
|||
|
Nine Months Ended September 30,
|
||||||||||||||
|
2018
|
2017
|
Better / (Worse)
|
||||||||||||
|
Segment Adjusted EBITDA
|
$
|
266
|
|
$
|
250
|
|
$
|
16
|
|
6.3
|
%
|
|||
Adjusted EBITDA, which included an insignificant net unfavorable currency impact,
increase
d during the
three and nine
months ended
September 30, 2018
compared to the
three and nine
months ended
September 30, 2017
. The increase during the three months ended September 30, 2018, compared to the three months ended September 30, 2017, was driven by the modest increase in management, franchise, and other fees noted above offset by a termination fee recognized in the three months ended September 30, 2017 for a property that left the chain. The increase during the
nine
months ended
September 30, 2018
, compared to the
nine
months ended
September 30, 2017
, was driven by management, franchise, and other fees as discussed above, as well as the recovery of legal fees related to the aforementioned legal settlement.
ASPAC management and franchising segment revenues.
|
Three Months Ended September 30,
|
||||||||||||||
|
2018
|
2017
|
Better / (Worse)
|
||||||||||||
|
Segment revenues
|
||||||||||||||
|
Management, franchise, and other fees
|
$
|
30
|
|
$
|
27
|
|
$
|
3
|
|
11.4
|
%
|
|||
|
Contra revenue
|
—
|
|
—
|
|
—
|
|
(31.6
|
)%
|
||||||
|
Revenues for the reimbursement of costs incurred on behalf of managed and franchised properties
|
24
|
|
19
|
|
5
|
|
25.0
|
%
|
||||||
|
Total segment revenues
|
$
|
54
|
|
$
|
46
|
|
$
|
8
|
|
16.9
|
%
|
|||
56
|
Nine Months Ended September 30,
|
||||||||||||||
|
2018
|
2017
|
Better / (Worse)
|
||||||||||||
|
Segment revenues
|
||||||||||||||
|
Management, franchise, and other fees
|
$
|
90
|
|
$
|
79
|
|
$
|
11
|
|
14.2
|
%
|
|||
|
Contra revenue
|
(1
|
)
|
(1
|
)
|
—
|
|
(48.2
|
)%
|
||||||
|
Revenues for the reimbursement of costs incurred on behalf of managed and franchised properties
|
67
|
|
56
|
|
11
|
|
20.0
|
%
|
||||||
|
Total segment revenues
|
$
|
156
|
|
$
|
134
|
|
$
|
22
|
|
16.4
|
%
|
|||
ASPAC management and franchising revenues included an insignificant net unfavorable and a
$2 million
net favorable currency impacts during the
three and nine months ended
September 30, 2018
, respectively, compared to the
three and nine months ended
September 30, 2017
. The increases in management, franchise, and other fees were driven by increases in management fees primarily due to higher base and incentive fees related to new hotels and improved performance in Greater China. The increase during the nine months ended
September 30, 2018
also included higher incentive fees due to improved performance across the remainder of the segment.
The
increase
s in revenues for the reimbursement of costs incurred on behalf of managed and franchised properties during the
three and nine
months ended
September 30, 2018
, compared to the same periods in 2017, were driven by the growth of our third-party owned full and select service portfolio and increased redemptions related to the loyalty program.
|
Three Months Ended September 30,
|
||||||||||||||||||||||||||||||||||||
|
RevPAR
|
Occupancy
|
ADR
|
||||||||||||||||||||||||||||||||||
|
(Comparable System-wide Hotels)
|
2018
|
2017
|
Better /
(Worse) |
Better / (Worse) Constant $
|
2018
|
2017
|
Change in
% pts |
2018
|
2017
|
Better /
(Worse) |
Better (Worse) Constant $
|
|||||||||||||||||||||||||
|
ASPAC Full Service
|
$
|
151
|
|
$
|
150
|
|
0.7
|
%
|
2.5
|
%
|
77.7
|
%
|
76.2
|
%
|
1.5
|
%
|
$
|
194
|
|
$
|
197
|
|
(1.2
|
)%
|
0.6
|
%
|
||||||||||
|
ASPAC Select Service
|
$
|
52
|
|
$
|
55
|
|
(5.2
|
)%
|
(3.7
|
)%
|
67.8
|
%
|
71.2
|
%
|
(3.4
|
)%
|
$
|
77
|
|
$
|
78
|
|
(0.4
|
)%
|
1.2
|
%
|
||||||||||
|
Nine Months Ended September 30,
|
||||||||||||||||||||||||||||||||||||
|
RevPAR
|
Occupancy
|
ADR
|
||||||||||||||||||||||||||||||||||
|
(Comparable System-wide Hotels)
|
2018
|
2017
|
Better /
(Worse) |
Better / (Worse) Constant $
|
2018
|
2017
|
Change in
Occ % pts |
2018
|
2017
|
Better /
(Worse) |
Better (Worse) Constant $
|
|||||||||||||||||||||||||
|
ASPAC Full Service
|
$
|
153
|
|
$
|
144
|
|
6.7
|
%
|
4.5
|
%
|
75.0
|
%
|
72.6
|
%
|
2.4
|
%
|
$
|
205
|
|
$
|
198
|
|
3.2
|
%
|
1.1
|
%
|
||||||||||
|
ASPAC Select Service
|
$
|
62
|
|
$
|
55
|
|
12.9
|
%
|
7.5
|
%
|
72.3
|
%
|
71.2
|
%
|
1.1
|
%
|
$
|
86
|
|
$
|
78
|
|
11.2
|
%
|
5.9
|
%
|
||||||||||
Excluding the currency impacts, the increases in comparable full service RevPAR during the
three and nine
months ended
September 30, 2018
, compared to the same periods in 2017, were driven by increased occupancy across the segment, most notably in Greater China. Additionally, Japan experienced higher demand and ADR due to increased inbound travel. The increase during the three and nine months ended
September 30, 2018
was partially offset by decreases due to natural disasters in Southeast Asia and Japan and renovations at certain properties, as well as weak demand in South Korea during the nine months ended
September 30, 2018
.
During the three months ended
September 30, 2018
, no properties were removed from the comparable ASPAC full service system-wide hotel results. During the nine months ended
September 30, 2018
, we removed one property that left the chain from the comparable ASPAC full service system-wide hotel results and no properties were removed from the ASPAC select service system-wide hotel results.
57
ASPAC management and franchising segment Adjusted EBITDA.
|
Three Months Ended September 30,
|
||||||||||||||
|
2018
|
2017
|
Better / (Worse)
|
||||||||||||
|
Segment Adjusted EBITDA
|
$
|
19
|
|
$
|
17
|
|
$
|
2
|
|
15.9
|
%
|
|||
|
Nine Months Ended September 30,
|
||||||||||||||
|
2018
|
2017
|
Better / (Worse)
|
||||||||||||
|
Segment Adjusted EBITDA
|
$
|
55
|
|
$
|
48
|
|
$
|
7
|
|
15.1
|
%
|
|||
Adjusted EBITDA increased during the
three and nine
months ended
September 30, 2018
, compared to the
three and nine
months ended
September 30, 2017
, including a
$1 million
net unfavorable and a
$1 million
net favorable currency impact, respectively. The increases were driven by the aforementioned increases in management, franchise, and other fees, partially offset by increases in payroll and related costs primarily for development activity in Greater China.
EAME/SW Asia management and franchising segment revenues.
|
Three Months Ended September 30,
|
||||||||||||||
|
2018
|
2017
|
Better / (Worse)
|
||||||||||||
|
Segment revenues
|
||||||||||||||
|
Management, franchise, and other fees
|
$
|
21
|
|
$
|
17
|
|
$
|
4
|
|
17.0
|
%
|
|||
|
Contra revenue
|
(1
|
)
|
(1
|
)
|
—
|
|
(5.8
|
)%
|
||||||
|
Revenues for the reimbursement of costs incurred on behalf of managed and franchised properties
|
16
|
|
15
|
|
1
|
|
14.4
|
%
|
||||||
|
Total segment revenues
|
$
|
36
|
|
$
|
31
|
|
$
|
5
|
|
16.2
|
%
|
|||
|
Nine Months Ended September 30,
|
||||||||||||||
|
2018
|
2017
|
Better / (Worse)
|
||||||||||||
|
Segment revenues
|
||||||||||||||
|
Management, franchise, and other fees
|
$
|
58
|
|
$
|
49
|
|
$
|
9
|
|
18.6
|
%
|
|||
|
Contra revenue
|
(4
|
)
|
(3
|
)
|
(1
|
)
|
(8.5
|
)%
|
||||||
|
Revenues for the reimbursement of costs incurred on behalf of managed and franchised properties
|
49
|
|
41
|
|
8
|
|
19.5
|
%
|
||||||
|
Total segment revenues
|
$
|
103
|
|
$
|
87
|
|
$
|
16
|
|
19.5
|
%
|
|||
EAME/SW Asia management and franchising revenues included a
$1 million
net unfavorable and an insignificant net favorable currency impacts during the
three and nine
months ended
September 30, 2018
, respectively, compared to the same periods in 2017. The
increase
s in management, franchise, and other fees were driven primarily by improved performance in Europe and new hotels in the segment. The increases in Europe were largely attributable to hotels in Russia, which benefited from hosting the FIFA World Cup.
The
increase
s in revenues for the reimbursement of costs incurred on behalf of managed and franchised properties during the
three and nine
months ended
September 30, 2018
, compared to the same periods in 2017, were driven by the growth of our third-party owned full and select service portfolio and increased redemptions related to the loyalty program.
58
|
|
Three Months Ended September 30,
|
|||||||||||||||||||||||||||||||||||
|
|
RevPAR
|
Occupancy
|
ADR
|
|||||||||||||||||||||||||||||||||
|
(Comparable System-wide Hotels)
|
2018
|
2017
|
Better /
(Worse) |
Better / (Worse) Constant $
|
2018
|
2017
|
Change in
% pts |
2018
|
2017
|
Better /
(Worse) |
Better / (Worse) Constant $
|
|||||||||||||||||||||||||
|
EAME/SW Asia Full Service
|
$
|
127
|
|
$
|
120
|
|
6.4
|
%
|
11.0
|
%
|
67.8
|
%
|
64.2
|
%
|
3.6
|
%
|
$
|
188
|
|
$
|
187
|
|
0.7
|
%
|
5.0
|
%
|
||||||||||
|
EAME/SW Asia Select Service
|
$
|
74
|
|
$
|
73
|
|
1.2
|
%
|
2.8
|
%
|
83.2
|
%
|
80.3
|
%
|
2.9
|
%
|
$
|
89
|
|
$
|
91
|
|
(2.3
|
)%
|
(0.8
|
)%
|
||||||||||
|
|
Nine Months Ended September 30,
|
|||||||||||||||||||||||||||||||||||
|
|
RevPAR
|
Occupancy
|
ADR
|
|||||||||||||||||||||||||||||||||
|
(Comparable System-wide Hotels)
|
2018
|
2017
|
Better /
(Worse) |
Better / (Worse) Constant $
|
2018
|
2017
|
Change in
Occ % pts |
2018
|
2017
|
Better /
(Worse) |
Better / (Worse) Constant $
|
|||||||||||||||||||||||||
|
EAME/SW Asia Full Service
|
$
|
127
|
|
$
|
117
|
|
9.0
|
%
|
8.2
|
%
|
66.9
|
%
|
63.7
|
%
|
3.2
|
%
|
$
|
190
|
|
$
|
183
|
|
3.7
|
%
|
3.0
|
%
|
||||||||||
|
EAME/SW Asia Select Service
|
$
|
71
|
|
$
|
66
|
|
8.0
|
%
|
5.2
|
%
|
75.7
|
%
|
72.3
|
%
|
3.4
|
%
|
$
|
94
|
|
$
|
91
|
|
3.1
|
%
|
0.5
|
%
|
||||||||||
Excluding the currency impacts, the increases in RevPAR during the
three and nine
months ended
September 30, 2018
, compared to the same periods in 2017, were driven by Russia, Western Europe, Turkey, and India. In particular, Russia benefited from hosting the FIFA World Cup, and Western Europe benefited from higher transient demand. Turkey experienced improved market conditions, while the increases in India were driven by improved group performance.
During the three and nine months ended September 30, 2018, we removed one property that left the chain from the comparable EAME/SW Asia full service system-wide hotel results. During the nine months ended
September 30, 2018
, we removed one property from the comparable EAME/SW Asia select service system-wide hotel results as a result of significant renovations.
EAME/SW Asia management and franchising segment Adjusted EBITDA.
|
Three Months Ended September 30,
|
||||||||||||||
|
2018
|
2017
|
Better / (Worse)
|
||||||||||||
|
Segment Adjusted EBITDA
|
$
|
12
|
|
$
|
10
|
|
$
|
2
|
|
16.0
|
%
|
|||
|
Nine Months Ended September 30,
|
||||||||||||||
|
2018
|
2017
|
Better / (Worse)
|
||||||||||||
|
Segment Adjusted EBITDA
|
$
|
33
|
|
$
|
26
|
|
$
|
7
|
|
29.2
|
%
|
|||
Adjusted EBITDA
increase
d during the
three and nine
months ended
September 30, 2018
, compared to the
three and nine
months ended
September 30, 2017
, including a
$1 million
net unfavorable and an insignificant net favorable currency impact, respectively. The increases were driven by the aforementioned increases in management, franchise, and other fees.
59
Corporate and other.
|
|
Three Months Ended September 30,
|
|||||||||||||
|
2018
|
2017
|
Better / (Worse)
|
||||||||||||
|
Revenues
|
$
|
26
|
|
$
|
25
|
|
$
|
1
|
|
7.7
|
%
|
|||
|
Revenues for the reimbursement of costs incurred on behalf of managed and franchised properties
|
$
|
2
|
|
$
|
—
|
|
$
|
2
|
|
NM
|
|
|||
|
Adjusted EBITDA
|
$
|
(29
|
)
|
$
|
(33
|
)
|
$
|
4
|
|
14.6
|
%
|
|||
|
|
Nine Months Ended September 30,
|
|||||||||||||
|
2018
|
2017
|
Better / (Worse)
|
||||||||||||
|
Revenues
|
$
|
89
|
|
$
|
73
|
|
$
|
16
|
|
23.0
|
%
|
|||
|
Revenues for the reimbursement of costs incurred on behalf of managed and franchised properties
|
$
|
3
|
|
$
|
—
|
|
$
|
3
|
|
NM
|
|
|||
|
Adjusted EBITDA
|
$
|
(85
|
)
|
$
|
(90
|
)
|
$
|
5
|
|
6.8
|
%
|
|||
Corporate and other revenues increased during the
three and nine
months ended
September 30, 2018
, compared to the
three and nine
months ended
September 30, 2017
, driven primarily by the acquisition of exhale.
Corporate and other Adjusted EBITDA increased during the
three and nine
months ended
September 30, 2018
, compared to the
three and nine
months ended
September 30, 2017
, driven by decreased adjusted selling, general, and administrative expenses due to marketing initiatives completed during 2017, including master brand marketing expenses to support the launch of the World of Hyatt loyalty platform, as well as severance during 2017.
Non-GAAP Measures
Adjusted Earnings Before Interest Expense, Taxes, Depreciation, and Amortization ("Adjusted EBITDA") and EBITDA
We use the terms Adjusted EBITDA and EBITDA throughout this quarterly report. Adjusted EBITDA and EBITDA, as we define them, are non-GAAP measures. We define consolidated Adjusted EBITDA as net income attributable to Hyatt Hotels Corporation plus our pro rata share of unconsolidated hospitality ventures Adjusted EBITDA based on our ownership percentage of each venture, adjusted to exclude the following items:
|
•
|
interest expense;
|
|
•
|
provision for income taxes;
|
|
•
|
depreciation and amortization;
|
|
•
|
amortization of management and franchise agreement assets constituting payments to customers ("Contra revenue");
|
|
•
|
revenues for the reimbursement of costs incurred on behalf of managed and franchised properties;
|
|
•
|
costs incurred on behalf of managed and franchised properties;
|
|
•
|
equity earnings (losses) from unconsolidated hospitality ventures;
|
|
•
|
stock-based compensation expense;
|
|
•
|
gains (losses) on sales of real estate;
|
|
•
|
asset impairments; and
|
|
•
|
other income (loss), net
.
|
We calculate consolidated Adjusted EBITDA by adding the Adjusted EBITDA of each of our reportable segments and eliminations to corporate and other Adjusted EBITDA.
Our board of directors and executive management team focus on Adjusted EBITDA as a key performance and compensation measure both on a segment and on a consolidated basis. Adjusted EBITDA assists us in comparing
60
our performance over various reporting periods on a consistent basis because it removes from our operating results the impact of items that do not reflect our core operations both on a segment and on a consolidated basis. Our President and Chief Executive Officer, who is our chief operating decision maker, also evaluates the performance of each of our reportable segments and determines how to allocate resources to those segments, in significant part, by assessing the Adjusted EBITDA of each segment. In addition, the compensation committee of our board of directors determines the annual variable compensation for certain members of our management based in part on consolidated Adjusted EBITDA, segment Adjusted EBITDA, or some combination of both.
We believe Adjusted EBITDA is useful to investors because it provides investors the same information that we use internally for purposes of assessing our operating performance and making compensation decisions.
Adjusted EBITDA and EBITDA are not substitutes for net income attributable to Hyatt Hotels Corporation, net income, or any other measure prescribed by GAAP. There are limitations to using non-GAAP measures such as Adjusted EBITDA and EBITDA. Although we believe that Adjusted EBITDA can make an evaluation of our operating performance more consistent because it removes items that do not reflect our core operations, other companies in our industry may define Adjusted EBITDA differently than we do. As a result, it may be difficult to use Adjusted EBITDA or similarly named non-GAAP measures that other companies may use to compare the performance of those companies to our performance. Because of these limitations, Adjusted EBITDA should not be considered as a measure of the income generated by our business. Our management compensates for these limitations by reference to our GAAP results and using Adjusted EBITDA supplementally. See our condensed consolidated statements of income in our condensed consolidated financial statements included elsewhere in this quarterly report.
See below for a reconciliation of net income attributable to Hyatt Hotels Corporation to EBITDA and a reconciliation of EBITDA to consolidated Adjusted EBITDA.
Adjusted selling, general, and administrative expenses
Adjusted selling, general, and administrative expenses, as we define it, is a non-GAAP measure. Adjusted selling, general, and administrative expenses exclude the impact of expenses related to deferred compensation plans funded through rabbi trusts and stock-based compensation expense. Adjusted selling, general, and administrative expenses assist us in comparing our performance over various reporting periods on a consistent basis because it removes from our operating results the impact of items that do not reflect our core operations, both on a segment and consolidated basis. See "—Results of Operations" for a reconciliation of selling, general, and administrative expenses to Adjusted selling, general, and administrative expenses.
Constant dollar currency
We report the results of our operations both on an as-reported basis, as well as on a constant dollar basis. Constant dollar currency, which is a non-GAAP measure, excludes the effects of movements in foreign currency exchange rates between comparative periods. We believe constant dollar analysis provides valuable information regarding our results as it removes currency fluctuations from our operating results. We calculate constant dollar currency by restating prior-period local currency financial results at the current period’s exchange rates. These adjusted amounts are then compared to our current period reported amounts to provide operationally driven variances in our results.
61
The charts below illustrate Adjusted EBITDA by segment for the
three and nine months ended
September 30, 2018
and
September 30, 2017
:
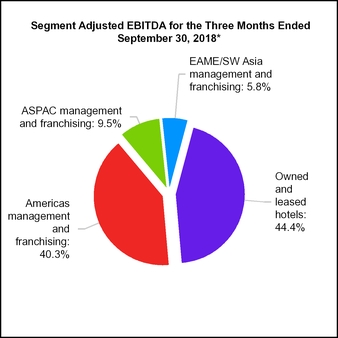
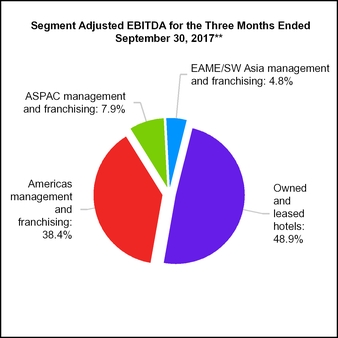
*Consolidated Adjusted EBITDA for the three months ended
September 30, 2018
included eliminations of
$(1) million
and corporate and other Adjusted EBITDA of
$(29) million
.
**Consolidated Adjusted EBITDA for the three months ended
September 30, 2017
included eliminations of
$(2) million
and corporate and other Adjusted EBITDA of
$(33) million
.
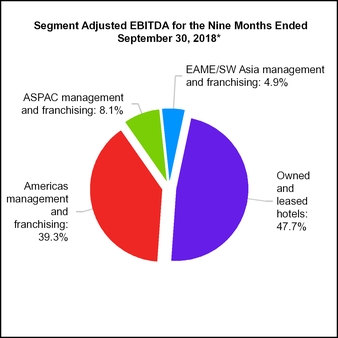
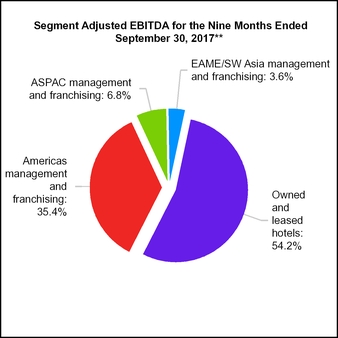
*Consolidated Adjusted EBITDA for the
nine
months ended
September 30, 2018
included eliminations of
$2 million
and corporate and other Adjusted EBITDA of
$(85) million
.
**Consolidated Adjusted EBITDA for the
nine
months ended
September 30, 2017
included eliminations of
$3 million
and corporate and other Adjusted EBITDA of
$(90) million
.
62
The table below provides a reconciliation of our net income attributable to Hyatt Hotels Corporation to EBITDA and a reconciliation of EBITDA to consolidated Adjusted EBITDA for the
three and nine months ended
September 30, 2018
and
September 30, 2017
:
|
Three Months Ended September 30,
|
||||||||||||||
|
2018
|
2017
|
Change
|
||||||||||||
|
Net income attributable to Hyatt Hotels Corporation
|
$
|
237
|
|
$
|
18
|
|
$
|
219
|
|
NM
|
|
|||
|
Interest expense
|
19
|
|
20
|
|
(1
|
)
|
(3.2
|
)%
|
||||||
|
Provision for income taxes
|
19
|
|
16
|
|
3
|
|
28.9
|
%
|
||||||
|
Depreciation and amortization
|
81
|
|
88
|
|
(7
|
)
|
(8.1
|
)%
|
||||||
|
EBITDA
|
356
|
|
142
|
|
214
|
|
151.9
|
%
|
||||||
|
Contra revenue
|
5
|
|
4
|
|
1
|
|
8.6
|
%
|
||||||
|
Revenues for the reimbursement of costs incurred on behalf of managed and franchised properties
|
(489
|
)
|
(429
|
)
|
(60
|
)
|
(14.1
|
)%
|
||||||
|
Costs incurred on behalf of managed and franchised properties
|
487
|
|
425
|
|
62
|
|
14.9
|
%
|
||||||
|
Equity (earnings) losses from unconsolidated hospitality ventures
|
6
|
|
(1
|
)
|
7
|
|
909.6
|
%
|
||||||
|
Stock-based compensation expense
|
5
|
|
5
|
|
—
|
|
(4.3
|
)%
|
||||||
|
Gains on sales of real estate
|
(239
|
)
|
—
|
|
(239
|
)
|
NM
|
|
||||||
|
Asset impairments
|
21
|
|
—
|
|
21
|
|
NM
|
|
||||||
|
Other (income) loss, net
|
9
|
|
16
|
|
(7
|
)
|
(42.6
|
)%
|
||||||
|
Pro rata share of unconsolidated hospitality ventures Adjusted EBITDA
|
14
|
|
15
|
|
(1
|
)
|
(3.8
|
)%
|
||||||
|
Adjusted EBITDA
|
$
|
175
|
|
$
|
177
|
|
$
|
(2
|
)
|
(0.9
|
)%
|
|||
|
Nine Months Ended September 30,
|
||||||||||||||
|
2018
|
2017
|
Change
|
||||||||||||
|
Net income attributable to Hyatt Hotels Corporation
|
$
|
725
|
|
$
|
176
|
|
$
|
549
|
|
312.0
|
%
|
|||
|
Interest expense
|
57
|
|
61
|
|
(4
|
)
|
(5.6
|
)%
|
||||||
|
Provision for income taxes
|
194
|
|
103
|
|
91
|
|
89.7
|
%
|
||||||
|
Depreciation and amortization
|
243
|
|
261
|
|
(18
|
)
|
(7.1
|
)%
|
||||||
|
EBITDA
|
1,219
|
|
601
|
|
618
|
|
103.1
|
%
|
||||||
|
Contra revenue
|
15
|
|
13
|
|
2
|
|
13.0
|
%
|
||||||
|
Revenues for the reimbursement of costs incurred on behalf of managed and franchised properties
|
(1,447
|
)
|
(1,302
|
)
|
(145
|
)
|
(11.2
|
)%
|
||||||
|
Costs incurred on behalf of managed and franchised properties
|
1,447
|
|
1,313
|
|
134
|
|
10.3
|
%
|
||||||
|
Equity (earnings) losses from unconsolidated hospitality ventures
|
17
|
|
1
|
|
16
|
|
NM
|
|
||||||
|
Stock-based compensation expense
|
28
|
|
26
|
|
2
|
|
8.6
|
%
|
||||||
|
Gains on sales of real estate
|
(769
|
)
|
(60
|
)
|
(709
|
)
|
NM
|
|
||||||
|
Asset impairments
|
21
|
|
—
|
|
21
|
|
NM
|
|
||||||
|
Other (income) loss, net
|
22
|
|
(32
|
)
|
54
|
|
169.2
|
%
|
||||||
|
Pro rata share of unconsolidated hospitality ventures Adjusted EBITDA
|
42
|
|
59
|
|
(17
|
)
|
(28.6
|
)%
|
||||||
|
Adjusted EBITDA
|
$
|
595
|
|
$
|
619
|
|
$
|
(24
|
)
|
(3.8
|
)%
|
|||
63
Liquidity and Capital Resources
Overview
We finance our business primarily with existing cash, short-term investments, and cash generated from our operations. As part of our business strategy, we also recycle capital by using net proceeds from dispositions to support our acquisitions and new investment opportunities. When appropriate, we borrow cash under our revolving credit facility or from other third-party sources and may also raise funds by issuing debt or equity securities as necessary. We maintain a cash investment policy that emphasizes preservation of capital. We believe that our cash position, short-term investments, and cash from operations, together with borrowing capacity under our revolving credit facility and our access to the capital markets, will be adequate to meet all of our funding requirements and capital deployment objectives for the foreseeable future.
We may, from time to time, seek to retire or purchase additional amounts of our outstanding equity and/or debt securities through cash purchases and/or exchanges for other securities, in open market purchases, privately negotiated transactions, or otherwise, including pursuant to a Rule 10b5-1 plan or an accelerated share repurchase transaction. Such repurchases or exchanges, if any, will depend on prevailing market conditions, our liquidity requirements, contractual restrictions, and other factors. The amounts involved may be material.
Recent Transactions Affecting our Liquidity and Capital Resources
During the
nine
months ended
September 30, 2018
and
September 30, 2017
, various transactions impacted our liquidity. See "—Sources and Uses of Cash."
Sources and Uses of Cash
|
Nine Months Ended September 30,
|
|||||||
|
2018
|
2017
|
||||||
|
Cash provided by (used in):
|
|||||||
|
Operating activities
|
$
|
132
|
|
$
|
428
|
|
|
|
Investing activities
|
712
|
|
(54
|
)
|
|||
|
Financing activities
|
(543
|
)
|
(324
|
)
|
|||
|
Effect of exchange rate changes on cash
|
3
|
|
—
|
|
|||
|
Net increase in cash, cash equivalents, and restricted cash
|
$
|
304
|
|
$
|
50
|
|
|
Cash Flows from Operating Activities
Cash provided by operating activities decreased by $
296 million
for the
nine months ended
September 30, 2018
, compared to the
nine months ended
September 30, 2017
, primarily due to higher tax payments in the current year driven by certain transactions in 2018 and 2017 and
$94 million
of interest income received upon the redemption of our Playa preferred shares in the prior year.
Cash Flows from Investing Activities
During the
nine
months ended
September 30, 2018
:
|
•
|
We sold Grand Hyatt San Francisco, Andaz Maui at Wailea Resort, and Hyatt Regency Coconut Point Resort and Spa to an unrelated third party as a portfolio for approximately
$992 million
, net of closing costs and proration adjustments. Proceeds from the sale of Hyatt Regency Coconut Point Resort and Spa of
$221 million
were held as restricted for use in a potential like-kind exchange, of which approximately $198 million were subsequently used for acquisitions and the remaining
$23 million
were released.
|
|
•
|
We received $360 million of proceeds from the HRMC transaction.
|
|
•
|
We received $
17 million
of proceeds from sales activity related to certain equity method investments.
|
|
•
|
We invested
$195 million
in capital expenditures (see "—Capital Expenditures").
|
|
•
|
We had $146 million of net purchases of marketable securities and short-term investments.
|
|
•
|
We acquired Hyatt Regency Phoenix for a purchase price of approximately
$139 million
, net of proration adjustments.
|
64
|
•
|
We acquired Hyatt Regency Indian Wells Resort & Spa for a net purchase price of approximately $120 million.
|
During the
nine
months ended
September 30, 2017
:
|
•
|
We acquired Miraval for approximately $237 million.
|
|
•
|
We invested
$212 million
in capital expenditures (see "—Capital Expenditures").
|
|
•
|
We contributed $67 million in investments and HTM debt securities.
|
|
•
|
We acquired exhale for $16 million, net of $1 million cash acquired.
|
|
•
|
We sold Hyatt Regency Grand Cypress for approximately $202 million of net cash proceeds.
|
|
•
|
We received $196 million of distributions related to the redemption of our Playa preferred shares.
|
|
•
|
We sold Hyatt Regency Louisville for approximately $65 million of net cash proceeds.
|
|
•
|
We sold land and construction in progress for $29 million to an unconsolidated hospitality venture, in which we have a 50% ownership interest.
|
Cash Flows from Financing Activities
During the
nine
months ended
September 30, 2018
:
|
•
|
We repurchased
8,560,012
shares of common stock at a weighted-average price of
$78.42
for $654 million. Of the shares repurchased,
2,481,341
were delivered in settlement of the May 2018 ASR and 244,260 were delivered in the settlement of the November 2017 ASR in 2018, for which payment was made during 2017.
|
|
•
|
We repaid our outstanding 2019 Notes for approximately $203 million, inclusive of a $7 million make-whole premium.
|
|
•
|
We paid three quarterly cash dividends of $0.15 per share on Class A common stock and Class B common stock totaling $52 million.
|
|
•
|
We had
$20 million
of borrowings and repayments on our revolving credit facility.
|
|
•
|
We redeemed the Miraval preferred shares for approximately
$10 million
.
|
|
•
|
We issued our 2028 Notes and received $396 million of net proceeds, after deducting approximately $4 million of underwriting discounts and offering expenses.
|
During the
nine
months ended
September 30, 2017
:
|
•
|
We repurchased
9,492,729
shares of common stock at a weighted-average price of
$56.37
for an aggregate purchase price of
$535 million
. Included in the repurchases were 6,795,456 shares repurchased under the 2017 ASR Agreements for an aggregate purchase price of $380 million. At September 30, 2017, the remaining $20 million of shares under the August 2017 ASR had not yet settled.
|
|
•
|
We had $620 million of borrowings and $380 million of repayments on our revolving credit facility.
|
|
•
|
In conjunction with the acquisition of Miraval, we issued
$9 million
of redeemable preferred shares of a subsidiary.
|
65
We define net debt as total debt less the total of cash and cash equivalents and short-term investments. We consider net debt and its components to be an important indicator of liquidity and a guiding measure of capital structure strategy. Net debt is a non-GAAP measure and may not be computed the same as similarly titled measures used by other companies. The following table provides a summary of our debt to capital ratios:
|
September 30, 2018
|
December 31, 2017
|
||||||
|
Consolidated debt (1)
|
$
|
1,633
|
|
$
|
1,451
|
|
|
|
Stockholders’ equity
|
3,929
|
|
3,837
|
|
|||
|
Total capital
|
5,562
|
|
5,288
|
|
|||
|
Total debt to total capital
|
29.4
|
%
|
27.4
|
%
|
|||
|
Consolidated debt (1)
|
1,633
|
|
1,451
|
|
|||
|
Less: cash and cash equivalents and short-term investments
|
(1,231
|
)
|
(552
|
)
|
|||
|
Net consolidated debt
|
$
|
402
|
|
$
|
899
|
|
|
|
Net debt to total capital
|
7.2
|
%
|
17.0
|
%
|
|||
(1) Excludes approximately $554 million and $580 million of our share of unconsolidated hospitality venture indebtedness at
September 30, 2018
and
December 31, 2017
, respectively, substantially all of which is non-recourse to us and a portion of which we guarantee pursuant to separate agreements.
Capital Expenditures
We routinely make capital expenditures to enhance our business. We classify our capital expenditures into maintenance and technology, enhancements to existing properties, and investment in new properties under development or recently opened. We have been and will continue to be prudent with respect to our capital spending, taking into account our cash flow from operations.
|
Nine Months Ended September 30,
|
|||||||
|
2018
|
2017
|
||||||
|
Maintenance and technology
|
$
|
47
|
|
$
|
54
|
|
|
|
Enhancements to existing properties
|
97
|
|
117
|
|
|||
|
Investment in new properties under development or recently opened
|
51
|
|
41
|
|
|||
|
Total capital expenditures
|
$
|
195
|
|
$
|
212
|
|
|
The decrease in enhancements to existing properties is driven by prior year expenditures related to our new corporate office.
Senior Notes
The table below sets forth the outstanding principal balance of our Senior Notes at
September 30, 2018
. Interest on the Senior Notes is payable semi-annually.
|
Description
|
Principal Amount
|
||
|
2021 Notes
|
$
|
250
|
|
|
2023 Notes
|
350
|
|
|
|
2026 Notes
|
400
|
|
|
|
2028 Notes
|
400
|
|
|
|
Total
|
$
|
1,400
|
|
We are in compliance with all applicable covenants under the indenture governing our Senior Notes at
September 30, 2018
.
Revolving Credit Facility
We had no outstanding balance on our revolving credit facility at
September 30, 2018
and
December 31, 2017
. At
September 30, 2018
, we had available borrowing capacity of approximately
$1.5 billion
, net of outstanding undrawn letters of credit.
We are in compliance with all applicable covenants under the revolving credit facility at
September 30, 2018
.
66
Letters of Credit
We issue letters of credit either under the revolving credit facility or directly with financial institutions. We had
$297 million
and
$309 million
in letters of credit issued directly with financial institutions outstanding at
September 30, 2018
and
December 31, 2017
, respectively. These letters of credit had weighted-average fees of
92
basis points and a range of maturity of up to approximately three years at
September 30, 2018
.
Critical Accounting Policies and Estimates
The preparation of financial statements in accordance with GAAP requires management to make estimates and assumptions that affect reported amounts and related disclosures. We have discussed those estimates that we believe are critical and require the use of complex judgment in their application in our
2017
Form
10-K
. Upon adoption of ASU 2014-09, we made changes to a critical accounting estimate and the methodologies or assumptions we apply to the estimate, as detailed below. For updates made to significant accounting policies upon adoption of ASU 2014-09 and ASU 2016-01, see Part I, Item 1, "Financial Statements—Note 2 to our Consolidated Financial Statements."
Loyalty Program Future Redemption Obligation and Revenue Recognition
We utilize an actuary to assist with the valuation of the deferred revenue liability related to the loyalty program. Changes in the estimates, including the estimate of the breakage for points that will not be redeemed, could result in a material change to our liability and the amount of revenue we recognize when redemptions occur.
At
September 30, 2018
, our total deferred revenue liability related to the loyalty program was
$584 million
. A 10% decrease in the breakage assumption would result in an increase in the liability of approximately
$30 million
on a full-year basis.
67
Item 3.
Quantitative and Qualitative Disclosures About Market Risk.
We are exposed to market risk primarily from changes in interest rates and foreign currency exchange rates. In certain situations, we seek to reduce earnings and cash flow volatility associated with changes in interest rates and foreign currency exchange rates by entering into financial arrangements to provide a hedge against a portion of the risks associated with such volatility. We continue to have exposure to such risks to the extent they are not hedged. We enter into derivative financial arrangements to the extent they meet the objectives described above, and we do not use derivatives for trading or speculative purposes. At
September 30, 2018
, we were a party to hedging transactions, including the use of derivative financial instruments, as discussed below.
Interest Rate Risk
In the normal course of business, we are exposed to the impact of interest rate changes due to our borrowing activities. Our objective is to manage the risk of interest rate changes on the results of operations, cash flows, and the market value of our debt by creating an appropriate balance between our fixed and
floating-
rate debt. We enter into interest rate derivative transactions from time to time, including interest rate swaps and interest rate locks, in order to maintain a level of exposure to interest rate variability that we deem acceptable.
During the
nine months ended
September 30, 2018
, we entered into
two
interest rate locks with a
$425 million
total notional value to hedge a portion of the risk of changes in the benchmark interest rate associated with long-term debt we anticipate issuing in the future. During the
three months ended
September 30, 2018
, we settled one of the interest rate locks with a $225 million notional value at the date of the issuance of the 2028 Notes. The outstanding interest rate lock with a
$200 million
notional value remains highly effective at
September 30, 2018
. See Part I, Item 1 "Financial Statements—Note 9 to the Condensed Consolidated Financial Statements." At
September 30, 2018
and
December 31, 2017
, we did not hold any interest rate swap contracts.
The following table sets forth the contractual maturities and the total fair values at
September 30, 2018
for our financial instruments materially affected by interest rate risk:
|
Maturities by Period
|
|||||||||||||||||||||||||||||||
|
2018
|
2019
|
2020
|
2021
|
2022
|
Thereafter
|
Total Carrying Amount
(1)
|
Total Fair Value
|
||||||||||||||||||||||||
|
Fixed-rate debt
|
$
|
1
|
|
$
|
4
|
|
$
|
4
|
|
$
|
255
|
|
$
|
5
|
|
$
|
1,313
|
|
$
|
1,582
|
|
$
|
1,591
|
|
|||||||
|
Average interest rate (2)
|
4.51
|
%
|
|||||||||||||||||||||||||||||
|
Floating-rate debt
|
$
|
1
|
|
$
|
5
|
|
$
|
5
|
|
$
|
5
|
|
$
|
5
|
|
$
|
33
|
|
$
|
54
|
|
$
|
65
|
|
|||||||
|
Average interest rate (2)
|
7.94
|
%
|
|||||||||||||||||||||||||||||
(1) Excludes
$13 million
of capital lease obligations and
$16 million
of unamortized discounts and deferred financing fees.
(2) Average interest rate at
September 30, 2018
.
Foreign Currency Exposures and Exchange Rate Instruments
We transact business in various foreign currencies and utilize foreign currency forward contracts to offset our exposure associated with the fluctuations of certain foreign currencies. The U.S. dollar equivalents of the notional amounts of the outstanding forward contracts, the majority of which relate to intercompany transactions, with terms of less than one year, were
$215 million
and
$254 million
at
September 30, 2018
and
December 31, 2017
, respectively.
We intend to offset the gains and losses related to our third-party debt, debt repayment guarantees, and intercompany transactions with gains or losses on our foreign currency forward contracts such that there is a negligible effect on net income. Our exposure to market risk has not materially changed from what we previously disclosed in our 2017 Form 10-K.
For the
three and nine months ended
September 30, 2018
, the effect of these derivative instruments within other income (loss), net on our condensed consolidated statements of income were gains of
$3 million
and
$11 million
, respectively. For the
three and nine months ended
September 30, 2017
, the effect of these derivative instruments within other income (loss), net on our condensed consolidated statements of income were losses of
$5 million
and
$13 million
, respectively. We offset the gains and losses on our foreign currency forward contracts with
68
gains and losses related to our intercompany loans and transactions, such that there is a negligible effect to net income.
69
Item 4.
Controls and Procedures.
Disclosure Controls and Procedures.
We maintain a set of disclosure controls and procedures designed to ensure that information required to be disclosed by the Company in reports that it files or submits under the Securities Exchange Act of 1934, as amended (the "Exchange Act"), is recorded, processed, summarized, and reported within the time periods specified in SEC rules and forms. In accordance with Rule 13a-15(b) of the Exchange Act, as of the end of the period covered by this quarterly report, an evaluation was carried out under the supervision and with the participation of our management, including our Principal Executive Officer and Principal Financial Officer, of the effectiveness of our disclosure controls and procedures. Based on that evaluation, our Principal Executive Officer and Principal Financial Officer concluded that our disclosure controls and procedures, as of the end of the period covered by this quarterly report, were effective to provide reasonable assurance that information required to be disclosed by the Company in reports that it files or submits under the Exchange Act is recorded, processed, summarized, and reported within the time periods specified in SEC rules and forms and is accumulated and communicated to our management, including the Principal Executive Officer and Principal Financial Officer, as appropriate to allow timely decisions regarding required disclosure.
Changes in Internal Control Over Financial Reporting.
There were no changes in our internal control over financial reporting during the quarter ended September 30, 2018 that have materially affected, or are reasonably likely to materially affect, our internal control over financial reporting. We implemented internal controls to ensure we adequately evaluated our contracts and properly assessed the impact of the new accounting standards related to revenue recognition on our financial statements to facilitate the adoption on January 1, 2018. There were no significant changes to our internal control over financial reporting due to the adoption of the new standards.
70
Item 1.
Legal Proceedings.
We are involved in various claims and lawsuits arising in the normal course of business, including proceedings involving tort and other general liability claims, workers' compensation and other employee claims, intellectual property claims, and claims related to our management of certain hotel properties. Most occurrences involving liability, claims of negligence, and employees are covered by insurance, in each case, with solvent insurance carriers. We recognize a liability when we believe the loss is probable and reasonably estimable. We currently believe that the ultimate outcome of such lawsuits and proceedings will not, individually or in the aggregate, have a material effect on our consolidated financial position, results of operations, or liquidity.
In March 2018, a putative class action was filed against the Company and several other hotel companies in federal district court in Illinois seeking an unspecified amount of damages and equitable relief for an alleged violation of the federal antitrust laws. The Company disputes the allegations and will defend its interests vigorously. We currently do not believe the ultimate outcome of this litigation will have a material effect on our consolidated financial position, results of operation, or liquidity.
Item 1A.
Risk Factors.
At
September 30, 2018
, there have been no material changes from the risk factors previously disclosed in response to Item 1A. to Part I of our Annual Report on Form 10-K for the fiscal year ended
December 31, 2017
.
Item 2.
Unregistered Sales of Equity Securities and Use of Proceeds.
Issuer Purchases of Equity Securities
The following table sets forth information regarding our purchases of shares of Class A common stock during the quarter ended
September 30, 2018
:
|
Total number
of shares
purchased (1)
|
Weighted average
price paid
per share
|
Total number of
shares purchased
as part of publicly
announced plans
|
Maximum number (or approximate dollar value) of shares that may yet be purchased under the program
|
|||||||||||
|
July 1 to July 31, 2018
|
262,358
|
|
$
|
79.86
|
|
262,358
|
|
$
|
254,814,959
|
|
||||
|
August 1 to August 31, 2018
|
286,176
|
|
$
|
77.96
|
|
286,176
|
|
$
|
232,503,749
|
|
||||
|
September 1 to September 30, 2018
|
295,684
|
|
$
|
76.96
|
|
295,684
|
|
$
|
209,747,155
|
|
||||
|
Total
|
844,218
|
|
$
|
78.20
|
|
844,218
|
|
|||||||
|
(1)
|
On December 14, 2017, we announced the approval of the expansion of our share repurchase program pursuant to which we are authorized to purchase up to an additional $750 million of Class A and Class B common stock in the open market, in privately negotiated transactions, or otherwise, including pursuant to a Rule 10b5-1 plan or an accelerated share repurchase transaction. The repurchase program does not have an expiration date. At
September 30, 2018
, we had approximately
$210
million remaining under the share repurchase authorization. On October 30, 2018, we announced the approval of the expansion of our share repurchase program up to an additional $750 million.
|
71
Item 3.
Defaults Upon Senior Securities.
None.
Item 4.
Mine Safety Disclosures.
Not Applicable.
Item 5.
Other Information.
On October 30, 2018, we filed a Certificate of Retirement with the Secretary of State of the State of Delaware to retire 950,161 shares of Class B common stock, $0.01 par value per share, of the Company (the "Class B common stock"). All 950,161 shares of Class B common stock were converted into shares of Class A common stock. The Company's Amended and Restated Certificate of Incorporation requires that any shares of Class B common stock that are converted into shares of Class A common stock be retired and may not be reissued.
Effective upon filing, the Certificate of Retirement amended the Amended and Restated Certificate of Incorporation of the Company to reduce the total authorized number of shares of capital stock of the Company by 950,161 shares. The total number of authorized shares of the Company is now 1,409,113,894, such shares consisting of 1,000,000,000 shares designated Class A common stock, 399,113,894 shares designated Class B common stock, and 10,000,000 shares designated Preferred Stock, par value $0.01 per share. A copy of the Certificate of Retirement is attached as Exhibit 3.1 hereto.
72
Item 6.
Exhibits.
|
Exhibit Number
|
Exhibit Description
|
|
2.1*
|
|
|
3.1
|
|
|
3.2
|
|
|
4.1
|
|
|
4.2
|
|
|
+10.1
|
|
|
+10.2
|
|
|
+10.3
|
|
|
31.1
|
|
|
31.2
|
|
|
32.1
|
|
|
32.2
|
|
|
101.INS
|
XBRL Instance Document
|
|
101.SCH
|
XBRL Taxonomy Extension Schema Document
|
|
101.CAL
|
XBRL Taxonomy Extension Calculation Linkbase Document
|
|
101.DEF
|
XBRL Taxonomy Extension Definition Linkbase Document
|
|
101.LAB
|
XBRL Taxonomy Extension Label Linkbase Document
|
|
101.PRE
|
XBRL Taxonomy Extension Presentation Linkbase Document
|
|
* Schedules and exhibits have been omitted pursuant to Item 601(b)(2) of Regulation S-K. The Company hereby agrees to furnish supplementary copies of any of the omitted schedules and exhibits upon request by the Securities and Exchange Commission; provided, however, that the Company may request confidential treatment pursuant to Rule 24b-2 of the Securities Exchange Act of 1934, as amended, for any schedule or exhibit so furnished.
|
|
73
SIGNATURES
Pursuant to the requirements of the Securities Exchange Act of 1934, the registrant has duly caused this report to be signed on its behalf by the undersigned thereunto duly authorized.
|
|
Hyatt Hotels Corporation
|
||
|
Date:
|
October 31, 2018
|
By:
|
/s/ Mark S. Hoplamazian
|
|
Mark S. Hoplamazian
|
|||
|
President and Chief Executive Officer
|
|||
|
(Principal Executive Officer)
|
|||
Pursuant to the requirements of the Securities Exchange Act of 1934, this report has been signed by the undersigned, in his capacity as the principal financial officer of the registrant.
|
|
Hyatt Hotels Corporation
|
||
|
Date:
|
October 31, 2018
|
By:
|
/s/ Patrick J. Grismer
|
|
Patrick J. Grismer
|
|||
|
Executive Vice President, Chief Financial Officer
|
|||
|
(Principal Financial Officer)
|
|||
74
TABLE OF CONTENTS
Part I. Financial InformationItem 1. Financial StatementsItem 2. Management's Discussion and Analysis Of Financial Condition and Results Of OperationsItem 3. Quantitative and Qualitative Disclosures About Market RiskItem 4. Controls and ProceduresPart II. Other InformationItem 1. Legal ProceedingsItem 1A. Risk FactorsItem 2. Unregistered Sales Of Equity Securities and Use Of ProceedsItem 3. Defaults Upon Senior SecuritiesItem 4. Mine Safety DisclosuresItem 5. Other Information