HALLIBURTON CO
10-Ks and 10-Qs
|
|
|
|
|
|
|
|
|
|
|
|
|
|
|
|
|
|
|
|
|
|
|
|
|
|
|
|
|
|
|
|
|
|
|
|
|
|
|
|
|
|
|
|
|
|
|
|
|
|
|
|
|
|
|
|
UNITED STATES SECURITIES AND EXCHANGE COMMISSION
Washington, D.C. 20549
FORM 10-K
(Mark One)
[X] Annual Report Pursuant to Section 13 or 15(d) of the Securities Exchange Act of 1934
For the fiscal year ended
December 31, 2015
OR
[ ] Transition Report Pursuant to Section 13 or 15(d) of the Securities Exchange Act of 1934
For the transition period from ______ to ______
Commission File Number 001-03492
HALLIBURTON COMPANY
(Exact name of registrant as specified in its charter)
|
Delaware
|
75-2677995
|
|
(State or other jurisdiction of
|
(I.R.S. Employer
|
|
incorporation or organization)
|
Identification No.)
|
|
3000 North Sam Houston Parkway East
|
|
|
Houston, Texas 77032
|
|
|
(Address of principal executive offices)
|
|
|
Telephone Number – Area code (281) 871-2699
|
|
|
Securities registered pursuant to Section 12(b) of the Act:
|
|
|
Name of each exchange on
|
|
|
Title of each class
|
which registered
|
|
Common Stock par value $2.50 per share
|
New York Stock Exchange
|
|
Securities registered pursuant to Section 12(g) of the Act: None
|
|
Indicate by check mark if the registrant is a well-known seasoned issuer, as defined in Rule 405 of the Securities Act.
Yes [X] No [ ]
Indicate by check mark if the registrant is not required to file reports pursuant to Section 13 or Section 15(d) of the Act.
Yes [ ] No [X]
Indicate by check mark whether the registrant (1) has filed all reports required to be filed by Section 13 or 15(d) of the Securities Exchange Act of 1934 during the preceding 12 months (or for such shorter period that the registrant was required to file such reports), and (2) has been subject to such filing requirements for the past 90 days.
Yes [X] No [ ]
Indicate by check mark whether the registrant has submitted electronically and posted on its corporate Web site, if any, every Interactive Data File required to be submitted and posted pursuant to Rule 405 of Regulation S-T (§ 232.405 of this chapter) during the preceding 12 months (or for such shorter period that the registrant was required to submit and post such files).
Yes [X] No [ ]
Indicate by check mark if disclosure of delinquent filers pursuant to Item 405 of Regulation S-K (§229.405 of this chapter) is not contained herein, and will not be contained, to the best of registrant’s knowledge, in definitive proxy or information statements incorporated by reference in Part III of this Form 10-K or any amendment to this Form 10-K. [X]
Indicate by check mark whether the registrant is a large accelerated filer, an accelerated filer, a non-accelerated filer, or a smaller reporting company. See the definitions of “large accelerated filer,” “accelerated filer,” and “smaller reporting company” in Rule 12b-2 of the Exchange Act.
Large accelerated filer [X] Accelerated filer [ ]
Non-accelerated filer [ ] Smaller reporting company [ ]
Indicate by check mark whether the registrant is a shell company (as defined in Rule 12b-2 of the Exchange Act). Yes [ ] No [X]
The aggregate market value of Halliburton Company Common Stock held by nonaffiliates on
June 30, 2015
, determined using the per share closing price on the New York Stock Exchange Composite tape of $43.07 on that date, was approximately
$36.7 billion
.
As of
January 29, 2016
, there were
858,342,017
shares of Halliburton Company Common Stock,
$2.50
par value per share, outstanding.
Portions of the Halliburton Company Proxy Statement for our
2016
Annual Meeting of Stockholders (File No. 001-03492) are incorporated by reference into Part III of this report.
HALLIBURTON COMPANY
Index to Form 10-K
For the Year Ended
December 31, 2015
|
PAGE
|
||
i
Item 1.
Business
.
General description of business
Halliburton Company’s predecessor was established in 1919 and incorporated under the laws of the State of Delaware in 1924. We are a leading provider of services and products to the upstream oil and natural gas industry throughout the lifecycle of the reservoir, from locating hydrocarbons and managing geological data, to drilling and formation evaluation, well construction and completion, and optimizing production throughout the life of the field. We serve major, national, and independent oil and natural gas companies throughout the world and operate under
two
divisions, which form the basis for the
two
operating segments we report, the Completion and Production segment and the Drilling and Evaluation segment:
|
-
|
our Completion and Production segment delivers cementing, stimulation, intervention, pressure control, specialty chemicals, artificial lift, and completion products and services. The segment consists of Production Enhancement, Cementing, Completion Tools, Production Solutions, Pipeline and Process Services, Multi-Chem, and Artificial Lift.
|
|
-
|
our Drilling and Evaluation segment provides field and reservoir modeling, drilling, evaluation, and precise wellbore placement solutions that enable customers to model, measure, drill, and optimize their well construction activities. The segment consists of Baroid, Sperry Drilling, Wireline and Perforating, Drill Bits and Services, Landmark Software and Services, Testing and Subsea, and Consulting and Project Management.
|
See
Note 4
to the consolidated financial statements for further financial information related to each of our business segments and a description of the services and products provided by each segment. We have significant manufacturing operations in various locations, including the United States, Canada, China, Malaysia, Singapore, and the United Kingdom.
Pending Acquisition of Baker Hughes
In November 2014, we and Baker Hughes Incorporated (Baker Hughes) entered into a merger agreement under which, subject to the conditions set forth in the merger agreement, we will acquire all the outstanding shares of Baker Hughes in a stock and cash transaction. Baker Hughes is a leading supplier of oilfield services, products, technology and systems to the worldwide oil and natural gas industry. We are continuing our discussions with competition authorities to obtain approval of the acquisition and recently offered an enhanced set of divestitures in an effort to resolve competition-related concerns. We have agreed with Baker Hughes to extend the period to obtain required regulatory approvals to no later than April 30, 2016, and remain focused on completing the transaction as early as possible in 2016. See
Note 2
to the consolidated financial statements for further information about the pending acquisition and Item 1(a). “Risk Factors” for risks associated with the pending acquisition.
Business strategy
Our business strategy is to secure a distinct and sustainable competitive position as an oilfield service company by delivering services and products that enable our customers to extract proven reserves and maximize recovery. Our objectives are to:
|
-
|
create a balanced portfolio of services and products supported by global infrastructure and anchored by technological innovation to further differentiate our company;
|
|
-
|
reach a distinguished level of operational excellence that reduces costs and creates real value;
|
|
-
|
preserve a dynamic workforce by being a preferred employer to attract, develop, and retain the best global talent; and
|
|
-
|
uphold our strong ethical and business standards, and maintain the highest standards of health, safety, and environmental performance.
|
Markets and competition
We are one of the world’s largest diversified energy services companies. Our services and products are sold in highly competitive markets throughout the world. Competitive factors impacting sales of our services and products include:
|
-
|
price;
|
- service delivery (including the ability to deliver services and products on an “as needed, where needed” basis);
|
-
|
health, safety, and environmental standards and practices;
|
|
-
|
service quality;
|
|
-
|
global talent retention;
|
|
-
|
understanding the geological characteristics of the hydrocarbon reservoir;
|
|
-
|
product quality;
|
|
-
|
warranty; and
|
|
-
|
technical proficiency.
|
We conduct business worldwide in approximately
80
countries. The business operations of our divisions are organized around four primary geographic regions: North America, Latin America, Europe/Africa/CIS, and Middle East/Asia. In
2015
,
2014
, and
2013
, based on the location of services provided and products sold,
44%
,
51%
, and
49%
of our consolidated revenue was from the United States. No other country accounted for more than 10% of our consolidated revenue during these periods.
1
See “Management’s Discussion and Analysis of Financial Condition and Results of Operations – Business Environment and Results of Operations” and
Note 4
to the consolidated financial statements for additional financial information about our geographic operations in the last three years. Because the markets for our services and products are vast and cross numerous geographic lines, it is not practicable to provide a meaningful estimate of the total number of our competitors. The industries we serve are highly competitive, and we have many substantial competitors. Most of our services and products are marketed through our servicing and sales organizations.
Operations in some countries may be adversely affected by unsettled political conditions, acts of terrorism, civil unrest, expropriation or other governmental actions, changes in foreign currency exchange rates, foreign currency exchange restrictions, and highly inflationary currencies, as well as other geopolitical factors. We believe the geographic diversification of our business activities reduces the risk that loss of operations in any one country, other than the United States, would significantly impact the conduct of our operations taken as a whole.
Information regarding our exposure to foreign currency fluctuations, risk concentration, and financial instruments used to minimize risk is included in “Management’s Discussion and Analysis of Financial Condition and Results of Operations – Financial Instrument Market Risk” and in
Note 14
to the consolidated financial statements.
Customers
Our revenue from continuing operations during the past three years was derived from the sale of services and products to the energy industry. No customer represented more than 10% of our consolidated revenue in any period presented.
Raw materials
Raw materials essential to our business are normally readily available. Market conditions can trigger constraints in the supply of certain raw materials, such as proppants, hydrochloric acid, and gels, including guar gum (a blending additive used in our hydraulic fracturing process). We are always seeking ways to ensure the availability of resources, as well as manage costs of raw materials. Our procurement department uses our size and buying power to enhance our access to key materials at competitive prices.
Research and development costs
We maintain an active research and development program. The program improves products, processes, and engineering standards and practices that serve the changing needs of our customers, such as those related to high pressure and high temperature environments, and also develops new products and processes. Our expenditures for research and development activities were
$487 million
in
2015
,
$601 million
in
2014
, and
$588 million
in
2013
. We sponsored over
95%
of these expenditures in each year.
Patents
We own a large number of patents and have pending a substantial number of patent applications covering various products and processes. We are also licensed to utilize technology covered by patents owned by others, and we license others to utilize technology covered by our patents. We do not consider any particular patent to be material to our business operations.
Seasonality
Weather and natural phenomena can temporarily affect the performance of our services, but the widespread geographical locations of our operations mitigate those effects. Examples of how weather can impact our business include:
|
-
|
the severity and duration of the winter in North America can have a significant impact on natural gas storage levels and drilling activity;
|
|
-
|
the timing and duration of the spring thaw in Canada directly affects activity levels due to road restrictions;
|
|
-
|
typhoons and hurricanes can disrupt coastal and offshore operations; and
|
|
-
|
severe weather during the winter months normally results in reduced activity levels in the North Sea and Russia.
|
Additionally, customer spending patterns for software and various other oilfield services and products can typically result in higher activity in the fourth quarter of the year.
Employees
At
December 31, 2015
, we employed approximately
65,000
people worldwide compared to more than
80,000
at
December 31, 2014
. At
December 31, 2015
, approximately
17%
of our employees were subject to collective bargaining agreements. Based upon the geographic diversification of these employees, we do not believe any risk of loss from employee strikes or other collective actions would be material to the conduct of our operations taken as a whole.
Environmental regulation
We are subject to numerous environmental, legal, and regulatory requirements related to our operations worldwide. For further information related to environmental matters and regulation, see
Note 9
to the consolidated financial statements and Item 1(a), “Risk Factors.”
Hydraulic fracturing process
Hydraulic fracturing is a process that creates fractures extending from the well bore into the rock formation to enable natural gas or oil to move more easily from the rock pores to a production conduit. A significant portion of our Completion and Production segment provides hydraulic fracturing services to customers developing shale natural gas and shale oil. From time to time, questions arise about the scope of our operations in the shale natural gas and shale oil sectors, and the extent to which these operations may affect human health and the environment.
2
We sometimes design and generally implement a hydraulic fracturing operation to 'stimulate' the well's production, at the direction of our customer, once the well has been drilled, cased, and cemented. Our customer is generally responsible for providing the base fluid (usually water) used in the hydraulic fracturing of a well. We supply the proppant (often sand) and at least a portion of the additives used in the overall fracturing fluid mixture. In addition, we mix the additives and proppant with the base fluid and pump the mixture down the wellbore to create the desired fractures in the target formation. The customer is responsible for disposing of any materials that are subsequently produced or pumped out of the well, including flowback fluids and produced water.
As part of the process of constructing the well, the customer will take a number of steps designed to protect drinking water resources. In particular, the casing and cementing of the well are designed to provide 'zonal isolation' so that the fluids pumped down the wellbore and the oil and natural gas and other materials that are subsequently pumped out of the well will not come into contact with shallow aquifers or other shallow formations through which those materials could potentially migrate to freshwater aquifers or the surface.
The potential environmental impacts of hydraulic fracturing have been studied by numerous government entities and others. In 2004, the United States Environmental Protection Agency (EPA) conducted an extensive study of hydraulic fracturing practices, focusing on coalbed methane wells, and their potential effect on underground sources of drinking water. The EPA’s study concluded that hydraulic fracturing of coalbed methane wells poses little or no threat to underground sources of drinking water. At the request of Congress, the EPA is currently undertaking another study of the relationship between hydraulic fracturing and drinking water resources that will focus on the fracturing of shale natural gas wells.
We have made detailed information regarding our fracturing fluid composition and breakdown available on our internet web site at
www.halliburton.com
. We also have proactively developed processes to provide our customers with the chemical constituents of our hydraulic fracturing fluids to enable our customers to comply with state laws as well as voluntary standards established by the Chemical Disclosure Registry,
www.fracfocus.org
.
At the same time, we have invested considerable resources in developing hydraulic fracturing technologies, which offer our customers a variety of especially environment-friendly alternatives related to the use of hydraulic fracturing fluid additives and other aspects of our hydraulic fracturing operations. We created a hydraulic fracturing fluid system comprised of materials sourced entirely from the food industry. In addition, we have engineered a process that uses ultraviolet light to control the growth of bacteria in hydraulic fracturing fluids, allowing customers to minimize the use of chemical biocides. We are committed to the continued development of innovative chemical and mechanical technologies that allow for more economical and environmentally friendly development of the world’s oil and natural gas reserves.
In evaluating any environmental risks that may be associated with our hydraulic fracturing services, it is helpful to understand the role that we play in the development of shale natural gas and shale oil. Our principal task generally is to manage the process of injecting fracturing fluids into the borehole to 'stimulate' the well. Thus, based on the provisions in our contracts and applicable law, the primary environmental risks we face are potential pre-injection spills or releases of stored fracturing fluids and potential spills or releases of fuel or other fluids associated with pumps, blenders, conveyors, or other above-ground equipment used in the hydraulic fracturing process.
Although possible concerns have been raised about hydraulic fracturing operations, the circumstances described above have helped to mitigate those concerns. To date, we have not been obligated to compensate any indemnified party for any environmental liability arising directly from hydraulic fracturing, although there can be no assurance that such obligations or liabilities will not arise in the future.
Working capital
We fund our business operations through a combination of available cash and equivalents, short-term investments, and cash flow generated from operations. In addition, our revolving credit facility is available for additional working capital needs.
Web site access
Our annual reports on Form 10-K, quarterly reports on Form 10-Q, current reports on Form 8-K, and amendments to those reports filed or furnished pursuant to Section 13(a) or 15(d) of the Exchange Act of 1934 are made available free of charge on our internet web site at
www.halliburton.com
as soon as reasonably practicable after we have electronically filed the material with, or furnished it to, the Securities and Exchange Commission (SEC). The public may read and copy any materials we have filed with the SEC at the SEC’s Public Reference Room at 100 F Street, NE, Washington, DC 20549. Information on the operation of the Public Reference Room may be obtained by calling the SEC at 1-800-SEC-0330. The SEC maintains an internet site that contains our reports, proxy and information statements, and our other SEC filings. The address of that web site is
www.sec.gov
. We have posted on our web site our Code of Business Conduct, which applies to all of our employees and Directors and serves as a code of ethics for our principal executive officer, principal financial officer, principal accounting officer, and other persons performing similar functions. Any amendments to our Code of Business Conduct or any waivers from provisions of our Code of Business Conduct granted to the specified officers above are disclosed on our web site within four business days after the date of any amendment or waiver pertaining to these officers. There have been no waivers from provisions of our Code of Business Conduct for the years
2015
,
2014
, or
2013
. Except to the extent expressly stated otherwise, information contained on or accessible from our web site or any other web site is not incorporated by reference into this annual report on Form 10-K and should not be considered part of this report.
3
Executive Officers of the Registrant
The following table indicates the names and ages of the executive officers of Halliburton Company as of
February 5, 2016
, including all offices and positions held by each in the past five years:
|
Name and Age
|
Offices Held and Term of Office
|
|
|
James S. Brown
(Age 61)
|
President, Western Hemisphere of Halliburton Company, since January 2008
|
|
|
*
|
Christian A. Garcia
(Age 52)
|
Senior Vice President, Finance and Acting Chief Financial Officer of Halliburton Company, since January 2015
|
|
Senior Vice President and Chief Accounting Officer of Halliburton Company, January 2014 to December 2014
|
||
|
Senior Vice President and Treasurer of Halliburton Company, September 2011 to December 2013
|
||
|
Senior Vice President, Investor Relations of Halliburton Company, January 2011 to August 2011
|
||
|
Charles E. Geer, Jr.
(Age 45)
|
Vice President and Corporate Controller of Halliburton Company, since January 2015
|
|
|
Vice President, Finance of Halliburton Company, December 2013 to December 2014
|
||
|
Vice President and Chief Accounting Officer of Select Energy Services, April 2011 to November 2013
|
||
|
Vice President and Principal Accounting Officer of Weatherford International, June 2010 to March 2011
|
||
|
Myrtle L. Jones
(Age 56) |
Senior Vice President, Tax of Halliburton Company, since March 2013
|
|
|
Senior Managing Director of Tax and Internal Audit, Service Corporation International, February 2008 to February 2013
|
||
|
*
|
David J. Lesar
(Age 62)
|
Chairman of the Board and Chief Executive Officer of Halliburton Company, since August 2014
|
|
Chairman of the Board, President, and Chief Executive Officer of Halliburton Company, August 2000 to July 2014
|
||
|
Mark A. McCollum
(Age 56)
|
Executive Vice President and Chief Integration Officer of Halliburton Company, since January 2015
|
|
|
Executive Vice President and Chief Financial Officer of Halliburton Company, January 2008 to December 2014
|
||
|
Timothy M. McKeon
(Age 43) |
Vice President and Treasurer of Halliburton Company, since January 2014
|
|
|
Assistant Treasurer of Halliburton Company, September 2011 to December 2013
|
||
|
Director of Finance, Drilling & Evaluation Division of Halliburton Company, February 2011 to August 2011
|
||
|
Director of Treasury Operations of Halliburton Company, March 2009 to January 2011
|
||
|
*
|
Jeffrey A. Miller
(Age 52)
|
Member of the Board of Directors and President of Halliburton Company, since August 2014
|
|
Executive Vice President and Chief Operating Officer of Halliburton Company, September 2012 to July 2014
|
||
|
Senior Vice President, Global Business Development and Marketing of Halliburton Company, January 2011 to August 2012
|
||
4
|
*
|
Lawrence J. Pope
(Age 47)
|
Executive Vice President of Administration and Chief Human Resources Officer of Halliburton Company, since January 2008
|
|
Joe D. Rainey
(Age 59) |
President, Eastern Hemisphere of Halliburton Company, since January 2011
|
|
|
*
|
Robb L. Voyles (Age 58)
|
Executive Vice President, Secretary and General Counsel of Halliburton Company, since May 2015
|
|
Executive Vice President and General Counsel of Halliburton Company, January 2014 to April 2015
|
||
|
Senior Vice President, Law of Halliburton Company, September 2013 to December 2013
|
||
|
Partner, Baker Botts L.L.P., January 1989 to August 2013
|
||
* Members of the Policy Committee of the registrant.
There are no family relationships between the executive officers of the registrant or between any director and any executive officer of the registrant.
5
The statements in this section describe the known material risks to our business and should be considered carefully.
We may be unable to obtain the necessary consents and approvals from governmental authorities required to complete the Baker Hughes acquisition in a timely manner, or at all. Even if such consents and approvals are obtained, governmental authorities may impose conditions that could adversely affect us or cause the acquisition to be abandoned.
To complete the acquisition, we and Baker Hughes must satisfy various closing conditions, including obtaining certain consents and approvals from various governmental and regulatory authorities.
We have not yet obtained all of the regulatory consents and approvals required to complete the acquisition. Governmental or regulatory agencies could seek to block or challenge the acquisition. Even if these regulatory consents and approvals are obtained, they may not be obtained prior to April 30, 2016, the current deadline under the merger agreement to obtain required regulatory approvals before either party is permitted to terminate the merger agreement. The governmental authorities from which these approvals are required are expected to require significant divestitures, and may impose other conditions on the completion of the acquisition that could have an adverse effect on the combined company following the acquisition. We will be unable to complete the acquisition until consents and approvals are received from the European Commission (EC) and various other governmental authorities (jointly, the “Regulatory Clearances”). Notwithstanding that the statutory waiting period under U.S. law ended when our timing agreement with the U.S. Department of Justice (DOJ) expired on December 15, 2015, and even after completion of the acquisition, the DOJ and other governmental authorities could seek to block or challenge the acquisition as they deem necessary or desirable in the public interest. In addition, in some jurisdictions, a competitor, customer or other third party could initiate a private action under the antitrust laws challenging or seeking to enjoin the acquisition, before or after it is completed. Halliburton may not prevail and may incur significant costs in defending or settling any action under the antitrust laws. The merger agreement may require us to accept conditions from these regulators that could adversely impact the combined company. If we agree to undertake divestitures or comply with operating restrictions in order to obtain any approvals required to complete the acquisition, we may be less able to realize anticipated benefits of the acquisition, and the business and results of operations of the combined company after the acquisition may be adversely affected.
In December 2015, the DOJ informed us that they did not believe that our previously announced proposed divestitures were sufficient to address its concerns, and in January 2016, the EC issued a report detailing initial concerns about the competition-related implications of the acquisition. Although we have recently presented to the DOJ and informally notified the EC and other jurisdictions of an enhanced set of proposed divestitures, there can be no assurance that the proposed divestiture package will be sufficient to satisfy their concerns, and there is no agreement to date with the DOJ or the EC as to the adequacy of the proposed divestitures. Even if the proposed divestiture package is satisfactory to those and other authorities, there can be no assurance that we will be able to reach an agreement with one or more buyers of those product lines. If the Regulatory Clearances are not received, or they are not received on terms that satisfy the conditions set forth in the merger agreement, then neither we nor Baker Hughes will be obligated to complete the acquisition.
If we are unable to complete the acquisition, we would be subject to a number of risks, including the following:
|
-
|
we would not realize the anticipated benefits of the acquisition, including, among other things, increased operating efficiencies;
|
|
-
|
the attention of our management will have been diverted to the acquisition rather than to our own operations and the pursuit of other opportunities that could have been beneficial to us;
|
|
-
|
the potential loss of key personnel during the pendency of the acquisition as employees may have experienced uncertainty about their future roles with the combined company;
|
|
-
|
we will have been subject to certain restrictions on the conduct of our business, which may have prevented us from making certain acquisitions or dispositions or pursuing certain business opportunities while the acquisition is pending; and
|
|
-
|
the trading price of our common stock may decline to the extent that the current market prices reflect a market assumption that the acquisition will be completed.
|
If the acquisition is not completed, our ongoing businesses may be adversely affected. If we are unable to close the acquisition by April 30, 2016, either Baker Hughes or we may terminate the merger agreement. Under the merger agreement, we could be required, in certain circumstances where the termination of the merger agreement is related to failures to obtain the Regulatory Clearances, to pay Baker Hughes a termination fee of $3.5 billion. If we do not complete the acquisition, we will also recognize additional non-cash expenses as discussed further in Note 2 to the consolidated financial statements. Payment of the termination fee and incurring such expenses could have material and adverse consequences to the financial condition and operations of Halliburton.
We can provide no assurance that the various closing conditions will be satisfied and that the necessary Regulatory Clearances and other approvals will be obtained, or that any required conditions will not materially adversely affect the combined company following the acquisition. In addition, we can provide no assurance that these conditions will not result in the
6
abandonment or delay of the acquisition. The occurrence of any of these events individually or in combination could have a material adverse effect on our results of operations and the trading price of our common stock.
Pending litigation against us and Baker Hughes could result in an injunction preventing the consummation of the acquisition or may adversely affect our business, financial condition or results of operations following the acquisition.
Following the announcement of the acquisition, various lawsuits were filed in the Court of Chancery of the State of Delaware and the U.S. District Court for the Southern District of Texas against Baker Hughes, the members of the Baker Hughes Board, and us, alleging breaches of various fiduciary duties by the members of the Baker Hughes Board during the acquisition negotiations and by entering into the merger agreement and approving the acquisition and alleging that we and Baker Hughes aided and abetted such alleged breaches of fiduciary duties. Among other remedies, the plaintiffs sought to enjoin the acquisition and rescind the merger agreement, in addition to certain unspecified damages and reimbursement of costs. While we and Baker Hughes believe these suits are without merit and have entered into a memorandum of understanding with the plaintiffs of such lawsuits to settle such claims, the outcome of any such litigation is inherently uncertain and is contingent upon the acquisition closing and court approval. If the settlement is not approved or the lawsuits otherwise remain unresolved after the closing of the acquisition, it may adversely affect the combined company’s business, financial condition or results of operation.
Our stockholders will have a reduced ownership and voting interest after the Baker Hughes acquisition and will exercise less influence over management of the combined company.
Our stockholders currently have the right to vote for our board of directors and on other matters affecting the company. When the acquisition occurs, each Baker Hughes stockholder that receives shares of our common stock will become a stockholder of ours and correspondingly, each of our stockholders will remain a stockholder of Halliburton Company with a percentage ownership of the combined company that is significantly smaller than the stockholder’s percentage ownership prior to the acquisition. Upon completion of the acquisition, former Baker Hughes stockholders are expected to hold approximately 37% of our common stock. As a result of these reduced ownership percentages, our stockholders will have less influence on the management and policies of the combined company than they now have with respect to Halliburton Company.
We have incurred, and will continue to incur, significant transaction, acquisition-related and restructuring costs in connection with the Baker Hughes acquisition and the combined company could incur substantial expenses related to the integration of Baker Hughes.
We have incurred, and will continue to incur, significant costs associated with the expected combination of our operations and the operations of Baker Hughes, as well as transaction fees and other costs related to the acquisition. Many of these costs will be borne by us even if the acquisition is not completed. We have also incurred, will incur through completion of the acquisition, and the combined company will incur following the completion of the acquisition, substantial expenses in connection with integrating each company’s respective businesses, policies, procedures, operations, technologies and systems. There are a large number of systems that must be integrated, including information management, purchasing, accounting and finance, sales, billing, payroll and benefits, fixed asset and lease administration systems and regulatory compliance. Many of the expenses that will be incurred, by their nature, are difficult to estimate accurately at the present time. These expenses could, particularly in the near term, reduce the savings that we expect to achieve from the elimination of duplicative expenses and the realization of economies of scale and cost savings related to the integration of the businesses following the completion of the acquisition, and accordingly, any net benefits may not be achieved in the near term or at all. These integration expenses may result in significant charges taken against earnings by us prior to completion of the acquisition and by the combined company following the completion of the acquisition. During the year ended December 31, 2015, we incurred an aggregate of $411 million in costs related to the pending Baker Hughes acquisition, of which $308 million are acquisition and integration costs included within our consolidated statements of operations and $103 million are capitalized divestiture costs included within "Other current assets" on our consolidated balance sheets.
The market value of our common stock could decline if large amounts of our common stock are sold following the Baker Hughes acquisition.
Following the acquisition, our stockholders and former stockholders of Baker Hughes will own interests in a combined company operating an expanded business with more assets and a different mix of liabilities. Our current stockholders and the current stockholders of Baker Hughes may not wish to continue to invest in the combined company, or may wish to reduce their investment in the combined company, in order to comply with institutional investing guidelines, to increase diversification or to track any rebalancing of stock indices in which our or Baker Hughes common stock is or was included. If, following the acquisition, large amounts of our common stock are sold, the price of our common stock could decline.
7
The Baker Hughes acquisition may not be accretive, and may be dilutive, to our earnings per share in the near term, which may negatively affect the market price of our common stock.
We anticipate that the acquisition may not be accretive, and may be dilutive, to earnings per share until the end of the second calendar year after closing. This expectation is based on preliminary estimates that may materially change. In addition, future events and conditions could decrease or delay any accretion, result in dilution or cause greater dilution than is currently expected, including:
|
-
|
further adverse changes in energy market conditions;
|
|
-
|
commodity prices for oil, natural gas and natural gas liquids;
|
|
-
|
production levels;
|
|
-
|
operating results;
|
|
-
|
competitive conditions;
|
|
-
|
laws and regulations affecting the energy business;
|
|
-
|
capital expenditure obligations;
|
|
-
|
higher than expected integration costs;
|
|
-
|
lower than expected synergies; and
|
|
-
|
general economic conditions.
|
Any dilution of, or decrease or delay of any accretion to, our earnings per share could cause the price of our common stock to decline.
The combined Halliburton and Baker Hughes company will record goodwill that could become impaired and adversely affect the combined company’s operating results.
The acquisition will be accounted for as an acquisition by us in accordance with accounting principles generally accepted in the United States. Under the acquisition method of accounting, the assets and liabilities of Baker Hughes will be recorded, as of the acquisition closing date, at their respective fair values and added to those of Halliburton. Our reported financial condition and results of operations issued after completion of the acquisition will reflect Baker Hughes balances and results after completion of the acquisition, but will not be restated retroactively to reflect the historical financial position or results of operations of Baker Hughes for periods prior to the acquisition. Under the acquisition method of accounting, the total purchase price will be allocated to Baker Hughes’s tangible assets and liabilities and identifiable intangible assets based on their fair values as of the acquisition closing date. The excess of the purchase price over those fair values will be recorded as goodwill. We and Baker Hughes expect that the acquisition will result in the creation of goodwill based upon the application of the acquisition method of accounting. To the extent the value of goodwill or intangibles becomes impaired, which is more likely during adverse market conditions similar to the current environment, the combined company may be required to incur material charges relating to such impairment. Such a potential impairment charge could have a material adverse impact on the combined company’s operating results.
The pendency of the Baker Hughes acquisition could adversely affect us.
In connection with the pending acquisition, some of our suppliers and customers may delay or defer sales and purchasing decisions, which could negatively impact revenues, earnings and cash flows regardless of whether the acquisition is completed. We have agreed in the merger agreement to refrain from taking certain actions with respect to our business and financial affairs during the pendency of the acquisition, which restrictions have been, and could continue to be, in place for an extended period of time if completion of the acquisition is delayed and could adversely impact our financial condition, results of operations or cash flows.
The combined Halliburton and Baker Hughes enterprise’s indebtedness following the acquisition will be greater than Halliburton’s existing indebtedness. Therefore, it may be more difficult for the combined enterprise to pay or refinance its debts or take other actions, and the combined enterprise may need to divert its cash flow from operations to debt service payments.
In connection with the acquisition, we will incur additional debt to pay the merger consideration and transaction expenses and the indebtedness of the combined enterprise will increase as a result of Baker Hughes’s outstanding debt. Halliburton’s total liabilities as of December 31, 2015 were approximately
$21.4 billion
, including
$15.3 billion
of long-term debt (including current maturities), which includes $7.5 billion aggregate principal amount of senior notes issued in November 2015 to finance a portion of the merger consideration. Baker Hughes’s total liabilities as of December 31, 2015 were approximately $7.7 billion, including $4.0 billion of long-term debt (including current maturities). We could incur additional debt or use cash on hand to finance the remainder of the cash portion of the merger consideration. If the Baker Hughes acquisition is not completed, we will be required to redeem $2.5 billion of the senior notes issued in November 2015 at a price of 101% of their principal amount. See
Note 8
to the consolidated financial statements for further information about debt financing for the pending acquisition. The combined enterprise’s debt service obligations with respect to this increased indebtedness could
8
have an adverse impact on its earnings and cash flows, which after the acquisition would include the earnings and cash flows of Baker Hughes, for as long as the indebtedness is outstanding.
The combined enterprise’s increased indebtedness could also have important consequences to holders of our common stock. For example, it could:
|
-
|
make it more difficult for the combined enterprise to pay or refinance its debts as they become due during adverse economic and industry conditions because any decrease in revenues could cause the combined enterprise to not have sufficient cash flows from operations to make its scheduled debt payments;
|
|
-
|
limit the combined enterprise’s flexibility to pursue other strategic opportunities or react to changes in its business and the industry in which it operates and, consequently, place the combined enterprise at a competitive disadvantage to its competitors with less debt;
|
|
-
|
require a substantial portion of the combined enterprise’s cash flows from operations to be used for debt service payments, thereby reducing the availability of its cash flow to fund working capital, capital expenditures, acquisitions, dividend payments and other general corporate purposes;
|
|
-
|
result in a downgrade in the rating of our indebtedness, which could limit our ability to borrow additional funds and increase the interest rates applicable to our indebtedness (after the announcement of the acquisition, Standard & Poor’s Ratings Services placed all of our ratings on negative watch, and all of Baker Hughes’s ratings on negative watch, and in October 2015 Moody's placed all of our ratings on review for downgrade);
|
|
-
|
result in higher interest expense in the event of increases in interest rates since some of our borrowings are, and will continue to be, at variable rates of interest; or
|
|
-
|
require the combined enterprise to repatriate foreign earnings to meet liquidity demands, resulting in a tax payment that may not be accrued for.
|
Based upon current levels of operations, we expect the combined enterprise to be able to generate sufficient cash on a consolidated basis to make all of the principal and interest payments when such payments are due under our existing credit facilities, indentures and other instruments governing our outstanding indebtedness, and the indebtedness of Baker Hughes that may remain outstanding after the acquisition, but there can be no assurance that the combined enterprise will be able to repay or refinance such borrowings and obligations.
Following the Baker Hughes acquisition, the combined company may encounter difficulties in integrating Halliburton's and Baker Hughes's businesses and realizing the anticipated benefits of the acquisition.
The acquisition involves the combination of two companies which currently operate as independent public companies. The combined company will be required to devote management attention and resources to integrating its business practices and operations, and prior to the acquisition, management attention and resources will be required to plan for such integration. Potential difficulties the combined company may encounter in the integration process include the following:
|
-
|
the inability to successfully integrate the respective businesses of the two companies in a manner that permits the combined company to achieve the cost savings and operating synergies anticipated to result from the acquisition, which could result in the anticipated benefits of the acquisition not being realized partly or wholly in the time frame currently anticipated or at all;
|
|
-
|
lost sales and customers as a result of certain customers of either or both of the two companies deciding not to do business with the combined company, or deciding to decrease their amount of business in order to reduce their reliance on a single company;
|
|
-
|
integrating personnel from the two companies while maintaining focus on providing consistent, high quality products and services;
|
|
-
|
potential unknown liabilities and unforeseen increased expenses, delays or regulatory conditions associated with the acquisition; and
|
|
-
|
performance shortfalls at one or both of the two companies as a result of the diversion of management’s attention caused by completing the acquisition and integrating the companies’ operations.
|
Liabilities arising out of the Macondo well incident could have a material adverse effect on our liquidity, consolidated results of operations, and consolidated financial condition.
The semisubmersible drilling rig, Deepwater Horizon, sank on April 22, 2010 after an explosion and fire onboard the rig that began on April 20, 2010. The Deepwater Horizon was owned by Transocean Ltd. and had been drilling the Macondo exploration well in the Gulf of Mexico for the lease operator, BP Exploration and Production, Inc. (BP). We performed a variety of services on that well for BP. There were eleven fatalities and a number of injuries as a result of the Macondo well incident.
Numerous lawsuits relating to the Macondo well incident and alleging damages arising from the blowout were filed against various parties, including BP, Transocean and us, most of which were consolidated in a Multi-District Litigation (MDL) proceeding. In addition, the Bureau of Safety and Environmental Enforcement has issued a notification of Incidents of Noncompliance (INCs) to us relating to the Macondo well incident. We understand that regulations in effect at the time of the alleged violations provide for fines of up to $35,000 per day per violation.
9
Although the MDL proceeding has concluded and we, BP, Transocean and the plaintiff’s steering committee in the MDL proceeding have settled all claims against each other, the MDL rulings are still subject to appeal and the settlements are subject to court approval and other conditions before they become effective. In addition, we have appealed the INCs, but the appeal has been suspended pending final resolution, including appeals, of the MDL. If the MDL court’s ruling that we were not grossly negligent is overturned on appeal, and our settlement is not approved, liabilities resulting from the Macondo well incident could have a material adverse effect on our liquidity, consolidated results of operations and consolidated financial condition. We are unable to predict whether or when the court will approve our MDL settlement or whether or when the conditions of our MDL Settlement will be satisfied.
For additional information relating to the Macondo well incident, our MDL Settlement, the status of the MDL and the INCs, see
Note 9
to the consolidated financial statements.
Our operations are subject to political and economic instability, risk of government actions, and cyber-attacks that
could have a material adverse effect on our business, consolidated results of operations, and consolidated financial condition.
We are exposed to risks inherent in doing business in each of the countries in which we operate. Our operations are subject to various risks unique to each country that could have a material adverse effect on our business, consolidated results of operations, and consolidated financial condition. With respect to any particular country, these risks may include:
|
-
|
political and economic instability, including:
|
•
civil unrest, acts of terrorism, force majeure, war, other armed conflict, and sanctions;
•
inflation; and
•
currency fluctuations, devaluations, and conversion restrictions; and
|
-
|
governmental actions that may:
|
•
result in expropriation and nationalization of our assets in that country;
•
result in confiscatory taxation or other adverse tax policies;
•
limit or disrupt markets or our operations, restrict payments, or limit the movement of funds;
•
result in the deprivation of contract rights; and
•
result in the inability to obtain or retain licenses required for operation.
For example, due to the unsettled political conditions in many oil-producing countries, our operations, revenue, and profits are subject to the adverse consequences of war, the effects of terrorism, civil unrest, strikes, currency controls, and governmental actions. These and other risks described above could result in the loss of our personnel or assets, cause us to evacuate our personnel from certain countries, cause us to increase spending on security worldwide, disrupt financial and commercial markets, including the supply of and pricing for oil and natural gas, and generate greater political and economic instability in some of the geographic areas in which we operate. Areas where we operate that have significant risk include, but are not limited to: the Middle East, North Africa, Angola, Azerbaijan, Colombia, Indonesia, Kazakhstan, Mexico, Nigeria, Russia, and Venezuela. In addition, any possible reprisals as a consequence of military or other action, such as acts of terrorism in the United States or elsewhere, could have a material adverse effect on our business, consolidated results of operations, and consolidated financial condition.
Our operations are becoming increasingly dependent on digital technologies and services. We use these technologies for internal purposes, including data storage, processing, and transmissions, as well as in our interactions with customers and suppliers. Digital technologies are subject to the risk of cyber-attacks. If our systems for protecting against cybersecurity risks prove not to be sufficient, we could be adversely affected by, among other things: loss of or damage to intellectual property, proprietary or confidential information, or customer, supplier, or employee data; interruption of our business operations; and increased costs required to prevent, respond to, or mitigate cybersecurity attacks. These risks could harm our reputation and our relationships with customers, suppliers, employees, and other third parties, and may result in claims against us. In addition, these risks could have a material adverse effect on our business, consolidated results of operations, and consolidated financial condition.
Our operations outside the United States require us to comply with a number of United States and international regulations, violations of which could have a material adverse effect on our business, consolidated results of operations, and consolidated financial condition.
Our operations outside the United States require us to comply with a number of United States and international regulations. For example, our operations in countries outside the United States are subject to the United States Foreign Corrupt Practices Act (FCPA), which prohibits United States companies and their agents and employees from providing anything of value to a foreign official for the purposes of influencing any act or decision of these individuals in their official capacity to help obtain or retain business, direct business to any person or corporate entity, or obtain any unfair advantage. Our activities create the risk of unauthorized payments or offers of payments by our employees, agents, or joint venture partners that could be in violation of anti-corruption laws, even though these parties are not subject to our control. We have internal control policies and procedures and have implemented training and compliance programs for our employees and agents with respect to the FCPA. However, we cannot assure that our policies, procedures, and programs always will protect us from reckless or criminal acts
10
committed by our employees or agents. Allegations of violations of applicable anti-corruption laws may result in internal, independent, or government investigations. Violations of anti-corruption laws may result in severe criminal or civil sanctions, and we may be subject to other liabilities, which could have a material adverse effect on our business, consolidated results of operations, and consolidated financial condition.
In addition, the shipment of goods, services, and technology across international borders subjects us to extensive trade laws and regulations. Our import activities are governed by the unique customs laws and regulations in each of the countries where we operate. Moreover, many countries, including the United States, control the export and re-export of certain goods, services and technology and impose related export recordkeeping and reporting obligations. Governments may also impose economic sanctions against certain countries, persons, and entities that may restrict or prohibit transactions involving such countries, persons and entities, which may limit or prevent our conduct of business in certain jurisdictions. During 2014, the United States and European Union imposed sectoral sanctions directed at Russia’s oil and gas industry. Among other things, these sanctions restrict the provision of goods, services, and technology in support of exploration or production for deep water, Arctic offshore, or shale projects that have the potential to produce oil in Russia. These sanctions resulted in our winding down and ending work on two projects in Russia in 2014, and have prevented us from pursuing certain other projects in Russia. Any expansion of sanctions against Russia’s oil and gas industry could further hinder our ability to do business in Russia, which could have a material adverse effect on our consolidated results of operations.
The laws and regulations concerning import activity, export recordkeeping and reporting, export control, and economic sanctions are complex and constantly changing. These laws and regulations can cause delays in shipments and unscheduled operational downtime. Moreover, any failure to comply with applicable legal and regulatory trading obligations could result in criminal and civil penalties and sanctions, such as fines, imprisonment, debarment from governmental contracts, seizure of shipments and loss of import and export privileges. In addition, investigations by governmental authorities as well as legal, social, economic, and political issues in these countries could have a material adverse effect on our business, consolidated results of operations, and consolidated financial condition. We are also subject to the risks that our employees, joint venture partners, and agents outside of the United States may fail to comply with other applicable laws.
Changes in, compliance with, or our failure to comply with laws in the countries in which we conduct business may negatively impact our ability to provide services in, make sales of equipment to, and transfer personnel or equipment among some of those countries and could have a material adverse effect on our business and consolidated results of operations.
In the countries in which we conduct business, we are subject to multiple and, at times, inconsistent regulatory regimes, including those that govern our use of radioactive materials, explosives, and chemicals in the course of our operations. Various national and international regulatory regimes govern the shipment of these items. Many countries, but not all, impose special controls upon the export and import of radioactive materials, explosives, and chemicals. Our ability to do business is subject to maintaining required licenses and complying with these multiple regulatory requirements applicable to these special products. In addition, the various laws governing import and export of both products and technology apply to a wide range of services and products we offer. In turn, this can affect our employment practices of hiring people of different nationalities because these laws may prohibit or limit access to some products or technology by employees of various nationalities. Changes in, compliance with, or our failure to comply with these laws may negatively impact our ability to provide services in, make sales of equipment to, and transfer personnel or equipment among some of the countries in which we operate and could have a material adverse effect on our business and consolidated results of operations.
The adoption of any future federal, state, or local laws or implementing regulations imposing reporting obligations on, or limiting or banning, the hydraulic fracturing process could make it more difficult to complete natural gas and oil wells and could have a material adverse effect on our liquidity, consolidated results of operations, and consolidated financial condition.
Various federal legislative and regulatory initiatives have been undertaken which could result in additional requirements or restrictions being imposed on hydraulic fracturing operations. For example, the Department of Interior has issued regulations that apply to hydraulic fracturing operations on wells that are subject to federal oil and gas leases and that impose requirements regarding the disclosure of chemicals used in the hydraulic fracturing process as well as requirements to obtain certain federal approvals before proceeding with hydraulic fracturing at a well site. The Department of Interior has been preliminarily enjoined from enforcing these regulations pending the outcome of a federal court challenge. If they become effective, these regulations would establish additional levels of regulation at the federal level that could lead to operational delays and increased operating costs. At the same time, legislation and/or regulations have been adopted in several states that require additional disclosure regarding chemicals used in the hydraulic fracturing process but that generally include protections for proprietary information. Legislation and/or regulations are being considered at the state and local level that could impose further chemical disclosure or other regulatory requirements (such as restrictions on the use of certain types of chemicals or prohibitions on hydraulic fracturing operations in certain areas) that could affect our operations. Two states (New York and Vermont) have banned the use of high volume hydraulic fracturing. Local jurisdictions in some states have adopted ordinances that restrict or in certain cases prohibit the use of hydraulic fracturing for oil and gas development.
In addition, governmental authorities in various foreign countries
11
where we have provided or may provide hydraulic fracturing services have imposed or are considering imposing various restrictions or conditions that may affect hydraulic fracturing operations.
The adoption of any future federal, state, local, or foreign laws or implementing regulations imposing reporting obligations on, or limiting or banning, the hydraulic fracturing process could make it more difficult to complete natural gas and oil wells and could have a material adverse effect on our liquidity, consolidated results of operations, and consolidated financial condition.
Liability for cleanup costs, natural resource damages, and other damages arising as a result of environmental laws could be substantial and could have a material adverse effect on our liquidity, consolidated results of operations, and consolidated financial condition.
We are exposed to claims under environmental requirements and, from time to time, such claims have been made against us. In the United States, environmental requirements and regulations typically impose strict liability. Strict liability means that in some situations we could be exposed to liability for cleanup costs, natural resource damages, and other damages as a result of our conduct that was lawful at the time it occurred or the conduct of prior operators or other third parties. Liability for damages arising as a result of environmental laws could be substantial and could have a material adverse effect on our liquidity, consolidated results of operations, and consolidated financial condition.
We are periodically notified of potential liabilities at federal and state superfund sites. These potential liabilities may arise from both historical Halliburton operations and the historical operations of companies that we have acquired. Our exposure at these sites may be materially impacted by unforeseen adverse developments both in the final remediation costs and with respect to the final allocation among the various parties involved at the sites. The relevant regulatory agency may bring suit against us for amounts in excess of what we have accrued and what we believe is our proportionate share of remediation costs at any superfund site. We also could be subject to third-party claims, including punitive damages, with respect to environmental matters for which we have been named as a potentially responsible party.
Failure on our part to comply with, and the costs of compliance with, applicable health, safety, and environmental requirements could have a material adverse effect on our liquidity, consolidated results of operations, and consolidated financial condition.
Our business is subject to a variety of health, safety, and environmental laws, rules, and regulations in the United States and other countries, including those covering hazardous materials and requiring emission performance standards for facilities. For example, our well service operations routinely involve the handling of significant amounts of waste materials, some of which are classified as hazardous substances. We also store, transport, and use radioactive and explosive materials in certain of our operations. Applicable regulatory requirements include, for example, those concerning:
|
-
|
the containment and disposal of hazardous substances, oilfield waste, and other waste materials;
|
|
-
|
the importation and use of radioactive materials;
|
|
-
|
the use of underground storage tanks;
|
|
-
|
the use of underground injection wells; and
|
|
-
|
the protection of worker safety both onshore and offshore.
|
These and other requirements generally are becoming increasingly strict. Sanctions for failure to comply with the requirements, many of which may be applied retroactively, may include:
|
-
|
administrative, civil, and criminal penalties;
|
|
-
|
revocation of permits to conduct business; and
|
|
-
|
corrective action orders, including orders to investigate and/or clean up contamination.
|
Failure on our part to comply with applicable environmental requirements could have a material adverse effect on our liquidity, consolidated results of operations, and consolidated financial condition. We are also exposed to costs arising from regulatory compliance, including compliance with changes in or expansion of applicable regulatory requirements, which could have a material adverse effect on our liquidity, consolidated results of operations, and consolidated financial condition.
Existing or future laws, regulations, treaties or international agreements related to greenhouse gases and climate change could have a negative impact on our business and may result in additional compliance obligations with respect to the release, capture, and use of carbon dioxide that could have a material adverse effect on our liquidity, consolidated results of operations, and consolidated financial condition.
Changes in environmental requirements related to greenhouse gases and climate change may negatively impact demand for our services. For example, oil and natural gas exploration and production may decline as a result of environmental requirements, including land use policies responsive to environmental concerns. State, national, and international governments and agencies have been evaluating climate-related legislation and other regulatory initiatives that would restrict emissions of greenhouse gases in areas in which we conduct business. Because our business depends on the level of activity in the oil and natural gas industry, existing or future laws, regulations, treaties, or international agreements related to greenhouse gases and climate change, including incentives to conserve energy or use alternative energy sources, could have a negative impact on our
12
business if such laws, regulations, treaties, or international agreements reduce demand for oil and natural gas. Likewise, such restrictions may result in additional compliance obligations with respect to the release, capture, sequestration, and use of carbon dioxide that could have a material adverse effect on our liquidity, consolidated results of operations, and consolidated financial condition.
Trends in oil and natural gas prices affect the level of exploration, development, and production activity of our customers and the demand for our services and products, which could have a material adverse effect on our business, consolidated results of operations, and consolidated financial condition.
Demand for our services and products is particularly sensitive to the level of exploration, development, and production activity of, and the corresponding capital spending by, oil and natural gas companies. The level of exploration, development, and production activity is directly affected by trends in oil and natural gas prices, which historically have been volatile and are likely to continue to be volatile.
Prices for oil and natural gas are subject to large fluctuations in response to relatively minor changes in the supply of and demand for oil and natural gas, market uncertainty, and a variety of other economic factors that are beyond our control. Crude oil prices have declined significantly since 2014, with West Texas Intermediate (WTI) oil spot prices declining from a high of $108 per barrel in June 2014 to a low of $27 per barrel in January 2016, a level which has not been experienced since 2003. Crude oil prices are not forecast to improve significantly during 2016. We anticipate 2016 will be another challenging year for us, as our customers continue to make downward revisions to their operating budgets. Therefore, we expect a continued reduction in activity coupled with pricing pressures, and corresponding reductions in revenue and operating performance in 2016. For more information, see “Management’s Discussion and Analysis of Financial Condition and Results of Operations - Business Environment and Results of Operations.”
Any prolonged reduction in oil and natural gas prices will depress the immediate levels of exploration, development, and production activity which could have a material adverse effect on our business, consolidated results of operations, and consolidated financial condition. Should current market conditions worsen or persist for an extended period of time, we may be required to record additional asset impairments, including an impairment of the carrying value of our goodwill. Such a potential impairment charge could have a material adverse impact on our operating results. Even the perception of longer-term lower oil and natural gas prices by oil and natural gas companies can similarly reduce or defer major expenditures given the long-term nature of many large-scale development projects.
Factors affecting the prices of oil and natural gas include:
|
-
|
the level of supply and demand for oil and natural gas, especially demand for natural gas in the United States;
|
|
-
|
governmental regulations, including the policies of governments regarding the exploration for and production and development of their oil and natural gas reserves;
|
|
-
|
weather conditions and natural disasters;
|
|
-
|
worldwide political, military, and economic conditions;
|
|
-
|
the level of oil production by non-OPEC countries and the available excess production capacity within OPEC;
|
|
-
|
oil refining capacity and shifts in end-customer preferences toward fuel efficiency and the use of natural gas;
|
|
-
|
the cost of producing and delivering oil and natural gas; and
|
|
-
|
potential acceleration of the development of alternative fuels.
|
Our business is dependent on capital spending by our customers, and reductions in capital spending could have a material adverse effect on our business, consolidated results of operations, and consolidated financial condition.
Our business is directly affected by changes in capital expenditures by our customers, and reductions in their capital spending could reduce demand for our services and products and have a material adverse effect on our business, consolidated results of operations, and consolidated financial condition. Some of the items that may impact our customer's capital spending include:
|
-
|
oil and natural gas prices, including volatility of oil and natural gas prices and expectations regarding future prices;
|
|
-
|
the inability of our customers to access capital on economically advantageous terms;
|
|
-
|
the consolidation of our customers;
|
|
-
|
customer personnel changes; and
|
|
-
|
adverse developments in the business or operations of our customers, including write-downs of reserves and borrowing base reductions under customer credit facilities.
|
As a result of the decreases in commodity prices, many of our customers reduced capital spending in 2015 and have continued a reduction in their capital spending budgets for 2016. We expect that further reductions in commodity prices or prices remaining at current levels for a prolonged period of time may result in further capital budget reductions in the future.
13
Our business could be materially and adversely affected by severe or unseasonable weather where we have operations.
Our business could be materially and adversely affected by severe weather, particularly in the Gulf of Mexico, Russia, and the North Sea. Some experts believe global climate change could increase the frequency and severity of extreme weather conditions. Repercussions of severe or unseasonable weather conditions may include:
|
-
|
evacuation of personnel and curtailment of services;
|
|
-
|
weather-related damage to offshore drilling rigs resulting in suspension of operations;
|
|
-
|
weather-related damage to our facilities and project work sites;
|
|
-
|
inability to deliver materials to jobsites in accordance with contract schedules;
|
|
-
|
decreases in demand for natural gas during unseasonably warm winters; and
|
|
-
|
loss of productivity.
|
Changes in or interpretation of tax law and currency/repatriation control could impact the determination of our income tax liabilities for a tax year.
We have operations in approximately
80
countries. Consequently, we are subject to the jurisdiction of a significant number of taxing authorities. The income earned in these various jurisdictions is taxed on differing bases, including net income actually earned, net income deemed earned, and revenue-based tax withholding. The final determination of our income tax liabilities involves the interpretation of local tax laws, tax treaties, and related authorities in each jurisdiction, as well as the significant use of estimates and assumptions regarding the scope of future operations and results achieved and the timing and nature of income earned and expenditures incurred. Changes in the operating environment, including changes in or interpretation of tax law and currency/repatriation controls, could impact the determination of our income tax liabilities for a tax year.
We are subject to foreign exchange risks and limitations on our ability to reinvest earnings from operations in one country to fund the capital needs of our operations in other countries or to repatriate assets from some countries.
A sizable portion of our consolidated revenue and consolidated operating expenses is in foreign currencies. As a result, we are subject to significant risks, including:
|
-
|
foreign currency exchange risks resulting from changes in foreign currency exchange rates and the implementation of exchange controls; and
|
|
-
|
limitations on our ability to reinvest earnings from operations in one country to fund the capital needs of our operations in other countries.
|
As an example, we conduct business in countries, such as Venezuela, that have restricted or limited trading markets for their local currencies. We may accumulate cash in those geographies, but we may be limited in our ability to convert our profits into United States dollars or to repatriate the profits from those countries. In addition, we may accumulate cash in foreign jurisdictions that may be subject to taxation if repatriated to the United States. For further information, see "Management's Discussion and Analysis of Financial Condition and Results of Operations - Business Environment and Results of Operations" and
Note 10
to the consolidated financial statements.
Our failure to protect our proprietary information and any successful intellectual property challenges or infringement proceedings against us could materially and adversely affect our competitive position.
We rely on a variety of intellectual property rights that we use in our services and products. We may not be able to successfully preserve these intellectual property rights in the future, and these rights could be invalidated, circumvented, or challenged. In addition, the laws of some foreign countries in which our services and products may be sold do not protect intellectual property rights to the same extent as the laws of the United States. Our failure to protect our proprietary information and any successful intellectual property challenges or infringement proceedings against us could materially and adversely affect our competitive position.
If we are not able to design, develop, and produce commercially competitive products and to implement commercially competitive services in a timely manner in response to changes in the market, customer requirements, competitive pressures, and technology trends, our business and consolidated results of operations could be materially and adversely affected, and the value of our intellectual property may be reduced.
The market for our services and products is characterized by continual technological developments to provide better and more reliable performance and services. If we are not able to design, develop, and produce commercially competitive products and to implement commercially competitive services in a timely manner in response to changes in the market, customer requirements, competitive pressures, and technology trends, our business and consolidated results of operations could be materially and adversely affected, and the value of our intellectual property may be reduced. Likewise, if our proprietary technologies, equipment, facilities, or work processes become obsolete, we may no longer be competitive, and our business and consolidated results of operations could be materially and adversely affected.
14
If our customers delay paying or fail to pay a significant amount of our outstanding receivables, it could have a material adverse effect on our liquidity, consolidated results of operations, and consolidated financial condition.
We depend on a limited number of significant customers. While none of these customers represented more than 10% of consolidated revenue in any period presented, the loss of one or more significant customers could have a material adverse effect on our business and our consolidated results of operations.
In most cases, we bill our customers for our services in arrears and are, therefore, subject to our customers delaying or failing to pay our invoices. In weak economic environments, we may experience increased delays and failures due to, among other reasons, a reduction in our customers’ cash flow from operations and their access to the credit markets. If our customers delay paying or fail to pay us a significant amount of our outstanding receivables, it could have a material adverse effect on our liquidity, consolidated results of operations, and consolidated financial condition.
Our business in Venezuela subjects us to actions by the Venezuelan government, the risk of delayed payments, and currency risks, which could have a material adverse effect on our liquidity, consolidated results of operations, and consolidated financial condition.
We believe there are risks associated with our operations in Venezuela, including the possibility that the Venezuelan government could assume control over our operations and assets. Any delays in receiving payment on our receivables from our primary customer in Venezuela or failure to pay us a significant amount of our outstanding receivables could have a material adverse effect on our liquidity, consolidated results of operations, and consolidated financial condition.
The future results of our Venezuelan operations will be affected by many factors, including the foreign currency exchange rate, actions of the Venezuelan government, and general economic conditions such as continued inflation and future customer payments and spending. For further information, see "Management's Discussion and Analysis of Financial Condition and Results of Operations - Business Environment and Results of Operations - International operations - Venezuela."
Some of our customers require bids for contracts in the form of long-term, fixed pricing contracts that may require us to assume additional risks associated with cost over-runs, operating cost inflation, labor availability and productivity, supplier and contractor pricing and performance, and potential claims for liquidated damages.
Some of our customers, primarily NOCs, may require bids for contracts in the form of long-term, fixed pricing contracts that may require us to provide integrated project management services outside our normal discrete business to act as project managers as well as service providers, and may require us to assume additional risks associated with cost over-runs. These customers may provide us with inaccurate information in relation to their reserves, which is a subjective process that involves location and volume estimation, that may result in cost over-runs, delays, and project losses. In addition, NOCs often operate in countries with unsettled political conditions, war, civil unrest, or other types of community issues. These issues may also result in cost over-runs, delays, and project losses.
Providing services on an integrated basis may also require us to assume additional risks associated with operating cost inflation, labor availability and productivity, supplier pricing and performance, and potential claims for liquidated damages. We rely on third-party subcontractors and equipment providers to assist us with the completion of these types of contracts. To the extent that we cannot engage subcontractors or acquire equipment or materials in a timely manner and on reasonable terms, our ability to complete a project in accordance with stated deadlines or at a profit may be impaired. If the amount we are required to pay for these goods and services exceeds the amount we have estimated in bidding for fixed-price work, we could experience losses in the performance of these contracts. These delays and additional costs may be substantial, and we may be required to compensate our customers for these delays. This may reduce the profit to be realized or result in a loss on a project.
Constraints in the supply of, prices for, and availability of transportation of raw materials can have a material adverse effect on our business and consolidated results of operations.
Raw materials essential to our business, such as proppants, hydrochloric acid, and gels, including guar gum, are normally readily available. Shortage of raw materials as a result of high levels of demand or loss of suppliers during market challenges can trigger constraints in the supply chain of those raw materials, particularly where we have a relationship with a single supplier for a particular resource. Many of the raw materials essential to our business require the use of rail, storage, and trucking services to transport the materials to our jobsites. These services, particularly during times of high demand, may cause delays in the arrival of or otherwise constrain our supply of raw materials. These constraints could have a material adverse effect on our business and consolidated results of operations. In addition, price increases imposed by our vendors for raw materials used in our business and the inability to pass these increases through to our customers could have a material adverse effect on our business and consolidated results of operations.
15
Our acquisitions, dispositions, and investments may not result in anticipated benefits and may present risks not originally contemplated, which may have a material adverse effect on our liquidity, consolidated results of operations, and consolidated financial condition.
We continually seek opportunities to maximize efficiency and value through various transactions, including purchases or sales of assets, businesses, investments, or joint venture interests. These transactions are intended to (but may not) result in the realization of savings, the creation of efficiencies, the offering of new products or services, the generation of cash or income, or the reduction of risk. Acquisition transactions may be financed by additional borrowings or by the issuance of our common stock. These transactions may also affect our liquidity, consolidated results of operations, and consolidated financial condition.
These transactions also involve risks, and we cannot ensure that:
|
-
|
any acquisitions would result in an increase in income or provide an adequate return of capital or other anticipated benefits;
|
|
-
|
any acquisitions would be successfully integrated into our operations and internal controls;
|
|
-
|
the due diligence conducted prior to an acquisition would uncover situations that could result in financial or legal exposure, including under the FCPA, or that we will appropriately quantify the exposure from known risks;
|
|
-
|
any disposition would not result in decreased earnings, revenue, or cash flow;
|
|
-
|
use of cash for acquisitions would not adversely affect our cash available for capital expenditures and other uses;
|
|
-
|
any dispositions, investments, or acquisitions, including integration efforts, would not divert management resources; or
|
|
-
|
any dispositions, investments, or acquisitions would not have a material adverse effect on our liquidity, consolidated results of operations, or consolidated financial condition.
|
Actions of and disputes with our joint venture partners could have a material adverse effect on the business and results of operations of our joint ventures and, in turn, our business and consolidated results of operations.
We conduct some operations through joint ventures, where control may be shared with unaffiliated third parties. As with any joint venture arrangement, differences in views among the joint venture participants may result in delayed decisions or in failures to agree on major issues. We also cannot control the actions of our joint venture partners, including any nonperformance, default, or bankruptcy of our joint venture partners. These factors could have a material adverse effect on the business and results of operations of our joint ventures and, in turn, our business and consolidated results of operations.
Our ability to operate and our growth potential could be materially and adversely affected if we cannot employ and retain technical personnel at a competitive cost.
Many of the services that we provide and the products that we sell are complex and highly engineered and often must perform or be performed in harsh conditions. We believe that our success depends upon our ability to employ and retain technical personnel with the ability to design, utilize, and enhance these services and products. A significant increase in the wages paid by competing employers could result in a reduction of our skilled labor force, increases in the wage rates that we must pay, or both. If either of these events were to occur, our cost structure could increase, our margins could decrease, and any growth potential could be impaired.
The loss or unavailability of any of our executive officers or other key employees could have a material adverse effect on our business.
We depend greatly on the efforts of our executive officers and other key employees to manage our operations. The loss or unavailability of any of our executive officers or other key employees could have a material adverse effect on our business.
16
None.
Item 2.
Properties
.
We own or lease numerous properties in domestic and foreign locations. Our principal properties include manufacturing facilities, research and development laboratories, technology centers, and corporate offices. We also have numerous small facilities that include sales, project, and support offices and bulk storage facilities throughout the world. All of our owned properties are unencumbered.
The following locations represent our major facilities by segment:
Completion and Production
: Arbroath, United Kingdom; Johor Bahru, Malaysia; and Lafayette, Louisiana.
Drilling and Evaluation
: Alvarado, Texas; Nisku, Canada; and The Woodlands, Texas.
Shared/corporate facilities
: Carrollton, Texas; Denver, Colorado; Dhahran, Saudi Arabia; Dubai, United Arab Emirates (corporate executive offices); Duncan, Oklahoma; Houston, Texas (corporate executive offices); Kuala Lumpur, Malaysia; London, England; Moscow, Russia; Panama City, Panama; Pune, India; Rio de Janeiro, Brazil; Singapore; and Stavanger, Norway.
We believe all properties that we currently occupy are suitable for their intended use.
Item 3.
Legal Proceedings
.
Information related to Item 3. Legal Proceedings is included in
Note 9
to the consolidated financial statements.
Item 4.
Mine Safety Disclosures
.
Our barite and bentonite mining operations, in support of our fluid services business, are subject to regulation by the federal Mine Safety and Health Administration under the Federal Mine Safety and Health Act of 1977. Information concerning mine safety violations or other regulatory matters required by section 1503(a) of the Dodd-Frank Wall Street Reform and Consumer Protection Act and Item 104 of Regulation S-K (17 CFR 229.104) is included in
Exhibit 95
to this annual report.
17
Item 5.
Market for Registrant’s Common Equity, Related Stockholder Matters, and Issuer Purchases of Equity Securities
.
Halliburton Company’s common stock is traded on the New York Stock Exchange. Information related to the high and low market prices of our common stock and quarterly dividend payments is included under the caption “Quarterly Data and Market Price Information” on page 77 of this annual report. Quarterly cash dividends on our common stock, which were paid in March, June, September, and December of each year, were $0.15 per share for the first three quarters of
2014
, and $0.18 per share in the fourth quarter of
2014
and all four quarters of
2015
. The declaration and payment of future dividends will be at the discretion of the Board of Directors and will depend on, among other things, future earnings, general financial condition and liquidity, success in business activities, capital requirements, and general business conditions. Subject to Board of Directors approval, our intention is to pay dividends representing at least 15% to 20% of our net income on an annual basis.
The following graph and table compare total shareholder return on our common stock for the five-year period ended
December 31, 2015
, with the
Philadelphia Oil Service Index (OSX)
and the
Standard & Poor’s 500 ® Index
over the same period. This comparison assumes the investment of $100 on December 31,
2010
, and the reinvestment of all dividends. The shareholder return set forth is not necessarily indicative of future performance.
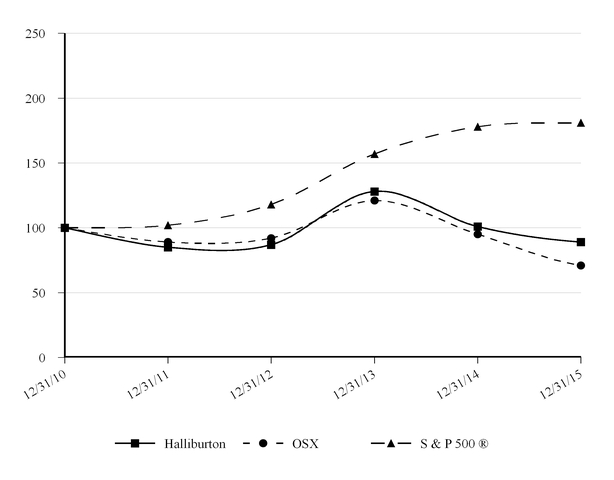
|
December 31
|
||||||||||||||||||
|
2010
|
2011
|
2012
|
2013
|
2014
|
2015
|
|||||||||||||
|
Halliburton
|
$
|
100.00
|
|
$
|
85.31
|
|
$
|
86.73
|
|
$
|
128.36
|
|
$
|
100.63
|
|
$
|
88.69
|
|
|
Philadelphia Oil Service Index (OSX)
|
100.00
|
|
89.45
|
|
92.26
|
|
121.15
|
|
95.32
|
|
71.30
|
|
||||||
|
Standard & Poor’s 500 ® Index
|
100.00
|
|
102.11
|
|
118.45
|
|
156.82
|
|
178.28
|
|
180.75
|
|
||||||
18
At
January 29, 2016
, we had 13,484 shareholders of record. In calculating the number of shareholders, we consider clearing agencies and security position listings as one shareholder for each agency or listing.
The following table is a summary of repurchases of our common stock during the three-month period ended
December 31, 2015
.
|
Period
|
Total Number
of Shares Purchased (a) |
Average
Price Paid per Share |
Total Number
of Shares Purchased as Part of Publicly Announced Plans or Programs (b) |
Maximum
Number (or Approximate Dollar Value) of Shares that may yet be Purchased Under the Program (b) |
|
October 1 - 31
|
34,214
|
$38.54
|
—
|
$5,700,004,373
|
|
November 1 - 30
|
60,838
|
$38.65
|
—
|
$5,700,004,373
|
|
December 1 - 31
|
166,766
|
$37.54
|
—
|
$5,700,004,373
|
|
Total
|
261,818
|
$37.93
|
—
|
|
|
(a)
|
All of the
261,818
shares purchased during the three-month period ended
December 31, 2015
were acquired from employees in connection with the settlement of income tax and related benefit withholding obligations arising from vesting in restricted stock grants. These shares were not part of a publicly announced program to purchase common stock.
|
|
(b)
|
Our Board of Directors has authorized a plan to repurchase our common stock from time to time. During the
fourth
quarter of
2015
, we did not repurchase shares of our common stock pursuant to that plan. We have authorization remaining to repurchase up to a total of approximately
$5.7 billion
of our common stock.
|
Item 6.
Selected Financial Data
.
Information related to selected financial data is included on page 76 of this annual report.
Item 7.
Management’s Discussion and Analysis of Financial Condition and Results of Operations
.
Information related to Management’s Discussion and Analysis of Financial Condition and Results of Operations is included on pages 21 through 41 of this annual report.
Information related to market risk is included in “
Management’s Discussion and Analysis of Financial Condition and Results of Operations
– Financial Instrument Market Risk” on page 40 of this annual report and
Note 14
to the consolidated financial statements on page 69 of this annual report.
19
Item 8.
Financial Statements and Supplementary Data
.
|
Page No.
|
|
|
Management’s Report on Internal Control Over Financial Reporting
|
|
|
Reports of Independent Registered Public Accounting Firm
|
|
|
Consolidated Statements of Operations for the years ended December 31, 2015, 2014, and 2013
|
|
|
Consolidated Statements of Comprehensive Income for the years ended December 31, 2015, 2014, and 2013
|
|
|
Consolidated Balance Sheets at December 31, 2015 and 2014
|
|
|
Consolidated Statements of Cash Flows for the years ended December 31, 2015, 2014, and 2013
|
|
|
Consolidated Statements of Shareholders’ Equity for the years ended December 31, 2015, 2014, and 2013
|
|
|
Notes to Consolidated Financial Statements
|
|
|
Selected Financial Data (Unaudited)
|
|
|
Quarterly Data and Market Price Information (Unaudited)
|
|
Item 9.
Changes in and Disagreements with Accountants on Accounting and Financial Disclosure
.
None.
In accordance with the Securities Exchange Act of 1934 Rules 13a-15 and 15d-15, we carried out an evaluation, under the supervision and with the participation of management, including our Chief Executive Officer and Chief Financial Officer, of the effectiveness of our disclosure controls and procedures as of the end of the period covered by this report. Based on that evaluation, our Chief Executive Officer and Chief Financial Officer concluded that our disclosure controls and procedures were effective as of
December 31, 2015
to provide reasonable assurance that information required to be disclosed in our reports filed or submitted under the Exchange Act is recorded, processed, summarized, and reported within the time periods specified in the Securities and Exchange Commission’s rules and forms. Our disclosure controls and procedures include controls and procedures designed to ensure that information required to be disclosed in reports filed or submitted under the Exchange Act is accumulated and communicated to our management, including our Chief Executive Officer and Chief Financial Officer, as appropriate, to allow timely decisions regarding required disclosure.
There has been no change in our internal control over financial reporting that occurred during the three months ended
December 31, 2015
that has materially affected, or is reasonably likely to materially affect, our internal control over financial reporting.
See page 42 for Management’s Report on Internal Control Over Financial Reporting and page 44 for Report of Independent Registered Public Accounting Firm on its assessment of our internal control over financial reporting.
None.
20
HALLIBURTON COMPANY
Management’s Discussion and Analysis of Financial Condition and Results of Operations
EXECUTIVE OVERVIEW
Pending acquisition of Baker Hughes
In November 2014, we and Baker Hughes entered into a merger agreement under which, subject to the conditions set forth in the merger agreement, we will acquire all the outstanding shares of Baker Hughes in a stock and cash transaction. The acquisition is expected to create a leading global oilfield services company and combine the companies’ product and service capabilities to deliver exceptional depth and breadth of solutions to our customers. We are continuing our discussions with competition authorities to obtain approval of the acquisition and recently offered an enhanced set of divestitures in an effort to resolve competition-related concerns. We have agreed with Baker Hughes to extend the period to obtain required regulatory approvals to no later than April 30, 2016, and remain focused on completing the transaction as early as possible in 2016. See
Note 2
to the consolidated financial statements for further information about the pending acquisition and Item 1(a). “Risk Factors” for risks associated with the pending acquisition.
Financial results
We experienced a decline in revenue and operating income during 2015, as compared to 2014, as a result of the depressed crude oil pricing environment and its corresponding negative impact on activity levels and pricing for our products and services. The industry experienced an unprecedented decline in North America stimulation activity during 2015, which significantly impacted our financial results. From its peak in November 2014 through December 31, 2015, the United States land rig count declined approximately 64%, which in turn has resulted in pricing pressure across the services industry.
We generated
$23.6 billion
of revenue during 2015, a 28% decrease from the
$32.9 billion
of revenue generated in 2014. We reported an operating loss of $165 million in 2015, as compared to operating income of $5.1 billion in 2014. This decrease was due to a decline in activity and pricing in most of our product services lines, particularly stimulation activity in the United States land market, as well as our company-wide cost mitigation activities, as a result of which we recorded $2.2 billion of impairments and other charges during 2015. These charges were recorded primarily as a result of the downturn in the energy market, and consisted of equipment write-offs, asset impairments, expenses and write-downs related to idle equipment, impairments of intangible assets, inventory write-downs, severance costs, country and facility closures, and other items. We took actions to reduce our cost structure, which included a global headcount reduction of approximately 25% since the beginning of 2015, to help mitigate the current market conditions that we are experiencing. See Note 3 to the consolidated financial statements for further information about these charges.
Business outlook
Reduced commodity prices made 2015 a challenging year, as this created widespread pricing pressure and activity reductions on a global basis. We have taken actions throughout 2015 to help mitigate the effect on our business during the downturn in the energy market, and we will continue to evaluate our cost structure and make further adjustments as required.
In North America, we experienced pricing pressures, which impacted our margins. Lower commodity prices resulted in unprecedented reductions in rig count over the course of 2015, which in turn resulted in substantial pricing pressure across all of our product service lines. While our global revenue declined 28% in 2015 as compared to 2014, revenue in North America declined 39%. We anticipate 2016 being another challenging year for us in North America, and we will continue to adapt our cost structure to market conditions, which we believe will position us well when the market ultimately recovers.
The international markets have been more resilient than North America, however they are not immune to the impacts of the lower commodity price environment. We experienced pricing concessions and activity reductions in our international operations throughout 2015, the impact of which was mitigated by our cost management initiatives. Despite a 16% year over year reduction in our revenues, we were able to keep operating margins relatively stable during 2015, primarily due to a relentless focus on cost management. We have continued to work with customers during this downturn to improve project economics through technology and improved operating efficiency, but expect margins to be negatively impacted by lower activity levels and pricing pressure throughout 2016. Going into 2016, we expect all international regions to experience activity declines and price reductions again due to challenging economics and budget constraints, although the Middle East/Asia region is expected to be the most resilient, as recent mature field project awards are anticipated to move forward.
While the intensity and duration of the current market downturn is uncertain, we are continuing to execute on our two-pronged strategy in the downturn. The first part being to control what we can control in the short term, and the second is to look beyond the cycle and prepare for the recovery. We will make further adjustments as required to adjust to market conditions. Manufacturing our own equipment provides us with flexibility to adjust our capital spend based on our visibility of the market. Given the continued decline in activity levels, we further reduced our capital budget for 2016 to an estimated $1.6 billion, representing a 27% decline compared to 2015. We continue to believe in the strength of the long-term fundamentals of our business. Despite the worldwide activity declines in 2015 and challenges we expect to face going into 2016, energy demand is still anticipated to increase over the long term.
21
We plan to continue executing the following strategies in 2016:
- directing capital and resources into strategic growth markets, including unconventional plays, mature fields, and deepwater;
|
-
|
leveraging our broad technology offerings to provide value to our customers through integrated solutions and to enable them to more efficiently drill and complete their wells;
|
|
-
|
exploring additional opportunities for acquisitions that will enhance or augment our current portfolio of services and products, including those with technologies or distribution networks in areas where we do not already have significant operations;
|
|
-
|
investing in technology that will help our customers reduce reservoir uncertainty and increase operational efficiency;
|
|
-
|
improving working capital, and managing our balance sheet to maximize our financial flexibility; and
|
|
-
|
continuing to seek ways to be one of the most cost-efficient service providers in the industry by maintaining capital discipline and leveraging our scale and breadth of operations.
|
Our operating performance and business outlook are described in more detail in “Business Environment and Results of Operations.”
Financial markets, liquidity, and capital resources
We believe we have invested our cash balances conservatively and secured sufficient financing to help mitigate any near-term negative impact on our operations from adverse market conditions. In November 2015, we issued $7.5 billion aggregate principal amount of senior notes with the intention of using the net proceeds to finance a portion of the cash consideration of the Baker Hughes acquisition. We may incur additional debt or use cash on hand to finance the remainder of the cash portion of the merger consideration. For additional information on market conditions and the pending acquisition of Baker Hughes, see “Liquidity and Capital Resources,” “Business Environment and Results of Operations,”
Note 2
to the consolidated financial statements, and Note 8 to the consolidated financial statements.
22
LIQUIDITY AND CAPITAL RESOURCES
As of December 31, 2015, we had
$10.1 billion
of cash and equivalents, compared to
$2.3 billion
at
December 31, 2014
. Additionally, at
December 31, 2015
, we held
$96 million
of investments in fixed income securities held offshore compared to
$103 million
at
December 31, 2014
. These securities are reflected in "Other current assets" and "Other assets" in our consolidated balance sheets. As of
December 31, 2015
, approximately
$1.5 billion
of the
$10.1 billion
of cash and equivalents was held by our foreign subsidiaries, of which
$861 million
would be subject to United States tax if repatriated. However, our intent is to permanently reinvest these funds outside of the United States and our current plans do not suggest a need to repatriate them to fund our United States operations.
Significant sources and uses of cash
We had the following significant sources and uses of cash during the year ended December 31, 2015:
- Cash flows from operating activities were $
2.9 billion
in
2015
.
- In November 2015, we received $7.4 billion in net proceeds from the issuance of debt. We intend to use the net proceeds of this offering for general corporate purposes, including to finance a portion of the cash consideration component of our pending Baker Hughes acquisition and to pay related fees and expenses. See Note 8 to the consolidated financial statements for further information.
- Capital expenditures were $
2.2 billion
in
2015
. The capital expenditures in
2015
were predominantly made in our
Production Enhancement
,
Cementing
,
Sperry Drilling
,
Production Solutions
, and
Wireline and Perforating
product service lines.
- Our primary components of net working capital (receivables, inventories, and accounts payable) decreased during the year by a net
$1.0 billion
, primarily due to decreased business activity driven by current market conditions.
- We paid $
614 million
of dividends to our shareholders in
2015
.
- During the third quarter of 2015, we made the second installment payment of $333 million related to the settlement we reached during 2014 for the Macondo well incident. See
Note 9
to the consolidated financial statements for further information.
- We sold $
168 million
of property, plant, and equipment during
2015
.
Future sources and uses of cash
We issued $7.5 billion aggregate principal amount of senior notes in November 2015 for general corporate purposes, including to finance a portion of the cash consideration component of our pending acquisition of Baker Hughes. We may finance the remainder of the cash portion of the consideration for the acquisition with cash on hand, additional debt financing, or a combination thereof. We have $1.1 billion remaining under the senior unsecured bridge facility commitment we obtained for the acquisition, although we may obtain other debt financing in lieu of utilizing all or a portion of the bridge facility. We have not drawn any amounts under this facility as of
December 31, 2015
. See Note 8 to the consolidated financial statements for further information. Additionally, we expect to receive cash proceeds from the sale of the businesses we are currently marketing for sale as part of the regulatory review of the pending Baker Hughes acquisition. If the acquisition is not completed, we could be required to pay Baker Hughes a termination fee of $3.5 billion in certain circumstances where the termination of the merger agreement is related to failures to obtain regulatory clearances. See
Note 2
to the consolidated financial statements for further information about the pending acquisition and related divestitures.
We manufacture our own equipment, which allows us flexibility to increase or decrease our capital expenditures based on market conditions. Capital spending for
2016
is currently expected to be approximately $1.6 billion, a reduction of approximately $600 million, or 27%, from 2015 primarily due to the current market environment. The capital expenditures plan for
2016
is primarily directed towards our Production Enhancement, Production Solutions, Wireline and Perforating, and Cementing product service lines.
During 2014, we reached an agreement, subject to court approval, to settle a substantial portion of the plaintiffs' claims asserted against us relating to the Macondo well incident. We have $472 million of Macondo-related liabilities as of
December 31, 2015
, of which $400 million is expected to be paid in 2016. See
Note 9
to the consolidated financial statements for further information.
Subject to Board of Directors approval, our intention is to pay dividends representing at least 15% to 20% of our net income on an annual basis. Currently, our quarterly dividend rate is
$0.18
per share, or approximately
$154 million
per quarter.
Our Board of Directors has authorized a program to repurchase our common stock from time to time. Approximately
$5.7 billion
remains authorized for repurchases as of December 31, 2015, and may be used for open market and other share purchases. There were no repurchases made under the program during the year ended December 31, 2015.
We had $
322 million
of gross unrecognized tax benefits at
December 31, 2015
, of which we estimate $
152 million
may require a cash payment. We estimate that $
148 million
of the cash payment will not be settled within the next 12 months. We are not able to reasonably estimate in which future periods this amount will ultimately be settled and paid.
23
Contractual obligations
The following table summarizes our significant contractual obligations and other long-term liabilities as of
December 31, 2015
:
|
Payments Due
|
|||||||||||||||||||||
|
Millions of dollars
|
2016
|
2017
|
2018
|
2019
|
2020
|
Thereafter
|
Total
|
||||||||||||||
|
Long-term debt (a)
|
$
|
659
|
|
$
|
79
|
|
$
|
823
|
|
$
|
1,013
|
|
$
|
1,261
|
|
$
|
11,643
|
|
$
|
15,478
|
|
|
Interest on debt (b)
|
711
|
|
696
|
|
692
|
|
659
|
|
596
|
|
9,446
|
|
12,800
|
|
|||||||
|
Operating leases
|
257
|
|
171
|
|
132
|
|
96
|
|
60
|
|
228
|
|
944
|
|
|||||||
|
Purchase obligations (c)
|
873
|
|
391
|
|
152
|
|
28
|
|
29
|
|
50
|
|
1,523
|
|
|||||||
|
Other long-term liabilities (d)
|
37
|
|
10
|
|
10
|
|
10
|
|
9
|
|
32
|
|
108
|
|
|||||||
|
Total
|
$
|
2,537
|
|
$
|
1,347
|
|
$
|
1,809
|
|
$
|
1,806
|
|
$
|
1,955
|
|
$
|
21,399
|
|
$
|
30,853
|
|
|
(a)
|
Represents principal amounts of long-term debt, including current maturities, which excludes any unamortized debt issuance costs and discounts. See Note 8 to the consolidated financial statements.
|
|
(b)
|
Interest on debt includes
81
years of interest on
$300 million
of debentures at
7.6%
interest that become due in 2096.
|
|
(c)
|
Amount in
2016
primarily represents certain purchase orders for goods and services utilized in the ordinary course of our business.
|
|
(d)
|
Includes capital lease obligations and pension funding obligations. Amounts for pension funding obligations, which include international plans and are based on assumptions that are subject to change, are only included for
2016
as we are currently not able to reasonably estimate our contributions for years after
2016
.
|
Other factors affecting liquidity
Financial position in current market.
As of
December 31, 2015
, we had $
10.1 billion
of cash and equivalents,
$96 million
in fixed income investments, and a total of $
3.0 billion
of available committed bank credit under our revolving credit facility. In July 2015, we executed a new five-year revolving credit agreement with an initial capacity of $3.0 billion, increasing to $4.5 billion upon closing of the pending Baker Hughes acquisition. Furthermore, we have no financial covenants or material adverse change provisions in our bank agreements, and our debt maturities extend over a long period of time. Although a portion of earnings from our foreign subsidiaries is reinvested outside the United States indefinitely, we do not consider this to have a significant impact on our liquidity. We currently believe that cash on hand, cash flows generated from operations and our available credit facility will provide sufficient liquidity to manage our global cash needs in
2016
, including capital expenditures, working capital investments, dividends, if any, and contingent liabilities.
Guarantee agreements.
In the normal course of business, we have agreements with financial institutions under which approximately
$2.0 billion
of letters of credit, bank guarantees, or surety bonds were outstanding as of
December 31, 2015
. Some of the outstanding letters of credit have triggering events that would entitle a bank to require cash collateralization.
Credit ratings.
Credit ratings for our long-term debt remain A2 with Moody’s Investors Service (Moody's) and A with Standard & Poor’s. The credit ratings on our short-term debt remain P-1 with Moody’s and A-1 with Standard & Poor’s. While these credit ratings remained unchanged during 2015, after the 2014 announcement of the pending Baker Hughes acquisition, Standard & Poor’s placed all of our ratings on negative watch, and in October 2015 Moody's placed all of our ratings on review for downgrade.
Customer receivables
. In line with industry practice, we bill our customers for our services in arrears and are, therefore, subject to our customers delaying or failing to pay our invoices. In weak economic environments, we may experience increased delays and failures to pay our invoices due to, among other reasons, a reduction in our customers’ cash flow from operations and their access to the credit markets as well as unsettled political conditions. If our customers delay paying or fail to pay us a significant amount of our outstanding receivables, it could have a material adverse effect on our liquidity, consolidated results of operations, and consolidated financial condition. See “Business Environment and Results of Operations – International operations – Venezuela” for further discussion related to receivables from our primary customer in Venezuela.
24
BUSINESS ENVIRONMENT AND RESULTS OF OPERATIONS
We operate in approximately
80
countries throughout the world to provide a comprehensive range of services and products to the upstream oil and natural gas industry. A significant amount of our consolidated revenue is derived from the sale of services and products to major, national, and independent oil and natural gas companies worldwide. The industry we serve is highly competitive with many substantial competitors in each segment of our business. In
2015
,
2014
, and
2013
, based on the location of services provided and products sold,
44%
,
51%
, and 49% of our consolidated revenue was from the United States. No other country accounted for more than 10% of our revenue during these periods.
Operations in some countries may be adversely affected by unsettled political conditions, acts of terrorism, civil unrest, force majeure, war or other armed conflict, sanctions, expropriation or other governmental actions, inflation, changes in foreign currency exchange rates, foreign currency exchange restrictions, and highly inflationary currencies, as well as other geopolitical factors. We believe the geographic diversification of our business activities reduces the risk that loss of operations in any one country, other than the United States, would be materially adverse to our consolidated results of operations.
Activity within our business segments is significantly impacted by spending on upstream exploration, development, and production programs by our customers. Also impacting our activity is the status of the global economy, which impacts oil and natural gas consumption.
Some of the more significant determinants of current and future spending levels of our customers are oil and natural gas prices, global oil supply, the world economy, the availability of credit, government regulation, and global stability, which together drive worldwide drilling activity. Due to improved drilling and completion efficiencies as more of our customers move to multi-well pad drilling, our financial performance in North America is impacted by well count in the North America market. Additionally, our financial performance is significantly affected by oil and natural gas prices and worldwide rig activity, which are summarized in the following tables.
The following table shows the average oil and natural gas prices for West Texas Intermediate (WTI), United Kingdom Brent crude oil, and Henry Hub natural gas:
|
2015
|
2014
|
2013
|
|||||||
|
Oil price - WTI
(1)
|
$
|
48.69
|
|
$
|
93.37
|
|
$
|
97.99
|
|
|
Oil price - Brent
(1)
|
52.36
|
|
99.04
|
|
108.71
|
|
|||
|
Natural gas price - Henry Hub
(2)
|
2.63
|
|
4.39
|
|
3.73
|
|
|||
|
(1)
Oil price measured in dollars per barrel
(2) Natural gas price measured in dollars per million British thermal units (Btu), or MMBtu |
|||||||||
25
The historical average rig counts based on the weekly Baker Hughes Incorporated rig count information were as follows:
|
Land vs. Offshore
|
2015
|
2014
|
2013
|
|||
|
United States:
|
||||||
|
Land
|
943
|
|
1,804
|
|
1,705
|
|
|
Offshore (incl. Gulf of Mexico)
|
35
|
|
57
|
|
56
|
|
|
Total
|
978
|
|
1,861
|
|
1,761
|
|
|
Canada:
|
|
|
|
|
|
|
|
Land
|
189
|
|
378
|
|
352
|
|
|
Offshore
|
2
|
|
2
|
|
2
|
|
|
Total
|
191
|
|
380
|
|
354
|
|
|
International (excluding Canada):
|
||||||
|
Land
|
884
|
|
1,011
|
|
978
|
|
|
Offshore
|
283
|
|
326
|
|
318
|
|
|
Total
|
1,167
|
|
1,337
|
|
1,296
|
|
|
Worldwide total
|
2,336
|
|
3,578
|
|
3,411
|
|
|
Land total
|
2,016
|
|
3,193
|
|
3,035
|
|
|
Offshore total
|
320
|
|
385
|
|
376
|
|
|
Oil vs. Natural Gas
|
2015
|
2014
|
2013
|
|||
|
United States (incl. Gulf of Mexico):
|
||||||
|
Oil
|
751
|
|
1,528
|
|
1,375
|
|
|
Natural gas
|
227
|
|
333
|
|
386
|
|
|
Total
|
978
|
|
1,861
|
|
1,761
|
|
|
Canada:
|
||||||
|
Oil
|
84
|
|
218
|
|
234
|
|
|
Natural gas
|
107
|
|
162
|
|
120
|
|
|
Total
|
191
|
|
380
|
|
354
|
|
|
International (excluding Canada):
|
||||||
|
Oil
|
916
|
|
1,070
|
|
1,029
|
|
|
Natural gas
|
251
|
|
267
|
|
267
|
|
|
Total
|
1,167
|
|
1,337
|
|
1,296
|
|
|
Worldwide total
|
2,336
|
|
3,578
|
|
3,411
|
|
|
Oil total
|
1,751
|
|
2,816
|
|
2,638
|
|
|
Natural gas total
|
585
|
|
762
|
|
773
|
|
|
Drilling Type
|
2015
|
2014
|
2013
|
|
United States (incl. Gulf of Mexico):
|
|||
|
Horizontal
|
744
|
1,274
|
1,102
|
|
Vertical
|
139
|
376
|
435
|
|
Directional
|
95
|
211
|
224
|
|
Total
|
978
|
1,861
|
1,761
|
Our customers’ cash flows, in most instances, depend upon the revenue they generate from the sale of oil and natural gas. Lower oil and natural gas prices usually translate into lower exploration and production budgets.
WTI oil spot prices declined significantly towards the second half of 2014 from a high of $108 per barrel in June 2014, and continued to decline throughout 2015, ranging from a high of $61 per barrel in June 2015 to a low of $35 per barrel in December 2015. WTI oil spot prices reduced further into January 2016 to a low of $27 per barrel, a level which has not been experienced since 2003. Brent crude oil spot prices declined from a high of $115 per barrel in June 2014, and ranged from a high of $66 per barrel in May 2015 to a low of $35 per barrel in December 2015, and declined further to $26 per barrel in
26
January 2016. Crude oil prices continue to be negatively affected as the combination of robust world crude oil supply growth and weak global demand contribute to an increase in the rate of global inventory builds.
Brent crude oil spot prices had a monthly average in December 2015 of $38 per barrel, the lowest monthly average price since July 2004, while WTI oil spot prices averaged $37 per barrel in December 2015, the lowest monthly average price since April 2004. Prices continued to fall as OPEC producers indicated plans to continue the policy of defending market share in a low oil price environment and as global oil inventories continued to build. Crude oil production in the United States averaged an estimated 9.4 million barrels per day in 2015. The expansion of export possibilities in the United States contributed to the decreased differential between WTI and Brent crude oil spot prices, which has narrowed from an average of $3 per barrel in the third quarter of 2015 to $2 per barrel in the fourth quarter of 2015.
According to the United States Energy Information Administration (EIA) January 2016 "Short Term Energy Outlook," the EIA projects that Brent prices will average $40 per barrel in 2016. The EIA also noted that price projections reflect a scenario in which the largest inventory builds occur in the first half of 2016, keeping Brent prices below $40 per barrel through April. Global oil demand declined during the fourth quarter of 2015 as a result of mild temperatures in the early part of the winter in Japan, Europe and the United States, alongside weak economic sentiment in China, Brazil, Russia and other commodity-dependent economies. Although there are no signs that point to an immediate rebalance of the market, the International Energy Agency's (IEA) January 2016 "Oil Market Report" forecasts the 2016 global demand to average approximately 95.7 million barrels per day, which is up 1% from 2015, driven by an increase in the Asia Pacific region, while all other regions remain approximately the same.
The average 2015 full year Henry Hub natural gas price in the United States decreased approximately 40% from 2014 as the mild winter resulted in higher natural gas storage levels in 2015. The Henry Hub natural gas spot price averaged $1.93 per MMBtu in December, a decline of $0.73 per MMBtu, or 27%, from September. Record inventory levels, production growth, and forecasts for a warm winter contributed to spot prices remaining low. The EIA January 2016 “Short Term Energy Outlook” projects Henry Hub natural gas prices to average $2.65 per MMBtu in 2016. Over the long term, the EIA expects natural gas consumption in the residential and commercial sectors to increase, offsetting the decline in the power sector.
North America operations
Volatility in oil and natural gas prices can impact our customers’ drilling and production activities. During 2015, the average full year natural gas-directed rig count in North America decreased 161 rigs, or 33%, while the average full year oil directed rig count decreased 911 rigs, or 52%, from 2014. In the United States land market, there was a decline of 48% in the average rig count from 2014 levels.
The United States land rig count has dropped approximately 64% since its peak in November 2014. Price erosion for our services continued during 2015, specifically in North America, and we believe pricing pressure will continue until activity stabilizes. Current market conditions aside, in the long run, we believe the shift to unconventional oil and liquids-rich basins in the United States land market will continue to drive increased service intensity. This would create higher demand in fluid chemistry and other technologies required for these complex reservoirs, which will have positive implications for our operations when the energy market ultimately recovers.
In the Gulf of Mexico, the average offshore rig count for 2015 was down 39% compared to 2014. Activity in the Gulf of Mexico is dependent on, among other things, governmental approvals for permits, our customers' actions, and new deepwater rigs entering the market.
International operations
The average international rig count for 2015 decreased by 13% compared to 2014. Declining crude oil prices have caused several of our customers to reduce their budgets and defer several new projects; however, we have continued to work with our customers to improve project economics through technology and improved operating efficiency. Although the international markets have been more resilient than North America, they are not immune to the impacts of the lower commodity price environment and, therefore, our international operations could be further impacted in the near term.
Venezuela.
In February 2015, the Venezuelan government created a new foreign exchange rate mechanism, called the Marginal Currency System, or SIMADI. The new mechanism, which is the third system in a three-tier exchange control mechanism, is a floating market rate for the conversion of Bolívares to United States dollars. The three-tier exchange rate mechanisms are as follows: (i) the National Center of Foreign Commerce official rate of 6.3 Bolívares per United States dollar, which remains unchanged; (ii) the SICAD I, which will continue to hold periodic auctions for specific sectors of the economy with a rate of 13.5 Bolívares per United States dollar at December 31, 2015; and (iii) the SIMADI, which replaces the SICAD II system with a market rate of 199 Bolívares per United States dollar at December 31, 2015.
27
During the first quarter of 2015, we began utilizing the SIMADI mechanism to remeasure our net monetary assets denominated in Bolívares, which resulted in us recording a foreign currency loss of $199 million during the first quarter of 2015. As of December 31, 2015, our total net investment in Venezuela was approximately
$767 million
, with only
$8 million
of net monetary assets denominated in Bolívares. Also, at December 31, 2015 we had $31 million of surety bond guarantees outstanding relating to our Venezuelan operations. The United States dollar value of our net monetary assets and surety bond guarantees have significantly declined from December 31, 2014, primarily as a result of the currency devaluation in Venezuela.
Our total outstanding trade receivables in Venezuela were
$704 million
, which is more than
10%
of our gross trade receivables, as of December 31, 2015, compared to
$670 million
, or approximately
9%
of our gross trade receivables, as of
December 31, 2014
. We have experienced delays in collecting payment on our receivables from our primary customer in Venezuela, which contributed to the increase in receivables during the period. This was partially offset by a decline due to the currency devaluation. These receivables are not disputed, and we have not historically had material write-offs relating to this customer. Additionally, we routinely monitor the financial stability of our customers. Of the
$704 million
receivables in Venezuela as of December 31, 2015, the majority of which are United States dollar-denominated receivables,
$175 million
has been classified as long-term and included within “Other assets” on our consolidated balance sheets.
For additional information, see Part I, Item 1(a), “Risk Factors.”
28
RESULTS OF OPERATIONS IN
2015
COMPARED TO
2014
|
REVENUE:
|
Favorable
|
Percentage
|
|||||||||
|
Millions of dollars
|
2015
|
2014
|
(Unfavorable)
|
Change
|
|||||||
|
Completion and Production
|
$
|
13,682
|
|
$
|
20,253
|
|
$
|
(6,571
|
)
|
(32
|
)%
|
|
Drilling and Evaluation
|
9,951
|
|
12,617
|
|
(2,666
|
)
|
(21
|
)
|
|||
|
Total revenue
|
$
|
23,633
|
|
$
|
32,870
|
|
$
|
(9,237
|
)
|
(28
|
)%
|
|
|
|||||||||||
|
By geographic region:
|
|||||||||||
|
Completion and Production:
|
|||||||||||
|
North America
|
$
|
8,352
|
|
$
|
13,688
|
|
$
|
(5,336
|
)
|
(39
|
)%
|
|
Latin America
|
1,340
|
|
1,633
|
|
(293
|
)
|
(18
|
)
|
|||
|
Europe/Africa/CIS
|
2,081
|
|
2,595
|
|
(514
|
)
|
(20
|
)
|
|||
|
Middle East/Asia
|
1,909
|
|
2,337
|
|
(428
|
)
|
(18
|
)
|
|||
|
Total
|
13,682
|
|
20,253
|
|
(6,571
|
)
|
(32
|
)
|
|||
|
Drilling and Evaluation:
|
|||||||||||
|
North America
|
2,504
|
|
4,010
|
|
(1,506
|
)
|
(38
|
)
|
|||
|
Latin America
|
1,809
|
|
2,242
|
|
(433
|
)
|
(19
|
)
|
|||
|
Europe/Africa/CIS
|
2,094
|
|
2,895
|
|
(801
|
)
|
(28
|
)
|
|||
|
Middle East/Asia
|
3,544
|
|
3,470
|
|
74
|
|
2
|
|
|||
|
Total
|
9,951
|
|
12,617
|
|
(2,666
|
)
|
(21
|
)
|
|||
|
Total revenue by region:
|
|||||||||||
|
North America
|
10,856
|
|
17,698
|
|
(6,842
|
)
|
(39
|
)
|
|||
|
Latin America
|
3,149
|
|
3,875
|
|
(726
|
)
|
(19
|
)
|
|||
|
Europe/Africa/CIS
|
4,175
|
|
5,490
|
|
(1,315
|
)
|
(24
|
)
|
|||
|
Middle East/Asia
|
5,453
|
|
5,807
|
|
(354
|
)
|
(6
|
)
|
|||
29
|
OPERATING INCOME:
|
Favorable
|
Percentage
|
|||||||||
|
Millions of dollars
|
2015
|
2014
|
(Unfavorable)
|
Change
|
|||||||
|
Completion and Production
|
$
|
1,069
|
|
$
|
3,670
|
|
$
|
(2,601
|
)
|
(71
|
)%
|
|
Drilling and Evaluation
|
1,519
|
|
1,740
|
|
(221
|
)
|
(13
|
)
|
|||
|
Corporate and other
|
(576
|
)
|
(184
|
)
|
(392
|
)
|
213
|
|
|||
|
Impairments and other charges
|
(2,177
|
)
|
(129
|
)
|
(2,048
|
)
|
1,588
|
|
|||
|
Total operating income (loss)
|
$
|
(165
|
)
|
$
|
5,097
|
|
$
|
(5,262
|
)
|
(103
|
)%
|
|
|
|||||||||||
|
By geographic region:
|
|||||||||||
|
Completion and Production:
|
|||||||||||
|
North America
|
$
|
230
|
|
$
|
2,618
|
|
$
|
(2,388
|
)
|
(91
|
)%
|
|
Latin America
|
186
|
|
214
|
|
(28
|
)
|
(13
|
)
|
|||
|
Europe/Africa/CIS
|
280
|
|
389
|
|
(109
|
)
|
(28
|
)
|
|||
|
Middle East/Asia
|
373
|
|
449
|
|
(76
|
)
|
(17
|
)
|
|||
|
Total
|
1,069
|
|
3,670
|
|
(2,601
|
)
|
(71
|
)
|
|||
|
Drilling and Evaluation:
|
|||||||||||
|
North America
|
228
|
|
598
|
|
(370
|
)
|
(62
|
)
|
|||
|
Latin America
|
254
|
|
217
|
|
37
|
|
17
|
|
|||
|
Europe/Africa/CIS
|
243
|
|
300
|
|
(57
|
)
|
(19
|
)
|
|||
|
Middle East/Asia
|
794
|
|
625
|
|
169
|
|
27
|
|
|||
|
Total
|
1,519
|
|
1,740
|
|
(221
|
)
|
(13
|
)
|
|||
|
Total operating income by region
|
|||||||||||
|
(excluding Corporate and other):
|
|||||||||||
|
North America
|
458
|
|
3,216
|
|
(2,758
|
)
|
(86
|
)
|
|||
|
Latin America
|
440
|
|
431
|
|
9
|
|
2
|
|
|||
|
Europe/Africa/CIS
|
523
|
|
689
|
|
(166
|
)
|
(24
|
)
|
|||
|
Middle East/Asia
|
1,167
|
|
1,074
|
|
93
|
|
9
|
|
|||
Consolidated revenue in
2015
decreased
28%
compared to
2014
, associated with widespread pricing pressure and activity reductions on a global basis, primarily attributable to pressure pumping in North America and Europe/Africa/CIS. Revenue outside of North America was
54%
of consolidated revenue in
2015
and
46%
of consolidated revenue in
2014
.
We reported a consolidated operating loss of $165 million in 2015, as compared to operating income of $5.1 billion in 2014. This
$5.3 billion
decrease
was primarily driven by a significant decline in pressure pumping activity and pricing declines in North America as a result of the global downturn in the energy market. Also impacting consolidated operating income was $2.2 billion of impairments and other charges recorded in 2015 and $308 million of costs related to the pending Baker Hughes acquisition. See Note 3 to the consolidated financial statements for further information about impairments and other charges.
Completion and Production
Revenue declined $6.6 billion, or
32%
, compared to
2014
, with activity decreases across all regions, mainly North America.
|
•
|
North America revenue dropped
39%
, across most product service lines, mainly in the United States land market, as a result of steep rig count declines, pricing concessions, and reduced stimulation activity.
|
|
•
|
Latin America revenue decreased
18%
, mainly due to reduced activity and pricing in Mexico, primarily associated with pressure pumping services and production solution services, and decreased cementing activity in Colombia, Brazil, and Ecuador.
|
|
•
|
Europe/Africa/CIS revenue fell
20%
, as a result of reduced well completion services and currency weakness in Norway, lower pressure pumping services and currency weakness in Russia, a decrease in stimulation activity in Egypt, a reduction in completion tools sales in Kazakhstan, and decreased pipeline and process services in the United Kingdom. These reductions were partially offset by improved completion tool sales in Nigeria.
|
30
|
•
|
Middle East/Asia revenue declined by
18%
, primarily due to decreased pressure pumping and production solution services in Australia and Saudi Arabia, reduced activity in the majority of our product service lines in Malaysia and Indonesia, and lower pressure pumping services and completion tool sales in China, which were partially offset by higher completion tool sales in Saudi Arabia and United Arab Emirates, and improved pipeline and process services in China.
|
|
•
|
Revenue outside of North America was
39%
of total segment revenue in
2015
and
32%
of total segment revenue in
2014
.
|
Operating income was
$1.1 billion
, a decrease of $2.6 billion, or
71%
compared to
2014
, driven predominantly by the decline in North America.
|
•
|
North America operating income declined
91%
, primarily due to the fall in rig counts and decreased profitability for well completion services and stimulation activity in the United States land market.
|
|
•
|
Latin America operating income declined
13%
, due to lower pressure pumping services in Argentina and Mexico, reduced cementing services in Colombia, and lower production solution services in Mexico, which were partially offset by increased activity across most product service lines in Venezuela.
|
|
•
|
Europe/Africa/CIS operating income fell
28%
compared to
2014
, mainly due to reduced cementing services in Norway and Nigeria, lower completion tool sales in Kazakhstan and Nigeria, and lower stimulation activity in Egypt, which were partially offset by higher stimulation activity in Angola, and increased cementing and production solution services in Algeria.
|
|
•
|
Middle East/Asia operating income dropped
17%
, primarily due to decreased pressure pumping services in Australia and Saudi Arabia, lower completion tool sales in Malaysia, and reduced activity and pricing pressure for production solution services in Saudi Arabia, which were partially offset by increased completion tools sales in Saudi Arabia.
|
Drilling and Evaluation
Revenue decreased $2.7 billion, or
21%
, compared to
2014
, primarily due to reduced activity across most product service lines.
|
•
|
North America revenue declined
38%
, due to a drop in activity across all product service lines, primarily as a result of pricing concessions and reduced activity levels in the United States land market, and lower drilling services in the Gulf of Mexico and Canada.
|
|
•
|
Latin America revenue decreased
19%
, as a result of reduced drilling activity in Colombia and Ecuador, lower software sales and project management services in Mexico, and reduced logging services in Mexico and Venezuela, which were partially offset by higher fluid services in Mexico.
|
|
•
|
Europe/Africa/CIS revenue fell
28%
, due to a decline in fluid services in Norway, reduced drilling activity in Angola, Egypt, Russia, and the United Kingdom, and lower offshore services in Nigeria.
|
|
•
|
Middle East/Asia revenue was relatively flat as increased project management services throughout the region and higher drilling services in Saudi Arabia and Kuwait were partially offset by lower drilling and offshore activity in Malaysia.
|
|
•
|
Revenue outside of North America was
75%
of total segment revenue in
2015
and
68%
of total segment revenue in
2014
.
|
Operating income was
$1.5 billion
, a decrease of
13%
compared to
2014
. All regions benefited from the cessation of recognizing depreciation expense on assets held for sale. See Note 2 to the consolidated financial statements for further information.
|
•
|
North America operating income was down
62%
from
2014
due to a decline in activity across all product service lines, predominately driven by the United States land market.
|
|
•
|
Latin America operating income grew
17%
, mainly due to improved fluid services in Venezuela, which was partially offset by reduced offshore activity in Brazil and lower project management services in Mexico.
|
|
•
|
Europe/Africa/CIS operating income fell
19%
, primarily due to lower fluid services in Norway, reduced drilling services in Angola, and a decrease in logging services in Nigeria, which were partially offset by higher fluid services in Kazakhstan.
|
|
•
|
Middle East/Asia operating income increased
27%
, driven by higher fluid and logging services in Saudi Arabia and Iraq, increased project management services in Saudi Arabia, Iraq, and India, increased fluid services in India, and higher logging services in Kuwait.
|
Corporate and other
expenses increased to $
576 million
in
2015
compared to $
184 million
in
2014
, primarily due to $308 million of costs related to the pending Baker Hughes acquisition recorded in 2015, as compared to $17 million in 2014. Additionally, in 2014, we recorded a reduction of our Macondo-related loss contingency liability and an expected insurance recovery totaling $195 million.
Impairments and other charges.
As a result of the downturn in the energy market and its corresponding impact on our business outlook, we recorded a total of approximately $2.2 billion in company-wide charges during 2015, which consisted of equipment write-offs, asset impairments, expenses and write-downs related to idle equipment, inventory write-downs, impairments of intangible assets, severance costs, facility closures, and other charges. During 2014, $129 million was recorded for impairments and other charges. See
Note 3
to the consolidated financial statements for further information.
31
NONOPERATING ITEMS
Interest expense, net
increased $64 million in 2015, compared to 2014, primarily due to fees associated with the bridge facility commitment related to the pending acquisition of Baker Hughes and additional interest expense associated with the $7.5 billion of senior notes issued in November 2015. See Note 8 to the consolidated financial statements for further information.
Other, net
was a $324 million loss in 2015, as compared to a $2 million loss in 2014, primarily due to a $199 million foreign exchange loss we incurred in Venezuela in the first quarter of 2015 as a result of utilizing the new SIMADI currency exchange mechanism, coupled with foreign currency exchange losses in Brazil and Argentina. See Note 3 to the consolidated financial statements and "Business Environment and Results of Operations" for further information about Venezuela.
Effective tax rate.
Our effective tax rate was 29.3% for 2015 and 27.1% for 2014. The effective tax rates in both periods were positively impacted by lower tax rates in certain foreign jurisdictions. The effective tax rate for 2015 was also impacted by the tax effects of the $2.2 billion of impairments and other charges, a change in mix of geographic earnings in which we experienced low levels of United States income during the year, additional valuation allowances booked on foreign deferred tax assets, a $199 million foreign currency exchange loss in Venezuela, and non-deductible costs related to the pending Baker Hughes acquisition. The effective tax rate for 2014 was positively impacted by a $201 million net operating loss valuation allowance released as a result of a reorganization of our legal entity structure in Brazil. This was partially offset by the following other items in 2014: tax expenses related to Macondo, which was tax-effected at the United States statutory rate, a write-off of certain prepaid tax assets recorded in Iraq, additional tax expenses related to the settlement of a research and development credit with the United States tax authorities, and tax expenses related to other unrecognized tax benefits. See Note 10 to the consolidated financial statements for further information regarding income taxes.
32
RESULTS OF OPERATIONS IN
2014
COMPARED TO
2013
|
REVENUE:
|
Favorable
|
Percentage
|
|||||||||
|
Millions of dollars
|
2014
|
2013
|
(Unfavorable)
|
Change
|
|||||||
|
Completion and Production
|
$
|
20,253
|
|
$
|
17,506
|
|
$
|
2,747
|
|
16
|
%
|
|
Drilling and Evaluation
|
12,617
|
|
11,896
|
|
721
|
|
6
|
|
|||
|
Total revenue
|
$
|
32,870
|
|
$
|
29,402
|
|
$
|
3,468
|
|
12
|
%
|
|
|
|||||||||||
|
By geographic region:
|
|||||||||||
|
Completion and Production:
|
|||||||||||
|
North America
|
$
|
13,688
|
|
$
|
11,417
|
|
$
|
2,271
|
|
20
|
%
|
|
Latin America
|
1,633
|
|
1,586
|
|
47
|
|
3
|
|
|||
|
Europe/Africa/CIS
|
2,595
|
|
2,391
|
|
204
|
|
9
|
|
|||
|
Middle East/Asia
|
2,337
|
|
2,112
|
|
225
|
|
11
|
|
|||
|
Total
|
20,253
|
|
17,506
|
|
2,747
|
|
16
|
|
|||
|
Drilling and Evaluation:
|
|||||||||||
|
North America
|
4,010
|
|
3,795
|
|
215
|
|
6
|
|
|||
|
Latin America
|
2,242
|
|
2,323
|
|
(81
|
)
|
(3
|
)
|
|||
|
Europe/Africa/CIS
|
2,895
|
|
2,834
|
|
61
|
|
2
|
|
|||
|
Middle East/Asia
|
3,470
|
|
2,944
|
|
526
|
|
18
|
|
|||
|
Total
|
12,617
|
|
11,896
|
|
721
|
|
6
|
|
|||
|
Total revenue by region:
|
|||||||||||
|
North America
|
17,698
|
|
15,212
|
|
2,486
|
|
16
|
|
|||
|
Latin America
|
3,875
|
|
3,909
|
|
(34
|
)
|
(1
|
)
|
|||
|
Europe/Africa/CIS
|
5,490
|
|
5,225
|
|
265
|
|
5
|
|
|||
|
Middle East/Asia
|
5,807
|
|
5,056
|
|
751
|
|
15
|
|
|||
33
|
OPERATING INCOME:
|
Favorable
|
Percentage
|
|||||||||
|
Millions of dollars
|
2014
|
2013
|
(Unfavorable)
|
Change
|
|||||||
|
Completion and Production
|
$
|
3,670
|
|
$
|
2,875
|
|
$
|
795
|
|
28
|
%
|
|
Drilling and Evaluation
|
1,740
|
|
1,770
|
|
(30
|
)
|
(2
|
)
|
|||
|
Corporate and other
|
(184
|
)
|
(1,507
|
)
|
1,323
|
|
(88
|
)
|
|||
|
Impairments and other charges
|
(129
|
)
|
—
|
|
(129
|
)
|
100
|
|
|||
|
Total operating income
|
$
|
5,097
|
|
$
|
3,138
|
|
$
|
1,959
|
|
62
|
%
|
|
|
|||||||||||
|
By geographic region:
|
|||||||||||
|
Completion and Production:
|
|||||||||||
|
North America
|
$
|
2,618
|
|
$
|
1,916
|
|
$
|
702
|
|
37
|
%
|
|
Latin America
|
214
|
|
211
|
|
3
|
|
1
|
|
|||
|
Europe/Africa/CIS
|
389
|
|
356
|
|
33
|
|
9
|
|
|||
|
Middle East/Asia
|
449
|
|
392
|
|
57
|
|
15
|
|
|||
|
Total
|
3,670
|
|
2,875
|
|
795
|
|
28
|
|
|||
|
Drilling and Evaluation:
|
|||||||||||
|
North America
|
598
|
|
656
|
|
(58
|
)
|
(9
|
)
|
|||
|
Latin America
|
217
|
|
307
|
|
(90
|
)
|
(29
|
)
|
|||
|
Europe/Africa/CIS
|
300
|
|
334
|
|
(34
|
)
|
(10
|
)
|
|||
|
Middle East/Asia
|
625
|
|
473
|
|
152
|
|
32
|
|
|||
|
Total
|
1,740
|
|
1,770
|
|
(30
|
)
|
(2
|
)
|
|||
|
Total operating income by region
|
|||||||||||
|
(excluding Corporate and other):
|
|||||||||||
|
North America
|
3,216
|
|
2,572
|
|
644
|
|
25
|
|
|||
|
Latin America
|
431
|
|
518
|
|
(87
|
)
|
(17
|
)
|
|||
|
Europe/Africa/CIS
|
689
|
|
690
|
|
(1
|
)
|
—
|
|
|||
|
Middle East/Asia
|
1,074
|
|
865
|
|
209
|
|
24
|
|
|||
Consolidated revenue in
2014
increased
12%
compared to
2013
, primarily as a result of higher stimulation activity in the United States land market and increased activity in almost all of our product service lines in the Eastern Hemisphere, which were partially offset by lower activity in Latin America. Revenue outside of North America was
46%
of consolidated revenue in
2014
and
48%
of consolidated revenue in
2013
.
The
$2.0 billion
increase in consolidated operating income compared to
2013
was primarily a result of various corporate expense items in
2013
as well as increased stimulation activity in the United States land market and growth in Middle East/Asia in 2014, which more than offset lower activity and margins experienced in Latin America. Operating income in
2014
was positively impacted by $195 million of Macondo-related items as a result of a reduction of our loss contingency liability and an expected insurance recovery, offset by $129 million of impairments and other charges related to severance and asset write-offs and $17 million of Baker Hughes acquisition-related costs. Operating income in
2013
was negatively impacted by the following pre-tax items: a $1.0 billion increase in our loss contingency liability related to Macondo and a $55 million charge related to a charitable contribution to the National Fish and Wildlife Foundation, partially offset by a $28 million value-added tax refund receivable in Brazil.
34
Completion and Production
Revenue increased
16
% compared to
2013
, with activity increases across all regions and predominately in North America.
|
•
|
North America revenue rose
20%
primarily as a result of increased stimulation activity in the United States land market.
|
|
•
|
Latin America revenue improved
3
%, as increased activity levels in the majority of our product service lines in Venezuela and Argentina more than offset a decrease in stimulation activity in Mexico and lower pressure pumping activity in Brazil.
|
|
•
|
Europe/Africa/CIS revenue grew
9
%, driven by
strong growth across most of our product service lines in Angola and the United Kingdom, as well as increased completion tools sales in Nigeria, which were partially offset by lower pressure pumping activity and currency weakness in Norway.
|
|
•
|
Middle East/Asia revenue improved
11
% primarily due to increased activity in the majority of our product service lines in Saudi Arabia, higher cementing activity in Thailand, and increased stimulation and artificial lift activity in Australia, which more than offset reduced activity levels in Oman and a decline in completion tools sales in Malaysia.
|
|
•
|
Revenue outside of North America was
32%
of total segment revenue in
2014
and
35%
of total segment revenue in
2013
.
|
Operating income increased
28
% compared to
2013
, driven predominantly by strong growth in North America coupled with modest improvement in the Eastern Hemisphere.
|
•
|
North America operating income rose
37%
from
2013
, primarily due to increased profitability for stimulation activity in the United States land market.
|
|
•
|
Latin America operating income was flat as improved pressure pumping activity in Argentina and increased profitability for well intervention services in Mexico and Venezuela were offset by reduced completion tools sales and profitability in Brazil, Mexico and Trinidad.
|
|
•
|
Europe/Africa/CIS operating income grew
9
% compared to
2013
, primarily due to higher completion products sales in Nigeria, Angola and the United Kingdom, which were partially offset by decreased well completion activity and currency weakness in Russia and Norway.
|
|
•
|
Middle East/Asia operating income rose by
15
% primarily due to increased profitability for the majority of our product services lines in Saudi Arabia, which was partially offset by reduced activity levels in China and Oman.
|
Drilling and Evaluation
Revenue increased
6
% compared to
2013
, primarily due to a strong performance in the Eastern Hemisphere, primarily in Saudi Arabia, which was partially offset by a decrease in drilling activity and consulting services in Latin America.
|
•
|
North America revenue rose by
6
% due to increased fluids activity in the United States land market and higher activity in the majority of our product service lines in the Gulf of Mexico.
|
|
•
|
Latin America revenue decreased 3%, as reduced activity across all of our product service lines in Mexico and a decline in drilling activity in Brazil more than offset increased activity across all of our product service lines in Venezuela and Argentina.
|
|
•
|
Europe/Africa/CIS revenue was relatively flat as increased testing activity in Angola and Nigeria was offset by decreased drilling and fluids activity in Egypt and Libya.
|
|
•
|
Middle East/Asia revenue rose
18
% as a result of increased activity in all of our product services lines in Saudi Arabia and increased demand for drilling services in Thailand and fluids activity in Australia, India and Iraq.
|
|
•
|
Revenue outside of North America was
68%
of total segment revenue in both
2014
and
2013
.
|
Operating income decreased
2
% compared to
2013
, primarily due to lower drilling activity and margins in Latin America and lower profitability in the Europe/Africa/CIS region. This decrease was partially offset by strong activity growth in the Middle East/Asia region.
|
•
|
North America operating income was down
9%
from
2013
due to a decline in drilling services in Canada and the United States land market.
|
|
•
|
Latin America operating income declined
29%
mainly due to reduced activity levels in Mexico and lower drilling activity and pricing in Brazil, which were partially offset by improved activity levels in Argentina.
|
|
•
|
Europe/Africa/CIS operating income fell
10%
primarily due to lower activity and currency weakness in Russia and Norway.
|
|
•
|
Middle East/Asia operating income increased
32%
primarily due to an increase in demand and profitability for drilling activity in Saudi Arabia, as well as improved demand for drilling services in Thailand, which were partially offset by reduced drilling services and logging activity in China.
|
Corporate and other
expenses were $
184 million
in
2014
compared to $
1.5 billion
in
2013
. The significant decrease was primarily due to Macondo-related items. In 2013, we recorded a $1.0 billion increase to our loss contingency for the Macondo well incident, while in 2014 we recorded a reduction of our loss contingency liability and an expected insurance recovery totaling $195 million. We recorded $17 million of costs in 2014 related to the pending Baker Hughes acquisition and a $55 million charge in 2013 related to a charitable contribution to the National Fish and Wildlife Foundation. See Note 9 to the consolidated financial statements for further information regarding the Macondo well incident.
35
Impairments and other charges.
Primarily as a result of the downturn in the energy market and its corresponding impact on the company’s business outlook, we recorded a total of approximately $129 million in company-wide charges during 2014, which consisted of fixed asset impairments and write-offs, inventory write-downs, impairments of intangible assets, severance costs, and other charges. See
Note 3
to the consolidated financial statements for further information.
NONOPERATING ITEMS
Interest expense, net
increased $52 million in 2014, compared to 2013, primarily due to higher interest expense as a result of the issuance of $3.0 billion aggregate principal amount of senior notes in August 2013.
Effective tax rate.
Our effective tax rate was 27.1% for 2014 and 23.5% for 2013. The effective tax rate for 2014 was positively impacted by a $201 million net operating loss valuation allowance released as a result of a reorganization of our legal entity structure in Brazil, as well as lower tax rates in certain foreign jurisdictions. Partially offsetting these items were tax expenses related to Macondo items recorded during 2014, which was tax-effected at the United States statutory rate, as well as total charges of approximately $150 million for a write-off of certain prepaid tax assets recorded in Iraq, additional tax expenses related to the settlement of a research and development credit with the United States tax authorities, and tax expenses related to other unrecognized tax benefits. Our effective tax rate for 2013 was also positively impacted by lower tax rates in certain foreign jurisdictions; federal tax benefits of approximately $50 million due to the reinstatement of certain tax benefits and credits related to the first quarter of 2013 enactment of the American Taxpayer Relief Act of 2012; and the tax impact related to an increase of our Macondo-related loss contingency recorded during 2013, which was tax-effected at the United States statutory rate. See Note 10 to the consolidated financial statements for further information regarding income taxes.
36
CRITICAL ACCOUNTING ESTIMATES
The preparation of financial statements requires the use of judgments and estimates. Our critical accounting policies are described below to provide a better understanding of how we develop our assumptions and judgments about future events and related estimations and how they can impact our financial statements. A critical accounting estimate is one that requires our most difficult, subjective, or complex judgments and assessments and is fundamental to our results of operations. We identified our most critical accounting estimates to be:
|
-
|
forecasting our effective income tax rate, including our future ability to utilize foreign tax credits and the realizability of deferred tax assets, and providing for uncertain tax positions;
|
|
-
|
legal, environmental, and investigation matters;
|
|
-
|
valuations of long-lived assets, including intangible assets and goodwill;
|
|
-
|
purchase price allocation for acquired businesses;
|
|
-
|
pensions;
|
|
-
|
allowance for bad debts; and
|
|
-
|
percentage-of-completion accounting for long-term, integrated project management contracts.
|
We base our estimates on historical experience and on various other assumptions we believe to be reasonable according to the current facts and circumstances, the results of which form the basis for making judgments about the carrying values of assets and liabilities that are not readily apparent from other sources. We believe the following are the critical accounting policies used in the preparation of our consolidated financial statements, as well as the significant estimates and judgments affecting the application of these policies. This discussion and analysis should be read in conjunction with our consolidated financial statements and related notes included in this report.
Income tax accounting
We recognize the amount of taxes payable or refundable for the current year and use an asset and liability approach in recognizing the amount of deferred tax liabilities and assets for the future tax consequences of events that have been recognized in our financial statements or tax returns. As of December 31, 2015, we adopted a new accounting standard which requires that all deferred tax assets and liabilities be classified as noncurrent on the balance sheet instead of separating deferred taxes into current and noncurrent amounts. See Note 16 to the consolidated financial statements for additional information. We apply the following basic principles in accounting for our income taxes:
|
-
|
a current tax liability or asset is recognized for the estimated taxes payable or refundable on tax returns for the current year;
|
|
-
|
a deferred tax liability or asset is recognized for the estimated future tax effects attributable to temporary differences and carryforwards;
|
|
-
|
the measurement of current and deferred tax liabilities and assets is based on provisions of the enacted tax law, and the effects of potential future changes in tax laws or rates are not considered; and
|
|
-
|
the value of deferred tax assets is reduced, if necessary, by the amount of any tax benefits that, based on available evidence, are not expected to be realized.
|
We determine deferred taxes separately for each tax-paying component (an entity or a group of entities that is consolidated for tax purposes) in each tax jurisdiction. That determination includes the following procedures:
|
-
|
identifying the types and amounts of existing temporary differences;
|
|
-
|
measuring the total deferred tax liability for taxable temporary differences using the applicable tax rate;
|
|
-
|
measuring the total deferred tax asset for deductible temporary differences and operating loss carryforwards using the applicable tax rate;
|
|
-
|
measuring the deferred tax assets for each type of tax credit carryforward; and
|
|
-
|
reducing the deferred tax assets by a valuation allowance if, based on available evidence, it is more likely than not that some portion or all of the deferred tax assets will not be realized.
|
Our methodology for recording income taxes requires a significant amount of judgment in the use of assumptions and estimates. Additionally, we use forecasts of certain tax elements, such as taxable income and foreign tax credit utilization, as well as evaluate the feasibility of implementing tax planning strategies. Given the inherent uncertainty involved with the use of such variables, there can be significant variation between anticipated and actual results. Unforeseen events may significantly impact these variables, and changes to these variables could have a material impact on our income tax accounts related to both continuing and discontinued operations.
We have operations in approximately
80
countries. Consequently, we are subject to the jurisdiction of a significant number of taxing authorities. The income earned in these various jurisdictions is taxed on differing bases, including income actually earned, income deemed earned, and revenue-based tax withholding. The final determination of our income tax liabilities involves the interpretation of local tax laws, tax treaties, and related authorities in each jurisdiction. Changes in the operating environment, including changes in tax law and currency/repatriation controls, could impact the determination of our income tax liabilities for a tax year.
37
Tax filings of our subsidiaries, unconsolidated affiliates, and related entities are routinely examined in the normal course of business by tax authorities. These examinations may result in assessments of additional taxes, which we work to resolve with the tax authorities and through the judicial process. Predicting the outcome of disputed assessments involves some uncertainty. Factors such as the availability of settlement procedures, willingness of tax authorities to negotiate, and the operation and impartiality of judicial systems vary across the different tax jurisdictions and may significantly influence the ultimate outcome. We review the facts for each assessment, and then utilize assumptions and estimates to determine the most likely outcome and provide taxes, interest, and penalties as needed based on this outcome. We provide for uncertain tax positions pursuant to current accounting standards, which prescribe a minimum recognition threshold and measurement methodology that a tax position taken or expected to be taken in a tax return is required to meet before being recognized in the financial statements. The standards also provide guidance for derecognition classification, interest and penalties, accounting in interim periods, disclosure, and transition.
Legal, environmental and investigation matters
As discussed in
Note 9
of our consolidated financial statements, as of
December 31, 2015
, we have accrued an estimate of the probable and estimable costs for the resolution of some of our legal, environmental, and investigation matters. For other matters for which the liability is not probable and reasonably estimable, we have not accrued any amounts. Attorneys in our legal department monitor and manage all claims filed against us and review all pending investigations. Generally, the estimate of probable costs related to these matters is developed in consultation with internal and outside legal counsel representing us. Our estimates are based upon an analysis of potential results, assuming a combination of litigation and settlement strategies. The accuracy of these estimates is impacted by, among other things, the complexity of the issues and the amount of due diligence we have been able to perform. We attempt to resolve these matters through settlements, mediation, and arbitration proceedings when possible. If the actual settlement costs, final judgments, or fines, after appeals, differ from our estimates, our future financial results may be adversely affected. We have in the past recorded significant adjustments to our initial estimates of these types of contingencies.
Value of long-lived assets, including intangible assets and goodwill
We carry a variety of long-lived assets on our balance sheet including property, plant and equipment, goodwill, and other intangibles. We conduct impairment tests on long-lived assets whenever events or changes in circumstances indicate that the carrying value may not be recoverable. Impairment is the condition that exists when the carrying amount of a long-lived asset exceeds its fair value, and any impairment charge that we record reduces our earnings. We review the carrying value of these assets based upon estimated future cash flows while taking into consideration assumptions and estimates including the future use of the asset, remaining useful life of the asset, and service potential of the asset.
Goodwill is the excess of the cost of an acquired entity over the net of the amounts assigned to assets acquired and liabilities assumed. We test goodwill for impairment annually, during the third quarter, or if an event occurs or circumstances change that would more likely than not reduce the fair value of a reporting unit below its carrying amount. For purposes of performing the goodwill impairment test our reporting units are the same as our reportable segments, the Completion and Production division and the Drilling and Evaluation division. See
Note 1
to the consolidated financial statements for our accounting policies related to long-lived assets and intangible assets, as well as the results of our goodwill impairment assessment.
The quantitative impairment test we perform for goodwill utilizes certain assumptions, including forecasted revenue and costs assumptions. If the crude oil market continues to decline and remains at low levels for a sustained period of time, we could record an impairment of the carrying value of our goodwill in the future. If crude oil prices decline further or remain at low levels, to the extent appropriate we expect to perform our goodwill impairment assessment on a more frequent basis to determine whether an impairment is required.
Acquisitions-purchase price allocation
We allocate the purchase price of an acquired business to its identifiable assets and liabilities based on estimated fair values. The excess of the purchase price over the amount allocated to the assets and liabilities, if any, is recorded as goodwill. We use all available information to estimate fair values, including quoted market prices, the carrying value of acquired assets, and widely accepted valuation techniques such as discounted cash flows. We engage third-party appraisal firms to assist in fair value determination of inventories, identifiable intangible assets, and any other significant assets or liabilities when appropriate. The judgments made in determining the estimated fair value assigned to each class of assets acquired and liabilities assumed, as well as asset lives, can materially impact our results of operations. Our acquisitions may also include contingent consideration, or earn-out provisions, which provide for additional consideration to be paid to the seller if certain future conditions are met. These earn-out provisions are estimated and recognized at fair value at the acquisition date based on projected earnings or other financial metrics over specified periods after the acquisition date. These estimates are reviewed during the specified period and adjusted based on actual results.
Pensions
Our pension benefit obligations and expenses are calculated using actuarial models and methods. Two of the more critical assumptions and estimates used in the actuarial calculations are the discount rate for determining the current value of benefit obligations and the expected long-term rate of return on plan assets used in determining net periodic benefit cost. Other
38
critical assumptions and estimates used in determining benefit obligations and cost, including demographic factors such as retirement age, mortality, and turnover, are evaluated periodically and updated accordingly to reflect our actual experience.
Discount rates are determined annually and are based on the prevailing market rate of a portfolio of high-quality debt instruments with maturities matching the expected timing of the payment of the benefit obligations. Expected long-term rates of return on plan assets are determined annually and are based on an evaluation of our plan assets and historical trends and experience, taking into account current and expected market conditions. These assumptions differ based on varying factors specific to each particular country or economic environment.
The discount rate utilized in 2015 to determine the projected benefit obligation at the measurement date for our United Kingdom pension plan, which constituted 81% of our international plans’ pension obligations, was 3.90%, compared to a discount rate of 3.75% utilized in 2014. The expected long-term rate of return assumption used for our United Kingdom pension plan expense was 6.0% in 2015 and 6.5% in 2014.
The following table illustrates the sensitivity to changes in certain assumptions, holding all other assumptions constant, for our United Kingdom pension plan.
|
Effect on
|
||||||
|
Millions of dollars
|
Pretax Pension Expense in 2015
|
Pension Benefit Obligation at December 31, 2015
|
||||
|
50-basis-point decrease in discount rate
|
$
|
2
|
|
$
|
92
|
|
|
50-basis-point increase in discount rate
|
(2
|
)
|
(80
|
)
|
||
|
50-basis-point decrease in expected long-term rate of return
|
4
|
|
NA
|
|
||
|
50-basis-point increase in expected long-term rate of return
|
(4
|
)
|
NA
|
|
||
Our international defined benefit plans reduced pretax income by $42 million in
2015
, $36 million in
2014
, and $32 million in
2013
. Included in these amounts was income from expected return on plan assets of $48 million in
2015
, $52 million in
2014
, and $44 million in
2013
. Actual returns on international plan assets totaled $34 million in
2015
, compared to $69 million in
2014
. Our net actuarial loss, net of tax, related to international pension plans was
$205 million
at
December 31, 2015
and
$298 million
at
December 31, 2014
. In our international plans where employees earn additional benefits for continued service, actuarial gains and losses will be recognized in operating income over a period of two to 20 years, which represents the estimated average remaining service of the participant group expected to receive benefits. In our international plans where benefits are not accrued for continued service, actuarial gains and losses will be recognized in operating income over a period of 17 to 31 years, which represents the estimated average remaining lifetime of the benefit obligations. These ranges reflect varying maturity levels among the plans.
During
2015
, we made contributions of $18 million to our international defined benefit plans. We expect to make contributions of approximately
$14 million
to our international defined benefit plans in
2016
.
The actuarial assumptions used in determining our pension benefit obligations may differ materially from actual results due to changing market and economic conditions, higher or lower withdrawal rates, and longer or shorter life spans of participants. While we believe that the assumptions used are appropriate, differences in actual experience or changes in assumptions may materially affect our financial position or results of operations. See
Note 15
to the consolidated financial statements for further information related to defined benefit and other postretirement benefit plans.
We evaluate our accounts receivable through a continuous process of assessing our portfolio on an individual customer and overall basis. This process consists of a thorough review of historical collection experience, current aging status of the customer accounts, financial condition of our customers, and whether the receivables involve retainages. We also consider the economic environment of our customers, both from a marketplace and geographic perspective, in evaluating the need for an allowance. Based on our review of these factors, we establish or adjust allowances for specific customers and the accounts receivable portfolio as a whole. This process involves a high degree of judgment and estimation, and frequently involves significant dollar amounts. Accordingly, our results of operations can be affected by adjustments to the allowance due to actual write-offs that differ from estimated amounts. Our estimates of allowances for bad debts have historically been accurate. Over the last five years, our estimates of allowances for bad debts, as a percentage of notes and accounts receivable before the allowance, have ranged from 1.6% to 2.7%. At
December 31, 2015
, allowance for bad debts totaled
$145 million
, or 2.7% of notes and accounts receivable before the allowance. At
December 31, 2014
, allowance for bad debts totaled
$137 million
, or 1.8% of notes and accounts receivable before the allowance. A hypothetical 100 basis point change in our estimate of the collectability of our notes and accounts receivable balance as of
December 31, 2015
would have resulted in a $53 million adjustment to
2015
total operating costs and expenses. See
Note 5
to the consolidated financial statements for further information.
39
Percentage of completion
Revenue from certain long-term, integrated project management contracts to provide well construction and completion services is reported on the percentage-of-completion method of accounting. Progress is generally based upon physical progress related to contractually defined units of work. At the outset of each contract, we prepare a detailed analysis of our estimated cost to complete the project. Risks related to service delivery, usage, productivity, and other factors are considered in the estimation process. The recording of profits and losses on long-term contracts requires an estimate of the total profit or loss over the life of each contract. This estimate requires consideration of total contract value, change orders, and claims, less costs incurred and estimated costs to complete. Anticipated losses on contracts are recorded in full in the period in which they become evident. Profits are recorded based upon the total estimated contract profit times the current percentage complete for the contract.
At least quarterly, significant projects are reviewed in detail by senior management. There are many factors that impact future costs, including weather, inflation, labor and community disruptions, timely availability of materials, productivity, and other factors as outlined in Item 1(a), “Risk Factors.” These factors can affect the accuracy of our estimates and materially impact our future reported earnings. See
Note 1
to the consolidated financial statements for further information.
OFF BALANCE SHEET ARRANGEMENTS
At
December 31, 2015
, we had no material off balance sheet arrangements, except for operating leases. For information on our contractual obligations related to operating leases, see “Management’s Discussion and Analysis of Financial Condition and Results of Operations – Liquidity and Capital Resources – Contractual obligations.”
FINANCIAL INSTRUMENT MARKET RISK
We are exposed to market risk from changes in foreign currency exchange rates and interest rates. We selectively manage these exposures through the use of derivative instruments, including forward foreign exchange contracts, foreign exchange options, and interest rate swaps. The objective of our risk management strategy is to minimize the volatility from fluctuations in foreign currency and interest rates. We do not use derivative instruments for trading purposes. The counterparties to our forward contracts, options, and interest rate swaps are global commercial and investment banks.
We use a sensitivity analysis model to measure the impact of a 10% adverse movement of foreign currency exchange rates against the United States dollar. A hypothetical 10% adverse change in the value of all our foreign currency positions relative to the United States dollar as of
December 31, 2015
would result in a $76 million, pre-tax, loss for our net monetary assets denominated in currencies other than United States dollars.
With respect to interest rates sensitivity, after consideration of the impact from the interest rate swaps, a hypothetical 100 basis point increase in the LIBOR rate would result in approximately an additional $15 million of interest charges for the year ended
December 31, 2015
.
There are certain limitations inherent in the sensitivity analyses presented, primarily due to the assumption that interest rates and exchange rates change instantaneously in an equally adverse fashion. In addition, the analyses are unable to reflect the complex market reactions that normally would arise from the market shifts modeled. While this is our best estimate of the impact of the various scenarios, these estimates should not be viewed as forecasts.
For further information regarding foreign currency exchange risk, interest rate risk, and credit risk, see
Note 14
to the consolidated financial statements.
ENVIRONMENTAL MATTERS
We are subject to numerous environmental, legal, and regulatory requirements related to our operations worldwide. For information related to environmental matters, see
Note 9
to the consolidated financial statements and Part I, Item 1(a), “Risk Factors.”
FORWARD-LOOKING INFORMATION
The Private Securities Litigation Reform Act of 1995 provides safe harbor provisions for forward-looking information. Forward-looking information is based on projections and estimates, not historical information. Some statements in this Form 10-K are forward-looking and use words like “may,” “may not,” “believe,” “do not believe,” “plan,” “estimate,” “intend,” “expect,” “do not expect,” “anticipate,” “do not anticipate,” “should,” “likely,” and other expressions. We may also provide oral or written forward-looking information in other materials we release to the public. Forward-looking information involves risk and uncertainties and reflects our best judgment based on current information. Our results of operations can be affected by inaccurate assumptions we make or by known or unknown risks and uncertainties. In addition, other factors may affect the accuracy of our forward-looking information. As a result, no forward-looking information can be guaranteed. Actual events and results of operations may vary materially.
40
We do not assume any responsibility to publicly update any of our forward-looking statements regardless of whether factors change as a result of new information, future events, or for any other reason. You should review any additional disclosures we make in our press releases and Forms 10-K, 10-Q, and 8-K filed with or furnished to the SEC. We also suggest that you listen to our quarterly earnings release conference calls with financial analysts.
41
MANAGEMENT’S REPORT ON INTERNAL CONTROL OVER FINANCIAL REPORTING
The management of Halliburton Company is responsible for establishing and maintaining adequate internal control over financial reporting as defined in the Securities Exchange Act Rule 13a-15(f).
Internal control over financial reporting, no matter how well designed, has inherent limitations. Therefore, even those systems determined to be effective can provide only reasonable assurance with respect to financial statement preparation and presentation. Further, because of changes in conditions, the effectiveness of internal control over financial reporting may vary over time.
Under the supervision and with the participation of our management, including our chief executive officer and chief financial officer, we conducted an evaluation to assess the effectiveness of our internal control over financial reporting as of
December 31, 2015
based upon criteria set forth in the Internal Control - Integrated Framework (2013) issued by the Committee of Sponsoring Organizations of the Treadway Commission. Based on our assessment, we believe that, as of
December 31, 2015
, our internal control over financial reporting is effective.
The effectiveness of Halliburton’s internal control over financial reporting as of
December 31, 2015
has been audited by KPMG LLP, an independent registered public accounting firm, as stated in their report that is included herein.
HALLIBURTON COMPANY
by
|
/s/ David J. Lesar
|
/s/ Christian A. Garcia
|
|
|
David J. Lesar
|
Christian A. Garcia
|
|
|
Chairman of the Board and
|
Senior Vice President, Finance and
|
|
|
Chief Executive Officer
|
Acting Chief Financial Officer
|
|
42
Report of Independent Registered Public Accounting Firm
The Board of Directors and Shareholders
Halliburton Company:
We have audited the accompanying consolidated balance sheets of Halliburton Company and subsidiaries as of December 31, 2015 and 2014, and the related consolidated statements of operations, shareholders’ equity, comprehensive income, and cash flows for each of the years in the three‑year period ended December 31, 2015. These consolidated financial statements are the responsibility of Halliburton Company’s management. Our responsibility is to express an opinion on these consolidated financial statements based on our audits.
We conducted our audits in accordance with the standards of the Public Company Accounting Oversight Board (United States). Those standards require that we plan and perform the audit to obtain reasonable assurance about whether the financial statements are free of material misstatement. An audit includes examining, on a test basis, evidence supporting the amounts and disclosures in the financial statements. An audit also includes assessing the accounting principles used and significant estimates made by management, as well as evaluating the overall financial statement presentation. We believe that our audits provide a reasonable basis for our opinion.
In our opinion, the consolidated financial statements referred to above present fairly, in all material respects, the financial position of Halliburton Company and subsidiaries as of December 31, 2015 and 2014, and the results of their operations and their cash flows for each of the years in the three‑year period ended December 31, 2015, in conformity with U.S. generally accepted accounting principles.
As discussed in Note 16 to the financial statements, Halliburton Company changed its method of accounting for debt issuance costs effective January 1, 2014 due to the adoption of FASB ASU 2015-03,
Simplifying the Presentation of Debt Issuance Costs
. Additionally, as discussed in Note 16 to the financial statements, Halliburton Company changed its method of accounting for deferred income taxes effective January 1, 2014 due to the adoption of FASB ASU 2015-17,
Balance Sheet Classification of Deferred Taxes
.
We also have audited, in accordance with the standards of the Public Company Accounting Oversight Board (United States), Halliburton Company’s internal control over financial reporting as of December 31, 2015, based on criteria established in Internal Control - Integrated Framework (2013) issued by the Committee of Sponsoring Organizations of the Treadway Commission (COSO), and our report dated
February 5, 2016
expressed an unqualified opinion on the effectiveness of Halliburton Company’s internal control over financial reporting.
/s/ KPMG LLP
Houston, Texas
February 5, 2016
43
Report of Independent Registered Public Accounting Firm
The Board of Directors and Shareholders
Halliburton Company:
We have audited Halliburton Company’s internal control over financial reporting as of December 31, 2015, based on criteria established in Internal Control - Integrated Framework (2013) issued by the Committee of Sponsoring Organizations of the Treadway Commission (COSO). Halliburton Company’s management is responsible for maintaining effective internal control over financial reporting and for its assessment of the effectiveness of internal control over financial reporting, included in the accompanying Management’s Report on Internal Control over Financial Reporting. Our responsibility is to express an opinion on Halliburton Company’s internal control over financial reporting based on our audit.
We conducted our audit in accordance with the standards of the Public Company Accounting Oversight Board (United States). Those standards require that we plan and perform the audit to obtain reasonable assurance about whether effective internal control over financial reporting was maintained in all material respects. Our audit included obtaining an understanding of internal control over financial reporting, assessing the risk that a material weakness exists, and testing and evaluating the design and operating effectiveness of internal control based on the assessed risk. Our audit also included performing such other procedures as we considered necessary in the circumstances. We believe that our audit provides a reasonable basis for our opinion.
A company’s internal control over financial reporting is a process designed to provide reasonable assurance regarding the reliability of financial reporting and the preparation of financial statements for external purposes in accordance with generally accepted accounting principles. A company’s internal control over financial reporting includes those policies and procedures that (1) pertain to the maintenance of records that, in reasonable detail, accurately and fairly reflect the transactions and dispositions of the assets of the company; (2) provide reasonable assurance that transactions are recorded as necessary to permit preparation of financial statements in accordance with generally accepted accounting principles, and that receipts and expenditures of the company are being made only in accordance with authorizations of management and directors of the company; and (3) provide reasonable assurance regarding prevention or timely detection of unauthorized acquisition, use, or disposition of the company’s assets that could have a material effect on the financial statements.
Because of its inherent limitations, internal control over financial reporting may not prevent or detect misstatements. Also, projections of any evaluation of effectiveness to future periods are subject to the risk that controls may become inadequate because of changes in conditions, or that the degree of compliance with the policies or procedures may deteriorate.
In our opinion, Halliburton Company maintained, in all material respects, effective internal control over financial reporting as of December 31, 2015, based on criteria established in Internal Control - Integrated Framework (2013) issued by COSO.
We also have audited, in accordance with the standards of the Public Company Accounting Oversight Board (United States), the consolidated balance sheets of Halliburton Company and subsidiaries as of December 31, 2015 and 2014, and the related consolidated statements of operations, shareholders’ equity, comprehensive income, and cash flows for each of the years in the three-year period ended December 31, 2015, and our report dated
February 5, 2016
expressed an unqualified opinion on those consolidated financial statements.
/s/ KPMG LLP
Houston, Texas
February 5, 2016
44
|
HALLIBURTON COMPANY
|
|||||||||
|
Year Ended December 31
|
|||||||||
|
Millions of dollars and shares except per share data
|
2015
|
2014
|
2013
|
||||||
|
Revenue:
|
|||||||||
|
Services
|
$
|
17,482
|
|
$
|
25,039
|
|
$
|
22,257
|
|
|
Product sales
|
6,151
|
|
7,831
|
|
7,145
|
|
|||
|
Total revenue
|
23,633
|
|
32,870
|
|
29,402
|
|
|||
|
Operating costs and expenses:
|
|||||||||
|
Cost of services
|
15,900
|
|
20,959
|
|
18,959
|
|
|||
|
Cost of sales
|
5,213
|
|
6,571
|
|
5,972
|
|
|||
|
Impairment and other charges
|
2,177
|
|
129
|
|
—
|
|
|||
|
Baker Hughes acquisition-related costs
|
308
|
|
17
|
|
—
|
|
|||
|
General and administrative
|
200
|
|
292
|
|
333
|
|
|||
|
Activity related to the Macondo well incident
|
—
|
|
(195
|
)
|
1,000
|
|
|||
|
Total operating costs and expenses
|
23,798
|
|
27,773
|
|
26,264
|
|
|||
|
Operating income (loss)
|
(165
|
)
|
5,097
|
|
3,138
|
|
|||
|
Interest expense, net of interest income of $16, $13, and $8
|
(447
|
)
|
(383
|
)
|
(331
|
)
|
|||
|
Other, net
|
(324
|
)
|
(2
|
)
|
(43
|
)
|
|||
|
Income (loss) from continuing operations before income taxes
|
(936
|
)
|
4,712
|
|
2,764
|
|
|||
|
Income tax benefit (provision)
|
274
|
|
(1,275
|
)
|
(648
|
)
|
|||
|
Income (loss) from continuing operations
|
(662
|
)
|
3,437
|
|
2,116
|
|
|||
|
Income (loss) from discontinued operations, net of income tax benefit (provision) of $3, $(9), and $1
|
(5
|
)
|
64
|
|
19
|
|
|||
|
Net income (loss)
|
$
|
(667
|
)
|
$
|
3,501
|
|
$
|
2,135
|
|
|
Net (income) attributable to noncontrolling interest
|
(4
|
)
|
(1
|
)
|
(10
|
)
|
|||
|
Net income (loss) attributable to company
|
$
|
(671
|
)
|
$
|
3,500
|
|
$
|
2,125
|
|
|
Amounts attributable to company shareholders:
|
|||||||||
|
Income (loss) from continuing operations
|
$
|
(666
|
)
|
$
|
3,436
|
|
$
|
2,106
|
|
|
Income (loss) from discontinued operations, net
|
(5
|
)
|
64
|
|
19
|
|
|||
|
Net income (loss) attributable to company
|
$
|
(671
|
)
|
$
|
3,500
|
|
$
|
2,125
|
|
|
Basic income per share attributable to company shareholders:
|
|||||||||
|
Income (loss) from continuing operations
|
$
|
(0.78
|
)
|
$
|
4.05
|
|
$
|
2.35
|
|
|
Income (loss) from discontinued operations, net
|
(0.01
|
)
|
0.08
|
|
0.02
|
|
|||
|
Net income (loss) per share
|
$
|
(0.79
|
)
|
$
|
4.13
|
|
$
|
2.37
|
|
|
Diluted income per share attributable to company shareholders:
|
|||||||||
|
Income (loss) from continuing operations
|
$
|
(0.78
|
)
|
$
|
4.03
|
|
$
|
2.33
|
|
|
Income (loss)from discontinued operations, net
|
(0.01
|
)
|
0.08
|
|
0.03
|
|
|||
|
Net income (loss) per share
|
$
|
(0.79
|
)
|
$
|
4.11
|
|
$
|
2.36
|
|
|
Basic weighted average common shares outstanding
|
853
|
|
848
|
|
898
|
|
|||
|
Diluted weighted average common shares outstanding
|
853
|
|
852
|
|
902
|
|
|||
|
See notes to consolidated financial statements.
|
|||||||||
45
|
HALLIBURTON COMPANY
Consolidated Statements of Comprehensive Income
|
|||||||||
|
Year Ended December 31
|
|||||||||
|
Millions of dollars
|
2015
|
2014
|
2013
|
||||||
|
Net income (loss)
|
$
|
(667
|
)
|
$
|
3,501
|
|
$
|
2,135
|
|
|
Other comprehensive income, net of income taxes:
|
|||||||||
|
Defined benefit and other post retirement plans adjustment
|
105
|
|
(84
|
)
|
—
|
|
|||
|
Unrealized loss on cash flow hedges
|
(67
|
)
|
—
|
|
—
|
|
|||
|
Other
|
(2
|
)
|
(7
|
)
|
2
|
|
|||
|
Other comprehensive income (loss), net of income taxes
|
36
|
|
(91
|
)
|
2
|
|
|||
|
Comprehensive income (loss)
|
$
|
(631
|
)
|
$
|
3,410
|
|
$
|
2,137
|
|
|
Comprehensive income attributable to noncontrolling interest
|
(4
|
)
|
(1
|
)
|
(10
|
)
|
|||
|
Comprehensive income (loss) attributable to company shareholders
|
$
|
(635
|
)
|
$
|
3,409
|
|
$
|
2,127
|
|
|
See notes to consolidated financial statements.
|
|||||||||
46
|
HALLIBURTON COMPANY
|
||||||
|
December 31
|
||||||
|
Millions of dollars and shares except per share data
|
2015
|
2014
|
||||
|
Assets
|
||||||
|
Current assets:
|
||||||
|
Cash and equivalents
|
$
|
10,077
|
|
$
|
2,291
|
|
|
Receivables (net of allowances for bad debts of $145 and $137)
|
5,317
|
|
7,564
|
|
||
|
Inventories
|
2,417
|
|
3,571
|
|
||
|
Assets held for sale
|
2,115
|
|
—
|
|
||
|
Prepaid expenses
|
1,051
|
|
658
|
|
||
|
Other current assets
|
632
|
|
563
|
|
||
|
Total current assets
|
21,609
|
|
14,647
|
|
||
|
Property, plant, and equipment (net of accumulated depreciation of $9,789 and $11,007)
|
10,911
|
|
12,475
|
|
||
|
Goodwill
|
2,109
|
|
2,330
|
|
||
|
Other assets
|
2,313
|
|
2,713
|
|
||
|
Total assets
|
$
|
36,942
|
|
$
|
32,165
|
|
|
Liabilities and Shareholders’ Equity
|
||||||
|
Current liabilities:
|
||||||
|
Accounts payable
|
$
|
2,019
|
|
$
|
2,814
|
|
|
Accrued employee compensation and benefits
|
838
|
|
1,033
|
|
||
|
Current maturities of long-term debt
|
659
|
|
14
|
|
||
|
Liabilities for Macondo well incident
|
400
|
|
367
|
|
||
|
Deferred revenue
|
298
|
|
349
|
|
||
|
Taxes other than income
|
293
|
|
407
|
|
||
|
Other current liabilities
|
852
|
|
882
|
|
||
|
Total current liabilities
|
5,359
|
|
5,866
|
|
||
|
Long-term debt
|
14,687
|
|
7,765
|
|
||
|
Employee compensation and benefits
|
457
|
|
691
|
|
||
|
Other liabilities
|
944
|
|
1,545
|
|
||
|
Total liabilities
|
21,447
|
|
15,867
|
|
||
|
Shareholders’ equity:
|
||||||
|
Common shares, par value $2.50 per share (authorized 2,000 shares,
issued 1,071 and 1,071 shares)
|
2,677
|
|
2,679
|
|
||
|
Paid-in capital in excess of par value
|
274
|
|
309
|
|
||
|
Accumulated other comprehensive loss
|
(363
|
)
|
(399
|
)
|
||
|
Retained earnings
|
20,524
|
|
21,809
|
|
||
|
Treasury stock, at cost (215 and 223 shares)
|
(7,650
|
)
|
(8,131
|
)
|
||
|
Company shareholders’ equity
|
15,462
|
|
16,267
|
|
||
|
Noncontrolling interest in consolidated subsidiaries
|
33
|
|
31
|
|
||
|
Total shareholders’ equity
|
15,495
|
|
16,298
|
|
||
|
Total liabilities and shareholders’ equity
|
$
|
36,942
|
|
$
|
32,165
|
|
|
See notes to consolidated financial statements.
|
||||||
47
|
HALLIBURTON COMPANY
|
|||||||||
|
Year Ended December 31
|
|||||||||
|
Millions of dollars
|
2015
|
2014
|
2013
|
||||||
|
Cash flows from operating activities:
|
|||||||||
|
Net income (loss)
|
$
|
(667
|
)
|
$
|
3,501
|
|
$
|
2,135
|
|
|
Adjustments to reconcile net income (loss) to net cash flows from operating activities:
|
|||||||||
|
Impairments and other charges
|
2,177
|
|
129
|
|
—
|
|
|||
|
Cash impact of impairments and other charges - severance payments
|
(304
|
)
|
(28
|
)
|
—
|
|
|||
|
Depreciation, depletion, and amortization
|
1,835
|
|
2,126
|
|
1,900
|
|
|||
|
Activity related to the Macondo well incident
|
(333
|
)
|
(569
|
)
|
1,000
|
|
|||
|
Deferred income tax benefit, continuing operations
|
(224
|
)
|
(454
|
)
|
(132
|
)
|
|||
|
Other changes:
|
|||||||||
|
Receivables
|
1,468
|
|
(1,381
|
)
|
(449
|
)
|
|||
|
Accounts payable
|
(603
|
)
|
489
|
|
327
|
|
|||
|
Inventories
|
153
|
|
(271
|
)
|
(107
|
)
|
|||
|
Other
|
(596
|
)
|
520
|
|
(227
|
)
|
|||
|
Total cash flows from operating activities
|
2,906
|
|
4,062
|
|
4,447
|
|
|||
|
Cash flows from investing activities:
|
|||||||||
|
Capital expenditures
|
(2,184
|
)
|
(3,283
|
)
|
(2,934
|
)
|
|||
|
Sales of property, plant, and equipment
|
168
|
|
338
|
|
241
|
|
|||
|
Purchases of investment securities
|
(109
|
)
|
(183
|
)
|
(329
|
)
|
|||
|
Sales of investment securities
|
106
|
|
444
|
|
356
|
|
|||
|
Payments to acquire businesses, net of cash acquired
|
(39
|
)
|
(231
|
)
|
(94
|
)
|
|||
|
Other investing activities
|
(134
|
)
|
(223
|
)
|
(110
|
)
|
|||
|
Total cash flows from investing activities
|
(2,192
|
)
|
(3,138
|
)
|
(2,870
|
)
|
|||
|
Cash flows from financing activities:
|
|||||||||
|
Proceeds from issuance of long-term debt, net
|
7,440
|
|
—
|
|
2,968
|
|
|||
|
Dividends to shareholders
|
(614
|
)
|
(533
|
)
|
(465
|
)
|
|||
|
Proceeds from exercises of stock options
|
167
|
|
332
|
|
277
|
|
|||
|
Payments to reacquire common stock
|
—
|
|
(800
|
)
|
(4,356
|
)
|
|||
|
Other financing activities
|
88
|
|
(29
|
)
|
(178
|
)
|
|||
|
Total cash flows from financing activities
|
7,081
|
|
(1,030
|
)
|
(1,754
|
)
|
|||
|
Effect of exchange rate changes on cash
|
(9
|
)
|
41
|
|
49
|
|
|||
|
Increase (decrease) in cash and equivalents
|
7,786
|
|
(65
|
)
|
(128
|
)
|
|||
|
Cash and equivalents at beginning of year
|
2,291
|
|
2,356
|
|
2,484
|
|
|||
|
Cash and equivalents at end of year
|
$
|
10,077
|
|
$
|
2,291
|
|
$
|
2,356
|
|
|
Supplemental disclosure of cash flow information:
|
|||||||||
|
Cash payments during the period for:
|
|||||||||
|
Interest
|
$
|
380
|
|
$
|
384
|
|
$
|
293
|
|
|
Income taxes
|
$
|
370
|
|
$
|
1,269
|
|
$
|
913
|
|
|
See notes to consolidated financial statements.
|
|||||||||
48
|
HALLIBURTON COMPANY
Consolidated Statements of Shareholders' Equity
|
|||||||||||||||||||||
|
Company Shareholders’ Equity
|
|||||||||||||||||||||
|
Millions of dollars
|
Common Shares
|
Paid-in Capital in Excess of Par Value
|
Treasury Stock
|
Retained Earnings
|
Accumulated Other Comprehensive Income (Loss)
|
Noncontrolling interest in Consolidated Subsidiaries
|
Total
|
||||||||||||||
|
Balance at December 31, 2012
|
$
|
2,682
|
|
$
|
486
|
|
$
|
(4,276
|
)
|
$
|
17,182
|
|
$
|
(309
|
)
|
$
|
25
|
|
$
|
15,790
|
|
|
Comprehensive income (loss):
|
|
|
|
|
|
|
|
|
|
|
|
|
|||||||||
|
Net income
|
—
|
|
—
|
|
—
|
|
2,125
|
|
—
|
|
10
|
|
2,135
|
|
|||||||
|
Other comprehensive income
|
—
|
|
—
|
|
—
|
|
—
|
|
2
|
|
—
|
|
2
|
|
|||||||
|
Common shares repurchased
|
—
|
|
—
|
|
(4,356
|
)
|
—
|
|
—
|
|
—
|
|
(4,356
|
)
|
|||||||
|
Stock plans
|
(2
|
)
|
(97
|
)
|
583
|
|
—
|
|
—
|
|
—
|
|
484
|
|
|||||||
|
Cash dividends ($0.525 per share)
|
—
|
|
—
|
|
—
|
|
(465
|
)
|
—
|
|
—
|
|
(465
|
)
|
|||||||
|
Other
|
—
|
|
26
|
|
—
|
|
—
|
|
—
|
|
(1
|
)
|
25
|
|
|||||||
|
Balance at December 31, 2013
|
$
|
2,680
|
|
$
|
415
|
|
$
|
(8,049
|
)
|
$
|
18,842
|
|
$
|
(307
|
)
|
$
|
34
|
|
$
|
13,615
|
|
|
Comprehensive income (loss):
|
|||||||||||||||||||||
|
Net income
|
—
|
|
—
|
|
—
|
|
3,500
|
|
—
|
|
1
|
|
3,501
|
|
|||||||
|
Other comprehensive loss
|
—
|
|
—
|
|
—
|
|
—
|
|
(92
|
)
|
—
|
|
(92
|
)
|
|||||||
|
Common shares repurchased
|
—
|
|
—
|
|
(800
|
)
|
—
|
|
—
|
|
—
|
|
(800
|
)
|
|||||||
|
Stock plans
|
(1
|
)
|
(161
|
)
|
718
|
|
—
|
|
—
|
|
—
|
|
556
|
|
|||||||
|
Cash dividends ($0.63 per share)
|
—
|
|
—
|
|
—
|
|
(533
|
)
|
—
|
|
—
|
|
(533
|
)
|
|||||||
|
Other
|
—
|
|
55
|
|
—
|
|
—
|
|
—
|
|
(4
|
)
|
51
|
|
|||||||
|
Balance at December 31, 2014
|
$
|
2,679
|
|
$
|
309
|
|
$
|
(8,131
|
)
|
$
|
21,809
|
|
$
|
(399
|
)
|
$
|
31
|
|
$
|
16,298
|
|
|
Comprehensive income (loss):
|
|
|
|
|
|
|
|
|
|
|
|
|
|
|
|||||||
|
Net income (loss)
|
—
|
|
—
|
|
—
|
|
(671
|
)
|
—
|
|
4
|
|
(667
|
)
|
|||||||
|
Other comprehensive income
|
—
|
|
—
|
|
—
|
|
—
|
|
36
|
|
—
|
|
36
|
|
|||||||
|
Stock plans
|
(2
|
)
|
(39
|
)
|
481
|
|
—
|
|
—
|
|
—
|
|
440
|
|
|||||||
|
Cash dividends ($0.72 per share)
|
—
|
|
—
|
|
—
|
|
(614
|
)
|
—
|
|
—
|
|
(614
|
)
|
|||||||
|
Other
|
—
|
|
4
|
|
—
|
|
—
|
|
—
|
|
(2
|
)
|
2
|
|
|||||||
|
Balance at December 31, 2015
|
$
|
2,677
|
|
$
|
274
|
|
$
|
(7,650
|
)
|
$
|
20,524
|
|
$
|
(363
|
)
|
$
|
33
|
|
$
|
15,495
|
|
|
See notes to consolidated financial statements.
|
|||||||||||||||||||||
49
HALLIBURTON COMPANY
Notes to Consolidated Financial Statements
Note 1
. Description of Company and Significant Accounting Policies
Description of Company
Halliburton Company’s predecessor was established in 1919 and incorporated under the laws of the State of Delaware in 1924. We are one of the world’s largest oilfield services companies. Our
two
business segments are the Completion and Production segment and the Drilling and Evaluation segment. We provide a comprehensive range of services and products for the exploration, development, and production of oil and natural gas around the world.
Use of estimates
Our financial statements are prepared in conformity with United States generally accepted accounting principles, requiring us to make estimates and assumptions that affect:
|
-
|
the reported amounts of assets and liabilities and disclosure of contingent assets and liabilities at the date of the financial statements; and
|
|
-
|
the reported amounts of revenue and expenses during the reporting period.
|
We believe the most significant estimates and assumptions are associated with the forecasting of our effective income tax rate and the valuation of deferred taxes, legal and environmental reserves, long-lived asset valuations, purchase price allocations, pensions, allowance for bad debts, and percentage-of-completion accounting for long-term contracts. Ultimate results could differ from our estimates.
Basis of presentation
The consolidated financial statements include the accounts of our company and all of our subsidiaries that we control or variable interest entities for which we have determined that we are the primary beneficiary. All material intercompany accounts and transactions are eliminated. Investments in companies in which we have significant influence are accounted for using the equity method of accounting. If we do not have significant influence, we use the cost method of accounting. In addition, certain reclassifications of prior period balances have been made to conform to the current period presentation.
Revenue recognition
Overall.
Our services and products are generally sold based upon purchase orders or contracts with our customers that include fixed or determinable prices but do not include right of return provisions or other significant post-delivery obligations. Our products are produced in a standard manufacturing operation, even if produced to our customer’s specifications. We recognize revenue from product sales when title passes to the customer, the customer assumes risks and rewards of ownership, collectability is reasonably assured, and delivery occurs as directed by our customer. Service revenue, including training and consulting services, is recognized when the services are rendered and collectability is reasonably assured. Rates for services are typically priced on a per day, per meter, per man-hour, or similar basis.
Software sales.
Sales of perpetual software licenses, net of any deferred maintenance and support fees, are recognized as revenue upon shipment. Sales of time-based licenses are recognized as revenue over the license period. Maintenance and support fees are recognized as revenue ratably over the contract period, usually a
one
-year duration.
Percentage of completion.
Revenue from certain long-term, integrated project management contracts to provide well construction and completion services is reported on the percentage-of-completion method of accounting. Progress is generally based upon physical progress related to contractually defined units of work. Physical percent complete is determined as a combination of input and output measures as deemed appropriate by the circumstances. All known or anticipated losses on contracts are provided for when they become evident. Cost adjustments that are in the process of being negotiated with customers for extra work or changes in the scope of work are included in revenue when collection is deemed probable.
New Accounting Pronouncement.
In May 2014, a new revenue recognition standard was issued that will supersede existing revenue recognition guidance. See
Note 16
for additional information.
Research and development
Research and development costs are expensed as incurred. Research and development costs were
$487 million
in
2015
,
$601 million
in
2014
, and
$588 million
in
2013
.
Cash equivalents
We consider all highly liquid investments with an original maturity of
three
months or less to be cash equivalents.
Inventories
Inventories are stated at the lower of cost or market. Cost represents invoice or production cost for new items and original cost less allowance for condition for used material returned to stock. Production cost includes material, labor, and manufacturing overhead. Some domestic manufacturing and field service finished products and parts inventories for drill bits, completion products, and bulk materials are recorded using the last-in, first-out method. The remaining inventory is recorded on the average cost method. We regularly review inventory quantities on hand and record provisions for excess or obsolete inventory based primarily on historical usage, estimated product demand, and technological developments.
50
Allowance for bad debts
We establish an allowance for bad debts through a review of several factors, including historical collection experience, current aging status of the customer accounts, and financial condition of our customers. Our policy is to write off bad debts when the customer accounts are determined to be uncollectible.
Property, plant, and equipment
Other than those assets that have been written down to their fair values due to impairment, property, plant, and equipment are reported at cost less accumulated depreciation, which is generally provided on the straight-line method over the estimated useful lives of the assets. Accelerated depreciation methods are used for tax purposes, wherever permitted. Upon sale or retirement of an asset, the related costs and accumulated depreciation are removed from the accounts and any gain or loss is recognized. Planned major maintenance costs are generally expensed as incurred. Expenditures for additions, modifications, and conversions are capitalized when they increase the value or extend the useful life of the asset.
Goodwill and other intangible assets
We record as goodwill the excess purchase price over the fair value of the tangible and identifiable intangible assets acquired. Changes in the carrying amount of goodwill are detailed below by reportable segment.
|
Millions of dollars
|
Completion and Production
|
Drilling and Evaluation
|
Total
|
||||||
|
Balance at December 31, 2013:
|
$
|
1,533
|
|
$
|
635
|
|
$
|
2,168
|
|
|
Current year acquisitions
|
77
|
|
79
|
|
156
|
|
|||
|
Purchase price adjustments for previous acquisitions
|
(4
|
)
|
10
|
|
6
|
|
|||
|
Balance at December 31, 2014:
|
$
|
1,606
|
|
$
|
724
|
|
$
|
2,330
|
|
|
Current year acquisitions
|
27
|
|
26
|
|
53
|
|
|||
|
Purchase price adjustments for previous acquisitions
|
1
|
|
1
|
|
2
|
|
|||
|
Allocation to assets held for sale
|
—
|
|
(276
|
)
|
(276
|
)
|
|||
|
Balance at December 31, 2015:
|
$
|
1,634
|
|
$
|
475
|
|
$
|
2,109
|
|
As of
December 31, 2015
, we allocated
$276 million
of goodwill in the Drilling and Evaluation segment to assets held for sale. See
Note 2
for further information.
The reported amounts of goodwill for each reporting unit are reviewed for impairment on an annual basis, during the third quarter, and more frequently should negative conditions exist such as significant current or projected operating losses. In
2013
,
2014
, and
2015
, we elected to bypass the qualitative assessment and perform a quantitative impairment test. This two-step quantitative process, which consists of a discounted cash flow analysis based on management’s short-term and long-term forecast of operating performance, compares the estimated fair value of each reporting unit to the reporting unit’s carrying value, including goodwill. If the fair value of a reporting unit exceeds its carrying amount, goodwill of the reporting unit is not considered impaired, and the second step of the impairment test is unnecessary. If the carrying amount of a reporting unit exceeds its fair value, the second step of the goodwill impairment test is performed to measure the amount of impairment loss to be recorded, if any. As a result of our annual goodwill impairment assessments performed in
2015
,
2014
, and
2013
, we determined that the fair value of each reporting unit exceeded its net book value and, therefore, no goodwill impairments were deemed necessary.
In
2015
, the energy market continued to experience a considerable downturn as a result of a significant reduction in crude oil prices, including the period subsequent to our annual goodwill impairment testing date. Due to this pricing decline and its corresponding impact on our short-term business outlook, we determined that these recent events constituted a triggering event that would require us to update our goodwill impairment assessment through December 31, 2015. As a result of our analysis, we determined that the fair value of each reporting unit exceeded its net book value and therefore, no goodwill impairment was necessary as of
December 31, 2015
. Should current market conditions worsen or persist for an extended period of time, an impairment of the carrying value of our goodwill could occur, particularly in our Completion and Production operating segment.
We amortize other identifiable intangible assets with a finite life on a straight-line basis over the period which the asset is expected to contribute to our future cash flows, ranging from
two
to
fifteen
years. The components of these other intangible assets generally consist of patents, license agreements, non-compete agreements, trademarks, and customer lists and contracts.
Evaluating impairment of long-lived assets
When events or changes in circumstances indicate that long-lived assets other than goodwill may be impaired, an evaluation is performed. For an asset classified as held for use, the estimated future undiscounted cash flows associated with the asset are compared to the asset’s carrying amount to determine if a write-down to fair value is required. When an asset is classified as held for sale, the asset’s book value is evaluated and adjusted to the lower of its carrying amount or fair value less cost to sell. In addition, depreciation and amortization is ceased while it is classified as held for sale.
51
Income taxes
We recognize the amount of taxes payable or refundable for the year. In addition, deferred tax assets and liabilities are recognized for the expected future tax consequences of events that have been recognized in the financial statements or tax returns. A valuation allowance is provided for deferred tax assets if it is more likely than not that these items will not be realized. As of
December 31, 2015
, we adopted a new accounting standard which requires that all deferred tax assets and liabilities be classified as noncurrent on the balance sheet instead of separating deferred taxes into current and noncurrent amounts. See
Note 16
for additional information.
In assessing the realizability of deferred tax assets, management considers whether it is more likely than not that some portion or all of the deferred tax assets will not be realized. The ultimate realization of deferred tax assets is dependent upon the generation of future taxable income during the periods in which those temporary differences become deductible. Management considers the scheduled reversal of deferred tax liabilities, projected future taxable income, and tax planning strategies in making this assessment. Based upon the level of historical taxable income and projections for future taxable income over the periods in which the deferred tax assets are deductible, management believes it is more likely than not that we will realize the benefits of these deductible differences, net of the existing valuation allowances.
We recognize interest and penalties related to unrecognized tax benefits within the provision for income taxes on continuing operations in our consolidated statements of operations.
We generally do not provide income taxes on the undistributed earnings of non-United States subsidiaries because such earnings are intended to be reinvested indefinitely to finance foreign activities. These additional foreign earnings could be subject to additional tax if remitted, or deemed remitted, as a dividend; however, it is not practicable to estimate the additional amount, if any, of taxes payable. Taxes are provided as necessary with respect to earnings that are not permanently reinvested.
Derivative instruments
At times, we enter into derivative financial transactions to hedge existing or projected exposures to changing foreign currency exchange rates and interest rates. We do not enter into derivative transactions for speculative or trading purposes. We recognize all derivatives on the balance sheet at fair value. Derivatives that are not hedges are adjusted to fair value and reflected through the results of operations. If the derivative is designated as a hedge, depending on the nature of the hedge, changes in the fair value of derivatives are either offset against:
|
-
|
the change in fair value of the hedged assets, liabilities, or firm commitments through earnings; or
|
|
-
|
recognized in other comprehensive income until the hedged item is recognized in earnings.
|
The ineffective portion of a derivative’s change in fair value is recognized in earnings. Recognized gains or losses on derivatives entered into to manage foreign currency exchange risk are included in “Other, net” on the consolidated statements of operations. Gains or losses on interest rate derivatives are included in “Interest expense, net.”
Foreign currency translation
Foreign entities whose functional currency is the United States dollar translate monetary assets and liabilities at year-end exchange rates, and nonmonetary items are translated at historical rates. Revenue and expense transactions are translated at the average rates in effect during the year, except for those expenses associated with nonmonetary balance sheet accounts, which are translated at historical rates. Gains or losses from remeasurement of monetary assets and liabilities due to changes in exchange rates are recognized in our consolidated statements of operations in “Other, net” in the year of occurrence.
Stock-based compensation
Stock-based compensation cost is measured at the date of grant, based on the calculated fair value of the award, and is recognized as expense over the employee’s service period, which is generally the vesting period of the equity grant. Additionally, compensation cost is recognized based on awards ultimately expected to vest, therefore, we have reduced the cost for estimated forfeitures based on historical forfeiture rates. Forfeitures are estimated at the time of grant and revised in subsequent periods to reflect actual forfeitures. See
Note 12
for additional information related to stock-based compensation.
52
Note 2
. Acquisitions and Dispositions
Pending acquisition of Baker Hughes
In November 2014, we and Baker Hughes entered into a merger agreement under which, subject to the conditions set forth in the merger agreement, we will acquire all the outstanding shares of Baker Hughes in a stock and cash transaction. Baker Hughes is a leading supplier of oilfield services, products, technology and systems to the worldwide oil and natural gas industry. Under the terms of the merger agreement, at the effective time of the acquisition, each share of Baker Hughes common stock will be converted into the right to receive
1.12
shares of our common stock and
$19.00
in cash. The merger agreement has been unanimously approved by both companies' Board of Directors, our stockholders have approved the issuance of shares necessary to complete the acquisition of Baker Hughes, and Baker Hughes’ stockholders have adopted the merger agreement and thereby approved the acquisition. The closing of the transaction is subject to receipt of certain regulatory approvals and other conditions specified in the merger agreement.
Because the exchange ratio was fixed at the time of the merger agreement and the market value of our common stock will continue to fluctuate, the total value of the consideration exchanged will not be determinable until the closing date. The number of shares to be issued will not fluctuate based upon changes in the price of shares of our common stock or shares of Baker Hughes common stock prior to the closing date, but the exact number of Halliburton shares to be issued with respect to Baker Hughes stock awards will not be determinable until the closing of the transaction. We have estimated the total consideration expected to be issued and paid to Baker Hughes stockholders in the acquisition to consist of approximately
492 million
shares of our common stock and approximately
$8.3 billion
to be paid in cash.
In November 2015, we issued
$7.5 billion
aggregate principal amount of senior notes to be used for general corporate purposes, including to finance a portion of the cash consideration for the acquisition. If the Baker Hughes acquisition is not consummated, we are required to redeem
$2.5 billion
of the senior notes issued at a price of
101%
of their principal amount. See Note 8 for further information on the debt issuance and mandatory redemption features. We may finance the remainder of the cash portion of the consideration for the acquisition with cash on hand, additional debt financing, or a combination thereof. We have
$1.1 billion
remaining under the senior unsecured bridge facility commitment we obtained for the acquisition, although we may obtain other debt financings in lieu of utilizing all or a portion of the bridge facility.
In December 2015, we announced that our timing agreement with the DOJ expired without reaching a settlement or the DOJ initiating litigation. The DOJ informed us that they do not believe that our previously announced proposed divestitures are sufficient to address their concerns, but acknowledged that they would assess further proposals. In January 2016, the EC entered into Phase II of its investigation, and issued a report detailing initial concerns about the competition-related implications of the acquisition.
Also, in January 2016, we presented to the DOJ an enhanced set of proposed divestitures in order to seek their approval of the transaction. We also informally notified the EC and other jurisdictions about the enhanced divestitures package. The sales process for the planned divestitures is continuing, but there is no agreement to date with any buyer or an agreement with the DOJ or EC as to the adequacy of the proposed divestitures. Our conversations with the DOJ, the EC and other enforcement authorities continue with the desire to resolve their competition-related concerns as soon as possible.
We remain committed to completing this transaction, despite the extended time required to obtain regulatory approvals. We agreed with Baker Hughes to extend the period to obtain required regulatory approvals to no later than April 30, 2016, as permitted under the merger agreement, though we would proceed with closing prior to such date if all relevant regulatory approvals have been obtained. If review by the relevant competition authorities extends beyond April 30, 2016, the merger agreement does not terminate automatically; the parties may continue to seek relevant regulatory approvals or either of the parties may terminate the merger agreement. Under the merger agreement, we could be required in certain circumstances, where the termination of the merger agreement is related to failures to obtain regulatory clearances, to pay Baker Hughes a termination fee of
$3.5 billion
. See "Assets Held for Sale" below for additional expenses we would recognize if the merger agreement is terminated.
Assets Held for Sale
In April 2015, we announced our decision to market for sale our Fixed Cutter and Roller Cone Drill Bits, our Directional Drilling, and our Logging-While-Drilling/Measurement-While-Drilling businesses in connection with the pending Baker Hughes acquisition. The assets and liabilities for these businesses, which are included within our Drilling and Evaluation operating segment, were classified as held for sale beginning in the second quarter of 2015 and, therefore, the corresponding depreciation and amortization expense was ceased at that time. These anticipated divestitures are not presented as discontinued operations in our consolidated statements of operations, because they do not represent a strategic shift in our business, as we will continue operating similar businesses of Baker Hughes after the acquisition.
During the years ended December 31, 2015, 2014, and 2013, we generated revenue from these assets of
$2.6 billion
,
$3.6 billion
, and
$3.6 billion
. Additionally, during the years ended December 31, 2015, 2014, and 2013, we recognized operating income from these assets, consistent with our business segments presentation in Note 4, of
$460 million
,
$391 million
, and
$422 million
. These amounts reflect the impact of ceasing the recording of depreciation and amortization expense for these businesses subsequent to their held for sale reclassification in 2015; the recording of such expenses would have reduced operating income by
$244 million
during the year ended December 31, 2015. If the merger agreement for the pending
53
Baker Hughes acquisition is terminated, and therefore these businesses are no longer considered held for sale, we would reclassify the assets as held and used at the lower of fair value or carrying value less ceased depreciation and amortization expense as of that date. Additionally, we recorded
$103 million
of capitalized divestiture costs within "Other current assets" on our consolidated balance sheets as of December 31, 2015, which we would record as an expense in our statement of operations if the acquisition is not consummated.
When an asset is classified as held for sale, the asset’s book value is evaluated and adjusted to the lower of its carrying amount or fair value less cost to sell. As of December 31, 2015, we determined the fair value less cost to sell exceeded the carrying amount of our assets held for sale.
A summary of the carrying amounts of assets and liabilities held for sale on our consolidated balance sheet as of December 31, 2015 related to the anticipated divestitures discussed above is detailed below.
|
Millions of dollars
|
December 31, 2015
|
||
|
Assets
|
|||
|
Property, plant, and equipment
|
$
|
1,206
|
|
|
Inventories
|
576
|
|
|
|
Goodwill
|
276
|
|
|
|
Patents and other intangibles
|
57
|
|
|
|
Total assets
|
$
|
2,115
|
|
|
Liabilities
|
|||
|
Employee benefit liabilities (a)
|
$
|
46
|
|
|
Total liabilities
|
$
|
46
|
|
|
(a) Liabilities held for sale are classified within “Other current liabilities” on our consolidated balance sheet as of December 31, 2015.
|
|||
In the third quarter of 2015, we announced that we also intended to divest our expandable liner hangers business in connection with the pending Baker Hughes acquisition, but the anticipated divestiture did not meet all of the requirements for classification as assets held for sale. We have recently proposed a revised and enhanced divestiture package to the DOJ, which no longer includes our expandable liner hangers business.
The final sale of each of the businesses described above, as well as any other businesses disposed of in connection with the Baker Hughes acquisition, will be subject to the ability to negotiate acceptable terms and conditions, each company's Board of Directors approval, as applicable, and final approval of the Baker Hughes acquisition by competition authorities. We anticipate that each company would complete the sale of divested businesses concurrent with the closing of the Baker Hughes acquisition.
Note 3
. Impairments and Other Charges
We carry a variety of long-lived assets on our balance sheet including property, plant and equipment, goodwill, and other intangibles. We conduct impairment tests on long-lived assets at least annually, and more frequently whenever events or changes in circumstances indicate that the carrying value may not be recoverable. We review the recoverability of the carrying value of our assets based upon estimated future cash flows while taking into consideration assumptions and estimates including the future use of the asset, remaining useful life of the asset, and service potential of the asset. Additionally, inventories are valued at the lower of cost or market.
During the year ended December 31, 2015, as a result of the downturn in the energy market and its corresponding impact on our business outlook, we determined the carrying amount of a number of our long-lived assets exceeded their respective fair values due to projected declines in asset utilization, and that the cost of some of our inventory exceeded its market value; therefore, we recorded corresponding impairments and other charges. Additionally, we initiated a company-wide reduction in workforce by approximately
25%
during 2015 intended to reduce costs and better align our workforce with anticipated activity levels in the near-term, which resulted in us recording severance costs relating to termination benefits. We also recorded a write-off of our operations in both Libya and Yemen during the first quarter of 2015 due to our decision to exit our operations in these countries. As part of the anticipated divestitures of certain businesses included in our Drilling and Evaluation operating segment, we are incurring certain non-capitalizable costs, which we have included within "other matters" in the table below.
Primarily as a result of the events described above, we recorded charges of approximately
$2.2 billion
and
$129 million
during the years ended December 31, 2015 and 2014, respectively, which consisted of equipment write-offs, asset impairments, expenses and write-downs related to idle equipment, inventory write-downs, impairments of intangible assets, severance costs, country and facility closures, and other items. We also recorded a
$199 million
foreign currency exchange loss in Venezuela during the first quarter of 2015 as discussed in further detail below.
54
The following table presents various charges we recorded during the years ended December 31, 2015 and December 31, 2014 as a result of the downturn in the energy market and other matters:
|
Millions of dollars
|
Year Ended
December 31, 2015
|
Year Ended
December 31, 2014
|
Income Statement Classification
|
||||
|
Economic downturn:
|
|||||||
|
Fixed asset impairments
|
$
|
760
|
|
$
|
47
|
|
Impairments and other charges
|
|
Inventory write-downs
|
484
|
|
24
|
|
Impairments and other charges
|
||
|
Severance costs
|
352
|
|
28
|
|
Impairments and other charges
|
||
|
Intangible asset impairments
|
212
|
|
10
|
|
Impairments and other charges
|
||
|
Other
|
201
|
|
20
|
|
Impairments and other charges
|
||
|
Other matters:
|
|||||||
|
Country closures
|
80
|
|
—
|
|
Impairments and other charges
|
||
|
Other
|
88
|
|
—
|
|
Impairments and other charges
|
||
|
Total impairments and other charges
|
$
|
2,177
|
|
$
|
129
|
|
|
|
Venezuela currency devaluation loss
|
199
|
|
—
|
|
Other, net
|
||
|
Total charges
|
$
|
2,376
|
|
129
|
|
|
|
In February 2015, the Venezuelan government created a new foreign exchange rate mechanism, called the Marginal Currency System, or SIMADI. The new mechanism, which is the third system in a three-tier exchange control mechanism, is a floating market rate for the conversion of Bolívares to United States dollars based on supply and demand. Prior to 2015, we had remeasured our net monetary assets denominated in Bolívares using the official exchange rate of
6.3
Bolívares per United States dollar. During the first quarter of 2015, we began utilizing SIMADI to remeasure our net monetary assets denominated in Bolívares with a market rate of
192
Bolívares per United States dollar as of March 31, 2015, which resulted in us recording a foreign currency loss of
$199 million
during the first quarter of 2015.
Note 4
. Business Segment and Geographic Information
We operate under
two
divisions, which form the basis for the
two
operating segments we report: the Completion and Production segment and the Drilling and Evaluation segment.
Completion and Production
delivers cementing, stimulation, intervention, pressure control, specialty chemicals, artificial lift, and completion services. The segment consists of Production Enhancement, Cementing, Completion Tools, Production Solutions, Pipeline & Process Services, Multi-Chem, and Artificial Lift.
Production Enhancement services include stimulation services and sand control services. Stimulation services optimize oil and natural gas reservoir production through a variety of pressure pumping services, nitrogen services, and chemical processes, commonly known as hydraulic fracturing and acidizing. Sand control services include fluid and chemical systems and pumping services for the prevention of formation sand production.
Cementing services involve bonding the well and well casing while isolating fluid zones and maximizing wellbore stability. Our cementing service line also provides casing equipment.
Completion Tools provides downhole solutions and services to our customers to complete their wells, including well completion products and services, intelligent well completions, liner hanger systems, sand control systems, and service tools.
Production Solutions includes pressure control services such as coiled tubing, hydraulic workover units, and downhole tools.
Pipeline & Process Services include pre-commissioning and maintenance services, subsea pipeline services, conventional pipeline services, and process services.
Multi-Chem includes oilfield production and completion chemicals and services that address production, processing, and transportation challenges.
Artificial Lift offers electrical submersible pumps and progressive cavity pumps, including the associated surface package for power, control, and monitoring of the entire lift system, and provides installation, maintenance, repair, and testing services. The objective of these services is to maximize reservoir and wellbore recovery by applying lifting technology and intelligent field management solutions throughout the life of the well.
Drilling and Evaluation
provides field and reservoir modeling, drilling, evaluation, and precise wellbore placement solutions that enable customers to model, measure, drill, and optimize their well construction activities. The segment consists of Baroid, Sperry Drilling, Wireline and Perforating, Drill Bits and Services, Landmark Software and Services, Testing and Subsea, and Consulting and Project Management.
55
Baroid provides drilling fluid systems, performance additives, completion fluids, solids control, specialized testing equipment, and waste management services for oil and natural gas drilling, completion, and workover operations.
Sperry Drilling provides drilling systems and services. These services include directional and horizontal drilling, measurement-while-drilling, logging-while-drilling, surface data logging, multilateral systems, underbalanced applications, and rig site information systems. Our drilling systems offer directional control for precise wellbore placement while providing important measurements about the characteristics of the drill string and geological formations while drilling wells. Real-time operating capabilities enable the monitoring of well progress and aid decision-making processes.
Wireline and Perforating services include open-hole logging services that provide information on formation evaluation and reservoir fluid analysis, including formation lithology, rock properties, and reservoir fluid properties. Also offered are cased-hole and slickline services, which provide perforating, pipe recovery services, through-casing formation evaluation and reservoir monitoring, casing and cement integrity measurements, and well intervention services. Borehole seismic services include downhole seismic operations check-shots and vertical seismic profiles, and provide the link between surface seismic and the wellbore. Finally, formation and reservoir solutions transform formation evaluation data into reservoir insight through geoscience solutions.
Drill Bits and Services provides roller cone rock bits, fixed cutter bits, hole enlargement, and related downhole tools and services used in drilling oil and natural gas wells. In addition, coring equipment and services are provided to acquire cores of the formation drilled for evaluation.
Landmark Software and Services is a supplier of integrated exploration, drilling and production software, and related professional and data management services for the upstream oil and natural gas industry.
Testing and Subsea services provide acquisition and analysis of dynamic reservoir information and reservoir optimization solutions to the oil and natural gas industry through a broad portfolio of test tools, data acquisition services, fluid sampling, surface well testing, and subsea safety systems.
Consulting and Project Management provides oilfield project management and integrated solutions to independent, integrated, and national oil companies. These offerings make use of all of our oilfield services, products, technologies, and project management capabilities to assist our customers in optimizing the value of their oil and natural gas assets. In addition, well control and prevention services are included.
Corporate and other
includes expenses related to support functions and corporate executives and is primarily composed of cash and equivalents, deferred tax assets, and investment securities. Also included are certain gains, losses and costs not attributable to a particular business segment.
Intersegment revenue and revenue between geographic areas are immaterial. Our equity in earnings and losses of unconsolidated affiliates that are accounted for under the equity method of accounting is included in revenue and operating income of the applicable segment.
56
The following tables present information on our business segments.
|
Operations by business segment
|
|||||||||
|
Year Ended December 31
|
|||||||||
|
Millions of dollars
|
2015
|
2014
|
2013
|
||||||
|
Revenue:
|
|||||||||
|
Completion and Production
|
$
|
13,682
|
|
$
|
20,253
|
|
$
|
17,506
|
|
|
Drilling and Evaluation
|
9,951
|
|
12,617
|
|
11,896
|
|
|||
|
Total revenue
|
$
|
23,633
|
|
$
|
32,870
|
|
$
|
29,402
|
|
|
Operating income (loss):
|
|||||||||
|
Completion and Production
|
$
|
1,069
|
|
$
|
3,670
|
|
$
|
2,875
|
|
|
Drilling and Evaluation
|
1,519
|
|
1,740
|
|
1,770
|
|
|||
|
Total operations
|
2,588
|
|
5,410
|
|
4,645
|
|
|||
|
Corporate and other
|
(576
|
)
|
(184
|
)
|
(1,507
|
)
|
|||
|
Impairments and other charges (a)
|
(2,177
|
)
|
(129
|
)
|
—
|
|
|||
|
Total operating income (loss)
|
$
|
(165
|
)
|
$
|
5,097
|
|
$
|
3,138
|
|
|
Interest expense, net of interest income
|
$
|
(447
|
)
|
$
|
(383
|
)
|
$
|
(331
|
)
|
|
Other, net
|
(324
|
)
|
(2
|
)
|
(43
|
)
|
|||
|
Income (loss) from continuing operations before income taxes
|
$
|
(936
|
)
|
$
|
4,712
|
|
$
|
2,764
|
|
|
Capital expenditures:
|
|||||||||
|
Completion and Production
|
$
|
1,526
|
|
$
|
1,953
|
|
$
|
1,676
|
|
|
Drilling and Evaluation
|
650
|
|
1,297
|
|
1,210
|
|
|||
|
Corporate and other
|
8
|
|
33
|
|
48
|
|
|||
|
Total
|
$
|
2,184
|
|
$
|
3,283
|
|
$
|
2,934
|
|
|
Depreciation, depletion, and amortization:
|
|||||||||
|
Completion and Production
|
$
|
1,160
|
|
$
|
1,162
|
|
$
|
1,013
|
|
|
Drilling and Evaluation
|
638
|
|
934
|
|
873
|
|
|||
|
Corporate and other
|
37
|
|
30
|
|
14
|
|
|||
|
Total
|
$
|
1,835
|
|
$
|
2,126
|
|
$
|
1,900
|
|
(a) Includes
$1.1 billion
attributable to Completion and Production,
$1.0 billion
attributable to Drilling and Evaluation, and
$88 million
attributable to Corporate and other for the year ended December 31, 2015. Includes
$60 million
attributable to Completion and Production and
$69 million
attributable to Drilling and Evaluation for the year ended December 31, 2014.
|
December 31
|
||||||
|
Millions of dollars
|
2015
|
2014
|
||||
|
Total assets:
|
||||||
|
Completion and Production
|
$
|
13,628
|
|
$
|
16,033
|
|
|
Drilling and Evaluation
|
10,531
|
|
11,237
|
|
||
|
Shared assets
|
1,785
|
|
1,930
|
|
||
|
Corporate and other
|
10,998
|
|
2,965
|
|
||
|
Total
|
$
|
36,942
|
|
$
|
32,165
|
|
Not all assets are associated with specific segments. Those assets specific to segments include receivables, inventories, certain identified property, plant, and equipment (including field service equipment), equity in and advances to related companies, and goodwill. The remaining assets, such as cash and equivalents, are considered to be shared among the segments.
57
The following tables present information by geographic area. In
2015
,
2014
, and
2013
, based on the location of services provided and products sold,
44%
,
51%
, and
49%
of our consolidated revenue was from the United States. As of
December 31, 2015
and
December 31, 2014
,
51%
and
46%
of our property, plant, and equipment was from the United States. No other country accounted for more than 10% of our revenue or property, plant, and equipment during the periods presented.
|
Operations by geographic region
|
|||||||||
|
Year Ended December 31
|
|||||||||
|
Millions of dollars
|
2015
|
2014
|
2013
|
||||||
|
Revenue:
|
|||||||||
|
North America
|
$
|
10,856
|
|
$
|
17,698
|
|
$
|
15,212
|
|
|
Latin America
|
3,149
|
|
3,875
|
|
3,909
|
|
|||
|
Europe/Africa/CIS
|
4,175
|
|
5,490
|
|
5,225
|
|
|||
|
Middle East/Asia
|
5,453
|
|
5,807
|
|
5,056
|
|
|||
|
Total
|
$
|
23,633
|
|
$
|
32,870
|
|
$
|
29,402
|
|
|
December 31
|
||||||
|
Millions of dollars
|
2015
|
2014
|
||||
|
Net property, plant, and equipment:
|
||||||
|
North America
|
$
|
5,745
|
|
$
|
6,057
|
|
|
Latin America
|
1,450
|
|
1,406
|
|
||
|
Europe/Africa/CIS
|
1,594
|
|
1,832
|
|
||
|
Middle East/Asia
|
2,122
|
|
3,180
|
|
||
|
Total
|
$
|
10,911
|
|
$
|
12,475
|
|
Note 5
. Receivables
Our trade receivables are generally not collateralized. At
December 31, 2015
and
December 31, 2014
,
26%
and
39%
of our gross trade receivables were from customers in the United States, respectively. Other than Venezuela, as further discussed below, no other country or single customer accounted for more than 10% of our gross trade receivables at these dates.
Venezuela.
During the first quarter of 2015, we began utilizing the new SIMADI exchange rate mechanism to remeasure our net monetary assets denominated in Bolívares, at a market rate of
192
Bolívares per United States dollar as compared to the official exchange rate of
6.3
Bolívares per United States dollar we had previously utilized, resulting in a foreign currency devaluation loss of
$199 million
. See Note 3 and “Management’s Discussion and Analysis of Financial Condition and Results of Operations – Business Environment and Results of Operations” for further information.
Our total outstanding trade receivables in Venezuela were
$704 million
, which is more than
10%
of our gross trade receivables, as of
December 31, 2015
, compared to
$670 million
, or approximately
9%
of our gross trade receivables, as of
December 31, 2014
. We have experienced delays in collecting payment on our receivables from our primary customer in Venezuela, which contributed to the increase in those receivables during the period. This was partially offset by a decline due to the currency devaluation in the first quarter of 2015. These receivables are not disputed, and we have not historically had material write-offs relating to this customer. Additionally, we routinely monitor the financial stability of our customers. Of the
$704 million
of receivables in Venezuela as of
December 31, 2015
, the majority of which are United States dollar-denominated receivables,
$175 million
has been classified as long-term and included within “Other assets” on our consolidated balance sheets. Of the
$670 million
receivables in Venezuela as of
December 31, 2014
,
$256 million
has been classified as long-term and included within “Other assets” on our consolidated balance sheets.
The following table presents a rollforward of our allowance for bad debts for
2013
,
2014
, and
2015
.
|
Millions of dollars
|
Balance at Beginning of Period
|
Charged to Costs and Expenses
|
Write-Offs
|
Balance at End of Period
|
||||||||
|
Year ended December 31, 2013
|
$
|
92
|
|
$
|
39
|
|
$
|
(14
|
)
|
$
|
117
|
|
|
Year ended December 31, 2014
|
117
|
|
26
|
|
(6
|
)
|
137
|
|
||||
|
Year ended December 31, 2015
|
137
|
|
44
|
|
(36
|
)
|
145
|
|
||||
58
Inventories are stated at the lower of cost or market. In the United States, we manufacture certain finished products and parts inventories for drill bits, completion products, bulk materials, and other tools that are recorded using the last-in, first-out method and totaled
$120 million
at
December 31, 2015
and
$227 million
at
December 31, 2014
. If the average cost method had been used, there would have been
no
difference reported at
December 31, 2015
and total inventories would have been
$38 million
higher than reported at
December 31, 2014
. The cost of the remaining inventory was recorded on the average cost method. Inventories consisted of the following:
|
December 31
|
||||||
|
Millions of dollars
|
2015
|
2014
|
||||
|
Finished products and parts
|
$
|
1,747
|
|
$
|
2,606
|
|
|
Raw materials and supplies
|
548
|
|
754
|
|
||
|
Work in process
|
122
|
|
211
|
|
||
|
Total
|
$
|
2,417
|
|
$
|
3,571
|
|
We reclassified
$576 million
of our inventory to assets held for sale as of
December 31, 2015
. See
Note 2
for further information. Additionally, as a result of the downturn in the energy market and its corresponding impact on our business outlook, we recorded inventory write-downs as the cost of some of our inventory exceeded its market value. See
Note 3
for further information about impairments and other charges.
Finished products and parts are reported net of obsolescence reserves of
$218 million
at
December 31, 2015
and
$161 million
at
December 31, 2014
.
Property, plant, and equipment were composed of the following:
|
December 31
|
||||||
|
Millions of dollars
|
2015
|
2014
|
||||
|
Land
|
$
|
232
|
|
$
|
217
|
|
|
Buildings and property improvements
|
3,359
|
|
3,311
|
|
||
|
Machinery, equipment, and other
|
17,109
|
|
19,954
|
|
||
|
Total
|
20,700
|
|
23,482
|
|
||
|
Less accumulated depreciation
|
9,789
|
|
11,007
|
|
||
|
Net property, plant, and equipment
|
$
|
10,911
|
|
$
|
12,475
|
|
Classes of assets, excluding oil and natural gas investments, are depreciated over the following useful lives:
|
Buildings and Property
Improvements |
||
|
2015
|
2014
|
|
|
1 - 10 years
|
12%
|
12%
|
|
11 - 20 years
|
41%
|
42%
|
|
21 - 30 years
|
22%
|
21%
|
|
31 - 40 years
|
25%
|
25%
|
|
Machinery, Equipment,
and Other |
||
|
2015
|
2014
|
|
|
1 - 5 years
|
23%
|
23%
|
|
6 - 10 years
|
69%
|
70%
|
|
11 - 20 years
|
8%
|
7%
|
59
Note 8
. Debt
Our long-term debt, including current maturities, consisted of the following:
|
December 31
|
||||||
|
Millions of dollars
|
2015
|
2014
|
||||
|
5.0% senior notes due November 2045
|
$
|
2,000
|
|
$
|
—
|
|
|
3.8% senior notes due November 2025
|
2,000
|
|
—
|
|
||
|
3.375% senior notes due November 2022
|
1,250
|
|
—
|
|
||
|
2.7% senior notes due November 2020
|
1,250
|
|
—
|
|
||
|
3.5% senior notes due August 2023
|
1,100
|
|
1,100
|
|
||
|
4.85% senior notes due November 2035
|
1,000
|
|
—
|
|
||
|
6.15% senior notes due September 2019
|
1,000
|
|
1,000
|
|
||
|
7.45% senior notes due September 2039
|
1,000
|
|
1,000
|
|
||
|
4.75% senior notes due August 2043
|
900
|
|
900
|
|
||
|
6.7% senior notes due September 2038
|
800
|
|
800
|
|
||
|
1.0% senior notes due August 2016
|
600
|
|
600
|
|
||
|
3.25% senior notes due November 2021
|
500
|
|
500
|
|
||
|
4.5% senior notes due November 2041
|
500
|
|
500
|
|
||
|
2.0% senior notes due August 2018
|
400
|
|
400
|
|
||
|
5.9% senior notes due September 2018
|
400
|
|
400
|
|
||
|
7.6% senior debentures due August 2096
|
300
|
|
300
|
|
||
|
8.75% senior debentures due February 2021
|
185
|
|
185
|
|
||
|
6.75% notes due February 2027
|
104
|
|
104
|
|
||
|
7.53% notes due May 2017
|
45
|
|
45
|
|
||
|
Other
|
144
|
|
37
|
|
||
|
Unamortized debt issuance costs and discounts
|
(132
|
)
|
(92
|
)
|
||
|
Total
|
15,346
|
|
7,779
|
|
||
|
Current maturities
|
(659
|
)
|
(14
|
)
|
||
|
Total long-term debt
|
$
|
14,687
|
|
$
|
7,765
|
|
$7.5 billion issuance
In November 2015, we issued
$7.5 billion
aggregate principal amount of senior notes in five tranches:
$1.25 billion
of
2.7%
senior notes due 2020,
$1.25 billion
of
3.375%
senior notes due 2022,
$2.0 billion
of
3.8%
senior notes due 2025,
$1.0 billion
of
4.85%
senior notes due 2035, and
$2.0 billion
of
5.0%
senior notes due 2045. We intend to use the net proceeds of the offering for general corporate purposes, including financing a portion of the cash consideration component of our pending acquisition of Baker Hughes. The 2020 notes and the 2022 notes, which aggregate
$2.5 billion
in principal amount, are subject to a special mandatory redemption. In the event the Baker Hughes acquisition is not consummated on or prior to November 13, 2016, or, if prior to such date, the merger agreement is terminated for any reason, we will be required to redeem the 2020 notes and the 2022 notes at a redemption price equal to
101%
of the principal amount, plus accrued and unpaid interest. Based on management's assessment, we believe the 2020 notes and the 2022 notes are appropriately classified as long-term debt on our consolidated balance sheets as of December 31, 2015.
In conjunction with the November 2015 debt issuance, we adopted a new accounting standards update requiring debt issuance costs be presented in the balance sheet as a direct deduction from the carrying amount of that debt liability, consistent with debt discounts. We applied the change retrospectively for prior period balances of unamortized debt issuance costs. As such, the table above now presents unamortized debt issuance costs and discounts in the aggregate for both periods. See Note 16 for further information.
Senior debt
All of our senior notes and debentures rank equally with our existing and future senior unsecured indebtedness, have semiannual interest payments, and have no sinking fund requirements.
We may redeem all of our senior notes from time to time or all of the notes of each series at any time at the applicable redemption prices, plus accrued and unpaid interest.
Our
7.6%
and
8.75%
senior debentures
may not be redeemed prior to maturity
.
Revolving credit facilities
In July 2015, we entered into a new five-year revolving credit agreement, with an initial capacity of
$3.0 billion
, increasing to
$4.5 billion
upon closing of the Baker Hughes acquisition and satisfaction of the conditions provided in the credit agreement. The credit agreement is for working capital or general corporate purposes and expires on July 21, 2020. The full amount of the revolving credit facility was available as of
December 31, 2015
.
60
Debt maturities
Our long-term debt matures as follows:
$659 million
in 2016,
$79 million
in 2017,
$823 million
in 2018,
$1.0 billion
in 2019,
$1.3 billion
in 2020, and the remainder in 2021 and thereafter.
Bridge facility commitment
In November 2014, we obtained a commitment letter for an
$8.6
billion senior unsecured bridge facility in connection with the pending acquisition of Baker Hughes. Upon issuance of the
$7.5 billion
principal amount of senior notes in November 2015, the commitment was reduced by that amount to
$1.1 billion
, and the facility expires on April 30, 2016. We have not drawn any amounts under this commitment as of
December 31, 2015
. We may use cash on hand, obtain additional debt financings or a combination thereof, in lieu of utilizing all or a portion of the bridge facility for the remaining portion of the cash consideration for the acquisition. See
Note 2
for further information about the pending acquisition.
Note 9
. Commitments and Contingencies
Macondo well incident
The semisubmersible drilling rig, Deepwater Horizon, sank on April 22, 2010 after an explosion and fire onboard the rig that began on April 20, 2010. The Deepwater Horizon was owned by an affiliate of Transocean Ltd. and had been drilling the Macondo exploration well in the Gulf of Mexico for the lease operator, BP Exploration & Production, Inc. (BP). We performed a variety of services on that well for BP. There were
eleven
fatalities and a number of injuries as a result of the Macondo well incident.
Litigation and settlements.
Numerous lawsuits relating to the Macondo well incident and alleging damages arising from the blowout were filed against various parties, including BP, Transocean and us, in federal and state courts throughout the United States, most of which were consolidated in a Multi District Litigation proceeding (MDL) in the United States Eastern District of Louisiana. The defendants in the MDL proceeding filed a variety of cross claims against each other.
In 2012, BP reached a settlement to resolve the substantial majority of eligible private economic loss and medical claims stemming from the Macondo well incident (BP MDL Settlements). The MDL court has since certified the classes and granted final approval for the BP MDL Settlements, which also provided for the release by participating plaintiffs of compensatory damage claims against us.
The trial for the first phase of the MDL proceeding occurred in February 2013 through April 2013 and covered issues arising out of the conduct and degree of culpability of various parties allegedly relevant to the loss of well control, the ensuing fire and explosion on and sinking of the Deepwater Horizon, and the initiation of the release of hydrocarbons from the Macondo well. In September 2014, the MDL court ruled (Phase One Ruling) that, among other things, (1) in relation to the Macondo well incident, BP’s conduct was reckless, Transocean’s conduct was negligent, and our conduct was negligent, (2) fault for the Macondo blowout, explosion, and spill was apportioned
67%
to BP,
30%
to Transocean and
3%
to us, and (3) the indemnity and release clauses in our contract with BP are valid and enforceable against BP. The MDL court did not find that our conduct was grossly negligent, thereby, subject to any appeals, eliminating our exposure in the MDL for punitive damages. The appeal process for the Phase One Ruling is underway, with various parties filing briefs according to a court-ordered schedule.
In September 2014, prior to the Phase One Ruling, we reached an agreement, subject to court approval, to settle a substantial portion of the plaintiffs’ claims asserted against us relating to the Macondo well incident (our MDL Settlement). Pursuant to our MDL Settlement, we agreed to pay an aggregate of
$1.1 billion
, which includes legal fees and costs, into a settlement fund in
three
installments over
two
years, except that
one
installment of legal fees will not be paid until all of the conditions to the settlement have been satisfied or waived. Certain conditions must be satisfied before our MDL Settlement becomes effective and the funds are released from the settlement fund. These conditions include, among others, the issuance of a final order of the MDL court, including the resolution of certain appeals. In addition, we have the right to terminate our MDL Settlement if more than an agreed number of plaintiffs elect to opt out of the settlement prior to the expiration of the opt out deadline to be established by the MDL court. Before approving our MDL Settlement, the MDL court must certify the settlement class, the numerous class members must be notified of the proposed settlement, and the court must hold a fairness hearing. We are unable to predict when the MDL court will approve our MDL Settlement.
Our MDL Settlement does not cover claims against us by the state governments of Alabama, Florida, Mississippi, Louisiana, or Texas, claims by our own employees, compensatory damages claims by plaintiffs in the MDL that opted out of or were excluded from the settlement class in the BP MDL Settlements, or claims by other defendants in the MDL or their respective employees. However, these claims have either been dismissed, are subject to dismissal, are subject to indemnification by BP, or are not believed to be material.
On May 20, 2015, we and BP entered into an agreement to resolve all remaining claims against each other, and pursuant to which BP will defend and indemnify us in future trials for compensatory damages. We have also reached a similar agreement with Transocean, each agreeing to drop all remaining claims against the other. On July 2, 2015, BP announced that it had reached agreements in principle to settle all remaining federal, state and local government claims arising from the Macondo well incident.
61
Regulatory action.
In October 2011, the Bureau of Safety and Environmental Enforcement (BSEE) issued a notification of Incidents of Noncompliance (INCs) to us for allegedly violating federal regulations relating to the failure to take measures to prevent the unauthorized release of hydrocarbons, the failure to take precautions to keep the Macondo well under control, the failure to cement the well in a manner that would, among other things, prevent the release of fluids into the Gulf of Mexico, and the failure to protect health, safety, property, and the environment as a result of a failure to perform operations in a safe and workmanlike manner. We have appealed the INCs, but the appeal has been suspended pending certain proceedings in the MDL and potential appeals. The BSEE has announced that the INCs will be reviewed for possible imposition of civil penalties once the appeal has ended. We understand that the regulations in effect at the time of the alleged violations provide for fines of up to
$35,000
per day per violation.
Loss contingency.
During 2015, we made the second installment payment under our MDL Settlement in the amount of
$333 million
. Accordingly, as of
December 31, 2015
, our remaining liability related to the Macondo well incident was
$472 million
, consisting of a current portion of
$400
million related to our MDL Settlement and a non-current portion of
$72
million representing a loss contingency unrelated to that settlement, included within "Other liabilities" on our consolidated balance sheets. Our loss contingency liability has not been reduced for potential recoveries from our insurers. See below for information regarding amounts that we could potentially recover from insurance.
Subject to the satisfaction of the conditions of our MDL Settlement and to the resolution of the appeal of the Phase One Ruling, we believe that the BP MDL Settlement, our MDL Settlement, the Phase One Ruling and our settlement with BP have eliminated any additional material financial exposure to us in relation to the Macondo well incident.
Insurance coverage.
We had a general liability insurance program of
$600 million
at the time of the Macondo well incident. Our insurance was
designed to cover claims by businesses and individuals made against us in the event of property damage, injury, or death and, among
other things, claims relating to environmental damage, as well as legal fees incurred in defending against those claims. Through
December 31, 2015
, we have incurred approximately
$1.5 billion
of expenses related to the MDL Settlement, legal fees, and other settlement-related costs, of which
$403 million
has been reimbursed under our insurance program. Most of the insurance carriers that issued policies in the final
$200 million
layer of insurance coverage relating to the Macondo well incident notified us that they would not reimburse us with respect to our MDL Settlement. During the first and third quarters of 2015, we settled with two of the remaining insurance carriers. We have initiated arbitration proceedings to pursue recovery of the remaining balance of approximately
$118 million
. Due to the uncertainty surrounding such recovery, no related amounts have been recognized in the consolidated financial statements as of
December 31, 2015
.
Fair Labor Standards Act (FLSA) Claim
In 2014, the U.S. Department of Labor Wage and Hour Division (DOL) commenced an audit to determine whether certain workers have been properly classified by us as exempt under the FLSA. In addition, litigation was commenced against us alleging that certain field professionals were not properly classified. During 2015, upon completion of a detailed analysis of the potential exposure involved and settlement with the DOL and of the pending litigation, we recorded corresponding loss contingency liabilities.
Securities litigation
In June 2002, a class action lawsuit was filed against us in federal court alleging violations of the federal securities laws after the Securities and Exchange Commission (SEC) initiated an investigation in connection with our change in accounting for revenue on long-term construction projects and related disclosures. In the weeks that followed, approximately
twenty
similar class actions were filed against us. Several of those lawsuits also named as defendants several of our present or former officers and directors. The class action cases were later consolidated, and the amended consolidated class action complaint, styled
Richard Moore, et al. v. Halliburton Company, et al.
, was filed and served upon us in April 2003. As a result of a substitution of lead plaintiffs, the case was styled
Archdiocese of Milwaukee Supporting Fund (AMSF) v. Halliburton Company, et al
. AMSF has changed its name to Erica P. John Fund, Inc. (the Fund). We settled with the SEC in the second quarter of 2004.
In June 2003, the lead plaintiffs filed a motion for leave to file a second amended consolidated complaint, which was granted by the court. In addition to restating the original accounting and disclosure claims, the second amended consolidated complaint included claims arising out of our 1998 acquisition of Dresser Industries, Inc., including that we failed to timely disclose the resulting asbestos liability exposure.
In April 2005, the court appointed new co-lead counsel and named the Fund the new lead plaintiff, directing that it file a third consolidated amended complaint and that we file our motion to dismiss. The court held oral arguments on that motion in August 2005. In March 2006, the court entered an order in which it granted the motion to dismiss with respect to claims arising prior to June 1999 and granted the motion with respect to certain other claims while permitting the Fund to re-plead some of those claims to correct deficiencies in its earlier complaint. In April 2006, the Fund filed its fourth amended consolidated complaint. We filed a motion to dismiss those portions of the complaint that had been re-pled. A hearing was held on that motion in July 2006, and in March 2007 the court ordered dismissal of the claims against all individual defendants other than our Chief Executive Officer (CEO). The court ordered that the case proceed against our CEO and us.
62
In September 2007, the Fund filed a motion for class certification, and our response was filed in November 2007. The district court issued an order in November 2008 denying the motion for class certification. The Fifth Circuit Court of Appeals affirmed the district court’s order denying class certification. In June 2011, the United States Supreme Court reversed the Fifth Circuit ruling that the Fund needed to prove loss causation in order to obtain class certification and the case was returned to the lower courts for further consideration.
In January 2012, the district court issued an order certifying the class. In April 2013, the Fifth Circuit issued an order affirming the district court's order.
Our writ of certiorari with the United States Supreme Court was granted and in June 2014 the Supreme Court issued its decision, maintaining the presumption of class member reliance through the “fraud on the market” theory, but holding that we are entitled to rebut that presumption by presenting evidence that there was no impact on our stock price from the alleged misrepresentation. Because the district court and the Fifth Circuit denied us that opportunity, the Supreme Court vacated the Fifth Circuit’s decision and remanded for further proceedings consistent with the Supreme Court decision.
In December 2014, the district court held a hearing to consider whether there was an impact on our stock price from the alleged misrepresentations. On July 27, 2015, the district court denied certification for the plaintiff class with respect to five of the six dates upon which the plaintiffs claimed that disclosures correcting previously misleading statements had been made that resulted in an impact to the stock price. However, the district court certified the class with respect to a disclosure made on December 7, 2001 regarding an adverse jury verdict in an asbestos case that plaintiffs alleged was corrective, leaving the allegation relating to disclosure of the asbestos liability exposure as the only remaining punitive class action claim. The ruling was based on the district court's conclusion that the court was required to assume at class certification that a disclosure was actually corrective. We do not agree with that conclusion and filed a petition with the Fifth Circuit seeking to appeal the ruling. On November 4, 2015, the Fifth Circuit granted our petition to appeal the district court's ruling. The case will now be fully briefed and argued before the Fifth Circuit. We cannot predict the outcome or consequences of this case, which we intend to vigorously defend.
Investigations
We are conducting internal investigations of certain areas of our operations in Angola and Iraq, focusing on compliance with certain company policies, including our Code of Business Conduct (COBC), and the FCPA and other applicable laws.
In December 2010, we received an anonymous e-mail alleging that certain current and former personnel violated our COBC and the FCPA, principally through the use of an Angolan vendor. The e-mail also alleges conflicts of interest, self-dealing, and the failure to act on alleged violations of our COBC and the FCPA. We contacted the DOJ to advise them that we were initiating an internal investigation.
During the second quarter of 2012, in connection with a meeting with the DOJ and the SEC regarding the above investigation, we advised the DOJ and the SEC that we were initiating unrelated, internal investigations into payments made to a third-party agent relating to certain customs matters in Angola and to third-party agents relating to certain customs and visa matters in Iraq.
Since the initiation of the investigations described above, we have participated in meetings with the DOJ and the SEC to brief them on the status of the investigations and produced documents to them both voluntarily and as a result of SEC subpoenas to us and certain of our current and former officers and employees.
We expect to continue to have discussions with the DOJ and the SEC regarding issues relevant to the Angola and Iraq matters described above. We have engaged outside counsel and independent forensic accountants to assist us with these investigations.
Because these investigations are ongoing, we cannot predict their outcome or the consequences thereof.
Environmental
We are subject to numerous environmental, legal, and regulatory requirements related to our operations worldwide. In the United States, these laws and regulations include, among others:
|
-
|
the Comprehensive Environmental Response, Compensation, and Liability Act;
|
|
-
|
the Resource Conservation and Recovery Act;
|
|
-
|
the Clean Air Act;
|
|
-
|
the Federal Water Pollution Control Act;
|
|
-
|
the Toxic Substances Control Act; and
|
|
-
|
the Oil Pollution Act.
|
In addition to the federal laws and regulations, states and other countries where we do business often have numerous environmental, legal, and regulatory requirements by which we must abide. We evaluate and address the environmental impact of our operations by assessing and remediating contaminated properties in order to avoid future liabilities and comply with environmental, legal, and regulatory requirements. Our Health, Safety, and Environment group has several programs in place to maintain environmental leadership and to help prevent the occurrence of environmental contamination. On occasion, in addition to the matters relating to the Macondo well incident described above, we are involved in other environmental litigation and claims, including the remediation of properties we own or have operated, as well as efforts to meet or correct compliance-
63
related matters. We do not expect costs related to those claims and remediation requirements to have a material adverse effect on our liquidity, consolidated results of operations, or consolidated financial position. Our accrued liabilities for environmental matters were
$50 million
as of
December 31, 2015
and
$57 million
as of
December 31, 2014
. Because our estimated liability is typically within a range and our accrued liability may be the amount on the low end of that range, our actual liability could eventually be well in excess of the amount accrued. Our total liability related to environmental matters covers numerous properties.
Additionally, we have subsidiaries that have been named as potentially responsible parties along with other third parties for
eight
federal and state Superfund sites for which we have established reserves. As of
December 31, 2015
, those
eight
sites accounted for approximately
$3 million
of our
$50 million
total environmental reserve. Despite attempts to resolve these Superfund matters, the relevant regulatory agency may at any time bring suit against us for amounts in excess of the amount accrued. With respect to some Superfund sites, we have been named a potentially responsible party by a regulatory agency; however, in each of those cases, we do not believe we have any material liability. We also could be subject to third-party claims with respect to environmental matters for which we have been named as a potentially responsible party.
Guarantee arrangements
In the normal course of business, we have agreements with financial institutions under which approximately
$2.0 billion
of letters of credit, bank guarantees, or surety bonds were outstanding as of
December 31, 2015
. Some of the outstanding letters of credit have triggering events that would entitle a bank to require cash collateralization.
Leases
We are party to numerous operating leases, principally for the use of land, offices, equipment, manufacturing and field facilities, and warehouses. Total rentals on our operating leases, net of sublease rentals, were
$875 million
in
2015
,
$1.0 billion
in
2014
, and
$958 million
in
2013
.
Future total rentals on our noncancellable operating leases are
$944 million
in the aggregate, which includes the following:
$257 million
in
2016
;
$171 million
in
2017
;
$132 million
in
2018
;
$96 million
in
2019
;
$60 million
in
2020
; and
$228 million
thereafter.
Note 10
. Income Taxes
The components of the benefit (provision) for income taxes on continuing operations were:
|
Year Ended December 31
|
|||||||||
|
Millions of dollars
|
2015
|
2014
|
2013
|
||||||
|
Current income taxes:
|
|||||||||
|
Federal
|
$
|
635
|
|
$
|
(959
|
)
|
$
|
(245
|
)
|
|
Foreign
|
(636
|
)
|
(734
|
)
|
(485
|
)
|
|||
|
State
|
51
|
|
(36
|
)
|
(49
|
)
|
|||
|
Total current
|
50
|
|
(1,729
|
)
|
(779
|
)
|
|||
|
Deferred income taxes:
|
|||||||||
|
Federal
|
(18
|
)
|
83
|
|
4
|
|
|||
|
Foreign
|
262
|
|
357
|
|
125
|
|
|||
|
State
|
(20
|
)
|
14
|
|
2
|
|
|||
|
Total deferred
|
224
|
|
454
|
|
131
|
|
|||
|
Income tax benefit (provision)
|
$
|
274
|
|
$
|
(1,275
|
)
|
$
|
(648
|
)
|
The United States and foreign components of income (loss) from continuing operations before income taxes were as follows:
|
Year Ended December 31
|
|||||||||
|
Millions of dollars
|
2015
|
2014
|
2013
|
||||||
|
United States
|
$
|
(1,560
|
)
|
$
|
3,020
|
|
$
|
1,070
|
|
|
Foreign
|
624
|
|
1,692
|
|
1,694
|
|
|||
|
Total
|
$
|
(936
|
)
|
$
|
4,712
|
|
$
|
2,764
|
|
64
Reconciliations between the actual provision for income taxes on continuing operations and that computed by applying the United States statutory rate to income (loss) from continuing operations before income taxes were as follows:
|
Year Ended December 31
|
||||||
|
2015
|
2014
|
2013
|
||||
|
United States statutory rate
|
35.0
|
%
|
35.0
|
%
|
35.0
|
%
|
|
Impact of foreign income taxed at different rates
|
(15.6
|
)
|
(5.7
|
)
|
(9.3
|
)
|
|
Venezuela devaluation
|
4.3
|
|
—
|
|
—
|
|
|
Valuation allowance against tax assets
|
3.5
|
|
(3.6
|
)
|
(0.1
|
)
|
|
Impact of impairments and other charges
|
(3.0
|
)
|
—
|
|
—
|
|
|
Non-deductible acquisition costs
|
2.6
|
|
—
|
|
—
|
|
|
Adjustments of prior year taxes
|
(0.7
|
)
|
0.3
|
|
(0.6
|
)
|
|
Other impact of foreign operations
|
(0.5
|
)
|
(0.1
|
)
|
(0.7
|
)
|
|
State income taxes
|
0.3
|
|
0.8
|
|
1.7
|
|
|
Domestic manufacturing deduction
|
—
|
|
(1.9
|
)
|
(2.0
|
)
|
|
Other items, net
|
3.4
|
|
2.3
|
|
(0.5
|
)
|
|
Total effective tax rate on continuing operations
|
29.3
|
%
|
27.1
|
%
|
23.5
|
%
|
Our effective tax rate on continuing operations was
29.3%
for
2015
,
27.1%
for
2014
and
23.5%
for 2013. The effective tax rate in all periods were positively impacted by lower tax rates in certain foreign jurisdictions. The effective tax rate for 2015 was also impacted by the tax effects of the
$2.2 billion
of impairments and other charges, a change in mix of geographic earnings in which we experienced low levels of United States income during the year, additional valuation allowances booked on foreign deferred tax assets, a
$199 million
foreign currency exchange loss in Venezuela, and non-deductible costs related to the pending Baker Hughes acquisition. The effective tax rate for 2014 was positively impacted by a
$201 million
net operating loss valuation allowance released as a result of a reorganization of our legal structure in Brazil. Partially offsetting these items were total charges of approximately
$150 million
for a write-off of certain prepaid tax assets recorded in Iraq, additional tax expenses related to the settlement of a research and development credit with the United States authorities, and tax expenses related to other unrecognized tax benefits, which are mostly included in "Other items, net" in the table above.
We have not provided United States income taxes and foreign withholding taxes on the undistributed earnings of foreign subsidiaries as of
December 31, 2015
because we intend to permanently reinvest such earnings outside the United States. If these foreign earnings were to be repatriated in the future, the related United States tax liability may be reduced by any foreign income taxes previously paid on these earnings. As of
December 31, 2015
, the cumulative amount of earnings upon which United States income taxes have not been provided is approximately
$6.9 billion
. It is not practicable to estimate the amount of unrecognized deferred tax liability related to these earnings at this time.
The primary components of our deferred tax assets and liabilities were as follows:
|
December 31
|
||||||
|
Millions of dollars
|
2015
|
2014
|
||||
|
Gross deferred tax assets:
|
||||||
|
Accrued liabilities
|
$
|
392
|
|
$
|
494
|
|
|
Net operating loss carryforwards
|
540
|
|
462
|
|
||
|
Employee compensation and benefits
|
403
|
|
395
|
|
||
|
Foreign tax credit carry forward
|
365
|
|
79
|
|
||
|
Other
|
354
|
|
236
|
|
||
|
Total gross deferred tax assets
|
2,054
|
|
1,666
|
|
||
|
Gross deferred tax liabilities:
|
||||||
|
Depreciation and amortization
|
1,334
|
|
1,005
|
|
||
|
Other
|
109
|
|
111
|
|
||
|
Total gross deferred tax liabilities
|
1,443
|
|
1,116
|
|
||
|
Valuation allowances
|
213
|
|
184
|
|
||
|
Net deferred income tax asset
|
$
|
398
|
|
$
|
366
|
|
65
At
December 31, 2015
, we had
$2.0 billion
of net operating loss carryforwards, of which
$375 million
will expire from
2016
through
2019
, $
367 million
will expire from
2020
through
2024
, and $
285 million
will expire from
2025
through
2035
. The remaining balance will not expire.
The following table presents a rollforward of our unrecognized tax benefits and associated interest and penalties.
|
Millions of dollars
|
Unrecognized Tax Benefits
|
Interest
and Penalties |
|||||
|
Balance at January 1, 2013
|
$
|
228
|
|
$
|
68
|
|
|
|
Change in prior year tax positions
|
(53
|
)
|
(9
|
)
|
|||
|
Change in current year tax positions
|
30
|
|
1
|
|
|||
|
Cash settlements with taxing authorities
|
(21
|
)
|
(17
|
)
|
|||
|
Lapse of statute of limitations
|
(9
|
)
|
(9
|
)
|
|||
|
Balance at December 31, 2013
|
$
|
175
|
|
$
|
34
|
|
|
|
Change in prior year tax positions
|
83
|
|
24
|
|
|||
|
Change in current year tax positions
|
84
|
|
—
|
|
|||
|
Cash settlements with taxing authorities
|
(27
|
)
|
(1
|
)
|
|||
|
Lapse of statute of limitations
|
(1
|
)
|
(1
|
)
|
|||
|
Balance at December 31, 2014
|
$
|
314
|
|
(a)
|
$
|
56
|
|
|
Change in prior year tax positions
|
(33
|
)
|
7
|
|
|||
|
Change in current year tax positions
|
62
|
|
1
|
|
|||
|
Cash settlements with taxing authorities
|
(16
|
)
|
(15
|
)
|
|||
|
Lapse of statute of limitations
|
(5
|
)
|
(2
|
)
|
|||
|
Balance at December 31, 2015
|
$
|
322
|
|
(a)(b)
|
$
|
47
|
|
|
(a)
|
Includes
$67 million
as of
December 31, 2015
and
$46 million
as of
December 31, 2014
in foreign unrecognized tax benefits that would give rise to a United States tax credit. Approximately
$176 million
, which excludes
$10 million
of unrecognized tax benefits covered by an indemnification asset, as of
December 31, 2015
and
$194 million
as of
December 31, 2014
, if resolved in our favor, would positively impact the effective tax rate and, therefore, be recognized as additional tax benefits in our statement of operations.
|
|
(b)
|
Includes
$37 million
that could be resolved within the next 12 months.
|
We file income tax returns in the United States federal jurisdiction and in various states and foreign jurisdictions. In most cases, we are no longer subject to state, local, or non-United States income tax examination by tax authorities for years before 2005. Tax filings of our subsidiaries, unconsolidated affiliates, and related entities are routinely examined in the normal course of business by tax authorities. Currently, our United States federal tax filings for the tax years 2012 through 2013 are under review, 2003 through 2009 are under appeal pending final calculation of certain tax attribute carryforwards, and 2010 through 2011 are also under appeals by the Internal Revenue Service.
Note 11
. Shareholders’ Equity
Shares of common stock
The following table summarizes total shares of common stock outstanding:
|
December 31
|
||||
|
Millions of shares
|
2015
|
2014
|
||
|
Issued
|
1,071
|
|
1,071
|
|
|
In treasury
|
(215
|
)
|
(223
|
)
|
|
Total shares of common stock outstanding
|
856
|
|
848
|
|
Our Board of Directors has authorized a program to repurchase our common stock from time to time. The program does not require a specific number of shares to be purchased and the program may be effected through solicited or unsolicited transactions in the market or in privately negotiated transactions. The program may be terminated or suspended at any time. There were no repurchases made under the program during the year ended December 31, 2015. Approximately
$5.7 billion
remains authorized for repurchases as of
December 31, 2015
. From the inception of this program in February 2006 through
December 31, 2015
, we repurchased approximately
201 million
shares of our common stock for a total cost of approximately
$8.4 billion
.
Preferred stock
Our preferred stock consists of
five million
total authorized shares at
December 31, 2015
, of which
none
are issued.
66
Accumulated other comprehensive loss
Accumulated other comprehensive loss consisted of the following:
|
December 31
|
||||||
|
Millions of dollars
|
2015
|
2014
|
||||
|
Defined benefit and other postretirement liability adjustments (a)
|
$
|
(221
|
)
|
$
|
(326
|
)
|
|
Cumulative translation adjustment
|
(78
|
)
|
(70
|
)
|
||
|
Unrealized loss on cash flow hedge
|
(67
|
)
|
—
|
|
||
|
Other
|
3
|
|
(3
|
)
|
||
|
Total accumulated other comprehensive loss
|
$
|
(363
|
)
|
$
|
(399
|
)
|
(a) Included net actuarial losses for our international pension plans of
$205 million
at
December 31, 2015
and
$298 million
at
December 31, 2014
.
Note 12
. Stock-based Compensation
The following table summarizes stock-based compensation costs for the years ended
December 31, 2015
,
2014
, and
2013
.
|
Year Ended December 31
|
|||||||||
|
Millions of dollars
|
2015
|
2014
|
2013
|
||||||
|
Stock-based compensation cost
|
$
|
294
|
|
$
|
298
|
|
$
|
264
|
|
|
Tax benefit
|
(99
|
)
|
(90
|
)
|
(81
|
)
|
|||
|
Stock-based compensation cost, net of tax
|
$
|
195
|
|
$
|
208
|
|
$
|
183
|
|
Our Stock and Incentive Plan, as amended (Stock Plan), provides for the grant of any or all of the following types of stock-based awards:
|
-
|
stock options, including incentive stock options and nonqualified stock options;
|
|
-
|
restricted stock awards;
|
|
-
|
restricted stock unit awards;
|
|
-
|
stock appreciation rights; and
|
|
-
|
stock value equivalent awards.
|
There are currently no stock appreciation rights, stock value equivalent awards, or incentive stock options outstanding.
Under the terms of the Stock Plan, approximately
187 million
shares of common stock have been reserved for issuance to employees and non-employee directors. At
December 31, 2015
, approximately
19 million
shares were available for future grants under the Stock Plan. The stock to be offered pursuant to the grant of an award under the Stock Plan may be authorized but unissued common shares or treasury shares.
In addition to the provisions of the Stock Plan, we also have stock-based compensation provisions under our Restricted Stock Plan for Non-Employee Directors and our Employee Stock Purchase Plan (ESPP).
Each of the active stock-based compensation arrangements is discussed below.
Stock options
The majority of our options are generally issued during the second quarter of the year. All stock options under the Stock Plan are granted at the fair market value of our common stock at the grant date. Employee stock options vest ratably over a
three
-year period and generally expire
10
years from the grant date. Compensation expense for stock options is generally recognized on a straight line basis over the entire vesting period. No further stock option grants are being made under the stock plans of acquired companies.
67
The following table represents our stock options activity during
2015
.
|
Number
of Shares (in millions) |
Weighted
Average Exercise Price per Share |
Weighted
Average Remaining Contractual Term (years) |
Aggregate
Intrinsic Value (in millions) |
||||||
|
Outstanding at January 1, 2015
|
17.4
|
|
$
|
43.73
|
|
||||
|
Granted
|
4.3
|
|
43.49
|
|
|||||
|
Exercised
|
(0.8
|
)
|
30.81
|
|
|||||
|
Forfeited/expired
|
(0.9
|
)
|
49.88
|
|
|||||
|
Outstanding at December 31, 2015
|
20.0
|
|
$
|
43.90
|
|
7.1
|
$
|
20
|
|
|
Exercisable at December 31, 2015
|
11.2
|
|
$
|
39.95
|
|
5.8
|
$
|
20
|
|
The total intrinsic value of options exercised was
$9 million
in
2015
,
$151 million
in
2014
, and
$93 million
in
2013
. As of
December 31, 2015
, there was
$88 million
of unrecognized compensation cost, net of estimated forfeitures, related to nonvested stock options, which is expected to be recognized over a weighted average period of approximately
two
years.
Cash received from option exercises was
$167 million
during
2015
,
$332 million
during
2014
, and
$277 million
during
2013
.
The fair value of options at the date of grant was estimated using the Black-Scholes option pricing model. The expected volatility of options granted was a blended rate based upon implied volatility calculated on actively traded options on our common stock and upon the historical volatility of our common stock. The expected term of options granted was based upon historical observation of actual time elapsed between date of grant and exercise of options for all employees. The assumptions and resulting fair values of options granted were as follows:
|
Year Ended December 31
|
|||
|
2015
|
2014
|
2013
|
|
|
Expected term (in years)
|
5.16
|
5.23
|
5.27
|
|
Expected volatility
|
39%
|
37%
|
40%
|
|
Expected dividend yield
|
1.51 - 1.85%
|
0.94 - 1.77%
|
0.94 - 1.33%
|
|
Risk-free interest rate
|
1.43 - 1.72%
|
1.57 - 1.86%
|
0.77 - 1.73%
|
|
Weighted average grant-date fair value per share
|
$13.47
|
$19.26
|
$14.34
|
Restricted stock
Restricted shares issued under the Stock Plan are restricted as to sale or disposition. These restrictions lapse periodically over an extended period of time not exceeding
10
years. Restrictions may also lapse for early retirement and other conditions in accordance with our established policies. Upon termination of employment, shares on which restrictions have not lapsed must be returned to us, resulting in restricted stock forfeitures. The fair market value of the stock on the date of grant is amortized and charged to income on a straight-line basis over the requisite service period for the entire award.
The following table represents our restricted stock awards and restricted stock units granted, vested, and forfeited during
2015
.
|
Number of Shares
(in millions) |
Weighted Average
Grant-Date Fair Value per Share |
||||
|
Nonvested shares at January 1, 2015
|
16.1
|
|
$
|
45.88
|
|
|
Granted
|
6.5
|
|
43.24
|
|
|
|
Vested
|
(4.8
|
)
|
42.86
|
|
|
|
Forfeited
|
(1.3
|
)
|
47.57
|
|
|
|
Nonvested shares at December 31, 2015
|
16.5
|
|
$
|
45.59
|
|
68
The weighted average grant-date fair value of shares granted during
2014
was
$58.21
and during
2013
was
$42.93
. The total fair value of shares vested during
2015
was
$211 million
, during
2014
was
$278 million
, and during
2013
was
$208 million
. As of
December 31, 2015
, there was
$507 million
of unrecognized compensation cost, net of estimated forfeitures, related to nonvested restricted stock, which is expected to be recognized over a weighted average period of
three
years.
Employee Stock Purchase Plan
Under the ESPP, eligible employees may have up to
10%
of their earnings withheld, subject to some limitations, to be used to purchase shares of our common stock. The ESPP contains
four
three
-month offering periods commencing on January 1, April 1, July 1, and October 1 of each year. The price at which common stock may be purchased under the ESPP is equal to
85%
of the lower of the fair market value of the common stock on the commencement date or last trading day of each offering period. Under this plan,
74 million
shares of common stock have been reserved for issuance. The stock to be offered may be authorized but unissued common shares or treasury shares. As of
December 31, 2015
,
40 million
shares have been sold through the ESPP since the inception of the plan and
34 million
shares are available for future issuance.
The fair value of ESPP shares was estimated using the Black-Scholes option pricing model. The expected volatility was a one-year historical volatility of our common stock. The assumptions and resulting fair values were as follows:
|
Year Ended December 31
|
|||||||||
|
2015
|
2014
|
2013
|
|||||||
|
Expected volatility
|
35
|
%
|
23
|
%
|
27
|
%
|
|||
|
Expected dividend yield
|
1.82
|
%
|
1.07
|
%
|
1.12
|
%
|
|||
|
Risk-free interest rate
|
0.01
|
%
|
0.04
|
%
|
0.06
|
%
|
|||
|
Weighted average grant-date fair value per share
|
$
|
8.62
|
|
$
|
11.80
|
|
$
|
8.40
|
|
Basic income or loss per share is based on the weighted average number of common shares outstanding during the period. Diluted income per share includes additional common shares that would have been outstanding if potential common shares with a dilutive effect had been issued. Antidilutive securities represent potentially dilutive securities which are excluded from the computation of diluted income or loss per share as their impact was antidilutive.
A reconciliation of the number of shares used for the basic and diluted income per share computations is as follows:
|
Year Ended December 31
|
||||||
|
Millions of shares
|
2015
|
2014
|
2013
|
|||
|
Basic weighted average common shares outstanding
|
853
|
|
848
|
|
898
|
|
|
Dilutive effect of awards granted under our stock incentive plans
|
—
|
|
4
|
|
4
|
|
|
Diluted weighted average common shares outstanding
|
853
|
|
852
|
|
902
|
|
|
|
|
|
|
|||
|
Antidilutive shares:
|
|
|
|
|||
|
Options with exercise price greater than the average market price
|
10
|
|
2
|
|
3
|
|
|
Options which ordinarily would be considered dilutive if not for being in net loss position
|
2
|
|
—
|
|
—
|
|
|
Total antidilutive shares
|
12
|
|
2
|
|
3
|
|
Note 14
. Financial Instruments and Risk Management
At
December 31, 2015
, we held
$96 million
of investments in fixed income securities with maturities ranging from less than
one
year to
January 2018
, of which
$63 million
are classified as “Other current assets” and
$33 million
are classified as “Other assets” on our consolidated balance sheets. At
December 31, 2014
, we held
$103 million
of investments in fixed income securities, of which
$56 million
are classified as "Other current assets" and
$47 million
are classified as "Other assets" on our consolidated balance sheets.
These securities consist primarily of corporate bonds and other debt instruments, are accounted for as available-for-sale and recorded at fair value, and are classified as Level 2 assets. Level 2 asset fair values are based on quoted prices for identical assets in less active markets. We have no financial instruments measured at fair value based on quoted prices in active markets (Level 1) or unobservable inputs (Level 3). The carrying amount of cash and equivalents, receivables, and accounts payable, as reflected in the consolidated balance sheets, approximates fair value due to the short maturities of these instruments.
69
The carrying amount and fair value of our long-term debt is as follows:
|
December 31, 2015
|
December 31, 2014
|
||||||||||||||||||||||||
|
Millions of dollars
|
Level 1
|
Level 2
|
Total fair value
|
Carrying value
|
Level 1
|
Level 2
|
Total fair value
|
Carrying value
|
|||||||||||||||||
|
Long-term debt
|
$
|
1,009
|
|
$
|
14,947
|
|
$
|
15,956
|
|
$
|
15,346
|
|
$
|
4,822
|
|
$
|
4,257
|
|
$
|
9,079
|
|
$
|
7,779
|
|
|
Our Level 1 debt fair values are calculated using quoted prices in active markets for identical liabilities with transactions occurring on the last two days of year-end. Our Level 2 debt fair values are calculated using significant observable inputs for similar liabilities where estimated values are determined from observable data points on our other bonds and on other similarly rated corporate debt or from observable data points of transactions occurring prior to two days from year-end and adjusting for changes in market conditions. Our total fair value and carrying value of debt increased in 2015 compared to 2014 associated with the
$7.5 billion
debt issuance in November 2015. Additionally, differences between the periods presented in our Level 1 and Level 2 classification of our long-term debt relate to the timing of when transactions are executed. We have no debt measured at fair value using unobservable inputs (Level 3).
We are exposed to market risk from changes in foreign currency exchange rates and interest rates. We selectively manage these exposures through the use of derivative instruments, including forward foreign exchange contracts, foreign exchange options, and interest rate swaps. The objective of our risk management strategy is to minimize the volatility from fluctuations in foreign currency and interest rates. We do not use derivative instruments for trading purposes. The fair value of our forward contracts, options, and interest rate swaps was not material as of
December 31, 2015
or
December 31, 2014
. The counterparties to our derivatives are primarily global commercial and investment banks.
Foreign currency exchange risk
We have operations in many international locations and are involved in transactions denominated in currencies other than the United States dollar, our functional currency, which exposes us to foreign currency exchange rate risk. Techniques in managing foreign currency exchange risk include, but are not limited to, foreign currency borrowing and investing and the use of currency exchange instruments. We attempt to selectively manage significant exposures to potential foreign currency exchange losses based on current market conditions, future operating activities, and the associated cost in relation to the perceived risk of loss. The purpose of our foreign currency risk management activities is to minimize the risk that our cash flows from the sale and purchase of services and products in foreign currencies will be adversely affected by changes in exchange rates.
We use forward contracts and options to manage our exposure to fluctuations in the currencies of certain countries in which we do business internationally. These instruments are not treated as hedges for accounting purposes, generally have an expiration date of
one
year or less, and are not exchange traded. While these instruments are subject to fluctuations in value, the fluctuations are generally offset by the value of the underlying exposures being managed. The use of some of these instruments may limit our ability to benefit from favorable fluctuations in foreign currency exchange rates.
Derivatives are not utilized to manage exposures in some currencies due primarily to the lack of available markets or cost considerations (non-traded currencies). We attempt to manage our working capital position to minimize foreign currency exposure in non-traded currencies and recognize that pricing for the services and products offered in these countries should account for the cost of exchange rate devaluations. We have historically incurred transaction losses in non-traded currencies.
The notional amounts of open foreign exchange derivatives were
$619 million
at
December 31, 2015
and
$662 million
at
December 31, 2014
. The notional amounts of these instruments do not generally represent amounts exchanged by the parties, and thus are not a measure of our exposure or of the cash requirements related to these contracts. As such, cash flows related to these contracts are typically not material. The amounts exchanged are calculated by reference to the notional amounts and by other terms of the contracts, such as exchange rates.
Interest rate risk
We are subject to interest rate risk on our existing long-term debt, debt potentially issued in the future, and some of our long-term investments in fixed income securities. Our short-term borrowings and short-term investments in fixed income securities do not give rise to significant interest rate risk due to their short-term nature. We had fixed rate long-term debt totaling
$15.3 billion
at
December 31, 2015
and
$7.8 billion
at
December 31, 2014
, with
$659 million
maturing during
2016
. We also had
$33 million
of long-term investments in fixed income securities at
December 31, 2015
with maturities that extend through
January 2018
.
70
We maintain an interest rate management strategy that is intended to mitigate the exposure to changes in interest rates in the aggregate for our debt portfolio. We hold a series of interest rate swaps relating to
three
of our debt instruments with a total notional amount of
$1.5 billion
at a weighted-average,
LIBOR-based
, floating rate of
4.0%
as of
December 31, 2015
. We utilize interest rate swaps to effectively convert a portion of our fixed rate debt to floating rates. These interest rate swaps, which expire when the underlying debt matures, are designated as fair value hedges of the underlying debt and are determined to be highly effective. The fair value of our interest rate swaps is included in “Other assets” in our consolidated balance sheets as of
December 31, 2015
and
December 31, 2014
. The fair value of our interest rate swaps was determined using an income approach model with inputs, such as the notional amount, LIBOR rate spread, and settlement terms that are observable in the market or can be derived from or corroborated by observable data (Level 2). These derivative instruments are marked to market with gains and losses recognized currently in interest expense to offset the respective gains and losses recognized on changes in the fair value of the hedged debt. At
December 31, 2015
, we had fixed rate debt aggregating
$13.8 billion
and variable rate debt aggregating
$1.5 billion
, after taking into account the effects of the interest rate swaps.
Credit risk
Financial instruments that potentially subject us to concentrations of credit risk are primarily cash equivalents, investments in fixed income securities, and trade receivables. It is our practice to place our cash equivalents and investments in fixed income securities in high quality investments with various institutions. We derive the majority of our revenue from selling products and providing services to the energy industry. Within the energy industry, our trade receivables are generated from a broad and diverse group of customers. As of
December 31, 2015
,
26%
of our gross trade receivables were in the United States and more than
10%
were in Venezuela, compared to
39%
in the United States and
9%
in Venezuela at
December 31, 2014
. We maintain an allowance for losses based upon the expected collectability of all trade accounts receivable.
We do not have any significant concentrations of credit risk with any individual counterparty to our derivative contracts. We select counterparties to those contracts based on our belief that each counterparty’s profitability, balance sheet, and capacity for timely payment of financial commitments is unlikely to be materially adversely affected by foreseeable events.
Note 15
. Retirement Plans
Our company and subsidiaries have various plans that cover a significant number of our employees. These plans include defined contribution plans, defined benefit plans, and other postretirement plans:
|
-
|
our defined contribution plans provide retirement benefits in return for services rendered. These plans provide an individual account for each participant and have terms that specify how contributions to the participant’s account are to be determined rather than the amount of pension benefits the participant is to receive. Contributions to these plans are based on pretax income and/or discretionary amounts determined on an annual basis. Our expense for the defined contribution plans for continuing operations totaled
$288 million
in
2015
,
$347 million
in
2014
, and
$313 million
in
2013
;
|
|
-
|
our defined benefit plans, which include both funded and unfunded pension plans, define an amount of pension benefit to be provided, usually as a function of age, years of service, and/or compensation. The unfunded obligations and net periodic benefit cost of our United States defined benefit plans were not material for the periods presented; and
|
|
-
|
our postretirement plans other than pensions are offered to specific eligible employees. The accumulated benefit obligations and net periodic benefit cost for these plans were not material for the periods presented.
|
Funded status
For our international pension plans, at
December 31, 2015
, the projected benefit obligation was
$1.0 billion
and the fair value of plan assets was
$872 million
, which resulted in an unfunded obligation of
$174 million
. At
December 31, 2014
, the projected benefit obligation was
$1.2 billion
and the fair value of plan assets was
$891 million
, which resulted in an unfunded obligation of
$347 million
. The accumulated benefit obligation for our international plans was
$990 million
at
December 31, 2015
and
$1.2 billion
at
December 31, 2014
.
71
The following table presents additional information about our international pension plans.
|
December 31
|
||||||
|
Millions of dollars
|
2015
|
2014
|
||||
|
Amounts recognized on the Consolidated Balance Sheets
|
||||||
|
Accrued employee compensation and benefits
|
$
|
20
|
|
$
|
22
|
|
|
Employee compensation and benefits
|
155
|
|
325
|
|
||
|
Pension plans in which projected benefit obligation exceeded plan assets
|
||||||
|
Projected benefit obligation
|
$
|
1,042
|
|
$
|
1,232
|
|
|
Fair value of plan assets
|
867
|
|
884
|
|
||
|
Pension plans in which accumulated benefit obligation exceeded plan assets
|
||||||
|
Accumulated benefit obligation
|
$
|
964
|
|
$
|
1,120
|
|
|
Fair value of plan assets
|
846
|
|
860
|
|
||
Fair value measurements of plan assets
Our Level 1 plan asset fair values are based on quoted prices in active markets for identical assets, our Level 2 plan asset fair values are based on significant observable inputs for similar assets, and our Level 3 plan asset fair values are based on significant unobservable inputs.
The following table sets forth by level within the fair value hierarchy the fair value of assets held by our international pension plans.
|
Millions of dollars
|
Level 1
|
Level 2
|
Level 3
|
Total
|
||||||||
|
Cash and equivalents
|
$
|
—
|
|
$
|
46
|
|
$
|
—
|
|
$
|
46
|
|
|
Common/collective trust funds
|
||||||||||||
|
Equity funds (a)
|
—
|
|
209
|
|
—
|
|
209
|
|
||||
|
Bond funds (b)
|
—
|
|
212
|
|
38
|
|
250
|
|
||||
|
Alternatives funds (c)
|
—
|
|
42
|
|
46
|
|
88
|
|
||||
|
Real estate funds (d)
|
—
|
|
231
|
|
—
|
|
231
|
|
||||
|
Other assets
|
2
|
|
19
|
|
27
|
|
48
|
|
||||
|
Fair value of plan assets at December 31, 2015
|
$
|
2
|
|
$
|
759
|
|
$
|
111
|
|
$
|
872
|
|
|
|
||||||||||||
|
Common/collective trust funds
|
||||||||||||
|
Equity funds (a)
|
$
|
—
|
|
$
|
320
|
|
$
|
—
|
|
$
|
320
|
|
|
Bond funds (b)
|
—
|
|
197
|
|
70
|
|
267
|
|
||||
|
Alternatives fund (c)
|
—
|
|
148
|
|
—
|
|
148
|
|
||||
|
Real estate funds (d)
|
—
|
|
86
|
|
—
|
|
86
|
|
||||
|
Other assets
|
6
|
|
33
|
|
31
|
|
70
|
|
||||
|
Fair value of plan assets at December 31, 2014
|
$
|
6
|
|
$
|
784
|
|
$
|
101
|
|
$
|
891
|
|
|
(a)
|
Strategy is to invest in diversified funds of global common stocks.
|
|
(b)
|
Strategy is to invest in diversified funds of fixed income securities of varying geographies and credit quality and whose cash flows approximate the maturities of the benefit obligation.
|
|
(c)
|
Strategy is to invest in a fund of diversifying investments, including but not limited to reinsurance, commodities, and currencies.
|
|
(d)
|
Strategy is to invest in diversified funds of real estate investment trusts and private real estate.
|
Common/collective trust funds are valued at the net asset value of units held by the plans at year-end. Our investment strategy varies by country depending on the circumstances of the underlying plan. Risk management practices include diversification by issuer, industry, and geography, as well as the use of multiple asset classes and investment managers within each asset class. For our United Kingdom pension plan, which constituted
81%
of our international pension plans’ projected benefit obligation at
December 31, 2015
and is no longer accruing service benefits, we implemented an investment strategy in 2014 that aims to achieve full funding of the benefit obligation, with the plan's assets increasingly composed of investments whose cash flows match the maturities of the obligation.
72
Net periodic benefit cost
Net periodic benefit cost for our international pension plans was
$42 million
in
2015
, which included
$9 million
of net curtailment and settlement cost arising from reductions in workforce during the year. Net periodic benefit cost for our international pension plans was
$36 million
in
2014
, and
$32 million
in
2013
.
Actuarial assumptions
Certain weighted-average actuarial assumptions used to determine benefit obligations of our international pension plans at December 31 were as follows:
|
2015
|
2014
|
|
|
Discount rate
|
4.2%
|
4.1%
|
|
Rate of compensation increase
|
5.4%
|
5.3%
|
Certain weighted-average actuarial assumptions used to determine net periodic benefit cost of our international pension plans for the years ended December 31 were as follows:
|
2015
|
2014
|
2013
|
|
|
Discount rate
|
4.1%
|
4.8%
|
4.8%
|
|
Expected long-term return on plan assets
|
5.9%
|
6.4%
|
6.4%
|
|
Rate of compensation increase
|
5.3%
|
5.4%
|
5.5%
|
Assumed long-term rates of return on plan assets, discount rates for estimating benefit obligations, and rates of compensation increases vary by plan according to local economic conditions. Discount rates were determined based on the prevailing market rates of a portfolio of high-quality debt instruments with maturities matching the expected timing of the payment of the benefit obligations. Expected long-term rates of return on plan assets were determined based upon an evaluation of our plan assets and historical trends and experience, taking into account current and expected market conditions.
Other information
Contributions.
Funding requirements for each plan are determined based on the local laws of the country where such plan resides. In certain countries the funding requirements are mandatory, while in other countries they are discretionary. We currently expect to contribute
$14 million
to our international pension plans in
2016
.
Benefit payments.
The following table presents expected benefit payments over the next
10
years for our international pension plans.
|
Millions of dollars
|
|||
|
2016
|
$
|
51
|
|
|
2017
|
37
|
|
|
|
2018
|
39
|
|
|
|
2019
|
44
|
|
|
|
2020
|
44
|
|
|
|
Years 2021 - 2025
|
280
|
|
|
73
Note 16
. New Accounting Pronouncements
Standards adopted in 2015
Discontinued Operations
On January 1, 2015, we adopted an accounting standards update issued by the FASB related to discontinued operations, which added criteria providing that only those disposals of a component of an entity or a group of components of an entity that represent a strategic shift in operations should be presented as discontinued operations. The update allows an entity to present a disposal as discontinued operations even when it has continuing cash flows and significant continuing involvement with the disposed component. The update also requires expanded disclosures for discontinued operations and individually significant components of an entity that does not qualify for discontinued operations reporting. The adoption of this update did not impact our consolidated financial statements. This update may have a material impact on our consolidated financial statements in connection with the anticipated divestitures related to the pending acquisition of Baker Hughes. Because we will continue operating similar businesses of Baker Hughes after the acquisition, the disposition of the Halliburton businesses discussed in
Note 2
does not represent a strategic shift in our business. Accordingly, these businesses anticipated to be divested will not be presented as discontinued operations.
Debt Issuance Costs
In April 2015, the FASB issued an accounting standards update to simplify the presentation of debt issuance costs. The update requires that debt issuance costs related to a recognized debt liability be presented in the balance sheet as a direct deduction from the carrying amount of that debt liability, consistent with debt discounts, as opposed to current presentation of an asset on the balance sheet. This update is effective for fiscal years beginning after December 15, 2015, and interim periods within those fiscal years, and may be adopted earlier on a voluntary basis. We adopted this update in the fourth quarter of 2015 upon execution of our debt financing for the pending Baker Hughes acquisition. We applied the change retrospectively to January 1, 2014 for prior period balances of unamortized debt issuance costs, resulting in a
$75 million
reduction in other assets and long-term debt on our consolidated balance sheet as of December 31, 2014. See
Note 2
for further information about the pending acquisition and
Note 8
for information about our debt issuance in the fourth quarter of 2015.
Deferred Income Taxes
In November 2015, the FASB issued an accounting standards update to simplify income tax accounting. The update requires that all deferred tax assets and liabilities be classified as noncurrent on the balance sheet instead of separating deferred taxes into current and noncurrent amounts. This update is effective for fiscal years beginning after December 15, 2016, and interim periods within those fiscal years, and may be adopted earlier on a voluntary basis. We adopted this update as of December 31, 2015 and applied the change retrospectively to January 1, 2014 for prior period balances of deferred tax assets and liabilities, resulting in a
$421 million
reduction in total current assets and corresponding increase in other assets, along with a
$17 million
reduction in total current liabilities and corresponding increase in other liabilities on our consolidated balance sheet as of December 31, 2014.
Standards not yet adopted
Revenue Recognition
In May 2014, the Financial Accounting Standards Board (FASB) and the International Accounting Standards Board (IASB) issued a comprehensive new revenue recognition standard that will supersede existing revenue recognition guidance under United States generally accepted accounting principles (U.S. GAAP) and International Financial Reporting Standards (IFRS). The issuance of this guidance completes the joint effort by the FASB and the IASB to improve financial reporting by creating common revenue recognition guidance for U.S. GAAP and IFRS.
The core principle of the new guidance is that a company should recognize revenue to depict the transfer of promised goods or services to customers in an amount that reflects the consideration to which the company expects to be entitled in exchange for those goods or services. The standard creates a five-step model that requires companies to exercise judgment when considering the terms of a contract and all relevant facts and circumstances. The standard allows for several transition methods: (a) a full retrospective adoption in which the standard is applied to all of the periods presented, or (b) a modified retrospective adoption in which the standard is applied only to the most current period presented in the financial statements, including additional disclosures of the standard’s application impact to individual financial statement line items.
In August 2015, the FASB issued an accounting standards update for a one-year deferral of the revenue recognition standard's effective date for all entities, which changed the effectiveness to annual reporting periods beginning after December 15, 2017, including interim periods within that reporting period. We are currently evaluating this standard and our existing revenue recognition policies to determine which contracts in the scope of the guidance will be affected by the new requirements and what impact they would have on our consolidated financial statements upon adoption. We have not yet determined which transition method we will utilize upon adoption on the effective date.
Consolidation
In February 2015, the FASB issued an accounting standards update related to the consolidation analysis, which amends the guidelines for determining whether certain legal entities should be consolidated. This update eliminates the presumption that
74
a general partner should consolidate a limited partnership and modifies the evaluation of whether limited partnerships are variable interest entities or voting interest entities. This update is effective for fiscal years beginning after December 15, 2015, and interim periods within those fiscal years. We do not expect the adoption of this update to have a material impact on our consolidated financial statements.
Inventory
In July 2015, the FASB issued an accounting standards update to simplify the measurement of inventory, which requires inventory measured using the first in, first out (FIFO) or average cost methods to be subsequently measured at the lower of cost and net realizable value. Net realizable value is the estimated selling price in the ordinary course of business, less reasonably predictable cost of completion, disposal, and transportation. Currently, these inventory methods are required to be subsequently measured at the lower of cost or market. Market could be replacement cost, net realizable value, or net realizable value less an approximately normal profit margin. This update will be effective for fiscal years beginning after December 15, 2016, including interim periods within those fiscal years, and will be applied prospectively. Early adoption is permitted. We are currently evaluating the impact that this update will have on our consolidated financial statements.
Business Combinations
In September 2015, the FASB issued an accounting standards update to simplify the accounting for measurement-period adjustments for an acquirer in a business combination. The update will require an acquirer to recognize any adjustments to provisional amounts of the initial accounting for a business combination with a corresponding adjustment to goodwill in the reporting period in which the adjustments are determined in the measurement period, as opposed to revising prior periods presented in financial statements. Thus, an acquirer shall adjust its financial statements as needed, including recognizing in its current-period earnings the full effect of changes in depreciation, amortization, or other income effects, by line item, if any, as a result of the change to the provisional amounts calculated as if the accounting had been completed at the acquisition date. This update is effective for fiscal years beginning after December 15, 2015, and interim periods within those fiscal years. This update may have a material impact on our consolidated financial statements subsequent to the pending acquisition of Baker Hughes for any measurement-period adjustments after the initial accounting period. See
Note 2
for further information about the pending acquisition.
75
|
HALLIBURTON COMPANY
Selected Financial Data
(Unaudited)
|
|||||||||||||||
|
Year ended December 31
|
|||||||||||||||
|
Millions of dollars except per share
|
2015
|
2014
|
2013
|
2012
|
2011
|
||||||||||
|
Revenue
|
$
|
23,633
|
|
$
|
32,870
|
|
$
|
29,402
|
|
$
|
28,503
|
|
$
|
24,829
|
|
|
Operating income (loss)
|
(165
|
)
|
5,097
|
|
3,138
|
|
4,159
|
|
4,737
|
|
|||||
|
Income (loss) from continuing operations
|
(662
|
)
|
3,437
|
|
2,116
|
|
2,587
|
|
3,010
|
|
|||||
|
Basic income (loss) per share from continuing operations
|
(0.78
|
)
|
4.05
|
|
2.35
|
|
2.78
|
|
3.27
|
|
|||||
|
Diluted income (loss) per share from continuing operations
|
(0.78
|
)
|
4.03
|
|
2.33
|
|
2.78
|
|
3.26
|
|
|||||
|
Cash dividends per share
|
0.72
|
|
0.63
|
|
0.525
|
|
0.36
|
|
0.36
|
|
|||||
|
Net working capital
|
16,250
|
|
8,781
|
|
8,678
|
|
8,334
|
|
7,456
|
|
|||||
|
Total assets
|
36,942
|
|
32,165
|
|
29,223
|
|
27,410
|
|
23,677
|
|
|||||
|
Long-term debt (including current maturities)
|
15,346
|
|
7,779
|
|
7,816
|
|
4,820
|
|
4,820
|
|
|||||
|
Total shareholders’ equity
|
15,495
|
|
16,298
|
|
13,615
|
|
15,790
|
|
13,216
|
|
|||||
|
Capital expenditures
|
2,184
|
|
3,283
|
|
2,934
|
|
3,566
|
|
2,953
|
|
|||||
76
|
HALLIBURTON COMPANY
Quarterly Data and Market Price Information
(Unaudited)
|
|||||||||||||||
|
Quarter
|
|||||||||||||||
|
Millions of dollars except per share data
|
First
|
Second
|
Third
|
Fourth
|
Year
|
||||||||||
|
2015
|
|||||||||||||||
|
Revenue
|
$
|
7,050
|
|
$
|
5,919
|
|
$
|
5,582
|
|
$
|
5,082
|
|
$
|
23,633
|
|
|
Operating income (loss)
|
(548
|
)
|
254
|
|
43
|
|
86
|
|
(165
|
)
|
|||||
|
Net income (loss)
|
(641
|
)
|
53
|
|
(53
|
)
|
(26
|
)
|
(667
|
)
|
|||||
|
Amounts attributable to company shareholders:
|
|||||||||||||||
|
Income (loss) from continuing operations
|
(639
|
)
|
55
|
|
(54
|
)
|
(28
|
)
|
(666
|
)
|
|||||
|
Income (loss) from discontinued operations
|
(4
|
)
|
(1
|
)
|
—
|
|
—
|
|
(5
|
)
|
|||||
|
Net income (loss) attributable to company
|
(643
|
)
|
54
|
|
(54
|
)
|
(28
|
)
|
(671
|
)
|
|||||
|
Basic income per share attributable to company shareholders:
|
|||||||||||||||
|
Income (loss) from continuing operations
|
(0.75
|
)
|
0.06
|
|
(0.06
|
)
|
(0.03
|
)
|
(0.78
|
)
|
|||||
|
Income (loss) from discontinued operations
|
(0.01
|
)
|
—
|
|
—
|
|
—
|
|
(0.01
|
)
|
|||||
|
Net income (loss)
|
(0.76
|
)
|
0.06
|
|
(0.06
|
)
|
(0.03
|
)
|
(0.79
|
)
|
|||||
|
Diluted income per share attributable to company shareholders:
|
|||||||||||||||
|
Income (loss) from continuing operations
|
(0.75
|
)
|
0.06
|
|
(0.06
|
)
|
(0.03
|
)
|
(0.78
|
)
|
|||||
|
Income (loss) from discontinued operations
|
(0.01
|
)
|
—
|
|
—
|
|
—
|
|
(0.01
|
)
|
|||||
|
Net income (loss)
|
(0.76
|
)
|
0.06
|
|
(0.06
|
)
|
(0.03
|
)
|
(0.79
|
)
|
|||||
|
Cash dividends paid per share
|
0.18
|
|
0.18
|
|
0.18
|
|
0.18
|
|
0.72
|
|
|||||
|
Common stock prices
(1)
|
|||||||||||||||
|
High
|
44.92
|
|
50.20
|
|
43.71
|
|
41.28
|
|
50.20
|
|
|||||
|
Low
|
37.27
|
|
42.46
|
|
30.93
|
|
32.13
|
|
30.93
|
|
|||||
|
2014
|
|||||||||||||||
|
Revenue
|
$
|
7,348
|
|
$
|
8,051
|
|
$
|
8,701
|
|
$
|
8,770
|
|
$
|
32,870
|
|
|
Operating income
|
970
|
|
1,194
|
|
1,634
|
|
1,299
|
|
5,097
|
|
|||||
|
Net income
|
616
|
|
775
|
|
1,205
|
|
905
|
|
3,501
|
|
|||||
|
Amounts attributable to company shareholders:
|
|||||||||||||||
|
Income from continuing operations
|
623
|
|
776
|
|
1,137
|
|
900
|
|
3,436
|
|
|||||
|
Income (loss) from discontinued operations
|
(1
|
)
|
(2
|
)
|
66
|
|
1
|
|
64
|
|
|||||
|
Net income attributable to company
|
622
|
|
774
|
|
1,203
|
|
901
|
|
3,500
|
|
|||||
|
Basic income per share attributable to company shareholders:
|
|||||||||||||||
|
Income from continuing operations
|
0.73
|
|
0.92
|
|
1.34
|
|
1.06
|
|
4.05
|
|
|||||
|
Income from discontinued operations
|
—
|
|
—
|
|
0.08
|
|
—
|
|
0.08
|
|
|||||
|
Net income
|
0.73
|
|
0.92
|
|
1.42
|
|
1.06
|
|
4.13
|
|
|||||
|
Diluted income per share attributable to company shareholders:
|
|||||||||||||||
|
Income from continuing operations
|
0.73
|
|
0.91
|
|
1.33
|
|
1.06
|
|
4.03
|
|
|||||
|
Income from discontinued operations
|
—
|
|
—
|
|
0.08
|
|
—
|
|
0.08
|
|
|||||
|
Net income
|
0.73
|
|
0.91
|
|
1.41
|
|
1.06
|
|
4.11
|
|
|||||
|
Cash dividends paid per share
|
0.15
|
|
0.15
|
|
0.15
|
|
0.18
|
|
0.63
|
|
|||||
|
Common stock prices
(1)
|
|||||||||||||||
|
High
|
59.99
|
|
71.26
|
|
74.33
|
|
64.88
|
|
74.33
|
|
|||||
|
Low
|
47.60
|
|
57.13
|
|
63.06
|
|
37.21
|
|
37.21
|
|
|||||
|
Note:
Results include an aggregate of $2.2 billion in impairments and other charges during 2015. See Note 3 for further information.
|
|||||||||||||||
|
(1) New York Stock Exchange – composite transactions high and low intraday price.
|
|||||||||||||||
77
Item 10.
Directors, Executive Officers, and Corporate Governance
.
The information required for the directors of the Registrant is incorporated by reference to the Halliburton Company Proxy Statement for our
2016
Annual Meeting of Stockholders (File No. 001-03492) under the captions “Election of Directors” and “Involvement in Certain Legal Proceedings.” The information required for the executive officers of the Registrant is included under Part I on pages 4 through 5 of this annual report. The information required for a delinquent form required under Section 16(a) of the Securities Exchange Act of 1934 is incorporated by reference to the Halliburton Company Proxy Statement for our
2016
Annual Meeting of Stockholders (File No. 001-03492) under the caption “Section 16(a) Beneficial Ownership Reporting Compliance,” to the extent any disclosure is required. The information for our code of ethics is incorporated by reference to the Halliburton Company Proxy Statement for our
2016
Annual Meeting of Stockholders (File No. 001-03492) under the caption “Corporate Governance.” The information regarding our Audit Committee and the independence of its members, along with information about the audit committee financial expert(s) serving on the Audit Committee, is incorporated by reference to the Halliburton Company Proxy Statement for our
2016
Annual Meeting of Stockholders (File No. 001-03492) under the caption “The Board of Directors and Standing Committees of Directors.”
Item 11.
Executive Compensation
.
This information is incorporated by reference to the Halliburton Company Proxy Statement for our
2016
Annual Meeting of Stockholders (File No. 001-03492) under the captions “Compensation Discussion and Analysis,” “Compensation Committee Report,” “Summary Compensation Table,” “Grants of Plan-Based Awards in Fiscal
2015
,” “Outstanding Equity Awards at Fiscal Year End
2015
,” “
2015
Option Exercises and Stock Vested,” “
2015
Nonqualified Deferred Compensation,” “Employment Contracts and Change-in-Control Arrangements,” “Post-Termination or Change-in-Control Payments,” “Equity Compensation Plan Information,” and “Directors’ Compensation.”
This information is incorporated by reference to the Halliburton Company Proxy Statement for our
2016
Annual Meeting of Stockholders (File No. 001-03492) under the caption “Stock Ownership of Certain Beneficial Owners and Management.”
This information is incorporated by reference to the Halliburton Company Proxy Statement for our
2016
Annual Meeting of Stockholders (File No. 001-03492) under the caption “Stock Ownership of Certain Beneficial Owners and Management.”
Not applicable.
This information is incorporated by reference to the Halliburton Company Proxy Statement for our
2016
Annual Meeting of Stockholders (File No. 001-03492) under the caption “Equity Compensation Plan Information.”
Item 13.
Certain Relationships and Related Transactions, and Director Independence
.
This information is incorporated by reference to the Halliburton Company Proxy Statement for our
2016
Annual Meeting of Stockholders (File No. 001-03492) under the caption “Corporate Governance” to the extent any disclosure is required and under the caption “The Board of Directors and Standing Committees of Directors.”
Item 14.
Principal Accounting Fees and Services
.
This information is incorporated by reference to the Halliburton Company Proxy Statement for our
2016
Annual Meeting of Stockholders (File No. 001-03492) under the caption “Fees Paid to KPMG LLP.”
78
Item 15.
Exhibits
.
|
1.
|
Financial Statements:
|
|
|
The reports of the Independent Registered Public Accounting Firm and the financial statements of Halliburton Company as required by Part II, Item 8, are included on pages 43 and 44 and pages 45 through 75 of this annual report. See index on page (i).
|
||
|
2.
|
Financial Statement Schedules:
|
|
|
The schedules listed in Rule 5-04 of Regulation S-X (17 CFR 210.5-04) have been omitted because they are not applicable or the required information is shown in the consolidated financial statements or notes thereto.
|
||
|
3.
|
Exhibits:
|
|
|
Exhibit
|
||
|
Number
|
Exhibits
|
|
|
2.1
|
Agreement and Plan of Merger, dated as of November 16, 2014, among Halliburton Company, Red Tiger LLC and Baker Hughes Incorporated (incorporated by reference to Exhibit 2.1 to Halliburton’s Form 8-K filed November 18, 2014, File No. 001-03492).
|
|
|
3.1
|
Restated Certificate of Incorporation of Halliburton Company filed with the Secretary of State of Delaware on May 30, 2006 (incorporated by reference to Exhibit 3.1 to Halliburton’s Form 8-K filed June 5, 2006, File No. 001-03492).
|
|
|
3.2
|
By-laws of Halliburton Company revised effective February 12, 2014 (incorporated by reference to Exhibit 3.1 to Halliburton’s Form 8-K filed February 18, 2014, File No. 001-03492).
|
|
|
4.1
|
Form of debt security of 8.75% Debentures due February 12, 2021 (incorporated by reference to Exhibit 4(a) to the Form 8-K of Halliburton Company, now known as Halliburton Energy Services, Inc. (the Predecessor), dated as of February 20, 1991, File No. 001-03492).
|
|
|
4.2
|
Senior Indenture dated as of January 2, 1991 between the Predecessor and The Bank of New York Trust Company, N.A. (as successor to Texas Commerce Bank National Association), as Trustee (incorporated by reference to Exhibit 4(b) to the Predecessor’s Registration Statement on Form S-3 (Registration No. 33-38394) originally filed with the Securities and Exchange Commission on December 21, 1990), as supplemented and amended by the First Supplemental Indenture dated as of December 12, 1996 among the Predecessor, Halliburton and the Trustee (incorporated by reference to Exhibit 4.1 of Halliburton’s Registration Statement on Form 8-B dated December 12, 1996, File No. 001-03492).
|
|
|
4.3
|
Resolutions of the Predecessor’s Board of Directors adopted at a meeting held on February 11, 1991 and of the special pricing committee of the Board of Directors of the Predecessor adopted at a meeting held on February 11, 1991 and the special pricing committee’s consent in lieu of meeting dated February 12, 1991 (incorporated by reference to Exhibit 4(c) to the Predecessor’s Form 8-K dated as of February 20, 1991, File No. 001-03492).
|
|
|
4.4
|
Second Senior Indenture dated as of December 1, 1996 between the Predecessor and The Bank of New York Trust Company, N.A. (as successor to Texas Commerce Bank National Association), as Trustee, as supplemented and amended by the First Supplemental Indenture dated as of December 5, 1996 between the Predecessor and the Trustee and the Second Supplemental Indenture dated as of December 12, 1996 among the Predecessor, Halliburton and the Trustee (incorporated by reference to Exhibit 4.2 of Halliburton’s Registration Statement on Form 8-B dated December 12, 1996, File No. 001-03492).
|
|
79
|
4.5
|
Third Supplemental Indenture dated as of August 1, 1997 between Halliburton and The Bank of New York Trust Company, N.A. (as successor to Texas Commerce Bank National Association), as Trustee, to the Second Senior Indenture dated as of December 1, 1996 (incorporated by reference to Exhibit 4.7 to Halliburton’s Form 10-K for the year ended December 31, 1998, File No. 001-03492).
|
|
|
4.6
|
Fourth Supplemental Indenture dated as of September 29, 1998 between Halliburton and The Bank of New York Trust Company, N.A. (as successor to Texas Commerce Bank National Association), as Trustee, to the Second Senior Indenture dated as of December 1, 1996 (incorporated by reference to Exhibit 4.8 to Halliburton’s Form 10-K for the year ended December 31, 1998, File No. 001-03492).
|
|
|
4.7
|
Resolutions of Halliburton’s Board of Directors adopted by unanimous consent dated December 5, 1996 (incorporated by reference to Exhibit 4(g) of Halliburton’s Form 10-K for the year ended December 31, 1996, File No. 001-03492).
|
|
|
4.8
|
Form of debt security of 6.75% Notes due February 1, 2027 (incorporated by reference to Exhibit 4.1 to Halliburton’s Form 8-K dated as of February 11, 1997, File No. 001-03492).
|
|
|
4.9
|
Copies of instruments that define the rights of holders of miscellaneous long-term notes of Halliburton Company and its subsidiaries have not been filed with the Commission. Halliburton Company agrees to furnish copies of these instruments upon request.
|
|
|
4.10
|
Form of debt security of 7.53% Notes due May 12, 2017 (incorporated by reference to Exhibit 4.4 to Halliburton’s Form 10-Q for the quarter ended March 31, 1997, File No. 001-03492).
|
|
|
4.11
|
Form of Indenture dated as of April 18, 1996 between Dresser and The Bank of New York Trust Company, N.A. (as successor to Texas Commerce Bank National Association), as Trustee (incorporated by reference to Exhibit 4 to Dresser’s Registration Statement on Form S-3/A filed on April 19, 1996, Registration No. 333-01303), as supplemented and amended by Form of First Supplemental Indenture dated as of August 6, 1996 between Dresser and The Bank of New York Trust Company, N.A. (as successor to Texas Commerce Bank National Association), Trustee, for 7.60% Debentures due 2096 (incorporated by reference to Exhibit 4.1 to Dresser’s Form 8-K filed on August 9, 1996, File No. 1-4003).
|
|
|
4.12
|
Second Supplemental Indenture dated as of October 27, 2003 between DII Industries, LLC and The Bank of New York Trust Company, N.A. (as successor to JPMorgan Chase Bank), as Trustee, to the Indenture dated as of April 18, 1996 (incorporated by reference to Exhibit 4.15 to Halliburton’s Form 10-K for the year ended December 31, 2003, File No. 001-03492).
|
|
|
4.13
|
Third Supplemental Indenture dated as of December 12, 2003 among DII Industries, LLC, Halliburton Company and The Bank of New York Trust Company, N.A. (as successor to JPMorgan Chase Bank), as Trustee, to the Indenture dated as of April 18, 1996, (incorporated by reference to Exhibit 4.16 to Halliburton’s Form 10-K for the year ended December 31, 2003, File No. 001-03492).
|
|
|
4.14
|
Indenture dated as of October 17, 2003 between Halliburton Company and The Bank of New York Trust Company, N.A. (as successor to JPMorgan Chase Bank), as Trustee (incorporated by reference to Exhibit 4.1 to Halliburton’s Form 10-Q for the quarter ended September 30, 2003, File No. 001-03492).
|
|
|
4.15
|
Second Supplemental Indenture dated as of December 15, 2003 between Halliburton Company and The Bank of New York Trust Company, N.A. (as successor to JPMorgan Chase Bank), as Trustee, to the Senior Indenture dated as of October 17, 2003 (incorporated by reference to Exhibit 4.27 to Halliburton’s Form 10-K for the year ended December 31, 2003, File No. 001-03492).
|
|
|
4.16
|
Form of note of 7.6% debentures due 2096 (included as Exhibit A to Exhibit 4.15 above).
|
|
80
|
4.17
|
Fourth Supplemental Indenture, dated as of September 12, 2008, between Halliburton Company and The Bank of New York Mellon Trust Company, N.A., as successor trustee to JPMorgan Chase Bank, to the Senior Indenture dated as of October 17, 2003 (incorporated by reference to Exhibit 4.2 to Halliburton’s Form 8-K filed September 12, 2008, File No. 001-03492).
|
|
|
4.18
|
Form of Global Note for Halliburton’s 5.90% Senior Notes due 2018 (included as part of Exhibit 4.17).
|
|
|
4.19
|
Form of Global Note for Halliburton’s 6.70% Senior Notes due 2038 (included as part of Exhibit 4.17).
|
|
|
4.20
|
Fifth Supplemental Indenture, dated as of March 13, 2009, between Halliburton Company and The Bank of New York Mellon Trust Company, N.A., as successor trustee to JPMorgan Chase Bank, to the Senior Indenture dated as of October 17, 2003 (incorporated by reference to Exhibit 4.2 to Halliburton’s Form 8-K filed March 13, 2009, File No. 001-03492).
|
|
|
4.21
|
Form of Global Note for Halliburton’s 6.15% Senior Notes due 2019 (included as part of Exhibit 4.20).
|
|
|
4.22
|
Form of Global Note for Halliburton’s 7.45% Senior Notes due 2039 (included as part of Exhibit 4.20).
|
|
|
4.23
|
Sixth Supplemental Indenture, dated as of November 14, 2011, between Halliburton Company and The Bank of New York Mellon Trust Company, N.A., as successor trustee to JPMorgan Chase Bank, to the Senior Indenture dated as of October 17, 2003 (incorporated by reference to Exhibit 4.2 to Halliburton’s Form 8-K filed November 14, 2011, File No. 001-03492).
|
|
|
4.24
|
Form of Global Note for Halliburton’s 3.25% Senior Notes due 2021 (included as part of Exhibit 4.23).
|
|
|
4.25
|
Form of Global Note for Halliburton’s 4.50% Senior Notes due 2041 (included as part of Exhibit 4.23).
|
|
|
4.26
|
Seventh Supplemental Indenture, dated as of August 5, 2013, between Halliburton Company and The Bank of New York Mellon Trust Company, N.A., as successor trustee to JPMorgan Chase Bank (incorporated by reference to Exhibit 4.2 of Halliburton’s Form 8-K filed August 5, 2013, File No. 001-03492).
|
|
|
4.27
|
Form of Global Note for Halliburton’s 1.00% Senior Notes due 2016 (included as part of Exhibit 4.26).
|
|
|
4.28
|
Form of Global Note for Halliburton’s 2.00% Senior Notes due 2018 (included as part of Exhibit 4.26).
|
|
|
4.29
|
Form of Global Note for Halliburton’s 3.50% Senior Notes due 2023 (included as part of Exhibit 4.26).
|
|
|
4.30
|
Form of Global Note for Halliburton’s 4.75% Senior Notes due 2043 (included as part of Exhibit 4.26).
|
|
|
4.31
|
Eighth Supplemental Indenture, dated as of November 13, 2015, between Halliburton Company and The Bank of New York Mellon Trust Company, N.A., as successor trustee to JPMorgan Chase Bank (incorporated by reference to Exhibit 4.2 to Halliburton’s Form 8-K filed November 13, 2015, File No. 001-03492).
|
|
|
4.32
|
Form of Global Note for Halliburton’s 2.700% Senior Notes due 2020 (included as part of Exhibit 4.31).
|
|
|
4.33
|
Form of Global Note for Halliburton’s 3.375% Senior Notes due 2022 (included as part of Exhibit 4.31).
|
|
|
4.34
|
Form of Global Note for Halliburton’s 3.800% Senior Notes due 2025 (included as part of Exhibit 4.31).
|
|
81
|
4.35
|
Form of Global Note for Halliburton’s 4.850% Senior Notes due 2035 (included as part of Exhibit 4.31).
|
|
|
4.36
|
Form of Global Note for Halliburton’s 5.000% Senior Notes due 2045 (included as part of Exhibit 4.31).
|
|
|
†
|
10.1
|
Halliburton Company Restricted Stock Plan for Non-Employee Directors (incorporated by reference to Appendix B of the Predecessor’s proxy statement dated March 23, 1993, File No. 001-03492).
|
|
†
|
10.2
|
Dresser Industries, Inc. Deferred Compensation Plan, as amended and restated effective January 1, 2000 (incorporated by reference to Exhibit 10.16 to Halliburton’s Form 10-K for the year ended December 31, 2000, File No. 001-03492).
|
|
†
|
10.3
|
ERISA Excess Benefit Plan for Dresser Industries, Inc., as amended and restated effective June 1, 1995 (incorporated by reference to Exhibit 10.7 to Dresser’s Form 10-K for the year ended October 31, 1995, File No. 1-4003).
|
|
†
|
10.4
|
Employment Agreement (David J. Lesar) (incorporated by reference to Exhibit 10(n) to the Predecessor’s Form 10-K for the year ended December 31, 1995, File No. 001-03492).
|
|
†
|
10.5
|
Employment Agreement (Mark A. McCollum) (incorporated by reference to Exhibit 10.1 to Halliburton’s Form 10-Q for the quarter ended September 30, 2003, File No. 001-03492).
|
|
†
|
10.6
|
Halliburton Company Performance Unit Program (incorporated by reference to Exhibit 10.2 to Halliburton’s Form 10-Q for the quarter ended September 30, 2001, File No. 001-03492).
|
|
10.7
|
Form of Indemnification Agreement for Officers (incorporated by reference to Exhibit 10.1 to Halliburton’s Form 8-K filed August 3, 2007, File No. 001-03492).
|
|
|
10.8
|
Form of Indemnification Agreement for Directors (incorporated by reference to Exhibit 10.2 to Halliburton’s Form 8-K filed August 3, 2007, File No. 001-03492).
|
|
|
10.9
|
Form of Indemnification Agreement for Officers (first elected after January 1, 2013) (incorporated by reference to Exhibit 10.2 to Halliburton's Form 10-Q for the quarter ended March 31, 2013, File No. 001-03492).
|
|
|
10.10
|
Form of Indemnification Agreement for Directors (first elected after January 1, 2013) (incorporated by reference to Exhibit 10.1 of Halliburton’s Form 8-K filed March 22, 2013, File No. 001-03492).
|
|
|
†
|
10.11
|
2008 Halliburton Elective Deferral Plan, as amended and restated effective January 1, 2008 (incorporated by reference to Exhibit 10.3 to Halliburton’s Form 10-Q for the quarter ended September 30, 2007, File No. 001-03492).
|
|
†
|
10.12
|
Halliburton Company Supplemental Executive Retirement Plan, as amended and restated effective January 1, 2008 (incorporated by reference to Exhibit 10.4 to Halliburton’s Form 10-Q for the quarter ended September 30, 2007, File No. 001-03492).
|
|
†
|
10.13
|
Halliburton Company Benefit Restoration Plan, as amended and restated effective January 1, 2008 (incorporated by reference to Exhibit 10.5 to Halliburton’s Form 10-Q for the quarter ended September 30, 2007, File No. 001-03492).
|
|
†
|
10.14
|
Halliburton Company Pension Equalizer Plan, as amended and restated effective March 1, 2007 (incorporated by reference to Exhibit 10.8 to Halliburton’s Form 10-Q for the quarter ended September 30, 2007, File No. 001-03492).
|
82
|
†
|
10.15
|
Halliburton Company Directors' Deferred Compensation Plan, as amended and restated effective as of May 16, 2012 (incorporated by reference to Exhibit 10.5 to Halliburton's Form 10-Q for the quarter ended June 30, 2012, File No. 001-03492).
|
|
†
|
10.16
|
Retirement Plan for the Directors of Halliburton Company, as amended and restated effective July 1, 2007 (incorporated by reference to Exhibit 10.10 to Halliburton’s Form 10-Q for the quarter ended September 30, 2007, File No. 001-03492).
|
|
†
|
10.17
|
Employment Agreement (James S. Brown) (incorporated by reference to Exhibit 10.36 to Halliburton’s Form 10-K for the year ended December 31, 2007, File No. 001-03492).
|
|
†
|
10.18
|
Executive Agreement (Lawrence J. Pope) (incorporated by reference to Exhibit 10.1 to Halliburton’s Form 8-K filed December 12, 2008, File No. 001-03492).
|
|
†
|
10.19
|
Halliburton Company Stock and Incentive Plan, as amended and restated effective February 24, 2015 (incorporated by reference to Appendix B of Halliburton's proxy statement filed April 7, 2015, File No. 001-03492).
|
|
†
|
10.20
|
Halliburton Company Employee Stock Purchase Plan, as amended and restated effective February 24, 2015 (incorporated by reference to Appendix C of Halliburton’s proxy statement filed April 7, 2015, File No. 001-03492).
|
|
†
|
10.21
|
Form of Nonstatutory Stock Option Agreement (incorporated by reference as Exhibit 99.2 of Halliburton’s Form S-8 filed July 24, 2015, Registration No. 333-205842).
|
|
†
|
10.22
|
Form of Restricted Stock Agreement (incorporated by reference as Exhibit 99.3 of Halliburton’s Form S-8 filed July 24, 2015, Registration No. 333-205842).
|
|
†
|
10.23
|
Form of Restricted Stock Unit Agreement (incorporated by reference as Exhibit 99.4 of Halliburton’s Form S-8 filed July 24, 2015, Registration No. 333-205842).
|
|
†
|
10.24
|
Form of Non-Employee Director Restricted Stock Unit Agreement (Director Plan) (incorporated by reference as Exhibit 99.8 of Halliburton’s Form S-8 filed July 24, 2015, Registration No. 333-205842).
|
|
†
|
10.25
|
First Amendment to Halliburton Company Supplemental Executive Retirement Plan, as amended and restated effective January 1, 2008 (incorporated by reference to Exhibit 10.1 to Halliburton’s Form 8-K filed September 21, 2009, File No. 001-03492).
|
|
†
|
10.26
|
Amendment No. 1 to Halliburton Company Benefit Restoration Plan, as amended and restated effective January 1, 2008 (incorporated by reference to Exhibit 10.2 to Halliburton’s Form 8-K filed September 21, 2009, File No. 001-03492).
|
|
†
|
10.27
|
Halliburton Annual Performance Pay Plan, as amended and restated effective January 1, 2010 (incorporated by reference to Exhibit 10.3 to Halliburton’s Form 8-K filed September 21, 2009, File No. 001-03492).
|
|
†
|
10.28
|
Amendment to Executive Employment Agreement (James S. Brown) (incorporated by reference to Exhibit 10.39 to Halliburton’s Form 10-K for the year ended December 31, 2008, File No. 001-03492).
|
|
†
|
10.29
|
Amendment to Executive Employment Agreement (Mark A. McCollum) (incorporated by reference to Exhibit 10.43 to Halliburton’s Form 10-K for the year ended December 31, 2008, File No. 001-03492).
|
83
|
†
|
10.30
|
Amendment No. 1 to 2008 Halliburton Elective Deferral Plan, as amended and restated effective January 1, 2008 (incorporated by reference to Exhibit 10.41 to Halliburton’s Form 10-K for the year ended December 31, 2010, File No. 001-03492).
|
|
†
|
10.31
|
Executive Agreement (Joe D. Rainey) (incorporated by reference to Exhibit 10.43 to Halliburton’s Form 10-K for the year ended December 31, 2010, File No. 001-03492).
|
|
10.32
|
U.S. $4,500,000,000 Five Year Revolving Credit Agreement among Halliburton Company, as Borrower, the Banks party thereto, and Citibank, N.A., as Agent, effective July 21, 2015 (incorporated by reference to Exhibit 10.1 to Halliburton's Form 10-Q for the quarter ended June 30, 2015, File No. 001-03492).
|
|
|
†
|
10.33
|
First Amendment to the Retirement Plan for the Directors of Halliburton Company, effective September 1, 2007 (incorporated by reference to Exhibit 10.3 to Halliburton’s Form 10-Q for the quarter ended March 31, 2011, File No. 001-03492).
|
|
†
|
10.34
|
Executive Agreement (Christian A. Garcia) (incorporated by reference to Exhibit 10.40 to Halliburton’s Form 10-K for the year ended December 31, 2011, File No. 001-03492).
|
|
†
|
10.35
|
First Amendment to Halliburton Company Restricted Stock Plan for Non-Employee Directors (incorporated by reference to Exhibit 10.41 to Halliburton’s Form 10-K for the year ended December 31, 2011, File No. 001-03492).
|
|
†
|
10.36
|
Form of Restricted Stock Agreement (Section 16 officers) (incorporated by reference to Exhibit 10.42 to Halliburton’s Form 10-K for the year ended December 31, 2011, File No. 001-03492).
|
|
†
|
10.37
|
Form of Non-Employee Director Restricted Stock Unit Agreement (Stock and Incentive Plan) (incorporated by reference as Exhibit 99.9 of Halliburton's Form S-8 filed July 24, 2015, Registration No. 333-205842).
|
|
†
|
10.38
|
Second Amendment to Restricted Stock Plan for Non-Employee Directors of Halliburton Company (incorporated by reference to Exhibit 10.4 to Halliburton's Form 10-Q for the quarter ended June 30, 2012, File No. 001-03492).
|
|
†
|
10.39
|
Third Amendment to Restricted Stock Plan for Non-Employee Directors of Halliburton Company effective December 1, 2012 (incorporated by reference to Exhibit 10.44 to Halliburton’s Form 10-K for the year ended December 31, 2012, File No. 001-03492).
|
|
†
|
10.40
|
First Amendment dated December 1, 2012 to Halliburton Company Directors' Deferred Compensation Plan, as amended and restated effective May 16, 2012 (incorporated by reference to Exhibit 10.45 to Halliburton’s Form 10-K for the year ended December 31, 2012, File No. 001-03492).
|
|
†
|
10.41
|
Executive Agreement (Jeffrey A. Miller) (incorporated by reference to Exhibit 10.1 to Halliburton's Form 8-K filed September 21, 2012, File No. 001-03492).
|
|
†
|
10.42
|
Executive Agreement (Myrtle L. Jones) (incorporated by reference to Exhibit 10.1 to Halliburton's Form 10-Q for the quarter ended March 31, 2013, File No. 001-03492).
|
|
†
|
10.43
|
Executive Agreement (Robb L. Voyles) (incorporated by reference to Exhibit 10.48 to Halliburton’s Form 10-K filed February 7, 2014, File No. 001-03492).
|
|
†
|
10.44
|
Executive Agreement (Timothy McKeon) (incorporated by reference to Exhibit 10.49 to Halliburton’s Form 10-K filed February 7, 2014, File No. 001-03492).
|
|
†
|
10.45
|
Executive Agreement (Charles E. Geer, Jr.) (incorporated by reference to Exhibit 10.2 to Halliburton’s Form 8-K filed December 9, 2014, File No. 001-03492).
|
84
|
10.46
|
HESI Punitive Damages and Assigned Claims Settlement Agreement dated September 2, 2014, entered into between Halliburton Company and Halliburton Energy Services, Inc. and counsel for The Plaintiffs Steering Committee in MDL 2179 and the Deepwater Horizon Economic and Property Damages Settlement Class (incorporated by reference to Exhibit 10.1 to Halliburton's Form 10-Q for the quarter ended September 30, 2014, File No. 001-03492).
|
|
|
†
|
10.47
|
Form of Non-Employee Director Restricted Stock Agreement (Directors Plan) (incorporated by reference as Exhibit 99.5 of Halliburton's Form S-8 filed May 21, 2009, Registration No. 333-159394).
|
|
†
|
10.48
|
Form of Non-Employee Director Restricted Stock Agreement (Stock and Incentive Plan) (incorporated by reference to Exhibit 10.43 to Halliburton's Form 10-K for the year ended December 31, 2011, Registration No. 001-03492).
|
|
*
|
12.1
|
Statement of Computation of Ratio of Earnings to Fixed Charges.
|
|
*
|
21.1
|
Subsidiaries of the Registrant.
|
|
*
|
23.1
|
Consent of KPMG LLP.
|
|
*
|
24.1
|
Powers of attorney for the following directors signed in January 2016:
|
|
Abdulaziz F. Al Khayyal
|
||
|
Alan M. Bennett
|
||
|
James R. Boyd
|
||
|
Milton Carroll
|
||
|
Nance K. Dicciani
|
||
|
Murry S. Gerber
|
||
|
José C. Grubisich
|
||
|
Robert A. Malone
|
||
|
J. Landis Martin
|
||
|
Jeffrey A. Miller
|
||
|
Debra L. Reed
|
||
|
*
|
31.1
|
Certification of Chief Executive Officer pursuant to Section 302 of the Sarbanes-Oxley Act of 2002.
|
|
*
|
31.2
|
Certification of Chief Financial Officer pursuant to Section 302 of the Sarbanes-Oxley Act of 2002.
|
|
**
|
32.1
|
Certification of Chief Executive Officer pursuant to Section 906 of the Sarbanes-Oxley Act of 2002.
|
|
**
|
32.2
|
Certification of Chief Financial Officer pursuant to Section 906 of the Sarbanes-Oxley Act of 2002.
|
|
*
|
95
|
Mine Safety Disclosures.
|
|
99.1
|
Notice of Extension dated July 10, 2015 of the Agreement and Plan of Merger among Halliburton Company, Red Tiger LLC and Baker Hughes Incorporated dated November 16, 2014, extending termination date to December 1, 2015 (incorporated by reference to Exhibit 99.1 to Halliburton's Form 10-Q for the quarter ended September 30, 2015, File No. 001-03492).
|
|
85
|
99.2
|
Notice of Extension dated September 25, 2015 of the Agreement and Plan of Merger among Halliburton Company, Red Tiger LLC and Baker Hughes Incorporated dated November 16, 2014, extending termination date to December 16, 2015 (incorporated by reference to Exhibit 99.2 to Halliburton's Form 10-Q for the quarter ended September 30, 2015, File No. 001-03492).
|
|
|
*
|
99.3
|
Notice of Extension dated December 15, 2015 of the Agreement and Plan of Merger among Halliburton Company, Red Tiger LLC and Baker Hughes Incorporated dated November 16, 2014, extending termination date to April 30, 2016.
|
|
*
|
101.INS
|
XBRL Instance Document
|
|
*
|
101.SCH
|
XBRL Taxonomy Extension Schema Document
|
|
*
|
101.CAL
|
XBRL Taxonomy Extension Calculation Linkbase Document
|
|
*
|
101.LAB
|
XBRL Taxonomy Extension Label Linkbase Document
|
|
*
|
101.PRE
|
XBRL Taxonomy Extension Presentation Linkbase Document
|
|
*
|
101.DEF
|
XBRL Taxonomy Extension Definition Linkbase Document
|
|
* Filed with this Form 10-K.
|
||
|
** Furnished with this Form 10-K.
|
||
|
† Management contracts or compensatory plans or arrangements.
|
||
86
SIGNATURES
As required by Section 13 or 15(d) of the Securities Exchange Act of 1934, the registrant has authorized this report to be signed on its behalf by the undersigned authorized individuals on this
5th day
of
February, 2016
.
|
HALLIBURTON COMPANY
|
|
|
By
|
/s/ David J. Lesar
|
|
David J. Lesar
|
|
|
Chairman of the Board and Chief Executive Officer
|
|
As required by the Securities Exchange Act of 1934, this report has been signed below by the following persons in the capacities indicated on this
5th day
of
February, 2016
.
|
Signature
|
Title
|
|
/s/ David J. Lesar
|
Chairman of the Board, Director, and
|
|
David J. Lesar
|
Chief Executive Officer
|
|
/s/ Christian A. Garcia
|
Senior Vice President, Finance and
|
|
Christian A. Garcia
|
Acting Chief Financial Officer
|
|
/s/ Charles E. Geer, Jr.
|
Vice President and
|
|
Charles E. Geer, Jr.
|
Corporate Controller
|
87
|
Signature
|
Title
|
|
* Abdulaziz F. Al Khayyal
|
Director
|
|
Abdulaziz F. Al Khayyal
|
|
|
* Alan M. Bennett
|
Director
|
|
Alan M. Bennett
|
|
|
* James R. Boyd
|
Director
|
|
James R. Boyd
|
|
|
* Milton Carroll
|
Director
|
|
Milton Carroll
|
|
|
* Nance K. Dicciani
|
Director
|
|
Nance K. Dicciani
|
|
|
* Murry S. Gerber
|
Director
|
|
Murry S. Gerber
|
|
|
* José C. Grubisich
|
Director
|
|
José C. Grubisich
|
|
|
* Robert A. Malone
|
Director
|
|
Robert A. Malone
|
|
|
* J. Landis Martin
|
Director
|
|
J. Landis Martin
|
|
|
* Jeffrey A. Miller
|
President and Director
|
|
Jeffrey A. Miller
|
|
|
* Debra L. Reed
|
Director
|
|
Debra L. Reed
|
|
|
/s/ Robb L. Voyles
|
|
|
*By Robb L. Voyles, Attorney-in-fact
|
|
88
TABLE OF CONTENTS
Part IItem 1. BusinessItem 1(a). Risk FactorsItem 1(a)Item 1(b). Unresolved Staff CommentsItem 1(b)Item 2. PropertiesItem 3. Legal ProceedingsItem 4. Mine Safety DisclosuresPart IIItem 5. Market For Registrant S Common Equity, Related Stockholder Matters, and Issuer Purchases Of Equity SecuritiesItem 6. Selected Financial DataItem 7. Management S Discussion and Analysis Of Financial Condition and Results Of OperationsItem 7(a). Quantitative and Qualitative Disclosures About Market RiskItem 7(a)Item 8. Financial Statements and Supplementary DataItem 9. Changes in and Disagreements with Accountants on Accounting and Financial DisclosureItem 9(a). Controls and ProceduresItem 9(a)Item 9(b). Other InformationItem 9(b)Note 1 . Description Of Company and Significant Accounting PoliciesNote 2 . Acquisitions and DispositionsNote 3 . Impairments and Other ChargesNote 4 . Business Segment and Geographic InformationNote 5 . ReceivablesNote 6. InventoriesNote 7. Property, Plant, and EquipmentNote 8 . DebtNote 9 . Commitments and ContingenciesNote 10 . Income TaxesNote 11 . Shareholders EquityNote 12 . Stock-based CompensationNote 13. Income Per ShareNote 14 . Financial Instruments and Risk ManagementNote 15 . Retirement PlansNote 16 . New Accounting PronouncementsPart IIIItem 10. Directors, Executive Officers, and Corporate GovernanceItem 11. Executive CompensationItem 12(a). Security Ownership Of Certain Beneficial OwnersItem 12(a)Item 12(b). Security Ownership Of ManagementItem 12(b)Item 12(c). Changes in ControlItem 12(c)Item 12(d). Securities Authorized For Issuance Under Equity Compensation PlansItem 12(d)Item 13. Certain Relationships and Related Transactions, and Director IndependenceItem 14. Principal Accounting Fees and ServicesPart IVItem 15. Exhibits