HALLIBURTON CO
10-Ks and 10-Qs
|
|
|
|
|
|
|
|
|
|
|
|
|
|
|
|
|
|
|
|
|
|
|
|
|
|
|
|
|
|
|
|
|
|
|
|
|
|
|
|
|
|
|
|
|
|
|
|
|
|
|
|
|
|
|
|
UNITED STATES
SECURITIES AND EXCHANGE COMMISSION
Washington, D.C. 20549
FORM
10-Q
|
|
QUARTERLY REPORT PURSUANT TO SECTION 13 OR 15(d) OF THE SECURITIES EXCHANGE ACT OF 1934 | ||||
For the quarterly period ended
September 30, 2022
or
|
|
TRANSITION REPORT PURSUANT TO SECTION 13 OR 15(d) OF THE SECURITIES EXCHANGE ACT OF 1934 | ||||
For the transition period from _______to_______
Commission File Number
001-03492
(Exact name of registrant as specified in its charter)
|
|
|
||||
| (State or other jurisdiction of incorporation or organization) | (I.R.S. Employer Identification No.) | ||||
|
|
|
|
|
||||||||
| (Address of principal executive offices) | (Zip Code) | ||||||||||
(
281
)
871-2699
(Registrant's telephone number, including area code)
Securities registered pursuant to Section 12(b) of the Act:
| Title of each class | Trading Symbol | Name of each exchange on which registered | ||||||
|
|
|
|
||||||
Indicate by check mark whether the registrant (1) has filed all reports required to be filed by Section 13 or 15(d) of the Securities Exchange Act of 1934 during the preceding 12 months (or for such shorter period that the registrant was required to file such reports), and (2) has been subject to such filing requirements for the past 90 days.
☒
Yes
☐
No
Indicate by check mark whether the registrant has submitted electronically every Interactive Data File required to be submitted pursuant to Rule 405 of Regulation S-T (§232.405 of this chapter) during the preceding 12 months (or for such shorter period that the registrant was required to submit such files).
☒
Yes
☐
No
Indicate by check mark whether the registrant is a large accelerated filer, an accelerated filer, a non-accelerated filer, a smaller reporting company, or an emerging growth company. See the definitions of “large accelerated filer,” “accelerated filer,” “smaller reporting company,” and "emerging growth company" in Rule 12b-2 of the Exchange Act.
|
|
☒ | Accelerated Filer | ☐ | |||||||||||
| Non-accelerated Filer | ☐ | Smaller Reporting Company |
|
|||||||||||
| Emerging Growth Company |
|
|||||||||||||
If an emerging growth company, indicate by check mark if the registrant has elected not to use the extended transition period for complying with any new or revised financial accounting standards provided pursuant to Section 13(a) of the Exchange Act.
☐
Indicate by check mark whether the registrant is a shell company (as defined in Rule 12b-2 of the Exchange Act).
As of October 19, 2022, there were
908,046,777
shares of Halliburton Company common stock, $2.50 par value per share, outstanding.
HALLIBURTON COMPANY
Index
| Page No. | ||||||||
PART I. FINANCIAL INFORMATION
Item 1. Financial Statements
HALLIBURTON COMPANY
Condensed Consolidated Statements of Operations
(Unaudited)
|
Three Months Ended
September 30 |
Nine Months Ended
September 30 |
||||||||||||||||
| Millions of dollars and shares except per share data | 2022 | 2021 | 2022 | 2021 | |||||||||||||
| Revenue: | |||||||||||||||||
| Services | $ |
|
$ |
|
$ |
|
$ |
|
|||||||||
| Product sales |
|
|
|
|
|||||||||||||
| Total revenue |
|
|
|
|
|||||||||||||
| Operating costs and expenses: | |||||||||||||||||
| Cost of services |
|
|
|
|
|||||||||||||
| Cost of sales |
|
|
|
|
|||||||||||||
| Impairments and other charges |
|
|
|
|
|||||||||||||
| General and administrative |
|
|
|
|
|||||||||||||
| Total operating costs and expenses |
|
|
|
|
|||||||||||||
| Operating income |
|
|
|
|
|||||||||||||
|
Interest expense, net of interest income of $
|
(
|
(
|
(
|
(
|
|||||||||||||
| Loss on early extinguishment of debt |
|
|
(
|
|
|||||||||||||
| Other, net |
(
|
(
|
(
|
(
|
|||||||||||||
| Income before income taxes |
|
|
|
|
|||||||||||||
| Income tax provision |
(
|
(
|
(
|
(
|
|||||||||||||
| Net income | $ |
|
$ |
|
$ |
|
$ |
|
|||||||||
| Net income attributable to noncontrolling interest |
(
|
(
|
(
|
(
|
|||||||||||||
| Net income attributable to company | $ |
|
$ |
|
$ |
|
$ |
|
|||||||||
| Basic and diluted net income per share | $ |
|
$ |
|
$ |
|
$ |
|
|||||||||
| Basic weighted average common shares outstanding |
|
|
|
|
|||||||||||||
| Diluted weighted average common shares outstanding |
|
|
|
|
|||||||||||||
| See notes to condensed consolidated financial statements. | |||||||||||||||||
HAL Q3 2022 FORM 10-Q | 1
HALLIBURTON COMPANY
Condensed Consolidated Statements of Comprehensive Income
(Unaudited)
|
Three Months Ended
September 30 |
Nine Months Ended
September 30 |
||||||||||||||||
| Millions of dollars | 2022 | 2021 | 2022 | 2021 | |||||||||||||
| Net income | $ |
|
$ |
|
$ |
|
$ |
|
|||||||||
| Other comprehensive income (loss), net of income taxes |
(
|
|
|
|
|||||||||||||
| Comprehensive income | $ |
|
$ |
|
$ |
|
$ |
|
|||||||||
| Comprehensive income attributable to noncontrolling interest |
(
|
(
|
(
|
(
|
|||||||||||||
| Comprehensive income attributable to company shareholders | $ |
|
$ |
|
$ |
|
$ |
|
|||||||||
| See notes to condensed consolidated financial statements. | |||||||||||||||||
HAL Q3 2022 FORM 10-Q | 2
HALLIBURTON COMPANY
Condensed Consolidated Balance Sheets
(Unaudited)
| Millions of dollars and shares except per share data |
September 30,
2022 |
December 31,
2021 |
|||||||||
| Assets | |||||||||||
| Current assets: | |||||||||||
| Cash and equivalents | $ |
|
$ |
|
|||||||
|
Receivables (net of allowances for credit losses of $
|
|
|
|||||||||
| Inventories |
|
|
|||||||||
| Other current assets |
|
|
|||||||||
| Total current assets |
|
|
|||||||||
|
Property, plant, and equipment (net of accumulated depreciation of $
|
|
|
|||||||||
| Goodwill |
|
|
|||||||||
| Deferred income taxes |
|
|
|||||||||
| Operating lease right-of-use assets |
|
|
|||||||||
| Other assets |
|
|
|||||||||
| Total assets | $ |
|
$ |
|
|||||||
| Liabilities and Shareholders’ Equity | |||||||||||
| Current liabilities: | |||||||||||
| Accounts payable | $ |
|
$ |
|
|||||||
| Accrued employee compensation and benefits |
|
|
|||||||||
| Taxes other than income |
|
|
|||||||||
| Income tax payable |
|
|
|||||||||
| Current portion of operating lease liabilities |
|
|
|||||||||
| Other current liabilities |
|
|
|||||||||
| Total current liabilities |
|
|
|||||||||
| Long-term debt |
|
|
|||||||||
| Operating lease liabilities |
|
|
|||||||||
| Employee compensation and benefits |
|
|
|||||||||
| Other liabilities |
|
|
|||||||||
| Total liabilities |
|
|
|||||||||
| Shareholders’ equity: | |||||||||||
|
Common stock, par value $
|
|
|
|||||||||
| Paid-in capital in excess of par value |
|
|
|||||||||
| Accumulated other comprehensive loss |
(
|
(
|
|||||||||
| Retained earnings |
|
|
|||||||||
|
Treasury stock, at cost (
|
(
|
(
|
|||||||||
| Company shareholders’ equity |
|
|
|||||||||
| Noncontrolling interest in consolidated subsidiaries |
|
|
|||||||||
| Total shareholders’ equity |
|
|
|||||||||
| Total liabilities and shareholders’ equity | $ |
|
$ |
|
|||||||
| See notes to condensed consolidated financial statements. | |||||||||||
HAL Q3 2022 FORM 10-Q | 3
HALLIBURTON COMPANY
Condensed Consolidated Statements of Cash Flows
(Unaudited)
|
Nine Months Ended
September 30 |
|||||||||||
| Millions of dollars | 2022 | 2021 | |||||||||
| Cash flows from operating activities: | |||||||||||
| Net income | $ |
|
$ |
|
|||||||
| Adjustments to reconcile net income to cash flows from operating activities: | |||||||||||
| Depreciation, depletion, and amortization |
|
|
|||||||||
| Impairments and other charges |
|
|
|||||||||
| Changes in assets and liabilities: | |||||||||||
| Receivables |
(
|
(
|
|||||||||
| Inventories |
(
|
(
|
|||||||||
| Accounts payable |
|
|
|||||||||
| Other operating activities |
(
|
(
|
|||||||||
| Total cash flows provided by operating activities |
|
|
|||||||||
| Cash flows from investing activities: | |||||||||||
| Capital expenditures |
(
|
(
|
|||||||||
| Proceeds from sales of property, plant, and equipment |
|
|
|||||||||
| Proceeds from a structured real estate transaction |
|
|
|||||||||
| Other investing activities |
(
|
(
|
|||||||||
| Total cash flows used in investing activities |
(
|
(
|
|||||||||
| Cash flows from financing activities: | |||||||||||
| Payments on long-term borrowings |
(
|
(
|
|||||||||
| Dividends to shareholders |
(
|
(
|
|||||||||
| Other financing activities |
|
|
|||||||||
| Total cash flows used in financing activities |
(
|
(
|
|||||||||
| Effect of exchange rate changes on cash |
(
|
(
|
|||||||||
| Increase/(decrease) in cash and equivalents |
(
|
|
|||||||||
| Cash and equivalents at beginning of period |
|
|
|||||||||
| Cash and equivalents at end of period | $ |
|
$ |
|
|||||||
| Supplemental disclosure of cash flow information: | |||||||||||
| Cash payments during the period for: | |||||||||||
| Interest | $ |
|
$ |
|
|||||||
| Income taxes | $ |
|
$ |
|
|||||||
| See notes to condensed consolidated financial statements. | |||||||||||
HAL Q3 2022 FORM 10-Q | 4
| Part I. Item 1 | Notes to Condensed Consolidated Financial Statements | |||||
HALLIBURTON COMPANY
Notes to Condensed Consolidated Financial Statements
(Unaudited)
Note 1.
Basis of Presentation
The accompanying unaudited condensed consolidated financial statements were prepared using generally accepted accounting principles for interim financial information and the instructions to Form 10-Q and Regulation S-X. Accordingly, these financial statements do not include all information or notes required by generally accepted accounting principles for annual financial statements and should be read together with our 2021 Annual Report on Form 10-K.
Our accounting policies are in accordance with United States generally accepted accounting principles. The preparation of financial statements in conformity with these accounting principles requires us to make estimates and assumptions that affect:
•
the reported amounts of assets and liabilities and disclosure of contingent assets and liabilities at the date of the financial statements; and
•
the reported amounts of revenue and expenses during the reporting period.
Ultimate results could differ from our estimates.
In our opinion, the condensed consolidated financial statements included herein contain all adjustments necessary to present fairly our financial position as of September 30, 2022 and the results of our operations for the three and nine months ended September 30, 2022 and 2021, and our cash flows for the nine months ended September 30, 2022 and 2021. Such adjustments are of a normal recurring nature. In addition, certain reclassifications of prior period balances have been made to conform to the current period presentation.
The results of our operations for the three and nine months ended September 30, 2022 may not be indicative of results for the full year.
Note 2.
Impairments and Other Charges
The following table presents various pre-tax charges we recorded during the three months ended September 30, 2021 and the nine months ended September 30, 2022 and 2021, respectively, which are reflected within "Impairments and other charges" on our condensed consolidated statements of operations.
|
Three Months Ended
September 30 |
Nine Months Ended
September 30 |
||||||||||
| Millions of dollars | 2021 | 2022 | 2021 | ||||||||
| Catch-up depreciation | $ |
|
$ |
|
$ |
|
|||||
| Severance costs |
|
|
|
||||||||
| Receivables |
|
|
|
||||||||
| Property, plant, and equipment, net |
|
|
|
||||||||
| Inventory |
|
|
|
||||||||
| Gain on real estate transaction |
(
|
|
(
|
||||||||
| Other |
|
(
|
|
||||||||
| Total impairments and other charges | $ |
|
$ |
|
$ |
|
|||||
During the third quarter of 2022, we completed the sale of our Russia operations to a Russia-based management team made up of former Halliburton employees. As a result, we no longer conduct operations in Russia. The Russia-based management team now owns and operates our former business and assets in Russia under the name BurService LLC, which is independent from Halliburton. There were
no
impairments and other charges recorded during the three months ended September 30, 2022 related to the Russian divestiture or otherwise.
HAL Q3 2022 FORM 10-Q | 5
| Part I. Item 1 | Notes to Condensed Consolidated Financial Statements | |||||
During the second quarter of 2022, due to Russia's invasion of Ukraine and resulting sanctions imposed on Russia, we made the decision to sell our Russian operations. We executed a non-binding letter of intent with the Russia based management team in May of 2022 for the divestiture of the Russian operations. The net assets to be sold (i.e., the disposal group) met the held for sale criteria and, as a result, in the second quarter of 2022 we wrote down the disposal group to fair value less costs to sell, resulting in a pre-tax charge of $
344
million. The resulting value of the disposal group held for sale was $
1
. Of this pre-tax charge, approximately $
131
million was attributable to our Completion and Production segment, approximately $
178
million was attributable to our Drilling and Evaluation segment, and $
35
million was selling costs and was attributable to Corporate and other.
During the first quarter of 2022, we recorded a pre-tax charge of $
22
million primarily related to the write down of all our assets in Ukraine as part of our decision to cease our operations in Ukraine. Included in this charge is a $
16
million allowance for credit loss as we do not expect to collect our receivables in Ukraine.
Note 3.
Business Segment Information
We operate under
two
divisions, which form the basis for the
two
operating segments we report: the Completion and Production segment and the Drilling and Evaluation segment. Our equity in earnings and losses of unconsolidated affiliates that are accounted for using the equity method of accounting are included within cost of services and cost of sales on our statements of operations, which is part of operating income of the applicable segment.
The following table presents information on our business segments.
|
Three Months Ended
September 30 |
Nine Months Ended
September 30 |
||||||||||||||||
| Millions of dollars | 2022 | 2021 | 2022 | 2021 | |||||||||||||
| Revenue: | |||||||||||||||||
| Completion and Production | $ |
|
$ |
|
$ |
|
$ |
|
|||||||||
| Drilling and Evaluation |
|
|
|
|
|||||||||||||
| Total revenue | $ |
|
$ |
|
$ |
|
$ |
|
|||||||||
| Operating income: | |||||||||||||||||
| Completion and Production | $ |
|
$ |
|
$ |
|
$ |
|
|||||||||
| Drilling and Evaluation |
|
|
|
|
|||||||||||||
| Total operations |
|
|
|
|
|||||||||||||
| Corporate and other (a) |
(
|
(
|
(
|
(
|
|||||||||||||
| Impairments and other charges (b) |
|
(
|
(
|
(
|
|||||||||||||
| Total operating income | $ |
|
$ |
|
$ |
|
$ |
|
|||||||||
| Interest expense, net of interest income |
(
|
(
|
(
|
(
|
|||||||||||||
| Loss on early extinguishment of debt (c) |
|
|
(
|
|
|||||||||||||
| Other, net |
(
|
(
|
(
|
(
|
|||||||||||||
| Income before income taxes | $ |
|
$ |
|
$ |
|
$ |
|
|||||||||
| (a) |
|
||||||||||||||||
| (b) |
|
||||||||||||||||
| (c) |
For the nine months ended September 30, 2022, amount consists of a $
|
||||||||||||||||
HAL Q3 2022 FORM 10-Q | 6
| Part I. Item 1 | Notes to Condensed Consolidated Financial Statements | |||||
Note 4.
Revenue
Disaggregation of revenue
We disaggregate revenue from contracts with customers into types of services or products, consistent with our
two
reportable segments, in addition to geographical area. Based on the location of services provided and products sold,
45
% and
40
%
of our consolidated revenue was from the United States for the nine months ended September 30, 2022 and 2021, respectively. No other country accounted for more than 10% of our revenue.
The following table presents information on our disaggregated revenue.
|
Three Months Ended
September 30 |
Nine Months Ended
September 30 |
|||||||||||||
| Millions of dollars | 2022 | 2021 | 2022 | 2021 | ||||||||||
| Revenue by segment: | ||||||||||||||
| Completion and Production | $ |
|
$ |
|
$ |
|
$ |
|
||||||
| Drilling and Evaluation |
|
|
|
|
||||||||||
| Total revenue | $ |
|
$ |
|
$ |
|
$ |
|
||||||
| Revenue by geographic region: | ||||||||||||||
| North America | $ |
|
$ |
|
$ |
|
$ |
|
||||||
| Latin America |
|
|
|
|
||||||||||
| Europe/Africa/CIS |
|
|
|
|
||||||||||
| Middle East/Asia |
|
|
|
|
||||||||||
| Total revenue | $ |
|
$ |
|
$ |
|
$ |
|
||||||
Contract balances
We perform our obligations under contracts with our customers by transferring services and products in exchange for consideration. The timing of our performance often differs from the timing of our customer’s payment, which results in the recognition of receivables and deferred revenue. Deferred revenue represents advance consideration received from customers for contracts where revenue is recognized on future performance of service. Deferred revenue, as well as revenue recognized during the period relating to amounts included as deferred revenue at the beginning of the period, was not material to our condensed consolidated financial statements.
Transaction price allocated to remaining performance obligations
Remaining performance obligations represent firm contracts for which work has not been performed and future revenue recognition is expected. We have elected the practical expedient permitting the exclusion of disclosing remaining performance obligations for contracts that have an original expected duration of
one year
or less. We have some long-term contracts related to software and integrated project management services such as lump sum turnkey contracts. For software contracts, revenue is generally recognized over time throughout the license period when the software is considered to be a right to access our intellectual property. For lump sum turnkey projects, we recognize revenue over time using an input method, which requires us to exercise judgment. Revenue allocated to remaining performance obligations for these long-term contracts is not material.
HAL Q3 2022 FORM 10-Q | 7
| Part I. Item 1 | Notes to Condensed Consolidated Financial Statements | |||||
Receivables
As of September 30, 2022,
38
% of our net trade receivables were from customers in the United States and
11
% were from customers in Mexico. As of December 31, 2021,
34
% of our net trade receivables were from customers in the United States and
11
% were from customers in Mexico. Receivables from our primary customer in Mexico accounted for approximately
9
% and
10
% of our total receivables as of September 30, 2022 and December 31, 2021, respectively. While we have experienced payment delays in Mexico, these amounts are not in dispute and we have not historically had, and we do not expect, any material write-offs due to collectability of receivables from this customer.
No
other country or single customer accounted for more than
10
% of our net trade receivables at those dates.
Although the market environment has been improving, we continue to have risk of delayed customer payments and payment defaults associated with customer liquidity issues. We routinely monitor the financial stability of our customers and employ an extensive process to evaluate the collectability of outstanding receivables. This process, which involves a high degree of judgment utilizing significant assumptions, includes analysis of our customers’ historical time to pay, financial condition and various financial metrics, debt structure, credit ratings, and production profile, as well as political and economic factors in countries of operations and other customer-specific factors.
Note 5.
Inventories
Inventories consisted of the following:
| Millions of dollars |
September 30,
2022 |
December 31,
2021 |
||||||
| Finished products and parts | $ |
|
$ |
|
||||
| Raw materials and supplies |
|
|
||||||
| Work in process |
|
|
||||||
| Total inventories | $ |
|
$ |
|
||||
Note 6.
Debt
In February of 2022, we redeemed $
600
million aggregate principal amount of our $
1.0
billion
3.8
% senior notes due in November 2025. The early redemption of the notes resulted in a loss of $
42
million, consisting of premiums and unamortized expenses. The loss is included in "Loss on early extinguishment of debt" in our condensed consolidated statements of operations for the nine months ended September 30, 2022. We used cash on hand to fund the aggregate redemption price of the notes, which included the principal amount, the make-whole premium, and accrued interest, in the amount of $
641
million. The remaining $
400
million aggregate principal amount of the notes remains outstanding.
On April 27, 2022, we entered into a new $
3.5
billion five-year revolving credit facility which replaced our $
3.5
billion revolving credit facility established in March of 2019. The revolving credit facility is for general working capital purposes and expires on April 27, 2027. The full amount of the revolving credit facility was available as of September 30, 2022.
In September of 2022, we redeemed the entire $
600
million outstanding principal amount of our
3.5
% senior notes due in August of 2023 at par. We used cash on hand to fund the redemption amount of $
603
million, which included the principal amount and accrued interest.
Note 7.
Income Taxes
HAL Q3 2022 FORM 10-Q | 8
| Part I. Item 1 | Notes to Condensed Consolidated Financial Statements | |||||
Note 8.
Shareholders’ Equity
The following tables summarize our shareholders’ equity activity for the three and nine months ended September 30, 2022 and September 30, 2021, respectively:
| Millions of dollars | Common Stock | Paid-in Capital in Excess of Par Value | Treasury Stock | Retained Earnings | Accumulated Other Comprehensive Income (Loss) | Noncontrolling Interest in Consolidated Subsidiaries | Total | |||||||||||||||||||
| Balance at December 31, 2021 | $ |
|
$ |
|
$ |
(
|
$ |
|
$ |
(
|
$ |
|
$ |
|
||||||||||||
| Comprehensive income (loss): | ||||||||||||||||||||||||||
| Net income |
|
|
|
|
|
|
|
|||||||||||||||||||
| Other comprehensive income |
|
|
|
|
|
|
|
|||||||||||||||||||
|
Cash dividends ($
|
|
|
|
(
|
|
|
(
|
|||||||||||||||||||
| Stock plans (a) |
|
(
|
|
(
|
|
|
|
|||||||||||||||||||
| Balance at March 31, 2022 | $ |
|
$ |
|
$ |
(
|
$ |
|
$ |
(
|
$ |
|
$ |
|
||||||||||||
| Comprehensive income (loss): | ||||||||||||||||||||||||||
| Net income |
|
|
|
|
|
|
|
|||||||||||||||||||
| Other comprehensive loss |
|
|
|
|
(
|
|
(
|
|||||||||||||||||||
|
Cash dividends ($
|
|
|
|
(
|
|
|
(
|
|||||||||||||||||||
| Stock plans (a) |
|
|
|
(
|
|
|
|
|||||||||||||||||||
| Other |
|
|
|
|
|
(
|
(
|
|||||||||||||||||||
| Balance at June 30, 2022 | $ |
|
$ |
|
$ |
(
|
$ |
|
$ |
(
|
$ |
|
$ |
|
||||||||||||
| Comprehensive income (loss): | ||||||||||||||||||||||||||
| Net income |
|
|
|
|
|
|
|
|||||||||||||||||||
| Other comprehensive loss |
|
|
|
|
(
|
|
(
|
|||||||||||||||||||
|
Cash dividends ($
|
|
|
|
(
|
|
|
(
|
|||||||||||||||||||
| Stock plans (a) |
(
|
|
|
(
|
|
|
|
|||||||||||||||||||
| Other |
|
|
|
|
|
|
|
|||||||||||||||||||
| Balance at September 30, 2022 | $ |
|
$ |
|
$ |
(
|
$ |
|
$ |
(
|
$ |
|
$ |
|
||||||||||||
| (a) |
|
|||||||||||||||||||||||||
HAL Q3 2022 FORM 10-Q | 9
| Part I. Item 1 | Notes to Condensed Consolidated Financial Statements | |||||
| Millions of dollars | Common Stock | Paid-in Capital in Excess of Par Value | Treasury Stock | Retained Earnings | Accumulated Other Comprehensive Income (Loss) | Noncontrolling Interest in Consolidated Subsidiaries | Total | |||||||||||||||||||
| Balance at December 31, 2020 | $ |
|
$ |
|
$ |
(
|
$ |
|
$ |
(
|
$ |
|
$ |
|
||||||||||||
| Comprehensive income (loss): | ||||||||||||||||||||||||||
| Net income |
|
|
|
|
|
|
|
|||||||||||||||||||
|
Cash dividends ($
|
|
|
|
(
|
|
|
(
|
|||||||||||||||||||
| Stock plans (a) |
|
|
|
(
|
|
|
|
|||||||||||||||||||
| Other |
|
|
|
|
|
(
|
(
|
|||||||||||||||||||
| Balance at March 31, 2021 | $ |
|
$ |
|
$ |
(
|
$ |
|
$ |
(
|
$ |
|
$ |
|
||||||||||||
| Comprehensive income (loss): | ||||||||||||||||||||||||||
| Net income |
|
|
|
|
|
|
|
|||||||||||||||||||
| Other comprehensive income |
|
|
|
|
|
|
|
|||||||||||||||||||
|
Cash dividends ($
|
|
|
|
(
|
|
|
(
|
|||||||||||||||||||
| Stock plans |
|
(
|
|
|
|
|
|
|||||||||||||||||||
| Other |
|
|
|
|
|
(
|
(
|
|||||||||||||||||||
| Balance at June 30, 2021 | $ |
|
$ |
|
$ |
(
|
$ |
|
$ |
(
|
$ |
|
$ |
|
||||||||||||
| Comprehensive income (loss): | ||||||||||||||||||||||||||
| Net income |
|
|
|
|
|
|
|
|||||||||||||||||||
|
Cash dividends ($
|
|
|
|
(
|
|
|
(
|
|||||||||||||||||||
| Stock plans (a) |
|
(
|
|
(
|
|
|
|
|||||||||||||||||||
| Other |
|
|
|
|
|
(
|
(
|
|||||||||||||||||||
| Balance at September 30, 2021 | $ |
|
$ |
|
$ |
(
|
$ |
|
$ |
(
|
$ |
|
$ |
|
||||||||||||
| (a) |
|
|||||||||||||||||||||||||
Our Board of Directors has authorized a program to repurchase our common stock from time to time. There were no repurchases made under the program during the three and nine months ended September 30, 2022. Approximately $
5.1
billion remained authorized for repurchases as of September 30, 2022. From the inception of this program in February of 2006 through September 30, 2022, we repurchased approximately
224
million shares of our common stock for a total cost of approximately $
9.0
billion.
Accumulated other comprehensive loss consisted of the following:
| Millions of dollars |
September 30,
2022 |
December 31,
2021 |
|||||||||
| Cumulative translation adjustments | $ |
(
|
$ |
(
|
|||||||
| Defined benefit and other postretirement liability adjustments |
(
|
(
|
|||||||||
| Other |
(
|
(
|
|||||||||
| Total accumulated other comprehensive loss | $ |
(
|
$ |
(
|
|||||||
Note 9.
Commitments and Contingencies
HAL Q3 2022 FORM 10-Q | 10
| Part I. Item 1 | Notes to Condensed Consolidated Financial Statements | |||||
Guarantee arrangements
In the normal course of business, we have in place agreements with financial institutions under which approximately $
2.0
billion of letters of credit, bank guarantees, or surety bonds were outstanding as of September 30, 2022. Some of the outstanding letters of credit have triggering events that would entitle a bank to require cash collateralization. None of these off-balance sheet arrangements either has, or is likely to have, a material effect on our condensed consolidated financial statements.
Note 10.
Income per Share
Basic income or loss per share is based on the weighted average number of common shares outstanding during the period. Diluted income per share includes additional common shares that would have been outstanding if potential common shares with a dilutive effect had been issued. Antidilutive securities represent potentially dilutive securities which are excluded from the computation of diluted income or loss per share as their impact was antidilutive.
A reconciliation of the number of shares used for the basic and diluted income per share computations is as follows:
|
Three Months Ended
September 30 |
Nine Months Ended
September 30 |
|||||||||||||
| Millions of shares | 2022 | 2021 | 2022 | 2021 | ||||||||||
| Basic weighted average common shares outstanding |
|
|
|
|
||||||||||
| Dilutive effect of awards granted under our stock incentive plans |
|
|
|
|
||||||||||
| Diluted weighted average common shares outstanding |
|
|
|
|
||||||||||
| Antidilutive shares: | ||||||||||||||
| Options with exercise price greater than the average market price |
|
|
|
|
||||||||||
| Total antidilutive shares |
|
|
|
|
||||||||||
Note 11.
Fair Value of Financial Instruments
The carrying amount of cash and equivalents, receivables, and accounts payable, as reflected in the condensed consolidated balance sheets, approximates fair value due to the short maturities of these instruments.
The carrying amount and fair value of our total debt, including short-term borrowings and current maturities of long-term debt, is as follows:
| September 30, 2022 | December 31, 2021 | ||||||||||||||||||||||||||||
| Millions of dollars | Level 1 | Level 2 | Total fair value | Carrying value | Level 1 | Level 2 | Total fair value | Carrying value | |||||||||||||||||||||
| Total debt | $ |
|
$ |
|
$ |
|
$ |
|
$ |
|
$ |
|
$ |
|
$ |
|
|||||||||||||
In the first nine months of 2022, the fair value of our debt decreased as a result of the early redemption of senior notes and higher debt yields. The carrying value of our debt decreased as a result of the early redemption of senior notes. See Note 6 for further information.
Our debt categorized within level 1 on the fair value hierarchy is calculated using quoted prices in active markets for identical liabilities with transactions occurring on the last
two days
of period-end. Our debt categorized within level 2 on the fair value hierarchy is calculated using significant observable inputs for similar liabilities where estimated values are determined from observable data points on our other bonds and on other similarly rated corporate debt or from observable data points of transactions occurring prior to
two days
from period-end and adjusting for changes in market conditions. Differences between the periods presented in our level 1 and level 2 classification of our long-term debt relate to the timing of when third party market transactions on our debt are executed. We have
no
debt categorized within level 3 on the fair value hierarchy.
HAL Q3 2022 FORM 10-Q | 11
| Part I. Item 2 | Executive Overview | ||||||||
Item 2. Management's Discussion and Analysis of Financial Condition and Results of Operations
Management's Discussion and Analysis of Financial Condition and Results of Operations (MD&A) should be read in conjunction with the condensed consolidated financial statements included in "Item 1. Financial Statements" contained herein.
EXECUTIVE OVERVIEW
Organization
We are one of the world's largest providers of products and services to the energy industry. We help our customers maximize value throughout the lifecycle of the reservoir - from locating hydrocarbons and managing geological data, to drilling and formation evaluation, well construction and completion, and optimizing production throughout the life of the asset. Activity levels within our operations are significantly impacted by spending on upstream exploration, development, and production programs by major, national, and independent oil and natural gas companies. We report our results under two segments, the Completion and Production segment and the Drilling and Evaluation segment.
•
Completion and Production delivers cementing, stimulation, intervention, pressure control, artificial lift, and completion products and services. The segment consists of Production Enhancement, Cementing, Completion Tools, Production Solutions, Artificial Lift, and Pipeline and Process Services.
•
Drilling and Evaluation provides field and reservoir modeling, drilling, fluids and specialty chemicals, evaluation and precise wellbore placement solutions that enable customers to model, measure, drill, and optimize their well construction activities. The segment consists of Baroid, Sperry Drilling, Wireline and Perforating, Drill Bits and Services, Landmark Software and Services, Testing and Subsea, and Project Management.
The business operations of our segments are organized around four primary geographic regions: North America, Latin America, Europe/Africa/CIS, and Middle East/Asia. We have manufacturing operations in various locations, the most significant of which are in the United States, Malaysia, Singapore, and the United Kingdom. With more than 40,000 employees, we operate in more than 70 countries around the world, and our corporate headquarters is in Houston, Texas.
Our value proposition is to collaborate and engineer solutions to maximize asset value for our customers. We work to achieve strong cash flows and returns for our shareholders by delivering technology and services that improve efficiency, increase recovery, and maximize production for our customers. Our strategic priorities are to:
-deliver profitable growth in our international business;
-maximize value and cash flows in our North America business;
-accelerate the deployment and integration of digitalization and automation technologies that create differentiation, both internally and for our customers;
-drive increased capital efficiencies in all parts of our business; and
-actively participate in advancing a sustainable energy future.
The following charts depict revenue split between our two operating segments and our four primary geographic regions for the quarter ended September 30, 2022.
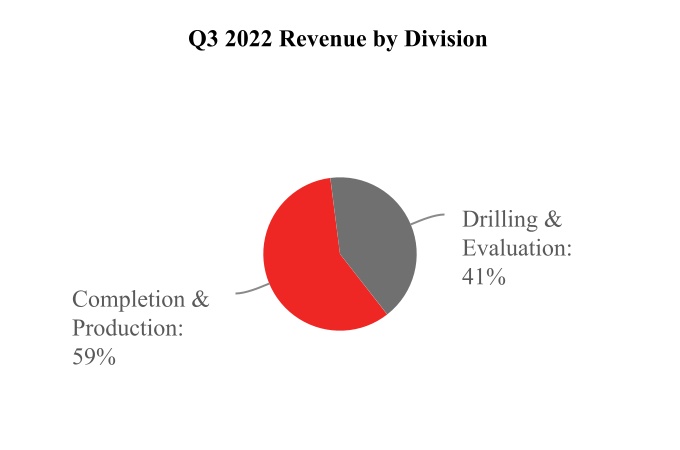
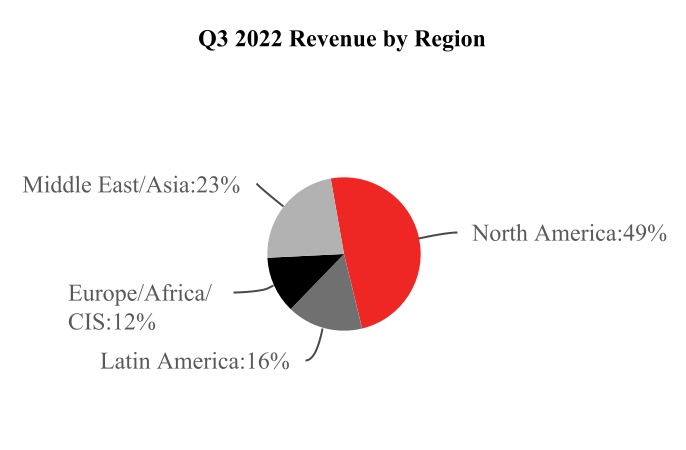
HAL Q3 2022 FORM 10-Q | 12
| Part I. Item 2 | Executive Overview | ||||||||
Market conditions, COVID-19 pandemic, and Russia/Ukraine Conflict
Since early 2020, world-wide oil supply and demand imbalances and related volatility of oil and natural gas prices have resulted in dramatic fluctuations in global markets including oil and gas markets. These imbalances and volatility continue to be impacted by efforts to contain the COVID-19 pandemic, including current lockdowns and threats of future lockdowns in certain countries, inflationary pressures and efforts to combat it, threats of recession, changes to OPEC+ production levels, supply chain shortages, and geopolitical conflicts including Russia’s invasion of and continued war with Ukraine. West Texas Intermediate (WTI) averaged approximately $93 per barrel during the third quarter of 2022. The U.S. land average rig count continues to be below pre-pandemic levels, but improved 7% in the third quarter of 2022 compared to the second
quarter of
2022
. The Brent crude oil price averaged over $101 per barrel during the
third
quarter of
2022
and the international average rig count improved
5%
as compared to the second
quarter of
2022.
Globally, we are being impacted by supply chain shortages as the post-pandemic recovery stressed both the supply of raw materials and transportation logistics. We monitor market trends and work to mitigate cost impacts through economies of scale in global procurement, technology modifications, and efficient sourcing practices. Also, while we have been impacted by inflationary cost increases, primarily related to frac sand, chemicals, cement, and logistics costs, we generally try to pass much of those increases on to our customers and we believe we have effective solutions that work to minimize the operational impact.
As a result of Russia's invasion of Ukraine, governments in the European Union, the United States, the United Kingdom, Switzerland, and other countries enacted new sanctions against Russia and Russian interests. In order to comply with these sanctions, we ceased pursuing future business in Russia and began to wind down our remaining operations in Russia in March of 2022. During the second quarter of 2022, we made the decision to sell our Russian operations. We executed a non-binding letter of intent with our Russia based management team in May of 2022 for the divestiture of the Russian operations. The net assets to be sold (i.e., the disposal group) met the held for sale criteria as of June 30, 2022 and as a result, we wrote down the disposal group to fair value less costs to sell, resulting in a pre-tax charge of $344 million during the second quarter of 2022. The divestiture was completed in the third quarter of 2022. See Note 2 to our condensed consolidated financial statements for additional information.
Financial results
The following graph illustrates our revenue and operating margins for each operating segment for the third quarter of 2021 and 2022.
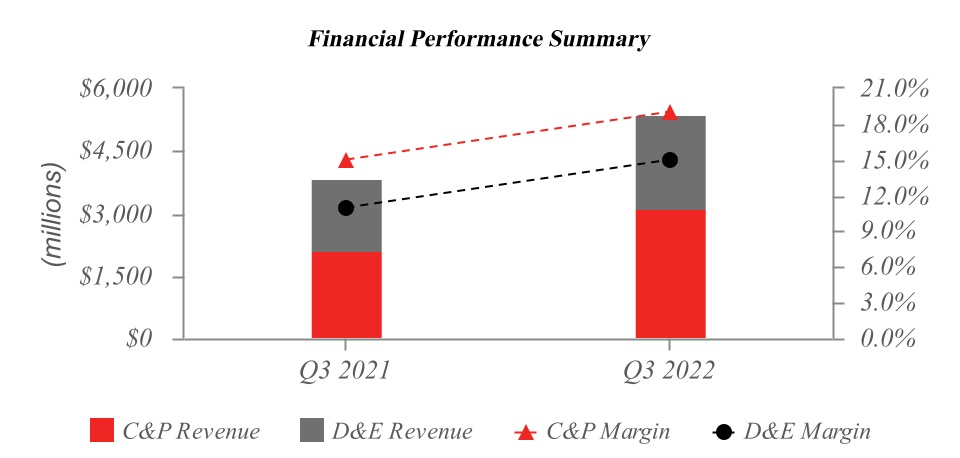
During the third quarter of 2022, we generated total company revenue of $5.4 billion, a 39% increase as compared to the third quarter of 2021.
We reported operating income of $846 million during the third quarter of 2022
compared to operating income of $446 million during the third quarter of 2021. Both of our segments were negatively impacted by our exit from Russia in August of 2022. Our Completion and Production segment revenue increased 47% in the third quarter of 2022 as compared to the third quarter of 2021, primarily due to increased pressure pumping services in North America land. Our Drilling and Evaluation segment revenue increased 29% in the third quarter of 2022 as compared to the third quarter of 2021, driven primarily by improvements in drilling-related services, wireline services, and project management activity in most regions.
In North America, our revenue increased 63% in the third quarter of 2022, as compared to the third quarter of 2021, driven by increased pressure pumping services in North America land, as well as increased activity in most product service lines. While the average North America land rig count increased 59% from the third quarter of 2021, it is still about 20% below 2019 pre-pandemic levels.
HAL Q3 2022 FORM 10-Q | 13
| Part I. Item 2 | Executive Overview | ||||||||
Revenue in our international markets increased 21% in the third quarter of 2022, as compared to the third quarter of 2021, primarily driven by higher activity for drilling and completions related services across all regions, partially offset by the impact of our exit from Russia. The international rig count increased 11% in the third quarter of 2022 as compared to the third quarter of 2021.
Sustainability and Energy Advancement
We continue to pursue our strategic initiatives around advancing cleaner, affordable energy, and supporting sustainable energy advancements using innovation and technology to reduce the environmental impact of producing oil and gas. This includes the continued development and deployment of low-carbon solutions to help oil and gas operators lower their current emissions profiles while also using our existing technologies in renewable energy applications. In addition, Halliburton Labs, our clean energy accelerator, continues to pursue companies and has 19 participants and alumni as of the third quarter of 2022.
Our operating performance and liquidity are described in more detail in "Liquidity and Capital Resources" and “Business Environment and Results of Operations.”
HAL Q3 2022 FORM 10-Q | 14
| Part I. Item 2 | Liquidity and Capital Resources | ||||||||
LIQUIDITY AND CAPITAL RESOURCES
As of September 30, 2022, we had $2.0 billion of cash and equivalents, compared to $3.0 billion of cash and equivalents at December 31, 2021.
Significant sources and uses of cash during the first nine months of 2022
Sources of cash:
•
Cash from operating activities was $1.1 billion, which included a negative net impact of $907 million from the primary components of our working capital (receivables, inventories, and accounts payable).
Uses of cash:
•
In February of 2022, we paid $641 million to redeem $600 million aggregate principal amount of our 3.8% senior notes due 2025. The payment also included the make-whole premium and accrued interest.
•
In September of 2022, we paid $603 million to redeem $600 million aggregate principal amount of our 3.5% senior notes due 2023 at par. The payment also included accrued interest.
•
Capital expenditures were $661 million.
•
We paid $327 million in dividends to our shareholders.
Future sources and uses of cash
We manufacture most of our own equipment, which provides significant flexibility to increase or decrease our capital expenditures based on market conditions. We expect capital spending for the full year 2022 will be approximately 5-6% of revenue. We believe this level of spend will allow us to adequately invest in key strategic areas. However, we will continue to maintain capital discipline and monitor changing market dynamics, and we may adjust our capital spend accordingly.
Our quarterly dividend rate is $0.12 per common share, or approximately $110 million. While we will maintain our focus on liquidity, we will also focus on our priorities of increasing cash returns to our shareholders through dividends, share buy-backs under our existing repurchase program, or both, and opportunistic investment in our business.
Our Board of Directors has authorized a program to repurchase our common stock from time to time. No repurchases occurred during the third quarter of 2022 under this program. Approximately $5.1 billion remained authorized for repurchases as of September 30, 2022 and may be used for open market and other share purchases.
Other factors affecting liquidity
Financial position in current market.
As of September 30, 2022, we had $2.0 billion of cash and equivalents and $3.5 billion of available committed bank credit under a new revolving credit facility executed on April 27, 2022 with an expiration date of April 27, 2027. We believe we have a manageable debt maturity profile, with approximately $500 million coming due through the end of 2027. Furthermore, we have no financial covenants or material adverse change provisions in our bank agreements, and our debt maturities extend over a long period of time. We believe our cash on hand, cash flows generated from operations, and our available credit facility will provide sufficient liquidity to address the challenges and opportunities of the current market and our global cash needs, including capital expenditures, working capital investments, dividends, if any, and contingent liabilities.
Guarantee agreements.
In the normal course of business, we have in place agreements with financial institutions under which approximately $2.0 billion of letters of credit, bank guarantees, or surety bonds were outstanding as of September 30, 2022. Some of the outstanding letters of credit have triggering events that would entitle a bank to require cash collateralization, however, none of these triggering events have occurred. As of September 30, 2022, we had no material off-balance sheet liabilities and were not required to make any material cash distributions to our unconsolidated subsidiaries.
Credit ratings.
Our credit ratings with Standard & Poor’s (S&P) remain BBB+ for our long-term debt and A-2 for our short-term debt, with a stable outlook. Our credit ratings with Moody’s Investors Service (Moody's) remain Baa1 for our long-term debt and P-2 for our short-term debt, with a stable outlook.
HAL Q3 2022 FORM 10-Q | 15
| Part I. Item 2 | Liquidity and Capital Resources | ||||||||
Customer receivables
. In line with industry practice, we bill our customers for our services in arrears and are, therefore, subject to risk that our customers may delay or fail to pay our invoices. In weak economic environments, we may experience increased delays and failures to pay our invoices due to, among other reasons, a reduction in our customers’ cash flow from operations and their access to the credit markets, as well as unsettled political conditions.
Receivables from our primary customer in Mexico accounted for approximately 9% of our total receivables as of September 30, 2022. While we have experienced payment delays in Mexico, these amounts are not in dispute and we have not historically had, and we do not expect, any material write-offs due to collectability of receivables from this customer.
HAL Q3 2022 FORM 10-Q | 16
| Part I. Item 2 | Business Environment and Results of Operations | ||||||||
BUSINESS ENVIRONMENT AND RESULTS OF OPERATIONS
We operate in more than 70 countries throughout the world to provide a comprehensive range of services and products to the energy industry. Our revenue is generated from the sale of services and products to major, national, and independent oil and natural gas companies worldwide. The industry we serve is highly competitive with many substantial competitors in each segment of our business. During the first nine months of 2022, based upon the location of the services provided and products sold, 45% of our consolidated revenue was from the United States, compared to 40% of consolidated revenue from the United States in the first nine months of 2021. No other country accounted for more than 10% of our revenue.
Activity within our business segments is significantly impacted by spending on upstream exploration, development, and production programs by our customers. Also impacting our activity is the status of the global economy, which impacts oil and natural gas consumption.
Some of the more significant determinants of current and future spending levels of our customers are oil and natural gas prices and our customers' expectations about future prices, global oil supply and demand, completions intensity, the world economy, the availability of capital, government regulation, and global stability, which together drive worldwide drilling and completions activity.
Additionally, many of our customers in North America have shifted their strategy from production growth to operating within cash flow and generating returns, and we generally expect that to continue throughout
2022
.
Lower oil and natural gas prices usually translate into lower exploration and production budgets and lower rig count, while the opposite is usually true for higher oil and natural gas prices. Our financial performance is therefore significantly affected by oil and natural gas prices and worldwide rig activity, which are summarized in the tables below.
The table below shows the average oil and natural gas prices for WTI, United Kingdom Brent crude oil, and Henry Hub natural gas.
|
Three Months Ended
September 30 |
Year Ended
December 31 |
|||||||||||||
| 2022 | 2021 | 2021 | ||||||||||||
|
Oil price - WTI
(1)
|
$ | 93.18 | $ | 70.62 | $ | 67.99 | ||||||||
|
Oil price - Brent
(1)
|
100.71 | 73.47 | 70.68 | |||||||||||
|
Natural gas price - Henry Hub
(2)
|
7.72 | 4.36 | 3.91 | |||||||||||
| (1) | Oil price measured in dollars per barrel. | |||||||||||||
| (2) | Natural gas price measured in dollars per million British thermal units (Btu), or MMBtu. | |||||||||||||
The historical average rig counts based on the weekly Baker Hughes rig count data were as follows:
|
Three Months Ended
September 30 |
Nine Months Ended
September 30 |
Year Ended
December 31 |
|||||||||||||||
| 2022 | 2021 | 2022 | 2021 | 2021 | |||||||||||||
| U.S. Land | 744 | 485 | 690 | 435 | 465 | ||||||||||||
| U.S. Offshore | 17 | 11 | 16 | 15 | 15 | ||||||||||||
| Canada | 199 | 151 | 171 | 122 | 132 | ||||||||||||
| North America | 960 | 647 | 877 | 572 | 612 | ||||||||||||
| International | 857 | 772 | 832 | 735 | 755 | ||||||||||||
| Worldwide total | 1,817 | 1,419 | 1,709 | 1,307 | 1,367 | ||||||||||||
HAL Q3 2022 FORM 10-Q | 17
| Part I. Item 2 | Business Environment and Results of Operations | ||||||||
Business outlook
The United States Energy Information Administration (EIA) recently cut its pricing forecast for the fourth quarter of 2022 and for 2023 based on its projection of lower demand resulting from slower GDP growth. According to the EIA October 2022 "Short Term Energy Outlook," the Brent spot price is expected to average $93 per barrel for the fourth quarter of 2022, with an expected full year 2022 average of $102 per barrel, a rise of approximately $31 per barrel, or 44%, as compared to the full year 2021 average. According to the EIA, WTI prices are expected to average $86 per barrel in the fourth quarter of 2022 and $96 per barrel for the full year 2022, resulting in an increase of $28 per barrel, or 41%, compared to the full year 2021. Slower than expected crude oil production growth continues to create the potential for higher oil prices, while the possibility of slower than forecasted economic growth creates the potential for lower prices.
The EIA October 2022 “Short Term Energy Outlook” projects Henry Hub natural gas prices to average $7.41 per MMBtu during the fourth quarter of 2022, average $6.88 per MMBtu for the full year 2022, and to decrease to an average of $5.77 per MMBtu in 2023.
Per the International Energy Agency's (IEA) October 2022 "Oil Market Report", the forecasted global oil demand is set to average 99.6 million barrels per day in 2022, an approximate 2 million barrels per day increase from 2021. The EIA projects crude oil production in the United States will average 11.75 million barrels per day in 2022, a 4% increase from the average 11.25 million barrels per day in 2021, and to average 12.36 million barrels per day in 2023, an increase of 5% from 2022.
We continue to expect that oil and gas demand will grow over the next several years, despite the actions taken by central banks in an attempt to control inflation and the resulting concern about a potential economic slowdown, with the demand driven by economic expansion, energy security concerns, and population growth. We believe supply dynamics have fundamentally changed due to investor return requirements, publicly stated environmental, social, and governance commitments, and regulatory pressure, all of which resulted in low inventory levels, and production below expectations. We believe that temporary measures, such as the largest ever release by the United States of strategic petroleum reserves, will not solve the supply/demand imbalance; instead, only multiple years of increased investment in existing and new sources of production will solve the short supply and that solutions are in conventional and unconventional, deep-water and shallow-water, and short and long-cycle projects.
Internationally, we expect to see increased activity in the Middle East, led by Saudi Arabia, but with meaningful activity increases in the United Arab Emirates, Qatar, Iraq, and Kuwait into 2023. Elsewhere, Brazil and Guyana have also signaled a commitment to increase production. Importantly, these broad-based activity increases serve to tighten oil field services equipment availability and tend to drive price increases for equipment across the globe. In North America, net pricing improvements resulted in strong margin expansion during the third quarter, and we continue to expect that customer spending in 2022 will increase by over 35% compared to 2021.
HAL Q3 2022 FORM 10-Q | 18
|
Part I. Item 2 | Results of Operations in 2022 Compared to 2021 (QTD)
|
|||||
RESULTS OF OPERATIONS IN 2022 COMPARED TO 2021
Three Months Ended September 30, 2022 Compared with Three Months Ended September 30, 2021
|
Three Months Ended
September 30 |
Favorable | Percentage | ||||||||||||
| Millions of dollars | 2022 | 2021 | (Unfavorable) | Change | ||||||||||
| Revenue: | ||||||||||||||
| By operating segment: | ||||||||||||||
| Completion and Production | $ | 3,136 | $ | 2,136 | $ | 1,000 | 47 | % | ||||||
| Drilling and Evaluation | 2,221 | 1,724 | 497 | 29 | ||||||||||
| Total revenue | $ | 5,357 | $ | 3,860 | $ | 1,497 | 39 | % | ||||||
| By geographic region: | ||||||||||||||
| North America | $ | 2,635 | $ | 1,615 | $ | 1,020 | 63 | % | ||||||
| Latin America | 841 | 624 | 217 | 35 | ||||||||||
| Europe/Africa/CIS | 639 | 676 | (37) | (5) | ||||||||||
| Middle East/Asia | 1,242 | 945 | 297 | 31 | ||||||||||
| Total revenue | $ | 5,357 | $ | 3,860 | $ | 1,497 | 39 | % | ||||||
| Operating income: | ||||||||||||||
| By operating segment: | ||||||||||||||
| Completion and Production | $ | 583 | $ | 322 | $ | 261 | 81 | % | ||||||
| Drilling and Evaluation | 325 | 186 | 139 | 75 | ||||||||||
| Total operations | 908 | 508 | 400 | 79 | ||||||||||
| Corporate and other | (62) | (50) | (12) | (24) | % | |||||||||
| Impairments and other charges | — | (12) | 12 | n/m | ||||||||||
| Total operating income | $ | 846 | $ | 446 | $ | 400 | 90 | % | ||||||
| n/m = not meaningful | ||||||||||||||
Operating Segments
Completion and Production
Completion and Production revenue in the third quarter of 2022 was $3.1 billion, an increase of $1 billion, or 47%, when compared to the third quarter of 2021. Operating income in the third quarter of 2022 was $583 million, an increase of $261 million, or 81%, when compared to the third quarter of 2021. These results were driven by increased pressure pumping services in the Western Hemisphere, higher completion tool sales in the Middle East and the Western Hemisphere, and improved artificial lift activity in North America land. These improvements were partially offset by lower stimulation activity in Oman and well intervention services in Brazil.
Drilling and Evaluation
Drilling and Evaluation revenue in the third quarter of 2022 was $2.2 billion, an increase of $497 million, or 29%, when compared to the third quarter of 2021. Operating income in the third quarter of 2022 was $325 million, an increase of $139 million, or 75%, when compared to the third quarter of 2021. These results were due to increased drilling-related services in the Western Hemisphere and Middle East/Asia, improved wireline services in Middle East/Asia and the Western Hemisphere, and higher project management services in Latin America and Middle East/Asia. Partially offsetting these increases were lower drilling-related services in Brazil and decreased drilling services in Norway.
Both of our segments were negatively impacted by our exit from Russia in August of 2022.
HAL Q3 2022 FORM 10-Q | 19
|
Part I. Item 2 | Results of Operations in 2022 Compared to 2021 (QTD)
|
|||||
Geographic Regions
North America
North America revenue in the third quarter of 2022 was $2.6 billion, a 63% increase compared to the third quarter of 2021. This increase was primarily driven by pressure pumping services, drilling-related services, and artificial lift services in North America land, and improved drilling-related services in the Gulf of Mexico. These increases were partially offset by reduced software sales and project management activity.
Latin America
Latin America revenue in the third quarter of 2022 was $841 million, a 35% increase compared to the third quarter of 2021 due to increases across multiple product service lines in Argentina, Mexico and Colombia, improved project management activity in Ecuador and Suriname, and improved fluids activity in Guyana. Partially offsetting these increases was reduced well intervention services in Brazil.
Europe/Africa/CIS
Europe/Africa/CIS revenue in the third quarter of 2022 was $639 million, a 5% decrease compared to the third quarter of 2021. This decline was primarily driven by our exit from Russia in August of 2022, in addition to a decrease in drilling services and completion tool sales in Norway. These decreases were partially offset by increases in multiple product service lines in Angola, Egypt, Senegal, and the Eastern Mediterranean.
Middle East/Asia
Middle East/Asia revenue in the third quarter of 2022 was $1.2 billion, a 31% increase compared to the third quarter of 2021, resulting from increased activity across multiple product lines in Saudi Arabia and Kuwait, improved project management services in India, increased drilling-related services in Indonesia, higher well construction services in United Arab Emirates, and higher completion tool sales in Qatar. These increases were partially offset by reduced stimulation activity and well intervention services in Oman.
Other Operating Items
Impairments and other charges.
During the three months ended September 30, 2021, we recognized $12 million of special charges. This includes $36 million of depreciation catch-up expense related to assets previously classified as held for sale related to our Pipeline and Process Services business, $15 million of severance costs, and $35 million of other items, partially offset by a $74 million gain related to the closing of a structured transaction for our North America real estate assets.
Nonoperating Items
Effective tax rate
. During the three months ended September 30, 2022, we recorded a total income tax provision of $156 million on a pre-tax income of $705 million, resulting in an effective tax rate of 22.2% for the quarter. During the three months ended September 30, 2021, we recorded a total income tax provision of $76 million on a pre-tax income of $316 million, resulting in an effective tax rate of 24% for the quarter.
HAL Q3 2022 FORM 10-Q | 20
| Part I. Item 2 | Results of Operations in 2022 Compared to 2021 (YTD) | |||||
Nine Months Ended September 30, 2022 Compared with Nine Months Ended September 30, 2021
|
Nine Months Ended
September 30 |
Favorable | Percentage | ||||||||||||
| Millions of dollars | 2022 | 2021 | (Unfavorable) | Change | ||||||||||
| Revenue: | ||||||||||||||
| By operating segment: | ||||||||||||||
| Completion and Production | $ | 8,400 | $ | 6,054 | $ | 2,346 | 39 | % | ||||||
| Drilling and Evaluation | 6,315 | 4,964 | 1,351 | 27 | ||||||||||
| Total revenue | $ | 14,715 | $ | 11,018 | $ | 3,697 | 34 | % | ||||||
| By geographic region: | ||||||||||||||
| North America | $ | 6,986 | $ | 4,588 | $ | 2,398 | 52 | % | ||||||
| Latin America | 2,252 | 1,693 | 559 | 33 | ||||||||||
| Europe/Africa/CIS | 2,034 | 1,989 | 45 | 2 | ||||||||||
| Middle East/Asia | 3,443 | 2,748 | 695 | 25 | ||||||||||
| Total revenue | $ | 14,715 | $ | 11,018 | $ | 3,697 | 34 | % | ||||||
| Operating income: | ||||||||||||||
| By operating segment: | ||||||||||||||
| Completion and Production | $ | 1,378 | $ | 891 | $ | 487 | 55 | % | ||||||
| Drilling and Evaluation | 905 | 532 | 373 | 70 | ||||||||||
| Total operations | $ | 2,283 | $ | 1,423 | $ | 860 | 60 | |||||||
| Corporate and other | (186) | (161) | (25) | (16) | % | |||||||||
| Impairments and other charges | (366) | (12) | (354) | n/m | ||||||||||
| Total operating income | $ | 1,731 | $ | 1,250 | $ | 481 | 38 | % | ||||||
| n/m = not meaningful | ||||||||||||||
Operating Segments
Completion and Production
Completion and Production revenue in the first nine months of 2022 was $8.4 billion, an increase of $2.3 billion, or 39%, compared to the first nine months of 2021. Operating income in the first nine months of 2022 was $1.4 billion, an increase of $487 million, or 55%, compared to the first nine months of 2021. These increases were primarily driven by higher utilization in pressure pumping services globally, increased artificial lift activity and well intervention services in North America land, and additional completion tool sales in the Western Hemisphere. Partially offsetting these increases were lower well intervention services in Brazil and decreased stimulation activity in Oman.
Drilling and Evaluation
Drilling and Evaluation revenue in the first nine months of 2022 was $6.3 billion, an increase of $1.4 billion, or 27%, compared to the first nine months of 2021. Operating income in the first nine months of 2022 was $905 million, an increase of $373 million, or 70%, compared to the first nine months of 2021. These results were primarily related to increased drilling-related services in the Western Hemisphere, Middle East/Asia, Egypt, Azerbaijan, and the Eastern Mediterranean, along with higher wireline activity and testing services globally. Project management activity increased in Ecuador, Colombia, India, and Saudi Arabia. Partially offsetting these increases were lower project management activity in Mexico and Iraq, along with lower drilling services in Norway.
Both of our segments were negatively impacted by our exit from Russia in August of 2022.
HAL Q3 2022 FORM 10-Q | 21
| Part I. Item 2 | Results of Operations in 2022 Compared to 2021 (YTD) | |||||
Geographic Regions
North America
North America revenue in the first nine months of 2022 was $7.0 billion, a 52% increase compared to the first nine months of 2021, driven by higher activity and pricing across the region, primarily associated with pressure pumping activity, drilling-related services, and artificial lift activity. Partially offsetting these increases were lower project management activity and software sales.
Latin America
Latin America revenue in the first nine months of 2022 was $2.3 billion, a 33% increase compared to the first nine months of 2021, resulting primarily from increases across multiple product service lines in Argentina, Colombia, and Mexico, and increased project management activity in Ecuador. Partially offsetting these increases was lower well intervention services in Brazil.
Europe/Africa/CIS
Europe/Africa/CIS revenue in the first nine months of 2022 was $2.0 billion, a 2% increase compared to the first nine months of 2021, driven by increases across multiple product service lines in Egypt, Azerbaijan, and the Eastern Mediterranean, along with increased cementing services and completion tool sales in Angola. Well intervention services and testing services increased across the region, coupled with higher fluid services in West Africa. These increases were partially offset by decreases in multiple product service lines in Russia and Norway.
Middle East/Asia
Middle East/Asia revenue in the first nine months of 2022 was $3.4 billion, a 25% increase compared to the first nine months of 2021, resulting primarily from increased activity across multiple product service lines in Saudi Arabia, Kuwait, India, United Arab Emirates, and Australia, improved wireline activity across the region, and higher drilling-related services and project management activity in Oman. Partially offsetting these increases were lower stimulation activity in Oman.
Other Operating Items
Impairments and other charges.
During the nine months ended September 30, 2022, we recognized a pre-tax charge of $366 million, primarily related to a $344 million write down of all our net assets in Russia as a result of our decision in the second quarter of 2022 to market our Russia operations for sale due to the additional sanctions enacted against Russia arising from the conflict in Ukraine. In the first quarter of 2022, we recognized a pre-tax charge of $22 million to write down all of our assets in Ukraine, including $16 million in receivables, due to the ongoing conflict between Russia and Ukraine. During the nine months ended September 30, 2021, we recognized $12 million of special items. These special items include $36 million of depreciation catch-up expense related to assets previously classified as held for sale related to our Pipeline and Process Services business, $15 million of severance costs, and $35 million of other items, partially offset by a $74 million gain related to the closing of a structured transaction for our North America real estate assets. See Note 2 to the condensed consolidated financial statements for further discussion on these charges.
Nonoperating Items
Loss on early extinguishment of debt
. During the nine months ended September 30, 2022, we recorded a $42 million loss on the early redemption of $600 million aggregate principal amount of our 3.8% senior notes in February of 2022, which included premiums and unamortized expenses. See Note 6 to the condensed consolidated financial statements for further information.
Effective tax rate
. During the nine months ended September 30, 2022, we recorded a total income tax provision of $338 million on a pre-tax income of $1.3 billion, resulting in an effective tax rate of 26.6%. The effective tax rate was higher than the nine months ended September 30, 2021 primarily due to the impact of the decision to sell our Russian operations and a corresponding increase in the valuation allowance on foreign tax credits. During the nine months ended September 30, 2021, we recorded a total income tax provision of $193 million on pre-tax income of $834 million, resulting in an effective tax rate of 23.2%.
HAL Q3 2022 FORM 10-Q | 22
| Part I. Item 2 | Forward-Looking Information | ||||||||
FORWARD-LOOKING INFORMATION
The Private Securities Litigation Reform Act of 1995 provides safe harbor provisions for forward-looking information. Forward-looking information is based on projections and estimates, not historical information. Some statements in this Form 10-Q are forward-looking and use words like “may,” “may not,” “believe,” “do not believe,” “plan,” “estimate,” “intend,” “expect,” “do not expect,” “anticipate,” “do not anticipate,” “should,” “likely,” and other expressions. We may also provide oral or written forward-looking information in other materials we release to the public. Forward-looking information involves risk and uncertainties and reflects our best judgment based on current information. Our results of operations can be affected by inaccurate assumptions we make or by known or unknown risks and uncertainties. In addition, other factors may affect the accuracy of our forward-looking information. As a result, no forward-looking information can be guaranteed. Actual events and the results of our operations may vary materially.
We do not assume any responsibility to publicly update any of our forward-looking statements regardless of whether factors change as a result of new information, future events or for any other reason. You should review any additional disclosures we make in our press releases and Forms 10-K, 10-Q, and 8-K filed with or furnished to the SEC. We also suggest that you listen to our quarterly earnings release conference calls with financial analysts.
Item 3. Quantitative and Qualitative Disclosures About Market Risk
For quantitative and qualitative disclosures about market risk, see Part II, Item 7(a), “Quantitative and Qualitative Disclosures About Market Risk,” in our 2021 Annual Report on Form 10-K. Our exposure to market risk has not changed materially since December 31, 2021.
Item 4. Controls and Procedures
In accordance with the Securities Exchange Act of 1934 Rules 13a-15 and 15d-15, we carried out an evaluation, under the supervision and with the participation of management, including our Chief Executive Officer and Chief Financial Officer, of the effectiveness of our disclosure controls and procedures as of the end of the period covered by this report. Based on that evaluation, our Chief Executive Officer and Chief Financial Officer concluded that our disclosure controls and procedures were effective as of September 30, 2022 to provide reasonable assurance that information required to be disclosed in our reports filed or submitted under the Exchange Act is recorded, processed, summarized, and reported within the time periods specified in the Securities and Exchange Commission’s rules and forms. Our disclosure controls and procedures include controls and procedures designed to ensure that information required to be disclosed in reports filed or submitted under the Exchange Act is accumulated and communicated to our management, including our Chief Executive Officer and Chief Financial Officer, as appropriate, to allow timely decisions regarding required disclosure.
There has been no change in our internal control over financial reporting that occurred during the quarter ended September 30, 2022 that has materially affected, or is reasonably likely to materially affect, our internal control over financial reporting.
HAL Q3 2022 FORM 10-Q | 23
| Part II. Item 1 | Legal Proceedings | ||||||||
PART II. OTHER INFORMATION
Item 1. Legal Proceedings
Information related to Item 1.
Legal Proceedings is included in Note 9 to the condensed consolidated financial statements.
Item 1(a). Risk Factors
The statements in this section describe the known material risks to our business and should be considered carefully. As of September 30, 2022, there have been no material changes in risk factors previously disclosed in our Annual Report on Form 10-K for the fiscal year ended December 31, 2021, as updated by our quarterly report on Form 10-Q for the fiscal quarter ended June 30, 2022.
HAL Q3 2022 FORM 10-Q | 24
| Part II. Item 2 | Unregistered Sales of Equity Securities and Use of Proceeds | |||||
Item 2. Unregistered Sales of Equity Securities and Use of Proceeds
Following is a summary of our repurchases of our common stock during the three months ended September 30, 2022.
| Period |
Total Number
of Shares Purchased (a) |
Average
Price Paid per Share |
Total Number
of Shares Purchased as Part of Publicly Announced Plans or Programs (b) |
Maximum
Number (or Approximate Dollar Value) of Shares that may yet be Purchased Under the Program (b) |
|||||||||||||
| July 1 - 31 | 468,948 | $28.92 | — | $5,100,008,081 | |||||||||||||
| August 1 - 31 | 31,459 | $29.64 | — | $5,100,008,081 | |||||||||||||
| September 1 - 30 | 10,663 | $28.52 | — | $5,100,008,081 | |||||||||||||
| Total | 511,070 | $28.95 | — | ||||||||||||||
| (a) |
All of the 511,070 shares purchased during the three-month period ended September 30, 2022 were acquired from employees in connection with the settlement of income tax and related benefit withholding obligations arising from vesting in restricted stock grants. These shares were not part of our publicly announced program to repurchase common stock.
|
||||||||||||||||
| (b) |
Our Board of Directors has authorized a program to repurchase our common stock from time to time. Approximately $5.1 billion remained authorized for repurchases as of September 30, 2022. From the inception of this program in February of 2006 through September 30, 2022, we repurchased approximately 224 million shares of our common stock for a total cost of approximately $9.0 billion. We did not repurchase any shares under this program during the three months ended September 30, 2022.
|
||||||||||||||||
Item 3. Defaults Upon Senior Securities
None.
Item 4. Mine Safety Disclosures
Our barite and bentonite mining operations, in support of our fluids services business, are subject to regulation by the U.S. Mine Safety and Health Administration under the Federal Mine Safety and Health Act of 1977. Information concerning mine safety violations or other regulatory matters required by section 1503(a) of the Dodd-Frank Wall Street Reform and Consumer Protection Act and Item 104 of Regulation S-K (17 CFR 229.104) is included in Exhibit 95 to this quarterly report.
Item 5. Other Information
None.
HAL Q3 2022 FORM 10-Q | 25
| Part II. Item 6 | Exhibits | ||||||||
Item 6. Exhibits
| * | 31.1 | |||||||
| * | 31.2 | |||||||
| ** | 32.1 | |||||||
| ** | 32.2 | |||||||
| * | 95 | |||||||
| * | 101.INS | XBRL Instance Document - the instance document does not appear in the Interactive Data File because its XBRL tags are embedded within the Inline XBRL document | ||||||
| * | 101.SCH | XBRL Taxonomy Extension Schema Document | ||||||
| * | 101.CAL | XBRL Taxonomy Extension Calculation Linkbase Document | ||||||
| * | 101.LAB | XBRL Taxonomy Extension Label Linkbase Document | ||||||
| * | 101.PRE | XBRL Taxonomy Extension Presentation Linkbase Document | ||||||
| * | 101.DEF | XBRL Taxonomy Extension Definition Linkbase Document | ||||||
| * | 104 | Cover Page Interactive Data File - the cover page interactive data file does not appear in the Interactive Data File because its XBRL tags are embedded within the Inline XBRL document | ||||||
| * | Filed with this Form 10-Q. | |||||||
| ** | Furnished with this Form 10-Q. | |||||||
HAL Q3 2022 FORM 10-Q | 26
SIGNATURES
As required by the Securities Exchange Act of 1934, the registrant has authorized this report to be signed on behalf of the registrant by the undersigned authorized individuals.
HALLIBURTON COMPANY
| /s/ Eric J. Carre | /s/ Charles E. Geer, Jr. | ||||
| Eric J. Carre | Charles E. Geer, Jr. | ||||
| Executive Vice President and | Senior Vice President and | ||||
| Chief Financial Officer | Chief Accounting Officer | ||||
Date: October 26, 2022
HAL Q3 2022 FORM 10-Q | 27
TABLE OF CONTENTS
Part I. Financial InformationItem 1. Financial StatementsNote 1. Basis Of PresentationNote 2. Impairments and Other ChargesNote 3. Business Segment InformationNote 4. RevenueNote 5. InventoriesNote 6. DebtNote 7. Income TaxesNote 8. Shareholders EquityNote 9. Commitments and ContingenciesNote 10. Income Per ShareNote 11. Fair Value Of Financial InstrumentsItem 2. Management's Discussion and Analysis Of Financial Condition and Results Of OperationsItem 3. Quantitative and Qualitative Disclosures About Market RiskItem 4. Controls and ProceduresPart II. Other InformationItem 1. Legal ProceedingsItem 1(a). Risk FactorsItem 2. Unregistered Sales Of Equity Securities and Use Of ProceedsItem 3. Defaults Upon Senior SecuritiesItem 4. Mine Safety DisclosuresItem 5. Other InformationItem 6. Exhibits