HALOZYME THERAPEUTICS, INC.
10-Ks and 10-Qs
|
|
|
|
|
|
|
|
|
|
|
|
|
|
|
|
|
|
|
|
|
|
|
|
|
|
|
|
|
|
|
|
|
|
|
|
|
|
|
|
|
|
|
|
|
|
|
|
|
|
|
|
|
|
|
|
UNITED STATES
SECURITIES AND EXCHANGE COMMISSION
Washington, D.C. 20549
FORM 10-Q
(Mark One)
|
ý
|
QUARTERLY REPORT PURSUANT TO SECTION 13 OR 15(d) OF THE SECURITIES EXCHANGE ACT OF 1934
|
For the quarterly period ended
September 30, 2018
OR
|
¨
|
TRANSITION REPORT PURSUANT TO SECTION 13 OR 15(d) OF THE SECURITIES EXCHANGE ACT OF 1934
|
For the transition period from to
Commission File Number 001-32335
___________________________
HALOZYME THERAPEUTICS, INC.
(
Exact name of registrant as specified in its charter
)
___________________________
|
Delaware
|
|
88-0488686
|
|
(State or other jurisdiction of incorporation or organization)
|
|
(I.R.S. Employer Identification No.)
|
|
11388 Sorrento Valley Road, San Diego, CA
|
|
92121
|
|
(Address of principal executive offices)
|
|
(Zip Code)
|
(858) 794-8889
(Registrant’s telephone number, including area code)
Indicate by check mark whether the registrant: (1) has filed all reports required to be filed by Section 13 or 15(d) of the Securities Exchange Act of 1934 during the preceding 12 months (or for such shorter period that the registrant was required to file such reports), and (2) has been subject to such filing requirements for the past 90 days. Yes
x
No
¨
Indicate by check mark whether the registrant has submitted electronically every Interactive Data File required to be submitted pursuant to Rule 405 of Regulation S-T (§232.405 of this chapter) during the preceding 12 months (or for such shorter period that the registrant was required to submit such files). Yes
x
No
¨
Indicate by check mark whether the registrant is a large accelerated filer, an accelerated filer, a non-accelerated filer or a smaller reporting company. See the definitions of “large accelerated filer,” “accelerated filer,” “smaller reporting company” and “emerging growth company” in Rule 12b-2 of the Exchange Act. (Check one):
|
Large accelerated filer
x
|
Accelerated filer
¨
|
|
Non-accelerated filer
¨
|
Smaller reporting company
¨
|
Emerging growth company
¨
|
|
(Do not check if a smaller reporting company)
|
|||||
|
If an emerging growth company, indicate by check mark if the registrant has elected not to use the extended transition period for complying with any new or revised financial accounting standards provided pursuant to Section 13(a) of the Exchange Act.
¨
|
|||||
Indicate by check mark whether the registrant is a shell company (as defined in Rule 12b-2 of the Exchange Act). Yes
¨
No
x
The number of outstanding shares of the registrant’s common stock, par value $0.001 per share, was
144,557,543
as of
October 30, 2018
.
HALOZYME THERAPEUTICS, INC.
INDEX
|
|
|
Page
|
||
|
Item 1.
|
||||
|
Item 2.
|
||||
|
Item 3.
|
||||
|
Item 4.
|
||||
|
Item 1.
|
||||
|
Item 1A.
|
||||
|
Item 2.
|
||||
|
Item 3.
|
||||
|
Item 4.
|
||||
|
Item 5.
|
||||
|
Item 6.
|
||||
2
|
Item 1.
|
Financial Statements
|
HALOZYME THERAPEUTICS, INC.
(Unaudited)
(In thousands, except per share amounts)
|
September 30,
2018 |
December 31,
2017 |
|||||||
|
ASSETS
|
||||||||
|
Current assets:
|
||||||||
|
Cash and cash equivalents
|
$
|
55,019
|
|
$
|
168,740
|
|
||
|
Marketable securities, available-for-sale
|
309,347
|
|
300,474
|
|
||||
|
Accounts receivable, net and other contract assets
|
27,656
|
|
22,133
|
|
||||
|
Inventories
|
18,285
|
|
5,146
|
|
||||
|
Prepaid expenses and other assets
|
19,619
|
|
13,879
|
|
||||
|
Total current assets
|
429,926
|
|
510,372
|
|
||||
|
Property and equipment, net
|
6,790
|
|
3,520
|
|
||||
|
Prepaid expenses and other assets
|
7,291
|
|
5,553
|
|
||||
|
Restricted cash
|
500
|
|
500
|
|
||||
|
Total assets
|
$
|
444,507
|
|
$
|
519,945
|
|
||
|
LIABILITIES AND STOCKHOLDERS’ EQUITY
|
||||||||
|
Current liabilities:
|
||||||||
|
Accounts payable
|
$
|
3,331
|
|
$
|
7,948
|
|
||
|
Accrued expenses
|
43,020
|
|
39,601
|
|
||||
|
Deferred revenue, current portion
|
4,247
|
|
6,568
|
|
||||
|
Current portion of long-term debt, net
|
88,521
|
|
77,211
|
|
||||
|
Total current liabilities
|
139,119
|
|
131,328
|
|
||||
|
Deferred revenue, net of current portion
|
5,507
|
|
54,297
|
|
||||
|
Long-term debt, net
|
57,940
|
|
125,140
|
|
||||
|
Other long-term liabilities
|
2,203
|
|
814
|
|
||||
|
Commitments and contingencies (Note 9)
|
|
|
||||||
|
Stockholders’ equity:
|
||||||||
|
Preferred stock - $0.001 par value; 20,000 shares authorized; no shares
issued and outstanding
|
—
|
|
—
|
|
||||
|
Common stock - $0.001 par value; 200,000 shares authorized; 144,522 and
142,789 shares issued and outstanding at September 30, 2018 and
December 31, 2017, respectively
|
145
|
|
143
|
|
||||
|
Additional paid-in capital
|
769,382
|
|
731,044
|
|
||||
|
Accumulated other comprehensive loss
|
(478
|
)
|
(450
|
)
|
||||
|
Accumulated deficit
|
(529,311
|
)
|
(522,371
|
)
|
||||
|
Total stockholders’ equity
|
239,738
|
|
208,366
|
|
||||
|
Total liabilities and stockholders’ equity
|
$
|
444,507
|
|
$
|
519,945
|
|
||
See accompanying notes to condensed consolidated financial statements.
3
HALOZYME THERAPEUTICS, INC.
(Unaudited)
(In thousands, except per share amounts)
|
Three Months Ended
September 30, |
Nine Months Ended
September 30, |
|||||||||||||||
|
|
2018
|
2017
|
2018
|
2017
|
||||||||||||
|
Revenues:
|
||||||||||||||||
|
Royalties
|
$
|
18,710
|
|
$
|
17,119
|
|
$
|
59,643
|
|
$
|
45,839
|
|
||||
|
Product sales, net
|
6,269
|
|
13,589
|
|
17,553
|
|
37,803
|
|
||||||||
|
Revenues under collaborative agreements
|
577
|
|
33,023
|
|
14,434
|
|
43,407
|
|
||||||||
|
Total revenues
|
25,556
|
|
63,731
|
|
91,630
|
|
127,049
|
|
||||||||
|
Operating expenses:
|
||||||||||||||||
|
Cost of product sales
|
626
|
|
8,332
|
|
4,514
|
|
23,664
|
|
||||||||
|
Research and development
|
35,540
|
|
33,993
|
|
113,602
|
|
109,267
|
|
||||||||
|
Selling, general and administrative
|
14,864
|
|
13,329
|
|
42,773
|
|
39,045
|
|
||||||||
|
Total operating expenses
|
51,030
|
|
55,654
|
|
160,889
|
|
171,976
|
|
||||||||
|
Operating (loss) income
|
(25,474
|
)
|
8,077
|
|
(69,259
|
)
|
(44,927
|
)
|
||||||||
|
Other income (expense):
|
||||||||||||||||
|
Investment and other income, net
|
1,910
|
|
790
|
|
5,561
|
|
1,512
|
|
||||||||
|
Interest expense
|
(4,286
|
)
|
(5,538
|
)
|
(14,286
|
)
|
(16,526
|
)
|
||||||||
|
Net (loss) income before income taxes
|
(27,850
|
)
|
3,329
|
|
(77,984
|
)
|
(59,941
|
)
|
||||||||
|
Income tax expense
|
—
|
|
580
|
|
220
|
|
970
|
|
||||||||
|
Net (loss) income
|
$
|
(27,850
|
)
|
$
|
2,749
|
|
$
|
(78,204
|
)
|
$
|
(60,911
|
)
|
||||
|
Net (loss) income per share:
|
||||||||||||||||
|
Basic
|
$
|
(0.19
|
)
|
$
|
0.02
|
|
$
|
(0.55
|
)
|
$
|
(0.45
|
)
|
||||
|
Diluted
|
$
|
(0.19
|
)
|
$
|
0.02
|
|
$
|
(0.55
|
)
|
$
|
(0.45
|
)
|
||||
|
Shares used in computing net (loss) income per share:
|
||||||||||||||||
|
Basic
|
143,949
|
|
141,190
|
|
143,396
|
|
134,633
|
|
||||||||
|
Diluted
|
143,949
|
|
143,236
|
|
143,396
|
|
134,633
|
|
||||||||
See accompanying notes to condensed consolidated financial statements.
4
HALOZYME THERAPEUTICS, INC.
CONDENSED CONSOLIDATED STATEMENTS OF COMPREHENSIVE (LOSS) INCOME
(Unaudited)
(In thousands)
|
Three Months Ended
September 30, |
Nine Months Ended
September 30, |
|||||||||||||||
|
2018
|
2017
|
2018
|
2017
|
|||||||||||||
|
Net (loss) income
|
$
|
(27,850
|
)
|
$
|
2,749
|
|
$
|
(78,204
|
)
|
$
|
(60,911
|
)
|
||||
|
Other comprehensive income (loss):
|
||||||||||||||||
|
Unrealized gain (loss) on marketable securities
|
256
|
|
24
|
|
(17
|
)
|
(40
|
)
|
||||||||
|
Foreign currency translation adjustment
|
2
|
|
1
|
|
(11
|
)
|
(6
|
)
|
||||||||
|
Unrealized loss on foreign currency
|
—
|
|
(17
|
)
|
—
|
|
(1
|
)
|
||||||||
|
Total comprehensive (loss) income
|
$
|
(27,592
|
)
|
$
|
2,757
|
|
$
|
(78,232
|
)
|
$
|
(60,958
|
)
|
||||
See accompanying notes to condensed consolidated financial statements.
5
HALOZYME THERAPEUTICS, INC.
(Unaudited)
(In thousands)
|
Nine Months Ended
September 30, |
||||||||
|
|
2018
|
2017
|
||||||
|
Operating activities:
|
||||||||
|
Net loss
|
$
|
(78,204
|
)
|
$
|
(60,911
|
)
|
||
|
Adjustments to reconcile net loss to net cash used in operating activities:
|
||||||||
|
Share-based compensation
|
26,684
|
|
23,268
|
|
||||
|
Depreciation and amortization
|
1,798
|
|
1,668
|
|
||||
|
Non-cash interest expense
|
2,000
|
|
2,378
|
|
||||
|
Accretion of discounts on marketable securities, net
|
(2,166
|
)
|
(94
|
)
|
||||
|
Deferral of unearned revenue
|
3,000
|
|
422
|
|
||||
|
Recognition of deferred revenue
|
(2,333
|
)
|
(4,192
|
)
|
||||
|
Deferral (recognition) of rent expense
|
78
|
|
(125
|
)
|
||||
|
Other
|
(10
|
)
|
38
|
|
||||
|
Changes in operating assets and liabilities:
|
||||||||
|
Accounts receivable, net and other contract assets
|
13,962
|
|
985
|
|
||||
|
Inventories
|
(13,139
|
)
|
5,292
|
|
||||
|
Prepaid expenses and other assets
|
(7,477
|
)
|
8,998
|
|
||||
|
Accounts payable and accrued expenses
|
(4,155
|
)
|
3,077
|
|
||||
|
Net cash used in operating activities
|
(59,962
|
)
|
(19,196
|
)
|
||||
|
Investing activities:
|
||||||||
|
Purchases of marketable securities
|
(272,643
|
)
|
(198,748
|
)
|
||||
|
Proceeds from maturities of marketable securities
|
265,917
|
|
184,494
|
|
||||
|
Purchases of property and equipment
|
(1,590
|
)
|
(490
|
)
|
||||
|
Net cash used in investing activities
|
(8,316
|
)
|
(14,744
|
)
|
||||
|
Financing activities:
|
||||||||
|
Proceeds from issuance of common stock, net
|
—
|
|
134,875
|
|
||||
|
Repayment of long-term debt
|
(57,099
|
)
|
(10,988
|
)
|
||||
|
Proceeds from issuance of common stock under equity incentive plans, net of taxes paid related to net share settlement
|
11,656
|
|
7,686
|
|
||||
|
Net cash (used in) provided by financing activities
|
(45,443
|
)
|
131,573
|
|
||||
|
Net (decrease) increase in cash, cash equivalents and restricted cash
|
(113,721
|
)
|
97,633
|
|
||||
|
Cash, cash equivalents and restricted cash at beginning of period
|
169,240
|
|
67,264
|
|
||||
|
Cash, cash equivalents and restricted cash at end of period
|
$
|
55,519
|
|
$
|
164,897
|
|
||
|
Supplemental disclosure of non-cash investing and financing activities:
|
||||||||
|
Amounts accrued for purchases of property and equipment
|
$
|
2,345
|
|
$
|
266
|
|
||
|
Leasehold improvements paid by lessor
|
$
|
1,322
|
|
$
|
—
|
|
||
See accompanying notes to condensed consolidated financial statements.
6
HALOZYME THERAPEUTICS, INC.
NOTES TO CONDENSED CONSOLIDATED FINANCIAL STATEMENTS
(Unaudited)
1. Organization and Business
Halozyme Therapeutics, Inc. is a biotechnology company focused on developing and commercializing novel oncology therapies. We are seeking to translate our unique knowledge of the tumor microenvironment to create therapies that have the potential to improve cancer patient survival. Our research primarily focuses on human enzymes that alter the extracellular matrix and tumor microenvironment. The extracellular matrix is a complex matrix of proteins and carbohydrates surrounding the cell that provides structural support in tissues and orchestrates many important biological activities, including cell migration, signaling and survival. Over many years, we have developed unique technology and scientific expertise enabling us to pursue this target-rich environment for the development of therapies.
Our proprietary enzymes are used to facilitate the delivery of injected drugs and fluids, potentially enhancing the efficacy and the convenience of other drugs or can be used to alter tissue structures for potential clinical benefit. We exploit our technology and expertise using a two pillar strategy that we believe enables us to manage risk and cost by: (1) developing our own proprietary products in therapeutic areas with significant unmet medical needs, with a focus on oncology, and (2) licensing our technology to biopharmaceutical companies to collaboratively develop products that combine our technology with the collaborators’ proprietary compounds.
The majority of our approved product and product candidates are based on rHuPH20, our patented recombinant human hyaluronidase enzyme. rHuPH20 is the active ingredient in our first commercially approved product,
Hylenex
®
recombinant, and it works by temporarily breaking down hyaluronan (or “HA”), a naturally occurring carbohydrate that is a major component of the extracellular matrix in tissues throughout the body such as skin and cartilage. We believe this temporary degradation creates an opportunistic window for the improved subcutaneous delivery of injectable biologics, such as monoclonal antibodies and other large therapeutic molecules, as well as small molecules and fluids. We refer to the application of rHuPH20 to facilitate the delivery of other drugs or fluids as our ENHANZE
®
Drug Delivery Technology (“ENHANZE”). We license the ENHANZE technology to form collaborations with biopharmaceutical companies that develop or market drugs requiring or benefiting from injection via the subcutaneous route of administration.
We currently have ENHANZE collaborations with F. Hoffmann-La Roche, Ltd. and Hoffmann-La Roche, Inc. (“Roche”), Baxalta US Inc. and Baxalta GmbH (Baxalta Incorporated was acquired by Shire plc in June 2016) (“Baxalta”), Pfizer Inc. (“Pfizer”), Janssen Biotech, Inc. (“Janssen”), AbbVie, Inc. (“AbbVie”), Eli Lilly and Company (“Lilly”), Bristol-Myers Squibb Company (“BMS”) and Alexion Pharma Holding (“Alexion”).We receive royalties from two of these collaborations, including royalties from sales of one product from the Baxalta collaboration and two products from the Roche collaboration. Future potential revenues from the sales and/or royalties of our approved products, product candidates, and ENHANZE collaborations will depend on the ability of Halozyme and our collaborators to develop, manufacture, secure and maintain regulatory approvals for approved products and product candidates and commercialize product candidates.
Our proprietary development pipeline consists primarily of pre-clinical and clinical stage product candidates in oncology. Our lead oncology program is Pegvorhyaluronidase alfa (PVHA), also referred to as PEGylated recombinant human hyaluronidase (“PEGPH20”), a molecular entity we are developing in combination with currently approved cancer therapies as a candidate for the systemic treatment of tumors that accumulate HA. We have demonstrated that when HA accumulates in a tumor, it can cause increased pressure in the tumor, reducing blood flow into the tumor and with that, reduced access of cancer therapies to the tumor. PEGPH20 has been demonstrated in animal models to work by temporarily degrading HA surrounding cancer cells resulting in reduced pressure and increased blood flow to the tumor thereby enabling increased amounts of anticancer treatments administered concomitantly gaining access to the tumor. Through our efforts and efforts of our partners and collaborators, we are currently in Phase 3 clinical testing for PEGPH20 with ABRAXANE
®
(nab-paclitaxel) and gemcitabine in stage IV pancreatic ductal adenocarcinoma (“PDA”) (HALO 109-301), in Phase 1b clinical testing for
PEGPH20 with KEYTRUDA
®
(pembrolizumab) in
7
non-small cell lung cancer and gastric cancer (HALO 107-101), in Phase 1b/2 clinical testing for PEGPH20 with Tecentriq® (atezolizumab) in patients with previously treated metastatic PDA, in Phase 1b/2 clinical testing for PEGPH20 with Tecentriq in patients with gastric cancer and in Phase 1b/2 clinical testing for PEGPH20 with Tecentriq in patients with cholangiocarcinoma and gall bladder cancer (HALO 110-101/MATRIX).
Except where specifically noted or the context otherwise requires, references to “Halozyme,” “the Company,” “we,” “our,” and “us” in these notes to condensed consolidated financial statements refer to Halozyme Therapeutics, Inc. and its wholly owned subsidiary, Halozyme, Inc., and Halozyme, Inc.’s wholly owned subsidiaries, Halozyme Holdings Ltd., Halozyme Royalty LLC, Halozyme Switzerland GmbH and Halozyme Switzerland Holdings GmbH.
2. Summary of Significant Accounting Policies
Basis of Presentation
The accompanying interim unaudited condensed consolidated financial statements have been prepared in accordance with United States generally accepted accounting principles (“U.S. GAAP”) and with the rules and regulations of the U.S. Securities and Exchange Commission (“SEC”) related to a quarterly report on Form 10-Q. Accordingly, they do not include all of the information and disclosures required by U.S. GAAP for a complete set of financial statements. These interim unaudited condensed consolidated financial statements and notes thereto should be read in conjunction with the audited consolidated financial statements and notes thereto included in our Annual Report on Form 10-K for the year ended
December 31, 2017
, filed with the SEC on February 20, 2018. The unaudited financial information for the interim periods presented herein reflects all adjustments which, in the opinion of management, are necessary for a fair presentation of the financial condition and results of operations for the periods presented, with such adjustments consisting only of normal recurring adjustments. Certain reclassifications have been made to the prior period condensed consolidated statement of cash flows within operating activities to conform to the current period presentation. There was no change to net cash used in operating activities. Operating results for interim periods are not necessarily indicative of the operating results for an entire fiscal year.
The accompanying condensed consolidated financial statements include the accounts of Halozyme Therapeutics, Inc. and our wholly owned subsidiary, Halozyme, Inc., and Halozyme, Inc.’s wholly owned subsidiaries, Halozyme Holdings Ltd., Halozyme Royalty LLC, Halozyme Switzerland GmbH and Halozyme Switzerland Holdings GmbH. All intercompany accounts and transactions have been eliminated.
Use of Estimates
The preparation of consolidated financial statements in conformity with U.S. GAAP requires management to make estimates and assumptions that affect the amounts reported in our consolidated financial statements and accompanying notes. On an ongoing basis, we evaluate our estimates and judgments, which are based on historical and anticipated results and trends and on various other assumptions that management believes to be reasonable under the circumstances. By their nature, estimates are subject to an inherent degree of uncertainty and, as such, actual results may differ from management’s estimates.
Cash Equivalents and Marketable Securities
Cash equivalents consist of highly liquid investments, readily convertible to cash, that mature within ninety days or less from the date of purchase. As of
September 30, 2018
, our cash equivalents consisted of money market funds and commercial paper.
Marketable securities are investments with original maturities of more than ninety days from the date of purchase that are specifically identified to fund current operations. Marketable securities are considered available-for-sale. These investments are classified as current assets, even though the stated maturity date may be one year or more beyond the current balance sheet date which reflects management’s intention to use the proceeds from the sale of these investments to fund our operations, as necessary. Such available-for-sale investments are carried at fair value with unrealized gains and losses recorded in other comprehensive gain (loss) and included as a separate component of stockholders’ equity (deficit). The cost of marketable securities is adjusted
8
for amortization of premiums or accretion of discounts to maturity, and such amortization or accretion is included in investment and other income, net in the condensed consolidated statements of operations. We use the specific identification method for calculating realized gains and losses on marketable securities sold. Realized gains and losses and declines in value judged to be other-than-temporary on marketable securities, if any, are included in investment and other income, net in the consolidated statements of operations.
Restricted Cash
Under the terms of the leases of our facilities, we are required to maintain letters of credit as security deposits during the terms of such leases. At
September 30, 2018
and
December 31, 2017
, restricted cash of
$0.5 million
was pledged as collateral for the letters of credit.
Fair Value of Financial Instruments
The authoritative guidance for fair value measurements establishes a three tier fair value hierarchy, which prioritizes the inputs used in measuring fair value. These tiers include: Level 1, defined as observable inputs such as quoted prices in active markets; Level 2, defined as inputs other than quoted prices in active markets that are either directly or indirectly observable; and Level 3, defined as unobservable inputs in which little or no market data exists, therefore requiring an entity to develop its own assumptions.
Our financial instruments include cash equivalents, available-for-sale marketable securities, accounts receivable, prepaid expenses and other assets, accounts payable, accrued expenses and long-term debt. Fair value estimates of these instruments are made at a specific point in time, based on relevant market information. These estimates may be subjective in nature and involve uncertainties and matters of significant judgment and therefore cannot be determined with precision. The carrying amount of cash equivalents, accounts receivable, prepaid expenses and other assets, accounts payable and accrued expenses are generally considered to be representative of their respective fair values because of the short-term nature of those instruments. Based on Level 3 inputs and the borrowing rates currently available for loans with similar terms, we believe the fair value of long-term debt approximates its carrying value.
Available-for-sale marketable securities consist of asset-backed securities, corporate debt securities, U.S. Treasury securities and commercial paper, and are measured at fair value using Level 1 and Level 2 inputs. Level 2 financial instruments are valued using market prices on less active markets and proprietary pricing valuation models with observable inputs, including interest rates, yield curves, maturity dates, issue dates, settlement dates, reported trades, broker-dealer quotes, issue spreads, benchmark securities or other market related data. We obtain the fair value of Level 2 investments from our investment manager, who obtains these fair values from a third-party pricing source. We validate the fair values of Level 2 financial instruments provided by our investment manager by comparing these fair values to a third-party pricing source.
Inventories
Inventories are stated at lower of cost or net realizable value. Cost is determined on a first-in, first-out basis. Net realizable value is the estimated selling price in the ordinary course of business, less reasonably predictable costs of completion, disposal, and transportation. Inventories are reviewed periodically for potential excess, dated or obsolete status. We evaluate the carrying value of inventories on a regular basis, taking into account such factors as historical and anticipated future sales compared to quantities on hand, the price we expect to obtain for products in their respective markets compared with historical cost and the remaining shelf life of goods on hand.
We capitalize inventory costs associated with our drug candidates prior to receipt of regulatory approval, based on management’s judgment of probable future commercialization. We would be required to expense these capitalized costs upon a change in such judgment, due to, among other factors, a decision denying approval of the drug candidate by regulatory agencies.
9
Bulk rHuPH20 formulations manufactured for partner use prior to our partner receiving marketing approval from the U.S. Food and Drug Administration (“FDA”) or comparable regulatory agencies in foreign countries and with no alternative future use are recorded as research and development expense. All direct manufacturing costs incurred after the partner receives marketing approval are capitalized as inventory. Bulk rHuPH20 formulations manufactured for general partner and internal use, which can potentially be used by any collaboration partner or by us in any stage of development or in commercial product, and ENHANZE drug product used by our partners in clinical trials, is considered to have alternative future use and all manufacturing costs are capitalized as inventory. Inventories used in our clinical trials are expensed at the time the inventories are packaged for the clinical trials.
As of
September 30, 2018
and
December 31, 2017
, inventories consisted of
$2.4 million
and
$2.9 million
, respectively, of
Hylenex
recombinant inventory, net and
$15.9 million
and
$2.2 million
, respectively, of bulk rHuPH20.
Revenue Recognition
We generate revenues from payments received under collaborative agreements and product sales. As of January 1, 2018, we adopted ASC 606,
Revenue from Contracts with Customers
(ASC 606) which affects how we recognize revenues in these arrangements. We applied the provisions of ASC 606 using the modified retrospective approach, with the cumulative effect of the adoption recognized as of January 1, 2018, to all contracts that had not been completed as of that date. Under ASC 606, we recognize revenue when we transfer promised goods or services to customers in an amount that reflects the consideration to which we expect to be entitled in exchange for those goods or services. To determine revenue recognition for contracts with customers we perform the following five steps: (i) identify the promised goods or services in the contract; (ii) identify the performance obligations in the contract, including whether they are distinct in the context of the contract; (iii) determine the transaction price, including the constraint on variable consideration; (iv) allocate the transaction price to the performance obligations in the contract; and (v) recognize revenue when (or as) we satisfy the performance obligations. Amounts reported in prior periods have not been adjusted. Accordingly, the reported revenue amounts for the
three and nine months ended
September 30, 2018
and
2017
are based on different accounting policies.
Prior to the ASC 606 adoption, revenue was recognized when all of the following criteria were met: (1) persuasive evidence of an arrangement exists; (2) delivery has occurred or services have been rendered; (3) the seller’s price to the buyer is fixed or determinable; and (4) collectibility is reasonably assured. Differences between the revenue recognition policies applicable prior to the adoption and ASC 606 are described in the following sections and in Note 4.
Revenues under Collaborative Agreements - as reported under ASC 606 beginning January 1, 2018
Under these agreements, we grant the collaboration partner a worldwide license to develop and commercialize products using our ENHANZE technology to combine our patented rHuPH20 enzyme with their proprietary biologics directed at up to a specified number of targets. Targets are usually licensed on an exclusive, global basis. Targets selected subsequent to inception of the arrangement require payment of an additional license fee. The collaboration partner is responsible for all development, manufacturing, clinical, regulatory, sales and marketing costs for any products developed under the agreement. We are responsible for supply of bulk rHuPH20 based on the collaboration partner’s purchase orders, and may also be separately engaged to perform research and development services.
We collect an upfront license payment from the collaboration partner, and are also entitled to receive event-based payments subject to the collaboration partner’s achievement of specified development, regulatory and sales-based milestones. In several agreements, collaboration partners pay us annual fees to maintain their exclusive license rights if they are unable to advance product development to specified stages. We earn separate fees for bulk rHuPH20 supplies and research and development services. In addition, the collaboration partner will pay us royalties at an on average mid-single digit percent rate of their sales if products under the collaboration are commercialized. All amounts owed to us are noncancelable after the underlying triggering event occurs,
10
and nonrefundable once paid. Unless terminated earlier in accordance with its terms, the collaboration continues in effect until the later of: (i) expiration of the last to expire of the valid claims of our patents covering rHuPH20 or other specified patents developed under the collaboration which valid claim covers a product developed under the collaboration, and (ii) expiration of the last to expire royalty term for a product developed under the collaboration, which is determined separately for each country. In the event such valid claims expire prior to the last to expire royalty term, the royalty rate is reduced for the remaining royalty term following such expiration. The collaboration partner may terminate the agreement prior to expiration for any reason in its entirety or on a target-by-target basis generally upon 90 days prior written notice to us. Upon any such termination, the license granted to the collaboration partner (in total or with respect to the terminated target, as applicable) will terminate provided, however, that in the event of expiration of the agreement, the licenses granted will become perpetual, non-exclusive and fully paid.
Although these agreements are in form structured as collaborative agreements, we concluded for accounting purposes they represent contracts with customers, and are not subject to accounting literature on collaborative arrangements. This is because we grant to collaboration partners licenses to our intellectual property, and provide supply of bulk rHuPH20 and research and development services which are all outputs of our ongoing activities, in exchange for consideration. We do not develop assets jointly with collaboration partners, and do not share in significant risks of their development or commercialization activities. Accordingly, we concluded our collaborative agreements must be accounted for pursuant to ASC Topic 606, Revenue from Contracts with Customers.
Under all of our collaborative agreements, we have identified licenses to use functional intellectual property as the only performance obligation. The intellectual property underlying the license is our proprietary ENHANZE
®
technology which represents application of rHuPH20 to facilitate delivery of drugs or fluids. The license grants the collaboration partners right to use our intellectual property as it exists on the effective date of the license, because there is no ongoing development of the ENHANZE technology required. Therefore, we recognize revenue from licenses at the point when the license becomes effective and the collaboration partner has received access to our intellectual property, usually at the inception of the agreement.
When collaboration partners can select additional targets to add to the licenses granted, we consider these rights to be options. We evaluate whether such options contain material rights, i.e. have exercise prices that are discounted compared to what we would charge for a similar license to a new collaboration partner. The exercise price of these options includes a combination of the target selection fees, event-based milestone payments and royalties. When these amounts in aggregate are not offered at a discount that exceeds discounts available to other customers, we conclude the option does not contain a material right, and we consider grants of additional licensing rights upon option exercises to be separate contracts (target selection contracts).
We provide standard indemnification and protection of licensed intellectual property for our customers. These provisions are part of assurance that the licenses meet the agreements representations and are not obligations to provide goods or services.
We also fulfill purchase orders for supply of bulk rHuPH20 and perform research and development services pursuant to projects authorization forms for our collaboration partners, which represent separate contracts. Additionally, we price our supply of bulk rHuPH20 and research and development services at our regular selling prices, called standalone selling price or SSP. Therefore, our collaboration partners do not have material rights to order these items at prices not reflective of SSP. Refer to the discussion below regarding recognition of revenue for these separate contracts.
Transaction price for a contract represents the amount to which we are entitled in exchange for providing goods and services to the customer. Transaction price does not include amounts subject to uncertainties unless it is probable that there will be no significant reversal of revenue when the uncertainty is resolved. Apart from the upfront license payment (or target selection fees in the target selection contracts), all other fees we may earn under our collaborative agreements are subject to significant uncertainties of product development. Achievement of many of the event-based development and regulatory milestones may not be probable until such milestones are actually achieved. This generally relates to milestones such as obtaining marketing authorization approvals
11
and successful completion of clinical trials. With respect to other development milestones, e.g. dosing of a first patient in a clinical trial, achievement could be considered probable prior to its actual occurrence, based on the progress towards commencement of the trial. We do not include any amounts subject to uncertainties into the transaction price until it is probable that the amount will not result in a significant reversal of revenue in the future. At the end of each reporting period, we re-evaluate the probability of achievement of such milestones and any related constraint, and if necessary, adjust our estimate of the overall transaction price.
When target exchange rights are held by collaboration partners, and the amounts attributed to these rights are not refundable, they are included in the transaction price. However, they are recorded as deferred revenues because we have a potential performance obligation to provide a new target if the exchange right is exercised. These amounts are recognized in revenue when the right of exchange expires or is exercised.
Because our agreements only have one type of performance obligation (licenses) which are typically all transferred at the same time at agreement inception, allocation of transaction price often is not required. However, allocation is required when licenses for some of the individual targets are subject to rights of exchange, because revenue associated with these targets cannot be recognized. We perform an allocation of the upfront amount based on relative SSP of licenses for individual targets. We determine license SSP using income-based valuation approach utilizing risk-adjusted discounted cash flow projections of the estimated return a licensor would receive. When amounts subject to uncertainties, such as milestones and royalties, are included in the transaction price, we attribute them to the specific individual target licenses which generate such milestone or royalty amounts.
We also estimate SSP of bulk rHuPH20 and research and development services, to determine that our collaboration partners do not have material rights to order them at discounted prices. For supplies of bulk rHuPH20, because we effectively act as a contract manufacturer to our collaboration partners, we estimate and charge SSP based on the typical contract manufacturer margins consistently with all of our collaborative partners. We determine SSP of research and development services based on a fully-burdened labor rate. Our rates are comparable to those we observe in other collaborative agreements. We also have a history of charging similar rates to all of our collaboration partners.
Upfront amounts allocated to licenses to individual targets are recognized as revenue when the license is transferred to the collaboration partner, as discussed above, if the license is not subject to exchange rights, or when the exchange right expires or is exercised. Development milestones and other fees are recognized in revenue when they are included in the transaction price, because by that time we have already transferred the related license to the collaboration partner.
Sales-based milestones and royalties cannot be recognized until the underlying sales occur. We do not receive final royalty reports from our collaboration partners until after we complete our financial statements for a prior quarter. Therefore, we recognize revenue based on estimates of the royalty earned, which are based on preliminary reports provided by our collaboration partners. We will record a true-up in the following quarter if necessary, when final royalty reports are received. To date, we have not recorded any material true-ups.
In contracts to provide research and development services, such services represent the only performance obligation. The fees are charged based on hours worked by our employees and the fixed contractual rate per hour, plus third-party pass-through costs, on a monthly basis. We recognize revenues as the related services are performed based on the amounts billed, as the collaboration partner consumes the benefit of research and development work simultaneously as we perform these services, and the amounts billed reflect the value of these services to the customer.
Refer to Note 4
Revenue
, for further discussion on our collaborative arrangements.
Prior to the adoption of ASC 606 on January 1, 2018, we recognized upfront amounts received under two of our collaborative agreements straight-line over the contract term in accordance with the accounting standards that were in effect in 2006-2007, when these collaborative agreements were entered into. In addition, we recognized royalty revenue in the period when we received final
12
royalty reports from the collaboration partners, in the quarter following the quarter in which the corresponding sales occurred. There were no other differences in revenue to be recognized under the previously existing authoritative accounting literature and ASC 606 applied to our collaborative agreements.
Product Sales,
Net - as reported under ASC 606 beginning January 1, 2018
Hylenex
Recombinant
We sell
Hylenex
recombinant in the U.S. to wholesale pharmaceutical distributors, who sell the product to hospitals and other end-user customers. Sales to wholesalers are made pursuant to purchase orders subject to the terms of a master agreement, and delivery of individual packages of
Hylenex
recombinant represent performance obligations under each purchase order. We use a contract manufacturer to produce
Hylenex
recombinant and a third-party logistics (3PL) vendor to process and fulfill orders
.
We concluded we are the principal in the sales to wholesalers because we control access to services rendered by both vendors and direct their activities. We have no significant obligations to wholesalers to generate pull-through sales.
Selling prices initially billed to wholesalers are subject to discounts for prompt payment and subsequent chargebacks when wholesalers sell
Hylenex
recombinant at negotiated discounted prices to members of certain group purchasing organizations (“GPOs”) and government programs. We also pay quarterly distribution fees to certain wholesalers for inventory reporting and chargeback processing, and to GPOs for access to GPO members. We concluded the benefits received in exchange for these fees are not distinct from our sales of
Hylenex
recombinant, and accordingly we apply these amounts to reduce revenues. Wholesalers also have rights to return unsold product nearing or past the expiration date. Because of the shelf life of
Hylenex
recombinant and our lengthy return period, there may be a significant period of time between when the product is shipped and when we issue credits on returned product.
We estimate the transaction price when we receive each purchase order taking into account the expected reductions of the selling price initially billed to the wholesaler arising from all of the above factors. We have compiled historical experience and data to estimate future returns and chargebacks of
Hylenex
recombinant and the impact of the other discounts and fees we pay. When estimating these adjustments to the transaction price, we reduce it sufficiently to be able to assert that it is probable that there will be no significant reversal of revenue when the ultimate adjustment amounts are known.
Each purchase order contains only one type of product, and is usually shipped to the wholesaler in a single shipment. Therefore, allocation of the transaction price to individual packages is not required.
We recognize revenue from
Hylenex
recombinant product sales and related cost of sales upon product delivery to the wholesaler location. At that time, the wholesalers take control of the product as they take title, bear the risk of loss of ownership, and have an enforceable obligation to pay us. They also have the ability to direct sales of product to their customers on terms and at prices they negotiate. Although wholesalers have product return rights, we do not believe they have a significant incentive to return the product to us.
Upon recognition of revenue from product sales of
Hylenex
recombinant, the estimated amounts of credit for product returns, chargebacks, distribution fees, prompt payment discounts, and GPO fees are included in sales reserves, accrued liabilities and net of accounts receivable. We monitor actual product returns, chargebacks, discounts and fees subsequent to the sale. If these amounts differ from our estimates, we make adjustments to these allowances, which are applied to increase or reduce product sales revenue and earnings in the period of adjustments.
In connection with the orders placed by wholesalers, we incur costs such as commissions to our sales representatives. However, as revenue from product sales is recognized upon delivery to the wholesaler, which occurs shortly after we receive a purchase order, we do not capitalize these commissions and other costs, based on application of a practical expedient allowed in ASC 606.
13
Bulk rHuPH20
We sell bulk rHuPH20 to collaboration partners for use in research and development; subsequent to receiving marketing approval, we sell it for use in collaboration commercial products. Sales are made pursuant to purchase orders subject to the terms of the collaborative agreement, and delivery of units of bulk rHuPH20 represent performance obligations under each purchase order. We provide a standard warranty that the product conforms to specifications. We use a contract manufacturer to produce bulk rHuPH20 and have concluded we are the principal in the sales to collaboration partners. The transaction price for each purchase order of bulk rHuPH20 is fixed based on the cost of production plus a contractual markup, and is not subject to adjustments. Allocation of the transaction price to individual quantities of the product is usually not required because each order contains only one type of product.
We recognize revenue from bulk rHuPH20 formulations as product sales and related cost of sales upon transfer of title to our partners. At that time, the partners take control of the product, bear the risk of loss of ownership, and have an enforceable obligation to pay us.
There were no differences in how the previously existing authoritative accounting literature applied to our product sales transactions.
ENHANZE Drug Product
We sell ENHANZE drug product to collaboration partners for use in research and development in early phase clinical studies. Sales are made pursuant to purchase orders subject to the terms of the collaborative agreement, and delivery of units of ENHANZE drug product represent performance obligations under each purchase order. We provide a standard warranty that the product conforms to specifications. We use a contract manufacturer to produce ENHANZE drug product and we concluded we are the principal in the sales to collaboration partners. The transaction price for each purchase order of ENHANZE drug product is fixed based on the cost of production plus a contractual markup, and is not subject to adjustments. Allocation of the transaction price to individual quantities of the product is usually not required because each order contains only one type of product.
We recognize revenue from ENHANZE drug product as product sales and related cost of sales upon transfer of title to our partners. At that time, the partners take control of the product, bear the risk of loss of ownership, and have an enforceable obligation to pay us.
There were no differences in how the previously existing authoritative accounting literature applied to our product sales transactions.
Revenue Presentation
In our statements of operations, we report as revenues under collaborative agreements the upfront payments, event-based development and regulatory milestones and sales milestones. We also include in this category revenues from separate research and development contracts pursuant to project authorization forms and sales of bulk rHuPH20 that has no alternative future use.
We report royalties received from collaboration partners as a separate line in our statements of operations.
Revenues from sales of
Hylenex
recombinant, bulk rHuPH20 that has alternative future use and ENHANZE drug product are included in product sales, net.
In footnotes to our financial statements, we provide disaggregated revenue information by type of arrangement (product sales, net, collaborative agreements and research and development services), and additionally, by type of payment stream received under collaborative agreements (upfront amounts, event-based development and regulatory milestones and other fees, sales milestones and royalties).
14
Cost of Product Sales
Cost of product sales consists primarily of raw materials, third-party manufacturing costs, fill and finish costs, freight costs, internal costs and manufacturing overhead associated with the production of
Hylenex
recombinant and bulk rHuPH20 and ENHANZE drug product that has alternative future use. Cost of product sales also consists of the write-down of excess, dated and obsolete inventories and the write-off of inventories that do not meet certain product specifications, if any. Prior to bulk rHuPH20 and ENHANZE drug product having alternative future use, all costs related to the manufacturing of those products were charged to research and development expenses in the periods such costs were incurred. During the
three and nine months ended
September 30, 2018
, sales of bulk rHuPH20 and ENHANZE drug product included
$1.7 million
and
$2.3 million
, respectively, of cost of sales that were previously expensed as research and development. Of the bulk rHuPH20 and ENHANZE drug product that has alternative future use on hand as of
September 30, 2018
, approximately
$2.0 million
in manufacturing costs were previously recorded as research and development expenses. We expect to sell this inventory by the end of 2020.
Research and Development Expenses
Research and development expenses include salaries and benefits, facilities and other overhead expenses, external clinical trial expenses, research related manufacturing services, contract services and other outside expenses. Research and development expenses are charged to operating expenses as incurred when these expenditures relate to our research and development efforts and have no alternative future uses.
When bulk rHuPH20 is manufactured for use in research and development by us or our partners and the product cannot be redirected for alternative use due to formulation and manufacturing specifications, the manufacturing costs are recorded as research and development expense. Bulk rHuPH20 that is manufactured for partner use prior to our partner receiving marketing approval from the FDA or comparable regulatory agencies in foreign countries and meet these specifications is recorded as research and development expenses. The manufacturing costs of bulk rHuPH20 for the approved collaboration products, Herceptin SC, MabThera SC (RITUXAN HYCELA™ in the U.S.) and HYQVIA, incurred after the receipt of marketing approvals are capitalized as inventory. Bulk rHuPH20 formulations manufactured for general partner and internal use, which can potentially be used by any collaboration partner or by us in any stage of development or in commercial products, is considered to have alternative future use and all manufacturing costs are capitalized as inventory. Inventories used in our clinical trials are expensed at the time the inventories are packaged for the clinical trials.
We are obligated to make upfront payments upon execution of certain research and development agreements. Advance payments, including nonrefundable amounts, for goods or services that will be used or rendered for future research and development activities are deferred. Such amounts are recognized as expense as the related goods are delivered or the related services are performed or such time when we do not expect the goods to be delivered or services to be performed.
Milestone payments that we make in connection with in-licensed technology for a particular research and development project that have no alternative future uses (in other research and development projects or otherwise) and therefore no separate economic value are expensed as research and development costs at the time the costs are incurred. We currently have
no
in-licensed technologies that have alternative future uses in research and development projects or otherwise.
Clinical Trial Expenses
We make payments in connection with our clinical trials under contracts with contract research organizations that support conducting and managing clinical trials. The financial terms of these agreements are subject to negotiation and vary from contract to contract and may result in uneven payment flows. Generally, these agreements set forth the scope of work to be performed at a fixed fee, unit price or on a time and materials basis. A portion of our obligation to make payments under these contracts depends on factors such as the successful enrollment or treatment of patients or the completion of other clinical trial milestones.
Expenses related to clinical trials are accrued based on our estimates and/or representations from service providers regarding work performed, including actual level of patient enrollment, completion of patient studies and progress of the clinical trials. Other
15
incidental costs related to patient enrollment or treatment are accrued when reasonably certain. If the amounts we are obligated to pay under our clinical trial agreements are modified (for instance, as a result of changes in the clinical trial protocol or scope of work to be performed), we adjust our accruals accordingly on a prospective basis. Revisions to our contractual payment obligations are charged to expense in the period in which the facts that give rise to the revision become reasonably certain.
Share-Based Compensation
We record compensation expense associated with stock options, restricted stock awards (“RSAs”), restricted stock units (“RSUs”), and RSUs with performance conditions (“PRSUs”) in accordance with the authoritative guidance for stock-based compensation. The cost of employee services received in exchange for an award of an equity instrument is measured at the grant date, based on the estimated fair value of the award, and is recognized as expense on a straight-line basis over the requisite service period of the award. Share-based compensation expense for an award with a performance condition is recognized when the achievement of such performance condition is determined to be probable. If the outcome of such performance condition is not determined to be probable or is not met, no compensation expense is recognized and any previously recognized compensation expense is reversed. Forfeitures are recognized as a reduction of share-based compensation expense as they occur.
Income Taxes
We provide for income taxes using the liability method. Under this method, deferred income tax assets and liabilities are determined based on the differences between the financial statement carrying amounts of existing assets and liabilities at each year end and their respective tax bases and are measured using enacted tax rates in effect for the year in which the differences are expected to affect taxable income. Significant judgment is required by management to determine our provision for income taxes, our deferred tax assets and liabilities, and the valuation allowance to record against our net deferred tax assets, which are based on complex and evolving tax regulations throughout the world. Deferred tax assets and other tax benefits are recorded when it is more likely than not that the position will be sustained upon audit. While we have begun to utilize certain of our net operating losses, we have not yet established a track record of profitability. Accordingly, valuation allowances have been recorded to reduce our net deferred tax assets to
zero
, with the exception of the alternative minimum tax ("AMT") credit carryover of
$5.5 million
. Under the Tax Cuts and Jobs Act (the “Act”) enacted in December 2017, the AMT credit carryover will either be utilized, or if unutilized fully refunded in 2022. For all other deferred tax assets the valuation allowance will reduce the net value to
zero
until such time as we can demonstrate an ability to realize them.
The Act reduces the U.S. federal corporate tax rate from 35% to 21%. As a result, the Company evaluated and adjusted its deferred tax assets to reflect the new corporate tax rates as of December 31, 2017. The Company is still evaluating other potential impacts and planning opportunities related to tax reform. As of September 30, 2018, the Company believes that its disclosures in its financial statements as of December 31, 2017 are still reasonably accurate.
Net (Loss) Income Per Share
Basic net (loss) income per common share is computed by dividing net (loss) income for the period by the weighted average number of common shares outstanding during the period, without consideration for common stock equivalents. Outstanding stock options, unvested RSAs, unvested RSUs and unvested PRSUs are considered common stock equivalents and are only included in the calculation of diluted earnings per common share when net income is reported and their effect is dilutive. For the
three and nine months ended
September 30, 2018, approximately
13.8 million
shares of outstanding stock options, unvested RSAs, unvested RSUs were excluded from the calculation of diluted net loss per common share because a net loss was reported in each of these periods and therefore their effect was anti-dilutive. Outstanding common stock equivalents totaling approximately
7.8 million
and
14.3 million
, respectively, were excluded from the calculation of diluted net (loss) income per common share for the
three and nine months ended
September 30, 2017, respectively, because their effect was anti-dilutive. A reconciliation of the numerators
16
and the denominators of the basic and diluted net (loss) income per common share computations is as follows (in thousands, except per share amounts):
|
Three Months Ended
September 30, |
Nine Months Ended
September 30, |
|||||||||||||||
|
|
2018
|
2017
|
2018
|
2017
|
||||||||||||
|
Numerator:
|
||||||||||||||||
|
Net (loss) income
|
$
|
(27,850
|
)
|
$
|
2,749
|
|
$
|
(78,204
|
)
|
$
|
(60,911
|
)
|
||||
|
Denominator:
|
||||||||||||||||
|
Weighted average common shares outstanding for basic
net (loss) income per share |
143,949
|
|
141,190
|
|
143,396
|
|
134,633
|
|
||||||||
|
Net effect of dilutive common stock equivalents
|
—
|
|
2,046
|
|
—
|
|
—
|
|
||||||||
|
Weighted average common shares outstanding for diluted
net (loss) income per share |
143,949
|
|
143,236
|
|
143,396
|
|
134,633
|
|
||||||||
|
Net (loss) income per share:
|
||||||||||||||||
|
Basic
|
$
|
(0.19
|
)
|
$
|
0.02
|
|
$
|
(0.55
|
)
|
$
|
(0.45
|
)
|
||||
|
Diluted
|
$
|
(0.19
|
)
|
$
|
0.02
|
|
$
|
(0.55
|
)
|
$
|
(0.45
|
)
|
||||
Segment Information
We operate our business in
one
segment, which includes all activities related to the research, development and commercialization of our proprietary enzymes. This segment also includes revenues and expenses related to (i) research and development and bulk rHuPH20 manufacturing activities conducted under our collaborative agreements with third parties and (ii) product sales of
Hylenex
recombinant. The chief operating decision-maker reviews the operating results on an aggregate basis and manages the operations as a single operating segment. Our long-lived assets located in foreign countries had minimal book value as of
September 30, 2018
and
December 31, 2017
.
17
Adoption and Pending Adoption of Recent Accounting Pronouncements
The following table provides a brief description of recently issued accounting standards, those adopted in the current period and those not yet adopted:
|
Standard
|
Description
|
Effective Date
|
Effect on the Financial
Statements or Other Significant Matters
|
|||
|
In January 2016, the FASB issued ASU 2016-01, Financial Instruments - Overall; Recognition and Measurement of Financial Assets and Financial Liabilities.
|
The new guidance supersedes the guidance to classify equity securities with readily determinable fair values into different categories (that is, trading or available-for-sale) and requires equity securities to be measured at fair value with changes in the fair value recognized through net income. The new guidance requires public business entities that are required to disclose fair value of financial instruments measured at amortized cost on the balance sheet to measure that fair value using the exit price notion consistent with Topic 820, Fair Value Measurement.
|
January 1, 2018
|
We currently do not hold equity securities. The adoption did not have a material impact on our condensed consolidated financial position or results of operations.
|
|||
|
In October 2016, the FASB issued ASU 2016-16, Income Taxes; Intra-Entity Transfers of Assets Other Than Inventory.
|
The new guidance removes the current requirement to defer the income tax effects of intercompany transfers of assets other than inventory (e.g., intangible assets) until the asset has been sold to an outside party. As a result, the income tax consequences of an intercompany transfer of assets other than inventory will be recognized in the current period income statement rather than being deferred until the assets leave the consolidated entity.
|
January 1, 2018
|
We adopted the new guidance on January 1, 2018. The adoption did not have a material impact on our condensed consolidated financial position or results of operations.
|
|||
18
|
Standard
|
Description
|
Effective Date
|
Effect on the Financial
Statements or Other Significant Matters
|
|||
|
In May 2014, the FASB issued ASU 2014-09, Revenue from Contracts with Customers (Topic 606). In March, April, May and December 2016, the FASB issued additional guidance related to Topic 606.
|
The new standard superseded nearly all existing revenue recognition guidance. Under Topic 606, an entity is required to recognize revenue upon transfer of promised goods or services to customers in an amount that reflects the expected consideration to be received in exchange for those goods or services. Topic 606 defines a five-step process in order to achieve this core principle, which may require the use of judgment and estimates, and also requires expanded qualitative and quantitative disclosures relating to the nature, amount, timing and uncertainty of revenue and cash flows arising from contracts with customers, including significant judgments and estimates used. The new standard also defines accounting for certain costs related to origination and fulfillment of contracts with customers, including whether such costs should be capitalized.
|
January 1, 2018
|
We adopted the new guidance on January 1, 2018 using the modified retrospective approach. Refer to Notes 2 “Revenue Recognition” and 4 for additional detail regarding the impact of this adoption.
|
|||
19
|
Standard
|
Description
|
Effective Date
|
Effect on the Financial
Statements or Other Significant Matters
|
|||
|
In February 2016, the FASB issued ASU 2016-02, Leases (Topic 842). In July 2018, the FASB issued additional guidance related to Topic 842.
|
The new guidance requires lessees to recognize assets and liabilities for most leases and provides enhanced disclosures.
|
January 1, 2019. Early adoption is permitted.
|
We plan to implement the guidance on January 1, 2019 using a modified retrospective transition basis for leases existing as of the period of adoption. In order to adopt the new standard, we will be using available practical expedients and newly implemented processes and internal controls for lease accounting. The practical expedients allow us to carry forward our historical assessment of whether existing agreements are or contain a lease and the classification of our existing lease arrangements. We expect all of our real-estate and automobile operating lease commitments will be recognized as lease liabilities with corresponding right-of-use assets upon adoption, resulting in an increase in the assets and liabilities of the consolidated balance sheet. We anticipate that the adoption will have a material impact on our consolidated financial statements.
|
|||
|
In August 2018, the FASB issued ASU 2018-13, Fair Value Measurement (Topic 820).
|
The new guidance removes, modifies and adds to certain disclosure requirements on fair value measurements in Topic 820, Fair Value Measurement.
|
January 1, 2020
|
We plan to adopt the new guidance on January 1, 2020. We do not anticipate the adoption will have a material impact on our condensed consolidated financial position or results of operations.
|
|||
20
3. Fair Value Measurement
Available-for-sale marketable securities consisted of the following (in thousands):
|
September 30, 2018
|
||||||||||||||||
|
Amortized Cost
|
Gross Unrealized Gains
|
Gross Unrealized Losses
|
Estimated Fair Value
|
|||||||||||||
|
Asset-backed securities
|
$
|
39,721
|
|
$
|
—
|
|
$
|
(24
|
)
|
$
|
39,697
|
|
||||
|
Corporate debt securities
|
74,699
|
|
—
|
|
(181
|
)
|
74,518
|
|
||||||||
|
U.S. Treasury securities
|
99,716
|
|
—
|
|
(248
|
)
|
99,468
|
|
||||||||
|
Commercial paper
|
95,664
|
|
—
|
|
—
|
|
95,664
|
|
||||||||
|
$
|
309,800
|
|
$
|
—
|
|
$
|
(453
|
)
|
$
|
309,347
|
|
|||||
|
December 31, 2017
|
||||||||||||||||
|
Amortized Cost
|
Gross Unrealized Gains
|
Gross Unrealized Losses
|
Estimated Fair Value
|
|||||||||||||
|
Corporate debt securities
|
$
|
117,427
|
|
$
|
—
|
|
$
|
(235
|
)
|
$
|
117,192
|
|
||||
|
U.S. Treasury securities
|
66,601
|
|
—
|
|
(201
|
)
|
66,400
|
|
||||||||
|
Commercial paper
|
116,882
|
|
—
|
|
—
|
|
116,882
|
|
||||||||
|
$
|
300,910
|
|
$
|
—
|
|
$
|
(436
|
)
|
$
|
300,474
|
|
|||||
As of
September 30, 2018
, all of our available-for-sale debt securities were scheduled to mature within the next 12 months and
27
available-for-sale marketable securities were in a gross unrealized loss position, all of which had been in such position for less than 12 months. Based on our review of these marketable securities, we believe we had
no
other than-temporary impairments on these securities as of
September 30, 2018
, because we do not intend to sell these securities and it is not more-likely-than-not that we will be required to sell these securities before the recovery of their amortized cost basis.
21
The following table summarizes, by major security type, our cash equivalents and available-for-sale marketable securities that are measured at fair value on a recurring basis and are categorized using the fair value hierarchy (in thousands):
|
September 30, 2018
|
December 31, 2017
|
|||||||||||||||||||||||
|
Level 1
|
Level 2
|
Total estimated fair value
|
Level 1
|
Level 2
|
Total estimated fair value
|
|||||||||||||||||||
|
Cash equivalents:
|
||||||||||||||||||||||||
|
Money market funds
|
$
|
55,271
|
|
$
|
—
|
|
$
|
55,271
|
|
$
|
142,091
|
|
$
|
—
|
|
$
|
142,091
|
|
||||||
|
Commercial paper
|
—
|
|
—
|
|
—
|
|
—
|
|
15,700
|
|
15,700
|
|
||||||||||||
|
Available-for-sale marketable
securities:
|
||||||||||||||||||||||||
|
Asset-backed securities
|
—
|
|
39,697
|
|
39,697
|
|
—
|
|
—
|
|
—
|
|
||||||||||||
|
Corporate debt securities
|
—
|
|
74,518
|
|
74,518
|
|
—
|
|
117,192
|
|
117,192
|
|
||||||||||||
|
U.S. Treasury securities
|
99,468
|
|
—
|
|
99,468
|
|
66,400
|
|
—
|
|
66,400
|
|
||||||||||||
|
Commercial paper
|
—
|
|
95,664
|
|
95,664
|
|
—
|
|
116,882
|
|
116,882
|
|
||||||||||||
|
$
|
154,739
|
|
$
|
209,879
|
|
$
|
364,618
|
|
$
|
208,491
|
|
$
|
249,774
|
|
$
|
458,265
|
|
|||||||
There were
no
transfers between Level 1 and Level 2 of the fair value hierarchy during the
nine months ended
September 30, 2018
. We had
no
instruments that were classified within Level 3 as of
September 30, 2018
and
December 31, 2017
.
4. Revenue
Our disaggregated revenues were as follows (in thousands):
|
Three Months Ended
September 30, |
Nine Months Ended
September 30, |
|||||||||||||||
|
2018
|
2017
|
2018
|
2017
|
|||||||||||||
|
Royalties
|
$
|
18,710
|
|
$
|
17,119
|
|
$
|
59,643
|
|
$
|
45,839
|
|
||||
|
Product sales, net
|
||||||||||||||||
|
Sales of bulk rHuPH20
|
$
|
2,402
|
|
$
|
9,748
|
|
$
|
6,350
|
|
$
|
26,825
|
|
||||
|
Sales of ENHANZE drug product
|
186
|
|
—
|
|
322
|
|
—
|
|
||||||||
|
Sales of
Hylenex
|
3,681
|
|
3,841
|
|
10,881
|
|
10,978
|
|
||||||||
|
Total product sales, net
|
6,269
|
|
13,589
|
|
17,553
|
|
37,803
|
|
||||||||
|
Revenues under collaborative agreements:
|
||||||||||||||||
|
Upfront license fees
|
—
|
|
30,352
|
|
1,336
|
|
31,054
|
|
||||||||
|
Event-based development milestones and other fees
|
—
|
|
329
|
|
11,000
|
|
988
|
|
||||||||
|
Sales-based milestones
|
—
|
|
342
|
|
—
|
|
1,028
|
|
||||||||
|
Research and development services
|
577
|
|
2,000
|
|
2,098
|
|
10,337
|
|
||||||||
|
Total revenues under collaborative agreements
|
577
|
|
33,023
|
|
14,434
|
|
43,407
|
|
||||||||
|
Total revenue
|
$
|
25,556
|
|
$
|
63,731
|
|
$
|
91,630
|
|
$
|
127,049
|
|
||||
22
During the
three months ended
September 30, 2018
we recognized revenue related to licenses granted to collaboration partners in prior periods in the amount of
$18.7 million
. This amount represents royalties earned in the current period. We recognized revenue of
$0.5 million
during the
three months ended
September 30, 2018
that had been included in deferred revenues at December 31, 2017. We did not recognize any adjustments to reduce sales reserves and allowances liability related to
Hylenex
recombinant sales in prior periods.
During the
nine months ended
September 30, 2018
we recognized revenue related to licenses granted to collaboration partners in prior periods in the amount of
$70.6 million
. This amount represents royalties earned in the current period, development milestones of
$1.0 million
from Roche and
$5.0 million
from Alexion, and
$5.0 million
of variable consideration in the contract where uncertainties have been resolved and the development milestone is expected to be achieved. We also recognized revenue of
$2.3 million
during the
nine months ended
September 30, 2018
that had been included in deferred revenues at December 31, 2017. We did not recognize any adjustments to reduce sales reserves and allowances liability related to
Hylenex
recombinant sales in prior periods.
Revenue recognized during the
three and nine months ended
September 30, 2017
was determined in accordance with the accounting rules applicable prior to the adoption of ASC 606 on January 1, 2018.
Upon the adoption of ASC 606, we recognized an adjustment to increase our accounts receivable by
$19.4 million
, decrease deferred revenues by
$51.8 million
, and decrease accumulated deficit by
$71.2 million
. The impact of applying the provisions of ASC 606 in the
three and nine months ended
September 30, 2018
was to decrease revenues by
$6.4 million
and to increase revenues by
$2.6 million
, respectively. Under the previously existing authoritative accounting literature, at
September 30, 2018
our accounts receivable and other contract assets would have been
$18.7 million
lower, and our deferred revenue
$48.7 million
higher, than the amounts reported in our condensed consolidated balance sheet. ASC 606 did not have an aggregate impact on our net cash used in operating activities, but resulted in offsetting changes in net loss and certain assets and liabilities within net cash used in operating activities in the condensed consolidated statement of cash flows.
Accounts receivable, net, other contract assets and deferred revenues (contract liabilities) from contracts with customers, including collaboration partners, consisted of the following (in thousands):
|
September 30, 2018
|
December 31, 2017
|
|||||||
|
Accounts receivable, net
|
$
|
22,656
|
|
$
|
22,133
|
|
||
|
Other contract assets
|
5,000
|
|
—
|
|
||||
|
Deferred revenues
|
9,754
|
|
60,865
|
|
||||
As of
September 30, 2018
, the amounts included in the transaction price of our contracts with customers, including collaboration partners, and allocated to goods and services not yet provided were
$9.8 million
. This amount has been collected and is reported as deferred revenues. Of the total deferred revenues,
$3.0 million
represents pre-payment of bulk rHuPH20 that we estimate will be delivered in 2019. Of the remaining deferred revenues, for which the timing of when these goods and services will be provided is controlled by our customers,
$4.5 million
can be used by the customers at any time through 2022 and the remaining
$2.3 million
at any time through 2019.
We recognized contract assets of
$5.0 million
related to collaborative agreements as of
September 30, 2018
, for amounts considered probable to receive for development milestones that relate to intellectual property licenses granted to collaboration partners in prior periods. The following table presents amounts under our collaborative agreements included in the transaction price (i.e. cumulative amounts triggered or probable) as of
September 30, 2018
(in thousands):
23
|
Upfront
(1)
|
Development
(2)
|
Sales
(3)
|
Royalty
|
Total
|
||||||||||||||||
|
Collaboration partner and agreement date:
|
||||||||||||||||||||
|
Roche (December 2006 and September 2017)
|
$
|
70,000
|
|
$
|
25,000
|
|
$
|
22,000
|
|
$
|
211,613
|
|
$
|
328,613
|
|
|||||
|
Baxalta (September 2007)
|
10,000
|
|
3,000
|
|
9,000
|
|
22,438
|
|
44,438
|
|
||||||||||
|
Pfizer (December 2012)
|
14,500
|
|
2,000
|
|
—
|
|
—
|
|
16,500
|
|
||||||||||
|
Janssen (December 2014)
|
15,250
|
|
15,000
|
|
—
|
|
—
|
|
30,250
|
|
||||||||||
|
AbbVie (June 2015)
|
23,000
|
|
6,000
|
|
—
|
|
—
|
|
29,000
|
|
||||||||||
|
Lilly (December 2015)
|
33,000
|
|
—
|
|
—
|
|
—
|
|
33,000
|
|
||||||||||
|
BMS (September 2017)
|
105,000
|
|
5,000
|
|
—
|
|
—
|
|
110,000
|
|
||||||||||
|
Alexion (December 2017)
|
40,000
|
|
5,000
|
|
—
|
|
—
|
|
45,000
|
|
||||||||||
|
(1)
|
Upfront and additional target selection fees
|
|
(2)
|
Event-based development and regulatory milestone amounts and other fees
|
|
(3)
|
Sales-based milestone amounts
|
Through
September 30, 2018
, our collaboration partners have completed development, obtained marketing authorization approvals for certain indications and commenced commercialization of the following products:
|
•
|
Roche, for Herceptin SC in the European Union (“EU”) in August 2013; and MabThera SC in the EU in March 2014 and its equivalent RITUXAN HYCELA™ in the US in June 2017; and Herceptin SC in Canada in September 2018;
|
|
•
|
Baxalta, for HYQVIA in the EU and in the US in May 2013.
|
The remaining targets and products are currently in the process of development by the collaboration partners.
5. Certain Balance Sheet Items
Accounts receivable, net and other contract assets consisted of the following (in thousands):
|
September 30,
2018 |
December 31,
2017 |
|||||||
|
Accounts receivable from product sales to collaborators
|
$
|
1,980
|
|
$
|
18,475
|
|
||
|
Accounts receivable from revenues under collaborative agreements
|
451
|
|
2,142
|
|
||||
|
Accounts receivable from royalty payments
|
18,777
|
|
—
|
|
||||
|
Accounts receivable from other product sales
|
1,949
|
|
2,075
|
|
||||
|
Other contract assets
|
5,000
|
|
—
|
|
||||
|
Subtotal
|
28,157
|
|
22,692
|
|
||||
|
Allowance for distribution fees and discounts
|
(501
|
)
|
(559
|
)
|
||||
|
Total accounts receivable, net and other contract assets
|
$
|
27,656
|
|
$
|
22,133
|
|
||
24
Inventories consisted of the following (in thousands):
|
September 30,
2018 |
December 31,
2017 |
|||||||
|
Raw materials
|
$
|
625
|
|
$
|
377
|
|
||
|
Work-in-process
|
15,401
|
|
2,131
|
|
||||
|
Finished goods
|
2,259
|
|
2,638
|
|
||||
|
Total inventories
|
$
|
18,285
|
|
$
|
5,146
|
|
||
Prepaid expenses and other assets consisted of the following (in thousands):
|
September 30,
2018 |
December 31,
2017 |
|||||||
|
Prepaid manufacturing expenses
|
$
|
8,844
|
|
$
|
2,337
|
|
||
|
Prepaid research and development expenses
|
9,195
|
|
7,793
|
|
||||
|
Other prepaid expenses
|
2,344
|
|
2,585
|
|
||||
|
Other assets
|
6,527
|
|
6,717
|
|
||||
|
Total prepaid expenses and other assets
|
26,910
|
|
19,432
|
|
||||
|
Less long-term portion
|
7,291
|
|
5,553
|
|
||||
|
Total prepaid expenses and other assets, current
|
$
|
19,619
|
|
$
|
13,879
|
|
||
Prepaid manufacturing expenses include raw materials, slot reservation fees and other amounts paid to contract manufacturing organizations. Such amounts are reclassified to work-in-process inventory as materials are used or the CMO services are complete.
Property and equipment, net consisted of the following (in thousands):
|
September 30,
2018 |
December 31,
2017 |
|||||||
|
Research equipment
|
$
|
9,528
|
|
$
|
9,268
|
|
||
|
Manufacturing equipment
|
3,979
|
|
1,702
|
|
||||
|
Computer and office equipment
|
4,811
|
|
3,725
|
|
||||
|
Leasehold improvements
|
4,160
|
|
2,715
|
|
||||
|
Subtotal
|
22,478
|
|
17,410
|
|
||||
|
Accumulated depreciation and amortization
|
(15,688
|
)
|
(13,890
|
)
|
||||
|
Property and equipment, net
|
$
|
6,790
|
|
$
|
3,520
|
|
||
Depreciation and amortization expense totaled
$0.6 million
and
$0.5 million
for the
three months ended
September 30, 2018
and
2017
, and
$1.8 million
and
$1.7 million
for the
nine months ended
September 30, 2018
and
2017
, respectively.
25
Accrued expenses consisted of the following (in thousands):
|
September 30,
2018 |
December 31,
2017 |
|||||||
|
Accrued outsourced research and development expenses
|
$
|
19,786
|
|
$
|
18,757
|
|
||
|
Accrued compensation and payroll taxes
|
12,914
|
|
13,384
|
|
||||
|
Accrued outsourced manufacturing expenses
|
4,743
|
|
2,504
|
|
||||
|
Other accrued expenses
|
6,142
|
|
5,396
|
|
||||
|
Total accrued expenses
|
43,585
|
|
40,041
|
|
||||
|
Less long-term portion
|
565
|
|
440
|
|
||||
|
Total accrued expenses, current
|
$
|
43,020
|
|
$
|
39,601
|
|
||
Deferred revenue consisted of the following (in thousands):
|
September 30,
2018 |
December 31,
2017 |
|||||||
|
Collaborative agreements
|
||||||||
|
License fees and event-based payments:
|
||||||||
|
Roche
|
$
|
—
|
|
$
|
39,379
|
|
||
|
Other
|
2,265
|
|
15,999
|
|
||||
|
Total license fees and event-based payments
|
2,265
|
|
55,378
|
|
||||
|
Product sales
|
7,489
|
|
5,487
|
|
||||
|
Total deferred revenue
|
9,754
|
|
60,865
|
|
||||
|
Less current portion
|
4,247
|
|
6,568
|
|
||||
|
Deferred revenue, net of current portion
|
$
|
5,507
|
|
$
|
54,297
|
|
||
Royalty-backed Loan
In
January 2016
, through our wholly-owned subsidiary Halozyme Royalty LLC (“Halozyme Royalty”), we received a
$150 million
loan (the “Royalty-backed Loan”) pursuant to a credit agreement (the “Credit Agreement”) with BioPharma Credit Investments IV Sub, LP and Athyrium Opportunities II Acquisition LP (the “Royalty-backed Lenders”). Under the terms of the Credit Agreement, Halozyme Therapeutics, Inc. transferred to Halozyme Royalty the right to receive royalty payments from the commercial sales of ENHANZE products owed under the Roche Collaboration and Baxalta Collaboration (“Collaboration Agreements”). The royalty payments from the Collaboration Agreements will be used to repay the principal and interest on the loan (the “Royalty Payments”). The Royalty-backed Loan bears interest at a per annum rate of
8.75% plus the three-month LIBOR rate
. The three-month LIBOR rate is subject to a floor of
0.7%
and a cap of
1.5%
. The interest rate as of
September 30, 2018
was
10.25%
.
The Credit Agreement provides that
none
of the Royalty Payments were required to be applied to the Royalty-backed Loan prior to January 1, 2017,
50%
of the Royalty Payments are required to be applied to the Royalty-backed Loan between January 1, 2017 and January 1, 2018 and thereafter
all
Royalty Payments must be applied to the Royalty-backed Loan. However, the amounts available to repay the Royalty-backed Loan are subject to caps of
$13.75 million
per quarter in 2017,
$18.75 million
per quarter in 2018,
$21.25 million
per quarter in 2019 and
$22.5 million
per quarter in 2020 and thereafter. Amounts available to repay the Royalty-backed Loan will be applied first to pay interest and second to repay principal on the Royalty-backed Loan. Any accrued interest that is not paid on any applicable quarterly payment date, as defined, will be capitalized and added to the principal balance
26
of the Royalty-backed Loan on such date. Halozyme Royalty will be entitled to receive and distribute to Halozyme any Royalty Payments that are not required to be applied to the Royalty-backed Loan or which are in excess of the foregoing caps.
Because the repayment of the term loan is contingent upon the level of Royalty Payments received, the repayment term may be shortened or extended depending on the actual level of Royalty Payments. The
final maturity date of the Royalty-backed Loan will be the earlier of (i) the date when principal and interest is paid in full, (ii) the termination of Halozyme Royalty’s right to receive royalties under the Collaboration Agreements, and (iii) December 31, 2050
. Currently, we estimate that the loan will be repaid in the first quarter of 2020. This estimate could be adversely affected and the repayment period could be extended if future royalty amounts are less than currently expected. Under the terms of the Credit Agreement, at any time after January 1, 2019, Halozyme Royalty may, subject to certain limitations, prepay the outstanding principal of the Royalty-backed Loan in whole or in part, at a price equal to
105%
of the outstanding principal on the Royalty-backed Loan, plus accrued but unpaid interest. The Royalty-backed Loan constitutes an obligation of Halozyme Royalty, and is non-recourse to Halozyme. Halozyme Royalty retains its right to the Royalty Payments following repayment of the loan.
As of
September 30, 2018
, we were
in compliance
with all covenants under the Royalty-backed Loan and there was no material adverse change in our business, operations or financial condition.
We began making principal and interest payments against the Royalty-backed Loan in the first quarter of 2017 and therefore had
no
capitalized interest in the
three and nine months ended
September 30, 2018
. In addition, we recorded accrued interest, which is included in accrued expenses, of
$0.5 million
and
$0.7 million
as of
September 30, 2018
and
December 31, 2017
, respectively
In connection with the Royalty-backed Loan, we paid the Royalty-backed Lenders a fee of
$1.5 million
and incurred additional debt issuance costs totaling
$0.4 million
, which includes expenses that we paid on behalf of the Royalty-backed Lenders and expenses incurred directly by us. Debt issuance costs and the lender fee have been netted against the debt as of
September 30, 2018
, and are being amortized over the estimated term of the debt using the effective interest method. For the
three months ended
September 30, 2018
and 2017, the Company recognized interest expense, including amortization of the debt discount, related to the Royalty-backed Loan of
$3.1 million
and
$4.2 million
, respectively, and
$10.5 million
and
$12.4 million
for the
nine months ended
September 30, 2018
and
2017
, respectively. The assumptions used in determining the expected repayment term of the debt and amortization period of the issuance costs requires that we make estimates that could impact the short- and long-term classification of these costs, as well as the period over which these costs will be amortized. The outstanding balance of the Royalty-backed Loan as of
September 30, 2018
was
$101.0 million
, net of unamortized debt discount of
$0.4 million
.
Oxford and SVB Loan and Security Agreement
In
June 2016
, we entered into a Loan and Security Agreement (the “Loan Agreement”) with Oxford Finance LLC (“Oxford”) and Silicon Valley Bank (“SVB”) (collectively, the “Lenders”), providing a senior secured loan facility of up to an aggregate principal amount of
$70.0 million
, comprising a
$55.0 million
draw in June 2016 and an additional
$15.0 million
tranche, which we had the option to draw during the second quarter of 2017 and did not exercise. The initial proceeds were partially used to pay the outstanding principal and final payment of
$4.25 million
owed on a previous loan agreement with the Lenders. The remaining proceeds are being used for working capital and general business requirements. The senior secured loan facility carries a fixed interest rate of
8.25%
. The repayment schedule provides for
interest only payments for the first 18 months
, followed by consecutive equal monthly payments of principal and interest in arrears through the maturity date of
January 1, 2021
. The Loan Agreement provides for a final payment equal to
5.50%
of the initial
$55.0 million
principal amount. The final payment is due when the Loan Agreement becomes due or upon the prepayment of the facility. We have the option to prepay the outstanding balance of the Loan Agreement in full, subject to a prepayment fee of
2%
in the first year and
1%
in the second year of the Loan Agreement.
In connection with the Loan Agreement, the debt offering costs have been recorded as a debt discount in our condensed consolidated balance sheets which, together with the final payment and fixed interest rate payments, are being amortized and recorded as interest expense throughout the life of the loan using the effective interest rate method.
27
The Loan Agreement is secured by substantially all of the assets of the Company and our subsidiary, Halozyme, Inc., except that the collateral does not include any equity interests in Halozyme, Inc., any of our intellectual property (including all licensing, collaboration and similar agreements relating thereto), and certain other excluded assets. The Loan Agreement contains customary representations, warranties and covenants by us, which covenants limit our ability to convey, sell, lease, transfer, assign or otherwise dispose of certain of our assets; engage in any business other than the businesses currently engaged in by us or reasonably related thereto; liquidate or dissolve; make certain management changes; undergo certain change of control events; create, incur, assume, or be liable with respect to certain indebtedness; grant certain liens; pay dividends and make certain other restricted payments; make certain investments; make payments on any subordinated debt; enter into transactions with any of our affiliates outside of the ordinary course of business or permit our subsidiaries to do the same; and make any voluntary prepayment of or modify certain terms of the Royalty-backed Loan. In addition, subject to certain exceptions, we are required to maintain with SVB our primary deposit accounts, securities accounts and commodities, and to do the same for our subsidiary, Halozyme, Inc.
The Loan Agreement also contains customary indemnification obligations and customary events of default, including, among other things, our failure to fulfill certain of our obligations under the Loan Agreement and the occurrence of a material adverse change which is defined as a material adverse change in our business, operations, or condition (financial or otherwise), a material impairment of the prospect of repayment of any portion of the loan, a material impairment in the perfection or priority of the Lender’s lien in the collateral or in the value of such collateral or the occurrence of an event of default under the Royalty-backed Loan. In the event of default by us under the Loan Agreement, the Lenders would be entitled to exercise their remedies thereunder, including the right to accelerate the debt, upon which we may be required to repay all amounts then outstanding under the Loan Agreement, which could harm our financial condition.
As of
September 30, 2018
, we were
in compliance
with all covenants under the Loan Agreement and there was no material adverse change in our business, operations or financial condition.
Interest expense, including amortization of the debt discount, related to the Loan Agreement totaled
$1.2 million
and
$1.4 million
for the
three months ended
September 30, 2018
and 2017, respectively, and
$3.8 million
and
$4.1 million
for the
nine months ended
September 30, 2018
and
2017
, respectively. Accrued interest, which is included in accrued expenses, was
$0.3 million
and
$0.4 million
as of
September 30, 2018
and
December 31, 2017
, respectively. The outstanding term loan balance was
$45.5 million
as of
September 30, 2018
, inclusive of
$2.0 million
of accretion of the final payment and net of unamortized debt discount related to offering costs of
$0.2 million
.
7. Share-based Compensation
Total share-based compensation expense related to share-based awards was comprised of the following (in thousands):
|
Three Months Ended
September 30, |
Nine Months Ended
September 30, |
|||||||||||||||
|
|
2018
|
2017
|
2018
|
2017
|
||||||||||||
|
Research and development
|
$
|
4,407
|
|
$
|
3,060
|
|
$
|
13,107
|
|
$
|
9,891
|
|
||||
|
Selling, general and administrative
|
4,460
|
|
4,702
|
|
13,577
|
|
13,377
|
|
||||||||
|
Share-based compensation expense
|
$
|
8,867
|
|
$
|
7,762
|
|
$
|
26,684
|
|
$
|
23,268
|
|
||||
Share-based compensation expense by type of share-based award (in thousands):
|
Three Months Ended
September 30, |
Nine Months Ended
September 30, |
|||||||||||||||
|
|
2018
|
2017
|
2018
|
2017
|
||||||||||||
|
Stock options
|
$
|
4,645
|
|
$
|
4,973
|
|
$
|
14,026
|
|
$
|
14,971
|
|
||||
|
RSAs, RSUs and PRSUs
|
4,222
|
|
2,789
|
|
12,658
|
|
8,297
|
|
||||||||
|
$
|
8,867
|
|
$
|
7,762
|
|
$
|
26,684
|
|
$
|
23,268
|
|
|||||
28
We granted stock options to purchase approximately
0.4 million
and
0.1 million
shares of common stock during the
three months ended
September 30, 2018
and
2017
, respectively, and
2.3 million
and
2.5 million
shares of the Company’s common stock during the
nine months ended
September 30, 2018
and
2017
, respectively. The exercise price of stock options granted is equal to the closing price of the common stock on the date of grant. The fair value of each option award is estimated on the date of grant using the Black-Scholes-Merton option pricing model (“Black-Scholes model”). Expected volatility is based on historical volatility of our common stock. The expected term of options granted is based on analyses of historical employee termination rates and option exercises. The risk-free interest rate is based on the U.S. Treasury yield for a period consistent with the expected term of the option in effect at the time of the grant. The dividend yield assumption is based on the expectation of no future dividend payments. The assumptions used in the Black-Scholes model were as follows:
|
Three Months Ended
September 30, |
Nine Months Ended
September 30, |
|||||||
|
|
2018
|
2017
|
2018
|
2017
|
||||
|
Expected volatility
|
58.6-60.6%
|
70.5-70.8%
|
58.7-70.1%
|
70.5-71.7%
|
||||
|
Average expected term (in years)
|
5.4
|
5.6
|
5.5
|
5.6
|
||||
|
Risk-free interest rate
|
2.75-2.87%
|
1.73-1.93%
|
2.25-2.87%
|
1.73-1.94%
|
||||
|
Expected dividend yield
|
—
|
—
|
—
|
—
|
||||
Total unrecognized estimated compensation cost by type of award and the weighted-average remaining requisite service period over which such expense is expected to be recognized (in thousands, unless otherwise noted):
|
September 30, 2018
|
||||||
|
|
Unrecognized
Expense
|
Remaining
Weighted-Average
Recognition Period
(years)
|
||||
|
Stock options
|
$
|
38,966
|
|
2.45
|
||
|
RSAs
|
$
|
2,743
|
|
1.09
|
||
|
RSUs
|
$
|
26,434
|
|
2.24
|
||
8. Stockholders’ Equity
In May 2017, we completed an underwritten public offering pursuant to which we sold
11.5 million
shares of common stock, including
1.5 million
shares sold pursuant to the full exercise of an option to purchase additional shares granted to the underwriters. All of the shares were offered at a public offering price of
$12.50
per share, generating
$134.9 million
in net proceeds, after deducting underwriting discounts and commissions and other offering expenses. We intend to use the net proceeds from this offering to fund continued development of our PEGPH20 oncology program and for other general corporate purposes.
During the
nine
months ended
September 30, 2018 and 2017
, we issued an aggregate of
1,280,996
and
1,020,028
shares of common stock, respectively, in connection with the exercises of stock options at a weighted average exercise price of
$11.13
and
$8.71
per share, respectively, for net proceeds of approximately
$14.3 million
and
$8.9 million
, respectively. For the
nine
months ended
September 30, 2018 and 2017
, we issued
438,536
and
375,906
shares of common stock, respectively, upon vesting of certain RSUs for which the RSU holders surrendered
138,986
and
96,069
RSUs, respectively, to pay for minimum withholding taxes totaling approximately
$4.2 million
and
$1.9 million
, respectively. In addition, we issued
67,959
and
98,945
shares of common stock in connection with the grants of RSAs during the
nine months ended
September 30, 2018 and 2017
, respectively. Stock options and unvested restricted units totaling approximately
13.4 million
shares and
14.7 million
shares of our common stock were outstanding as of
September 30, 2018 and December 31, 2017
, respectively.
29
9. Commitments and Contingencies
From time to time, we may be involved in disputes, including litigation, relating to claims arising out of operations in the normal course of our business. Any of these claims could subject us to costly legal expenses and, while we generally believe that we have adequate insurance to cover many different types of liabilities, our insurance carriers may deny coverage or our policy limits may be inadequate to fully satisfy any damage awards or settlements. If this were to happen, the payment of any such awards could have a material adverse effect on our consolidated results of operations and financial position. Additionally, any such claims, whether or not successful, could damage our reputation and business. We currently are not a party to any legal proceedings, the adverse outcome of which, in management’s opinion, individually or in the aggregate, would have a material adverse effect on our consolidated results of operations or financial position.
10. Subsequent Events
In October 2018, we entered into an agreement with Roche for the right to develop and commercialize one additional exclusive target and an option to select two additional targets within four years using our ENHANZE technology for an upfront payment of
$25.0 million
. We will receive potential milestone payments of up to
$160.0 million
to
$165.0 million
per target, subject to the achievement of specific development, regulatory and sales-based milestones. We will also receive mid-single digit royalties on sales of commercialized products.
|
Item 2.
|
Management’s Discussion and Analysis of Financial Condition and Results of Operations
|
As
used in this report, unless the context suggests otherwise, references to “Halozyme,” “the Company,” “we,” “our,” “ours,” and “us” refer to Halozyme Therapeutics, Inc., its wholly owned subsidiary, Halozyme, Inc. and Halozyme Inc.’s wholly owned subsidiaries, Halozyme Holdings Ltd., Halozyme Royalty LLC, Halozyme Switzerland GmbH and Halozyme Switzerland Holdings GmbH. References to “Notes” refer to the Notes to Condensed Consolidated Financial Statements included herein (refer to Item 1 of Part I).
The following information should be read in conjunction with the interim unaudited condensed consolidated financial statements and Notes thereto included in Item 1 of this Quarterly Report on Form 10-Q, as well as the audited financial statements and notes thereto and Management’s Discussion and Analysis of Financial Condition and Results of Operations for the fiscal year ended
December 31, 2017
, included in our Annual Report on Form 10-K for the year ended
December 31, 2017
. Past financial or operating performance is not necessarily a reliable indicator of future performance, and our historical performance should not be used to anticipate results or future period trends.
This report contains “forward-looking statements” within the meaning of the Private Securities Litigation Reform Act of 1995. All statements in this report other than statements of historical fact are, or may be deemed to be, forward-looking statements. Words such as “expect,” “anticipate,” “intend,” “plan,” “believe,” “seek,” “estimate,” “think,” “may,” “could,” “will,” “would,” “should,” “continue,” “potential,” “likely,” “opportunity,” “project” and similar expressions or variations of such words are intended to identify forward-looking statements, but are not the exclusive means of identifying forward-looking statements in this report. Additionally, statements concerning future matters such as the anticipated timing and scope of planned clinical trials, the development or regulatory approval of new products, enhancements of existing products or technologies, timing and success of the launch of new products by us or by our collaborators, third party performance under key collaboration agreements, revenue, expense and cash burn levels and expected trends, expected repayment of the Royalty-backed Loan and trends and other statements regarding matters that are not historical are forward-looking statements. Such statements reflect management’s current forecast of certain aspects of our future, are based on currently available operating, financial and competitive information and are subject to various risks, uncertainties and assumptions that could cause actual results to differ materially from those anticipated or implied in our forward-looking statements due to a number of factors including, but not limited to, those set forth below under the section entitled “Risks Factors” and elsewhere in this Quarterly Report on Form 10-Q and our most recent Annual Report on Form 10-K. Readers are urged not to place undue reliance on these forward-looking statements, which speak only as of the date of this Quarterly Report. We undertake no obligation to revise or update any forward-looking statements in order to reflect any event or circumstance that may arise after the date of this Quarterly Report.
30
Overview
Halozyme Therapeutics, Inc. is a biotechnology company focused on developing and commercializing novel oncology therapies. Our proprietary enzymes are used to facilitate the delivery of injected drugs and fluids, potentially enhancing the efficacy and the convenience of other drugs or can be used to alter tissue structures for potential clinical benefit. We exploit our technology and expertise using a two pillar strategy that we believe enables us to manage risk and cost by: (1) developing our own proprietary products in therapeutic areas with significant unmet medical needs, with a focus on oncology, and (2) licensing our technology to biopharmaceutical companies to collaboratively develop products that combine our technology with the collaborators’ proprietary compounds.
The majority of our approved product and product candidates are based on rHuPH20, our patented recombinant human hyaluronidase enzyme. Our proprietary development pipeline consists primarily of pre-clinical and clinical stage product candidates in oncology. Our lead oncology program is Pegvorhyaluronidase alfa (PVHA), also referred to as PEGylated recombinant human hyaluronidase (PEGPH20), a molecular entity we are developing in combination with currently approved cancer therapies as a candidate for the systemic treatment of tumors that accumulate HA. We have demonstrated that when HA accumulates in a tumor, it can cause higher pressure in the tumor, reducing blood flow into the tumor and with that, reduced access of cancer therapies to the tumor. Through our efforts and efforts of our partners and collaborators, we are currently in Phase 3 clinical testing for PEGPH20 with ABRAXANE
®
(nab-paclitaxel) and gemcitabine in stage IV pancreatic ductal adenocarcinoma (PDA) (HALO 109-301), in Phase 1b clinical testing for PEGPH20 with KEYTRUDA
®
(pembrolizumab) in non-small cell lung cancer and gastric cancer (HALO 107-101), in Phase 1b/2 clinical testing for PEGPH20 with Tecentriq
®
(atezolizumab) in patients with previously treated metastatic PDA, in Phase 1b/2 clinical testing for PEGPH20 with Tecentriq in patients with gastric cancer and in Phase 1b/2 clinical testing for PEGPH20 with Tecentriq in patients with cholangiocarcinoma and gall bladder cancer (HALO 110-101/MATRIX).
We refer to the application of rHuPH20 to facilitate the delivery of other drugs or fluids as our ENHANZE
®
Drug Delivery Technology (ENHANZE). We license the ENHANZE technology to form collaborations with biopharmaceutical companies that develop or market drugs requiring or benefiting from injection via the subcutaneous route of administration. We currently have ENHANZE collaborations with F. Hoffmann-La Roche, Ltd. and Hoffmann-La Roche, Inc. (Roche), Baxalta US Inc. and Baxalta GmbH (Baxalta Incorporated was acquired by Shire plc in June 2016) (Baxalta), Pfizer Inc. (Pfizer), Janssen Biotech, Inc. (Janssen), AbbVie, Inc. (AbbVie), Eli Lilly and Company (Lilly), Bristol-Myers Squibb Company (BMS) and Alexion Pharma Holding (Alexion).We receive royalties from two of these collaborations, including royalties from sales of one product from the Baxalta collaboration and two products from the Roche collaboration. Future potential revenues from the sales and/or royalties of our approved products, product candidates, and ENHANZE collaborations will depend on the ability of Halozyme and our collaborators to develop, manufacture, secure and maintain regulatory approvals for approved products and product candidates and commercialize product candidates.
Our
third
quarter of
2018
and recent key events include:
|
•
|
In October 2018, we entered into an agreement with Roche for the right to develop and commercialize one additional exclusive target and an option to select two additional targets within four years using our ENHANZE technology for an upfront payment of $25.0 million. We will receive potential milestone payments of up to $160.0 million to $165.0 million per target, subject to the achievement of specific development, regulatory and sales-based milestones. We will also receive mid-single digit royalties on sales of commercialized products.
|
|
•
|
In October 2018, BMS dosed the first patient in a Phase 1 study evaluating the safety, pharmacokinetics and pharmacodynamics of BMS-986179, an investigational anti-CD-73 antibody, and ENHANZE technology, triggering a $5 million milestone payment which, under current revenue recognition standards, was recorded as revenue in the second quarter of 2018.
|
|
•
|
In September 2018, we announced that Roche received approval from Health Canada for a subcutaneous formulation of Herceptin (trastuzumab) for the treatment of patients with HER2-positive breast cancer. This is a co-formulation with our ENHANZE technology.
|
31
|
•
|
In August 2018, Alexion initiated a Phase 1 trial to study a next-generation subcutaneous formulation of ALXN1210 co-administered with ENHANZE technology, triggering a $5 million milestone payment which, under current revenue recognition standards, was recorded as revenue in the second quarter of 2018.
|
|
•
|
In July 2018, we announced the FDA accepted a Biologics License Application (BLA) from Genentech, a member of the Roche Group, for a subcutaneous version of Herceptin in its FDA-approved breast cancer indications. This is the same co-formulation with ENHANZE marketed under the Herceptin SC brand in many countries outside the U.S.
|
32
Product and Product Candidates
We have one marketed proprietary product, three partnered products, one proprietary product candidate targeting several indications in various stages of development, and one preclinical product candidate. The following table summarizes our proprietary product and product candidate as well as products and product candidates under development with our collaborators:
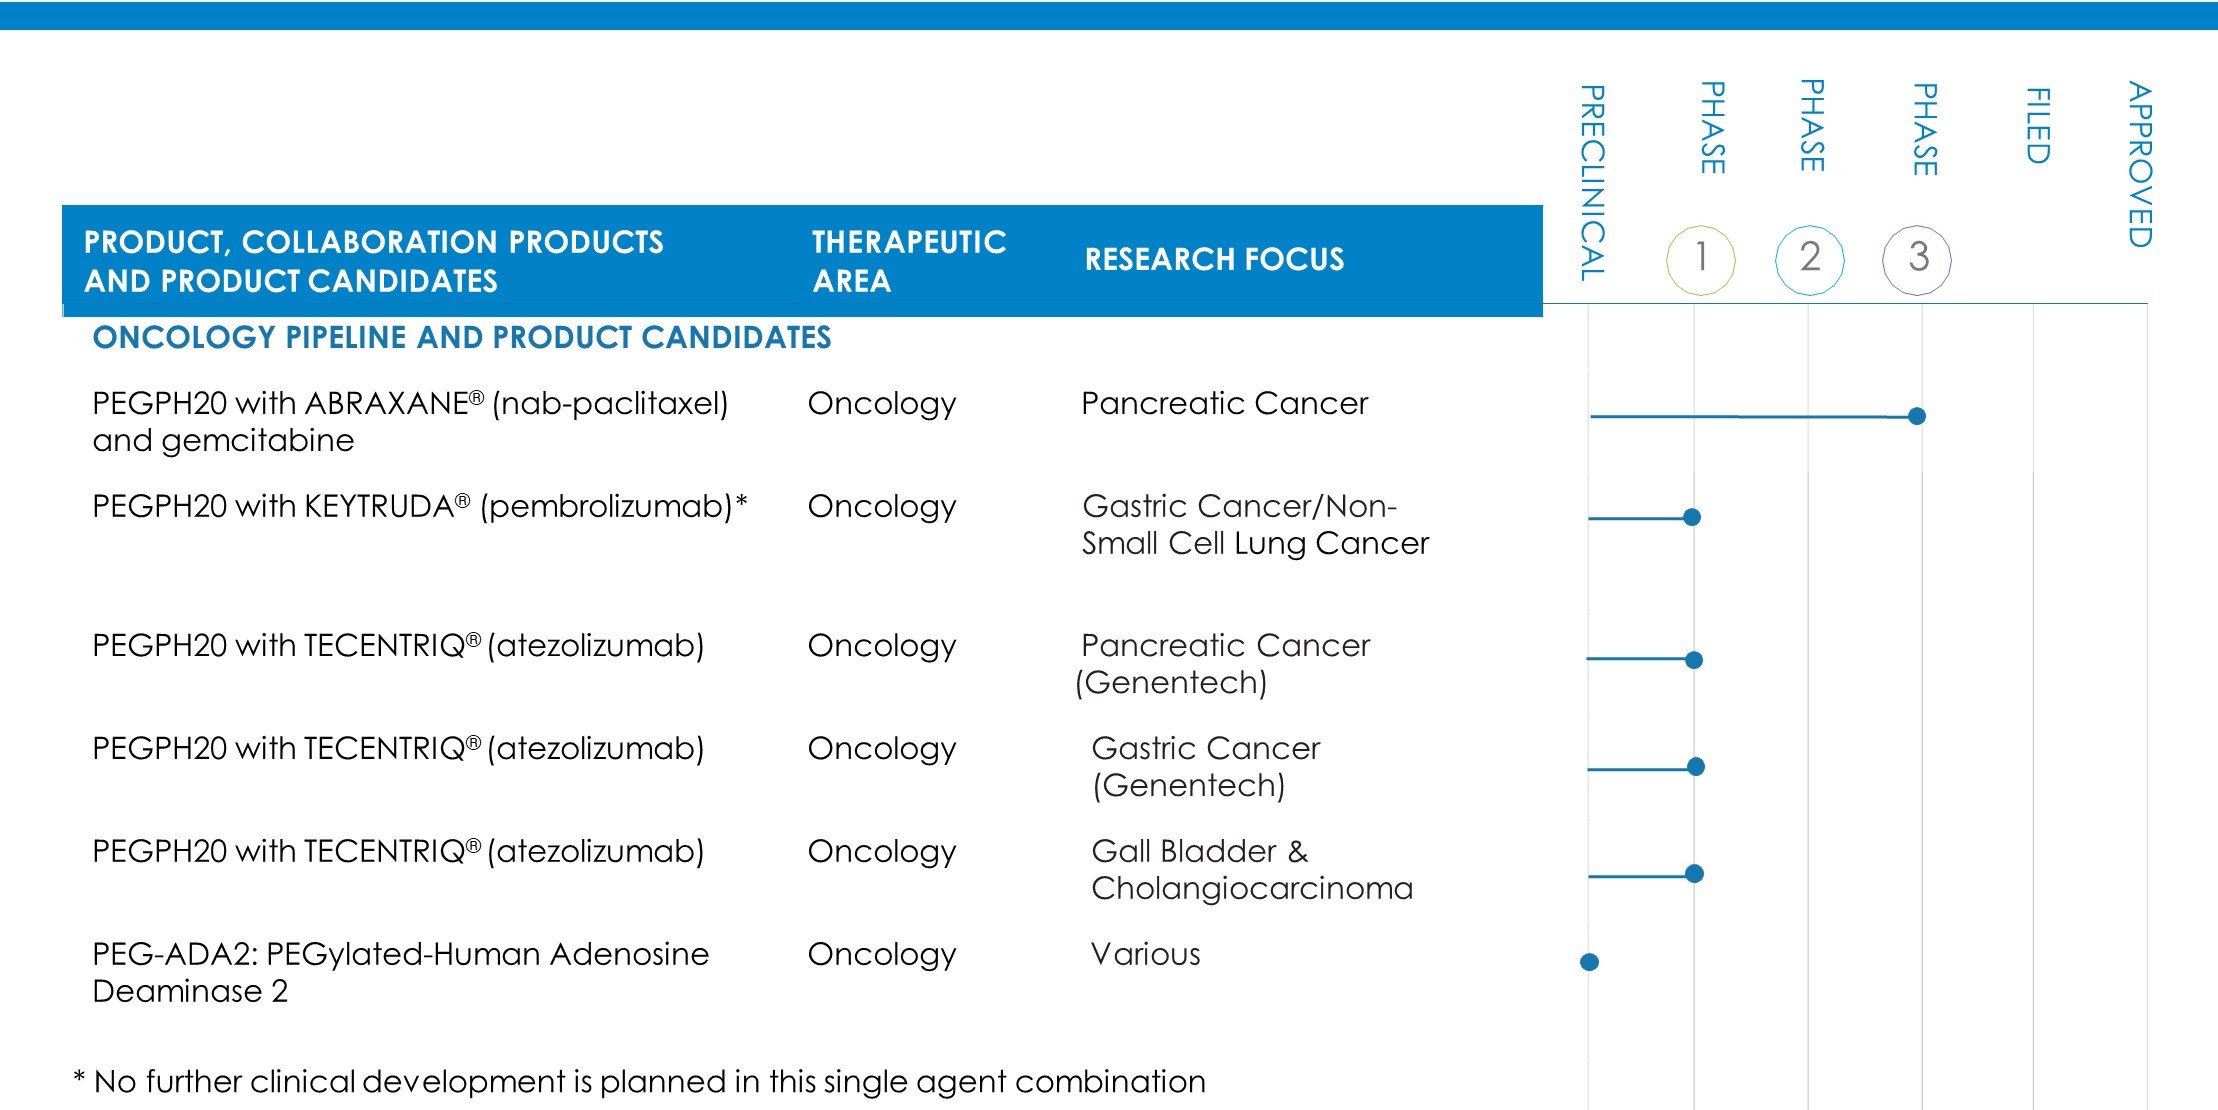
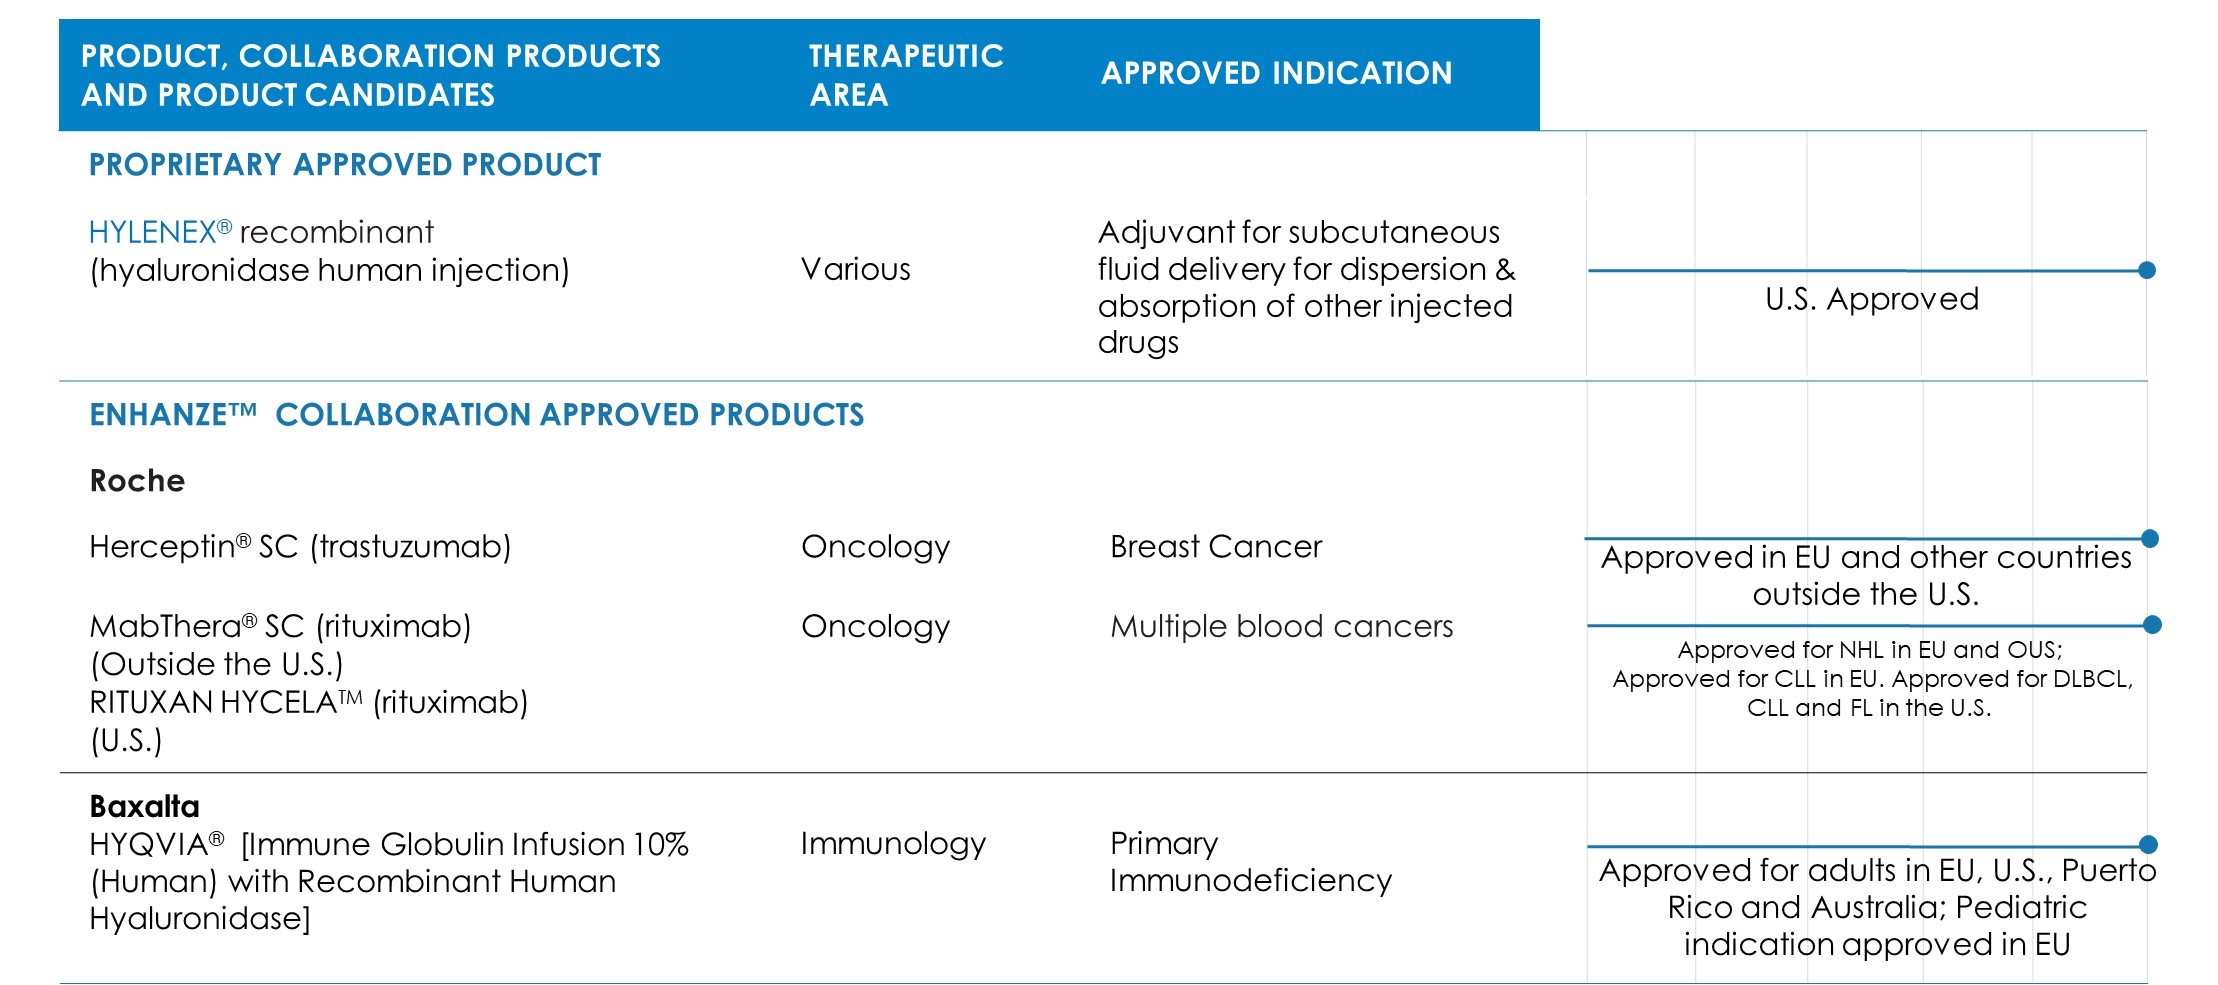
33
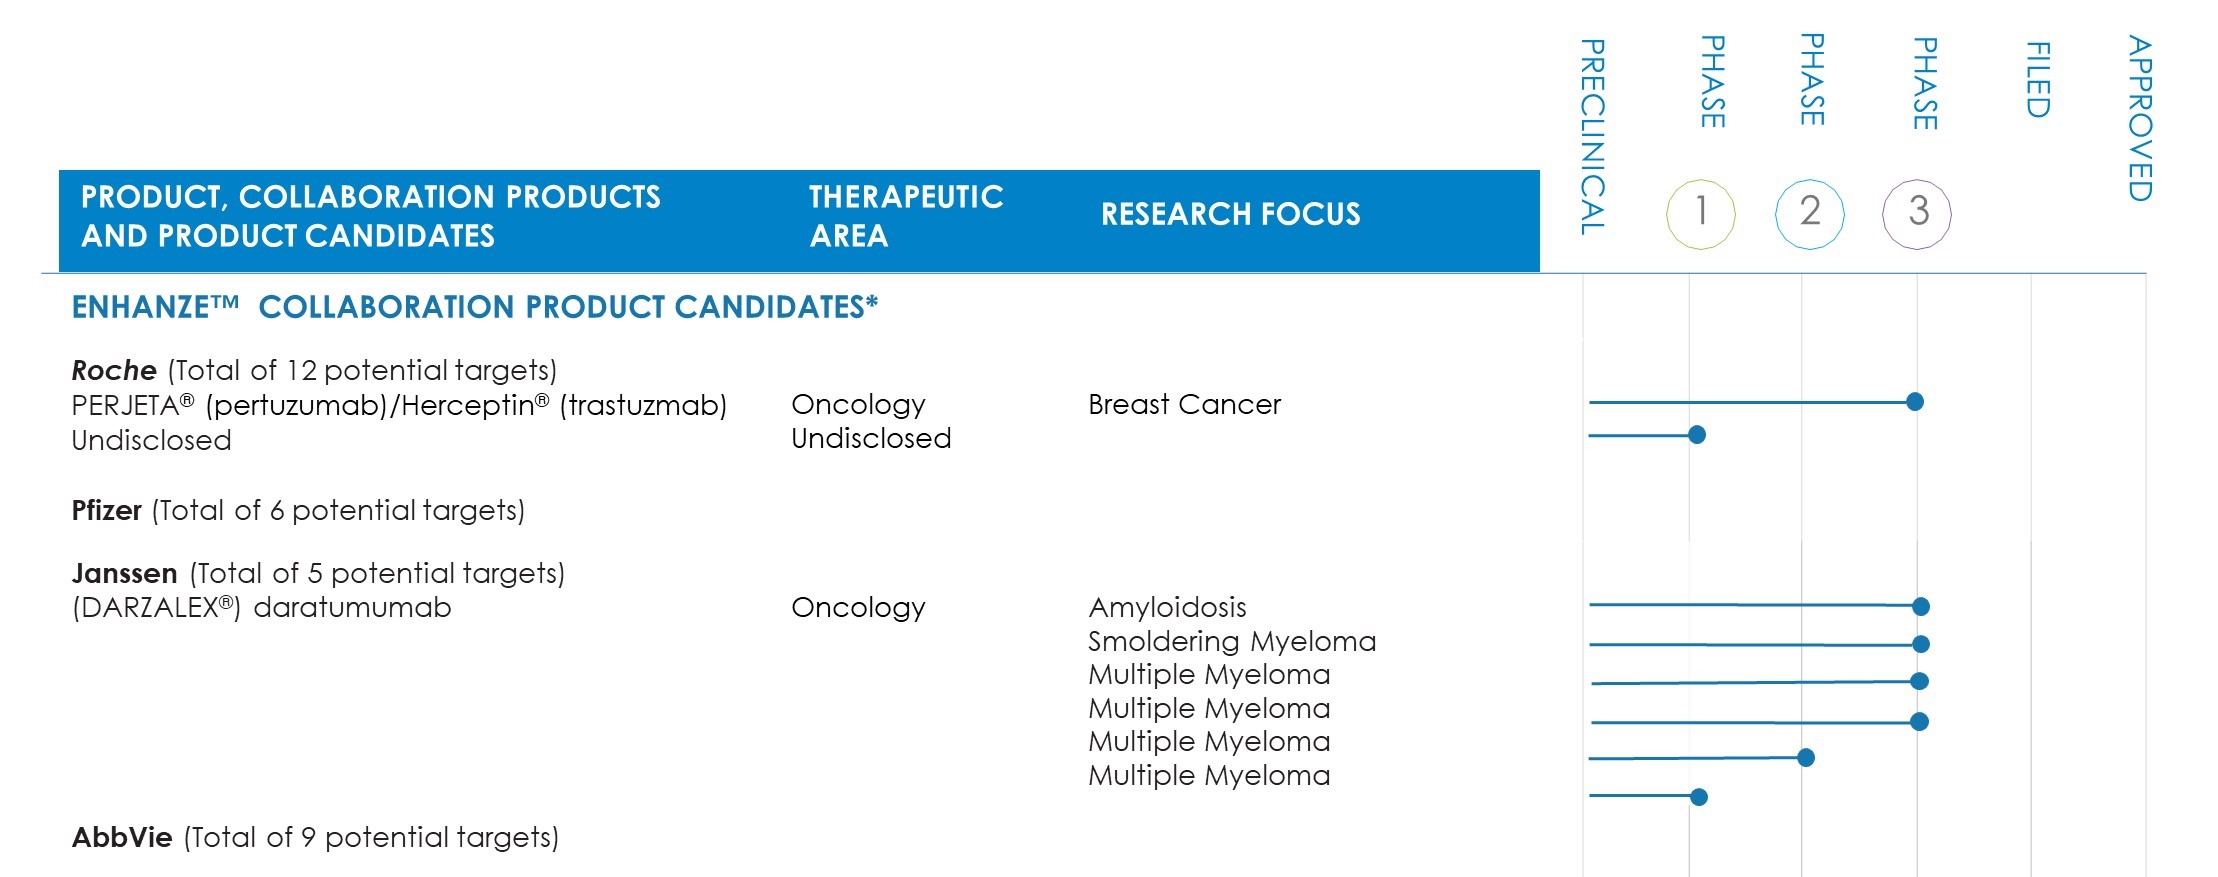
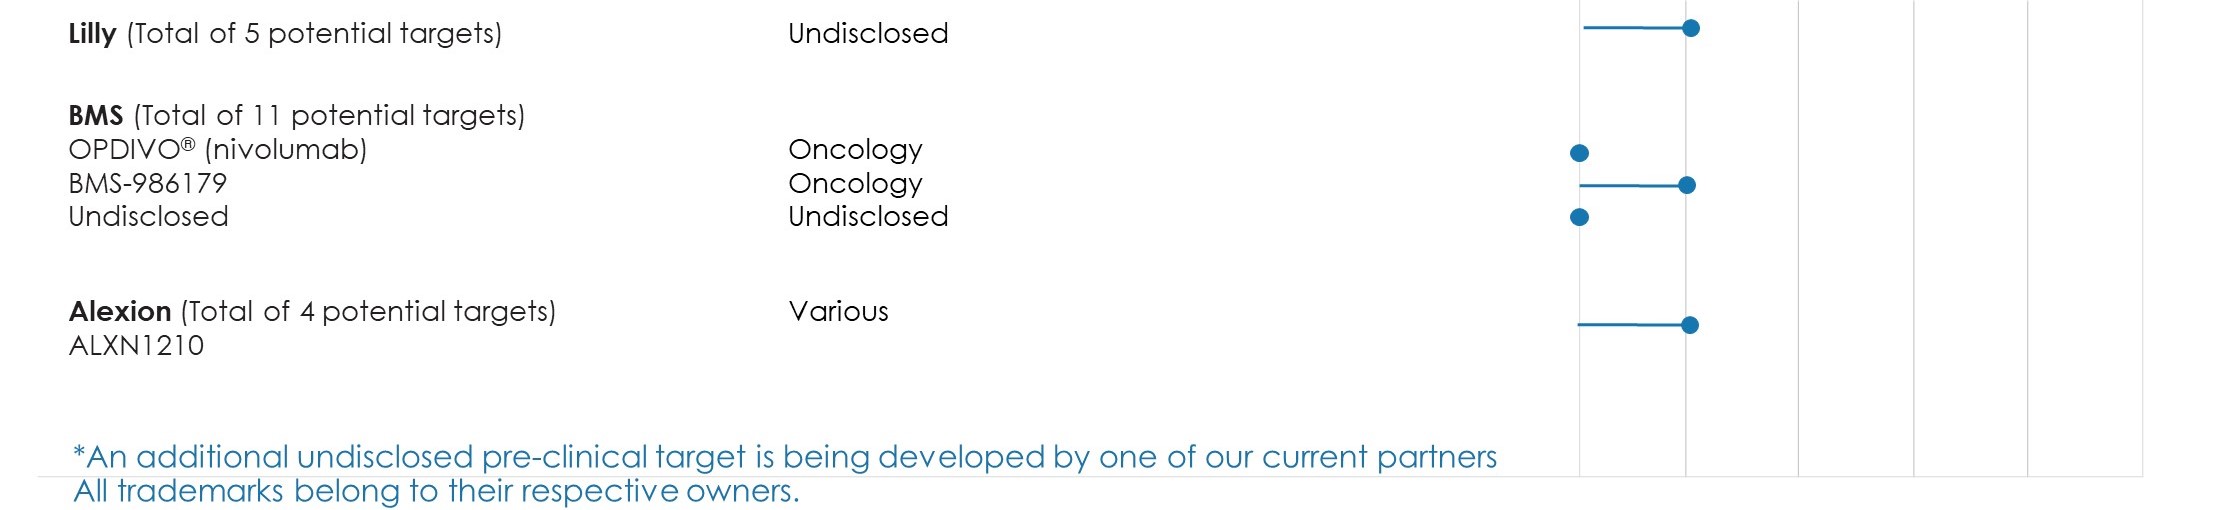
Proprietary Pipeline
Hylenex Recombinant (hyaluronidase human injection)
Hylenex recombinant is a formulation of rHuPH20 that has received U.S. Food and Drug Administration (FDA) approval to facilitate subcutaneous fluid administration for achieving hydration, to increase the dispersion and absorption of other injected drugs and, in subcutaneous urography, to improve resorption of radiopaque agents. Hylenex recombinant is currently the number one prescribed branded hyaluronidase.
PEGPH20
We are developing PEGPH20 in combination with currently approved cancer therapies as a candidate for the systemic treatment of tumors that accumulate HA. ‘PEG’ refers to the attachment of polyethylene glycol to rHuPH20, thereby creating PEGPH20. One of the novel properties of PEGPH20 is that it lasts for an extended duration in the bloodstream and, therefore, can be administered systemically to maintain its therapeutic effect to treat disease.
Cancer malignancies, including pancreatic, lung, breast, gastric, and biliary tract cancers can accumulate high levels of HA and therefore we believe that PEGPH20 has the potential to help patients with these types of cancer when used with certain currently approved cancer therapies. Among solid tumors, PDA has been reported to be associated with one of the highest frequencies of HA accumulation. There are approximately 65,000 annual diagnoses of PDA in the United States and the European Union, and we estimate that 35-40% have high levels of HA based on our companion diagnostic assay cutpoint.
34
The pathologic accumulation of HA, along with other matrix components, creates a unique microenvironment for the growth of tumor cells compared to normal cells. We believe that degrading the HA component of the tumor microenvironment with PEGPH20 remodels the tumor microenvironment, resulting in tumor growth inhibition in animal models. Removal of HA from the tumor microenvironment results in expansion of previously constricted blood vessels allowing increased blood flow, potentially increasing the access of activated immune cells and factors in the blood into the tumor microenvironment. If PEGPH20 is administered in conjunction with other anti-cancer therapies, the increase in blood flow may allow anti-cancer therapies to have greater access to the tumor, which may enhance the treatment effect of therapeutic modalities like chemotherapies, monoclonal antibodies and other agents.
We are developing PEGPH20 as a targeted therapy, for patients who have tumors with high levels of HA. We have a collaboration with Ventana Medical Systems Inc. (Ventana), a member of the Roche Group, to develop, and for Ventana to ultimately commercialize, a companion diagnostic assay for use with PEGPH20. The companion diagnostic assay is being used to identify high levels of HA in tumor biopsies, and may be the first diagnostic to target tumor-associated HA and possibly the first companion diagnostic assay in pancreatic cancer.
Pancreatic cancer indications:
HALO 109-201:
In January 2015, we presented the final results from HALO 109-201, a multi-center, international open label dose escalation Phase 1b clinical study of PEGPH20 in combination with gemcitabine for the treatment of patients with stage IV PDA at the 2015 Gastrointestinal Cancers Symposium (also known as ASCO-GI meeting). This study enrolled 28 patients with previously untreated stage IV PDA. Patients were treated with one of three doses of PEGPH20 (1.0, 1.6 and 3.0 µg/kg twice weekly for four weeks, then weekly thereafter) in combination with gemcitabine 1000 mg/m2 administered intravenously. In this study, the confirmed overall response rate (complete response + partial response confirmed on a second scan as assessed by an independent radiology review) was 29 percent (7 of 24 patients) for those treated at therapeutic dose levels of PEGPH20 (1.6 and 3.0 µg/kg). Median progression-free survival (PFS) was 154 days (95% CI, 50-166) in the efficacy-evaluable population (n = 24). Among efficacy-evaluable patients with baseline tumor HA staining (n = 17), the median PFS in patients with high baseline tumor HA staining (6/17 patients) was substantially longer, 219 days, than in the patients with low baseline tumor HA staining (11/17 patients), 108 days. Median overall survival (OS) was 200 days (95% CI, 123-370) in the efficacy-evaluable population (n = 24). Among efficacy-evaluable patients with baseline tumor HA staining (n = 17), the median OS in patients with high baseline tumor HA staining (6/17 patients) was substantially longer, 395 days, than in the patients with low baseline tumor HA staining (11/17 patients), 174 days. The most common treatment-emergent adverse events (occurring in ≥ 15% of patients) were peripheral edema, muscle spasms, thrombocytopenia, fatigue, myalgia, anemia, and nausea. Thromboembolic (TE) events were reported in 8 patients (28.6%) and musculoskeletal events were reported in 21 patients (75%) which were generally grade 1/2 in severity.
HALO 109-202:
In the second quarter of 2013, we initiated HALO 109-202 (HALO-202), a Phase 2 multicenter randomized clinical trial evaluating PEGPH20 as a first-line therapy for patients with stage IV PDA. The study was designed to enroll patients who would receive gemcitabine and nab-paclitaxel (ABRAXANE®) either with or without PEGPH20. The primary endpoint is to measure the improvement in PFS in patients receiving PEGPH20 plus gemcitabine and ABRAXANE (PAG arm) compared to those who are receiving gemcitabine and ABRAXANE alone (AG arm). In April 2014, after 146 patients had been enrolled, the trial was put on clinical hold by Halozyme and the FDA to assess a question raised by the Data Monitoring Committee regarding a possible difference in the TE events rate between the group of patients treated in the PAG arm versus the group of patients treated in the AG arm. This portion of the study and patients in this portion are now referred to as Stage 1. At the time of the clinical hold all patients remaining in the study continued on gemcitabine and ABRAXANE. In July 2014, HALO-202 was reinitiated (Stage 2) under a revised protocol, which excludes patients that are expected to be at a greater risk for TE events. The revised protocol provides for thromboembolism prophylaxis of all patients in both arms of the study with low molecular weight heparin, and adds evaluation of the TE events rate in Stage 2 PEGPH20-treated patients as a co-primary endpoint. Stage 2 of HALO-202 enrolled an additional 133 patients, to add to the 146 patients already in the clinical trial, with a 2:1 randomization for the PAG arm compared to the AG arm.
35
In March 2016, our partner Ventana received approval for an investigational device exemption (IDE) application from the FDA for our companion diagnostic test to enable patient selection in our Phase 3 Study HALO-301 of PEGPH20 in HA-High patients. Based on the cutpoint for the Ventana diagnostic, we expect approximately 35 to 40 percent of stage IV PDA patients to have HA-High tumors, similar to the previously reported interim results from Stage 1 of Study HALO-202 using the Halozyme prototype assay.
In January 2017, we announced topline results from the combined analysis of Stage 1 and Stage 2, and Stage 2 alone, based on a December 2016 data cutoff. The combined analysis included 135 treated patients in Stage 1, of whom a total of 45 patients (24 in the PAG arm and 21 in the AG arm) were determined to have high HA, and 125 treated patients in Stage 2, of whom a total of 35 patients (24 in the PAG arm and 11 in the AG arm) were determined to have high HA. This analysis of secondary and exploratory endpoints was conducted using the Ventana companion diagnostic to prospectively identify high levels of HA. The key results showed in the combined Stage 1 and Stage 2 dataset:
|
•
|
The primary endpoint of PFS in the efficacy evaluable population (total of 231 patients) was met with statistical significance with a median PFS of 6.0 months in the PAG arm compared to 5.3 months in the AG arm, hazard ratio (HR) with a 95% confidence interval (CI): 0.73 (0.53, 1.00); p=0.048;
|
|
•
|
The secondary endpoint of PFS in the HA-High intent to treat population (total of 84 HA-High patients) was met with statistical significance with a median PFS of 9.2 months in the PAG arm compared to 5.2 months in the AG arm, HR 0.51 (95% CI: 0.26, 1.00); p=0.048;
|
|
•
|
The exploratory analysis of median OS was 11.5 months vs. 8.5 months in the PAG vs. AG arms, respectively, of the combined Stage 1 and Stage 2 HA-High patients. Factors potentially having an impact on these results include less aggressive disease among patients in the AG arm within the Stage 1 patient population, and 9 of the 24 patients in the PAG arm (approximately 40 percent) discontinued PEGPH20 treatment at the time of the clinical hold, resulting in many patients receiving AG alone in both arms.
|
In the Stage 2 cohort population, in a total of 35 HA-High patients, the key results showed:
|
•
|
Median PFS was 8.6 months in the PAG arm compared to 4.5 months in the AG arm, hazard ratio of 0.63 (95% CI: 0.21, 1.93);
|
|
•
|
Median overall survival (OS) was 11.7 months in the PAG arm compared to 7.8 months in the AG arm, hazard ratio of 0.52 (95% CI: 0.22, 1.23);
|
|
•
|
The primary safety endpoint of decreasing the rate of TE events in Stage 2 was also met with the rate of TE events reducing from 43 percent to 10 percent in the PAG arm and from 25 percent to 6 percent in the AG arm, following a protocol amendment that excluded patients at high risk of TE events and with the introduction of prophylaxis with low molecular weight heparin (enoxaparin) in Stage 2 of the study with the current 1mg/kg/day dose of enoxaparin prophylaxis given in both treatment arms of the study.
|
In June 2017, results from Study HALO-202 were presented at the ESMO World Congress of Gastrointestinal Cancer and the Annual Meeting of the American Society of Clinical Oncology (ASCO). In May 2018, the database was locked, an updated analysis is being performed and the Final Study Report is currently being generated. In September 2018 the last remaining patient receiving study medication was discontinued from the study.
HALO 109-301:
In March 2015, we met with the FDA to discuss both the interim efficacy and safety data from HALO-202, which included the potential risk profile including TE event rate. Based on the feedback from that meeting, we proceeded with HALO 109-301 (HALO-301), a Phase 3 clinical study of PEGPH20 in patients with stage IV PDA, using a design allowing for potential marketing application based on PFS (accelerated approval pathway) or OS. The study will enroll patients whose tumors accumulate high levels of HA measured using the Ventana companion diagnostic test. The FDA provided feedback on the current companion diagnostic approach and confirmed that an approved IDE is required for the Phase 3 study.
36
The use of PFS as the basis for marketing approval will be subject to the overall benefit and risk associated with PEGPH20 combined with gemcitabine and ABRAXANE therapy, including the:
|
•
|
Magnitude of the PFS treatment effect observed;
|
|
•
|
Toxicity profile; and
|
|
•
|
Interim OS data.
|
In June 2015, we received scientific advice/protocol assistance from the European Medicines Agency (EMA) regarding our Phase 3 study. The EMA agreed to the patient population, and the use of both PFS and OS as co-primary endpoints stating that OS is the preferred endpoint and that ultimate approval would require an overall positive benefit:risk balance.
In March 2016, we dosed the first patient in HALO-301, a Phase 3 multicenter randomized clinical trial evaluating PEGPH20 as a first-line therapy for patients with stage IV PDA. The study will evaluate the effects on PFS and OS of PEGPH20 with gemcitabine and ABRAXANE compared with gemcitabine and ABRAXANE alone in stage IV PDA patients. In May 2018, our independent Data Safety Monitoring Committee met to review ongoing safety data from the trial and informed us the study should proceed as planned. Over 200 sites in 22 countries located in North America, Europe, South America and Asia have been initiated to participate in the HALO-301 study. An interim analysis will be conducted for our first primary endpoint when we achieve the target number of PFS events. We project that the target number of PFS events will be achieved between December 2018 and February 2019. We project we will have enrolled approximately 500 patients by the end of 2018.
SWOG Study S1313:
In October 2013, SWOG, a cancer research cooperative group of more than 4,000 researchers in over 500 institutions around the world, initiated a 144 patient Phase 1b/2 randomized clinical trial in some of their study centers, examining PEGPH20 in combination with modified FOLFIRINOX chemotherapy compared to modified FOLFIRINOX treatment alone in patients with stage IV PDA, irrespective of HA levels, referred to as an all-comer population. This study was funded by the National Cancer Institute. In March 2017 SWOG stopped enrollment in the Phase 1b/2 trial following a recommendation of SWOG’s independent Data Monitoring committee after a preplanned futility analysis. In January 2018, SWOG presented final data of the all-comers population at the ASCO-GI conference. The median overall survival was 7.7 months for the PEGPH20 arm vs. 14.4 months in the modified FOLFIRINOX alone arm. Also, increased GI-toxicities and substantially shorter median treatment duration for modified FOLFIRINOX were reported for the PEGPH20 arm compared to the modified FOLFIRINOX alone arm. Collection of biopsy samples from participating sites, to the extent available, is ongoing to potentially enable an HA biomarker subgroup analysis. Our PEGPH20 studies and clinical collaborations in combination with agents other than modified FOLFIRINOX continue unchanged.
Clinical collaboration:
In October 2016, we announced that PEGPH20 will be included in a pancreatic cancer clinical trial initiative called Precision Promise, an initiative that aims to change the current treatment approach to pancreatic cancer by offering options to patients based on the molecular profile of their tumor. This is being accomplished through the Pancreatic Cancer Action Network leading a collaboration that brings together clinicians, researchers, and drug developers. Pancreatic Cancer Action Network continues to work to finalize the trial design and protocol which may include a potential PEGPH20 trial arm or trial.
Other indications outside of pancreatic cancer
:
HALO 107-101:
In November 2015, we initiated a Phase 1b study exploring the combination of PEGPH20 and KEYTRUDA
®
, an immuno-oncology agent in relapsed non-small cell lung cancer (NSCLC) and gastric cancer. In December 2016, we identified a dose of PEGPH20, namely 2.2 ug/kg, to move into the dose expansion phase of the study with KEYTRUDA in combination with PEGPH20. In September 2017, our standing Independent Data Monitoring Safety Committee met to review ongoing safety data from the trial and informed us that the study should proceed with study protocol modifications to exclude patients at risk and increase liver safety monitoring, after observing clinical and laboratory signs of hepato-biliary dysfunction. In April 2018 we informed participating sites to stop screening for new patients in the gastric cancer cohort of the study as the overall enrollment goal has been reached. Patients already in screening prior to the notification date were allowed to enter the study contingent of all eligibility
37
criteria being met. Following the results of Merck’s KEYNOTE-189 study evaluating KEYTRUDA in combination with chemotherapy as a first-line treatment, the standard of care in lung cancer is expected to change. As we are seeking to enroll second line immune checkpoint inhibitor naïve patients, we have closed enrollment in the lung cohort of the study and investigators were given the option to continue treatment of ongoing patients.
HALO 107-101 is an ongoing study with an open database and enrollment has ended in both the NSCLC and gastric cancer cohorts. In the NSCLC cohort we enrolled 17 of the target 30 patients in the dose expansion cohort prior to closing enrollment. Two patients are ongoing. Of the 13 currently evaluable patients, four patients experienced a greater than 30% reduction in tumor volume as assessed by investigator sites. Two of these patients had a further scan confirming the greater than 30% reduction was maintained. Of the four patients experiencing a greater than 30% reduction, three were PD-L1 negative, while data was unavailable for the fourth. Discussions are ongoing with advisers and investigators regarding the data and any next steps.
In the gastric cancer cohort, we reached target enrollment of 34 patients in the dose finding and dose expansion cohort. Of the 26 currently evaluable patients, we have seen one responder in a PD-L1 positive patient. This response rate does not meet our threshold to continue development of PEGPH20 in combination with Keytruda alone in gastric cancer.
We continue to collect and receive data on both NSCLC and gastric patients. When the database is considered complete and locked, a Final Study Report will be generated and data presented.
Clinical collaborations:
In July 2015, we entered into a clinical collaboration agreement with Eisai Co., Ltd. (Eisai) to evaluate Eisai's HALAVEN
®
(eribulin) with PEGPH20 in HER2-negative metastatic breast cancer. Halozyme and Eisai jointly share the costs to conduct this global study. In July 2016, the first patient was dosed in a Phase 1b/2 study for patients treated with up to two lines of prior therapy for HER2-negative metastatic breast cancer. In January 2018, the Phase 1b portion of the study closed enrollment with 14 patients. As a result of an Eisai portfolio decision, no further clinical development is planned on the Phase 2 portion of this study. We presented the data from our Phase 1 study in October at the 2018 European Society for Medical Oncology Congress. Based on a data cut off in February 2018, the addition of PEGPH20 to eribulin showed an overall response rate of 28.6% in this single arm trial. A fifth response was reported following the data cut off resulting in a 36% overall response rate, double the response rate reported with single-agent eribulin, in prior studies of patients with HER2-negative metastatic breast cancer. This is our first demonstration of PEGPH20’s positive effect outside of pancreas cancer.
In November 2016, we entered into an agreement with Genentech, a member of the Roche Group, to collaborate on clinical studies to evaluate their cancer immunotherapy Tecentriq, an anti-PD-L1 monoclonal antibody, in combination with PEGPH20, in up to eight different tumor types. Genentech initiated a Phase 1b/2 clinical trial in patients with previously treated metastatic PDA in July 2017 and a Phase 1b/2 clinical trial in patients with gastric cancer in October 2017, as part of its Morpheus master protocol. We will supply PEGPH20 for the Genentech-funded studies. In October 2017, we initiated a Phase 1b/2 clinical trial to assess Tecentriq with PEGPH20 in patients with cholangiocarcinoma and gall bladder cancer (HALO 110-101/MATRIX). Genentech will supply Tecentriq for the Halozyme sponsored study.
Regulatory
The FDA has granted Fast Track designation for our program investigating PEGPH20 in combination with gemcitabine and nab-paclitaxel for the treatment of patients with stage IV PDA to demonstrate an improvement in OS. The Fast Track designation process was developed by the FDA to facilitate the development and expedite the review of drugs to treat serious or life-threatening diseases and address unmet medical needs.
The FDA has granted Orphan Drug designation for PEGPH20 for the treatment of pancreatic cancer. The FDA Office of Orphan Products Development’s mission is to advance the evaluation and development of products (drugs, biologics, devices, or medical foods) that demonstrate promise for the diagnosis and/or treatment of rare diseases or conditions. Similarly, the European Committee for Orphan Medicinal Products of the EMA designated PEGPH20 an orphan medicinal product for the treatment of pancreatic cancer.
38
Other Pipeline Asset
PEG-ADA2:
PEGylated adenosine deaminase 2, or PEG-ADA2, is an immune checkpoint inhibitor that targets adenosine, which may accumulate to high levels in the tumor microenvironment and has been linked to immunosuppression. We are currently in preclinical development with PEG-ADA2 and are exploring potential collaboration or partnership interest in this program prior to making additional investments in the development of PEG-ADA2.
ENHANZE Collaborations
Roche Collaboration
In December 2006, we and Roche entered into a collaboration and license agreement under which Roche obtained a worldwide license to develop and commercialize product combinations of rHuPH20 and up to thirteen Roche target compounds (the Roche Collaboration). Roche initially had the exclusive right to apply rHuPH20 to three pre-defined Roche biologic targets with the option to develop and commercialize rHuPH20 with ten additional targets. Roche had the right to exercise this option to identify additional targets for ten years. As of the ten year anniversary of the Roche Collaboration in December 2016, Roche had elected a total of eight targets, two of which are exclusive.
In September 2013, Roche launched a subcutaneous (SC) formulation of Herceptin (trastuzumab) (Herceptin SC) in Europe for the treatment of patients with HER2-positive breast cancer. This formulation utilizes our patented ENHANZE technology and is administered in two to five minutes, compared to 30 to 90 minutes with the standard intravenous form. Roche received European marketing approval for Herceptin SC in August 2013. Breast cancer is the most common cancer among women worldwide. HER2-positive cancer is reported to be a particularly aggressive form of breast cancer. Directed at the same target, Roche initiated a Phase 1 study of rHuPH20 with PERJETA® (pertuzumab) and Herceptin (trastuzumab) in patients with early breast cancer in March 2016. In June 2018, Roche initiated a global Phase 3 study of a fixed-dose combination of Perjeta® (pertuzumab) and Herceptin (trastuzumab) with ENHANZE in patients with HER2-positive early breast cancer. This study follows supportive Phase 1 results from the same combination shared at the 2017 San Antonio Breast Cancer Symposium. In July 2018, we announced the FDA accepted a BLA from Genentech for a subcutaneous version of Herceptin in its FDA-approved breast cancer indications. This is the same co-formulation with ENHANZE marketed under the Herceptin SC brand in many countries outside the U.S. In September 2018, we announced that Roche received approval from Health Canada for Herceptin SC for the treatment of patients with HER2-positive breast cancer.
In June 2014, Roche launched MabThera SC in Europe for the treatment of patients with common forms of non-Hodgkin lymphoma (NHL). This formulation utilizes our patented ENHANZE technology and is administered in approximately five minutes compared to the approximately 1.5 to 4 hour infusion time for intravenous MabThera. The European Commission approved MabThera SC in March 2014. In May 2016, Roche announced that the EMA approved Mabthera SC to treat patients with chronic lymphocytic leukemia (CLL). In June 2017, the FDA approved Genentech’s RITUXAN HYCELA™, a combination of rituximab and rHuPH20 (approved and marketed under the MabThera SC brand in countries outside the U.S.), for CLL and two types of NHL, follicular lymphoma and diffuse large B-cell lymphoma.
39
In September 2017, we and Roche entered into an agreement providing Roche the right to develop and commercialize one additional exclusive target using our ENHANZE technology. The upfront license payment may be followed by event-based payments subject to Roche’s achievement of specified development, regulatory and sales-based milestones. In addition, Roche will pay royalties to us if products under the collaboration are commercialized.
In January 2018, Roche initiated a Phase 1 study of an undisclosed target with ENHANZE technology.
In October 2018, we entered into an agreement with Roche for the right to develop and commercialize one additional exclusive target and an option to select two additional targets within four years using our ENHANZE technology for an upfront payment of $25.0 million. We will receive potential milestone payments of up to $160.0 million to $165.0 million per target, subject to the achievement of specific development, regulatory and sales-based milestones. We will also receive mid-single digit royalties on sales of commercialized products.
Baxalta Collaboration
In September 2007, we and Baxalta entered into a collaboration and license agreement under which Baxalta obtained a worldwide, exclusive license to develop and commercialize product combinations of rHuPH20 with GAMMAGARD LIQUID (HYQVIA) (the Baxalta Collaboration). HYQVIA is indicated for the treatment of primary immunodeficiency disorders associated with defects in the immune system.
In May 2013, the European Commission granted Baxalta marketing authorization in all EU Member States for the use of HYQVIA (solution for subcutaneous use) as replacement therapy for adult patients with primary and secondary immunodeficiencies. Baxalta launched HYQVIA in the first EU country in July 2013 and has continued to launch in additional countries.
In September 2014, HYQVIA was approved by the FDA for treatment of adult patients with primary immunodeficiency in the U.S. HYQVIA is the first subcutaneous immune globulin (IG) treatment approved for adult primary immunodeficiency patients with a dosing regimen requiring only one infusion up to once per month (every three to four weeks) and one injection site per infusion in most patients, to deliver a full therapeutic dose of IG. Prior to the approval of HYQVIA, the majority of primary immunodeficiency patients received intravenous infusions in a doctor’s office or infusion center, and other subcutaneous IG treatments require weekly or bi-weekly treatment with multiple infusion sites per treatment. The FDA’s approval of HYQVIA was a significant milestone for us as it represented the first U.S. approved BLA which utilizes our rHuPH20 platform.
In May 2016, Baxalta announced that HYQVIA received a marketing authorization from the European Commission for a pediatric indication, which is being launched in Europe to treat primary and certain secondary immunodeficiencies.
Pfizer Collaboration
In December 2012, we and Pfizer entered into a collaboration and license agreement, under which Pfizer has the worldwide license to develop and commercialize products combining our rHuPH20 enzyme with Pfizer proprietary biologics directed to up to six targets in primary care and specialty care indications. Targets may be selected on an exclusive or non-exclusive basis. Pfizer has elected five targets on an exclusive basis and returned two targets.
40
Janssen Collaboration
In December 2014, we and Janssen entered into a collaboration and license agreement, under which Janssen has the worldwide license to develop and commercialize products combining our rHuPH20 enzyme with Janssen proprietary biologics directed to up to five targets. Targets may be selected on an exclusive basis. Janssen has elected CD38 as the first target on an exclusive basis. In November 2015, Janssen initiated dosing in a Phase 1b clinical trial evaluating subcutaneous delivery of DARZALEX (daratumumab), directed at CD38, using ENHANZE technology, in multiple myeloma patients. In December 2016, Janssen announced results of the trial, which supported continued development of daratumumab with rHuPH20. In December 2017, Janssen announced data which demonstrated that subcutaneous administration of DARZALEX and rHuPH20 was well-tolerated, with rates of infusion reactions lower than those observed with IV administration of DARZALEX. Janssen has initiated four Phase 3 studies and one Phase 1 study of daratumumab combined with the ENHANZE technology in patients with Amyloidosis, Smoldering Myeloma and Multiple Myeloma. A Phase 2 study of daratumumab combined with the ENHANZE technology was initiated in the second quarter of 2018 for patients with multiple myeloma.
AbbVie Collaboration
In June 2015, we and AbbVie entered into a collaboration and license agreement, under which AbbVie has the worldwide license to develop and commercialize products combining our rHuPH20 enzyme with AbbVie proprietary biologics directed to up to nine targets. Targets may be selected on an exclusive basis. AbbVie elected one target on an exclusive basis, TNF alpha, for which it has discontinued development and returned the target.
Lilly Collaboration
In December 2015, we and Lilly entered into a collaboration and license agreement, under which Lilly has the worldwide license to develop and commercialize products combining our rHuPH20 enzyme with Lilly proprietary biologics directed to up to five targets. Targets may be selected on an exclusive basis. Lilly has elected two targets on an exclusive basis and one target on a semi-exclusive basis. In August 2017, Lilly initiated a Phase 1 study of an investigational new therapy in combination with rHuPH20.
BMS Collaboration
In September 2017, we and BMS entered into a collaboration and license agreement, which became effective in November 2017, under which BMS has the worldwide license to develop and commercialize products combining our rHuPH20 enzyme with BMS immuno-oncology targets directed at up to eleven targets. Targets may be selected on an exclusive basis, with the exception of one co-exclusive target. BMS has designated multiple immuno-oncology targets including programmed death 1 (PD-1) and has an option to select additional targets within five years from the effective date. In October 2018, BMS dosed the first patient in a Phase 1 study evaluating the safety, pharmacokinetics and pharmacodynamics of BMS-986179, an investigational anti-CD-73 antibody and ENHANZE technology. BMS plans to dose the first patients in a Phase 1 study of OPDIVO® nivolumab with ENHANZE in the fourth quarter of 2018 and a Phase 1 study of an undisclosed target in the first quarter of 2019.
Alexion Collaboration
In December 2017, we and Alexion entered into a collaboration and license agreement, under which Alexion has the worldwide license to develop and commercialize products combining our rHuPH20 enzyme with Alexion’s portfolio of products directed at up to four targets. Targets may be selected on an exclusive basis. Alexion elected two targets on an exclusive basis, including a C5 complement inhibitor and has an option to select two additional targets within five years from the effective date. In August 2018, Alexion initiated a Phase 1 trial to study a next-generation subcutaneous formulation of ALXN1210 with ENHANZE technology.
For a further discussion of the collaboration agreements, refer to Note 4,
Revenue
.
41
Results of Operations
Three Months Ended
September 30, 2018
Compared to
Three Months Ended
September 30, 2017
Royalties
–
Royalty revenue was
$18.7 million
for the
three months ended
September 30, 2018
compared to
$17.1 million
for the three months ended
September 30, 2017
. The increase was driven by higher sales of MabThera SC (RITUXAN HYCELA™ in the U.S.) by Roche. In general, we expect royalty revenue to increase in future periods reflecting expected increases in sales of collaboration products, although there may be periods with flat or declining royalty revenue as sales of products under collaborations vary.
Product Sales, Net
–
Product sales, net were as follows (in thousands):
|
Three Months Ended
|
||||||||||||
|
September 30,
|
||||||||||||
|
2018
|
2017
|
Change
|
||||||||||
|
Sales of bulk rHuPH20:
|
||||||||||||
|
Roche
|
$
|
159
|
|
$
|
5,947
|
|
$
|
(5,788
|
)
|
|||
|
Baxalta
|
—
|
|
3,302
|
|
(3,302
|
)
|
||||||
|
Janssen
|
1,904
|
|
—
|
|
1,904
|
|
||||||
|
Other
|
498
|
|
499
|
|
(1
|
)
|
||||||
|
Sales of ENHANZE drug product
|
27
|
|
—
|
|
27
|
|
||||||
|
Sales of
Hylenex
|
3,681
|
|
3,841
|
|
(160
|
)
|
||||||
|
Total product sales, net
|
$
|
6,269
|
|
$
|
13,589
|
|
$
|
(7,320
|
)
|
|||
Product sales, net decreased in the three months ended
September 30, 2018
compared to the same period in
2017
, mainly due to a decrease in the sales of bulk rHuPH20 to Roche and Baxalta and a decrease in sales of
Hylenex
offset by an increase in sales of bulk rHuPH20 to Janssen. We expect that product sales of bulk rHuPH20 and ENHANZE drug product will fluctuate in future periods based on the needs of our collaborators. In 2016, we performed services for Roche to bring on-line a second contract manufacturing facility for bulk rHuPH20. This new facility may become the primary source for Roche of bulk rHuPH20 once it receives regulatory approval. As a result, we anticipated Roche would deplete their existing inventory of bulk rHuPH20 ahead of the transition to the new facility, which resulted in lower bulk rHuPH20 product sales during 2017 and year to date 2018, and will likely continue to result in lower bulk rHuPH20 product sales during the remainder of 2018. We expect that future product sales of
Hylenex
to be flat or experience modest growth, although there may be periods with declining revenue as we experience competition for market share.
Revenues Under Collaborative Agreements
– Revenues under collaborative agreements were as follows (in thousands):
|
Three Months Ended
|
||||||||||||
|
September 30,
|
||||||||||||
|
2018
|
2017
|
Change
|
||||||||||
|
Upfront license fees, license fees for the election of additional targets,
license maintenance fees and other license fees and event-based
payments:
|
||||||||||||
|
Roche
|
—
|
|
30,831
|
|
(30,831
|
)
|
||||||
|
Baxalta
|
—
|
|
192
|
|
(192
|
)
|
||||||
|
—
|
|
31,023
|
|
(31,023
|
)
|
|||||||
|
Reimbursements for research and development services
|
577
|
|
2,000
|
|
(1,423
|
)
|
||||||
|
Total revenues under collaborative agreements
|
$
|
577
|
|
$
|
33,023
|
|
$
|
(32,446
|
)
|
|||
Revenue from license fees decreased in the three months ended
September 30, 2018
, compared to the same period in
2017
mainly due to a $30.0 million upfront license fee for the Roche Collaboration recognized in the
three months ended
September 30,
42
2017
and no such revenue recognized in the
three months ended
September 30, 2018
. Revenue from upfront licenses fees, license fees for the election of additional targets, license maintenance fees and other license fees and event-based payments vary from period to period based on our ENHANZE collaboration activity. We expect these revenues to continue to fluctuate in future periods based on our collaborators’ abilities to meet various clinical and regulatory milestones set forth in such agreements and our abilities to obtain new collaborative agreements.
Revenue from reimbursements for research and development services decreased in the
three months ended
September 30, 2018
, compared to the same period in
2017
mainly due to a decrease in services provided to Roche related to work associated with bringing on-line a second contract manufacturing facility. The validation of the new facility was completed in the second quarter of 2017 and, therefore, we expect to continue to see a decrease in research and development service revenue from Roche going forward. Research and development services rendered by us on behalf of our collaborators are at the request of the collaborators; therefore, the amount and timing of future revenues related to reimbursable research and development services is uncertain.
Cost of Product Sales
–
Cost of product sales were
$0.6 million
for the
three months ended
September 30, 2018
compared to
$8.3 million
for the
three months ended
September 30, 2017
. The decrease of
$7.7 million
in cost of product sales was mainly due to a decrease in sales of bulk rHuPH20 to Roche and Baxalta.
There were $1.7 million of costs of bulk rHuPH20 and ENHANZE drug product sales for the
three months ended
September 30, 2018
that were previously expensed as research and development. The estimated selling price of the zero-cost inventory of bulk rHuPH20 on hand as of
September 30, 2018
was approximately $2.0 million. We expect to sell this inventory by the end of 2020. After this zero-cost inventory has been consumed, we expect the estimated cost of product sales to be approximately 83% of bulk rHuPH20 product sales revenue.
Research and Development
–
Research and development expenses consist of external costs, salaries and benefits and allocation of facilities and other overhead expenses related to research manufacturing, clinical trials, preclinical and regulatory activities. Research and development expenses incurred were as follows (in thousands):
|
Three Months Ended
|
||||||||||||
|
|
September 30,
|
|||||||||||
|
Programs
|
2018
|
2017
|
Change
|
|||||||||
|
PEGPH20
|
$
|
31,096
|
|
$
|
29,279
|
|
$
|
1,817
|
|
|||
|
ENHANZE collaborations and rHuPH20 platform
|
4,040
|
|
4,081
|
|
(41
|
)
|
||||||
|
Other
|
404
|
|
633
|
|
(229
|
)
|
||||||
|
Total research and development expenses
|
$
|
35,540
|
|
$
|
33,993
|
|
$
|
1,547
|
|
|||
Research and development expenses relating to our PEGPH20 programs for the three months ended
September 30, 2018
increased by
6%
, compared to the same period in
2017
, primarily due to increased clinical trial activities. We expect PEGPH20 program expenses to increase in future periods reflecting expected increases in our PEGPH20 development activities.
Research and development expenses relating to our ENHANZE collaborations and our rHuPH20 platform for the
three months ended
September 30, 2018
decreased by
1%
, compared to the same period in
2017
, primarily due to a decrease in manufacturing expenses related to inventory with no alternative future use, partially offset by increased costs to support new partners and targets related to our ENHANZE collaboration activity. The rHuPH20 platform includes research, development and manufacturing expenses related to our proprietary rHuPH20 enzyme. These expenses were not designated to a specific program at the time the expenses were incurred.
Research and development expenses relating to other programs for the
three months ended
September 30, 2018
decreased by
36%
, compared to the same period in
2017
, due to a decrease in preclinical development of HTI-1511 and PEG-ADA2.
Selling, General and Administrative
–
Selling, general and administrative (SG&A) expenses were
$14.9 million
for the
three months ended
September 30, 2018
compared to
$13.3 million
for the
three months ended
September 30, 2017
. The increase of
$1.6 million
, or
12%
, was primarily due to an increase in market research expenses as we prepare for a potential commercial launch
43
of PEGPH20 and compensation expense including stock compensation. We expect SG&A expenses to increase moderately in future periods as our operations expand.
Interest Expense
–
Interest expense was
$4.3 million
for the
three months ended
September 30, 2018
compared to
$5.5 million
for the
three months ended
September 30, 2017
. The decrease of
$1.2 million
was primarily due to a decrease in the Royalty-backed Loan balance.
Income Tax Expense
–
Income tax expense was
zero
for the
three months ended
September 30, 2018
, compared to
$0.6 million
for the three months ended
September 30, 2017
, which was comprised of U.S. federal alternative minimum tax.
Nine Months Ended
September 30, 2018
Compared to
Nine Months Ended
September 30, 2017
Royalties
–
Royalty revenue was
$59.6 million
for the
nine
months ended
September 30, 2018
compared to
$45.8 million
for the
nine
months ended
September 30, 2017
. The increase was driven by higher sales of Herceptin SC and MabThera SC (RITUXAN HYCELA in the U.S.) by Roche and of HYQVIA by Baxalta. In general, we expect royalty revenue to increase in future periods reflecting expected increases in sales of collaboration products, although there may be periods with flat or declining royalty revenue as sales of products under collaborations vary.
Product Sales, Net
–
Product sales, net were as follows (in thousands):
|
Nine Months Ended
|
||||||||||||
|
September 30,
|
||||||||||||
|
2018
|
2017
|
Change
|
||||||||||
|
Sales of bulk rHuPH20
|
||||||||||||
|
Roche
|
$
|
2,290
|
|
$
|
16,543
|
|
$
|
(14,253
|
)
|
|||
|
Baxalta
|
712
|
|
9,328
|
|
(8,616
|
)
|
||||||
|
Janssen
|
2,510
|
|
—
|
|
2,510
|
|
||||||
|
Other
|
998
|
|
954
|
|
44
|
|
||||||
|
Sales of ENHANZE drug product
|
162
|
|
—
|
|
162
|
|
||||||
|
Sales of
Hylenex
|
10,881
|
|
10,978
|
|
(97
|
)
|
||||||
|
Total product sales, net
|
$
|
17,553
|
|
$
|
37,803
|
|
$
|
(20,250
|
)
|
|||
Product sales, net decreased in the
nine
months ended
September 30, 2018
compared to the same period in
2017
, primarily due to a decrease in the sale of bulk rHuPH20 to Roche and Baxalta offset by an increase in sales of bulk rHuPH20 to Janssen. We expect that product sales of bulk rHuPH20 and ENHANZE drug product will fluctuate in future periods based on the needs of our collaborators. In 2016, we performed services for Roche to bring on-line a second contract manufacturing facility for bulk rHuPH20. This new facility may become the primary source for Roche of bulk rHuPH20 once it receives regulatory approval. As a result, we anticipated Roche would deplete their existing inventory of rHuPH20 ahead of the transition to the new facility, which resulted in lower bulk rHuPH20 product sales during 2017 and year to date 2018, and will likely continue to result in lower bulk rHuPH20 product sales during the remainder of 2018. We expect that future product sales of
Hylenex
to be flat or experience modest growth, although there may be periods with declining revenue as we experience competition for market share.
44
Revenues Under Collaborative Agreements
– Revenues under collaborative agreements were as follows (in thousands):
|
Nine Months Ended
|
||||||||||||
|
September 30,
|
||||||||||||
|
2018
|
2017
|
Change
|
||||||||||
|
Upfront license fees, license fees for the election of additional targets, license maintenance fees and amortization of deferred upfront and other license fees and event-based payments:
|
||||||||||||
|
BMS
|
$
|
6,336
|
|
$
|
—
|
|
$
|
6,336
|
|
|||
|
Alexion
|
5,000
|
|
—
|
|
5,000
|
|
||||||
|
Roche
|
1,000
|
|
32,496
|
|
(31,496
|
)
|
||||||
|
Baxalta
|
—
|
|
574
|
|
(574
|
)
|
||||||
|
12,336
|
|
33,070
|
|
(20,734
|
)
|
|||||||
|
Reimbursements for research and development services
|
2,098
|
|
10,337
|
|
(8,239
|
)
|
||||||
|
Total revenues under collaborative agreements
|
$
|
14,434
|
|
$
|
43,407
|
|
$
|
(28,973
|
)
|
|||
Revenue from license fees decreased in the
nine
months ended
September 30, 2018
, compared to the same period in
2017
due to a $30.0 million upfront license fee for the Roche Collaboration recognized in the
nine months ended
September 30, 2017
compared to $12.3 million in upfront and milestone revenue for the BMS, Alexion and Roche Collaborations recognized in the
nine months ended
September 30, 2018
. Revenue from upfront licenses fees, license fees for the election of additional targets, license maintenance fees and other license fees and event-based payments vary from period to period based on our ENHANZE collaboration activity. We expect these revenues to continue to fluctuate in future periods based on our collaborators’ abilities to meet various clinical and regulatory milestones set forth in such agreements and our abilities to obtain new collaborative agreements.
Revenue from reimbursements for research and development services decreased in the
nine
months ended
September 30, 2018
, compared to the same period in
2017
mainly due to a decrease in services provided to Roche related to the validation of a new manufacturing facility, partially offset by an increase in services provided to Janssen and Baxalta. The validation of the new Roche facility was completed in the second quarter of 2017 and, therefore, we expect to continue to see a decrease in research and development service revenue from Roche going forward. Research and development services rendered by us on behalf of our collaborators are at the request of the collaborators; therefore, the amount of future revenues related to reimbursable research and development services is uncertain. We expect the non-reimbursement revenues under our collaborative agreements to continue to fluctuate in future periods based on our collaborators’ abilities to meet various clinical and regulatory milestones set forth in such agreements and our abilities to obtain new collaborative agreements.
Cost of Product Sales
–
Cost of product sales were
$4.5 million
for the
nine
months ended
September 30, 2018
compared to
$23.7 million
for the
nine
months ended
September 30, 2017
. The decrease of
$19.2 million
in cost of product sales was mainly due to a decrease in sales of bulk rHuPH20 to Roche and Baxalta. There were $2.3 million in costs of bulk rHuPH20 and ENHANZE drug product sales for the
nine
months ended
September 30, 2018
that were previously expensed as research and development.
45
Research and Development
–
Research and development expenses consist of external costs, salaries and benefits and allocation of facilities and other overhead expenses related to research manufacturing, clinical trials, preclinical and regulatory activities. Research and development expenses incurred were as follows (in thousands):
|
Nine Months Ended
|
||||||||||||
|
|
September 30,
|
|||||||||||
|
Programs
|
2018
|
2017
|
Change
|
|||||||||
|
PEGPH20
|
$
|
99,026
|
|
$
|
89,023
|
|
$
|
10,003
|
|
|||
|
ENHANZE collaborations and rHuPH20 platform
|
13,309
|
|
13,305
|
|
4
|
|
||||||
|
Other
|
1,267
|
|
6,939
|
|
(5,672
|
)
|
||||||
|
Total research and development expenses
|
$
|
113,602
|
|
$
|
109,267
|
|
$
|
4,335
|
|
|||
Research and development expenses relating to our PEGPH20 program for the
nine
months ended
September 30, 2018
increased by
11%
, compared to the same period in
2017
, primarily due to increased clinical trial activities. We expect these expenses to increase in future periods reflecting expected increases in our PEGPH20 development activities.
Research and development expenses relating to our ENHANZE collaborations and our rHuPH20 platform for the
nine
months ended
September 30, 2018
remained flat compared to the same period in
2017
, primarily due to a decrease in manufacturing expenses related to Roche’s second contract manufacturing facility and a decrease in manufacturing inventory with no alternative future use, offset by increased costs to support new partners and targets related to our ENHANZE collaboration activity. The rHuPH20 platform includes research, development and manufacturing expenses related to our proprietary rHuPH20 enzyme. These expenses were not designated to a specific program at the time the expenses were incurred.
Research and development expenses relating to other programs for the
nine
months ended
September 30, 2018
decreased by
82%
, compared to the same period in
2017
, due to a decrease in preclinical development of HTI-1511 and PEG-ADA2.
Selling, General and Administrative
–
SG&A expenses were
$42.8 million
for the
nine
months ended
September 30, 2018
compared to
$39.0 million
for the
nine
months ended
September 30, 2017
. The increase of
$3.8 million
, or
10%
, was primarily due to an increase in market research expense as we prepare for a potential commercial launch of PEGPH20 and compensation expense including stock compensation. We expect SG&A expenses to increase moderately in future periods as our operations expand.
Interest Expense
–
Interest expense was
$14.3 million
for the
nine
months ended
September 30, 2018
compared to
$16.5 million
for the
nine
months ended
September 30, 2017
. The decrease of
$2.2 million
was primarily due to a decrease in the Royalty-backed Loan balance.
Income Tax Expense
–
Income tax expense was
$0.2 million
for the
nine
months ended
September 30, 2018
, which was comprised of state taxes, compared to
$1.0 million
for the
nine
months ended
September 30, 2017
, which was comprised of U.S. federal alternative minimum tax.
Liquidity and Capital Resources
Overview
Our principal sources of liquidity are our existing cash, cash equivalents and available-for-sale marketable securities. As of
September 30, 2018
, we had cash, cash equivalents and marketable securities of
$364.4 million
. We will continue to have significant cash requirements to support product development activities. The amount and timing of cash requirements and cash on hand will depend on the progress and success of our clinical development programs, regulatory and market acceptance, the resources we devote to research and commercialization activities and the achievement of various milestones and royalties under our existing collaborative agreements.
46
We believe that our current cash, cash equivalents and marketable securities will be sufficient to fund our operations for at least the next twelve months. We expect to fund our operations going forward with existing cash resources, anticipated revenues from our existing collaborations and cash that we may raise through future transactions. We may raise cash through any one of the following financing vehicles: (i) the public offering of securities; (ii) new collaborative agreements; (iii) expansions or revisions to existing collaborative relationships; (iv) private financings; (v) other equity or debt financings; and/or (vi) monetizing assets.
In February 2017, we filed an automatic shelf registration statement on Form S-3 (Registration No. 333-216315) with the SEC, which allow us, from time to time, to offer and sell equity, debt securities and warrants to purchase any of such securities, either individually or in units. In May 2017, we completed an underwritten public offering pursuant to which we sold 11.5 million shares of common stock, generating $134.9 million in net proceeds, after deducting underwriting discounts and commissions and other offering expenses. We may, in the future, offer and sell additional equity, debt securities and warrants to purchase any of such securities, either individually or in units to raise capital to fund the continued development of our product candidates, the commercialization of our products or for other general corporate purposes.
Our existing cash, cash equivalents and marketable securities may not be adequate to fund our operations until we become profitable, if ever. We cannot be certain that additional financing will be available when needed or, if available, financing will be obtained on favorable terms. If we are unable to raise sufficient funds, we may need to delay, scale back or eliminate some or all of our research and development programs, delay the launch of our product candidates, if approved, and/or restructure our operations. If we raise additional funds by issuing equity securities, substantial dilution to existing stockholders could result. If we raise additional funds by incurring debt financing, the terms of the debt may involve significant cash payment obligations, the issuance of warrants that may ultimately dilute existing stockholders when exercised and covenants that may restrict our ability to operate our business.
Cash Flows
Operating Activities
Net cash used in operations was
$60.0 million
for the
nine months ended
September 30, 2018
compared to
$19.2 million
for the
nine months ended
September 30, 2017
. The $40.8 million increase in utilization of cash in operations was mainly due to an increase in working capital for the
nine
months ended
September 30, 2018
compared to the corresponding period in the prior year.
Investing Activities
Net cash used in investing activities was
$8.3 million
for the
nine months ended
September 30, 2018
compared to
$14.7 million
for the
nine months ended
September 30, 2017
. The decrease in net cash used in investing activities was primarily due to an increase in proceeds from maturities of marketable securities for the
nine months ended
September 30, 2018
.
Financing Activities
Net cash used in financing activities was
$45.4 million
for the
nine months ended
September 30, 2018
, compared to net cash provided by financing activities of
$131.6 million
for the
nine months ended
September 30, 2017
, mainly due to $134.9 million in net proceeds from the sale of common stock in a public offering in May 2017 compared to no sale of common stock in a public offering occurring and increased amount of repayments of long-term debt in the nine months ended September 30, 2018.
47
Long-Term Debt
Royalty-backed Loan
In January 2016, through our wholly-owned subsidiary Halozyme Royalty LLC (Halozyme Royalty), we received a $150 million loan (the Royalty-backed Loan) pursuant to a credit agreement (the Credit Agreement) with BioPharma Credit Investments IV Sub, LP and Athyrium Opportunities II Acquisition LP (the Royalty-backed Lenders). Under the terms of the Credit Agreement, Halozyme Therapeutics, Inc. transferred to Halozyme Royalty the right to receive royalty payments from the commercial sales of ENHANZE products owed under the Roche Collaboration and Baxalta Collaboration (Collaboration Agreements). The royalty payments from the Collaboration Agreements will be used to repay the principal and interest on the loan (the Royalty Payments). The Royalty-backed Loan bears interest at a per annum rate of 8.75% plus the three-month LIBOR rate. The three-month LIBOR rate is subject to a floor of 0.7% and a cap of 1.5%. The interest rate as of
September 30, 2018
was
10.25%
. The outstanding balance of the Royalty-backed Loan as of
September 30, 2018
was
$101.0 million
net of unamortized debt discount of $0.4 million.
The Credit Agreement provides that none of the Royalty Payments were required to be applied to the Royalty-backed Loan prior to January 1, 2017, 50% of the Royalty Payments were required to be applied to the Royalty-backed Loan between January 1, 2017 and January 1, 2018 and thereafter all Royalty Payments must be applied to the Royalty-backed Loan. However, the amounts available to repay the Royalty-backed Loan are subject to caps of $13.75 million per quarter in 2017, $18.75 million per quarter in 2018, $21.25 million per quarter in 2019 and $22.5 million per quarter in 2020 and thereafter. Amounts available to repay the Royalty-backed Loan will be applied first, to pay interest and second, to repay principal on the Royalty-backed Loan. Any accrued interest that is not paid on any applicable quarterly payment date, as defined, will be capitalized and added to the principal balance of the Royalty-backed Loan on such date. Halozyme Royalty will be entitled to receive and distribute to Halozyme any Royalty Payments that are not required to be applied to the Royalty-backed Loan or which are in excess of the foregoing caps.
The final maturity date of the Royalty-backed Loan will be the earlier of (i) the date when principal and interest is paid in full, (ii) the termination of Halozyme Royalty’s right to receive royalties under the Collaboration Agreements, and (iii) December 31, 2050. Currently, we estimate that the loan will be repaid in the first quarter of 2020. This estimate could be adversely affected and the repayment period could be extended if future royalty amounts are less than currently expected. Under the terms of the Credit Agreement, at any time after January 1, 2019, Halozyme Royalty may, subject to certain limitations, prepay the outstanding principal of the Royalty-backed Loan in whole or in part, at a price equal to 105% of the outstanding principal on the Royalty-backed Loan, plus accrued but unpaid interest. The Royalty-backed Loan constitutes an obligation of Halozyme Royalty, and is non-recourse to Halozyme. Halozyme Royalty retains its right to the Royalty Payments following repayment of the loan.
Oxford and SVB Loan and Security Agreement
In June 2016, we entered into a Loan and Security Agreement (the Loan Agreement) with Oxford Finance LLC (Oxford) and Silicon Valley Bank (SVB) (collectively, the Lenders), providing a senior secured loan facility of up to an aggregate principal amount of $70 million, comprising a $55.0 million draw in June 2016 and an additional $15.0 million tranche, which we had the option to draw during the second quarter of 2017 and did not exercise. The proceeds were partially used to pay the outstanding principal and final payment owed on a previous loan agreement with the Lenders. The remaining proceeds are being used for working capital and general business requirements. The Loan Agreement repayment schedule provides for interest only payments for the first 18 months, followed by consecutive equal monthly payments of principal and interest in arrears through the maturity date of January 1, 2021. The Loan Agreement provides for a final payment equal to 5.50% of the initial $55 million principal amount. The final payment is due when the Loan Agreement becomes due or upon the prepayment of the facility. We have the option to prepay the outstanding balance of the Loan Agreement in full, subject to a prepayment fee of 2% in the first year and 1% in the second year of the term loan. The Loan Agreement carries a fixed interest rate of
8.25%
. The outstanding term loan balance was
$45.5 million
as of
September 30, 2018
net of unamortized debt discount of $1.2 million.
48
The Loan Agreement is secured by substantially all of the assets of the Company and its subsidiary, Halozyme, Inc., except that the collateral does not include any equity interests in Halozyme, Inc. and any intellectual property (including all licensing, collaboration and similar agreements relating thereto), and certain other excluded assets. The Loan Agreement contains customary representations, warranties and covenants by us, which covenants limit our ability to convey, sell, lease, transfer, assign or otherwise dispose of certain of our assets; engage in any business other than the businesses currently engaged in by us or reasonably related thereto; liquidate or dissolve; make certain management changes; undergo certain change of control events; create, incur, assume, or be liable with respect to certain indebtedness; grant certain liens; pay dividends and make certain other restricted payments; make certain investments; make payments on any subordinated debt; enter into transactions with any of our affiliates outside of the ordinary course of business or permit our subsidiaries to do the same; and make any voluntary prepayment of or modify certain terms of the Royalty-backed Loan. In addition, subject to certain exceptions, we are required to maintain with SVB our primary deposit accounts, securities accounts and commodities, and to do the same for our domestic subsidiary.
The Loan Agreement also contains customary indemnification obligations and customary events of default, including, among other things, our failure to fulfill certain of our obligations under the Loan Agreement and the occurrence of a material adverse change which is defined as a material adverse change in our business, operations or condition (financial or otherwise), a material impairment of the prospect of repayment of any portion of the loan, a material impairment in the perfection or priority of the Lender’s lien in the collateral or in the value of such collateral or the occurrence of an event of default under the Royalty-backed Loan. In the event of default by us under the Loan Agreement, the Lenders would be entitled to exercise their remedies thereunder, including the right to accelerate the debt, upon which we may be required to repay all amounts then outstanding under the Loan Agreement, which could harm our financial condition.
Off-Balance Sheet Arrangements
As of
September 30, 2018
, we did not have any relationships with unconsolidated entities or financial partnerships, such as entities often referred to as structured finance or special purpose entities, which would have been established for the purpose of facilitating off-balance sheet arrangements or other contractually narrow or limited purposes. In addition, we did not engage in trading activities involving non-exchange traded contracts. As such, we are not materially exposed to any financing, liquidity, market or credit risk that could arise if we had engaged in such relationships.
Critical Accounting Policies and Estimates
The discussion and analysis of our financial condition and results of operations are based on our condensed consolidated financial statements, which have been prepared in accordance with U.S. generally accepted accounting principles, or U.S. GAAP. The preparation of our condensed consolidated financial statements requires us to make estimates and judgments that affect the reported amounts of assets, liabilities, revenues and expenses and related disclosure of contingent assets and liabilities.
As described in our 2017 Form 10-K, the most critical accounting policies and estimates upon which our condensed consolidated financial statements were prepared were those relating to revenue recognition, debt classification, stock compensation and research and development expenses - clinical trials. We have reviewed our policies and estimates and determined that these remain the most critical accounting policies and estimates for the nine months ended September 30, 2018. We have updated our revenue recognition policies in conjunction with our adoption of ASC 606 as further described in Note 2 to the accompanying financial statements. Readers should refer to our 2017 Form 10-K under “Management’s Discussion and Analysis of Financial Condition and Results of Operations - Critical Accounting Estimates” and Note 1 to the accompanying financial statements for descriptions of these policies and estimates.
Recent Accounting Pronouncements
Refer to Note 2,
Summary of Significant Accounting Policies
, of our condensed consolidated financial statements for a discussion of recent accounting pronouncements and their effect, if any.
49
Risk Factors
Risks Related To Our Business
We have generated only limited revenues from product sales to date; we have a history of net losses and negative cash flows, and we may never achieve or maintain profitability.
Relative to expenses incurred in our operations, we have generated only limited revenues from product sales, royalties, licensing fees, milestone payments, bulk rHuPH20 supply payments and research reimbursements to date and we may never generate sufficient revenues from future product sales, licensing fees and milestone payments to offset expenses. Even if we ultimately do achieve significant revenues from product sales, royalties, licensing fees, research reimbursements, bulk rHuPH20 supply payments and/or milestone payments, we expect to incur significant operating losses over the next few years and we may never become profitable on an extended basis. Through
September 30, 2018
, we have incurred aggregate net losses of
$529.3 million
.
If our product candidates do not receive and maintain regulatory approvals, or if approvals are not obtained in a timely manner, such failure or delay would substantially impair our ability to generate revenues.
Approval from the FDA or equivalent health authorities is necessary to manufacture and market pharmaceutical products in the U.S. and the other countries in which we anticipate doing business have similar requirements. The process for obtaining FDA and other regulatory approvals is extensive, time-consuming, risky and costly, and there is no guarantee that the FDA or other regulatory bodies will approve any applications that may be filed with respect to any of our product candidates, or that the timing of any such approval will be appropriate for the desired product launch schedule for a product candidate. We and our collaborators attempt to provide guidance as to the timing for the filing and acceptance of such regulatory approvals, but such filings and approvals may not occur when we or our collaborators expect, or at all. The FDA or other foreign regulatory agency may refuse or delay approval of our product candidates for failure to collect sufficient clinical or animal safety data and require us or our collaborators to conduct additional clinical or animal safety studies which may cause lengthy delays and increased costs to our programs. For example, the approval of Baxalta’s HYQVIA BLA in the U.S. was delayed until we and Baxalta provided additional preclinical data sufficient to address concerns regarding non-neutralizing antibodies to rHuPH20 that were detected in the registration trial. Although these antibodies have not been associated with any known adverse clinical effects, and the HYQVIA BLA was approved by the FDA in September 2014, we cannot assure you that they will not arise and have an adverse impact on future development of products which include rHuPH20, future sales of
Hylenex
recombinant, our ability to enter into collaborations, or be raised by the FDA or other health authorities in connection with testing or approval of products including rHuPH20.
We and our collaborators may not be successful in obtaining approvals for any additional potential products in a timely manner, or at all. Refer to the risk factor titled “
Our proprietary and collaboration product candidates or companion diagnostic assays may not receive regulatory approvals or their development may be delayed for a variety of reasons, including delayed or unsuccessful clinical trials, regulatory requirements or safety concerns
” for additional information relating to the approval of product candidates.
Additionally, even with respect to products which have been approved for commercialization, in order to continue to manufacture and market pharmaceutical products, we or our collaborators must maintain our regulatory approvals. If we or any of our collaborators are unsuccessful in maintaining our regulatory approvals, our ability to generate revenues would be adversely affected.
50
We may need to raise additional capital in the future and there can be no assurance that we will be able to obtain such funds.
We may need to raise additional capital in the future to continue the development of our product candidates or for other current corporate purposes. Our current cash reserves and expected revenues during the next few years will not be sufficient for us to continue the development of our proprietary product candidates, to fund general operations and conduct our business at the level desired. In addition, if we engage in acquisitions of companies, products or technologies in order to execute our business strategy, we may need to raise additional capital. We may raise additional capital in the future through one or more financing vehicles that may be available to us including (i) the public offering of securities; (ii) new collaborative agreements; (iii) expansions or revisions to existing collaborative relationships; (iv) private financings; (v) other equity or debt financings; and/or (vi) monetizing assets.
In view of our stage of development, business prospects, the nature of our capital structure and general market conditions, if we are required to raise additional capital in the future, the additional financing may not be available on favorable terms, or at all. If additional capital is not available on favorable terms when needed, we will be required to raise capital on adverse terms or significantly reduce operating expenses through the restructuring of our operations or deferral of one or more product development programs. If we raise additional capital, a substantial number of additional shares may be issued, which may negatively affect our stock price and these additional shares will dilute the ownership interest of our current investors.
Use of our product candidates or those of our collaborators could be associated with side effects or adverse events.
As with most pharmaceutical products, use of our product candidates or those of our collaborators could be associated with side effects or adverse events which can vary in severity (from minor reactions to death) and frequency (infrequent or prevalent). Side effects or adverse events associated with the use of our product candidates or those of our collaborators may be observed at any time, including in clinical trials or when a product is commercialized, and any such side effects or adverse events may negatively affect our or our collaborators’ ability to obtain or maintain regulatory approval or market our product candidates. Side effects such as toxicity or other safety issues associated with the use of our product candidates or those of our collaborators could require us or our collaborators to perform additional studies or halt development or commercialization of these product candidates or expose us to product liability lawsuits which will harm our business. We or our collaborators may be required by regulatory agencies to conduct additional animal or human studies regarding the safety and efficacy of our pharmaceutical product candidates which we have not planned or anticipated. Furthermore, there can be no assurance that we or our collaborators will resolve any issues related to any product related adverse events to the satisfaction of the FDA or any regulatory agency in a timely manner or ever, which could harm our business, prospects and financial condition. For example, in April 2014, a clinical hold was placed on patient enrollment and dosing of PEGPH20 in Study HALO-202 as a result of a possible difference in the TE event rate that had been observed at that time in the trial between the group of patients treated with PEGPH20 versus the group of patients treated without PEGPH20. The clinical hold was lifted by the FDA in June 2014, and we have completed enrollment and continue to monitor ongoing patients who remain either on treatment or in follow-up on Study HALO-202 under a revised clinical protocol.
If our contract manufacturers are unable to manufacture and supply to us bulk rHuPH20 or other raw materials in the quantity and quality required by us or our collaborators for use in our products and product candidates, our product development and commercialization efforts could be delayed or stopped and our collaborations could be damaged.
We have existing supply agreements with contract manufacturing organizations Avid Bioservices, Inc. (Avid) and Catalent Indiana LLC (formerly Cook Pharmica LLC) (Catalent) to produce bulk rHuPH20. These manufacturers each produce bulk rHuPH20 under cGMP for clinical uses. Catalent currently produces bulk rHuPH20 for use in Hylenex recombinant, product candidates and collaboration product candidates. Avid currently produces bulk rHuPH20 for use in collaboration products. In addition to supply obligations, Avid and Catalent will also provide support for the chemistry, manufacturing and controls sections for FDA and other regulatory filings. We rely on their ability to successfully manufacture these batches according to product specifications. If either Avid or Catalent: (i) is unable to retain its status as an FDA approved manufacturing facility; (ii) is unable to otherwise successfully scale up bulk rHuPH20 production to meet corporate or regulatory authority quality standards; or (iii) fails to manufacture and supply bulk rHuPH20 in the quantity and quality required by us or our collaborators for use in our proprietary and collaboration products and product candidates for any other reason, our business will be adversely affected. In addition, a significant change in such parties’ or other third party manufacturers’ business or financial condition could adversely
51
affect their abilities to fulfill their contractual obligations to us. We have not established, and may not be able to establish, favorable arrangements with additional bulk rHuPH20 manufacturers and suppliers of the ingredients necessary to manufacture bulk rHuPH20 should the existing manufacturers and suppliers become unavailable or in the event that our existing manufacturers and suppliers are unable to adequately perform their responsibilities. We have attempted to mitigate the impact of a potential supply interruption through the establishment of excess bulk rHuPH20 inventory where possible, but there can be no assurances that this safety stock will be maintained or that it will be sufficient to address any delays, interruptions or other problems experienced by Avid and/or Catalent. Any delays, interruptions or other problems regarding the ability of Avid and/or Catalent to supply bulk rHuPH20 or the ability of other third party manufacturers, to supply other raw materials or ingredients necessary to produce our products on a timely basis could: (i) cause the delay of clinical trials or otherwise delay or prevent the regulatory approval of proprietary or collaboration product candidates; (ii) delay or prevent the effective commercialization of proprietary or collaboration products; and/or (iii) cause us to breach contractual obligations to deliver bulk rHuPH20 to our collaborators. Such delays would likely damage our relationship with our collaborators, and they would have a material adverse effect on royalties and thus our business and financial condition.
If we or any party to a key collaboration agreement fail to perform material obligations under such agreement, or if a key collaboration agreement, is terminated for any reason, our business could significantly suffer.
We have entered into multiple collaboration agreements under which we may receive significant future payments in the form of milestone payments, target designation fees, maintenance fees and royalties. We are dependent on our collaborators to develop and commercialize product candidates subject to our collaborations in order for us to realize any financial benefits from these collaborations. Our collaborators may not devote the attention and resources to such efforts that we would ourselves, change their clinical development plans, promotional efforts or simultaneously develop and commercialize products in competition to those products we have licensed to them. Any of these actions could not be visible to us immediately and could negatively impact the benefits and revenue we receive from such collaboration. In addition, in the event that a party fails to perform under a key collaboration agreement, or if a key collaboration agreement is terminated, the reduction in anticipated revenues could delay or suspend our product development activities for some of our product candidates, as well as our commercialization efforts for some or all of our products. Specifically, the termination of a key collaboration agreement by one of our collaborators could materially impact our ability to enter into additional collaboration agreements with new collaborators on favorable terms, if at all. In certain circumstances, the termination of a key collaboration agreement would require us to revise our corporate strategy going forward and reevaluate the applications and value of our technology.
Most of our current proprietary and collaboration products and product candidates rely on the rHuPH20 enzyme, and any adverse development regarding rHuPH20 could substantially impact multiple areas of our business, including current and potential collaborations, as well as proprietary programs.
rHuPH20 is a key technological component of ENHANZE technology and our most advanced proprietary and collaboration products and product candidates, including the current and future products and product candidates under our ENHANZE collaborations, our PEGPH20 program, and
Hylenex
recombinant. If there is an adverse development for rHuPH20 (e.g., an adverse regulatory determination relating to rHuPH20, if we are unable to obtain sufficient quantities of rHuPH20, if we are unable to obtain or maintain material proprietary rights to rHuPH20 or if we discover negative characteristics of rHuPH20), multiple areas of our business, including current and potential collaborations, as well as proprietary programs would be substantially impacted. For example, elevated anti-rHuPH20 antibody titers were detected in the registration trial for Baxalta’s HYQVIA product as well as in a former collaborator’s product in a Phase 2 clinical trial with rHuPH20, but have not been associated, in either case, with any adverse events. We monitor for antibodies to rHuPH20 in our collaboration and proprietary programs, and although we do not believe at this time that the incidence of non-neutralizing anti-rHuPH20 antibodies in either the HYQVIA program or the former collaborator’s program will have a significant impact on our other proprietary and other collaboration product candidates, there can be no assurance that there will not be other such occurrences in the foregoing programs or our other programs or that concerns regarding these antibodies will not also be raised by the FDA or other health authorities in the future, which could result in delays or discontinuations of our development or commercialization activities or deter entry into additional collaborations with third parties.
52
We routinely evaluate, and may modify, our business strategy and our strategic focus to only a few fields or applications of our technology which may increase the risk for potential negative impact from adverse developments.
We routinely evaluate our business strategy, and may modify this strategy in the future in light of our assessment of unmet medical needs, growth potential, resource requirements, regulatory issues, competition, risks and other factors. As a result of these strategic evaluations, we may focus our resources and efforts on one or a few programs or fields and may suspend or reduce our efforts on other programs and fields. For example, in the third quarter of 2014, we decided to focus our resources on advancing PEGPH20 and expanding utilization of our ENHANZE technology. While we believe these are applications with the greatest potential value, we have reduced the diversification of our programs and increased our dependence on the success of the areas we are pursuing. By focusing on one or a few areas, we increase the potential impact on us if one of those programs or product candidates does not successfully complete clinical trials, achieve commercial acceptance or meet expectations regarding sales and revenue. Our decision to focus on one or a few programs may also reduce the value of programs that are no longer within our principal strategic focus, which could impair our ability to pursue collaborations or other strategic alternatives for those programs we are not pursuing.
Our proprietary and collaboration product candidates or companion diagnostic assays may not receive regulatory approvals or their development may be delayed for a variety of reasons, including delayed or unsuccessful clinical trials, regulatory requirements or safety concerns.
Clinical testing of pharmaceutical products is a long, expensive and uncertain process, and the failure or delay of a clinical trial can occur at any stage, including the patient enrollment stage. Even if initial results of preclinical and nonclinical studies or clinical trial results are promising, we or our collaborators may obtain different results in subsequent trials or studies that fail to show the desired levels of safety and efficacy, or we may not, or our collaborators may not, obtain applicable regulatory approval for a variety of other reasons. Preclinical, nonclinical, and clinical trials for any of our proprietary or collaboration product candidates or development of any collaboration companion diagnostic assays could be unsuccessful, which would delay or preclude regulatory approval and commercialization of the product candidates or companion diagnostic assays. In the U.S. and other jurisdictions, regulatory approval can be delayed, limited or not granted for many reasons, including, among others:
|
•
|
during the course of clinical studies, the final data may differ from initial reported data, and clinical results may not meet prescribed endpoints for the studies or otherwise provide sufficient data to support the efficacy of our product candidates;
|
|
•
|
clinical and nonclinical test results may reveal side effects, adverse events or unexpected safety issues associated with the use of our product candidates; for example, in April 2014, a clinical hold was placed on patient enrollment and dosing of PEGPH20 in Study HALO-202 as a result of a possible difference in the TE event rate that had been observed at that time in the trial between the group of patients treated with PEGPH20 versus the group of patients treated without PEGPH20. The clinical hold was lifted by the FDA in June 2014, and we have completed enrollment and continue to monitor patients who remain either on treatment or in follow-up on Study HALO-202 under a revised clinical protocol;
|
|
•
|
completion of clinical trials may be delayed for a variety of reasons including the amount of time it may take to identify and enroll patients with high levels of HA in our target population, and the ability to procure drug supply required in clinical trial protocols;
|
|
•
|
clinical trial results may be negatively impacted if our companion diagnostic does not accurately identify patients most likely to respond to the therapy, including the level of HA in patients;
|
|
•
|
third parties, such as contract research organizations, upon whom we rely to help conduct and manage our clinical trials may not perform satisfactorily, fulfill their contractual obligations to us, meet expected deadlines or conduct our clinical trials in accordance with regulatory requirements or our stated protocols;
|
|
•
|
regulatory review may not find a product candidate safe or effective enough to merit either continued testing or final approval;
|
|
•
|
regulatory review may not find that the data from preclinical testing and clinical trials justifies approval;
|
|
•
|
regulatory authorities may require that we change our studies or conduct additional studies which may significantly delay or make continued pursuit of approval commercially unattractive;
|
53
|
•
|
a regulatory agency may reject our trial data or disagree with our interpretations of either clinical trial data or applicable regulations;
|
|
•
|
a regulatory agency may approve only a narrow use of our product or may require additional safety monitoring and reporting through Risk Evaluation and Mitigation Strategies or conditions to assure safe use programs;
|
|
•
|
the cost of clinical trials required for product approval may be greater than what we originally anticipate, and we may decide to not pursue regulatory approval for such a product;
|
|
•
|
a regulatory agency may not approve our manufacturing processes or facilities, or the processes or facilities of our collaborators, our contract manufacturers or our raw material suppliers;
|
|
•
|
a regulatory agency may identify problems or other deficiencies in our existing manufacturing processes or facilities, or the existing processes or facilities of our collaborators, our contract manufacturers or our raw material suppliers;
|
|
•
|
a regulatory agency may change its formal or informal approval requirements and policies, act contrary to previous guidance, adopt new regulations or raise new issues or concerns late in the approval process; or
|
|
•
|
a product candidate may be approved only for indications that are narrow or under conditions that place the product at a competitive disadvantage, which may limit the sales and marketing activities for such product candidate or otherwise adversely impact the commercial potential of a product.
|
If a proprietary or collaboration product candidate or companion diagnostic assay is not approved in a timely fashion or obtained on commercially viable terms, or if development of any product candidate or a companion diagnostic assay is terminated due to difficulties or delays encountered in the regulatory approval process, it could have a material adverse impact on our business, and we would become more dependent on the development of other proprietary or collaboration product candidates and/or our ability to successfully acquire other products and technologies. There can be no assurances that any proprietary or collaboration product candidate or companion diagnostic assay will receive regulatory approval in a timely manner, or at all. There can be no assurance that we will be able to gain clarity as to the FDA’s requirements or that the requirements may be satisfied in a commercially feasible way, in which case our ability to enter into collaborations with third parties or explore other strategic alternatives to exploit this opportunity will be limited or may not be possible.
We anticipate that certain proprietary and collaboration products will be marketed, and perhaps manufactured, in foreign countries. The process of obtaining regulatory approvals in foreign countries is subject to delay and failure for the reasons set forth above, as well as for reasons that vary from jurisdiction to jurisdiction. The approval process varies among countries and jurisdictions and can involve additional testing. The time required to obtain approval may differ from that required to obtain FDA approval. Foreign regulatory agencies may not provide approvals on a timely basis, if at all. Approval by the FDA does not ensure approval by regulatory authorities in other countries or jurisdictions, and approval by one foreign regulatory authority does not ensure approval by regulatory authorities in other foreign countries or jurisdictions or by the FDA.
Our third party collaborators are responsible for providing certain proprietary materials that are essential components of our collaboration products and product candidates, and any failure to supply these materials could delay the development and commercialization efforts for these collaboration products and product candidates and/or damage our collaborations.
Our development and commercialization collaborators are responsible for providing certain proprietary materials that are essential components of our collaboration products and product candidates. For example, Roche is responsible for producing the Herceptin and MabThera required for its subcutaneous products and Baxalta is responsible for producing the GAMMAGARD LIQUID for its product HYQVIA. If a collaborator, or any applicable third party service provider of a collaborator, encounters difficulties in the manufacture, storage, delivery, fill, finish or packaging of the collaboration product or product candidate or component of such product or product candidate, such difficulties could (i) cause the delay of clinical trials or otherwise delay or prevent the regulatory approval of collaboration product candidates; and/or (ii) delay or prevent the effective commercialization of collaboration products. Such delays could have a material adverse effect on our business and financial condition.
54
We rely on third parties to manufacture, prepare, fill, finish and package our products and product candidates, and if such third parties should fail to perform, our commercialization and development efforts for our products and product candidates could be delayed or stopped.
We rely on third parties to manufacture, prepare, fill, finish, package, store and ship our products and product candidates on our behalf. If we are unable to locate third parties to perform these functions on terms that are acceptable to us, or if the third parties we identify fail to perform their obligations, the progress of clinical trials could be delayed or even suspended and the commercialization of approved product candidates could be delayed or prevented. In addition, we are scaling up our manufacturing of PEGPH20 with third party suppliers to support additional clinical trials, including the Phase 3 trial, and ultimately, if approved, potential commercial supply. If our contract manufacturers are unable to successfully manufacture and supply PEGPH20, the progress of our clinical trials could be delayed or halted for a period of time.
If we are unable to sufficiently develop our sales, marketing and distribution capabilities or enter into successful agreements with third parties to perform these functions, we will not be able to fully commercialize our products.
We may not be successful in marketing and promoting our approved product,
Hylenex
recombinant, or any other products we develop or acquire in the future. Our sales, marketing and distribution capabilities are very limited. In order to commercialize any products successfully, we must internally develop substantial sales, marketing and distribution capabilities or establish collaborations or other arrangements with third parties to perform these services. We do not have extensive experience in these areas, and we may not be able to establish adequate in-house sales, marketing and distribution capabilities or engage and effectively manage relationships with third parties to perform any or all of such services. To the extent that we enter into co-promotion or other licensing arrangements, our product revenues are likely to be lower than if we directly marketed and sold our products, and any revenues we receive will depend upon the efforts of third parties, whose efforts may not meet our expectations or be successful. These third parties would be largely responsible for the speed and scope of sales and marketing efforts, and may not dedicate the resources necessary to maximize product opportunities. Our ability to cause these third parties to increase the speed and scope of their efforts may also be limited. In addition, sales and marketing efforts could be negatively impacted by the delay or failure to obtain additional supportive clinical trial data for our products. In some cases, third party collaborators are responsible for conducting these additional clinical trials, and our ability to increase the efforts and resources allocated to these trials may be limited.
If we or our collaborators fail to comply with regulatory requirements applicable to promotion, sale and manufacturing of approved products, regulatory agencies may take action against us or them, which could significantly harm our business.
Any approved products, along with the manufacturing processes, post-approval clinical data, labeling, advertising and promotional activities for these products, are subject to continual requirements and review by the FDA, state and foreign regulatory bodies. Regulatory authorities subject a marketed product, its manufacturer and the manufacturing facilities to continual review and periodic inspections. We, our collaborators and our respective contractors, suppliers and vendors, will be subject to ongoing regulatory requirements, including complying with regulations and laws regarding advertising, promotion and sales of drug products, required submissions of safety and other post-market information and reports, registration requirements, cGMP regulations (including requirements relating to quality control and quality assurance, as well as the corresponding maintenance of records and documentation), and the requirements regarding the distribution of samples to physicians and recordkeeping requirements. Regulatory agencies may change existing requirements or adopt new requirements or policies. We, our collaborators and our respective contractors, suppliers and vendors, may be slow to adapt or may not be able to adapt to these changes or new requirements.
In particular, regulatory requirements applicable to pharmaceutical products make the substitution of suppliers and manufacturers costly and time consuming. We have minimal internal manufacturing capabilities and are, and expect to be in the future, entirely dependent on contract manufacturers and suppliers for the manufacture of our products and for their active and other ingredients. The disqualification of these manufacturers and suppliers through their failure to comply with regulatory requirements could negatively impact our business because the delays and costs in obtaining and qualifying alternate suppliers (if such alternative suppliers are available, which we cannot assure) could delay clinical trials or otherwise inhibit our ability to bring approved products to market, which would have a material adverse effect on our business and financial condition. Likewise, if we, our collaborators and our respective contractors, suppliers and vendors involved in sales and promotion of our products do
55
not comply with applicable laws and regulations, for example off-label or false or misleading promotion, this could materially harm our business and financial condition.
Failure to comply with regulatory requirements may result in any of the following:
|
•
|
restrictions on our products or manufacturing processes;
|
|
•
|
warning letters;
|
|
•
|
withdrawal of the products from the market;
|
|
•
|
voluntary or mandatory recall;
|
|
•
|
fines;
|
|
•
|
suspension or withdrawal of regulatory approvals;
|
|
•
|
suspension or termination of any of our ongoing clinical trials;
|
|
•
|
refusal to permit the import or export of our products;
|
|
•
|
refusal to approve pending applications or supplements to approved applications that we submit;
|
|
•
|
product seizure;
|
|
•
|
injunctions; or
|
|
•
|
imposition of civil or criminal penalties.
|
We currently have significant debt and failure by us to fulfill our obligations under the applicable loan agreements may cause the repayment obligations to accelerate.
In December 2015, our subsidiaries, Halozyme, Inc. (Halozyme) and Halozyme Royalty LLC (Halozyme Royalty) entered into a credit agreement (the Credit Agreement) with BioPharma Credit Investments IV Sub, LP and Athyrium Opportunities II Acquisition LP (the Royalty-backed Lenders) pursuant to which we borrowed $150 million through Halozyme Royalty (the Royalty-backed Loan). The Royalty-backed Loan will be repaid primarily from a specified percentage of the royalty payments we receive under our collaboration agreements with Roche and Baxalta (the Royalty Payments).
The obligations of Halozyme Royalty under the Credit Agreement to repay the Royalty-backed Loan may be accelerated upon the occurrence of certain events of default under the Credit Agreement, including but not limited to:
|
•
|
if any payment of principal is not made within three days of when such payment is due and payable or otherwise made in accordance with the terms of the Credit Agreement;
|
|
•
|
if any representations or warranties made in the Credit Agreement or any other transaction document proves to be incorrect or misleading in any material respect when made;
|
|
•
|
if there occurs a default in the performance of affirmative and negative covenants set forth in the Credit Agreement or any other transaction document;
|
|
•
|
the failure by either Baxalta or Roche to pay material amounts owed under our collaboration agreements because of an actual breach or default by us under the collaboration agreements;
|
|
•
|
the voluntary or involuntary commencement of bankruptcy proceedings by either Halozyme or Halozyme Royalty and other insolvency related defaults;
|
|
•
|
any materially adverse effect on the binding nature of any of the transaction documents or the collaboration agreements with Baxalta and Roche; or
|
|
•
|
Halozyme ceases to own, of record and beneficially, 100% of the equity interests in Halozyme Royalty.
|
The Credit Agreement also contains covenants applicable to Halozyme and Halozyme Royalty, including certain visitation, information and audits rights granted to the collateral agent and the lenders and restrictions on the conduct of business, including continued compliance with the Baxalta and Roche collaboration agreements and specified affirmative actions regarding the escrow account established to facilitate payment of Royalty Payments to the Royalty-backed Lenders or other specified parties. The Credit Agreement also contains covenants solely applicable to Halozyme Royalty, including restrictions on incurring indebtedness, creating or granting liens, making acquisitions and making specified restricted payments. These covenants could make it more difficult for us to execute our business strategy.
56
In connection with the Royalty-backed Loan, Halozyme Royalty granted a first priority lien and security interest (subject only to permitted liens) in all of its assets and all real, intangible and personal property, including all of its right, title and interest in and to the Royalty Payments.
In June 2016, we entered into a Loan and Security Agreement (the Loan Agreement) with Oxford Finance LLC (Oxford) and Silicon Valley Bank (SVB) (collectively, the Lenders), providing a senior secured loan facility of up to an aggregate principal amount of $70 million, comprising a $55.0 million draw in June 2016 and an additional $15.0 million tranche, which we had the option to draw during the second quarter of 2017 and did not exercise. The initial proceeds were partially used to pay the outstanding principal and final payment owed on our previous loan agreement with the Lenders. The remaining proceeds are to be used for working capital and general business requirements. The Loan Agreement is secured by substantially all of the assets of the Company and its subsidiary, Halozyme, Inc., except that the collateral does not include any equity interests in Halozyme, Inc., any intellectual property (including all licensing, collaboration and similar agreements relating thereto), and certain other excluded assets. The Loan Agreement contains customary representations, warranties and covenants by us, which covenants limit our ability to convey, sell, lease, transfer, assign or otherwise dispose of certain of our assets; engage in any business other than the businesses currently engaged in by us or reasonably related thereto; liquidate or dissolve; make certain management changes; undergo certain change of control events; create, incur, assume, or be liable with respect to certain indebtedness; grant certain liens; pay dividends and make certain other restricted payments; make certain investments; make payments on any subordinated debt; and enter into transactions with any of our affiliates outside of the ordinary course of business or permit our subsidiaries to do the same. In addition, subject to certain exceptions, we are required to maintain with SVB our primary deposit accounts, securities accounts and commodities, and to do the same for our domestic subsidiary. Complying with these covenants may make it more difficult for us to successfully execute our business strategy.
The Loan Agreement also contains customary indemnification obligations and customary events of default, including, among other things, our failure to fulfill certain of our obligations under the Loan Agreement and the occurrence of a material adverse change which is defined as a material adverse change in our business, operations or condition (financial or otherwise), a material impairment of the prospect of repayment of any portion of the loan, or a material impairment in the perfection or priority of the Lender’s lien in the collateral or in the value of such collateral.
Our ability to make payments on our debt will depend on our future operating performance and ability to generate cash and may also depend on our ability to obtain additional debt or equity financing. We will need to use cash to pay principal and interest on our debt, thereby reducing the funds available to fund our research and development programs, strategic initiatives and working capital requirements. If we are unable to generate sufficient cash to service our debt obligation, an event of default may occur. In the event of default by us under the Credit Agreement or the Loan Agreement, the lenders would be entitled to exercise their remedies thereunder, including the right to accelerate the debt, upon which we may be required to repay all amounts then outstanding under the Credit Agreement or the Loan Agreement which could harm our financial condition.
If proprietary or collaboration product candidates are approved for marketing but do not gain market acceptance, our business may suffer and we may not be able to fund future operations.
Assuming that our proprietary or collaboration product candidates obtain the necessary regulatory approvals for commercial sale, a number of factors may affect the market acceptance of these existing product candidates or any other products which are developed or acquired in the future, including, among others:
|
•
|
the price of products relative to other therapies for the same or similar treatments;
|
|
•
|
the perception by patients, physicians and other members of the health care community of the effectiveness and safety of these products for their prescribed treatments relative to other therapies for the same or similar treatments;
|
|
•
|
our ability to fund our sales and marketing efforts and the ability and willingness of our collaborators to fund sales and marketing efforts;
|
|
•
|
the degree to which the use of these products is restricted by the approved product label;
|
|
•
|
the effectiveness of our sales and marketing efforts and the effectiveness of the sales and marketing efforts of our collaborators;
|
|
•
|
the introduction of generic competitors; and
|
57
|
•
|
the extent to which reimbursement for our products and related treatments will be available from third party payors including government insurance programs (Medicare and Medicaid) and private insurers.
|
If these products do not gain market acceptance, we may not be able to fund future operations, including the development or acquisition of new product candidates and/or our sales and marketing efforts for our approved products, which would cause our business to suffer.
In addition, our proprietary and collaboration product candidates will be restricted to the labels approved by FDA and applicable regulatory bodies, and these restrictions may limit the marketing and promotion of the ultimate products. If the approved labels are restrictive, the sales and marketing efforts for these products may be negatively affected.
Developing and marketing pharmaceutical products for human use involves significant product liability risks for which we currently have limited insurance coverage.
The testing, marketing and sale of pharmaceutical products involves the risk of product liability claims by consumers and other third parties. Although we maintain product liability insurance coverage, product liability claims can be high in the pharmaceutical industry, and our insurance may not sufficiently cover our actual liabilities. If product liability claims were to be made against us, it is possible that the liabilities may exceed the limits of our insurance policy, or our insurance carriers may deny, or attempt to deny, coverage in certain instances. If a lawsuit against us is successful, then the lack or insufficiency of insurance coverage could materially and adversely affect our business and financial condition. Furthermore, various distributors of pharmaceutical products require minimum product liability insurance coverage before purchase or acceptance of products for distribution. Failure to satisfy these insurance requirements could impede our ability to achieve broad distribution of our proposed products, and higher insurance requirements could impose additional costs on us. In addition, since many of our collaboration product candidates include the pharmaceutical products of a third party, we run the risk that problems with the third party pharmaceutical product will give rise to liability claims against us.
Our inability to attract, hire and retain key management and scientific personnel could negatively affect our business.
Our success depends on the performance of key management and scientific employees with relevant experience. For example, in order to pursue our current business strategy, we will need to recruit and retain personnel experienced in oncology drug development which is a highly competitive market for talent. We depend substantially on our ability to hire, train, motivate and retain high quality personnel, especially our scientists and management team. Particularly in view of the small number of employees on our staff to cover our numerous programs and key functions, if we are unable to retain existing personnel or identify or hire additional personnel, we may not be able to research, develop, commercialize or market our products and product candidates as expected or on a timely basis and we may not be able to adequately support current and future alliances with strategic collaborators. Our use of domestic and international third-party contractors, consultants and staffing agencies also subjects us to potential co-employment liability claims.
Furthermore, if we were to lose key management personnel, we would likely lose some portion of our institutional knowledge and technical know-how, potentially causing a substantial delay in one or more of our development programs until adequate replacement personnel could be hired and trained. We currently have a severance policy applicable to all employees and a change in control policy applicable to senior executives.
We do not have key man life insurance policies on the lives of any of our employees.
58
Our operations might be interrupted by the occurrence of a natural disaster or other catastrophic event.
Our operations, including laboratories, offices and other research facilities, are located in four buildings in San Diego, California. In addition, we have a satellite office in South San Francisco, California. We depend on our facilities and on our collaborators, contractors and vendors for the continued operation of our business. Natural disasters or other catastrophic events, interruptions in the supply of natural resources, political and governmental changes, wildfires and other fires, floods, explosions, actions of animal rights activists, earthquakes and civil unrest could disrupt our operations or those of our collaborators, contractors and vendors. Even though we believe we carry commercially reasonable business interruption and liability insurance, and our contractors may carry liability insurance that protect us in certain events, we may suffer losses as a result of business interruptions that exceed the coverage available under our and our contractors’ insurance policies or for which we or our contractors do not have coverage. Any natural disaster or catastrophic event could have a significant negative impact on our operations and financial results. Moreover, any such event could delay our research and development programs.
If we or our collaborators do not achieve projected development, clinical, regulatory or sales goals in the timeframes we publicly announce or otherwise expect, the commercialization of our products and the development of our product candidates may be delayed and, as a result, our stock price may decline, and we may face lawsuits relating to such declines.
From time to time, we or our collaborators may publicly articulate the estimated timing for the accomplishment of certain scientific, clinical, regulatory and other product development goals. The accomplishment of any goal is typically based on numerous assumptions, and the achievement of a particular goal may be delayed for any number of reasons both within and outside of our control. If scientific, regulatory, strategic or other factors cause us to not meet a goal, regardless of whether that goal has been publicly articulated or not, our stock price may decline rapidly. For example, the announcement in April 2014 of the temporary halting of our Phase 2 clinical trial for PEGPH20 caused a rapid decline in our stock price. Stock price declines may also trigger direct or derivative shareholder lawsuits. As with any litigation proceeding, the eventual outcome of any legal action is difficult to predict. If any such lawsuits occur, we will incur expenses in connection with the defense of these lawsuits, and we may have to pay substantial damages or settlement costs in connection with any resolution thereof. Although we have insurance coverage against which we may claim recovery against some of these expenses and costs, the amount of coverage may not be adequate to cover the full amount or certain expenses and costs may be outside the scope of the policies we maintain. In the event of an adverse outcome or outcomes, our business could be materially harmed from depletion of cash resources, negative impact on our reputation, or restrictions or changes to our governance or other processes that may result from any final disposition of the lawsuit. Moreover, responding to and defending pending litigation significantly diverts management’s attention from our operations.
In addition, the consistent failure to meet publicly announced milestones may erode the credibility of our management team with respect to future milestone estimates.
Future acquisitions could disrupt our business and harm our financial condition.
In order to augment our product pipeline or otherwise strengthen our business, we may decide to acquire additional businesses, products and technologies. As we have limited experience in evaluating and completing acquisitions, our ability as an organization to make such acquisitions is unproven. Acquisitions could require significant capital infusions and could involve many risks, including, but not limited to, the following:
|
•
|
we may have to issue convertible debt or equity securities to complete an acquisition, which would dilute our stockholders and could adversely affect the market price of our common stock;
|
|
•
|
an acquisition may negatively impact our results of operations because it may require us to amortize or write down amounts related to goodwill and other intangible assets, or incur or assume substantial debt or liabilities, or it may cause adverse tax consequences, substantial depreciation or deferred compensation charges;
|
|
•
|
we may encounter difficulties in assimilating and integrating the business, products, technologies, personnel or operations of companies that we acquire;
|
|
•
|
certain acquisitions may impact our relationship with existing or potential collaborators who are competitive with the acquired business, products or technologies;
|
59
|
•
|
acquisitions may require significant capital infusions and the acquired businesses, products or technologies may not generate sufficient value to justify acquisition costs;
|
|
•
|
we may take on liabilities from the acquired company such as debt, legal liabilities or business risk which could be significant;
|
|
•
|
an acquisition may disrupt our ongoing business, divert resources, increase our expenses and distract our management;
|
|
•
|
acquisitions may involve the entry into a geographic or business market in which we have little or no prior experience; and
|
|
•
|
key personnel of an acquired company may decide not to work for us.
|
If any of these risks occurred, it could adversely affect our business, financial condition and operating results. There is no assurance that we will be able to identify or consummate any future acquisitions on acceptable terms, or at all. If we do pursue any acquisitions, it is possible that we may not realize the anticipated benefits from such acquisitions or that the market will not view such acquisitions positively.
Security breaches may disrupt our operations and harm our operating results.
We and our partners are subject to increasingly sophisticated attempts to gain unauthorized access to our information technology storage and access systems and are devoting resources to protect against such intrusion. The wrongful use, theft, deliberate sabotage or any other type of security breach with respect to any of our or any of our vendors and partners’ information technology storage and access systems could result in the disruption of our ability to use such systems or disclosure or dissemination of our or our partners’ proprietary and confidential information that is electronically stored, including research or clinical data and information regarding strategic initiatives, resulting in a material adverse impact on our business, operating results and financial condition. Our security and data recovery measures may not be adequate to protect against computer viruses, break-ins, and similar disruptions from unauthorized tampering with our electronic storage systems. Furthermore, any physical break-in or trespass of our facilities could result in the misappropriation, theft, sabotage or any other type of security breach with respect to our proprietary and confidential information, including research or clinical data or damage to our research and development equipment and assets. Such adverse effects could be material and irrevocable to our business, operating results and financial condition.
Risks Related To Ownership of Our Common Stock
Our stock price is subject to significant volatility.
We participate in a highly dynamic industry which often results in significant volatility in the market price of common stock irrespective of company performance. The high and low sales prices of our common stock during the twelve months ended
September 30, 2018
were
$21.48
and
$16.06
, respectively. We expect our stock price to continue to be subject to significant volatility and, in addition to the other risks and uncertainties described elsewhere in this Quarterly Report on Form 10-Q and all other risks and uncertainties that are either not known to us at this time or which we deem to be immaterial, any of the following factors may lead to a significant drop in our stock price:
|
•
|
the presence of competitive products to those being developed by us;
|
|
•
|
failure (actual or perceived) of our collaborators to devote attention or resources to the development or commercialization of product candidates licensed to such collaborator;
|
|
•
|
a dispute regarding our failure, or the failure of one of our third party collaborators, to comply with the terms of a collaboration agreement;
|
|
•
|
the termination, for any reason, of any of our collaboration agreements;
|
|
•
|
the sale of common stock by any significant stockholder, including, but not limited to, direct or indirect sales by members of management or our Board of Directors;
|
|
•
|
the resignation, or other departure, of members of management or our Board of Directors;
|
|
•
|
general negative conditions in the healthcare industry;
|
|
•
|
general negative conditions in the financial markets;
|
|
•
|
the cost associated with obtaining regulatory approval for any of our proprietary or collaboration product candidates;
|
60
|
•
|
the failure, for any reason, to secure or defend our intellectual property position;
|
|
•
|
for those products that are not yet approved for commercial sale, the failure or delay of applicable regulatory bodies to approve such products;
|
|
•
|
identification of safety or tolerability issues;
|
|
•
|
failure of clinical trials to meet efficacy endpoints;
|
|
•
|
suspensions or delays in the conduct of clinical trials or securing of regulatory approvals;
|
|
•
|
adverse regulatory action with respect to our and our collaborators’ products and product candidates such as clinical holds, imposition of onerous requirements for approval or product recalls;
|
|
•
|
our failure, or the failure of our third party collaborators, to successfully commercialize products approved by applicable regulatory bodies such as the FDA;
|
|
•
|
our failure, or the failure of our third party collaborators, to generate product revenues anticipated by investors;
|
|
•
|
disruptions in our clinical or commercial supply chains, including disruptions caused by problems with a bulk rHuPH20 contract manufacturer or a fill and finish manufacturer for any product or product candidate;
|
|
•
|
the sale of additional debt and/or equity securities by us;
|
|
•
|
our failure to obtain financing on acceptable terms or at all; or
|
|
•
|
a restructuring of our operations.
|
Future transactions where we raise capital may negatively affect our stock price.
We are currently a “Well-Known Seasoned Issuer” and may file automatic shelf registration statements at any time with the SEC. In February 2017, we filed an automatic shelf registration statement on Form S-3 (Registration No. 333-216315) with the SEC. Sales of substantial amounts of shares of our common stock or other securities under our current or future shelf registration statements could lower the market price of our common stock and impair our ability to raise capital through the sale of equity securities.
Anti-takeover provisions in our charter documents and Delaware law may make an acquisition of us more difficult.
Anti-takeover provisions in our charter documents and Delaware law may make an acquisition of us more difficult. First, our board of directors is classified into three classes of directors. Under Delaware law, directors of a corporation with a classified board may be removed only for cause unless the corporation’s certificate of incorporation provides otherwise. Our amended and restated certificate of incorporation, as amended, does not provide otherwise. In addition, our bylaws limit who may call special meetings of stockholders, permitting only stockholders holding at least 50% of our outstanding shares to call a special meeting of stockholders. Our amended and restated certificate of incorporation, as amended, does not include a provision for cumulative voting for directors. Under cumulative voting, a minority stockholder holding a sufficient percentage of a class of shares may be able to ensure the election of one or more directors. Finally, our bylaws establish procedures, including advance notice procedures, with regard to the nomination of candidates for election as directors and stockholder proposals.
These provisions may discourage potential takeover attempts, discourage bids for our common stock at a premium over market price or adversely affect the market price of, and the voting and other rights of the holders of, our common stock. These provisions could also discourage proxy contests and make it more difficult for stockholders to elect directors other than the candidates nominated by our board of directors.
In addition, because we are incorporated in Delaware, we are governed by the provisions of Section 203 of the Delaware General Corporation Law, which may prohibit large stockholders from consummating a merger with, or acquisition of, us.
61
These provisions may deter an acquisition of us that might otherwise be attractive to stockholders.
Risks Related to Our Industry
Our products must receive regulatory approval before they can be sold, and compliance with the extensive government regulations is expensive and time consuming and may result in the delay or cancellation of product sales, introductions or modifications.
Extensive industry regulation has had, and will continue to have, a significant impact on our business. All pharmaceutical companies, including ours, are subject to extensive, complex, costly and evolving regulation by the health regulatory agencies including the FDA (and with respect to controlled drug substances, the U.S. Drug Enforcement Administration (DEA)) and equivalent foreign regulatory agencies and state and local/regional government agencies. The Federal Food, Drug and Cosmetic Act, the Controlled Substances Act and other domestic and foreign statutes and regulations govern or influence the testing, manufacturing, packaging, labeling, storing, recordkeeping, safety, approval, advertising, promotion, sale and distribution of our products. We are dependent on receiving FDA and other governmental approvals, including regulatory approvals in jurisdictions outside the United States, prior to manufacturing, marketing and shipping our products. Consequently, there is always a risk that the FDA or other applicable governmental authorities, including those outside the United States, will not approve our products or may impose onerous, costly and time-consuming requirements such as additional clinical or animal testing. Regulatory authorities may require that we change our studies or conduct additional studies, which may significantly delay or make continued pursuit of approval commercially unattractive. For example, the approval of Baxalta’s HYQVIA BLA was delayed by the FDA until we and Baxalta provided additional preclinical data sufficient to address concerns regarding non-neutralizing antibodies to rHuPH20 that were detected in the registration trial. Although these antibodies have not been associated with any known adverse clinical effects, and the HYQVIA BLA was approved by the FDA in September 2014, the FDA or other foreign regulatory agency may, at any time, halt our and our collaborators’ development and commercialization activities due to safety concerns. In addition, even if our products are approved, regulatory agencies may also take post-approval action limiting or revoking our ability to sell our products. Any of these regulatory actions may adversely affect the economic benefit we may derive from our products and therefore harm our financial condition.
Under certain of these regulations, we and our contract suppliers and manufacturers are subject to periodic inspection of our or their respective facilities, procedures and operations and/or the testing of products by the FDA, the DEA and other authorities, which conduct periodic inspections to confirm that we and our contract suppliers and manufacturers are in compliance with all applicable regulations. The FDA also conducts pre-approval and post-approval reviews and plant inspections to determine whether our systems, or our contract suppliers’ and manufacturers’ processes, are in compliance with cGMP and other FDA regulations. If we, or our contract supplier, fail these inspections, we may not be able to commercialize our product in a timely manner without incurring significant additional costs, or at all.
In addition, the FDA imposes a number of complex regulatory requirements on entities that advertise and promote pharmaceuticals including, but not limited to, standards and regulations for direct-to-consumer advertising, off-label promotion, industry-sponsored scientific and educational activities, and promotional activities involving the internet.
We may be subject, directly or indirectly, to various broad federal and state healthcare laws. If we are unable to comply, or have not fully complied, with such laws, we could face civil, criminal and administrative penalties, damages, monetary fines, disgorgement, possible exclusion from participation in Medicare, Medicaid and other federal healthcare programs, contractual damages, reputational harm, diminished profits and future earnings and curtailment or restructuring of our operations, any of which could adversely affect our ability to operate.
Our business operations and activities may be directly, or indirectly, subject to various broad federal and state healthcare laws, including without limitation, anti-kickback laws, the Foreign Corrupt Practices Act, false claims laws, civil monetary penalty laws, data privacy and security laws, tracing and tracking laws, as well as transparency laws regarding payments or other items of value provided to healthcare providers. These laws may restrict or prohibit a wide range of business activities, including, but not limited to, research, manufacturing, distribution, pricing, discounting, marketing and promotion and other business arrangements. These laws may impact, among other things, our current activities with principal investigators and research subjects,
62
as well as sales, marketing and education programs. Many states have similar healthcare fraud and abuse laws, some of which may be broader in scope and may not be limited to items or services for which payment is made by a government health care program.
Efforts to ensure that our business arrangements will comply with applicable healthcare laws may involve substantial costs. While we have adopted a healthcare corporate compliance program, it is possible that governmental and enforcement authorities will conclude that our business practices may not comply with current or future statutes, regulations or case law interpreting applicable fraud and abuse or other healthcare laws. If our operations or activities are found to be in violation of any of the laws described above or any other governmental regulations that apply to us, we may be subject to, without limitation, civil, criminal and administrative penalties, damages, monetary fines, disgorgement, possible exclusion from participation in Medicare, Medicaid and other federal healthcare programs, contractual damages, reputational harm, diminished profits and future earnings and curtailment or restructuring of our operations, any of which could adversely affect our ability to operate.
In addition, any sales of products outside the U.S. will also likely subject us to foreign equivalents of the healthcare laws mentioned above, among other foreign laws.
We may be required to initiate or defend against legal proceedings related to intellectual property rights, which may result in substantial expense, delay and/or cessation of the development and commercialization of our products.
We primarily rely on patents to protect our intellectual property rights. The strength of this protection, however, is uncertain. For example, it is not certain that:
|
•
|
we will be able to obtain patent protection for our products and technologies;
|
|
•
|
the scope of any of our issued patents will be sufficient to provide commercially significant exclusivity for our products and technologies;
|
|
•
|
others will not independently develop similar or alternative technologies or duplicate our technologies and obtain patent protection before we do; and
|
|
•
|
any of our issued patents, or patent pending applications that result in issued patents, will be held valid, enforceable and infringed in the event the patents are asserted against others.
|
We currently own or license several patents and also have pending patent applications applicable to rHuPH20 and other proprietary materials. There can be no assurance that our existing patents, or any patents issued to us as a result of our pending patent applications, will provide a basis for commercially viable products, will provide us with any competitive advantages, or will not face third party challenges or be the subject of further proceedings limiting their scope or enforceability. Any weaknesses or limitations in our patent portfolio could have a material adverse effect on our business and financial condition. In addition, if any of our pending patent applications do not result in issued patents, or result in issued patents with narrow or limited claims, this could result in us having no or limited protection against generic or biosimilar competition against our product candidates which would have a material adverse effect on our business and financial condition.
We may become involved in interference proceedings in the U.S. Patent and Trademark Office, or other proceedings in other jurisdictions, to determine the priority, validity or enforceability of our patents. In addition, costly litigation could be necessary to protect our patent position.
We also rely on trademarks to protect the names of our products (e.g.
Hylenex
recombinant). We may not be able to obtain trademark protection for any proposed product names we select. In addition, product names for pharmaceutical products must be approved by health regulatory authorities such as the FDA in addition to meeting the legal standards required for trademark protection and product names we propose may not be timely approved by regulatory agencies which may delay product launch. In addition, our trademarks may be challenged by others. If we enforce our trademarks against third parties, such enforcement proceedings may be expensive.
We also rely on trade secrets, unpatented proprietary know-how and continuing technological innovation that we seek to protect with confidentiality agreements with employees, consultants and others with whom we discuss our business. Disputes may
63
arise concerning the ownership of intellectual property or the applicability or enforceability of these agreements, and we might not be able to resolve these disputes in our favor.
In addition to protecting our own intellectual property rights, third parties may assert patent, trademark or copyright infringement or other intellectual property claims against us. If we become involved in any intellectual property litigation, we may be required to pay substantial damages, including but not limited to treble damages, attorneys’ fees and costs, for past infringement if it is ultimately determined that our products infringe a third party’s intellectual property rights. Even if infringement claims against us are without merit, defending a lawsuit takes significant time, may be expensive and may divert management’s attention from other business concerns. Further, we may be stopped from developing, manufacturing or selling our products until we obtain a license from the owner of the relevant technology or other intellectual property rights. If such a license is available at all, it may require us to pay substantial royalties or other fees.
Patent protection for protein-based therapeutic products and other biotechnology inventions is subject to a great deal of uncertainty, and if patent laws or the interpretation of patent laws change, our competitors may be able to develop and commercialize products based on our discoveries.
Patent protection for protein-based therapeutic products is highly uncertain and involves complex legal and factual questions. In recent years, there have been significant changes in patent law, including the legal standards that govern the scope of protein and biotechnology patents. Standards for patentability of full-length and partial genes, and their corresponding proteins, are changing. Recent court decisions have made it more difficult to obtain patents, by making it more difficult to satisfy the patentable subject matter requirement and the requirement of non-obviousness, have decreased the availability of injunctions against infringers, and have increased the likelihood of challenging the validity of a patent through a declaratory judgment action. Taken together, these decisions could make it more difficult and costly for us to obtain, license and enforce our patents. In addition, the Leahy-Smith America Invents Act (HR 1249) was signed into law in September 2011, which among other changes to the U.S. patent laws, changes patent priority from “first to invent” to “first to file,” implements a post-grant opposition system for patents and provides for a prior user defense to infringement. These judicial and legislative changes have introduced significant uncertainty in the patent law landscape and may potentially negatively impact our ability to procure, maintain and enforce patents to provide exclusivity for our products.
There also have been, and continue to be, policy discussions concerning the scope of patent protection awarded to biotechnology inventions. Social and political opposition to biotechnology patents may lead to narrower patent protection within the biotechnology industry. Social and political opposition to patents on genes and proteins and recent court decisions concerning patentability of isolated genes may lead to narrower patent protection, or narrower claim interpretation, for isolated genes, their corresponding proteins and inventions related to their use, formulation and manufacture. Patent protection relating to biotechnology products is also subject to a great deal of uncertainty outside the U.S., and patent laws are evolving and undergoing revision in many countries. Changes in, or different interpretations of, patent laws worldwide may result in our inability to obtain or enforce patents, and may allow others to use our discoveries to develop and commercialize competitive products, which would impair our business.
If third party reimbursement and customer contracts are not available, our products may not be accepted in the market.
Our ability to earn sufficient returns on our products will depend in part on the extent to which reimbursement for our products and related treatments will be available from government health administration authorities, private health insurers, managed care organizations and other healthcare providers.
Third-party payors are increasingly attempting to limit both the coverage and the level of reimbursement of new drug products to contain costs. Consequently, significant uncertainty exists as to the reimbursement status of newly approved healthcare products. Third party payors may not establish adequate levels of reimbursement for the products that we commercialize, which could limit their market acceptance and result in a material adverse effect on our revenues and financial condition.
64
Customer contracts, such as with group purchasing organizations and hospital formularies, will often not offer contract or formulary status without either the lowest price or substantial proven clinical differentiation. If, for example, Hylenex is compared to animal-derived hyaluronidases by these entities, it is possible that neither of these conditions will be met, which could limit market acceptance and result in a material adverse effect on our revenues and financial condition.
The rising cost of healthcare and related pharmaceutical product pricing has led to cost containment pressures that could cause us to sell our products at lower prices, resulting in less revenue to us.
Any of the proprietary or collaboration products that have been, or in the future are, approved by the FDA may be purchased or reimbursed by state and federal government authorities, private health insurers and other organizations, such as health maintenance organizations and managed care organizations. Such third party payors increasingly challenge pharmaceutical product pricing. The trend toward managed healthcare in the U.S., the growth of such organizations, and various legislative proposals and enactments to reform healthcare and government insurance programs, including the Medicare Prescription Drug Modernization Act of 2003, could significantly influence the manner in which pharmaceutical products are prescribed and purchased, resulting in lower prices and/or a reduction in demand. Such cost containment measures and healthcare reforms could adversely affect our ability to sell our products.
In March 2010, the U.S. adopted the Patient Protection and Affordable Care Act, as amended by the Health Care and Education Reconciliation Act (the PPACA). This law substantially changes the way healthcare is financed by both governmental and private insurers, and significantly impacts the pharmaceutical industry. The PPACA contains a number of provisions that are expected to impact our business and operations, in some cases in ways we cannot currently predict. Changes that may affect our business include those governing enrollment in federal healthcare programs, reimbursement changes, fraud and abuse and enforcement. These changes will impact existing government healthcare programs and will result in the development of new programs, including Medicare payment for performance initiatives and improvements to the physician quality reporting system and feedback program.
Additional provisions of the PPACA may negatively affect our revenues in the future. For example, the PPACA imposes a non-deductible excise tax on pharmaceutical manufacturers or importers that sell branded prescription drugs to U.S. government programs that we believe will impact our revenues from our products. In addition, as part of the PPACA’s provisions closing a funding gap that currently exists in the Medicare Part D prescription drug program, we will also be required to provide a 50% discount on branded prescription drugs dispensed to beneficiaries under this prescription drug program. Recently, Congress and the current administration have proposed and taken various steps to revise, repeal or delay implementation of, various aspects of the Healthcare Reform Act. We expect that the PPACA, as it may be amended, and other healthcare reform measures that may be adopted in the future could have a material adverse effect on our industry generally and on our ability to maintain or increase our product sales or successfully commercialize our product candidates and could limit or eliminate our future spending on development projects.
Furthermore, individual states have become increasingly aggressive in passing legislation and implementing regulations designed to control pharmaceutical product pricing, including price or patient reimbursement constraints, discounts, restrictions on certain product access, importation from other countries and bulk purchasing. Legally mandated price controls on payment amounts by third party payors or other restrictions could negatively and materially impact our revenues and financial condition. We anticipate that we will encounter similar regulatory and legislative issues in most other countries outside the U.S.
We face intense competition and rapid technological change that could result in the development of products by others that are superior to our proprietary and collaboration products under development.
Our proprietary and collaboration products have numerous competitors in the U.S. and abroad including, among others, major pharmaceutical and specialized biotechnology firms, universities and other research institutions that have developed competing products. The competitors for
Hylenex
recombinant include, but are not limited to, Valeant Pharmaceuticals International, Inc.’s FDA-approved product, Vitrase
®
, an ovine (ram) hyaluronidase, and Amphastar Pharmaceuticals, Inc.’s product, Amphadase
®
, a bovine (bull) hyaluronidase. For our PEGPH20 product candidate, such competitors may include major pharmaceutical and specialized biotechnology firms. These competitors may develop technologies and products that are more effective, safer, or less costly than our current or future proprietary and collaboration product candidates or that could render our
65
technologies and product candidates obsolete or noncompetitive. Many of these competitors have substantially more resources and product development, manufacturing and marketing experience and capabilities than we do. In addition, many of our competitors have significantly greater experience than we do in undertaking preclinical testing and clinical trials of pharmaceutical product candidates and obtaining FDA and other regulatory approvals of products and therapies for use in healthcare.
|
Item 3.
|
Quantitative and Qualitative Disclosures About Market Risk
|
There have been no material changes in our market risks during the quarter ended
September 30, 2018
.
As of
September 30, 2018
, our cash equivalents and marketable securities consisted of investments in money market funds, U.S. Treasury securities, corporate debt obligations and commercial paper. These investments were made in accordance with our investment policy which specifies the categories, allocations, and ratings of securities we may consider for investment. The primary objective of our investment activities is to preserve principal while at the same time maximizing the income we receive without significantly increasing risk. Some of the financial instruments that we invest in could be subject to market risk. This means that a change in prevailing interest rates may cause the value of the instruments to fluctuate. For example, if we purchase a security that was issued with a fixed interest rate and the prevailing interest rate later rises, the value of that security will probably decline. Based on our current investment portfolio as of
September 30, 2018
, we do not believe that our results of operations would be materially impacted by an immediate change of 10% in interest rates.
We do not hold or issue derivatives, derivative commodity instruments or other financial instruments for speculative trading purposes. Further, we do not believe our cash, cash equivalents and marketable securities have significant risk of default or illiquidity. We made this determination based on discussions with our investment advisors and a review of our holdings. While we believe our cash, cash equivalents and marketable securities do not contain excessive risk, we cannot provide absolute assurance that in the future our investments will not be subject to adverse changes in market value. All of our cash equivalents and marketable securities are recorded at fair market value.
|
Item 4.
|
Controls and Procedures
|
Evaluation of Disclosure Controls and Procedures
We maintain disclosure controls and procedures that are designed to ensure that information required to be disclosed in our Exchange Act reports is recorded, processed, summarized and reported within the timelines specified in the Securities and Exchange Commission’s rules and forms, and that such information is accumulated and communicated to our management, including our Chief Executive Officer and Chief Financial Officer, as appropriate, to allow timely decision regarding required disclosure. In designing and evaluating the disclosure controls and procedures, management recognized that any controls and procedures, no matter how well designed and operated, can only provide reasonable assurance of achieving the desired control objectives, and in reaching a reasonable level of assurance, management necessarily was required to apply its judgment in evaluating the cost-benefit relationship of possible controls and procedures.
Under the supervision and with the participation of our management, including our principal executive officer and principal financial officer, we conducted an evaluation of our disclosure controls and procedures, as such term is defined under Rule 13a-15(e) promulgated under the Securities Exchange Act of 1934, as amended. Based on this evaluation, our principal executive officer and our principal financial officer concluded that our disclosure controls and procedures were effective as of the end of the period covered by this Quarterly Report on Form 10-Q.
Changes in Internal Control Over Financial Reporting
There have been no significant changes in our internal control over financial reporting that occurred during the quarter ended
September 30, 2018
that have materially affected, or are reasonably likely to materially affect, our internal control over financial reporting.
66
|
Item 1.
|
Legal Proceedings
|
From time to time, we may be involved in disputes, including litigation, relating to claims arising out of operations in the normal course of our business. Any of these claims could subject us to costly legal expenses and, while we generally believe that we have adequate insurance to cover many different types of liabilities, our insurance carriers may deny coverage or our policy limits may be inadequate to fully satisfy any damage awards or settlements. If this were to happen, the payment of any such awards could have a material adverse effect on our consolidated results of operations and financial position. Additionally, any such claims, whether or not successful, could damage our reputation and business. We currently are not a party to any legal proceedings, the adverse outcome of which, in management’s opinion, individually or in the aggregate, would have a material adverse effect on our consolidated results of operations or financial position.
|
Item 1A.
|
Risk Factors
|
We have provided updated Risk Factors in the section labeled “Risk Factors” in Part I, Item 2, “Management’s Discussion and Analysis of Financial Condition and Results of Operations”. The “Risk Factors” section provides updated information in certain areas, particularly with respect to the risks and uncertainties regarding the regulatory approval of proprietary and collaboration product candidates.
We do not believe the updates have materially changed the type or magnitude of risks we face in comparison to the disclosure provided in our most recent Annual Report on Form 10-K.
|
Item 2.
|
Unregistered Sales of Equity Securities and Use of Proceeds
|
None.
|
Item 3.
|
Defaults Upon Senior Securities
|
Not applicable.
|
Item 4.
|
Mine Safety Disclosures
|
Not applicable.
|
Item 5.
|
Other Information
|
None.
67
|
Item 6.
|
Exhibits
|
|
|
Composite Certificate of Incorporation (1)
|
|
|
|
Bylaws, as amended (2)
|
|
|
Halozyme Therapeutics, Inc. Severance Policy
|
||
|
|
Certification of Chief Executive Officer pursuant to Rule 13a-14(a) and 15d-14(a) of the Securities Exchange Act of 1934, as amended
|
|
|
|
Certification of Chief Financial Officer pursuant to Rule 13a-14(a) and 15d-14(a) of the Securities Exchange Act of 1934, as amended
|
|
|
|
Certification of Chief Executive Officer and Chief Financial Officer pursuant to 18 U.S.C. 1350, as adopted pursuant to Section 906 of the Sarbanes-Oxley Act of 2002
|
|
|
101.INS
|
|
Instance Document
|
|
101.SCH
|
Taxonomy Extension Schema Document
|
|
|
101.CAL
|
Taxonomy Extension Calculation Linkbase Document
|
|
|
101.DEF
|
Taxonomy Extension Definition Linkbase Document
|
|
|
101.LAB
|
Taxonomy Extension Label Linkbase Document
|
|
|
101.PRE
|
Taxonomy Extension Presentation Linkbase Document
|
|
|
(1)
|
Incorporated by reference to the Registrant’s Quarterly Report on Form 10-Q, filed August 7, 2013 (File No. 001-32335).
|
|
(2)
|
Incorporated by reference to the Registrant’s Current Report on Form 8-K, filed December 19, 2016 (File No. 001-32335).
|
# Indicates management contract or compensatory plan or arrangement.
68
SIGNATURES
Pursuant to the requirements of the Securities Exchange Act of 1934, the Registrant has duly caused this report to be signed on its behalf by the undersigned thereunto duly authorized.
|
|
Halozyme Therapeutics, Inc.,
a Delaware corporation
|
||
|
|
|||
|
Dated:
|
November 6, 2018
|
/s/ Helen I. Torley, M.B. Ch.B., M.R.C.P.
|
|
|
|
Helen I. Torley, M.B. Ch.B., M.R.C.P.
President and Chief Executive Officer
(Principal Executive Officer)
|
||
|
|
|||
|
|
|||
|
Dated:
|
November 6, 2018
|
/s/ Laurie D. Stelzer
|
|
|
|
Laurie D. Stelzer
Senior Vice President and Chief Financial Officer
(Principal Financial and Accounting Officer)
|
||
|
|
|||
|
|
|||
69
TABLE OF CONTENTS
Part I Financial InformationItem 1. Financial StatementsItem 2. Management S Discussion and Analysis Of Financial Condition and Results Of OperationsItem 3. Quantitative and Qualitative Disclosures About Market RiskItem 4. Controls and ProceduresPart II Other InformationItem 1. Legal ProceedingsItem 1A. Risk FactorsItem 2. Unregistered Sales Of Equity Securities and Use Of ProceedsItem 3. Defaults Upon Senior SecuritiesItem 4. Mine Safety DisclosuresItem 5. Other InformationItem 6. Exhibits