HANESBRANDS INC.
10-Ks and 10-Qs
|
|
|
|
|
|
|
|
|
|
|
|
|
|
|
|
|
|
|
|
|
|
|
|
|
|
|
|
|
|
|
|
|
|
|
|
|
|
|
|
|
|
|
|
|
|
|
|
|
|
|
|
|
|
|
|
UNITED STATES
SECURITIES AND EXCHANGE COMMISSION
Washington, D.C. 20549
FORM 10-K
|
x
|
ANNUAL REPORT PURSUANT TO SECTION 13 OR 15(d) OF THE SECURITIES EXCHANGE ACT OF 1934
|
For the fiscal year ended
December 29, 2018
or
|
¨
|
TRANSITION REPORT PURSUANT TO SECTION 13 OR 15(d) OF THE SECURITIES EXCHANGE ACT OF 1934
|
For the transition period from to
Commission file number: 001-32891
Hanesbrands Inc.
(Exact name of registrant as specified in its charter)
|
Maryland
|
|
20-3552316
|
|
(State of incorporation)
|
|
(I.R.S. employer
identification no.)
|
|
1000 East Hanes Mill Road
Winston-Salem, North Carolina
|
|
27105
|
|
(Address of principal executive office)
|
|
(Zip code)
|
(336) 519-8080
(Registrant’s telephone number including area code)
Securities registered pursuant to Section 12(b) of the Act:
Common Stock, par value $0.01 per share
Name of each exchange on which registered:
New York Stock Exchange
Indicate by check mark if the registrant is a well-known seasoned issuer, as defined in Rule 405 of the Securities Act. Yes
ý
No
¨
Indicate by check mark if the registrant is not required to file reports pursuant to Section 13 or Section 15(d) of the Exchange Act. Yes
¨
No
x
Indicate by check mark whether the registrant: (1) has filed all reports required to be filed by Section 13 or 15(d) of the Securities Exchange Act of 1934 during the preceding 12 months (or for such shorter period that the registrant was required to file such reports), and (2) has been subject to such filing requirements for the past 90 days. Yes
x
No
¨
Indicate by check mark whether the registrant has submitted electronically every Interactive Data File required to be submitted and posted pursuant to Rule 405 of Regulation S-T (§ 232.405 of this chapter) during the preceding 12 months (or for such shorter period that the registrant was required to submit such files). Yes
x
No
¨
Indicate by check mark if disclosure of delinquent filers pursuant to Item 405 of Regulation S-K is not contained herein, and will not be contained, to the best of registrant’s knowledge, in definitive proxy or information statements incorporated by reference into Part III of this Form 10-K or any amendment to this Form 10-K.
x
Indicate by check mark whether the registrant is a large accelerated filer, an accelerated filer, a non-accelerated filer, a smaller reporting company or an emerging growth company. See the definitions of “large accelerated filer,” “accelerated filer,” “smaller reporting company,” and “emerging growth company” in Rule 12b-2 of the Exchange Act. (Check one):
|
Large accelerated filer
|
|
x
|
Accelerated filer
|
|
¨
|
||||
|
Non-accelerated filer
|
|
Smaller reporting company
|
|
¨
|
Emerging growth company
|
¨
|
|||
If an emerging growth company, indicate by check mark if the registrant has elected not to use the extended transition period for complying with any new or revised financial accounting standards provided pursuant to Section 13(a) of the Exchange
Act.
¨
Indicate by check mark whether the registrant is a shell company (as defined in Rule 12b-2 of the Exchange Act). Yes
¨
No
x
As of
June 29, 2018
, the aggregate market value of the registrant’s common stock held by non-affiliates was approximately
$7,881,568,615
(based on the closing price of the common stock of
$22.02
per share on that date, as reported on the New York Stock Exchange and, for purposes of this computation only, the assumption that all of the registrant’s directors and executive officers are affiliates and that beneficial holders of 5% or more of the outstanding common stock are not affiliates).
As of
February 1, 2019
, there were
361,424,006
shares of the registrant’s common stock outstanding.
DOCUMENTS INCORPORATED BY REFERENCE
Part III of this Form 10-K incorporates by reference to portions of the registrant’s proxy statement for its
2019
annual meeting of stockholders.
TABLE OF CONTENTS
|
|
Page
|
|
|
PART I
|
||
|
Item 1
|
||
|
Item 1A
|
||
|
Item 1B
|
||
|
Item 1C
|
||
|
Item 2
|
||
|
Item 3
|
||
|
Item 4
|
||
|
PART II
|
||
|
Item 5
|
||
|
Item 6
|
||
|
Item 7
|
||
|
Item 7A
|
||
|
Item 8
|
||
|
Item 9
|
||
|
Item 9A
|
||
|
Item 9B
|
||
|
PART III
|
||
|
Item 10
|
||
|
Item 11
|
||
|
Item 12
|
||
|
Item 13
|
||
|
Item 14
|
||
|
PART IV
|
||
|
Item 15
|
||
|
Item 16
|
||
FORWARD-LOOKING STATEMENTS
This Annual Report on Form 10-K contains information that may constitute “forward-looking statements” within the meaning of Section 27A of the Securities Act of 1933 and Section 21E of the Securities Exchange Act of 1934 (the “Exchange Act”). Forward-looking statements include all statements that do not relate solely to historical or current facts, and can generally be identified by the use of words such as “may,” “believe,” “will,” “expect,” “project,” “estimate,” “intend,” “anticipate,” “plan,” “continue” or similar expressions. However, the absence of these words or similar expressions does not mean that a statement is not forward-looking. All statements regarding our intent, belief and current expectations about our strategic direction, prospects and future results are forward-looking statements. Management believes that these forward-looking statements are reasonable as and when made. However, caution should be taken not to place undue reliance on any such forward-looking statements because such statements speak only as of the date when made. We undertake no obligation to publicly update or revise any forward-looking statements, whether as a result of new information, future events or otherwise, except as required by law. In addition, forward-looking statements are subject to certain risks and uncertainties that could cause actual results to differ materially from our historical experience and our present expectations or projections. These risks and uncertainties include, but are not limited to, those described under “Risk Factors” and elsewhere in this report and those described from time to time in our future reports filed with the Securities and Exchange Commission (“SEC”).
PART I
|
Item 1.
|
Business
|
Company Overview
Hanesbrands Inc. (collectively with its subsidiaries, “Hanesbrands,” “we,” “us,” “our” or the “Company”) is a socially responsible leading marketer of everyday basic innerwear and activewear apparel in the Americas, Europe, Australia and Asia/Pacific under some of the world’s strongest apparel brands, including
Hanes, Champion, Bonds
,
Maidenform, DIM, Bali, Playtex, Bras N Things
,
Nur Die/Nur Der, Alternative
,
L’eggs, JMS/Just My Size, Lovable, Wonderbra, Berlei
and
Gear for Sports.
Hanesbrands is a diverse, global apparel company that operates a portfolio of profitable businesses. Our products are marketed to consumers shopping in mass merchants, mid-tier and department stores, specialty stores, the consumer-directed channel, which includes our owned retail locations, as well as e-commerce sites.
Unlike most apparel companies, Hanesbrands primarily operates its own manufacturing facilities. More than 70% of the apparel units that we sell are manufactured in our own plants or those of dedicated contractors. We have a long history of innovation, product excellence and brand recognition and we continue to use our Innovate-to-Elevate strategy to integrate our brand superiority, industry-leading innovation and low-cost global supply chain to provide higher value products while lowering production costs. Our Tagless apparel platform, Comfort Flex Fit apparel platform, ComfortBlend fabric platform, temperature-control X-Temp fabric platform and FreshIQ advanced odor protection technology fabric platform incorporate big-idea innovation to span across brands, product categories, business segments, retailer and distribution channels and geographies.
We take great pride in our strong reputation for ethical business practices and the success of our Hanes for Good corporate responsibility program for community and environmental improvement. Hanesbrands has been a U.S. Environmental Protection Agency Energy Star Sustained Excellence Award winner every year from 2012-2018 and Partner of the Year winner in 2010 and 2011. We are committed to the responsible management of energy, carbon emissions, water, wastewater, chemicals, solid waste and recycled materials in all of our facilities worldwide, and we report our progress annually. We are also a recognized leader for our community-building, philanthropy and workplace practices. More information about our Hanes for Good corporate responsibility initiatives may be found at
www.HanesForGood.com
.
Our fiscal year ends on the Saturday closest to December 31. All references to “
2018
”, “
2017
” and “
2016
” relate to the 52 week fiscal years ended on
December 29, 2018
,
December 30, 2017
and
December 31, 2016
, respectively.
We make available copies of materials we file with, or furnish to, the SEC free of charge at
www.Hanes.com/investors
(in the “Investors” section). By referring to our corporate website,
www.Hanes.com/corporate
, or any of our other websites, we do not incorporate any such website or its contents into this Annual Report on Form 10-K.
1
Our Brands
Our portfolio of leading brands is designed to address the needs and wants of various consumer segments across a broad range of basic apparel products. Each of our brands has a unique consumer positioning that distinguishes it from its competitors and guides its advertising and product development. We discuss some of our most important brands in more detail below.
Hanes
is the largest and most widely recognized brand in our portfolio.
Hanes
is the number one selling apparel brand in the United States and is found in nine out of 10 U.S. households. The
Hanes
brand covers all of our product categories, including men’s underwear, women’s panties, children’s underwear, bras, socks, T-shirts, fleece, shapewear and sheer hosiery.
Hanes
stands for outstanding comfort, style and value.
Hanes
is one of the most widely distributed brands in apparel, with a presence across mass merchandise retailers, e-commerce sites, discount stores and department stores. Through collaborations with third parties, the brand has also gained distribution with specialty retailers like Supreme and Urban Outfitters and in high end retail establishments like Nordstrom, Bloomingdales and Barneys.
Champion
is our second-largest brand. This iconic athleticwear brand will celebrate its 100
th
anniversary in 2019. Founded in Rochester, New York in 1919,
Champion
has always been known for authentic American style and performance and helped pioneer some of the most important innovations in athleticwear, including reverse weave sweatshirts, mesh practice uniforms and sports bras.
Champion
athleticwear can be found in sporting goods retailers, e-commerce sites, department stores, college bookstores and specialty retailers, including Urban Outfitters, Zumiez and PacSun. In addition, we currently distribute a full line of men’s, women’s and children’s
C9 Champion
products exclusively through Target Corporation (“Target”) stores.
Champion
has collaborated with designers and other iconic brands around the world, including Todd Snyder, Supreme, Off-White and Beams. The
Champion
brand’s momentum has been fueled by distribution growth and expansion of
Champion
retail stores across the United States, Europe and Asia. As we celebrate the brand’s centennial with a year-long global marketing campaign, the
Champion
brand is poised to be a powerful global growth platform for Hanesbrands.
Our global portfolio includes two other megabrands with strong heritage and deep household penetration in their respective markets.
Bonds
is an over century-old brand that is the number one brand of men’s underwear, women’s underwear, children’s underwear and socks in Australia.
DIM
is a flagship European brand and a mass market leader in hosiery, men’s underwear, intimate apparel and socks in France.
Our portfolio also includes a number of iconic intimate apparel brands.
Maidenform
is America’s number one shapewear brand and has been trusted for stylish, modern bras, panties and shapewear since 1922.
Bali
offers a range of bras, panties and shapewear sold in the department store channel and is the number one bra brand in department stores. The
Playtex
brand is a recognized industry leader in supportive bras designed for the curvy woman and is sold everywhere from mass merchandise retailers to department stores.
In addition, we offer a variety of products under the following well-known brands:
Bras N Things
,
Nur Die/Nur Der
,
Alternative
,
L’eggs
,
JMS
/
Just My Size,
Lovable
,
Wonderbra, Berlei
, and
Gear for Sports
.
These brands compliment our primary product offerings, allowing us to give consumers a variety of options to meet their diverse needs.
Our Segments
Our operations are managed and reported in three operating segments, each of which is a reportable segment for financial reporting purposes: Innerwear, Activewear and International. These segments are organized principally by product category and geographic location. Each segment has its own management team that is responsible for the operations of the segment’s businesses, but the segments share a common supply chain and media and marketing platforms. In the first quarter of 2018, we eliminated the allocation of certain corporate overhead selling, general and administrative expenses related to the legal, human resources, information technology, finance and real estate departments to the segments in order to reflect the manner in which the business is managed and results are reviewed by our Chief Executive Officer, who is our chief operating decision maker. Prior year segment operating profit disclosures have been revised to conform to the current year presentation.
The following table summarizes our operating segments by product category:
2
|
Segment
|
Primary Products
|
Primary Brands
|
|
Innerwear
|
Basics, including men’s underwear, women’s panties, children’s underwear and socks
|
Hanes
,
Champion
,
Maidenform
,
Bali
,
JMS/Just My Size
,
Polo Ralph Lauren
*
|
|
Intimate apparel, such as bras and shapewear
|
Maidenform, Bali
,
Playtex
,
Hanes
,
JMS/Just My Size
,
DKNY,
*
Donna Karan*
|
|
|
Activewear
|
T-shirts, fleece, sport shirts, performance T-shirts and shorts, sports bras, thermals and teamwear
|
Champion
,
Hanes
,
Alternative
,
Gear for Sports
,
JMS/Just My Size
,
Hanes Beefy-T
|
|
International
|
Activewear, men’s underwear, women’s panties, children’s underwear, intimate apparel, socks, hosiery and home goods
|
Champion
,
Bonds, DIM
,
Hanes
,
Sheridan
,
Bras N Things
,
Playtex, Nur Die/Nur Der, Lovable, Wonderbra
,
Berlei
,
Maidenform
,
Abanderado
,
Shock Absorber, Zorba
,
Explorer
,
Sol y Oro
,
Bellinda
, Polo Ralph Lauren,
*
Donna Karan,* DKNY*
|
|
*
|
Brand used under a license agreement.
|
Innerwear
Our Innerwear segment includes core apparel products, such as men’s underwear, women’s panties, children’s underwear, socks and intimate apparel, sold in the United States, under well-known brands that are trusted by consumers. We are the intimate apparel category leader in the United States with our
Hanes
,
Maidenform
,
Bali
,
Playtex
,
JMS
/
Just My Size
, Donna Karan and DKNY
brands, and we are also the leading manufacturer and marketer of men’s underwear and children’s underwear in the United States under the
Hanes
,
Champion
and Polo Ralph Lauren brands. During
2018
, net sales from our Innerwear segment were
$2.4 billion
, representing approximately
35%
of total net sales.
Activewear
Our Activewear segment includes activewear products, such as T-shirts, fleece, performance apparel, sport shirts and thermals, sold in the United States. We are a leader in the activewear market through our
Champion
,
Hanes, Alternative
,
and
JMS
/
Just My Size
brands, where we sell products such as T-shirts and fleece to both retailers and wholesalers. In addition to activewear for men and women,
Champion
provides uniforms for athletic programs and currently includes an apparel program,
C9 Champion
, at Target stores. We also license our
Champion
name for footwear and sports accessories. In 2017, we expanded our activewear offerings with the acquisition of the
Alternative
brand, a better basics lifestyle brand for men and women as we continue our shift to higher margin products. In our American Casualwear business, we supply our T-shirts, sport shirts and fleece products, including brands such as
Hanes
,
Champion, Alternative
and
Hanes Beefy-T
, to customers, primarily wholesalers, who then resell to the embellishment channel, and the consumer-directed channel. We sell licensed logo apparel in the mass retail channel and in collegiate bookstores and other channels under our
Gear for Sports
and
Champion
brands. We also sell licensed collegiate logo apparel primarily in the mass retail channel under our
Knights Apparel
brand. We also offer a range of quality, comfortable clothing for men, women and children marketed under the
Hanes
and
JMS
/
Just My Size
brands. During
2018
, net sales from our Activewear segment were
$1.8 billion
, representing approximately
26%
of total net sales.
International
Our International segment includes innerwear, activewear, hosiery and home goods products, sold outside of the United States, that are primarily marketed under the
Champion
,
Bonds
,
DIM
,
Hanes
,
Sheridan
,
Bras N Things
,
Playtex
,
Nur Die/Nur Der
,
Lovable
,
Wonderbra
,
Berlei
,
Maidenform
,
Abanderado
,
Shock Absorber
,
Zorba
,
Sol y Oro
, Polo Ralph Lauren,
Fila,
Bellinda
,
Ritmo
,
Kendall
,
Donna Karan and DKNY brands. Our Innerwear brands are market leaders across Australia and Western and Central Europe. In the intimate apparel category, we hold the number one market share in Australia and the number two market share in France, Italy and Spain. We are also the category leader in men’s underwear in Australia, France and Spain, and in hosiery in France and Germany. During
2018
, net sales from our International segment were
$2.3 billion
, representing approximately
34%
of total net sales and included sales primarily in Australasia, Europe, Asia, Latin America, Canada, the Middle East and Africa. Our largest international markets are Australasia, Europe, Japan, Canada, Mexico, China and Brazil.
The following table summarizes our brands and product categories sold within each international region:
3
|
International Country/Region
|
Primary Products
|
Primary Brands
|
|
Australasia
|
Basics, including men’s underwear, women’s panties, children’s underwear and socks
|
Bonds
,
Explorer
|
|
Intimate apparel, such as bras and shapewear
|
Bonds
,
Bras N Things
,
Berlei
|
|
|
Activewear
|
Champion
|
|
|
Home goods
|
Sheridan
|
|
|
Europe
|
Basics, including men’s underwear, women’s panties, children’s underwear and socks
|
DIM
,
Nur Die/Nur Der
,
Abanderado
,
Bellinda
|
|
Intimate apparel, such as bras and shapewear
|
DIM
,
Playtex
,
Lovable
,
Wonderbra
,
Maidenform
,
Shock Absorber
|
|
|
Hosiery
|
DIM
,
Nur Die/Nur Der
,
Bellinda
|
|
|
Activewear
|
Champion
|
|
|
Asia
|
Basics, including men’s underwear, women’s panties, children’s underwear and socks
|
Hanes, Champion
,
Polo Ralph Lauren,
*
|
|
Intimate apparel, such as bras and shapewear
|
Playtex
,
Wonderbra
|
|
|
Activewear
|
Champion
|
|
|
Americas (excluding the United States)
|
Basics, including men’s underwear, women’s panties, children’s underwear and socks
|
Hanes
,
Zorba
|
|
Intimate apparel, such as bras and shapewear
|
Wonderbra
,
Sol y Oro
, Donna Karan,* DKNY*
|
|
|
*
|
Brand used under a license agreement.
|
We have experienced significant growth in sales generated outside the United States driven by acquisitions, primarily in Europe and Australasia, as well as the strong momentum of our
Champion
brand in Europe and Asia. The following table summarizes our international sales as a percentage of total net sales.

Customers and Distribution Channels
Our products are distributed through two main channels: indirectly through our third party brick-and-mortar wholesale customers and directly through consumer-directed sales. Third party brick-and-mortar wholesale revenue is primarily generated by sales of our products to retailers to support their brick-and-mortar operations, as well as by royalty revenue from licensing agreements. Consumer-directed revenue is primarily generated by sales to individual consumers through our own stores or e-commerce platforms, which include both our owned sites and the sites of our retail customers. In
2018
, approximately 78% of our total net sales were to third party brick-and-mortar customers and 22% of our total net sales were consumer-directed.
In
2018
, approximately 66% of our total net sales were in the United States and approximately 34% were outside the United States. Within the United States, approximately 84% of our net sales were wholesale sales to retailers and wholesalers and 16% were consumer-directed. We have well-established relationships with some of the largest apparel retailers in the world. Our largest customers are Wal-Mart Stores, Inc. (“Wal-Mart”) and Target, accounting for
16%
and
12%
, respectively, of our total net sales in
2018
. As is common in the basic apparel industry, we generally do not have purchase agreements that
4
obligate our customers to purchase our products. However, the majority of our key customer relationships have been in place for 10 years or more. Wal-Mart and Target are our only customers with sales that exceeded 10% of our total net sales in
2018
, with substantially all Wal-Mart and Target sales reported within our Innerwear and Activewear segments.
Sales to mass merchants in the United States accounted for approximately 27% of our total net sales in
2018
and included all of our product categories under our
Hanes
,
Champion
,
Playtex, Maidenform
and
JMS
/
Just My Size
brands, as well as licensed logo apparel. Mass merchants feature high-volume, low-cost sales of basic apparel items along with a diverse variety of consumer goods products, such as grocery and drug products and other hard lines, and are characterized by large retailers, such as Wal-Mart and Target. Our largest mass merchant customer is Wal-Mart, which accounted for approximately
16%
of our total net sales in
2018
.
Sales to mid-tier and department stores in the United States accounted for approximately 8% of our total net sales in
2018
. Mid-tier stores target a higher-income consumer than mass merchants, focus more on sales of apparel items rather than other consumer goods such as grocery and drug products and are characterized by large retailers such as Kohl’s Corporation and J.C. Penney Company, Inc. We sell all of our product categories in mid-tier stores. Traditional department stores target higher-income consumers and carry more high-end, fashion conscious products than mid-tier stores or mass merchants and tend to operate in higher-income areas and commercial centers. Traditional department stores are characterized by large retailers such as Macy’s, Inc. and Belk, Inc. We sell products in our intimate apparel, underwear, socks, hosiery and activewear categories through department stores.
Consumer-directed sales in the United States accounted for approximately 10% of our total net sales in
2018
. We sell products that span across the Innerwear and Activewear product categories in the e-commerce environment through our owned e-commerce websites and through pure play e-commerce sites, such as Amazon.com (“Amazon”). We also sell a range of our products through our retail and value-based outlet stores, as well as through the e-commerce sites of our brick and mortar retail customers.
Sales to other customers in the United States represented approximately 21% of our total net sales in
2018
. We sell T-shirts, golf and sport shirts and fleece sweatshirts to wholesalers and third party embellishers primarily under our
Hanes
,
Champion
and
Hanes
Beefy-T brands. We also sell a significant range of our underwear, activewear and socks products under the
Champion
brand to wholesale clubs, such as Costco Wholesale Corporation, and sporting goods stores, such as DICK’S Sporting Goods Inc. We sell primarily legwear and underwear products under the
Hanes
and
L’eggs
brands to food, drug and variety stores. We also sell licensed logo apparel in collegiate bookstores. We sell products that span across our Innerwear and Activewear segments to the United States military for sale to servicemen and servicewomen and through discount retailers, such as the Dollar General Corporation.
Internationally, approximately 65% of our net sales were wholesale sales to retailers and 35% of our net sales were consumer-directed sales through our owned retail stores and e-commerce sites. For more information about our sales on a geographic basis, see Note, “Geographic Area Information,” to our consolidated financial statements.
Manufacturing, Sourcing and Distribution
During
2018
, more than 70% of the apparel units we sold were from finished goods manufactured through a combination of facilities we own and operate, and facilities owned and operated by dedicated third party contractors who perform some of the steps in the manufacturing process for us, such as dyeing, cutting and/or sewing. We sourced the remainder of our finished goods from third party manufacturers who supply us with finished products based on our designs. In making decisions about the location of manufacturing operations and third party sources of supply, we consider a number of factors, including labor, local operating costs, geopolitical factors, product quality, regional infrastructure, applicable quotas and duties and freight costs. We believe that our balanced approach to product supply, which relies on a combination of owned, contracted and sourced manufacturing located across different geographic regions, increases the efficiency of our operations, reduces product costs and offers customers a reliable source of supply.
Finished Goods That Are Manufactured by Hanesbrands
The manufacturing process for the finished goods that we manufacture begins with raw materials we obtain from suppliers. The principal raw materials in our product categories are cotton and synthetics. Cotton and synthetic materials are typically spun into yarn by our suppliers, which is then knitted into cotton, synthetic and blended fabrics. We source all of our yarn requirements from large-scale domestic and international suppliers. To a lesser extent, we purchase fabric from several domestic and international suppliers in conjunction with scheduled production. In addition to cotton yarn and cotton-based textiles, we use thread, narrow elastic and trim for product identification, buttons, zippers, snaps and lace. These fabrics are cut and sewn into finished products, either by us or by third party contractors. We currently operate 48 manufacturing facilities. Most of our cutting and sewing operations are strategically located in Asia, Central America and the Caribbean Basin. Alternate sources of these materials and services are readily available.
5
Finished Goods That Are Manufactured by Third Parties
In addition to our own manufacturing capabilities, we also source finished goods that we design from third-party manufacturers, also referred to as “turnkey products.” Many of these turnkey products are sourced from international suppliers by our strategic sourcing hubs in Asia.
All contracted and sourced manufacturing must meet our high quality standards. Further, all contractors and third-party manufacturers must be preaudited and adhere to our strict supplier and business practices guidelines. These requirements provide strict standards that, among other things, cover hours of work, age of workers, health and safety conditions, freedom of association and conformity with local laws and Hanesbrands’ standards. Each new supplier must be inspected and agree to comprehensive compliance terms prior to commencing any production on our behalf. We audit compliance with these standards against our 265 question, scored audit protocol using both internal and external audit teams. We are also a fully accredited participating company in the Fair Labor Association. For more information, visit
www.HanesForGood.com
.
Distribution
As of
December 29, 2018
, we distributed our products from 45 distribution centers. These facilities include 15 facilities located in the United States and 30 facilities located outside the United States, primarily in regions where we sell our products. We internally manage and operate 32 of these facilities, and we use third party logistics providers who operate the other 13 facilities on our behalf. International distribution operations use a combination of third party logistics providers, as well as owned and operated distribution operations, to distribute goods to our various international markets.
Inventory
Effective inventory management is key to our success. Because our customers generally do not purchase our products under long-term supply contracts, but rather on a purchase order basis, effective inventory management requires close coordination with the customer base. We seek to ensure that products are available to meet customer demands while effectively managing inventory levels. We employ various types of inventory management techniques that include collaborative forecasting and planning, supplier-managed inventory, key event management and various forms of replenishment management processes. Our supplier-managed inventory initiative is intended to shift raw material ownership and management to our suppliers until consumption, freeing up cash and improving response time. We have demand management planners in our customer management group who work closely with customers to develop demand forecasts that are passed to the supply chain. We also have professionals within the customer management group who coordinate daily with our larger customers to help ensure that our customers’ planned inventory levels are in fact available at their individual retail outlets. Additionally, within our supply chain organization we have dedicated professionals who translate the demand forecast into our inventory strategy and specific production plans. These individuals work closely with our customer management team to balance inventory investment/exposure with customer service targets.
Seasonality and Other Factors
Our operating results are subject to some variability due to seasonality and other factors. For instance, we generally have higher sales during the back-to-school and holiday shopping seasons and during periods of cooler weather, which benefits certain product categories such as fleece. Our diverse range of product offerings, however, provides some mitigation to the impact of seasonal changes in demand for certain items. Sales levels in any period are also impacted by customer decisions to increase or decrease their inventory levels in response to anticipated consumer demand. Our customers may cancel orders, change delivery schedules or change the mix of products ordered with minimal notice to us. Media, advertising and promotion expenses may vary from period to period during a fiscal year depending on the timing of our advertising campaigns for retail selling seasons and product introductions.
Product Innovation and Marketing
A significant component of our margin-enhancing Innovate-to-Elevate strategy is our strong product research and development and innovation capabilities, including the development of new and improved products, including our Tagless apparel platform, Comfort Flex Fit apparel platform, ComfortBlend fabric platform, temperature-control X-Temp fabric platform and FreshIQ advanced odor protection technology fabric platform.
Driving innovation platforms across brands and categories is a major element of our Innovate-to-Elevate strategy as it is designed to meet key consumer needs and leverage advertising dollars. During 2018, our advertising and promotion expense was approximately
$153 million
, representing 2% of our total net sales. We advertise in consumer and trade publications, television and through digital initiatives including social media, online video and mobile platforms on the Internet. We also participate in cooperative advertising on a shared cost basis with major retailers in print and digital media and television. During 2018, to enhance and support the growth of our brands, we increased the investment in our brands by approximately
6
$15 million as compared to 2017. Brand investment includes costs such as advertising, marketing and other costs associated with supporting brand growth.
Competition
The basic apparel market is highly competitive and rapidly evolving. Competition generally is based upon brand, comfort, fit, style and price. Our businesses face competition today from other large corporations and foreign manufacturers. In the United States, Fruit of the Loom, Inc., a subsidiary of Berkshire Hathaway Inc., competes with us across our Innerwear and Activewear segments through its own offerings and those of its Russell Corporation and Vanity Fair Intimates offerings. Other competitors in our Innerwear segment include L Brands Inc.’s Victoria’s Secret brand and Jockey International, Inc. Other competitors in our Activewear segment include various private label and controlled brands sold by many of our customers, as well as Gildan Activewear, Inc. and Gap Inc. Large European intimate apparel distributors such as Triumph International and Calzedonia S.p.A Group, as well as international activewear retailers such as Nike, Adidas, Puma, Under Armour and Converse, compete with us in our International segment. We also compete with many small manufacturers across all of our business segments, including our International segment. Additionally, mass merchant retailers, department stores and other retailers, including many of our customers, market and sell basic apparel products under private labels that compete directly with our brands. Our competitive strengths include our strong brands with leading market positions, our industry-leading innovation, our high-volume, core products focus, our significant scale of operations, our global supply chain and our strong customer relationships. We continually strive to improve in each of these areas.
Intellectual Property
We market our products under hundreds of our own trademarks in the United States and other countries around the world, the most widely recognized of which are
Hanes
,
Champion
,
C9 Champion
,
Bonds, Maidenform
,
DIM
,
Bali
,
Playtex
,
Sheridan, Bras N Things
,
Nur Die/Nur Der
,
Alternative
,
L
’
eggs
,
JMS/Just My Size
,
Lovable
,
Wonderbra
,
Berlei
,
Gear for Sports
,
Abanderado
,
Shock Absorber
and
Zorba
. Some of our products are sold under trademarks that have been licensed from third parties, such as Polo Ralph Lauren men’s underwear and Donna Karan and DKNY intimate apparel.
Some of our trademarks are licensed to third parties, such as
Champion
for athletic-oriented accessories. In the United States and Canada, the
Playtex
trademark is owned by Playtex Marketing Corporation, of which we own a 50% interest and which grants to us a perpetual royalty-free license to the
Playtex
trademark on and in connection with the sale of apparel in the United States and Canada. The other 50% interest in Playtex Marketing Corporation is owned by Playtex Products, LLC, an unrelated third party, whose affiliate, Edgewell Personal Care Brands, LLC, has a perpetual royalty-free license to the
Playtex
trademark on and in connection with the sale of non-apparel products in the United States and Canada. Outside the United States and Canada, we own the
Playtex
trademark and perpetually license such trademark to Edgewell Personal Care Brands, LLC for non-apparel products. We own the
Berlei
trademark in Australia, New Zealand, South Africa and a limited number of smaller jurisdictions. Apart from these jurisdictions, the
Berlei
trademark is owned by PD Enterprise Limited in most major markets, including Japan, China, the United States and the European Union. Each of Hanesbrands and PD Enterprise Limited has granted the other a non-exclusive, perpetual, royalty-free license to manufacture product bearing the
Berlei
trademark wherever that party has registered the
Berlei
trademark. Our trademarks are important to our marketing efforts and have substantial value.
We aggressively protect these trademarks from infringement and dilution through appropriate measures, including court actions and administrative proceedings. Although the laws vary by jurisdiction, trademarks generally remain valid as long as they are in use and/or their registrations are properly maintained. Most of the trademarks in our portfolio, including our core brands, are covered by trademark registrations in the countries of the world in which we do business, in addition to many other jurisdictions around the world, with a registration period of 10 years in most countries. Generally, trademark registrations can be renewed indefinitely as long as the trademarks are in use. We have an active program designed to ensure that our trademarks are registered, renewed, protected and maintained. We plan to continue to use all of our core trademarks and plan to renew the registrations for such trademarks as needed.
We also own a number of copyrights. Most of our copyrights are unregistered, although we have a sizable portfolio of copyrighted lace designs that are the subject of a number of registrations at the United States Copyright Office.
We place high importance on product innovation and design, and a number of these innovations and designs are the subject of patents. However, we do not regard any segment of our business as being dependent upon any single patent or group of related patents. In addition, we own proprietary trade secrets, technology and know-how that we have not patented.
Governmental Regulation and Environmental Matters
We are subject to federal, state and local laws and regulations in the United States that could affect our business, including those promulgated under the Occupational Safety and Health Act, the Consumer Product Safety Act, the Flammable
7
Fabrics Act, the Textile Fiber Product Identification Act, the rules and regulations of the Consumer Products Safety Commission and various environmental laws and regulations. Some of our international businesses are subject to similar laws and regulations in the countries in which they operate. Our operations also are subject to various international trade agreements and regulations. While we believe that we are in compliance in all material respects with all applicable governmental regulations, current governmental regulations may change or become more stringent or unforeseen events may occur, any of which could have a material adverse effect on our financial position or results of operations.
We are also subject to various domestic and international laws and regulations relating to generating emissions, water discharges, waste, product and packaging content and workplace safety. Noncompliance with these laws and regulations may result in substantial monetary penalties and criminal sanctions. We are aware of hazardous substances or petroleum releases at certain of our facilities and are working with the relevant environmental authorities to investigate and address such releases. We also have been identified as a “potentially responsible party” at certain waste disposal sites in the United States undergoing investigation and cleanup under the federal Comprehensive Environmental Response, Compensation and Liability Act (commonly known as Superfund) or state Superfund equivalent programs. Where we have determined that a liability has been incurred and the amount of the loss can reasonably be estimated, we have accrued amounts in our balance sheet for losses related to these sites. Compliance with environmental laws and regulations and our remedial environmental obligations historically have not had a material impact on our operations, and we are not aware of any proposed regulations or remedial obligations that could trigger significant costs or capital expenditures in connection with such compliance.
Corporate Social Responsibility
Hanesbrands conducts business around the world in a highly ethical manner. We are protective of our strong reputation for corporate citizenship and social responsibility and proud of our significant achievements in the areas of environmental stewardship, workplace quality and community building.
We call our corporate social responsibility program “Hanes for Good” because adhering to responsible and sustainable business practices is good for our company, good for our employees, good for our communities and good for our investors. We own the majority of our supply chain and have more direct control over how we do business than many of our competitors. More than 70% of the apparel units that we sell are produced in facilities that we own or control through dedicated contractors. We also have an industry-leading compliance program that helps to ensure our business partners live up to the high standards that we set for ourselves.
We have been recognized for our socially responsible business practices by such organizations as the U.S. Environmental Protection Agency Energy Star program, social compliance rating group Free2Work, the United Way, Corporate Responsibility magazine and others. In fact, Richard Noll, our Chairman and former Chief Executive Officer, received the 2016 Responsible CEO of the Year award from Corporate Responsibility magazine which is annually presented to CEOs who visibly exceed standards in the areas of employee relations, environmental impact and sustainability, human rights, philanthropy, and corporate responsibility practices. We are also members of the Fair Labor Association, Sustainable Apparel Coalition, The Sustainability Consortium and the Corporate Eco Forum.
We have made significant progress across a range of corporate social responsibility issues, but we recognize that there is always room for improvement. We pride ourselves on listening to others outside our company and reacting quickly and responsibly if issues emerge. We hope to continue making a positive and lasting contribution to our world in the years to come. More information about our Hanes for Good corporate responsibility initiatives may be found at
www.HanesForGood.com
.
Employees
As of
December 29, 2018
, we had approximately 68,000 employees, approximately 8,000 of whom were located in the United States. As of
December 29, 2018
, less than 40 employees in the United States were covered by collective bargaining agreements. A significant portion of our employees based in foreign countries are represented by works councils or unions or are subject to trade-sponsored or governmental agreements. We believe our relationships with our employees are good.
|
Item 1A.
|
Risk Factors
|
This section describes circumstances or events that could have a negative effect on our financial results or operations or that could change, for the worse, existing trends in our businesses. The occurrence of one or more of the circumstances or events described below could have a material adverse effect on our financial condition, results of operations and cash flows or on the trading price of our common stock. The risks and uncertainties described in this Annual Report on Form 10-K are not the only ones facing us. Additional risks and uncertainties that currently are not known to us or that we currently believe are immaterial also may adversely affect our businesses and operations.
8
We operate in a highly competitive and rapidly evolving market, and our market share and results of operations could be adversely affected if we fail to compete effectively in the future.
The basic apparel market is highly competitive and evolving rapidly. Competition is generally based upon brand, comfort, fit, style and price. Our businesses face competition today from other large domestic and foreign corporations and manufacturers, as well as mass merchant retailers, department stores and other retailers, including many of our customers, that market and sell basic apparel products under private labels that compete directly with our brands. Also, online retail shopping is rapidly evolving, and we expect competition in the e-commerce market to intensify in the future as the Internet facilitates competitive entry and comparison shopping. If we do not successfully develop and maintain a relevant omni-channel experience for our customers, our businesses and results of operations could be adversely impacted. Increased competition may result in a loss of or a reduction in shelf space and promotional support and reduced prices, in each case decreasing our cash flows, operating margins and profitability. Our ability to identify and capitalize on retail trends, including technology, e-commerce and other process efficiencies to gain market share and better service our customer base will, in large part, determine our future success. If we fail to compete successfully, our market share, results of operations and financial condition will be materially and adversely affected.
The rapidly changing retail environment could result in the loss of or material reduction in sales to certain of our customers, which could have a material adverse effect on our business, results of operations, financial condition and cash flows.
The retail environment is highly competitive. Consumers are increasingly embracing shopping online and through mobile commerce applications. As a result, a greater portion of total consumer expenditures with retailers is occurring online and through mobile commerce applications. If our brick-and-mortar retail customers fail to maintain or grow their overall market position through the integration of physical retail presence and digital retail, these customers may experience financial difficulties including store closures, bankruptcies or liquidations. This could, in turn, create difficulty in moving our products to market, which would increase inventories or backlog, substantially reduce our revenues, increase our credit risk and ultimately have a material adverse effect on our results of operations, financial condition and cash flows.
Any inadequacy, interruption, integration failure or security failure with respect to our information technology could harm our ability to effectively operate our business.
Our ability to effectively manage and operate our business depends significantly on information technology systems. The failure of these systems to operate effectively and support global growth and expansion, problems with integrating various data sources, challenges in transitioning to upgraded or replacement systems, difficulty in integrating new systems or systems of acquired businesses, or a breach in security of these systems could adversely impact the operations of our business.
Despite our policies, procedures and programs designed to ensure the integrity of our information technology systems, we may not be effective in identifying and mitigating every risk to which we are exposed. Furthermore, from time to time we rely on information technology systems which may be managed, hosted, provided and/or accessed by third parties or their vendors to assist in conducting our business. Such relationships and access may create difficulties in anticipating and implementing adequate preventative measures or fully mitigating harms after a breach.
Hackers and data thieves are increasingly sophisticated and operate large-scale and complex attacks that may include computer viruses or other malicious codes, ransomware, unauthorized access attempts, denial of service attacks and large-scale automated attacks, phishing, social engineering, hacking and other cyber-attacks. Any breach of our network or databases, or those of our third party providers, may result in the loss of valuable business data, misappropriation of our consumers’ or employees’ personal information, or a disruption of our business, which could give rise to unwanted media attention, impair our ability to order materials, make and ship orders, and process payments, materially damage our customer relationships and reputation, and result in lost sales, fines or lawsuits.
Moreover, we must comply with increasingly complex and rigorous regulatory standards enacted to protect business and personal data, including, among other, the General Data Protection Regulation in effect in the European Union. Any failure to comply with these regulatory standards could subject us to legal and reputational risks. Misuse of or failure to secure personal information could also result in violation of data privacy laws and regulations, proceedings, and potentially significant monetary penalties, against us by governmental entities or others, damage to our reputation and credibility, and could have a negative impact on revenues and profits.
9
Significant fluctuations and volatility in the price of various input costs, such as cotton and oil-related materials, utilities, freight and wages, may have a material adverse effect on our business, results of operations, financial condition and cash flows.
Inflation can have a long-term impact on us because increasing costs of materials and labor may impact our ability to maintain satisfactory margins. For example, the cost of the materials that are used in our manufacturing process, such as oil-related commodity prices and other raw materials, including cotton, dyes and chemicals, and other costs, such as fuel, energy and utility costs, can fluctuate as a result of inflation and other factors. Similarly, a significant portion of our products are manufactured in other countries and declines in the value of the U.S. dollar may result in higher manufacturing costs. In addition, sudden decreases in the costs for materials may result in the cost of inventory exceeding the cost of new production, which could result in lower profitability, particularly if these decreases result in downward price pressure. If, in the future we incur volatility in the costs for materials and labor that we are unable to offset through price adjustments or improved efficiencies, or if our competitors’ unwillingness to follow our price changes results in downward price pressure, our business, results of operations, financial condition and cash flows may be adversely affected.
Our failure to properly manage strategic projects in order to achieve the desired results may negatively impact our business.
The implementation of our business strategy periodically involves the execution of complex projects, which places significant demands on our management, accounting, financial, information and other systems and on our business. Our ability to successfully implement such projects is dependent on management’s ability to timely and effectively anticipate and adapt to our changing business needs. We cannot assure you that our management will be able to manage these projects effectively or implement them successfully. If we miscalculate the resources or time we need to complete a project or fail to implement the project effectively, our business and operating results could be adversely affected.
Our business depends on our senior management team and other key personnel.
Our success depends upon the continued contributions of our senior management team and other key personnel, some of whom have unique talents and experience that would be difficult to replace. The loss or interruption of the services of a member of our senior management team or other key personnel could have a material adverse effect on our business during the transitional period that would be required for a successor to assume the responsibilities of the position. Our future success will also depend on our ability to develop and/or recruit employees with the core competencies needed to support our growth in global markets and in new products or services. We may not be able to attract or retain these employees, which could adversely affect our business.
Due to the extensive nature of our foreign operations, fluctuations in foreign currency exchange rates could negatively impact our results of operations.
A growing percentage of our total revenues (approximately
34%
in
2018
) is derived from markets outside the United States. We sell a majority of our products in transactions denominated in U.S. dollars; however, we purchase many of our raw materials, pay a portion of our wages and make other payments to participants in our supply chain in foreign currencies. As a result, when the U.S. dollar weakens against any of these currencies, our cost of sales could increase substantially. Outside the United States, we may pay for materials or finished products in U.S. dollars, and in some cases a strengthening of the U.S. dollar could effectively increase our costs where we use foreign currency to purchase the U.S. dollars we need to make such payments. Changes in foreign currency exchange rates could have an adverse impact on our financial condition, results of operations and cash flows.
We use foreign exchange forward contracts to hedge material exposure to adverse changes in foreign exchange rates. However, no hedging strategy can completely insulate us from foreign exchange risk. We are also exposed to gains and losses resulting from the effect that fluctuations in foreign currency exchange rates have on the reported results in our consolidated financial statements due to the translation of operating results and financial position of our foreign subsidiaries.
We rely on a relatively small number of customers for a significant portion of our sales, and the loss of or material reduction in sales to any of our top customers could have a material adverse effect on our business, results of operations, financial condition and cash flows.
In
2018
, our top 10 customers accounted for approximately 42% of our total net sales and our top two customers, Wal-Mart and Target, accounted for
16%
and
12%
of our total net sales, respectively. We expect that these customers will continue to represent a significant portion of our net sales in the future. Moreover, our top customers are the largest market participants in our primary distribution channels across all of our product lines. We generally do not enter into purchase agreements that obligate our customers to purchase our products, and as a result, most of our sales are made on a purchase order basis. A
10
decision by any of our top customers to significantly decrease the volume of products purchased from us could substantially reduce revenues and may have a material adverse effect on our business, results of operations, financial condition and cash flows. In addition, if any of our customers devote less selling space to apparel products, our sales to those customers could be reduced even if we maintain our share of their apparel business. Any such reduction in apparel selling space could result in lower sales and our business, results of operations, financial condition and cash flows may be adversely affected.
Our operations in international markets, and our earnings in those markets, may be affected by legal, regulatory, political and economic risks.
During 2018, net sales from our International segment were
$2.3 billion
, representing approximately
34%
of total net sales. In addition, a significant amount of our manufacturing and production operations are located, or our products are sourced from, outside the United States. As a result, our business is subject to risks associated with international operations. These risks include the burdens of complying with foreign laws and regulations, unexpected changes in tariffs, taxes or regulatory requirements, and political unrest and corruption.
Regulatory changes could limit the countries in which we sell, produce or source our products or significantly increase the cost of operating in or obtaining materials originating from certain countries. Restrictions imposed by such changes can have a particular impact on our business when, after we have moved our operations to a particular location, new unfavorable regulations are enacted in that area or favorable regulations currently in effect are changed.
Countries in which our products are manufactured or sold may from time to time impose additional new regulations, or modify existing regulations, including:
|
•
|
changes in duties, taxes, tariffs and other charges on imports;
|
|
•
|
limitations on the quantity of goods which may be imported into the United States from a particular country;
|
|
•
|
requirements as to where products and/or inputs are manufactured or sourced;
|
|
•
|
creation of export licensing requirements, imposition of restrictions on export quantities or specification of minimum export pricing and/or export prices or duties;
|
|
•
|
limitations on foreign owned businesses; or
|
|
•
|
government actions to cancel contracts, re-denominate the official currency, renounce or default on obligations, renegotiate terms unilaterally or expropriate assets.
|
In addition, political and economic changes or volatility, geopolitical regional conflicts, terrorist activity, political unrest, civil strife, acts of war, public corruption and other economic or political uncertainties could interrupt and negatively affect our business operations. All of these factors could result in increased costs or decreased revenues and could materially and adversely affect our product sales, financial condition and results of operations.
Recently, political discourse in the United States has increasingly focused on ways to discourage United States corporations from outsourcing manufacturing and production activities to foreign jurisdictions. Many prominent government officials have publicly addressed the need to discourage these practices through television, news publications and social media platforms, including through the possibility of imposing tariffs or other penalties on goods manufactured outside the United States to attempt to discourage these practices. During 2017, the United States withdrew from some of its existing trade agreements and it has also been suggested that the United States may materially modify or withdraw from other trade agreements. Furthermore, it is possible that other forms of trade restriction, including tariffs, quotas and customs restrictions, will be put into place in the United States or in countries from which we source our materials or finished products. We cannot predict whether any of the countries in which our merchandise currently is manufactured or may be manufactured in the future will be subject to additional trade restrictions imposed by the United States or other foreign governments, including the likelihood, type, or effect of any such restrictions. Any of these actions, if ultimately enacted, could adversely affect our results of operations or profitability. Further, our image, the reputation of our brands and our stock price may be adversely affected if we are publicly singled out for criticism by government officials as a result of our foreign operations.
We are also subject to the United States Foreign Corrupt Practices Act, in addition to the anti-corruption laws of the foreign countries in which we operate. Although we implement policies and procedures designed to promote compliance with these laws, our employees, contractors and agents, as well as those companies to which we outsource certain of our business operations, may take actions in violation of our policies. Any such violation could result in sanctions or other penalties and have an adverse effect on our business, reputation and operating results.
In addition, in June 2016, voters in the United Kingdom approved an advisory referendum to withdraw from the European Union, commonly referred to as “Brexit.” This referendum has created political and economic uncertainty, particularly in the United Kingdom and the European Union, and this uncertainty may persist for years. The withdrawal could significantly
11
disrupt the free movement of goods, services, and people between the United Kingdom and the European Union, and result in increased legal and regulatory complexities, as well as potential higher costs of conducting business in Europe. The United Kingdom’s vote to exit the European Union could also result in similar referendums or votes in other European countries in which we do business. The uncertainty surrounding the terms of the United Kingdom’s withdrawal and its consequences could adversely impact consumer and investor confidence, and the level of consumer purchases of discretionary items and retail products, including our products. Any of these effects, among others, could materially adversely affect our business, results of operations, and financial condition.
We may not realize all of the anticipated benefits of acquisitions or those benefits may take longer to realize than expected. We may also encounter significant unexpected difficulties in integrating acquired businesses.
We have historically pursued strategic acquisitions as part of our long-term business strategy and may continue to do so in the future. The success of these acquisitions will depend, in part, on our ability to realize anticipated cost and operational synergies. Acquired businesses may not achieve expected results of operations, including expected levels of revenues, and may require unanticipated costs and expenditures. In addition, following completion of an acquisition, we may not be able to maintain the levels of revenue, earnings or operating efficiency that we and the acquired business have achieved or might achieve separately. Acquired businesses may also subject us to liabilities that we were unable to discover in the course of our due diligence, and our rights to indemnification from the sellers of such other businesses, even if obtained, may not be sufficient to offset the relevant liabilities. Annual cost savings in each such transaction may be materially less than anticipated if the integration of operations is delayed beyond what is anticipated. We cannot assure you that we will realize the full expected benefits of any acquisition within the anticipated time frame or at all.
In addition, the integration of newly acquired businesses may be expensive and time-consuming, diverting management attention from core operations, and may not be entirely successful. The process of integrating the operations of acquired businesses could cause an interruption of, or loss of momentum in, the activities of one or more of our combined businesses and the possible loss of key personnel. Integration of the acquired businesses may also place additional pressures on our systems of internal control over financial reporting. If we are unable to successfully integrate any newly acquired business, it could have an adverse effect on our results of operations or financial condition.
The loss of one or more of our suppliers of finished goods or raw materials may interrupt our supplies and materially harm our business.
We purchase all of the raw materials used in our self-manufactured products and the sourced finished goods that we design from a limited number of third party suppliers and manufacturers. Our ability to meet our customers’ needs depends on our ability to maintain an uninterrupted supply of raw materials and finished products from our third party suppliers and manufacturers. Our business, financial condition or results of operations could be adversely affected if any of our principal third party suppliers or manufacturers experience financial difficulties that they are not able to overcome resulting from worldwide economic conditions, production problems, difficulties in sourcing raw materials, lack of capacity or transportation disruptions, or if for these or other reasons they raise the prices of the raw materials or finished products we purchase from them. The magnitude of this risk depends upon the timing of any interruptions, the materials or products that the third party manufacturers provide and the volume of production.
Our dependence on third parties for raw materials and finished products subjects us to the risk of supplier failure and customer dissatisfaction with the quality of our products. Quality failures by our third party manufacturers or changes in their financial or business condition that affect their production could disrupt our ability to supply quality products to our customers and thereby materially harm our business.
Our results of operations could be materially harmed if we are unable to manage our inventory effectively and accurately forecast demand for our products.
We are faced with the constant challenge of balancing our inventory levels with our ability to meet marketplace needs. Factors that could affect our ability to accurately forecast demand for our products include our ability to anticipate and respond effectively to evolving consumer preferences and trends and to translate these preferences and trends into marketable product offerings, as well as unanticipated changes in general economic conditions or other factors, which result in cancellations of orders or a reduction or increase in the rate of reorders placed by retailers.
Inventory reserves can result from the complexity of our supply chain, a long manufacturing process and the seasonal nature of certain products. We sell a large number of our products to a small number of customers, and these customers generally are not required by contract to purchase our goods. As a result, we often schedule internal production and place orders for products with third-party manufacturers before our customers’ orders are firm. If we fail to accurately forecast consumer demand, we may experience excess inventory levels or a shortage of product required to meet the demand. Inventory
12
levels in excess of consumer demand may result in inventory write-downs and the sale of excess inventory at discounted prices, which could have an adverse effect on the image and reputation of our brands and negatively impact profitability. On the other hand, if we underestimate demand for our products, our manufacturing facilities or third-party manufacturers may not be able to produce products to meet consumer requirements, and this could result in delays in the shipment of products and lost revenues, as well as damage to our reputation and relationships. These risks could have a material adverse effect on our brand image as well as our results of operations and financial condition.
Additionally, sudden decreases in the costs for materials may result in the cost of inventory exceeding the cost of new production; if this occurs, it could have a material adverse effect on our business, results of operations, financial condition or cash flow, particularly if we hold a large amount of excess inventory. Excess inventory charges can reduce gross margins or result in operating losses, lowered plant and equipment utilization and lowered fixed operating cost absorption, all of which could have a material adverse effect on our business, results of operations, financial condition or cash flows.
The success of our business is tied to the strength and reputation of our brands. If the reputation of one or more of our brands erodes significantly, it could have a material impact on our financial results.
Many of our brands have worldwide recognition, and our financial success is directly dependent on the success of our brands. The success of a brand can suffer if our marketing plans or product initiatives do not have the desired impact on a brand’s image or its ability to attract consumers. Our results could also be negatively impacted if one of our brands suffers substantial harm to its reputation due to a significant product recall, product-related litigation or the sale of counterfeit products. Additionally, negative or inaccurate postings or comments on social media or networking websites about the Company, its practices or one of its brands could generate adverse publicity that could damage the reputation of our brands.
We also license some of our important trademarks to third parties. For example, we license
Champion
to third parties for athletic-oriented accessories. Although we make concerted efforts to protect our brands through quality control mechanisms and contractual obligations imposed on our licensees, there is a risk that some licensees may not be in full compliance with those mechanisms and obligations. If the reputation of one or more of our brands is significantly eroded, it could adversely affect our sales, results of operations, cash flows and financial condition.
We have a complex multinational tax structure, and changes in effective tax rates or adverse outcomes resulting from examination of our income tax returns could impact our capital deployment strategy and adversely affect our results.
We have a complex multinational tax structure with multiple types of intercompany transactions, and our allocation of profits and losses among us and our subsidiaries through our intercompany transfer pricing agreements is subject to review by the Internal Revenue Service and other tax authorities. Our future effective tax rates could be adversely affected by earnings being lower than anticipated in countries where we have lower statutory rates and higher than anticipated in countries where we have higher statutory rates, by changes in the valuation of our deferred tax assets and liabilities, or by changes in tax laws, regulations, accounting principles or interpretations thereof. We are continuously evaluating its capital allocation strategies in an effort maximize shareholder value, which includes maintaining appropriate debt to earnings ratios, and as a result there may be times where we need to reevaluate our plans to permanently reinvest certain unremitted foreign earnings to the United States which may increase or decrease our income tax expense during periods of change. In addition, we are also subject to the continuous examination of our income tax returns and related transfer pricing documentation by the Internal Revenue Service and other tax authorities. We regularly assess the likelihood of adverse outcomes resulting from these examinations to determine the adequacy of our provision for income taxes. There can be no assurance that the outcomes from these continuous examinations will not have an adverse effect on our operating results and financial condition. Additionally, changes in tax laws, regulations, future jurisdictional profitability of us and our subsidiaries, and related regulatory interpretations in the countries in which we operate may impact the taxes we pay or tax provision we record, as well as our capital deployment strategy, which could adversely affect our results of operations.
On December 22, 2017, the Tax Cuts and Jobs Act (the “Tax Act”) was enacted. The Tax Act significantly revised United States corporate income tax law by, among other things, reducing the corporate income tax rate to 21%, introducing a new minimum tax on global intangible low-taxed income (“GILTI”) and implementing a modified territorial tax system that included a one-time transition tax on deemed repatriated earnings from foreign subsidiaries. In the fourth quarter of 2018, we completed our accounting as it relates to the enactment of the Tax Act pursuant to the guidance set forth in Staff Accounting Bulletin No. 118 (“SAB 118”) and have accounted for the tax provisions of the Tax Act which became effective in 2018. The actual impact of the Tax Act may differ from amounts recorded to date as further guidance and regulations continue to be issued to further clarify and help taxpayers interpret various components of the Tax Act.
13
Our reputation, ability to do business and results of operations could be impaired by improper conduct by any of our employees, agents or business partners.
Our business is subject to federal, state, local and international laws, rules and regulations, such as state and local wage and hour laws, the U.S. Foreign Corrupt Practices Act, the U.K. Bribery Act, the False Claims Act, the Employee Retirement Income Security Act (“ERISA”), the Global Data Protection Regulation, securities laws, import and export laws (including customs regulations), unclaimed property laws and many others. We cannot provide assurance our internal controls will always protect us from the improper conduct of our employees, agents and business partners. Any violations of law or improper conduct could damage our reputation and, depending on the circumstances, subject us to, among other things, civil and criminal penalties, material fines, equitable remedies (including profit disgorgement and injunctions on future conduct), securities litigation and a general loss of investor confidence, any one of which could have a material adverse impact on our business prospects, financial condition, results of operations, cash flows, and the market value of our stock.
Our customers may require products on an exclusive basis, forms of economic support and other changes that could be harmful to our business.
Customers increasingly may require us to provide them with some of our products on an exclusive basis, which could cause an increase in the number of stock keeping units, or “SKUs,” we must carry and, consequently, increase our inventory levels and working capital requirements. Moreover, our customers may increasingly seek markdown allowances, incentives and other forms of economic support, which reduce our gross margins and affect our profitability. Our financial performance is negatively affected by these pricing pressures when we are forced to reduce our prices without being able to correspondingly reduce our production costs.
If our advertising, marketing and promotional programs are unsuccessful, or if our competitors are more effective with their programs than we are, our sales could be negatively affected.
Ineffective marketing, advertising and promotional programs could inhibit our ability to maintain brand relevance and drive increased sales. While we use social media, websites, mobile applications, email, print and television to promote our products and attract customers, some of our competitors may expend more for their programs than we do, or use different approaches than we do, which may provide them with a competitive advantage. Our programs may not be effective or could require increased expenditures, which could have a material adverse effect on our revenue and results of operations.
If we fail to maintain effective internal controls, we may not be able to report our financial results accurately or timely or prevent or detect fraud, which could have a material adverse effect on our business or the market price of our securities.
Effective internal controls are necessary for us to provide reasonable assurance with respect to our financial reports and to effectively prevent or detect fraud. If we cannot provide reasonable assurance with respect to our financial reports and effectively prevent or detect fraud, our brands and operating results could be harmed. Pursuant to the Sarbanes-Oxley Act of 2002, we are required to furnish a report by management on internal control over financial reporting, including management’s assessment of the effectiveness of such control. Internal control over financial reporting may not prevent or detect misstatements because of its inherent limitations, including the possibility of human error, the circumvention or overriding of controls, or fraud. Therefore, even effective internal controls cannot provide absolute assurance with respect to the preparation and fair presentation of financial statements. In addition, projections of any evaluation of effectiveness of internal control over financial reporting to future periods are subject to the risk that the control may become inadequate because of changes in conditions, or that the degree of compliance with the policies or procedures may deteriorate. If we fail to maintain the adequacy of our internal controls, including any failure to implement required new or improved controls, or if we experience difficulties in their implementation, our business and operating results could be harmed and we could fail to meet our reporting obligations, which could have a material adverse effect on our business.
Economic conditions may adversely impact demand for our products, reduce access to credit and cause our customers, suppliers and other business partners to suffer financial hardship, all of which could adversely impact our business, results of operations, financial condition and cash flows.
Although the majority of our products are replenishment in nature and tend to be purchased by consumers on a planned, rather than on an impulse, basis, our sales are impacted by discretionary spending by consumers. Discretionary spending is affected by many factors that are outside of our control, including, among others, general business conditions, interest rates, inflation, consumer debt levels, the availability of consumer credit, currency exchange rates, taxation, energy prices, unemployment trends and other matters that influence consumer confidence and spending. Reduced sales at our wholesale customers may lead to lower retail inventory levels, reduced orders to us or order cancellations. These lower sales volumes, along with the possibility of restrictions on access to the credit markets, may result in our customers experiencing financial
14
difficulties including store closures, bankruptcies or liquidations. This may result in higher credit risk relating to receivables from our customers who are experiencing these financial difficulties. Any of these occurrences could have a material adverse effect on our business, results of operations, financial condition and cash flows.
In addition, economic conditions, including decreased access to credit, may result in financial difficulties leading to restructurings, bankruptcies, liquidations and other unfavorable events for our suppliers of raw materials and finished goods, logistics and other service providers and financial institutions which are counterparties to our credit facilities and derivatives transactions. In addition, the inability of these third parties to overcome these difficulties may increase. If third parties on which we rely for raw materials, finished goods or services are unable to overcome financial difficulties and provide us with the materials and services we need, or if counterparties to our credit facilities or derivatives transactions do not perform their obligations, our business, results of operations, financial condition and cash flows could be adversely affected.
Our inability to successfully recover should we experience a disaster or other business continuity problem could cause material financial loss, loss of human capital, regulatory actions, reputational harm, or legal liability.
We have a complex global supply chain and distribution network that supports our ability to consistently provide our products to our customers. Should we experience a local or regional disaster or other business continuity problem, such as an earthquake, tsunami, terrorist attack, pandemic or other natural or man-made disaster, our continued success will depend, in part, on the safety and availability of our personnel, our office facilities, and the proper functioning of our computer, telecommunication and other systems and operations. While our operational size, the diversity of locations from which we operate, and our redundant back-up systems provide us with a strong advantage should we experience a local or regional disaster or other business continuity event, we could still experience operational challenges, in particular depending upon how a local or regional event may affect our human capital across our operations or with regard to particular aspects of our operations, such as key executive officers or personnel in our technology group. If we cannot respond to disruptions in our operations, for example, by finding alternative suppliers or replacing capacity at key manufacturing or distribution locations, or cannot quickly repair damage to our information, production or supply systems, we may be late in delivering, or be unable to deliver, products to our customers. These events could result in reputational damage, lost sales, cancellation charges or excessive markdowns. All of the foregoing can have an adverse effect on our business, results of operations, financial condition and cash flows.
Our balance sheet includes a significant amount of intangible assets and goodwill. A decline in the estimated fair value of an intangible asset or of a business unit could result in an asset impairment charge, which would be recorded as a noncash expense in our Consolidated Statement of Income.
Goodwill, trademarks and other identifiable intangible assets must be tested for impairment at least annually. The fair value of the goodwill assigned to a business unit could decline if projected revenues or cash flows were to be lower in the future due to effects of the global economy or other causes. If the carrying value of intangible assets or of goodwill were to exceed its fair value, the asset would be written down to its fair value, with the impairment loss recognized as a noncash charge in the Consolidated Statement of Income.
As of
December 29, 2018
, we had approximately
$1.2 billion
of goodwill and
$1.6 billion
of trademarks and other identifiable intangibles on our balance sheet, which together represent
39%
of our total assets. No impairment was identified in
2018
. Changes in the future outlook of a business unit could result in an impairment loss, which could have a material adverse effect on our results of operations and financial condition.
We design, manufacture, source and sell products under trademarks that are licensed from third parties. If any licensor takes actions related to their trademarks that would cause their brands or our company reputational harm, our business may be adversely affected.
We design, manufacture, source and sell a number of our products under trademarks that are licensed from third parties, such as our Polo Ralph Lauren men’s underwear and our Donna Karan and DKNY intimate apparel. Because we do not control the brands licensed to us, our licensors could make changes to their brands or business models that could result in a significant downturn in a brand’s business, adversely affecting our sales and results of operations. If any licensor engages in behavior with respect to the licensed marks that would cause us reputational harm, or if any of the brands licensed to us violates the trademark rights of another or are deemed to be invalid or unenforceable, we could experience a significant downturn in that brand’s business, adversely affecting our sales and results of operations, and we may be required to expend significant amounts on public relations, advertising and, possibly, legal fees.
15
We may be adversely affected by unseasonal or severe weather conditions.
Our business may be adversely affected by unseasonable or severe weather conditions. Periods of unseasonably warm weather in the fall or winter, or periods of unseasonably cool and wet weather in the spring or summer, can negatively impact retail traffic and consumer spending. In addition, severe weather events such as snow storms or hurricanes typically lead to temporarily reduced retail traffic. Any of these conditions could result in negative point-of-sale trends for our merchandise and reduced replenishment shipments to our wholesale customers.
We are subject to certain risks as a result of our indebtedness.
Our indebtedness primarily includes (i) a $1.0 billion revolving loan facility (the “Revolving Loan Facility”), a $750 million term loan a facility (the “Term Loan A”), a $500 million term loan b facility (the “Term Loan B”), a A$200 million Australian term a-1 loan facility (the “Australian Term A-1”) and an A$65 million Australian revolving loan facility (the “Australian Revolver” and together with the Revolving Loan Facility, the Term Loan A, the Term Loan B and the Australian Term A-1, the “Senior Secured Credit Facility”), (ii) our $900 million 4.625% Senior Notes due 2024 (the “4.625% Senior Notes”) and our $900 million 4.875% Senior Notes due 2026 (the “4.875% Senior Notes”), (iii) our €500 million 3.5% Senior Notes due 2024 (the “3.5% Senior Notes” and together with the 4.625% Senior Notes and the 4.875% Senior Notes, the “Senior Notes”), and (iv) a $225 million accounts receivable securitization facility (the “Accounts Receivable Securitization Facility”) and (v) a €100 million European revolving loan facility (the “European Revolving Loan Facility”).
The Senior Secured Credit Facility contains restrictions that affect, and in some cases significantly limit or prohibit, among other things, our ability to borrow funds, pay dividends or make other distributions, make investments, engage in transactions with affiliates, or create liens on our assets. Covenants in the Senior Secured Credit Facility and the Accounts Receivable Securitization Facility require us to maintain a minimum interest coverage ratio and a maximum total debt to EBITDA (earnings before interest, income taxes, depreciation expense and amortization), or leverage ratio. The indentures governing the Senior Notes also restrict our ability to incur additional secured indebtedness in an amount that exceeds the greater of (a) $3.0 billion or (b) the amount that would cause our consolidated secured net debt ratio to exceed 3.25 to 1.00, as well as certain other customary covenants and restrictions. These restrictions and covenants could limit our ability to obtain additional capital in the future to fund capital expenditures or acquisitions, meet our debt payment obligations and capital commitments, fund any operating losses or future development of our business affiliates, obtain lower borrowing costs that are available from secured lenders or engage in advantageous transactions that monetize our assets or conduct other necessary or prudent corporate activities. Any failure to comply with these covenants and restrictions could result in an event of default that accelerates the maturity of our indebtedness under such facilities, resulting in an adverse effect on our business.
The lenders under the Senior Secured Credit Facility have received a pledge of substantially all of our existing and future direct and indirect subsidiaries, with certain customary or agreed-upon exceptions for certain foreign subsidiaries and certain other subsidiaries. Additionally, these lenders generally have a lien on substantially all of our assets and the assets of our U.S. subsidiaries and certain other foreign subsidiaries, with certain exceptions. The financial institutions that are party to the Accounts Receivable Securitization Facility have a lien on certain of our domestic accounts receivable. As a result of these pledges and liens, if we fail to meet our payment or other obligations under the Senior Secured Credit Facility or the Accounts Receivable Securitization Facility, the lenders under those facilities will be entitled to foreclose on substantially all of our assets and, at their option, liquidate these assets, which would adversely impact the operations of our business.
If we are unable to protect our intellectual property rights, our business may be adversely affected.
Our trademarks are important to our marketing efforts and have substantial value. We aggressively protect these trademarks from infringement and dilution through appropriate measures, including court actions and administrative proceedings. We are susceptible to others imitating our products and infringing our intellectual property rights. Infringement or counterfeiting of our products could diminish the value of our brands or otherwise adversely affect our business. Actions we have taken to establish and protect our intellectual property rights may not be adequate to prevent imitation of our products by others or to prevent others from seeking to invalidate our trademarks or block sales of our products as a violation of the trademarks and intellectual property rights of others. In addition, unilateral actions in the United States or other countries, such as changes to or the repeal of laws recognizing trademark or other intellectual property rights, could have an impact on our ability to enforce those rights.
The value of our intellectual property could diminish if others assert rights in, or ownership of, our trademarks and other intellectual property rights. We may be unable to successfully resolve these types of conflicts to our satisfaction. In some cases, there may be trademark owners who have prior rights to our trademarks because the laws of certain foreign countries may not protect intellectual property rights to the same extent as do the laws of the United States. In other cases, there may be holders who have prior rights to similar trademarks. We are from time to time involved in opposition and cancellation proceedings with respect to some items of our intellectual property.
16
Market returns could have a negative impact on the return on plan assets for our pension, which may require significant funding.
The plan assets of our pension plans, which had a loss of approximately 5% during
2018
and a return of approximately 11% during
2017
, are invested mainly in domestic and international equities, bonds, hedge funds and real estate. We are unable to predict the variations in asset values or the severity or duration of any disruptions in the financial markets or adverse economic conditions in the United States, Europe and Asia. The funded status of these plans, and the related cost reflected in our consolidated financial statements, are affected by various factors that are subject to an inherent degree of uncertainty, particularly in the current economic environment. Under the Pension Protection Act of 2006 (the “Pension Protection Act”), losses of asset values may necessitate increased funding of the plans in the future to meet minimum federal government requirements. Under the Pension Protection Act funding rules, our U.S. qualified pension plan is approximately 93% funded as of
December 29, 2018
. Any downward pressure on the asset values of these plans may require us to fund obligations earlier than we had originally planned, which would have a negative impact on cash flows from operations.
Our balance sheet includes a significant amount of deferred tax assets. We must generate sufficient future taxable income to realize the deferred tax benefits.
As of
December 29, 2018
, we had approximately $163 million of net deferred tax assets on our balance sheet, which represents approximately 2% of our total assets. Deferred tax assets relate to temporary differences (differences between the assets and liabilities in the consolidated financial statements and the assets and liabilities in the calculation of taxable income). The recognition of deferred tax assets is reduced by a valuation allowance if it is more likely than not that the tax benefits associated with the deferred tax benefits will not be realized. If we are unable to generate sufficient future taxable income in certain jurisdictions, or if there is a significant change in the actual effective tax rates or the time period within which the underlying temporary differences become taxable or deductible, we could be required to increase the valuation allowances against our deferred tax assets, which would cause an increase in our effective tax rate. A significant increase in our effective tax rate could have a material adverse effect on our financial condition or results of operations.
Inability to access sufficient capital at reasonable rates or commercially reasonable terms or maintain sufficient liquidity in the amounts and at the times needed could adversely impact our business.
We rely on our cash flows generated from operations and the borrowing capacity under our Revolving Loan Facility and other external debt financings to meet the cash requirements of our business. We have significant capital requirements and will need continued access to debt capital from outside sources in order to efficiently fund the cash flow needs of our business and pursue strategic acquisitions.
Although we currently have available credit facilities to fund our current operating needs, we cannot be certain that we will be able to replace our existing credit facilities or refinance our existing or future debt at a reasonable cost when necessary. The ability to have continued access to reasonably priced credit is dependent upon our current and future capital structure, financial performance, our credit ratings and general economic conditions. If we are unable to access the capital markets at a reasonable economic cost, it could have an adverse effect on our results of operations or financial condition.
We may suffer negative publicity if we or our third party manufacturers violate labor laws or engage in practices that are viewed as unethical or illegal, which could cause a loss of business.
We cannot fully control the business and labor practices of our third party manufacturers, the majority of whom are located in Asia, Central America and the Caribbean Basin. If one of our own manufacturing operations or one of our third party manufacturers violates or is accused of violating local or international labor laws or other applicable regulations, or engages in labor or other practices that would be viewed in any market in which our products are sold as unethical, we could suffer negative publicity, which could tarnish our brands’ image or result in a loss of sales. In addition, if such negative publicity affected one of our customers, it could result in a loss of business for us.
We had approximately 68,000 employees worldwide as of
December 29, 2018
, and our business operations and financial performance could be adversely affected by changes in our relationship with our employees or changes to United States or foreign employment regulations.
We had approximately 68,000 employees worldwide as of
December 29, 2018
. This means we have a significant exposure to changes in domestic and foreign laws governing our relationships with our employees, including wage and hour laws and regulations, fair labor standards, minimum wage requirements, overtime pay, unemployment tax rates, workers’ compensation rates, citizenship requirements and payroll taxes, which likely would have a direct impact on our operating costs. Approximately 60,000 of those employees were outside of the United States. A significant increase in minimum wage or overtime rates in countries where we have employees could have a significant impact on our operating costs and may require
17
that we relocate those operations or take other steps to mitigate such increases, all of which may cause us to incur additional costs, expend resources responding to such increases and lower our margins.
In addition, less than 40 of our employees in the United States and a significant number of our international employees are members of labor organizations or are covered by collective bargaining agreements. If there were a significant increase in the number of our employees who are members of labor organizations or become parties to collective bargaining agreements, we would become vulnerable to a strike, work stoppage or other labor action by these employees that could have an adverse effect on our business.
Anti-takeover provisions of our charter and bylaws, as well as Maryland law, may reduce the likelihood of any potential change of control or unsolicited acquisition proposal that you might consider favorable.
Our charter permits our Board of Directors, with the approval of a majority of the entire Board and without stockholder approval, to amend our charter to increase or decrease the aggregate number of shares of stock or the number of shares of stock of any class or series that we have the authority to issue. In addition, our Board of Directors may classify or reclassify any unissued shares of common stock or preferred stock and may set the preferences, conversion or other rights, voting powers and other terms of the classified or reclassified shares. Our Board of Directors could establish a series of preferred stock that could have the effect of delaying, deferring or preventing a transaction or a change in control that might involve a premium price for our common stock or otherwise be in the best interest of our stockholders. Our charter also provides that a director may be removed at any time, but only for cause, as defined in our charter, and then only by the affirmative vote of at least two thirds of the votes entitled to be cast generally in the election of directors. We have also elected to be subject to certain provisions of Maryland law that provide that any and all vacancies on our Board of Directors may only be filled by the affirmative vote of a majority of our remaining directors, even if they do not constitute a quorum, and that any director elected to fill a vacancy shall serve for the remainder of the full term of the directorship in which the vacancy occurred. Under Maryland law, our Board of Directors also is permitted, without stockholder approval, to implement a classified board structure at any time.
Our bylaws provide that nominations of persons for election to our Board of Directors and the proposal of business to be considered at a stockholders meeting may be made only in the notice of the meeting, by or at the direction of our Board of Directors or by a stockholder who is entitled to vote at the meeting and has complied with the advance notice procedures of our bylaws. Also, under Maryland law, business combinations between us and an interested stockholder or an affiliate of an interested stockholder, including mergers, consolidations, share exchanges or, in circumstances specified in the statute, asset transfers or issuances or reclassifications of equity securities, are prohibited for five years after the most recent date on which the interested stockholder becomes an interested stockholder. An interested stockholder includes any person who beneficially owns 10% or more of the voting power of our stock or any affiliate or associate of ours who, at any time within the two-year period prior to the date in question, was the beneficial owner of 10% or more of the voting power of our stock. A person is not an interested stockholder under the statute if our Board of Directors approved in advance the transaction by which he otherwise would have become an interested stockholder. However, in approving a transaction, our Board of Directors may provide that its approval is subject to compliance, at or after the time of approval, with any terms and conditions determined by our Board. After the five-year prohibition, any business combination between us and an interested stockholder generally must be recommended by our Board of Directors and approved by two supermajority votes or our common stockholders must receive a minimum price, as defined under Maryland law, for their shares. The statute permits various exemptions from its provisions, including business combinations that are exempted by our Board of Directors prior to the time that the interested stockholder becomes an interested stockholder.
These and other provisions of Maryland law or our charter and bylaws could have the effect of delaying, deferring or preventing a transaction or a change in control that might involve a premium price for our common stock or otherwise be considered favorably by our stockholders.
|
Item 1B.
|
Unresolved Staff Comments
|
Not applicable.
18
|
Item 1C.
|
Executive Officers of the Registrant
|
The chart below lists our executive officers and is followed by biographical information about them. Each of our executive officers is elected annually by the Board of Directors to serve until his or her successor is elected and qualifies or until his or her death, resignation or removal. No family relationship exists between any of our directors or executive officers.
|
Name
|
Age
|
Positions
|
|
Gerald W. Evans, Jr.
|
59
|
Chief Executive Officer
|
|
Barry A. Hytinen
|
44
|
Chief Financial Officer
|
|
W. Howard Upchurch
|
54
|
Group President, Innerwear Americas
|
|
Joia M. Johnson
|
58
|
Chief Administrative Officer, General Counsel and Corporate Secretary
|
|
Michael E. Faircloth
|
53
|
Group President, Global Supply Chain, Information Technology and E-Commerce
|
|
Jonathan Ram
|
51
|
Group President, Global Activewear
|
|
David L. Bortolussi
|
49
|
President and Managing Director, Hanes Australasia
|
|
M. Scott Lewis
|
48
|
Chief Accounting Officer and Controller
|
Gerald W. Evans, Jr.
has served as the Chief Executive Officer of the Company since October 2016. From August 2013 until October 2016, Mr. Evans served as Chief Operating Officer of the Company. From October 2011 until August 2013, Mr. Evans served as Co-Chief Operating Officer of the Company. Prior to his appointment as Co-Chief Operating Officer, Mr. Evans served as our Co-Operating Officer, President International, from November 2010 until October 2011. From February 2009 until November 2010, he was our President, International Business and Global Supply Chain. From February 2008 until February 2009, he served as our President, Global Supply Chain and Asia Business Development. From September 2006 until February 2008, he served as Executive Vice President, Chief Supply Chain Officer. From July 2005 until September 2006, Mr. Evans served as a Vice President of Sara Lee Corporation (“Sara Lee”), a consumer goods company, and as Chief Supply Chain Officer of Sara Lee Branded Apparel. Mr. Evans served as President and Chief Executive Officer of Sara Lee Sportswear and Underwear from March 2003 until June 2005 and as President and Chief Executive Officer of Sara Lee Sportswear from March 1999 to February 2003.
Barry A. Hytinen
has served as our Chief Financial Officer since October 2017. Prior to his appointment as Chief Financial Officer and since 2015, Mr. Hytinen served as Executive Vice President and Chief Financial Officer of Tempur Sealy International, Inc. (“Tempur Sealy International”), a publicly traded global bedding manufacturer. Prior to that role and since 2005, he served in a range of finance, corporate development, financial planning and investor relations roles at Tempur Sealy International, including as Executive Vice President, Corporate Development and Finance. Prior to joining Tempur Sealy International, Mr. Hytinen served as Chief Financial Officer of Fogbreak Software, a venture-backed software company. Earlier in his career, he held finance and corporate development positions at Vignette and General Electric.
W. Howard Upchurch
has served as our Group President, Innerwear Americas (a position previously known as President, Innerwear) since January 2011. Prior to his appointment as Group President, Innerwear Americas, Mr. Upchurch served as our Executive Vice President and General Manager, Domestic Innerwear from January 2008 until December 2010 and as our Senior Vice President and General Manager, Intimate Apparel from July 2006 until December 2007. Prior to the completion of the Company’s spin off from Sara Lee, Mr. Upchurch served as President of Sara Lee Intimates and Hosiery.
Joia M. Johnson
has served as our Chief Administrative Officer since October 2016 and as our General Counsel and Corporate Secretary since January 2007. Since 2007, Ms. Johnson has also served as our Chief Legal Officer. From May 2000 until January 2007, Ms. Johnson served as Executive Vice President, General Counsel and Corporate Secretary of RARE Hospitality International, Inc., an owner, operator and franchisor of national chain restaurants acquired by Darden Restaurants, Inc. in October 2007. Ms. Johnson currently serves on the Boards of Directors of Crawford & Company and Total System Services, Inc.
Michael E. Faircloth
has served as our Group President, Global Supply Chain, Information Technology and E-Commerce since January 2018. He served as our President, Chief Global Supply Chain and Information Technology Officer from 2014 to 2017 and as our Chief Global Operations Officer (a position previously known as President, Chief Global Supply Chain Officer) from 2010 to 2014. Prior to his appointment as Chief Global Operations Officer, Mr. Faircloth served as our Senior Vice President, Supply Chain Support from October 2009 to November 2010, as our Vice President, Supply Chain Support from March 2009 to September 2009 and as our Vice President of Engineering & Quality from July 2006 to March 2009. Prior to the completion of the Company’s spin off from Sara Lee, Mr. Faircloth served as Vice President, Industrialization of Sara Lee.
Jonathan Ram
has served as our Group President, Global Activewear since May 2018. Prior to joining the Company, he served as executive vice president North America for New Balance Athletics, Inc., an athletic footwear manufacturer and
19
marketer. He joined New Balance in 2002, and prior assignments included vice president and managing director for Europe, the Middle East, Africa, and Mexico. Earlier, Mr. Ram held positions with Roots Ltd., National Basketball Association Entertainment Inc., Richmont Apparel Corporation, National Hockey League Players’ Association, and Major League Baseball Properties, Inc.
David L. Bortolussi
has served as our President and Managing Director, Hanes Australasia since the acquisition of Pacific Brands Limited (“Pacific Brands”), a consumer goods company, by the Company in 2016. Prior to that time, Mr. Bortolussi served as Chief Executive Officer of Pacific Brands from 2014 to 2016 and as Chief Financial and Operating Officer of Pacific Brands from 2009 to 2014. Prior to that time, Mr. Bortolussi was the Chief Strategy Officer at Foster’s Group and held senior consulting roles with McKinsey & Company and PricewaterhouseCoopers.
M. Scott Lewis
has served as the Company’s Chief Accounting Officer and Controller since May 2015. Mr. Lewis joined the Company in 2006 as Director, External Reporting and was promoted in 2011 to Vice President, External Reporting, promoted in 2013 to Vice President, Financial Reporting and Accounting, and promoted in December 2013 to Vice President, Tax. Prior to joining the Company, Mr. Lewis served as senior manager with the accounting, audit and tax consulting firm KPMG.
|
Item 2.
|
Properties
|
We own and lease properties supporting our administrative, manufacturing, distribution and direct outlet activities. As of
December 29, 2018
, we owned and leased properties in 41 countries, including 48 manufacturing facilities and 45 distribution centers, as well as office facilities. The leases for these properties expire between 2019 and 2057, with the exception of some seasonal warehouses that we lease on a month-by-month basis. As of
December 29, 2018
, we also operated 243 retail and direct outlet stores in the United States and the Commonwealth of Puerto Rico and 690 retail and outlet stores internationally, most of which are leased under five-year, renewable lease agreements and several of which are leased under 10-year agreements. We believe that our facilities, as well as equipment, are in good condition and meet our current business needs.
We own our approximately 470,000 square-foot headquarters located in Winston-Salem, North Carolina, which houses our various sales, marketing and corporate business functions. Research and development as well as certain product-design functions also are located in Winston-Salem, while other design functions are located in a mix of leased and owned facilities in New York City, Atlanta and Lenexa, Kansas, as well as several international cities.
Our products are manufactured through a combination of facilities we own and operate and facilities owned and operated by third party contractors who perform some of the steps in the manufacturing process for us, such as cutting and/or sewing. We source the remainder of our finished goods from third party manufacturers who supply us with finished products based on our designs. Our largest manufacturing facilities include an approximately 1.1 million square-foot owned facility located in San Juan Opico, El Salvador, an approximately 660,000 square-foot owned facility located in Cadca, Slovakia and an approximately 600,000 square-foot owned facility located in Bonao, Dominican Republic. We distribute our products from 45 distribution centers. These facilities include 15 facilities located in the United States and 30 facilities located outside the United States in regions where we manufacture our products. Our largest distribution facilities include an approximately 1.3 million square-foot leased facility located in Perris, California, an approximately 900,000 square-foot leased facility located in Rural Hall, North Carolina and an approximately 700,000 square-foot owned facility located in Martinsville, Virginia.
The following table summarizes the properties primarily used by our segments as of
December 29, 2018
:
|
Owned Square
Feet
|
Leased Square
Feet
|
Total
|
||||||
|
Properties by Segment
(1)
|
||||||||
|
Innerwear
|
2,347,885
|
|
6,581,403
|
|
8,929,288
|
|
||
|
Activewear
|
2,458,519
|
|
3,068,662
|
|
5,527,181
|
|
||
|
International
|
2,776,011
|
|
4,019,111
|
|
6,795,122
|
|
||
|
Other
|
303,445
|
|
1,050,508
|
|
1,353,953
|
|
||
|
Totals
|
7,885,860
|
|
14,719,684
|
|
22,605,544
|
|
||
|
(1)
|
Excludes vacant land, facilities under construction, facilities no longer in operation intended for disposal, apartments/residences, sourcing offices not associated with a particular segment, and office buildings housing corporate functions.
|
20
|
Item 3.
|
Legal Proceedings
|
Although we are subject to various claims and legal actions that occur from time to time in the ordinary course of our business, we are not party to any pending legal proceedings that we believe could have a material adverse effect on our business, results of operations, financial condition or cash flows.
|
Item 4.
|
Mine Safety Disclosures
|
Not applicable.
21
PART II
|
Item 5.
|
Market for Registrant’s Common Equity, Related Stockholder Matters and Issuer Purchases of Equity Securities
|
Market for our Common Stock
Our common stock currently is traded on the New York Stock Exchange, or the “NYSE,” under the symbol “HBI.” We have not made any unregistered sales of our equity securities.
Holders of Record
On
February 1, 2019
, there were 15,777 holders of record of our common stock.
Issuer Repurchases of Equity Securities
We did not repurchase any of our common stock during the quarter or the year ended December 29, 2018.
Performance Graph
The following graph compares the cumulative total stockholder return on our common stock with the comparable cumulative return of the S&P 500 Index and the S&P 1500 Apparel, Accessories & Luxury Goods Index. The graph assumes that $100 was invested in our common stock and each index on December 26, 2013. The stock price performance on the following graph is not necessarily indicative of future stock price performance.
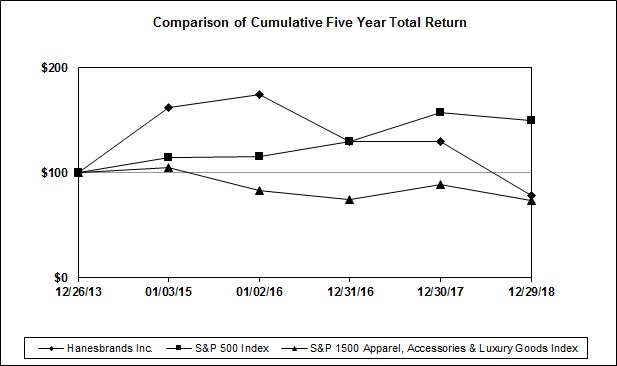
22
Equity Compensation Plan Information
The following table provides information about our equity compensation plans as of
December 29, 2018
:
|
Number of Securities to be Issued Upon Exercise of Outstanding Options, Warrants and Rights
|
Weighted Average Exercise Price of Outstanding Options, Warrants and Rights (2)
|
Number of Securities Remaining Available for Future Issuance under Equity Compensation Plans (1)
|
|||||||
|
(amounts in thousands, except per share data)
|
|||||||||
|
Plan Category
|
|||||||||
|
Equity compensation plans approved by security holders
|
5,097
|
|
$
|
1.00
|
|
14,473
|
|
||
|
Equity compensation plans not approved by security holders
|
—
|
|
—
|
|
—
|
|
|||
|
Total
|
5,097
|
|
$
|
1.00
|
|
14,473
|
|
||
|
(1)
|
The amount appearing under “Number of securities remaining available for future issuance under equity compensation plans” includes 7,840 shares available under the Hanesbrands Inc. Omnibus Incentive Plan (As Amended and Restated) and 6,633 shares available under the Hanesbrands Inc. Employee Stock Purchase Plan of 2006.
|
|
(2)
|
As of
December 29, 2018
, the Company had 783 outstanding options, warrants and rights that could be exercised for consideration. The weighted average exercise price of outstanding options, warrants and rights excluding those that can be exercised for no consideration is $6.51.
|
|
Item 6.
|
Selected Financial Data
|
The following table presents our selected historical financial data. The statement of income data for the years ended
December 29, 2018
,
December 30, 2017
and
December 31, 2016
and the balance sheet data as of
December 29, 2018
and
December 30, 2017
have been derived from our audited consolidated financial statements included elsewhere in this Annual Report on Form 10-K. The statement of income data for the years ended
January 2, 2016
and
January 3, 2015
and the balance sheet data as of
December 31, 2016
,
January 2, 2016
and
January 3, 2015
has been derived from our consolidated financial statements not included in this Annual Report on Form 10-K.
The data should be read in conjunction with our historical financial statements and “Management’s Discussion and Analysis of Financial Condition and Results of Operations” included elsewhere in this Annual Report on Form 10-K.
|
|
Years Ended
|
||||||||||||||||||
|
|
December 29,
2018 |
December 30,
2017 |
December 31,
2016 |
January 2,
2016 |
January 3,
2015 |
||||||||||||||
|
|
(amounts in thousands, except per share data)
|
||||||||||||||||||
|
Statement of Income Data:
|
|||||||||||||||||||
|
Net sales
|
$
|
6,803,955
|
|
$
|
6,471,410
|
|
$
|
6,028,199
|
|
$
|
5,731,549
|
|
$
|
5,324,746
|
|
||||
|
Operating profit
|
867,951
|
|
744,350
|
|
790,051
|
|
604,426
|
|
572,248
|
|
|||||||||
|
Income from continuing operations
|
553,084
|
|
63,991
|
|
536,927
|
|
428,855
|
|
404,519
|
|
|||||||||
|
Income (loss) from discontinued operations, net of tax
|
—
|
|
(2,097
|
)
|
2,455
|
|
—
|
|
—
|
|
|||||||||
|
Net income
|
$
|
553,084
|
|
$
|
61,894
|
|
$
|
539,382
|
|
$
|
428,855
|
|
$
|
404,519
|
|
||||
|
Earnings (loss) per share — basic:
|
|||||||||||||||||||
|
Continuing operations
|
$
|
1.52
|
|
$
|
0.17
|
|
$
|
1.41
|
|
$
|
1.07
|
|
$
|
1.01
|
|
||||
|
Discontinued operations
|
—
|
|
(0.01
|
)
|
0.01
|
|
—
|
|
—
|
|
|||||||||
|
Net income
|
$
|
1.52
|
|
$
|
0.17
|
|
$
|
1.41
|
|
$
|
1.07
|
|
$
|
1.01
|
|
||||
|
Earnings (loss) per share — diluted:
|
|||||||||||||||||||
|
Continuing operations
|
$
|
1.52
|
|
$
|
0.17
|
|
$
|
1.40
|
|
$
|
1.06
|
|
$
|
0.99
|
|
||||
|
Discontinued operations
|
—
|
|
(0.01
|
)
|
0.01
|
|
—
|
|
—
|
|
|||||||||
|
Net income
|
$
|
1.52
|
|
$
|
0.17
|
|
$
|
1.40
|
|
$
|
1.06
|
|
$
|
0.99
|
|
||||
|
Dividends per share
|
$
|
0.60
|
|
$
|
0.60
|
|
$
|
0.44
|
|
$
|
0.40
|
|
$
|
0.30
|
|
||||
23
|
December 29,
2018 |
December 30,
2017 |
December 31,
2016 |
January 2,
2016 |
January 3,
2015 |
|||||||||||||||
|
|
(in thousands)
|
||||||||||||||||||
|
Balance Sheet Data:
|
|||||||||||||||||||
|
Cash and cash equivalents
|
$
|
433,022
|
|
$
|
421,566
|
|
$
|
460,245
|
|
$
|
319,169
|
|
$
|
239,855
|
|
||||
|
Working capital
|
1,487,347
|
|
1,607,625
|
|
1,695,498
|
|
1,413,958
|
|
1,067,753
|
|
|||||||||
|
Total assets
|
7,255,958
|
|
6,894,775
|
|
6,930,480
|
|
5,597,590
|
|
5,187,891
|
|
|||||||||
|
Noncurrent liabilities:
|
|||||||||||||||||||
|
Long-term debt
|
3,534,183
|
|
3,702,054
|
|
3,507,685
|
|
2,232,712
|
|
1,593,695
|
|
|||||||||
|
Other noncurrent liabilities
|
620,624
|
|
590,548
|
|
573,213
|
|
585,078
|
|
725,010
|
|
|||||||||
|
Total stockholders’ equity
|
970,283
|
|
686,202
|
|
1,223,914
|
|
1,275,891
|
|
1,386,772
|
|
|||||||||
24
|
Item 7.
|
Management’s Discussion and Analysis of Financial Condition and Results of Operations
|
This management’s discussion and analysis of financial condition and results of operations, or MD&A, contains forward-looking statements that involve risks and uncertainties. Please see “Forward-Looking Statements” and “Risk Factors” in this Annual Report on Form 10-K for a discussion of the uncertainties, risks and assumptions associated with these statements. This discussion should be read in conjunction with our historical financial statements and related notes thereto and the other disclosures contained elsewhere in this Annual Report on Form 10-K. The results of operations for the periods reflected herein are not necessarily indicative of results that may be expected for future periods, and our actual results may differ materially from those discussed in the forward-looking statements as a result of various factors, including but not limited to those listed under “Risk Factors” in this Annual Report on Form 10-K and included elsewhere in this Annual Report on Form 10-K.
This MD&A is a supplement to our consolidated financial statements and notes thereto included elsewhere in this Annual Report on Form 10-K, and is provided to enhance your understanding of our results of operations and financial condition. Our MD&A is organized as follows:
|
•
|
Overview.
This section provides a general description of our Company and operating segments, business and industry trends, our key business strategies and background information on other matters discussed in this MD&A.
|
|
•
|
2018
Highlights.
This section discusses some of the highlights of our performance and activities during
2018
.
|
|
•
|
Consolidated Results of Operations and Operating Results by Business Segment.
These sections provide our analysis and outlook for the significant line items on our statements of income, as well as other information that we deem meaningful to an understanding of our results of operations on both a consolidated basis and a business segment basis.
|
|
•
|
Liquidity and Capital Resources.
This section provides an analysis of trends and uncertainties affecting liquidity, cash requirements for our business, sources and uses of our cash and our financing arrangements.
|
|
•
|
Critical Accounting Policies and Estimates.
This section discusses the accounting policies that we consider important to the evaluation and reporting of our financial condition and results of operations, and whose application requires significant judgments or a complex estimation process.
|
|
•
|
Recently Issued Accounting Pronouncements.
This section provides a summary of the most recent authoritative accounting pronouncements that we will be required to adopt in a future period.
|
Overview
Our Company
Hanesbrands Inc. is a socially responsible leading marketer of everyday basic innerwear and activewear apparel in the Americas, Europe, Australia and Asia/Pacific under some of the world’s strongest apparel brands, including
Hanes, Champion, Bonds
,
Maidenform, DIM, Bali, Playtex, Bras N Things
,
Nur Die/Nur Der, Alternative
,
L’eggs, JMS/Just My Size, Lovable, Wonderbra, Berlei
and
Gear for Sports.
We design, manufacture, source and sell a broad range of basic apparel such as T-shirts, bras, panties, men’s underwear, children’s underwear, activewear, socks and hosiery. Our brands hold either the number one or number two market position by units sold in many of the product categories and geographies in which we compete.
Acquisitions
On February 12, 2018, we acquired 100% of the outstanding equity of BNT Holdco Pty Limited (“Bras N Things”) for a total purchase price of A$498,236 (U.S. $391,572). The purchase price was subsequently revised to A$495,224 (U.S. $389,205) due to a final working capital adjustment. We funded the acquisition with a combination of short-term borrowings under its existing Revolving Loan Facility and cash on hand. Bras N Things is a leading intimate apparel retailer that sells proprietary bras, panties and lingerie sets through a retail network of approximately
170
brick-and-mortar retail stores at acquisition date in Australia, New Zealand and South Africa and an e-commerce platform. We believe this acquisition will create opportunities for expansion of the Bras N Things consumer-directed sales model.
Our Segments
Our operations are managed and reported in three operating segments, each of which is a reportable segment for financial reporting purposes: Innerwear, Activewear and International. These segments are organized principally by product category and geographic location. Each segment has its own management team that is responsible for the operations of the segment’s businesses, but the segments share a common supply chain and media and marketing platforms. Other consists of our U.S. value-based (“outlet”) stores and United States hosiery business. In the first quarter of 2018, we eliminated the allocation of certain corporate overhead selling, general and administrative expenses related to legal, human resources,
25
information technology, finance and real estate departments to the segments, in order to reflect the manner in which the business is managed and results are reviewed by our Chief Executive Officer, who is our chief operating decision maker. Prior year segment operating profit disclosures have been revised to conform to the current year presentation.
The reportable segments are as follows:
|
•
|
Innerwear includes sales in the United States of basic branded apparel products that are replenishment in nature under the product categories of men’s underwear, women’s panties, children’s underwear and socks, and intimate apparel, which includes bras and shapewear.
|
|
•
|
Activewear includes sales in the United States of basic branded products that are primarily seasonal in nature to both retailers and wholesalers, as well as licensed sports apparel and licensed logo apparel in collegiate bookstores, mass retailers and other channels.
|
|
•
|
International includes sales of products in all of our categories outside the United States, primarily in Europe, Australia, Asia, Latin America and Canada.
|
Outlook for
2019
Our 2019 guidance includes the following:
|
•
|
Net sales of $6.885 billion to $6.985 billion, operating profit of $900 million to $930 million, and net income of $583 million to $610 million;
|
|
•
|
Pre-tax acquisition, integration and other action-related costs of approximately $55 million reflected in operating profit;
|
|
•
|
Interest expense and other expenses to be approximately $224 million combined;
|
|
•
|
An annual tax rate of approximately 14%;
|
|
•
|
Cash flow from operations of $700 million to $800 million; and
|
|
•
|
Capital expenditure investment of approximately $90 million to $100 million.
|
Business and Industry Trends
Inflation and Changing Prices
Cotton is the primary raw material used in manufacturing many of our products. While we do not own yarn operations, we are still exposed to fluctuations in the cost of cotton. Increases in the cost of cotton can result in higher costs in the price we pay for yarn from our large-scale yarn suppliers and may result in the need to implement future price increases in order to maintain our margins. Decreases in cotton prices can lead to lower margins for inventory and products produced from cotton we have already purchased, particularly if there is downward price pressure as a result of consumer demand, competition or other factors.
Our costs for cotton yarn and cotton-based textiles vary based upon the fluctuating cost of cotton, which is affected by, among other factors, weather, consumer demand, speculation on the commodities market, the relative valuations and fluctuations of the currencies of producer versus consumer countries and other factors that are generally unpredictable and beyond our control. We are able to lock in the cost of cotton reflected in the price we pay for yarn from our primary yarn suppliers in an attempt to protect our business from the volatility of the market price of cotton. Under our agreements with these suppliers, we have the ability to periodically fix the cotton cost component of our yarn purchases. When we elect to fix the cotton cost component under these agreements, interim fluctuations in the price of cotton do not impact the price we pay for the specified volume of yarn. The yarn suppliers bear the risk of cotton fluctuations for the yarn volume specified and it is their responsibility to procure the cotton at the agreed upon pricing through arrangements they make with their cotton suppliers. However, our business can be affected by dramatic movements in cotton prices. The cost of cotton used in goods manufactured by us represented only approximately 5% of our cost of sales in
2018
. Costs incurred today for materials and labor, including cotton, typically do not impact our results until the inventory is sold approximately six to nine months later.
Inflation can have a long-term impact on us because increasing costs of materials and labor may impact our ability to maintain satisfactory margins. For example, the cost of the materials that are used in our manufacturing process, such as oil-related commodities and other raw materials, such as dyes and chemicals, and other costs, such as fuel, energy and utility costs, can fluctuate as a result of inflation and other factors. Costs incurred for materials and labor are capitalized into inventory and impact our results as the inventory is sold. In addition, a significant portion of our products are manufactured in countries other than the United States and declines in the value of the U.S. dollar may result in higher manufacturing costs. Increases in inflation may not be matched by rises in consumer income, which also could have a negative impact on spending.
26
Other Business and Industry Trends
The basic apparel market is highly competitive and evolving rapidly. Competition is generally based upon brand, comfort, fit, style and price. The majority of our core styles continue from year to year, with variations only in color, fabric or design details. Some products, however, such as intimate apparel, activewear and sheer hosiery, do have more of an emphasis on style and innovation. Our businesses face competition from other large corporations and foreign manufacturers, as well as smaller companies, department stores, specialty stores and other retailers that market and sell basic apparel products under private labels that compete directly with our brands.
Our top 10 customers accounted for 42% of our net sales in 2018. Our largest customers in
2018
were Wal-Mart and Target, which accounted for
16%
and
12%
of total sales, respectively. The increasing bargaining power of retailers can create pricing pressures as our customers grow larger and seek greater concessions in their purchase of our products, while also demanding exclusivity with respect to some of our products. To counteract these effects, it has become increasingly important to leverage our national brands through investment in our largest and strongest brands as our customers strive to maximize their performance especially in today’s challenging retail economic environment. Brands are important in our core categories to drive traffic and project the quality and value our customers demand.
Consumers are increasingly embracing shopping online through e-commerce platforms. As a result, an increasing portion of our revenue across all channels is being generated online through e-commerce platforms. We are continuing to develop and expand our omnichannel capabilities to allow a consumer to use more than one channel when making a purchase, including in-store, at one of our retail or outlet stores or those of our retail partners, online or with a mobile device, through one of our branded websites, the website of one of our retail partners, or an online pureplay, such as Amazon. In addition to broadening our assortment of product offerings across all online channels, we are also increasing the proportion of our media budget dedicated to digital marketing.
Foreign Exchange Rates
Changes in exchange rates between the U.S. Dollar and other currencies can impact our financial results in two ways; a translation impact and a transaction impact. The translation impact refers to the impact that changes in exchange rates can have on our published financial results. Similar to many multi-national corporations that publish financial results in U.S. Dollars, our revenue and profit earned in local foreign currencies is translated back into U.S. Dollars using an average exchange rate over the representative period. A period of strengthening in the U.S. Dollar results in a negative impact to our published financial results (because it would take more units of a local currency to convert into a dollar). The opposite is true during a period of weakening in the U.S. Dollar. Our biggest foreign currency exposures are the Australian dollar and the Euro.
The transaction impact on financial results is common for apparel companies that source goods because these goods are purchased in U.S. Dollars. The transaction impact from a strengthening dollar would be negative to our financial results (because the U.S. Dollar-based costs would convert into a higher amount of local currency units, which means a higher local-currency cost of goods, and in turn, a lower local-currency gross profit). The transaction impact from exchange rates is typically recovered over time with price increases. However, during periods of rapid change in exchange rates; pricing is unable to change quickly enough, therefore we hedge against our sourcing costs to minimize our exposure to fluctuating exchange rates.
Our Key Business Strategies
Our Innovate-to-Elevate strategy integrates our brand superiority, industry-leading innovation and low-cost supply chain to provide higher valued products while lowering production costs.
The first element of our Innovate-to-Elevate strategy is our brand power. We seek to drive sales growth by consistently offering consumers brands they trust and products with strong value. Our brands have a strong heritage in the basic apparel industry. Our brands hold either the number one or number two U.S. market position by units sold in most product categories in which we compete. Internationally, our commercial markets include Europe, Australasia, Japan, Canada, Mexico, China and Brazil, where we expect a substantial amount of gross domestic product growth outside the United States will be concentrated over the next decade. Our ability to react to changing customer needs and industry trends is key to our success. Our design, research and product development teams, in partnership with our marketing teams, drive our efforts to bring innovations to market. We seek to leverage our insights into consumer demand in the basic apparel industry to develop new products within our existing lines and to modify our existing core products in ways that make them more appealing, addressing changing customer needs and industry trends. We also support our key brands with targeted, effective advertising and marketing campaigns.
27
The second element of our Innovate-to-Elevate strategy is platform innovation. We focus on identifying the long-term megatrends that will impact our categories over the next five to 10 years. Once we have identified these trends, we utilize a disciplined big-idea process to put more science into the art of apparel. Our approach to innovation is to focus on big platforms. Our Tagless apparel platform, Comfort Flex Fit apparel platform, ComfortBlend fabric platform, temperature-control X-Temp fabric platform and FreshIQ advanced odor protection technology fabric platform incorporate big-idea innovation to span brands, product categories, business segments, retailer and distribution channels and geographies. We are focused on driving innovation that is margin accretive and that can leverage our supply chain in order to drive further economies of scale.
The third element of our Innovate-to-Elevate strategy is our low-cost global supply chain. We seek to expand margins through optimizing our low-cost global supply chain and streamlining our operations to reduce costs. We believe that we are able to leverage our significant scale of operations to provide us with greater manufacturing efficiencies, purchasing power and product design, marketing and customer management resources than our smaller competitors. Our global supply chain spans across both the Western and Eastern hemispheres and provides us with a balanced approach to product supply, which relies on a combination of owned, contracted and sourced manufacturing located across different geographic regions, increases the efficiency of our operations, reduces product costs and offers customers a reliable source of supply. Our global supply chain enables us to expand and leverage our production scale as we balance our supply chain across hemispheres, thereby diversifying our production risks. We have generated significant cost savings, margin expansion and contributions to cash flow and should continue to do so as we further optimize our size, scale and production capability.
We seek to effectively generate strong cash flow through optimizing our capital structure and managing working capital levels. Our capital allocation strategy is to effectively deploy our significant, consistent cash flow to generate the best long-term returns for our shareholders. Our goal is to use our cash flow for organic growth (via capital expenditures), debt prepayments and dividends. After funding those priorities, to the extent there is remaining cash available or borrowing capacity, we generally intend to invest in strategic acquisitions and share repurchases.
Tax Expense
As a global company, we are subject to income taxes and file income tax returns in more than 100 United States and foreign jurisdictions each year. For the year ended December 29, 2018, a substantial majority of our foreign income was earned by our manufacturing and sourcing operations in El Salvador, Hong Kong, Dominican Republic, Honduras, Vietnam and Thailand. The relatively lower effective tax rates in these jurisdictions as a result of favorable local tax regimes and various free trade zone agreements significantly reduced our consolidated effective tax rate. Our future effective tax rates could be adversely affected by earnings being lower than anticipated in countries where we have lower effective tax rates and higher than anticipated in countries where we have higher effective tax rates, or by changes in tax laws or regulations.
In addition, future acquisitions may affect the proportion of our pre-tax income from foreign jurisdictions, both due to external sales and also increased volume in our self-owned supply chain. We follow a disciplined acquisition strategy focused on acquisitions that meet strict criteria for strong likely returns with relatively low risk. It is difficult to predict whether or when such acquisitions will occur and whether the acquisition targets will be foreign or domestic. Therefore, it is also difficult to predict the effect of acquisitions on the future distribution of our pre-tax income.
We maintain intercompany transfer pricing agreements governing sales within our self-owned supply chain, which can impact the amount of pre-tax income we recognize in foreign jurisdictions. In compliance with applicable tax laws, we regularly review the terms of these agreements utilizing independent third-party transfer pricing studies to ensure that intercompany pricing is consistent with what a seller would charge an independent, arm’s length customer, or what a buyer would pay an independent, arm’s length supplier. Therefore, changes in intercompany pricing are often driven by market conditions, which are also difficult to predict.
The recently enacted Tax Act significantly revised United States corporate income tax law by, among other things, reducing the corporate income tax rate to 21%, imposing a new minimum tax on GILTI and implementing a modified territorial tax system that included a one-time transition tax on deemed repatriated earnings of foreign subsidiaries. In response to the Tax Act, the SEC issued SAB 118 which allowed issuers to recognize provisional estimates of the impact of the Tax Act in their financial statements, during a measurement period not to exceed one year from the date of enactment. We have completed our accounting for the enactment of the Tax Act in accordance with SAB 118 in the fourth quarter of 2018.
As of December 29, 2018, we have evaluated the effects of the Tax Act and its inherent interplay with our global capital allocation strategy and its impact on our historical permanent reinvestment assertion with respect to the accumulated earnings of our foreign subsidiaries. As a result of this evaluation, we have determined that a portion of our unremitted foreign earnings, totaling approximately $1.4 billion, will no longer be permanently reinvested as we intend to use these earnings to prepay debt held in the United States. The remainder of our foreign earnings will continue to be permanently reinvested to fund working capital requirements and operations abroad. During the first three quarters of 2018, we accrued and incurred income taxes of
28
$7 million related to actual repatriations of foreign earnings during the year. As of December 29, 2018, and consistent with our change in assertion with respect to certain foreign earnings, we have accrued an additional $56 million with respect to the $1.4 billion we intend to remit in the future. These income tax effects include United States federal, state, foreign and withholding tax implications in accordance with the planned remittance of such foreign earnings.
We regularly assess any significant exposure associated with increases in effective tax rates, and adjustments are made as events occur that warrant adjustment to our tax provisions. See
“Risk Factors.” - We have a complex multinational tax structure, and changes in effective tax rates or adverse outcomes resulting from examination of our income tax returns could impact our capital deployment strategy and adversely affect our results.”
2018
Highlights
|
•
|
Net sales in
2018
were
$6.8 billion
, compared with
$6.5 billion
in
2017
, representing a 5% increase.
|
|
•
|
Operating profit was
$868 million
in
2018
compared with
$744 million
in
2017
, representing a 17% increase. As a percentage of sales, operating profit was 12.8% in
2018
compared to 11.5% in
2017
. Included within operating profit were acquisition and integration related charges of $80 million and $191 million in 2018 and 2017, respectively.
|
|
•
|
Diluted earnings per share was
$1.52
in
2018
, compared with
$0.17
in
2017
, representing a 794% increase. Net income in 2017 was significantly impacted by charges related to the Tax Act.
|
|
•
|
Operating cash flows were
$643 million
in
2018
compared to
$656 million
in
2017
.
|
|
•
|
We acquired Bras N Things on February 12, 2018. Bras N Things is a leading intimate apparel retailer and e-commerce business in Australia, New Zealand and South Africa. Bras N Things sells proprietary bras, panties and lingerie sets through a retail network and an e-commerce platform.
|
|
•
|
As part of our cash deployment strategy, we paid four quarterly dividends, in March, June, September and December, of $0.15 per share.
|
Consolidated Results of Operations — Year Ended
December 29, 2018
(“
2018
”) Compared with Year Ended
December 30, 2017
(“
2017
”)
|
|
Years Ended
|
|
|
|||||||||||
|
|
December 29,
2018 |
December 30,
2017 |
Higher
(Lower)
|
Percent
Change
|
||||||||||
|
|
(dollars in thousands)
|
|||||||||||||
|
Net sales
|
$
|
6,803,955
|
|
$
|
6,471,410
|
|
$
|
332,545
|
|
5.1
|
%
|
|||
|
Cost of sales
|
4,147,436
|
|
3,980,859
|
|
166,577
|
|
4.2
|
|
||||||
|
Gross profit
|
2,656,519
|
|
2,490,551
|
|
165,968
|
|
6.7
|
|
||||||
|
Selling, general and administrative expenses
|
1,788,568
|
|
1,718,349
|
|
70,219
|
|
4.1
|
|
||||||
|
Change in fair value of contingent consideration
|
—
|
|
27,852
|
|
(27,852
|
)
|
NM
|
|
||||||
|
Operating profit
|
867,951
|
|
744,350
|
|
123,601
|
|
16.6
|
|
||||||
|
Other expenses
|
26,395
|
|
32,645
|
|
(6,250
|
)
|
(19.1
|
)
|
||||||
|
Interest expense, net
|
194,675
|
|
174,435
|
|
20,240
|
|
11.6
|
|
||||||
|
Income from continuing operations before income tax expense
|
646,881
|
|
537,270
|
|
109,611
|
|
20.4
|
|
||||||
|
Income tax expense
|
93,797
|
|
473,279
|
|
(379,482
|
)
|
(80.2
|
)
|
||||||
|
Income from continuing operations
|
553,084
|
|
63,991
|
|
489,093
|
|
764.3
|
|
||||||
|
Loss from discontinued operations, net of tax
|
—
|
|
(2,097
|
)
|
2,097
|
|
NM
|
|
||||||
|
Net income
|
$
|
553,084
|
|
$
|
61,894
|
|
$
|
491,190
|
|
793.6
|
%
|
|||
Net Sales
Higher net sales primarily due to the following:
|
•
|
Acquisitions of Bras N Things in 2018 and Alternative Apparel in 2017, which added incremental net sales of $177 million in 2018;
|
|
•
|
Organic sales on a constant currency basis, defined as sales excluding the impact of foreign currency and businesses acquired within 12 months, increased 2% in 2018, driven by strong growth in our global
Champion
sales,
our
|
29
innerwear businesses in Australia, Asia and Americas and online sales offset in part by declines in our United States innerwear business and United States
Hanes
activewear business; and
|
•
|
Favorable impact of foreign currency exchange rates of in our International businesses of approximately $13 million.
|
Operating Profit
Operating profit as a percentage of net sales was 12.8% in 2018, an increase from the prior year of approximately 130 basis points, primarily due to the following:
|
•
|
Gross margin expansion of approximately 50 basis points as the increase of International gross profit from acquisition synergies and lower acquisition, integration and other action-related charges were partially offset by higher input costs; and
|
|
•
|
Lower selling, general and administrative expenses as a percentage of net sales of approximately 30 basis points primarily due to lower acquisition, integration and other action-related costs and cost savings realized from the corporate headcount reduction efforts in 2017, partially offset by increased bad debt charges, primarily related to the Sears Holdings Corporation (“Sears”) bankruptcy filing, increased distribution expenses from investments to support future growth and higher proportion of selling, general and administrative costs at our recently acquired businesses.
|
Included within operating profit are charges of approximately $80 million and $191 million related to acquisition, integration and other action-related costs in
2018
and
2017
, respectively. Included within acquisition, integration and other action-related costs in 2017, is $28 million related to the change in fair value of contingent consideration resulting in the final settlement ruling of the contingent consideration liability in connection with the Champion Europe acquisition in 2016.
Other Highlights
Other Expenses
–
Other expenses were lower by $6 million in
2018
compared to
2017
primarily due to $4 million of lower pension expense in 2018 and higher costs in
2017
to refinance credit facilities.
Interest Expense
– Interest expense was higher by $20 million in
2018
compared to
2017
driven by higher debt balances and a higher weighted average interest rate. Our weighted average interest rate on our outstanding debt was 3.91% during
2018
, compared to 3.78% during
2017
.
Income Tax Expense
– Our effective income tax rate was 14.5% and 88% for
2018
and
2017
, respectively. The lower tax rate in 2018 compared to 2017 is primarily due to the provisional charge recorded in
2017
related to the Tax Act of $435 million, primarily related to a transition tax charge on deemed repatriated earnings of foreign subsidiaries and a charge for the revaluation of our deferred tax assets and liabilities to the lower corporate income tax rate of 21%.
Discontinued Operations
– The results of our discontinued operations in 2017 included the operations of two businesses, Dunlop Flooring and Tontine Pillow, purchased in the Hanes Australasia acquisition and sold in 2017.
Operating Results by Business Segment — Year Ended
December 29, 2018
(“
2018
”) Compared with Year Ended
December 30, 2017
(“
2017
”)
|
Net Sales
|
||||||||||||||
|
|
Years Ended
|
|
||||||||||||
|
|
December 29,
2018 |
December 30,
2017 |
Higher
(Lower)
|
Percent
Change
|
||||||||||
|
|
(dollars in thousands)
|
|||||||||||||
|
Innerwear
|
$
|
2,379,675
|
|
$
|
2,462,876
|
|
$
|
(83,201
|
)
|
(3.4
|
)%
|
|||
|
Activewear
|
1,792,280
|
|
1,654,278
|
|
138,002
|
|
8.3
|
|
||||||
|
International
|
2,344,115
|
|
2,054,664
|
|
289,451
|
|
14.1
|
|
||||||
|
Other
|
287,885
|
|
299,592
|
|
(11,707
|
)
|
(3.9
|
)
|
||||||
|
Total
|
$
|
6,803,955
|
|
$
|
6,471,410
|
|
$
|
332,545
|
|
5.1
|
%
|
|||
30
|
|
Operating Profit and Margin
|
|||||||||||||||||||
|
|
Years Ended
|
|||||||||||||||||||
|
|
December 29,
2018 |
December 30,
2017 |
Higher
(Lower)
|
Percent
Change
|
||||||||||||||||
|
|
(dollars in thousands)
|
|||||||||||||||||||
|
Innerwear
|
$
|
526,831
|
|
22.1
|
%
|
$
|
580,879
|
|
23.6
|
%
|
$
|
(54,048
|
)
|
(9.3
|
)%
|
|||||
|
Activewear
|
267,428
|
|
14.9
|
|
264,975
|
|
16.0
|
|
2,453
|
|
0.9
|
|
||||||||
|
International
|
351,769
|
|
15.0
|
|
268,367
|
|
13.1
|
|
83,402
|
|
31.1
|
|
||||||||
|
Other
|
25,348
|
|
8.8
|
|
31,540
|
|
10.5
|
|
(6,192
|
)
|
(19.6
|
)
|
||||||||
|
Corporate
|
(303,425
|
)
|
NM
|
|
(401,411
|
)
|
NM
|
|
97,986
|
|
24.4
|
|
||||||||
|
Total
|
$
|
867,951
|
|
12.8
|
%
|
$
|
744,350
|
|
11.5
|
%
|
$
|
123,601
|
|
16.6
|
%
|
|||||
Innerwear
Innerwear net sales decreased 3% compared to
2017
driven by a 1% decline in our basics business and a 10% decline in our intimate apparel business. Within our basics business, strength in our men’s underwear business was more than offset by declines in our women’s panties, children’s underwear and sock businesses. Net sales in our intimate apparel business decreased primarily driven by declines in our bras product category, which continues to be impacted by door closings and the challenging retail landscape within the mid-tier and department store channel.
Innerwear operating margin was
22.1%
, representing a reduction from 2017 of approximately 150 basis points due to the impact from lower sales volume, higher raw material costs and product mix, which was partially offset by lower selling, general and administrative expenses as a result of the prior year’s corporate headcount reduction efforts.
Activewear
Activewear net sales increased as a result of our acquisition of Alternative Apparel in October 2017, which contributed incremental net sales in 2018 of $54 million, as well as approximately 5% increase in net sales among our other activewear businesses. Core
Champion
sales within our Activewear segment, which we define as
Champion
sales outside of the mass retail channel, were up 48% in 2018, driven by strong consumer demand, space gains in the sports specialty channels and growth in the online channel. Growth in core
Champion
sales more than offset declines in our
Champion
and
Hanes
activewear businesses within the mass retail channel due to space reductions.
Activewear operating margin was
14.9%
, representing a decline from
2017
of approximately 110 basis points as favorable product mix and cost savings associated with prior year’s corporate headcount reduction efforts were more than offset by higher raw material costs, higher distribution costs driven primarily by investments to support future growth and a higher proportion of selling, general and administrative expenses from our recently acquired businesses.
International
Net sales in the International segment were higher as a result of the following:
|
•
|
Our acquisition of Bras N Things in the first quarter of 2018, which contributed incremental net sales of nearly $123 million;
|
|
•
|
Organic sales on a constant currency basis increased driven by our global
Champion
sales growth, primarily in the Europe and Asia markets, and growth in our
innerwear businesses in Australia, Asia and Americas; and
|
|
•
|
Favorable impact of foreign currency exchange rates of approximately $13 million.
|
International operating margin was
15.0%
, an increase from
2017
of approximately 190 basis points primarily due to scale efficiencies, favorable mix and the continued realization of acquisition synergies coupled with high margin contributions from the recently acquired Bras N Things business.
Other
Other net sales were lower as a result of continued declines in hosiery sales in the United States and slower traffic at our outlet stores. Operating margin decreased slightly as the impact from lower sales volume was only partially offset by continued cost control.
31
Corporate
Corporate expenses decreased in
2018
primarily related to lower acquisition, integration and other action-related charges of $111 million, partially offset by increased bad debt charges, primarily related to the Sears bankruptcy filing. Acquisition and integration costs are expenses related directly to an acquisition and its integration into the organization. Smaller acquisitions, business disruption and other action-related costs include acquisition and integration charges for our smaller acquisitions such as Alternative Apparel, expenses associated with natural disasters that impact our business and other action-related costs related to a supply chain network realignment. Contingent consideration related to Champion Europe represents the charge recognized in relation to the final contingent consideration settlement in excess of amounts previously accrued, as further described in Note, “Acquisitions” to our consolidated financial statements.
|
|
Years Ended
|
||||||
|
|
December 29,
2018 |
December 30,
2017 |
|||||
|
|
(dollars in thousands)
|
||||||
|
Acquisition, integration and other action-related costs included in operating profit:
|
|||||||
|
Hanes Europe Innerwear
|
$
|
26,403
|
|
$
|
65,995
|
|
|
|
Hanes Australasia
|
14,266
|
|
40,681
|
|
|||
|
Bras N Things
|
6,948
|
|
—
|
|
|||
|
Champion Europe
|
4,899
|
|
10,645
|
|
|||
|
Smaller acquisitions, business disruption and other action-related costs
|
27,682
|
|
45,731
|
|
|||
|
Contingent consideration related to Champion Europe
|
—
|
|
27,852
|
|
|||
|
Total acquisition, integration and other action-related costs included in operating profit
|
$
|
80,198
|
|
$
|
190,904
|
|
|
Consolidated Results of Operations — Year Ended
December 30, 2017
(“
2017
”) Compared with Year Ended
December 31, 2016
(“
2016
”)
|
|
Years Ended
|
|
|
|||||||||||
|
|
December 30,
2017 |
December 31,
2016 |
Higher
(Lower)
|
Percent
Change
|
||||||||||
|
|
(dollars in thousands)
|
|||||||||||||
|
Net sales
|
$
|
6,471,410
|
|
$
|
6,028,199
|
|
$
|
443,211
|
|
7.4
|
%
|
|||
|
Cost of sales
|
3,980,859
|
|
3,752,151
|
|
228,708
|
|
6.1
|
|
||||||
|
Gross profit
|
2,490,551
|
|
2,276,048
|
|
214,503
|
|
9.4
|
|
||||||
|
Selling, general and administrative expenses
|
1,718,349
|
|
1,485,997
|
|
232,352
|
|
15.6
|
|
||||||
|
Change in fair value of contingent consideration
|
27,852
|
|
—
|
|
27,852
|
|
NM
|
|
||||||
|
Operating profit
|
744,350
|
|
790,051
|
|
(45,701
|
)
|
(5.8
|
)
|
||||||
|
Other expenses
|
32,645
|
|
66,160
|
|
(33,515
|
)
|
(50.7
|
)
|
||||||
|
Interest expense, net
|
174,435
|
|
152,692
|
|
21,743
|
|
14.2
|
|
||||||
|
Income from continuing operations before income tax expense
|
537,270
|
|
571,199
|
|
(33,929
|
)
|
(5.9
|
)
|
||||||
|
Income tax expense
|
473,279
|
|
34,272
|
|
439,007
|
|
1,280.9
|
|
||||||
|
Income from continuing operations
|
63,991
|
|
536,927
|
|
(472,936
|
)
|
(88.1
|
)
|
||||||
|
Income (loss) from discontinued operations, net of tax
|
(2,097
|
)
|
2,455
|
|
(4,552
|
)
|
NM
|
|
||||||
|
Net income
|
$
|
61,894
|
|
$
|
539,382
|
|
$
|
(477,488
|
)
|
(88.5
|
)%
|
|||
Net Sales
Higher net sales primarily due to the following:
|
•
|
Acquisitions of Hanes Australasia, Champion Europe and It’s Greek to Me, Inc. and GTM Retail, Inc. (“GTM”) in 2016 and Alternative Apparel in 2017, which added incremental net sales of approximately $470 million in 2017;
|
|
•
|
Increased nets sales driven by our global
Champion
and global online growth initiatives;
|
|
•
|
Increased net sales in our licensed intimate apparel business, along with our sock and men’s underwear product categories;
|
|
•
|
Sales growth in licensed sports apparel in the college bookstore business; and
|
|
•
|
Favorable impact of foreign currency exchange rates of approximately $25 million.
|
32
Partially offset by:
|
•
|
Lower net sales in our remaining Innerwear product categories as a result of challenging consumer traffic at retail, cautious inventory management by retailers and store closures within the mid-tier and department store channel;
|
|
•
|
Lower net sales in our licensed sports apparel business and
Hanes
activewear apparel within the mass merchant channel; and
|
|
•
|
Lower net sales in Other driven by continued declines in hosiery, slower traffic at our outlet stores and the planned exit of our legacy catalog business in the third quarter of 2016.
|
Operating Profit
Operating profit as a percentage of net sales was 11.5% in 2017, a decrease from prior year of approximately 160 basis points, primarily due to the following:
|
•
|
Increase in gross profit as a percentage of net sales of approximately 70 basis points as supply chain efficiencies and synergies recognized from the integration of our acquisitions was partially offset by higher acquisition, integration and other action-related costs; and
|
|
•
|
Higher selling, general and administrative expenses as a percentage of net sales of approximately 190 basis points primarily due to higher distribution expenses as a result of increased volume, increased labor expenses to handle late-quarter customer orders, increased marketing investment, mix of product sold, as well as higher acquisition, integration and other action-related charges and expenses related to our U.S. corporate office headcount reduction efforts. The aforementioned expenses were partially offset by synergy benefits from the integration of prior acquisitions, cost savings from the planned reduction of our legacy catalog distribution and continued cost control.
|
Included within operating profit are charges of approximately $191 million and $139 million related to acquisition, integration and other action-related costs in
2017
and
2016
, respectively. Included within acquisition, integration and other action-related costs in
2017
, is $28 million related to the change in fair value of contingent consideration resulting in the final settlement ruling of the contingent consideration liability in connection with the Champion Europe acquisition in 2016.
Other Highlights
Other Expenses
–
Other expenses were lower by $34 million in
2017
compared to
2016
primarily due to costs of approximately $47 million associated with the redemption of our 6.375% Senior Notes in 2016, which included a call premium and write-off of unamortized debt issuance costs. In 2017, we refinanced our Senior Secured Credit Facility and incurred costs associated with the refinancing of approximately $5 million, which included a write-off of unamortized debt issuance costs and fees paid to third parties.
Interest Expense –
Interest expense was
higher by $22 million in
2017
compared to
2016
primarily due to higher debt balances to help fund acquisitions and share repurchases coupled with a higher weighted average interest rate. Our weighted average interest rate on our outstanding debt was 3.78% during
2017
, compared to 3.64% during
2016
.
Income Tax Expense
–
Income tax expense for
2017
included a provisional charge related to the Tax Act of $435 million, which included a $360 million transition tax charge on deemed repatriated earnings of foreign subsidiaries, a charge of $72 million for the revaluation of our deferred tax assets and liabilities to the lower corporate income tax rate of 21% and a $3 million charge related to the deductibility of employee compensation. In addition, we incurred incremental tax costs of approximately $22 million for other impacts of tax reform and other actions taken in
2017
.
Discontinued Operations
– The results of our discontinued operations included the operations of two businesses, Dunlop Flooring and Tontine Pillow, purchased in the Hanes Australasia acquisition.
33
Operating Results by Business Segment — Year Ended
December 30, 2017
(“
2017
”) Compared with Year Ended
December 31, 2016
(“
2016
”)
|
Net Sales
|
||||||||||||||
|
|
Years Ended
|
|
||||||||||||
|
|
December 30, 2017
|
December 31,
2016 |
Higher
(Lower)
|
Percent
Change
|
||||||||||
|
|
(dollars in thousands)
|
|||||||||||||
|
Innerwear
|
$
|
2,462,876
|
|
$
|
2,543,717
|
|
$
|
(80,841
|
)
|
(3.2
|
)%
|
|||
|
Activewear
|
1,654,278
|
|
1,601,108
|
|
53,170
|
|
3.3
|
|
||||||
|
International
|
2,054,664
|
|
1,531,913
|
|
522,751
|
|
34.1
|
|
||||||
|
Other
|
299,592
|
|
351,461
|
|
(51,869
|
)
|
(14.8
|
)
|
||||||
|
Total
|
$
|
6,471,410
|
|
$
|
6,028,199
|
|
$
|
443,211
|
|
7.4
|
%
|
|||
|
|
Operating Profit and Margin
|
|||||||||||||||||||
|
|
Years Ended
|
|||||||||||||||||||
|
|
December 30, 2017
|
December 31,
2016 |
Higher
(Lower)
|
Percent
Change
|
||||||||||||||||
|
|
(dollars in thousands)
|
|||||||||||||||||||
|
Innerwear
|
$
|
580,879
|
|
23.6
|
%
|
$
|
615,202
|
|
24.2
|
%
|
$
|
(34,323
|
)
|
(5.6
|
)%
|
|||||
|
Activewear
|
264,975
|
|
16.0
|
|
264,955
|
|
16.5
|
|
20
|
|
—
|
|
||||||||
|
International
|
268,367
|
|
13.1
|
|
188,966
|
|
12.3
|
|
79,401
|
|
42.0
|
|
||||||||
|
Other
|
31,540
|
|
10.5
|
|
41,293
|
|
11.7
|
|
(9,753
|
)
|
(23.6
|
)
|
||||||||
|
Corporate
|
(401,411
|
)
|
NM
|
|
(320,365
|
)
|
NM
|
|
(81,046
|
)
|
(25.3
|
)
|
||||||||
|
Total
|
$
|
744,350
|
|
11.5
|
%
|
$
|
790,051
|
|
13.1
|
%
|
$
|
(45,701
|
)
|
(5.8
|
)%
|
|||||
Innerwear
Innerwear net sales decreased in both our basics and intimates apparel businesses. Strength in our licensed intimate apparel, socks and men’s underwear businesses, as well as growth in the online channel was more than offset by declines in other product categories due to challenging consumer traffic at retail and cautious inventory management by retailers. Our intimate apparel business also experienced sales declines driven by the continued impact from retail store closures in the mid-tier and department store channel, partially offset by strong performance from our new
Maidenform
sport and millennial product offerings.
Decreased operating profit was driven largely by lower sales volume coupled with lower margins from unfavorable product mix, as well as expenses related to Project Booster, our multi-year program to drive investment for sales growth, cost reduction and cash flow, offset partially by continued cost control.
Activewear
Activewear net sales increased as a result of our acquisition of Alternative Apparel in October 2017 and expansion into the teamwear and fanware space with the acquisition of GTM in 2016, growth in our core
Champion
brand in the sports specialty, mid-tier and department store channels, increased licensed sports apparel sales in the college bookstore business, and growth across Activewear product categories online, partially offset by sales declines in
Hanes
activewear apparel and licensed sports apparel within the mass merchant channel.
Operating profit increased primarily as a result of increased sales volume and continued cost control offset, in part, by the impact of retailer bankruptcies and higher proportion of selling, general and administrative expenses at our recently acquired Alternative Apparel and GTM businesses.
International
Net sales in the International segment were higher as a result of the following:
|
•
|
Incremental net sales from the acquisitions of Hanes Australasia in July of 2016 and Champion Europe in June of 2016;
|
|
•
|
Continued growth in Asia within our Activewear product category, primarily driven by
Champion
and
Hanes
sales growth; and
|
|
•
|
Favorable impact of foreign currency exchange rates of approximately $25 million.
|
34
Partially offset by:
|
•
|
Declining hosiery sales and slower traffic at retail in certain European markets.
|
Operating profit increased primarily due to higher sales volume, coupled with cost synergies realized in our Hanes Europe Innerwear and Hanes Australasia businesses.
Other
Other net sales were lower as a result of continued declines in hosiery sales in the United States, slower traffic at our outlet stores and the planned exit from our legacy catalog business in 2016. Operating profit decreased as a result of lower sales volume, offset, in part, by continued cost control.
Corporate
Corporate expenses increased in
2017
primarily from higher acquisition, integration and other action-related charges in
2017
compared to
2016
of $52 million and increased amortization expense related to acquired intangible assets in our recent acquisitions. Acquisition and integration costs are expenses related directly to an acquisition and its integration into the organization. Business disruption and other actions are mainly expenses associated with natural disasters that impact our business and other action-related costs. Contingent consideration related to Champion Europe represents the charge recognized in relation to the final contingent consideration settlement in excess of amounts previously accrued, as further described in Note, “Acquisitions” to our consolidated financial statements. Acquisition-related currency transactions represent the foreign exchange gain from financing activities related to the Champion Europe and Hanes Australasia acquisitions.
|
|
Years Ended
|
||||||
|
|
December 30,
2017 |
December 31,
2016 |
|||||
|
|
(dollars in thousands)
|
||||||
|
Acquisition, integration and other action-related costs included in operating profit:
|
|||||||
|
Hanes Europe Innerwear
|
$
|
65,995
|
|
$
|
79,003
|
|
|
|
Hanes Australasia
|
40,681
|
|
30,783
|
|
|||
|
Champion Europe
|
10,645
|
|
10,972
|
|
|||
|
Knights Apparel
|
11,994
|
|
29,056
|
|
|||
|
Other acquisitions
|
1,995
|
|
4,344
|
|
|||
|
Business disruption and other actions
|
31,742
|
|
—
|
|
|||
|
Contingent consideration related to Champion Europe
|
27,852
|
|
—
|
|
|||
|
Acquisition related currency transactions
|
—
|
|
(15,639
|
)
|
|||
|
Total acquisition and integration costs
|
$
|
190,904
|
|
$
|
138,519
|
|
|
Liquidity and Capital Resources
Cash Requirements and Trends Affecting Liquidity
We rely on our cash flows generated from operations and the borrowing capacity under our credit facilities to meet the cash requirements of our business. The primary cash requirements of our business are payments to vendors in the normal course of business, capital expenditures, maturities of debt and related interest payments, business acquisitions, contributions to our pension plans, repurchases of our stock, regular quarterly dividend payments and income tax payments. We believe we have sufficient cash and available borrowings for our foreseeable liquidity needs.
We typically use cash during the first half of the year and generate most of our cash flow in the second half of the year. We expect our top priorities of our cash deployment strategy in the future will include organic growth (via capital expenditures), debt prepayments and dividends. After funding those priorities, to the extent there is remaining cash or borrowing capacity available, we generally intend to invest in strategic acquisitions and share repurchases.
Our primary sources of liquidity are cash generated from global operations and cash available under our Revolving Loan Facility, our Accounts Receivable Securitization Facility and our international loan facilities.
35
We had the following borrowing capacity and availability under our credit facilities as of
December 29, 2018
:
|
|
As of December 29, 2018
|
||||||
|
Borrowing
Capacity
|
Borrowing
Availability
|
||||||
|
(dollars in thousands)
|
|||||||
|
Senior Secured Credit Facility:
|
|||||||
|
Revolving Loan Facility
|
$
|
1,000,000
|
|
$
|
995,665
|
|
|
|
Australian Revolving Loan Facility
|
42,236
|
|
21,118
|
|
|||
|
European Revolving Loan Facility
|
113,520
|
|
—
|
|
|||
|
Accounts Receivable Securitization Facility
(1)
|
161,608
|
|
—
|
|
|||
|
Other international credit facilities
|
163,959
|
|
112,796
|
|
|||
|
Total liquidity from credit facilities
|
$
|
1,481,323
|
|
$
|
1,129,579
|
|
|
|
(1)
|
Borrowing availability under the Accounts Receivable Securitization Facility is subject to a quarterly fluctuating facility limit, not to exceed
$225 million
and permitted only to the extent that the face of the receivables in the collateral pool, net of applicable reserves and other deductions, exceeds the outstanding loans.
|
As of
December 29, 2018
, we had
$433 million
in cash and cash equivalents. We currently believe that our existing cash balances and cash generated by operations, together with our borrowing availability, will enable us to comply with the terms of our indebtedness and meet foreseeable liquidity requirements.
The following have impacted or are expected to impact liquidity:
|
•
|
We have principal and interest obligations under our outstanding debt.
|
|
•
|
We acquired Bras N Things in February 2018 and Alternative Apparel in October 2017 and we may pursue strategic acquisitions in the future.
|
|
•
|
We expect to continue to invest in efforts to accelerate worldwide omnichannel and global growth initiatives, as well as marketing and brand building.
|
|
•
|
We expect to continue to invest in efforts to improve operating efficiencies and lower costs.
|
|
•
|
We made contributions of $17 million to our U.S. pension plan in 2018 and expect to make required cash contributions of $26 million to our U.S. pension plan in 2019 based on a preliminary calculation by our actuary. We may also elect to make additional voluntary contributions. Our U.S. qualified pension plan was approximately 93% and 94% funded as of
December 29, 2018
and
December 30, 2017
, respectively, under the Pension Protection Act funding rules.
|
|
•
|
We may increase or decrease the portion of the current-year income of our foreign subsidiaries that we remit to the United States, which could impact our effective income tax rate. We have also reevaluated our reinvestment strategy with regards to our historic earnings which were taxed as part of the Tax Act and intend to remit foreign earnings totaling $1.4 billion.
|
|
•
|
We are obligated to make installment payments over an eight-year period related to our transition tax liability resulting from the implementation of the Tax Act, which began in 2018, in addition to any estimated income taxes due based on current year taxable income. In 2018, we made an installment payment on our transition tax liability in the amount of $13 million and have a remaining balance due of $107 million to be paid in installment payments through 2025.
|
|
•
|
Our Board of Directors has authorized a regular quarterly dividend.
|
|
•
|
We may repurchase shares of the Company’s common stock under current share repurchase program, which has been approved by our Board of Directors. We did not repurchase any shares of common stock during 2018. During 2017 and 2016, respectively, we repurchased 19.6 million and 14.2 million shares of our common stock (at a cost of $400 million and $380 million). At
December 29, 2018
, the remaining repurchase authorization totaled approximately
20 million
shares.
|
36
Dividends
The following chart summarizes historical dividend activity and the impact on liquidity.

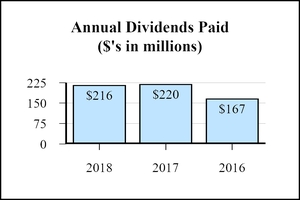
In February 2019, our Board of Directors declared a regular quarterly cash dividend of
$0.15
per share on outstanding common stock to be paid on March 12, 2019 to stockholders of record at the close of business on February 19, 2019.
Off-Balance Sheet Arrangements
We do not have any off-balance sheet arrangements within the meaning of Item 303(a)(4) of SEC Regulation S-K.
Future Contractual Obligations and Commitments
The following table contains information on our contractual obligations and commitments as of
December 29, 2018
, and their expected timing on future cash flows and liquidity.
|
|
|
Payments Due by Period
|
|||||||||||||||||
|
At December 29, 2018
|
Fiscal
2019 |
Fiscal
2020-2021
|
Fiscal
2022-2023
|
Fiscal
2024 and
Thereafter
|
|||||||||||||||
|
(dollars in thousands)
|
|||||||||||||||||||
|
Operating activities:
|
|||||||||||||||||||
|
Interest on debt obligations
(1)
|
811,005
|
|
$
|
157,985
|
|
$
|
303,327
|
|
$
|
261,558
|
|
$
|
88,135
|
|
|||||
|
Inventory purchase obligations
|
499,348
|
|
491,152
|
|
8,196
|
|
—
|
|
—
|
|
|||||||||
|
Operating lease obligations
|
662,168
|
|
148,218
|
|
239,845
|
|
158,164
|
|
115,941
|
|
|||||||||
|
Marketing and advertising obligations
|
14,780
|
|
10,060
|
|
4,720
|
|
—
|
|
—
|
|
|||||||||
|
Defined benefit plan minimum contributions
(2)
|
26,000
|
|
26,000
|
|
—
|
|
—
|
|
—
|
|
|||||||||
|
Tax obligations
(3)
|
133,937
|
|
13,823
|
|
34,343
|
|
30,568
|
|
55,203
|
|
|||||||||
|
Other long-term obligations
(4)
|
349,201
|
|
148,731
|
|
92,683
|
|
34,984
|
|
72,803
|
|
|||||||||
|
Investing activities:
|
|||||||||||||||||||
|
Capital expenditures
|
25,814
|
|
25,814
|
|
—
|
|
—
|
|
—
|
|
|||||||||
|
Financing activities:
|
|||||||||||||||||||
|
Debt
|
4,009,553
|
|
440,596
|
|
116,744
|
|
610,000
|
|
2,842,213
|
|
|||||||||
|
Notes payable
|
5,824
|
|
5,824
|
|
—
|
|
—
|
|
—
|
|
|||||||||
|
Total
|
$
|
6,537,630
|
|
$
|
1,468,203
|
|
$
|
799,858
|
|
$
|
1,095,274
|
|
$
|
3,174,295
|
|
||||
|
(1)
|
Interest obligations on floating rate debt instruments are calculated for future periods using interest rates in effect at
December 29, 2018
.
|
|
(2)
|
Represents only the required minimum pension contributions to our U.S. qualified pension plan in 2019. In addition to the required cash contributions, we may elect to make voluntary contributions to maintain certain funded levels. For a discussion of our pension plan obligations, see Note, “Defined Benefit Pension Plans,” to our consolidated financial statements.
|
|
(3)
|
Represents uncertain tax positions and the transition tax liability resulting from the Tax Act.
|
|
(4)
|
Represents the projected payment for long-term liabilities recorded on the Consolidated Balance Sheet for certain employee benefit claims, royalty-bearing license agreement payments, post retirement obligations and deferred compensation.
|
37
Sources and Uses of Our Cash
The information presented below regarding the sources and uses of our cash flows for the years ended
December 29, 2018
and
December 30, 2017
was derived from our consolidated financial statements.
|
|
Years Ended
|
||||||
|
|
December 29,
2018 |
December 30,
2017 |
|||||
|
|
(dollars in thousands)
|
||||||
|
Operating activities
|
$
|
643,402
|
|
$
|
655,718
|
|
|
|
Investing activities
|
(418,651
|
)
|
(104,513
|
)
|
|||
|
Financing activities
|
(200,497
|
)
|
(585,768
|
)
|
|||
|
Effect of changes in foreign currency exchange rates on cash
|
9,912
|
|
(4,116
|
)
|
|||
|
Change in cash, cash equivalents and restricted cash
|
34,166
|
|
(38,679
|
)
|
|||
|
Cash and cash equivalents at beginning of year
|
421,566
|
|
460,245
|
|
|||
|
Cash, cash equivalents and restricted cash at end of year
|
455,732
|
|
421,566
|
|
|||
|
Less restricted cash at end of year
|
22,710
|
|
$
|
—
|
|
||
|
Cash and cash equivalents at end of year
|
$
|
433,022
|
|
$
|
421,566
|
|
|
Operating Activities
Our overall liquidity is primarily driven by our strong cash flow provided by operating activities, which is dependent on net income and changes in working capital. As compared to prior year, our operating cash decreased slightly due to the final Champion Europe contingent consideration payment in the first quarter of 2018, $17 million of U.S. pension contributions in 2018 and higher cash payments for inventory as we increased our investments to support the global demand of our
Champion
products. Higher cash payments mentioned above were partially offset by increased accounts receivable collections and improved payment terms with our trade payable vendors.
Investing Activities
The increased cash used by investing activities is primarily the result of the acquisition of Bras N Things in 2018. In 2017, we received cash as a result of the dispositions of the Dunlop Flooring and Tontine Pillow businesses which were acquired in conjunction with the Hanes Australasia acquisition.
Financing Activities
The lower cash used for financing activities in 2018 was primarily driven by our share repurchase activity. We did not repurchase any shares in 2018, however we repurchased shares for a total cost of $400 million in 2017.
Financing Arrangements
We believe our financing structure provides a secure base to support our operations and key business strategies. As of
December 29, 2018
, we were in compliance with all financial covenants under our credit facilities and other outstanding indebtedness discussed below. We continue to monitor our covenant compliance carefully. We expect to maintain compliance with our covenants during
2019
, however economic conditions or the occurrence of events discussed above under “Risk Factors” could cause noncompliance.
For further details regarding our liquidity from our available cash balances and credit facilities see, “Trends and Uncertainties Affecting Liquidity”, above.
Critical Accounting Policies and Estimates
We have chosen accounting policies that we believe are appropriate to accurately and fairly report our operating results and financial condition in conformity with accounting principles generally accepted in the United States. We apply these accounting policies in a consistent manner. Our significant accounting policies are discussed in Note, “Summary of Significant Accounting Policies,” to our consolidated financial statements.
The application of critical accounting policies requires that we make estimates and assumptions that affect the reported amounts of assets, liabilities, revenues and expenses and related disclosures. These estimates and assumptions are based on historical and other factors believed to be reasonable under the circumstances. We evaluate these estimates and assumptions on an ongoing basis and may retain outside consultants to assist in our evaluation. If actual results ultimately differ from previous estimates, the revisions are included in results of operations in the period in which the actual amounts become known. The
38
critical accounting policies that involve the most significant management judgments and estimates used in preparation of our consolidated financial statements, or are the most sensitive to change from outside factors, are described below:
Sales Recognition and Incentives
We recognize revenue when obligations under the terms of a contract with a customer are satisfied, which occurs at a point in time, upon either shipment or delivery to the customer. Revenue is measured as the amount of consideration we expect to receive in exchange for transferring goods, which includes estimate for variable consideration. We record provisions for any uncollectible amounts based upon our historical collection statistics and current customer information. Our management reviews these estimates each quarter and makes adjustments based upon actual experience.
Note, “Summary of Significant Accounting Policies” — (d) Sales Recognition and Incentives,” to our consolidated financial statements describes a variety of sales incentives that we offer to resellers and consumers of our products. Measuring the cost of these incentives requires, in many cases, estimating future customer utilization and redemption rates. We use historical data for similar transactions to estimate the cost of current incentive programs. Our management reviews these estimates each quarter and makes adjustments based upon actual experience and other available information. We classify the costs associated with cooperative advertising as a reduction of “Net sales” in our Consolidated Statements of Income.
Accounts Receivable Valuation
Accounts receivable consist primarily of amounts due from customers. We carry our accounts receivable at their net realizable value. In determining the appropriate allowance for doubtful accounts, we consider a combination of factors, such as the aging of trade receivables, industry trends, and our customers’ financial strength, credit standing and payment and default history. Changes in the aforementioned factors, among others, may lead to adjustments in our allowance for doubtful accounts. The calculation of the required allowance requires judgment by our management as to the impact of these and other factors on the ultimate realization of our trade receivables. Charges to the allowance for doubtful accounts are reflected in the “Selling, general and administrative expenses” line and charges to the allowance for customer chargebacks and other customer deductions are primarily reflected as a reduction in the “Net sales” line of our Consolidated Statements of Income. Our management reviews these estimates each quarter and makes adjustments based upon actual experience. Because we cannot predict future changes in the financial stability of our customers, actual future losses from uncollectible accounts may differ from our estimates. If the financial condition of our customers were to deteriorate, resulting in their inability to make payments, a large reserve might be required. The amount of actual historical losses has not varied materially from our estimates for bad debts.
Inventory Valuation
We carry inventory on our balance sheet at the estimated lower of cost or market. Cost is determined by the first-in, first-out, or “FIFO,” method for our inventories. We carry obsolete, damaged and excess inventory at the net realizable value, which we determine by assessing historical recovery rates, current market conditions and our future marketing and sales plans. Because our assessment of net realizable value is made at a point in time, there are inherent uncertainties related to our value determination. Market factors and other conditions underlying the net realizable value may change, resulting in further reserve requirements. A reduction in the carrying amount of an inventory item from cost to market value creates a new cost basis for the item that cannot be reversed at a later period. While we believe that adequate write-downs for inventory obsolescence have been provided in the consolidated financial statements, consumer tastes and preferences will continue to change and we could experience additional inventory write-downs in the future.
Rebates, discounts and other cash consideration received from a vendor related to inventory purchases are reflected as reductions in the cost of the related inventory item, and are therefore reflected in cost of sales when the related inventory item is sold.
Income Taxes
Deferred tax assets and liabilities are established for temporary differences between the financial reporting basis and the income tax basis of our assets and liabilities, as well as for realizable operating loss and tax credit carryforwards, at tax rates in effect for the years in which the differences are expected to reverse. Realization of deferred tax assets is dependent on future taxable income in specific jurisdictions, the amount and timing of which are uncertain, and on possible changes in tax laws and tax planning strategies. If in our judgment it appears that it is more likely than not that all or some portion of the asset will not be realized, valuation allowances are established against our deferred tax assets, which increase income tax expense in the period when such determination is made.
39
We recognize the tax benefit from an uncertain tax position only if it is more likely than not that the tax position will be sustained on examination by the taxing authorities, based on the technical merits of the position. The tax benefits recognized in the consolidated financial statements from such a position are measured based on the largest benefit that has a greater than 50% likelihood of being realized upon ultimate resolution. These assessments of uncertain tax positions contain judgments related to the interpretation of tax regulations in the jurisdictions in which we transact business. The judgments and estimates made at a point in time may change based on the outcome of tax audits, expiration of statutes of limitations, as well as changes to, or further interpretations of, tax laws and regulations. Income tax expense is adjusted in our Consolidated Statements of Income in the period in which these events occur.
We have completed our accounting for the enactment of the Tax Act incorporating assumptions made based upon our current interpretation of the Tax Act and relevant proposed regulations in accordance with SAB 118. We have also accounted for impacts of the Tax Act which became effective in 2018. The amounts recorded as it relates to the Tax Act could change in the future as a result of further guidance and regulations being issued and evaluated.
Assets and Liabilities Acquired in Business Combinations
We account for business combinations using the purchase method, which requires us to allocate the cost of an acquired business to the acquired assets and liabilities based on their estimated fair values at the acquisition date. We recognize the excess of an acquired business’ cost over the fair value of acquired assets and liabilities as goodwill. We use a variety of information sources to determine the fair value of acquired assets and liabilities. We generally use third party appraisers to assist management in determination of the fair value and lives of property and identifiable intangibles, consulting actuaries to assist management in determining the fair value of obligations associated with defined benefit pension plans and legal counsel to assist management in assessing obligations associated with legal and environmental claims.
Trademarks and Other Identifiable Intangibles
Trademarks, license agreements, customer and distributor relationships and computer software are our primary identifiable intangible assets. We amortize identifiable intangibles with finite lives over their estimated useful lives, and we do not amortize identifiable intangibles with indefinite lives. We base the estimated useful life of an identifiable intangible asset upon a number of factors, including the effects of demand, competition, expected changes in distribution channels and the level of maintenance expenditures required to obtain future cash flows. As of
December 29, 2018
, the net book value of trademarks and other identifiable intangible assets was
$1.6
billion, of which we are amortizing a balance of
$208
million. We anticipate that our amortization expense for
2019
will be
$33
million.
We evaluate identifiable intangible assets subject to amortization for impairment at least annually and as triggering events occur, such as significant adverse changes in business climate, several periods of operating or cash flow losses, forecasted continued losses or a current expectation that an intangible asset’s value will be eliminated prior to the end of its useful life. We estimate an intangible asset’s useful life based on historical experience, future business plans and the period over which the asset will be economically useful to us. Our policies require that we periodically review our assets’ remaining depreciable lives based upon actual experience and expected future utilization. A change in the depreciable life is treated as a change in accounting estimate and the accelerated amortization is accounted for in the period of change and future periods.
We assess identifiable intangible assets not subject to amortization for impairment at least annually, as of the first day of the third fiscal quarter, and more often as triggering events occur. In order to determine the impairment of identifiable intangible assets, we compare the fair value of the intangible asset to its carrying amount. Fair values of intangible assets are primarily based on future cash flows projected to be generated from that asset. We recognize an impairment loss for the amount by which an identifiable intangible asset’s carrying value exceeds its fair value.
In connection with our annual impairment testing performed in 2018, we performed a quantitative assessment for each indefinite-lived asset. The tests indicate that the indefinite-lived intangible assets have fair values that exceeded their carrying amounts and no impairment of trademarks or other identifiable intangible assets was identified as a result of our testing conducted in 2018.
Goodwill
As of
December 29, 2018
, we had
$1.2 billion
of goodwill. We do not amortize goodwill, but we assess for impairment at least annually and more often as triggering events occur. The timing of our annual goodwill impairment testing is the first day of the third fiscal quarter. The estimated fair values significantly exceeded the carrying values of each of our reporting units as of the first day of the third fiscal quarter, and no impairment of goodwill was identified as a result of the testing conducted in
2018
.
40
In evaluating the recoverability of goodwill in
2018
, we estimated the fair value of our reporting units. We relied on a number of factors to determine the fair value of our reporting units and evaluate various factors to discount anticipated future cash flows, including operating results, business plans and present value techniques. As discussed above under “Trademarks and Other Identifiable Intangibles,” there are inherent uncertainties related to these factors, and our judgment in applying them and the assumptions underlying the impairment analysis may change in such a manner that impairment in value may occur in the future. Such impairment will be recognized in the period in which it becomes known.
Defined Benefit Pension Plans
For a discussion of our net periodic benefit cost, plan obligations, plan assets and how we measure the amount of these costs, see Note, “Defined Benefit Pension Plans,” to our consolidated financial statements. The funded status of our defined benefit pension plans are recognized on our balance sheet. Differences between actual results in a given year and the actuarially determined assumed results for that year are deferred as unrecognized actuarial gains or losses in comprehensive income. We measure the funded status of our plans as of the date of our fiscal year end.
The net periodic cost of the pension plans is determined using projections and actuarial assumptions, the most significant of which are the discount rate and the long-term rate of asset return. The net periodic pension income or expense is recognized in the year incurred. Gains and losses, which occur when actual experience differs from actuarial assumptions, are amortized over the average future expected life of participants. As benefits under the Hanesbrands Inc. Pension Plan are frozen, year over year fluctuations in our pension expense are not expected to be material and not expected to have a material impact on our Consolidated Statements of Income.
Our policies regarding the establishment of pension assumptions are as follows:
|
•
|
In determining the discount rate, we utilized the Aon Hewitt AA-Only Above Median Curve (rounded to the nearest 10 basis points) in order to determine a unique interest rate for each plan and match the expected cash flows for each plan. We utilized a full series specific spot rates along the Aon Hewitt AA Above Median yield curve in our determination of discount rates, for our U.S. defined benefit plans, in order to determine our interest rate and match to the relevant cash flows for the plans.
|
|
•
|
Salary increase assumptions were based on historical experience and anticipated future management actions. The salary increase assumption only applies to the Canadian plans, certain Hanes Europe Innerwear plans and portions of the Hanesbrands nonqualified retirement plans, as benefits under these plans are not frozen. The benefits under the Hanesbrands Inc. Pension Plan were frozen as of December 31, 2005.
|
|
•
|
In determining the long-term rate of return on plan assets we applied a proportionally weighted blend between assuming the historical long-term compound growth rate of the plan portfolio would predict the future returns of similar investments, and the utilization of forward-looking assumptions.
|
|
•
|
Retirement rates were based primarily on actual experience while standard actuarial tables were used to estimate mortality. In
2018
, the tables used as a basis for the mortality assumption were from the RP-2014 table with Scale MP-2018.
|
The sensitivity of changes in actuarial assumptions on our annual pension expense and on our plans’ benefit obligations, all other factors being equal, is illustrated by the following:
|
|
Increase (Decrease) in
|
||||||
|
Pension
Expense
|
Benefit
Obligation
|
||||||
|
(in millions)
|
|||||||
|
1% decrease in discount rate
|
$
|
(1
|
)
|
$
|
142
|
|
|
|
1% increase in discount rate
|
1
|
|
(116
|
)
|
|||
|
1% decrease in expected investment return
|
7
|
|
N/A
|
|
|||
|
1% increase in expected investment return
|
(7
|
)
|
N/A
|
|
|||
Recently Issued Accounting Pronouncements
For a summary of recently issued accounting pronouncements, see Note, “Summary of Significant Accounting Policies” to our consolidated financial statements included in this Annual Report on Form 10-K.
41
|
Item 7A.
|
Quantitative and Qualitative Disclosures about Market Risk
|
We are exposed to market risk from changes in foreign exchange rates, interest rates and commodity prices. Our risk management control system uses analytical techniques including market value, sensitivity analysis and value at risk estimations.
Foreign Exchange Risk
We sell the majority of our products in transactions denominated in U.S. dollars; however, we purchase some raw materials, pay a portion of our wages and make other payments in our supply chain in foreign currencies. With our international commercial presence, we also have foreign entities that purchase raw materials and finished goods in U.S. dollars. Our exposure to foreign exchange rates exists primarily with respect to the Euro, Australian dollar, Canadian dollar, Mexican peso and Japanese yen against the U.S. dollar. We use foreign exchange forward contracts to hedge material exposure to adverse changes in foreign exchange rates. A sensitivity analysis technique has been used to evaluate the effect that changes in the market value of foreign exchange currencies will have on our forward and option contracts. At
December 29, 2018
, the potential change in fair value of foreign currency derivative instruments, assuming a 10% adverse change in the underlying currency price, was approximately $58 million.
Interest Rates
Our debt under the Revolving Loan Facility, Accounts Receivable Securitization Facility, Term Loan A, Term Loan B, Australian Term A-1, Australian Revolver, European Revolver, certain other international debt and notes payable bears interest at variable rates. As a result, we are exposed to changes in market interest rates that could impact the cost of servicing our debt and notes payable. Approximately 59% of our total debt and notes payable outstanding at
December 29, 2018
is at a fixed rate. A 25-basis point movement in the annual interest rate charged on the outstanding debt and notes payable balances as of
December 29, 2018
would result in a change in annual interest expense of approximately $4 million.
Commodities
We are exposed to commodity price fluctuations primarily as a result of the cost of materials that are used in our manufacturing process. Cotton is the primary raw material used in manufacturing many of our products. Under our current agreements with our primary yarn suppliers, we have the ability to periodically fix the cotton cost component of our yarn purchases so that the suppliers bear the risk of cotton price fluctuation for the specified yarn volume and interim fluctuations in the price of cotton do not impact our costs. However, our business can be affected by sustained dramatic movements in cotton prices.
In addition, fluctuations in crude oil or petroleum prices may influence the prices of other raw materials we use to manufacture our products, such as chemicals, dyestuffs, polyester yarn and foam, as well as affect our transportation and utility costs. We generally purchase raw materials at market prices.
|
Item 8.
|
Financial Statements and Supplementary Data
|
Our consolidated financial statements required by this item are contained on pages F-1 through F-51 of this Annual Report on Form 10-K. See Item 15(a)(1) for a listing of consolidated financial statements provided.
|
Item 9.
|
Changes in and Disagreements with Accountants on Accounting and Financial Disclosure
|
None.
|
Item 9A.
|
Controls and Procedures
|
Disclosure Controls and Procedures
As required by Exchange Act Rule 13a-15(b), our management, including our Chief Executive Officer and Chief Financial Officer, conducted an evaluation of the effectiveness of our disclosure controls and procedures, as defined in Exchange Act Rule 13a-15(e), as of the end of the period covered by this report. Based on that evaluation, our Chief Executive Officer and Chief Financial Officer concluded that our disclosure controls and procedures were effective.
42
Internal Control over Financial Reporting
Our management is responsible for establishing and maintaining adequate internal control over financial reporting, as defined in Exchange Act Rule 13a-15(f). Management’s annual report on internal control over financial reporting and the report of independent registered public accounting firm are incorporated by reference to pages F-2 and F-3 of this Annual Report on Form 10-K.
Changes in Internal Control over Financial Reporting
In connection with the evaluation required by Exchange Act Rule 13a-15(d), our management, including our Chief Executive Officer and Chief Financial Officer, concluded that no changes in our internal control over financial reporting occurred during the quarter ended
December 29, 2018
that have materially affected, or are reasonably likely to materially affect, our internal control over financial reporting. We excluded our wholly owned subsidiary, Bras N Things, from our assessment of internal control over financial reporting as of
December 29, 2018
because our control over the operation of the subsidiary was acquired in a purchase business combination during
2018
.
|
Item 9B.
|
Other Information
|
None.
43
PART III
|
Item 10.
|
Directors, Executive Officers and Corporate Governance
|
The material under the heading “Proposal 1 - Election of Directors: Nominees for Election as Directors for a One-Year Term Expiring in 2020,” “Ownership of Our Stock: Section 16(a) Beneficial Ownership Reporting Compliance,” “Proposal 1 - Election of Directors: Other Governance Information - Code of Ethics,” “Proposal 1 - Election of Directors: Board Structure and Processes - Committees of the Board of Directors” and “Proposal 1 - Election of Directors: How We Select our Directors - Director Independence,” each as included and to be filed in the Company’s definitive Proxy Statement for the 2019 Annual Meeting of Stockholders (the “2019 Proxy Statement”), is incorporated by reference herein in response to this Item. Certain information concerning the Company’s executive officers is included in Item 1C of this Annual Report on Form 10-K.
|
Item 11.
|
Executive Compensation
|
The material under the heading “Proposal 3 - Advisory Vote to Approve Executive Compensation: Compensation Discussion and Analysis,” “Proposal 3 - Advisory Vote to Approve Executive Compensation: Executive Compensation,” “Proposal 1 - Election of Directors: Board Structure and Processes - Committees of the Board of Directors - Compensation Committee Interlocks and Insider Participation,” and “Proposal 3 - Advisory Vote to Approve Executive Compensation: Compensation Committee Report,” each as included and to be filed in the 2019 Proxy Statement, is incorporated by reference herein in response to this Item.
|
Item 12.
|
Security Ownership of Certain Beneficial Owners and Management and Related Stockholder Matters
|
The material under the heading “Equity Compensation Plan Information” as included in Item 5 of this Annual Report on Form 10-K and the material under the heading “Ownership of Our Stock: Share Ownership of Major Stockholders, Management and Directors” as included and to be filed in the 2019 Proxy Statement is incorporated by reference herein in response to this Item.
|
Item 13.
|
Certain Relationships and Related Transactions, and Director Independence
|
The material under the heading “Proposal 1 - Election of Directors: Other Governance Information - Related Party Transactions” and “Proposal 1 - Election of Directors: How We Select our Directors - Director Independence,”each as included and to be filed in the 2019 Proxy Statement, is incorporated by reference herein in response to this Item.
|
Item 14.
|
Principal Accounting Fees and Services
|
The material under the heading “Proposal 2 - Ratification of Appointment of Independent Registered Public Accounting Firm: Relationship with Independent Registered Public Accounting Firm” as included and to be filed in the 2019 Proxy Statement is incorporated by reference herein in response to this Item.
44
PART IV
|
Item 15.
|
Exhibits and Financial Statement Schedules
|
(a)(1) Financial Statements
The financial statements listed in the accompanying Index to Consolidated Financial Statements on page F-1 are filed as part of this Annual Report on Form 10-K.
(a)(3) Exhibits
|
Exhibit
Number
|
|
Description
|
|
2.1
|
||
|
2.2
|
||
|
3.1
|
||
|
3.2
|
||
|
3.3
|
||
|
3.4
|
||
|
3.5
|
||
|
4.1
|
||
|
4.2
|
|
|
|
4.3
|
||
|
4.4
|
|
|
45
|
Exhibit
Number
|
|
Description
|
|
4.5
|
|
|
|
4.6
|
|
|
|
4.7
|
|
|
|
4.8
|
|
|
|
4.9
|
|
|
|
4.10
|
|
|
|
4.11
|
|
|
|
4.12
|
||
|
10.1
|
||
|
10.2
|
|
|
|
10.3
|
|
|
|
10.4
|
||
|
10.5
|
||
46
|
Exhibit
Number
|
|
Description
|
|
10.6
|
|
|
|
10.7
|
||
|
10.8
|
||
|
10.9
|
||
|
10.10
|
||
|
10.11
|
||
|
10.12
|
||
|
10.13
|
||
|
10.14
|
||
|
10.15
|
||
|
10.16
|
||
|
10.17
|
||
|
10.18
|
||
|
10.19
|
||
|
10.20
|
||
|
10.21
|
||
47
|
Exhibit
Number
|
|
Description
|
|
10.22
|
||
|
10.23
|
||
|
10.24
|
|
|
|
10.25
|
||
|
10.26
|
|
|
|
10.27
|
||
|
10.28
|
|
|
|
10.29
|
||
|
21.1
|
||
|
23.1
|
||
|
24.1
|
||
|
31.1
|
||
|
31.2
|
||
|
32.1
|
||
|
32.2
|
||
|
101.INS XBRL
|
Instance Document
|
|
|
101.SCH XBRL
|
Taxonomy Extension Schema Document
|
|
48
|
Exhibit
Number
|
|
Description
|
|
101.CAL XBRL
|
Taxonomy Extension Calculation Linkbase Document
|
|
|
101.LAB XBRL
|
Taxonomy Extension Label Linkbase Document
|
|
|
101.PRE XBRL
|
Taxonomy Extension Presentation Linkbase Document
|
|
|
101.DEF XBRL
|
Taxonomy Extension Definition Linkbase Document
|
|
|
*
|
Management contract or compensatory plans or arrangements.
|
|
Item 16.
|
Form 10-K Summary
|
Not applicable.
49
SIGNATURES
Pursuant to the requirements of Section 13 or 15(d) of the Securities Exchange Act of 1934, the registrant has duly caused this Form 10-K to be signed on its behalf by the undersigned, thereunto duly authorized, on the
February 8, 2019
.
|
HANESBRANDS INC.
|
|
/s/ Gerald W. Evans, Jr.
|
|
Gerald W. Evans, Jr.
|
|
Chief Executive Officer
|
50
POWER OF ATTORNEY
KNOW BY ALL PERSONS BY THESE PRESENTS, that each person whose signature appears below constitutes and appoints jointly and severally, Gerald W. Evans, Jr., Barry A. Hytinen and Joia M. Johnson, and each one of them, his or her attorneys-in-fact, each with the power of substitution, for him or her in any and all capacities, to sign any and all amendments to this Annual Report on Form 10-K and to file the same, with exhibits thereto and other documents in connection therewith, with the Securities and Exchange Commission, hereby ratifying and confirming all that each said attorneys-in-fact, or his substitute or substitutes, may do or cause to be done by virtue hereof.
Pursuant to the requirements of the Securities Exchange Act of 1934, this Annual Report on Form 10-K has been signed below by the following persons on behalf of the registrant and in the capacities and on the dates indicated:
|
Signature
|
Capacity
|
Date
|
||
|
/s/ Gerald W. Evans, Jr.
|
Chief Executive Officer
(principal executive officer)
|
February 8, 2019
|
||
|
Gerald W. Evans, Jr.
|
||||
|
/s/ Barry A. Hytinen
|
Chief Financial Officer
(principal financial officer)
|
February 8, 2019
|
||
|
Barry A. Hytinen
|
||||
|
/s/ M. Scott Lewis
|
Chief Accounting Officer and Controller
(principal accounting officer)
|
February 8, 2019
|
||
|
M. Scott Lewis
|
||||
|
/s/ Geralyn R. Breig
|
Director
|
February 8, 2019
|
||
|
Geralyn R. Breig
|
||||
|
/s/ Bobby J. Griffin
|
Director
|
February 8, 2019
|
||
|
Bobby J. Griffin
|
||||
|
/s/ James C. Johnson
|
Director
|
February 8, 2019
|
||
|
James C. Johnson
|
||||
|
/s/ Jessica T. Mathews
|
Director
|
February 8, 2019
|
||
|
Jessica T. Mathews
|
||||
|
/s/ Franck J. Moison
|
Director
|
February 8, 2019
|
||
|
Franck J. Moison
|
||||
|
/s/ Robert F. Moran
|
Director
|
February 8, 2019
|
||
|
Robert F. Moran
|
||||
|
/s/ Ronald L. Nelson
|
Director
|
February 8, 2019
|
||
|
Ronald L. Nelson
|
||||
|
/s/ Richard A. Noll
|
Director
|
February 8, 2019
|
||
|
Richard A. Noll
|
||||
|
/s/ David V. Singer
|
Director
|
February 8, 2019
|
||
|
David V. Singer
|
||||
|
/s/ Ann E. Ziegler
|
Director
|
February 8, 2019
|
||
|
Ann E. Ziegler
|
||||
51
INDEX TO CONSOLIDATED FINANCIAL STATEMENTS
HANESBRANDS INC.
|
Consolidated Financial Statements:
|
Page
|
F-1
Hanesbrands Inc.
Management’s Report on Internal Control Over Financial Reporting
Management of Hanesbrands Inc. (“Hanesbrands”) is responsible for establishing and maintaining adequate internal control over financial reporting as defined in Rules 13a — 15(f) under the Securities and Exchange Act of 1934. Internal control over financial reporting is a process designed to provide reasonable assurance regarding the reliability of financial reporting and the preparation of financial statements for external purposes in accordance with accounting principles generally accepted in the United States. Hanesbrands’ system of internal control over financial reporting includes those policies and procedures that (i) pertain to the maintenance of records that, in reasonable detail, accurately and fairly reflect the transactions and dispositions of the assets of Hanesbrands; (ii) provide reasonable assurance that transactions are recorded as necessary to permit preparation of financial statements in accordance with accounting principles generally accepted in the United States, and that receipts and expenditures of Hanesbrands are being made only in accordance with authorizations of management and directors of Hanesbrands; and (iii) provide reasonable assurance regarding prevention or timely detection of unauthorized acquisition, use, or disposition of Hanesbrands’ assets that could have a material effect on the financial statements.
The Company excluded its wholly owned subsidiary BNT Holdco Pty Limited (“Bras N Things”) from its assessment of internal control over financial reporting as of
December 29, 2018
because its control over these operations was acquired by the Company in a purchase business combination during
2018
. The Company is in the process of integrating the operations of Bras N Things into the Company’s overall internal control over financial reporting process. This is a wholly-owned subsidiary whose combined total assets and total revenues represent 0.2% and 1.8% of the related consolidated financial statement amounts as of and for the year ended
December 29, 2018
.
Management has evaluated the effectiveness of Hanesbrands’ internal control over financial reporting as of
December 29, 2018
, based upon criteria for effective internal control over financial reporting described in
Internal Control — Integrated Framework (2013)
issued by the Committee of Sponsoring Organizations of the Treadway Commission (“COSO”). Based on our evaluation, management determined that Hanesbrands’ internal control over financial reporting was effective as of
December 29, 2018
.
The effectiveness of our internal control over financial reporting as of
December 29, 2018
has been audited by PricewaterhouseCoopers LLP, an independent registered public accounting firm, as stated in their report, which is included on the following page.
F-2
Report of Independent Registered Public Accounting Firm
To the Board of Directors and Stockholders of Hanesbrands Inc.
Opinions on the Financial Statements and Internal Control over Financial Reporting
We have audited the accompanying consolidated balance sheets of Hanesbrands Inc. and its subsidiaries (the “Company”) as of December 29, 2018 and December 30, 2017, and the related consolidated statements of income, comprehensive income, stockholders’ equity and cash flows for each of the three years in the period ended December 29, 2018, including the related notes (collectively referred to as the “consolidated financial statements”). We also have audited the Company's internal control over financial reporting as of December 29, 2018, based on criteria established in
Internal Control - Integrated Framework
(2013) issued by the Committee of Sponsoring Organizations of the Treadway Commission (“COSO”).
In our opinion, the consolidated financial statements referred to above present fairly, in all material respects, the financial position of the Company as of December 29, 2018 and December 30, 2017, and the results of its operations and its cash flows for each of the three years in the period ended December 29, 2018 in conformity with accounting principles generally accepted in the United States of America. Also in our opinion, the Company maintained, in all material respects, effective internal control over financial reporting as of December 29, 2018, based on criteria established in
Internal Control - Integrated Framework
(2013) issued by the COSO.
Basis for Opinions
The Company's management is responsible for these consolidated financial statements, for maintaining effective internal control over financial reporting, and for its assessment of the effectiveness of internal control over financial reporting, included in the accompanying Management’s Report on Internal Control Over Financial Reporting. Our responsibility is to express opinions on the Company’s consolidated financial statements and on the Company's internal control over financial reporting based on our audits. We are a public accounting firm registered with the Public Company Accounting Oversight Board (United States) (“PCAOB”) and are required to be independent with respect to the Company in accordance with the U.S. federal securities laws and the applicable rules and regulations of the Securities and Exchange Commission and the PCAOB.
We conducted our audits in accordance with the standards of the PCAOB. Those standards require that we plan and perform the audits to obtain reasonable assurance about whether the consolidated financial statements are free of material misstatement, whether due to error or fraud, and whether effective internal control over financial reporting was maintained in all material respects.
Our audits of the consolidated financial statements included performing procedures to assess the risks of material misstatement of the consolidated financial statements, whether due to error or fraud, and performing procedures that respond to those risks. Such procedures included examining, on a test basis, evidence regarding the amounts and disclosures in the consolidated financial statements. Our audits also included evaluating the accounting principles used and significant estimates made by management, as well as evaluating the overall presentation of the consolidated
financial statements. Our audit of internal control over financial reporting included obtaining an understanding of internal control over financial reporting, assessing the risk that a material weakness exists, and testing and evaluating the design and operating effectiveness of internal control based on the assessed risk. Our audits also included performing such other procedures as we considered necessary in the circumstances. We believe that our audits provide a reasonable basis for our opinions.
As described in Management’s Report on Internal Control Over Financial Reporting, management has excluded BNT Holdco Pty Limited (“Bras N Things”) from its assessment of internal control over financial reporting as of December 29, 2018 because it was acquired by the Company in a purchase business combination during 2018. We have also excluded Bras N Things from our audit of internal control over financial reporting. Bras N Things is a wholly-owned subsidiary whose total assets and total revenues excluded from management’s assessment and our audit of internal control over financial reporting represent 0.2% and 1.8%, respectively, of the related consolidated financial statement amounts as of and for the year ended December 29, 2018.
Definition and Limitations of Internal Control over Financial Reporting
A company’s internal control over financial reporting is a process designed to provide reasonable assurance regarding the reliability of financial reporting and the preparation of financial statements for external purposes in accordance with generally accepted accounting principles. A company’s internal control over financial reporting includes those policies and procedures that (i) pertain to the maintenance of records that, in reasonable detail, accurately and fairly reflect the transactions and dispositions of the assets of the company; (ii) provide reasonable assurance that transactions are recorded as necessary to permit preparation of financial statements in accordance with generally accepted accounting principles, and that receipts and
F-3
expenditures of the company are being made only in accordance with authorizations of management and directors of the company; and (iii) provide reasonable assurance regarding prevention or timely detection of unauthorized acquisition, use, or disposition of the company’s assets that could have a material effect on the financial statements.
Because of its inherent limitations, internal control over financial reporting may not prevent or detect misstatements. Also, projections of any evaluation of effectiveness to future periods are subject to the risk that controls may become inadequate because of changes in conditions, or that the degree of compliance with the policies or procedures may deteriorate.
/s/ PricewaterhouseCoopers LLP
Charlotte, North Carolina
February 8, 2019
We have served as the Company’s auditor since 2006.
F-4
HANESBRANDS INC.
Consolidated Statements of Income
(in thousands, except per share amounts)
|
|
Years Ended
|
||||||||||
|
|
December 29,
2018 |
December 30,
2017 |
December 31,
2016 |
||||||||
|
Net sales
|
$
|
6,803,955
|
|
$
|
6,471,410
|
|
$
|
6,028,199
|
|
||
|
Cost of sales
|
4,147,436
|
|
3,980,859
|
|
3,752,151
|
|
|||||
|
Gross profit
|
2,656,519
|
|
2,490,551
|
|
2,276,048
|
|
|||||
|
Selling, general and administrative expenses
|
1,788,568
|
|
1,718,349
|
|
1,485,997
|
|
|||||
|
Change in fair value of contingent consideration
|
—
|
|
27,852
|
|
—
|
|
|||||
|
Operating profit
|
867,951
|
|
744,350
|
|
790,051
|
|
|||||
|
Other expenses
|
26,395
|
|
32,645
|
|
66,160
|
|
|||||
|
Interest expense, net
|
194,675
|
|
174,435
|
|
152,692
|
|
|||||
|
Income from continuing operations before income tax expense
|
646,881
|
|
537,270
|
|
571,199
|
|
|||||
|
Income tax expense
|
93,797
|
|
473,279
|
|
34,272
|
|
|||||
|
Income from continuing operations
|
553,084
|
|
63,991
|
|
536,927
|
|
|||||
|
Income (loss) from discontinued operations, net of tax
|
—
|
|
(2,097
|
)
|
2,455
|
|
|||||
|
Net income
|
$
|
553,084
|
|
$
|
61,894
|
|
$
|
539,382
|
|
||
|
Earnings (loss) per share — basic:
|
|||||||||||
|
Continuing operations
|
$
|
1.52
|
|
$
|
0.17
|
|
$
|
1.41
|
|
||
|
Discontinued operations
|
—
|
|
(0.01
|
)
|
0.01
|
|
|||||
|
Net income
|
$
|
1.52
|
|
$
|
0.17
|
|
$
|
1.41
|
|
||
|
Earnings (loss) per share — diluted:
|
|||||||||||
|
Continuing operations
|
$
|
1.52
|
|
$
|
0.17
|
|
$
|
1.40
|
|
||
|
Discontinued operations
|
—
|
|
(0.01
|
)
|
0.01
|
|
|||||
|
Net income
|
$
|
1.52
|
|
$
|
0.17
|
|
$
|
1.40
|
|
||
See accompanying notes to Consolidated Financial Statements.
F-5
HANESBRANDS INC.
Consolidated Statements of Comprehensive Income
(in thousands)
|
|
Years Ended
|
||||||||||
|
|
December 29,
2018 |
December 30,
2017 |
December 31,
2016 |
||||||||
|
Net income
|
$
|
553,084
|
|
$
|
61,894
|
|
$
|
539,382
|
|
||
|
Other comprehensive loss:
|
|||||||||||
|
Foreign currency translation
|
(113,555
|
)
|
34,554
|
|
(20,384
|
)
|
|||||
|
Cash flow hedges, net of tax effect of ($11,297), $7,951, and ($1,272), respectively
|
35,978
|
|
(31,281
|
)
|
5,757
|
|
|||||
|
Defined benefit plans, net of tax effect of ($4,852), $930, and $16,393, respectively
|
13,841
|
|
(6,488
|
)
|
(26,431
|
)
|
|||||
|
Other comprehensive loss
|
(63,736
|
)
|
(3,215
|
)
|
(41,058
|
)
|
|||||
|
Comprehensive income
|
$
|
489,348
|
|
$
|
58,679
|
|
$
|
498,324
|
|
||
See accompanying notes to Consolidated Financial Statements.
F-6
HANESBRANDS INC.
Consolidated Balance Sheets
(in thousands, except share and per share amounts)
|
December 29,
2018 |
December 30,
2017 |
||||||
|
Assets
|
|||||||
|
Cash and cash equivalents
|
$
|
433,022
|
|
$
|
421,566
|
|
|
|
Trade accounts receivable, net
|
870,878
|
|
903,318
|
|
|||
|
Inventories
|
2,054,458
|
|
1,874,990
|
|
|||
|
Other current assets
|
159,231
|
|
186,496
|
|
|||
|
Total current assets
|
3,517,589
|
|
3,386,370
|
|
|||
|
Property, net
|
607,688
|
|
623,991
|
|
|||
|
Trademarks and other identifiable intangibles, net
|
1,555,381
|
|
1,402,857
|
|
|||
|
Goodwill
|
1,241,727
|
|
1,167,007
|
|
|||
|
Deferred tax assets
|
249,693
|
|
234,932
|
|
|||
|
Other noncurrent assets
|
83,880
|
|
79,618
|
|
|||
|
Total assets
|
$
|
7,255,958
|
|
$
|
6,894,775
|
|
|
|
Liabilities and Stockholders’ Equity
|
|||||||
|
Accounts payable
|
$
|
1,029,933
|
|
$
|
867,649
|
|
|
|
Accrued liabilities and other:
|
|||||||
|
Payroll and employee benefits
|
147,418
|
|
153,394
|
|
|||
|
Advertising and promotion
|
148,295
|
|
150,375
|
|
|||
|
Other
|
258,188
|
|
345,865
|
|
|||
|
Notes payable
|
5,824
|
|
11,873
|
|
|||
|
Accounts Receivable Securitization Facility
|
161,608
|
|
125,209
|
|
|||
|
Current portion of long-term debt
|
278,976
|
|
124,380
|
|
|||
|
Total current liabilities
|
2,030,242
|
|
1,778,745
|
|
|||
|
Long-term debt
|
3,534,183
|
|
3,702,054
|
|
|||
|
Pension and postretirement benefits
|
378,972
|
|
405,238
|
|
|||
|
Accrued income taxes - noncurrent
|
100,626
|
|
137,226
|
|
|||
|
Other noncurrent liabilities
|
241,652
|
|
185,310
|
|
|||
|
Total liabilities
|
6,285,675
|
|
6,208,573
|
|
|||
|
Stockholders’ equity:
|
|||||||
|
Preferred stock (50,000,000 authorized shares; $.01 par value)
|
|||||||
|
Issued and outstanding — None
|
—
|
|
—
|
|
|||
|
Common stock (2,000,000,000 authorized shares; $.01 par value)
|
|||||||
|
Issued and outstanding — 361,330,128 and 360,125,894, respectively
|
3,613
|
|
3,601
|
|
|||
|
Additional paid-in capital
|
284,877
|
|
271,462
|
|
|||
|
Retained earnings
|
1,184,735
|
|
850,345
|
|
|||
|
Accumulated other comprehensive loss
|
(502,942
|
)
|
(439,206
|
)
|
|||
|
Total stockholders’ equity
|
970,283
|
|
686,202
|
|
|||
|
Total liabilities and stockholders’ equity
|
$
|
7,255,958
|
|
$
|
6,894,775
|
|
|
See accompanying notes to Consolidated Financial Statements.
F-7
HANESBRANDS INC.
Consolidated Statements of Stockholders’ Equity
(in thousands)
|
|
Common Stock
|
Additional
Paid-In Capital |
Retained
Earnings |
Accumulated
Other Comprehensive Loss |
Total
|
|||||||||||||||||
|
|
Shares
|
Amount
|
||||||||||||||||||||
|
Balances at January 2, 2016
|
391,653
|
|
$
|
3,917
|
|
$
|
277,569
|
|
$
|
1,389,338
|
|
$
|
(394,933
|
)
|
$
|
1,275,891
|
|
|||||
|
Net income
|
—
|
|
—
|
|
—
|
|
539,382
|
|
—
|
|
539,382
|
|
||||||||||
|
Dividends
|
—
|
|
—
|
|
—
|
|
(169,294
|
)
|
—
|
|
(169,294
|
)
|
||||||||||
|
Translation adjustments
|
—
|
|
—
|
|
—
|
|
—
|
|
(20,384
|
)
|
(20,384
|
)
|
||||||||||
|
Net unrealized gain on qualifying cash flow hedges
|
—
|
|
—
|
|
—
|
|
—
|
|
5,757
|
|
5,757
|
|
||||||||||
|
Net unrecognized loss from pension and postretirement plans
|
—
|
|
—
|
|
—
|
|
—
|
|
(26,431
|
)
|
(26,431
|
)
|
||||||||||
|
Stock-based compensation
|
—
|
|
—
|
|
30,617
|
|
6,051
|
|
—
|
|
36,668
|
|
||||||||||
|
Net exercise of stock options, vesting of restricted stock units and other
|
1,277
|
|
12
|
|
(37,786
|
)
|
—
|
|
—
|
|
(37,774
|
)
|
||||||||||
|
Share repurchases
|
(14,243
|
)
|
(142
|
)
|
(10,398
|
)
|
(369,361
|
)
|
—
|
|
(379,901
|
)
|
||||||||||
|
Balances at December 31, 2016
|
378,687
|
|
$
|
3,787
|
|
$
|
260,002
|
|
$
|
1,396,116
|
|
$
|
(435,991
|
)
|
$
|
1,223,914
|
|
|||||
|
Net income
|
—
|
|
—
|
|
—
|
|
61,894
|
|
—
|
|
61,894
|
|
||||||||||
|
Dividends
|
—
|
|
—
|
|
—
|
|
(222,290
|
)
|
—
|
|
(222,290
|
)
|
||||||||||
|
Translation adjustments
|
—
|
|
—
|
|
—
|
|
—
|
|
34,554
|
|
34,554
|
|
||||||||||
|
Net unrealized loss on qualifying cash flow hedges
|
—
|
|
—
|
|
—
|
|
—
|
|
(31,281
|
)
|
(31,281
|
)
|
||||||||||
|
Net unrecognized loss from pension and postretirement plans
|
—
|
|
—
|
|
—
|
|
—
|
|
(6,488
|
)
|
(6,488
|
)
|
||||||||||
|
Stock-based compensation
|
—
|
|
—
|
|
23,224
|
|
—
|
|
—
|
|
23,224
|
|
||||||||||
|
Net exercise of stock options, vesting of restricted stock units and other
|
1,079
|
|
10
|
|
2,154
|
|
528
|
|
—
|
|
2,692
|
|
||||||||||
|
Share repurchases
|
(19,640
|
)
|
(196
|
)
|
(13,918
|
)
|
(385,903
|
)
|
—
|
|
(400,017
|
)
|
||||||||||
|
Balances at December 30, 2017
|
360,126
|
|
$
|
3,601
|
|
$
|
271,462
|
|
$
|
850,345
|
|
$
|
(439,206
|
)
|
$
|
686,202
|
|
|||||
|
Net income
|
—
|
|
—
|
|
—
|
|
553,084
|
|
—
|
|
553,084
|
|
||||||||||
|
Dividends
|
—
|
|
—
|
|
—
|
|
(218,694
|
)
|
—
|
|
(218,694
|
)
|
||||||||||
|
Translation adjustments
|
—
|
|
—
|
|
—
|
|
—
|
|
(113,555
|
)
|
(113,555
|
)
|
||||||||||
|
Net unrealized gain on qualifying cash flow hedges
|
—
|
|
—
|
|
—
|
|
—
|
|
35,978
|
|
35,978
|
|
||||||||||
|
Net unrecognized gain from pension and postretirement plans
|
—
|
|
—
|
|
—
|
|
—
|
|
13,841
|
|
13,841
|
|
||||||||||
|
Stock-based compensation
|
—
|
|
—
|
|
21,063
|
|
—
|
|
—
|
|
21,063
|
|
||||||||||
|
Net exercise of stock options, vesting of restricted stock units and other
|
1,204
|
|
12
|
|
(7,648
|
)
|
—
|
|
—
|
|
(7,636
|
)
|
||||||||||
|
Balances at December 29, 2018
|
361,330
|
|
$
|
3,613
|
|
$
|
284,877
|
|
$
|
1,184,735
|
|
$
|
(502,942
|
)
|
$
|
970,283
|
|
|||||
See accompanying notes to Consolidated Financial Statements.
F-8
HANESBRANDS INC.
Consolidated Statements of Cash Flows
(in thousands)
|
|
Years Ended
|
||||||||||
|
|
December 29,
2018 |
December 30,
2017 |
December 31,
2016 |
||||||||
|
Operating activities:
|
|||||||||||
|
Net income
|
$
|
553,084
|
|
$
|
61,894
|
|
$
|
539,382
|
|
||
|
Adjustments to reconcile net income to net cash from operating activities:
|
|||||||||||
|
Depreciation
|
95,359
|
|
87,595
|
|
81,057
|
|
|||||
|
Amortization of intangibles
|
36,437
|
|
34,892
|
|
22,118
|
|
|||||
|
Charges incurred for amendments of credit facilities
|
—
|
|
—
|
|
34,624
|
|
|||||
|
Write-off on early extinguishment of debt
|
—
|
|
4,028
|
|
12,667
|
|
|||||
|
Amortization of debt issuance costs
|
9,278
|
|
10,394
|
|
9,034
|
|
|||||
|
Stock compensation expense
|
21,416
|
|
23,582
|
|
31,780
|
|
|||||
|
Deferred taxes
|
22,146
|
|
239,068
|
|
(8,836
|
)
|
|||||
|
Change in fair value of contingent consideration liability
|
—
|
|
27,852
|
|
—
|
|
|||||
|
Other
|
(1,134
|
)
|
1,468
|
|
(12,587
|
)
|
|||||
|
Changes in assets and liabilities, net of acquisition and disposition of businesses:
|
|||||||||||
|
Accounts receivable
|
10,269
|
|
(31,656
|
)
|
(83,279
|
)
|
|||||
|
Inventories
|
(205,319
|
)
|
22,648
|
|
135,807
|
|
|||||
|
Other assets
|
(4
|
)
|
(28,346
|
)
|
(24,563
|
)
|
|||||
|
Accounts payable
|
165,788
|
|
71,806
|
|
(60,994
|
)
|
|||||
|
Accrued pension and postretirement benefits
|
(5,024
|
)
|
19,042
|
|
(31,504
|
)
|
|||||
|
Accrued income taxes
|
(23,936
|
)
|
179,117
|
|
7,396
|
|
|||||
|
Accrued liabilities and other
|
(34,958
|
)
|
(67,666
|
)
|
(46,495
|
)
|
|||||
|
Net cash from operating activities
|
643,402
|
|
655,718
|
|
605,607
|
|
|||||
|
Investing activities:
|
|||||||||||
|
Purchases of property, plant and equipment
|
(86,293
|
)
|
(87,008
|
)
|
(83,399
|
)
|
|||||
|
Proceeds from sales of assets
|
2,557
|
|
4,459
|
|
80,833
|
|
|||||
|
Acquisition of businesses, net of cash acquired
|
(334,915
|
)
|
(62,249
|
)
|
(964,075
|
)
|
|||||
|
Disposition of businesses
|
—
|
|
40,285
|
|
—
|
|
|||||
|
Net cash from investing activities
|
(418,651
|
)
|
(104,513
|
)
|
(966,641
|
)
|
|||||
|
Financing activities:
|
|||||||||||
|
Borrowings on notes payable
|
278,147
|
|
278,489
|
|
904,476
|
|
|||||
|
Repayments on notes payable
|
(286,591
|
)
|
(327,615
|
)
|
(992,760
|
)
|
|||||
|
Borrowings on Accounts Receivable Securitization Facility
|
213,336
|
|
373,640
|
|
238,065
|
|
|||||
|
Repayments on Accounts Receivable Securitization Facility
|
(176,937
|
)
|
(292,952
|
)
|
(388,707
|
)
|
|||||
|
Borrowings on Revolving Loan Facilities
|
3,546,360
|
|
4,161,799
|
|
3,798,942
|
|
|||||
|
Repayments on Revolving Loan Facilities
|
(3,506,500
|
)
|
(4,153,000
|
)
|
(3,795,500
|
)
|
|||||
|
Borrowings on Senior Notes
|
—
|
|
—
|
|
2,359,347
|
|
|||||
|
Repayments on Senior Notes
|
—
|
|
—
|
|
(1,000,000
|
)
|
|||||
|
Borrowings on Term Loan Facilities
|
—
|
|
1,250,000
|
|
301,272
|
|
|||||
|
Repayments on Term Loan Facilities
|
(31,875
|
)
|
(1,145,215
|
)
|
(268,264
|
)
|
|||||
|
Borrowings on International Debt
|
—
|
|
—
|
|
9,145
|
|
|||||
|
Repayments on International Debt
|
(1,105
|
)
|
(45,072
|
)
|
(12,734
|
)
|
|||||
|
Share repurchases
|
—
|
|
(400,017
|
)
|
(379,901
|
)
|
|||||
|
Cash dividends paid
|
(216,316
|
)
|
(219,903
|
)
|
(167,375
|
)
|
|||||
|
Payments to amend and refinance credit facilities
|
(677
|
)
|
(9,122
|
)
|
(80,069
|
)
|
|||||
|
Payment of contingent consideration
|
(3,540
|
)
|
(41,250
|
)
|
—
|
|
|||||
|
Taxes paid related to net shares settlement of equity awards
|
(12,715
|
)
|
(15,463
|
)
|
(17,414
|
)
|
|||||
|
Other
|
(2,084
|
)
|
(87
|
)
|
2,531
|
|
|||||
|
Net cash from financing activities
|
(200,497
|
)
|
(585,768
|
)
|
511,054
|
|
|||||
|
Effect of changes in foreign exchange rates on cash
|
9,912
|
|
(4,116
|
)
|
(8,944
|
)
|
|||||
|
Change in cash, cash equivalents and restricted cash
|
34,166
|
|
(38,679
|
)
|
141,076
|
|
|||||
|
Cash and cash equivalents at beginning of year
|
421,566
|
|
460,245
|
|
319,169
|
|
|||||
|
Cash, cash equivalents and restricted cash at end of year
|
455,732
|
|
421,566
|
|
460,245
|
|
|||||
|
Less restricted cash at end of year
|
22,710
|
|
—
|
|
—
|
|
|||||
|
Cash and cash equivalents per balance sheet at end of year
|
$
|
433,022
|
|
$
|
421,566
|
|
$
|
460,245
|
|
||
See accompanying notes to Consolidated Financial Statements.
F-9
HANESBRANDS INC.
Notes to Consolidated Financial Statements — (Continued)
Years ended December 29, 2018, December 30, 2017 and December 31, 2016
(amounts in thousands, except per share data)
|
(1)
|
Basis of Presentation
|
Hanesbrands Inc., a Maryland corporation (the “Company”), is a consumer goods company with a portfolio of leading apparel brands, including
Hanes, Champion, Bonds
,
Maidenform, DIM, Bali, Playtex, Bras N Things
,
Nur Die/Nur Der, Alternative
,
L’eggs, JMS/Just My Size, Lovable, Wonderbra, Berlei
and
Gear for Sports.
The Company designs, manufactures, sources and sells a broad range of basic apparel such as T-shirts, bras, panties, men’s underwear, children’s underwear, activewear, socks and hosiery.
During the third quarter of 2016, the Company separately reported the results of its Dunlop Flooring and Tontine Pillow businesses as discontinued operations in its Consolidated Statements of Income. Unless otherwise noted, discussion within these notes to the consolidated financial statements relates to continuing operations. See note “Discontinued Operations” for additional information on discontinued operations.
The Company’s fiscal year ends on the Saturday closest to December 31. All references to “
2018
”, “
2017
” and “
2016
” relate to the 52 week fiscal years ended on
December 29, 2018
,
December 30, 2017
and
December 31, 2016
, respectively. Two subsidiaries of the Company close within two days after the Company’s consolidated year end. The difference in reporting of financial information for these subsidiaries did not have a material impact on the Company’s financial condition, results of operations or cash flows.
|
(2)
|
Summary of Significant Accounting Policies
|
(a) Consolidation
The accompanying consolidated financial statements include the accounts of the Company and its wholly owned subsidiaries. All intercompany balances and transactions have been eliminated in consolidation.
(b) Use of Estimates
The preparation of consolidated financial statements in conformity with U.S. generally accepted accounting principles (“GAAP”) requires management to make use of estimates and assumptions that affect the reported amount of assets and liabilities, certain financial statement disclosures at the date of the financial statements, and the reported amounts of revenues and expenses during the reporting period. Actual results may vary from these estimates.
(c) Foreign Currency Translation
Foreign currency-denominated assets and liabilities are translated into U.S. dollars at exchange rates existing at the respective balance sheet dates. Translation adjustments resulting from fluctuations in exchange rates are recorded as a separate component of accumulated other comprehensive loss (“AOCI”) within stockholders’ equity. The Company translates the results of operations of its foreign operations at the average exchange rates during the respective periods. Gains and losses resulting from foreign currency transactions are included in both the “Cost of sales” and “Selling, general and administrative expenses” lines of the Consolidated Statements of Income.
(d) Sales Recognition and Incentives
The Company recognizes revenue when obligations under the terms of a contract with a customer are satisfied, which occurs at a point in time, upon either shipment or delivery to the customer. Revenue is measured as the amount of consideration the Company expects to receive in exchange for transferring goods, which includes estimates for variable consideration. The Company records a sales reduction for returns and allowances based upon historical return experience. The Company earns royalty revenues through license agreements with manufacturers of other consumer products that incorporate certain of the Company’s brands. The Company accrues revenue earned under these contracts based upon reported sales from the licensee. The Company offers a variety of sales incentives to resellers and consumers of its products, and the policies regarding the recognition and display of these incentives within the Consolidated Statements of Income are as follows:
F-10
HANESBRANDS INC.
Notes to Consolidated Financial Statements — (Continued)
Years ended December 29, 2018, December 30, 2017 and December 31, 2016
(amounts in thousands, except per share data)
Discounts, Coupons, and Rebates
The Company provides customers with discounts and rebates that are explicitly stated in the Company’s contracts and are recorded as a reduction of revenue in the period the product revenue is recognized. The cost of these incentives is estimated using a number of factors, including historical utilization and redemption rates. The Company includes incentives offered in the form of free products in the determination of cost of sales.
For all variable consideration, where appropriate, the Company estimates the amount using the expected value, which takes into consideration historical experience, current contractual requirements, specific known market events and forecasted customer buying and payment patterns. Overall, these reserves reflect the Company’s best estimates of the amount of consideration to which the customer is entitled based on the terms of the contracts.
Volume-Based Incentives
Volume-based incentives involve rebates or refunds of cash that are redeemable only if the customer completes a specified number of sales transactions. Under these incentive programs, the Company estimates the anticipated rebate to be paid and allocates a portion of the estimated cost of the rebate to each underlying sales transaction with the customer. The Company records volume-based incentives as a reduction of revenue.
Cooperative Advertising
Under cooperative advertising arrangements, the Company agrees to reimburse the retailer for a portion of the costs incurred by the retailer to advertise and promote certain of the Company’s products. The Company recognizes the cost of cooperative advertising programs in the period in which the advertising and promotional activity takes place as a reduction of revenue.
Fixtures and Racks
Store fixtures and racks are periodically used by resellers to display Company products. The Company expenses the cost of these fixtures and racks in the period in which they are delivered to the resellers. The Company includes the costs of fixtures and racks incurred by resellers and charged back to the Company in the determination of net sales. Fixtures and racks purchased by the Company and provided to resellers are included in selling, general and administrative expenses.
Product Returns
The Company generally offers customers a limited right of return for a purchased product. The Company estimates the amount of its product sales that may be returned by its customers and records this as a reduction of revenue in the period the related product revenue is recognized.
(e) Advertising Expense
Advertising costs represent one of several brand building methods used by the Company. Advertising costs, which include the development and production of advertising materials and the communication of these materials through various forms of media, are expensed in the period the advertising first takes place. The Company recognized advertising expense in the “Selling, general and administrative expenses” caption in the Consolidated Statements of Income of
$152,670
,
$154,969
and
$154,416
in
2018
,
2017
and
2016
, respectively. Prior year amounts have been reclassified by immaterial amounts to conform with the current year presentation of advertising expense.
(f) Shipping and Handling Costs
Revenue received for shipping and handling costs is included in net sales and was
$19,315
,
$19,738
and
$19,446
in
2018
,
2017
and
2016
, respectively. Shipping costs, which comprise payments to third party shippers, and handling costs, which consist of warehousing costs in the Company’s various distribution facilities, were
$409,098
,
$376,449
and
$324,845
in
2018
,
2017
and
2016
, respectively. The Company recognizes shipping, handling and distribution costs in the “Selling, general and administrative expenses” line of the Consolidated Statements of Income.
F-11
HANESBRANDS INC.
Notes to Consolidated Financial Statements — (Continued)
Years ended December 29, 2018, December 30, 2017 and December 31, 2016
(amounts in thousands, except per share data)
(g) Research and Development
Research and development costs are expensed as incurred and are included in the “Selling, general and administrative expenses” line of the Consolidated Statements of Income. Research and development includes expenditures for new product, technological improvements for existing products and process innovation, which primarily consist of salaries, consulting and supplies attributable to time spent on research and development activities. Additional costs include depreciation and maintenance for research and development equipment and facilities. Research and development expense was
$59,313
,
$65,457
and
$70,096
in
2018
,
2017
and
2016
, respectively.
(h) Defined Contribution Benefit Plans
The Company sponsors 401(k) plans as well as other defined contribution benefit plans. Expense for these plans was
$25,799
,
$21,251
and
$26,434
in
2018
,
2017
and
2016
, respectively.
(i) Cash and Cash Equivalents
All highly liquid investments with an original maturity of
three months or less
at the time of purchase are considered to be cash equivalents. Cash that is subject to legal restrictions or in unavailable for general operating purposes is classified as restricted cash and is included with in “Other current assets” in the Consolidated Balance Sheets. At December 29, 2018, the Company’s restricted cash balance was
$22,710
, which represents cash paid into the escrow account for the Bras N Things acquisition that closed in the first quarter of 2018.
(j) Accounts Receivable Valuation
Accounts receivable are stated at their net realizable value. The allowance for doubtful accounts reflects the Company’s best estimate of probable losses inherent in the accounts receivable portfolio determined on the basis of historical experience, aging of trade receivables, specific allowances for known troubled accounts and other currently available information.
(k) Inventory Valuation
Inventories are stated at the estimated lower of cost or market. Cost is determined by the first-in, first-out, or “FIFO,” method for inventories. Obsolete, damaged, and excess inventory is carried at the net realizable value, which is determined by assessing historical recovery rates, current market conditions and future marketing and sales plans. Rebates, discounts and other cash consideration received from a vendor related to inventory purchases are reflected as reductions in the cost of the related inventory item, and are therefore reflected in cost of sales when the related inventory item is sold.
(l) Property
Property is stated at historical cost and depreciation expense is computed using the straight-line method over the estimated useful lives of the assets. Machinery and equipment is depreciated over periods ranging from
three
to
15 years
and buildings and building improvements over periods of up to
40
years. A change in the depreciable life is treated as a change in accounting estimate and the accelerated depreciation is accounted for in the period of change and future periods. Additions and improvements that substantially extend the useful life of a particular asset and interest costs incurred during the construction period of major properties are capitalized. Repairs and maintenance costs are expensed as incurred. Upon sale or disposition of an asset, the cost and related accumulated depreciation are removed from the accounts.
Property is tested for recoverability whenever events or changes in circumstances indicate that its carrying value may not be recoverable. Such events include significant adverse changes in the business climate, several periods of operating or cash flow losses, forecasted continuing losses or a current expectation that an asset or an asset group will be disposed of before the end of its useful life. Recoverability of property is evaluated by a comparison of the carrying amount of an asset or asset group to future net undiscounted cash flows expected to be generated by the asset or asset group. If these comparisons indicate that an asset is not recoverable, the impairment loss recognized is the amount by which the carrying amount of the asset exceeds the estimated fair value. When an impairment loss is recognized for assets to be held and used, the adjusted carrying amount of those assets is depreciated over its remaining useful life. Restoration of a previously recognized impairment loss is not permitted under U.S. GAAP.
F-12
HANESBRANDS INC.
Notes to Consolidated Financial Statements — (Continued)
Years ended December 29, 2018, December 30, 2017 and December 31, 2016
(amounts in thousands, except per share data)
(m) Trademarks and Other Identifiable Intangible Assets
The primary identifiable intangible assets of the Company are trademarks, licensing agreements, customer and distributor relationships and computer software. Identifiable intangible assets with finite lives are amortized and those with indefinite lives are not amortized. The estimated useful life of a finite-lived intangible asset is based upon a number of factors, including the effects of demand, competition, expected changes in distribution channels and the level of maintenance expenditures required to obtain future cash flows. Trademarks with finite lives are being amortized over periods ranging from
ten
to
12 years
, license agreements are being amortized over periods ranging from
three
to
17 years
, customer and distributor relationships are being amortized over periods ranging from
one
to
15 years
and computer software and other intangibles are being amortized over periods ranging from
one
to
seven years
.
Identifiable intangible assets that are subject to amortization are evaluated for impairment using a process similar to that used in evaluating elements of property. Identifiable intangible assets not subject to amortization are assessed for impairment at least annually, as of the first day of the third fiscal quarter, and as triggering events occur. The impairment test for identifiable intangible assets not subject to amortization consists of comparing the fair value of the intangible asset to its carrying value. If the carrying value exceeds the fair value of the asset, an impairment loss is recognized in an amount equal to such excess. In assessing fair value, management relies on a number of factors to discount anticipated future cash flows including operating results, business plans and present value techniques. Rates used to discount cash flows are dependent upon interest rates and the cost of capital at a point in time. There are inherent uncertainties related to these factors and management’s judgment in applying them to the analysis of intangible asset impairment.
In connection with the Company’s annual impairment testing performed in the third quarter of 2018, it performed a quantitative assessment for each indefinite-lived asset. The tests indicate that the indefinite-lived intangible assets have fair values that exceeded their carrying amounts and no impairment of trademarks or other identifiable intangible assets was identified as a result of the testing conducted in 2018.
The Company capitalizes internal software development costs incurred during the application development stage, which include the actual costs to purchase software from vendors and generally include personnel and related costs for employees who were directly associated with the enhancement and implementation of purchased computer software. Additions to computer software are included in purchases of property, plant and equipment in the Consolidated Statements of Cash Flows.
(n) Goodwill
Goodwill is the amount by which the purchase price exceeds the fair value of the assets acquired and liabilities assumed in a business combination. When a business combination is completed, the assets acquired and liabilities assumed are assigned to the reporting unit or units of the Company given responsibility for managing, controlling and generating returns on these assets and liabilities. In many instances, all of the acquired assets and assumed liabilities are assigned to a single reporting unit and in these cases all of the goodwill is assigned to the same reporting unit. In those situations in which the acquired assets and liabilities are allocated to more than one reporting unit, the goodwill to be assigned to each reporting unit is determined in a manner similar to how the amount of goodwill recognized in a business combination is determined.
Goodwill is not amortized; however, it is assessed for impairment at least annually and as triggering events occur. The Company’s annual measurement date is the first day of the third fiscal quarter. In evaluating the recoverability of goodwill, the Company estimates the fair value of its reporting units and compares it to the carrying value. If the carrying value of the reporting unit exceeds its fair value, the next step of the process involves comparing the implied fair value to the carrying value of the goodwill of that reporting unit. If the carrying value of the goodwill of a reporting unit exceeds the implied fair value of that goodwill, an impairment loss is recognized in an amount equal to such excess.
No
impairment of goodwill was identified as a result of the testing conducted in
2018
. In estimating the fair values of the reporting units, management relies on a number of factors to discount anticipated future cash flows including operating results, business plans and present value techniques. Rates used to discount cash flows are dependent upon interest rates and the cost of capital at a point in time. There are inherent uncertainties related to these factors and management’s judgment in applying them to the analysis of goodwill impairment.
(o) Insurance Reserves
The Company is self-insured for property, workers’ compensation, medical and other casualty programs up to certain stop-loss limits. Undiscounted liabilities for self-insured exposures are accrued at the present value of the expected aggregate
F-13
HANESBRANDS INC.
Notes to Consolidated Financial Statements — (Continued)
Years ended December 29, 2018, December 30, 2017 and December 31, 2016
(amounts in thousands, except per share data)
losses below those limits and are based on a number of assumptions, including historical trends, actuarial assumptions and economic conditions.
(p) Stock-Based Compensation
The Company established the Hanesbrands Inc. Omnibus Incentive Plan (As Amended and Restated), (the “Omnibus Incentive Plan”) to award stock options, stock appreciation rights, restricted stock, restricted stock units, deferred stock units, performance shares and cash to its employees, non-employee directors and employees of its subsidiaries to promote the interests of the Company, incent performance and retention of employees. Stock-based compensation is estimated at the grant date based on the award’s fair value and is recognized as expense over the requisite service period. The Company estimates forfeitures for stock-based awards granted that are not expected to vest.
(q) Income Taxes
Deferred taxes are recognized for the future tax effects of temporary differences between financial and income tax reporting using tax rates in effect for the years in which the differences are expected to reverse. Given continuing losses in certain jurisdictions in which the Company operates on a separate return basis, a valuation allowance has been established for the deferred tax assets in these specific locations. The Company periodically estimates the probable tax obligations using historical experience in tax jurisdictions and informed judgment. There are inherent uncertainties related to the interpretation of tax regulations in the jurisdictions in which the Company transacts business. The judgments and estimates made at a point in time may change based on the outcome of tax audits, as well as changes to, or further interpretations of, regulations. Income tax expense is adjusted in the period in which these events occur, and these adjustments are included in the Company’s Consolidated Statements of Income. If such changes take place, there is a risk that the Company’s effective tax rate may increase or decrease in any period. A company must recognize the tax benefit from an uncertain tax position only if it is more likely than not that the tax position will be sustained on examination by the taxing authorities, based on the technical merits of the position. The tax benefits recognized in the financial statements from such a position are measured based on the largest benefit that has a greater than fifty percent likelihood of being realized upon ultimate resolution.
The recently enacted Tax Act significantly revised U.S. corporate income tax law by, among other things, reducing the corporate income tax rate to 21% and implementing a modified territorial tax system that included a one-time transition tax on deemed repatriated earnings foreign subsidiaries. The Company has completed the accounting for the enactment of the Tax Act based upon its current interpretation of the Tax Act in accordance with available notices and regulations issued and proposed by the U.S. Department of the Treasury and the Internal Revenue Service.
In addition, the Tax Act implemented a new minimum tax on GILTI. A company can elect an accounting policy to account for GILTI in either of the following ways:
|
•
|
As a period charge in the future period the tax arises; or
|
|
•
|
As part of deferred taxes related to the investment or subsidiary.
|
The Company has elected to account for GILTI as a period cost.
(r) Financial Instruments
The Company uses forward foreign exchange contracts to manage its exposures to movements in foreign exchange rates. The use of these financial instruments modifies the Company’s exposure to these risks with the goal of reducing the risk or cost to the Company. Depending on the nature of the underlying risk being hedged, these financial instruments are either designated as cash flow hedges or are economic hedges against changes in the value of the hedged item and therefore not designated as hedges for accounting purposes. The Company does not use derivatives for trading purposes and is not a party to leveraged derivative contracts.
On the date the derivative is entered into, the Company determines whether the derivative meets the criteria for cash flow hedge accounting treatment or whether the financial instrument is serving as an economic hedge against changes in the value of the hedged item and therefore is not designated as a hedge for accounting purposes. The accounting for changes in fair value of the derivative instrument depends on whether the derivative has been designated and qualifies as part of a hedging relationship.
The Company formally documents its hedge relationships, including identifying the hedging instruments and the hedged items, as well as its risk management objectives and strategies for undertaking the hedge transaction. This process includes
F-14
HANESBRANDS INC.
Notes to Consolidated Financial Statements — (Continued)
Years ended December 29, 2018, December 30, 2017 and December 31, 2016
(amounts in thousands, except per share data)
linking derivatives that are designated as hedges of specific assets, liabilities, firm commitments or forecasted transactions. The Company also formally assesses, both at inception and on a monthly basis thereafter, whether the derivatives that are used in hedging transactions are highly effective in offsetting changes in cash flows of the hedged item. If it is determined that a derivative ceases to be a highly effective hedge, or if the anticipated transaction is no longer likely to occur, the Company discontinues hedge accounting, and any deferred gains or losses are recorded in the “Selling, general and administrative expenses” line of the Consolidated Statements of Income.
Derivatives are recorded in the Consolidated Balance Sheets at fair value. The fair value is based upon either market quotes for actively traded instruments or independent bids for nonexchange traded instruments. Cash flows hedges are classified in the same category as the item being hedged, and cash flows from derivative contracts not designated as hedges are classified as cash flows from operating activities in the Consolidated Statements of Cash Flows.
The Company may be exposed to credit losses in the event of nonperformance by individual counterparties or the entire group of counterparties to the Company’s derivative contracts. Risk of nonperformance by counterparties is mitigated by dealing with highly rated counterparties and by diversifying across counterparties.
Cash Flow Hedges
The effective portion of the change in the fair value of a derivative that is designated as a cash flow hedge is recorded in the “Accumulated other comprehensive loss” line of the Consolidated Balance Sheets. When the hedged item affects the income statement, the gain or loss included in AOCI is reported on the same line in the Consolidated Statements of Income as the hedged item. In addition, both the changes in fair value excluded from the Company’s effectiveness assessments and the ineffective portion of the changes in the fair value of derivatives used as cash flow hedges are also reported in the same line in the Consolidated Statements of Income as the hedged item.
Derivative Contracts Not Designated as Hedges
For derivative contracts not designated as hedges, changes in fair value are reported in the “Selling, general and administrative expenses” line of the Consolidated Statements of Income. These contracts are recorded at fair value when the hedged item is recorded as an asset or liability and then are revalued each accounting period.
(s) Assets and Liabilities Acquired in Business Combinations
Business combinations are accounted for using the purchase method, which requires the Company to allocate the cost of an acquired business to the acquired assets and assumed liabilities based on their estimated fair values at the acquisition date. The Company recognizes the excess of an acquired business’ cost over the fair value of acquired assets and assumed liabilities as goodwill. Fair values are determined using the income approach based on market participant assumptions focusing on future cash flow projections and accepted industry standards.
(t) Recently Issued Accounting Pronouncements
Revenue from Contracts with Customers
In May 2014, the Financial Accounting Standards Board (“FASB”) issued ASU 2014-09, “Revenue from Contracts with Customers (Topic 606)”, a new accounting standard on revenue recognition that outlines a single comprehensive model for entities to use in accounting for revenue arising from contracts with customers. The FASB has subsequently issued updates to the standard to provide additional clarification on specific topics. The new standard was effective for the Company in the first quarter of 2018 and applied using a modified retrospective method. The Company has included enhanced disclosures related to disaggregation of revenue sources and accounting policies. The adoption of the new accounting rules did not have a material impact on the Company’s financial condition, results of operations or cash flows, but did result in additional disclosures regarding revenue recognition. Refer to Note, “Revenue Recognition.”
Statement of Cash Flows
In August 2016, the FASB issued ASU 2016-15, “Statement of Cash Flows (Topic 230): Classification of Certain Cash Receipts and Cash Payments”. Issues addressed in the new guidance that are relevant to the Company include debt prepayment and extinguishment costs, contingent consideration payments made after a business combination and beneficial interests in
F-15
HANESBRANDS INC.
Notes to Consolidated Financial Statements — (Continued)
Years ended December 29, 2018, December 30, 2017 and December 31, 2016
(amounts in thousands, except per share data)
securitization transactions. The new standard was effective for the Company in the first quarter of 2018. The adoption of the new accounting rules did not have a material impact on the Company’s cash flows.
In November 2016, the FASB issued ASU 2016-18, “Statement of Cash Flows (Topic 230): Restricted Cash (a consensus of the FASB Emerging Issues Task Force).” This standard requires that restricted cash and restricted cash equivalents be included in cash and cash equivalents when reconciling the beginning-of-period and end-of-period total amounts shown in the statement of cash flows. The Company adopted the provisions of ASU 2016-18 in the first quarter of 2018 using the retrospective transition method. The Company did not have restricted cash in prior periods; therefore, the adoption of the new guidance did not have an impact to previously reported cash flows. The Consolidated Statement of Cash Flows for the year ended
December 29, 2018
includes restricted cash of
$22,710
.
Retirement Benefits
In March 2017, the FASB issued ASU 2017-07, “Compensation - Retirement Benefits (Topic 715): Improving the presentation of net periodic pension cost and net periodic postretirement benefit cost”. The new rules require that an employer report the service cost component in the same line item or items as other compensation costs arising from services rendered by pertinent employees during the period. The other components of net benefit cost are required to be presented in the income statement separately from the service cost component and outside a subtotal of income from operations. The new standard was effective for the Company in the first quarter of 2018 and applied with retrospective treatment. Accordingly, the Company reclassified
$21,282
and
$14,402
from the “Selling, general and administrative expenses” line to the “Other expenses” line within the Consolidated Statements of Income for the years ended
December 30, 2017
and
December 31, 2016
, respectively. The adoption of the new accounting rules did not have a material impact on the Company’s financial condition, results of operations or cash flows.
In August 2018, the FASB issued ASU 2018-14, “Compensation - Retirement Benefits - Defined Benefit Plans - General (Subtopic 715-20).” The new rule expands disclosure requirements for employer sponsored defined benefit pension and other retirement plans. The new rules will be effective for the Company in the first quarter of 2020. The Company does not expect the new accounting rules to have a material impact on the Company’s financial condition, results of operations or cash flows, however expanded disclosure will be required.
Income Taxes
In October 2016, the FASB issued ASU 2016-16, “Income Taxes (Topic 740): Intra-Entity Transfers of Assets Other Than Inventory.” The new rules eliminate the exception for an intra-entity transfer of an asset other than inventory, which aligns the recognition of income tax consequences for such transfers. The new rules require the recognition of current and deferred income taxes resulting from these transfers when the transfer occurs rather than when it is sold to an external party. The Company adopted this new standard on December 31, 2017, using the modified retrospective method, however there was no net cumulative-effect adjustment recorded to retained earnings as of that date. Upon adoption, the Company recognized additional net deferred tax assets of approximately
$34,043
; however, a corresponding valuation allowance was recorded against these additional deferred tax assets as these deferred tax assets are not considered to be more likely than not realizable. As a result, the adoption of this new standard did not have a material impact on the Company’s financial condition, results of operations or cash flows.
In March 2018, the FASB issued ASU 2018-05, “Income Taxes (Topic 740).” The new rules amended SAB 118 to incorporate the impact of the Tax Act. The new standard was effective for the Company in the first quarter of 2018 and the impact was reflected in the Company’s tax related disclosures throughout the year. The Company has completed its accounting in the fourth quarter of 2018 in accordance with the rules set forth in SAB 118.
Definition of a Business
In January 2017, the FASB issued ASU 2017-01, “Business Combinations (Topic 805): Clarifying the Definition of a Business.” The new rules provide for the application of a screen test to consider whether substantially all the fair value of the assets acquired is concentrated in a single identifiable asset or a group of similar identifiable assets. If the screen test determines this to be true, the set is not a business. The new standard was effective for the Company in the first quarter of 2018. The adoption of the new accounting rules did not have a material impact on the Company’s financial condition, results of operations or cash flows.
F-16
HANESBRANDS INC.
Notes to Consolidated Financial Statements — (Continued)
Years ended December 29, 2018, December 30, 2017 and December 31, 2016
(amounts in thousands, except per share data)
Stock Compensation
In May 2017, the FASB issued ASU 2017-09, “Compensation - Stock Compensation (Topic 718): Scope of Modification Accounting”. The new rules provide guidance about which changes to the terms or conditions of a share-based payment award require an entity to apply modification accounting. Under the new rules, an entity should account for the effects of a modification unless the fair value, vesting conditions and classification of the modified award are the same as the original award immediately before the original award is modified. The new standard was effective for the Company in the first quarter of 2018. The adoption of the new accounting rules did not have a material impact on the Company’s financial condition, results of operations or cash flows.
Financial Instruments
In February 2018, the FASB issued ASU 2018-03, “Technical Corrections and Improvements to Financial Instruments - Overall (Subtopic 825-10).” The new rules clarify previously issued guidance regarding determination of the fair value of financial instruments. The new standard was effective for the Company in the third quarter of 2018. The adoption of the new accounting rules did not have a material impact on the Company’s financial condition, results of operations or cash flows.
Lease Accounting
In February 2016, the FASB issued ASU 2016-02, “Leases,” which will require lessees to recognize a right-of-use asset and a lease liability for all leases that are not short-term in nature. The standard will also result in enhanced quantitative and qualitative disclosures surrounding leases. The FASB has subsequently issued updates to the standard to provide clarification on specific topics, including adoption guidance and practical expedients. The new rules will be effective for the Company in the first quarter of 2019. The Company plans to adopt the new rules utilizing the modified retrospective method and will recognize any cumulative effect adjustment in retained earnings at the beginning of the period of adoption. The Company has established a cross-functional implementation team to analyze the impact and implement the new standard. The Company has collected relevant data in order to evaluate lease arrangements, assess potential embedded leases and evaluate accounting policy elections. The Company is also evaluating its processes and internal controls to identify any changes necessary as a result of the new rules. The Company has identified a global lease management and accounting software solution, which has been tested and implemented. The Company’s assessment of the quantitative impact is an estimate and subject to change as the Company finalizes implementation of the accounting guidance. The Company expects this adoption to result in material increases in assets between
$475,000
and
$525,000
and liabilities between
$500,000
and
$550,000
in its consolidated balance sheet, as well as enhanced disclosure regarding the Company’s lease obligations, but does not expect this adoption to have a material impact on the Company’s results of operations or cash flows.
Derivatives and Hedging
In August 2017, the FASB issued ASU 2017-12, “Derivatives and Hedging (Topic 815): Targeted Improvements to Accounting for Hedging Activities.” The new rules expand the hedging strategies that qualify for hedge accounting. The new rules also allow additional time to complete hedge effectiveness testing and allow qualitative assessments subsequent to initial quantitative tests if there is a supportable expectation that the hedge will remain highly effective. The new rules will be effective for the Company in the first quarter of 2019. The Company expects to adopt the new rules in the first quarter of 2019 and does not expect the adoption of the new accounting rules to have a material impact on the Company’s financial condition, results of operations or cash flows.
Comprehensive Income
In February 2018, the FASB issued ASU 2018-02, “Income Statement - Reporting Comprehensive Income (Topic 220): Reclassification of Certain Tax Effects from Accumulated Other Comprehensive Income.” The new rules allow a reclassification from accumulated other comprehensive income to retained earnings for stranded tax effects resulting from the Tax Act. The new rules will be effective for the Company in the first quarter of 2019. The Company is in the process of assessing the impact of the new accounting rules on the Company’s financial condition and does not expect the adoption of the new accounting rules to have a material impact on the Company’s results of operations or cash flows.
F-17
HANESBRANDS INC.
Notes to Consolidated Financial Statements — (Continued)
Years ended December 29, 2018, December 30, 2017 and December 31, 2016
(amounts in thousands, except per share data)
Codification Improvements
In July 2018, the FASB issued ASU 2018-09, “Codification Improvements.” The new rules clarify guidance around several subtopics by adopting enhanced verbiage to the following subtopics: reporting comprehensive income, debt modifications and extinguishments, distinguishing liabilities from equity, stock compensation, business combinations, derivatives and hedging, fair value measurement and defined contribution pension plans. Some of the amendments were effective upon issuance, none of which materially impacted the Company’s results of operations or cash flows. Many of the amendments will be effective for the Company in the first quarter of 2019. The Company does not expect the adoption of the new accounting rules to have a material impact on the Company’s results of operations or cash flows.
Goodwill Impairment
In January 2017, the FASB issued ASU 2017-04, “Intangibles - Goodwill and Other (Topic 350): Simplifying the Test for Goodwill Impairment”. The new rules simplify how an entity is required to test goodwill for impairment by eliminating Step 2 from the goodwill impairment test. Step 2 measures a goodwill impairment loss by comparing the implied fair value of a reporting unit’s goodwill with the carrying amount. The new rules will be effective for the Company in the first quarter of 2020. The Company does not expect the adoption of the new accounting rules to have a material impact on the Company’s financial condition, results of operations or cash flows.
Fair Value
In August 2018, the FASB issued ASU 2018-13, “Fair Value Measurement (Topic 820),” which modifies the disclosure requirements on fair value measurements. The new rules will be effective for the Company in the first quarter of 2020. The Company does not expect the adoption of the new accounting rules to have a material impact on the Company’s financial condition, results of operations or cash flows, however its disclosures will be impacted.
Internal-Use Software
In August 2018, the FASB issued ASU 2018-15, “Intangibles - Goodwill and Other - Internal-Use Software (Subtopic 340-40),” which aligns the requirements for capitalizing implementation costs incurred in a hosting arrangement that is a service contract with the requirements for capitalizing implementation costs incurred to develop or obtain internal-use software. The new rules will be effective for the Company in the first quarter of 2020. The Company does not expect the adoption of the new accounting rules to have a material impact on the Company’s financial condition, results of operations or cash flows.
Financial Instruments - Credit Losses
In June 2016, the FASB issued ASU 2016-13, “Financial Instruments - Credit Losses (Topic 326): Measurement of Credit Losses on Financial Instruments”, which require a financial asset measured at amortized cost basis to be presented at the net amount expected to be collected. The new rules eliminate the probable initial recognition threshold and, instead, reflect an entity’s current estimate of all expected credit losses. The new rules will be effective for the Company in the first quarter of 2020. The Company expects the new rules to apply to its trade receivables and standby letters of credit, but does not expect the adoption of the new accounting rules to have a material impact on the Company’s financial condition, results of operations or cash flows.
(u) Reclassifications
Certain prior year amounts in the notes to the Consolidated Financial Statements, none of which are material, have been reclassified to conform with the current year presentation. These classifications within the statements had no impact on the Company’s results of operations.
|
(3)
|
Revenue Recognition
|
On December 31, 2017, the Company adopted ASU 2014-09, “Revenue from Contracts with Customers (Topic 606)” (“Topic 606”) using the modified retrospective method applied to contracts which were pending as of December 31, 2017. Financial results included in the Company’s Consolidated Statement of Income for the year ended
December 29, 2018
are presented under Topic 606, while prior year amounts have not been restated and continue to be reported in accordance with
F-18
HANESBRANDS INC.
Notes to Consolidated Financial Statements — (Continued)
Years ended December 29, 2018, December 30, 2017 and December 31, 2016
(amounts in thousands, except per share data)
ASC 605, “Revenue Recognition” (“Topic 605”). As a result of adopting Topic 606, the Company did not adjust opening retained earnings.
Revenue is recognized when obligations under the terms of a contract with a customer are satisfied, which occurs at a point in time, upon either shipment or delivery to the customer. Revenue is measured as the amount of consideration the Company expects to receive in exchange for transferring goods, which includes estimates for variable consideration. Variable consideration includes trade discounts, rebates, volume-based incentives, cooperative advertising and product returns, which are offered within contracts between the Company and its customers, employing the practical expedient for contract costs. Incidental items that are immaterial to the context of the contract are recognized as expense at the transaction date.
The following table presents the Company’s revenues disaggregated by the customer’s method of purchase:
|
Year Ended
|
||||
|
December 29,
2018 |
||||
|
Third-party brick-and-mortar wholesale
|
$
|
5,288,966
|
|
|
|
Consumer-directed
|
1,514,989
|
|
||
|
Total net sales
|
$
|
6,803,955
|
|
|
Revenue Sources
Third-Party Brick-and-Mortar Wholesale Revenue
Third-party brick-and-mortar wholesale revenue is primarily generated by sales of the Company’s products to retailers to support their brick-and-mortar operations. Also included within third-party brick-and-mortar wholesale revenues is royalty revenue from licensing agreements. The Company earns royalties through license agreements with manufacturers of other consumer products that incorporate certain of the Company’s brands. The Company accrues revenue earned under these contracts based upon reported sales from the licensees.
Consumer-Directed Revenue
Consumer-directed revenue is primarily generated by sales driven directly by the consumer through company-operated stores and e-commerce platforms, which include both owned sites and the sites of the Company’s retail customers.
|
(4)
|
Acquisitions
|
Bras N Things
On February 12, 2018, the Company acquired
100%
of the outstanding equity of BNT Holdco Pty Limited (“Bras N Things”) for a total purchase price of
A$498,236
(U.S.
$391,572
), which included a cash payment of
A$428,956
(U.S.
$337,123
), an indemnification escrow of
A$31,988
(U.S.
$25,140
) and debt assumed of
A$34,280
(U.S.
$26,942
). During the year ended
December 29, 2018
, the purchase consideration was reduced by
A$3,012
(U.S.
$2,367
) due to the final working capital adjustment, which ultimately resulted in a revised purchase price of
A$495,224
(U.S.
$389,205
). U.S. dollar equivalents are based on acquisition date exchange rates.
The Company funded the acquisition with a combination of short-term borrowings under its existing revolving loan facility (the “Revolving Loan Facility”) and cash on hand. The indemnification escrow is held in a retention account for a period of 18 months after the date of the acquisition to secure indemnification claims or other obligations of the sellers under the purchase agreement. The remaining balance of the indemnification escrow, including interest earned, if any, will be paid to the sellers at the end of the 18 month period. The indemnification escrow, held in one of the Company’s bank accounts, is recognized and classified as restricted cash, with the balance as of
December 29, 2018
included in the “Other current assets” line of the Consolidated Balance Sheet.
Bras N Things contributed net revenues of
$122,399
and pretax earnings of
$27,514
(excluding acquisition and integration related charges of approximately
$6,948
) since the date of acquisition. The results of Bras N Things have been included in the Company’s consolidated financial statements since the date of acquisition and are reported as part of the International segment.
F-19
HANESBRANDS INC.
Notes to Consolidated Financial Statements — (Continued)
Years ended December 29, 2018, December 30, 2017 and December 31, 2016
(amounts in thousands, except per share data)
Bras N Things is a leading intimate apparel retailer that sells proprietary bras, panties and lingerie sets through a retail network of approximately
170
brick-and-mortar retail stores at acquisition date in Australia, New Zealand and South Africa. The Company believes this acquisition will create opportunities for expansion of the Bras N Things’ consumer-directed sales model. Factors that contribute to the amount of goodwill recognized for the acquisition include the value of entry into the outlet store sector, expansion of online presence, including the third-party marketplace, and expected synergies with existing Company functions. Goodwill associated with the acquisition is not tax deductible.
The
Bras N Things
trademark and brand name, which management believes to have an indefinite life, has been valued at
$275,071
. Amortizable intangible assets have been assigned values of
$2,358
for noncompete agreements and
$785
for customer lists. Noncompete agreements and the customer list are being amortized over
three
years.
The allocation of purchase price is preliminary and subject to change. The primary areas of the purchase price allocation that are not yet finalized are related to income taxes and residual goodwill. Accordingly, adjustments may be made to the values of the assets acquired and liabilities assumed as additional information is obtained about the facts and circumstances, which existed at the acquisition date. The acquired assets and liabilities as of the date of acquisition include the following:
|
Cash and cash equivalents
|
$
|
2,765
|
|
|
Accounts receivable, net
|
197
|
|
|
|
Inventories
|
9,610
|
|
|
|
Other current assets
|
1,637
|
|
|
|
Property, net
|
11,764
|
|
|
|
Trademarks and other identifiable intangibles
|
278,214
|
|
|
|
Deferred tax assets and other noncurrent assets
|
2,539
|
|
|
|
Total assets acquired
|
306,726
|
|
|
|
Accounts payable
|
4,929
|
|
|
|
Accrued liabilities and other
|
16,339
|
|
|
|
Deferred tax liabilities and other noncurrent liabilities
|
7,864
|
|
|
|
Total liabilities assumed
|
29,132
|
|
|
|
Net assets acquired
|
277,594
|
|
|
|
Goodwill
|
111,611
|
|
|
|
Total purchase price
|
$
|
389,205
|
|
Total purchase price of the Bras N Things acquisition consisted of the following components:
|
Cash consideration paid
|
$
|
337,123
|
|
|
Indemnification escrow asset
|
25,140
|
|
|
|
Debt assumed
|
26,942
|
|
|
|
Total purchase price
|
$
|
389,205
|
|
Since February 12, 2018, goodwill related to the Bras N Things acquisition decreased by
$1,013
as a result of measurement period adjustments, primarily related to working capital adjustments.
Unaudited pro forma results of operations for the Company are presented below assuming that the 2018 acquisition of Bras N Things had occurred on January 1, 2017. Pro forma operating results for the year ended
December 30, 2017
include expenses totaling
$317
, for acquisition-related adjustments primarily related to inventory and intangible assets.
|
Year Ended
|
||||||||
|
December 29,
2018 |
December 30,
2017 |
|||||||
|
Net sales
|
$
|
6,822,462
|
|
$
|
6,608,714
|
|
||
|
Net income from continuing operations
|
556,114
|
|
91,253
|
|
||||
|
Earnings per share from continuing operations:
|
||||||||
|
Basic
|
$
|
1.53
|
|
$
|
0.25
|
|
||
|
Diluted
|
1.53
|
|
0.25
|
|
||||
F-20
HANESBRANDS INC.
Notes to Consolidated Financial Statements — (Continued)
Years ended December 29, 2018, December 30, 2017 and December 31, 2016
(amounts in thousands, except per share data)
Hanes Australasia
On July 14, 2016, the Company acquired
100%
of the outstanding shares of Pacific Brands Limited (“Hanes Australasia”) for a total purchase price of A$
1,049,360
(U.S.
$800,871
). U.S. dollar equivalents are based on acquisition date exchange rates. The Company funded the acquisition through a combination of cash on hand, a portion of the net proceeds from the
3.5%
Senior Notes (as defined below) issued in June 2016 and borrowings under the Australian Term A-1 Loan Facility and the Australian Term A-2 Loan Facility.
The results of Hanes Australasia have been included in the Company’s consolidated financial statements since the date of acquisition and are reported as part of the International segment.
Hanes Australasia is a leading underwear and intimate apparel company in Australia with a portfolio of strong brands including
Bonds
, Australia’s top brand of underwear, babywear and socks, and
Berlei
, a leading sports bra brand and leading seller of premium bras in department stores. The Company believes the acquisition creates growth opportunities by adding to the Company’s portfolio of leading innerwear brands supported by the Company’s global low-cost supply chain and manufacturing network. Factors that contribute to the amount of goodwill recognized for the acquisition include the value of the existing work force and expected cost savings by utilizing the Company’s low-cost supply chain and expected synergies with existing Company functions. Goodwill associated with the acquisition is not tax deductible
Champion Europe
On June 30, 2016, the Company acquired
100%
of Champion Europe S.p.A. (“Champion Europe”), which owns the trademark for the
Champion
brand in Europe, the Middle East and Africa, from certain individual shareholders in an all-cash transaction valued at
€220,751
(U.S.
$245,554
) enterprise value less working capital adjustments as defined in the purchase agreement, which included
€40,700
(U.S.
$45,277
) in estimated contingent consideration. The final contingent consideration for the Champion Europe acquisition was determined to be
€64,250
(U.S.
$73,738
), of which
$37,820
(U.S.
$41,250
) was paid in April 2017 and
$26,430
(U.S.
$32,488
) was paid in February 2018. U.S. dollar equivalents are based on acquisition date or payment date exchange rates, as applicable. The Company funded the acquisition through a combination of cash on hand and borrowings under the
3.5%
Senior Notes issued in June 2016.
The results of Champion Europe have been included in the Company’s consolidated financial statements since the date of acquisition and are reported as part of the International segment.
The Company believes combining the
Champion
business creates a unified platform to benefit from the global consumer growth trend for active apparel. Factors that contribute to the amount of goodwill recognized for the acquisition include the value of the existing work force and expected cost savings by utilizing the Company’s low-cost supply chain and expected synergies with existing Company functions. Goodwill associated with the acquisition is not tax deductible.
Consolidated Pro Forma Results
Consolidated unaudited pro forma results of operations for the Company are presented below assuming that the 2016 acquisition of Hanes Australasia and Champion Europe had occurred on January 4, 2015. Pro forma operating results for the year ended
December 31, 2016
include expenses totaling
$9,560
, for acquisition-related adjustments primarily related to inventory and stock compensation.
|
Year Ended
|
|||
|
December 31,
2016 |
|||
|
Net sales
|
$
|
6,434,928
|
|
|
Net income from continuing operations
|
617,261
|
|
|
|
Earnings per share from continuing operations:
|
|||
|
Basic
|
$
|
1.62
|
|
|
Diluted
|
1.61
|
|
|
F-21
HANESBRANDS INC.
Notes to Consolidated Financial Statements — (Continued)
Years ended December 29, 2018, December 30, 2017 and December 31, 2016
(amounts in thousands, except per share data)
Pro forma financial information is not necessarily indicative of the Company’s actual results of operations if the acquisitions had been completed at the dates indicated, nor is it necessarily an indication of future operating results. Amounts do not include any operating efficiencies or cost savings that the Company believes are achievable.
Other Acquisitions
On October 13, 2017, the Company acquired
100%
of Alternative Apparel, Inc. (“Alternative Apparel”) from Rosewood Capital V, L.P. and certain individual shareholders in an all-cash transaction. Alternative Apparel sells the
Alternative
brand better basics T-shirts, fleece and other tops and bottoms.
Alternative
is a lifestyle brand known for its comfort, style and social responsibility. The Company believes this acquisition will create growth opportunities by supporting its Activewear growth strategy by expanding its market and channel penetration, including online, supported by the Company’s global low-cost supply chain and manufacturing network. Total consideration paid was
$62,094
. The Company funded the acquisition with cash on hand and short term borrowing under the Revolving Loan Facility. In connection with the acquisition, the Company recorded net working capital of
$18,517
, goodwill of
$23,716
, intangible assets of
$26,800
and other net liabilities of
$6,939
. The results of Alternative Apparel have been included in the Company’s consolidated financial statements since the date of the acquisition and are reported as part of the Activewear segment. Due to the immaterial nature of this acquisition, the Company has not provided additional disclosures herein.
|
(5)
|
Earnings Per Share
|
Basic earnings per share (“EPS”) was computed by dividing net income by the number of weighted average shares of common stock outstanding during the period. Diluted EPS was calculated to give effect to all potentially dilutive shares of common stock using the treasury stock method.
The reconciliation of basic to diluted weighted average shares outstanding is as follows:
|
|
Years Ended
|
|||||||
|
|
December 29,
2018 |
December 30,
2017 |
December 31,
2016 |
|||||
|
Basic weighted average shares outstanding
|
363,513
|
|
367,680
|
|
381,782
|
|
||
|
Effect of potentially dilutive securities:
|
||||||||
|
Stock options
|
801
|
|
1,435
|
|
1,983
|
|
||
|
Restricted stock units
|
186
|
|
307
|
|
756
|
|
||
|
Employee stock purchase plan and other
|
5
|
|
4
|
|
45
|
|
||
|
Diluted weighted average shares outstanding
|
364,505
|
|
369,426
|
|
384,566
|
|
||
Restricted stock units totaling
450
,
488
and
303
units were excluded from the diluted earnings per share calculation because their effect would be anti-dilutive for
2018
,
2017
, and
2016
, respectively. In
2018
,
2017
and
2016
, there were
no
anti-dilutive options to purchase shares of common stock.
|
(6)
|
Stock-Based Compensation
|
The Company established the Omnibus Incentive Plan to award stock options, stock appreciation rights, restricted stock, restricted stock units, deferred stock units, performance shares and cash to its employees, non-employee directors and employees of its subsidiaries to promote the interests of the Company, incent performance and retention of employees.
Stock Options
The exercise price of each stock option equals the closing market price of the Company’s stock on the date of grant. Options granted vest ratably over
three
years and can be exercised over a term of
10
years. The fair value of each option grant is estimated on the date of grant using the Black-Scholes option-pricing model. There were no options granted during any of the periods presented.
F-22
HANESBRANDS INC.
Notes to Consolidated Financial Statements — (Continued)
Years ended December 29, 2018, December 30, 2017 and December 31, 2016
(amounts in thousands, except per share data)
A summary of the changes in stock options outstanding to the Company’s employees under the Omnibus Incentive Plan is presented below:
|
Shares
|
Weighted-
Average Exercise Price |
Aggregate
Intrinsic Value |
Weighted-
Average Remaining Contractual Term (Years) |
|||||||||
|
Options outstanding at January 2, 2016
|
2,752
|
|
$
|
5.62
|
|
$
|
65,531
|
|
2.88
|
|||
|
Exercised
|
(477
|
)
|
5.90
|
|
|
|
||||||
|
Options outstanding at December 31, 2016
|
2,275
|
|
$
|
5.56
|
|
$
|
36,438
|
|
2.20
|
|||
|
Exercised
|
(736
|
)
|
6.22
|
|
|
|
||||||
|
Options outstanding at December 30, 2017
|
1,539
|
|
$
|
5.24
|
|
$
|
24,108
|
|
1.76
|
|||
|
Exercised
|
(756
|
)
|
3.92
|
|
|
|
||||||
|
Options outstanding and exercisable at December 29, 2018
|
783
|
|
$
|
6.51
|
|
$
|
4,449
|
|
1.54
|
|||
The total intrinsic value of options that were exercised during
2018
,
2017
and
2016
was
$6,242
,
$10,821
and
$7,465
respectively.
Stock Unit Awards
Restricted stock units (RSUs) of the Company’s stock are granted to certain Company non-employee directors and employees to incent performance and retention over periods of
one
to
three
years, respectively. Upon vesting, the RSUs are converted into shares of the Company’s common stock on a one-for-one basis and issued to the grantees. Some RSUs which have been granted under the Omnibus Incentive Plan vest upon continued future service to the Company, while others also have a performanced-based vesting feature. The cost of these awards is determined using the fair value of the shares on the date of grant, and compensation expense is recognized over the period during which the grantees provide the requisite service to the Company. A summary of the changes in the restricted stock unit awards outstanding under the Omnibus Incentive Plan is presented below:
|
Shares
|
Weighted-
Average Grant Date Fair Value |
Aggregate
Intrinsic Value |
Weighted-
Average Remaining Contractual Term (Years) |
|||||||||
|
Nonvested share units outstanding at January 2, 2016
|
2,833
|
|
$
|
23.99
|
|
$
|
83,381
|
|
1.78
|
|||
|
Granted — non-performanced based
|
748
|
|
23.44
|
|
|
|
||||||
|
Granted — performanced based
|
511
|
|
23.64
|
|
|
|
||||||
|
Vested
|
(1,525
|
)
|
19.47
|
|
|
|
||||||
|
Forfeited
|
(47
|
)
|
23.38
|
|
|
|
||||||
|
Nonvested share units outstanding at December 31, 2016
|
2,520
|
|
$
|
26.46
|
|
$
|
54,356
|
|
2.11
|
|||
|
Granted — non-performanced based
|
628
|
|
21.22
|
|
|
|
||||||
|
Granted — performanced based
|
590
|
|
23.04
|
|
|
|
||||||
|
Vested
|
(991
|
)
|
26.74
|
|
|
|
||||||
|
Forfeited
|
(81
|
)
|
26.81
|
|
|
|
||||||
|
Nonvested share units outstanding at December 30, 2017
|
2,666
|
|
$
|
24.36
|
|
$
|
55,741
|
|
2.00
|
|||
|
Granted — non-performanced based
|
970
|
|
15.52
|
|
|
|
||||||
|
Granted — performanced based
|
777
|
|
15.57
|
|
|
|
||||||
|
Vested
|
(1,114
|
)
|
27.55
|
|
|
|
||||||
|
Forfeited
|
(38
|
)
|
25.15
|
|
|
|
||||||
|
Nonvested share units outstanding at December 29, 2018
|
3,261
|
|
$
|
18.53
|
|
$
|
39,747
|
|
2.23
|
|||
The total fair value of shares vested during
2018
,
2017
and
2016
was
$30,701
,
$26,510
and
$29,705
, respectively. Certain participants elected to defer receipt of shares earned upon vesting.
F-23
HANESBRANDS INC.
Notes to Consolidated Financial Statements — (Continued)
Years ended December 29, 2018, December 30, 2017 and December 31, 2016
(amounts in thousands, except per share data)
In addition to granting RSUs that vest solely upon continued future service to the Company, the Company also grants performanced-based restricted stock units where the number of shares of the Company’s common stock that will be received upon vesting range from
0%
to
200%
of the number of units granted based on the Company’s achievement of certain performance metrics. These performanced-based stock awards, which are included in the table above, represent awards that are earned based on future performance and service. As reported in the above table, the number of performanced-based restricted stock units granted each year represents the initial units granted on the date of grant plus any additional units that were earned based on the final achievement of the respective performance thresholds.
For all share-based payments under the Omnibus Incentive Plan, during
2018
,
2017
and
2016
, the Company recognized total compensation expense of
$21,063
,
$23,224
and
$30,617
and recognized a deferred tax benefit of
$1,888
,
$6,085
and
$11,754
, respectively.
At
December 29, 2018
, there was
$12,501
of total unrecognized compensation cost related to non-vested stock-based compensation arrangements, of which
$8,845
,
$2,670
, and
$986
is expected to be recognized in
2019
,
2020
, and
2021
, respectively. The Company satisfies the requirement for common shares for share-based payments to employees pursuant to the Omnibus Incentive Plan by issuing newly authorized shares. The Omnibus Incentive Plan authorized
63,220
shares for awards of stock options and restricted stock units, of which
7,840
were available for future grants as of
December 29, 2018
.
|
(7)
|
Trade Accounts Receivable
|
Allowances for Trade Accounts Receivable
The changes in the Company’s allowance for doubtful accounts and allowance for chargebacks and other deductions are as follows:
|
Allowance
for Doubtful Accounts |
Allowance
for Chargebacks and Other Deductions (1) |
Total
|
|||||||||
|
Balance at January 2, 2016
|
$
|
3,749
|
|
$
|
9,351
|
|
$
|
13,100
|
|
||
|
Charged to expenses
|
3,650
|
|
19,820
|
|
23,470
|
|
|||||
|
Deductions and write-offs
|
(381
|
)
|
(16,259
|
)
|
(16,640
|
)
|
|||||
|
Currency translation
|
(360
|
)
|
(844
|
)
|
(1,204
|
)
|
|||||
|
Balance at December 31, 2016
|
$
|
6,658
|
|
$
|
12,068
|
|
$
|
18,726
|
|
||
|
Charged to expenses
|
6,642
|
|
16,169
|
|
22,811
|
|
|||||
|
Deductions and write-offs
|
(632
|
)
|
(18,264
|
)
|
(18,896
|
)
|
|||||
|
Currency translation
|
904
|
|
2,551
|
|
3,455
|
|
|||||
|
Balance at December 30, 2017
|
$
|
13,572
|
|
$
|
12,524
|
|
$
|
26,096
|
|
||
|
Charged to expenses
|
15,813
|
|
13,487
|
|
29,300
|
|
|||||
|
Deductions and write-offs
|
(8,893
|
)
|
(12,959
|
)
|
(21,852
|
)
|
|||||
|
Currency translation
|
(430
|
)
|
(510
|
)
|
(940
|
)
|
|||||
|
Balance at December 29, 2018
|
$
|
20,062
|
|
$
|
12,542
|
|
$
|
32,604
|
|
||
|
(1)
|
The balances presented herein reflect the prior year reclassification from the “Accounts Receivable” line as disclosed in Note, “Basis of Presentation.”
|
Charges to the allowance for doubtful accounts are reflected in the “Selling, general and administrative expenses” line and charges to the allowance for customer chargebacks and other customer deductions are primarily reflected as a reduction in the “Net sales” line of the Consolidated Statements of Income. Deductions and write-offs, which do not increase or decrease income, represent write-offs of previously reserved accounts receivable and allowed customer chargebacks and deductions against gross accounts receivable.
F-24
HANESBRANDS INC.
Notes to Consolidated Financial Statements — (Continued)
Years ended December 29, 2018, December 30, 2017 and December 31, 2016
(amounts in thousands, except per share data)
Sales of Accounts Receivable
The Company has entered into agreements to sell selected trade accounts receivable to financial institutions based on programs offered by certain of the Company’s largest customers. As a result of the strong credit worthiness of these customers, the discount taken on these programs is less than the marginal borrowing rate on the Company’s variable rate credit facilities. After the sale, the Company does not retain any interests in the receivables and the applicable financial institution services and collects these accounts receivable directly from the customer. Net proceeds of these accounts receivable sale programs are recognized in the Consolidated Statements of Cash Flows as part of operating cash flows. The Company recognized funding fees of
$9,566
,
$6,059
and
$4,497
in
2018
,
2017
and
2016
, respectively, for sales of accounts receivable to financial institutions in the “Other expenses” line in the Consolidated Statements of Income. The increase in funding fees in 2018 compared to 2017 was primarily due to the increase in LIBOR during 2018, which resulted in higher funding fees of
$2,897
.
|
(8)
|
Inventories
|
Inventories consisted of the following:
|
December 29,
2018 |
December 30,
2017 |
||||||
|
Raw materials
|
$
|
107,300
|
|
$
|
129,287
|
|
|
|
Work in process
|
182,966
|
|
226,659
|
|
|||
|
Finished goods
|
1,764,192
|
|
1,519,044
|
|
|||
|
$
|
2,054,458
|
|
$
|
1,874,990
|
|
||
|
(9)
|
Property, Net
|
Property is summarized as follows:
|
December 29,
2018 |
December 30,
2017 |
||||||
|
Land
|
$
|
44,980
|
|
$
|
45,882
|
|
|
|
Buildings and improvements
|
500,366
|
|
486,893
|
|
|||
|
Machinery and equipment
|
1,095,413
|
|
1,063,661
|
|
|||
|
Construction in progress
|
34,643
|
|
33,922
|
|
|||
|
Capital leases
|
2,123
|
|
7,133
|
|
|||
|
1,677,525
|
|
1,637,491
|
|
||||
|
Less accumulated depreciation
|
1,069,837
|
|
1,013,500
|
|
|||
|
Property, net
|
$
|
607,688
|
|
$
|
623,991
|
|
|
Property, plant and equipment expenditures included in accounts payable at
December 29, 2018
,
December 30, 2017
and
December 31, 2016
was
$20,275
,
$11,285
and
$9,646
, respectively.
|
(10)
|
Notes Payable
|
The Company had short-term revolving facilities in the following locations at
December 29, 2018
and
December 30, 2017
:
|
|
Interest
Rate as of December 29, 2018 |
Principal Amount
|
|||||||
|
December 29,
2018 |
December 30,
2017 |
||||||||
|
Europe
|
Various
|
$
|
5,824
|
|
$
|
10,072
|
|
||
|
Philippines
|
—%
|
—
|
|
1,801
|
|
||||
|
$
|
5,824
|
|
$
|
11,873
|
|
||||
As of
December 29, 2018
and
December 30, 2017
, the Company had total borrowing availability of
$158,135
and
$133,708
, respectively, under its international notes payable facilities. Total interest paid on notes payable was
$1,579
,
$364
F-25
HANESBRANDS INC.
Notes to Consolidated Financial Statements — (Continued)
Years ended December 29, 2018, December 30, 2017 and December 31, 2016
(amounts in thousands, except per share data)
and
$1,103
in
2018
,
2017
and
2016
, respectively. The Company was in compliance with the financial covenants contained in each of the facilities at
December 29, 2018
.
|
(11)
|
Debt
|
The Company had the following debt at
December 29, 2018
and
December 30, 2017
:
|
|
Interest
Rate as of December 29, 2018 |
Principal Amount
|
|
||||||||
|
December 29,
2018 |
December 30,
2017 |
Maturity Date
|
|||||||||
|
Senior Secured Credit Facility:
|
|||||||||||
|
Revolving Loan Facility
|
—
|
$
|
—
|
|
$
|
—
|
|
December 2022
|
|||
|
Term Loan A
|
3.87%
|
721,875
|
|
750,000
|
|
December 2022
|
|||||
|
Term Loan B
|
4.10%
|
496,250
|
|
500,000
|
|
December 2024
|
|||||
|
Australian Term A-1
|
3.42%
|
122,968
|
|
135,826
|
|
July 2019
|
|||||
|
Australian Revolving Loan Facility
|
2.30%
|
21,118
|
|
—
|
|
July 2021
|
|||||
|
4.875% Senior Notes
|
4.88%
|
900,000
|
|
900,000
|
|
May 2026
|
|||||
|
4.625% Senior Notes
|
4.63%
|
900,000
|
|
900,000
|
|
May 2024
|
|||||
|
3.5% Senior Notes
|
3.50%
|
572,213
|
|
599,649
|
|
June 2024
|
|||||
|
European Revolving Loan Facility
|
1.50%
|
113,520
|
|
81,539
|
|
September 2019
|
|||||
|
Accounts Receivable Securitization Facility
|
3.36%
|
161,608
|
|
125,209
|
|
March 2019
|
|||||
|
Other International Debt
|
Various
|
1
|
|
1,044
|
|
Various
|
|||||
|
4,009,553
|
|
3,993,267
|
|
||||||||
|
Less long-term debt issuance costs
|
34,774
|
|
41,624
|
|
|||||||
|
Less current maturities
(1)
|
440,596
|
|
249,589
|
|
|||||||
|
$
|
3,534,183
|
|
$
|
3,702,054
|
|
||||||
|
(1)
|
Current maturities excludes
$12
of short-term debt issuance costs.
|
The Company’s primary financing arrangements are the senior secured credit facility (the “Senior Secured Credit Facility”),
4.875%
senior notes (the “
4.875%
Senior Notes”),
4.625%
senior notes (the “
4.625%
Senior Notes”),
3.5%
senior notes (the “
3.5%
Senior Notes”), the Accounts Receivable Securitization Facility and the European Revolving Loan Facility. The outstanding balances at
December 29, 2018
are reported in the “Current portion of long-term debt”, “Long-term debt” and “Accounts Receivable Securitization Facility” lines of the Consolidated Balance Sheets.
Total cash paid for interest related to debt in
2018
,
2017
and
2016
was
$177,717
,
$164,716
and
$130,603
, respectively.
Senior Secured Credit Facility
On December 15, 2017, the Company refinanced its Senior Secured Credit Facility to extend the maturity date of the Revolving Loan Facility to December 2022 and re-price at more favorable rates, extend the maturity date of the Term Loan A to December 2022 and re-price at more favorable rates, extend the maturity date of the Term Loan B to December 2024 and re-price at more favorable rates, and add an additional
$325,750
in term loan borrowings (
$144,375
for Term Loan A and
$181,375
for Term Loan B). The Company incurred
$11,935
in fees related to this refinancing. The proceeds of the Term Loan A and the Term Loan B were used to pay down existing borrowings under the Senior Secured Credit Facility and pay fees and expenses in connection with the closing of the Senior Secured Credit Facility. Proceeds of the Revolving Loan Facility are used for general corporate purposes and working capital needs.
All borrowings under the Revolving Loan Facility must be repaid in full upon maturity.
Outstanding borrowings under the Term Loan A are repayable in
1.25%
quarterly installments, with the remainder of the outstanding principal to be repaid at maturity.
Outstanding borrowings under the Term Loan B are repayable in
0.25%
quarterly installments, with the remainder of the outstanding principal to be repaid at maturity.
F-26
HANESBRANDS INC.
Notes to Consolidated Financial Statements — (Continued)
Years ended December 29, 2018, December 30, 2017 and December 31, 2016
(amounts in thousands, except per share data)
A portion of the Revolving Loan Facility is available for the issuances of letters of credit and the making of swingline loans, and any such issuance of letters of credit or making of a swingline loan will reduce the amount available under the Revolving Loan Facility. At the Company’s option, it may add one or more term loan facilities or increase the commitments under the Revolving Loan Facility so long as certain conditions are satisfied, including, among others, that no default or event of default is in existence, that the Company is in pro forma compliance with the financial covenants described below and that the Company’s senior secured leverage ratio is less than
3.50
to 1 on a pro forma basis after giving effect to the incurrence of such indebtedness. As of
December 29, 2018
, the Company had
$4,335
of standby and trade letters of credit issued and outstanding under the Revolving Loan Facility and
$995,665
of borrowing availability.
The Senior Secured Credit Facility is guaranteed by substantially all of the Company’s existing and future direct and indirect U.S. subsidiaries, with certain customary or agreed-upon exceptions for foreign subsidiaries and certain other subsidiaries. The Company and each of the guarantors under the Senior Secured Credit Facility have granted the lenders under the Senior Secured Credit Facility a valid and perfected first priority (subject to certain customary exceptions) lien and security interest in the following:
|
•
|
the equity interests of substantially all of the Company’s direct and indirect U.S. subsidiaries (other than U.S. subsidiaries directly or indirectly owned by foreign subsidiaries) and 65% of the voting securities of certain first tier foreign subsidiaries; and
|
|
•
|
substantially all present and future property and assets, real and personal, tangible and intangible, of the Company and each guarantor, except for certain enumerated interests, and all proceeds and products of such property and assets.
|
The Term Loan A and the Term Loan B require the Company and its subsidiary MFB International Holdings, as applicable, to prepay any outstanding term loans in connection with (i) the incurrence of certain indebtedness and (ii) non-ordinary course asset sales or other dispositions (including as a result of casualty or condemnation) that exceed certain thresholds in any period of twelve-consecutive months, with customary reinvestment provisions. The Term Loan B also requires the Company and MFB International Holdings, as applicable, to prepay any outstanding term loans under the Term Loan B in connection with excess cash flow, which percentage will be based upon the Company’s leverage ratio during the relevant fiscal period. All such prepayments will be made on a pro rata basis under each of the applicable term loans that are subject to such prepayments.
Borrowings under the Revolving Loan Facility, the Term Loan A and the Term Loan B bear interest based on the LIBOR rate or the “base rate” plus, in each case, an applicable margin. The applicable margin for the Revolving Loan Facility and the Term Loan A is determined by reference to a leverage-based pricing grid set forth in the Senior Secured Credit Facility, ranging from a maximum of
2.00%
in the case of LIBOR-based loans and
1.00%
in the case of Base Rate loans if the Company’s leverage ratio is greater than or equal to
4.50
to 1.00, and will step down in
0.25%
increments to a minimum of
1.00%
in the case of LIBOR-based loans and
0.00%
in the case of Base Rate loans if the Company’s leverage ratio is less than
2.25
to 1.00. The applicable margin under the Term Loan B is
1.75%
in the case of LIBOR-based loans and
0.75%
in the case of Base Rate loans.
The Senior Secured Credit Facility requires the Company to comply with customary affirmative, negative and financial covenants. The Senior Secured Credit Facility requires that the Company maintain a minimum interest coverage ratio and a maximum total debt to EBITDA (earnings before interest, income taxes, depreciation expense and amortization, as computed pursuant to the Senior Secured Credit Facility), or leverage ratio. The interest coverage ratio covenant requires that the ratio of the Company’s EBITDA for the preceding four fiscal quarters to its consolidated total interest expense for such period shall not be less than
3.00
to 1.00 for each fiscal quarter. The leverage ratio covenant requires that the ratio of the Company’s total debt to EBITDA for the preceding four fiscal quarters will not be more than
4.50
to 1.00 for each fiscal quarter provided that, following a permitted acquisition in which the consideration is at least
$200,000
, such maximum leverage ratio covenant shall be increased to
5.00
to 1.00 for each fiscal quarter ending in the succeeding 12-month period following such permitted acquisition. The method of calculating all of the components used in the covenants is included in the Senior Secured Credit Facility.
In addition, the commitment fee for the unused portion of revolving loan commitments made by the lenders is between 25 and 40 basis points based on the applicable commitment fee margin in effect from time to time. When the leverage ratio (as defined in the Senior Secured Credit Facility) is greater than or equal to
4.50
to 1.00, the commitment fee margin is
0.400%
.
F-27
HANESBRANDS INC.
Notes to Consolidated Financial Statements — (Continued)
Years ended December 29, 2018, December 30, 2017 and December 31, 2016
(amounts in thousands, except per share data)
When the leverage ratio is less than
4.50
to 1.00 but greater than or equal to
3.00
to 1.00, the applicable commitment fee margin is
0.300%
. When the leverage ratio is less than
3.00
to 1.00, the applicable commitment fee margin is
0.250%
.
The Senior Secured Credit Facility contains customary events of default, including nonpayment of principal when due; nonpayment of interest, fees or other amounts after stated grace period; material inaccuracy of representations and warranties; violations of covenants; certain bankruptcies and liquidations; any cross-default to material indebtedness; certain material judgments; certain events related to the ERISA, actual or asserted invalidity of any guarantee, security document or subordination provision or non-perfection of security interest, and a change in control (as defined in the Senior Secured Credit Facility). As of
December 29, 2018
, the Company was in compliance with all financial covenants.
Senior Notes Refinancing
In 2016, the Company refinanced its debt structure to reduce interest rates, increase borrowing capacity, increase the proportion of fixed rate debt and fund a portion of the acquisitions of Champion Europe and Hanes Australasia. The refinancing: (i) issued
$900,000
aggregate principal amount of the
4.875%
Senior Notes due 2026 (the “4.875% Senior Notes”),
$900,000
aggregate principal amount of the
4.625%
Senior Notes due 2024 (the “4.625% Senior Notes”), and
€500,000
aggregate principal amount of the
3.5%
Senior Notes due 2024 (the “3.5% Senior Notes”); (ii) redeemed in full the Company’s
6.375%
Senior Notes due 2020; and (iii) repaid a portion of the indebtedness outstanding under the Revolving Loan Facility.
The refinancing activity resulted in the incurrence of
$39,523
in capitalized debt issuance costs for the new series of senior notes, each of which is discussed in more detail below. Debt issuance costs are amortized to interest expense over the respective lives of the debt instruments, which ranged from
eight
to
10 years
.
4.875%
Senior Notes and
4.625%
Senior Notes
On May 6, 2016, the Company issued
$900,000
aggregate principal amount of
4.875%
Senior Notes and
$900,000
aggregate principal amount of
4.625%
Senior Notes (collectively, the “USD Senior Notes”), with interest payable on May 15 and November 15 of each year. The
4.875%
Senior Notes will mature on May 15, 2026 and the
4.625%
Senior Notes will mature on May 15, 2024. The sale of the USD Senior Notes resulted in aggregate net proceeds from the sale of approximately
$1,773,000
, which were used to repay all outstanding borrowings under the
6.375%
Senior Notes and reduce the outstanding borrowings under the Revolving Loan Facility.
On or after February 15, 2026, in the case of the
4.875%
Senior Notes, and February 15, 2024, in the case of the
4.625%
Senior Notes, the Company may redeem all or a portion of such notes at a price equal to
100%
of the principal amount, plus
a
ny accrued and unpaid interest.
The USD Senior Notes are senior unsecured obligations of the Company and are fully and unconditionally guaranteed, subject to certain exceptions, by substantially all of the Company’s current domestic subsidiaries. The indenture governing the USD Senior Notes limits the ability of the Company and its subsidiaries to incur liens, enter into certain sale and leaseback transactions and consolidate, merge or sell all or substantially all of their assets. The indenture also contains customary events of default which include (subject in certain cases to customary grace and cure periods), among others, nonpayment of principal or interest; breach of other agreements in such indenture; failure to pay certain other indebtedness; failure to pay certain final judgments; failure of certain guarantees to be enforceable; and certain events of bankruptcy or insolvency.
The USD Senior Notes were issued in a transaction exempt from registration under the Securities Act and do not require disclosure of separate financial information for the guarantor subsidiaries.
3.5%
Senior Notes
On June 3, 2016, the Company issued
€500,000
aggregate principal amount of
3.5%
Senior Notes, with interest payable on June 15 and December 15 of each year. The 3.5% Senior Notes will mature on June 15, 2024. The sale of the 3.5% Senior Notes resulted in net proceeds of approximately
€492,500
, which were used to fund a portion of the acquisition of Champion Europe and Hanes Australasia.
On or after March 15, 2024, the Company may redeem all or a portion of the
3.5%
Senior Notes at a price equal to
100%
of the principal amount, plus any accrued and unpaid interest. The Company may also redeem all, but not less than all, of the 3.5% Senior Notes upon the occurrence of certain changes in applicable tax law.
F-28
HANESBRANDS INC.
Notes to Consolidated Financial Statements — (Continued)
Years ended December 29, 2018, December 30, 2017 and December 31, 2016
(amounts in thousands, except per share data)
The
3.5%
Senior Notes are senior unsecured obligations of the Company and are fully and unconditionally guaranteed, subject to certain exceptions, by the Company and certain of its subsidiaries that guarantee the Company’s Euro Term Loan facility, which was paid in full in August 2016, under the Company’s Senior Secured Credit Facility. The indenture governing the
3.5%
Senior Notes limits the ability of the Company and each of the guarantors of the Notes (including the Company) to incur certain liens, enter into certain sale and leaseback transactions and consolidate, merge or sell all or substantially all of their assets. The indenture also contains customary events of default which include (subject in certain cases to customary grace and cure periods), among others, nonpayment of principal or interest; breach of other agreements in the indenture; failure to pay certain other indebtedness; certain events of bankruptcy, insolvency or reorganization; failure to pay certain final judgments; and failure of certain guarantees to be enforceable.
The
3.5%
Senior Notes were issued in a transaction exempt from registration under the Securities Act and do not require disclosure of separate financial information for the guarantor subsidiaries.
Australian Term A-1 and Australian Revolver
On July 4, 2016, the Company established a floating rate A$
200,000
Australian Term A-1 Loan Facility (the “Australian Term A-1”) with interest payable every three or six months. The Australian Term A-1 matures on July 7, 2019. On July 15, 2016, the Company established the Australian Revolving Facility (the “Australian Revolver”) in the amount of A$
65,000
with interest payable at a variable rate. The Australian Revolver is comprised of a bilateral cash advance of A
$50,000
, a bank overdraft of A
$10,000
and a bank guarantee of A
$5,000
. The Australian Revolver will mature on July 15, 2021. The Australian Term A-1 and Australian Revolver interest rates are based on the Bank Bill Swap Bid Rate (“BBSY”) plus an applicable margin which is driven by the Company’s debt rating.
The Australian Term A-1 was issued to help fund the Hanes Australasia acquisition while the Revolver is utilized for future working capital requirements. The Australian Term A-1 and Australian Revolver were established under the Company’s Syndicated Facility, a joinder to the Company’s Senior Secured Credit Facility.
The Syndicated Facility Agreement requires the Company to prepay any outstanding Term Loans in connection with (i) the incurrence of certain indebtedness and (ii) non-ordinary course asset sales or other dispositions (including as a result of casualty or condemnation) that exceed certain thresholds in any period of twelve consecutive months, with customary reinvestment provisions. The Syndicated Facility Agreement also requires the Company, and certain of its subsidiary guarantors, as applicable, to prepay any outstanding Term Loans in connection with excess cash flow, which amount will be based upon the Company’s leverage ratio during the relevant fiscal period. All such prepayments will be made on a pro rata basis under each of the applicable Term Loan Facilities that are subject to such prepayments.
Under the terms of the Syndicated Facility Agreement, the leverage ratio covenant requires that the ratio of the Company’s total debt to EBITDA for the preceding four fiscal quarters will not be more than
4.50
to 1.00 for each fiscal quarter provided that, following a permitted acquisition in which the consideration is at least
$200,000
, the maximum leverage ratio covenant increases to
5.00
to 1.00 for each fiscal quarter in the succeeding 12-month period following such permitted acquisition.
There were no letters of credit issued and outstanding under the Australian Revolving Loan Facility at
December 29, 2018
, and the Company had
$21,118
of borrowing availability.
European Revolving Loan Facility
On September 9, 2016, the Company established a
€100,000
European Revolving Loan Facility. Proceeds from the European Revolving Loan Facility were used to refinance existing debt for Hanes Europe Innerwear and will be used for future working capital requirements. In September 2018, the Company amended the European Revolving Loan Facility primarily to extend the maturity date to September 2019.
The Company may from time to time voluntarily prepay the European Revolving Loan Facility in whole or in part without a premium or penalty provided that among other items, principal payments be made in amounts of
€5,000
or in whole multiple of
€1,000
in excess thereof. Any prepayment of principal shall be accompanied by all accrued interest on the amount prepaid.
F-29
HANESBRANDS INC.
Notes to Consolidated Financial Statements — (Continued)
Years ended December 29, 2018, December 30, 2017 and December 31, 2016
(amounts in thousands, except per share data)
Interest under the European Revolving Credit Facility is calculated using LIBOR for Euro with a
zero
floor plus a 150 basis point margin. Interest is based on the outstanding principal amount for each interest period from the applicable borrowing date at a rate per annum equal to the Eurocurrency Rate for such interest period plus the applicable rate.
At
December 29, 2018
, the Company had
no
borrowing availability, taking into account the outstanding balance at the end of the year.
Accounts Receivable Securitization Facility
Borrowings under the Accounts Receivable Securitization Facility are permitted only to the extent that the face of the receivables in the collateral pool, net of applicable reserves and other deductions, exceeds the outstanding loans and also subject to a fluctuating facility limit, not to exceed
$225,000
. The Company’s maximum borrowing capacity under the Accounts Receivable Securitization Facility was
$225,000
as of December 29, 2018, however based on the outstanding borrowings and net eligible receivables balance within the collateral pool, the Accounts Receivable Securitization Facility was fully utilized as of December 29, 2018. Under the terms of the Accounts Receivable Securitization Facility, the Company and certain of its subsidiaries sell, on a revolving basis, certain domestic trade receivables to HBI Receivables LLC (“Receivables LLC”), a wholly owned bankruptcy-remote subsidiary that in turn uses the trade receivables to secure the borrowings, which are funded through conduits and financial institutions that are not affiliated with the Company. The commitments of any conduits party to the Accounts Receivable Securitization Facility are funded through the issuance of commercial paper in the short-term market or through committed bank purchasers if the conduits fail to fund. The assets and liabilities of Receivables LLC are fully reflected on the Consolidated Balance Sheet, and the securitization is treated as a secured borrowing for accounting purposes, but the assets of Receivables LLC will be used first to satisfy the creditors of Receivables LLC, not the Company’s creditors. The borrowings under the Accounts Receivable Securitization Facility remain outstanding throughout the term of the agreement subject to the Company maintaining sufficient eligible receivables, by continuing to sell trade receivables to Receivables LLC, unless an event of default occurs. In March 2018, the Company amended the Accounts Receivable Securitization Facility primarily to extend the termination date to March 2019. In June 2018, the Company amended the Accounts Receivable Securitization Facility to remove certain receivables from being pledged as collateral for the facility and reduce the maximum availability to
$225,000
. In September 2018, the Company amended the Accounts Receivable Securitization Facility to remove certain additional receivables from being pledged as collateral for the facility.
Availability of funding under the Accounts Receivable Securitization Facility depends primarily upon the eligible outstanding receivables balance. The outstanding balance under the Accounts Receivable Securitization Facility is reported on the Consolidated Balance Sheet in the line “Accounts Receivable Securitization Facility.” In the case of any creditors party to the Accounts Receivable Securitization Facility that are conduits, unless the conduits fail to fund, the yield on the commercial paper, which is the conduits’ cost to issue the commercial paper plus certain dealer fees, is considered a financing cost and is included in interest expense on the Consolidated Statement of Income. If the conduits fail to fund, the Accounts Receivable Securitization Facility would be funded through committed bank purchasers, and the interest rate would be payable at the Company’s option at the rate announced from time to time by HSBC Bank USA, N.A. as its prime rate or at the LIBO Rate (as defined in the Accounts Receivable Securitization Facility) plus the applicable margin in effect from time to time. In the case of borrowings from any other creditors party to the Accounts Receivable Securitization Facility that are not conduits or their related committed bank purchasers, the interest rate is payable at the LIBO Rate (as defined in the Accounts Receivable Securitization Facility) or, if this rate is unavailable or otherwise does not accurately reflect the costs to these creditors related to the borrowings, the prime rate. These amounts are also considered financing costs and are included in interest expense on the Consolidated Statement of Income. In addition, HBI Receivables LLC is required to make certain payments to a conduit purchaser, a committed purchaser, or certain entities that provide funding to or are affiliated with them, in the event that assets and liabilities of a conduit purchaser are consolidated for financial and/or regulatory accounting purposes with certain other entities.
The Accounts Receivable Securitization Facility contains customary events of default and requires the Company to maintain the same interest coverage ratio and leverage ratio contained from time to time in the Senior Secured Credit Facility, provided that any changes to such covenants will only be applicable for purposes of the Accounts Receivable Securitization Facility if approved by the managing agents or their affiliates. As of
December 29, 2018
, the Company was in compliance with all financial covenants.
The total amount of receivables used as collateral for the credit facility was
$161,608
at
December 29, 2018
and is reported on the Company’s Consolidated Balance Sheet in “Trade accounts receivable, net.”
F-30
HANESBRANDS INC.
Notes to Consolidated Financial Statements — (Continued)
Years ended December 29, 2018, December 30, 2017 and December 31, 2016
(amounts in thousands, except per share data)
Future Principal Payments
Future principal payments for all of the facilities described above are as follows:
$440,596
due in
2019
,
$53,126
due in
2020
,
$63,618
due in
2021
,
$605,000
due in
2022
,
$5,000
due in
2023
and
$2,842,213
due thereafter.
Debt Issuance Costs
During 2018, 2017 and 2016, the Company incurred
$677
,
$9,130
and
$45,065
, respectively, in capitalized debt issuance costs in connection with the amendments to the Senior Secured Credit Facility, the Accounts Receivable Securitization Facility, issuance of new Senior Notes, the Australian Revolving Loan Facility, the Australian Accounts Receivable Securitization Facility and the European Revolving Loan Facility. Debt issuance costs are amortized to interest expense over the respective lives of the debt instruments, which range from
one
to
10
years. As of
December 29, 2018
, the net carrying value of unamortized debt issuance costs for the revolving loan facilities, which is included in “Other Noncurrent Assets” in the Consolidated Balance Sheet, was
$8,459
and the net carrying value of unamortized debt issuance costs for the remainder of the Company’s debt, is included in “Long-term debt” in the Consolidated Balance Sheet was
$34,774
. The Company’s debt issuance cost amortization was
$9,278
,
$10,394
and
$9,034
in
2018
,
2017
and
2016
, respectively.
The Company recognizes charges in the “Other expenses” line of the Consolidated Statements of Income for fees incurred in financing transactions such as refinancing, amendments and write-offs incurred in the early extinguishment of debt. In 2018, the Company did not recognize any charges for acceleration of unamortized debt issuance costs. In 2017, the Company recognized charges of
$380
for acceleration of unamortized debt costs related to the Euro Term Loan,
$1,909
for the Australian Term Loans, and
$1,739
for the Refinancing of the U.S. Term Loans. In 2016, the Company recognized charges of
$873
for acceleration of unamortized debt costs related to the Euro Term Loan, which was paid in full in August 2016. In 2016, the Company recognized charges of
$47,291
for acceleration of unamortized debt costs related to the redemption of the
6.375%
Senior Notes.
|
(12)
|
Commitments and Contingencies
|
The Company is a party to various pending legal proceedings, claims and environmental actions by government agencies. In accordance with the accounting rules for contingencies, the Company records a provision with respect to a claim, suit, investigation or proceeding when it is probable that a liability has been incurred and the amount of the loss can reasonably be estimated. Any provisions are reviewed at least quarterly and are adjusted to reflect the impact and status of settlements, rulings, advice of counsel and other information pertinent to the particular matter. The recorded liabilities for these items were not material to the consolidated financial statements of the Company in any of the years presented. Although the outcome of such items cannot be determined with certainty, the Company’s legal counsel and management are of the opinion that the final outcome of these matters will not have a material adverse impact on the consolidated financial position, results of operations or liquidity.
Purchase Commitments
In the ordinary course of business, the Company has entered into purchase commitments for raw materials, production and finished goods. These agreements, typically with terms ending within a year, require total payments of
$491,152
in
2019
,
$3,998
in
2020
and
$4,198
in
2021
.
Operating Leases
The Company leases certain buildings and equipment under agreements that are classified as operating leases. Rental expense under operating leases was
$185,696
,
$184,603
and
$132,128
in
2018
,
2017
and
2016
, respectively.
Future minimum lease payments under noncancelable operating leases (with initial or remaining lease terms in excess of one year) are as follows:
$148,218
in
2019
,
$129,660
in
2020
,
$110,185
in
2021
,
$91,411
in
2022
,
$66,753
in
2023
and
$115,941
thereafter.
F-31
HANESBRANDS INC.
Notes to Consolidated Financial Statements — (Continued)
Years ended December 29, 2018, December 30, 2017 and December 31, 2016
(amounts in thousands, except per share data)
License Agreements
The Company is party to several royalty-bearing license agreements for the use of third party trademarks in certain of their products. The license agreements typically require a minimum guarantee to be paid either at the commencement of the agreement, by a designated date during the term of the agreement or by the end of the agreement period. When payments are made in advance of when they are due, the Company records a prepayment and amortizes the expense in the “Cost of sales” line of the Consolidated Statements of Income uniformly over the guaranteed period. For guarantees required to be paid at the completion of the agreement, royalties are expensed through “Cost of sales” as the related sales are made. Management has reviewed all license agreements and has concluded that there are no liabilities recorded at inception of the agreements.
During
2018
,
2017
and
2016
, the Company incurred royalty expense of approximately
$109,851
,
$100,869
and
$95,650
, respectively.
Minimum amounts due under the license agreements are approximately
$45,974
in
2019
,
$51,594
in
2020
,
$11,296
in
2021
,
$9,543
in
2022
,
$7,755
in
2023
and
$20,810
thereafter.
|
(13)
|
Intangible Assets and Goodwill
|
As described in Note, “Acquisitions,” the Company acquired Bras N things in February 2018 and Alternative Apparel in October 2017, which resulted in the recognition of certain intangible assets and goodwill. In addition, during 2017, the Company elected to assign a useful life of
12 years
to both the Knights Apparel and ProEdge brands and related trademarks, shifting them from indefinite lived intangible assets. As a result, on January 1, 2017, the Company began amortizing these trademarks.
(a) Intangible Assets
The primary components of the Company’s intangible assets and the related accumulated amortization are as follows:
|
Gross
|
Accumulated
Amortization |
Net Book
Value |
|||||||||
|
Year ended December 29, 2018:
|
|||||||||||
|
Intangible assets subject to amortization:
|
|||||||||||
|
Trademarks and brand names
|
$
|
35,818
|
|
$
|
26,218
|
|
$
|
9,600
|
|
||
|
Licensing agreements
|
102,929
|
|
50,222
|
|
52,707
|
|
|||||
|
Customer and distributor relationships
|
166,176
|
|
56,923
|
|
109,253
|
|
|||||
|
Computer software
|
125,319
|
|
90,203
|
|
35,116
|
|
|||||
|
Other intangibles
|
3,343
|
|
1,670
|
|
1,673
|
|
|||||
|
$
|
433,585
|
|
$
|
225,236
|
|
208,349
|
|
||||
|
Intangible assets not subject to amortization:
|
|||||||||||
|
Trademarks
|
1,312,202
|
|
|||||||||
|
Perpetual licensing agreements and other
|
34,830
|
|
|||||||||
|
Net book value of intangible assets
|
$
|
1,555,381
|
|
||||||||
F-32
HANESBRANDS INC.
Notes to Consolidated Financial Statements — (Continued)
Years ended December 29, 2018, December 30, 2017 and December 31, 2016
(amounts in thousands, except per share data)
|
Gross
|
Accumulated
Amortization |
Net Book
Value |
|||||||||
|
Year ended December 30, 2017:
|
|||||||||||
|
Intangible assets subject to amortization:
|
|||||||||||
|
Trademarks and brand names
|
$
|
35,498
|
|
$
|
24,694
|
|
$
|
10,804
|
|
||
|
Licensing agreements
|
103,366
|
|
42,218
|
|
61,148
|
|
|||||
|
Customer and distributor relationships
|
172,820
|
|
42,010
|
|
130,810
|
|
|||||
|
Computer software
|
116,273
|
|
83,390
|
|
32,883
|
|
|||||
|
Other intangibles
|
2,131
|
|
397
|
|
1,734
|
|
|||||
|
$
|
430,088
|
|
$
|
192,709
|
|
237,379
|
|
||||
|
Intangible assets not subject to amortization:
|
|||||||||||
|
Trademarks
|
1,089,742
|
|
|||||||||
|
Perpetual licensing agreements and other
|
75,736
|
|
|||||||||
|
Net book value of intangible assets
|
$
|
1,402,857
|
|
||||||||
The amortization expense for intangible assets subject to amortization was
$36,437
,
$34,892
and
$22,118
for
2018
,
2017
and
2016
, respectively. The estimated amortization expense for the next five years, assuming no change in the estimated useful lives of identifiable intangible assets or changes in foreign exchange rates is as follows:
$32,918
in
2019
,
$30,851
in
2020
,
$27,610
in
2021
,
$25,274
in
2022
and
$23,187
in
2023
.
(b) Goodwill
Goodwill and the changes in those amounts during the period are as follows:
|
Innerwear
|
Activewear
|
International
|
Other
|
Total
|
|||||||||||||||
|
Net book value at December 31, 2016
|
$
|
431,561
|
|
$
|
291,443
|
|
$
|
372,312
|
|
$
|
3,224
|
|
$
|
1,098,540
|
|
||||
|
Acquisition of businesses
|
—
|
|
25,248
|
|
3,351
|
|
—
|
|
28,599
|
|
|||||||||
|
Segment change
|
(24,708
|
)
|
259
|
|
—
|
|
24,449
|
|
—
|
|
|||||||||
|
Currency translation
|
—
|
|
—
|
|
39,868
|
|
—
|
|
39,868
|
|
|||||||||
|
Net book value at December 30, 2017
|
$
|
406,853
|
|
$
|
316,950
|
|
$
|
415,531
|
|
$
|
27,673
|
|
$
|
1,167,007
|
|
||||
|
Acquisition of businesses
|
—
|
|
(566
|
)
|
111,611
|
|
—
|
|
111,045
|
|
|||||||||
|
Currency translation
|
—
|
|
—
|
|
(36,325
|
)
|
—
|
|
(36,325
|
)
|
|||||||||
|
Net book value at December 29, 2018
|
$
|
406,853
|
|
$
|
316,384
|
|
$
|
490,817
|
|
$
|
27,673
|
|
$
|
1,241,727
|
|
||||
|
(14)
|
Accumulated Other Comprehensive Loss
|
The components of AOCI are as follows:
|
|
Cumulative Translation Adjustment
|
Hedges
|
Defined Benefit Plans
|
Income Taxes
|
Accumulated Other Comprehensive Loss
|
||||||||||||||
|
|
|||||||||||||||||||
|
Balance at December 31, 2016
|
$
|
(78,059
|
)
|
$
|
13,772
|
|
$
|
(606,583
|
)
|
$
|
234,879
|
|
$
|
(435,991
|
)
|
||||
|
Amounts reclassified from accumulated other comprehensive loss
|
—
|
|
(1,825
|
)
|
19,062
|
|
(7,095
|
)
|
10,142
|
|
|||||||||
|
Current-period other comprehensive income (loss) activity
|
34,554
|
|
(37,408
|
)
|
(26,479
|
)
|
15,976
|
|
(13,357
|
)
|
|||||||||
|
Balance at December 30, 2017
|
$
|
(43,505
|
)
|
$
|
(25,461
|
)
|
$
|
(614,000
|
)
|
$
|
243,760
|
|
$
|
(439,206
|
)
|
||||
|
Amounts reclassified from accumulated other comprehensive loss
|
—
|
|
9,836
|
|
19,693
|
|
(7,552
|
)
|
21,977
|
|
|||||||||
|
Current-period other comprehensive income (loss) activity
|
(113,555
|
)
|
37,439
|
|
(1,000
|
)
|
(8,597
|
)
|
(85,713
|
)
|
|||||||||
|
Balance at December 29, 2018
|
$
|
(157,060
|
)
|
$
|
21,814
|
|
$
|
(595,307
|
)
|
$
|
227,611
|
|
$
|
(502,942
|
)
|
||||
F-33
HANESBRANDS INC.
Notes to Consolidated Financial Statements — (Continued)
Years ended December 29, 2018, December 30, 2017 and December 31, 2016
(amounts in thousands, except per share data)
The Company had the following reclassifications out of AOCI:
|
Component of AOCI
|
Location of Reclassification into Income
|
Amount of Reclassification from AOCI
|
||||||||||||
|
December 29,
2018 |
December 30,
2017 |
December 31,
2016 |
||||||||||||
|
Gain (loss) on foreign exchange contracts
|
Cost of sales
|
$
|
9,836
|
|
$
|
(1,825
|
)
|
$
|
(3,966
|
)
|
||||
|
Income tax
|
(2,038
|
)
|
225
|
|
1,543
|
|
||||||||
|
Net of tax
|
$
|
7,798
|
|
$
|
(1,600
|
)
|
$
|
(2,423
|
)
|
|||||
|
Amortization of deferred actuarial loss and prior service cost
|
Selling, general and administrative expenses
|
$
|
19,693
|
|
$
|
19,062
|
|
$
|
17,116
|
|
||||
|
Income tax
|
(5,514
|
)
|
(7,320
|
)
|
(6,573
|
)
|
||||||||
|
Net of tax
|
$
|
14,179
|
|
$
|
11,742
|
|
$
|
10,543
|
|
|||||
|
Total reclassifications
|
$
|
21,977
|
|
$
|
10,142
|
|
$
|
8,120
|
|
|||||
|
(15)
|
Financial Instruments and Risk Management
|
The Company uses forward foreign exchange contracts to manage its exposures to movements in foreign exchange rates. As of
December 29, 2018
, the notional U.S. dollar equivalent of the Company’s derivative portfolio of cash flow hedges and mark to market hedges was
$533,260
and
$42,209
, respectively, consisting of contracts hedging exposures primarily related to the Euro, Australian dollar, Canadian dollar, and Mexican peso.
As of
December 30, 2017
, the notional U.S. dollar equivalent of the Company’s derivative portfolio of cash flow hedges and mark to market hedges was
$584,582
and
$21,652
, respectively, consisting of contracts hedging exposures primarily related to the Australian dollar, Euro, Canadian dollar, Mexican peso and the New Zealand dollar.
Fair Values of Derivative Instruments
The fair values of derivative financial instruments related to forward foreign exchange contracts recognized in the Consolidated Balance Sheets of the Company were as follows:
|
|
|
Fair Value
|
|||||||
|
|
Balance Sheet Location
|
December 29,
2018 |
December 30,
2017 |
||||||
|
Hedges
|
Other current assets
|
$
|
18,381
|
|
$
|
1,464
|
|
||
|
Non-hedges
|
Other current assets
|
12,410
|
|
136
|
|
||||
|
Total derivative assets
|
$
|
30,791
|
|
$
|
1,600
|
|
|||
|
Hedges
|
Accrued liabilities
|
$
|
(286
|
)
|
$
|
(14,750
|
)
|
||
|
Non-hedges
|
Accrued liabilities
|
(114
|
)
|
(7,818
|
)
|
||||
|
Total derivative liabilities
|
$
|
(400
|
)
|
$
|
(22,568
|
)
|
|||
|
Net derivative asset (liability)
|
$
|
30,391
|
|
$
|
(20,968
|
)
|
|||
Cash Flow Hedges
The Company uses forward foreign exchange contracts to reduce the effect of fluctuating foreign currencies on short-term foreign currency-denominated transactions, foreign currency-denominated investments, and other known foreign currency exposures. Gains and losses on these contracts are intended to offset losses and gains on the hedged transaction in an effort to reduce the earnings volatility resulting from fluctuating foreign currency exchange rates.
The Company expects to reclassify into earnings during the next 12 months a net gain from AOCI of approximately
$26,444
.
F-34
HANESBRANDS INC.
Notes to Consolidated Financial Statements — (Continued)
Years ended December 29, 2018, December 30, 2017 and December 31, 2016
(amounts in thousands, except per share data)
The ineffective portion of the changes in the fair value of derivatives used as cash flow hedges are reported in the “Cost of sales” line in the Consolidated Statements of Income.
The effect of cash flow hedge derivative instruments on the Consolidated Statements of Income and Accumulated Other Comprehensive Loss is as follows:
|
|
Amount of Gain (Loss) Recognized in
Accumulated Other Comprehensive Loss (Effective Portion) Year Ended |
||||||||||
|
December 29,
2018 |
December 30,
2017 |
December 31,
2016 |
|||||||||
|
Foreign exchange contracts
|
$
|
37,439
|
|
$
|
(37,408
|
)
|
$
|
10,995
|
|
||
|
Location of Gain (Loss) Reclassified from
Accumulated Other Comprehensive Loss into Income (Effective Portion) |
Amount of Gain (Loss) Reclassified from
Accumulated Other Comprehensive Loss into Income (Effective Portion) Year Ended |
||||||||||||
|
December 29,
2018 |
December 30,
2017 |
December 31,
2016 |
|||||||||||
|
Foreign exchange contracts
|
Cost of sales
|
$
|
(9,836
|
)
|
$
|
1,825
|
|
$
|
3,966
|
|
|||
Mark to Market Hedges
A derivative used as a hedging instrument whose change in fair value is recognized to act as a hedge against changes in the values of the hedged item is designated as a mark to market hedge. The Company uses foreign exchange derivative contracts as hedges against the impact of foreign exchange fluctuations on existing accounts receivable and payable balances and intercompany lending transactions denominated in foreign currencies. Foreign exchange derivative contracts are recorded as mark to market hedges when the hedged item is a recorded asset or liability that is revalued in each accounting period. These contracts are not designated as hedges under the accounting standards and are recorded at fair value in the Consolidated Balance Sheets. Any gains or losses resulting from changes in fair value are recognized directly into earnings. Gains or losses on these contracts largely offset the net remeasurement gains or losses on the related assets and liabilities.
The effect of derivative contracts not designated as hedges on the Consolidated Statements of Income is as follows:
|
|
Location of Gain Recognized in Income
on Derivatives |
Amount of Gain Recognized in
Income Year Ended |
|||||||||||
|
December 29,
2018 |
December 30,
2017 |
December 31,
2016 |
|||||||||||
|
Foreign exchange contracts
|
Selling, general and
administrative expenses |
$
|
726
|
|
$
|
114
|
|
$
|
12,222
|
|
|||
|
(16)
|
Fair Value of Assets and Liabilities
|
Fair value is an exit price, representing the price that would be received to sell an asset or paid to transfer a liability in an orderly transaction between market participants at the measurement date. The Company utilizes market data or assumptions that market participants would use in pricing the asset or liability. A three-tier fair value hierarchy, which prioritizes the inputs used in measuring fair value, is utilized for disclosing the fair value of the Company’s assets and liabilities. These tiers include: Level 1, defined as observable inputs such as quoted prices in active markets; Level 2, defined as inputs other than quoted prices in active markets that are either directly or indirectly observable; and Level 3, defined as unobservable inputs about which little or no market data exists, therefore requiring an entity to develop its own assumptions.
Assets and liabilities measured at fair value are based on one or more of the following three valuation techniques:
|
•
|
Market approach — prices and other relevant information generated by market transactions involving identical or comparable assets or liabilities.
|
|
•
|
Cost approach — amount that would be required to replace the service capacity of an asset or replacement cost.
|
F-35
HANESBRANDS INC.
Notes to Consolidated Financial Statements — (Continued)
Years ended December 29, 2018, December 30, 2017 and December 31, 2016
(amounts in thousands, except per share data)
|
•
|
Income approach — techniques to convert future amounts to a single present amount based on market expectations, including present value techniques, option-pricing and other models.
|
The Company primarily applies the market approach for commodity derivatives and for all defined benefit plan investment assets and the income approach for interest rate and foreign currency derivatives for recurring fair value measurements and attempts to utilize valuation techniques that maximize the use of observable inputs and minimize the use of unobservable inputs. Assets and liabilities are classified in their entirety based on the lowest level of input that is significant to the fair value measurement. The determination of fair values incorporates various factors that include not only the credit standing of the counterparties involved and the impact of credit enhancements, but also the impact of the Company’s nonperformance risk on its liabilities. The Company’s assessment of the significance of a particular input to the fair value measurement requires judgment and may affect the valuation of fair value assets and liabilities and their placement within the fair value hierarchy levels.
As of
December 29, 2018
and
December 30, 2017
, the Company held certain financial assets and liabilities that are required to be measured at fair value on a recurring basis. These consisted of the Company’s derivative instruments related to foreign exchange rates, defined benefit pension plan investment assets and deferred compensation plan liabilities. The fair values of foreign exchange rate derivatives are determined using the cash flows of the foreign exchange contract, discount rates to account for the passage of time and current foreign exchange market data which are all based on inputs readily available in public markets and are categorized as Level 2. The fair value of deferred compensation plans is based on readily available current market data and is categorized as Level 2. The fair values of defined benefit pension plan investments include: certain U.S. equity securities, certain foreign equity securities, cash and cash equivalents and debt securities that are determined based on quoted prices in public markets categorized as Level 1; insurance contracts that are determined based on inputs readily available in public markets or can be derived from information available in publicly quoted markets categorized as Level 2; certain foreign equity securities, debt securities and commodity investments measured at their net asset value, which is determined based on inputs readily available in public markets; and investments in hedge funds of funds and real estate investments that are based on unobservable inputs about which little or no market data exists and are measured at a net asset value. Assets valued utilizing a net asset value are not required to be classified within the fair value hierarchy. There were no changes during
2018
to the Company’s valuation techniques used to measure asset and liability fair values on a recurring basis.
As of
December 29, 2018
, the Company did not have any non-financial assets or liabilities that are required to be measured at fair value on a recurring basis.
F-36
HANESBRANDS INC.
Notes to Consolidated Financial Statements — (Continued)
Years ended December 29, 2018, December 30, 2017 and December 31, 2016
(amounts in thousands, except per share data)
The following tables set forth by level within the fair value hierarchy the Company’s financial assets and liabilities accounted for at fair value on a recurring basis.
|
|
Assets (Liabilities) at Fair Value as of
December 29, 2018 |
||||||||||||||
|
Total
|
Quoted Prices In
Active Markets for Identical Assets (Level 1) |
Significant
Other Observable Inputs (Level 2) |
Significant Unobservable Inputs (Level 3) |
||||||||||||
|
Defined benefit pension plan investment assets:
|
|||||||||||||||
|
U.S. equity securities
|
$
|
138,356
|
|
$
|
138,356
|
|
$
|
—
|
|
$
|
—
|
|
|||
|
Foreign equity securities
|
29,345
|
|
29,345
|
|
—
|
|
—
|
|
|||||||
|
Debt securities
|
52,896
|
|
52,896
|
|
—
|
|
—
|
|
|||||||
|
Cash and other
|
6,286
|
|
6,286
|
|
—
|
|
—
|
|
|||||||
|
Insurance contracts
|
1,474
|
|
—
|
|
1,474
|
|
—
|
|
|||||||
|
Total plan assets in the fair value hierarchy
|
228,357
|
|
226,883
|
|
1,474
|
|
—
|
|
|||||||
|
Plan assets measured at net asset value:
(1)
|
|||||||||||||||
|
Hedge fund of funds
|
311,730
|
|
|||||||||||||
|
Foreign equity securities
|
84,698
|
|
|||||||||||||
|
Debt securities
|
101,910
|
|
|||||||||||||
|
Real estate
|
43,998
|
|
|||||||||||||
|
Commodities
|
15,919
|
|
|||||||||||||
|
Total plan assets measured at net asset value
|
558,255
|
|
|||||||||||||
|
Total plan assets
|
786,612
|
|
|||||||||||||
|
Derivative contracts:
|
|||||||||||||||
|
Foreign exchange derivative contracts - assets
|
30,791
|
|
—
|
|
30,791
|
|
—
|
|
|||||||
|
Foreign exchange derivative contracts - liabilities
|
(400
|
)
|
—
|
|
(400
|
)
|
—
|
|
|||||||
|
30,391
|
|
—
|
|
30,391
|
|
—
|
|
||||||||
|
Deferred compensation plan liability
|
(39,542
|
)
|
—
|
|
(39,542
|
)
|
—
|
|
|||||||
|
Total
|
$
|
777,461
|
|
$
|
226,883
|
|
$
|
(7,677
|
)
|
$
|
—
|
|
|||
|
(1)
|
Certain investments that are measured at fair value using the net asset value per share (or its equivalent) practical expedient have not been categorized in the fair value hierarchy. The fair value amounts presented in the tables above are intended to permit reconciliation of the fair value hierarchy to the amounts presented in the consolidated balance sheets.
|
F-37
HANESBRANDS INC.
Notes to Consolidated Financial Statements — (Continued)
Years ended December 29, 2018, December 30, 2017 and December 31, 2016
(amounts in thousands, except per share data)
|
|
Assets (Liabilities) at Fair Value as of
December 30, 2017 |
||||||||||||||
|
|
Total
|
Quoted Prices In
Active Markets for Identical Assets (Level 1) |
Significant
Other Observable Inputs (Level 2) |
Significant Unobservable Inputs (Level 3) |
|||||||||||
|
Defined benefit pension plan investment assets:
|
|||||||||||||||
|
U.S. equity securities
|
$
|
172,558
|
|
$
|
172,558
|
|
$
|
—
|
|
$
|
—
|
|
|||
|
Foreign equity securities
|
40,920
|
|
40,920
|
|
—
|
|
—
|
|
|||||||
|
Debt securities
|
52,331
|
|
52,331
|
|
—
|
|
—
|
|
|||||||
|
Cash and other
|
2,595
|
|
2,595
|
|
—
|
|
—
|
|
|||||||
|
Insurance contracts
|
2,194
|
|
—
|
|
2,194
|
|
—
|
|
|||||||
|
Total plan assets in the fair value hierarchy
|
270,598
|
|
268,404
|
|
2,194
|
|
—
|
|
|||||||
|
Plan assets measured at net asset value:
(1)
|
|||||||||||||||
|
Hedge fund of funds
|
328,511
|
|
|||||||||||||
|
Foreign equity securities
|
109,525
|
|
|||||||||||||
|
Debt securities
|
102,531
|
|
|||||||||||||
|
Real estate
|
42,996
|
|
|||||||||||||
|
Commodities
|
18,525
|
|
|||||||||||||
|
Total plan assets measured at net asset value
|
602,088
|
|
|||||||||||||
|
Total plan assets
|
872,686
|
|
|||||||||||||
|
Derivative contracts:
|
|||||||||||||||
|
Foreign exchange derivative contracts - assets
|
1,600
|
|
—
|
|
1,600
|
|
—
|
|
|||||||
|
Foreign exchange derivative contracts - liabilities
|
(22,568
|
)
|
—
|
|
(22,568
|
)
|
—
|
|
|||||||
|
(20,968
|
)
|
—
|
|
(20,968
|
)
|
—
|
|
||||||||
|
Deferred compensation plan liability
|
(52,758
|
)
|
—
|
|
(52,758
|
)
|
—
|
|
|||||||
|
Total
|
$
|
798,960
|
|
$
|
268,404
|
|
$
|
(71,532
|
)
|
$
|
—
|
|
|||
|
(1)
|
Certain investments that are measured at fair value using the net asset value per share (or its equivalent) practical expedient have not been categorized in the fair value hierarchy. The fair value amounts presented in the tables above are intended to permit reconciliation of the fair value hierarchy to the amounts presented in the consolidated balance sheets.
|
Fair Value of Financial Instruments
The carrying amounts of cash and cash equivalents, trade accounts receivable, notes receivable and accounts payable approximated fair value as of
December 29, 2018
and
December 30, 2017
. The fair value of debt, which is classified as a Level 2 liability, was
$3,863,299
and
$4,093,229
as of
December 29, 2018
and
December 30, 2017
and had a carrying value of
$4,009,553
and
$3,993,267
, respectively. The fair values were estimated using quoted market prices as provided in secondary markets, which consider the Company’s credit risk and market related conditions. The carrying amounts of the Company’s notes payable, which is classified as a Level 2 liability, approximated fair value as of
December 29, 2018
and
December 30, 2017
, primarily due to the short-term nature of these instruments.
|
(17)
|
Defined Benefit Pension Plans
|
At
December 29, 2018
, the Company’s pension plans consisted of the Hanesbrands Inc. Pension Plan, various nonqualified retirement plans and international plans, which include certain defined benefit plans acquired in connection with the purchases of Hanes Europe Innerwear, Champion Europe and Hanes Australasia. Benefits under the Hanesbrands Inc. Pension Plan were frozen effective December 31, 2005.
F-38
HANESBRANDS INC.
Notes to Consolidated Financial Statements — (Continued)
Years ended December 29, 2018, December 30, 2017 and December 31, 2016
(amounts in thousands, except per share data)
The components of net periodic benefit cost and other amounts recognized in other comprehensive loss of the Company’s noncontributory defined benefit pension plans were as follows:
|
|
Years Ended
|
||||||||||
|
|
December 29,
2018 |
December 30,
2017 |
December 31,
2016 |
||||||||
|
Service cost
|
$
|
2,776
|
|
$
|
2,216
|
|
$
|
1,856
|
|
||
|
Interest cost
|
40,208
|
|
40,830
|
|
42,061
|
|
|||||
|
Expected return on assets
|
(45,280
|
)
|
(41,780
|
)
|
(47,621
|
)
|
|||||
|
Curtailments
|
(186
|
)
|
154
|
|
(489
|
)
|
|||||
|
Settlement cost
|
42
|
|
23
|
|
115
|
|
|||||
|
Amortization of:
|
|||||||||||
|
Prior service cost
|
(6
|
)
|
9
|
|
9
|
|
|||||
|
Net actuarial loss
|
19,699
|
|
19,053
|
|
17,052
|
|
|||||
|
Net periodic benefit cost
|
$
|
17,253
|
|
$
|
20,505
|
|
$
|
12,983
|
|
||
|
Other Changes in Plan Assets and Benefit Obligations Recognized in Other Comprehensive Loss
|
|||||||||||
|
Net (gain) loss
|
$
|
(20,965
|
)
|
$
|
15,186
|
|
$
|
41,921
|
|
||
|
Prior service credit (cost)
|
6
|
|
(380
|
)
|
(9
|
)
|
|||||
|
Total (gain) loss recognized in other comprehensive income
|
(20,959
|
)
|
14,806
|
|
41,912
|
|
|||||
|
Total recognized in net periodic benefit cost and other comprehensive loss
|
$
|
(3,706
|
)
|
$
|
35,311
|
|
$
|
54,895
|
|
||
The estimated net loss and prior service cost for the defined benefit pension plans that will be amortized from AOCI into net periodic benefit cost in
2019
are
$20,115
and
$(6)
, respectively.
The funded status of the Company’s defined benefit pension plans at the respective year ends was as follows:
|
December 29,
2018 |
December 30,
2017 |
||||||
|
Benefit obligation:
|
|||||||
|
Beginning of year
|
$
|
1,277,722
|
|
$
|
1,197,189
|
|
|
|
Service cost
|
2,776
|
|
2,216
|
|
|||
|
Interest cost
|
40,208
|
|
40,830
|
|
|||
|
Plan amendment
|
—
|
|
(370
|
)
|
|||
|
Benefits paid
|
(59,808
|
)
|
(57,464
|
)
|
|||
|
Curtailments
|
(186
|
)
|
187
|
|
|||
|
Settlements
|
(878
|
)
|
(688
|
)
|
|||
|
Impact of exchange rate change
|
(4,621
|
)
|
9,453
|
|
|||
|
Actuarial (gain) loss
|
(92,156
|
)
|
86,414
|
|
|||
|
Other
|
1,461
|
|
(45
|
)
|
|||
|
End of year
|
1,164,518
|
|
1,277,722
|
|
|||
|
Fair value of plan assets:
|
|||||||
|
Beginning of year
|
872,686
|
|
827,169
|
|
|||
|
Actual return (loss) on plan assets
|
(46,370
|
)
|
94,957
|
|
|||
|
Employer contributions
|
23,176
|
|
6,376
|
|
|||
|
Benefits paid
|
(59,808
|
)
|
(57,464
|
)
|
|||
|
Settlements
|
(878
|
)
|
(688
|
)
|
|||
|
Impact of exchange rate change
|
(2,176
|
)
|
2,381
|
|
|||
|
Other
|
(18
|
)
|
(45
|
)
|
|||
|
End of year
|
786,612
|
|
872,686
|
|
|||
|
Funded status
|
$
|
(377,906
|
)
|
$
|
(405,036
|
)
|
|
F-39
HANESBRANDS INC.
Notes to Consolidated Financial Statements — (Continued)
Years ended December 29, 2018, December 30, 2017 and December 31, 2016
(amounts in thousands, except per share data)
As most of the Company’s pension plans are frozen, the accumulated benefit obligation (“ABO”) approximates the benefit obligation. The total benefit obligation and the benefit obligation and fair value of plan assets for the Company’s pension plans with benefit obligations in excess of plan assets are as follows:
|
December 29,
2018 |
December 30,
2017 |
||||||
|
Benefit obligation
|
$
|
1,164,518
|
|
$
|
1,277,722
|
|
|
|
Plans with benefit obligation in excess of plan assets:
|
|||||||
|
Benefit obligation
|
1,136,559
|
|
1,245,844
|
|
|||
|
Fair value of plan assets
|
760,155
|
|
842,168
|
|
|||
Amounts recognized in the Company’s Consolidated Balance Sheets consist of:
|
December 29,
2018 |
December 30,
2017 |
||||||
|
Current liabilities
|
$
|
(3,765
|
)
|
$
|
(3,663
|
)
|
|
|
Noncurrent liabilities
|
(374,615
|
)
|
(401,749
|
)
|
|||
|
Accumulated other comprehensive loss
|
(597,457
|
)
|
(618,416
|
)
|
|||
Amounts recognized in accumulated other comprehensive loss consist of:
|
December 29,
2018 |
December 30,
2017 |
||||||
|
Prior service cost
|
$
|
(157
|
)
|
$
|
(163
|
)
|
|
|
Actuarial loss
|
597,614
|
|
618,579
|
|
|||
|
$
|
597,457
|
|
$
|
618,416
|
|
||
Accrued benefit costs related to the Company’s defined benefit pension plans are reported in the “Accrued liabilities — Payroll and employee benefits” and “Pension and postretirement benefits” lines of the Consolidated Balance Sheets.
(a) Measurement Date and Assumptions
A December 31 measurement date is used to value plan assets and obligations for the pension plans. In determining the discount rate, the Company utilizes a full yield curve approach in the estimation of the interest component of benefit costs by applying the specific spot rates along the yield curve used in the determination of the benefit obligations to the relevant projected cash flows. The expected long-term rate of return on plan assets was based on the Company’s investment policy target allocation of the asset portfolio between various asset classes and the expected real returns of each asset class over various periods of time. The weighted average actuarial assumptions used in measuring the net periodic benefit cost and plan obligations for the periods presented were as follows:
|
December 29,
2018 |
December 30,
2017 |
December 31,
2016 |
||||||
|
Net periodic benefit cost:
|
||||||||
|
Discount rate
|
3.60
|
%
|
4.15
|
%
|
4.43
|
%
|
||
|
Long-term rate of return on plan assets
|
5.32
|
|
5.21
|
|
5.80
|
|
||
|
Rate of compensation increase
(1)
|
4.40
|
|
3.84
|
|
3.51
|
|
||
|
Plan obligations:
|
||||||||
|
Discount rate
|
4.24
|
%
|
3.60
|
%
|
4.15
|
%
|
||
|
Rate of compensation increase
(1)
|
4.40
|
|
4.40
|
|
3.84
|
|
||
|
(1)
|
The compensation increase assumption applies to the international plans and portions of the nonqualified retirement plans, as benefits under these plans were not frozen at
December 29, 2018
,
December 30, 2017
and
December 31, 2016
.
|
F-40
HANESBRANDS INC.
Notes to Consolidated Financial Statements — (Continued)
Years ended December 29, 2018, December 30, 2017 and December 31, 2016
(amounts in thousands, except per share data)
(b) Plan Assets, Expected Benefit Payments, and Funding
The allocation of pension plan assets as of the respective period end measurement dates is as follows:
|
December 29,
2018 |
December 30,
2017 |
||||
|
Asset category:
|
|||||
|
Hedge fund of funds
|
40
|
%
|
38
|
%
|
|
|
Debt securities
|
20
|
|
18
|
|
|
|
U.S. equity securities
|
18
|
|
20
|
|
|
|
Foreign equity securities
|
14
|
|
17
|
|
|
|
Real estate
|
6
|
|
5
|
|
|
|
Commodities
|
2
|
|
2
|
|
|
|
Insurance contracts
|
—
|
|
—
|
|
|
|
Cash and other
|
—
|
|
—
|
|
|
The Company’s asset strategy and primary investment objective are to maximize the principal value of the plan assets to meet current and future benefit obligations to plan participants and their beneficiaries. To accomplish this goal, the assets of the plan are broadly diversified to protect against large investment losses and to reduce the likelihood of excessive volatility of returns. Diversification of assets is achieved through strategic allocations to various asset classes, as well as various investment styles within these asset classes, and by retaining multiple, third party investment management firms with complementary investment styles and philosophies to implement these allocations. The Company has established a target asset allocation based upon analysis of risk/return tradeoffs and correlations of asset mixes given long-term historical data, prospective capital market returns and forecasted liabilities of the plans. The target asset allocation approximates the actual asset allocation as of
December 29, 2018
. In addition to volatility protection, diversification enables the assets of the plan the best opportunity to provide adequate returns in order to meet the Company’s investment return objectives. These objectives include, over a rolling
5
-year period, to achieve a total return that exceeds the required actuarial rate of return for the plan and to outperform a passive portfolio, consisting of a similar asset allocation.
The Company utilizes market data or assumptions that market participants would use in pricing the pension plan assets. At
December 29, 2018
, the Company had
$226,883
classified as Level 1 assets,
$1,474
classified as Level 2 assets and no assets classified as Level 3. At
December 30, 2017
, the Company had $
268,404
classified as Level 1 assets,
$2,194
classified as Level 2 assets and no assets classified as Level 3. The Level 1 assets consisted primarily of certain U.S. equity securities, certain foreign equity securities, certain debt securities and cash and cash equivalents. Certain foreign equity securities, debt securities, insurance contracts and commodity investments measured at their net asset value, which is determined based on inputs readily available in public markets, and investments in hedge funds of funds and real estate investments that are based on unobservable inputs about which little or no market data exists and are measured at a net asset value per share shall not be categorized within the fair value hierarchy. Refer to Note, “Fair Value of Assets and Liabilities,” for the Company’s complete disclosure of the fair value of pension plan assets.
Expected benefit payments are as follows:
$62,899
in
2019
,
$63,957
in
2020
,
$67,947
in
2021
,
$68,674
in
2022
,
$71,047
in
2023
and
$368,558
in 2024 through 2028.
(c) Nonretirement Postemployment Benefit Plans
Certain of the international plans, specifically those acquired in connection with the purchases of Hanes Europe Innerwear and Champion Europe, are in substance nonretirement postemployment benefit plans, which are future liabilities funded through future operational results of the Company. However, for purposes of consolidation, the Company is including these plans within the defined benefit reporting. At
December 29, 2018
and
December 30, 2017
, the total amounts accrued for these plans were
$49,808
and
$52,943
, respectively and the total expense was
$1,264
,
$2,778
and
$1,824
for
2018
,
2017
and
2016
, respectively.
F-41
HANESBRANDS INC.
Notes to Consolidated Financial Statements — (Continued)
Years ended December 29, 2018, December 30, 2017 and December 31, 2016
(amounts in thousands, except per share data)
|
(18)
|
Income Taxes
|
The provision for income tax computed by applying the U.S. statutory rate to income before taxes as reconciled to the actual provisions were:
|
|
Years Ended
|
|||||||
|
|
December 29,
2018 |
December 30,
2017 |
December 31,
2016 |
|||||
|
Income before income tax expense:
|
||||||||
|
Domestic
|
(9.4
|
)%
|
(6.6
|
)%
|
(10.2
|
)%
|
||
|
Foreign
|
109.4
|
|
106.6
|
|
110.2
|
|
||
|
100.0
|
%
|
100.0
|
%
|
100.0
|
%
|
|||
|
Tax expense at U.S. statutory rate
|
21.0
|
%
|
35.0
|
%
|
35.0
|
%
|
||
|
State income tax
|
(0.3
|
)
|
0.2
|
|
(0.7
|
)
|
||
|
Tax on actual and planned remittances of foreign earnings
|
9.8
|
|
0.5
|
|
9.9
|
|
||
|
Tax on foreign earnings due to U.S. tax reform including measurement period adjustments
|
(0.5
|
)
|
67.0
|
|
N/A
|
|
||
|
Revaluation of net deferred tax assets due to U.S. tax reform including measurement period adjustments
|
(1.2
|
)
|
14.3
|
|
N/A
|
|
||
|
Tax on foreign earnings (U.S. tax reform - GILTI and FDII)
|
2.3
|
|
N/A
|
|
N/A
|
|
||
|
Foreign taxes less than U.S. statutory rate
|
(12.6
|
)
|
(27.4
|
)
|
(38.5
|
)
|
||
|
Statutory stock deduction
|
(17.2
|
)
|
N/A
|
|
N/A
|
|
||
|
Employee benefits
|
(0.1
|
)
|
(0.2
|
)
|
(0.7
|
)
|
||
|
Change in valuation allowance due to statutory stock deduction
|
17.2
|
|
—
|
|
—
|
|
||
|
Other changes in valuation allowance
|
(3.9
|
)
|
0.1
|
|
1.2
|
|
||
|
Increase in unrecognized tax benefits
|
0.5
|
|
1.8
|
|
0.6
|
|
||
|
Release of unrecognized tax benefit reserves
|
—
|
|
(0.9
|
)
|
(0.4
|
)
|
||
|
State tax rate change
|
0.4
|
|
0.1
|
|
0.6
|
|
||
|
Federal and state provision to return
|
(0.4
|
)
|
(2.6
|
)
|
(0.7
|
)
|
||
|
Other, net
|
(0.5
|
)
|
0.2
|
|
(0.3
|
)
|
||
|
Taxes at effective worldwide tax rates
|
14.5
|
%
|
88.1
|
%
|
6.0
|
%
|
||
The Tax Cuts and Jobs Act (the “Tax Act”) was enacted in the U.S. on December 22, 2017. The Tax Act reduced the U.S. federal corporate income tax rate to 21% from 35%, required companies to pay a one-time transition tax on earnings of certain foreign subsidiaries that were previously tax deferred and created new taxes on certain foreign-sourced earnings. In response to the Tax Act, the SEC issued SAB 118 which allows issuers to recognize provisional estimates of the impact of the Tax Act in their financial statements and adjust in the period in which the estimate becomes finalized, or in circumstances where estimates cannot be made, to disclose and recognize within a one year measurement period.
At December 30, 2017 and throughout 2018, the Company applied the guidance described under SAB 118 and recorded provisional estimates for the effects of the Tax Act in connection with the following: one-time transition tax, remeasurement of deferred tax assets and liabilities, tax on global intangible low-taxed income and the impact of the Tax Act on the Company’s permanent reinvestment assertion with respect to its unremitted foreign earnings. As of December 29, 2018, the Company has now completed the accounting for the income tax effects of the Act. As a result, the Company recognized additional tax expense of
$45,203
which consisted of additional income tax expense associated with the Company’s plan to remit certain foreign earnings that are no longer considered to be permanently reinvested less income tax benefits resulting from reductions in the Company’s original provisional charges recorded in connection with the one-time transition tax and the remeasurement of deferred tax assets and liabilities.
One-time Transition Tax
The Company recorded a provisional amount for the one-time transition tax liability for each of the Company’s foreign subsidiaries, resulting in a transition tax liability of
$359,938
at December 30, 2017. Upon further analysis of the Tax Act, notices, and regulations issued and proposed by the U.S. Department of the Treasury and the Internal Revenue Service (“IRS”), the Company finalized the calculations of the transition tax liability during 2018. The Company decreased the December 30,
F-42
HANESBRANDS INC.
Notes to Consolidated Financial Statements — (Continued)
Years ended December 29, 2018, December 30, 2017 and December 31, 2016
(amounts in thousands, except per share data)
2017 provisional amount by approximately
$2,925
, which is included as a component of income tax expense in 2018. The Company has elected to pay its transition tax over the eight-year period provided in the Tax Act. As of December 29, 2018, the remaining balance of the Company’s transition tax obligation is
$106,792
, which will be paid over the next seven years.
Remeasurement of Deferred Tax Assets and Liabilities
As of December 30, 2017, the Company remeasured certain deferred tax assets and liabilities based on the rates at which they were expected to reverse in the future (which was generally 21%), by recording a provisional amount of
$72,333
. This amount was reduced by approximately
$7,627
due to additional deferred tax assets reversing in the 2017 tax return year and therefore not being repriced to 21% but rather being realized at their carrying value.
Global Intangible Low-taxed Income (GILTI)
The Tax Act subjects a U.S. shareholder to tax on GILTI earned by certain foreign subsidiaries. The FASB Staff Q&A, Topic 740, No. 5, Accounting for Global Intangible Low-Taxed Income, states that an entity can make an accounting policy election to either recognize deferred taxes for temporary basis differences expected to reverse as GILTI in future years or to provide for the tax expense related to GILTI in the year the tax is incurred as a period expense only. The Company has elected to account for GILTI as a period cost in the year the tax is incurred.
Permanent Reinvestment Assertion
As a result of the Tax Act, the Company has been reevaluating the permanent reinvestment assertion with respect to unremitted foreign earnings, including those unremitted foreign earnings that were taxed in the U.S. as part of the one-time transition tax. As a result of this evaluation, the Company has determined that a portion of the Company’s unremitted foreign earnings, totaling approximately
$1,366,000
will no longer be permanently reinvested. The remainder of the Company’s foreign earnings will continue to be permanently reinvested to fund working capital requirements and operations abroad. During the first three quarters of 2018, the Company accrued and incurred income taxes of
$7,041
related to actual repatriations of foreign earnings during the year. As of December 29, 2018, and consistent with the Company’s change in assertion with respect to certain foreign earnings, the Company has accrued an additional
$55,728
of income taxes with respect to the
$1,366,000
of foreign earnings the Company intends to remit in the future Of the
$55,728
,
$11,550
relates to current year earnings while the remaining
$44,178
relates to accumulated prior year earnings. These income tax effects include U.S. federal, state, foreign and withholding tax implications in accordance with the planned remittance of such foreign earnings.
The Company has been granted income tax rates lower than statutory rates in two foreign jurisdictions through 2019. These lower rates, when compared with the countries’ statutory rates, resulted in an income tax reduction of approximately
$424
(negligible impact per diluted share) in
2018
,
$2,800
(
$0.01
impact per diluted share) in
2017
and
$1,300
(negligible impact per diluted share) in
2016
.
F-43
HANESBRANDS INC.
Notes to Consolidated Financial Statements — (Continued)
Years ended December 29, 2018, December 30, 2017 and December 31, 2016
(amounts in thousands, except per share data)
Current and deferred tax provisions (benefits) were:
|
Current
|
Deferred
|
Total
|
|||||||||
|
Year ended December 29, 2018
|
|||||||||||
|
Domestic
|
$
|
(22,498
|
)
|
$
|
57,378
|
|
$
|
34,880
|
|
||
|
Foreign
|
86,880
|
|
(42,446
|
)
|
44,434
|
|
|||||
|
State
|
7,269
|
|
7,214
|
|
14,483
|
|
|||||
|
$
|
71,651
|
|
$
|
22,146
|
|
$
|
93,797
|
|
|||
|
Year ended December 30, 2017
|
|||||||||||
|
Domestic
|
$
|
154,751
|
|
$
|
260,393
|
|
$
|
415,144
|
|
||
|
Foreign
|
10,603
|
|
(15,098
|
)
|
(4,495
|
)
|
|||||
|
State
|
68,857
|
|
(6,227
|
)
|
62,630
|
|
|||||
|
$
|
234,211
|
|
$
|
239,068
|
|
$
|
473,279
|
|
|||
|
Year ended December 31, 2016
|
|||||||||||
|
Domestic
|
$
|
2,768
|
|
$
|
34,590
|
|
$
|
37,358
|
|
||
|
Foreign
|
38,257
|
|
(34,232
|
)
|
4,025
|
|
|||||
|
State
|
2,083
|
|
(9,194
|
)
|
(7,111
|
)
|
|||||
|
$
|
43,108
|
|
$
|
(8,836
|
)
|
$
|
34,272
|
|
|||
|
|
Years Ended
|
||||||||||
|
December 29,
2018 |
December 30,
2017 |
December 31,
2016 |
|||||||||
|
Cash payments for income taxes
|
$
|
94,556
|
|
$
|
57,882
|
|
$
|
39,655
|
|
||
The deferred tax assets and liabilities at the respective year-ends were as follows:
|
December 29,
2018 |
December 30,
2017 |
||||||
|
Deferred tax assets:
|
|||||||
|
Nondeductible reserves
|
$
|
3,388
|
|
$
|
1,859
|
|
|
|
Inventories
|
61,956
|
|
57,857
|
|
|||
|
Property and equipment
|
—
|
|
—
|
|
|||
|
Bad debt allowance
|
8,671
|
|
7,363
|
|
|||
|
Accrued expenses
|
18,975
|
|
14,399
|
|
|||
|
Employee benefits
|
121,133
|
|
143,970
|
|
|||
|
Tax credits
|
12,768
|
|
10,140
|
|
|||
|
Net operating loss and other tax carryforwards
|
261,751
|
|
142,064
|
|
|||
|
Derivatives
|
—
|
|
3,305
|
|
|||
|
Other
|
11,466
|
|
17,305
|
|
|||
|
Gross deferred tax assets
|
500,108
|
|
398,262
|
|
|||
|
Less valuation allowances
|
(179,599
|
)
|
(72,602
|
)
|
|||
|
Deferred tax assets
|
320,509
|
|
325,660
|
|
|||
|
Deferred tax liabilities:
|
|||||||
|
Property and equipment
|
2,943
|
|
4,455
|
|
|||
|
Derivatives
|
1,101
|
|
—
|
|
|||
|
Accrued tax on unremitted foreign earnings
|
55,728
|
|
—
|
|
|||
|
Intangibles
|
94,700
|
|
120,033
|
|
|||
|
Prepaids
|
2,742
|
|
3,932
|
|
|||
|
Deferred tax liabilities
|
157,214
|
|
128,420
|
|
|||
|
Net deferred tax assets
|
$
|
163,295
|
|
$
|
197,240
|
|
|
In assessing the realizability of deferred tax assets, management considers whether it is more likely than not that some portion or all of the deferred tax assets will not be realized. The ultimate realization of deferred tax assets is dependent upon the
F-44
HANESBRANDS INC.
Notes to Consolidated Financial Statements — (Continued)
Years ended December 29, 2018, December 30, 2017 and December 31, 2016
(amounts in thousands, except per share data)
generation of future taxable income during the periods in which those temporary differences become deductible. Management considers the scheduled reversal of deferred tax liabilities, projected future taxable income, and tax planning strategies in making this assessment. Based upon the level of historical taxable income and projections for future taxable income over the periods which the deferred tax assets are deductible, management believes it is more likely than not the Company will realize the benefits of these deductible differences, net of the existing valuation allowances.
The changes in the Company’s valuation allowance for deferred tax assets are as follows:
|
January 2, 2016
|
$
|
61,358
|
|
|
Charge to expenses
|
6,859
|
|
|
|
Charged to other accounts
(1)
|
(766
|
)
|
|
|
December 31, 2016
|
$
|
67,451
|
|
|
Charge to expenses
|
729
|
|
|
|
Charged to other accounts
(1)
|
4,422
|
|
|
|
December 30, 2017
|
$
|
72,602
|
|
|
Charge to expenses
|
52,135
|
|
|
|
Charged to other accounts
(1)
|
20,819
|
|
|
|
Charged to retained earnings upon adoption of ASU 2016-16
(2)
|
34,043
|
|
|
|
December 29, 2018
|
$
|
179,599
|
|
|
(1)
|
Charges to other accounts include the effects of foreign currency translation and purchase accounting adjustments.
|
|
(2)
|
The Company adopted ASU 2016-16 on December 31, 2017 using the modified retrospective method, however there was no net cumulative-effect adjustment recorded to retained earnings as of that date. Upon adoption, the Company recognized additional net deferred tax assets of
$34,043
and a corresponding increase in valuation allowance against these additional deferred tax assets as these deferred tax assets are not considered to be more likely than not realizable.
|
As of
December 29, 2018
, the valuation allowance for deferred tax assets was
$179,599
, made up of
$128,732
for foreign loss carryforwards,
$41,634
for other foreign deferred tax assets,
$9,135
for federal and state operating loss carryforwards and
$98
for other federal deferred tax assets. The net change in the total valuation allowance for
2018
was
$106,997
related to an increase of
$106,825
for foreign loss carryforwards which were primarily the result of generating a large loss as a result of a statutory stock deduction which leads to the increase in valuation allowance in the Company’s Luxembourg subsidiary and other foreign deferred tax assets and an increase of
$171
for federal and state operating loss carryforwards and other domestic deferred tax assets. However, approximately
$34,900
of the net operating losses being carried forward generated in the Company’s Luxembourg subsidiary will be utilized based on forecasted taxable income generated in the Luxembourg subsidiary through 2021. The valuation allowance was provided against the remaining deferred tax assets of approximately
$136,000
as the Company does not plan to have taxable income in the Luxembourg subsidiary beyond 2021 as the Company intends to reorganize the Luxembourg operations.
At
December 29, 2018
, the Company has total net operating loss carryforwards of approximately
$804,880
for foreign jurisdictions, which will expire as follows:
|
Fiscal Year:
|
|
||
|
2019
|
$
|
22,057
|
|
|
2020
|
4,729
|
|
|
|
2021
|
5,236
|
|
|
|
2022
|
5,100
|
|
|
|
2023
|
8,018
|
|
|
|
Thereafter
|
759,740
|
|
|
At
December 29, 2018
, the Company had tax credit carryforwards totaling
$12,768
, which expire
beginning after 2019
.
At
December 29, 2018
, the Company had federal and state net operating loss carryforwards of approximately
$38,528
and
$850,769
, respectively, which expire
beginning after 2018
.
In
2018
and
2017
, the Company recognized a benefit related to the realization of unrecognized tax benefits resulting from the expiration of statutes of limitations of
$1,000
and
$4,227
, respectively. Although it is not reasonably possible to estimate the
F-45
HANESBRANDS INC.
Notes to Consolidated Financial Statements — (Continued)
Years ended December 29, 2018, December 30, 2017 and December 31, 2016
(amounts in thousands, except per share data)
amount by which unrecognized tax benefits may increase or decrease within the next
12 months
due to uncertainties regarding the timing of examinations and the amount of settlements that may be paid, if any, to tax authorities, the Company currently expects a reduction of approximately
$6,397
for unrecognized tax benefits accrued at
December 29, 2018
within the next 12 months.
A reconciliation of the beginning and ending amount of unrecognized tax benefits is as follows:
|
Balance at December 31, 2016 (gross balance of $20,688)
|
$
|
19,696
|
|
|
Additions based on tax positions related to the current year
|
7,902
|
|
|
|
Additions for tax positions of prior years
|
36
|
|
|
|
Reductions for tax positions of prior years
|
(3,602
|
)
|
|
|
Balance at December 30, 2017 (gross balance of $26,175)
|
$
|
24,032
|
|
|
Additions based on tax positions related to the current year
|
2,877
|
|
|
|
Additions for tax positions of prior years
|
430
|
|
|
|
Additions based on tax positions related to the acquisition of Bras N Things
|
10,911
|
|
|
|
Settlements
|
(542
|
)
|
|
|
Reductions for tax positions of prior years
|
(3,096
|
)
|
|
|
Balance at December 29, 2018 (gross balance of $35,645)
|
$
|
34,612
|
|
At
December 29, 2018
, the balance of the Company’s unrecognized tax benefits, which would, if recognized, affect the Company’s annual effective tax rate was
$34,612
. The Company’s policy is to recognize interest and/or penalties related to income tax matters in income tax expense. The Company recognized
$5,395
and
$760
in
2018
and
2017
, respectively for interest and penalties classified as income tax expense and
$549
in
2016
, for interest and penalties classified as income tax benefit in the Consolidated Statement of Income. At
December 29, 2018
and
December 30, 2017
, the Company had a total of
$9,406
and
$4,011
, respectively, of interest and penalties accrued related to unrecognized tax benefits.
The Company files a consolidated U.S. federal income tax return, as well as separate and combined income tax returns in numerous state and foreign jurisdictions. In the United States, the IRS began an examination of the Company’s 2015 and 2016 tax years during 2017 and 2018, respectively. The Company is also subject to examination by various state and international tax authorities. The tax years subject to examination vary by jurisdiction. The Company regularly assesses the outcomes of both ongoing and future examinations for the current or prior years to ensure the Company’s provision for income taxes is sufficient. The Company recognizes liabilities based on estimates of whether additional taxes will be due and believes its reserves are adequate in relation to any potential assessments. The outcome of any one examination, some of which may conclude during the next 12 months, is not expected to have a material impact on the Company’s financial position or results of operations.
|
(19)
|
Stockholders’ Equity
|
The Company is authorized to issue up to
2,000,000
shares of common stock, par value
$0.01
per share, and up to
50,000
shares of preferred stock, par value
$0.01
per share, and the Company’s Board of Directors may, without stockholder approval, increase or decrease the aggregate number of shares of stock or the number of shares of stock of any class or series that the Company is authorized to issue. At
December 29, 2018
and
December 30, 2017
,
361,330
and
360,126
shares, respectively, of common stock were issued and outstanding and no shares of preferred stock were issued or outstanding.
On April 27, 2016, the Company’s Board of Directors approved a new share repurchase program for up to
40,000
shares to be repurchased in open market transactions, subject to market conditions, legal requirements and other factors. The new program replaced the Company’s previous share repurchase program for up to
40,000
shares that was originally approved in 2007. Additionally, management has been granted authority to establish a trading plan under Rule 10b5-1 of the Exchange Act in connection with share repurchases, which will allow the Company to repurchase shares in the open market during periods in which the stock trading window is otherwise closed for the Company and certain of the Company’s officers and employees pursuant to the Company’s insider trading policy. The Company did not purchase any shares of the Company’s common stock in 2018. During
2017
, under the current repurchase program, the Company purchased
19,640
shares of the Company’s common stock at a cost of
$400,017
(average price of
$20.35
). Since inception of the share repurchase plan approved in 2016 the Company has purchased
19,640
shares of the Company’s common stock at a cost of
$400,017
(average price of
$20.35
). At
December 29, 2018
, the remaining repurchase authorization under the current share repurchase program totaled approximately
20,360
shares. The primary objective of the share repurchase program is to utilize excess cash to generate shareholder value.
F-46
HANESBRANDS INC.
Notes to Consolidated Financial Statements — (Continued)
Years ended December 29, 2018, December 30, 2017 and December 31, 2016
(amounts in thousands, except per share data)
Dividends
In
2016
, the Company’s Board of Directors declared regular quarterly dividends of
$0.11
per share on outstanding common stock, which were paid in
2016
.
In
2017
, the Company’s Board of Directors declared and increased the regular quarterly dividend to
$0.15
per share of the Company’s outstanding common stock, which was paid in
2017
.
During the Company’s
2018
fiscal year, the Company’s Board of Directors declared regular quarterly cash dividends of
$0.15
per share of the Company’s outstanding common stock, which were paid on March 13, 2018, June 5, 2018, September 5, 2018 and December 4, 2018.
In February
2019
, the Company’s Board of Directors declared a regular quarterly cash dividend of
$0.15
per share of the Company’s outstanding common stock to be paid on March 12, 2019 to stockholders of record at the close of business on February 19, 2019.
|
(20)
|
Discontinued Operations
|
As part of the Company’s acquisition of Hanes Australasia in 2016, the Company acquired Hanes Australasia’s legacy Dunlop Flooring and Tontine Pillow businesses. The Company concluded that these businesses were not a strategic fit; therefore, the decision was made to divest the businesses.
In February 2017, the Company sold its Dunlop Flooring business for A
$34,564
(
$26,219
) in net cash proceeds at the time of sale, with an additional A
$1,334
(
$1,012
) of proceeds received in April 2017 related to a working capital adjustment, resulting in a pre-tax loss of A
$2,715
(
$2,083
). U.S. dollar equivalents are based on exchange rates on the date of the sale transaction. The Dunlop Flooring business was reported as part of discontinued operations since the date of acquisition.
In March 2017, the Company sold its Tontine Pillow business for A
$13,500
(
$10,363
) in net cash proceeds at the time of sale. A working capital adjustment of A
$966
(
$742
) was paid to the buyer in April 2017, resulting in a net pre-tax gain of A
$2,415
(
$1,856
). U.S. dollar equivalents are based on exchange rates on the date of the sale transaction. The Tontine Pillow business was reported as part of discontinued operations since the date of acquisition.
The operating results of these discontinued operations only reflect revenues and expenses that are directly attributable to these businesses that were eliminated from ongoing operations. The key components from discontinued operations related to the Dunlop Flooring and Tontine Pillow businesses were as follows:
|
Years Ended
|
|||||||
|
December 30,
2017 |
December 31,
2016 |
||||||
|
Net sales
|
$
|
6,865
|
|
$
|
34,698
|
|
|
|
Cost of sales
|
4,507
|
|
22,554
|
|
|||
|
Gross profit
|
2,358
|
|
12,144
|
|
|||
|
Selling, general and administrative expenses
|
3,729
|
|
8,632
|
|
|||
|
Operating profit (loss)
|
(1,371
|
)
|
3,512
|
|
|||
|
Other expenses
|
303
|
|
1,106
|
|
|||
|
Net loss on disposal of business
|
242
|
|
—
|
|
|||
|
Income (loss) from discontinued operations before income tax expense
|
(1,916
|
)
|
2,406
|
|
|||
|
Income tax expense (benefit)
|
181
|
|
(49
|
)
|
|||
|
Net income (loss) from discontinued operations, net of tax
|
$
|
(2,097
|
)
|
$
|
2,455
|
|
|
All assets and liabilities of discontinued operations were sold in 2017.
For the years ended December 30, 2017 and December 31, 2016, there were no material amounts of depreciation, amortization, capital expenditures, or significant operating or investing non-cash items related to discontinued operations.
|
(21)
|
Business Segment Information
|
The Company’s operations are managed and reported in
three
operating segments, each of which is a reportable segment for financial reporting purposes: Innerwear, Activewear and International. These segments are organized principally by product
F-47
HANESBRANDS INC.
Notes to Consolidated Financial Statements — (Continued)
Years ended December 29, 2018, December 30, 2017 and December 31, 2016
(amounts in thousands, except per share data)
category and geographic location. Each segment has its own management team that is responsible for the operations of the segment’s businesses, but the segments share a common supply chain and media and marketing platforms. Other consists of the Company’s U.S. value-based (“outlet”) stores and U.S. hosiery business.
The types of products and services from which each reportable segment derives its revenues are as follows:
|
•
|
Innerwear includes sales of basic branded apparel products that are replenishment in nature under the product categories of men’s underwear, women’s panties, children’s underwear and socks, and intimate apparel, which includes bras and shapewear.
|
|
•
|
Activewear includes sales of basic branded products that are primarily seasonal in nature to both retailers and wholesalers, as well as licensed sports apparel and licensed logo apparel in collegiate bookstores, mass retailers and other channels.
|
|
•
|
International includes sales of products in all of the Company’s categories outside the United States, primarily in Europe, Australia, Asia, Latin America and Canada.
|
The Company evaluates the operating performance of its segments based upon segment operating profit, which is defined as operating profit before general corporate expenses, acquisition-related and integration charges and amortization of intangibles. In the first quarter of 2018, the Company eliminated the allocation of certain corporate overhead selling, general and administrative expenses related to the legal, human resources, information technology, finance and real estate departments to the segments, in order to reflect the manner in which the business is managed and results are reviewed by the Chief Executive Officer, who is the Company’s chief operating decision maker. Prior year segment operating profit disclosures have been revised to conform to the current year presentation. The accounting policies of the segments are consistent with those described in Note, “Summary of Significant Accounting Policies.”
|
|
Years Ended
|
||||||||||
|
|
December 29,
2018 |
December 30,
2017 |
December 31,
2016 |
||||||||
|
Net sales:
|
|||||||||||
|
Innerwear
|
$
|
2,379,675
|
|
$
|
2,462,876
|
|
$
|
2,543,717
|
|
||
|
Activewear
|
1,792,280
|
|
1,654,278
|
|
1,601,108
|
|
|||||
|
International
|
2,344,115
|
|
2,054,664
|
|
1,531,913
|
|
|||||
|
Other
|
287,885
|
|
299,592
|
|
351,461
|
|
|||||
|
Total net sales
|
$
|
6,803,955
|
|
$
|
6,471,410
|
|
$
|
6,028,199
|
|
||
|
|
Years Ended
|
||||||||||
|
|
December 29,
2018 |
December 30,
2017 |
December 31,
2016 |
||||||||
|
Segment operating profit:
|
|||||||||||
|
Innerwear
|
$
|
526,831
|
|
$
|
580,879
|
|
$
|
615,202
|
|
||
|
Activewear
|
267,428
|
|
264,975
|
|
264,955
|
|
|||||
|
International
|
351,769
|
|
268,367
|
|
188,966
|
|
|||||
|
Other
|
25,348
|
|
31,540
|
|
41,293
|
|
|||||
|
Total segment operating profit
|
1,171,376
|
|
1,145,761
|
|
1,110,416
|
|
|||||
|
Items not included in segment operating profit:
|
|||||||||||
|
General corporate expenses
|
(186,790
|
)
|
(175,615
|
)
|
(159,728
|
)
|
|||||
|
Acquisition, integration and other action-related charges
|
(80,198
|
)
|
(190,904
|
)
|
(138,519
|
)
|
|||||
|
Amortization of intangibles
|
(36,437
|
)
|
(34,892
|
)
|
(22,118
|
)
|
|||||
|
Total operating profit
|
867,951
|
|
744,350
|
|
790,051
|
|
|||||
|
Other expenses
|
(26,395
|
)
|
(32,645
|
)
|
(66,160
|
)
|
|||||
|
Interest expense, net
|
(194,675
|
)
|
(174,435
|
)
|
(152,692
|
)
|
|||||
|
Income from continuing operations before income tax expense
|
$
|
646,881
|
|
$
|
537,270
|
|
$
|
571,199
|
|
||
For the year ended
December 29, 2018
, the Company incurred pre-tax acquisition, integration and other action-related charges of
$80,162
, of which
$38,355
is reported in the “Cost of sales” line,
$41,843
is reported in the “Selling, general and
F-48
HANESBRANDS INC.
Notes to Consolidated Financial Statements — (Continued)
Years ended December 29, 2018, December 30, 2017 and December 31, 2016
(amounts in thousands, except per share data)
administrative expenses” line and a gain of
$36
is reported in the “Other Expenses” line in the Consolidated Statement of Income. For the year ended
December 30, 2017
, the Company incurred pre-tax acquisition-related and integration charges of
$197,904
, of which
$54,970
is reported in the “Cost of sales” line,
$108,082
is reported in the “Selling, general and administrative expenses” line,
$27,852
is reported in the “Change in fair value of contingent consideration” line and
$7,000
is reported in the “Other Expenses” line in the Consolidated Statement of Income. For the year ended
December 31, 2016
, the Company incurred pre-tax acquisition, integration and other action-related charges of
$185,810
, of which
$39,379
is reported in the “Cost of sales” line,
$99,140
is reported in the “Selling, general and administrative expenses” line and
$47,291
is reported in the “Other Expenses” line in the Consolidated Statement of Income.
As part of the Hanes Europe Innerwear acquisition strategy, in 2015 the Company identified management and administrative positions that were considered non-essential and/or duplicative that have been or will be eliminated. As of
December 30, 2017
, the Company had accrued
$22,302
for expected benefit payments related to employee termination and other benefits for affected employees. During the year ended
December 29, 2018
, a net
$11,496
of benefit payments, accrual adjustments and foreign currency adjustments had been made, resulting in an ending accrual of
$10,806
, of which,
$5,641
and
$5,165
, is included in the “Accrued liabilities — Other” and “Other noncurrent liabilities” lines of the Consolidated Balance Sheet, respectively.
|
December 29,
2018 |
December 30,
2017 |
||||||
|
Assets:
|
|||||||
|
Innerwear
|
$
|
1,483,732
|
|
$
|
1,578,023
|
|
|
|
Activewear
|
1,068,927
|
|
872,132
|
|
|||
|
International
|
1,259,715
|
|
1,275,838
|
|
|||
|
Other
|
143,911
|
|
151,980
|
|
|||
|
3,956,285
|
|
3,877,973
|
|
||||
|
Corporate
(1)
|
3,299,673
|
|
3,016,802
|
|
|||
|
Total assets
|
$
|
7,255,958
|
|
$
|
6,894,775
|
|
|
|
|
Years Ended
|
||||||||||
|
December 29,
2018 |
December 30,
2017 |
December 31,
2016 |
|||||||||
|
Depreciation and amortization expense:
|
|||||||||||
|
Innerwear
|
$
|
33,348
|
|
$
|
32,000
|
|
$
|
36,591
|
|
||
|
Activewear
|
18,768
|
|
19,485
|
|
19,196
|
|
|||||
|
International
|
37,642
|
|
30,219
|
|
18,694
|
|
|||||
|
Other
|
5,601
|
|
5,891
|
|
6,576
|
|
|||||
|
95,359
|
|
87,595
|
|
81,057
|
|
||||||
|
Corporate
|
36,437
|
|
34,892
|
|
22,118
|
|
|||||
|
Total depreciation and amortization expense
|
$
|
131,796
|
|
$
|
122,487
|
|
$
|
103,175
|
|
||
F-49
HANESBRANDS INC.
Notes to Consolidated Financial Statements — (Continued)
Years ended December 29, 2018, December 30, 2017 and December 31, 2016
(amounts in thousands, except per share data)
|
|
Years Ended
|
||||||||||
|
|
December 29,
2018 |
December 30,
2017 |
December 31,
2016 |
||||||||
|
Additions to property, plant and equipment:
|
|||||||||||
|
Innerwear
|
$
|
20,459
|
|
$
|
21,427
|
|
$
|
28,078
|
|
||
|
Activewear
|
16,024
|
|
11,263
|
|
11,518
|
|
|||||
|
International
|
33,632
|
|
31,127
|
|
23,520
|
|
|||||
|
Other
|
3,221
|
|
3,455
|
|
4,353
|
|
|||||
|
73,336
|
|
67,272
|
|
67,469
|
|
||||||
|
Corporate
|
12,957
|
|
19,736
|
|
15,930
|
|
|||||
|
Total additions to long-lived assets
|
$
|
86,293
|
|
$
|
87,008
|
|
$
|
83,399
|
|
||
|
(1)
|
Principally cash and equivalents, certain fixed assets, net deferred tax assets, goodwill, trademarks and other identifiable intangibles, and certain other noncurrent assets.
|
Sales to Wal-Mart and Target were substantially in the Innerwear and Activewear segments and represented
16%
and
12%
of total sales in
2018
, respectively. Sales to Wal-Mart and Target represented
18%
and
13%
of total net sales in
2017
, respectively. Sales to Wal-Mart and Target represented
20%
and
15%
of total net sales in
2016
, respectively.
Worldwide sales by product category for Innerwear and Activewear were
$4,253,338
and
$2,550,617
, respectively, in
2018
. Worldwide sales by product category for Innerwear and Activewear were
$4,257,877
and
$2,213,533
, respectively, in
2017
. Worldwide sales by product category for Innerwear and Activewear were
$4,112,598
and
$1,915,601
, respectively, in
2016
.
|
(22)
|
Geographic Area Information
|
|
|
Years Ended or at
|
||||||||||||||||||||||
|
|
December 29,
2018 |
December 30,
2017 |
December 31,
2016 |
||||||||||||||||||||
|
|
Sales
|
Property, Net
|
Sales
|
Property, Net
|
Sales
|
Property, Net
|
|||||||||||||||||
|
Americas
|
$
|
4,658,346
|
|
$
|
402,370
|
|
$
|
4,620,931
|
|
$
|
413,900
|
|
$
|
4,693,494
|
|
$
|
411,712
|
|
|||||
|
Asia Pacific
|
1,129,605
|
|
104,305
|
|
909,539
|
|
102,430
|
|
540,917
|
|
184,271
|
|
|||||||||||
|
Europe
|
987,016
|
|
99,835
|
|
914,415
|
|
105,825
|
|
769,538
|
|
94,662
|
|
|||||||||||
|
Other
|
28,988
|
|
1,178
|
|
26,525
|
|
1,836
|
|
24,250
|
|
1,819
|
|
|||||||||||
|
$
|
6,803,955
|
|
$
|
607,688
|
|
$
|
6,471,410
|
|
$
|
623,991
|
|
$
|
6,028,199
|
|
$
|
692,464
|
|
||||||
The net sales by geographic region are attributed by customer location. The property by geographic region includes assets held and used, which are recognized within the “Property, net” line of the Consolidated Balance Sheet.
F-50
HANESBRANDS INC.
Notes to Consolidated Financial Statements — (Continued)
Years ended December 29, 2018, December 30, 2017 and December 31, 2016
(amounts in thousands, except per share data)
|
(23)
|
Quarterly Financial Data (Unaudited)
|
|
First
|
Second
|
Third
|
Fourth
|
Total
|
|||||||||||||||
|
2018
|
|||||||||||||||||||
|
Net sales
|
$
|
1,471,504
|
|
$
|
1,715,443
|
|
$
|
1,848,707
|
|
$
|
1,768,301
|
|
$
|
6,803,955
|
|
||||
|
Gross profit
|
578,921
|
|
659,956
|
|
712,667
|
|
704,975
|
|
2,656,519
|
|
|||||||||
|
Income from continuing operations
|
79,409
|
|
140,633
|
|
171,421
|
|
161,621
|
|
553,084
|
|
|||||||||
|
Net income
|
79,409
|
|
140,633
|
|
171,421
|
|
161,621
|
|
553,084
|
|
|||||||||
|
Earnings per share - basic:
|
|||||||||||||||||||
|
Continuing operations
|
0.22
|
|
0.39
|
|
0.47
|
|
0.44
|
|
1.52
|
|
|||||||||
|
Earnings per share - diluted:
|
|||||||||||||||||||
|
Continuing operations
|
0.22
|
|
0.39
|
|
0.47
|
|
0.44
|
|
1.52
|
|
|||||||||
|
2017
|
|||||||||||||||||||
|
Net sales
|
$
|
1,380,355
|
|
$
|
1,646,610
|
|
$
|
1,799,270
|
|
$
|
1,645,175
|
|
$
|
6,471,410
|
|
||||
|
Gross profit
|
539,531
|
|
645,902
|
|
678,457
|
|
626,661
|
|
2,490,551
|
|
|||||||||
|
Income (loss) from continuing operations
|
73,082
|
|
172,164
|
|
203,356
|
|
(384,611
|
)
|
63,991
|
|
|||||||||
|
Income (loss) from discontinued operations
|
(2,465
|
)
|
368
|
|
—
|
|
—
|
|
(2,097
|
)
|
|||||||||
|
Net income (loss)
|
70,617
|
|
172,532
|
|
203,356
|
|
(384,611
|
)
|
61,894
|
|
|||||||||
|
Earnings (loss) per share - basic:
|
|||||||||||||||||||
|
Continuing operations
|
0.20
|
|
0.47
|
|
0.56
|
|
(1.06
|
)
|
0.17
|
|
|||||||||
|
Discontinued operations
|
(0.01
|
)
|
—
|
|
—
|
|
—
|
|
(0.01
|
)
|
|||||||||
|
Earnings (loss) per share - diluted:
|
|||||||||||||||||||
|
Continuing operations
|
0.19
|
|
0.47
|
|
0.55
|
|
(1.06
|
)
|
0.17
|
|
|||||||||
|
Discontinued operations
|
(0.01
|
)
|
—
|
|
—
|
|
—
|
|
(0.01
|
)
|
|||||||||
F-51
TABLE OF CONTENTS
Part IItem 1. BusinessItem 1A. Risk FactorsItem 1B. Unresolved Staff CommentsItem 1C. Executive Officers Of The RegistrantItem 2. PropertiesItem 3. Legal ProceedingsItem 4. Mine Safety DisclosuresPart IIItem 5. Market For Registrant S Common Equity, Related Stockholder Matters and Issuer Purchases Of Equity SecuritiesItem 6. Selected Financial DataItem 7. Management S Discussion and Analysis Of Financial Condition and Results Of OperationsItem 7A. Quantitative and Qualitative Disclosures About Market RiskItem 8. Financial Statements and Supplementary DataItem 9. Changes in and Disagreements with Accountants on Accounting and Financial DisclosureItem 9A. Controls and ProceduresItem 9B. Other InformationPart IIIItem 10. Directors, Executive Officers and Corporate GovernanceItem 11. Executive CompensationItem 12. Security Ownership Of Certain Beneficial Owners and Management and Related Stockholder MattersItem 13. Certain Relationships and Related Transactions, and Director IndependenceItem 14. Principal Accounting Fees and ServicesPart IVItem 15. Exhibits and Financial Statement SchedulesItem 16. Form 10-k Summary