HEALTHCARE SERVICES GROUP INC
10-Ks and 10-Qs
|
|
|
|
|
|
|
|
|
|
|
|
|
|
|
|
|
|
|
|
|
|
|
|
|
|
|
|
|
|
|
|
|
|
|
|
|
|
|
|
|
|
|
|
|
|
|
|
|
|
|
|
|
|
|
|
UNITED STATES SECURITIES AND EXCHANGE COMMISSION
Washington, D.C. 20549
Form 10-K
|
|
þ
|
ANNUAL REPORT PURSUANT TO SECTION 13 OR 15(d) OF THE SECURITIES EXCHANGE ACT OF 1934
|
|
For the fiscal year ended
December 31, 2017
|
|
¨
|
TRANSITION REPORT PURSUANT TO SECTION 13 OR 15(d) OF THE SECURITIES EXCHANGE ACT OF 1934
|
|
For the transition period from to
Commission file number: 0-12015
HEALTHCARE SERVICES GROUP, INC.
(Exact name of registrant as specified in its charter)
|
Pennsylvania
|
|
23-2018365
|
|
(State or other jurisdiction of incorporation or organization)
|
|
(I.R.S. Employer Identification No.)
|
|
3220 Tillman Drive, Suite 300, Bensalem, PA
|
|
19020
|
|
(Address of principal executive offices)
|
|
(Zip Code)
|
Registrant’s telephone number, including area code:
(215) 639-4274
Securities registered pursuant to Section 12(b) of the 1934 Act:
|
Common Stock ($.01 par value)
|
|
The NASDAQ Global Select Market
|
|
Title of each class
|
|
Name of each exchange on which registered
|
Securities registered pursuant to Section 12(g) of the Act: None
Indicate by check mark if the registrant is a well-known seasoned issuer, as defined in Rule 405 of the Securities Act. YES
þ
NO
¨
Indicate by check mark if the registrant is not required to file reports pursuant to Section 13 or Section 15(d) of the Act. YES
¨
NO
þ
Indicate by check mark whether the registrant (1) has filed all reports required to be filed by Section 13 or 15(d) of the Securities Exchange Act of 1934 during the preceding 12 months (or for such shorter period that the registrant was required to file such reports), and (2) has been subject to such filing requirements for the past 90 days. YES
þ
NO
¨
Indicate by check mark whether the registrant has submitted electronically and posted on its corporate Web site, if any, every Interactive Data File required to be submitted and posted pursuant to Rule 405 of Regulation S-T (§232.405 of this chapter) during the preceding 12 months (or for such shorter period that the registrant was required to submit and post such files). YES
þ
NO
¨
Indicate by check mark if disclosure of delinquent filers pursuant to Item 405 of Regulation S-K (§ 229.405 of this chapter) is not contained herein, and will not be contained, to the best of registrant’s knowledge, in definitive proxy or information statements incorporated by reference in Part III of this Form 10-K or any amendment to this Form 10-K.
¨
Indicate by check mark whether the registrant is a large accelerated filer, an accelerated filer, a non-accelerated filer, a smaller reporting company, or an emerging growth company. See the definitions of “large accelerated filer,” “accelerated filer,” “smaller reporting company” and “emerging growth company” in Rule 12b-2 of the Exchange Act.
|
Large accelerated filer
|
þ
|
Accelerated filer
|
o
|
|||
|
Non-accelerated filer
|
o
|
(Do not check if a smaller reporting company)
|
Smaller reporting company
|
o
|
||
|
Emerging growth company
|
o
|
|||||
|
If an emerging growth company, indicate by check mark if the registrant has elected not to use the extended transition period for complying with any new or revised financial accounting standards provided pursuant to Section 13(a) of the Exchange Act.
|
o
|
|||||
Indicate by check mark whether the registrant is a shell company (as defined in Rule 12b-2 of the Act). YES
¨
NO
þ
The aggregate market value of the voting stock (Common Stock, $.01 par value) held by non-affiliates of the Registrant as of the close of business on
June 30, 2017
was approximately
$2.49 billion
based on the closing sale price of the Common Stock on the NASDAQ Global Select Market on that date. The determination of affiliate status is not a determination for any other purpose. The Registrant does not have any non-voting common equity authorized or outstanding.
Indicate the number of shares outstanding of each of the registrant’s classes of Common Stock (Common Stock, $.01 par value) as of the latest practicable date (
February 21, 2018
).
73,679,000
DOCUMENTS INCORPORATED BY REFERENCE
Portions of the definitive Proxy Statement for the Registrant’s Annual Meeting of Shareholders to be held on May 29,
2018
have been incorporated by reference into Parts II and III of this Annual Report on Form 10-K.
Healthcare Services Group, Inc.
Annual Report on Form 10-K
For the Fiscal Year Ended
December 31, 2017
TABLE OF CONTENTS
|
PART I
|
||
|
PART II
|
||
|
PART III
|
||
|
PART IV
|
||
|
Item 16.
|
Form 10-K Summary
|
|
1
CAUTIONARY STATEMENT REGARDING FORWARD-LOOKING STATEMENTS
This Form 10-K may contain forward-looking statements within the meaning of Section 27A of the Securities Act of 1933, as amended, and Section 21E of the Securities Exchange Act of 1934, as amended, which are not historical facts but rather are based on current expectations, estimates and projections about our business and industry, and our beliefs and assumptions. Words such as “believes,” “anticipates,” “plans,” “expects,” “will,” “goal,” and similar expressions are intended to identify forward-looking statements. The inclusion of forward-looking statements should not be regarded as a representation by us that any of our plans will be achieved. We undertake no obligation to publicly update or revise any forward-looking statements, whether as a result of new information, future events or otherwise. Such forward-looking information is also subject to various risks and uncertainties. Such risks and uncertainties include, but are not limited to, risks arising from our providing services exclusively to the healthcare industry, primarily providers of long-term care; having several clients who individually contributed over 3%, with one as high as
17.6%
, of our total consolidated revenues for the year ended
December 31, 2017
; credit and collection risks associated with this industry; our claims experience related to workers’ compensation and general liability insurance; the effects of changes in, or interpretations of laws and regulations governing the industry, our workforce and services provided, including state and local regulations pertaining to the taxability of our services and other labor-related matters such as minimum wage increases; continued realization of tax benefits arising from our corporate reorganization and self-funded health insurance program; risks associated with the reorganization of our corporate structure; realization of our expectations regarding the impact of the Tax Cuts and Jobs Act on our financial results; and the risk factors described in Part I in this report under “Government Regulation of Clients,” “Service Agreements and Collections” and “Competition;” and under Item IA “Risk Factors.”
These factors, in addition to delays in payments from clients and/or clients in bankruptcy or clients with which we are in litigation to collect payment, have resulted in, and could continue to result in, significant additional bad debts in the near future. Additionally, our operating results would be adversely affected if unexpected increases in the costs of labor and labor-related costs, materials, supplies and equipment used in performing services could not be passed on to our clients.
In addition, we believe that to improve our financial performance we must continue to obtain service agreements with new clients, retain and provide new services to existing clients, achieve modest price increases on current service agreements with existing clients and maintain internal cost reduction strategies at our various operational levels. Furthermore, we believe that our ability to sustain the internal development of managerial personnel is an important factor impacting future operating results and the successful execution of our projected growth strategies.
2
In this Annual Report on Form 10-K for the year ended
December 31, 2017
, Healthcare Services Group, Inc. (together with its wholly-owned subsidiaries listed in Exhibit 21, which has been filed as part of this Report) is referred to using terms such as the “Company,” “we,” “us” or “our.”
General
Healthcare Service Group, Inc. (the “Company”) is a Pennsylvania corporation, incorporated on November 22, 1976.
We provide management, administrative and operating expertise and services to the housekeeping, laundry, linen, facility maintenance and dietary service departments of healthcare facilities, including nursing homes, retirement complexes, rehabilitation centers and hospitals located throughout the United States. We believe that we are the largest provider of housekeeping and laundry management services to the long-term care industry in the nation, rendering such services to over 3,500 facilities throughout the continental United States as of December 31, 2017.
Segment Information
The information called for herein is discussed below in Description of Services, and within Item 8 of this Annual Report on Form 10-K under Note 14 in the Notes to Consolidated Financial Statements for the years ended
December 31, 2017
,
2016
and
2015
.
Description of Services
We are organized into two reportable segments: housekeeping, laundry, linen and other services (“Housekeeping”) and dietary department services (“Dietary”).
Our corporate headquarters provides centralized financial management and support, legal services, human resources management and other administrative services to the Housekeeping and Dietary business segments.
We provide Housekeeping services to essentially all of our client facilities and provide Dietary services to over
1,500
facilities. Although we do not directly participate in any government reimbursement programs, our clients receive government reimbursements related to Medicare and Medicaid and are directly affected by any legislation and regulations relating to those programs.
We provide services primarily pursuant to full service agreements with our clients. Under such agreements, we are responsible for the day-to-day management of the employees located at our clients’ facilities, as well as the provision of certain supplies. We also provide services on the basis of management-only agreements for a limited number of clients. Under a management-only agreement, we provide management and supervisory services while the client facility retains payroll responsibility for the non-supervisory staff. Our agreements with clients typically provide for a renewable one year service term, cancelable by either party upon 30 to 90 days’ notice after an initial period of 60 to 120 days.
We typically adopt and follow our clients’ employee wage structures, including policies of wage rate increases, and pass through to the client any labor cost increases associated with wage rate adjustments.
Our labor force is interchangeable with respect to the services within Housekeeping, while the Dietary labor force is specific to Dietary operations. In addition, there are some differences in the expertise of the professional management personnel responsible for the services of the respective segments. We believe that the services of each segment provide opportunities for growth.
Housekeeping
Housekeeping accounted for approximately
52.5%
, or
$979.6 million
, of our consolidated revenues in
2017
. The services provided under this segment include
managing our clients’ housekeeping departments, which are principally responsible for the cleaning, disinfecting and sanitizing of resident rooms and common areas of the clients’ facilities, as well as the laundering and processing of the bed linens, uniforms, resident personal clothing and other assorted linen items utilized at the clients’ facilities.
Upon beginning service with a client facility, we typically hire and train the employees previously employed by such facility and assign an on-site manager to supervise and train the front-line personnel and coordinate housekeeping services with other facility support functions in accordance with client requests. Such management personnel also oversee the execution of various cost- and quality-control procedures including continuous training and employee evaluation, and on-site testing for infection control.
3
Housekeeping’s operating performance is significantly impacted by our management of labor costs. Management reviews costs as a percentage of revenues, in order to normalize and evaluate such costs in the context of the Company’s growth. Housekeeping labor costs represented approximately
80.1%
of Housekeeping revenues for
2017
. Changes in employee compensation resulting from legislative or other governmental actions, market factors, adjustments to staffing levels, and the composition of our labor force may adversely impact these costs. Similarly, an increase in the costs of supplies consumed in performing Housekeeping services may impact Housekeeping’s operating performance. In
2017
, the cost of Housekeeping supplies as a percentage of Housekeeping revenues was
8.0%
. Generally, the cost of such supplies is dictated by specific product market conditions, which are subject to price fluctuations influenced by factors outside of our control. Where possible, we negotiate fixed pricing from vendors for an extended period of time on certain supplies to mitigate such price fluctuations.
Dietary
Dietary services represented approximately
47.5%
, or
$886.5 million
, of our consolidated revenues in
2017
. Dietary services consist of
managing our clients’ dietary departments which are principally responsible for food purchasing, meal preparation and professional dietitian services, which include the development of menus that meet the dietary needs of residents.
On-site management is responsible for all daily dietary department activities, with regular support being provided by a District Manager specializing in Dietary services, as well as a registered dietitian. We also offer clinical consulting services to facilities.
Dietary operating performance is also impacted by price fluctuations in labor and supply costs resulting from similar factors discussed above for Housekeeping. In
2017
, the costs of labor and food-related supplies represented approximately
56.6%
and
36.1%
of Dietary revenues, respectively.
Significant Customers
For the year ended
December 31, 2017
, both the Housekeeping and Dietary segments earned revenue from several significant customers, including Genesis Healthcare, Inc.
Operational Management Structure
By applying our professional management techniques, we offer our clients the ability to manage certain housekeeping, laundry, linen, facility maintenance and dietary services and costs. We manage and provide our services through a network of management personnel, as illustrated below.
|
Vice President of Operations
|
||||||||||||
|
↓
|
||||||||||||
|
Director of Operations
|
||||||||||||
|
↓
|
||||||||||||
|
District Manager
|
||||||||||||
|
↓
|
||||||||||||
|
Facility Manager
|
||||||||||||
Facilities are managed by an on-site Facility Manager, and if necessary, additional supervisory personnel. Such facility-level management personnel are responsible for the management of staff, scheduling, procurement, customer service, quality control and overall day-to-day management of the Housekeeping or Dietary function.
District Managers oversee the operations of the facilities within their districts. Their responsibilities include oversight of Facility Managers and management of personnel, operational performance, quality control and customer satisfaction, while ensuring adherence to the Company’s systems and budgets.
Directors of Operations oversee District Managers and provide management support, training and personnel management, while ensuring operational performance consistent with the Company’s systems and budgets.
Vice Presidents of Operations are ultimately responsible for all aspects of the operations, compliance and financial performance of the Directors of Operations who they oversee.
4
We believe that our organizational structure facilitates our ability to best serve and expand our service offerings to existing clients, while also securing new clients.
Market
The market for our services consists of a large number of facilities involved in various aspects of the healthcare industry, including long-term and post-acute care facilities (skilled nursing facilities, residential care and assisted living facilities, etc.) and hospitals (acute care, critical access, psychiatric, etc.). Such facilities may be specialized or general, privately owned or public, for-profit or not-for-profit, and may serve residents on a long-term or short-term basis. We market our services to facilities after consideration of a variety of factors including facility type, size, location, and service opportunities (Housekeeping or Dietary). The market for our services, particularly in long-term and post-acute care, is expected to continue to grow as the population of the United States ages and as government reimbursement policies require increased cost control or containment by the constituents that comprise our target market.
Marketing and Sales
Our services are primarily marketed by our Chief Revenue Officer, Vice Presidents of Sales and our Directors of Sales. These marketing and sales efforts are supported by all levels of our corporate and operational management team. We provide incentive compensation to our sales and operational personnel based on achieving financial and non-financial goals and objectives, which are aligned with the key elements we believe are necessary for us to achieve overall improvement in our financial results, along with continued business development.
Our services are marketed primarily through referrals and in-person solicitation of target facilities. We also participate in industry trade shows, healthcare trade associations and healthcare support service seminars that are offered in conjunction with state or local health authorities in many of the states in which we conduct our business. Such programs are typically attended by facility owners, administrators and supervisory personnel, thus presenting marketing opportunities for us. Indications of interest in our services arising from initial marketing efforts are followed up with a presentation regarding our services and an assessment of the service requirements of the facility. Thereafter, a formal proposal, including operational recommendations and proposed costs, is submitted to the prospective client. Once the prospective client accepts the proposal and executes our service agreement, we are structured to timely and efficiently establish our operations and systems at the client facilities.
Government Regulation of Clients
We do not directly participate in any government reimbursement programs and our contractual relationships with our clients determine their payment obligations to us. However, our clients are subject to government regulation and laws and rulings which directly affect how they are paid for certain services they provide. Therefore, because our clients’ revenues are generally highly reliant on Medicare and Medicaid reimbursement funding rates, the overall effect of laws and trends in the long-term care industry have affected and could adversely affect our clients’ cash flows, resulting in their inability to make payments to us in accordance with agreed upon payment terms (see “Liquidity and Capital Resources” included in our “Management’s Discussion and Analysis of Financial Condition and Results of Operations”).
The prospects for legislative action, both on the federal and state level, regarding funding for nursing homes are uncertain. We are unable to predict or to estimate the ultimate impact of any further changes in reimbursement programs affecting our clients’ future results of operations and/or their impact on our cash flows and operations.
Environmental Regulation
Our operations are subject to various federal, state and/or local laws concerning emissions into the air, discharges into waterways and the generation, handling and disposal of waste and hazardous substances. Our past expenditures relating to environmental compliance have not had a material effect on our cash flows or results of operations and are included in normal operating expenses. These laws and regulations are constantly evolving, and it is impossible to predict accurately the effect they may have upon the capital expenditures, earnings and our competitive position in the future. Based upon information currently available, we believe that expenditures relating to environmental compliance will not have a material impact on the financial position of the Company.
Service Agreements and Collections
We have historically had a favorable client retention rate and expect to continue to maintain satisfactory relationships with our clients, despite many of our service agreements being cancelable on short notice.
5
We have had varying collections experiences with respect to our accounts and notes receivable. We have sometimes extended the period of payment for certain clients beyond contractual terms. Such clients include those who have terminated service agreements and slow payers experiencing financial difficulties. Related to these collection matters, we have recorded bad debt provisions (in an Allowance for Doubtful Accounts) of
$6.3 million
,
$4.6 million
and
$4.3 million
in the years ended
December 31, 2017
,
2016
and
2015
, respectively (see Schedule II - Valuation and Qualifying Accounts and Reserves for year-end balances). As a percentage of total revenues, these provisions represented approximately
0.3%
for each of the years ended
December 31, 2017
,
2016
and
2015
. In making our credit evaluations, we consider customer-specific risks as well as the general collection risk associated with trends in the long-term care industry. We establish credit limits, perform ongoing credit evaluations and monitor accounts to minimize the risk of loss. Despite our efforts to minimize credit risk exposure, our clients could be adversely affected if future industry trends change in a way that negatively impacts their cash flows, as discussed in “Government Regulation of Clients” and “Risk Factors” in this report. If our clients experience a negative impact on their cash flows, it could have a material adverse effect on our consolidated results of operations and financial condition.
Competition
We compete primarily with the in-house service departments of our potential clients. Most healthcare facilities perform their own support service functions without relying upon outside management firms. In addition, a number of local firms compete with us in the regional markets in which we conduct business. Several national service firms are larger and have greater financial and marketing resources than we do, although historically such firms have concentrated their marketing efforts primarily on hospitals, rather than the long-term care facilities typically serviced by us.
Employees
At
December 31, 2017
, we employed over
55,000
people, of which approximately
6,700
were corporate and field management personnel. Approximately
10%
of our employees are unionized. The majority of these union employees are subject to collective bargaining agreements that are negotiated by individual client facilities and are assented by us, so as to bind us as an “employer” under the agreements. In other cases, we are direct parties to the agreements. We may be adversely affected by relations between our client facilities and their employee unions, or between us and such unions. We consider our relationship with our employees to be good.
Available Information
Healthcare Services Group, Inc. is a reporting company under the Securities Exchange Act of 1934, as amended, and files reports, proxy statements and other information with the Securities and Exchange Commission (the “Commission” or “SEC”). The public may read and copy any of our filings at the Commissioner’s Public Reference Room at 100 F Street, N.E., Washington, D.C. 20549. You may obtain information on the operation of the Public Reference Room by calling the Commission at 1-800-SEC-0330. Additionally, because we make filings to the Commission electronically, you may access this information at the Commission’s internet site:
www.sec.gov
. This site contains reports, proxies and information statements and other information regarding issuers that file electronically with the Commission.
Website Access
Our website address is
www.hcsg.com
. Our filings with the Commission, as well as other pertinent financial and Company information, are available at no cost on our website as soon as reasonably practicable after the filing of such reports with the Commission.
6
Item 1A.
Risk Factors.
You should carefully consider the risk factors we have described below, as well as other related information contained within this annual report on Form 10-K as these factors could materially and adversely affect our business, results of operations, financial condition and cash flows. We believe that the risks described below are our most significant risk factors but there may be risks and uncertainties that are not currently known to us or that we currently deem to be immaterial.
We provide services to several clients which contribute significantly, on an individual as well as an aggregate basis, to our total revenues.
We have several clients who individually contributed over 3%, with one as high as
17.6%
, of our total consolidated revenues for the year ended
December 31, 2017
. Although we expect to continue the relationship with these clients, there can be no assurance thereof. The loss, individually or in aggregate, of such clients, or a significant reduction in the revenues we receive from such clients, could have a material adverse effect on the results of operations of our two operating segments and the Company. In addition, if any of these clients change or alter current payment terms it could increase our accounts receivable balance and have a material adverse effect on our cash flows.
Our clients are concentrated in the healthcare industry, which is subject to changes in government regulation. Many of our clients rely on reimbursement from Medicare, Medicaid and other third-party payors. Rates from such payors may be altered or reduced, thus affecting our clients’ results of operations and cash flows.
We provide our services primarily to providers of long-term and post-acute care. We cannot predict what efforts, and to what extent, legislation and proposals to contain healthcare costs will ultimately impact our clients’ revenues through reimbursement rate modifications. Congress has enacted a number of laws during the past decade that have significantly altered, and may continue to alter, overall government reimbursement for nursing home services. Because many of our clients’ revenues are generally highly reliant on Medicare, Medicaid and other third-party payors’ reimbursement funding rates and mechanisms, the overall effect of these laws and trends in the long-term care industry have affected and could adversely affect our clients’ cash flows, resulting in their inability to make payments to us on agreed upon payment terms. These factors, in addition to delays in payments from clients have resulted in, and could continue to result in, significant additional bad debts in the future.
Changes to federal healthcare legislation may adversely affect our operating costs and results of operations.
Continued changes to the healthcare structure and regulations related to the health insurance industry in the United States could impact our operating costs. Any requirements to provide additional benefits to our employees or the payment of penalties if such benefits are not provided, would increase our expenses. If we are unable to pass-through these charges to our clients to cover these expenses, such increases could adversely impact our operating costs and our results of operations.
In addition, often new regulations result in additional reporting requirements for businesses. These and other requirements could result in increased costs, expanded liability exposure, and other changes in the way we provide healthcare insurance and other benefits to our employees.
We have clients located in many states which have had and may continue to
experience significant budget deficits and such deficits may result in reduction of
reimbursements to nursing homes.
Many states in which our clients are located have significant budget deficits as a result of lower than projected revenue collections and increased demand for the funding of entitlements. As a result of these and other adverse economic factors, state Medicaid programs have and may continue to revise reimbursement structures for nursing home services. Any disruption or delay in the distribution of Medicaid and related payments to our clients will adversely affect their cash flows and impact their ability to pay us as agreed upon for the services provided.
7
The Company has substantial investment in the creditworthiness and financial condition of our customers.
The largest current asset on our balance sheet is the accounts and notes receivable balance from our customers. We grant credit to substantially all of our customers. Deterioration in the financial condition of a significant component of our customer base could hinder our ability to collect amounts due from our customers. Potential causes of such declines include national or local economic downturns, customers’ dependence on continued Medicare and Medicaid funding and the impact of additional regulatory actions. We have sometimes been required to extend the period of payment for certain clients beyond contractual terms. Such clients include those who have terminated service agreements and slow payers experiencing financial difficulties. In making our credit evaluations, in addition to analyzing and anticipating, where possible, the specific cases described above, we consider the general collection risk associated with trends in the long-term care industry. We also establish credit limits, perform ongoing credit evaluations and monitor accounts to minimize the risk of loss. Despite our efforts to minimize credit risk exposure, our clients could be adversely affected if future industry trends change in such a manner as to negatively impact their cash flows. If our clients experience a negative impact in their cash flows, it could have a material adverse effect on our consolidated results of operations, financial condition and cash flows.
We have a Paid Loss Retrospective Insurance Plan for general liability and
workers’ compensation insurance.
We carry a high deductible general liability and workers’ compensation program and therefore retain a substantial portion of the risk associated with the possible losses under such programs. Under our insurance plans for general liability and workers’ compensation, predetermined loss limits are arranged with our insurance company to limit both our per occurrence cash outlay and annual insurance plan cost. We regularly evaluate our claims pay-out experience and other factors related to the nature of specific claims in arriving at the basis for our accrued insurance claims estimate. Our evaluation is based primarily on current information derived from reviewing our claims experience and industry trends. In the event that our known claims experience and/or industry trends result in an unfavorable change in initial estimates of costs to settle such claims resulting from, among other factors, the severity levels of reported claims and medical cost inflation, it would have an adverse effect on our consolidated results of operations, financial condition and cash flows. Although we engage third-party experts to assist us in estimating appropriate reserves, the determination of the required reserves is dependent upon significant actuarial judgments. Changes in our insurance reserves as a result of our periodic evaluation of the related liabilities may cause significant fluctuations in our operating results.
Federal, state and local tax rules can adversely impact our results of operations and financial position.
We are subject to federal, state and local taxes in the United States. Significant judgment is required in determining the provision for income taxes. We believe our income tax estimates are reasonable. Although, if the Internal Revenue Service or other taxing authority disagrees a tax position we’ve taken and upon final adjudication we are unsuccessful, we could incur additional tax liability, including interest and penalties. Such costs and expenses could have a material adverse impact on our results of operations and financial position. Additionally, the taxability of our services is subject to various interpretations within the taxing jurisdictions in which we operate. Consequently, in the ordinary course of business, a jurisdiction may contest our reporting positions with respect to the application of its tax code to our services. A conflicting position taken by a state or local taxation authority on the taxability of our services could result in additional tax liabilities and could negatively impact our competitive position in that jurisdiction. Additionally, if we fail to comply with applicable tax laws and regulations, we could suffer civil or criminal penalties in addition to the delinquent tax assessment. In the taxing jurisdictions where our services have been determined to be subject to tax, the jurisdiction may increase the tax rate assessed on such services. We seek to pass-through to our clients such tax increases. In the event we are not able to pass-through any portion of the tax increase, our results of operations, financial condition and cash flows could be adversely impacted.
8
Our business and financial results could be adversely affected by unfavorable
results of material litigation or governmental inquiries.
We are currently involved in civil litigation and government inquiries which arise in the ordinary course of business. These matters relate to, among other things, general liability, payroll or employee-related matters. Legal actions could result in substantial monetary damages and expenses and may adversely affect our reputation and business status with our clients, whether or not we are ultimately determined to be liable. The outcome of litigation, particularly class action and collective action lawsuits and regulatory actions, is difficult to assess or quantify. The plaintiffs in these types of actions may seek recovery of very large or indeterminate amounts, and estimates may remain unknown for substantial periods of time.
We assess contingencies to determine the degree of probability and range of possible loss for potential accrual in our financial statements. We would accrue an estimated loss contingency in our financial statements if it were probable that a liability had been incurred and the amount of the loss could be reasonably estimated. Due to the unpredictable nature of litigation, assessing contingencies is highly subjective and requires judgments about future events. The amount of actual losses may differ from our current assessment. As a result of the costs and expenses of defending ourselves against lawsuits or claims, and risks and consequences of legal actions, regardless of merit, our results of operations and financial position could be adversely affected or cause variability in our results compared to expectations.
We primarily provide our services pursuant to agreements which have a one year
term, cancelable by either party upon 30 to 90 days’ notice after an initial 60 to 120 day service agreement period.
We do not enter into long-term contractual agreements with our clients for the rendering of our services. Consequently, our clients can unilaterally decrease the amount of services we provide or terminate all services pursuant to the terms of our service agreements. Any loss of a significant number of clients during the first year of providing services, for which we have incurred significant start-up costs or have invested in equipment installations, could in the aggregate materially adversely affect our consolidated results of operations and financial position.
The Company’s business success depends on the management experience of our key personnel.
We manage and provide our services through a network of management personnel, from on-site facility managers to our executive officers. Therefore, we believe that our ability to recruit and sustain the internal development of managerial personnel is an important factor impacting future operating results and our ability to successfully execute projected growth strategies. Our professional management personnel are the key personnel in maintaining current and selling additional services to existing clients and obtaining new clients.
Governmental regulations related to labor, employment, immigration and health and safety could adversely impact our results of operations and financial condition.
Our business is subject to various federal, state, and local laws and regulations in areas such as labor, employment, immigration, and health and safety. These laws frequently evolve through case law, legislative changes and changes in regulatory interpretation, implementation and enforcement. Our policies and procedures and compliance programs are subject to adjustments in response to these changing regulatory and enforcement environments, which could increase our cost of services provided. Although we have contractual rights to pass cost increases we incur to our clients due to regulatory changes, our delay in, or inability to pass such costs through to our clients, could have a material adverse effect on our financial condition, results of operations and cash flows.
In addition, if we fail to comply with applicable laws, we may be subject to lawsuits, investigations, criminal sanctions or civil remedies, including fines, penalties, damages, reimbursement, or injunctions. Also, our clients’ facilities are subject to periodic inspection by federal, state, and local authorities for compliance with state and local departments of health requirements. Expenses resulting from failed inspections of the departments that we service could result in our clients being fined and seeking recovery from us, which could also adversely impact our financial condition, results of operations and cash flows.
9
We may be adversely affected by inflationary or market fluctuations in the cost of products consumed in providing our services or our cost of labor. Additionally, we rely on certain vendors for housekeeping, laundry and dietary supplies.
The prices we pay for the principal items we consume in performing our services are dependent primarily on current market prices. We have consolidated certain supply purchases with national vendors through agreements containing negotiated prospective pricing. In the event such vendors are not able to comply with their obligations under the agreements and we are required to seek alternative suppliers, we may incur increased costs of supplies.
Dietary supplies, to a much greater extent than Housekeeping supplies, are impacted by commodity pricing factors, which in many cases are unpredictable and outside of our control. We seek to pass on to clients such increased costs but sometimes we are unable to do so. Even when we are able to pass on such costs to our clients, from time to time, sporadic unanticipated increases in the costs of certain supply items due to market or economic conditions may result in a timing delay in passing on such increases to our clients. It is this type of spike in Dietary supplies costs that could most adversely affect Dietary’s operating performance. The adverse effect would be realized if we delay in passing on such costs to our clients or in instances where we may not be able to pass such increase on to our clients until the time of our next scheduled service billing review. We seek to mitigate the impact of an unanticipated increase in such supplies’ costs through consolidation of vendors, which increases our ability to obtain more favorable pricing.
Our cost of labor may be influenced by factors in certain market areas or changes in the respective collective bargaining agreements to which we are a party. A substantial number of our employees are hourly employees whose wage rates are affected by increases in the federal or state minimum wage rates, wage inflation or local job market adjustments. As collective bargaining agreements are renegotiated, we may need to increase the wages paid to bargaining unit employees covered by such collective bargaining agreements. Although we have contractual rights to pass such union and minimum wage increases through to our clients, our delay in, or inability to pass such wage increases through to our clients could have a material adverse effect on our financial condition, results of operations and cash flows.
Any perceived or real health risks related to the food industry could adversely affect our Dietary segment.
We are subject to risks affecting the food industry generally, including food spoilage and food contamination. Our products are susceptible to contamination by disease-producing organisms, or pathogens, such as listeria monocytogenes, salmonella, campylobacter, hepatitis A, trichinosis and generic E. coli. Because these pathogens are generally found in the environment, there is a risk that these pathogens could be introduced to our products as a result of improper handling at the manufacturing, processing or food service level. Our suppliers’ manufacturing facilities and products are subject to extensive laws and regulations relating to health, food preparation, sanitation and safety standards. Difficulties or failures by these companies in obtaining any required licenses or approvals or otherwise complying with such laws and regulations could disrupt their operations which could adversely affect our operations. Furthermore, there can be no assurance that compliance with governmental regulations by our suppliers will eliminate the risks related to food safety. To the extent there is an outbreak of food related illness in any of our client facilities, it could materially harm our business, results of operations and financial condition.
Additionally, the Company may be subject to liability if the consumption of our food products causes injury, illness or death. Even if a product liability claim is unsuccessful or is not fully pursued, the negative publicity surrounding any assertion that our products caused injury or illness could adversely affect the our reputation.
Changes in interest rates and changes in financial market conditions may result in fluctuating and even negative returns in our investments, and could increase the cost of the borrowings under our borrowing agreements.
Although management believes we have a prudent investment policy, we are exposed to fluctuations in interest rates and in the market value of our investment portfolio which could adversely impact our financial condition and results of operations. Our marketable securities consist of municipal bonds. We believe that our investment criteria, which include diversification among issuers of bonds, requirements regarding credit ratings and monitoring of our investments’ duration periods, reduce our exposure related to the financial distress and budget shortfalls that many state and local governments currently face. Increases in market interest rates could adversely affect our payment obligations with respect to our variable-rate borrowing agreements and adversely affect our liquidity and earnings.
10
Investor and market expectations regarding our financial performance are high and rely greatly on execution of our growth
strategy and related increases in financial performance.
Management believes the historical performance of our Common Stock reflect high market expectations for our future operating results. Our ability to attract new clients through organic growth or acquisitions, and retain existing clients, has enabled us to execute our growth strategy and increase market share historically, however this cannot be guaranteed in the future. Our business strategy focuses on growth and improving profitability through obtaining service agreements with new clients, providing new services to existing clients, obtaining modest price increases on service agreements with clients and maintaining internal cost reduction strategies at our various operational levels. With respect to providing new services to new or existing clients, our strategy is to achieve corresponding profit margins in each of our segments. If we are unable to continue either historical client revenue and profitability growth rates or projected improvement, our operating performance may be adversely affected and the high expectations for our market performance may not be met. Any failure to meet the market’s high expectations for our revenue and operating results may have an adverse effect on the market price of our Common Stock.
Failure to maintain effective internal control over financial reporting could have a material adverse effect on our ability to report our financial results on a timely and accurate basis.
Failure to maintain appropriate and effective internal controls over our financial reporting could result in misstatements in our financial statements and potentially subject us to sanctions or investigations by the SEC or other regulatory authorities, and could cause us to delay the filing of required reports with the SEC and our reporting of financial results. Any of these events could result in a decline in the market price of our Common Stock. Although we have taken steps to maintain our internal control structure as required, we cannot guarantee that control deficiencies will not result in a misstatement in the future.
Any decrease in or suspension of our dividend could cause our stock price to decline.
We expect to continue to pay a regular quarterly cash dividend. However, our dividend policy and the payment of future cash dividends under the policy are subject to the final determination each quarter by our Board of Directors that (i) the dividend will be made in compliance with laws applicable to the declaration and payment of cash dividends, including Section 1551(b) of the Pennsylvania Business Corporation Law, and (ii) the policy remains in our best interests, which determination will be based on a number of factors, including the impact of changing laws and regulations, economic conditions, our results of operations and/or financial condition, capital resources, the ability to satisfy financial covenants and other factors considered relevant by the Board of Directors. While we have continually increased the amount of our dividends, given these considerations, there can be no assurance these increases will continue and our Board of Directors may increase or decrease the amount of the dividend at any time and may also decide to suspend or discontinue the payment of cash dividends in the future. Any decrease in the amount of the dividend, or suspension or discontinuance of payment of a dividend, could cause our stock price to decline.
Cyber attacks and breaches could cause operational disruptions, fraud or theft of sensitive information.
Aspects of our operations are reliant upon internet-based activities, such as ordering supplies and back-office functions such as accounting and transaction processing, making and accepting payments, processing payroll and other administrative functions, etc. Although we have taken measures to protect our technology systems and infrastructure, including employee education programs regarding cybersecurity, a breach of the security surrounding these functions could result in operational disruptions, theft or fraud, or exposure of sensitive information to unauthorized parties. Such events could result in additional costs related to operational inefficiencies, or damages, claims or fines.
11
Item 1B.
Unresolved Staff Comments.
None.
Item 2.
Properties.
We lease our corporate offices, located at 3220 Tillman Drive, Bensalem, Pennsylvania 19020.We also lease office space at other locations in Pennsylvania, Colorado, South Carolina, Connecticut, Georgia, California and New Jersey. The New Jersey office is the headquarters of our subsidiaries, including HCSG Insurance Corp. The other locations serve as divisional or regional offices providing management and administrative services to both of our operating segments in their respective geographical areas.
We are also provided with office and storage space at each of our clients’ facilities.
Management does not foresee any difficulties with regard to the continued utilization of these premises. We also believe that such properties are sufficient to support our current operations.
We own office furniture and equipment, housekeeping and laundry equipment, and vehicles. The office furniture and equipment and vehicles are primarily located at the corporate office, divisional and regional offices. We have housekeeping equipment at all client facilities where we provide services under a full service housekeeping agreement. Generally, the aggregate cost of housekeeping equipment located at each client facility is approximately $3,000. Additionally, we have laundry installations at certain client facilities. The cost of such laundry installations ranges between $5,000 and $100,000. We believe that such laundry equipment, office furniture and equipment, housekeeping equipment and vehicles are sufficient to support our current operations.
Item 3.
Legal Proceedings.
In the normal course of business, the Company is involved in various administrative and legal proceedings, including labor and employment, contractual, personal injury, workers compensation and insurance matters. We believe the Company is not a party to, nor are any of its properties the subject of, any pending legal proceeding or governmental examination that would have a material adverse effect on our consolidated financial condition or liquidity. However, in light of the uncertainties involved in such proceedings, the ultimate outcome of a particular matter could become material to our results of operations for a particular period depending on, among other factors, the size of the loss or liability imposed and the level of our operating income for that period.
Not applicable.
12
Item 5.
Market for Registrant’s Common Equity,
Related Stockholder Matters and Issuer
Purchases of Equity Securities.
Market Information
The Company’s Common Stock, $.01 par value (the “Common Stock”), is traded under the symbol “HCSG” on the NASDAQ Global Select Market. As of
February 21, 2018
, there were approximately
73.7 million
shares of our Common Stock outstanding.
The high and low sales price quotations for our Common Stock and the cash dividends declared during the years ended
December 31, 2017
and
2016
were as follows:
|
Quarter Ended
|
High
|
Low
|
Cash Dividends Declared
|
|||||||||
|
March 31, 2017
|
$
|
43.91
|
|
$
|
37.54
|
|
$
|
0.18750
|
|
|||
|
June 30, 2017
|
$
|
50.00
|
|
$
|
41.05
|
|
$
|
0.18875
|
|
|||
|
September 30, 2017
|
$
|
55.68
|
|
$
|
45.10
|
|
$
|
0.19000
|
|
|||
|
December 31, 2017
|
$
|
55.29
|
|
$
|
49.09
|
|
$
|
0.19125
|
|
|||
|
Quarter Ended
|
High
|
Low
|
Cash Dividends Declared
|
|||||||||
|
March 31, 2016
|
$
|
36.99
|
|
$
|
31.50
|
|
$
|
0.18250
|
|
|||
|
June 30, 2016
|
$
|
41.40
|
|
$
|
36.47
|
|
$
|
0.18375
|
|
|||
|
September 30, 2016
|
$
|
42.18
|
|
$
|
36.58
|
|
$
|
0.18500
|
|
|||
|
December 31, 2016
|
$
|
40.88
|
|
$
|
34.83
|
|
$
|
0.18625
|
|
|||
Dividends
On
January 30, 2018
, our Board of Directors declared a regular quarterly cash dividend of
$0.19125
per common share, which will be paid on
March 23, 2018
to shareholders of record as of the close of business on
February 16, 2018
.
Our Board of Directors reviews the dividend policy on a quarterly basis. Although there can be no assurance that the Company will continue to pay dividends or the amount of the dividend, we expect to continue to pay a regular quarterly cash dividend. In connection with the establishment of the Company’s dividend policy, the Company adopted a Dividend Reinvestment Plan in 2003.
Holders
As of
February 21, 2018
, we had approximately
500
holders of record of our Common Stock. Based on reports of security position listings compiled for the
2017
annual meeting of shareholders, we believe we may have approximately
7,000
beneficial owners of our Common Stock.
13
Securities Authorized for Issuance Under Equity Compensation Plans
The following table sets forth for the Company’s equity compensation plans, on an aggregated basis, the number of shares of our Common Stock subject to outstanding stock awards, the weighted-average exercise price of stock awards, and the number of shares remaining available for future award grants as of
December 31, 2017
.
|
Number of Securities to be Issued Upon Exercise of Outstanding Options, Warrants and Rights
|
Weighted-Average Exercise Price of Outstanding Options, Warrants and Rights
|
Number of Securities Remaining Available for Future Issuance Under Equity Compensation Plans (Excluding Securities Reflected in Column (a))
|
||||||||||
|
Plan Category
|
(a)
|
(b)
|
(c)
|
|||||||||
|
(in thousands, except per share amounts)
|
||||||||||||
|
Equity compensation plans approved by security holders
|
2,374
|
|
(1)
|
$
|
29.22
|
|
3,422
|
|
(2)
|
|||
|
Equity compensation plans not approved by security holders
|
—
|
|
—
|
|
—
|
|
||||||
|
Total
|
2,374
|
|
$
|
29.22
|
|
3,422
|
|
|||||
(1)
Represents shares of Common Stock issuable upon exercise of outstanding stock awards granted under the 2012 Equity Incentive Plan and carryover shares from pre-existing Plans.
(2)
Includes stock awards to purchase
0.8 million
shares available for future grant under the Company’s 2012 Equity Incentive Plan,
2.3 million
shares available for issuance under the Company’s 1999 Employee Stock Purchase Plan (the “1999 Plan”) as amended and
0.4 million
shares available for issuance under the Company’s Amended and Restated Deferred Compensation Plan. Treasury shares may be issued under the 1999 Plan and the Company’s Amended and Restated Deferred Compensation Plan.
Performance Graph
The following graph matches Healthcare Services Group, Inc.’s cumulative five-year total shareholder return on Common Stock with the cumulative total returns of the S&P 500 index, the NASDAQ Composite index and the Russell 2000 index. The graph tracks the performance of a $100 investment in our Common Stock and in each index (with the reinvestment of all dividends) from
December 31, 2012
to
December 31, 2017
. The stock price performance included in this graph is not necessarily indicative of future stock price performance.
We have not defined a peer group based on either industry classification or financial characteristics. We believe the Company is unique in its service offerings and client base, and among its closest industry peers, it is unique in size and financial profile. As such, we opted to utilize the Russell 2000 index to compare the Company performance to issuers with similar market capitalization.
14
Comparison of 5 Year Cumulative Total Return*
Among Healthcare Services Group, Inc., the S&P 500 Index, the NASDAQ Composite Index and the Russell 2000 Index
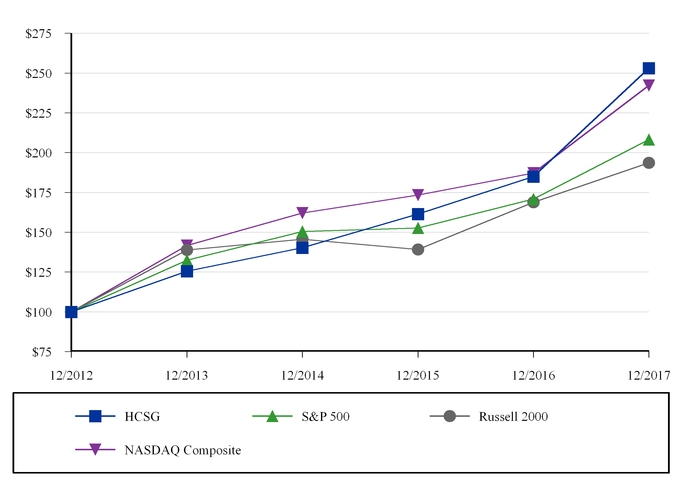
*$100 invested on
December 31, 2012
in stock or index, including reinvestment of dividends.
Fiscal year ending December 31.
Copyright© 2017 Standard & Poor’s, a division of S&P Global. All rights reserved.
Copyright© 2017 Russell Investment Group. All rights reserved.
Fiscal year ending December 31.
Copyright© 2017 Standard & Poor’s, a division of S&P Global. All rights reserved.
Copyright© 2017 Russell Investment Group. All rights reserved.
|
December 31,
|
||||||||||||||||||||||||
|
Company/Index
|
2012
|
2013
|
2014
|
2015
|
2016
|
2017
|
||||||||||||||||||
|
Healthcare Services Group, Inc.
|
$
|
100.00
|
|
$
|
125.52
|
|
$
|
140.22
|
|
$
|
161.47
|
|
$
|
185.00
|
|
$
|
253.03
|
|
||||||
|
S&P 500
|
$
|
100.00
|
|
$
|
132.39
|
|
$
|
150.51
|
|
$
|
152.59
|
|
$
|
170.84
|
|
$
|
208.14
|
|
||||||
|
Russell 2000
|
$
|
100.00
|
|
$
|
138.82
|
|
$
|
145.62
|
|
$
|
139.19
|
|
$
|
168.85
|
|
$
|
193.58
|
|
||||||
|
NASDAQ Composite
|
$
|
100.00
|
|
$
|
141.63
|
|
$
|
162.09
|
|
$
|
173.33
|
|
$
|
187.19
|
|
$
|
242.29
|
|
||||||
Unregistered Sales of Equity Securities and Use of Proceeds
During the second quarter 2017, the Company issued
59,000
shares of common stock to a qualified offeree in accordance with the exemption provided by Section 4(a)(2) of the Securities Act of 1933, as amended.
15
Item 6.
Selected Financial Data.
The following selected condensed consolidated financial data has been derived from, and should be read in conjunction with “Management’s Discussion and Analysis of Financial Condition and Results of Operations” and our Consolidated Financial Statements and Notes thereto, included elsewhere in this report on Form 10-K and incorporated herein by reference.
|
|
Years Ended December 31,
|
||||||||||||||||||
|
|
2017
|
2016
|
2015
|
2014
|
2013
|
||||||||||||||
|
|
(in thousands, except per share amounts)
|
||||||||||||||||||
|
Selected Operating Results
|
|||||||||||||||||||
|
Revenues
|
$
|
1,866,131
|
|
$
|
1,562,662
|
|
$
|
1,436,849
|
|
$
|
1,293,183
|
|
$
|
1,149,890
|
|
||||
|
Net income
|
$
|
88,226
|
|
$
|
77,396
|
|
$
|
58,024
|
|
$
|
21,850
|
|
$
|
47,129
|
|
||||
|
Basic earnings per common share
|
$
|
1.20
|
|
$
|
1.06
|
|
$
|
0.81
|
|
$
|
0.31
|
|
$
|
0.68
|
|
||||
|
Diluted earnings per common share
|
$
|
1.19
|
|
$
|
1.05
|
|
$
|
0.80
|
|
$
|
0.31
|
|
$
|
0.67
|
|
||||
|
Selected Balance Sheet Data
|
|
|
|
|
|
||||||||||||||
|
Total assets
|
$
|
676,003
|
|
$
|
528,446
|
|
$
|
480,949
|
|
$
|
469,579
|
|
$
|
425,342
|
|
||||
|
Stockholders’ equity
|
$
|
399,952
|
|
$
|
338,842
|
|
$
|
296,456
|
|
$
|
275,830
|
|
$
|
285,143
|
|
||||
|
Selected Other Financial Data
|
|
|
|
|
|
||||||||||||||
|
Working capital
|
$
|
343,238
|
|
$
|
313,753
|
|
$
|
269,277
|
|
$
|
213,414
|
|
$
|
207,750
|
|
||||
|
Cash dividends declared per common share
|
$
|
0.75750
|
|
$
|
0.73750
|
|
$
|
0.71750
|
|
$
|
0.69750
|
|
$
|
0.67750
|
|
||||
|
Weighted average number of common shares outstanding - basic
|
73,355
|
|
72,754
|
|
71,826
|
|
70,616
|
|
69,206
|
|
|||||||||
|
Weighted average number of common shares outstanding - diluted
|
74,348
|
|
73,474
|
|
72,512
|
|
71,341
|
|
70,045
|
|
|||||||||
Item 7.
Management’s Discussion and Analysis
of Financial Condition and Results of
Operation.
You should read the following discussion and analysis of our financial condition and results of our operations in conjunction with our Consolidated Financial Statements and the related notes to those statements included elsewhere in this report. This discussion contains forward-looking statements reflecting our current expectations that involve risks and uncertainties. Our actual results and the timing of events may differ materially from those contained in these forward-looking statements due to a number of factors, including those discussed in the section entitled “Risk Factors,” and elsewhere in this report on Form 10-K. We are on a calendar year end, and except where otherwise indicated, “
2017
” refers to the year ended
December 31, 2017
, “
2016
” refers to the year ended
December 31, 2016
and “
2015
” refers to the year ended
December 31, 2015
.
Results of Operations
The following discussion is intended to provide the reader with information that will be helpful in understanding our financial statements, including the changes in certain key items in comparing financial statements period to period. We also intend to provide the primary factors that accounted for those changes, as well as a summary of how certain accounting principles affect our financial statements. In addition, we are providing information about the financial results of our two operating segments to further assist in understanding how these segments and their results affect our consolidated results of operations. This discussion should be read in conjunction with our financial statements as of
December 31, 2017
and for the year then ended and the notes accompanying those financial statements.
Overview
We provide management, administrative and operating expertise and services to the housekeeping, laundry, linen, facility maintenance and dietary service departments of healthcare facilities, including nursing homes, retirement complexes, rehabilitation centers and hospitals located throughout the United States. We believe that we are the largest provider of housekeeping and laundry management services to the long-term care industry in the nation, rendering such services to over 3,500 facilities throughout the continental United States as of December 31, 2017.
16
We provide services primarily pursuant to full service agreements with our clients. Under such agreements, we are responsible for the day-to-day management of the employees located at our clients’ facilities, as well as the provision of certain supplies. We also provide services on the basis of management-only agreements for a limited number of clients. Under a management-only agreement, we provide management and supervisory services while the client facility retains payroll responsibility for the non-supervisory staff. Our agreements with clients typically provide for a renewable one year service term, cancelable by either party upon 30 to 90 days’ notice after an initial period of 60 to 120 days.
We are organized into two reportable segments: housekeeping, laundry, linen and other services (“Housekeeping”) and dietary department services (“Dietary”).
Housekeeping consists of
managing our clients’ housekeeping departments, which are principally responsible for the cleaning, disinfecting and sanitizing of resident rooms and common areas of the clients’ facilities, as well as the laundering and processing of the bed linens, uniforms, resident personal clothing and other assorted linen items utilized at the clients’ facilities.
Dietary consists of
managing our clients’ dietary departments which are principally responsible for food purchasing, meal preparation and professional dietitian services, which include the development of menus that meet the dietary needs of residents.
At
December 31, 2017
, Housekeeping services were provided at essentially all of our more than
3,500
client facilities, generating approximately
52.5%
, or
$979.6 million
, of
2017
total revenues. Dietary services were provided to over
1,500
client facilities at
December 31, 2017
and contributed approximately
47.5%
, or
$886.5 million
, of
2017
total revenues.
Our workers’ compensation, general liability and certain employee health and welfare insurance programs are provided by HCSG Insurance Corp. (“HCSG Insurance” or the “Captive”), our wholly owned captive insurance subsidiary. HCSG Insurance provides the Company with greater flexibility and cost efficiency in meeting our insurance needs. In 2015, we completed a corporate restructuring by capitalizing three new operating entities and transitioning our facility-based employees to such entities based on the geography served. As a result, (i) HCSG Insurance provides workers’ compensation, general liability and other insurance coverages to such entities with respect to such transitioned workforce, (ii) such entities provide housekeeping, laundry and dietary services as a subcontracted provider to the Company, and (iii) the Company provides strategic client-service management and administrative support services to such entities.
Our ability to acquire new clients, retain existing clients and increase revenues are affected by many factors. Competitive factors consist primarily of competing with potential clients’ use of in-house support staff, as well as local or regional companies providing services similar to ours. We are unaware of any other companies, on a national, regional or local level, which have a significant presence or will impact our ability to secure new clients in our market. We believe the primary revenue drivers of our business are our ability to obtain new clients and to provide additional services to existing clients. In addition, we seek to pass through, by means of service billing increases, increases in our cost of providing the services, while also aiming to obtain modest annual revenue increases from our existing clients to attain desired profit margins at the facility level. The primary economic factor in acquiring new clients is our ability to demonstrate the cost-effectiveness of our services, because many of our clients’ revenues are generally highly reliant on Medicare and Medicaid reimbursements. Therefore, our clients’ economic decision-making is driven significantly by their reimbursement funding rate structure and the financial impact on their reimbursement as a result of engaging us for the respective services. The primary operational factor is our ability to demonstrate to potential clients the benefits of being relieved of the administrative and operational challenges related to the day-to-day management of their housekeeping and dietary operations. In addition, we must be able to assure new clients that we can improve the quality of service that they are providing to their residents. We believe the factors discussed above are equally applicable to each of our segments with respect to acquiring new clients and increasing revenues.
17
When evaluating financial performance, we consider the ratio of certain financial items to consolidated revenues. The table below summarizes those metrics for
2017
,
2016
and
2015
:
|
Relation to Consolidated Revenues
Years Ended December 31, |
||||||||
|
|
2017
|
2016
|
2015
|
|||||
|
Revenues
|
100.0
|
%
|
100.0
|
%
|
100.0
|
%
|
||
|
Operating costs and expenses:
|
||||||||
|
Costs of services provided
|
86.4
|
%
|
85.7
|
%
|
86.0
|
%
|
||
|
Selling, general and administrative
|
6.8
|
%
|
6.7
|
%
|
7.8
|
%
|
||
|
Net investment and interest income
|
0.3
|
%
|
0.2
|
%
|
0.0
|
%
|
||
|
Income before income taxes
|
7.1
|
%
|
7.8
|
%
|
6.2
|
%
|
||
|
Income taxes
|
2.4
|
%
|
2.8
|
%
|
2.2
|
%
|
||
|
Net income
|
4.7
|
%
|
5.0
|
%
|
4.0
|
%
|
||
Subject to the factors noted in the Cautionary Statement Regarding Forward Looking Statements included in this report on Form 10-K, we expect that our consolidated financial performance in
2018
may be comparable to the historical ratios above, absent the effects of non-recurring charges, such as those that affected selling, general and administrative costs in 2015. We anticipate that for
2018
, Dietary revenues will continue to increase as a percentage of consolidated revenues by expanding upon the services performed for our current Housekeeping client base. Our expected growth in Housekeeping will primarily come from obtaining new clients.
Our costs of services can vary and may impact our operating performance. Management reviews two key indicators (costs of labor and costs of supplies) to monitor and manage such costs. The variability of these costs may impact each segment differently, as Housekeeping is more significantly impacted by costs of labor than Dietary. Labor costs accounted for approximately
80.1%
of Housekeeping revenues in
2017
. Dietary labor costs accounted for approximately
56.6%
of Dietary revenues in
2017
. Changes in wage rates as a result of legislative or collective bargaining actions, market factors, adjustments to staffing levels, and other variations in our use of labor or in management labor costs can result in variability of these costs. Housekeeping supplies, including linen products, accounted for approximately
8.0%
of Housekeeping revenues in
2017
. In contrast, supplies consumed in performing our Dietary services accounted for approximately
36.1%
of Dietary revenues. Generally, fluctuations in these expenses are influenced by factors outside of our control and are unpredictable. Housekeeping and Dietary supplies are principally commodity products and are affected by market conditions specific to the respective products.
Our clients are concentrated in the healthcare industry and are primarily providers of long-term care. Many of our clients’ revenues are highly reliant on Medicare, Medicaid and third-party payors’ reimbursement funding rates. Legislation can significantly alter overall government reimbursement for nursing home services and such changes, as well as other trends in the long-term care industry, have affected and could adversely affect our clients’ cash flows, resulting in their inability to make payments to us in accordance with agreed-upon payment terms. The climate of legislative uncertainty has posed, and will continue to pose, both risks and opportunities for us: the risks are related to our clients’ cash flows and solvency, while the opportunities are related to our ability to offer our clients cost stability and efficiencies.
18
Years Ended
December 31, 2017
and
2016
The following table sets forth the
2017
income statement key components that we use to evaluate our financial performance on a consolidated and reportable segment basis compared to
2016
. The differences between the reportable segments’ operating results and other disclosed data and our Consolidated Financial Statements relate primarily to corporate level transactions and adjustments related to transactions recorded at the reportable segment level which use methods other than generally accepted accounting principles.
|
Year Ended December 31,
|
|||||||||||
|
2017
|
2016
|
% Change
|
|||||||||
|
(in thousands)
|
|||||||||||
|
Revenues
|
|||||||||||
|
Housekeeping
|
$
|
979,610
|
|
$
|
957,148
|
|
2.3
|
%
|
|||
|
Dietary
|
886,521
|
|
605,514
|
|
46.4
|
%
|
|||||
|
Consolidated
|
$
|
1,866,131
|
|
$
|
1,562,662
|
|
19.4
|
%
|
|||
|
Costs of services provided
|
|||||||||||
|
Housekeeping
|
$
|
884,105
|
|
$
|
866,392
|
|
2.0
|
%
|
|||
|
Dietary
|
840,513
|
|
570,873
|
|
47.2
|
%
|
|||||
|
Corporate and eliminations
|
(112,108
|
)
|
(97,773
|
)
|
14.7
|
%
|
|||||
|
Consolidated
|
$
|
1,612,510
|
|
$
|
1,339,492
|
|
20.4
|
%
|
|||
|
Selling, general and administrative expense
|
|||||||||||
|
Corporate and eliminations
|
$
|
126,732
|
|
$
|
105,417
|
|
20.2
|
%
|
|||
|
Investment and interest income
|
|||||||||||
|
Corporate and eliminations
|
$
|
6,076
|
|
$
|
2,634
|
|
130.7
|
%
|
|||
|
Income (loss) before income taxes
|
|||||||||||
|
Housekeeping
|
$
|
95,505
|
|
$
|
90,756
|
|
5.2
|
%
|
|||
|
Dietary
|
46,008
|
|
34,641
|
|
32.8
|
%
|
|||||
|
Corporate and eliminations
|
(8,548
|
)
|
(5,010
|
)
|
70.6
|
%
|
|||||
|
Consolidated
|
$
|
132,965
|
|
$
|
120,387
|
|
10.4
|
%
|
|||
|
Income taxes
|
|||||||||||
|
Corporate and eliminations
|
$
|
44,739
|
|
$
|
42,991
|
|
4.1
|
%
|
|||
Revenues
Consolidated
Consolidated revenues
increased
19.4%
to
$1.87 billion
in
2017
compared to
$1.56 billion
in
2016
as a result of the factors discussed below under Reportable Segments.
Reportable Segments
Housekeeping’s
2.3%
increase
in reportable segment revenues resulted primarily from service agreements entered into with new clients. Dietary’s
46.4%
increase
in reportable segment revenues resulted primarily from providing these services to a greater number of existing Housekeeping clients.
19
Costs of services provided
Consolidated
Consolidated costs of services
increased
20.4%
to
$1.61 billion
in
2017
compared to
$1.34 billion
in
2016
, primarily related to our overall growth, as represented by our
19.4%
growth in consolidated revenues for the same period. As a percentage of consolidated revenues, cost of services
increased
to
86.4%
in
2017
from
85.7%
in
2016
.
Certain significant components within our costs of services are subject to fluctuation with changes in our business and client base. Labor and other labor-related costs, dining and housekeeping supplies, and self insurance costs account for most of our consolidated costs of services. See the discussion under Reportable Segments below for additional information on the changes in the components of costs of services.
The following table provides a comparison of the key indicators we consider when managing the consolidated cost of services provided:
|
Year Ended December 31,
|
||||||
|
Costs of Services Provided - Key Indicators as % of Consolidated Revenue
|
2017
|
2016
|
% Change
|
|||
|
Bad debt provision
|
0.3%
|
0.3%
|
—%
|
|||
|
Self-insurance costs
|
2.4%
|
3.0%
|
(0.6)%
|
|||
The bad debt provision remained consistent due to our assessment of the collectability of our accounts and notes receivables.
The
decrease
in self-insurance costs as a percentage of consolidated revenue is primarily the result of the Company’s ongoing initiatives to promote safety and accident prevention in the workplace, as well as proactive management of workers’ compensation claims, which have positively impacted our claims experience.
Reportable Segments
Costs of services provided for Housekeeping, as a percentage of Housekeeping revenues for
2017
,
decreased
to
90.3%
compared to
90.5%
in
2016
. Cost of services provided for Dietary, as a percentage of Dietary revenues for
2017
,
increased
to
94.8%
compared to
94.3%
in
2016
.
The following table provides a comparison of the key indicators we consider when managing cost of services at the segment level, as a percentage of the respective segment’s revenues:
|
Year Ended December 31,
|
||||||
|
Costs of Services Provided - Key Indicators as % of Segment Revenue
|
2017
|
2016
|
% Change
|
|||
|
Housekeeping labor and other labor-related costs
|
80.1%
|
80.2%
|
(0.1)%
|
|||
|
Housekeeping supplies
|
8.0%
|
7.8%
|
0.2%
|
|||
|
Dietary labor and other labor-related costs
|
56.6%
|
53.8%
|
2.8%
|
|||
|
Dietary supplies
|
36.1%
|
38.0%
|
(1.9)%
|
|||
The ratios of these key indicators generally remain relatively consistent. However, during this period of high-growth, the Company has experienced some inefficiencies when integrating new business and facilities. Such inefficiencies can relate to standardizing work flows and labor resources, establishing administrative structures, provisioning and other operational and logistical activities. Further, variations in these ratios can relate to changes in the mix of clients for whom we provide supplies or do not provide supplies. Management focuses on building efficiencies based on our operational expertise, managing labor and labor-related costs, as well as managing supply chain costs by leveraging economies of scale.
Consolidated Selling, General and Administrative Expense
Excluding the change in the deferred compensation plan described below, consolidated selling, general and administrative expense for
2017
increased
$18.3 million
or
17.6%
compared to
2016
, related primarily to our overall growth.
20
Included in selling, general and administrative expense are gains and losses associated with changes in the value of investments under the deferred compensation plan. These investments represent the amounts held on behalf of the
participating employees and changes in the value of these investments affect the amount of our deferred compensation liability
.
Gains
on the plan investments during
2017
and
2016
increased
our selling, general and administrative expense for these periods.
|
|
Year Ended December 31,
|
|||||||||
|
|
2017
|
2016
|
% Change
|
|||||||
|
(in thousands)
|
||||||||||
|
Selling, general and administrative expense excluding change in deferred compensation liability
|
$
|
122,198
|
|
$
|
103,922
|
|
17.6
|
%
|
||
|
Gain on deferred compensation plan investments
|
4,534
|
|
1,495
|
|
203.3
|
%
|
||||
|
Selling, general and administrative expense
|
$
|
126,732
|
|
$
|
105,417
|
|
20.2
|
%
|
||
Consolidated Investment and Net Interest Income
Investment and interest income
increased
130.7%
for
2017
compared to
2016
, primarily due to
favorable
market fluctuations in the value of our trading security investments representing the funding for our deferred compensation plan.
Consolidated Income Taxes
Our effective tax rate was
33.6%
for
2017
compared to
35.7%
for
2016
. Changes in the accounting for the effects of income taxes took place during 2017, which impacted our effective tax rate. In the first quarter 2017, the Company adopted Accounting Standards Update (“ASU”) 2016-09, under which excess tax benefits related to share-based payments were recognized as a component of income tax expense, as opposed to additional paid-in capital, resulting in a decrease in 2017 income tax expense. In addition, in December 2017, the Tax Cuts and Jobs Act (the “Act”) was signed into law, enacting significant changes to corporate tax rates, as well as business-related exclusions, deductions and credits. During the fourth quarter 2017, the Company recognized the effects of the changes in the tax law and rates on its deferred tax balances. The net result of the remeasurement was an approximate $4.5 million decrease to the Company’s net deferred tax assets balance and a corresponding increase to the Company’s provision for income taxes. Excluding the effects of ASU 2016-09 and the Act, our estimated effective tax rate would have approximated 33.9%.
Differences between our effective tax rates and the applicable U.S. federal statutory rate arise primarily from the effects of state and local taxes and tax credits available to the Company. We participate in the Work Opportunity Tax Credit (“WOTC”) program, through which the Company receives tax credits for hiring and retaining employees from target groups with significant barriers to employment. This credit is currently scheduled to expire on December 31, 2019.
The Company expects that its effective tax rate for 2018, including the impact of the Company’s continuing participation in the WOTC program, will be approximately 21% to 23%.
21
Years Ended
December 31, 2016
and
2015
The following table sets forth
2016
income statement key components that we use to evaluate our financial performance on a consolidated and reportable segment basis compared to
2015
. The differences between the reportable segments’ operating results and other disclosed data and our Consolidated Financial Statements relate primarily to corporate level transactions and adjustments related to transactions recorded at the reportable segment level which use methods other than generally accepted accounting principles.
|
Year Ended
|
|||||||||||
|
2016
|
2015
|
% Change
|
|||||||||
|
(in thousands)
|
|||||||||||
|
Revenues
|
|||||||||||
|
Housekeeping
|
$
|
957,148
|
|
$
|
909,709
|
|
5.2
|
%
|
|||
|
Dietary
|
605,514
|
|
527,140
|
|
14.9
|
%
|
|||||
|
Consolidated
|
$
|
1,562,662
|
|
$
|
1,436,849
|
|
8.8
|
%
|
|||
|
|
|||||||||||
|
Costs of services provided
|
|||||||||||
|
Housekeeping
|
$
|
866,392
|
|
$
|
825,238
|
|
5.0
|
%
|
|||
|
Dietary
|
570,873
|
|
495,528
|
|
15.2
|
%
|
|||||
|
Corporate and eliminations
|
(97,773
|
)
|
(84,658
|
)
|
15.5
|
%
|
|||||
|
Consolidated
|
$
|
1,339,492
|
|
$
|
1,236,108
|
|
8.4
|
%
|
|||
|
|
|||||||||||
|
Selling, general and administrative expense
|
|||||||||||
|
Corporate and eliminations
|
$
|
105,417
|
|
$
|
111,689
|
|
(5.6
|
)%
|
|||
|
|
|||||||||||
|
Investment and interest income
|
|||||||||||
|
Corporate and eliminations
|
$
|
2,634
|
|
$
|
712
|
|
269.9
|
%
|
|||
|
|
|||||||||||
|
Income (loss) before income taxes
|
|||||||||||
|
Housekeeping
|
$
|
90,756
|
|
$
|
84,471
|
|
7.4
|
%
|
|||
|
Dietary
|
34,641
|
|
31,612
|
|
9.6
|
%
|
|||||
|
Corporate and eliminations
|
(5,010
|
)
|
(26,319
|
)
|
(81.0
|
)%
|
|||||
|
Consolidated
|
$
|
120,387
|
|
$
|
89,764
|
|
34.1
|
%
|
|||
|
Income taxes
|
|||||||||||
|
Corporate and eliminations
|
$
|
42,991
|
|
$
|
31,740
|
|
35.4
|
%
|
|||
Revenues
Consolidated
Consolidated revenues
increased
8.8%
to
$1.56 billion
in
2016
compared to
$1.44 billion
in
2015
as a result of the factors discussed below under Reportable Segments.
Reportable Segments
Housekeeping’s
5.2%
increase
in reportable segment revenues resulted primarily from service agreements entered into with new clients.
Dietary’s
14.9%
increase
in reportable segment revenues resulted primarily from providing these services to a greater number of existing Housekeeping clients.
22
Costs of services provided
Consolidated
Consolidated costs of services
increased
8.4%
to
$1.34 billion
in
2016
compared to
$1.24 billion
in
2015
. The
increase
in costs of services is primarily related to our overall growth, as represented by our
8.8%
growth in consolidated revenues. Certain significant components within our costs of services are subject to fluctuation with the changes in our business and client base. The
increase
during
2016
compared to
2015
relates primarily to labor and other labor related costs. Historically, these significant components accounted for approximately 96% to 98% of consolidated costs of services.
As a percentage of consolidated revenues, cost of services
decreased
to
85.7%
in
2016
from
86.0%
in
2015
. The following table provides a comparison of the key indicators we consider when managing the consolidated cost of services:
|
Year Ended December 31,
|
||||||
|
Costs of Services Provided - Key Indicators as % of Consolidated Revenue
|
2016
|
2015
|
% Change
|
|||
|
Bad debt provision
|
0.3%
|
0.3%
|
—%
|
|||
|
Self-insurance costs
|
3.0%
|
3.4%
|
(0.4)%
|
|||
The bad debt provision remained consistent due to our assessment of the collectability of our accounts and notes receivables.
The decrease in self-insurance costs as a percentage of consolidated revenue is primarily the result of the Company’s ongoing initiatives to promote safety and accident prevention in the workplace, as well as proactive management of workers’ compensation claims, which positively impact our claims experience.
Reportable Segments
Costs of services provided for Housekeeping, as a percentage of Housekeeping revenues for
2016
,
decreased
to
90.5%
compared to
90.7%
in
2015
. Costs of services provided for Dietary, as a percentage of Dietary revenues for
2016
,
increased
to
94.3%
compared to
94.0%
in
2015
.
The following table provides a comparison of the key indicators we consider when managing cost of services at the segment level, as a percentage of the respective segment’s revenues:
|
Year Ended December 31,
|
||||||
|
Costs of Services Provided - Key Indicators as % of Segment Revenue
|
2016
|
2015
|
% Change
|
|||
|
Housekeeping labor and other labor costs
|
80.2%
|
79.4%
|
0.8%
|
|||
|
Housekeeping supplies
|
7.8%
|
8.3%
|
(0.5)%
|
|||
|
Dietary labor and other labor costs
|
53.8%
|
52.9%
|
0.9%
|
|||
|
Dietary supplies
|
38.0%
|
38.7%
|
(0.7)%
|
|||
The ratios of these key indicators remain relatively consistent. Variations relate to the provision of services at new facilities and changes in the mix of clients for whom we provide supplies or do not provide supplies. Management focuses on building efficiencies and managing labor and other costs at the facility level, as well as managing supply chain costs, for new and existing facilities.
Consolidated Selling, General and Administrative Expense
Excluding the change in the deferred compensation plan, consolidated selling, general and administrative expense for
2016
decreased
$7.8 million
or
7.0%
compared to
2015
, related primarily to reduced legal expenses associated with settlements regarding certain employment related matters. The change in the value of the deferred compensation plan is a result of changes in the market value on the balance of investments held in our deferred compensation plan.
Included in selling, general and administrative expense are gains and losses associated with changes in the value of investments under the deferred compensation plan. These investments represent the amounts held on behalf of the
participating employees and changes in the value of these investments affect the amount of our deferred compensation liability
.
Gains
on the plan investments during
2016
increased
our selling, general and administrative expense compared to
2015
.
23
|
|
Year Ended December 31,
|
|||||||||
|
|
2016
|
2015
|
% Change
|
|||||||
|
(in thousands)
|
||||||||||
|
Selling, general and administrative expense excluding change in deferred compensation liability
|
$
|
103,922
|
|
$
|
111,751
|
|
(7.0
|
)%
|
||
|
Gain (loss) on deferred compensation plan investments
|
1,495
|
|
(62
|
)
|
(2,511.3
|
)%
|
||||
|
Selling, general and administrative expense
|
$
|
105,417
|
|
$
|
111,689
|
|
(5.6
|
)%
|
||
Consolidated Investment and Net Interest Income
Investment and interest income
increased
269.9%
for
2016
compared to
2015
, primarily due to
favorable
market fluctuations in the value of our trading security investments representing the funding for our deferred compensation plan.
Consolidated Income Taxes
Our effective tax rate was
35.7%
for
2016
and
35.4%
for
2015
. Differences between the effective tax rates and the applicable U.S. federal statutory rate arise primarily from the effect of state and local taxes and tax credits available to the Company. The Company participates in the WOTC program, through which we hire and retain employees from target groups with significant barriers to employment. As part of the program, the Company receives tax credits, and although the Company increased its participation in the program year-over-year, the increase in the effective tax rate is primarily related to the ratio of the tax credits to higher pre-tax book income in 2016 as compared to the prior year. This credit is currently scheduled to expire on December 31, 2019.
Critical Accounting Policies and Estimates
The preparation of financial statements in accordance with accounting standards generally accepted in the United States (“U.S. GAAP”) requires management to make estimates and assumptions that affect the reported amounts of assets and liabilities at the date of the financial statements and the reported amounts of revenues and expenses during the reporting period.
Financial reporting results rely on estimating the effects of matters that are inherently uncertain. An understanding of the policies discussed below is critical to the understanding of our financial statements because the application of these policies requires judgment. Specific risks for these critical accounting policies and estimates are described in the following paragraphs. For these estimates, we caution that future events do not always occur as forecasted, and the best estimates routinely require adjustment. Any such adjustments or revisions to estimates could result in material differences from previously reported amounts.
The policies discussed are not intended to be a comprehensive list of all of our accounting policies. In many cases, the accounting treatment of a particular transaction is specifically dictated by U.S. GAAP, with no need for our judgment in their application. There are also areas in which our judgment in selecting another available alternative would not produce a materially different result. See our audited consolidated financial statements and notes thereto which are included in this Annual Report on Form 10-K, which contain a discussion of our accounting policies and other disclosures required by U.S. GAAP.
Allowance for Doubtful Accounts
The allowance for doubtful accounts (the “Allowance”) is established as losses are estimated to have occurred through a provision for bad debts charged to earnings. The Allowance is evaluated based on our ongoing review of accounts and notes receivable and is inherently subjective as it requires estimates that are susceptible to significant revision as more information becomes available.
We have had varying collections experience with respect to our accounts and notes receivable. We have at times elected to extend the period of payment for certain clients beyond contractual terms. Such clients include those who have terminated service agreements and slow payers experiencing financial difficulties. In making credit evaluations, in addition to analyzing and anticipating, where possible, the specific cases described above, we consider customer-specific risks as well as the general collection risks associated with trends in the long-term care industry. We establish credit limits, perform ongoing credit evaluations, and monitor accounts to minimize the risk of loss.
We regularly evaluate our accounts and notes receivable for impairment or loss of value and when appropriate, we will record an Allowance for such receivables. We generally follow a policy of partially reserving for receivables due from clients in bankruptcy, clients with which we are in litigation for collection and other slow paying clients. The Allowance is adjusted as additional information becomes available to more accurately estimate collectability. If the amount of our recovery of a receivable is determined,
24
through litigation, bankruptcy proceedings or negotiation, to be less than the amount recorded on our balance sheet, we will charge the applicable amount to the Allowance.
Summarized below for the years
2017
,
2016
and
2015
are the aggregate account balances against which reserves were recorded, as well as net write-offs, the bad debt provision and the balance of the allowance for doubtful accounts:
|
Year Ended
|
Aggregate Account Balances of Clients in Bankruptcy or in/or Pending Collection/Litigation
|
Net Write-offs of Client Accounts
|
Bad Debt Provision
|
Allowance for Doubtful Accounts
|
||||||||||||
|
(in thousands)
|
||||||||||||||||
|
2017
|
$
|
30,035
|
|
$
|
1,176
|
|
$
|
6,250
|
|
$
|
11,985
|
|
||||
|
2016
|
$
|
15,873
|
|
$
|
2,326
|
|
$
|
4,629
|
|
$
|
6,911
|
|
||||
|
2015
|
$
|
12,073
|
|
$
|
5,863
|
|
$
|
4,335
|
|
$
|
4,608
|
|
||||
Actual collections of these accounts could differ from our current estimate. If our actual collection experience is 5% less than our estimate, the related increase to our Allowance would decrease net income by approximately
$0.6 million
. Despite our efforts to minimize credit risk exposure, our clients could be adversely affected if future industry trends, as more fully discussed under Liquidity and Capital Resources below, and in this Annual Report on Form 10-K in Part I under “Risk Factors,” “Government Regulation of Clients” and “Service Agreements and Collections,” change in such a manner as to negatively impact the cash flows of our clients. If our clients experience a negative impact in their cash flows, it could have a material adverse effect on our results of operations and financial condition.
Accrued Insurance Claims
We currently have a Paid Loss Retrospective Insurance Plan for general liability and workers’ compensation insurance, which comprise approximately
30.7%
of our liabilities at
December 31, 2017
. Under our insurance plans for general liability and workers’ compensation, predetermined loss limits are arranged with our insurance company to limit both our per occurrence cash outlay and annual insurance plan cost. Our accounting for this plan utilizes current valuations from a third party actuary, which include assumptions based on data such as historical claims and pay-out experience, demographic factors, industry trends, severity factors, and other actuarial calculations. In the event that our claims experience and/or industry trends result in an unfavorable change in our assumptions or outcomes, it would have an adverse effect on our results of operations and financial condition. Recently, our claims experiences have been favorable, as a result of our ongoing initiative to promote safety and accident prevention in the workplace, as well as proactive management of workers’ compensation claims.
For general liability and workers’ compensation, we record both a reserve for the estimated future cost of claims and related expenses that have been reported but not settled, as well as an estimate of claims incurred but not reported. Such reserves for claims incurred but not reported are developed by a third party actuary through review of our historical data and open claims.
A summary of the changes in our total self-insurance liability is as follows:
|
2017
|
2016
|
2015
|
|||||||||
|
(in thousands)
|
|||||||||||
|
Accrued insurance claims - January 1,
|
$
|
87,653
|
|
$
|
82,250
|
|
$
|
68,262
|
|
||
|
Claim payments
|
(41,077
|
)
|
(35,089
|
)
|
(27,883
|
)
|
|||||
|
Reserve accruals:
|
|
|
|
|
|
|
|||||
|
Current year accruals
|
49,673
|
|
42,592
|
|
41,871
|
|
|||||
|
Changes to the provision for prior year claims
|
(11,550
|
)
|
(2,100
|
)
|
—
|
|
|||||
|
Change in accrued insurance claims
|
(2,954
|
)
|
5,403
|
|
13,988
|
|
|||||
|
Accrued insurance claims - December 31,
|
$
|
84,699
|
|
$
|
87,653
|
|
$
|
82,250
|
|
||
Asset Valuations and Review for Potential Impairment
We review our fixed assets, deferred income taxes, goodwill and other intangible assets at least annually or whenever events or circumstances indicate that their carrying amounts may not be recoverable. This review requires that we make assumptions regarding the fair value of these assets and the changes in circumstances that would affect the carrying value of these assets. If the carrying value of an asset exceeds the fair value of the asset, an impairment loss would be recognized in earnings. The determination of fair value includes numerous uncertainties, such as the impact of competition on future value. We believe that we have made reasonable estimates and judgments in determining whether our long-term assets have been impaired; however, if there is a material
25
change in the assumptions used in our determination of fair value or if there is a material change in economic conditions or circumstances influencing fair value, we could be required to recognize certain impairment charges in the future. As a result of our most recent reviews, no changes in asset values were required.
Income Taxes
Deferred income taxes are recognized for the tax consequences related to temporary differences between the carrying amount of assets and liabilities for financial reporting purposes and the amounts used for tax purposes at each year-end, based on enacted tax laws and statutory tax rates applicable to the periods in which the differences are expected to affect taxable income. A valuation allowance is established when necessary based on the weight of available evidence, if it is considered more likely than not that all or some portion of the deferred tax assets will not be realized. Income tax expense is the sum of current income tax plus the change in deferred tax assets and liabilities.
We are subject to income taxes in the United States and numerous state and local jurisdictions. The determination of the income tax provision is an inherently complex process, requiring management to interpret continually changing regulations and to make certain significant judgments. Our assumptions, judgments and estimates relative to the amount of deferred income taxes take into account scheduled reversals of deferred tax liabilities, recent financial operations, estimates of the amount of future taxable income and available tax planning strategies. Actual operating results in future years could render our current assumptions, judgments and estimates inaccurate. No assurance can be given that the final impact of these matters will not be different from that which is reflected in the Company’s historical income tax provisions and accruals. The Company adjusts these items in light of changing facts and circumstances. To the extent that the final impact of these matters is different than the amounts recorded, such differences could have a material effect on the income tax provisions or benefits in the periods in which such determinations are made.
Liquidity and Capital Resources
Cash generated through operations is our primary source of liquidity. At
December 31, 2017
, we had cash, cash equivalents and marketable securities of
$82.8 million
and working capital of
$343.2 million
, compared to
December 31, 2016
cash, cash equivalents and marketable securities of
$91.6 million
and working capital of
$313.8 million
. The increase in working capital is driven by growth in our business and by the timing of cash receipts and cash payments. In addition, as of
December 31, 2017
, we had an unused line of credit of
$187.0 million
. Our current ratio at
December 31, 2017
was
2.9
to 1, versus
4.1
to 1 at
December 31, 2016
.
For the years ended
December 31, 2017
,
2016
and
2015
, our cash flows were as follows:
|
Year Ended December 31,
|
|||||||||||
|
2017
|
2016
|
2015
|
|||||||||
|
(in thousands)
|
|||||||||||
|
Net cash provided by operating activities
|
$
|
7,630
|
|
$
|
41,400
|
|
$
|
63,361
|
|
||
|
Net cash used in investing activities
|
$
|
(14,967
|
)
|
$
|
(6,452
|
)
|
$
|
(62,314
|
)
|
||
|
Net cash used in financing activities
|
$
|
(6,959
|
)
|
$
|
(44,284
|
)
|
$
|
(43,138
|
)
|
||
Operating Activities
Our primary sources of cash are the revenues generated from our Housekeeping and Dietary services. Our primary uses of cash are the funding of our payroll and other personnel-related costs, as well as the costs of supplies used in providing our services. The timing of cash receipts and cash payments are the primary drivers of the period-over-period changes in net cash provided by operating activities.
Investing Activities
The principal uses of cash for investing activities are our purchases of marketable securities and capital expenditures such as those for housekeeping and food service equipment, computer software and equipment, and furniture and fixtures (see “Capital Expenditures” below for additional information). Such uses of cash are partially offset by proceeds from sales of marketable securities.
Our investments in marketable securities are primarily comprised of tax-exempt municipal bonds and are intended to achieve our goal of preserving principal, maintaining adequate liquidity and maximizing returns subject to our investment guidelines. Our
26
investment policy limits investment to certain types of instruments issued by institutions primarily with investment-grade ratings and places restrictions on concentration by type and issuer.
Financing Activities
The primary use of cash for financing activities is the payment of dividends. We have paid regular quarterly cash dividends since the second quarter of 2003. During
2017
, we paid to shareholders regular quarterly cash dividends totaling
$55.2 million
, as follows:
|
Paid During the Quarter Ended
|
|||||||||||||||
|
March 31, 2017
|
June 30, 2017
|
September 30, 2017
|
December 31, 2017
|
||||||||||||
|
(in thousands, except per share data)
|
|||||||||||||||
|
Cash dividend per common share
|
$
|
0.18625
|
|
$
|
0.18750
|
|
$
|
0.18875
|
|
$
|
0.19000
|
|
|||
|
Total cash dividends paid
|
$
|
13,624
|
|
$
|
13,750
|
|
$
|
13,883
|
|
$
|
13,987
|
|
|||
|
Record date
|
February 17, 2017
|
|
May 19, 2017
|
|
August 18, 2017
|
|
November 17, 2017
|
|
|||||||
|
Payment date
|
March 24, 2017
|
|
June 23, 2017
|
|
September 22, 2017
|
|
December 22, 2017
|
|
|||||||
Additionally, on
January 30, 2018
, our Board of Directors declared a regular quarterly cash dividend of
$0.19125
per common share, which will be paid on
March 23, 2018
to shareholders of record as of the close of business on
February 16, 2018
.
The dividends paid to shareholders during the year ended
December 31, 2017
were funded through cash generated from operations. Our Board of Directors reviews our dividend policy on a quarterly basis. Although there can be no assurance that we will continue to pay dividends or the amount of the dividends, we expect to continue to pay a regular quarterly cash dividend. Partially offsetting the cash used to pay dividends are the proceeds received from the exercise of stock options by employees and directors. In connection with the establishment of our dividend policy, we adopted a Dividend Reinvestment Plan in 2003.
The primary source of cash from financing activities is the net borrowings under our bank line of credit. We borrow for general corporate purposes as needed throughout the year. The outstanding short-term borrowings balance as of
December 31, 2017
relates to cash flow requirements due to the timing of cash receipts and cash payments.
We did not repurchase any of our Common Stock during
2017
, but we remain authorized to repurchase
1.7 million
shares of our Common Stock pursuant to previous Board of Directors’ authorization.
Contractual Obligations
Our future contractual obligations and commitments at
December 31, 2017
consist of the following:
|
|
Payments Due by Period
|
|||||||||||||||||||
|
Year Ended December 31, 2017
|
Total
|
Less Than 1 Year
|
1-3 Years
|
3-5 Years
|
After 5 Years
|
|||||||||||||||
|
(in thousands)
|
||||||||||||||||||||
|
Operating lease obligations
|
$
|
9,118
|
|
$
|
2,482
|
|
$
|
3,457
|
|
$
|
1,469
|
|
$
|
1,710
|
|
|||||
27
Line of Credit
As of
December 31, 2017
, we had a
$300 million
bank line of credit on which to draw for general corporate purposes. Amounts drawn under the line of credit are payable upon demand and generally bear interest at LIBOR plus 75 basis points (or if LIBOR becomes unavailable, the higher of the Prime Rate or the Overnight Bank Funding Rate plus 50 basis points). At
December 31, 2017
, there were
$35.4 million
in borrowings under the line of credit.
The line of credit requires us to satisfy one financial covenant. The covenant and its respective status at
December 31, 2017
was as follows:
|
Covenant Description and Requirement
|
As of December 31, 2017
|
||
|
Funded debt
(1)
to EBITDA
(2)
ratio: less than 3.00 to 1.00
|
0.79
|
|
|
|
(1)
|
All indebtedness for borrowed money including, but not limited to, capitalized lease obligations, reimbursement obligations in respect of letters of credit and guarantees of any such indebtedness.
|
|
(2)
|
Net income plus interest expense, income tax expense, depreciation, amortization, and extraordinary non-recurring losses/gains.
|
As shown in the table above, we were in compliance with our financial covenant at
December 31, 2017
and we expect to continue to remain in compliance with such financial covenant. The line of credit expires on
December 18, 2018
.
At
December 31, 2017
, we also had outstanding
$77.6 million
in irrevocable standby letters of credit, which relate to payment obligations under our insurance programs. The letters of credit expire on January 2, 2019. In connection with the issuance of the letters of credit, the amount available under the line of credit was
further reduced by
$77.6 million
to
$187.0 million
at
December 31, 2017
. The letters of credit were
decreased to
$65.9 million
on
January 2, 2018
.
Accounts and Notes Receivable
Any decision to extend credit is made on a case-by-case basis and is based on a number of qualitative and quantitative factors related to the particular client, as well as the general risks associated with operating within the long-term care industry.
Our net accounts and notes receivable balance
increased
from
December 31, 2016
. Such fluctuations in net accounts and notes receivable are attributable to a variety of factors including, but not limited to, the timing of cash receipts from customers and the inception, transition or termination of client relationships.
There are a variety of factors that impact our clients’ ability to pay us in accordance with our agreements. Primary among these is our clients’ participation in programs funded by federal and state governmental agencies. Deviations in the timing or amounts of reimbursements under those programs can impact our clients’ cash flows and the timing of their payments to us. The payment terms in our service agreements are not contingent upon our clients’ cash flows and notwithstanding our efforts to minimize credit risk exposure, various factors affecting our clients’ cash flows could have an indirect, yet material adverse effect on our results of operations and financial condition.
We deploy significant resources and have invested in tools and processes to optimize our credit and collections efforts. When appropriate, we utilize interest-bearing promissory notes as an alternative to accounts receivable to enhance the collectability of amounts due, by providing a definitive repayment plan and providing a means by which to further evidence the amounts owed. At
December 31, 2017
and
December 31, 2016
, we had
$36.6 million
and
$19.2 million
, net of reserves, respectively, of such promissory notes outstanding. In addition, we may assist our clients who are adjusting to changes in their cash flows by amending our agreements from full-service to management-only arrangements, or by modifying contractual payment terms to accommodate clients who have in good faith established clearly-defined plans for addressing cash flow issues. These efforts are intended to minimize our collections risk while maintaining our relationships with our clients.
In order to provide for collections issues and the general risk associated with the granting of credit terms, we recorded a bad debt provision (in an Allowance for Doubtful Accounts) of
$6.3 million
,
$4.6 million
and
$4.3 million
in the years ended
December 31, 2017
,
2016
and
2015
, respectively. As a percentage of total revenues, these provisions represent approximately
0.3%
for each of the years ended
December 31, 2017
,
2016
and
2015
.
28
Insurance Programs
We self-insure or carry a high deductible insurance plan and therefore we retain a substantial portion of the risk associated with the expected losses under our general liability and workers compensation programs. Under our insurance plans for general liability and workers’ compensation, predetermined loss limits are arranged with our insurance company to limit both our per occurrence cash outlay and annual insurance plan cost. Our accounting for this plan is affected by various uncertainties, such as historical claims, pay-out experience, demographic factors, industry trends, severity factors, and other actuarial assumptions calculated by a third party actuary. Evaluations of our accrued insurance claims estimate as of the balance sheet date are based primarily on current information derived from our actuarial valuation which assists in quantifying and valuing these trends. In the event that our claims experience and/or industry trends result in an unfavorable change resulting from, among other factors, the severity levels of reported claims and medical cost inflation, as compared to historical claim trends, it would have an adverse effect on our results of operations and financial condition. Under these plans, predetermined loss limits are arranged with an insurance company to limit both our per-occurrence cash outlay and annual insurance plan cost.
For general liability and workers’ compensation, we record a reserve for the estimated future cost of claims and related expenses that have been reported but not settled, including an estimate of claims incurred but not reported that are developed as a result of a review of our historical data and open claims, which is based on estimates provided by a third party actuary.
Capital Expenditures
Our level of capital expenditures is generally dependent on the number of new clients obtained. Such capital expenditures primarily consist of housekeeping and food service equipment purchases, laundry and linen equipment installations, computer hardware and software, and furniture and fixtures. Our capital expenditures totaled
$5.4 million
in
2017
. Although we have no specific material commitments for capital expenditures through the end of calendar year
2018
, we estimate that for that period we will have capital expenditures of approximately
$4.5 million
to
$6.0 million
. We believe that our cash from operations, existing cash and cash equivalents balance and credit line will be adequate for the foreseeable future to satisfy the needs of our operations and to fund our anticipated growth. However, should these sources not be sufficient, we would seek to obtain necessary capital from such sources as long-term debt or equity financing.
Material Off-Balance Sheet Arrangements
We have no material off-balance sheet arrangements, other than our irrevocable standby letter of credit.
Effects of Inflation
Although there can be no assurance thereof, we believe that in most instances we will be able to recover increases in costs attributable to inflation by passing through such cost increases to our clients.
Item 7A.
Quantitative and Qualitative
Disclosures About Market Risk.
At
December 31, 2017
, we had investments in municipal bonds of
$73.2 million
. Our municipal bonds are categorized as marketable securities and are subject to interest rate risk, as changes in interest rates affect the fair values of those instruments. Investments in both fixed rate and floating rate investments carry a degree of interest rate risk. The value of fixed rate securities may be adversely impacted due to an increase in interest rates, while floating rate securities may produce less income than expected if interest rates fall. Due in part to these factors, our future investment income may fall short of expectations due to changes in interest rates or if there is a decline in the fair value of our investments. We make investments in instruments that meet our credit quality standards, as specified in our investment policy guidelines.
29
Item 8.
Financial Statements and Supplementary
Data.
INDEX TO CONSOLIDATED FINANCIAL STATEMENTS
|
Page
|
|
|
Report of Independent Registered Public Accounting Firm
|
|
|
Management's Report on Internal Control Over Financial Reporting
|
|
|
Report of Independent Registered Public Accounting Firm
|
|
|
Consolidated Financial Statements
|
|
|
Consolidated Balance Sheets as of December 31, 2017 and 2016
|
|
|
Consolidated Statements of Comprehensive Income for the Years Ended December 31, 2017, 2016 and 2015
|
|
|
Consolidated Statements of Cash Flows for the Years Ended December 31, 2017, 2016 and 2015
|
|
|
Consolidated Statements of Stockholders' Equity for the Years Ended December 31, 2017, 2016 and 2015
|
|
|
Notes to Consolidated Financial Statements for the Years Ended December 31, 2017, 2016 and 2015
|
|
30
REPORT OF INDEPENDENT REGISTERED PUBLIC ACCOUNTING FIRM
Board of Directors and Stockholders
Healthcare Services Group, Inc.
Opinion on the financial statements
We have audited the accompanying consolidated balance sheets of Healthcare Services Group, Inc. (a Pennsylvania corporation) and subsidiaries (the “Company”) as of
December 31, 2017
and
2016
, the related consolidated statements of comprehensive income, stockholders’ equity, and cash flows for each of the three years in the period ended
December 31, 2017
, and the related notes and schedules (collectively referred to as the “financial statements”). In our opinion, the financial statements present fairly, in all material respects, the financial position of the Company as of
December 31, 2017
and
2016
, and the results of its operations and its cash flows for each of the three years in the period ended
December 31, 2017
, in conformity with accounting principles generally accepted in the United States of America.
We also have audited, in accordance with the standards of the Public Company Accounting Oversight Board (United States) (“PCAOB”), the Company’s internal control over financial reporting as of
December 31, 2017
, based on criteria established in the 2013
Internal Control-Integrated Framework
issued by the Committee of Sponsoring Organizations of the Treadway Commission (“COSO”), and our report dated
February 23, 2018
expressed an unqualified opinion.
Basis for opinion
These financial statements are the responsibility of the Company’s management. Our responsibility is to express an opinion on the Company’s financial statements based on our audits. We are a public accounting firm registered with the PCAOB and are required to be independent with respect to the Company in accordance with the U.S. federal securities laws and the applicable rules and regulations of the Securities and Exchange Commission and the PCAOB.
We conducted our audits in accordance with the standards of the PCAOB. Those standards require that we plan and perform the audit to obtain reasonable assurance about whether the financial statements are free of material misstatement, whether due to error or fraud. Our audits included performing procedures to assess the risks of material misstatement of the financial statements, whether due to error or fraud, and performing procedures that respond to those risks. Such procedures included examining, on a test basis, evidence supporting the amounts and disclosures in the financial statements. Our audits also included evaluating the accounting principles used and significant estimates made by management, as well as evaluating the overall presentation of the financial statements. We believe that our audits provide a reasonable basis for our opinion.
|
/s/ GRANT THORNTON LLP
|
|
|
We have served as the Company’s auditor since 1992.
|
|
|
New York, New York
|
|
|
February 23, 2018
|
|
31
Management’s Annual Report on Internal Control Over Financial
Reporting
The management of Healthcare Services Group, Inc. (“Healthcare”, “We” or the “Company”), is responsible for establishing and maintaining adequate internal control over financial reporting. The Company’s internal control over financial reporting is defined in Rule 13a-15(f) and 15d-15(f) promulgated under the Securities Exchange Act of 1934 as a process designed by, or under the supervision of, the Company’s principal executive and principal financial officers and effected by the Company’s board of directors, management and other personnel, to provide reasonable assurance regarding the reliability of financial reporting and the preparation of the Company’s financial statements for external purposes in accordance with generally accepted accounting principles in the United States and includes those policies and procedures that:
|
1.
|
Pertain to the maintenance of records that in reasonable detail accurately and fairly reflect the transactions and dispositions of assets of the Company;
|
|
2.
|
Provide reasonable assurance that transactions are recorded as necessary to permit preparation of financial statements in accordance with generally accepted accounting principles, and that receipts and expenditures of the Company are being made only in accordance with authorizations of management and directors of the Company; and
|
|
3.
|
Provide reasonable assurance regarding prevention or timely detection of unauthorized acquisition, use or disposition of the Company’s assets that could have a material effect on the financial statements.
|
The Company’s management assessed the effectiveness of the Company’s internal control over financial reporting as of
December 31, 2017
. In making this assessment, the Company’s management used the criteria set forth in Internal Control -Integrated Framework issued by the Committee of Sponsoring Organizations of the Treadway Commission (the “2013 Framework”).
Under the supervision and with the participation of our management, including our principal executive officer and principal financial officer, we conducted an evaluation of our internal control over financial reporting, as prescribed above, for the period covered by this report. Based on our evaluation, our principal executive officer and principal financial officer concluded that the Company’s internal control over financial reporting as of
December 31, 2017
is effective as a whole.
Because of its inherent limitations, internal control over financial reporting may not prevent or detect misstatements. Projections of any evaluation of effectiveness to future periods are subject to the risk that controls may become inadequate because of changes in conditions, or that the degree of compliance with the policies or procedures may deteriorate.
The Company’s independent registered public accounting firm has audited, and reported on, the Company’s internal control over financial reporting as of
December 31, 2017
.
|
/s/ Theodore Wahl
|
|
/s/ John C. Shea
|
|
Theodore Wahl
|
|
John C. Shea
|
|
Chief Executive Officer
(Principal Executive Officer)
|
|
Chief Financial Officer
(Principal Financial and Accounting Officer)
|
|
February 23, 2018
|
|
February 23, 2018
|
32
REPORT OF INDEPENDENT REGISTERED PUBLIC ACCOUNTING FIRM
Board of Directors and Stockholders
Healthcare Services Group, Inc.
Opinion on internal control over financial reporting
We have audited the internal control over financial reporting of Healthcare Services Group, Inc. (a Pennsylvania corporation) and subsidiaries (the “Company”) as of
December 31, 2017
, based on criteria established in the 2013
Internal Control-Integrated Framework
issued by the Committee of Sponsoring Organizations of the Treadway Commission (“COSO”). In our opinion, the Company maintained, in all material respects, effective internal control over financial reporting as of
December 31, 2017
, based on criteria established in the 2013
Internal Control-Integrated Framework
issued by COSO.
We also have audited, in accordance with the standards of the Public Company Accounting Oversight Board (United States) (“PCAOB”), the consolidated financial statements of the Company as of and for the year ended
December 31, 2017
, and our report dated
February 23, 2018
expressed an unqualified opinion on those financial statements.
Basis for opinion
The Company’s management is responsible for maintaining effective internal control over financial reporting and for its assessment of the effectiveness of internal control over financial reporting, included in the accompanying Management’s Annual Report on Internal Control Over Financial Reporting. Our responsibility is to express an opinion on the Company’s internal control over financial reporting based on our audit. We are a public accounting firm registered with the PCAOB and are required to be independent with respect to the Company in accordance with the U.S. federal securities laws and the applicable rules and regulations of the Securities and Exchange Commission and the PCAOB.
We conducted our audit in accordance with the standards of the PCAOB. Those standards require that we plan and perform the audit to obtain reasonable assurance about whether effective internal control over financial reporting was maintained in all material respects. Our audit included obtaining an understanding of internal control over financial reporting, assessing the risk that a material weakness exists, testing and evaluating the design and operating effectiveness of internal control based on the assessed risk, and performing such other procedures as we considered necessary in the circumstances. We believe that our audit provides a reasonable basis for our opinion.
Definition and limitations of internal control over financial reporting
A company’s internal control over financial reporting is a process designed to provide reasonable assurance regarding the reliability of financial reporting and the preparation of financial statements for external purposes in accordance with generally accepted accounting principles. A company’s internal control over financial reporting includes those policies and procedures that (1) pertain to the maintenance of records that, in reasonable detail, accurately and fairly reflect the transactions and dispositions of the assets of the company; (2) provide reasonable assurance that transactions are recorded as necessary to permit preparation of financial statements in accordance with generally accepted accounting principles, and that receipts and expenditures of the company are being made only in accordance with authorizations of management and directors of the company; and (3) provide reasonable assurance regarding prevention or timely detection of unauthorized acquisition, use, or disposition of the company’s assets that could have a material effect on the financial statements.
Because of its inherent limitations, internal control over financial reporting may not prevent or detect misstatements. Also, projections of any evaluation of effectiveness to future periods are subject to the risk that controls may become inadequate because of changes in conditions, or that the degree of compliance with the policies or procedures may deteriorate.
|
/s/ GRANT THORNTON LLP
|
|
|
New York, New York
|
|
|
February 23, 2018
|
|
33
Healthcare Services Group, Inc.
(in thousands)
|
|
As of December 31,
|
||||||
|
|
2017
|
2016
|
|||||
|
ASSETS:
|
|||||||
|
Current assets:
|
|||||||
|
Cash and cash equivalents
|
$
|
9,557
|
|
$
|
23,853
|
|
|
|
Marketable securities, at fair value
|
73,221
|
|
67,730
|
|
|||
|
Accounts and notes receivable, less allowance for doubtful accounts of $11,985 and $6,911 as of December 31, 2017 and 2016, respectively
|
378,720
|
|
271,276
|
|
|||
|
Inventories and supplies
|
42,393
|
|
37,800
|
|
|||
|
Prepaid expenses and other assets
|
23,515
|
|
13,965
|
|
|||
|
Total current assets
|
527,406
|
|
414,624
|
|
|||
|
Property and equipment, net
|
13,509
|
|
13,455
|
|
|||
|
Goodwill
|
51,084
|
|
44,438
|
|
|||
|
Other intangible assets, less accumulated amortization of $12,853 and $14,672 as of December 31, 2017 and 2016, respectively
|
30,881
|
|
14,409
|
|
|||
|
Notes receivable — long-term portion
|
15,476
|
|
7,531
|
|
|||
|
Deferred compensation funding, at fair value
|
28,885
|
|
24,119
|
|
|||
|
Deferred income taxes
|
7,498
|
|
9,822
|
|
|||
|
Other noncurrent assets
|
1,264
|
|
48
|
|
|||
|
Total Assets
|
$
|
676,003
|
|
$
|
528,446
|
|
|
|
LIABILITIES AND STOCKHOLDERS’ EQUITY:
|
|||||||
|
Current liabilities:
|
|||||||
|
Accounts payable
|
$
|
74,463
|
|
$
|
42,912
|
|
|
|
Accrued payroll, accrued and withheld payroll taxes
|
32,139
|
|
22,303
|
|
|||
|
Other accrued expenses
|
4,561
|
|
4,397
|
|
|||
|
Borrowings under line of credit
|
35,382
|
|
—
|
|
|||
|
Income taxes payable
|
15,378
|
|
7,686
|
|
|||
|
Accrued insurance claims
|
22,245
|
|
23,573
|
|
|||
|
Total current liabilities
|
184,168
|
|
100,871
|
|
|||
|
Accrued insurance claims — long-term portion
|
62,454
|
|
64,080
|
|
|||
|
Deferred compensation liability
|
29,429
|
|
24,653
|
|
|||
|
Commitments and contingencies
|
|
|
|
|
|||
|
STOCKHOLDERS’ EQUITY:
|
|||||||
|
Common Stock, $.01 par value; 100,000 shares authorized; 74,960 and 74,204 shares issued, and 73,436 and 72,601 shares outstanding as of December 31, 2017 and 2016, respectively
|
750
|
|
742
|
|
|||
|
Additional paid-in capital
|
244,363
|
|
217,664
|
|
|||
|
Retained earnings
|
163,860
|
|
130,940
|
|
|||
|
Accumulated other comprehensive income (loss), net of taxes
|
837
|
|
(319
|
)
|
|||
|
Common Stock in treasury, at cost, 1,524 shares and 1,603 shares as of December 31, 2017 and 2016, respectively
|
(9,858
|
)
|
(10,185
|
)
|
|||
|
Total stockholders’ equity
|
399,952
|
|
338,842
|
|
|||
|
TOTAL LIABILITIES AND STOCKHOLDERS’ EQUITY
|
$
|
676,003
|
|
$
|
528,446
|
|
|
See accompanying notes.
34
Healthcare Services Group, Inc.
(in thousands, except per share amounts)
|
|
Years Ended December 31,
|
||||||||||
|
|
2017
|
2016
|
2015
|
||||||||
|
Revenues
|
$
|
1,866,131
|
|
$
|
1,562,662
|
|
$
|
1,436,849
|
|
||
|
Operating costs and expenses:
|
|||||||||||
|
Costs of services provided
|
1,612,510
|
|
1,339,492
|
|
1,236,108
|
|
|||||
|
Selling, general and administrative
|
126,732
|
|
105,417
|
|
111,689
|
|
|||||
|
Other income:
|
|||||||||||
|
Investment and interest
|
6,076
|
|
2,634
|
|
712
|
|
|||||
|
Income before income taxes
|
132,965
|
|
120,387
|
|
89,764
|
|
|||||
|
Income taxes
|
44,739
|
|
42,991
|
|
31,740
|
|
|||||
|
Net income
|
$
|
88,226
|
|
$
|
77,396
|
|
$
|
58,024
|
|
||
|
Per share data:
|
|||||||||||
|
Basic earnings per common share
|
$
|
1.20
|
|
$
|
1.06
|
|
$
|
0.81
|
|
||
|
Diluted earnings per common share
|
$
|
1.19
|
|
$
|
1.05
|
|
$
|
0.80
|
|
||
|
Weighted average number of common shares outstanding:
|
|||||||||||
|
Basic
|
73,355
|
|
72,754
|
|
71,826
|
|
|||||
|
Diluted
|
74,348
|
|
73,474
|
|
72,512
|
|
|||||
|
Comprehensive income:
|
|||||||||||
|
Net income
|
$
|
88,226
|
|
$
|
77,396
|
|
$
|
58,024
|
|
||
|
Other comprehensive income:
|
|||||||||||
|
Unrealized gain (loss) on available-for-sale marketable securities, net of taxes
|
1,156
|
|
(862
|
)
|
518
|
|
|||||
|
Total comprehensive income
|
$
|
89,382
|
|
$
|
76,534
|
|
$
|
58,542
|
|
||
See accompanying notes.
35
Healthcare Services Group, Inc.
(in thousands)
|
|
Years Ended December 31,
|
||||||||||
|
|
2017
|
2016
|
2015
|
||||||||
|
Cash flows from operating activities:
|
|||||||||||
|
Net income
|
$
|
88,226
|
|
$
|
77,396
|
|
$
|
58,024
|
|
||
|
Adjustments to reconcile net income to net cash provided by operating activities:
|
|||||||||||
|
Depreciation and amortization
|
8,886
|
|
7,496
|
|
7,660
|
|
|||||
|
Bad debt provision
|
6,250
|
|
4,629
|
|
4,335
|
|
|||||
|
Deferred income tax
|
1,887
|
|
3,001
|
|
17,842
|
|
|||||
|
Stock-based compensation expense, net of tax benefit from equity compensation plans
(1)
|
276
|
|
1,271
|
|
1,668
|
|
|||||
|
Amortization of premium on marketable securities
|
1,296
|
|
1,723
|
|
681
|
|
|||||
|
Unrealized (gain) loss on deferred compensation fund investments
|
(4,509
|
)
|
(1,460
|
)
|
24
|
|
|||||
|
Changes in operating assets and liabilities:
|
|
|
|
||||||||
|
Accounts and notes receivable
|
(121,639
|
)
|
(65,610
|
)
|
(18,854
|
)
|
|||||
|
Inventories and supplies
|
(1,873
|
)
|
(1,492
|
)
|
(846
|
)
|
|||||
|
Prepaid expenses and other assets
|
(9,545
|
)
|
(2,470
|
)
|
(1,710
|
)
|
|||||
|
Deferred compensation funding
|
(257
|
)
|
2,732
|
|
(649
|
)
|
|||||
|
Accounts payable and other accrued expenses
|
11,197
|
|
(4,251
|
)
|
2,403
|
|
|||||
|
Accrued payroll, accrued and withheld payroll taxes
|
11,927
|
|
6,307
|
|
(28,314
|
)
|
|||||
|
Accrued insurance claims
|
(2,954
|
)
|
5,404
|
|
13,987
|
|
|||||
|
Deferred compensation liability
|
5,061
|
|
(731
|
)
|
1,113
|
|
|||||
|
Income taxes payable
(1)
|
13,401
|
|
7,455
|
|
5,997
|
|
|||||
|
Net cash provided by operating activities
|
7,630
|
|
41,400
|
|
63,361
|
|
|||||
|
Cash flows from investing activities:
|
|
|
|
||||||||
|
Disposals of fixed assets
|
338
|
|
275
|
|
267
|
|
|||||
|
Additions to property and equipment
|
(5,397
|
)
|
(5,442
|
)
|
(4,998
|
)
|
|||||
|
Purchases of marketable securities
|
(33,861
|
)
|
(29,449
|
)
|
(75,150
|
)
|
|||||
|
Sales of marketable securities
|
28,537
|
|
28,164
|
|
17,567
|
|
|||||
|
Cash paid for acquisitions
|
(4,584
|
)
|
—
|
|
—
|
|
|||||
|
Net cash used in investing activities
|
(14,967
|
)
|
(6,452
|
)
|
(62,314
|
)
|
|||||
|
Cash flows from financing activities:
|
|
|
|
||||||||
|
Dividends paid
|
(55,244
|
)
|
(53,342
|
)
|
(51,375
|
)
|
|||||
|
Reissuance of treasury stock pursuant to Dividend Reinvestment Plan
|
95
|
|
109
|
|
113
|
|
|||||
|
Tax benefit from equity compensation plans
(1)
|
—
|
|
2,981
|
|
1,873
|
|
|||||
|
Proceeds from the exercise of stock options
|
12,808
|
|
5,968
|
|
6,251
|
|
|||||
|
Net proceeds from short-term borrowings
|
35,382
|
|
—
|
|
—
|
|
|||||
|
Net cash used in financing activities
|
(6,959
|
)
|
(44,284
|
)
|
(43,138
|
)
|
|||||
|
Net change in cash and cash equivalents
|
(14,296
|
)
|
(9,336
|
)
|
(42,091
|
)
|
|||||
|
Cash and cash equivalents at beginning of the period
|
23,853
|
|
33,189
|
|
75,280
|
|
|||||
|
Cash and cash equivalents at end of the period
|
$
|
9,557
|
|
$
|
23,853
|
|
$
|
33,189
|
|
||
|
Supplementary cash flow information:
|
|
|
|
||||||||
|
Cash paid for interest
|
$
|
1,363
|
|
$
|
574
|
|
$
|
258
|
|
||
|
Cash paid for income taxes, net of refunds
|
$
|
35,367
|
|
$
|
32,532
|
|
$
|
7,901
|
|
||
(1)
The Company adopted the provisions of ASU 2016-09 prospectively, and as such the amounts reflected for the years ended December 31, 2016 and 2015 have not been adjusted.
See accompanying notes.
36
Healthcare Services Group, Inc.
Consolidated Statements of Stockholders’ Equity
(in thousands)
|
|
Common Stock
|
Additional Paid-in Capital
|
Accumulated Other Comprehensive Income (Loss), net of Taxes
|
Retained Earnings
|
Treasury Stock
|
Stockholders’ Equity
|
||||||||||||||||||||
|
|
Shares
|
Amount
|
||||||||||||||||||||||||
|
Balance, December 31, 2014
|
72,878
|
|
$
|
729
|
|
$
|
186,022
|
|
$
|
25
|
|
$
|
100,237
|
|
$
|
(11,183
|
)
|
$
|
275,830
|
|
||||||
|
Comprehensive income:
|
|
|
|
|
|
|
|
|||||||||||||||||||
|
Net income for the period
|
|
|
|
|
58,024
|
|
|
58,024
|
|
|||||||||||||||||
|
Unrealized gain on available-for-sale marketable securities, net of taxes
|
|
|
|
518
|
|
|
|
518
|
|
|||||||||||||||||
|
Comprehensive income
|
|
|
|
|
|
|
$
|
58,542
|
|
|||||||||||||||||
|
Exercise of stock options and other stock-based compensation, net of shares tendered for payment
|
386
|
|
4
|
|
6,247
|
|
|
|
|
|
6,251
|
|
||||||||||||||
|
Tax benefit from equity compensation plans
|
|
|
1,873
|
|
|
|
|
1,873
|
|
|||||||||||||||||
|
Share-based compensation expense — stock options and restricted stock
|
|
|
3,033
|
|
|
|
|
3,033
|
|
|||||||||||||||||
|
Treasury shares issued for Deferred Compensation Plan funding and redemptions
|
|
|
418
|
|
|
|
70
|
|
488
|
|
||||||||||||||||
|
Shares issued pursuant to Employee Stock Plans
|
|
|
1,363
|
|
|
|
338
|
|
1,701
|
|
||||||||||||||||
|
Dividends paid
|
|
|
|
|
(51,375
|
)
|
|
(51,375
|
)
|
|||||||||||||||||
|
Shares issued pursuant to Dividend Reinvestment Plan
|
|
|
343
|
|
|
|
(230
|
)
|
113
|
|
||||||||||||||||
|
Shares issued pursuant to prior year acquisition
|
529
|
|
5
|
|
(5
|
)
|
|
|
|
|
|
|
—
|
|
||||||||||||
|
Balance, December 31, 2015
|
73,793
|
|
738
|
|
199,294
|
|
543
|
|
106,886
|
|
(11,005
|
)
|
296,456
|
|
||||||||||||
|
Comprehensive income:
|
|
|
|
|
|
|
|
|
|
|
|
|
|
|
||||||||||||
|
Net income for the period
|
|
|
|
|
77,396
|
|
|
77,396
|
|
|||||||||||||||||
|
Unrealized loss on available-for-sale marketable securities, net of taxes
|
|
|
|
(862
|
)
|
|
|
|
(862
|
)
|
||||||||||||||||
|
Comprehensive income
|
|
|
|
|
|
|
|
$
|
76,534
|
|
||||||||||||||||
|
Exercise of stock options and other stock-based compensation, net of shares tendered for payment
|
301
|
|
3
|
|
5,965
|
|
|
|
|
5,968
|
|
|||||||||||||||
|
Tax benefit from equity compensation plans
|
|
|
|
|
2,773
|
|
|
|
|
|
2,773
|
|
||||||||||||||
|
Share-based compensation expense — stock options and restricted stock
|
|
|
3,743
|
|
|
|
|
3,743
|
|
|||||||||||||||||
|
Treasury shares issued for Deferred Compensation Plan funding and redemptions
|
|
|
103
|
|
|
|
431
|
|
534
|
|
||||||||||||||||
|
Shares issued pursuant to Employee Stock Plans
|
|
|
1,696
|
|
|
|
371
|
|
2,067
|
|
||||||||||||||||
|
Dividends paid
|
|
|
|
|
|
(53,342
|
)
|
|
|
(53,342
|
)
|
|||||||||||||||
|
Shares issued pursuant to Dividend Reinvestment Plan
|
|
|
91
|
|
|
|
|
18
|
|
109
|
|
|||||||||||||||
|
Shares issued pursuant to previous settlement
|
113
|
|
1
|
|
3,999
|
|
|
|
|
|
4,000
|
|
||||||||||||||
|
Other
|
(3
|
)
|
|
|
|
|
|
|
|
—
|
|
|||||||||||||||
|
Balance, December 31, 2016
|
74,204
|
|
742
|
|
217,664
|
|
(319
|
)
|
130,940
|
|
(10,185
|
)
|
338,842
|
|
||||||||||||
|
Comprehensive income:
|
|
|
|
|
|
|
|
|
|
|
||||||||||||||||
|
Net income for the period
|
|
|
|
|
|
|
|
|
88,226
|
|
|
|
88,226
|
|
||||||||||||
|
Unrealized gain on available-for-sale marketable securities, net of taxes
|
|
|
|
|
|
|
1,156
|
|
|
|
|
|
1,156
|
|
||||||||||||
|
Comprehensive income
|
|
|
|
|
|
|
|
|
|
|
|
|
$
|
89,382
|
|
|||||||||||
|
Exercise of stock options and other stock-based compensation, net of shares tendered for payment
|
697
|
|
7
|
|
12,801
|
|
|
|
|
|
|
|
12,808
|
|
||||||||||||
|
Share-based compensation expense — stock options and restricted stock
|
|
|
|
|
4,945
|
|
|
|
|
|
|
|
4,945
|
|
||||||||||||
|
Treasury shares issued for Deferred Compensation Plan funding and redemptions
|
|
|
|
|
181
|
|
|
|
|
|
(25
|
)
|
156
|
|
||||||||||||
|
Shares issued pursuant to Employee Stock Plans
|
|
|
|
|
1,752
|
|
|
|
|
|
339
|
|
2,091
|
|
||||||||||||
|
Dividends paid and accrued
|
|
|
|
|
|
|
|
|
(55,306
|
)
|
|
|
(55,306
|
)
|
||||||||||||
|
Shares issued pursuant to Dividend Reinvestment Plans
|
|
|
|
|
82
|
|
|
|
|
|
13
|
|
95
|
|
||||||||||||
|
Shares issued pursuant to acquisition
|
59
|
|
1
|
|
6,938
|
|
|
|
|
|
|
|
6,939
|
|
||||||||||||
|
Balance, December 31, 2017
|
74,960
|
|
$
|
750
|
|
$
|
244,363
|
|
$
|
837
|
|
$
|
163,860
|
|
$
|
(9,858
|
)
|
$
|
399,952
|
|
||||||
See accompanying notes.
37
Healthcare Services Group, Inc.
Notes to Consolidated Financial Statements
Years Ended December 31,
2017
,
2016
and
2015
Nature of Operations
Healthcare Services Group, Inc. (the “Company”) provides management, administrative and operating expertise and services to the housekeeping, laundry, linen, facility maintenance and dietary service departments of healthcare facilities, including nursing homes, retirement complexes, rehabilitation centers and hospitals located throughout the United States. Although the Company does not directly participate in any government reimbursement programs, the Company’s clients receive government reimbursements related to Medicare and Medicaid. Therefore, they are directly affected by any legislation relating to Medicare and Medicaid reimbursement programs.
The Company provides services primarily pursuant to full service agreements with its clients. In such agreements, the Company is responsible for the day-to-day management of employees located at the clients’ facilities. The Company also provides services on the basis of management-only agreements for a limited number of clients. The Company’s agreements with its clients typically provide for a
one
year service term, cancelable by either party upon
30
to
90
days’ notice, after the initial
60
to
120
day period.
The Company is organized into
two
reportable segments; housekeeping, laundry, linen and other services (“Housekeeping”), and dietary department services (“Dietary”).
Housekeeping consists of managing the clients’ housekeeping departments, which are principally responsible for the cleaning, disinfecting and sanitizing of resident rooms and common areas of a client’s facility, as well as the laundering and processing of the bed linens, uniforms, resident personal clothing and other assorted linen items utilized at a client facility.
Dietary consists of managing the clients’ dietary departments which are principally responsible for food purchasing, meal preparation and dietitian professional services, which includes the development of menus that meet residents’ dietary needs.
Use of Estimates in Financial Statements
In preparing financial statements in conformity with United States generally accepted accounting principles (“U.S. GAAP”), estimates and assumptions are made that affect the reported amounts of assets and liabilities, disclosures of contingent assets and liabilities, and the reported amounts of revenues and expenses. Actual results could differ from those estimates. Significant estimates are used in determining, but are not limited to, the Company’s allowance for doubtful accounts, accrued insurance claims, valuations, deferred taxes and reviews for potential impairment. The estimates are based upon various factors including current and historical trends, as well as other pertinent industry and regulatory authority information. Management regularly evaluates this information to determine if it is necessary to update the basis for its estimates and to adjust for known changes.
Principles of Consolidation
The accompanying Consolidated Financial Statements include the accounts of Healthcare Services Group, Inc. and its wholly-owned subsidiaries. All significant intercompany transactions and balances have been eliminated in consolidation.
Fair Value of Financial Instruments
The Company determines fair value as the price that would be received to sell an asset or paid to transfer a liability in an orderly transaction between market participants at the measurement date. The Company utilizes valuation techniques that maximize the use of observable inputs (Levels 1 and 2) and minimize the use of unobservable inputs (Level 3) within the fair value hierarchy. Assets and liabilities are classified within the fair value hierarchy based on the lowest level (least observable) input that is significant to the measurement in its entirety.
The Company’s financial instruments that are measured at fair value on a recurring basis consist of marketable securities and the deferred compensation fund investments. Other financial instruments such as cash and cash equivalents, accounts and notes receivable, accounts payable (including income taxes payable and accrued expenses) and borrowings under the Company’s line of credit are short-term in nature, and therefore the carrying value of these instruments are deemed to approximate their fair value.
38
The Company has certain notes receivable that either do not bear interest or bear interest at a below-market rate. Therefore, such notes receivable of
$6.9 million
and
$5.7 million
at
December 31, 2017
and
2016
, respectively, have been discounted to their present value and are reported at values of
$6.8 million
and
$5.7 million
at
December 31, 2017
and
2016
, respectively.
Cash and Cash Equivalents
Cash and cash equivalents are held in U.S. financial institutions or in custodial accounts with U.S. financial institutions. Cash and cash equivalents are defined as short-term, highly liquid investments with a maturity of three months or less at time of purchase that are readily convertible into cash and have insignificant interest rate risk.
Investments in Marketable Securities
Marketable securities are defined as fixed income investments which are highly liquid and can be readily purchased or sold through established markets. At
December 31, 2017
, the Company had marketable securities of
$73.2 million
which were comprised primarily of tax exempt municipal bonds. These investments are accounted for as available-for-sale securities and are reported at fair value on the balance sheet. For the year ended
December 31, 2017
,
$1.1 million
of unrealized
gains
related to these investments were recorded in other comprehensive income. Unrealized gains and losses are recorded net of income taxes.
These assets are available for future needs under the Company’s self-insurance programs. The Company’s investment policy is intended to manage the assets to achieve the goals of preserving principal, maintaining adequate liquidity at all times, and maximizing returns subject to investment guidelines. The investment policy limits investment to certain types of instruments issued by institutions primarily with investment grade credit ratings and places restrictions on concentration by type and issuer.
The Company periodically reviews the investments in marketable securities for other than temporary declines in fair value below the cost basis and whenever events or changes in circumstances indicate that the carrying amount of an asset may not be recoverable. As of
December 31, 2017
, Management believes that the recorded value of the Company’s investments in marketable securities was recoverable in all material respects.
Inventories and Supplies
Inventories and supplies include housekeeping, linen and laundry supplies, as well as food provisions and supplies. Inventories and supplies are stated at cost to approximate a first-in, first-out (FIFO) basis. Linen supplies are amortized on a straight-line basis over their estimated useful life of
24
months.
Property and Equipment
Property and equipment are stated at cost, net of accumulated depreciation. Additions, renewals and improvements are capitalized, while maintenance and repair costs are expensed when incurred. When assets are retired or otherwise disposed of, the cost and related accumulated depreciation are removed from the respective accounts and any resulting gain or loss is included in income. Depreciation is recorded using the straight-line method over the following estimated useful lives: Housekeeping and Dietary equipment —
5
to
7
years; computer hardware and software —
3
to
7
years; and other, consisting of furniture and fixtures, leasehold improvements and vehicles —
5
to
10
years. Depreciation expense on property and equipment for the years ended
December 31, 2017
,
2016
and
2015
was
$5.0 million
,
$4.8 million
and
$4.4 million
, respectively.
Revenue Recognition
Revenues from the Company’s service agreements with clients are recognized as services are performed. Revenues are reported net of sales taxes that are collected from customers and remitted to taxing authorities.
Income Taxes
The Company uses the asset and liability method of accounting for income taxes. Under this method, income tax expense is recognized for the amount of taxes payable or refundable for the current year. The Company accrues for probable tax obligations as required by facts and circumstances in various regulatory environments. In addition, deferred tax assets and liabilities are recognized for expected future tax consequences of temporary differences between the financial reporting and tax basis of assets and liabilities. When appropriate, valuation allowances are recorded to reduce deferred tax assets to amounts for which realization is more likely than not. Deferred tax assets and liabilities are more fully described in Note 12.
39
Uncertain income tax positions taken or expected to be taken in tax returns are reflected within the Company’s financial statements based on a recognition and measurement process.
Earnings per Common Share
Basic earnings per common share is computed by dividing income available to common shareholders by the weighted-average number of common shares outstanding for the period. Diluted earnings per common share is calculated using the weighted-average number of common shares outstanding and dilutive common shares, such as those issuable upon exercise of stock options and upon the vesting of restricted stock and restricted stock units.
Share-Based Compensation
The Company estimates the fair value of share-based awards on the date of grant using the Black-Scholes valuation model for stock options and using the share price on the date of grant for restricted stock and restricted stock units. The value of the award is recognized ratably as an expense in the Company’s Consolidated Statements of Comprehensive Income over the requisite service periods, with adjustments made for forfeitures as they occur.
Advertising Costs
Advertising costs are expensed when incurred. Advertising costs were
no
t material for the years ended
December 31, 2017
,
2016
and
2015
.
Impairment of Long-Lived Assets
The carrying amounts of long-lived assets are periodically reviewed to determine whether current events or circumstances warrant adjustment to such carrying amounts. Any impairment would be measured as the amount that the carrying value of such assets exceeds their fair value, primarily based on estimated undiscounted cash flows. Considerable management judgment is necessary to estimate the fair value of assets. Assets to be disposed of are carried at the lower of their financial statement carrying amount or fair value, less cost to sell.
Identifiable Intangible Assets and Goodwill
Identifiable intangible assets are amortized on a straight-line basis over their respective lives. Goodwill represents the excess of cost over the fair value of net assets of acquired businesses. Management reviews the carrying value of goodwill at least annually during the fourth quarter of each year to assess for impairment, or more often if events or circumstances indicate that the carrying value may exceed its estimated fair value.
No
impairment loss was recognized on the Company’s intangible assets or goodwill for the years ended
December 31, 2017
,
2016
or
2015
.
Treasury Stock
Treasury stock purchases are accounted for under the cost method whereby the entire cost of the acquired stock is recorded as treasury stock. Gains or losses on the subsequent reissuance of shares are credited or charged to additional paid in capital.
Reclassification
Certain prior period amounts have been reclassified to conform to current year presentation.
Concentrations of Credit Risk
The Company’s financial instruments that are subject to concentrations of credit risk are cash and cash equivalents, marketable securities, deferred compensation funding and accounts and notes receivable. The Company’s marketable securities are fixed income investments which are highly liquid and can be readily purchased or sold using established markets. At
December 31, 2017
and
2016
, substantially all of the Company’s cash and cash equivalents and marketable securities were held in
one
large financial institution located in the United States.
The Company’s clients are concentrated in the healthcare industry, and are primarily providers of long-term care. The revenues of many of the Company’s clients are highly reliant on Medicare, Medicaid and third-party payors’ reimbursement funding rates. New legislation or changes in existing regulations could be made which could directly impact the governmental reimbursement
40
programs in which the clients participate. As a result, the Company may not know the full effects of such programs until these laws are fully implemented and governmental agencies issue applicable regulations or guidance.
Significant Clients
For the year ended
December 31, 2017
, the Company had several clients who individually contributed over 3%, with one client, a multi-state operator, contributing as high as
17.6%
, of the Company’s total consolidated revenues. Although the Company expects to continue its relationships with these clients, there can be no assurance thereof. The loss, individually or in the aggregate, of such clients, or a significant reduction in the revenues the Company receives from such clients, could have a material adverse effect on the Company’s results of operations. In addition, if any of these clients change or alter current payments terms, it could increase the Company’s accounts receivables balance and have a material adverse effect on the Company’s cash flows.
Recent Accounting Pronouncements
In March 2016, the Financial Accounting Standards Board (“FASB”) issued ASU 2016-09,
Stock Compensation: Improvements to Employee Share-Based Payment Accounting.
ASU 2016-09 was intended to simplify several aspects of the accounting for share-based payments. The Company adopted the standard beginning January 1, 2017. The impact of adopting the standard included the recognition of excess tax benefits related to share-based payments as a component of income tax expense, as opposed to additional paid-in capital; an amendment to the calculation of diluted earnings per share to exclude windfall tax benefits from assumed proceeds when calculating diluted shares outstanding; as well as accounting for forfeitures of share-based awards as they occur, as opposed to reserving for estimated forfeitures. The most material impact of the adoption was a reduction to income tax expense in 2017 of
$5.7 million
.
In January 2017, the FASB issued ASU 2017-01,
Business Combinations: Clarifying the Definition of a Business
. The guidance changes the definition of a business to assist entities in evaluating whether a set of transferred assets and activities constitutes a business under Topic 805. The guidance is effective for annual periods beginning after December 15, 2017, with early adoption permitted. The Company adopted the standard effective January 1, 2018.
In May 2014, the FASB issued ASU 2014-09,
Revenue from Contracts with Customers
, which was subsequently amended and updated throughout 2015 and 2016. The standard provides guidance on revenue recognition, among other topics such as the accounting for compensation and costs to obtain a contract. The standard requires that an entity recognize revenue to depict the transfer of promised goods or services to customers in an amount that reflects the consideration to which the entity expects to be entitled in exchange for those goods or services. Adoption is required for reporting periods beginning after December 15, 2017, with early adoption prohibited. The Company adopted the standard beginning on January 1, 2018 utilizing the modified retrospective method. The Company has evaluated the impact of the adoption of the standard by reviewing the nature and terms of existing contracts under the provisions of the new guidance and designing operational and process updates required for ongoing compliance. Management does not expect this guidance to result in a material impact to the Company's accounting for the revenue earned related to its Housekeeping and Dietary department services and accordingly, does not expect to record an adjustment to its consolidated financial statements upon adoption of the standard. Management anticipates that the most significant impact of the new standard will relate to additional disclosure obligations.
In February 2016, the FASB issued ASU 2016-02,
Leases
. ASU 2016-02 requires lessees to recognize assets and liabilities on their balance sheet related to the rights and obligations created by most leases, while continuing to recognize expenses on their income statements over the lease term. It will also require disclosures designed to give financial statement users information regarding the amount, timing, and uncertainty of cash flows arising from leases. The guidance is effective for annual reporting periods beginning after December 15, 2018, and interim periods within those years. Early adoption is permitted for all entities. The Company will adopt the new guidance as of January 1, 2019. Management is continuing to evaluate the expected impact of the requirements, however it is expected that the primary impact will relate to the capitalization of operating leases of office space, vehicles and equipment.
41
For the years ended
December 31, 2017
,
2016
and
2015
, the Company’s other comprehensive income related to the unrealized gains and losses from the Company’s available-for-sale marketable securities.
The following table provides a summary of changes in accumulated other comprehensive income, net of taxes:
|
Unrealized Gains and (Losses) on Available-for Sale-Securities
(1)
|
|||||||||||
|
2017
|
2016
|
2015
|
|||||||||
|
(in thousands)
|
|||||||||||
|
Accumulated other comprehensive (loss) income — beginning balance
|
$
|
(319
|
)
|
$
|
543
|
|
$
|
25
|
|
||
|
Other comprehensive income (loss) before reclassifications
|
1,149
|
|
(1,005
|
)
|
535
|
|
|||||
|
Losses (gains) reclassified from other comprehensive income
(2)
|
7
|
|
143
|
|
(17
|
)
|
|||||
|
Net current period other comprehensive income (loss)
(3)
|
1,156
|
|
(862
|
)
|
518
|
|
|||||
|
Accumulated other comprehensive income (loss) — ending balance
|
$
|
837
|
|
$
|
(319
|
)
|
$
|
543
|
|
||
|
(1)
|
All amounts are net of tax.
|
|
(2)
|
For the years ended
December 31, 2017
and
2016
, the Company recorded
less than $0.1 million
and
$0.2 million
of realized
losses
from the sale of available-for-sale securities, respectively. For the year ended
December 31, 2015
, the Company recorded
less than $0.1 million
of realized
gains
for the sale of available-for-sale securities. Refer to Note 5 herein for further information.
|
|
(3)
|
For the years ended
December 31, 2017
and 2015, the changes in other comprehensive income were both net of tax expense of $
0.3 million
. For the year ended December 31, 2016, the changes in other comprehensive income were net of a tax benefit of $
0.5 million
.
|
|
Amounts Reclassified from Accumulated Other Comprehensive Income
|
|||||||||||
|
2017
|
2016
|
2015
|
|||||||||
|
For the Year Ended December 31,
|
(in thousands)
|
||||||||||
|
Losses (gains) from the sale of available-for-sale securities
|
$
|
11
|
|
$
|
222
|
|
$
|
(27
|
)
|
||
|
Tax (benefit) expense
|
(4
|
)
|
(79
|
)
|
10
|
|
|||||
|
Net loss (gain) reclassified from accumulated other comprehensive income
|
7
|
|
$
|
143
|
|
$
|
(17
|
)
|
|||
Property and equipment are recorded at cost. Depreciation is computed using the straight-line method and is recorded over the estimated useful life of each class of depreciable asset. Leasehold improvements are amortized over the shorter of the estimated asset life or term of the lease. Repairs and maintenance costs are charged to expense as incurred.
The following table sets forth the amounts of property and equipment by each class of depreciable asset as of
December 31, 2017
and
December 31, 2016
:
|
December 31, 2017
|
December 31, 2016
|
||||||
|
(in thousands)
|
|||||||
|
Housekeeping and Dietary equipment
|
$
|
22,349
|
|
$
|
21,136
|
|
|
|
Computer hardware and software
|
12,665
|
|
11,750
|
|
|||
|
Other
(1)
|
990
|
|
1,133
|
|
|||
|
Total property and equipment, at cost
|
$
|
36,004
|
|
$
|
34,019
|
|
|
|
Less accumulated depreciation
|
22,495
|
|
20,564
|
|
|||
|
Total property and equipment, net
|
$
|
13,509
|
|
$
|
13,455
|
|
|
|
(1)
|
Includes furniture and fixtures, leasehold improvements and autos and trucks.
|
42
Depreciation expense for the years ended
December 31, 2017
,
2016
and
2015
was
$5.0 million
,
$4.8 million
and
$4.4 million
, respectively.
Goodwill
Goodwill represents the excess of the purchase price over the fair value of net assets of acquired businesses. Goodwill is not amortized, but is evaluated for impairment on an annual basis, or more frequently if impairment indicators arise.
Goodwill by reportable operating segment, as described in Note 14 - Segment Information, was approximately
$42.4 million
and
$8.7 million
for Housekeeping and Dietary, respectively, as of
December 31, 2017
. At
December 31, 2016
, goodwill by reportable operating segment was
$42.4 million
and
$2.1 million
for Housekeeping and Dietary, respectively. The increase in goodwill is related to the acquisition of certain Dietary-related assets during
2017
.
Intangible Assets
The Company’s intangible assets consist of customer relationships which were obtained through acquisitions and are recorded at their fair values at the date of acquisition. Intangible assets with determinable lives are amortized on a straight-line basis over their estimated useful lives. The customer relationships have a weighted-average amortization period of
9.9 years
. The increase from the prior year is due to the acquisition of certain Dietary-related assets during
2017
.
The following table sets forth the estimated amortization expense for intangibles subject to amortization for the next five years and thereafter:
|
Period/Year
|
Total Amortization Expense
|
|||
|
(in thousands)
|
||||
|
2018
|
$
|
4,364
|
|
|
|
2019
|
$
|
4,165
|
|
|
|
2020
|
$
|
4,165
|
|
|
|
2021
|
$
|
4,165
|
|
|
|
2022
|
$
|
4,165
|
|
|
|
Thereafter
|
$
|
9,859
|
|
|
Amortization expense for the years ended
December 31, 2017
,
2016
and
2015
was
$3.9 million
,
$2.7 million
and
$3.2 million
, respectively.
The Company’s current assets and current liabilities are financial instruments and most of these items (other than marketable securities and inventories) are recorded at cost in the Consolidated Balance Sheets. The estimated fair value of these financial instruments approximates their carrying value due to their short-term nature. The Company’s financial assets that are measured at fair value on a recurring basis are its marketable securities and deferred compensation funding. The recorded values of all of the financial instruments approximate their current fair values because of their nature, stated interest rates and respective maturity dates or durations.
The Company’s marketable securities consist of tax-exempt municipal bonds, which are classified as available-for-sale and are reported at fair value. Unrealized gains and losses associated with these investments are included in other comprehensive income (net of tax) within the Consolidated Statements of Comprehensive Income. The fair value of these marketable securities is classified within Level 2 of the fair value hierarchy, as these securities are measured using quoted prices for identical or similar instruments in markets that are not active, and model-based valuation techniques for which all significant assumptions are observable. Such valuations are determined by a third-party pricing service. For the years ended
December 31, 2017
,
2016
and
2015
, the Company recorded unrealized
gains
of
$1.2 million
, unrealized
losses
of
$0.9 million
and unrealized
gains
of
$0.5 million
on marketable securities, respectively.
For the years ended
December 31, 2017
,
2016
and
2015
, the Company received total proceeds, less the amount of interest received, of
$28.5 million
,
$28.1 million
and
$16.4 million
, respectively, from sales of available-for-sale municipal bonds. For the years
43
ended
December 31, 2017
and
2016
, these sales resulted in realized
losses
of
less than $0.1 million
and
$0.2 million
, respectively. For the year ended
December 31, 2015
, there were realized
gains
of
less than $0.1 million
. Such gains and losses were recorded in “Other income-Investment and interest” in the Consolidated Statements of Comprehensive Income. The basis for the sale of these securities was the specific identification of each bond sold during the period.
The investments under the funded deferred compensation plan are accounted for as trading securities and unrealized gains or losses are included in earnings. The fair value of these investments are determined based on quoted market prices (Level 1).
The following tables provide fair value measurement information for the Company’s marketable securities and deferred compensation fund investment assets as of
December 31, 2017
and
2016
:
|
|
As of December 31, 2017
|
||||||||||||||||||
|
|
|
|
Fair Value Measurement Using:
|
||||||||||||||||
|
|
Carrying
Amount |
Total Fair
Value |
Quoted
Prices in Active Markets (Level 1) |
Significant
Other Observable Inputs (Level 2) |
Significant
Unobservable Inputs (Level 3) |
||||||||||||||
|
(in thousands)
|
|||||||||||||||||||
|
Financial Assets:
|
|||||||||||||||||||
|
Marketable securities
|
|||||||||||||||||||
|
Municipal bonds — available-for-sale
|
$
|
73,221
|
|
$
|
73,221
|
|
$
|
—
|
|
$
|
73,221
|
|
$
|
—
|
|
||||
|
Deferred compensation fund
|
|||||||||||||||||||
|
Money Market
(1)
|
$
|
2,720
|
|
$
|
2,720
|
|
$
|
—
|
|
$
|
2,720
|
|
$
|
—
|
|
||||
|
Balanced and Lifestyle
|
8,523
|
|
8,523
|
|
8,523
|
|
—
|
|
—
|
|
|||||||||
|
Large Cap Growth
|
7,802
|
|
7,802
|
|
7,802
|
|
—
|
|
—
|
|
|||||||||
|
Small Cap Growth
|
3,442
|
|
3,442
|
|
3,442
|
|
—
|
|
—
|
|
|||||||||
|
Fixed Income
|
3,050
|
|
3,050
|
|
3,050
|
|
—
|
|
—
|
|
|||||||||
|
International
|
1,531
|
|
1,531
|
|
1,531
|
|
—
|
|
—
|
|
|||||||||
|
Mid Cap Growth
|
1,817
|
|
1,817
|
|
1,817
|
|
—
|
|
—
|
|
|||||||||
|
Deferred compensation fund
|
$
|
28,885
|
|
$
|
28,885
|
|
$
|
26,165
|
|
$
|
2,720
|
|
$
|
—
|
|
||||
44
|
|
As of December 31, 2016
|
||||||||||||||||||
|
|
|
|
Fair Value Measurement Using:
|
||||||||||||||||
|
|
Carrying
Amount |
Total Fair
Value |
Quoted
Prices in Active Markets (Level 1) |
Significant
Other Observable Inputs (Level 2) |
Significant
Unobservable Inputs (Level 3) |
||||||||||||||
|
(in thousands)
|
|||||||||||||||||||
|
Financial Assets:
|
|||||||||||||||||||
|
Marketable securities
|
|||||||||||||||||||
|
Municipal bonds — available-for-sale
|
$
|
67,730
|
|
$
|
67,730
|
|
$
|
—
|
|
$
|
67,730
|
|
$
|
—
|
|
||||
|
Deferred compensation fund
|
|||||||||||||||||||
|
Money Market
(1)
|
$
|
3,147
|
|
$
|
3,147
|
|
$
|
—
|
|
$
|
3,147
|
|
$
|
—
|
|
||||
|
Balanced and Lifestyle
|
7,162
|
|
7,162
|
|
7,162
|
|
—
|
|
—
|
|
|||||||||
|
Large Cap Growth
|
5,583
|
|
5,583
|
|
5,583
|
|
—
|
|
—
|
|
|||||||||
|
Small Cap Value
|
2,933
|
|
2,933
|
|
2,933
|
|
—
|
|
—
|
|
|||||||||
|
Fixed Income
|
2,752
|
|
2,752
|
|
2,752
|
|
—
|
|
—
|
|
|||||||||
|
International
|
1,132
|
|
1,132
|
|
1,132
|
|
—
|
|
—
|
|
|||||||||
|
Mid Cap Growth
|
1,410
|
|
1,410
|
|
1,410
|
|
—
|
|
—
|
|
|||||||||
|
Deferred compensation fund
|
$
|
24,119
|
|
$
|
24,119
|
|
$
|
20,972
|
|
$
|
3,147
|
|
$
|
—
|
|
||||
(1)
The fair value of the money market fund is based on the net asset value (“NAV”) of the shares held by the plan at the end of the period. The money market fund includes short-term United States dollar denominated money-market instruments and the NAV is determined by the custodian of the fund. The money market fund can be redeemed at its NAV at the measurement date, as there are no significant restrictions on the ability to sell this investment.
|
|
Amortized Cost
|
Gross Unrealized Gains
|
Gross Unrealized Losses
|
Estimated Fair Value
|
Other-Than-Temporary Impairments
|
||||||||||||||
|
(in thousands)
|
|||||||||||||||||||
|
December 31, 2017
|
|||||||||||||||||||
|
Marketable securities
|
|||||||||||||||||||
|
Municipal bonds — available-for-sale
|
$
|
72,249
|
|
$
|
1,169
|
|
$
|
(197
|
)
|
$
|
73,221
|
|
$
|
—
|
|
||||
|
Total debt securities
|
$
|
72,249
|
|
$
|
1,169
|
|
$
|
(197
|
)
|
$
|
73,221
|
|
$
|
—
|
|
||||
|
December 31, 2016
|
|
|
|
|
|
||||||||||||||
|
Marketable securities
|
|||||||||||||||||||
|
Municipal bonds — available-for-sale
|
$
|
68,220
|
|
$
|
178
|
|
$
|
(668
|
)
|
$
|
67,730
|
|
$
|
—
|
|
||||
|
Total debt securities
|
$
|
68,220
|
|
$
|
178
|
|
$
|
(668
|
)
|
$
|
67,730
|
|
$
|
—
|
|
||||
|
December 31, 2015
|
|
|
|
|
|
||||||||||||||
|
Marketable securities
|
|||||||||||||||||||
|
Municipal bonds — available-for-sale
|
$
|
68,640
|
|
$
|
869
|
|
$
|
(13
|
)
|
$
|
69,496
|
|
$
|
—
|
|
||||
|
Total debt securities
|
$
|
68,640
|
|
$
|
869
|
|
$
|
(13
|
)
|
$
|
69,496
|
|
$
|
—
|
|
||||
45
The following table summarizes the contractual maturities of debt securities held at
December 31, 2017
and
2016
, which are classified as marketable securities in the Consolidated Balance Sheets:
|
|
Municipal Bonds — Available-for-Sale
|
||||||
|
December 31,
|
|||||||
|
2017
|
2016
|
||||||
|
(in thousands)
|
|||||||
|
Contractual maturity:
|
|||||||
|
Maturing in one year or less
|
$
|
916
|
|
$
|
973
|
|
|
|
Maturing in second year through fifth year
|
15,948
|
|
28,671
|
|
|||
|
Maturing in sixth year through tenth year
|
22,851
|
|
21,651
|
|
|||
|
Maturing after ten years
|
33,506
|
|
16,435
|
|
|||
|
Total debt securities
|
$
|
73,221
|
|
$
|
67,730
|
|
|
Any decision to extend credit is made on a case-by-case basis and is based on a number of qualitative and quantitative factors related to the particular client, as well as the general risks associated with operating within the long-term care industry.
The Company’s net accounts and notes receivable balance
increased
from
December 31, 2016
. Fluctuations in net accounts and notes receivable are attributable to a variety of factors including, but not limited to, the timing of cash receipts from customers and the inception, transition or termination of client relationships.
There are a variety of factors that impact the clients’ ability to pay in accordance with the Company’s agreements. Primary among these factors is the clients’ participation in programs funded by federal and state governmental agencies. Deviations in the timing or amounts of reimbursements under those programs can impact the clients’ cash flows and the timing of their payments. The payment terms in the Company’s service agreements are not contingent upon the clients’ cash flows and notwithstanding the Company’s efforts to minimize credit risk exposure, various factors affecting the clients’ cash flows could have an indirect, yet material adverse effect on the Company’s results of operations and financial condition.
The Company deploys significant resources and has invested in tools and processes to optimize Management’s credit and collections efforts. When appropriate, the Company utilizes interest-bearing promissory notes as an alternative to accounts receivable to enhance the collectability of amounts due, by providing a definitive repayment plan and providing a means by which to further evidence the amounts owed. At
December 31, 2017
and
2016
, the Company had
$36.6 million
and
$19.2 million
, net of reserves, respectively, of such promissory notes outstanding. In addition, the Company may assist clients who are adjusting to changes in their cash flows by amending the Company’s agreements from full-service to management-only arrangements, or by modifying contractual payment terms to accommodate clients who have in good faith established clearly-defined plans for addressing cash flow issues. These efforts are intended to minimize the Company’s collections risk while maintaining relationships with the clients.
The allowance for doubtful accounts is established as losses are estimated to have occurred through a provision for bad debts charged to cost of services provided in the Company’s Consolidated Statements of Comprehensive Income. The allowance for doubtful accounts is evaluated based on the Company’s ongoing review of accounts and notes receivable and is inherently subjective as it requires estimates that are susceptible to significant revision as more information becomes available.
The Company has had varying collections experience with respect to its accounts and notes receivable. The Company has sometimes extended the period of payment for certain clients beyond contractual terms. Such clients include those who have terminated service agreements and slow payers experiencing financial difficulties. In order to provide for these collection problems and the general risk associated with the granting of credit terms, the Company recorded the following bad debt provisions (in an Allowance for Doubtful Accounts):
|
|
Year Ended December 31,
|
||||||||||
|
|
2017
|
2016
|
2015
|
||||||||
|
(in thousands)
|
|||||||||||
|
Bad debt provision
|
$
|
6,250
|
|
$
|
4,629
|
|
$
|
4,335
|
|
||
46
As a percentage of total revenues, these provisions represent approximately
0.3%
for each of the years ended
December 31, 2017
,
2016
and
2015
.
In making the Company’s credit evaluations, in addition to analyzing and anticipating, where possible, the specific cases described above, management considered the general collection risk associated with trends in the long-term care industry. The Company establishes credit limits, performs ongoing credit evaluations and monitors accounts to minimize the risk of loss. Despite the Company’s efforts to minimize credit risk exposure, clients could be adversely affected if future industry trends change in such a manner as to negatively impact their cash flows. If the Company’s clients experience a negative impact on their cash flows, it could have a material adverse effect on the Company’s results of operations and financial condition.
Impaired Notes Receivable
The Company evaluates its notes receivable for impairment quarterly and on an individual client basis. Notes receivable are generally evaluated for impairment when the respective clients are either in bankruptcy, are subject to collections activity or are slow payers that are experiencing financial difficulties. In the event that the evaluation results in a determination that a note receivable is impaired, it is valued at the present value of expected future cash flows or at the market value of related collateral. Summary schedules of impaired notes receivable, and the related reserve, for the years ended
December 31, 2017
,
2016
and
2015
are as follows:
|
Impaired Notes Receivable
|
||||||||||||||||||||
|
Year Ended December 31,
|
Balance Beginning of Year
|
Additions
|
Deductions
|
Balance End of Year
|
Average Outstanding Balance
|
|||||||||||||||
|
(in thousands)
|
||||||||||||||||||||
|
2017
|
$
|
5,685
|
|
$
|
1,169
|
|
$
|
—
|
|
$
|
6,854
|
|
$
|
6,270
|
|
|||||
|
2016
|
$
|
6,471
|
|
$
|
—
|
|
$
|
786
|
|
$
|
5,685
|
|
$
|
6,078
|
|
|||||
|
2015
|
$
|
10,208
|
|
$
|
395
|
|
$
|
4,132
|
|
$
|
6,471
|
|
$
|
8,340
|
|
|||||
|
Reserve for Impaired Notes Receivable
|
||||||||||||||||
|
Year Ended December 31,
|
Balance Beginning of Year
|
Additions
|
Deductions
|
Balance End of Year
|
||||||||||||
|
(in thousands)
|
||||||||||||||||
|
2017
|
$
|
2,419
|
|
$
|
465
|
|
$
|
—
|
|
$
|
2,884
|
|
||||
|
2016
|
$
|
2,139
|
|
$
|
280
|
|
$
|
—
|
|
$
|
2,419
|
|
||||
|
2015
|
$
|
3,031
|
|
$
|
99
|
|
$
|
991
|
|
$
|
2,139
|
|
||||
For impaired notes receivable, interest income is recognized on a cost recovery basis only. As a result, no interest income was recognized on impaired notes receivable. The Company follows an income recognition policy on all other notes receivable that do not recognize interest income until cash payments are received. This policy was established, recognizing the environment of the long-term care industry, and not because such notes receivable are necessarily impaired. The difference between income recognition on a full accrual basis and cash basis, for notes receivable that are not considered impaired, is not material.
47
The Company leases office facilities, equipment and vehicles under operating leases expiring on various dates through
2025
. Certain office leases contain renewal options. The following is a schedule by calendar year of future minimum lease payments under operating leases that have remaining terms as of
December 31, 2017
:
|
Period/Year
|
Operating Leases
|
|||
|
(in thousands)
|
||||
|
2018
|
$
|
2,482
|
|
|
|
2019
|
1,968
|
|
||
|
2020
|
1,489
|
|
||
|
2021
|
734
|
|
||
|
2022
|
735
|
|
||
|
Thereafter
|
1,710
|
|
||
|
Total minimum lease payments
|
$
|
9,118
|
|
|
Total expense for all operating leases for the years ended
December 31, 2017
,
2016
and
2015
was as follows:
|
|
Year Ended December 31,
|
||||||||||
|
|
2017
|
2016
|
2015
|
||||||||
|
(in thousands)
|
|||||||||||
|
Operating lease expense
|
$
|
3,833
|
|
$
|
2,615
|
|
$
|
2,003
|
|
||
A summary of stock-based compensation expense and related tax benefits for the years ended
December 31, 2017
,
2016
and
2015
is as follows:
|
Year Ended December 31,
|
|||||||||||
|
2017
|
2016
|
2015
|
|||||||||
|
(in thousands)
|
|||||||||||
|
Stock options
|
$
|
3,740
|
|
$
|
3,193
|
|
$
|
2,781
|
|
||
|
Restricted stock and restricted stock units
|
1,205
|
|
550
|
|
252
|
|
|||||
|
Employee Stock Purchase Plan
|
1,040
|
|
509
|
|
508
|
|
|||||
|
Total pre-tax stock-based compensation expense charged against income
(1)
|
$
|
5,985
|
|
$
|
4,252
|
|
$
|
3,541
|
|
||
|
Total recognized tax benefit related to stock-based compensation
|
$
|
5,709
|
|
$
|
2,773
|
|
$
|
1,873
|
|
||
|
(1)
|
Stock-based compensation expense is recorded in the selling, general and administrative caption in the Consolidated Statements of Comprehensive Income.
|
At
December 31, 2017
, the unrecognized compensation cost related to unvested stock options and awards was
$11.4 million
. The weighted average period over which these awards will vest is approximately
2.7
years.
2012 Equity Incentive Plan
The Company’s 2012 Equity Incentive Plan (the “Plan”) provides that current or prospective officers, employees, non-employee directors and advisors can receive share-based awards such as stock options, restricted stock, restricted stock units and other stock awards. The Plan seeks to promote the highest level of performance by providing an economic interest in the long-term success of the Company.
As of
December 31, 2017
,
3.2 million
shares of Common Stock were reserved for issuance under the Plan, including
0.8 million
shares available for future grant. No stock award will have a term in excess of
ten years
. All awards granted under the Plan become vested and exercisable ratably over a
five
year period on each yearly anniversary of the grant date.
48
The Nominating, Compensation and Stock Option Committee of the Board of Directors is responsible for determining the individuals who will be granted stock awards, the number of stock awards each individual will receive and the terms of the grants in accordance with the Plan.
Stock Options
A summary of stock options outstanding under the Plan as of
December 31, 2017
and changes during
2017
is as follows:
|
|
Number of Shares
|
Weighted Average Exercise Price
|
||||
|
(in thousands, except per share data)
|
||||||
|
December 31, 2016
|
2,615
|
|
$
|
24.61
|
|
|
|
Granted
|
544
|
|
$
|
39.38
|
|
|
|
Exercised
|
(682
|
)
|
$
|
18.95
|
|
|
|
Forfeited
|
(100
|
)
|
$
|
34.10
|
|
|
|
Expired
|
(3
|
)
|
$
|
23.49
|
|
|
|
December 31, 2017
|
2,374
|
|
$
|
29.22
|
|
|
The weighted average grant-date fair value of stock options granted during the years ended
2017
,
2016
and
2015
were
$8.52
,
$7.46
and
$6.64
per common share, respectively. The total intrinsic value of options exercised during the years ended
2017
,
2016
and
2015
were
$19.5 million
,
$4.9 million
and
$6.5 million
, respectively.
The tax benefit realized from stock options exercised during
2017
was
$5.3 million
.
The fair value of the stock option awards granted during
2017
,
2016
and
2015
were estimated on the dates of grant using the Black-Scholes option valuation model and the following assumptions:
|
Year Ended December 31,
|
||||||||
|
2017
|
2016
|
2015
|
||||||
|
Risk-free interest rate
|
2.0
|
%
|
2.0
|
%
|
1.9
|
%
|
||
|
Weighted average expected life
|
5.8 years
|
|
5.8 years
|
|
5.8 years
|
|
||
|
Expected volatility
|
25.1
|
%
|
26.0
|
%
|
27.2
|
%
|
||
|
Dividend yield
|
1.9
|
%
|
2.0
|
%
|
2.2
|
%
|
||
The following table summarizes other information about the stock options at
December 31, 2017
:
|
December 31, 2017
|
|||
|
(dollars in thousands, except per share data)
|
|||
|
Outstanding:
|
|||
|
Aggregate intrinsic value
|
$
|
55,789
|
|
|
Weighted average remaining contractual life
|
6.5 years
|
|
|
|
Exercisable:
|
|||
|
Number of options
|
954
|
|
|
|
Weighted average exercise price
|
$
|
22.19
|
|
|
Aggregate intrinsic value
|
$
|
29,134
|
|
|
Weighted average remaining contractual life
|
4.7 years
|
|
|
49
Restricted Stock
A summary of the restricted stock outstanding under the Plan as of
December 31, 2017
and changes during
2017
are as follows:
|
|
Number of Restricted Shares
|
Weighted Average Grant-Date Fair Value
|
||||
|
(in thousands, except per share data)
|
||||||
|
December 31, 2016
|
74
|
|
$
|
32.09
|
|
|
|
Granted
|
—
|
|
$
|
—
|
|
|
|
Vested
|
(17
|
)
|
$
|
31.41
|
|
|
|
Forfeited
|
—
|
|
$
|
—
|
|
|
|
December 31, 2017
|
57
|
|
$
|
32.30
|
|
|
There were
no
grants of restricted stock during
2017
. The weighted average grant-date fair values and total fair values of restricted stock vested during
2017
,
2016
and
2015
are as follows:
|
Year Ended December 31,
|
|||||||||||
|
2017
|
2016
|
2015
|
|||||||||
|
(in thousands, except per share data)
|
|||||||||||
|
Weighted average grant-date fair value of restricted stock granted
|
$
|
—
|
|
$
|
34.14
|
|
$
|
30.30
|
|
||
|
Total fair value of restricted stock vested
|
$
|
690
|
|
$
|
311
|
|
$
|
123
|
|
||
Fair value is determined based on the market price of the shares on the date of grant. The weighted average remaining vesting period for the unvested restricted stock is
2.5 years
.
Restricted Stock Units
For the year ended
December 31, 2017
, the Company granted
0.1 million
restricted stock units with a weighted average grant date fair value of
$40.16
per unit. Fair value is determined based on the market price of the underlying shares on the date of grant. During
2016
and
2015
, there were
no
grants of restricted stock units.
A summary of the outstanding restricted stock units as of
December 31, 2017
and changes during
2017
is as follows:
|
Number of Restricted Units
|
Weighted Average Grant Date Fair Value
|
|||||
|
(in thousands, except per share data)
|
||||||
|
December 31, 2016
|
—
|
|
$
|
—
|
|
|
|
Granted
|
88
|
|
$
|
40.16
|
|
|
|
Vested
|
—
|
|
$
|
—
|
|
|
|
Forfeited
|
—
|
|
$
|
—
|
|
|
|
December 31, 2017
|
88
|
|
$
|
40.16
|
|
|
The weighted average remaining vesting period for the unvested restricted stock units is
4.1 years
.
Employee Stock Purchase Plan
The Company's Employee Stock Purchase Plan ("ESPP") is currently available through 2021 to all eligible employees. All full-time and part-time employees who work an average of
20
hours per week and have completed
two
years of continuous service with the Company are eligible to participate. Annual offerings commence and terminate on the respective year’s first and last calendar day.
Under the ESPP, the Company is authorized to issue up to
4.1 million
shares of Common Stock to its employees. Pursuant to such authorization, there are
2.3 million
shares available for future grant at
December 31, 2017
(after deducting the
2017
funding of the
54,000
shares delivered in
2018
). Under the terms of the ESPP, participants may contribute through payroll deductions up to
$21,250
(
85%
of IRS limitation) of their compensation toward the purchase of the Company’s Common Stock. No employee may purchase Common Stock which exceeds
$25,000
in fair market value (determined on the option date) for each calendar year. The
50
option price per share is equal to the lower of
85%
of the fair market price on the first day of the offering period, or
85%
of the fair market price on the last day of the offering period.
The following table summarizes information about the Company’s ESPP annual offerings for the years ended
December 31, 2017
,
2016
and
2015
:
|
Year Ended December 31,
|
|||||||||||
|
|
2017
|
2016
|
2015
|
||||||||
|
(in thousands, except per share data)
|
|||||||||||
|
Common shares purchased
|
54
|
|
53
|
|
59
|
|
|||||
|
Per common share purchase price
|
$
|
33.29
|
|
$
|
29.64
|
|
$
|
26.29
|
|
||
Deferred Compensation Plan
The Company offers a Supplemental Executive Retirement Plan (“SERP”) for certain key executives and employees. The SERP is not qualified under Section 401 of the Internal Revenue Code. The SERP allows participants to defer up to
25%
of their earned income on a pre-tax basis and as of the last day of each plan year, each participant will be credited with a
25%
match of up to
15%
of their deferral in the form of Company Common Stock based on the then-current market value. SERP participants fully vest in the Company’s matching contribution
three years
from the first day of the initial year of participation. The income deferred and the matching contributions are unsecured and subject to the claims of the Company’s general creditors.
Under the SERP, the Company is authorized to issue up to
1.0 million
shares of Common Stock to its employees. Pursuant to such authorization, there are
0.4 million
shares available for future grant at
December 31, 2017
(after deducting the
2017
funding of
9,000
shares delivered in
2018
). At the time of issuance, such shares were accounted for at cost as treasury stock. At
December 31, 2017
, approximately
0.3 million
of such shares are vested and remain in the respective active participants’ accounts with the trustee.
The following table summarizes information about the SERP for the plan years ended
December 31, 2017
,
2016
and
2015
:
|
Year Ended December 31,
|
|||||||||||
|
|
2017
|
2016
|
2015
|
||||||||
|
(in thousands)
|
|||||||||||
|
SERP expense
(1)
|
$
|
503
|
|
$
|
511
|
|
$
|
538
|
|
||
|
Treasury shares issued to fund SERP expense
(2)
|
9
|
|
13
|
|
15
|
|
|||||
|
SERP trust account balance at December 31
(3)
|
$
|
42,467
|
|
$
|
34,599
|
|
$
|
37,765
|
|
||
|
Unrealized gain (loss) recorded in SERP liability account
|
$
|
4,534
|
|
$
|
1,495
|
|
$
|
(62
|
)
|
||
|
(1)
|
Both the SERP match and the deferrals are included in the selling, general and administrative caption in the Consolidated Statements of Comprehensive Income.
|
|
(2)
|
Shares related to the SERP match for each year are funded at the beginning of the subsequent year.
|
|
(3)
|
SERP trust account investments are recorded at their fair value which is based on quoted market prices. Differences between such amounts in the table above and the deferred compensation funding asset reported on the Consolidated Balance Sheets represent the value of Company Common Stock held in the Plan participants’ trust accounts and reported by the Company as treasury stock in the Consolidated Balance Sheets.
|
Retirement Savings Plan
Since October 1, 1999, the Company has had a retirement savings plan for eligible employees (the “RSP”) under Section 401(k) of the Internal Revenue Code. The RSP allows eligible employees to contribute up to
15%
of their eligible compensation on a pre-tax basis. There is no match by the Company.
51
The Company has paid regular quarterly cash dividends since the second quarter of 2003. During
2017
, the Company paid regular quarterly cash dividends totaling
$55.2 million
as detailed below:
|
Paid During the Quarter Ended
|
|||||||||||||||
|
March 31, 2017
|
June 30, 2017
|
September 30, 2017
|
December 31, 2017
|
||||||||||||
|
(in thousands, except per share amounts)
|
|||||||||||||||
|
Cash dividends paid per common share
|
$
|
0.18625
|
|
$
|
0.18750
|
|
$
|
0.18875
|
|
$
|
0.19000
|
|
|||
|
Total cash dividends paid
|
$
|
13,624
|
|
$
|
13,750
|
|
$
|
13,883
|
|
$
|
13,987
|
|
|||
|
Record date
|
February 17, 2017
|
|
May 19, 2017
|
|
August 18, 2017
|
|
November 17, 2017
|
|
|||||||
|
Payment date
|
March 24, 2017
|
|
June 23, 2017
|
|
September 22, 2017
|
|
December 22, 2017
|
|
|||||||
Additionally, on
January 30, 2018
, the Company’s Board of Directors declared a regular quarterly cash dividend of
$0.19125
per common share, which will be paid on
March 23, 2018
to shareholders of record as of the close of business on
February 16, 2018
.
Cash dividends declared on the Company’s outstanding weighted average number of basic common shares for the years ended
December 31, 2017
,
2016
and
2015
were as follows:
|
Year Ended December 31,
|
|||||||||||
|
|
2017
|
2016
|
2015
|
||||||||
|
Cash dividends declared per common share
|
$
|
0.75750
|
|
$
|
0.73750
|
|
$
|
0.71750
|
|
||
The Company’s Board of Directors review the dividend policy on a quarterly basis. Although there can be no assurance that the Company will continue to pay dividends or the amount of the dividends, the Company expects to continue to pay a regular quarterly cash dividend. In connection with the establishment of the Company’s dividend policy, the Company adopted a Dividend Reinvestment Plan in 2003.
The following table summarizes the provision for income taxes:
|
|
Year Ended December 31,
|
||||||||||
|
|
2017
|
2016
|
2015
|
||||||||
|
(in thousands)
|
|||||||||||
|
Current:
|
|||||||||||
|
Federal
|
$
|
35,673
|
|
$
|
33,032
|
|
$
|
11,917
|
|
||
|
State
|
7,179
|
|
6,958
|
|
2,173
|
|
|||||
|
42,852
|
|
39,990
|
|
14,090
|
|
||||||
|
Deferred:
|
|||||||||||
|
Federal
|
2,924
|
|
2,163
|
|
13,646
|
|
|||||
|
State
|
(1,037
|
)
|
838
|
|
4,004
|
|
|||||
|
1,887
|
|
3,001
|
|
17,650
|
|
||||||
|
Tax provision
|
$
|
44,739
|
|
$
|
42,991
|
|
$
|
31,740
|
|
||
Deferred income taxes are recorded using the asset and liability method. Deferred tax assets and liabilities are determined based on differences between the financial reporting and income tax basis of assets and liabilities.
52
On December 22, 2017, the Tax Cuts and Jobs Act (the “Act”) was signed into law, enacting significant changes to corporate tax rates, as well as business-related exclusions, deductions and credits. The primary impact to the Company was the decrease in the U.S. federal corporate income tax rate from 35% to 21%. Accordingly, during the fourth quarter 2017, the Company recognized the effects of the changes in the tax law and rates on its deferred tax balances. The net result of the remeasurement was an approximately
$4.5 million
decrease to the Company’s net deferred tax assets balance and a corresponding increase to the Company’s provision for income taxes.
Significant components of the Company’s federal and state deferred tax asset and liability balances are as follows:
|
|
Year Ended December 31,
|
||||||
|
|
2017
|
2016
|
|||||
|
(in thousands)
|
|||||||
|
Deferred tax assets:
|
|||||||
|
Allowance for doubtful accounts
|
$
|
3,109
|
|
$
|
2,672
|
|
|
|
Deferred compensation
|
6,601
|
|
8,532
|
|
|||
|
Accrued insurance claims
|
3,665
|
|
5,862
|
|
|||
|
Non-deductible reserves
|
567
|
|
1,257
|
|
|||
|
Amortization of intangibles
|
162
|
|
624
|
|
|||
|
Other
|
662
|
|
858
|
|
|||
|
14,766
|
|
19,805
|
|
||||
|
Deferred tax liabilities:
|
|||||||
|
Expensing of housekeeping supplies
|
(4,678
|
)
|
(6,752
|
)
|
|||
|
Depreciation of property and equipment
|
(1,745
|
)
|
(2,568
|
)
|
|||
|
Other
|
(845
|
)
|
(663
|
)
|
|||
|
(7,268
|
)
|
(9,983
|
)
|
||||
|
Net deferred tax assets
|
$
|
7,498
|
|
$
|
9,822
|
|
|
Realization of the Company’s deferred tax assets is dependent upon future earnings in specific tax jurisdictions, the timing and amount of which are uncertain. Management assesses the Company’s income tax positions and records tax benefits for all years subject to examination based upon an evaluation of the facts, circumstances, and information available at the reporting dates, which include historical operating results and expectations of future earnings. As such, management believes it is more likely than not that the deferred tax assets recorded will be realized to reduce future income taxes and therefore no valuation allowances are necessary.
The table below provides a reconciliation between the tax expense computed by applying the statutory federal income tax rate to income before income taxes and the provision for income taxes:
|
|
Year Ended December 31,
|
||||||||||
|
|
2017
|
2016
|
2015
|
||||||||
|
(in thousands)
|
|||||||||||
|
Income tax expense computed at statutory rate
|
$
|
46,538
|
|
$
|
42,136
|
|
$
|
31,418
|
|
||
|
Increases (decreases) resulting from:
|
|||||||||||
|
State income taxes, net of federal tax benefit
|
3,661
|
|
5,064
|
|
4,015
|
|
|||||
|
Federal jobs credits
|
(4,193
|
)
|
(4,550
|
)
|
(3,900
|
)
|
|||||
|
Tax exempt interest
|
(568
|
)
|
(457
|
)
|
(132
|
)
|
|||||
|
Other, net
|
(699
|
)
|
798
|
|
339
|
|
|||||
|
Income tax expense
|
$
|
44,739
|
|
$
|
42,991
|
|
$
|
31,740
|
|
||
The Company performs an evaluation each period of its tax positions taken and expected to be taken in tax returns. The evaluation is performed on positions relating to tax years that remain subject to examination by major tax jurisdictions, the earliest of which is the tax year ended
December 31, 2012
. Based on the evaluation, the Company concluded that there are no significant uncertain
53
tax positions requiring recognition in the Company’s financial statements. Therefore, the table reporting on the change in the liability for unrecognized tax benefits during the years ended
December 31, 2017
and
2016
is omitted as there is no activity to report in such account for the years ended
December 31, 2017
or
2016
, and there was
no
balance of unrecognized tax benefits at the beginning of
2016
.
The Company may from time to time be assessed interest or penalties by taxing jurisdictions, although any such assessments historically have been minimal and immaterial to its financial results. When the Company has received an assessment for interest and/or penalties, it will be classified in the financial statements as selling, general and administrative expense. In addition, any interest or penalties relating to recognized uncertain tax positions would also be recorded in selling, general and administrative expense.
A director is a member of a law firm which was retained by the Company. During the years ended
December 31, 2017
,
2016
and
2015
, fees paid by the Company to such firm did not exceed
$120,000
in any period. Additionally, such fees did not exceed, in any period,
5%
of such firm’s revenues or the Company’s revenues.
Reportable Operating Segments
The Company manages and evaluates its operations in
two
reportable segments: Housekeeping (housekeeping, laundry, linen and other services) and Dietary (dietary department services). Although both segments serve the same client base and share many operational similarities, they are managed separately due to distinct differences in the type of services provided, as well as the specialized expertise required of the professional management personnel responsible for delivering each segment’s services. Such services are rendered pursuant to discrete service agreements, specific to each reportable segment.
The Company’s accounting policies for the segments are generally the same as described in the Company’s significant accounting policies. Differences between the reportable segments’ operating results and other disclosed data and the information in the Consolidated Financial Statements relate primarily to corporate level transactions and recording of transactions at the reportable segment level using other than generally accepted accounting principles. There are certain inventories and supplies that are primarily expensed when incurred within the operating segments, while they are capitalized in the Consolidated Financial Statements. In addition, most corporate expenses such as corporate salary and benefit costs, certain legal costs, information technology costs, depreciation, amortization of finite-lived intangible assets, share based compensation costs and other corporate-specific costs, are not allocated to the operating segments. There are also allocations for workers’ compensation and general liability expense within the operating segments that differ from the actual expense recorded by the Company under U.S. GAAP. Segment amounts disclosed are prior to elimination entries made in consolidation.
All revenues and net income are earned in the United States.
54
|
Year Ended December 31,
|
||||||||||||
|
2017
|
2016
|
2015
|
||||||||||
|
(in thousands)
|
||||||||||||
|
Revenues
(1)
|
||||||||||||
|
Housekeeping services
|
$
|
979,610
|
|
$
|
957,148
|
|
$
|
909,709
|
|
|||
|
Dietary services
|
886,521
|
|
605,514
|
|
527,140
|
|
||||||
|
Corporate and eliminations
|
—
|
|
—
|
|
—
|
|
||||||
|
Consolidated
|
$
|
1,866,131
|
|
$
|
1,562,662
|
|
$
|
1,436,849
|
|
|||
|
Income before income taxes
|
||||||||||||
|
Housekeeping services
|
$
|
95,505
|
|
$
|
90,756
|
|
$
|
84,471
|
|
|||
|
Dietary services
|
46,008
|
|
34,641
|
|
31,612
|
|
||||||
|
Corporate and eliminations
(2)
|
(8,548
|
)
|
(5,010
|
)
|
(26,319
|
)
|
||||||
|
Consolidated
|
$
|
132,965
|
|
$
|
120,387
|
|
$
|
89,764
|
|
|||
|
Depreciation and amortization
|
||||||||||||
|
Housekeeping services
|
$
|
6,547
|
|
$
|
6,535
|
|
$
|
6,488
|
|
|||
|
Dietary services
|
1,813
|
|
439
|
|
685
|
|
||||||
|
Corporate and eliminations
|
526
|
|
522
|
|
487
|
|
||||||
|
Consolidated
|
$
|
8,886
|
|
$
|
7,496
|
|
$
|
7,660
|
|
|||
|
Total assets
|
||||||||||||
|
Housekeeping services
|
$
|
304,303
|
|
$
|
266,464
|
|
$
|
228,116
|
|
|||
|
Dietary services
|
242,874
|
|
127,187
|
|
104,797
|
|
||||||
|
Corporate and eliminations
(3)
|
128,826
|
|
134,795
|
|
148,036
|
|
||||||
|
Consolidated
|
$
|
676,003
|
|
$
|
528,446
|
|
$
|
480,949
|
|
|||
|
Capital expenditures
|
||||||||||||
|
Housekeeping services
|
$
|
4,287
|
|
$
|
4,612
|
|
$
|
3,586
|
|
|||
|
Dietary services
|
663
|
|
410
|
|
336
|
|
||||||
|
Corporate and eliminations
|
447
|
|
420
|
|
1,076
|
|
||||||
|
Consolidated
|
$
|
5,397
|
|
$
|
5,442
|
|
$
|
4,998
|
|
|||
|
(1)
|
For the year ended
December 31, 2017
, the Company earned revenue from one customer that amounted to more than 10% of total consolidated revenues. Housekeeping services and Dietary services both earned revenue from the customer, the total of which amounted to
$327.5 million
.
|
|
(2)
|
Represents primarily corporate office cost and related overhead, recording of certain inventories and supplies and workers compensation costs at the reportable segment level which use accounting methods that differ from those used at the corporate level, as well as consolidated subsidiaries’ operating expenses that are not allocated to the reportable segments, net of investment and interest income.
|
|
(3)
|
Primarily consists of cash and cash equivalents, marketable securities, deferred income taxes and other current and noncurrent assets.
|
55
Basic and diluted earnings per common share are computed by dividing net income by the weighted-average number of basic and diluted common shares outstanding, respectively. The weighted-average number of diluted common shares includes the impact of dilutive securities, including outstanding stock options and unvested restricted stock and restricted stock units. The table below reconciles the weighted-average basic and diluted common shares outstanding for
2017
,
2016
and
2015
:
|
|
Year Ended December 31, 2017
|
|||||||
|
2017
|
2016
|
2015
|
||||||
|
(in thousands)
|
||||||||
|
Weighted average number of common shares outstanding - basic
|
73,355
|
|
72,754
|
|
71,826
|
|
||
|
Effect of dilutive securities
(1)
|
993
|
|
720
|
|
686
|
|
||
|
Weighted average number of common shares outstanding - diluted
|
74,348
|
|
73,474
|
|
72,512
|
|
||
(1)
Certain outstanding stock option awards are anti-dilutive and were therefore excluded from the calculation of the weighted average number of diluted common shares outstanding. For the year ended
December 31, 2017
, options to purchase less than a thousand shares, having a weighted average exercise price of
$39.38
, were excluded from the computation. For the years ended December
2016
and
2015
, the computation excluded options to purchase
0.5 million
and
0.9 million
shares, having weighted average exercise prices of
$34.14
and
$29.34
, respectively.
Line of Credit
As of
December 31, 2017
, the Company had a
$300 million
bank line of credit on which to draw for general corporate purposes. Amounts drawn under the line of credit are payable upon demand and generally bear interest at LIBOR plus
75 basis points
(or if LIBOR becomes unavailable, the higher of the Prime Rate or the Overnight Bank Funding Rate plus
50 basis points
). At
December 31, 2017
, there were
$35.4 million
in borrowings under the line of credit. The line of credit requires the Company to satisfy
one
financial covenant, with which the Company is in compliance as of
December 31, 2017
and expects to remain in compliance. The line of credit expires on
December 18, 2018
.
At
December 31, 2017
, the Company also had outstanding
$77.6 million
in irrevocable standby letters of credit, which relate to payment obligations under the Company's insurance programs. The letters of credit expire on January 2, 2019. In connection with the issuance of the letters of credit, the amount available under the line of credit was
further reduced by
$77.6 million
to
$187.0 million
at
December 31, 2017
. The letters of credit were
decreased to
$65.9 million
on
January 2, 2018
.
Tax Jurisdictions and Matters
The Company provides services throughout the continental United States and is subject to numerous state and local taxing jurisdictions. In the ordinary course of business, a jurisdiction may contest the Company’s reporting positions with respect to the application of its tax code to the Company’s services, which could result in additional tax liabilities.
The Company has tax matters with various taxing authorities. Because of the uncertainties related to both the probable outcomes and amount of probable assessments due, the Company is unable to make a reasonable estimate of a liability. The Company does not expect the resolution of any of these matters, taken individually or in the aggregate, to have a material adverse effect on the consolidated financial position or results of operations based on the Company’s best estimate of the outcomes of such matters.
Legal Proceedings
The Company is subject to various claims and legal actions in the ordinary course of business. Some of these matters include payroll and employee-related matters and examinations by governmental agencies. As the Company becomes aware of such claims and legal actions, the Company records accruals for any exposures that are probable and estimable. If adverse outcomes of such claims and legal actions are reasonably possible, Management assesses materiality and provides financial disclosure, as appropriate. The Company believes it is not a party to, nor are any of its properties the subject of, any pending legal proceeding or governmental examination that would have a material adverse effect on the Company’s consolidated financial condition or liquidity.
56
Government Regulations
The Company’s clients are concentrated in the healthcare industry and are primarily providers of long-term care. The revenues of many of the Company’s clients are highly reliant on Medicare, Medicaid and third party payors’ reimbursement funding rates. New legislation or additional changes in existing regulations could directly impact the governmental reimbursement programs in which the clients participate. The full effect of any such programs would not be realized until these laws are fully implemented and government agencies issue applicable regulations or guidance.
The Company currently has a Paid Loss Retrospective Insurance Plan for general liability and workers’ compensation insurance, which comprise approximately
30.7%
of the Company’s liabilities at
December 31, 2017
. Under the Company’s insurance plans for general liability and workers’ compensation, predetermined loss limits are arranged with the Company’s insurance company to limit both per occurrence cash outlay and annual insurance plan cost. The Company’s accounting for this plan utilizes current valuations from a third party actuary, which include assumptions based on data such as historical claims, pay-out experience, demographic factors, industry trends, severity factors, and other actuarial calculations. In the event that the Company’s claims experience and/or industry trends result in an unfavorable change in the assumptions or outcomes, it would have an adverse effect on the Company’s results of operations and financial condition.
For general liability and workers’ compensation, the Company records both a reserve for the estimated future cost of claims and related expenses that have been reported but not settled, as well as an estimate of claims incurred but not reported. Such reserves for claims incurred but not reported are developed by a third party actuary through review of the Company’s historical data and open claims.
The Company evaluated all subsequent events through the date of this Annual Report on Form 10-K. There were no events or transactions occurring during this subsequent reporting period which require recognition or additional disclosure in these financial statements.
The following tables summarize the unaudited quarterly financial data for the last two fiscal years.
|
|
First Quarter
|
Second Quarter
|
Third Quarter
|
Fourth Quarter
|
|||||||||||
|
(in thousands, except per share amounts)
|
|||||||||||||||
|
2017
|
|||||||||||||||
|
Revenues
|
$
|
404,490
|
|
$
|
470,876
|
|
$
|
491,355
|
|
$
|
499,410
|
|
|||
|
Operating costs and expenses
|
$
|
373,780
|
|
$
|
439,313
|
|
$
|
459,864
|
|
$
|
466,285
|
|
|||
|
Income before income taxes
|
$
|
32,279
|
|
$
|
33,078
|
|
$
|
32,930
|
|
$
|
34,678
|
|
|||
|
Net income
|
$
|
22,017
|
|
$
|
22,551
|
|
$
|
23,472
|
|
$
|
20,186
|
|
|||
|
Basic earnings per common share
|
$
|
0.30
|
|
$
|
0.31
|
|
$
|
0.32
|
|
$
|
0.27
|
|
|||
|
Diluted earnings per common share
|
$
|
0.30
|
|
$
|
0.30
|
|
$
|
0.31
|
|
$
|
0.27
|
|
|||
|
Cash dividends declared per common share
|
$
|
0.18750
|
|
$
|
0.18875
|
|
$
|
0.19000
|
|
$
|
0.19125
|
|
|||
|
2016
|
|||||||||||||||
|
Revenues
|
$
|
384,807
|
|
$
|
386,556
|
|
$
|
392,734
|
|
$
|
398,565
|
|
|||
|
Operating costs and expenses
|
$
|
355,390
|
|
$
|
357,875
|
|
$
|
363,522
|
|
$
|
368,122
|
|
|||
|
Income before income taxes
|
$
|
29,604
|
|
$
|
29,683
|
|
$
|
30,571
|
|
$
|
30,529
|
|
|||
|
Net income
|
$
|
18,626
|
|
$
|
18,760
|
|
$
|
19,711
|
|
$
|
20,299
|
|
|||
|
Basic earnings per common share
|
$
|
0.26
|
|
$
|
0.26
|
|
$
|
0.27
|
|
$
|
0.28
|
|
|||
|
Diluted earnings per common share
|
$
|
0.26
|
|
$
|
0.26
|
|
$
|
0.27
|
|
$
|
0.28
|
|
|||
|
Cash dividends declared per common share
|
$
|
0.18250
|
|
$
|
0.18375
|
|
$
|
0.18500
|
|
$
|
0.18625
|
|
|||
57
Item 9.
Changes in and Disagreements with
Accountants on Accounting and Financial
Disclosure.
None.
Evaluation of Disclosure Controls and Procedures
In accordance with Securities Exchange Act Rules 13a-15 and 15a-15, the Company carried out an evaluation, under the supervision and with the participation of management, including the Company’s Chief Executive Officer and Chief Financial Officer, of the effectiveness of the Company’s disclosure controls and procedures as of the end of the period covered by this report. Based on that evaluation, the Company’s Chief Executive Officer and Chief Financial Officer concluded that the Company’s disclosure controls and procedures were effective as of
December 31, 2017
.
Design and Evaluation of Internal Control Over Financial Reporting
Pursuant to Section 404 of the Sarbanes-Oxley Act of 2002, the Company included a report of management’s assessment of the design and effectiveness of the Company’s internal controls over financial reporting as part of this Annual Report on Form 10-K for the fiscal year ended
December 31, 2017
. Grant Thornton, LLP, the Company’s independent registered public accounting firm, also audited the Company’s internal control over financial reporting. Management’s report and the independent registered public accounting firm’s audit report are included in this Annual Report on Form 10-K within Part II, Item 8 under the captions entitled “Management’s Report on Internal Control Over Financial Reporting” and “Report of Independent Registered Public Accounting Firm”.
Changes in Internal Control over Financial Reporting
There were no changes in the Company’s internal control over financial reporting that occurred during the period covered by this Annual Report on Form 10-K that have materially affected, or are reasonably likely to materially affect, the Company’s internal control over financial reporting.
Item 9B.
Other Information.
Not applicable.
58
Item 10.
Directors, Executive Officers and
Corporate Governance.
The information regarding directors and executive officers is incorporated herein by reference to the Company’s definitive proxy statement to be mailed to its shareholders in connection with its
2018
Annual Meeting of Shareholders and to be filed within 120 days of the close of the year ended
December 31, 2017
.
Code of Ethics
The Company has adopted a code of ethics that applies to all employees, including executive officers and directors. The code of ethics is publicly available on the Corporate Governance page of the Company’s website at
www.hcsg.com
. If the Company makes any amendments or grant any waivers, including implicit waivers, from a provision of the Company code of ethics that applies to the principal executive officer, principal financial officer, principal accounting officer or any person performing similar functions, the Company will disclose the nature of the amendment or waiver, its effective date and to whom it applies on the Company’s website set forth above or in a report on Form 8-K filed with the Securities and Exchange Commission.
Item 11.
Executive Compensation.
The information regarding executive compensation is incorporated herein by reference to the Company’s definitive proxy statement to be mailed to shareholders in connection with its
2018
Annual Meeting of Shareholders and to be filed within 120 days of the close of the fiscal year ended
December 31, 2017
.
Item 12.
Security Ownership of Certain
Beneficial Owners and Management and Related
Stockholder Matters.
The information regarding security ownership of certain beneficial owners and management and related stockholder matters is incorporated herein by reference to the Company’s definitive proxy statement to be mailed to shareholders in connection with its
2018
Annual Meeting of Shareholders and to be filed within 120 days of the close of the fiscal year ending
December 31, 2017
.
Item 13.
Certain Relationships and Related
Transactions, and Director Independence.
The information regarding certain relationships and related transactions, and director independence is incorporated herein by reference to the Company’s definitive proxy statement mailed to shareholders in connection with its
2018
Annual Meeting of Shareholders and to be filed within 120 days of the close of the fiscal year ended
December 31, 2017
.
Item 14.
Principal Accountant Fees and
Services.
The information regarding principal accountant fees and services is incorporated herein by reference to the Company’s definitive proxy statement mailed to shareholders in connection with its
2018
Annual Meeting of Shareholders and to be filed within 120 days of the close of the fiscal year ended
December 31, 2017
.
59
Item 15.
Exhibits and Financial Statement
Schedules.
|
(a)
|
The following financial statements, schedules and exhibits are filed as part of this report:
|
|
1.
|
Index to Consolidated Financial Statements
— The Financial Statements required by this item are listed on the Index to Financial Statements in Part II, Item 8 of this report.
|
|
2.
|
Index to Financial Statement Schedules
—
|
|
a.
|
Schedule II—Valuation and Qualifying Accounts and Reserves; and
|
|
b.
|
Other financial statement schedules are not included because they are not required or the information is otherwise shown in the financial statements or notes thereto.
|
|
3.
|
Index to Exhibits
—
|
|
a.
|
The exhibits listed below are filed as part of, or are incorporated by reference into, this report.
|
|
(b)
|
See Item 15(a)(3) above.
|
|
(c)
|
See Item 15(a)(2) above.
|
Item 16.
Form 10-K Summary.
None.
60
Healthcare Services Group, Inc.
Schedule II — Valuation
and Qualifying Accounts and Reserves
|
Additions
|
|||||||||||||||||||
|
Description
|
Beginning Balance
|
Charged to Costs and Expenses
|
Charged to Other Accounts
|
Deductions
|
Ending Balance
|
||||||||||||||
|
(in thousands)
|
|||||||||||||||||||
|
2017
|
|||||||||||||||||||
|
Allowance for Doubtful Accounts
|
$
|
6,911
|
|
$
|
6,250
|
|
$
|
—
|
|
$
|
1,176
|
|
$
|
11,985
|
|
||||
|
2016
|
|||||||||||||||||||
|
Allowance for Doubtful Accounts
|
$
|
4,608
|
|
$
|
4,629
|
|
$
|
—
|
|
$
|
2,326
|
|
$
|
6,911
|
|
||||
|
2015
|
|||||||||||||||||||
|
Allowance for Doubtful Accounts
|
$
|
6,136
|
|
$
|
4,335
|
|
$
|
—
|
|
$
|
5,863
|
|
$
|
4,608
|
|
||||
61
Exhibit Index
The following Exhibits are filed as part of this Report (references are to Reg. S-K Exhibit Numbers):
|
Incorporated by Reference
|
||||||||||||
|
Exhibit Number
|
Description
|
Form
|
File No.
|
Date of Filing
|
Exhibit Number
|
Filed Herewith
|
||||||
|
3.1
|
10-K
|
0-12015
|
3/21/2001
|
3.2
|
—
|
|||||||
|
3.2
|
8-K
|
0-12015
|
5/24/2007
|
3.1
|
—
|
|||||||
|
3.3
|
10-K
|
0-12015
|
2/19/2015
|
3.3
|
—
|
|||||||
|
4.1 (P)
|
Specimen Certificate of the Common Stock, $.01 par value, of the Registrant
|
S-18
|
2-87625-W
|
—
|
4.1
|
—
|
||||||
|
4.2†
|
S-8
|
333-92835
|
12/15/1999
|
4(a)
|
—
|
|||||||
|
4.3†
|
10-Q
|
0-12015
|
10/28/2016
|
4.1
|
—
|
|||||||
|
4.5†
|
10-Q
|
0-12015
|
10/22/2012
|
10.1
|
—
|
|||||||
|
10.1†
|
10-Q
|
0-12015
|
7/27/2012
|
10.1
|
—
|
|||||||
|
10.1
|
10-Q
|
0-12015
|
7/28/2017
|
10.1
|
||||||||
|
10.2
|
S-3D
|
333-108182
|
8/22/2003
|
99.0
|
—
|
|||||||
|
21
|
—
|
—
|
—
|
—
|
X
|
|||||||
|
23
|
—
|
—
|
—
|
—
|
X
|
|||||||
|
31.1
|
—
|
—
|
—
|
—
|
X
|
|||||||
|
31.2
|
—
|
—
|
—
|
—
|
X
|
|||||||
|
32.1
|
—
|
—
|
—
|
—
|
X
|
|||||||
|
32.2
|
—
|
—
|
—
|
—
|
X
|
|||||||
|
101
|
The following financial information from the Company's Form 10-K for the fiscal year ended December 31, 2015 formatted in eXtensible Business Reporting Language (XBRL): (i) Consolidated Balance Sheets, (ii) Consolidated Statements of Comprehensive Income, (iii) Consolidated Statements of Cash Flows, (iv) Consolidated Statements of Stockholders' Equity, and (v) Notes to Consolidated Financial Statements
|
—
|
—
|
—
|
—
|
X
|
||||||
|
†
|
Indicates a management plan or compensatory plan or arrangement.
|
|
|
(P)
|
Prior to digital copy
|
|
62
Signatures
Pursuant to the requirements of Section 13 or 15(d) of the Securities Exchange Act of 1934, the Registrant has duly caused this report to be signed on its behalf by the undersigned, thereunto duly authorized.
|
Dated: February 23, 2018
|
HEALTHCARE SERVICES GROUP, INC.
|
||
|
(Registrant)
|
|||
|
By:
|
/s/ Theodore Wahl
|
||
|
Theodore Wahl
|
|||
|
President and Chief Executive Officer
|
|||
Pursuant to the requirements of the Securities Exchange Act of 1934, this report has been signed below by the following persons and in the capacities and on the date indicated:
|
Signature
|
Title
|
Date
|
||
|
/s/ Theodore Wahl
|
Director and President & Chief Executive Officer
|
February 23, 2018
|
||
|
Theodore Wahl
|
(Principal Executive Officer)
|
|||
|
/s/ John C. Shea
|
Chief Financial Officer
|
February 23, 2018
|
||
|
John C. Shea
|
(Principal Financial and Accounting Officer)
|
|||
|
/s/ Jude Visconto
|
Chairman of the Board
|
February 23, 2018
|
||
|
Jude Visconto
|
|
|||
|
/s/ Michael E. McBryan
|
Director and Executive Vice President & Chief Revenue Officer
|
February 23, 2018
|
||
|
Michael E. McBryan
|
||||
|
/s/ John M. Briggs
|
Director
|
February 23, 2018
|
||
|
John M. Briggs
|
||||
|
/s/ Robert L. Frome
|
Director
|
February 23, 2018
|
||
|
Robert L. Frome
|
||||
|
/s/ Diane S. Casey
|
Director
|
February 23, 2018
|
||
|
Diane S. Casey
|
||||
|
/s/ Robert J. Moss
|
Director
|
February 23, 2018
|
||
|
Robert J. Moss
|
||||
|
/s/ Dino D. Ottaviano
|
Director
|
February 23, 2018
|
||
|
Dino D. Ottaviano
|
||||
|
/s/ John J. McFadden
|
Director
|
February 23, 2018
|
||
|
John J. McFadden
|
||||
63
TABLE OF CONTENTS
Part IItem I. BusinessItem 1A. Risk FactorsItem 1B. Unresolved Staff CommentsItem 2. PropertiesItem 3. Legal ProceedingsItem 4. Mine Safety DisclosuresPart IIItem 5. Market For Registrant S Common Equity, Related Stockholder Matters and Issuer Purchases Of Equity SecuritiesItem 6. Selected Financial DataItem 7. Management S Discussion and Analysis Of Financial Condition and Results Of OperationItem 7A. Quantitative and Qualitative Disclosures About Market RiskItem 8. Financial Statements and Supplementary DataNote 1 Description Of Business and Significant Accounting PoliciesNote 2 Changes in Accumulated Other Comprehensive Income By ComponentNote 3 Property and EquipmentNote 4 Goodwill and Other Intangible AssetsNote 5 Fair Value MeasurementsNote 6 Accounts and Notes ReceivableNote 7 Allowance For Doubtful AccountsNote 8 Lease CommitmentsNote 9 Share-based CompensationNote 10 Other Employee Benefit PlansNote 11 DividendsNote 12 Income TaxesNote 13 Related Party TransactionsNote 14 Segment InformationNote 15 Earnings Per Common ShareNote 16 Contractual Obligations and Other ContingenciesNote 17 Accrued Insurance ClaimsNote 18 Subsequent EventsNote 19 Selected Quarterly Financial Data (unaudited)Item 9. Changes in and Disagreements with Accountants on Accounting and Financial DisclosureItem 9A. Controls and ProceduresItem 9B. Other InformationPart IIIItem 10. Directors, Executive Officers and Corporate GovernanceItem 11. Executive CompensationItem 12. Security Ownership Of Certain Beneficial Owners and Management and Related Stockholder MattersItem 13. Certain Relationships and Related Transactions, and Director IndependenceItem 14. Principal Accountant Fees and ServicesPart IVItem 15. Exhibits and Financial Statement SchedulesItem 16. Form 10-k Summary