HOME DEPOT, INC.
10-Ks and 10-Qs
|
|
|
|
|
|
|
|
|
|
|
|
|
|
|
|
|
|
|
|
|
|
|
|
|
|
|
|
|
|
|
|
|
|
|
|
|
|
|
|
|
|
|
|
|
|
|
|
|
|
|
|
|
|
|
|
|
|
|
UNITED STATES
SECURITIES AND EXCHANGE COMMISSION
WASHINGTON, D.C. 20549
________________________________________
FORM 10-K
|
ý
|
ANNUAL REPORT PURSUANT TO SECTION 13 OR 15(d) OF THE SECURITIES EXCHANGE ACT OF 1934
|
For the fiscal year ended
January 29, 2012
OR
|
¨
|
TRANSITION REPORT PURSUANT TO SECTION 13 OR 15(d) OF THE SECURITIES EXCHANGE ACT OF 1934
|
Commission File Number 1-8207
THE HOME DEPOT, INC.
(Exact Name of Registrant as Specified in its Charter)
DELAWARE
(State or other jurisdiction of incorporation or organization)
95-3261426
(I.R.S. Employer Identification No.)
2455 PACES FERRY ROAD, N.W., ATLANTA, GEORGIA 30339
(Address of principal executive offices) (Zip Code)
Registrant’s Telephone Number, Including Area Code:
(770) 433-8211
SECURITIES REGISTERED PURSUANT TO SECTION 12(b) OF THE ACT:
|
TITLE OF EACH CLASS
|
NAME OF EACH EXCHANGE
ON WHICH REGISTERED
|
|
Common Stock, $0.05 Par Value Per Share
|
New York Stock Exchange
|
SECURITIES REGISTERED PURSUANT TO SECTION 12(g) OF THE ACT:
None
Indicate by check mark if the Registrant is a well-known seasoned issuer, as defined in Rule 405 of the Securities Act. Yes
ý
No
¨
Indicate by check mark if the Registrant is not required to file reports pursuant to Section 13 or Section 15(d) of the Act. Yes
¨
No
ý
Indicate by check mark whether the Registrant (1) has filed all reports required to be filed by Section 13 or 15(d) of the Securities Exchange Act of 1934 during the preceding 12 months (or for such shorter period that the Registrant was required to file such reports), and (2) has been subject to such filing requirements for the past 90 days. Yes
ý
No
¨
Indicate by check mark whether the Registrant has submitted electronically and posted on its corporate Web site, if any, every Interactive Data File required to be submitted and posted pursuant to Rule 405 of Regulation S-T during the preceding 12 months (or for such shorter period that the Registrant was required to submit and post such files). Yes
ý
No
¨
Indicate by check mark if disclosure of delinquent filers pursuant to Item 405 of Regulation S-K is not contained herein, and will not be contained, to the best of Registrant’s knowledge, in definitive proxy or information statements incorporated by reference in Part III of this Form 10-K or any amendment to this Form 10-K.
¨
Indicate by check mark whether the Registrant is a large accelerated filer, an accelerated filer, a non-accelerated filer, or a smaller reporting company. See the definitions of "large accelerated filer," "accelerated filer" and "smaller reporting company" in Rule 12b-2 of the Exchange Act. (Check one):
|
Large accelerated filer
ý
|
Accelerated filer
o
|
Non-accelerated filer
o
(Do not check if a smaller reporting company)
|
Smaller reporting company
o
|
Indicate by check mark whether the Registrant is a shell company (as defined in Rule 12b-2 of the Exchange Act). Yes
¨
No
ý
The aggregate market value of the common stock of the Registrant held by non-affiliates of the Registrant on
July 31, 2011
was $
53.7 billion
.
The number of shares outstanding of the Registrant’s common stock as of
March 14, 2012
was
1,523,263,533
shares.
DOCUMENTS INCORPORATED BY REFERENCE
Portions of the Registrant’s proxy statement for the
2012
Annual Meeting of Shareholders are incorporated by reference in Part III of this Form 10-K to the extent described herein.
THE HOME DEPOT, INC.
FISCAL YEAR
2011
FORM 10-K
TABLE OF CONTENTS
|
Item 1.
|
||
|
Item 1A.
|
||
|
Item 1B.
|
||
|
Item 2.
|
||
|
Item 3.
|
||
|
Item 4.
|
||
|
Item 5.
|
||
|
Item 6.
|
||
|
Item 7.
|
||
|
Item 7A.
|
||
|
Item 8.
|
||
|
Item 9.
|
||
|
Item 9A.
|
||
|
Item 9B.
|
||
|
Item 10.
|
||
|
Item 11.
|
||
|
Item 12.
|
||
|
Item 13.
|
||
|
Item 14.
|
||
|
Item 15.
|
||
CAUTIONARY STATEMENT PURSUANT TO THE
PRIVATE SECURITIES LITIGATION REFORM ACT OF 1995
Certain statements regarding our future performance constitute "forward-looking statements" as defined in the Private Securities Litigation Reform Act of 1995. Forward-looking statements may relate to, among other things, the demand for our products and services, net sales growth, comparable store sales, state of the economy, state of the residential construction, housing and home improvement markets, state of the credit markets, including mortgages, home equity loans and consumer credit, inventory and in-stock positions, commodity price inflation and deflation, implementation of store and supply chain initiatives, continuation of reinvestment plans, net earnings performance, earnings per share, stock-based compensation expense, capital allocation and expenditures, liquidity, the effect of adopting certain accounting standards, return on invested capital, management of our purchasing or customer credit policies, the effect of accounting charges, the ability to issue debt on terms and at rates acceptable to us, store openings and closures, expense leverage and financial outlook.
Forward-looking statements are based on currently available information and our current assumptions, expectations and projections about future events. You should not rely on our forward-looking statements. These statements are not guarantees of future performance and are subject to future events, risks and uncertainties – many of which are beyond our control or are currently unknown to us – as well as potentially inaccurate assumptions that could cause actual results to differ materially from our expectations and projections. These risks and uncertainties include, but are not limited to, those described in Item 1A, "Risk Factors," in this report.
Forward-looking statements speak only as of the date they are made, and we do not undertake to update these statements other than as required by law. You are advised, however, to review any further disclosures we make on related subjects in our periodic filings with the Securities and Exchange Commission ("SEC").
Introduction
The Home Depot, Inc. is the world’s largest home improvement retailer based on Net Sales for the fiscal year ended
January 29, 2012
("fiscal
2011
"). The Home Depot stores sell a wide assortment of building materials, home improvement and lawn and garden products and provide a number of services. The Home Depot stores average approximately
104,000
square feet of enclosed space, with approximately 24,000 additional square feet of outside garden area. As of the end of fiscal
2011
, we had
2,252
The Home Depot stores located throughout the United States including the Commonwealth of Puerto Rico and the territories of the U.S. Virgin Islands and Guam, Canada, China and Mexico. When we refer to "The Home Depot," the "Company," "we," "us" or "our" in this report, we are referring to The Home Depot, Inc. and its consolidated subsidiaries.
The Home Depot, Inc. is a Delaware corporation that was incorporated in 1978. Our Store Support Center (corporate office) is located at 2455 Paces Ferry Road, N.W., Atlanta, Georgia 30339. Our telephone number is (770) 433-8211.
We maintain an Internet website at www.homedepot.com. We make available on our website, free of charge, our Annual Reports to shareholders, Annual Reports on Form 10-K, Quarterly Reports on Form 10-Q, Current Reports on Form 8-K, Proxy Statements and Forms 3, 4 and 5, and amendments to those reports, as soon as reasonably practicable after filing such documents with, or furnishing such documents to, the SEC.
We include our website addresses throughout this filing for reference only. The information contained on our websites is not incorporated by reference into this report.
For information on key financial highlights, including historical revenues, profits and total assets, see the "Five-Year Summary of Financial and Operating Results" on page F-1 of this report and Item 7, "Management's Discussion and Analysis of Financial Condition and Results of Operations."
1
Our Business
Operating Strategy
In fiscal
2011
, we continued to execute on our strategy focused on the following key initiatives:
|
•
|
Customer Service
. Our customer service initiative is anchored on the principles of putting customers first, taking care of our associates and simplifying the business. To enhance customer service, we introduced new information technology and optimized certain elements of our supply chain to eliminate tasks and give associates more time with customers. We also sought to maintain competitive wages and incentive opportunities to attract, retain and motivate our associates.
|
|
•
|
Product Authority
. Our product authority initiative is facilitated by our merchandising transformation and portfolio strategy, focused on delivering product innovation, assortment and value. In fiscal
2011
, we introduced a wide range of new products to our customers, while remaining focused on offering every day values in our stores.
|
|
•
|
Productivity and Efficiency
. Our productivity and efficiency initiative is advanced through building best-in-class competitive advantages in information technology and supply chain, as well as building shareholder value through higher returns on invested capital and total value returned to shareholders. By the start of fiscal
2011
, we had completed our Rapid Deployment Center ("RDC") rollout, and our focus turned to operating and optimizing our supply chain network. We continued our focus on disciplined capital allocation, expense control and increasing shareholder returns, both through share repurchases and increased dividend payments.
|
|
•
|
Interconnected Retail
. As customers increasingly expect to be able to buy how, when and where they want, we believe that providing a seamless shopping experience across multiple channels will be a key enabler for future success. The interconnected retail initiative is woven throughout our business and connects our other three key initiatives. In fiscal
2011
, we focused in particular on enhancements to our online presence and other customer-facing technology, leveraging multiple channels to expand product assortment and simultaneously simplifying the process of locating and ordering products.
|
Customer Service
Our Customers
.
The Home Depot stores serve three primary customer groups, and we have different customer service approaches to meet their particular needs:
|
•
|
Do-It-Yourself ("D-I-Y") Customers.
These customers are typically home owners who purchase products and complete their own projects and installations. Our associates assist these customers with specific product and installation questions both in our stores and through online resources and other media designed to provide product and project knowledge.
|
|
•
|
Do-It-For-Me ("D-I-F-M") Customers.
These customers are typically home owners who purchase materials themselves and hire third parties to complete the project or installation. Our stores offer a variety of installation services targeted at D-I-F-M customers who select and purchase products and installation of those products from us in the store. Our installation programs include products such as carpeting, flooring, cabinets, countertops and water heaters. In addition, we provide professional installation of a number of products sold through our in-home sales programs, such as roofing, siding, windows, furnaces and central air systems.
|
|
•
|
Professional Customers
. These customers are primarily professional remodelers, general contractors, repairmen, small business owners and tradesmen. We offer a variety of special programs to these customers, including delivery and will-call services, dedicated staff and expanded credit programs. We recognize the unique service needs of the professional customer and use our expertise to facilitate their buying experience.
|
In fiscal
2011
, we introduced new information technology to serve our customers more effectively and enhance the overall shopping environment. To improve our labor efficiency, we completed the roll out of our new associate forecast and scheduling system and a centralized returns system in fiscal
2011
. These systems allow us to take tasks out of the stores and allocate more associate hours to assisting customers and to better align our labor hours with customer traffic patterns. As of the end of fiscal
2011
, approximately 53% of our store labor hours were dedicated to customer-facing activity, with a goal of reaching 60% by the end of fiscal 2013. During fiscal
2011
, we also implemented enhancements to our website to improve our customers' experience when shopping online. These include Buy Online, Pick-up In Store ("BOPIS"), which allows our customers to choose how they would like to receive merchandise ordered online, and "SuperSku," which provides greater flexibility in how items are displayed online and minimizes the number of clicks necessary to find a product. In February 2012, we rolled out a significant upgrade of our website, which enhances the layout, visual appearance and responsiveness of the site, as well as further reducing the number of clicks necessary to navigate our pages.
2
We help our professional, D-I-Y and D-I-F-M customers finance their projects by offering private label credit products in our stores through third-party credit providers. In fiscal
2011
, approximately 2.4 million new The Home Depot private label credit accounts were opened, and at fiscal year end the total number of The Home Depot active account holders was approximately 10 million. Private label credit card sales accounted for approximately 22% of sales in fiscal
2011
. In addition, to provide alternate payment options to our customers, in fiscal
2011
we launched a pilot program for our in-store customers to use PayPal
®
and plan to roll it out more broadly in the fiscal year ending February 3, 2013 ("fiscal
2012
").
Our Associates.
Employee relations matter to us, and our associates are key to our customer service initiative. We empower our associates to deliver excellent customer service through our Customers FIRST training program. At the end of fiscal
2011
, we employed approximately
331,000
associates, of whom approximately 20,000 were salaried, with the remainder compensated on an hourly or temporary basis. To attract and retain qualified personnel, we seek to maintain competitive salary and wage levels in each market we serve. We measure associate satisfaction regularly and maintain multiple means of ensuring effective communications with our associates. We believe that our employee relations are very good.
Product Authority
Our Products.
Our product portfolio strategy is aimed at delivering innovation, assortment and value. A typical Home Depot store stocks approximately
30,000
to
40,000
products during the year, including both national brand name and proprietary items. We also offer over 300,000 products through our website, homedepot.com. To enhance our merchandising capabilities, we made enhancements to our information technology tools in fiscal
2011
to give our merchants and vendors greater visibility into category and item performance. In addition, as part of a multi-phased project to improve our special order performance and make the special order process both simpler and more accurate for our customers and associates, we digitized our vendor catalogs in fiscal
2011
.
In fiscal
2011
, we continued to introduce a number of innovative and distinctive products to our customers at attractive values. Examples of these new products include lithium battery technology for power tools, Ryobi
®
lithium ion cordless outdoor tools, Glidden
®
DUO™
paint + primer, Toro
®
gas trimmers and organic lawn care products from Vigoro
®
.
To complement and enhance our product selection, we continued to form strategic alliances and exclusive relationships with selected suppliers to market products under a variety of well-recognized brand names. During fiscal
2011
, we offered a number of proprietary and exclusive brands across a wide range of departments, such as Defiant
®
door locks, Everbilt
®
hardware fasteners, Husky
®
paint tools and hand tools, Hampton Bay
®
lighting, Vigoro
®
lawn care products, RIDGID
®
and Ryobi
®
power tools and Glacier Bay
®
bath fixtures. We also continued our partnership with Martha Stewart Living Omnimedia to offer the exclusive Martha Stewart Living brand in select categories including outdoor living, paint, cabinetry, flooring, and shelving and storage. We will continue to assess strategic alliances and relationships with suppliers and opportunities to expand the range of products available under brand names that are exclusive to The Home Depot.
From our Store Support Center, we maintain a global sourcing program to obtain high-quality products directly from manufacturers around the world. Our merchant team identifies and purchases innovative products directly for our stores. Additionally, we have three sourcing offices located in the Chinese cities of Shanghai, Shenzhen and Dalian, and offices in Gurgaon, India; Rome, Italy; Monterrey, Mexico and Toronto, Canada.
Quality Assurance
. We have both quality assurance and engineering resources that are dedicated to overseeing the quality of all of our products, whether they are directly imported, locally or globally sourced or proprietary branded products. Through these programs, we have established criteria for supplier and product performance that are designed to ensure that our products comply with applicable international, federal, state and local safety, quality and performance standards. We also have a Supplier Social and Environmental Responsibility Program designed to ensure that our suppliers adhere to the highest standards of social and environmental responsibility.
Energy Saving Products and Programs.
As the world's largest home improvement retailer, we are in a unique position to enable our customers to achieve energy savings through our products and services and to educate our customers about "green" products and practices. Through our Eco Options
®
Program introduced in fiscal 2007, we have created product categories that allow consumers to easily identify environmentally preferred product selections in our stores. Our Eco Options
®
Program has certified over 4,000 products that meet specifications for energy efficiency, water conservation, healthy home, clean air and sustainable forestry. Through this program, we sell products such as ENERGY STAR
®
refrigerators, dishwashers, compact fluorescent light ("CFL") bulbs, EcoSmart
®
LED light bulbs, programmable thermostats, water heaters and other products, enabling our customers to save on their utility bills. LED light bulbs, which use approximately 85% less energy and last up to 20 years longer than traditional incandescent bulbs, were one of our fastest growing categories for the year. In fiscal 2011, the sales of ENERGY STAR
®
qualified products helped consumers save over
3
$700 million in annual utility costs, which equate to an over six billion kilowatt reduction and an almost five million ton decrease in greenhouse gas emissions. We also help our customers save water through sales of WaterSense
®
-labeled bath faucets, showerheads, aerators and toilets. Through the sales of these products, we have helped consumers save over 30 billion gallons of water and over $200 million in water bills.
Our Eco Options
®
page on our website offers consumer education on environmental impacts of various products and identifies easy green D-I-Y projects. This online experience, coupled with our D-I-Y in-store how-to clinics on green projects and our continual enhancement of our Eco Options
®
product categories, helps us to meet a growing customer demand for environmentally responsible and cost-saving products and projects. In 2011, we also partnered with the U.S. Green Building Council to establish a list of products sold at our stores that meet "LEED for Homes" product specifications. This program helps our customers easily identify products with potential Leadership in Energy and Environmental Design ("LEED") point values and is designed to simplify the complexities of building green. At the end of fiscal
2011
, we had approximately 2,000 LEED for Homes products.
We continue to offer our nationwide, in-store CFL bulb recycling program launched in 2008. This service is offered to customers free of charge and is available in all U.S. stores. We also maintain an in-store rechargeable battery recycling program. Launched in 2001 in partnership with the Rechargeable Battery Recycling Corporation, this program is also available to customers free of charge in all stores throughout the U.S. and Canada. Through these recycling programs, in fiscal
2011
we helped recycle over 480,000 pounds of CFL bulbs and over 770,000 pounds of rechargeable batteries collected from our customers. In fiscal
2011
, we also recycled over 130,000 lead acid batteries collected from our customers under our lead acid battery exchange program, as well as approximately 150,000 tons of cardboard through a nationwide cardboard recycling program across our U.S. stores.
Net Sales of Major Product Groups
. The following table shows the percentage of Net Sales of each major product group (and related services) for each of the last three fiscal years:
|
Product Group
|
Percentage of Net Sales for Fiscal Year Ended
|
|||||||
|
January 29,
2012 |
January 30,
2011 |
January 31,
2010 |
||||||
|
Plumbing, electrical and kitchen
|
30.5
|
%
|
30.0
|
%
|
29.8
|
%
|
||
|
Hardware and seasonal
|
29.5
|
|
29.4
|
|
29.1
|
|
||
|
Building materials, lumber and millwork
|
21.1
|
|
21.7
|
|
21.9
|
|
||
|
Paint and flooring
|
18.9
|
|
18.9
|
|
19.2
|
|
||
|
Total
|
100.0
|
%
|
100.0
|
%
|
100.0
|
%
|
||
Net Sales outside the U.S. were
$8.0 billion
,
$7.5 billion
and
$7.0 billion
for fiscal
2011
,
2010
and
2009
, respectively. Long-lived assets outside the U.S. totaled
$3.1 billion
,
$3.2 billion
and
$3.0 billion
as of
January 29, 2012
,
January 30, 2011
and
January 31, 2010
, respectively.
Seasonality.
Our business is subject to seasonal influences. Generally, our highest volume of sales occurs in our second fiscal quarter, and the lowest volume occurs during our fourth fiscal quarter.
Competition.
Our business is highly competitive, based primarily on customer service, price, store location and assortment of merchandise. Although we are currently the world’s largest home improvement retailer, in each of the markets we serve there are a number of other home improvement stores, electrical, plumbing and building materials supply houses and lumber yards. With respect to some products, we also compete with specialty design stores, showrooms, discount stores, local, regional and national hardware stores, mail order firms, warehouse clubs, independent building supply stores and, to a lesser extent, other retailers. In addition, we face growing competition from online and multichannel retailers.
Intellectual Property.
Our business has one of the most recognized brands in North America. As a result, we believe that The Home Depot
®
trademark has significant value and is an important factor in the marketing of our products, e-commerce, stores and business. We have registered or applied for registration of trademarks, service marks, copyrights and internet domain names, both domestically and internationally, for use in our business. We also maintain patent portfolios relating to some of our products and services and seek to patent or otherwise protect innovations we incorporate into our products or business operations.
4
Productivity and Efficiency
Logistics.
Our supply chain operations are focused on creating a competitive advantage through ensuring product availability for our customers, effectively using our investment in inventory, and managing total supply chain costs. Following the completion of our RDC rollout, our initiatives in fiscal
2011
have been to further optimize and efficiently operate our network, build new logistics capabilities and improve our inventory management systems and processes.
Our distribution strategy is to provide the optimal flow path for a given product. RDCs play a key role in optimizing our network as they allow for aggregation of product needs for multiple stores to a single purchase order and then rapid allocation and deployment of inventory to individual stores upon arrival at the RDC. This results in a simplified ordering process and improved transportation and inventory management. To enhance our RDC network, we continued adding mechanization, and at the end of fiscal
2011
, 15 of our 19 RDCs were mechanized. Over the past two years, we have expanded our transload pilot program to three facilities near ocean ports, with a fourth facility expected to become operational in fiscal
2012
. Transload facilities allow us to improve our import logistics costs and inventory management by enabling imported product to flow through our RDC network. In addition, we implemented a new distribution forecasting and replenishment system to further improve our inventory management.
We added approximately 1.5 million net square feet of distribution center space in fiscal
2011
, primarily for new repair and liquidation centers as part of our centralized returns system. These centers consolidate product from our stores to return to our vendors, liquidate or recycle. They also provide a small engine repair service for our stores and customers primarily focused on outdoor and hardware power equipment. At the end of fiscal
2011
, in addition to our 19 RDCs in the U.S., we operated 33 bulk distribution centers, which handle products distributed optimally on flat bed trucks, in the U.S. and Canada. We also operated 35 conventional distribution centers, which include stocking, direct fulfillment and specialty distribution centers, in the U.S., Canada and Mexico. In fiscal
2011
we made further progress toward our goal of 75% central distribution penetration. In the U.S. our central distribution penetration was approximately 70% as of the end of fiscal
2011
, with the remainder of goods shipped directly to our stores from our suppliers. We remain committed to leveraging our supply chain capabilities to fully utilize and optimize our improved logistics network.
Commitment to Environmentally Responsible Operations
. The Home Depot is committed to conducting business in an environmentally responsible manner. This commitment impacts all areas of our business, including energy usage, supply chain, store construction and maintenance, and, as noted above under "Energy Saving Products and Programs," product selection and delivery of product knowledge to our customers.
In fiscal
2011
, we continued to implement strict operational standards that establish energy efficient practices in all of our facilities. These include HVAC unit temperature regulation and adherence to strict lighting schedules, which are the largest sources of energy consumption in our stores, as well as use of energy management systems in each store to monitor energy efficiency. We estimate that by implementing and utilizing these energy saving programs, we have saved over 4.5 billion kilowatt hours (kWh) since 2004, enough to power approximately 400,000 U.S. homes for one year, and we are on track to meet our goal of a 20% reduction in kWh per square foot in our U.S. stores by 2015.
Through our supply chain efficiencies described above under "Logistics," we are targeting a 20% reduction in our domestic supply chain greenhouse gas emissions from 2008 to 2015, which would equate to annual fuel savings of approximately 25 million gallons. In fiscal
2011
, we also calculated our total carbon dioxide emissions for 2010, and we continue to monitor our "carbon footprint" from the operation of our stores as well as from our transportation and supply chain activities. Through our energy conservation and supply chain initiatives, we reduced our absolute carbon emissions by approximately 540,000 metric tons in 2010 compared to 2009.
With respect to construction of our stores, we partnered with the U.S. Green Building Council and have built seven LEED for New Construction certified and other similarly certified stores. In 2011, we also obtained a grant from the U.S. Department of Energy to help design, monitor and verify the energy savings of a new building in Lodi, California that is designed to consume substantially less energy than the 2007 90.1 ASHRAE standards set out by the American Society of Heating, Refrigerating and Air-Conditioning Engineers, an international society that sets forth HVAC and refrigeration standards to promote sustainability. We also implemented a rainwater reclamation pilot in 2010, and we have retrofitted a number of our stores with reclamation tanks to collect rainwater and condensation from HVAC units and garden center roofs, which is in turn used to water plants in our outside garden centers. In September 2011, we opened a store in St. Croix in the U.S. Virgin Islands with both ground mount and roof mount solar panel systems, and we estimate the combined total annual energy production of these systems to be up to 570 megawatt hours.
5
Our efforts have resulted in a number of environmental awards and recognitions. For instance, in 2011, we were named "Retail Partner of the Year" by the WaterSense division of the U.S. Environmental Protection Agency for our overall excellence in water efficiency, and we were recognized as a "High Performer" by the Carbon Disclosure Project.
We are also committed to maintaining a safe environment for our customers and associates and protecting the environment of the communities in which we do business. Our Environmental, Health & Safety ("EH&S") function is dedicated to ensuring the health and safety of our customers and associates, with trained associates who evaluate, develop, implement and enforce policies, processes and programs on a Company-wide basis. Our EH&S policies are woven into our everyday operations and are part of The Home Depot culture. Some common program elements include: daily store inspection checklists (by department); routine follow-up audits from our store-based safety team members and regional, district and store operations field teams; equipment enhancements and preventative maintenance programs to promote physical safety; departmental merchandising safety standards; training and education programs for all associates, with more extensive training provided based on an associate's role and responsibilities; and awareness, communication and recognition programs designed to drive operational awareness and understanding of EH&S issues.
Interconnected Retail
Our interconnected retail initiative supports and connects our three other key initiatives. In fiscal 2011, we focused on leveraging technology to improve our customer's retail experience and provide better access to and information about our products. As described above, these efforts included information technology solutions that take tasks out of the store and free our associates to devote more time to customer-facing activities. They also included significant website enhancements and improvements to our special ordering process that allow customers to more easily find and purchase an expanded array of products and provide a choice in how to receive the order (for example, through our BOPIS program). Through our website, which can be accessed through computers, smart phones and other mobile devices, customers can not only purchase products, but can also connect with our associates and with one another to gain product and project knowledge. Furthermore, to increase the productivity and efficiency of our associates, merchants and vendors and ensure that the right product is in the right place to meet our customers' needs, we developed and implemented the improved merchandising tools that provide better visibility into category and item performance and the new distribution forecasting and replenishment system for enhanced inventory management.
The risks and uncertainties described below could materially and adversely affect our business, financial condition and results of operations and could cause actual results to differ materially from our expectations and projections. The Risk Factors described below include the considerable risks associated with the current economic environment and the related potential adverse effects on our financial condition and results of operations. You should read these Risk Factors in conjunction with "Management’s Discussion and Analysis of Financial Condition and Results of Operations" in Item 7 and our Consolidated Financial Statements and related notes in Item 8. There also may be other factors that we cannot anticipate or that are not described in this report generally because we do not currently perceive them to be material. Those factors could cause results to differ materially from our expectations.
Sustained uncertainty regarding current economic conditions and other factors beyond our control could adversely affect demand for our products and services, our costs of doing business and our financial performance.
Our financial performance depends significantly on the stability of the housing, residential construction and home improvement markets, as well as general economic conditions, including changes in gross domestic product. Adverse conditions in or sustained uncertainty about these markets or the economy could adversely impact consumer confidence, causing our customers to delay purchasing or determine not to purchase home improvement products and services. Other factors – including high levels of unemployment and foreclosures, interest rate fluctuations, fuel and other energy costs, labor and healthcare costs, the availability of financing, the state of the credit markets, including mortgages, home equity loans and consumer credit, weather, natural disasters and other conditions beyond our control – could further adversely affect demand for our products and services, our costs of doing business and our financial performance.
Strong competition could adversely affect prices and demand for our products and services and could decrease our market share.
We operate in markets that are highly competitive. We compete principally based on customer service, price, store location and appearance, and quality, availability and assortment of merchandise. In each market we serve, there are a number of other home improvement stores, electrical, plumbing and building materials supply houses and lumber yards. With respect to some products and services, we also compete with specialty design stores, showrooms, discount stores, local, regional and national
6
hardware stores, mail order firms, warehouse clubs, independent building supply stores and other retailers, as well as with installers of home improvement products. In addition, we face growing competition from online and multichannel retailers. Intense competitive pressures from one or more of our competitors could affect prices or demand for our products and services. If we are unable to timely and appropriately respond to these competitive pressures, including through maintenance of superior customer service and customer loyalty, our financial performance and our market share could be adversely affected.
We may not timely identify or effectively respond to consumer needs, expectations or trends, which could adversely affect our relationship with customers, the demand for our products and services and our market share.
It is difficult to successfully predict the products and services our customers will demand. The success of our business depends in part on our ability to identify and respond promptly to evolving trends in demographics, consumer preferences, expectations and needs and unexpected weather conditions, while also managing inventory levels. Failure to maintain attractive stores and to timely identify or effectively respond to changing consumer preferences, expectations and home improvement needs could adversely affect our relationship with customers, the demand for our products and services and our market share.
Our success depends upon our ability to attract, train and retain highly qualified associates while also controlling our labor costs.
Our customers expect a high level of customer service and product knowledge from our associates. To meet the needs and expectations of our customers, we must attract, train and retain a large number of highly qualified associates while at the same time controlling labor costs. Our ability to control labor costs is subject to numerous external factors, including prevailing wage rates, the impact of legislation or regulations governing labor relations or healthcare benefits, and health and other insurance costs. In addition, we compete with other retail businesses for many of our associates in hourly positions, and we invest significant resources in training and motivating them to maintain a high level of job satisfaction. These positions have historically had high turnover rates, which can lead to increased training and retention costs. There is no assurance that we will be able to attract or retain highly qualified associates in the future.
We rely on third party suppliers. If we fail to identify and develop relationships with a sufficient number of qualified suppliers, or if our current suppliers experience financial difficulties, our ability to timely and efficiently access products that meet our high standards for quality could be adversely affected.
We buy our products from suppliers located throughout the world. Our ability to continue to identify and develop relationships with qualified suppliers who can satisfy our high standards for quality and our need to access products in a timely and efficient manner is a significant challenge. Our ability to access products also can be adversely affected by political instability, the financial instability of suppliers (particularly in light of continuing economic difficulties in various regions of the world), suppliers’ noncompliance with applicable laws, trade restrictions, tariffs, currency exchange rates, supply disruptions, shipping interruptions or costs, and other factors beyond our control.
If we are unable to effectively manage and expand our alliances and relationships with selected suppliers of brand name products, we may be unable to effectively execute our strategy to differentiate ourselves from our competitors.
As part of our focus on product differentiation, we have formed strategic alliances and exclusive relationships with selected suppliers to market products under a variety of well-recognized brand names. If we are unable to manage and expand these alliances and relationships or identify alternative sources for comparable products, we may not be able to effectively execute product differentiation.
If we do not maintain the security of customer, associate or company information, we could damage our reputation, incur substantial additional costs and become subject to litigation.
Any significant compromise or breach of customer, associate or company data security could significantly damage our reputation and result in significant costs, lost sales, fines and lawsuits. The regulatory environment related to information security and privacy is increasingly rigorous, with new and constantly changing requirements applicable to our business, and compliance with those requirements could result in additional costs. There is no guarantee that the procedures that we have implemented to protect against unauthorized access to secured data are adequate to safeguard against all data security breaches.
A failure of a key information technology system or process could adversely affect our business.
We rely extensively on information technology systems, some of which are managed by third-party service providers, to analyze, process and manage transactions and data. We also rely heavily on the integrity of this data in managing our business. We or our service providers could experience errors, interruptions, delays or cessations of service in key portions of
7
our information technology infrastructure, which could significantly disrupt our operations and be expensive, time consuming and resource-intensive to remedy.
Disruptions in our customer-facing technology systems could impair our interconnected retail strategy and give rise to negative customer experiences.
Through our information technology developments, we are able to provide an improved overall shopping environment and experience that empowers our customers to shop and interact with us from computers, smart phones and other mobile communication devices. We use our website both as a sales channel for our products and also as a method of providing product, project and other relevant information to our customers to drive both in-store and online sales. We have multiple online communities and knowledge centers that allow us to inform, assist and interact with our customers. Disruptions, failures or other performance issues with these customer-facing technology systems could impair the benefits that they provide to our online and in-store business and negatively affect our relationship with our customers.
The implementation of our supply chain and technology initiatives could disrupt our operations in the near term, and these initiatives might not provide the anticipated benefits or might fail.
We have made, and we plan to continue to make, significant investments in our supply chain and technology. These initiatives are designed to streamline our operations to allow our associates to continue to provide high quality service to our customers, while simplifying customer interaction and providing our customers with a more interconnected retail experience. The cost and potential problems and interruptions associated with the implementation of these initiatives, including those associated with managing third-party service providers and employing new web-based tools and services, could disrupt or reduce the efficiency of our operations in the near term. In addition, our improved supply chain and new or upgraded technology might not provide the anticipated benefits, it might take longer than expected to realize the anticipated benefits, or the initiatives might fail altogether.
Disruptions in our supply chain and other factors affecting the distribution of our merchandise could adversely impact our business.
A disruption within our logistics or supply chain network, including damage or destruction to our distribution centers, could adversely affect our ability to deliver inventory in a timely manner, which could impair our ability to meet customer demand for products and result in lost sales or damage to our reputation. Such a disruption could negatively impact our financial performance or financial condition.
The inflation or deflation of commodity prices could affect our prices, demand for our products, our sales and our profit margins.
Prices of certain commodity products, including lumber and other raw materials, are historically volatile and are subject to fluctuations arising from changes in domestic and international supply and demand, labor costs, competition, market speculation, government regulations and periodic delays in delivery. Rapid and significant changes in commodity prices may affect the demand for our products, our sales and our profit margins.
Our costs of doing business could increase as a result of changes in, increased enforcement of, or adoption of new federal, state or local laws and regulations.
We are subject to various federal, state and local laws and regulations that govern numerous aspects of our business. Recently, there have been a large number of legislative and regulatory initiatives and reforms, as well as increased enforcement of existing laws and regulations by federal, state and local agencies. Changes in, increased enforcement of, or adoption of new federal, state or local laws and regulations governing minimum wage or living wage requirements, other wage, labor or workplace regulations, the sale of some of our products, transportation, logistics, taxes, energy costs or environmental matters, could increase our costs of doing business or impact our store operations. Healthcare reform under the Patient Protection and Affordable Care Act and the Health Care and Education Reconciliation Act of 2010 could adversely impact our labor costs and our ability to negotiate favorable terms under our benefit plans for our associates.
Our ability to obtain additional financing on favorable terms, if needed, could be adversely affected by the volatility in the capital markets.
We obtain and manage liquidity from the positive cash flow we generate from our operating activities and our access to capital markets, including our commercial paper programs supported by a back-up credit facility with a consortium of banks. Although we currently maintain an investment grade rating and had no outstanding commercial paper obligations as of the end of fiscal
2011
, there is no assurance that our ability to obtain additional financing through the capital markets, if needed, will not be adversely impacted due to economic conditions. New or incremental tightening in the credit markets, low liquidity
8
and volatility in the capital markets could result in diminished availability of credit, higher cost of borrowing and lack of confidence in the equity market, making it more difficult to obtain additional financing on terms that are favorable to us.
If we cannot successfully manage the unique challenges presented by international markets, we may not be successful in our international operations.
Our ability to successfully conduct retail operations in, and source from, international markets is affected by many of the same risks we face in our U.S. operations, as well as unique costs and difficulties of managing international operations. Our international operations, including any expansion in international markets, may be adversely affected by local laws and customs, U.S. laws applicable to foreign operations, such as the Foreign Corrupt Practices Act ("FCPA") and other legal and regulatory constraints, as well as political and economic conditions. Risks inherent in international operations also include, among others, potential adverse tax consequences, greater difficulty in enforcing intellectual property rights, risks associated with FCPA and local anti-bribery law compliance, challenges in our ability to identify and gain access to local suppliers and the impact of foreign currency exchange rates and fluctuations.
If we are unable to manage effectively our installation service business, we could be subject to fines and lawsuits.
We act as a general contractor to provide installation services to our D-I-F-M customers through third-party installers. As such, we are subject to regulatory requirements and risks applicable to general contractors, which include management of licensing, permitting and quality of our third-party installers. We have established processes and procedures that provide protections beyond those required by law to manage these requirements and ensure customer satisfaction with the services provided by our third-party installers. If we fail to manage these processes effectively or provide proper oversight of these services, we could suffer lost sales, fines and lawsuits, as well as damage to our reputation, which could adversely affect our business.
Changes in accounting standards and subjective assumptions, estimates and judgments by management related to complex accounting matters could significantly affect our financial results or financial condition.
Generally accepted accounting principles and related accounting pronouncements, implementation guidelines and interpretations with regard to a wide range of matters that are relevant to our business, such as revenue recognition, asset impairment, impairment of goodwill and other intangible assets, inventories, lease obligations, self-insurance, tax matters and litigation, are highly complex and involve many subjective assumptions, estimates and judgments. Changes in these rules or their interpretation or changes in underlying assumptions, estimates or judgments could significantly change our reported or expected financial performance or financial condition.
We are involved in a number of legal proceedings, and while we cannot predict the outcomes of those proceedings and other contingencies with certainty, some of these outcomes may adversely affect our operations or increase our costs.
We are involved in a number of legal proceedings, including government inquiries and investigations, and consumer, employment, tort and other litigation that arise from time to time in the ordinary course of business. Litigation is inherently unpredictable, and the outcome of some of these proceedings and other contingencies could require us to take or refrain from taking actions which could adversely affect our operations or could result in excessive verdicts. Additionally, defending against these lawsuits and proceedings may involve significant expense and diversion of management’s attention and resources from other matters.
Not applicable.
9
The following tables show locations of the
1,974
The Home Depot stores located in the U.S. and its territories and the
278
The Home Depot stores outside the U.S. at the end of fiscal
2011
:
|
U.S. Locations
|
Number of Stores
|
|
U.S. Locations
|
Number of Stores
|
|
|
|
Alabama
|
28
|
|
Montana
|
6
|
|
|
|
Alaska
|
7
|
|
Nebraska
|
8
|
|
|
|
Arizona
|
56
|
|
Nevada
|
21
|
|
|
|
Arkansas
|
14
|
|
New Hampshire
|
20
|
|
|
|
California
|
231
|
|
New Jersey
|
67
|
|
|
|
Colorado
|
46
|
|
New Mexico
|
13
|
|
|
|
Connecticut
|
29
|
|
New York
|
100
|
|
|
|
Delaware
|
9
|
|
North Carolina
|
40
|
|
|
|
District of Columbia
|
1
|
|
North Dakota
|
1
|
|
|
|
Florida
|
153
|
|
Ohio
|
70
|
|
|
|
Georgia
|
90
|
|
Oklahoma
|
16
|
|
|
|
Guam
|
1
|
|
Oregon
|
26
|
|
|
|
Hawaii
|
7
|
|
Pennsylvania
|
70
|
|
|
|
Idaho
|
11
|
|
Puerto Rico
|
8
|
|
|
|
Illinois
|
76
|
|
Rhode Island
|
8
|
|
|
|
Indiana
|
24
|
|
South Carolina
|
25
|
|
|
|
Iowa
|
10
|
|
South Dakota
|
1
|
|
|
|
Kansas
|
16
|
|
Tennessee
|
39
|
|
|
|
Kentucky
|
14
|
|
Texas
|
178
|
|
|
|
Louisiana
|
27
|
|
Utah
|
22
|
|
|
|
Maine
|
11
|
|
Vermont
|
3
|
|
|
|
Maryland
|
41
|
|
Virgin Islands
|
2
|
|
|
|
Massachusetts
|
45
|
|
Virginia
|
49
|
|
|
|
Michigan
|
70
|
|
Washington
|
45
|
|
|
|
Minnesota
|
33
|
|
West Virginia
|
6
|
|
|
|
Mississippi
|
14
|
|
Wisconsin
|
27
|
|
|
|
Missouri
|
34
|
|
Wyoming
|
5
|
|
|
|
Total U.S.
|
1,974
|
|
||||
10
|
International Locations
|
Number of Stores
|
International Locations
|
Number of Stores
|
|||
|
Canada:
|
Mexico:
|
|||||
|
Alberta
|
27
|
|
Aguascalientes
|
1
|
|
|
|
British Columbia
|
26
|
|
Baja California Norte
|
5
|
|
|
|
Manitoba
|
6
|
|
Baja California Sur
|
2
|
|
|
|
New Brunswick
|
3
|
|
Chiapas
|
2
|
|
|
|
Newfoundland
|
1
|
|
Chihuahua
|
5
|
|
|
|
Nova Scotia
|
4
|
|
Coahuila
|
4
|
|
|
|
Ontario
|
86
|
|
Colima
|
1
|
|
|
|
Prince Edward Island
|
1
|
|
Distrito Federal
|
7
|
|
|
|
Quebec
|
22
|
|
Durango
|
1
|
|
|
|
Saskatchewan
|
4
|
|
Guanajuato
|
4
|
|
|
|
Total Canada
|
180
|
|
Guerrero
|
2
|
|
|
|
Hidalgo
|
1
|
|
||||
|
China:
|
Jalisco
|
6
|
|
|||
|
Henan
|
1
|
|
Michoacán
|
2
|
|
|
|
Shaanxi
|
2
|
|
Morelos
|
1
|
|
|
|
Tianjin
|
4
|
|
Nuevo León
|
9
|
|
|
|
Total China
|
7
|
|
Puebla
|
4
|
|
|
|
|
Queretaro
|
2
|
|
|||
|
Quintana Roo
|
1
|
|
||||
|
San Luis Potosi
|
1
|
|
||||
|
Sinaloa
|
3
|
|
||||
|
Sonora
|
2
|
|
||||
|
State of Mexico
|
14
|
|
||||
|
Tabasco
|
1
|
|
||||
|
Tamaulipas
|
4
|
|
||||
|
Tiaxcala
|
1
|
|
||||
|
Veracruz
|
4
|
|
||||
|
Yucatan
|
1
|
|
||||
|
Total Mexico
|
91
|
|
||||
During fiscal
2011
, we opened four new The Home Depot stores in the U.S., including two relocations, and closed four stores. We also opened one new store in Canada and six new stores in Mexico. We closed one store in China.
Of our
2,252
stores operating at the end of fiscal
2011
, approximately 89% were owned (including those owned subject to a ground lease) consisting of approximately 209.1 million square feet, and approximately 11% of such stores were leased consisting of approximately 25.8 million square feet.
Additionally, at the end of fiscal
2011
, we had six Home Decorators Collection locations in Georgia, Illinois, Kansas, Missouri and New Jersey.
At the end of fiscal
2011
, we utilized 143 warehouses and distribution centers located in 35 states or provinces, consisting of approximately 37.3 million square feet, of which approximately 1.2 million is owned and approximately 36.1 million is leased.
Our executive, corporate staff, divisional staff and financial offices occupy approximately 2.1 million square feet of leased and owned space in Atlanta, Georgia. At the end of fiscal
2011
, we occupied an aggregate of approximately 3.9 million square feet, of which approximately 2.3 million square feet is owned and approximately 1.6 million square feet is leased, for store support centers and customer support centers in Atlanta and other locations.
11
As previously reported, in July 2005, the Company received a grand jury subpoena from the United States Attorney's Office in Los Angeles, California, seeking documents and information relating to the Company's handling, storage and disposal of hazardous waste. The Company is cooperating fully with the United States Attorney's Office. Although the Company cannot predict the outcome of this proceeding, it does not expect the outcome to have a material adverse effect on its consolidated financial condition or results of operations.
As previously reported, in the second and third quarters of fiscal 2006, three purported, but uncertified, class actions were filed against the Company, The Home Depot FutureBuilder Administrative Committee and certain of the Company's current and former directors and employees alleging breach of fiduciary duty in violation of the Employee Retirement Income Security Act of 1974 ("ERISA") in connection with the Company's return-to-vendor and stock option practices. These actions were joined into one case in 2007, and the joint amended complaint seeks certification as a class action, unspecified damages, costs, attorney's fees and equitable and injunctive relief. On June 7, 2010, the U.S. District Court for the Northern District of Georgia in Atlanta granted with prejudice Home Depot's motion to dismiss plaintiffs' third amended complaint. On June 28, 2010, plaintiffs filed a notice of appeal with the U.S. Court of Appeals for the Eleventh Circuit (the "Circuit Court"), and on October 7, 2011, the Circuit Court held oral argument on the appeal. Although the Company cannot predict the outcome of this matter, it does not expect the outcome to have a material adverse effect on its consolidated financial condition or results of operations.
As previously reported, in September 2010, the Company was contacted by district attorneys in three counties in California within the South Coast Air Quality Management District (the "SCAQMD") and the City of Los Angeles regarding allegations that the Company sold products in those counties with VOC (volatile organic compound) levels in excess of amounts permitted by SCAQMD rules. In June 2011, two related complaints were filed in the Superior Court of California – County of Los Angeles against the Company. The first action was brought by the SCAQMD and alleges that the Company sold products with higher-than-permitted VOC levels. This action seeks $30 million in civil penalties and injunctive relief. The second action was brought by the Los Angeles City Attorney and the district attorneys of each of Orange, Riverside and San Bernadino counties and alleges that the Company engaged in unfair business practices and false advertising when selling these products. This action seeks unspecified civil penalties and injunctive relief. Although the Company cannot predict the outcomes of these matters, it does not expect either to have a material adverse effect on its consolidated financial condition or results of operations.
Not applicable.
12
Since April 19, 1984, our common stock has been listed on the New York Stock Exchange, trading under the symbol "HD." The Company paid its first cash dividend on June 22, 1987, and has paid cash dividends during each subsequent quarter. Future dividend payments will depend on the Company’s earnings, capital requirements, financial condition and other factors considered relevant by the Board of Directors.
The table below sets forth the high and low sales prices of our common stock on the New York Stock Exchange and the quarterly cash dividends declared per share of common stock for the periods indicated.
|
|
Price Range
|
Cash Dividends
Declared
|
|||||||||
|
|
High
|
Low
|
|||||||||
|
Fiscal Year 2011
|
|||||||||||
|
First Quarter Ended May 1, 2011
|
$
|
38.48
|
|
$
|
35.68
|
|
$
|
0.25
|
|
||
|
Second Quarter Ended July 31, 2011
|
$
|
37.46
|
|
$
|
33.47
|
|
$
|
0.25
|
|
||
|
Third Quarter Ended October 30, 2011
|
$
|
37.22
|
|
$
|
28.51
|
|
$
|
0.29
|
|
||
|
Fourth Quarter Ended January 29, 2012
|
$
|
45.41
|
|
$
|
35.54
|
|
$
|
0.29
|
|
||
|
Fiscal Year 2010
|
|||||||||||
|
First Quarter Ended May 2, 2010
|
$
|
36.49
|
|
$
|
27.93
|
|
$
|
0.23625
|
|
||
|
Second Quarter Ended August 1, 2010
|
$
|
35.89
|
|
$
|
27.07
|
|
$
|
0.23625
|
|
||
|
Third Quarter Ended October 31, 2010
|
$
|
31.89
|
|
$
|
27.31
|
|
$
|
0.23625
|
|
||
|
Fourth Quarter Ended January 30, 2011
|
$
|
37.98
|
|
$
|
30.21
|
|
$
|
0.25
|
|
||
As of
March 14, 2012
, there were approximately 155,000 shareholders of record of our common stock and approximately 1,048,000 additional "street name" holders whose shares are held of record by banks, brokers and other financial institutions.
13
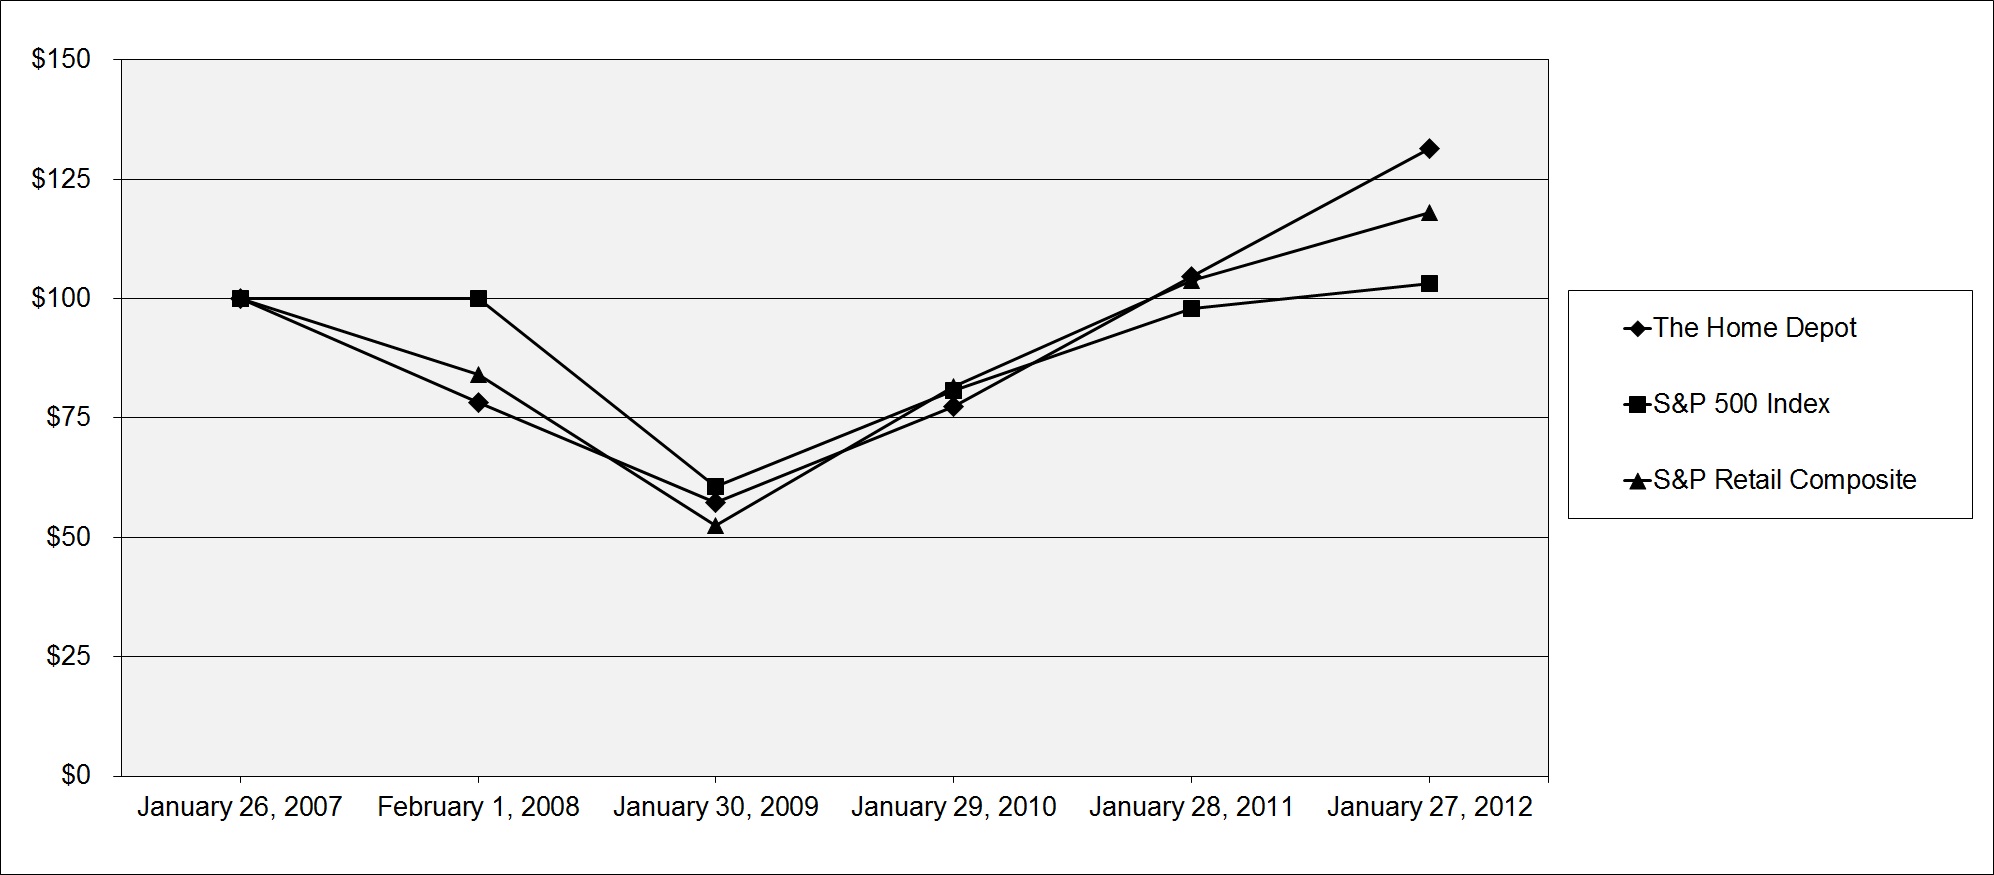
Stock Performance Graph
The graph and table below present the Company’s cumulative total shareholder returns relative to the performance of the Standard & Poor’s 500 Composite Stock Index and the Standard & Poor’s Retail Composite Index for the five-year period commencing January 26, 2007, the last trading day of fiscal 2006, and ending January 27, 2012, the last trading day of fiscal
2011
. The graph assumes $100 invested at the closing price of the Company’s common stock on the New York Stock Exchange and each index on January 26, 2007 and assumes that all dividends were reinvested on the date paid. The points on the graph represent fiscal year-end amounts based on the last trading day in each fiscal year.
|
January 26,
2007
|
February 1,
2008
|
January 30,
2009
|
January 29,
2010
|
January 28,
2011
|
January 27, 2012
|
||||||||||||||||||
|
The Home Depot
|
$
|
100.00
|
|
$
|
78.26
|
|
$
|
57.31
|
|
$
|
77.38
|
|
$
|
104.55
|
|
$
|
131.54
|
|
|||||
|
S&P 500 Index
|
$
|
100.00
|
|
$
|
100.03
|
|
$
|
60.65
|
|
$
|
80.74
|
|
$
|
97.91
|
|
$
|
103.12
|
|
|||||
|
S&P Retail Composite Index
|
$
|
100.00
|
|
$
|
84.13
|
|
$
|
52.40
|
|
$
|
81.51
|
|
$
|
103.85
|
|
$
|
117.97
|
|
|||||
14
Issuer Purchases of Equity Securities
Since the inception of the Company's share repurchase program in fiscal 2002 through the end of fiscal
2011
, the Company has repurchased shares of its common stock having a value of approximately $33.6 billion. The number and average price of shares purchased in each fiscal month of the fourth quarter of fiscal
2011
are set forth in the table below:
|
Period
|
Total Number of
Shares Purchased
(1)
|
Average
Price Paid
per Share
(1)
|
Total Number of
Shares Purchased as
Part of Publicly
Announced Program
(2)
|
Dollar Value of Shares
that May Yet Be
Purchased Under
the Program
(2)
|
|||||||||
|
Oct. 31, 2011 – Nov. 27, 2011
|
1,155,596
|
|
$
|
37.15
|
|
1,078,022
|
|
$
|
6,770,021,276
|
|
|||
|
Nov. 28, 2011 – Dec. 25, 2011
|
4,022,900
|
|
$
|
40.04
|
|
4,001,233
|
|
$
|
6,609,741,200
|
|
|||
|
Dec. 26, 2011 – Jan. 29, 2012
|
4,588,429
|
|
$
|
43.58
|
|
4,582,312
|
|
$
|
6,410,022,757
|
|
|||
—————
|
(1)
|
These amounts include repurchases pursuant to the Company’s 1997 and 2005 Omnibus Stock Incentive Plans (the "Plans"). Under the Plans, participants may exercise stock options by surrendering shares of common stock that the participants already own as payment of the exercise price. Participants in the Plans may also surrender shares as payment of applicable tax withholding on the vesting of restricted stock and deferred share awards. Shares so surrendered by participants in the Plans are repurchased pursuant to the terms of the Plans and applicable award agreement and not pursuant to publicly announced share repurchase programs.
|
|
(2)
|
The Company’s common stock repurchase program was initially announced on July 15, 2002. As of the end of fiscal
2011
, the Board had approved purchases up to $40.0 billion. The program does not have a prescribed expiration date.
|
In March 2012, the Company entered into an Accelerated Share Repurchase ("ASR") agreement with a third-party financial institution to repurchase $1.0 billion of the Company’s common stock. See Note 5 to the Consolidated Financial Statements included in this report. Shares received in connection with the ASR agreement will be reflected in the share repurchase table in future quarters.
Sales of Unregistered Securities
During the fourth quarter of fiscal
2011
, the Company issued 601 deferred stock units under The Home Depot, Inc. NonEmployee Directors’ Deferred Stock Compensation Plan pursuant to the exemption from registration provided by Section 4(2) of the Securities Act of 1933, as amended (the "Securities Act"). The deferred stock units were credited to the accounts of those nonemployee directors who elected to receive board retainers in the form of deferred stock units instead of cash during the fourth quarter of fiscal
2011
. The deferred stock units convert to shares of common stock on a one-for-one basis following a termination of service as described in this plan.
During the fourth quarter of fiscal
2011
, the Company credited 1,415 deferred stock units to participant accounts under The Home Depot FutureBuilder Restoration Plan pursuant to an exemption from the registration requirements of the Securities Act for involuntary, non-contributory plans. The deferred stock units convert to shares of common stock on a one-for-one basis following a termination of service as described in this plan.
The information required by this item is incorporated by reference to page F-1 of this report.
15
Executive Summary and Selected Consolidated Statements of Earnings Data
For the fiscal year ended
January 29, 2012
("fiscal
2011
"), we reported Net Earnings of $
3.9 billion
and Diluted Earnings per Share of $
2.47
compared to Net Earnings of $
3.3 billion
and Diluted Earnings per Share of $
2.01
for the fiscal year ended
January 30, 2011
("fiscal
2010
").
Net Sales increased
3.5
% to $
70.4 billion
for fiscal
2011
from $
68.0 billion
for fiscal
2010
. Our comparable store sales increased
3.4%
in fiscal
2011
, driven primarily by a 2.6% increase in our comparable store average ticket. Comparable store sales for our U.S. stores increased 3.0% in fiscal
2011
.
In fiscal
2011
, we continued to focus on the following four key initiatives:
Customer Service
– Our focus on customer service is anchored on the principles of putting customers first, taking care of our associates and simplifying the business. In fiscal 2011, we rolled out a new scheduling system for our associates and a new centralized return to vendor process. As a result, we now have approximately 53% of our store labor hours dedicated to customer-facing activity. We have a customer-facing store payroll target of 60%, and we believe we will achieve that goal by 2013. Also in fiscal 2011, we began the process of rolling out in-store repair services for power equipment and power tools, and we believe this will be a significant improvement in convenience for our customers.
Product Authority
– Our focus on product authority is facilitated by our merchandising transformation and portfolio strategy, including innovation, assortment and value. We are enhancing our special order system and when completed, this system will make the special order process both simpler and more accurate for our customers and associates. As part of this multi-phased project to improve our special order performance, we digitized our vendor catalogs in fiscal
2011
. We also continued to form strategic alliances and relationships with selected suppliers to bring a number of proprietary and exclusive brands across a wide range of departments in fiscal
2011
.
Productivity and Efficiency
– Our approach to driving productivity and efficiency is advanced through building best-in-class competitive advantages in information technology and supply chain, as well as building shareholder value through higher returns on invested capital and total value returned to shareholders in the form of dividends and share repurchases. In fiscal
2011
, we saw continued benefits from our supply chain investments, which improved our in-stock rate and asset efficiency. Our inventory turnover ratio was
4.3
times at the end of fiscal
2011
compared to
4.1
times at the end of fiscal
2010
. Additionally, as of the end of fiscal 2011, we handled approximately 70% of our U.S. Cost of Sales through centralized distribution compared to approximately 25% four years ago.
In terms of building shareholder value, we repurchased a total of 97 million shares for $3.5 billion during fiscal 2011. In addition, in November 2011 we announced a 16% increase in our quarterly cash dividend to 29 cents per share.
Interconnected Retail
– Our focus on interconnected retail is based on the view that providing a seamless shopping experience across multiple channels will be a critical enabler for future success. Our multiple channel focus is allowing us to greatly expand our assortment of merchandise, and we are making the investment to build these capabilities, including the roll out of Buy On-Line, Pick-up In Store ("BOPIS"), which we completed in fiscal 2011. In February 2012, we rolled out a significant upgrade of our website, which enhances the layout, visual appearance and responsiveness of the site.
We opened 11 new stores, including two relocations, and closed five stores in fiscal
2011
, bringing our total store count at the end of fiscal
2011
to 2,252. As of the end of fiscal
2011
, a total of 278 of these stores, or 12.3%, were located in Canada, Mexico and China compared to 272 stores, or 12.1%, at the end of fiscal
2010
.
We generated $
6.7 billion
of cash flow from operations in fiscal
2011
. We used a portion of this cash flow to fund $2.5 billion of the total $3.5 billion of share repurchases, pay $
1.6 billion
of dividends and fund $
1.2 billion
in capital expenditures.
At the end of fiscal
2011
, our long-term debt-to-equity ratio increased to
60.1%
from
46.1%
at the end of fiscal
2010
driven primarily by higher debt levels. Our return on invested capital (computed on net operating profit after tax for the trailing twelve months and the average of beginning and ending long-term debt and equity) was 14.9% for fiscal
2011
compared to 12.8% for fiscal
2010
.
16
We believe the selected sales data, the percentage relationship between Net Sales and major categories in the Consolidated Statements of Earnings and the percentage change in the dollar amounts of each of the items presented below are important in evaluating the performance of our business operations.
|
|
% of Net Sales
|
% Increase (Decrease)
In Dollar Amounts
|
|||||||||||||||
|
|
Fiscal Year
(1)
|
||||||||||||||||
|
|
2011
|
2010
|
2009
|
2011
vs. 2010
|
2010
vs. 2009
|
||||||||||||
|
NET SALES
|
100.0
|
%
|
100.0
|
%
|
100.0
|
%
|
3.5
|
%
|
2.8
|
%
|
|||||||
|
GROSS PROFIT
|
34.5
|
|
34.3
|
|
33.9
|
|
4.1
|
|
4.0
|
|
|||||||
|
Operating Expenses:
|
|||||||||||||||||
|
Selling, General and Administrative
|
22.8
|
|
23.3
|
|
24.0
|
|
1.1
|
|
(0.3
|
)
|
|||||||
|
Depreciation and Amortization
|
2.2
|
|
2.4
|
|
2.6
|
|
(2.7
|
)
|
(5.3
|
)
|
|||||||
|
Total Operating Expenses
|
25.0
|
|
25.7
|
|
26.6
|
|
0.8
|
|
(0.8
|
)
|
|||||||
|
OPERATING INCOME
|
9.5
|
|
8.6
|
|
7.3
|
|
14.1
|
|
21.6
|
|
|||||||
|
Interest and Other (Income) Expense:
|
|||||||||||||||||
|
Interest and Investment Income
|
—
|
|
—
|
|
—
|
|
(13.3
|
)
|
(16.7
|
)
|
|||||||
|
Interest Expense
|
0.9
|
|
0.8
|
|
1.0
|
|
14.3
|
|
(21.6
|
)
|
|||||||
|
Other
|
—
|
|
0.1
|
|
0.2
|
|
(100.0
|
)
|
(68.7
|
)
|
|||||||
|
Interest and Other, net
|
0.8
|
|
0.8
|
|
1.2
|
|
4.8
|
|
(31.1
|
)
|
|||||||
|
EARNINGS FROM CONTINUING
OPERATIONS BEFORE PROVISION
FOR INCOME TAXES
|
8.6
|
|
7.8
|
|
6.0
|
|
15.1
|
|
32.4
|
|
|||||||
|
Provision for Income Taxes
|
3.1
|
|
2.8
|
|
2.1
|
|
12.9
|
|
42.1
|
|
|||||||
|
EARNINGS FROM CONTINUING
OPERATIONS
|
5.5
|
%
|
4.9
|
%
|
4.0
|
%
|
16.3
|
%
|
27.4
|
%
|
|||||||
|
SELECTED SALES DATA
|
|||||||||||||||||
|
Number of Customer Transactions (in millions)
|
1,317.5
|
|
1,305.7
|
|
1,274.3
|
|
0.9
|
%
|
2.5
|
%
|
|||||||
|
Average Ticket
|
$
|
53.28
|
|
$
|
51.93
|
|
$
|
51.76
|
|
2.6
|
%
|
0.3
|
%
|
||||
|
Weighted Average Weekly Sales per
Operating Store (in thousands)
|
$
|
601
|
|
$
|
581
|
|
$
|
563
|
|
3.4
|
%
|
3.2
|
%
|
||||
|
Weighted Average Sales per Square Foot
|
$
|
299.00
|
|
$
|
288.64
|
|
$
|
278.97
|
|
3.6
|
%
|
3.5
|
%
|
||||
|
Comparable Store Sales Increase (Decrease) (%)
(2)
|
3.4
|
%
|
2.9
|
%
|
(6.6
|
)%
|
N/A
|
|
N/A
|
|
|||||||
Note: Certain percentages may not sum to totals due to rounding.
—————
|
(1)
|
Fiscal years
2011
,
2010
and
2009
refer to the fiscal years ended
January 29, 2012
,
January 30, 2011
and
January 31, 2010
, respectively. Fiscal years
2011
,
2010
and
2009
include 52 weeks.
|
|
(2)
|
Includes Net Sales at locations open greater than 12 months, including relocated and remodeled stores. Retail stores become comparable on the Monday following their 365
th
day of operation. Comparable store sales is intended only as supplemental information and is not a substitute for Net Sales or Net Earnings presented in accordance with generally accepted accounting principles.
|
N/A – Not Applicable
17
Results of Operations
For an understanding of the significant factors that influenced our performance during the past three fiscal years, the following discussion should be read in conjunction with the Consolidated Financial Statements and the Notes to Consolidated Financial Statements presented in this report.
Fiscal
2011
Compared to Fiscal
2010
Net Sales
Net Sales for fiscal
2011
increased
3.5%
to
$70.4 billion
from
$68.0 billion
for fiscal
2010
. The
increase
in Net Sales for fiscal
2011
reflects the impact of positive comparable store sales. Total comparable store sales increased
3.4%
for fiscal
2011
compared to an increase of
2.9%
for fiscal
2010
.
The positive comparable store sales for fiscal
2011
reflect a number of factors including the execution of our key initiatives, economic growth and favorable weather conditions. We experienced positive comparable store sales in 12 of our 14 departments for fiscal
2011
. Comparable store sales for our Building Materials, Paint, Hardware, Tools, Plumbing, Electrical and Kitchen product categories were above the Company average for fiscal
2011
. Comparable store sales for our Flooring, Bath, Lighting, Outdoor Garden and Indoor Garden product categories were positive for fiscal
2011
. Comparable store sales for our Lumber and Millwork product categories were negative for fiscal
2011
. The increase in comparable store sales also reflects a 2.6% increase in our comparable store average ticket and an 0.8% increase in our comparable store customer transactions.
We believe that our sales performance has been, and could continue to be, negatively impacted by the level of competition that we encounter in various markets. We estimate our share of the U.S. home improvement market is approximately 25% using the U.S. Census Bureau’s North American Industry Classification System, or NAICS, 4441 classification for building material and supplies dealers.
Gross Profit
Gross Profit
increased
4.1%
to
$24.3 billion
for fiscal
2011
from
$23.3 billion
for fiscal
2010
. Gross Profit as a percent of Net Sales was
34.5%
for fiscal
2011
compared to
34.3%
for fiscal
2010
, an
increase
of
20
basis points. The increase in gross profit margin in fiscal
2011
was driven primarily by benefits arising from our supply chain transformation in the U.S., which was partially offset by higher shrink compared to last year.
Operating Expenses
Selling, General and Administrative expenses ("SG&A")
increased
1.1%
to
$16.0 billion
for fiscal
2011
from
$15.8 billion
for fiscal
2010
. As a percent of Net Sales, SG&A was
22.8%
for fiscal
2011
compared to
23.3%
for fiscal
2010
. The
decrease
in SG&A as a percent of Net Sales for fiscal
2011
reflects expense leverage in the positive comparable store sales environment partially offset by a $32 million impairment charge for a non-core carpet cleaning and cabinet refinishing business that was sold in fiscal 2011 and $26 million of expenses related to natural disasters. Additionally, we experienced an expense benefit of $44 million in fiscal 2010 related to our private label credit card that did not repeat in fiscal 2011.
Depreciation and Amortization was
$1.6 billion
for both fiscal
2011
and
2010
. Depreciation and Amortization as a percent of Net Sales was
2.2%
for fiscal
2011
compared to
2.4%
for fiscal
2010
. The
decrease
in Depreciation and Amortization as a percent of Net Sales reflects expense leverage in the positive comparable store sales environment and an increase in fully depreciated assets.
Operating Income
Operating Income
increased
14.1%
to
$6.7 billion
for fiscal
2011
from
$5.8 billion
for fiscal
2010
. Operating Income as a percent of Net Sales was
9.5%
for fiscal
2011
compared to
8.6%
for fiscal
2010
.
Interest and Other, net
In fiscal
2011
, we recognized
$593 million
of Interest and Other, net, compared to
$566 million
for fiscal
2010
. Interest and Other, net, as a percent of Net Sales was
0.8%
for both fiscal
2011
and
2010
. Interest and Other, net, for fiscal 2010 reflects a $51 million pretax charge related to the extension of our guarantee of a senior secured loan of HD Supply, Inc. (the "HD Supply Guarantee Extension"). Additionally, we experienced a $44 million benefit in fiscal 2010 that arose from favorable Internal Revenue Service ("IRS") guidance and a resulting reversal of an interest accrual.
18
Provision for Income Taxes
Our combined effective income tax rate
decreased
to
36.0%
for fiscal
2011
from
36.7%
for fiscal
2010
. The effective income tax rate for fiscal 2011 reflects a benefit from the reversal of a valuation allowance related to the utilization of capital loss carryforwards as well as certain favorable state and local tax settlements.
Diluted Earnings per Share
Diluted Earnings per Share were
$2.47
for fiscal
2011
compared to
$2.01
for fiscal
2010
. Excluding the HD Supply Guarantee Extension charge from our fiscal 2010 results, Diluted Earnings per Share for fiscal 2010 were $2.03. Diluted Earnings per Share for fiscal
2011
reflect $0.13 of benefit from repurchases of our common stock in the twelve months ended January 29, 2012.
Non-GAAP Measures
To provide clarity, internally and externally, about our operating performance, we supplement our reporting with non-GAAP financial measures to reflect certain adjustments for fiscal 2010 and 2009. The results for fiscal 2010 included a $51 million pretax charge related to the HD Supply Guarantee Extension as described more fully in Note 3 to the Consolidated Financial Statements. The results for the fiscal year ended January 31, 2010 ("fiscal 2009") reflected the impact of several strategic actions initiated in fiscal 2008. These strategic actions resulted in store rationalization charges related to the closing of 15 underperforming U.S. stores and the removal of approximately 50 stores from our new store pipeline, business rationalization charges related to the exit of our EXPO, THD Design Center, Yardbirds and HD Bath businesses (the "Exited Businesses") and charges related to the restructuring of support functions (collectively, the "Rationalization Charges"), as described more fully in Note 2 to the Consolidated Financial Statements. These actions resulted in pretax Rationalization Charges of $146 million for fiscal 2009. The results for fiscal 2009 also included a pretax charge of $163 million to write-down our investment in HD Supply as described more fully in Note 3 to the Consolidated Financial Statements.
We believe these non-GAAP financial measures better enable management and investors to understand and analyze our performance by providing them with meaningful information relevant to events of unusual nature or frequency that impact the comparability of underlying business results from period to period. However, this supplemental information should not be considered in isolation or as a substitute for the related GAAP measures. There were no adjustments for fiscal 2011, and the following reconciles the non-GAAP financial measures to the corresponding GAAP measures for fiscal
2010
and
2009
(amounts in millions, except per share data):
|
|
Fiscal Year Ended January 30, 2011
|
|||||||||||||
|
|
As
Reported
|
Adjustment
|
Non-GAAP
Measures
|
% of
Net Sales
|
||||||||||
|
Net Sales
|
$
|
67,997
|
|
$
|
—
|
|
$
|
67,997
|
|
100.0
|
%
|
|||
|
Cost of Sales
|
44,693
|
|
—
|
|
44,693
|
|
65.7
|
|
||||||
|
Gross Profit
|
23,304
|
|
—
|
|
23,304
|
|
34.3
|
|
||||||
|
Operating Expenses:
|
||||||||||||||
|
Selling, General and Administrative
|
15,849
|
|
—
|
|
15,849
|
|
23.3
|
|
||||||
|
Depreciation and Amortization
|
1,616
|
|
—
|
|
1,616
|
|
2.4
|
|
||||||
|
Total Operating Expenses
|
17,465
|
|
—
|
|
17,465
|
|
25.7
|
|
||||||
|
Operating Income
|
5,839
|
|
—
|
|
5,839
|
|
8.6
|
|
||||||
|
Interest and Other, net
|
566
|
|
51
|
|
515
|
|
0.8
|
|
||||||
|
Earnings From Continuing Operations Before Provision
for Income Taxes
|
5,273
|
|
(51
|
)
|
5,324
|
|
7.8
|
|
||||||
|
Provision for Income Taxes
|
1,935
|
|
(18
|
)
|
1,953
|
|
2.9
|
|
||||||
|
Earnings from Continuing Operations
|
$
|
3,338
|
|
$
|
(33
|
)
|
$
|
3,371
|
|
5.0
|
%
|
|||
|
Diluted Earnings per Share from Continuing Operations
|
$
|
2.01
|
|
$
|
(0.02
|
)
|
$
|
2.03
|
|
N/A
|
|
|||
19
Non-GAAP Measures (continued):
|
|
Fiscal Year Ended January 31, 2010
|
|||||||||||||
|
|
As
Reported
|
Adjustments
|
Non-GAAP
Measures
|
% of
Net Sales
|
||||||||||
|
Net Sales
|
$
|
66,176
|
|
$
|
221
|
|
$
|
65,955
|
|
100.0
|
%
|
|||
|
Cost of Sales
|
43,764
|
|
193
|
|
43,571
|
|
66.1
|
|
||||||
|
Gross Profit
|
22,412
|
|
28
|
|
22,384
|
|
33.9
|
|
||||||
|
Operating Expenses:
|
||||||||||||||
|
Selling, General and Administrative
|
15,902
|
|
170
|
|
15,732
|
|
23.9
|
|
||||||
|
Depreciation and Amortization
|
1,707
|
|
4
|
|
1,703
|
|
2.6
|
|
||||||
|
Total Operating Expenses
|
17,609
|
|
174
|
|
17,435
|
|
26.4
|
|
||||||
|
Operating Income
|
4,803
|
|
(146
|
)
|
4,949
|
|
7.5
|
|
||||||
|
Interest and Other, net
|
821
|
|
163
|
|
658
|
|
1.0
|
|
||||||
|
Earnings From Continuing Operations Before Provision
for Income Taxes
|
3,982
|
|
(309
|
)
|
4,291
|
|
6.5
|
|
||||||
|
Provision for Income Taxes
|
1,362
|
|
(118
|
)
|
1,480
|
|
2.2
|
|
||||||
|
Earnings from Continuing Operations
|
$
|
2,620
|
|
$
|
(191
|
)
|
$
|
2,811
|
|
4.3
|
%
|
|||
|
Diluted Earnings per Share from Continuing Operations
|
$
|
1.55
|
|
$
|
(0.11
|
)
|
$
|
1.66
|
|
N/A
|
|
|||
Fiscal
2010
Compared to Fiscal
2009
Net Sales
Net Sales for fiscal 2010 increased 2.8% to $68.0 billion from $66.2 billion for fiscal 2009. The increase in Net Sales for fiscal 2010 reflects the impact of positive comparable store sales. Total comparable store sales increased 2.9% for fiscal 2010 compared to a decrease of 6.6% for fiscal 2009.
The increase in comparable store sales for fiscal 2010 reflects a number of factors. We experienced positive comparable store sales in 12 of our 14 departments for fiscal 2010. Comparable store sales for our Lumber, Tools, Electrical, Indoor Garden, Outdoor Garden and Kitchen product categories were above the Company average for fiscal 2010. The increase in comparable store sales also reflects a 2.4% increase in our comparable store customer transactions and a 0.5% increase in our comparable store average ticket.
Gross Profit
Gross Profit increased 4.0% to $23.3 billion for fiscal 2010 from $22.4 billion for fiscal 2009. Gross Profit as a percent of Net Sales was 34.3% for fiscal 2010 compared to 33.9% for fiscal 2009, an increase of 40 basis points. Our U.S. stores experienced gross profit margin expansion in fiscal 2010 as we realized benefits from better product assortment management through our portfolio approach and leveraging of our newly developed merchandising tools. Lower levels of clearance inventory in our stores for fiscal 2010 compared to fiscal 2009 also contributed to this expansion. Additionally, we realized gross profit margin expansion from our non-U.S. businesses, primarily Canada, due primarily to a change in the mix of products sold.
Operating Expenses
SG&A decreased 0.3% to $15.8 billion for fiscal 2010 from $15.9 billion for fiscal 2009. As a percent of Net Sales, SG&A was 23.3% for fiscal 2010 compared to 24.0% for fiscal 2009. Excluding the Rationalization Charges, SG&A as a percent of Net Sales was 23.9% for fiscal 2009. The decrease in SG&A as a percent of Net Sales for fiscal 2010 reflects expense leverage in the positive comparable store sales environment and lower payroll and other expenses.
Depreciation and Amortization decreased 5.3% to $1.6 billion for fiscal 2010 from $1.7 billion for fiscal 2009. Depreciation and Amortization as a percent of Net Sales was 2.4% for fiscal 2010 compared to 2.6% for fiscal 2009. The decrease in Depreciation and Amortization as a percent of Net Sales was primarily due to a smaller depreciable fixed asset base compared to fiscal 2009, arising from fully depreciated assets.
20
Operating Income
Operating Income increased 21.6% to $5.8 billion for fiscal 2010 from $4.8 billion for fiscal 2009. Operating Income as a percent of Net Sales was 8.6% for fiscal 2010 compared to 7.3% for fiscal 2009. Excluding the Rationalization Charges from the results of fiscal 2009, Operating Income increased 18.0% for fiscal 2010.
Interest and Other, net
In fiscal 2010, we recognized $566 million of Interest and Other, net, compared to $821 million for fiscal 2009. Interest and Other, net, as a percent of Net Sales was 0.8% for fiscal 2010 compared to 1.2% for fiscal 2009. Interest and Other, net, reflects a $51 million charge in fiscal 2010 related to the HD Supply Guarantee Extension and a $163 million charge in fiscal 2009 to write-down our investment in HD Supply. Excluding these charges, Interest and Other, net, as a percent of Net Sales was 0.8% for fiscal 2010 compared to 1.0% for fiscal 2009. This decrease was primarily due to a $44 million benefit arising from favorable IRS guidance resulting in the reversal of an interest accrual during fiscal 2010, a lower cost of outstanding indebtedness than fiscal 2009 and an interest benefit arising from certain state income tax settlements.
Provision for Income Taxes
Our combined effective income tax rate for continuing operations increased to 36.7% for fiscal 2010 from 34.2% for fiscal 2009. The effective income tax rate for fiscal 2009 included benefits arising from a favorable foreign tax settlement and a realignment of our foreign corporate structure.
Diluted Earnings per Share from Continuing Operations
Diluted Earnings per Share from Continuing Operations were $2.01 for fiscal 2010 and $1.55 for fiscal 2009. Excluding the HD Supply Guarantee Extension charge from our fiscal 2010 results, and the Rationalization Charges and the write-down of our investment in HD Supply from our fiscal 2009 results, Diluted Earnings per Share from Continuing Operations for fiscal 2010 were $2.03 compared to $1.66 for fiscal 2009, an increase of 22.3%. Diluted Earnings per Share from Continuing Operations for fiscal 2010 reflect $0.04 of benefit from repurchases of our common stock.
Discontinued Operations
On August 30, 2007, we closed the sale of HD Supply. Discontinued operations for fiscal 2009 consist of earnings of $41 million, net of tax, or $0.02 per diluted share, for the settlement of working capital matters arising from the sale of HD Supply.
Liquidity and Capital Resources
Cash flow generated from operations provides us with a significant source of liquidity. For fiscal
2011
, Net Cash Provided by Operating Activities was $
6.7 billion
compared to $
4.6 billion
for fiscal
2010
. This increase was primarily a result of an increase in Net Earnings, changes in inventory levels and other net working capital items.
Net Cash Used in Investing Activities for fiscal
2011
was $
1.1 billion
compared to $
1.0 billion
for fiscal
2010
. This change was primarily due to increased Capital Expenditures and Payments for Business Acquired related to the purchase of an online home services platform, partially offset by Proceeds from Sale of Business related to the sale of a non-core carpet cleaning and cabinet refinishing business. In fiscal
2011
, we spent $
1.2 billion
on Capital Expenditures, allocated as follows: 35% for core technology, 17% for maintenance, 17% for merchandising and operations, 11% for new stores and 20% for other initiatives.
Net Cash Used in Financing Activities for fiscal
2011
was $
4.0 billion
compared to $
4.5 billion
for fiscal
2010
. In March 2011, we issued $1.0 billion of 4.40% Senior Notes due April 1, 2021 at a discount of $2 million and $1.0 billion of 5.95% Senior Notes due April 1, 2041 at a discount of $4 million (together, the "March 2011 issuance"). Interest on these Senior Notes is due semi-annually on April 1 and October 1 of each year, beginning October 1, 2011. The net proceeds of the March 2011 issuance were used to repurchase $1.0 billion of our common stock under an Accelerated Share Repurchase ("ASR") agreement, and the balance of the net proceeds was used to repay our 5.20% Senior Notes that matured March 1, 2011 in the aggregate principal amount of $1.0 billion.
In connection with the March 2011 issuance, we entered into an ASR agreement with a third-party financial institution to repurchase $1.0 billion of our common stock. Under the agreement, we paid $1.0 billion to the financial institution and received a total of 27 million shares in fiscal 2011. Also in fiscal 2011, we repurchased an additional 70 million shares of our common stock for $2.5 billion through the open market. Since the inception of our share repurchase program in 2002, we
21
have repurchased 931 million shares of our common stock for a total of $33.6 billion. As of January 29, 2012, $6.4 billion remained under our share repurchase authorization.
In May 2010, we entered into a forward starting interest rate swap agreement with a notional amount of $500 million, which was accounted for as a cash flow hedge, to hedge interest rate fluctuations in anticipation of the March 2011 issuance. Upon the March 2011 issuance, we settled this forward starting interest rate swap agreement for an immaterial amount.
We have commercial paper programs that allow for borrowings up to $2.0 billion. In connection with the programs, we have a back-up credit facility with a consortium of banks for borrowings up to $2.0 billion. As of
January 29, 2012
, there were no borrowings outstanding under the commercial paper programs or the related credit facility. The credit facility expires in July 2013 and contains various restrictive covenants. As of
January 29, 2012
, we were in compliance with all of the covenants, and they are not expected to impact our liquidity or capital resources.
We use capital and operating leases to finance a portion of our real estate, including our stores, distribution centers and store support centers. The net present value of capital lease obligations is reflected in our Consolidated Balance Sheets in Long-Term Debt and Current Installments of Long-Term Debt. In accordance with generally accepted accounting principles, the operating leases are not reflected in our Consolidated Balance Sheets.
As of
January 29, 2012
, we guaranteed a $1.0 billion senior secured amortizing term loan in connection with the sale of HD Supply. We are responsible for up to $1.0 billion and any unpaid interest in the event of nonpayment by HD Supply. As reported in the quarterly report on Form 10-Q of HD Supply for the period ended
October 30, 2011
, the outstanding balance of this term loan as of
October 30, 2011
was $
930 million
. The guaranteed loan is collateralized by certain assets of HD Supply. The original expiration date of the guarantee was August 30, 2012. On March 19, 2010, we amended the guarantee to extend the expiration date to April 1, 2014. The fair value of the guarantee at August 30, 2007 was $16 million and was recorded as a liability in Other Long-Term Liabilities. The extension of the guarantee increased the fair value of the guarantee to $67 million, resulting in a $51 million charge to Interest and Other, net, for fiscal 2010.
As of
January 29, 2012
, we had $
2.0 billion
in Cash and Cash Equivalents. We believe that our current cash position, access to the debt capital markets and cash flow generated from operations should be sufficient to enable us to complete our capital expenditure programs and fund dividend payments, share repurchases and any required long-term debt payments through the next several fiscal years. In addition, we have funds available from our commercial paper programs and the ability to obtain alternative sources of financing.
In March 2011, we entered into an interest rate swap that expires on March 1, 2016, with a notional amount of $500 million, accounted for as a fair value hedge, that swaps fixed rate interest on our 5.40% Senior Notes due March 1, 2016 for variable interest equal to LIBOR plus 300 basis points. At
January 29, 2012
, the approximate fair value of this agreement was an asset of $39 million, which is the estimated amount we would have received to settle the agreement.
Also at
January 29, 2012
, we had outstanding interest rate swaps, accounted for as fair value hedges, that expire on December 16, 2013 with a notional amount of $1.25 billion that swap fixed rate interest on our $1.25 billion 5.25% Senior Notes due December 16, 2013 for variable interest equal to LIBOR plus 259 basis points. At
January 29, 2012
, the approximate fair value of these agreements was an asset of $52 million, which is the estimated amount we would have received to settle the agreements.
In March 2012, we entered into an ASR agreement with a third-party financial institution to repurchase $1.0 billion of our common stock. Under the agreement, we paid $1.0 billion to the financial institution, using cash on hand, and received an initial delivery of approximately
17 million
shares in the first quarter of fiscal 2012. The final number of shares delivered upon settlement of the agreement will be determined with reference to the average price of our common stock over the term of the ASR agreement.
22
Off-Balance Sheet Arrangements
In accordance with generally accepted accounting principles, operating leases for a portion of our real estate and other assets are not reflected in our Consolidated Balance Sheets.
Contractual Obligations
The following table summarizes our significant contractual obligations as of
January 29, 2012
(amounts in millions):
|
|
Payments Due by Fiscal Year
|
||||||||||||||||||
|
Contractual Obligations
|
Total
|
2012
|
2013-2014
|
2015-2016
|
Thereafter
|
||||||||||||||
|
Total Debt
(1)
|
$
|
18,660
|
|
$
|
522
|
|
$
|
2,259
|
|
$
|
3,899
|
|
$
|
11,980
|
|
||||
|
Capital Lease Obligations
(2)
|
1,259
|
|
106
|
|
204
|
|
183
|
|
766
|
|
|||||||||
|
Operating Leases
|
7,999
|
|
800
|
|
1,428
|
|
1,194
|
|
4,577
|
|
|||||||||
|
Purchase Obligations
(3)
|
3,412
|
|
1,602
|
|
1,805
|
|
5
|
|
—
|
|
|||||||||
|
Unrecognized Tax Benefits
(4)
|
97
|
|
97
|
|
—
|
|
—
|
|
—
|
|
|||||||||
|
Total
|
$
|
31,427
|
|
$
|
3,127
|
|
$
|
5,696
|
|
$
|
5,281
|
|
$
|
17,323
|
|
||||
—————
|
(1)
|
Excludes present value of capital lease obligations of $449 million. Includes $8.3 billion of interest payments.
|
|
(2)
|
Includes $
810 million
of imputed interest.
|
|
(3)
|
Purchase obligations include all legally binding contracts such as firm commitments for inventory purchases, utility purchases, capital expenditures, software acquisitions and license commitments and legally binding service contracts. Purchase orders that are not binding agreements are excluded from the table above.
|
|
(4)
|
Excludes $524 million of noncurrent unrecognized tax benefits due to uncertainty regarding the timing of future cash payments.
|
Quantitative and Qualitative Disclosures about Market Risk
Our exposure to market risk results primarily from fluctuations in interest rates. Interest rate swap agreements are used, at times, to manage our fixed/floating rate debt portfolio. At
January 29, 2012
, after giving consideration to our interest rate swap agreements, approximately 82% of our debt portfolio was comprised of fixed-rate debt and 18% was floating-rate debt. A 1.0 percentage point change in the interest costs of floating-rate debt would not have a material impact on our results of operations.
As of
January 29, 2012
we had, net of discounts, $
10.3 billion
of Senior Notes outstanding. The aggregate market value of these publicly traded Senior Notes as of
January 29, 2012
was approximately $
12.1 billion
.
Although we have international operating entities, our exposure to foreign currency rate fluctuations is not significant to our financial condition or results of operations.
Impact of Inflation, Deflation and Changing Prices
We have experienced inflation and deflation related to our purchase of certain commodity products. We do not believe that changing prices for commodities have had a material effect on our Net Sales or results of operations. Although we cannot precisely determine the overall effect of inflation and deflation on operations, we do not believe inflation and deflation have had a material effect on our results of operations.
23
Critical Accounting Policies
Our significant accounting policies are disclosed in Note 1 to the Consolidated Financial Statements. The following discussion addresses our most critical accounting policies, which are those that are both important to the portrayal of our financial condition and results of operations and that require significant judgment or use of significant assumptions or complex estimates.
Revenues
We recognize revenue, net of estimated returns and sales tax, at the time the customer takes possession of merchandise or receives services. We estimate the liability for sales returns based on our historical return levels. We believe that our estimate for sales returns is an accurate reflection of future returns. We have never recorded a significant adjustment to our estimated liability for sales returns. However, if these estimates are significantly below the actual amounts, our sales could be adversely impacted. When we receive payment from customers before the customer has taken possession of the merchandise or the service has been performed, the amount received is recorded as Deferred Revenue in the accompanying Consolidated Balance Sheets until the sale or service is complete. We also record Deferred Revenue for the sale of gift cards and recognize this revenue upon the redemption of gift cards in Net Sales.
Merchandise Inventories
Our Merchandise Inventories are stated at the lower of cost (first-in, first-out) or market, with approximately
81%
valued under the retail inventory method and the remainder under a cost method. Retailers like us, with many different types of merchandise at low unit cost and a large number of transactions, frequently use the retail inventory method. Under the retail inventory method, Merchandise Inventories are stated at cost, which is determined by applying a cost-to-retail ratio to the ending retail value of inventories. As our inventory retail value is adjusted regularly to reflect market conditions, our inventory valued under the retail method approximates the lower of cost or market. We evaluate our inventory valued under a cost method at the end of each quarter to ensure that it is carried at the lower of cost or market. The valuation allowance for Merchandise Inventories valued under a cost method was not material to our Consolidated Financial Statements as of the end of fiscal
2011
or
2010
.
Independent physical inventory counts or cycle counts are taken on a regular basis in each store and distribution center to ensure that amounts reflected in the accompanying Consolidated Financial Statements for Merchandise Inventories are properly stated. During the period between physical inventory counts in our stores, we accrue for estimated losses related to shrink on a store-by-store basis. Shrink (or in the case of excess inventory, "swell") is the difference between the recorded amount of inventory and the physical inventory. Shrink may occur due to theft, loss, inaccurate records for the receipt of inventory or deterioration of goods, among other things. We estimate shrink as a percent of Net Sales using the average shrink results from the previous two physical inventories. The estimates are evaluated quarterly and adjusted based on recent shrink results and current trends in the business. Actual shrink results did not vary materially from estimated amounts for fiscal
2011
,
2010
or
2009
.
Self-Insurance
We are self-insured for certain losses related to general liability, workers’ compensation, medical, product liability and automobile claims. Our liability represents an estimate of the ultimate cost for claims incurred as of the balance sheet date. The estimated liability is not discounted and is established based upon analysis of historical data and actuarial estimates, and is reviewed by management and third-party actuaries on a regular basis to ensure that the liability is appropriate. While we believe these estimates are reasonable based on the information currently available, if actual trends, including the severity or frequency of claims, medical cost inflation or fluctuations in premiums, differ from our estimates, our results of operations could be impacted. Actual results related to these types of claims did not vary materially from estimated amounts for fiscal
2011
,
2010
or
2009
.
Vendor Allowances
Vendor allowances primarily consist of volume rebates that are earned as a result of attaining certain purchase levels and advertising co-op allowances for the promotion of vendors’ products that are typically based on guaranteed minimum amounts with additional amounts being earned for attaining certain purchase levels. These vendor allowances are accrued as earned, with those allowances received as a result of attaining certain purchase levels accrued over the incentive period based on estimates of purchases. We believe that our estimate of vendor allowances earned based on expected volume of purchases over the incentive period is an accurate reflection of the ultimate allowance to be received from our vendors.
24
Volume rebates and certain advertising co-op allowances earned are initially recorded as a reduction in Merchandise Inventories and a subsequent reduction in Cost of Sales when the related product is sold. Certain advertising co-op allowances that are reimbursements of specific, incremental and identifiable costs incurred to promote vendors’ products are recorded as an offset against advertising expense in SG&A.
Impairment of Long-Lived Assets
We evaluate our long-lived assets each quarter for indicators of potential impairment. Indicators of impairment include current period losses combined with a history of losses, management’s decision to relocate or close a store or other location before the end of its previously estimated useful life or when changes in other circumstances indicate the carrying amount of an asset may not be recoverable. The evaluation for long-lived assets is performed at the lowest level of identifiable cash flows, which is generally the individual store level.
The assets of a store with indicators of impairment are evaluated by comparing its undiscounted cash flows with its carrying value. The estimate of cash flows includes management’s assumptions of cash inflows and outflows directly resulting from the use of those assets in operations, including gross margin on Net Sales, payroll and related items, occupancy costs, insurance allocations and other costs to operate a store. If the carrying value is greater than the undiscounted cash flows, an impairment loss is recognized for the difference between the carrying value and the estimated fair market value. Impairment losses are recorded as a component of SG&A in the accompanying Consolidated Statements of Earnings. When a leased location closes, we also recognize in SG&A the net present value of future lease obligations less estimated sublease income.
We make critical assumptions and estimates in completing impairment assessments of long-lived assets. Our cash flow projections look several years into the future and include assumptions on variables such as future sales and operating margin growth rates, economic conditions, market competition and inflation. A 10% decrease in the estimated undiscounted cash flows for the stores with indicators of impairment would not have a material impact on our results of operations. Our estimates of fair market value are generally based on market appraisals of owned locations and estimates on the amount of potential sublease income and the time required to sublease for leased locations.
As part of our Rationalization Charges, we recorded no material lease obligation costs in fiscal 2011 and 2010 and recorded $84 million of lease obligation costs in fiscal 2009. See Note 2 to the Consolidated Financial Statements for more details on the Rationalization Charges. A 10% decrease in estimated sublease income and a 10% increase in the time required to sublease would not have a material impact on our results of operations. We also recorded impairments and other lease obligation costs on other closings and relocations in the ordinary course of business, which were not material to the Consolidated Financial Statements in fiscal
2011
,
2010
or
2009
.
Goodwill and Other Intangible Assets
Goodwill represents the excess of purchase price over the fair value of net assets acquired. We do not amortize goodwill but do assess the recoverability of goodwill in the third quarter of each fiscal year, or more often if indicators warrant, by determining whether the fair value of each reporting unit supports its carrying value. The fair values of our identified reporting units were estimated using the present value of expected future discounted cash flows.
We make critical assumptions and estimates in completing impairment assessments of goodwill and other intangible assets. Our cash flow projections look several years into the future and include assumptions on variables such as future sales and operating margin growth rates, economic conditions, market competition, inflation and discount rates. A 10% decrease in the estimated discounted cash flows for the reporting units tested would result in an impairment that is not material to our results of operations. A 1.0 percentage point increase in the discount rate used would also result in an impairment that is not material to our results of operations.
We amortize the cost of other intangible assets over their estimated useful lives, which range up to
ten
years, unless such lives are deemed indefinite. Intangible assets with indefinite lives are tested in the third quarter of each fiscal year for impairment, or more often if indicators warrant. Impairment charges related to goodwill and other intangible assets were not material for fiscal
2011
,
2010
or
2009
.
25
Recent Accounting Pronouncements
In June 2011, the Financial Accounting Standards Board ("FASB") issued Accounting Standards Update No. 2011-05, "Comprehensive Income (Topic 220): Presentation of Comprehensive Income" ("ASU No. 2011-05"). ASU No. 2011-05 eliminates the current option to report other comprehensive income and its components in the Consolidated Statements of Stockholders' Equity and Comprehensive Income. Under ASU No. 2011-05, an entity can elect to present items of net earnings and other comprehensive income in one continuous statement or in two separate, but consecutive, statements. This guidance is effective for publicly traded companies for annual reporting periods beginning after December 15, 2011 and for interim and annual reporting periods thereafter, and retrospective application is required. As we report other comprehensive income within the Consolidated Statements of Stockholders' Equity and Comprehensive Income, the adoption of ASU No. 2011-05 will impact the presentation of our Consolidated Financial Statements beginning in the first quarter of fiscal 2012.
In June 2009, the FASB issued "Amendments to FASB Interpretation No. 46(R)" ("FASB ASC Subtopic 810-10"), which clarifies that the determination of whether a company is required to consolidate an entity is based on, among other things, an entity’s purpose and design and a company’s ability to direct the activities of the entity that most significantly impact the entity’s economic performance. FASB ASC Subtopic 810-10 requires ongoing reassessments of whether a company is the primary beneficiary of a variable interest entity and eliminates the qualifying special purpose entity concept. FASB ASC Subtopic 810-10 also requires additional disclosures about a company’s involvement in variable interest entities and any significant changes in risk exposure due to that involvement. This guidance was effective for annual reporting periods beginning after November 15, 2009, for interim periods within that first annual reporting period, and for interim and annual reporting periods thereafter. This guidance did not have a material impact on our consolidated financial statements.
The information required by this item is incorporated by reference to Item 7, "Management’s Discussion and Analysis of Financial Condition and Results of Operations" of this report.
26
Management’s Responsibility for Financial Statements
The financial statements presented in this Annual Report have been prepared with integrity and objectivity and are the responsibility of the management of The Home Depot, Inc. These financial statements have been prepared in conformity with U.S. generally accepted accounting principles and properly reflect certain estimates and judgments based upon the best available information.
The financial statements of the Company have been audited by KPMG LLP, an independent registered public accounting firm. Their accompanying report is based upon an audit conducted in accordance with the standards of the Public Company Accounting Oversight Board (United States).
The Audit Committee of the Board of Directors, consisting solely of independent directors, meets five times a year with the independent registered public accounting firm, the internal auditors and representatives of management to discuss auditing and financial reporting matters. In addition, a telephonic meeting is held prior to each quarterly earnings release. The Audit Committee retains the independent registered public accounting firm and regularly reviews the internal accounting controls, the activities of the independent registered public accounting firm and internal auditors and the financial condition of the Company. Both the Company’s independent registered public accounting firm and the internal auditors have free access to the Audit Committee.
Management’s Report on Internal Control Over Financial Reporting
Our management is responsible for establishing and maintaining adequate internal control over financial reporting, as such term is defined in Rule 13a-15(f) promulgated under the Securities Exchange Act of 1934, as amended (the "Exchange Act"). Under the supervision and with the participation of our management, including our Chief Executive Officer and Chief Financial Officer, we conducted an evaluation of the effectiveness of our internal control over financial reporting as of
January 29, 2012
based on the framework in
Internal Control – Integrated Framework
issued by the Committee of Sponsoring Organizations of the Treadway Commission (COSO). Based on our evaluation, our management concluded that our internal control over financial reporting was effective as of
January 29, 2012
in providing reasonable assurance regarding the reliability of financial reporting and the preparation of financial statements for external purposes in accordance with U.S. generally accepted accounting principles. The effectiveness of our internal control over financial reporting as of
January 29, 2012
has been audited by KPMG LLP, an independent registered public accounting firm, as stated in their report which is included on page 28 in this Form 10-K.
|
/s/ F
RANCIS
S. B
LAKE
|
|
/s/ C
AROL
B. T
OMÉ
|
|
Francis S. Blake
Chairman &
Chief Executive Officer
|
|
Carol B. Tomé
Chief Financial Officer &
Executive Vice President – Corporate Services
|
27
Report of Independent Registered Public Accounting Firm
The Board of Directors and Stockholders
The Home Depot, Inc.:
We have audited The Home Depot, Inc.’s internal control over financial reporting as of
January 29, 2012
, based on criteria established in
Internal Control – Integrated Framework
issued by the Committee of Sponsoring Organizations of the Treadway Commission (COSO). The Home Depot, Inc.’s management is responsible for maintaining effective internal control over financial reporting and for its assessment of the effectiveness of internal control over financial reporting, included in the accompanying Management’s Report on Internal Control Over Financial Reporting. Our responsibility is to express an opinion on the Company’s internal control over financial reporting based on our audit.
We conducted our audit in accordance with the standards of the Public Company Accounting Oversight Board (United States). Those standards require that we plan and perform the audit to obtain reasonable assurance about whether effective internal control over financial reporting was maintained in all material respects. Our audit included obtaining an understanding of internal control over financial reporting, assessing the risk that a material weakness exists, and testing and evaluating the design and operating effectiveness of internal control based on the assessed risk. Our audit also included performing such other procedures as we considered necessary in the circumstances. We believe that our audit provides a reasonable basis for our opinion.
A company’s internal control over financial reporting is a process designed to provide reasonable assurance regarding the reliability of financial reporting and the preparation of financial statements for external purposes in accordance with generally accepted accounting principles. A company’s internal control over financial reporting includes those policies and procedures that (1) pertain to the maintenance of records that, in reasonable detail, accurately and fairly reflect the transactions and dispositions of the assets of the company; (2) provide reasonable assurance that transactions are recorded as necessary to permit preparation of financial statements in accordance with generally accepted accounting principles, and that receipts and expenditures of the company are being made only in accordance with authorizations of management and directors of the company; and (3) provide reasonable assurance regarding prevention or timely detection of unauthorized acquisition, use, or disposition of the company’s assets that could have a material effect on the financial statements.
Because of its inherent limitations, internal control over financial reporting may not prevent or detect misstatements. Also, projections of any evaluation of effectiveness to future periods are subject to the risk that controls may become inadequate because of changes in conditions, or that the degree of compliance with the policies or procedures may deteriorate.
In our opinion, The Home Depot, Inc. maintained, in all material respects, effective internal control over financial reporting as of
January 29, 2012
, based on criteria established in
Internal Control – Integrated Framework
issued by the Committee of Sponsoring Organizations of the Treadway Commission.
We also have audited, in accordance with the standards of the Public Company Accounting Oversight Board (United States), the Consolidated Balance Sheets of The Home Depot, Inc. and subsidiaries as of
January 29, 2012
and
January 30, 2011
, and the related Consolidated Statements of Earnings, Stockholders’ Equity and Comprehensive Income, and Cash Flows for each of the fiscal years in the three-year period ended
January 29, 2012
, and our report dated
March 22, 2012
expressed an unqualified opinion on those consolidated financial statements.
/s/ KPMG LLP
Atlanta, Georgia
March 22, 2012
28
Report of Independent Registered Public Accounting Firm
The Board of Directors and Stockholders
The Home Depot, Inc.:
We have audited the accompanying Consolidated Balance Sheets of The Home Depot, Inc. and subsidiaries as of
January 29, 2012
and
January 30, 2011
, and the related Consolidated Statements of Earnings, Stockholders’ Equity and Comprehensive Income, and Cash Flows for each of the fiscal years in the three-year period ended
January 29, 2012
. These Consolidated Financial Statements are the responsibility of the Company’s management. Our responsibility is to express an opinion on these Consolidated Financial Statements based on our audits.
We conducted our audits in accordance with the standards of the Public Company Accounting Oversight Board (United States). Those standards require that we plan and perform the audit to obtain reasonable assurance about whether the financial statements are free of material misstatement. An audit includes examining, on a test basis, evidence supporting the amounts and disclosures in the financial statements. An audit also includes assessing the accounting principles used and significant estimates made by management, as well as evaluating the overall financial statement presentation. We believe that our audits provide a reasonable basis for our opinion.
In our opinion, the Consolidated Financial Statements referred to above present fairly, in all material respects, the financial position of The Home Depot, Inc. and subsidiaries as of
January 29, 2012
and
January 30, 2011
, and the results of their operations and their cash flows for each of the fiscal years in the three-year period ended
January 29, 2012
, in conformity with U.S. generally accepted accounting principles.
We also have audited, in accordance with the standards of the Public Company Accounting Oversight Board (United States), The Home Depot, Inc.’s internal control over financial reporting as of
January 29, 2012
, based on criteria established in
Internal Control – Integrated Framework
issued by the Committee of Sponsoring Organizations of the Treadway Commission (COSO), and our report dated
March 22, 2012
expressed an unqualified opinion on the effectiveness of the Company’s internal control over financial reporting.
/s/ KPMG LLP
Atlanta, Georgia
March 22, 2012
29
THE HOME DEPOT, INC. AND SUBSIDIARIES
CONSOLIDATED STATEMENTS OF EARNINGS
|
|
Fiscal Year Ended
(1)
|
||||||||||
|
amounts in millions, except per share data
|
January 29,
2012 |
January 30,
2011 |
January 31,
2010 |
||||||||
|
NET SALES
|
$
|
70,395
|
|
$
|
67,997
|
|
$
|
66,176
|
|
||
|
Cost of Sales
|
46,133
|
|
44,693
|
|
43,764
|
|
|||||
|
GROSS PROFIT
|
24,262
|
|
23,304
|
|
22,412
|
|
|||||
|
Operating Expenses:
|
|||||||||||
|
Selling, General and Administrative
|
16,028
|
|
15,849
|
|
15,902
|
|
|||||
|
Depreciation and Amortization
|
1,573
|
|
1,616
|
|
1,707
|
|
|||||
|
Total Operating Expenses
|
17,601
|
|
17,465
|
|
17,609
|
|
|||||
|
OPERATING INCOME
|
6,661
|
|
5,839
|
|
4,803
|
|
|||||
|
Interest and Other (Income) Expense:
|
|||||||||||
|
Interest and Investment Income
|
(13
|
)
|
(15
|
)
|
(18
|
)
|
|||||
|
Interest Expense
|
606
|
|
530
|
|
676
|
|
|||||
|
Other
|
—
|
|
51
|
|
163
|
|
|||||
|
Interest and Other, net
|
593
|
|
566
|
|
821
|
|
|||||
|
EARNINGS FROM CONTINUING OPERATIONS BEFORE PROVISION FOR INCOME TAXES
|
6,068
|
|
5,273
|
|
3,982
|
|
|||||
|
Provision for Income Taxes
|
2,185
|
|
1,935
|
|
1,362
|
|
|||||
|
EARNINGS FROM CONTINUING OPERATIONS
|
3,883
|
|
3,338
|
|
2,620
|
|
|||||
|
EARNINGS FROM DISCONTINUED OPERATIONS, NET OF TAX
|
—
|
|
—
|
|
41
|
|
|||||
|
NET EARNINGS
|
$
|
3,883
|
|
$
|
3,338
|
|
$
|
2,661
|
|
||
|
Weighted Average Common Shares
|
1,562
|
|
1,648
|
|
1,683
|
|
|||||
|
BASIC EARNINGS PER SHARE FROM CONTINUING OPERATIONS
|
$
|
2.49
|
|
$
|
2.03
|
|
$
|
1.56
|
|
||
|
BASIC EARNINGS PER SHARE FROM DISCONTINUED OPERATIONS
|
$
|
—
|
|
$
|
—
|
|
$
|
0.02
|
|
||
|
BASIC EARNINGS PER SHARE
|
$
|
2.49
|
|
$
|
2.03
|
|
$
|
1.58
|
|
||
|
Diluted Weighted Average Common Shares
|
1,570
|
|
1,658
|
|
1,692
|
|
|||||
|
DILUTED EARNINGS PER SHARE FROM CONTINUING OPERATIONS
|
$
|
2.47
|
|
$
|
2.01
|
|
$
|
1.55
|
|
||
|
DILUTED EARNINGS PER SHARE FROM DISCONTINUED OPERATIONS
|
$
|
—
|
|
$
|
—
|
|
$
|
0.02
|
|
||
|
DILUTED EARNINGS PER SHARE
|
$
|
2.47
|
|
$
|
2.01
|
|
$
|
1.57
|
|
||
—————
|
(1)
|
Fiscal years ended
January 29, 2012
,
January 30, 2011
and
January 31, 2010
include 52 weeks.
|
See accompanying Notes to Consolidated Financial Statements.
30
THE HOME DEPOT, INC. AND SUBSIDIARIES
|
amounts in millions, except share and per share data
|
January 29,
2012 |
January 30,
2011 |
|||||
|
ASSETS
|
|||||||
|
Current Assets:
|
|||||||
|
Cash and Cash Equivalents
|
$
|
1,987
|
|
$
|
545
|
|
|
|
Receivables, net
|
1,245
|
|
1,085
|
|
|||
|
Merchandise Inventories
|
10,325
|
|
10,625
|
|
|||
|
Other Current Assets
|
963
|
|
1,224
|
|
|||
|
Total Current Assets
|
14,520
|
|
13,479
|
|
|||
|
Property and Equipment, at cost:
|
|||||||
|
Land
|
8,480
|
|
8,497
|
|
|||
|
Buildings
|
17,737
|
|
17,606
|
|
|||
|
Furniture, Fixtures and Equipment
|
10,040
|
|
9,687
|
|
|||
|
Leasehold Improvements
|
1,372
|
|
1,373
|
|
|||
|
Construction in Progress
|
758
|
|
654
|
|
|||
|
Capital Leases
|
588
|
|
568
|
|
|||
|
38,975
|
|
38,385
|
|
||||
|
Less Accumulated Depreciation and Amortization
|
14,527
|
|
13,325
|
|
|||
|
Net Property and Equipment
|
24,448
|
|
25,060
|
|
|||
|
Notes Receivable
|
135
|
|
139
|
|
|||
|
Goodwill
|
1,120
|
|
1,187
|
|
|||
|
Other Assets
|
295
|
|
260
|
|
|||
|
Total Assets
|
$
|
40,518
|
|
$
|
40,125
|
|
|
|
LIABILITIES AND STOCKHOLDERS’ EQUITY
|
|||||||
|
Current Liabilities:
|
|||||||
|
Accounts Payable
|
$
|
4,856
|
|
$
|
4,717
|
|
|
|
Accrued Salaries and Related Expenses
|
1,372
|
|
1,290
|
|
|||
|
Sales Taxes Payable
|
391
|
|
368
|
|
|||
|
Deferred Revenue
|
1,147
|
|
1,177
|
|
|||
|
Income Taxes Payable
|
23
|
|
13
|
|
|||
|
Current Installments of Long-Term Debt
|
30
|
|
1,042
|
|
|||
|
Other Accrued Expenses
|
1,557
|
|
1,515
|
|
|||
|
Total Current Liabilities
|
9,376
|
|
10,122
|
|
|||
|
Long-Term Debt, excluding current installments
|
10,758
|
|
8,707
|
|
|||
|
Other Long-Term Liabilities
|
2,146
|
|
2,135
|
|
|||
|
Deferred Income Taxes
|
340
|
|
272
|
|
|||
|
Total Liabilities
|
22,620
|
|
21,236
|
|
|||
|
STOCKHOLDERS’ EQUITY
|
|||||||
|
Common Stock, par value $0.05; authorized: 10 billion shares; issued: 1.733 billion shares at January 29, 2012 and 1.722 billion shares at January 30, 2011; outstanding: 1.537 billion shares at January 29, 2012 and 1.623 billion shares at January 30, 2011
|
87
|
|
86
|
|
|||
|
Paid-In Capital
|
6,966
|
|
6,556
|
|
|||
|
Retained Earnings
|
17,246
|
|
14,995
|
|
|||
|
Accumulated Other Comprehensive Income
|
293
|
|
445
|
|
|||
|
Treasury Stock, at cost, 196 million shares at January 29, 2012 and 99 million shares at January 30, 2011
|
(6,694
|
)
|
(3,193
|
)
|
|||
|
Total Stockholders’ Equity
|
17,898
|
|
18,889
|
|
|||
|
Total Liabilities and Stockholders’ Equity
|
$
|
40,518
|
|
$
|
40,125
|
|
|
31
THE HOME DEPOT, INC. AND SUBSIDIARIES
|
Accumulated Other
Comprehensive Income (Loss) |
|||||||||||||||||||||||||||||||||
|
|
Common Stock
|
Paid-In
Capital
|
Retained
Earnings
|
Treasury Stock
|
Stockholders’
Equity
|
Total
Comprehensive
Income
|
|||||||||||||||||||||||||||
|
amounts in millions, except per share data
|
Shares
|
Amount
|
Shares
|
Amount
|
|||||||||||||||||||||||||||||
|
Balance, February 1, 2009
|
1,707
|
|
$
|
85
|
|
$
|
6,048
|
|
$
|
12,093
|
|
$
|
(77
|
)
|
(11
|
)
|
$
|
(372
|
)
|
$
|
17,777
|
|
|||||||||||
|
Net Earnings
|
—
|
|
—
|
|
—
|
|
2,661
|
|
—
|
|
—
|
|
—
|
|
2,661
|
|
$
|
2,661
|
|
||||||||||||||
|
Shares Issued Under Employee Stock Plans
|
9
|
|
1
|
|
57
|
|
—
|
|
—
|
|
—
|
|
—
|
|
58
|
|
|||||||||||||||||
|
Tax Effect of Stock-Based Compensation
|
—
|
|
—
|
|
(2
|
)
|
—
|
|
—
|
|
—
|
|
—
|
|
(2
|
)
|
|||||||||||||||||
|
Translation Adjustments
|
—
|
|
—
|
|
—
|
|
—
|
|
426
|
|
—
|
|
—
|
|
426
|
|
426
|
|
|||||||||||||||
|
Cash Flow Hedges, net of tax
|
—
|
|
—
|
|
—
|
|
—
|
|
11
|
|
—
|
|
—
|
|
11
|
|
11
|
|
|||||||||||||||
|
Stock Options, Awards and Amortization of
Restricted Stock
|
—
|
|
—
|
|
201
|
|
—
|
|
—
|
|
—
|
|
—
|
|
201
|
|
|||||||||||||||||
|
Repurchases of Common Stock
|
—
|
|
—
|
|
—
|
|
—
|
|
—
|
|
(7
|
)
|
(213
|
)
|
(213
|
)
|
|||||||||||||||||
|
Cash Dividends ($0.90 per share)
|
—
|
|
—
|
|
—
|
|
(1,525
|
)
|
—
|
|
—
|
|
—
|
|
(1,525
|
)
|
|||||||||||||||||
|
Other
|
—
|
|
—
|
|
—
|
|
(3
|
)
|
2
|
|
—
|
|
—
|
|
(1
|
)
|
2
|
|
|||||||||||||||
|
Comprehensive Income
|
$
|
3,100
|
|
||||||||||||||||||||||||||||||
|
Balance, January 31, 2010
|
1,716
|
|
$
|
86
|
|
$
|
6,304
|
|
$
|
13,226
|
|
$
|
362
|
|
(18
|
)
|
$
|
(585
|
)
|
$
|
19,393
|
|
|||||||||||
|
Net Earnings
|
—
|
|
—
|
|
—
|
|
3,338
|
|
—
|
|
—
|
|
—
|
|
3,338
|
|
$
|
3,338
|
|
||||||||||||||
|
Shares Issued Under Employee Stock Plans
|
6
|
|
—
|
|
42
|
|
—
|
|
—
|
|
—
|
|
—
|
|
42
|
|
|||||||||||||||||
|
Tax Effect of Stock-Based Compensation
|
—
|
|
—
|
|
2
|
|
—
|
|
—
|
|
—
|
|
—
|
|
2
|
|
|||||||||||||||||
|
Translation Adjustments
|
—
|
|
—
|
|
—
|
|
—
|
|
206
|
|
—
|
|
—
|
|
206
|
|
206
|
|
|||||||||||||||
|
Cash Flow Hedges, net of tax
|
—
|
|
—
|
|
—
|
|
—
|
|
(116
|
)
|
—
|
|
—
|
|
(116
|
)
|
(116
|
)
|
|||||||||||||||
|
Stock Options, Awards and Amortization of
Restricted Stock
|
—
|
|
—
|
|
214
|
|
—
|
|
—
|
|
—
|
|
—
|
|
214
|
|
|||||||||||||||||
|
Repurchases of Common Stock
|
—
|
|
—
|
|
—
|
|
—
|
|
—
|
|
(81
|
)
|
(2,608
|
)
|
(2,608
|
)
|
|||||||||||||||||
|
Cash Dividends ($0.945 per share)
|
—
|
|
—
|
|
—
|
|
(1,569
|
)
|
—
|
|
—
|
|
—
|
|
(1,569
|
)
|
|||||||||||||||||
|
Other
|
—
|
|
—
|
|
(6
|
)
|
—
|
|
(7
|
)
|
—
|
|
—
|
|
(13
|
)
|
(7
|
)
|
|||||||||||||||
|
Comprehensive Income
|
$
|
3,421
|
|
||||||||||||||||||||||||||||||
|
Balance, January 30, 2011
|
1,722
|
|
$
|
86
|
|
$
|
6,556
|
|
$
|
14,995
|
|
$
|
445
|
|
(99
|
)
|
$
|
(3,193
|
)
|
$
|
18,889
|
|
|||||||||||
|
Net Earnings
|
—
|
|
—
|
|
—
|
|
3,883
|
|
—
|
|
—
|
|
—
|
|
3,883
|
|
$
|
3,883
|
|
||||||||||||||
|
Shares Issued Under Employee Stock Plans
|
11
|
|
1
|
|
196
|
|
—
|
|
—
|
|
—
|
|
—
|
|
197
|
|
|||||||||||||||||
|
Tax Effect of Stock-Based Compensation
|
—
|
|
—
|
|
(2
|
)
|
—
|
|
—
|
|
—
|
|
—
|
|
(2
|
)
|
|||||||||||||||||
|
Translation Adjustments
|
—
|
|
—
|
|
—
|
|
—
|
|
(143
|
)
|
—
|
|
—
|
|
(143
|
)
|
(143
|
)
|
|||||||||||||||
|
Cash Flow Hedges, net of tax
|
—
|
|
—
|
|
—
|
|
—
|
|
5
|
|
—
|
|
—
|
|
5
|
|
5
|
|
|||||||||||||||
|
Stock Options, Awards and Amortization of
Restricted Stock
|
—
|
|
—
|
|
215
|
|
—
|
|
—
|
|
—
|
|
—
|
|
215
|
|
|||||||||||||||||
|
Repurchases of Common Stock
|
—
|
|
—
|
|
—
|
|
—
|
|
—
|
|
(97
|
)
|
(3,501
|
)
|
(3,501
|
)
|
|||||||||||||||||
|
Cash Dividends ($1.04 per share)
|
—
|
|
—
|
|
—
|
|
(1,632
|
)
|
—
|
|
—
|
|
—
|
|
(1,632
|
)
|
|||||||||||||||||
|
Other
|
—
|
|
—
|
|
1
|
|
—
|
|
(14
|
)
|
—
|
|
—
|
|
(13
|
)
|
(14
|
)
|
|||||||||||||||
|
Comprehensive Income
|
$
|
3,731
|
|
||||||||||||||||||||||||||||||
|
Balance, January 29, 2012
|
1,733
|
|
$
|
87
|
|
$
|
6,966
|
|
$
|
17,246
|
|
$
|
293
|
|
(196
|
)
|
$
|
(6,694
|
)
|
$
|
17,898
|
|
|||||||||||
See accompanying Notes to Consolidated Financial Statements.
32
THE HOME DEPOT, INC. AND SUBSIDIARIES
|
|
Fiscal Year Ended
(1)
|
||||||||||
|
amounts in millions
|
January 29,
2012 |
January 30,
2011 |
January 31,
2010 |
||||||||
|
CASH FLOWS FROM OPERATING ACTIVITIES:
|
|||||||||||
|
Net Earnings
|
$
|
3,883
|
|
$
|
3,338
|
|
$
|
2,661
|
|
||
|
Reconciliation of Net Earnings to Net Cash Provided by Operating Activities:
|
|||||||||||
|
Depreciation and Amortization
|
1,682
|
|
1,718
|
|
1,806
|
|
|||||
|
Impairment of Investment
|
—
|
|
—
|
|
163
|
|
|||||
|
Stock-Based Compensation Expense
|
215
|
|
214
|
|
201
|
|
|||||
|
Changes in Assets and Liabilities, net of the effects of acquisition and disposition:
|
|||||||||||
|
Receivables, net
|
(170
|
)
|
(102
|
)
|
(23
|
)
|
|||||
|
Merchandise Inventories
|
256
|
|
(355
|
)
|
625
|
|
|||||
|
Other Current Assets
|
159
|
|
12
|
|
4
|
|
|||||
|
Accounts Payable and Accrued Expenses
|
422
|
|
(133
|
)
|
59
|
|
|||||
|
Deferred Revenue
|
(29
|
)
|
10
|
|
(21
|
)
|
|||||
|
Income Taxes Payable
|
14
|
|
(85
|
)
|
(174
|
)
|
|||||
|
Deferred Income Taxes
|
170
|
|
104
|
|
(227
|
)
|
|||||
|
Other Long-Term Liabilities
|
(2
|
)
|
(61
|
)
|
(19
|
)
|
|||||
|
Other
|
51
|
|
(75
|
)
|
70
|
|
|||||
|
Net Cash Provided by Operating Activities
|
6,651
|
|
4,585
|
|
5,125
|
|
|||||
|
CASH FLOWS FROM INVESTING ACTIVITIES:
|
|||||||||||
|
Capital Expenditures, net of $25, $62 and $10 of non-cash capital expenditures in fiscal 2011, 2010 and 2009, respectively
|
(1,221
|
)
|
(1,096
|
)
|
(966
|
)
|
|||||
|
Proceeds from Sale of Business, net
|
101
|
|
—
|
|
—
|
|
|||||
|
Payments for Business Acquired, net
|
(65
|
)
|
—
|
|
—
|
|
|||||
|
Proceeds from Sales of Property and Equipment
|
56
|
|
84
|
|
178
|
|
|||||
|
Proceeds from Sales and Maturities of Investments
|
—
|
|
—
|
|
33
|
|
|||||
|
Net Cash Used in Investing Activities
|
(1,129
|
)
|
(1,012
|
)
|
(755
|
)
|
|||||
|
CASH FLOWS FROM FINANCING ACTIVITIES:
|
|||||||||||
|
Proceeds from Long-Term Borrowings, net of discount
|
1,994
|
|
998
|
|
—
|
|
|||||
|
Repayments of Long-Term Debt
|
(1,028
|
)
|
(1,029
|
)
|
(1,774
|
)
|
|||||
|
Repurchases of Common Stock
|
(3,470
|
)
|
(2,608
|
)
|
(213
|
)
|
|||||
|
Proceeds from Sales of Common Stock
|
306
|
|
104
|
|
73
|
|
|||||
|
Cash Dividends Paid to Stockholders
|
(1,632
|
)
|
(1,569
|
)
|
(1,525
|
)
|
|||||
|
Other Financing Activities
|
(218
|
)
|
(347
|
)
|
(64
|
)
|
|||||
|
Net Cash Used in Financing Activities
|
(4,048
|
)
|
(4,451
|
)
|
(3,503
|
)
|
|||||
|
Change in Cash and Cash Equivalents
|
1,474
|
|
(878
|
)
|
867
|
|
|||||
|
Effect of Exchange Rate Changes on Cash and Cash Equivalents
|
(32
|
)
|
2
|
|
35
|
|
|||||
|
Cash and Cash Equivalents at Beginning of Year
|
545
|
|
1,421
|
|
519
|
|
|||||
|
Cash and Cash Equivalents at End of Year
|
$
|
1,987
|
|
$
|
545
|
|
$
|
1,421
|
|
||
|
SUPPLEMENTAL DISCLOSURE OF CASH PAYMENTS MADE FOR:
|
|||||||||||
|
Interest, net of interest capitalized
|
$
|
580
|
|
$
|
579
|
|
$
|
664
|
|
||
|
Income Taxes
|
$
|
1,865
|
|
$
|
2,067
|
|
$
|
2,082
|
|
||
—————
|
(1)
|
Fiscal years ended
January 29, 2012
,
January 30, 2011
and
January 31, 2010
include 52 weeks.
|
See accompanying Notes to Consolidated Financial Statements.
33
NOTES TO CONSOLIDATED FINANCIAL STATEMENTS
1. SUMMARY OF SIGNIFICANT ACCOUNTING POLICIES
Business, Consolidation and Presentation
The Home Depot, Inc. and its subsidiaries (the "Company") operate The Home Depot stores, which are full-service, warehouse-style stores averaging approximately
104,000
square feet of enclosed space, with approximately
24,000
additional square feet of outside garden area. The stores stock approximately
30,000
to
40,000
different kinds of building materials, home improvement supplies and lawn and garden products that are sold to do-it-yourself customers, do-it-for-me customers and professional customers. The Company also offers over
300,000
products through its website, homedepot.com. At the end of fiscal
2011
, the Company was operating
2,252
The Home Depot stores, which included
1,974
stores in the United States, including the Commonwealth of Puerto Rico and the territories of the U.S. Virgin Islands and Guam ("U.S."),
180
stores in Canada,
91
stores in Mexico and
7
stores in China. The Consolidated Financial Statements include the accounts of the Company and its wholly-owned subsidiaries. All significant intercompany transactions have been eliminated in consolidation.
Fiscal Year
The Company’s fiscal year is a
52
- or
53
-week period ending on the Sunday nearest to
January 31
. Fiscal years ended
January 29, 2012
("fiscal
2011
"),
January 30, 2011
("fiscal
2010
") and
January 31, 2010
("fiscal
2009
") include
52
weeks.
Use of Estimates
Management of the Company has made a number of estimates and assumptions relating to the reporting of assets and liabilities, the disclosure of contingent assets and liabilities, and reported amounts of revenues and expenses in preparing these financial statements in conformity with U.S. generally accepted accounting principles. Actual results could differ from these estimates.
Fair Value of Financial Instruments
The carrying amounts of Cash and Cash Equivalents, Receivables and Accounts Payable approximate fair value due to the short-term maturities of these financial instruments. The fair value of the Company’s Long-Term Debt is discussed in Note 11.
Cash Equivalents
The Company considers all highly liquid investments purchased with original maturities of
three
months or less to be cash equivalents. The Company’s cash equivalents are carried at fair market value and consist primarily of money market funds.
Accounts Receivable
The Company has an agreement with a third-party service provider who directly extends credit to customers, manages the Company’s private label credit card program and owns the related receivables. The Company evaluated the third-party entities holding the receivables under the program and concluded that they should not be consolidated by the Company. The agreement with the third-party service provider expires in
2018
, with the Company having the option, but no obligation, to purchase the receivables at the end of the agreement. The deferred interest charges incurred by the Company for its deferred financing programs offered to its customers are included in Cost of Sales. The interchange fees charged to the Company for the customers’ use of the cards and any profit sharing with the third-party administrator are included in Selling, General and Administrative expenses ("SG&A"). The sum of the three is referred to by the Company as "the cost of credit" of the private label credit card program.
In addition, certain subsidiaries of the Company extend credit directly to customers in the ordinary course of business. The receivables due from customers were $
45 million
and $
42 million
as of
January 29, 2012
and
January 30, 2011
, respectively. The Company’s valuation reserve related to accounts receivable was not material to the Consolidated Financial Statements of the Company as of the end of fiscal
2011
or
2010
.
Merchandise Inventories
The majority of the Company’s Merchandise Inventories are stated at the lower of cost (first-in, first-out) or market, as determined by the retail inventory method. As the inventory retail value is adjusted regularly to reflect market conditions, the inventory valued using the retail method approximates the lower of cost or market. Certain subsidiaries, including retail operations in Canada, Mexico and China, and distribution centers, record Merchandise Inventories at the lower of cost or
34
market, as determined by a cost method. These Merchandise Inventories represent approximately
19%
of the total Merchandise Inventories balance. The Company evaluates the inventory valued using a cost method at the end of each quarter to ensure that it is carried at the lower of cost or market. The valuation allowance for Merchandise Inventories valued under a cost method was not material to the Consolidated Financial Statements of the Company as of the end of fiscal
2011
or
2010
.
Independent physical inventory counts or cycle counts are taken on a regular basis in each store and distribution center to ensure that amounts reflected in the accompanying Consolidated Financial Statements for Merchandise Inventories are properly stated. During the period between physical inventory counts in stores, the Company accrues for estimated losses related to shrink on a store-by-store basis based on historical shrink results and current trends in the business. Shrink (or in the case of excess inventory, "swell") is the difference between the recorded amount of inventory and the physical inventory. Shrink may occur due to theft, loss, inaccurate records for the receipt of inventory or deterioration of goods, among other things.
Income Taxes
Income taxes are accounted for under the asset and liability method. The Company provides for federal, state and foreign income taxes currently payable, as well as for those deferred due to timing differences between reporting income and expenses for financial statement purposes versus tax purposes. Deferred tax assets and liabilities are recognized for the future tax consequences attributable to temporary differences between the financial statement carrying amounts of existing assets and liabilities and their respective tax bases. Deferred tax assets and liabilities are measured using enacted income tax rates expected to apply to taxable income in the years in which those temporary differences are expected to be recovered or settled. The effect of a change in income tax rates is recognized as income or expense in the period that includes the enactment date.
The Company recognizes the effect of income tax positions only if those positions are more likely than not of being sustained. Recognized income tax positions are measured at the largest amount that is greater than
50%
likely of being realized. Changes in recognition or measurement are reflected in the period in which the change in judgment occurs.
The Company and its eligible subsidiaries file a consolidated U.S. federal income tax return. Non-U.S. subsidiaries and certain U.S. subsidiaries, which are consolidated for financial reporting purposes, are not eligible to be included in the Company’s consolidated U.S. federal income tax return. Separate provisions for income taxes have been determined for these entities. The Company intends to reinvest substantially all of the unremitted earnings of its non-U.S. subsidiaries and postpone their remittance indefinitely. Accordingly, no provision for U.S. income taxes for these non-U.S. subsidiaries was recorded in the accompanying Consolidated Statements of Earnings.
Depreciation and Amortization
The Company’s Buildings, Furniture, Fixtures and Equipment are recorded at cost and depreciated using the straight-line method over the estimated useful lives of the assets. Leasehold Improvements are amortized using the straight-line method over the original term of the lease or the useful life of the improvement, whichever is shorter. The Company’s Property and Equipment is depreciated using the following estimated useful lives:
|
|
Life
|
|
Buildings
|
5 – 45 years
|
|
Furniture, Fixtures and Equipment
|
2 – 20 years
|
|
Leasehold Improvements
|
5 – 45 years
|
Capitalized Software Costs
The Company capitalizes certain costs related to the acquisition and development of software and amortizes these costs using the straight-line method over the estimated useful life of the software, which is
three
to
six
years. These costs are included in Furniture, Fixtures and Equipment in the accompanying Consolidated Balance Sheets. Certain development costs not meeting the criteria for capitalization are expensed as incurred.
35
Revenues
The Company recognizes revenue, net of estimated returns and sales tax, at the time the customer takes possession of merchandise or receives services. The liability for sales returns is estimated based on historical return levels. When the Company receives payment from customers before the customer has taken possession of the merchandise or the service has been performed, the amount received is recorded as Deferred Revenue in the accompanying Consolidated Balance Sheets until the sale or service is complete. The Company also records Deferred Revenue for the sale of gift cards and recognizes this revenue upon the redemption of gift cards in Net Sales. Gift card breakage income is recognized based upon historical redemption patterns and represents the balance of gift cards for which the Company believes the likelihood of redemption by the customer is remote. During fiscal
2011
,
2010
and
2009
, the Company recognized $
42 million
, $
46 million
and $
40 million
, respectively, of gift card breakage income. This income is included in the accompanying Consolidated Statements of Earnings as a reduction in SG&A.
Services Revenue
Net Sales include services revenue generated through a variety of installation, home maintenance and professional service programs. In these programs, the customer selects and purchases material for a project and the Company provides or arranges professional installation. These programs are offered through the Company’s stores and in-home sales programs. Under certain programs, when the Company provides or arranges the installation of a project and the subcontractor provides material as part of the installation, both the material and labor are included in services revenue. The Company recognizes this revenue when the service for the customer is complete.
All payments received prior to the completion of services are recorded in Deferred Revenue in the accompanying Consolidated Balance Sheets. Services revenue was $
2.9 billion
, $
2.7 billion
and $
2.6 billion
for fiscal
2011
,
2010
and
2009
, respectively.
Self-Insurance
The Company is self-insured for certain losses related to general liability, workers’ compensation, medical, product liability and automobile claims. The expected ultimate cost for claims incurred as of the balance sheet date is not discounted and is recognized as a liability. The expected ultimate cost of claims is estimated based upon analysis of historical data and actuarial estimates.
Prepaid Advertising
Television and radio advertising production costs, along with media placement costs, are expensed when the advertisement first appears. Amounts included in Other Current Assets in the accompanying Consolidated Balance Sheets relating to prepayments of production costs for print and broadcast advertising as well as sponsorship promotions were not material at the end of fiscal
2011
and
2010
.
Vendor Allowances
Vendor allowances primarily consist of volume rebates that are earned as a result of attaining certain purchase levels and advertising co-op allowances for the promotion of vendors’ products that are typically based on guaranteed minimum amounts with additional amounts being earned for attaining certain purchase levels. These vendor allowances are accrued as earned, with those allowances received as a result of attaining certain purchase levels accrued over the incentive period based on estimates of purchases.
Volume rebates and certain advertising co-op allowances earned are initially recorded as a reduction in Merchandise Inventories and a subsequent reduction in Cost of Sales when the related product is sold. Certain advertising co-op allowances that are reimbursements of specific, incremental and identifiable costs incurred to promote vendors’ products are recorded as an offset against advertising expense. In fiscal
2011
,
2010
and
2009
, gross advertising expense was $
846 million
, $
864 million
and $
897 million
, respectively, and is included in SG&A. Specific, incremental and identifiable advertising co-op allowances were $
94 million
, $
90 million
and $
105 million
for fiscal
2011
,
2010
and
2009
, respectively, and are recorded as an offset to advertising expense in SG&A.
36
Cost of Sales
Cost of Sales includes the actual cost of merchandise sold and services performed, the cost of transportation of merchandise from vendors to the Company’s stores, locations or customers, the operating cost of the Company’s sourcing and distribution network and the cost of deferred interest programs offered through the Company’s private label credit card program.
The cost of handling and shipping merchandise from the Company’s stores, locations or distribution centers to the customer is classified as SG&A. The cost of shipping and handling, including internal costs and payments to third parties, classified as SG&A was $
430 million
, $
410 million
and $
386 million
in fiscal
2011
,
2010
and
2009
, respectively.
Impairment of Long-Lived Assets
The Company evaluates its long-lived assets each quarter for indicators of potential impairment. Indicators of impairment include current period losses combined with a history of losses, management’s decision to relocate or close a store or other location before the end of its previously estimated useful life or when changes in other circumstances indicate the carrying amount of an asset may not be recoverable. The evaluation for long-lived assets is performed at the lowest level of identifiable cash flows, which is generally the individual store level.
The assets of a store with indicators of impairment are evaluated by comparing its undiscounted cash flows with its carrying value. The estimate of cash flows includes management’s assumptions of cash inflows and outflows directly resulting from the use of those assets in operations, including gross margin on Net Sales, payroll and related items, occupancy costs, insurance allocations and other costs to operate a store. If the carrying value is greater than the undiscounted cash flows, an impairment loss is recognized for the difference between the carrying value and the estimated fair market value. Impairment losses are recorded as a component of SG&A in the accompanying Consolidated Statements of Earnings. When a leased location closes, the Company also recognizes in SG&A the net present value of future lease obligations less estimated sublease income.
As part of its Rationalization Charges, the Company recorded no material lease obligation costs in fiscal
2011
and
2010
and recorded $
84 million
of lease obligation costs in fiscal
2009
. See Note 2 for more details on the Rationalization Charges. The Company also recorded impairments and other lease obligation costs on other closings and relocations in the ordinary course of business, which were not material to the Consolidated Financial Statements in fiscal
2011
,
2010
and
2009
.
Goodwill and Other Intangible Assets
Goodwill represents the excess of purchase price over the fair value of net assets acquired. The Company does not amortize goodwill but does assess the recoverability of goodwill in the third quarter of each fiscal year, or more often if indicators warrant, by determining whether the fair value of each reporting unit supports its carrying value. The fair values of the Company’s identified reporting units were estimated using the present value of expected future discounted cash flows.
The Company amortizes the cost of other intangible assets over their estimated useful lives, which range up to
ten
years, unless such lives are deemed indefinite. Intangible assets with indefinite lives are tested in the third quarter of each fiscal year for impairment, or more often if indicators warrant. Impairment charges related to goodwill and other intangible assets were not material for fiscal
2011
,
2010
or
2009
.
Stock-Based Compensation
The per share weighted average fair value of stock options granted during fiscal
2011
,
2010
and
2009
was $
7.42
, $
6.70
and $
6.61
, respectively. The fair value of these options was determined at the date of grant using the Black-Scholes option-pricing model with the following assumptions:
|
|
Fiscal Year Ended
|
|||||||
|
|
January 29,
2012 |
January 30,
2011 |
January 31,
2010 |
|||||
|
Risk-free interest rate
|
2.0
|
%
|
3.1
|
%
|
2.3
|
%
|
||
|
Assumed volatility
|
27.3
|
%
|
26.4
|
%
|
41.5
|
%
|
||
|
Assumed dividend yield
|
2.7
|
%
|
2.9
|
%
|
3.9
|
%
|
||
|
Assumed lives of option
|
5 years
|
|
5 years
|
|
6 years
|
|
||
37
Derivatives
The Company uses derivative financial instruments from time to time in the management of its interest rate exposure on long-term debt and its exposure on foreign currency fluctuations. The Company accounts for its derivative financial instruments in accordance with the Financial Accounting Standards Board Accounting Standards Codification ("FASB ASC") Subtopic 815-10. The fair value of the Company’s derivative financial instruments is discussed in Note 11.
Comprehensive Income
Comprehensive Income includes Net Earnings adjusted for certain gains and losses that are excluded from Net Earnings under U.S. generally accepted accounting principles. Adjustments to Net Earnings and Accumulated Other Comprehensive Income consist primarily of foreign currency translation adjustments.
Foreign Currency Translation
Assets and liabilities denominated in a foreign currency are translated into U.S. dollars at the current rate of exchange on the last day of the reporting period. Revenues and expenses are generally translated using average exchange rates for the period and equity transactions are translated using the actual rate on the day of the transaction.
Segment Information
The Company operates within a single reportable segment primarily within North America. Net Sales for the Company outside the U.S. were $
8.0 billion
, $
7.5 billion
and $
7.0 billion
for fiscal
2011
,
2010
and
2009
, respectively. Long-lived assets outside the U.S. totaled $
3.1 billion
and $
3.2 billion
as of
January 29, 2012
and
January 30, 2011
, respectively.
Reclassifications
Certain amounts in prior fiscal years have been reclassified to conform with the presentation adopted in the current fiscal year.
2. RATIONALIZATION CHARGES
In fiscal 2008, the Company reduced its square footage growth plans to improve free cash flow, provide stronger returns for the Company and invest in its existing stores to continue improving the customer experience. As a result of this store rationalization plan, the Company determined that it would no longer pursue the opening of approximately
50
U.S. stores that had been in its new store pipeline. The Company expects to dispose of or sublet any remaining pipeline locations over varying periods. The Company also closed
15
underperforming U.S. stores in the second quarter of fiscal 2008, and the Company expects to dispose of or sublet any remaining locations over varying periods.
Also in fiscal 2008, the Company announced that it would exit its EXPO, THD Design Center, Yardbirds and HD Bath businesses (the "Exited Businesses") in order to focus on its core The Home Depot stores. The Company closed the Exited Businesses in the first quarter of fiscal 2009 and expects to dispose of or sublet any remaining locations over varying periods. These steps impacted approximately
5,000
associates in those locations, their support functions and their distribution centers.
Finally, in January
2009
the Company also restructured its support functions to better align the Company’s cost structure. These actions impacted approximately
2,000
associates.
The Company did not incur any material charges related to these actions (collectively, the "Rationalization Charges") in fiscal
2011
and
2010
and recognized $
146 million
and $
951 million
in total pretax charges for fiscal
2009
and 2008, respectively. The Company does not expect any further material charges related to these actions.
38
Activity related to Rationalization Charges for fiscal
2011
,
2010
and
2009
was as follows (amounts in millions):
|
Asset
Impairments
|
Lease Obligation
Costs, net
|
Severance
|
Other
|
Total
|
|||||||||||||||
|
Accrued Balance at February 1, 2009
|
$
|
38
|
|
$
|
213
|
|
$
|
72
|
|
$
|
20
|
|
$
|
343
|
|
||||
|
Fiscal 2009 Charges
|
—
|
|
84
|
|
8
|
|
54
|
|
146
|
|
|||||||||
|
Cash Uses
|
—
|
|
106
|
|
80
|
|
71
|
|
257
|
|
|||||||||
|
Non-cash Activity
|
15
|
|
—
|
|
—
|
|
3
|
|
18
|
|
|||||||||
|
Accrued Balance at January 31, 2010
|
23
|
|
191
|
|
—
|
|
—
|
|
214
|
|
|||||||||
|
Cash Uses
|
—
|
|
42
|
|
—
|
|
—
|
|
42
|
|
|||||||||
|
Non-cash Activity
|
19
|
|
(9
|
)
|
—
|
|
—
|
|
10
|
|
|||||||||
|
Accrued Balance at January 30, 2011
|
4
|
|
158
|
|
—
|
|
—
|
|
162
|
|
|||||||||
|
Cash Uses
|
—
|
|
29
|
|
—
|
|
—
|
|
29
|
|
|||||||||
|
Non-cash Activity
|
2
|
|
(15
|
)
|
—
|
|
—
|
|
(13
|
)
|
|||||||||
|
Accrued Balance at January 29, 2012
|
$
|
2
|
|
$
|
144
|
|
$
|
—
|
|
$
|
—
|
|
$
|
146
|
|
||||
Costs related to asset impairments, lease obligations, severance and other miscellaneous costs are included in SG&A in the accompanying Consolidated Statements of Earnings. Asset impairment charges, including contractual costs to complete certain assets, were determined based on fair market value using market data for each individual property. Lease obligation costs represent the present value of contractually obligated rental payments offset by estimated sublet income, including estimates of the time required to sublease the locations. The payments related to the leased locations therefore are not generally incremental uses of cash.
3. HD SUPPLY DISPOSITION
On
August 30, 2007
, the Company closed the sale of HD Supply, Inc. In accordance with FASB ASC Subtopic 360-10, the Company reclassified the results of HD Supply as discontinued operations in its Consolidated Statements of Earnings for all periods presented. Settlement of working capital matters arising from the sale of HD Supply resulted in earnings from discontinued operations of $
41 million
, net of tax, in fiscal 2009.
In connection with the sale, the Company purchased a
12.5%
equity interest in the newly formed HD Supply for $
325 million
. In fiscal 2008, the Company determined its
12.5%
equity interest in HD Supply was impaired and recorded a $
163 million
charge to write-down the investment. In fiscal 2009, the Company determined its equity interest in HD Supply was further impaired and recorded an additional charge of $
163 million
to write-down the remaining investment, which is included in Interest and Other, net, in the accompanying Consolidated Statements of Earnings.
Also in connection with the sale, the Company guaranteed a $
1.0 billion
senior secured amortizing term loan of HD Supply. The Company is responsible for up to $
1.0 billion
and any unpaid interest in the event of nonpayment by HD Supply. As reported in the quarterly report on Form 10-Q of HD Supply for the period ended
October 30, 2011
, the outstanding balance of this term loan as of
October 30, 2011
was $
930 million
. The guaranteed loan is collateralized by certain assets of HD Supply. The original expiration date of the guarantee was
August 30, 2012
. On
March 19, 2010
, the Company amended the guarantee to extend the expiration date to
April 1, 2014
. The fair value of the guarantee at
August 30, 2007
was $
16 million
and was recorded as a liability of the Company in Other Long-Term Liabilities. The extension of the guarantee increased the fair value of the guarantee to $
67 million
, resulting in a $
51 million
charge to Interest and Other, net, for fiscal 2010.
39
The Company has commercial paper programs that allow for borrowings up to
$2.0 billion
. All of the Company’s short-term borrowings in fiscal
2011
and
2010
were under these commercial paper programs. In connection with the commercial paper programs, the Company has a back-up credit facility with a consortium of banks for borrowings up to
$2.0 billion
. The credit facility expires in
July 2013
and contains various restrictive covenants. At
January 29, 2012
, the Company was in compliance with all of the covenants, and they are not expected to impact the Company’s liquidity or capital resources.
Short-term debt under the commercial paper programs was as follows (amounts in millions):
|
Fiscal Year Ended
|
|||||||
|
January 29,
2012 |
January 30,
2011 |
||||||
|
Balance outstanding at fiscal year-end
|
$
|
—
|
|
$
|
—
|
|
|
|
Maximum amount outstanding at any month-end
|
$
|
828
|
|
$
|
—
|
|
|
|
Average daily short-term borrowings
|
$
|
44
|
|
$
|
5
|
|
|
|
Weighted average interest rate
|
0.5
|
%
|
0.4
|
%
|
|||
The Company’s Long-Term Debt at the end of fiscal
2011
and
2010
consisted of the following (amounts in millions):
|
January 29,
2012 |
January 30,
2011 |
||||||
|
5.20% Senior Notes; due March 1, 2011; interest payable semi-annually on
March 1 and September 1 |
$
|
—
|
|
$
|
1,000
|
|
|
|
5.25% Senior Notes; due December 16, 2013; interest payable semi-annually on
June 16 and December 16 |
1,309
|
|
1,297
|
|
|||
|
5.40% Senior Notes; due March 1, 2016; interest payable semi-annually on
March 1 and September 1 |
3,069
|
|
3,033
|
|
|||
|
3.95% Senior Notes; due September 15, 2020; interest payable semi-annually on
March 15 and September 15 |
499
|
|
499
|
|
|||
|
4.40% Senior Notes; due April 1, 2021; interest payable semi-annually on
April 1 and October 1 |
998
|
|
—
|
|
|||
|
5.875% Senior Notes; due December 16, 2036; interest payable semi-annually on
June 16 and December 16 |
2,961
|
|
2,960
|
|
|||
|
5.40% Senior Notes; due September 15, 2040; interest payable semi-annually on
March 15 and September 15 |
499
|
|
499
|
|
|||
|
5.95% Senior Notes; due April 1, 2041; interest payable semi-annually on
April 1 and October 1 |
996
|
|
—
|
|
|||
|
Capital Lease Obligations; payable in varying installments through January 31, 2055
|
449
|
|
452
|
|
|||
|
Other
|
8
|
|
9
|
|
|||
|
Total debt
|
10,788
|
|
9,749
|
|
|||
|
Less current installments
|
30
|
|
1,042
|
|
|||
|
Long-Term Debt, excluding current installments
|
$
|
10,758
|
|
$
|
8,707
|
|
|
In
March 2011
, the Company entered into an interest rate swap that expires on
March 1, 2016
, with a notional amount of
$500 million
, accounted for as a fair value hedge, that swaps fixed rate interest on the Company's
5.40%
Senior Notes due
March 1, 2016
for variable interest equal to LIBOR plus
300
basis points. At
January 29, 2012
, the approximate fair value of this agreement was an asset of
$39 million
, which is the estimated amount the Company would have received to settle the agreement and is included in Other Assets in the accompanying Consolidated Balance Sheets.
Also at
January 29, 2012
, the Company had outstanding interest rate swaps, accounted for as fair value hedges, that expire on
December 16, 2013
with a notional amount of
$1.25 billion
that swap fixed rate interest on the Company’s
$1.25 billion
5.25%
Senior Notes due
December 16, 2013
for variable interest equal to LIBOR plus
259
basis points. At
January 29, 2012
,
40
the approximate fair value of these agreements was an asset of
$52 million
, which is the estimated amount the Company would have received to settle the agreements and is included in Other Assets in the accompanying Consolidated Balance Sheets.
In
March 2011
, the Company issued
$1.0 billion
of
4.40%
Senior Notes due
April 1, 2021
at a discount of
$2 million
and
$1.0 billion
of
5.95%
Senior Notes due
April 1, 2041
at a discount of
$4 million
(together, the "
March 2011
issuance"). Interest on these Senior Notes is due
semi-annually on April 1 and October 1
of each year, beginning
October 1, 2011
. The net proceeds of the
March 2011
issuance were used to repurchase
$1.0 billion
of the Company’s common stock through an Accelerated Share Repurchase ("ASR") agreement, and the balance of the net proceeds was used to repay the Company’s
5.20%
Senior Notes that matured
March 1, 2011
in the aggregate principal amount of
$1.0 billion
. The
$6 million
discount associated with the
March 2011
issuance is being amortized over the lives of the Senior Notes using the effective interest rate method. Issuance costs were approximately
$15 million
and are being amortized over the lives of the Senior Notes issued in
March 2011
.
In
May 2010
, the Company entered into a forward starting interest rate swap agreement with a notional amount of
$500 million
, accounted for as a cash flow hedge, to hedge interest rate fluctuations in anticipation of the
March 2011
issuance. Upon the
March 2011
issuance, the Company settled this forward starting interest rate swap agreement for an immaterial amount.
In
September 2010
, the Company issued
$500 million
of
3.95%
Senior Notes due
September 15, 2020
at a discount of
$1 million
and
$500 million
of
5.40%
Senior Notes due
September 15, 2040
at a discount of
$1 million
(together, the "
September 2010
issuance"). Interest on these Senior Notes is due
semi-annually on March 15 and September 15
of each year. The net proceeds of the
September 2010
issuance were used to refinance the Company’s
4.625%
Senior Notes that matured
August 15, 2010
in the aggregate principal amount of
$1.0 billion
. The
$2 million
discount associated with the
September 2010
issuance is being amortized over the lives of the Senior Notes using the effective interest rate method. Issuance costs were
$8 million
and are being amortized over the lives of the Senior Notes issued in
September 2010
.
In fiscal
2009
and
2010
, the Company entered into forward starting interest rate swap agreements with a combined notional amount of
$1.0 billion
to hedge interest rate fluctuations in anticipation of the
September 2010
issuance, accounted for as cash flow hedges. Upon the
September 2010
issuance, the Company paid
$193 million
to settle these forward starting interest rate swap agreements. This amount, net of income taxes, is included in Accumulated Other Comprehensive Income and is being amortized to Interest Expense over the lives of the Senior Notes issued in
September 2010
.
The Senior Notes may be redeemed by the Company at any time, in whole or in part, at the redemption price plus accrued interest up to the redemption date. The redemption price is equal to the greater of (1)
100%
of the principal amount of the Senior Notes to be redeemed, and (2) the sum of the present values of the remaining scheduled payments of principal and interest to maturity. Additionally, if a Change in Control Triggering Event occurs, as defined by the terms of the
March 2011
issuance, the
September 2010
issuance, and the
5.25%
Senior Notes and the
5.875%
Senior Notes issuance (together the "December 2006 issuance"), holders of the
March 2011
issuance,
September 2010
issuance and December 2006 issuance have the right to require the Company to redeem those notes at
101%
of the aggregate principal amount of the notes plus accrued interest up to the redemption date. The Company is generally not limited under the indenture governing the Senior Notes in its ability to incur additional indebtedness or required to maintain financial ratios or specified levels of net worth or liquidity. Further, while the indenture governing the Senior Notes contains various restrictive covenants, none is expected to impact the Company’s liquidity or capital resources.
At
January 29, 2012
, the Company had outstanding cross currency swap agreements with a notional amount of
$390 million
, accounted for as cash flow hedges, to hedge foreign currency fluctuations on certain intercompany debt. At
January 29, 2012
, the approximate fair value of these agreements was a liability of
$27 million
, which is the estimated amount the Company would have paid to settle the agreements and is included in Other Long-Term Liabilities in the accompanying Consolidated Balance Sheets.
Interest Expense in the accompanying Consolidated Statements of Earnings is net of interest capitalized of
$3 million
,
$3 million
and
$4 million
in fiscal
2011
,
2010
and
2009
, respectively. Maturities of Long-Term Debt are
$30 million
for fiscal
2012
,
$1.3 billion
for fiscal
2013
,
$30 million
for fiscal
2014
,
$27 million
for fiscal
2015
,
$3.1 billion
for fiscal
2016
and
$6.3 billion
thereafter.
41
5. ACCELERATED SHARE REPURCHASE AGREEMENTS
In
March 2011
, the Company entered into an ASR agreement with a third-party financial institution to repurchase
$1.0 billion
of the Company’s common stock. Under the agreement, the Company paid
$1.0 billion
to the financial institution, using a portion of the proceeds from the
March 2011
issuance, and received a total of
27 million
shares in fiscal 2011. The final number of shares delivered upon settlement of the agreement was determined with reference to the average price of the Company’s common stock over the term of the ASR agreement. The
$1.0 billion
of shares repurchased are included in Treasury Stock in the accompanying Consolidated Balance Sheets as of
January 29, 2012
.
In
March 2012
, the Company entered into an ASR agreement with a third-party financial institution to repurchase $
1.0 billion
of the Company’s common stock. Under the agreement, the Company paid $
1.0 billion
to the financial institution, using cash on hand, and received an initial delivery of approximately
17 million
shares in the first quarter of fiscal 2012. The final number of shares delivered upon settlement of the agreement will be determined with reference to the average price of the Company’s common stock over the term of the ASR agreement.
6. INCOME TAXES
The components of Earnings from Continuing Operations before Provision for Income Taxes for fiscal
2011
,
2010
and
2009
were as follows (amounts in millions):
|
|
Fiscal Year Ended
|
||||||||||
|
|
January 29,
2012 |
January 30,
2011 |
January 31,
2010 |
||||||||
|
United States
|
$
|
5,508
|
|
$
|
4,854
|
|
$
|
3,586
|
|
||
|
Foreign
|
560
|
|
419
|
|
396
|
|
|||||
|
Total
|
$
|
6,068
|
|
$
|
5,273
|
|
$
|
3,982
|
|
||
The Provision for Income Taxes consisted of the following (amounts in millions):
|
|
Fiscal Year Ended
|
||||||||||
|
|
January 29,
2012 |
January 30,
2011 |
January 31,
2010 |
||||||||
|
Current:
|
|||||||||||
|
Federal
|
$
|
1,566
|
|
$
|
1,478
|
|
$
|
1,157
|
|
||
|
State
|
234
|
|
181
|
|
184
|
|
|||||
|
Foreign
|
150
|
|
151
|
|
195
|
|
|||||
|
1,950
|
|
1,810
|
|
1,536
|
|
||||||
|
Deferred:
|
|||||||||||
|
Federal
|
199
|
|
79
|
|
(121
|
)
|
|||||
|
State
|
35
|
|
21
|
|
(24
|
)
|
|||||
|
Foreign
|
1
|
|
25
|
|
(29
|
)
|
|||||
|
235
|
|
125
|
|
(174
|
)
|
||||||
|
Total
|
$
|
2,185
|
|
$
|
1,935
|
|
$
|
1,362
|
|
||
The Company’s combined federal, state and foreign effective tax rates for fiscal
2011
,
2010
and
2009
were approximately
36.0%
,
36.7%
and
34.2%
, respectively.
42
The reconciliation of the Provision for Income Taxes at the federal statutory rate of
35%
to the actual tax expense for the applicable fiscal years was as follows (amounts in millions):
|
|
Fiscal Year Ended
|
||||||||||
|
|
January 29,
2012 |
January 30,
2011 |
January 31,
2010 |
||||||||
|
Income taxes at federal statutory rate
|
$
|
2,125
|
|
$
|
1,846
|
|
$
|
1,394
|
|
||
|
State income taxes, net of federal income tax benefit
|
175
|
|
131
|
|
104
|
|
|||||
|
Other, net
|
(115
|
)
|
(42
|
)
|
(136
|
)
|
|||||
|
Total
|
$
|
2,185
|
|
$
|
1,935
|
|
$
|
1,362
|
|
||
The tax effects of temporary differences that give rise to significant portions of the deferred tax assets and deferred tax liabilities as of
January 29, 2012
and
January 30, 2011
were as follows (amounts in millions):
|
January 29,
2012 |
January 30,
2011 |
||||||
|
Current:
|
|
|
|||||
|
Deferred Tax Assets:
|
|
|
|||||
|
Property and equipment
|
$
|
—
|
|
$
|
64
|
|
|
|
Accrued self-insurance liabilities
|
123
|
|
115
|
|
|||
|
Other accrued liabilities
|
202
|
|
196
|
|
|||
|
Deferred compensation
|
324
|
|
393
|
|
|||
|
Current Deferred Tax Assets
|
649
|
|
768
|
|
|||
|
Deferred Tax Liabilities:
|
|||||||
|
Accelerated inventory deduction
|
(93
|
)
|
(106
|
)
|
|||
|
Other
|
(105
|
)
|
(114
|
)
|
|||
|
Current Deferred Tax Liabilities
|
(198
|
)
|
(220
|
)
|
|||
|
Current Deferred Tax Assets, net
|
451
|
|
548
|
|
|||
|
Noncurrent:
|
|||||||
|
Deferred Tax Assets:
|
|||||||
|
Accrued self-insurance liabilities
|
353
|
|
345
|
|
|||
|
State income taxes
|
56
|
|
69
|
|
|||
|
Capital loss carryover
|
101
|
|
141
|
|
|||
|
Net operating losses
|
65
|
|
66
|
|
|||
|
Foreign tax credit carryforward
|
—
|
|
30
|
|
|||
|
Impairment of investment
|
120
|
|
120
|
|
|||
|
Other
|
295
|
|
212
|
|
|||
|
Valuation allowance
|
(19
|
)
|
(66
|
)
|
|||
|
Noncurrent Deferred Tax Assets
|
971
|
|
917
|
|
|||
|
Deferred Tax Liabilities:
|
|||||||
|
Property and equipment
|
(1,192
|
)
|
(1,073
|
)
|
|||
|
Goodwill and other intangibles
|
(94
|
)
|
(95
|
)
|
|||
|
Noncurrent Deferred Tax Liabilities
|
(1,286
|
)
|
(1,168
|
)
|
|||
|
Noncurrent Deferred Tax Liabilities, net
|
(315
|
)
|
(251
|
)
|
|||
|
Net Deferred Tax Assets
|
$
|
136
|
|
$
|
297
|
|
|
43
Current deferred tax assets and current deferred tax liabilities are netted by tax jurisdiction and noncurrent deferred tax assets and noncurrent deferred tax liabilities are netted by tax jurisdiction, and are included in the accompanying Consolidated Balance Sheets as follows (amounts in millions):
|
January 29,
2012 |
January 30,
2011 |
||||||
|
Other Current Assets
|
$
|
454
|
|
$
|
553
|
|
|
|
Other Assets
|
25
|
|
21
|
|
|||
|
Other Accrued Expenses
|
(3
|
)
|
(5
|
)
|
|||
|
Deferred Income Taxes
|
(340
|
)
|
(272
|
)
|
|||
|
Net Deferred Tax Assets
|
$
|
136
|
|
$
|
297
|
|
|
The Company believes that the realization of the deferred tax assets is more likely than not, based upon the expectation that it will generate the necessary taxable income in future periods, and except for certain net operating losses discussed below, no valuation reserves have been provided.
At
January 29, 2012
, the Company had state and foreign net operating loss carryforwards available to reduce future taxable income, expiring at various dates from
2011
to
2028
. Management has concluded that it is more likely than not that the tax benefits related to the state net operating losses will be realized. However, it is unlikely that the Company will be able to utilize certain foreign net operating losses. Therefore, a valuation allowance has been provided to reduce the deferred tax asset related to foreign net operating losses to an amount that is more likely than not to be realized. Total valuation allowances related to net operating losses at
January 29, 2012
and
January 30, 2011
were
$19 million
and
$21 million
, respectively.
As of
January 30, 2011
, the Company had a valuation allowance of
$45 million
related to capital loss carryforwards. During the fiscal year ended
January 29, 2012
, the Company was able to utilize a portion of its capital loss carryforward. This utilization combined with other available tax planning strategies enabled the Company to release the
$45 million
valuation allowance associated with the capital loss carryforward.
The Company had
no
foreign tax credit carryforwards as of
January 29, 2012
and
$30 million
as of
January 30, 2011
. During the fiscal year ended
January 29, 2012
, the Company generated sufficient foreign source income to fully utilize the foreign tax credit carryforward from the prior year.
The Company has not provided for deferred income taxes on approximately
$2.4 billion
of undistributed earnings of international subsidiaries because of its intention to indefinitely reinvest these earnings outside the U.S. The determination of the amount of the unrecognized deferred income tax liability related to the undistributed earnings is not practicable; however, unrecognized foreign income tax credits would be available to reduce a portion of this liability.
The Company’s income tax returns are routinely examined by domestic and foreign tax authorities. The Company’s U.S. federal and Canadian tax returns for fiscal years
2005
through
2009
are currently under audit by the Internal Revenue Service. The Company's Canadian operations are currently under audit by the Canada Revenue Agency for fiscal years 2005 to
2007
. There are also ongoing U.S. state and local and other foreign audits covering tax years
2003
to
2010
. At this time, the Company does not expect the results from any income tax audit to have a material impact on the Company’s financial statements.
The Company believes that certain adjustments under examination by the IRS and in certain states will be agreed upon within the next twelve months. The Company has classified approximately
$97 million
of the reserve for unrecognized tax benefits as a short-term liability in the accompanying Consolidated Balance Sheets. Final settlement of these audit issues may result in payments that are more or less than these amounts, but the Company does not anticipate the resolution of these matters will result in a material change to its consolidated financial position or results of operations.
44
Reconciliations of the beginning and ending amount of gross unrecognized tax benefits for fiscal
2011
,
2010
and
2009
were as follows (amounts in millions):
|
January 29,
2012 |
January 30,
2011 |
January 31,
2010 |
|||||||||
|
Unrecognized tax benefits balance at beginning of fiscal year
|
$
|
662
|
|
$
|
659
|
|
$
|
695
|
|
||
|
Additions based on tax positions related to the current year
|
37
|
|
174
|
|
55
|
|
|||||
|
Additions for tax positions of prior years
|
56
|
|
84
|
|
33
|
|
|||||
|
Reductions for tax positions of prior years
|
(123
|
)
|
(181
|
)
|
(28
|
)
|
|||||
|
Reductions due to settlements
|
(4
|
)
|
(65
|
)
|
(94
|
)
|
|||||
|
Reductions due to lapse of statute of limitations
|
(7
|
)
|
(9
|
)
|
(2
|
)
|
|||||
|
Unrecognized tax benefits balance at end of fiscal year
|
$
|
621
|
|
$
|
662
|
|
$
|
659
|
|
||
The amount of unrecognized tax benefits that if recognized would affect the annual effective income tax rate on Earnings from Continuing Operations was
$246 million
,
$298 million
and
$386 million
as of
January 29, 2012
,
January 30, 2011
and
January 31, 2010
, respectively.
Net adjustments to accruals for interest and penalties associated with uncertain tax positions provided income of
$2 million
and
$32 million
in fiscal
2011
and
2010
, respectively, and expense of
$41 million
in fiscal
2009
. Total accrued interest and penalties as of
January 29, 2012
and
January 30, 2011
were
$80 million
and
$84 million
, respectively. Interest and penalties are included in Interest Expense and SG&A, respectively, in the accompanying Consolidated Statements of Earnings.
7. EMPLOYEE STOCK PLANS
The Home Depot, Inc. 2005 Omnibus Stock Incentive Plan ("2005 Plan") and The Home Depot, Inc. 1997 Omnibus Stock Incentive Plan ("1997 Plan" and collectively with the 2005 Plan, the "Plans") provide that incentive and non-qualified stock options, stock appreciation rights, restricted stock, performance shares, performance units and deferred shares may be issued to selected associates, officers and directors of the Company. Under the 2005 Plan, the maximum number of shares of the Company’s common stock authorized for issuance is
255 million
shares, with any award other than a stock option reducing the number of shares available for issuance by
2.11
shares. As of
January 29, 2012
, there were
162 million
shares available for future grants under the 2005 Plan. No additional equity awards could be issued from the 1997 Plan after the adoption of the 2005 Plan on May 26, 2005.
Under the terms of the Plans, incentive stock options and non-qualified stock options must have an exercise price at or above the fair market value of the Company’s stock on the date of the grant. Typically, incentive stock options and non-qualified stock options vest at the rate of
25%
per year commencing on the first or second anniversary date of the grant and expire on the tenth anniversary date of the grant. Certain of the non-qualified stock options also include performance options which vest on the later of the first anniversary date of the grant and the date the closing price of the Company’s common stock has been
25%
greater than the exercise price of the options for 30 consecutive trading days. Additionally, certain stock options may become non-forfeitable upon the associate reaching age 60, provided the associate has had five years of continuous service. The Company recognized $
20 million
, $
20 million
and $
19 million
of stock-based compensation expense in fiscal
2011
,
2010
and
2009
, respectively, related to stock options.
Restrictions on the restricted stock issued under the Plans generally lapse according to one of the following schedules: (1) the restrictions on the restricted stock lapse over various periods up to five years, (2) the restrictions on
25%
of the restricted stock lapse upon the third and sixth anniversaries of the date of issuance with the remaining
50%
of the restricted stock lapsing upon the associate’s attainment of age 62, or (3) the restrictions on
25%
of the restricted stock lapse upon the third and sixth anniversaries of the date of issuance with the remaining
50%
of the restricted stock lapsing upon the earlier of the associate’s attainment of age 60 or the tenth anniversary of the grant date. The Company has also granted performance shares
45
under the Plans, the payout of which is dependent on either (1) the Company’s total shareholder return percentile ranking compared to the performance of individual companies included in the S&P 500 index at the end of the three-year performance cycle, or (2) the Company’s performance against target average return on invested capital and operating profit over a three-year performance cycle. Additionally, certain awards may become non-forfeitable upon the associate's attainment of age 60, provided the associate has had five years of continuous service. The fair value of the restricted stock and performance shares is expensed over the period during which the restrictions lapse. The Company recorded stock-based compensation expense related to restricted stock and performance shares of $
169 million
, $
167 million
and $
158 million
in fiscal
2011
,
2010
and
2009
, respectively.
In fiscal
2011
,
2010
and
2009
, there were an aggregate of
422 thousand
,
479 thousand
and
666 thousand
deferred shares, respectively, granted under the Plans. For associates, each deferred share entitles the individual to one share of common stock to be received up to five years after the grant date of the deferred shares, subject to certain deferral rights of the associate. Additionally, certain awards may become non-forfeitable upon the associate reaching age 60, provided the associate has had five years of continuous service. The Company recorded stock-based compensation expense related to deferred shares of $
12 million
, $
14 million
and $
14 million
in fiscal
2011
,
2010
and
2009
, respectively.
As of
January 29, 2012
, there were
2 million
non-qualified stock options outstanding under non-qualified stock option plans that are not part of the Plans.
The Company maintains two Employee Stock Purchase Plans ("ESPPs") (U.S. and non-U.S. plans). The plan for U.S. associates is a tax-qualified plan under Section 423 of the Internal Revenue Code. The non-U.S. plan is not a Section 423 plan. As of
January 29, 2012
, there were
8 million
shares available under the plan for U.S associates and
20 million
shares available under the non-U.S. plan. The purchase price of shares under the ESPPs is equal to
85%
of the stock’s fair market value on the last day of the purchase period, which is a six-month period ending on December 31 and June 30 of each year. During fiscal
2011
, there were
2 million
shares purchased under the ESPPs at an average price of $
33.07
. Under the outstanding ESPPs as of
January 29, 2012
, employees have contributed $
8 million
to purchase shares at
85%
of the stock’s fair market value on the last day (June 30, 2012) of the current purchase period. The Company recognized $
14 million
, $
13 million
and $
10 million
of stock-based compensation expense in fiscal
2011
,
2010
and
2009
, respectively, related to the ESPPs.
In total, the Company recorded stock-based compensation expense, including the expense of stock options, ESPP shares, restricted stock, performance shares and deferred shares, of $
215 million
, $
214 million
and $
201 million
, in fiscal
2011
,
2010
and
2009
, respectively.
The following table summarizes stock options outstanding at
January 29, 2012
,
January 30, 2011
and
January 31, 2010
, and changes during the fiscal years ended on these dates (shares in thousands):
|
Number of
Shares
|
Weighted
Average Exercise
Price
|
|||||
|
Outstanding at February 1, 2009
|
52,014
|
|
$
|
37.91
|
|
|
|
Granted
|
4,174
|
|
23.29
|
|
||
|
Exercised
|
(374
|
)
|
24.50
|
|
||
|
Canceled
|
(6,505
|
)
|
37.65
|
|
||
|
Outstanding at January 31, 2010
|
49,309
|
|
$
|
36.81
|
|
|
|
Granted
|
3,723
|
|
32.24
|
|
||
|
Exercised
|
(1,294
|
)
|
26.63
|
|
||
|
Canceled
|
(7,271
|
)
|
43.95
|
|
||
|
Outstanding at January 30, 2011
|
44,467
|
|
$
|
35.56
|
|
|
|
Granted
|
3,236
|
|
36.55
|
|
||
|
Exercised
|
(6,938
|
)
|
33.25
|
|
||
|
Canceled
|
(7,595
|
)
|
39.11
|
|
||
|
Outstanding at January 29, 2012
|
33,170
|
|
$
|
35.32
|
|
|
46
The total intrinsic value of stock options exercised was $
47 million
, $
9 million
and $
1 million
in fiscal
2011
,
2010
and
2009
, respectively. As of
January 29, 2012
, there were approximately
33 million
stock options outstanding with a weighted average remaining life of
four
years and an intrinsic value of $
317 million
. As of
January 29, 2012
, there were approximately
22 million
stock options exercisable with a weighted average exercise price of $
40.70
, a weighted average remaining life of
two
years, and an intrinsic value of $
151 million
. As of
January 29, 2012
, there were approximately
25 million
stock options vested or expected to ultimately vest. As of
January 29, 2012
, there was $
43 million
of unamortized stock-based compensation expense related to stock options, which is expected to be recognized over a weighted average period of
two
years.
The following table summarizes restricted stock and performance shares outstanding at
January 29, 2012
,
January 30, 2011
and
January 31, 2010
, and changes during the fiscal years ended on these dates (shares in thousands):
|
Number of
Shares
|
Weighted
Average Grant
Date Fair Value
|
|||||
|
Outstanding at February 1, 2009
|
16,287
|
|
$
|
34.22
|
|
|
|
Granted
|
8,257
|
|
23.41
|
|
||
|
Restrictions lapsed
|
(1,686
|
)
|
34.65
|
|
||
|
Canceled
|
(2,195
|
)
|
31.84
|
|
||
|
Outstanding at January 31, 2010
|
20,663
|
|
$
|
30.11
|
|
|
|
Granted
|
5,799
|
|
32.31
|
|
||
|
Restrictions lapsed
|
(5,276
|
)
|
32.28
|
|
||
|
Canceled
|
(1,747
|
)
|
30.11
|
|
||
|
Outstanding at January 30, 2011
|
19,439
|
|
$
|
30.18
|
|
|
|
Granted
|
5,776
|
|
35.83
|
|
||
|
Restrictions lapsed
|
(7,937
|
)
|
31.00
|
|
||
|
Canceled
|
(1,537
|
)
|
30.48
|
|
||
|
Outstanding at January 29, 2012
|
15,741
|
|
$
|
31.81
|
|
|
As of
January 29, 2012
, there was $
287 million
of unamortized stock-based compensation expense related to restricted stock and performance shares, which is expected to be recognized over a weighted average period of
two
years. The total fair value of restricted stock and performance shares vesting during fiscal
2011
,
2010
and
2009
was $
290 million
, $
168 million
and $
41 million
, respectively.
8. LEASES
The Company leases certain retail locations, office space, warehouse and distribution space, equipment and vehicles. While most of the leases are operating leases, certain locations and equipment are leased under capital leases. As leases expire, it can be expected that, in the normal course of business, certain leases will be renewed or replaced.
Certain lease agreements include escalating rents over the lease terms. The Company expenses rent on a straight-line basis over the lease term, which commences on the date the Company has the right to control the property. The cumulative expense recognized on a straight-line basis in excess of the cumulative payments is included in Other Accrued Expenses and Other Long-Term Liabilities in the accompanying Consolidated Balance Sheets.
Total rent expense, net of minor sublease income, for fiscal
2011
,
2010
and
2009
was $
823 million
, $
821 million
and $
823 million
, respectively. Certain store leases also provide for contingent rent payments based on percentages of sales in excess of specified minimums. Contingent rent expense for fiscal
2011
,
2010
and
2009
was approximately $
4 million
, $
3 million
and $
4 million
, respectively. Real estate taxes, insurance, maintenance and operating expenses applicable to the leased property are obligations of the Company under the lease agreements.
47
The approximate future minimum lease payments under capital and all other leases at
January 29, 2012
were as follows (amounts in millions):
|
Fiscal Year
|
Capital
Leases
|
Operating
Leases
|
|||||
|
2012
|
$
|
106
|
|
$
|
800
|
|
|
|
2013
|
104
|
|
746
|
|
|||
|
2014
|
100
|
|
682
|
|
|||
|
2015
|
93
|
|
637
|
|
|||
|
2016
|
90
|
|
557
|
|
|||
|
Thereafter through 2097
|
766
|
|
4,577
|
|
|||
|
1,259
|
|
$
|
7,999
|
|
|||
|
Less imputed interest
|
810
|
|
|||||
|
Net present value of capital lease obligations
|
449
|
|
|||||
|
Less current installments
|
29
|
|
|||||
|
Long-term capital lease obligations, excluding current installments
|
$
|
420
|
|
||||
Short-term and long-term obligations for capital leases are included in the accompanying Consolidated Balance Sheets in Current Installments of Long-Term Debt and Long-Term Debt, respectively. The assets under capital leases recorded in Property and Equipment, net of amortization, totaled $
328 million
and $
336 million
at
January 29, 2012
and
January 30, 2011
, respectively.
9. EMPLOYEE BENEFIT PLANS
The Company maintains active defined contribution retirement plans for its employees (the "Benefit Plans"). All associates satisfying certain service requirements are eligible to participate in the Benefit Plans. The Company makes cash contributions each payroll period up to specified percentages of associates’ contributions as approved by the Board of Directors.
The Company also maintains a restoration plan to provide certain associates deferred compensation that they would have received under the Benefit Plans as a matching contribution if not for the maximum compensation limits under the Internal Revenue Code. The Company funds the restoration plan through contributions made to a grantor trust, which are then used to purchase shares of the Company’s common stock in the open market.
The Company’s contributions to the Benefit Plans and the restoration plan were $
171 million
, $
171 million
and $
161 million
for fiscal
2011
,
2010
and
2009
, respectively. At
January 29, 2012
, the Benefit Plans and the restoration plan held a total of
14 million
shares of the Company’s common stock in trust for plan participants.
10. BASIC AND DILUTED WEIGHTED AVERAGE COMMON SHARES
The reconciliation of basic to diluted weighted average common shares for fiscal
2011
,
2010
and
2009
was as follows (amounts in millions):
|
|
Fiscal Year Ended
|
|||||||
|
|
January 29,
2012 |
January 30,
2011 |
January 31,
2010 |
|||||
|
Weighted average common shares
|
1,562
|
|
1,648
|
|
1,683
|
|
||
|
Effect of potentially dilutive securities:
|
||||||||
|
Stock Plans
|
8
|
|
10
|
|
9
|
|
||
|
Diluted weighted average common shares
|
1,570
|
|
1,658
|
|
1,692
|
|
||
Stock plans consist of shares granted under the Company’s employee stock plans as described in Note 7 to the Consolidated Financial Statements. Options to purchase
23 million
,
39 million
and
48 million
shares of common stock at
January 29, 2012
,
January 30, 2011
and
January 31, 2010
, respectively, were excluded from the computation of Diluted Earnings per Share because their effect would have been anti-dilutive.
48
11. FAIR VALUE MEASUREMENTS
The fair value of an asset is considered to be the price at which the asset could be sold in an orderly transaction between unrelated knowledgeable and willing parties. A liability’s fair value is defined as the amount that would be paid to transfer the liability to a new obligor, not the amount that would be paid to settle the liability with the creditor. Assets and liabilities recorded at fair value are measured using a three-tier fair value hierarchy, which prioritizes the inputs used in measuring fair value. These tiers include:
|
•
|
Level 1
|
–
|
Observable inputs that reflect quoted prices in active markets
|
|
•
|
Level 2
|
–
|
Inputs other than quoted prices in active markets that are either directly or indirectly observable
|
|
•
|
Level 3
|
–
|
Unobservable inputs in which little or no market data exists, therefore requiring the Company to develop its own assumptions
|
Assets and Liabilities Measured at Fair Value on a Recurring Basis
The assets and liabilities of the Company that are measured at fair value on a recurring basis as of
January 29, 2012
and
January 30, 2011
were as follows (amounts in millions):
|
|
Fair Value at January 29, 2012 Using
|
Fair Value at January 30, 2011 Using
|
|||||||||||||||||||||
|
|
Level 1
|
Level 2
|
Level 3
|
Level 1
|
Level 2
|
Level 3
|
|||||||||||||||||
|
Derivative agreements - assets
|
$
|
—
|
|
$
|
91
|
|
$
|
—
|
|
$
|
—
|
|
$
|
47
|
|
$
|
—
|
|
|||||
|
Derivative agreements - liabilities
|
—
|
|
(27
|
)
|
—
|
|
—
|
|
(40
|
)
|
—
|
|
|||||||||||
|
Total
|
$
|
—
|
|
$
|
64
|
|
$
|
—
|
|
$
|
—
|
|
$
|
7
|
|
$
|
—
|
|
|||||
The Company uses derivative financial instruments from time to time in the management of its interest rate exposure on long-term debt and its exposure on foreign currency fluctuations. The fair value of the Company’s derivative financial instruments was measured using level 2 inputs. The Company’s derivative agreements are discussed further in Note 4.
Assets and Liabilities Measured at Fair Value on a Nonrecurring Basis
The assets and liabilities of the Company that were measured at fair value on a nonrecurring basis during fiscal
2011
,
2010
and
2009
were as follows (amounts in millions):
|
Fair Value Measured
During Fiscal 2011
Level 3
|
Gains (Losses)
|
||||||
|
Lease obligation costs, net
|
$
|
(144
|
)
|
$
|
(15
|
)
|
|
|
Total for fiscal 2011
|
$
|
(15
|
)
|
||||
|
|
Fair Value Measured
During Fiscal 2010
Level 3
|
Gains (Losses)
|
|||||
|
Lease obligation costs, net
|
$
|
(158
|
)
|
$
|
(9
|
)
|
|
|
Guarantee of HD Supply loan
|
$
|
(67
|
)
|
(51
|
)
|
||
|
Total for fiscal 2010
|
$
|
(60
|
)
|
||||
|
Fair Value Measured
During Fiscal 2009
Level 3
|
Gains (Losses)
|
||||||
|
HD Supply investment
|
$
|
—
|
|
$
|
(163
|
)
|
|
|
Lease obligation costs, net
|
$
|
(191
|
)
|
(84
|
)
|
||
|
Total for fiscal 2009
|
$
|
(247
|
)
|
||||
Lease obligation costs included in the Company’s Rationalization Charges were measured on a nonrecurring basis using fair value measurements with unobservable inputs (level 3), as further discussed in Note 2. The guarantee of the HD Supply loan was measured on a nonrecurring basis using fair value measurements with unobservable inputs (level 3), as further discussed in Note 3. Additionally, the Company impaired the value of its investment in HD Supply using fair value measurements with unobservable inputs (level 3), as further discussed in Note 3.
49
Long-lived assets, goodwill and other intangible assets were also analyzed for impairment on a nonrecurring basis using fair value measurements with unobservable inputs (level 3). Impairment charges related to long-lived assets, goodwill and other intangible assets in fiscal
2011
and
2010
were not material, as further discussed in Note 1 under the captions "Impairment of Long-Lived Assets" and "Goodwill and Other Intangible Assets," respectively.
The aggregate fair value of the Company’s Senior Notes, based on quoted market prices, was $
12.1 billion
and $
9.8 billion
at
January 29, 2012
and
January 30, 2011
, respectively, compared to a carrying value of $
10.3 billion
and $
9.3 billion
at
January 29, 2012
and
January 30, 2011
, respectively.
12. COMMITMENTS AND CONTINGENCIES
At
January 29, 2012
, the Company was contingently liable for approximately
$413 million
under outstanding letters of credit and open accounts issued for certain business transactions, including insurance programs, trade contracts and construction contracts. The Company’s letters of credit are primarily performance-based and are not based on changes in variable components, a liability or an equity security of the other party.
The Company is involved in litigation arising from the normal course of business. In management’s opinion, this litigation is not expected to have a material adverse effect on the Company’s consolidated financial condition or results of operations.
13. QUARTERLY FINANCIAL DATA (UNAUDITED)
The following is a summary of the quarterly consolidated results of operations for the fiscal years ended
January 29, 2012
and
January 30, 2011
(amounts in millions, except per share data):
|
Net Sales
|
Gross
Profit
|
Net Earnings
|
Basic
Earnings per
Share
|
Diluted
Earnings per
Share
|
|||||||||||||||
|
Fiscal Year Ended January 29, 2012:
|
|||||||||||||||||||
|
First Quarter
|
$
|
16,823
|
|
$
|
5,828
|
|
$
|
812
|
|
$
|
0.51
|
|
$
|
0.50
|
|
||||
|
Second Quarter
|
20,232
|
|
6,876
|
|
1,363
|
|
0.87
|
|
0.86
|
|
|||||||||
|
Third Quarter
|
17,326
|
|
5,961
|
|
934
|
|
0.61
|
|
0.60
|
|
|||||||||
|
Fourth Quarter
|
16,014
|
|
5,597
|
|
774
|
|
0.51
|
|
0.50
|
|
|||||||||
|
Fiscal Year
|
$
|
70,395
|
|
$
|
24,262
|
|
$
|
3,883
|
|
$
|
2.49
|
|
$
|
2.47
|
|
||||
|
Fiscal Year Ended January 30, 2011:
|
|||||||||||||||||||
|
First Quarter
|
$
|
16,863
|
|
$
|
5,794
|
|
$
|
725
|
|
$
|
0.43
|
|
$
|
0.43
|
|
||||
|
Second Quarter
|
19,410
|
|
6,582
|
|
1,192
|
|
0.72
|
|
0.72
|
|
|||||||||
|
Third Quarter
|
16,598
|
|
5,685
|
|
834
|
|
0.51
|
|
0.51
|
|
|||||||||
|
Fourth Quarter
|
15,126
|
|
5,243
|
|
587
|
|
0.36
|
|
0.36
|
|
|||||||||
|
Fiscal Year
|
$
|
67,997
|
|
$
|
23,304
|
|
$
|
3,338
|
|
$
|
2.03
|
|
$
|
2.01
|
|
||||
—————
Note: The quarterly data may not sum to fiscal year totals.
50
Not applicable.
Disclosure Controls and Procedures
The Company maintains disclosure controls and procedures as defined in Rule 13a-15(e) under the Exchange Act that are designed to ensure that information required to be disclosed in the Company’s Exchange Act reports is recorded, processed, summarized and reported within the time periods specified in the SEC’s rules and forms, and that such information is accumulated and communicated to the Company’s management, including its Chief Executive Officer and Chief Financial Officer, as appropriate, to allow timely decisions regarding required disclosure.
The Company’s management, with the participation of the Company’s Chief Executive Officer and Chief Financial Officer, has evaluated the effectiveness of the Company’s disclosure controls and procedures as of the end of the period covered by this report. Based on that evaluation, the Chief Executive Officer and the Chief Financial Officer have concluded that, as of the end of the period covered by this report, the Company’s disclosure controls and procedures were effective.
Internal Control Over Financial Reporting
A report of the Company’s management on the Company’s internal control over financial reporting (as such term is defined in Rule 13a-15(f) under the Exchange Act) and a report of KPMG LLP, an independent registered public accounting firm, on the effectiveness of the Company’s internal control over financial reporting are incorporated by reference to Item 8, "Financial Statements and Supplementary Data" of this report.
There have not been any changes in the Company’s internal control over financial reporting during the fiscal quarter ended
January 29, 2012
that have materially affected, or are reasonably likely to materially affect, the Company’s internal control over financial reporting.
Not applicable.
51
Information required by this item, other than the information regarding the executive officers of the Company set forth below, is incorporated by reference to the sections entitled "Election of Directors," "Board of Directors Information," "General" and "Audit Committee Report" in the Company’s Proxy Statement for the
2012
Annual Meeting of Shareholders (the "Proxy Statement").
Executive officers of the Company are appointed by, and serve at the pleasure of, the Board of Directors. The current executive officers of the Company are as follows:
FRANCIS S. BLAKE, age 62, has been Chairman and Chief Executive Officer since January 2007. From March 2002 through January 2007, he served as the Company’s Executive Vice President – Business Development and Corporate Operations.
MATTHEW A. CAREY, age 47, has been Executive Vice President and Chief Information Officer since September 2008. From January 2006 through August 2008, he served as Senior Vice President and Chief Technology Officer at eBay. Mr. Carey was previously with Wal-Mart from June 1985 to December 2005. His final position with Wal-Mart was Senior Vice President and Chief Technology Officer. Mr. Carey serves as a director of Geeknet.com, a technology-oriented online media company.
TIMOTHY M. CROW, age 56, has been Executive Vice President – Human Resources since February 2007. From March 2005 through February 2007, he served as Senior Vice President – Human Resources, Organization, Talent and Performance Systems and he served as Vice President – Human Resources, Performance Systems from May 2002 through March 2005. Mr. Crow previously served as Senior Vice President – Human Resources of K-Mart Corporation, a mass merchandising company, from May 1999 through May 2002.
MARVIN R. ELLISON, age 47, has been Executive Vice President – U.S. Stores since August 2008. From January 2006 through August 2008, he served as President – Northern Division. From August 2005 through January 2006, he served as Senior Vice President – Logistics and from October 2004 through August 2005 he served as Vice President – Logistics. From June 2002 through October 2004, he served as Vice President – Loss Prevention. From 1987 until June 2002, Mr. Ellison held various management and executive level positions with Target Corporation, a general merchandise retailer. His final position with Target was Director, Assets Protection. Mr. Ellison serves as a director of H&R Block, Inc., a tax preparation company.
CRAIG A. MENEAR, age 54, has been Executive Vice President – Merchandising since April 2007. From August 2003 through April 2007, he served as Senior Vice President – Merchandising. From 1997 through August 2003, Mr. Menear served in various management and vice president level positions in the Company’s Merchandising department, including Merchandising Vice President of Hardware, Merchandising Vice President of the Southwest Division, and Divisional Merchandise Manager of the Southwest Division.
CAROL B. TOMÉ, age 55, has been Chief Financial Officer since May 2001 and Executive Vice President – Corporate Services since January 2007. Prior thereto, Ms. Tomé served as Senior Vice President – Finance and Accounting/Treasurer from February 2000 through May 2001 and as Vice President and Treasurer from 1995 through February 2000. From 1992 until 1995, when she joined the Company, Ms. Tomé was Vice President and Treasurer of Riverwood International Corporation, a provider of paperboard packaging. Ms. Tomé serves as a director of United Parcel Service, Inc., a package delivery company, and as chairman of the board of directors of the Federal Reserve Bank of Atlanta.
TERESA WYNN ROSEBOROUGH, age 53, has been Executive Vice President, General Counsel and Corporate Secretary since November 2011. From April 2006 through November 2011, Ms. Roseborough served in several legal positions with MetLife, Inc., a provider of insurance and other financial services, including Senior Chief Counsel – Compliance & Litigation and most recently as Deputy General Counsel. Prior to joining MetLife, Ms. Roseborough was a partner with the law firm Sutherland Asbill & Brennan LLP from February 1996 through March 2006 and a Deputy Assistant Attorney General in the Office of Legal Counsel of the United States Department of Justice from January 1994 through February 1996.
52
The information required by this item is incorporated by reference to the sections entitled "Executive Compensation," "Leadership Development and Compensation Committee Report" and "Director Compensation" in the Company’s Proxy Statement.
The information required by this item is incorporated by reference to the sections entitled "Beneficial Ownership of Common Stock" and "Executive Compensation – Equity Compensation Plan Information" in the Company’s Proxy Statement.
The information required by this item is incorporated by reference to the sections entitled "Board of Directors Information" and "General" in the Company’s Proxy Statement.
The information required by this item is incorporated by reference to the section entitled "Independent Registered Public Accounting Firm’s Fees" in the Company’s Proxy Statement.
53
(a)(1)
Financial Statements
The following financial statements are set forth in Item 8 hereof:
|
—
|
Management’s Responsibility for Financial Statements and Management’s Report on Internal Control Over Financial Reporting; and
|
|
—
|
Reports of Independent Registered Public Accounting Firm.
|
|
—
|
Consolidated Statements of Earnings for the fiscal years ended
January 29, 2012
,
January 30, 2011
and
January 31, 2010
;
|
|
—
|
Consolidated Balance Sheets as of
January 29, 2012
and
January 30, 2011
;
|
|
—
|
Consolidated Statements of Stockholders’ Equity and Comprehensive Income for the fiscal years ended
January 29, 2012
,
January 30, 2011
and
January 31, 2010
;
|
|
—
|
Consolidated Statements of Cash Flows for the fiscal years ended
January 29, 2012
,
January 30, 2011
and
January 31, 2010
;
|
|
—
|
Notes to Consolidated Financial Statements;
|
(2)
Financial Statement Schedules
All schedules are omitted as the required information is inapplicable or the information is presented in the consolidated financial statements or related notes.
(b)
Exhibits
Exhibits marked with an asterisk (*) are incorporated by reference to exhibits previously filed with the SEC, as indicated by the references in brackets. All other exhibits are filed or furnished herewith. Our Current, Quarterly and Annual Reports are filed with the SEC under File No. 1-8207. Our Registration Statements have the file numbers noted wherever such statements are identified in the following list of exhibits. The Company will furnish a copy of any exhibit to shareholders without charge upon written request to Investor Relations, The Home Depot, Inc., 2455 Paces Ferry Road, Atlanta, Georgia 30339, via the Internet at http://ir.homedepot.com, or by calling Investor Relations at (770) 384-4388.
|
*
3.1
|
Amended and Restated Certificate of Incorporation of The Home Depot, Inc.
[Form 10-Q for the fiscal quarter ended July 31, 2011, Exhibit 3.1]
|
|
*
3.2
|
By-Laws of The Home Depot, Inc. (Amended and Restated Effective June 2, 2011)
[Form 8-K filed on June 7, 2011, Exhibit 3.1]
|
|
*
4.1
|
Indenture, dated as of May 4, 2005, between The Home Depot, Inc. and The Bank of New York Trust Company, N.A., as Trustee.
[Form S-3 (File No. 333-124699) filed May 6, 2005, Exhibit 4.1]
|
|
*
4.2
|
Form of 5.40% Senior Note due March 1, 2016.
[Form 8-K filed March 23, 2006, Exhibit 4.2]
|
|
*
4.3
|
Form of 5.250% Senior Note due December 16, 2013.
[Form 8-K filed December 19, 2006, Exhibit 4.2]
|
|
*
4.4
|
Form of 5.875% Senior Note due December 16, 2036.
[Form 8-K filed December 19, 2006, Exhibit 4.3]
|
|
*
4.5
|
Form of 3.95% Senior Note due September 15, 2020.
[Form 8-K filed September 10, 2010, Exhibit 4.1]
|
|
*
4.6
|
Form of 5.40% Senior Note due September 15, 2040.
[Form 8-K filed September 10, 2010, Exhibit 4.2]
|
|
*
4.7
|
Form of 4.40% Senior Note due April 1, 2021.
[Form 8-K filed March 31, 2011, Exhibit 4.1]
|
|
*
4.8
|
Form of 5.95% Senior Note due April 1, 2041.
[Form 8-K filed March 31, 2011, Exhibit 4.2]
|
|
*
10.1
†
|
The Home Depot, Inc. 1997 Omnibus Stock Incentive Plan.
[Form 10-Q for the fiscal quarter ended August 4, 2002, Exhibit 10.1]
|
|
*
10.2
†
|
Form of Executive Employment Death Benefit Agreement.
[Form 10-K for the fiscal year ended January 30, 2011, Exhibit 10.2]
|
|
*
10.3
†
|
The Home Depot Deferred Compensation Plan for Officers (As Amended and Restated Effective January 1, 2008).
[Form 8-K filed on August 20, 2007, Exhibit 10.1]
|
54
|
*
10.4
†
|
Amendment No. 1 to The Home Depot Deferred Compensation Plan for Officers (As Amended and Restated Effective January 1, 2008).
[Form 10-K for the fiscal year ended January 31, 2010, Exhibit 10.4]
|
|
*
10.5
†
|
The Home Depot, Inc. 2005 Omnibus Stock Incentive Plan.
[Form 8-K filed on May 27, 2005, Exhibit 10.8]
|
|
*
10.6
†
|
Amendment No. 1 to The Home Depot, Inc. 2005 Omnibus Stock Incentive Plan and The Home Depot, Inc. 1997 Omnibus Stock Incentive Plan.
[Form 10-K for the fiscal year ended January 31, 2010, Exhibit 10.6]
|
|
*
10.7
†
|
The Home Depot FutureBuilder Restoration Plan.
[Form 8-K filed on August 20, 2007, Exhibit 10.2]
|
|
*
10.8
†
|
The Home Depot, Inc. Non-Employee Directors’ Deferred Stock Compensation Plan.
[Form 8-K filed on August 20, 2007, Exhibit 10.3]
|
|
*
10.9
†
|
The Home Depot, Inc. Management Incentive Plan (Effective February 2, 2008).
[Form 8-K filed on May 28, 2008, Exhibit 10.1]
|
|
*
10.10
†
|
The Home Depot, Inc. Amended and Restated Employee Stock Purchase Plan, as amended and restated effective July 1, 2008.
[Form S-8 filed June 23, 2008, Exhibit 10.1 (File No. 333-151849)]
|
|
*
10.11
†
|
Form of Executive Officer Restricted Stock Award Pursuant to The Home Depot, Inc. 1997 Omnibus Stock Incentive Plan.
[Form 10-Q for the fiscal quarter ended October 31, 2004, Exhibit 10.1]
|
|
*
10.12
†
|
Form of Restricted Stock Award Pursuant to The Home Depot, Inc. 2005 Omnibus Stock Incentive Plan.
[Form 8-K filed on March 3, 2008, Exhibit 10.2]
|
|
*
10.13
†
|
Form of U.S. Restricted Stock Award Pursuant to The Home Depot, Inc. 2005 Omnibus Stock Incentive Plan.
[Form 8-K filed on March 13, 2009, Exhibit 10.1]
|
|
*
10.14
†
|
Form of Nonqualified Stock Option Pursuant to The Home Depot, Inc. 2005 Omnibus Stock Incentive Plan.
[Form 8-K filed on March 27, 2007, Exhibit 10.6]
|
|
*
10.15
†
|
Form of Executive Officer Nonqualified Stock Option Award Pursuant to The Home Depot, Inc. 2005 Omnibus Stock Incentive Plan.
[Form 8-K filed on March 13, 2009, Exhibit 10.4]
|
|
*
10.16
†
|
Form of Outside Director Nonqualified Stock Option Award Pursuant to The Home Depot, Inc. 1997 Omnibus Stock Incentive Plan.
[Form 10-Q for the fiscal quarter ended October 31, 2004, Exhibit 10.3]
|
|
*
10.17
†
|
Form of Nonqualified Stock Option (Non-Employee Directors) Pursuant to The Home Depot, Inc. 2005 Omnibus Stock Incentive Plan.
[Form 8-K filed on March 27, 2007, Exhibit 10.5]
|
|
*
10.18
†
|
Form of Non-Employee Director Nonqualified Stock Option Award Pursuant to The Home Depot, Inc. 2005 Omnibus Stock Incentive Plan.
[Form 8-K filed on March 13, 2009, Exhibit 10.5]
|
|
*
10.19
†
|
Form of Deferred Share Award (Non-Employee Director) Pursuant to The Home Depot, Inc. 2005 Omnibus Stock Incentive Plan.
[Form 8-K filed on March 27, 2007, Exhibit 10.2]
|
|
*
10.20
†
|
Form of Performance Vested Option Award Pursuant to The Home Depot, Inc. 2005 Omnibus Stock Incentive Plan.
[Form 8-K filed on March 27, 2007, Exhibit 10.9]
|
|
*
10.21
†
|
Non-Qualified Stock Option and Deferred Stock Unit Plan and Agreement dated as of December 4, 2000.
[Form 10-K for the fiscal year ended January 28, 2001, Exhibit 10.20]
|
|
*
10.22
†
|
Form of Performance Share Award Pursuant to The Home Depot, Inc. 2005 Omnibus Stock Incentive Plan.
[Form 8-K filed on March 27, 2007, Exhibit 10.7]
|
|
*
10.23
†
|
Form of LTIP Performance Unit Award Pursuant to The Home Depot, Inc. 2005 Omnibus Stock Incentive Plan.
[Form 8-K filed on March 27, 2007, Exhibit 10.10]
|
|
*
10.24
†
|
Form of Performance Share Award Pursuant to The Home Depot, Inc. 2005 Omnibus Stock Incentive Plan.
[Form 8-K filed on March 13, 2009, Exhibit 10.6]
|
|
*
10.25
†
|
Form of Equity Award Terms and Conditions Agreement Pursuant to The Home Depot, Inc. 2005 Omnibus Stock Incentive Plan.
[Form 8-K filed on March 2, 2011, Exhibit 10.1]
|
|
*
10.26
†
|
Separation Agreement Between the Company and Robert Nardelli effective as of January 2, 2007.
[Form 10-K for the fiscal year ended January 28, 2007, Exhibit 10.37]
|
|
*
10.27
†
|
Deferred Payment Trust dated as of January 12, 2007.
[Form 10-K for the fiscal year ended January 28, 2007, Exhibit 10.38]
|
55
|
*
10.28
†
|
Employment Arrangement between Francis S. Blake and The Home Depot, Inc., dated January 23, 2007.
[Form 8-K/A filed on January 24, 2007, Exhibit 10.1]
|
|
*
10.29
†
|
Employment Arrangement between Carol B. Tomé and The Home Depot, Inc., dated January 22, 2007.
[Form 8- K/A filed on January 24, 2007, Exhibit 10.2]
|
|
*
10.30
†
|
Employment Arrangement between Craig A. Menear and The Home Depot, Inc., dated April 25, 2007.
[Form 10-K for the fiscal year ended February 3, 2008, Exhibit 10.47]
|
|
*
10.31
†
|
Employment Arrangement between Marvin R. Ellison and The Home Depot, Inc., dated August 27, 2008.
[Form 10-K for the fiscal year ended January 31, 2010, Exhibit 10.35]
|
|
*
10.32
†
|
Employment Arrangement between Matthew A. Carey and The Home Depot, Inc., dated August 22, 2008, as amended on September 3, 2008.
[Form 10-K for the fiscal year ended January 30, 2011, Exhibit 10.36]
|
|
*
10.33
|
Purchase and Sale Agreement, dated as of June 19, 2007, by and between The Home Depot, Inc., THD Holdings, LLC, Home Depot International, Inc., Homer TLC, Inc. and Pro Acquisition Corporation.
[Form 8-K filed on June 20, 2007, Exhibit 2.1]
|
|
*
10.34
|
Letter agreement, dated August 14, 2007, by and between The Home Depot, Inc., THD Holdings, LLC, Home Depot International, Inc., Homer TLC, Inc. and Pro Acquisition Corporation.
[Form 8-K filed on August 15, 2007, Exhibit 2.1]
|
|
*
10.35
|
Amendment, dated August 27, 2007, by and between The Home Depot, Inc., THD Holdings, LLC, Home Depot International, Inc., Homer TLC, Inc. and Pro Acquisition Corporation.
[Form 10-Q for the fiscal quarter ended July 29, 2007, Exhibit 2.3]
|
|
*
10.36
|
Participation Agreement dated as of October 22, 1998 among The Home Depot, Inc. as Guarantor; Home Depot U.S.A., Inc. as Lessee; HD Real Estate Funding Corp. II as Facility Lender; Credit Suisse Leasing 92A L.P. as Lessor; The Bank of New York as Indenture Trustee; and Credit Suisse First Boston Corporation and Invemed Associates, Inc. as Initial Purchasers.
[Form 10-K for the fiscal year ended January 31, 1999, Exhibit 10.10]
|
|
*
10.37
|
Master Modification Agreement dated as of April 20, 1998 among The Home Depot, Inc. as Guarantor; Home Depot U.S.A., Inc., as Lessee and Construction Agent; HD Real Estate Funding Corp., as Facility Lender; Credit Suisse Leasing 92A L.P. as Lessor; the lenders named on the Schedule thereto as Lenders; and Credit Suisse First Boston Corporation as Agent Bank.
[Form 10-K for the fiscal year ended January 31, 1999, Exhibit 10.13]
|
|
12
|
Statement of Computation of Ratio of Earnings to Fixed Charges.
|
|
*
21
|
List of Subsidiaries of the Company.
[Form 10-K for the fiscal year ended January 31, 2010, Exhibit 21]
|
|
23
|
Consent of Independent Registered Public Accounting Firm.
|
|
31.1
|
Certification of Chief Executive Officer, pursuant to Rule 13a-14(a) promulgated under the Securities Exchange Act of 1934, as amended.
|
|
31.2
|
Certification of Chief Financial Officer, pursuant to Rule 13a-14(a) promulgated under the Securities Exchange Act of 1934, as amended.
|
|
32.1
**
|
Certification of Chief Executive Officer, pursuant to 18 U.S.C. Section 1350, as adopted pursuant to Section 906 of the Sarbanes-Oxley Act of 2002.
|
|
32.2
**
|
Certification of Chief Financial Officer, pursuant to 18 U.S.C. Section 1350, as adopted pursuant to Section 906 of the Sarbanes-Oxley Act of 2002.
|
|
101
|
The following financial information from the Annual Report on Form 10-K for the fiscal year ended January 29, 2012, formatted in XBRL (Extensible Business Reporting Language) and filed electronically herewith: (i) the Consolidated Statements of Earnings; (ii) the Consolidated Balance Sheets; (iii) the Consolidated Statements of Cash Flows; (iv) the Consolidated Statements of Comprehensive Income; and (v) the Notes to the Consolidated Financial Statements.
|
—————
|
†
|
Management contract or compensatory plan or arrangement.
|
|
**
|
Furnished (and not filed) herewith pursuant to Item 601(b)(32)(ii) of the SEC's Regulation S-K.
|
56
SIGNATURES
Pursuant to the requirements of Section 13 or 15(d) of the Securities Exchange Act of 1934, the Registrant has duly caused this report to be signed on its behalf by the undersigned, thereunto duly authorized.
|
THE HOME DEPOT, INC.
(Registrant)
|
||
|
By:
|
|
/s/ F
RANCIS
S. B
LAKE
|
|
|
(Francis S. Blake, Chairman
and Chief Executive Officer)
|
|
|
Date:
|
March 21, 2012
|
|
Pursuant to the requirements of the Securities Exchange Act of 1934, this report has been signed below by the following persons on behalf of the Registrant and in the capacities and on the dates indicated.
|
Signature
|
|
Title
|
|
Date
|
|
/s/ F
RANCIS
S. B
LAKE
|
|
Chairman and Chief Executive Officer
(Principal Executive Officer)
|
|
March 21, 2012
|
|
(Francis S. Blake)
|
||||
|
/s/ C
AROL
B. T
OMÉ
|
|
Chief Financial Officer and Executive Vice President – Corporate Services (Principal Financial Officer and Principal Accounting Officer)
|
|
March 21, 2012
|
|
(Carol B. Tomé)
|
||||
|
/s/ F. D
UANE
A
CKERMAN
|
|
Director
|
|
March 21, 2012
|
|
(F. Duane Ackerman)
|
||||
|
/s/ A
RI
B
OUSBIB
|
|
Director
|
|
March 21, 2012
|
|
(Ari Bousbib)
|
||||
|
/s/ G
REGORY
D. B
RENNEMAN
|
|
Director
|
|
March 21, 2012
|
|
(Gregory D. Brenneman)
|
||||
|
/s/ J. F
RANK
B
ROWN
|
|
Director
|
|
March 21, 2012
|
|
(J. Frank Brown)
|
||||
|
/s/ A
LBERT
P. C
AREY
|
|
Director
|
|
March 21, 2012
|
|
(Albert P. Carey)
|
||||
|
/s/ A
RMANDO
C
ODINA
|
|
Director
|
|
March 21, 2012
|
|
(Armando Codina)
|
||||
|
/s/ B
ONNIE
G. H
ILL
|
|
Director
|
|
March 21, 2012
|
|
(Bonnie G. Hill)
|
||||
|
/s/ K
AREN
L. K
ATEN
|
|
Director
|
|
March 21, 2012
|
|
(Karen L. Katen)
|
||||
|
/s/ R
ONALD
L. S
ARGENT
|
|
Director
|
|
March 21, 2012
|
|
(Ronald L. Sargent)
|
||||
57
Five-Year Summary of Financial and Operating Results
The Home Depot, Inc. and Subsidiaries
|
amounts in millions, except where noted
|
2011
|
2010
|
2009
|
2008
|
2007
(1)
|
||||||||||||||
|
STATEMENT OF EARNINGS DATA
(2)
|
|||||||||||||||||||
|
Net sales
|
$
|
70,395
|
|
$
|
67,997
|
|
$
|
66,176
|
|
$
|
71,288
|
|
$
|
77,349
|
|
||||
|
Net sales increase (decrease) (%)
|
3.5
|
|
2.8
|
|
(7.2
|
)
|
(7.8
|
)
|
(2.1
|
)
|
|||||||||
|
Earnings before provision for income taxes
|
6,068
|
|
5,273
|
|
3,982
|
|
3,590
|
|
6,620
|
|
|||||||||
|
Net earnings
|
3,883
|
|
3,338
|
|
2,620
|
|
2,312
|
|
4,210
|
|
|||||||||
|
Net earnings increase (decrease) (%)
|
16.3
|
|
27.4
|
|
13.3
|
|
(45.1
|
)
|
(20.1
|
)
|
|||||||||
|
Diluted earnings per share ($)
|
2.47
|
|
2.01
|
|
1.55
|
|
1.37
|
|
2.27
|
|
|||||||||
|
Diluted earnings per share increase (decrease) (%)
|
22.9
|
|
29.7
|
|
13.1
|
|
(39.6
|
)
|
(11.0
|
)
|
|||||||||
|
Diluted weighted average number of common shares
|
1,570
|
|
1,658
|
|
1,692
|
|
1,686
|
|
1,856
|
|
|||||||||
|
Gross margin – % of sales
|
34.5
|
|
34.3
|
|
33.9
|
|
33.7
|
|
33.6
|
|
|||||||||
|
Total operating expenses – % of sales
|
25.0
|
|
25.7
|
|
26.6
|
|
27.5
|
|
24.3
|
|
|||||||||
|
Interest and other, net – % of sales
|
0.8
|
|
0.8
|
|
1.2
|
|
1.1
|
|
0.8
|
|
|||||||||
|
Earnings before provision for income taxes – % of sales
|
8.6
|
|
7.8
|
|
6.0
|
|
5.0
|
|
8.6
|
|
|||||||||
|
Net earnings – % of sales
|
5.5
|
|
4.9
|
|
4.0
|
|
3.2
|
|
5.4
|
|
|||||||||
|
BALANCE SHEET DATA AND FINANCIAL RATIOS
(2)
|
|||||||||||||||||||
|
Total assets
|
$
|
40,518
|
|
$
|
40,125
|
|
$
|
40,877
|
|
$
|
41,164
|
|
$
|
44,324
|
|
||||
|
Working capital
|
5,144
|
|
3,357
|
|
3,537
|
|
2,209
|
|
1,968
|
|
|||||||||
|
Merchandise inventories
|
10,325
|
|
10,625
|
|
10,188
|
|
10,673
|
|
11,731
|
|
|||||||||
|
Net property and equipment
|
24,448
|
|
25,060
|
|
25,550
|
|
26,234
|
|
27,476
|
|
|||||||||
|
Long-term debt
|
10,758
|
|
8,707
|
|
8,662
|
|
9,667
|
|
11,383
|
|
|||||||||
|
Stockholders’ equity
|
17,898
|
|
18,889
|
|
19,393
|
|
17,777
|
|
17,714
|
|
|||||||||
|
Book value per share ($)
|
11.64
|
|
11.64
|
|
11.42
|
|
10.48
|
|
10.48
|
|
|||||||||
|
Long-term debt-to-equity (%)
|
60.1
|
|
46.1
|
|
44.7
|
|
54.4
|
|
64.3
|
|
|||||||||
|
Total debt-to-equity (%)
|
60.3
|
|
51.6
|
|
49.9
|
|
64.3
|
|
75.8
|
|
|||||||||
|
Current ratio
|
1.55:1
|
|
1.33:1
|
|
1.34:1
|
|
1.20:1
|
|
1.15:1
|
|
|||||||||
|
Inventory turnover
|
4.3x
|
|
4.1x
|
|
4.1x
|
|
4.0x
|
|
4.2x
|
|
|||||||||
|
Return on invested capital (%)
|
14.9
|
|
12.8
|
|
10.7
|
|
9.5
|
|
13.9
|
|
|||||||||
|
STATEMENT OF CASH FLOWS DATA
|
|||||||||||||||||||
|
Depreciation and amortization
|
$
|
1,682
|
|
$
|
1,718
|
|
$
|
1,806
|
|
$
|
1,902
|
|
$
|
1,906
|
|
||||
|
Capital expenditures
|
1,221
|
|
1,096
|
|
966
|
|
1,847
|
|
3,558
|
|
|||||||||
|
Cash dividends per share ($)
|
1.040
|
|
0.945
|
|
0.900
|
|
0.900
|
|
0.900
|
|
|||||||||
|
STORE DATA
|
|||||||||||||||||||
|
Number of stores
|
2,252
|
|
2,248
|
|
2,244
|
|
2,274
|
|
2,234
|
|
|||||||||
|
Square footage at fiscal year-end (in thousands)
|
235
|
|
235
|
|
235
|
|
238
|
|
235
|
|
|||||||||
|
Increase (decrease) in square footage (%)
|
—
|
|
—
|
|
(1.3
|
)
|
1.3
|
|
4.9
|
|
|||||||||
|
Average square footage per store (in thousands)
|
104
|
|
105
|
|
105
|
|
105
|
|
105
|
|
|||||||||
|
STORE SALES AND OTHER DATA
|
|||||||||||||||||||
|
Comparable store sales increase (decrease) (%)
(3)
|
3.4
|
|
2.9
|
|
(6.6
|
)
|
(8.7
|
)
|
(6.7
|
)
|
|||||||||
|
Weighted average weekly sales per operating store (in thousands)
|
$
|
601
|
|
$
|
581
|
|
$
|
563
|
|
$
|
601
|
|
$
|
658
|
|
||||
|
Weighted average sales per square foot ($)
|
299
|
|
289
|
|
279
|
|
298
|
|
332
|
|
|||||||||
|
Number of customer transactions
|
1,318
|
|
1,306
|
|
1,274
|
|
1,272
|
|
1,336
|
|
|||||||||
|
Average ticket ($)
|
53.28
|
|
51.93
|
|
51.76
|
|
55.61
|
|
57.48
|
|
|||||||||
|
Number of associates at fiscal year-end
(2)
|
331,000
|
|
321,000
|
|
317,000
|
|
322,000
|
|
331,000
|
|
|||||||||
|
(1)
|
Fiscal year 2007 includes 53 weeks; all other fiscal years reported include 52 weeks.
|
|
(2)
|
Continuing Operations only. See Note 3 to the Consolidated Financial Statements included in Item 8, "Financial Statements and Supplementary Data."
|
|
(3)
|
Includes Net Sales at locations open greater than 12 months, including relocated and remodeled stores. Stores become comparable on the Monday following their 365th day of operation. Comparable store sales is intended only as supplemental information and is not a substitute for Net Sales or Net Earnings presented in accordance with generally accepted accounting principles.
|
F-1
INDEX OF ATTACHED EXHIBITS
|
12
|
Statement of Computation of Ratio of Earnings to Fixed Charges.
|
|
23
|
Consent of Independent Registered Public Accounting Firm.
|
|
31.1
|
Certification of Chief Executive Officer, pursuant to Rule 13a-14(a) promulgated under the Securities Exchange Act of 1934, as amended.
|
|
31.2
|
Certification of Chief Financial Officer, pursuant to Rule 13a-14(a) promulgated under the Securities Exchange Act of 1934, as amended.
|
|
32.1
*
|
Certification of Chief Executive Officer, pursuant to 18 U.S.C. Section 1350, as adopted pursuant to Section 906 of the Sarbanes-Oxley Act of 2002.
|
|
32.2
*
|
Certification of Chief Financial Officer, pursuant to 18 U.S.C. Section 1350, as adopted pursuant to Section 906 of the Sarbanes-Oxley Act of 2002.
|
|
101
|
The following financial information from the Annual Report on Form 10-K for the fiscal year ended January 29, 2012, formatted in XBRL (Extensible Business Reporting Language) and filed electronically herewith: (i) the Consolidated Statements of Earnings; (ii) the Consolidated Balance Sheets; (iii) the Consolidated Statements of Cash Flows; (iv) the Consolidated Statements of Comprehensive Income; and (v) the Notes to the Consolidated Financial Statements.
|
* Furnished (and not filed) herewith pursuant to Item 601(b)(32)(ii) of the SEC's Regulation S-K.
TABLE OF CONTENTS
Part IItem 1. BusinessItem 1A. Risk FactorsItem 1B. Unresolved Staff CommentsItem 2. PropertiesItem 3. Legal ProceedingsItem 4. Mine Safety DisclosuresPart IIItem 5. Market For Registrant S Common Equity, Related Stockholder Matters and Issuer Purchases Of Equity SecuritiesItem 6. Selected Financial DataItem 7. Management S Discussion and Analysis Of Financial Condition and Results Of OperationsItem 7A. Quantitative and Qualitative Disclosures About Market RiskItem 8. Financial Statements and Supplementary DataItem 9. Changes in and Disagreements with Accountants on Accounting and Financial DisclosureItem 9A. Controls and ProceduresItem 9B. Other InformationPart IIIItem 10. Directors, Executive Officers and Corporate GovernanceItem 11. Executive CompensationItem 12. Security Ownership Of Certain Beneficial Owners and Management and Related Stockholder MattersItem 13. Certain Relationships and Related Transactions, and Director IndependenceItem 14. Principal Accounting Fees and ServicesPart IVItem 15. Exhibits, Financial Statement Schedules