HERITAGE GLOBAL INC.
10-Ks and 10-Qs
|
|
|
|
|
|
|
|
|
|
|
|
|
|
|
|
|
|
|
|
|
|
|
|
|
|
|
|
|
|
|
|
UNITED
STATES
SECURITIES
AND EXCHANGE COMMISSION
Washington,
D.C. 20549
FORM
10-K
x
ANNUAL REPORT PURSUANT TO SECTION
13
OR
15(d) OF THE SECURITIES EXCHANGE ACT OF 1934
FOR
THE FISCAL YEAR ENDED DECEMBER 31, 2009
Commission
File No. 0-17973
C2
GLOBAL TECHNOLOGIES INC.
(Exact
Name of Registrant as Specified in Its Charter)
|
Florida
|
59-2291344
|
|
(State
or Other Jurisdiction
|
(I.R.S.
Employer
|
|
of
Incorporation or Organization)
|
Identification
No.)
|
|
3200
– 40 King St. West, Toronto, Ontario, Canada
|
M5H
3Y2
|
|
(Address
of Principal Executive Offices)
|
(Zip
Code)
|
(416)
866-3000
(Registrant’s
Telephone Number, Including Area Code)
Securities
registered pursuant to Section 12(b) of the Act:
None.
Securities
registered pursuant to Section 12(g) of the Act:
Common Stock, $0.01 par
value.
Indicate
by check mark if the registrant is a well-known seasoned issuer, as defined in
Rule 405 of the Securities Act. Yes
¨
No
þ
Indicate
by check mark if the registrant is not required to file reports pursuant to
Section 13 or Section 15(d) of the Act. Yes
¨
No
þ
Indicate by check mark whether the
registrant: (1) has filed all reports required to be filed by Section 13 or
15(d) of the Securities Exchange Act of 1934 during the preceding 12 months (or
for such shorter period that the registrant was required to file such reports),
and (2) has been subject to such filing requirements for the past 90 days. Yes
þ
No
¨
Indicate
by check mark whether the registrant has submitted electronically and posted on
its corporate Web site, if any, every Interactive Data File required to be
submitted and posted pursuant to Rule 405 of Regulation S-T during the preceding
12 months (or for such shorter period that the registrant was required to submit
and post such files). Yes
¨
No
¨
Indicate
by check mark if disclosure of delinquent filers pursuant to Item 405 of
Regulation S-K is not contained herein, and will not be contained, to the best
of registrant’s knowledge, in definitive proxy or information statements
incorporated by reference in Part III of this Form 10-K or any amendment to this
Form 10-K.
¨
Indicate
by check mark whether the registrant is a large accelerated filer, an
accelerated filer, a non-accelerated filer, or a smaller reporting company (as
defined in Rule 12b-2 of the Exchange Act).
Large
Accelerated Filer
¨
Accelerated
Filer
¨
Non-Accelerated Filer
þ
Smaller Reporting Company
¨
Indicate
by check mark whether the registrant is a shell company (as defined in Rule
12b-2 of the Exchange Act). Yes
¨
No
þ
The
aggregate market value of Common Stock held by non-affiliates based upon the
closing price of $0.15 per share on June 30, 2009, as reported by the OTC -
Bulletin Board, was approximately $311,000.
As of
March 25, 2010, there were 22,718,074 shares of Common Stock, $0.01 par value,
outstanding.
TABLE
OF CONTENTS
|
PAGE
|
|||
|
PART
I
|
|||
|
Item
1.
|
Business.
|
3
|
|
|
Item
1A.
|
Risk
Factors.
|
9
|
|
|
Item
1B.
|
Unresolved
Staff Comments.
|
11
|
|
|
Item
2.
|
Properties.
|
11
|
|
|
Item
3.
|
Legal
Proceedings.
|
12
|
|
|
Item
4.
|
Submission
of Matters to a Vote of Security Holders.
|
12
|
|
|
PART
II
|
|||
|
Item
5.
|
Market
for Registrant’s Common Equity, Related Stockholder Matters and Issuer
Purchases of Equity Securities.
|
13
|
|
|
Item
6.
|
Selected
Financial Data.
|
16
|
|
|
Item
7.
|
Management’s
Discussion and Analysis of Financial Condition and Results of
Operations.
|
17
|
|
|
Item
7A.
|
Quantitative
and Qualitative Disclosures About Market Risk.
|
28
|
|
|
Item
8.
|
Financial
Statements and Supplementary Data.
|
28
|
|
|
Item
9.
|
Changes
In and Disagreements With Accountants on Accounting and Financial
Disclosure.
|
28
|
|
|
Item
9A(T).
|
Controls
and Procedures.
|
29
|
|
|
Item
9B.
|
Other
Information.
|
30
|
|
|
PART
III
|
|||
|
Item
10.
|
Directors,
Executive Officers and Corporate Governance.
|
31
|
|
|
Item
11.
|
Executive
Compensation.
|
34
|
|
|
Item
12.
|
Security
Ownership of Certain Beneficial Owners and Management and Related
Stockholder Matters.
|
43
|
|
|
Item
13.
|
Certain
Relationships and Related Transactions, and Director
Independence.
|
44
|
|
|
Item
14.
|
Principal
Accountant Fees and Services.
|
44
|
|
|
PART
IV
|
|||
|
Item
15.
|
Exhibits
and Financial Statement Schedules.
|
46
|
|
2
Forward-Looking
Information
This Annual Report on Form 10-K (the
“Report”) contains certain “forward-looking statements” within the meaning of
Section 27A of the Securities Act of 1933, as amended, and Section 21E of the
Exchange Act of 1934, as amended, that are based on management’s exercise of
business judgment as well as assumptions made by, and information currently
available to, management. When used in this document, the words
“may”,
"
will”,
“anticipate”, “believe”, “estimate”, “expect”, “intend”, and words of similar
import, are intended to identify any forward-looking statements. You
should not place undue reliance on these forward-looking
statements. These statements reflect our current view of future
events and are subject to certain risks and uncertainties, as noted
below. Should one or more of these risks or uncertainties
materialize, or should underlying assumptions prove incorrect, our actual
results could differ materially from those anticipated in these forward-looking
statements. We undertake no obligation, and do not intend, to update,
revise or otherwise publicly release any revisions to these forward-looking
statements to reflect events or circumstances after the date hereof, or to
reflect the occurrence of any unanticipated events. Although we
believe that our expectations are based on reasonable assumptions, we can give
no assurance that our expectations will materialize.
(All
dollar amounts are presented in thousands of U.S. dollars (“USD”), unless
otherwise indicated, except per share amounts)
Overview
and Recent Developments
C2 Global
Technologies Inc. (“C2”, “we” or the “Company”) was incorporated in the State of
Florida in 1983 under the name “MedCross, Inc.” which was changed to “I-Link
Incorporated” in 1997, to “Acceris Communications Inc.” in 2003, and to “C2
Global Technologies Inc.” in 2005. The most recent name change
reflects a change in the strategic direction of the Company following the
disposition of its Telecommunications business in the third quarter of
2005.
C2 owns
certain patents, detailed below under “History and Development of the Business”
and “Intellectual Property”, including two foundational patents in voice over
internet protocol (“VoIP”) technology – U.S. Patent Nos. 6,243,373 and 6,438,124
(together the “VoIP Patent Portfolio”), which it licenses. All
activities relating to the Company’s licensing of the VoIP Patent Portfolio, or
its other intellectual property, constitute the Company’s Patent Licensing
operating segment. C2’s target market consists of carriers, equipment
manufacturers, service providers and end users in the internet protocol (“IP”)
telephone market who are using C2’s patented VoIP technologies by deploying VoIP
networks for phone-to-phone communications. The Company has engaged,
and intends to continue to engage, in licensing agreements with third parties
domestically and internationally.
The
Company’s objective is to obtain ongoing licensing and royalty revenue from the
target market for its patents. In this regard, in the third quarter
of 2005, the Company retained legal counsel with expertise in the enforcement of
intellectual property rights, and on June 15, 2006, C2 Communications
Technologies Inc., a wholly-owned subsidiary of the Company, filed a patent
infringement lawsuit against seven major U.S. telecommunications carriers, which
alleged that these companies’ VoIP services and systems infringed C2’s U.S.
Patent No. 6,243,373, entitled
“Method and Apparatus for
Implementing a Computer Network/Internet Telephone System”
(the “VoIP
Patent”). The complaint sought an injunction, monetary damages, and
costs. The litigation resulted in the Company entering into
settlement and license agreements in 2008, for which C2 was paid $17,625 in
aggregate, whereby C2 granted the defendants non-exclusive, perpetual,
worldwide, fully paid up, royalty free licenses under any of C2’s present
patents and patent applications, including the VoIP Patent, to make, use, sell
or otherwise dispose of any goods and services based on such
patents.
On August
27, 2009 C2 Communications Technologies Inc. filed a similar lawsuit against
PAETEC Corporation, Matrix Telecom, Inc., Windstream Corporation, and Telephone
and Data Systems, Inc. The complaint was filed in the United States
District Court for the Eastern District of Oklahoma and also alleges that the
defendants’ services and systems utilizing VoIP infringe the Company’s U.S.
Patent No. 6,243,373. The complaint seeks an injunction, monetary
damages and costs. In the fourth quarter of 2009, the complaint
against Matrix Telecom, Windstream Corporation and Telephone and Data Systems,
Inc. was dismissed without prejudice. Also in the fourth quarter of
2009, the case was transferred to the Eastern District of Texas. A
trial date has not been set.
In the
third quarter of 2007, the Company began investing in Internet-based e-commerce
businesses, when it acquired minority positions in MyTrade.com, Inc., Buddy
Media, Inc. (“Buddy Media”) and LIMOS.com LLC (“LIMOS.com”). Its
investments in MyTrade.com, Inc. and LIMOS.com were subsequently sold in 2007
and 2008, respectively.
In the fourth quarter of
2007 the Company acquired a one-third interest in Knight’s Bridge Capital
Partners Internet Fund No. 1 GP LLC (“Knight’s Bridge GP”). The
additional two-thirds interest in Knight’s Bridge GP was acquired by parties
affiliated with the Company’s majority stockholder, Counsel Corporation
(together with its subsidiaries, “Counsel”).
3
In the
second quarter of 2009, the Company sold a portion of its investment in Buddy
Media, recognizing a gain of $21 on an initial investment of
$100. Also in the second quarter of 2009, the Company invested $2,621
to indirectly acquire an approximate 5% interest in Polaroid Corporation,
pursuant to a Chapter 11 reorganization in a U.S. bankruptcy
court. C2’s interest is managed by Knight’s Bridge Capital Management
L.P., an affiliate of Counsel. The Company’s investments are
discussed in more detail in Note 5 of the audited consolidated financial
statements included in Item 15 of this Report.
In
February 2009 the Company established Counsel RB Capital LLC (“Counsel RB”),
which commenced operations in the second quarter of 2009. Counsel RB
is owned 75% by the Company and 25% by its Co-CEO’s. It specializes
in the acquisition and disposition of distressed and surplus assets throughout
the United States and Canada. Counsel RB’s operations are discussed
in more detail in Note 2 of the audited consolidated financial
statements. Counsel RB’s operations constitute the Company’s Asset
Liquidation operating segment. The Company’s segments are discussed
in more detail in Note 15 of the audited consolidated financial
statements.
History
and Development of the Business
In 1994,
we began operating as an Internet service provider and quickly identified that
the emerging IP environment was a promising basis for enhanced service
delivery. We soon turned to designing and building an IP
telecommunications platform consisting of proprietary software and hardware, and
leased telecommunications lines. The goal was to create a platform
with the quality and reliability necessary for voice transmission. In
1997, we began offering enhanced services over a mixed IP-and-circuit-switched
network platform. These services offered a blend of traditional and
enhanced communication services and combined the inherent cost advantages of an
IP-based network with the reliability of the existing Public Switched Telephone
Network (“PSTN”).
In August
1997, we acquired MiBridge, Inc. (“MiBridge”), a communications technology
company engaged in the design, development, integration and marketing of a range
of software telecommunications products that support multimedia communications
over the PSTN, local area networks (“LANs”) and IP networks. The
acquisition of MiBridge permitted us to accelerate the development and
deployment of IP technology across our network platform.
In 1998,
we first deployed our real-time IP communications network
platform. With this new platform, all core operating functions such
as switching, routing and media control became software-driven. This
new platform represented the first nationwide, commercially viable VoIP platform
of its kind. Following the launch of our software-defined VoIP
platform in 1998, we continued to refine and enhance the platform to make it
even more efficient and capable for our partners and customers.
In 2001,
the Company entered the Telecommunications business. The assets of
the Company’s Telecommunications segment were owned through a wholly-owned
subsidiary, Acceris Communications Corp. (name changed to WXC Corp. (“WXCC”) in
October 2005). This business was sold effective September 30,
2005.
In 2002,
the U.S. Patent and Trademark Office issued U.S. patent No. 6,438,124 (the “C2
Patent”) for the Company’s Voice Internet Transmission System. Filed
in 1996, the C2 Patent reflects foundational thinking, application, and practice
in the VoIP services market. The C2 Patent encompasses the technology
that allows two parties to converse phone-to-phone, regardless of the distance,
by transmitting voice/sound via the Internet. No special telephone or
computer is required at either end of the call. The apparatus that
makes this technically possible is a system of Internet access nodes, or voice
engines, which provide digitized, compressed, and encrypted duplex or simplex
Internet voice/sound. The end result is a high-quality calling
experience whereby the Internet serves only as the transport medium and, as
such, can lead to reduced toll charges. On May 1, 2003, shortly after
the issuance of our core C2 Patent, we disposed of our domestic U.S. VoIP
network. The sale included the physical assets required to operate
our nationwide network using our patented VoIP technology (constituting the core
business of the I-Link Communications Inc. (“ILC”) business) and included a
fully paid non-exclusive perpetual license to our proprietary software-based
network convergence solution for voice and data. The sale of the ILC
business removed essentially all operations that did not pertain to this
convergence solution. As part of the sale, we retained all of our
intellectual property rights and patents.
In 2003,
we added to our VoIP patent holdings when we acquired the VoIP Patent, which
included a corresponding foreign patent and related international patent
applications. The vendor of the VoIP Patent was granted a first
priority security interest in the patent in order to secure C2’s obligations
under the associated purchase agreement. The VoIP Patent, together
with the C2 Patent and related international patents and patent applications,
form our international VoIP Patent Portfolio that covers the basic process and
technology that enable VoIP communication as it is used in the market
today. Telecommunications companies that enable their customers to
originate a phone call on a traditional handset, transmit any part of that call
via IP, and then terminate the call over the traditional telephone network, are
utilizing C2’s patented technology. The comprehensive nature of the
VoIP Patent is summarized in the patent’s abstract, which, in pertinent part,
describes the technology as follows:
“A method and apparatus are provided
for communicating audio information over a computer network. A
standard telephone connected to the PSTN may be used to communicate with any
other PSTN-connected telephone, where a computer network, such as the Internet,
is the transmission facility instead of conventional telephone transmission
facilities.”
As part of the consideration for the acquisition
of the VoIP Patent, the vendor is entitled to receive 35% of the net earnings
from our VoIP Patent Portfolio.
4
Up to
December 31, 2004, revenue related to our intellectual property was based on the
sales and deployment of our VoIP solutions, which we ceased directly marketing
in 2005. No revenue was due to the receipt of licensing fees and
royalties. Revenue in 2008 was the result of entering into settlement
and license agreements with six major U.S. telecommunications carriers, as
described above. We expect to generate ongoing licensing and royalty
revenue in this business as we gain recognition of the underlying value in our
VoIP Patent Portfolio through the enforcement of our intellectual property
rights, as discussed above under “Overview and Recent
Developments”.
The
Company has previously conducted research and development activities related to
its patents, most recently in 2005, when it invested $389. The
Company suspended its investment in research and development in the third
quarter of 2005 in conjunction with its decision to focus on the realization of
licensing fees associated with its intellectual property.
As
discussed above under “Overview and Recent Developments”, in the third quarter
of 2007, the Company began investing in Internet-based e-commerce businesses
through its acquisitions of minority positions in MyTrade.com, Inc. (sold in the
fourth quarter of 2007), Buddy Media, Inc. (partially sold in the second quarter
of 2009) and LIMOS.com LLC (sold in the fourth quarter of 2008). It
continued its investment activities in the fourth quarter of 2007 with the
acquisition of a one-third interest in Knight’s Bridge Capital Partners Internet
Fund No. 1 GP LLC. In the second quarter of 2009, the Company
invested $2,621 in Polaroid, and in the third quarter it invested an additional
$10. At December 31, 2009 the Company’s investment in these
businesses totaled $2,791. In the fourth quarter of 2009 the Company
received distributions from Polaroid totalling $232. The Company’s
objective is to realize long-term capital appreciation as the value of these
businesses is developed and recognized. In this regard, to date the
Company recognized a gain of $75 on MyTrade.com, Inc., a gain of $425 on
LIMOS.com LLC, and a gain of $21 on Buddy Media, Inc.
As also
discussed above under “Overview and Recent Developments”, in February 2009 the
Company established Counsel RB. The Counsel RB operations have
allowed the Company to diversify into a new operating segment, Asset
Liquidation.
5
Intellectual
Property
Below is
a summary of the Company’s patents:
|
Type
|
Title
|
Numbe
r
|
Status
|
|||
|
VoIP
Architecture
|
Computer
Network/Internet Telephone System (“VoIP Patent”)
|
U.S.
No. 6,243,373
|
Issued: June
5, 2001
Expires:
November 1, 2015
|
|||
|
Australia
No. 716096
|
Issued: June
1, 2000
Expires:
October 29, 2016
|
|||||
|
People’s
Republic of China
No.
ZL96199457.6
|
Issued: December
14, 2005
Expires:
October 29, 2016
|
|||||
|
Canada
No. 2,238,867
|
Issued: October
18, 2005
Expires:
October 29, 2016
|
|||||
|
Hong
Kong No. HK1018372
|
Issued: August
11, 2006
Expires:
October 29, 2016
|
|||||
|
Europe
No. 0873637
|
Granted
March 21, 2007
1
|
|||||
|
Voice
Internet Transmission System
(“C2
Patent”)
|
U.S.
No. 6,438,124
|
Issued: August
20, 2002
Expires:
July 22, 2018
|
||||
|
People’s
Republic of China
No.
ZL97192954.8
|
Issued: May
21, 2004
Expires:
February 5, 2017
|
|||||
|
Canada
No. 2,245,815
|
Issued: October
10, 2006
Expires:
February 5, 2017
|
|||||
|
South
Korea No. 847335
|
Issued: July
14, 2008
Expires:
February 5, 2017
|
|||||
|
South
Korea No. 892950
|
Issued: April
3, 2009
Expires:
February 5, 2017
|
|||||
|
Private
IP Communication
Network
Architecture
|
U.S.
No. 7,215,663
|
Issued: May
8, 2007
Expires: June
12, 2017
|
||||
|
Conferencing
|
Delay
Synchronization in Compressed
Audio
Systems
|
U.S.
No. 5,754,534
|
Issued: May
19, 1998
Expires:
May 6, 2016
|
|||
|
|
Volume
Control Arrangement for Compressed Information Signal
Delays
|
|
U.S.
No. 5,898,675
|
|
Issued: April
27, 1999
Expires:
April 29, 2016
|
1
The
European patent has been validated in Austria, Belgium, Denmark, Finland,
France, Germany, Great Britain, Greece, Ireland, Italy, the Netherlands,
Portugal, Spain, Sweden and Switzerland.
In
addition to the C2 and VoIP patents, which cover the foundation of any VoIP
system, our patent portfolio includes:
Private IP Communication Network
Architecture (U.S. Patent No. 7,215,663 granted May 8, 2007) -
This
invention relates generally to multimedia communications
networks. The patent’s Internet Linked Network Architecture delivers
telecommunication type services across a network utilizing digital technology.
The unique breadth and flexibility of telecommunication services offered by the
Internet Linked Network Architecture flow directly from the network over which
they are delivered and the underlying design principles and architectural
decisions employed during its creation.
6
C2 also
owns intellectual property that solves teleconferencing problems:
Delay Synchronization in Compressed
Audio Systems (U.S. Patent No. 5,754,534 granted May 19, 1998) -
This
invention eliminates popping and clicking when switching between parties in a
communications conferencing system employing signal compression techniques to
reduce bandwidth requirements.
Volume Control Arrangement for
Compressed Information Signals (U.S. Patent No. 5,898,675 granted April 27,
1999) -
This invention allows for modifying amplitude, frequency or phase
characteristics of an audio or video signal in a compressed signal system
without altering the encoder or decoder employed by each conferee in a
conferencing setting, so that individuals on the conference call can each adjust
their own gain levels without signal degradation.
Employees
As of
December 31, 2009, C2 had ten employees. Four of them are employed
directly by Counsel RB. Six employees are also employees of Counsel,
and, except for the CEO, their salaries are paid by Counsel. Under
the terms of a management services agreement (the “Agreement”), as described in
Item 11 of this Report, the Counsel employees provide management and
administrative services to C2 and the associated costs are allocated to
C2. The CEO has a separate employment arrangement with C2, as
discussed in Item 11.
Industry
and Competition
Patent
Licensing
The
communications services industry continues to evolve, both domestically and
internationally, providing significant opportunities and risks to the
participants in these markets. Factors that have driven this change
include:
|
|
·
|
entry
of new competitors and investment of substantial capital in existing and
new services, resulting in significant price
competition
|
|
|
·
|
technological
advances resulting in a proliferation of new services and products and
rapid increases in network capacity
|
|
|
·
|
the
Telecommunications Act of 1996; as amended,
and
|
|
|
·
|
growing
deregulation of communications services markets in the United States and
in other countries around the world
|
Historically,
the communications services industry transmitted voice and data over separate
networks using different technologies. Traditional carriers have
typically built telephone networks based on circuit switching technology, which
establishes and maintains a dedicated path for each telephone call until the
call is terminated.
VoIP is a
technology that can replace the traditional telephone network. This
type of data network is more efficient than a dedicated circuit network because
the data network is not restricted by the one-call, one-line limitation of a
traditional telephone network. This improved efficiency creates cost
savings that can be either passed on to the consumer in the form of lower rates
or retained by the VoIP provider. In addition, VoIP technology
enables the provision of enhanced services such as unified
messaging.
We are
seeking to have telecommunications service providers (“TSPs”), equipment
suppliers (“ESs”) and end users license our patents. In this regard,
our competition is existing technology, outside the scope of our patents, which
allows TSPs and ESs to deliver communication services to their
customers.
VoIP has
become a widespread and accepted telecommunications technology, with a variety
of applications in the telecommunications and other industries. While
we believe that there will be continued proliferation of this technology in the
coming years, and while we believe that this proliferation will occur within the
context of our patents, there is no certainty that this will occur, and that it
will occur in a manner that requires organizations to license our
patents.
7
Asset
liquidation
Our asset
liquidation business, Counsel RB, is involved primarily in the purchase and
sale, including at auction, of industrial machinery and equipment, real estate,
inventories, accounts receivable and distressed debt. The market for
these assets is highly fragmented. Counsel RB competes with other
liquidators, auction companies, dealers and brokers. It competes for
potential purchasers with other liquidators and auction companies, as well as
with equipment manufacturers, distributors, dealers and equipment rental
companies. Some of Counsel RB’s competitors have significantly
greater financial and marketing resources and name recognition.
Government
Regulation
Recent
legislation in the United States, including the Sarbanes-Oxley Act of 2002, has
increased regulatory and compliance costs as well as the scope and cost of work
provided to us by our independent registered public accountants and legal
advisors. The Company became subject to Section 404 reporting as of
December 31, 2007. As implementation guidelines continue to evolve,
we expect to continue to incur costs, which may or may not be material, in order
to comply with legislative requirements or rules, pronouncements and guidelines
by regulatory bodies.
Available
Information
C2 is
subject to the informational requirements of the Securities Exchange Act of
1934, as amended (the “Exchange Act”), which requires that C2 file reports,
proxy statements and other information with the Securities and Exchange
Commission (“SEC”). The SEC maintains a website on the Internet at
http://www.sec.gov
that
contains reports, proxy and information statements, and other information
regarding issuers, including C2, which file electronically with the
SEC. In addition, C2’s Exchange Act filings may be inspected and
copied at the SEC’s Public Reference Room at 100 F Street, NE, Washington, D.C.
20549. The public may obtain information on the operation of the
Public Reference Room by calling the SEC at 1-800-SEC-0330. The
Company makes available free of charge through its Internet web site,
http://www.c2global.com
(follow Investor Relations tab to link to “SEC Filings”) its annual
report on Form 10-K, quarterly reports on Form 10-Q, current reports on Form 8-K
and amendments to those reports filed or furnished pursuant to Section 13(a) or
15(d) of the Exchange Act as soon as reasonably practicable after such material
has been electronically filed with, or furnished to, the SEC.
`
8
You
should carefully consider and evaluate these risk factors, as any of them could
materially and adversely affect our business, financial condition and results of
operations, which, in turn, can adversely affect the price of our
securities.
We
are subject to the risks of having entered into a new line of
business.
In the
first quarter of 2009 the Company established its 75%-owned subsidiary, Counsel
RB, which commenced operations in the second quarter of 2009. As
discussed elsewhere in this Report, Counsel RB specializes in the acquisition
and disposition of distressed and surplus assets throughout the United States
and Canada. The Company has therefore acquired exposure to the risks
inherent in this business, such as those associated with the collectability of
accounts receivable, inventory valuation and turnover.
We
face significant competition in our asset liquidation business.
Our asset
liquidation business depends on our ability to successfully obtain a continuous
supply of distressed and surplus assets for profitable resale to third
parties. In this regard, we compete with numerous other
organizations, of which some are much larger and better-capitalized, with
greater resources available for both asset acquisition and associated marketing
to potential customers. As competition in this business increases, we
may be unable to compete successfully against current and future
competitors.
Our
asset liquidation business is subject to inventory risk and credit
risk.
Under our
business model, we assume the general and physical inventory and credit risks
associated with purchasing assets for subsequent resale. Although we
do enter into transactions for which a subsequent purchaser has already been
identified, in most cases we purchase assets and assume the risk that they may
sell for less than our forecasted price. As well, we may miscalculate
demand or resale value, and subsequently sell the assets for less than their
original purchase price. Either situation could have a material
adverse effect upon our use of working capital and our results of
operations.
Our
asset liquidation business is subject to environmental risk.
Our asset
liquidation at times includes the purchase and resale of buildings and
land. Although our purchase process includes due diligence to
determine that there are no adverse environmental issues, it is possible that
such issues could be discovered subsequent to a completed
purchase. Any remediation and related costs could have a material
adverse effect upon our business and results of operations.
We
are dependent upon key personnel.
Our
operations, particularly those of Counsel RB, are substantially dependent on the
knowledge, skills and performance of our executive officers. The loss
of any one of these officers could damage key relationships, and result in the
loss of essential information and expertise. As our operations expand
we will be required to hire additional employees, and may face intense
competition for them. Therefore, either the loss of the services of
our existing officers, or the inability to attract and retain appropriately
skilled new employees, could have a material adverse effect upon our business
and therefore our results of operations.
We
may require additional financing in the future, which may not be available, or
may not be available on favourable terms.
We may
need additional funds to finance our operations, particularly our asset
liquidation business, to make additional investments, or to acquire
complementary businesses or assets. We may be unable to generate
these funds from our operations. Additionally, in connection with
Counsel RB’s operations, the Company, together with Counsel, has guaranteed
Counsel RB’s variable and fixed rate debt. If funds are not
available, or not available on acceptable terms, we could experience a material
adverse effect upon our business.
Our
investments are particularly subject to risk of loss.
The
Company’s portfolio investment in Buddy Media, Inc. is in a development stage
company that has yet to provide a return to shareholders. The
Company’s equity investment in Knight’s Bridge Capital Partners Internet Fund
No. 1 GP LLC is in a company whose underlying investments are also primarily in
development stage companies. Although the Company’s analyses of these
investments as at December 31, 2009 resulted in the conclusion that no
impairment was present, development stage companies are particularly vulnerable
during an economic downturn such as the one currently in
progress. There can be no assurance that the Company will either
recover the value of its initial investments or earn a positive
return.
We
have significantly increased our investment in non-publicly traded
equity.
The
investment that the Company has made in Polaroid during 2009 represents
approximately 23% of its total assets at December 31, 2009. The
investment is in a private company and therefore not easily
liquidated. Although the Company’s analysis of this investment
opportunity concluded that it will ultimately have a positive return, and
although cash distributions were received during 2009, there can be no assurance
that the Company will either recover the entire value of its initial investment
or earn a positive return to the extent that it expects.
9
We
are subject to litigation.
We are,
from time to time, involved in various claims, legal proceedings and complaints
arising in the ordinary course of business. The significant
litigation matters in which we are involved at this time are detailed in Item 3
of this Report.
We
may fail to either adequately protect our proprietary technology and processes,
or enforce our intellectual property rights, which would allow competitors to
take advantage of our development efforts.
The
Company’s VoIP Patent Portfolio consists of United States Patents No. 6,243,373
and No. 6,438,124. The ultimate value of these patents has yet to be
determined. If we fail to obtain or maintain adequate protections, or
are unsuccessful in enforcing our patent rights, we may not be able to either
realize additional value from our patents, or prevent third parties from
benefiting from those patents without benefit to the Company. Any
currently pending or future patent applications may not result in issued
patents. In addition, any issued patents may not have priority over
any patent applications of others or may not contain claims sufficiently broad
to protect us against third parties with similar technologies, products or
processes. In February 2010, at the request of certain third parties,
the U.S. Patent and Trademark Office agreed to re-examine the validity of U.S.
Patent No. 6,243,373; this re-examination is currently in progress and its
outcome cannot be determined at this time. In addition, the Company’s
existing patents have finite lives (although they may be extended by filing
continuations and/or divisional applications), most of which expire in
approximately seven years. There is no guarantee that they will be
fully exploited or commercialized before expiry.
The
telecommunications market is volatile.
During
the last several years, the telecommunications industry has been very volatile
as a result of overcapacity, which has led to price erosion and
bankruptcies. These negative trends may become even more significant
during the current economic downturn. Our potential licensees may
experience increased customer attrition, may have difficulty generating and
collecting revenue, or may even be forced into bankruptcy. Our
potential revenue could therefore decrease significantly as the licensees become
unable to meet their financial obligations.
If
we were to default on our related party loan, Counsel could foreclose on our
assets.
At
December 31, 2009, Counsel owned approximately 91% of the Company’s common
stock. Our assets serve as collateral for our related party
debt. In the event that we were to default on this debt, and Counsel
foreclosed on our assets, we would be unable to continue our operations as they
are presently conducted, if at all. Our aggregate total debt to
Counsel at December 31, 2009 was $1,564. See Note 7 and Note 11 of
the consolidated financial statements included in Item 15 of this Report for
further discussion of the debt to Counsel.
Our
principal stockholder, Counsel, has voting control of the Company and our
executive officers are employees of Counsel.
Counsel
owns approximately 91% of our outstanding common stock. As a result,
Counsel controls all matters requiring approval by the stockholders, including
the election of the Board of Directors and significant corporate
transactions. Our Board of Directors has five members, four of whom
are not employees or otherwise affiliated with Counsel. The Board
establishes corporate policies and has the sole authority to nominate and elect
officers to carry out those policies. Our Chief Executive Officer,
Chief Financial Officer, Vice President of Accounting and Corporate Secretary
are all employees of Counsel. Counsel’s control over C2 could delay
or prevent a change in control of the Company, impede a merger, consolidation,
takeover or other business combination, or discourage a potential acquirer from
making a tender offer or otherwise attempting to obtain control of the
Company.
Provisions
in our Articles of Incorporation, as amended, could prevent or delay
stockholders' attempts to replace or remove current management.
Our
Articles of Incorporation, as amended, provide for staggered terms for the
members of our Board. The Board is divided into three staggered
classes, and each director serves a term of three years. At each
annual stockholders’ meeting only those directors comprising one of the three
classes will have completed their term and stand for re-election or
replacement. These provisions may be beneficial to our management and
the Board in a hostile tender offer, and may have an adverse impact on
stockholders who may want to participate in such a tender offer, or who may want
to replace some or all of the members of the Board.
We
are restating our unaudited consolidated financial statements for the quarters
ended June 30 and September 30, 2009.
In March
2010 management concluded that the previously issued unaudited consolidated
financial statements as of and for the quarters ended June 30, 2009 and
September 30, 2009 required restatement to correct errors in (i) the recognition
of patent licensing revenue in the three months ended June 30, 2009, and (ii)
the proportionate consolidation of the Company's interests in certain
non-controlled entities. These errors, and the restated financial
information as of and for the three and six months ended June 30, 2009 and the
three and nine months ended September 30, 2009, are discussed in Items 7 and
9A(T) and in Note 17 of the audited consolidated financial statements included
in this Report. Any regulatory proceeding or litigation that might
result from the foregoing restatement, if and when it occurs, and even if
ultimately resolved in our favor, could cause us to incur significant legal and
other expenses, including management time and resources.
10
Our Board of Directors may issue additional shares of preferred stock without stockholder approval.
Our
Articles of Incorporation, as amended, authorize the issuance of up to
10,000,000 shares of preferred stock, $10.00 par value per share. The
Board is authorized to determine the rights and preferences of any additional
series or class of preferred stock. The Board may, without
stockholder approval, issue shares of preferred stock with dividend,
liquidation, conversion, voting or other rights which are senior to our shares
of common stock or which could adversely affect the voting power or other rights
of the existing holders of outstanding shares of preferred stock or common
stock. The issuance of additional shares of preferred stock may also
hamper or discourage an acquisition or change in control of C2.
We
may conduct future offerings of our common stock and preferred stock and pay
debt obligations with our common and preferred stock that may diminish our
investors’ pro rata ownership and depress our stock price.
We
reserve the right to make future offers and sales, either public or private, of
our securities including shares of our preferred stock, common stock or
securities convertible into common stock at prices differing from the price of
the common stock previously issued. In the event that any such future
sales of securities are effected or we use our common or preferred stock to pay
principal or interest on our debt obligations, an investor’s pro rata ownership
interest may be reduced to the extent of any such issuances and, to the extent
that any such sales are effected at consideration which is less than that paid
by the investor, the investor may experience dilution and a diminution in the
market price of the common stock.
There
is a limited public trading market for our common stock; the market price of our
common stock has been volatile and could experience substantial
fluctuations.
Our
common stock is currently quoted on the OTC Bulletin Board and has a limited
public trading market. Without an active trading market, there can be
no assurance regarding the liquidity or resale value of the common
stock. In addition, the market price of our common stock has been,
and may continue to be, volatile. Such price fluctuations may be
affected by general market price movements or by reasons unrelated to our
operating performance or prospects such as, among other things, announcements
concerning us or our competitors, technological innovations, government
regulations, and litigation concerning proprietary rights or other
matters.
We
may not be able to utilize income tax loss carryforwards.
Restrictions
in our ability to utilize income tax loss carry forwards have occurred in the
past due to the application of certain changes in ownership tax rules in the
United States. There is no certainty that the application of these
rules may not recur. In addition, further restrictions of, reductions
in, or expiry of net operating loss and net capital loss carry forwards may
occur through future merger, acquisition and/or disposition transactions or
failure to continue a significant level of business activities. Any
such additional limitations could require us to pay income taxes in the future
and record an income tax expense to the extent of such liability. We
could be liable for income taxes on an overall basis while having unutilized tax
loss carry forwards since these losses may be applicable to one jurisdiction
and/or particular line of business while earnings may be applicable to a
different jurisdiction and/or line of business. Additionally, income
tax loss carry forwards may expire before we have the ability to utilize such
losses in a particular jurisdiction and there is no certainty that current
income tax rates will remain in effect at the time when we have the opportunity
to utilize reported tax loss carry forwards.
We
have not declared any dividends on our common stock to date and have no
expectation of doing so in the foreseeable future.
The
payment of cash dividends on our common stock rests within the discretion of our
Board of Directors and will depend, among other things, upon our earnings,
unencumbered cash, capital requirements and our financial condition, as well as
other relevant factors. To date, we have not paid dividends on our
common stock nor do we anticipate that we will pay dividends in the foreseeable
future. As of December 31, 2009, we do not have any preferred stock
outstanding that has any preferential dividends.
Not
applicable.
The
Company, in connection with its intellectual property licensing business, rents
approximately 200 square feet of office space in Marshall, TX on a month to
month basis for a nominal amount. Should the Company be required to
vacate these premises, ample alternative space is available.
The
Company, in connection with its asset liquidation business, leases office space
in White Plains, NY and Los Angeles, CA. The White Plains space is
approximately 2,850 square feet and its lease is in effect until February 28,
2014. The Los Angeles space is approximately 300 square feet; it is
currently leased on a month-to-month basis pending the negotiation of final
lease terms.
11
All
accounting and reporting functions are carried out from the corporate office of
its majority stockholder, Counsel, located in Toronto, Ontario,
Canada. The Company is not required to pay rent or other occupancy
costs to Counsel.
Shareholder
Litigation
At our
Adjourned Meeting of Stockholders held on December 30, 2003, our stockholders,
among other things, approved an amendment to our Articles of Incorporation,
deleting Article VI thereof (regarding liquidations, reorganizations, mergers
and the like). Stockholders who were entitled to vote at the meeting
and advised us in writing, prior to the vote on the amendment, that they
dissented and intended to demand payment for their shares if the amendment was
effectuated, were entitled to exercise their appraisal rights and obtain payment
in cash for their shares under Sections 607.1301 – 607.1333 of the Florida
Business Corporation Act (the “Florida Act”), provided their shares were not
voted in favor of the amendment. In January 2004, we sent appraisal
notices in compliance with Florida corporate statutes to all stockholders who
had advised us of their intention to exercise their appraisal
rights. The appraisal notices included our estimate of fair value of
our shares, at $4.00 per share on a post-split basis. Approximately
33 stockholders holding approximately 74,000 shares of our stock returned
completed appraisal notices indicating that they did not accept our
offer. Because we did not agree with the estimates submitted by the
dissenting stockholders, we sought a judicial determination of the fair value of
their common stock. On June 24, 2004, we filed suit against the
dissenting stockholders seeking a declaratory judgment, appraisal and other
relief in Florida. On February 4, 2005, the declaratory judgment
action was stayed pending the resolution of direct and derivative lawsuits filed
in California. This decision was made by the judge in the Florida
declaratory judgment action due to the similar nature of certain allegations
brought by the defendants in the declaratory judgment matter and the California
lawsuits. As a result of the June 2008 settlement of the derivative
and securities lawsuits in California, the stay of the Florida declaratory
judgment action was lifted. In the first quarter of 2009, the Company
completed an agreement with the holders of 27,221 of the 27,536 shares
(including common share equivalents) held by the remaining dissenting
stockholders, whereby the stockholders agreed to accept $4.60 per share in full
payment for their respective shares, for cancellation by the Company, and a
release of any other claims that they may have against the Company and
Counsel. In the third quarter of 2009, the Company completed a
similar agreement with the remaining dissenting stockholders, who agreed to
accept $5.00 per share under the same terms and conditions as described above,
as well as the payment of $1 of legal expenses that they had incurred, thereby
concluding this matter.
Intellectual
Property Enforcement Litigation
On August
27, 2009 the Company’s wholly-owned subsidiary, C2 Communications Technologies
Inc., filed a patent infringement lawsuit against PAETEC Corporation, Matrix
Telecom, Inc., Windstream Corporation, and Telephone and Data Systems,
Inc. The complaint was filed in the United States District Court for
the Eastern District of Oklahoma and alleges that the defendants’ services and
systems utilizing VoIP infringe the Company’s U.S. Patent No.
6,243,373. The complaint seeks an injunction, monetary damages and
costs. In the fourth quarter of 2009, the complaint against Matrix
Telecom, Windstream Corporation and Telephone and Data Systems, Inc. was
dismissed without prejudice. Also in the fourth quarter of 2009, the
case was transferred to the Eastern District of Texas. A trial date
has not been set.
The
Company is involved in various other legal matters arising out of its operations
in the normal course of business, none of which are expected, individually or in
the aggregate, to have a material adverse effect on the Company.
None
12
Market
Information
Shares of
C2’s common stock, $0.01 par value per share, are traded on the OTC Bulletin
Board (“OTCBB”) under the symbol COBT.OB.
The
following table sets forth the high and low prices for our common stock, as
quoted on the OTCBB, for the calendar quarters from January 1, 2008 through
December 31, 2009, based on inter-dealer quotations, without retail markup,
markdown, commissions or adjustments. These prices may not represent
actual transactions:
|
Quarter Ended
|
High
|
Low
|
||||||
|
March
31, 2008
|
$
|
1.47
|
$
|
0.31
|
||||
|
June
30, 2008
|
1.30
|
0.47
|
||||||
|
September
30, 2008
|
1.01
|
0.35
|
||||||
|
December
31, 2008
|
0.75
|
0.11
|
||||||
|
March
31, 2009
|
$
|
0.50
|
$
|
0.14
|
||||
|
June
30, 2009
|
0.30
|
0.15
|
||||||
|
September
30, 2009
|
0.45
|
0.08
|
||||||
|
December
31, 2009
|
0.45
|
0.07
|
||||||
On March
25, 2010, the closing price for a share of the Company’s common stock was
$0.08.
Holders
As of
March 25, 2010, the Company had approximately 398 holders of common stock of
record.
Dividends
To date,
we have not paid dividends on our common stock nor do we anticipate that we will
pay dividends in the foreseeable future. As of December 31, 2009, we
do not have any preferred stock outstanding which has any preferential
dividends.
Securities
Authorized for Issuance Under Equity Compensation Plans
The
following table sets forth, as of December 31, 2009, information with respect to
equity compensation plans (including individual compensation arrangements) under
which the Company’s securities are authorized for issuance.
During
the twelve months ended December 31, 2009, 40,000 options were granted to
directors under the 2003 Employee Stock Option and Appreciation Rights
Plan. These options were issued with an exercise price of
$0.15/share, which equalled fair market value on the date of the grant, and they
vest over a 4-year period subject to the grantee’s continued service as a
director with the Company
.
The Company
relied on an exemption from registration under Section 4(2) of the
Securities Act of 1933, as amended (the “1933 Act”). No other options
were granted during the twelve months ended December 31,
2009.
13
|
Plan Category (1)
|
Number of Securities to be
issued upon exercise of
outstanding options
|
Weighted-average
exercise price of
outstanding options
|
Number of securities
remaining available for
future issuance under
equity compensation plans
(excluding securities
reflected in column (a))
|
|||||||||
|
(a)
|
(b)
|
(c)
|
||||||||||
|
Equity compensation plans approved by security
holders:
|
||||||||||||
|
2003
Stock Option and Appreciation Rights Plan
|
678,250 |
$
|
1.37 | 1,321,750 | ||||||||
|
1997
Recruitment Stock Option Plan
|
236,111 | 1.55 | 133,889 | |||||||||
|
1995
Directors Stock Option and Appreciation Rights Plan
|
— | — | 12,500 | |||||||||
|
1995
Employee Stock Option and Appreciation Rights Plan
|
— | — | 20,000 | |||||||||
|
Equity compensation plans not approved by security
holders:
|
||||||||||||
|
Issuance
of non-qualified options to employees and outside
consultants
|
79,666 | 58.87 | — | |||||||||
|
Total
|
994,027 |
$
|
6.02 | 1,488,139 | ||||||||
(1) For a
description of the material terms of these plans, see Note 14 in the Company’s
audited financial statements included in Item 15 of this Report.
Recent Sales of Unregistered
Securities; Use of Proceeds from Registered
Securities.
None.
Issuer
Purchases of Equity Securities.
We did
not make any stock repurchases during the last quarter of 2009.
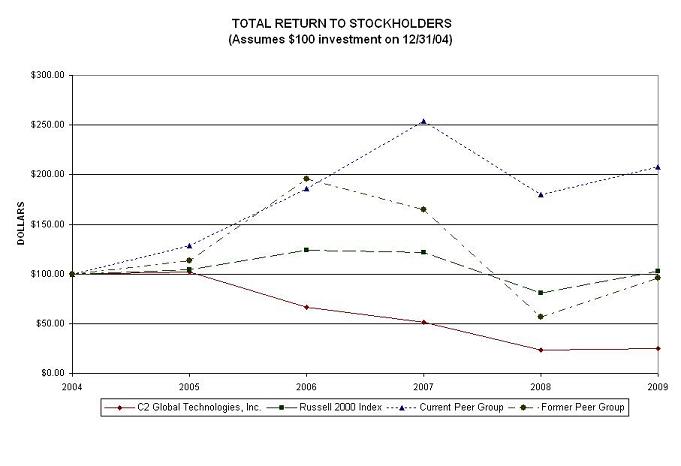
Performance
Graph.
The
following Performance Graph and related information shall not be deemed
“soliciting material” or to be “filed” with the Securities and Exchange
Commission, nor shall such information be incorporated by reference into any
future filings under the Securities Act of 1933 or Securities Exchange Act of
1934, each as amended, except to the extent that the Company specifically
incorporates it by reference into such filing.
The
following graph compares our cumulative total stockholder return with that of
the Russell 2000 index of small-capitalization companies, our former peer group
(“Former Group”), and our current peer group (“Current Group”). The graph
assumes an initial investment of $100.00 made on December 31, 2004, and the
reinvestment of dividends (where applicable). We have never paid a dividend on
our common stock.
Following
our investment in Counsel RB and diversification of our business into asset
liquidation, we reevaluated the composition of our Former Group, as previously
utilized to assess our stock performance, and concluded that it required
amendment. Accordingly, we constructed the Current
Group. The Current Group consists of Acacia Technologies Group,
Patriot Scientific Corporation, Network-1 Security Solutions Inc. and Ritchie
Bros. Auctioneers. The Former Group consists of Acacia Technologies
Group, Forgent Networks Inc. (d/b/a Asure Software), UTEK Corporation, Patriot
Scientific Corporation and Network-1 Security Solutions Inc.
14
|
Total Return Analysis
|
||||||||||||||||||||||||
|
12/31/04
|
12/31/05
|
12/31/06
|
12/31/07
|
12/31/08
|
12/31/09
|
|||||||||||||||||||
|
C2
Global Technologies Inc.
|
$ | 100.00 | $ | 101.67 | $ | 66.67 | $ | 51.67 | $ | 23.33 | $ | 25.00 | ||||||||||||
|
Russell
2000 Index
|
$ | 100.00 | $ | 104.55 | $ | 123.76 | $ | 121.82 | $ | 80.66 | $ | 102.58 | ||||||||||||
|
Current
Peer Group
|
$ | 100.00 | $ | 128.31 | $ | 185.93 | $ | 254.24 | $ | 179.60 | $ | 207.51 | ||||||||||||
|
Former
Peer Group
|
$ | 100.00 | $ | 113.00 | $ | 195.79 | $ | 164.39 | $ | 56.82 | $ | 96.30 | ||||||||||||
Source: Morningstar, Inc. (312)
384-4055
15
The
following selected consolidated financial information was derived from the
audited consolidated financial statements and notes thereto. The
information set forth below is not necessarily indicative of the results of
future operations and should be read in conjunction with Item 7, “Management’s
Discussion and Analysis of Financial Condition and Results of Operations” as
well as the Consolidated Financial Statements and Notes thereto included in Item
15 in this Report.
|
2009
|
2008
|
2007
|
2006
|
2005
|
||||||||||||||||
|
Statement
of Operations Data :
|
||||||||||||||||||||
|
Patent
licensing revenue
|
$ | — | $ | 17,625 | $ | — | $ | — | $ | — | ||||||||||
|
Asset
liquidation revenue
|
5,991 | — | — | — | — | |||||||||||||||
|
Earnings
of equity accounted asset liquidation investments
|
64 | — | — | — | — | |||||||||||||||
|
Operating
income (loss)
|
(769 | ) | 5,603 | (1,236 | ) | (1,301 | ) | (3,179 | ) | |||||||||||
|
Other
income (expense)
|
(88 | ) | 442 | (213 | ) | 155 | 1,084 | |||||||||||||
|
Interest
expense
|
(325 | ) | (43 | ) | (196 | ) | (10,900 | ) | (12,812 | ) | ||||||||||
|
Income
tax expense (recovery)
|
269 | 125 | (1,000 | ) | — | — | ||||||||||||||
|
Earnings
(loss) from equity accounted investments
|
252 | (38 | ) | 6 | — | — | ||||||||||||||
|
Income
(loss) from continuing operations
|
(1,199 | ) | 5,839 | (639 | ) | (12,046 | ) | (14,907 | ) | |||||||||||
|
Income
(loss) from discontinued operations
|
— | (12 | ) | (6 | ) | 4,370 | (3,582 | ) | ||||||||||||
|
Net
(income) loss attributable to non-controlling interest
|
(65 | ) | — | — | — | — | ||||||||||||||
|
Net
income (loss) attributable to controlling interest
|
(1,264 | ) | 5,827 | (645 | ) | (7,676 | ) | (18,489 | ) | |||||||||||
|
Earnings
(loss) from continuing operations per common share – basic and
diluted:
|
$ | (0.06 | ) | $ | 0.25 | $ | (0.03 | ) | $ | (0.63 | ) | $ | (0.77 | ) | ||||||
|
Balance
Sheet Data:
|
||||||||||||||||||||
|
Total
assets
|
$ | 11,627 | $ | 5,443 | $ | 1,796 | $ | 1,386 | $ | 3,490 | ||||||||||
|
Total
current liabilities
|
$ | 7,673 | $ | 472 | $ | 2,737 | $ | 1,855 | $ | 79,852 | ||||||||||
|
Total
long-term obligations
|
$ | — | $ | — | $ | — | $ | — | $ | 1,580 | ||||||||||
|
Stockholders’
equity (deficit)
|
$ | 3,954 | $ | 4,971 | $ | (941 | ) | $ | (469 | ) | $ | (77,942 | ) | |||||||
16
(All
dollar amounts are presented in thousands of USD, unless otherwise indicated,
except per share amounts)
The
following discussion and analysis should be read in conjunction with our
Consolidated Financial Statements and Notes thereto, included in Item 15 of this
Report. Our accounting policies have the potential to have a
significant impact on our financial statements, either because of the
significance of the financial statement item to which they relate, or because
they require judgment and estimation due to the uncertainty involved in
measuring, at a specific point in time, events which are continuous in
nature.
Business
Overview, Recent Developments and Outlook
Please
see Item 1, above, of this Report for an overview of the Company’s business and
development. Please see Item 1A, above, for a discussion of the risk
factors that may impact the Company’s current and future operations, and
financial condition.
Liquidity
and Capital Resources
Liquidity
At
December 31, 2009 the Company’s working capital deficit was $4,346 as compared
to working capital of $4,556 at December 31, 2008. The primary
contributor to the change was the commencement of Counsel RB’s operations, with
its resulting use of cash to acquire assets for resale, along with the
acquisition of third party debt to partially finance these
transactions. As well, the Company used cash to invest in Polaroid,
and acquired related party debt in connection with that
investment. The net result was that cash decreased by $3,983, from
$4,076 at December 31, 2008 to $93 at December 31, 2009. During 2009
the Company received cash distributions of $237 from its
investments. This was composed of $232 from Polaroid and $5 from
Knight’s Bridge GP.
During
2009 the Company recognized $5,991 in revenue from Counsel RB’s operations,
$1,230 of which was outstanding at December 31, 2009. Minimal amounts
of cash were received as interest on the Company’s bank
deposits. During 2009, the Company repurchased common shares for
cancellation for $126, as discussed in Note 12, and remitted $139 relating to a
patent participation fee that was outstanding at December 31,
2008. The remainder of the cash disbursements related to recurring
operating expenses.
The
Company’s liabilities at December 31, 2009 and December 31, 2008 totalled $7,673
and $472, respectively. At December 31, 2009 these were composed of
$4,626 of third party debt, $1,564 of related party debt, $1,457 of accounts
payable and accrued liabilities, and $26 of income taxes payable. The
Company’s liabilities at December 31, 2008 consisted solely of $472 in accounts
payable and accrued liabilities.
During
2009, the Company continued to pursue licensing and royalty agreements with
respect to its patents, and, through Counsel RB’s operations, entered into
trading activities in distressed and surplus assets. The Company
expects to generate sufficient cash from these activities to meet its ongoing
operating cash requirements for at least twelve months. Additionally,
Counsel RB has a revolving credit facility in place to finance its purchases of
assets for resale.
Ownership
Structure and Capital Resources
|
|
·
|
At
December 31, 2009 the Company had stockholders’ equity of $3,954
attributable to the Company’s common shareholders, as compared to $4,971
at December 31, 2008.
|
|
|
·
|
The
Company is 90.9% owned by Counsel. The remaining 9.1% is owned
by public stockholders.
|
|
|
·
|
Beginning
in 2001, Counsel invested over $100,000 in C2 to fund the development of
C2’s technology and its Telecommunications business, and at December 29,
2006 C2 owed $83,582 to Counsel, including accrued and unpaid
interest. On December 30, 2006 Counsel converted $3,386 of this
debt into 3,847,475 common shares of C2, and forgave the balance of
$80,196. Counsel subsequently provided additional advances, of
which $1,564 was outstanding at December 31,
2009.
|
17
Cash
Position and Cash Flows
Cash at
December 31, 2009 was $93 compared to $4,076 and $67 at the same date in 2008
and 2007, respectively. As noted above, the significant decrease of
$3,983 in 2009 is primarily related to two items: the
commencement of the operations of Counsel RB and the investment in
Polaroid.
Cash provided by
or used in operating activities.
Cash used by operating
activities (excluding discontinued operations) during 2009 was $7,842, as
compared to cash provided of $5,692 in 2008 and cash used of $1,275 in
2007. A major reason for the change was that in 2009 the Company had
a loss of $1,199 from continuing operations, as compared to income of $5,839 in
2008 and a loss of $639 in 2007. During 2009, in connection with the
commencement of Counsel RB’s operations, the Company used cash of $1,951 to
acquire inventory and invested $4,155 in asset liquidation investments; there
were no similar transactions in 2008 or 2007. During 2009, accounts
receivable increased by $1,000, also primarily due to the operations of Counsel
RB. This was partially offset by an increase of $985 in accounts
payable and accrued liabilities; the corresponding amounts in 2008 and 2007 were
an increase of $70 and a decrease of $148, respectively. In
connection with the Company’s assumption of both third party and related party
debt during 2009, interest of $169 was accrued, compared to $0 in 2008 and $184
in 2007; in 2009 the Company also amortized $112 of deferred financing costs on
the third party debt. In 2009 deferred income tax assets decreased by
$146, as compared to decreasing by $125 in 2008 and increasing by $1,000 in
2007. The Company recorded $252 in earnings from equity investments
during 2009, $246 of which was from Polaroid, as compared to a loss of $38
during 2008 and income of $6 in 2007. The Company’s gains on the sale
of investments were $21 in 2009, $425 in 2008 and $75 in 2007.
Cash provided by
or used in investing activities.
Net cash used by investing
activities during 2009 was $2,273, as compared to $664 and $662 of cash provided
during 2008 and 2007, respectively. During 2009, the primary
transaction was the use of $2,631 to invest in Polaroid, partially offset by
subsequent distributions of $232 from Polaroid and $5 from Knight’s Bridge
GP. In 2008, the Company made investments of $125, and received $8 in
cash distributions, and in 2007 the Company invested $595 and received
distributions of $7. In 2009, proceeds from the sale of a portion of
the Company’s investment in Buddy Media were $121, as compared to proceeds from
investment sales of $781 and $150 in 2008 and 2007, respectively. In
2007, the Company’s $1,100 preferred share investment in AccessLine
Communications was redeemed in full; there were no similar transactions in 2008
or 2009.
Cash provided by
or used in financing activities.
Net cash of $6,132 was
provided by financing activities during 2009, as compared to cash used of $2,335
in 2008 and cash provided of $683 in 2007. In 2009, in connection
with the operations of Counsel RB, the Company received net cash of $4,565 from
third party lenders and a contribution of $237 from the non-controlling interest
associated with Counsel RB. Also during 2009 the Company’s parent,
Counsel, provided net cash of $1,456. $126 was used to purchase and
cancel preferred and common shares, as part of a settlement with dissenting
shareholders. During 2008, the single financing activity was
repayment of the $2,335 debt owing to Counsel. During 2007, Counsel
provided net cash of $2,145, and the Company paid $1,462 to a third party
lender.
Contractual
Obligations
The
following table summarizes the amounts of payments due, including accrued
interest to December 31, 2009 and estimated interest to maturity, under
specified contractual obligations outstanding at December 31,
2009. We have no liabilities associated with income taxes that
require disclosure.
|
Payment due by period
|
||||||||||||||||||||
|
Contractual obligations:
|
Total
|
Less than 1
year
|
1-3
years
|
3-5
years
|
More than
5 years
|
|||||||||||||||
|
Promissory
Note
|
$ | 1,446 | $ | 1,446 | $ | — | $ | — | $ | — | ||||||||||
|
Revolving
Credit Facility
|
3,282 | 3,282 | — | — | — | |||||||||||||||
|
Related
party debt
|
1,726 | 1,726 | — | — | — | |||||||||||||||
|
Operating
leases
|
310 | 74 | 149 | 87 | — | |||||||||||||||
|
Total
|
$ | 6,764 | $ | 6,528 | $ | 149 | $ | 87 | $ | — | ||||||||||
18
Consolidated
Results of Operations
Key
selected financial data for the three years ended December 31, 2009, 2008 and
2007 are as follows:
|
2009
|
2008
|
2007
|
||||||||||
|
Revenue:
|
||||||||||||
|
Patent
licensing
|
$ | — | $ | 17,625 | $ | — | ||||||
|
Asset
liquidation
|
5,991 | — | — | |||||||||
|
Total
revenue
|
5,991 | 17,625 | — | |||||||||
|
Operating
costs and expenses:
|
||||||||||||
|
Patent
licensing
|
29 | 10,729 | — | |||||||||
|
Asset
liquidation
|
4,138 | — | — | |||||||||
|
Selling,
general and administrative
|
2,657 | 1,273 | 1,216 | |||||||||
|
Depreciation
and amortization
|
— | 20 | 20 | |||||||||
|
Total
operating costs and expenses
|
6,824 | 12,022 | 1,236 | |||||||||
| (833 | ) | 5,603 | (1,236 | ) | ||||||||
|
Earnings
of equity accounted asset liquidation investments
|
64 | — | — | |||||||||
|
Operating
income (loss)
|
(769 | ) | 5,603 | (1,236 | ) | |||||||
|
Other
income (expenses):
|
||||||||||||
|
Other
income (expense)
|
(88 | ) | 442 | (213 | ) | |||||||
|
Interest
expense – third party
|
(217 | ) | — | (12 | ) | |||||||
|
Interest
expense – related party
|
(108 | ) | (43 | ) | (184 | ) | ||||||
|
Total
other income (expenses)
|
(413 | ) | 399 | (409 | ) | |||||||
|
Income
(loss) from continuing operations before the undernoted
|
(1,182 | ) | 6,002 | (1,645 | ) | |||||||
|
Income
tax expense (recovery)
|
269 | 125 | (1,000 | ) | ||||||||
|
Earnings
(loss) of equity accounted investments (net of $0 tax)
|
252 | (38 | ) | 6 | ||||||||
|
Income
(loss) from continuing operations
|
(1,199 | ) | 5,839 | (639 | ) | |||||||
|
Loss
from discontinued operations
|
— | (12 | ) | (6 | ) | |||||||
|
Net
income (loss)
|
(1,199 | ) | 5,827 | (645 | ) | |||||||
|
Net
(income) loss attributable to non-controlling interest
|
(65 | ) | — | — | ||||||||
|
Net
income (loss) attributable to controlling interest
|
$ | (1,264 | ) | $ | 5,827 | $ | (645 | ) | ||||
Patent
licensing revenue is derived from licensing our intellectual
property. Our VoIP Patent Portfolio is an international patent
portfolio covering the basic process and technology that enable VoIP
communications.
Asset
liquidation revenue is earned from the acquisition and subsequent disposition of
distressed and surplus assets, including industrial machinery and equipment,
real estate, inventories, accounts receivable and distressed debt. It
is also earned from more traditional asset disposition services, such as on-site
and webcast auctions, liquidations and negotiated sales. The Company
also earns income from its asset liquidation business through its earnings from
equity accounted asset liquidation investments, as discussed in Note 2 of the
consolidated financial statements. The Company began operating in the
asset liquidation segment in the second quarter of 2009 when Counsel RB, its
75%-owned subsidiary that was established in the first quarter of 2009,
commenced operations.
2009
Compared to 2008
Patent licensing revenues
were
$0 in 2009 and $17,625 in 2008. In 2008 these revenues were from
settlement and license agreements entered into with several U.S.
telecommunications carriers.
Patent licensing expense
was
$29 in 2009 and $10,729 in 2008. This expense includes four
components: disbursements directly related to patent licensing,
contingency fees earned by our legal counsel, ongoing business expenses related
to patent licensing, and the participation fee of 35% payable to the vendor of
the VoIP Patent.
Asset liquidation revenues
were $5,991 in 2009, relating to the dispositions of assets by Counsel
RB. There were no similar revenues in 2008, given that Counsel RB was
formed in 2009.
Asset liquidation expense
was
$4,138 in 2009. There was no similar expense in 2008, given that
Counsel RB was formed in 2009.
19
Earnings of equity accounted asset
liquidation investments
were $64 in 2009. There was no similar
earnings in 2008, given that these earnings relate to Counsel RB
operations.
Selling, general, administrative and
other expense
was $2,657 for the year ended December 31, 2009 as compared
to $1,273 for the year ended December 31, 2008. The significant
changes included:
|
|
·
|
Compensation
expense in 2009 was $1,163 compared to $361 in 2008. The
increase was primarily due to $954 of compensation paid to Counsel RB
employees, for which there was no corresponding expense in
2008. The salary earned by the CEO of C2 remained unchanged at
$138. There was no bonus paid to the CEO of C2 in 2009,
compared to $138 paid in 2008. Stock-based compensation expense
decreased by $14, from $85 in 2008 to $71 in
2009.
|
|
|
·
|
Legal
expenses in 2009 were $536, an increase of $448 compared to $88 in
2008. The increase is primarily due to costs incurred with
respect to potential investment funds. As well, Counsel RB
incurred $85 of legal expense during
2009.
|
|
|
·
|
Accounting
and tax consulting expenses in 2009 were $97 compared to $122 in
2008.
|
|
|
·
|
Fees
paid to the members of our Board of Directors remained unchanged at $126
in both 2009 and 2008.
|
|
|
·
|
Consulting
expense was $82 in 2009, and related solely to the operations of Counsel
RB. There was no comparable expense in
2008.
|
|
|
·
|
Management
fee expense charged by our majority stockholder, Counsel, remained
unchanged at $360 in both 2009 and 2008. See Item 13 of this
Report for details regarding these management
fees.
|
|
|
·
|
Directors
and officers liability insurance expense was $91 in 2009 as compared to
$150 in 2008. The decrease reflects a decrease in the premium,
which became effective in June
2009.
|
|
|
·
|
Office
rent was $64 in 2009 and related solely to the operations of Counsel
RB. There was no comparable expense in
2008.
|
Depreciation and amortization
– This expense was $0 in 2009 as compared to $20 in 2008. The 2008
expense relates to the amortization of the cost of the VoIP Patent, which was
fully amortized at December 31, 2008.
O
ther income (expense) and earnings of
equity accounted investments
– the changes are related to the
following:
|
|
·
|
Other
expense was $88 in 2009, as compared to other income of $442 in
2008. In 2009 this consists primarily of a write down of $113
taken against Counsel RB inventory, of which $24 relates to equipment and
$89 to real estate. These losses were partially offset by a
gain of $21 on the Company’s sale of a portion of its investment in Buddy
Media and $4 of bank interest. In 2008 this consisted of a $425
gain on the sale of the Company’s investment in LIMOS.com, $15 of interest
income and $2 received as a reduction of prior years’ insurance
premiums.
|
|
|
·
|
Third
party interest expense was $217 in 2009, all of which related to the third
party debt owed by Counsel RB. $112 of this expense represents
the amortization of deferred financing costs. There was no
corresponding expense in 2008, as the Company had no third party debt
outstanding during the year.
|
|
|
·
|
Related
party interest expense was $108 in 2009, as compared to $43 in
2008. The Company began receiving advances from its parent,
Counsel, in the second quarter of 2009, and at December 31, 2009, total
principal and interest outstanding totaled $1,564. In the first
quarter of 2008, the Company accrued $43 of interest on the related party
loan balance that was outstanding at December 31, 2007. This
debt was repaid in March 2008 and therefore the Company incurred no
interest expense subsequent to that
date.
|
20
|
|
·
|
In
2009, the Company recorded $252 of earnings from its equity accounted
investments, as compared to recording a loss of $38 in 2008. In
2009, the earnings consist of $246 from Polaroid and $6 from Knight’s
Bridge GP. In 2008, the Company recorded a loss of $38,
consisting of a $43 loss from LIMOS.com, partially offset by $5 earnings
from Knight’s Bridge GP.
|
2008
Compared to 2007
Patent licensing revenues
were
$17,625 in 2008 and $0 in 2007. These revenues, as noted above, were
from settlement and license agreements entered into with the parties to the
Company’s patent litigation that commenced in June 2006.
Patent licensing expense
was
$10,729 in 2008 and $0 in 2007. This expense includes four
components: disbursements directly related to patent licensing,
contingency fees earned by our legal counsel, ongoing business expenses related
to patent licensing, and the participation fee of 35% payable to the vendor of
the VoIP Patent.
Selling, general, administrative and
other expense
was $1,273 for the year ended December 31, 2008 as compared
to $1,216 for the year ended December 31, 2007. The significant
changes included:
|
|
·
|
Compensation
expense in 2008 was $361 compared to $304 in 2007. The salary
earned by the CEO of C2 remained unchanged at $138. In 2008 a
bonus of $138 was paid; there was no bonus expense in
2007. Stock-based compensation expense decreased by $81, from
$166 in 2007 to $85 in 2008.
|
|
|
·
|
Legal
expenses in 2008 were $88, a decrease of $69 compared to $157 in
2007.
|
|
|
·
|
Accounting
and tax consulting expenses in 2008 were $122 compared to $146 in
2007.
|
|
|
·
|
Fees
paid to the members of our Board of Directors were $126 in 2008 as
compared to $104 in 2007. The increase reflects the addition of
a Class III director in January
2008.
|
|
|
·
|
Management
fee expense charged by our majority stockholder, Counsel, was $360 in 2008
as compared to $225 in 2007. The increase reflects the
additional use of Counsel resources in connection with the patent
licensing litigation and the Company’s investments in Internet-based
e-commerce businesses. See Item 13 of this Report for details
regarding these management fees.
|
|
|
·
|
Directors
and officers insurance expense was $150 in both 2008 and
2007.
|
|
|
·
|
In
2008, the Company incurred expenses of $21 with respect to maintenance
fees for its patents. In 2007 it incurred $60 with respect to
filing fees for patents being issued in various European
countries.
|
Depreciation and amortization
– This expense was $20 in both 2008 and 2007, and relates to the amortization of
the cost of the VoIP Patent. As of December 31, 2008, the cost of the
patent has been fully amortized.
O
ther income (expense) and earnings of
equity accounted investments
– the changes are related to the
following:
|
|
·
|
Other
income was $442 in 2008, as compared to other expense of $213 in
2007. In 2008 this consists of the $425 gain on the sale of the
Company’s investment in LIMOS.com, $15 interest income and $2 received as
a reduction of prior years’ insurance premiums. The 2007
expense is primarily composed of the $293 cost to prepay a note owed to a
third party lender. This was partially offset by the gain of
$75 on the sale of MyTrade.com, $2 of bank interest income, and $3
received as a reduction of prior years’ insurance
premiums.
|
|
|
·
|
Third
party interest expense was $0 in 2008, as compared to $12 in
2007. All of the interest expense in 2007 related to the debt
held by the Company’s third party lender. The loan was repaid
in full effective January 10, 2007.
|
|
|
·
|
Related
party interest expense was $43 in 2008, as compared to $184 in
2007. The decrease of $141 is due to the repayment in full of
the debt owing to Counsel. This was repaid in March 2008 and
therefore the Company incurred no interest expense subsequent to that
date.
|
21
|
|
·
|
In
2008, the Company recorded a loss of $38 from its equity accounted
investments. This consisted of a $43 loss from LIMOS.com,
partially offset by $5 earnings from Knight’s Bridge GP. In
2007 the Company had income of $6 from its equity accounted investments,
which consisted of $7 of income representing the Company’s share of the
earnings of Knight’s Bridge GP, and $1 representing the Company’s share of
the loss recorded by LIMOS.com.
|
Future
Accounting Pronouncements
In June
2009, the FASB issued new guidance on “Accounting for Transfers of Financial
Assets”. It addresses concerns raised by the SEC, members of
Congress, and financial statement users about the accounting and disclosures
required by existing guidance in the wake of the subprime mortgage crisis and
the global credit market deterioration, and is intended to improve the
accounting and disclosure for transfers of financial assets. The new
guidance is effective for financial asset transfers occurring after the
beginning of an entity’s first fiscal year that begins after November 15, 2009,
with early adoption prohibited. The Company will therefore adopt it
on January 1, 2010. The Company does not anticipate that the adoption
will have a material impact on its financial statements.
In June
2009, the FASB updated “Consolidation – Consolidation of Variable Interest
Entities” (“Consolidation”). The update amends the consolidation
guidance that applies to variable interest entities (“VIEs”), and will
significantly affect an entity’s overall consolidation analysis. The
amendments to the consolidation guidance affect all entities currently within
the scope of Consolidation as well as qualifying special-purpose entities that
are outside of its scope. An enterprise will need to reconsider its
previous conclusions regarding the entities that it consolidates, as the update
involves a shift to a qualitative approach that identifies which entities have
the power to direct the activities that most significantly impact the VIE’s
economic performance and the obligation to absorb its losses or the right to
receive benefits from it, as compared to the existing quantitative-based risks
and rewards calculation. The update also requires ongoing assessment
of whether an entity is the primary beneficiary of a VIE, modifies the
presentation of consolidated VIE assets and liabilities, and requires additional
disclosures. The updated guidance is effective as of the beginning of
an entity’s first fiscal year that begins after November 15, 2009, with early
adoption prohibited. The Company does not anticipate that the new
guidance will have a material impact on its financial statements upon its
adoption on January 1, 2010.
In
October 2009, the FASB issued Accounting Standards Update 2009-13,
Revenue Recognition
(“ASU
2009-13”). ASU 2009-13 amends the criteria for separating
consideration in multiple-deliverable revenue arrangements, and establishes a
hierarchy of selling prices to determine the selling price of each specific
deliverable. As part of this, ASU 2009-13 eliminates the residual
method for allocating revenue among the elements of an arrangement and requires
that consideration be allocated at the inception of an
arrangement. As well, it expands disclosure
requirements. ASU 2009-13 is effective for fiscal years beginning on
or after June 15, 2010, and therefore will be adopted by the Company on January
1, 2011. At December 31, 2009, the Company has no revenue generating
activities that would be impacted by the adoption of ASU 2009-13.
In
January 2010, the FASB issued Accounting Standards Update 2010-06,
Improving Disclosures About Fair
Value Measurements
(“ASU 2010-6”). ASU 2010-6 amends the
existing guidance to add new requirements for disclosures about transfers into
and out of Levels 1 and 2, and separate disclosures about purchases, sales,
issuances, and settlements relating to Level 3 measurements. It also
clarifies existing fair value disclosures about the level of disaggregation and
about inputs and valuation techniques used to measure fair value. As
well, it amends guidance on employers’ disclosures about postretirement benefit
plan assets to require that disclosures be provided by classes of assets instead
of by major categories of assets. With one exception, ASU 2010-6 is
effective for reporting periods, including interim periods, beginning after
December 15, 2009. The exception is that the requirement to provide
the Level 3 activity of purchases, sales, issuances, and settlements on a gross
basis is effective for fiscal years beginning after December 15,
2010. Early adoption is permitted. The Company will adopt
ASU 2010-6 on January 1, 2010. It does not currently expect that the
adoption of ASU 2010-6 will significantly impact its financial
statements.
The FASB,
the EITF and the SEC have issued other accounting pronouncements and regulations
during 2009 that will become effective in subsequent periods. The
Company’s management does not believe that these pronouncements will have a
significant impact on the Company’s financial statements at the time they become
effective.
Critical
Accounting Policies
Use
of estimates
Our
consolidated financial statements have been prepared in accordance with
accounting principles generally accepted in the United States
(“GAAP”). This requires management to make estimates and assumptions
based on historical experience and various other factors that are considered to
be reasonable under the circumstances. These affect the reported
amounts of assets and liabilities and the disclosure of contingent assets and
liabilities at the date of the financial statements, as well as the reported
amounts of revenues and expenses during the reporting period. Actual
results could differ from those estimates.
22
Significant
estimates required for the preparation of the consolidated financial statements
included in Item 15 of this Report were those related to accounts receivable,
allowance for doubtful accounts, inventory valuation, goodwill impairment,
valuation and impairment of investments, deferred income tax assets, and timing
of revenue recognition. These estimates are considered significant
because of the significance of the financial statement item to which they
relate, or because they require judgment and estimation due to the uncertainty
involved in measuring, at a specific point in time, events that are continuous
in nature.
Accounts
receivable
The
Company’s accounts receivable are primarily composed of accounts receivable
acquired by Counsel RB as a component of an asset acquisition or pursuant to an
asset disposition. Accounts receivable are recorded at their fair
value at the acquisition or disposition date. At each financial
statement date the fair value of the outstanding accounts receivable is
evaluated, and an allowance is recorded if the book value exceeds the fair
value.
Inventory
The
Company’s inventory consists of assets acquired for resale by Counsel RB, which
are normally expected to be sold within a one-year operating
cycle. They are recorded at the lower of cost and net realizable
value. Since the commencement of Counsel RB’s operations in the
second quarter of 2009, the assets’ selling prices have in general been in
excess of their cost. However, at December 31, 2009, management
determined that certain assets’ net realizable value was less than their
cost. Accordingly, equipment inventory was written down by $24, and
real estate inventory was written down by $89.
Investments
The
Company holds investments in three private companies: a minority
preferred share investment in Buddy Media, Inc. (“Buddy Media”), an equity
interest in KPL, LLC (“Polaroid) and an equity interest in Knight’s Bridge
Capital Partners Internet Fund No. 1 GP LLC (“Knight’s Bridge
GP”). Since none of these investments are traded on an open market,
and none of them are convertible into investments that are traded on an open
market, significant judgment is involved in estimating their fair
values.
The
investment in Buddy Media preferred shares is accounted for under the cost
method, which requires the fair value of the securities to be estimated
quarterly using the best available information as of the evaluation date in
order to determine whether there have been any other than temporary impairments
in the investment’s carrying value. A determination that the
investment was other than temporarily impaired would require that it be written
down to its fair value, with the loss recorded in earnings in the period of the
write down. Given the nature of the investment, fair value estimates
are based upon Level 3 inputs, as defined by GAAP. For Buddy Media,
these inputs consist of the price received for the Company’s second quarter sale
of its Series A preferred share investment, a recent financing round, and other
Buddy Media-specific information such as its financial statements and
projections. Based on an analysis of this information, the Company
concluded that as of December 31, 2009 there had been no impairment in the fair
value of its investment.
The
investments in Polaroid and Knight’s Bridge GP are accounted for under the
equity method. Under this method, the investments are carried at
cost, plus or minus the Company’s share of increases and decreases in the
investee’s net assets and certain other adjustments. The Company’s
share of the net income or loss of the investee is reported separately in the
Company’s income statement, and any return of capital or dividend received from
the investee is credited to the investment account. The Company also
recognizes any other-than-temporary impairments of equity method
investments.
As with
Buddy Media, the fair value estimates of these investments are based on Level 3
inputs. For Polaroid, an internal valuation, based on current
financial statements and projections, was used. The Company concluded
that its investment was not impaired and that the fair value exceeded book
value. The value of Knight’s Bridge GP is primarily based on the
value of the investments held by its own equity method investee, the Internet
Fund. These investments are also not publicly traded, and their
values are estimated using Level 3 inputs, primarily investee financial
statements and projections. Based on an analysis of Knight’s Bridge
GP and the Internet Fund at December 31, 2009, management concluded that its
equity investment was not impaired and that cost is the best estimate of fair
value.
Deferred
income tax assets
The
Company recognizes deferred tax assets and liabilities for temporary differences
between the tax bases of assets and liabilities and the amounts at which they
are carried in the financial statements, based upon the enacted tax rates in
effect for the year in which the differences are expected to reverse. The
Company establishes a valuation allowance when necessary to reduce deferred tax
assets to the amount expected to be realized.
23
The
accounting for uncertainty in income taxes requires a more-likely-than-not
threshold for financial statement recognition and measurement of tax positions
taken or expected to be taken in a tax return. Upon adoption of this
principle, effective January 1, 2007, the Company derecognized certain tax
positions that, upon examination, more likely than not would not have been
sustained as a recognized tax benefit. However, to date the adoption
has had no material effect on the Company’s financial position, operations or
cash flow.
The
Company periodically assesses the value of its deferred tax assets, which have
been generated by a history of net operating and net capital losses, and
determines the necessity for a valuation allowance. The Company
evaluates which portion of the deferred tax assets, if any, will more likely
than not be realized by offsetting future taxable income, taking into
consideration any limitations that may exist on its use of its net operating and
net capital loss carryforwards. For further discussion of the
Company’s income taxes, see Note 10 of the consolidated financial statements
included in Item 15 of this Report.
Liabilities
The
Company is involved from time to time in various legal matters arising out of
its operations in the normal course of business. On a case by case
basis, the Company evaluates the likelihood of possible outcomes for this
litigation. Based on this evaluation, the Company determines whether
a liability accrual is appropriate. If the likelihood of a negative
outcome is probable, and the amount is estimable, the Company accounts for the
liability in the current period. At this time, the Company is not
involved in any litigation and therefore no such liabilities have been
recorded.
Patent
licensing revenue
To date,
patent licensing revenue has been in the form of one-time payments for past and
future use of the Company’s patented technology. These payments were
not contingent upon the occurrence or non-occurrence of any events, and the
parties had no further obligations or performance commitments, nor any
unilateral ability to rescind the agreement. The full payment amounts
were recognized as revenue in the quarter in which the agreements were
completed. In general, patent licensing revenue is recognized when
persuasive evidence of an arrangement exists, delivery has occurred or services
have been rendered, the Company’s price to the customer is fixed or
determinable, and collection of the resulting receivable is reasonably
assured. Revenues where collectability is not assured are recognized
when the total cash collections to be retained by the Company are
finalized.
Asset
liquidation revenue
Asset
liquidation revenue consists of Counsel RB’s proceeds from asset inventory
resale. Asset proceeds are derived from auctions and negotiated
sales. Revenue is recognized when persuasive evidence of an
arrangement exists, the amount of the proceeds is fixed, delivery terms are
arranged and collectability is reasonably assured.
Restatement
of Interim 2009 Financial Results
The
Company’s consolidated financial statements have been restated for the three and
six months ending June 30, 2009, and the three and nine months ending September
30, 2009, to include two corrections in the application of US
GAAP. These were (i) the recognition of patent licensing revenue in
the three months ended June 30, 2009, and (ii) the proportionate consolidation
of the Company’s interests in certain Joint Ventures (as defined in Note 2 of
the audited consolidated financial statements included in Item 15 of this
Report).
Patent
Licensing Revenue Recognition
In June
2009, the Company entered into a patent licensing agreement with an independent
third party in Korea. In connection with this agreement, the Company
recognized the initial revenue and associated costs in the quarter ended June
30, 2009. In the quarter ended September 30, 2009 C2’s management
determined that the collectability of the revenue was doubtful, and recorded an
allowance for doubtful accounts for the full amount of the revenue, net of the
associated costs. Although C2 and the third party had negotiated the
license price and terms, and persuasive evidence of an arrangement existed in
the form of a signed contract, which constituted delivery of the license,
collectability of the associated revenue was not sufficiently assured to warrant
such recognition.
The
impact on the unaudited condensed consolidated financial statements for the
periods ended June 30 and September 30, 2009 is detailed below.
24
Asset
Liquidation Investments
In March
2010, during the Company’s audit of the consolidated financial statements for
the year ended December 31, 2009, C2’s management determined that the Company
had made an error in its reporting of its investments in Joint Ventures, and the
associated revenue and costs, in the quarters ended June 30 and September 30,
2009.
Counsel
RB’s asset liquidation transactions are generally conducted through two
different formats as described below. GAAP requires that they be
reported separately in the consolidated financial statements as
follows:
(1)
Revenue from transactions that Counsel RB conducts directly is reported as Asset
Liquidation revenue, and the associated direct costs are reported as Asset
Liquidation costs. At the balance sheet date, any unsold assets are
reported as Inventory, any outstanding accounts receivable are included in the
Company’s Accounts Receivable, and any associated liabilities are included in
the Company’s Accrued Liabilities. Although all inventory is expected
to be sold in less than one year, real estate inventory is not recorded as a
current asset.
(2)
Transactions that involve Counsel RB’s investment in Joint Ventures require that
they be accounted for using the equity method of accounting wherein Counsel RB’s
proportionate share of the net income (loss) be reported as Earnings (Loss) of
Equity Accounted Asset Liquidation Investments. Although all of
Counsel RB’s investments in Joint Ventures are expected to be sold in less than
one year, they are reported on the balance sheet as non-current Asset
Liquidation Investments.
In the
quarters ended June 30 and September 30, 2009, the Company recorded its
proportionate share of the revenue and costs associated with its investments in
Joint Ventures as Asset Liquidation Revenue and Asset Liquidation
Costs. At June 30 and September 30, 2009, the Company recorded its
proportionate share of the Joint Ventures as allocations to accounts receivable,
inventory, other current assets, accounts payable and accrued liabilities, and
debt payable to third parties. All inventory was recorded as a
current asset. The impact on the unaudited condensed consolidated
financial statements for the periods ended June 30 and September 30, 2009 is
detailed below. In addition, the quarterly results reported in Note
17 of the audited consolidated financial statements included in this Report have
been restated to reflect the correct application of GAAP in each affected
quarter.
Effect of the restatements on the consolidated balance sheets
|
Previously
reported on
Form 10-Q
|
Patent
licensing
restatement
|
Counsel RB
restatement
|
As restated
|
|||||||||||||
|
As
at June 30, 2009
|
$
|
$
|
$
|
$
|
||||||||||||
|
Accounts
receivable
|
1,977 | (552 | ) | (893 | ) | 532 | ||||||||||
|
Inventory
– current
|
4,009 | — | (1,615 | ) | 2,394 | |||||||||||
|
Other
current assets
|
47 | — | (6 | ) | 41 | |||||||||||
|
Total
current assets
|
6,259 | (552 | ) | (2,514 | ) | 3,193 | ||||||||||
|
Inventory
– non-current
|
— | — | 919 | 919 | ||||||||||||
|
Asset
liquidation investments
|
— | — | 1,325 | 1,325 | ||||||||||||
|
Total
assets
|
10,233 | (552 | ) | (270 | ) | 9,411 | ||||||||||
|
Accounts
payable and accrued liabilities
|
1,376 | (187 | ) | (63 | ) | 1,126 | ||||||||||
|
Debt
payable to third parties
|
2,569 | — | (207 | ) | 2,362 | |||||||||||
|
Total
liabilities
|
5,380 | (187 | ) | (270 | ) | 4,923 | ||||||||||
|
Accumulated
deficit
|
(270,253 | ) | (365 | ) | — | (270,618 | ) | |||||||||
|
Total
equity
|
4,853 | (365 | ) | — | 4,488 | |||||||||||
|
Total
liabilities and stockholders’ equity
|
10,233 | (552 | ) | (270 | ) | 9,411 | ||||||||||
25
|
Previously
reported on
Form 10-Q
|
Patent
licensing
restatement
|
Counsel RB
restatement
|
As restated
|
|||||||||||||
|
As
at September 30, 2009
|
$
|
$
|
$
|
$
|
||||||||||||
|
Accounts
receivable
|
1,779 | — | (912 | ) | 867 | |||||||||||
|
Inventory
– current
|
4,828 | — | (1,648 | ) | 3,180 | |||||||||||
|
Total
current assets
|
7,242 | — | (2,560 | ) | 4,682 | |||||||||||
|
Inventory
– non-current
|
— | — | 928 | 928 | ||||||||||||
|
Asset
liquidation investments
|
— | — | 1,358 | 1,358 | ||||||||||||
|
Total
assets
|
10,789 | — | (274 | ) | 10,515 | |||||||||||
|
Accounts
payable and accrued liabilities
|
1,247 | — | (68 | ) | 1,179 | |||||||||||
|
Debt
payable to third parties
|
3,028 | — | (206 | ) | 2,822 | |||||||||||
|
Total
liabilities
|
5,977 | — | (274 | ) | 5,703 | |||||||||||
|
Accumulated
deficit
|
(270,374 | ) | — | — | (270,374 | ) | ||||||||||
|
Total
equity
|
4,812 | — | — | 4,812 | ||||||||||||
|
Total
liabilities and stockholders’ equity
|
10,789 | — | (274 | ) | 10,515 | |||||||||||
Effect
of the restatements on the consolidated statements of operations
|
Previously
reported on
Form 10-Q
|
Patent
licensing
restatement
|
Counsel RB
restatement
|
As restated
|
|||||||||||||
|
For
the three months ended June 30, 2009
|
$
|
$
|
$
|
$
|
||||||||||||
|
Patent
licensing revenue
|
950 | (950 | ) | — | — | |||||||||||
|
Asset
liquidation revenue
|
3,102 | — | (3,067 | ) | 35 | |||||||||||
|
Total
revenue
|
4,052 | (950 | ) | (3,067 | ) | 35 | ||||||||||
|
Patent
licensing expense
|
586 | (585 | ) | — | 1 | |||||||||||
|
Asset
liquidation expense
|
2,675 | — | (2,675 | ) | — | |||||||||||
|
Total
operating costs and expenses
|
3,969 | (585 | ) | (2,675 | ) | 709 | ||||||||||
|
Earnings
of asset liquidation investments
|
— | — | 392 | 392 | ||||||||||||
|
Operating
income (loss)
|
83 | (365 | ) | — | (282 | ) | ||||||||||
|
Income
(loss) from continuing operations
|
106 | (365 | ) | — | (259 | ) | ||||||||||
|
Net
income (loss)
|
112 | (365 | ) | — | (253 | ) | ||||||||||
|
Earnings
(loss) per share from continuing operations
|
||||||||||||||||
|
Common
shares
|
$
|
0.01 |
$
|
(0.01 | ) | |||||||||||
|
Preferred
shares
|
$
|
0.20 | N/A | |||||||||||||
|
Earnings
(loss) per share
|
||||||||||||||||
|
Common
shares
|
$
|
0.01 |
$
|
(0.01 | ) | |||||||||||
|
Preferred
shares
|
$
|
0.20 | N/A | |||||||||||||
26
|
Previously
reported on
Form 10-Q
|
Patent
licensing
restatement
|
Counsel RB
restatement
|
As restated
|
|||||||||||||
|
For
the six months ended June 30, 2009
|
$
|
$
|
$
|
$
|
||||||||||||
|
Patent
licensing revenue
|
950 | (950 | ) | — | — | |||||||||||
|
Asset
liquidation revenue
|
3,102 | — | (3,067 | ) | 35 | |||||||||||
|
Total
revenue
|
4,052 | (950 | ) | (3,067 | ) | 35 | ||||||||||
|
Patent
licensing expense
|
587 | (585 | ) | — | 2 | |||||||||||
|
Asset
liquidation expense
|
2,675 | — | (2,675 | ) | — | |||||||||||
|
Total
operating costs and expenses
|
4,357 | (585 | ) | (2,675 | ) | 1,097 | ||||||||||
|
Earnings
of asset liquidation investments
|
— | — | 392 | 392 | ||||||||||||
|
Operating
loss
|
(305 | ) | (365 | ) | — | (670 | ) | |||||||||
|
Loss
from continuing operations
|
(273 | ) | (365 | ) | — | (638 | ) | |||||||||
|
Net
loss
|
(230 | ) | (365 | ) | — | (595 | ) | |||||||||
|
Loss
per share from continuing operations
|
||||||||||||||||
|
Common
shares
|
$
|
(0.01 | ) |
$
|
(0.03 | ) | ||||||||||
|
Preferred
shares
|
N/A | N/A | ||||||||||||||
|
Loss
per share
|
||||||||||||||||
|
Common
shares
|
$
|
(0.01 | ) |
$
|
(0.03 | ) | ||||||||||
|
Preferred
shares
|
N/A | N/A | ||||||||||||||
|
For
the three months ended September 30, 2009
|
$
|
$
|
$
|
$
|
||||||||||||
|
Patent
licensing revenue
|
— | — | — | — | ||||||||||||
|
Asset
liquidation revenue
|
1,948 | — | (79 | ) | 1,869 | |||||||||||
|
Total
revenue
|
1,948 | — | (79 | ) | 1,869 | |||||||||||
|
Patent
licensing expense
|
11 | 8 | — | 19 | ||||||||||||
|
Asset
liquidation expense
|
917 | — | (28 | ) | 889 | |||||||||||
|
Selling,
general and administrative expense
|
966 | (373 | ) | — | 593 | |||||||||||
|
Total
operating costs and expenses
|
1,894 | (365 | ) | (28 | ) | 1,501 | ||||||||||
|
Earnings
of asset liquidation investments
|
— | — | 51 | 51 | ||||||||||||
|
Operating
income
|
54 | 365 | — | 419 | ||||||||||||
|
Income
(loss) from continuing operations
|
(57 | ) | 365 | — | 308 | |||||||||||
|
Net
income (loss)
|
(121 | ) | 365 | — | 244 | |||||||||||
|
Earnings
(loss) per share from continuing operations
|
||||||||||||||||
|
Common
shares
|
$
|
(0.01 | ) |
$
|
0.01 | |||||||||||
|
Preferred
shares
|
N/A |
$
|
0.54 | |||||||||||||
|
Earnings
(loss) per share
|
||||||||||||||||
|
Common
shares
|
$
|
(0.01 | ) |
$
|
0.01 | |||||||||||
|
Preferred
shares
|
N/A |
$
|
0.43 | |||||||||||||
27
|
Previously
reported on
Form 10-Q
|
Patent
licensing
restatement
|
Counsel RB
restatement
|
As restated
|
|||||||||||||
|
For
the nine months ended September 30, 2009
|
$
|
$
|
$
|
$
|
||||||||||||
|
Patent
licensing revenue
|
950 | (950 | ) | — | — | |||||||||||
|
Asset
liquidation revenue
|
5,050 | — | (3,146 | ) | 1,904 | |||||||||||
|
Total
revenue
|
6,000 | (950 | ) | (3,146 | ) | 1,904 | ||||||||||
|
Patent
licensing expense
|
598 | (577 | ) | — | 21 | |||||||||||
|
Asset
liquidation expense
|
3,592 | — | (2,703 | ) | 889 | |||||||||||
|
Selling,
general and administrative expense
|
2,061 | (373 | ) | — | 1,688 | |||||||||||
|
Total
operating costs and expenses
|
6,251 | (950 | ) | (2,703 | ) | 2,598 | ||||||||||
|
Earnings
of asset liquidation investments
|
— | — | 443 | 443 | ||||||||||||
|
Operating
loss
|
(251 | ) | — | — | (251 | ) | ||||||||||
|
Loss
from continuing operations
|
(330 | ) | — | — | (330 | ) | ||||||||||
|
Net
loss
|
(351 | ) | — | — | (351 | ) | ||||||||||
|
Loss
per share from continuing operations
|
||||||||||||||||
|
Common
shares
|
$
|
(0.02 | ) |
$
|
(0.02 | ) | ||||||||||
|
Preferred
shares
|
N/A | N/A | ||||||||||||||
|
Loss
per share
|
||||||||||||||||
|
Common
shares
|
$
|
(0.02 | ) |
$
|
(0.02 | ) | ||||||||||
|
Preferred
shares
|
N/A | N/A | ||||||||||||||
Our
exposure to market risk is limited to interest rate sensitivity, which is
affected by changes in the general level of interest rates. Due to
the fact that our cash is deposited with major financial institutions, we
believe that we are not subject to any material interest rate risk as it relates
to interest income. As to interest expense, we have one debt
instrument that has a variable interest rate. Our Revolving Credit
Facility provides that the principal amount outstanding bears interest at the
lender’s prime rate + 1.5%, or a minimum of 5%. Assuming that the
debt amount on the Revolving Credit Facility at December 31, 2009 was constant
during the next twelve-month period, the impact of a one percent increase in the
interest rate would be an increase in interest expense of approximately $32 for
that twelve-month period. We do not believe that, in the near term,
we are subject to material market risk on either our fixed rate third party or
related party debt.
We did
not have any foreign currency hedges or other derivative financial instruments
as of December 31, 2009. We do not enter into financial instruments
for trading or speculative purposes and do not currently utilize derivative
financial instruments. Our operations are conducted primarily in the
United States and as such are not subject to material foreign currency exchange
rate risk.
See
Consolidated Financial Statements and supplementary data beginning on pages F-1
and S-1.
None.
28
Evaluation
of Disclosure Controls and Procedures
As of the
end of the period covered by this Annual Report, under the supervision and with
the participation of management, including the Chief Executive Officer and Chief
Financial Officer (the “Certifying Officers”), the Company conducted an
evaluation of its disclosure controls and procedures. As defined in
Rules 13a-15(e) and 15d-15(e) of the Exchange Act, the term “disclosure controls
and procedures” means controls and other procedures of an issuer that are
designed to ensure that information required to be disclosed by the issuer in
the reports that it files or submits under the Exchange Act is recorded,
processed, summarized and reported, within the time periods specified in the
Commission’s rules and forms. Disclosure controls and procedures
include, without limitation, controls and procedures designed to ensure that
information required to be disclosed by an issuer in the reports that it files
or submits under the Exchange Act is accumulated and communicated to the
issuer’s management, including the Certifying Officers, to allow timely
decisions regarding required disclosure. Based on this evaluation,
the Certifying Officers have concluded that the Company’s disclosure controls
and procedures were effective as of December 31, 2009.
Management’s
Annual Report on Internal Control Over Financial Reporting
The
Company’s management is responsible for establishing and maintaining adequate
internal control over financial reporting, in accordance with Rules 13a-15(f)
and 15d-15(f) of the Exchange Act. Under the supervision and with the
participation of the Company’s management, including the Certifying Officers, we
conducted an evaluation of the effectiveness of the Company’s internal control
over financial reporting based on the framework in
Internal Control—Integrated
Framework
issued by the Committee of Sponsoring Organizations of the
Treadway Commission.
The
Company’s internal control over financial reporting is a process designed to
provide reasonable assurance regarding the reliability of financial reporting
and the preparation of financial statements for external purposes in accordance
with generally accepted accounting principles in the United States of America.
The Company’s internal control over financial reporting includes those policies
and procedures that (i) pertain to the maintenance of records that, in
reasonable detail, accurately and fairly reflect the transactions and
dispositions of the assets of the Company; (ii) provide reasonable assurance
that transactions are recorded as necessary to permit preparation of financial
statements in accordance with generally accepted accounting principles, and that
receipts and expenditures of the Company are being made only in accordance with
authorizations of management and directors of the Company; and (iii) provide
reasonable assurance regarding prevention or timely detection of unauthorized
acquisition, use, or disposition of the Company’s assets that could have a
material effect on the financial statements.
Because
of its inherent limitations, internal control over financial reporting may not
prevent or detect misstatements. Also, projections of any evaluation of
effectiveness to future periods are subject to the risk that controls may become
inadequate because of changes in conditions, or that the degree of compliance
with the policies or procedures may deteriorate.
Based on
its assessment using these criteria, the Company’s management concluded that,
because of the existence of the material weaknesses as discussed below, the
Company‘s internal control over financial reporting was not effective as of
December 31, 2009.
In June
2009, the Company entered into a patent licensing agreement with an independent
third party in Korea. In connection with this agreement, the Company
incorrectly recognized the initial revenue and associated costs in the quarter
ended June 30, 2009. Although C2 and the third party had negotiated
the license price and terms, and persuasive evidence of an arrangement existed
in the form of a signed contract, which constituted delivery of the license,
collectability of the associated revenue was not sufficiently assured to warrant
such recognition. Further, for the quarter ended September 30, 2009
C2’s management determined that the collectability of the revenue was doubtful,
and recorded an allowance in the quarter for doubtful accounts for the full
amount of the revenue recognized in the quarter ended June 30,
2009. Management concluded that this revenue recognition error
resulted from a failure of judgment and a misapplication of the relevant GAAP
concerning revenue recognition criteria to the specific fact situation of the
Korean patent licensing agreement. C2’s management has, accordingly,
concluded that a material weakness in internal control over financial reporting
regarding revenue recognition on a non-routine business transaction
exists as of December 31, 2009.
In
addition, in March 2010, during the audit of the Company’s consolidated
financial statements for the year ended December 31, 2009, C2’s management
determined that the Company had made an error, in the quarters ended June 30 and
September 30, 2009, in reporting its investments pursuant to partnership, joint
venture and limited liability company agreements (collectively, “Joint
Ventures”), and the associated revenue and costs, all related to its 75%-owned
subsidiary Counsel RB Capital LLC. The Company incorrectly
proportionately consolidated such investments when they should have been
accounted for using the equity method of accounting under US
GAAP. Management concluded that the misapplication of GAAP to its
accounting for non-consolidated Joint Ventures involved in its Asset Liquidation
business resulted from a failure to adequately research the GAAP applicable to
this new business segment. C2’s management has, accordingly,
concluded that a material weakness in internal control over financial reporting
regarding its investments in Joint Ventures and the associated revenue and costs
exists as of December 31, 2009.
29
The
impact on the unaudited condensed consolidated financial statements for the
periods ended June 30 and September 30, 2009 is set out in Item 7 of this
Report, in the section entitled “Restatement of Interim 2009 Financial
Results”. In addition, the quarterly results reported in Note 17 of
the audited consolidated financial statements included in this Report have been
restated to reflect the correct application of GAAP in each affected
quarter.
Management
considered what changes, if any, were necessary to the Company’s internal
control over financial reporting to ensure that the errors described above would
not recur. Management has determined that in the future licensing
revenue recognition will be scrutinized more stringently. In
addition, management concluded that it will ensure that a more thorough
investigation of GAAP will be undertaken when it enters into new business
segments to ensure the proper principles are applied.
This
Report does not include an attestation report of the Company’s independent
registered public accounting firm regarding internal control over financial
reporting. Management’s report was not subject to attestation by the
Company’s independent registered public accounting firm pursuant to temporary
rules of the SEC that permit the Company to provide only management’s report in
this Report. Subject to pending legislation that would eliminate the
requirement for an auditor’s attestation, the Company will require an
attestation regarding the effectiveness of internal control to be included as a
report submitted with the Company's Annual Report on Form 10-K for its fiscal
year ending December 31, 2010.
Changes
in Internal Control over Financial Reporting
There
were no changes in our internal control over financial reporting during the
fourth fiscal quarter of 2009 that have materially affected, or are reasonably
likely to materially affect, our internal control over financial
reporting.
None.
30
Under our
Articles of Incorporation, as amended, the Board of Directors is divided into
three classes, with the total number of directors to be not less than five and
not more than nine. Each director is to serve a term of three years
or until his or her successor is duly elected and qualified. As of
the date hereof, the Board of Directors consists of five members: one
Class I director (Mr. Shimer), three Class II directors (Messrs. Toh, Heaton,
and Silber) and one Class III director (Mr. Turock). The following
table sets forth the names, ages and positions with C2 of the persons who
currently serve as our directors and executive officers. There are no
family relationships between any present executive officers and
directors.
|
Name
|
Age
(1)
|
Title
|
||
|
Allan
C. Silber
|
61
|
Chairman
of the Board and Chief Executive Officer
|
||
|
Hal
B. Heaton
|
59
|
Director
(2), (3), (4)
|
||
|
Henry
Y.L. Toh
|
52
|
Director
(2), (3), (4)
|
||
|
Samuel
L. Shimer
|
46
|
Director
(2)
|
||
|
David
L. Turock
|
52
|
Director
(2)
|
||
|
Stephen
A. Weintraub
|
62
|
Executive
Vice President, Corporate Secretary and Chief Financial
Officer
|
|
(1)
|
As
of December 31, 2009.
|
|
(2)
|
Independent
Director
|
|
(3)
|
Member
of the Audit Committee
|
|
(4)
|
Member
of the Compensation Committee
|
Set forth
below are descriptions of the backgrounds of the executive officers and
directors of the Company, their principal occupations for the past five years,
and their directorships held at public companies and registered investment
companies at any time during the last five years:
Allan C. Silber
, Chairman of
the Board and Chief Executive Officer. Mr. Silber was elected to the
Board of Directors as a Class II director in September 2001. He was
appointed as Chairman of the Board in November 2001, a position he held until
October 2004, and was again appointed as Chairman of the Board in March
2005. Mr. Silber is the Chairman and CEO of Counsel Corporation,
which he founded in 1979, the Chairman of Knight’s Bridge Capital Partners Inc.,
a wholly-owned subsidiary of Counsel that is a financial services provider, and,
since 2007, the Chairman and CEO of Terra Firma Capital Corporation, a TSX
Venture Exchange listed company of which Counsel owns approximately
23%. Mr. Silber attended McMaster University and received a Bachelor
of Science degree from the University of Toronto.
Hal B. Heaton
,
Director. Dr. Heaton was appointed by the Board of Directors as a
Class II director on June 14, 2000 to fill a Board vacancy. Mr.
Heaton has expertise in capital markets, corporate finance, emerging markets and
entrepreneurial finance, all of which have relevance to the Company as it
pursues varied investment and business opportunities both in North America and
foreign markets. From 1983 to the present he has been a professor of
Finance at Brigham Young University and between 1988 and 1990 was a visiting
professor of Finance at Harvard University. Dr. Heaton holds a
Bachelor’s degree in Computer Science/Mathematics and a Master’s in Business
Administration from Brigham Young University, as well as a Master’s degree in
Economics and a Ph.D. in Finance from Stanford University.
Henry Y.L. Toh
,
Director. The Board of Directors elected Mr. Toh as a Class II
director and as Vice Chairman of the Board of Directors in April
1992. Mr. Toh has valuable experience as a director with a variety of
technology-oriented companies, in addition to extensive hands-on experience as
an executive officer of the Company. Mr. Toh became President of C2
in May 1993, Acting Chief Financial Officer in September 1995 and Chairman of
the Board in May 1996, and served as such through September 1996. Mr.
Toh was appointed as Chairman of the Audit Committee in March
2005. Mr. Toh has been President and CEO of Amerique Investments
International Corporation since 1992. Additionally, he has been
Executive Vice President and a director of InovaChem, Inc., a development stage
research and development company in specialized chemistry, since February 2008,
and currently serves as the board’s Vice Chairman. Mr. Toh has served
as a director of iDNA, Inc., a specialized finance and entertainment company,
since 1999; a director of Teletouch Communications, Inc., a retail provider of
internet, cellular and paging services, since 2002; a director of Isolagen,
Inc., a biotechnology company, from 2003 until 2009; and a director of American
Surgical Holdings, Inc. since 2007. Mr. Toh is a graduate of Rice
University.
31
Samuel L. Shimer
,
Director. Mr. Shimer has extensive expertise in mergers and
acquisitions, including those transactions that occurred while he was an officer
of the Company and Counsel. Mr. Shimer was appointed by the Board of
Directors as a Class I director on April 15, 2001 to fill a Board
vacancy. He was appointed Senior Vice President, Mergers &
Acquisitions and Business Development on February 12, 2003 and he terminated his
employment with the Company on February 27, 2004 to join J. H. Whitney &
Co., a private equity fund management company, where he remains as a
Partner. From 1997 to February 2003 he was employed by Counsel as a
Managing Director. From 1991 to 1997, Mr. Shimer worked at two
merchant banking funds affiliated with Lazard Frères & Co., Center Partners
and Corporate Partners, ultimately serving as a Principal. Mr. Shimer
earned a Bachelor of Science in Economics degree from The Wharton School of the
University of Pennsylvania, and a Master’s of Business Administration degree
from Harvard Business School.
David L. Turock
,
Director. Mr. Turock is the inventor of the Company’s VoIP Patent,
and an expert on numerous technologies and their applications. Mr.
Turock was appointed by the Board of Directors as a Class III director on
January 16, 2008 to fill a Board vacancy. Mr. Turock began his career
working with AT&T Bell Laboratories in 1982 and Bell Communications Research
in 1988, and subsequently founded enhanced telephone service provider, Call
Sciences. He later formed Interexchange, which designed and operated
one of the world’s largest debit card systems. Most recently, from
2001 to 2007, Mr. Turock was Chief Technology Officer of Therap Services, a
provider of informatics services to disabled patients. Mr. Turock
received his B.S. in Experimental Psychology from Syracuse University, his M.S.
and Ph.D. degrees in Cognitive Psychology from Rutgers University, and his
M.S.E. in Computer Science from the Moore School of the University of
Pennsylvania.
Stephen A. Weintraub
,
Executive Vice President, Corporate Secretary and Chief Financial
Officer. Mr. Weintraub was appointed Senior Vice President and
Secretary of C2 in December 2002. Mr. Weintraub was elected as a
Class I director on November 26, 2003, and served as a director until June 15,
2004. He became an Executive Vice President in October 2005 and was
appointed Chief Financial Officer in December 2005. Mr. Weintraub
joined Counsel in June 1983 as Vice President, Finance and Chief Financial
Officer. He has been and is an officer and director of Counsel and
various Counsel subsidiaries. He has been Secretary of Counsel since
1987 and was appointed Senior Vice President in 1989. In December
2004, Mr. Weintraub was promoted to Executive Vice President and Secretary and
became Chief Financial Officer again in December 2005. Mr. Weintraub
received a Bachelor’s degree in Commerce from the University of Toronto in 1969,
qualified as a Chartered Accountant with Clarkson, Gordon (now Ernst & Young
LLP) in 1972 and received his law degree (LL.B.) from Osgoode Hall Law School,
York University in 1975.
Each
officer of C2 has been appointed by the Board of Directors and holds his office
at the discretion of the Board of Directors.
No
director or officer of our company has, during the last ten years: (i) been
subject to or involved in any legal proceedings described under Item 401(f) of
Regulation S-K, including, without limitation, any criminal proceeding
(excluding traffic violations or similar misdemeanors) or (ii) been a party to a
civil proceeding of a judicial or administrative body of competent jurisdiction
and as a result of such proceeding was or is subject to a judgment, decree or
final order enjoining future violations of, or prohibiting or mandating
activities subject to, United States federal or state securities laws, or
finding any violations with respect to such laws.
Section
16(a) Beneficial Ownership Reporting Compliance
Section
16(a) of the Exchange Act requires our officers and directors, and persons who
own more than ten percent of a registered class of our equity securities, to
file reports of ownership and changes in ownership of equity securities of C2
with the SEC. Officers, directors, and greater than ten percent
stockholders are required by the SEC regulation to furnish us with copies of all
Section 16(a) forms that they file.
Based
solely upon a review of Forms 3 and Forms 4 furnished to us pursuant to Rule
16a-3 under the Exchange Act during our most recent fiscal year, and Forms 5
with respect to our most recent fiscal year, we believe that all such forms
required to be filed pursuant to Section 16(a) were timely filed as necessary,
by the executive officers, directors and security holders required to file same
during the fiscal year ended December 31, 2009.
Code
of Ethics
C2 has
adopted a Code of Ethics that applies to its employees, including its principal
executive, financial and accounting officers or persons performing similar
functions. The C2 Code of Conduct (the “Code”) can be found on the
Company’s website at
http://www.c2global.com
(follow Corporate Governance link to Governance Documents tab). The
Company intends to satisfy the disclosure requirements under Item 5.05 of Form
8-K regarding any amendments to, or waivers from, a provision of the Code that
applies to its principal executive, financial and accounting officers or persons
performing similar functions by posting such information on its website at the
website address set forth above.
32
Corporate
Governance
Board
Leadership and Risk Oversight
C2 is a
small organization, with a market capitalization at December 31, 2009 of
approximately $3.4 million, of which approximately 91% is owned by its parent,
Counsel. As noted above, Mr. Allan Silber is the Chairman and CEO of
Counsel, and we believe that it is most efficient and effective to have Mr.
Silber assume those roles at C2 as well. Also, as noted above, Mr.
Stephen Weintraub has the role of CFO for both Counsel and
C2. Consequently, C2’s operations are largely directed by
Counsel. In prior years, prior to C2’s success with its patent
licensing and asset liquidation businesses, C2’s operations have been
principally funded by Counsel. The Board does not have a lead
independent director since, given the modest size and scale of the Company’s
operations, the Company believes the Board, as a whole, effectively oversees the
strategic priorities of the Company and its operations.
C2’s
operations are modest and it has very few employees, as detailed in Item 11 of
this report, and therefore requires limited oversight by the
Board. As such, the Board meets quarterly to review and approve the
Company’s operating results. It meets annually to review and approve
the Company’s strategy and budget. Material matters such as
acquisitions and dispositions, investments and business initiatives are approved
by the full Board.
Board
Meetings and Committees
The Board
held four meetings during the fiscal year ended December 31,
2009. The Board has designated two standing
committees: the Audit Committee and the Compensation
Committee. C2 does not have a nominating or a corporate governance
committee. However, corporate governance functions are included in
the Audit Committee Charter, and Board nominations are considered by the full
Board. There are no specific criteria for Director nominees, and the
Company does not specifically consider diversity with respect to the selection
of its Board nominees. Given the combination of the Company’s limited
operations and its 91% ownership by Counsel, the Company believes that it would
have difficulty identifying and attracting a diverse selection of
candidates. To date, it has been deemed most effective to nominate
and appoint individuals who are either former employees with detailed knowledge
of the business, such as Mr. Toh and Mr. Shimer, or individuals with expertise
that is unique to the Company’s operations, such as Mr. Turock. There
has been no material change in the procedures by which our shareholders may
recommend nominees to our Board since such procedures were adopted and
implemented.
Audit
Committee
The Audit
Committee is responsible for making recommendations to the Board of Directors
concerning the selection and engagement of independent accountants and for
reviewing the scope of the annual audit, audit fees, results of the audit and
independent registered public accounting firm’s independence. The
Audit Committee is also responsible for corporate governance, and reviews and
discusses with management and the Board of Directors such matters as accounting
policies, internal accounting controls and procedures for preparation of
financial statements. Its membership is currently comprised of Mr.
Toh (Chairman) and Mr. Heaton, both independent directors. The Audit
Committee held four meetings during the fiscal year ended December 31,
2009. On June 9, 2000, the Board of Directors approved C2’s Audit
Committee Charter, which was subsequently revised and amended on July 10, 2001
and again on February 12, 2003 in order to incorporate certain updates in light
of the most recent regulatory developments, including the Sarbanes-Oxley Act of
2002. A copy of the current Audit Committee Charter is available on
the Company’s website
www.c2global.com
.
Audit
Committee Financial Expert
The Board
has determined that Mr. Henry Y.L. Toh is an Audit Committee financial expert as
defined by Item 407(d) of Regulation S-K and is “independent” as such term is
defined under Nasdaq Marketplace Rules and applicable federal securities laws
and regulations.
33
Compensation
Discussion and Analysis
Summary
This
report is the Compensation Discussion and Analysis of our executive compensation
program and an explanation and analysis of the material elements of total
compensation paid to each of our named executive officers. Included
in the discussion is an overview and description of:
|
•
|
our
compensation philosophy and
program;
|
|
•
|
the
objectives of our compensation
program;
|
|
•
|
what
the compensation program is designed to
reward;
|
|
•
|
each
element of compensation;
|
|
•
|
why
we choose to pay each element;
|
|
•
|
how
we determine the amount for each element;
and
|
|
•
|
how
each compensation element and our decision regarding that element fit into
our overall compensation objectives and affects decisions regarding other
elements, including the relationship between our compensation objectives
and our overall risk
management.
|
In
reviewing our executive compensation program, we considered issues pertaining to
policies and practices for allocating between long-term and currently paid
compensation and those policies for allocating between cash and non-cash
compensation. We also considered the determinations for granting
awards, performance factors for our company and our named executive officers,
and how specific elements of compensation are structured and taken into account
in making compensation decisions. Questions related to the
benchmarking of total compensation or any material element of compensation, the
tax and accounting treatment of particular forms of compensation and the role of
executive officers (if any) in the total compensation process also are addressed
where appropriate. In addition to the named executive officers
discussed below, the Company has only two salaried employees. As
their compensation does not contain any elements that promote risk-taking, and
thus could not have a material adverse effect on the Company, this compensation
requires no discussion.
General
Executive Compensation Philosophy
At the
Corporate level, we compensate our executive management through a combination of
base salaries, merit based performance bonuses, and long-term equity
compensation that is designed to be competitive with similarly situated
companies within our industry. At our Counsel RB subsidiary, our
executive management’s compensation does not include merit based performance
bonuses or long-term equity compensation. However, the Counsel RB
executives collectively own 25% of Counsel RB and are entitled to earn 25% of
its profits. Therefore, at all levels of operations, our executive
compensation programs are structured to align management’s incentives with the
long-term interests of our shareholders, and to maximize profitability and
shareholder value.
We adhere
to the following compensation policies, which are designed to support the
achievement of our business strategies:
|
•
|
Our
executive compensation program should strengthen the relationship between
compensation, both cash and equity-based, and performance by emphasizing
variable, at-risk earnings that are dependent upon the successful
achievement of specified corporate, business unit and individual
performance goals.
|
|
•
|
A
portion of each executive’s total compensation should be comprised of
long-term, at-risk compensation to focus management on the long-term
interests of shareholders.
|
|
•
|
An
appropriately balanced mix of at-risk incentive cash and equity-based
compensation aligns the interests of our executives with that of our
shareholders. The equity-based component promotes a continuing focus on
building profitability and shareowner
value.
|
|
•
|
Total
compensation should enhance our ability to attract, retain, motivate and
develop knowledgeable and experienced executives upon whom, in large part,
our successful operation and management
depends.
|
|
•
|
Total
compensation should encourage our executives to ensure that the risks
involved in any business decision align that executive’s potential
personal return with maximal return to
shareholders.
|
34
We set
compensation by establishing targeted compensation levels for each senior
executive and allocating that compensation amount, where appropriate, among base
salary, merit-based compensation bonuses, and long-term equity
compensation. At the highest and most senior levels, we offer
incentive based compensation to reward company wide performance and to maximize
future profitability, stock appreciation and shareholder value.
A core
principle of our executive compensation program is the belief that compensation
paid to executive officers should be closely aligned with our near- and
long-term success, while simultaneously giving us the flexibility to recruit and
retain the most qualified key executives. Our compensation program is
structured so that it is related to our stock performance and other factors,
direct and indirect, all of which may influence long-term shareholder value and
our success.
We
utilize each element of executive compensation to ensure proper balance between
our short- and long-term success as well as between our financial performance
and shareholder return. In this regard, we believe that the executive
compensation program for our named executive officers is consistent with our
financial performance and the performance of each named executive
officer. We do not utilize the services of compensation consultants
in determining or recommending executive or director compensation.
Our
Named Executive Officers for 2009
This
analysis focuses on the compensation paid to our “named executive officers,”
which is a defined term generally encompassing all persons that served as our
principal executive officer or principal financial officer at any time during
the fiscal year, as well as certain other highly paid executive officers serving
in such positions at the end of the fiscal year. During 2009, our
named executive officers consisted of the following officers:
Allan C. Silber
- our Chairman
of the Board and Chief Executive Officer. Mr. Silber is the Chairman and CEO of
Counsel Corporation, our majority shareholder, which he founded in
1979.
Stephen A. Weintraub
– our
Executive Vice President, Corporate Secretary and Chief Financial Officer since
December 2005. Mr. Weintraub is the Executive Vice President, Corporate
Secretary and Chief Financial Officer of Counsel Corporation.
Jonathan Reich
– one of two
Co-CEO’s of Counsel RB. Counsel RB was formed, and Mr. Reich became
Co-CEO, in the first quarter of 2009.
Adam Reich
– one of two
Co-CEO’s of Counsel RB. Counsel RB was formed, and Mr. Reich became
Co-CEO, in the first quarter of 2009.
During
2007 and 2008, our named executive officers consisted of Mr. Silber and Mr.
Weintraub, who held the positions described above.
During
2009, Mr. Silber and Messrs. Reich were paid employees. During 2007
and 2008, with the exception of Mr. Silber, our company had no paid
employees.
Elements
of Compensation
Base
Salaries
Unless
specified otherwise in their employment agreements, the base salaries of the
Company’s named executive officers are evaluated annually. In
evaluating appropriate pay levels and salary increases for such officers, the
Compensation Committee considers achievement of the Company’s strategic goals,
level of responsibility, individual performance, and internal equity and
external pay practices. In addition, the Committee considers the
scope of the executives’ responsibilities, taking into account competitive
market compensation for similar positions, as well as seniority of the
individual, our ability to replace the individual and other primarily judgmental
factors deemed relevant by our Board of Directors and Compensation
Committee.
Base
salaries are reviewed annually by our Compensation Committee and our Board, and
adjusted from time to time pursuant to such review or at other appropriate
times, in order to align salaries with market levels after taking into account
individual responsibilities, performance and experience.
During
2009, the Company’s CEO and the two Counsel RB Co-CEOS were paid
employees. During 2007 and 2008, with the exception of the CEO, the
Company had no paid employees. As noted above, the Company’s CEO, Mr.
Allan Silber, is also the CEO of Counsel. Mr. Silber’s annual salary
of $137.5, and a discretionary bonus of up to 100% of his base salary, have been
fixed at these amounts since 2005.
35
Mr.
Jonathan Reich and Mr. Adam Reich each earn base salaries of $450, and no
discretionary bonuses. These were negotiated in the first quarter of
2009 when they assumed their roles as Co-CEO’s.
Bonuses
Bonus
awards are designed to focus management attention on key operational goals for
the current fiscal year. Our company executives may earn a bonus
based upon achievement of their specific operational goals and achievement by
the Company or business unit of its financial targets. Cash bonus
awards are distributed based upon the Company and the individual meeting
performance criteria objectives. The final determination for all
bonus payments is made by our Compensation Committee.
We set
bonuses based on certain performance measures in order to maximize and align the
interests of our officers with those of our shareholders. Although
performance goals are generally standard for determining bonus awards, we have
and will consider additional performance rating goals when evaluating the bonus
compensation structure of our executive management. In addition, in
instances where the employee has responsibility over a specific area,
performance goals may be directly tied to the overall performance of that
particular area.
As noted
above, Mr. Silber is entitled to a bonus of up to 100% of his annual
salary. Since assuming the role of CEO, he has received a bonus only
in 2008, when he received 100% of his base salary. As this bonus can
only be awarded at the discretion of the Compensation Committee, it does not
encourage inappropriate risk-taking on the part of Mr. Silber, nor represent a
risk to the Company.
Equity
Incentive Grants
In
keeping with our philosophy of providing a total compensation package that
favors at-risk components of pay, long-term incentives can comprise a
significant component of our executives’ total compensation package. These
incentives are designed to motivate and reward executives for maximizing
shareowner value and encourage the long-term employment of key employees. Our
objective is to provide executives with above-average, long-term incentive award
opportunities.
We view
stock options as our primary long-term compensation vehicle for our executive
officers. Stock options generally are granted at the prevailing market price on
the date of grant and will have value only if our stock price increases. Grants
of stock options generally are based upon our performance, the level of the
executive’s position, and an evaluation of the executive’s past and expected
future performance. We do not time or plan the release of material,
non-public information for the purpose of affecting the value of executive
compensation.
We
believe that stock options will continue to be used as the predominant form of
stock-based compensation. The most recent option grants occurred in
2006, when Mr. Silber, as well as other employees of Counsel who receive no
direct compensation from the Company, were awarded a total of 455,000 options to
purchase common stock.
Mr.
Jonathan Reich and Mr. Adam Reich have employment contracts that do not contain
any equity incentive elements. However, as noted above, collectively
they are 25% owners of Counsel RB, and their shareholder agreements provide for
them to earn 25% of Counsel RB profits. We believe that the equity
investment by Mssrs. Reich aligns their interests with those of the Company and
its shareholders, and encourages investment decisions that are aligned with the
Company’s overall risk management philosophy, thereby maximizing long-term
shareholder return.
Other
Benefits
The only
additional benefits provided to employees at this time are the payment of health
insurance premiums, Social Security and Medicare for the
Co-CEO’s. There are no pension, severance or change in control
benefits.
Tax
Considerations
Section
162(m) of the Internal Revenue Code places limits on the deductibility of
compensation in excess of $1 million paid to executive officers of publicly held
companies. The Compensation Committee does not believe that Section
162(m) has had or will have any impact on the compensation policies followed by
the Company.
36
Executive
Compensation Process
Compensation
Committee
Our
Compensation Committee oversees and approves all compensation and awards made to
executive officers under our executive compensation program. The
Compensation Committee reviews the performance and compensation of the Chief
Executive Officer, without his participation, and establishes his compensation
accordingly, with consultation from others when appropriate. For the
remaining executive officers, recommendations are made to the Compensation
Committee by the Chief Executive Officer.
Executive
and Director Compensation – Tabular Disclosure
Please
note that all amounts reported in the tables below, and the accompanying notes,
are in dollars, rounded to the nearest dollar.
Summary
Compensation Table
The
following table sets forth the aggregate compensation for services rendered
during the fiscal years ended December 31, 2009, 2008 and 2007 by our Named
Executive Officers. We have no other officers or employees whose compensation is
$100,000 or more. As discussed below and in Item 13, certain
employees of Counsel provide services to C2, and compensation for those services
is provided and paid for under the terms and provisions of a Management Services
Agreement (the “Agreement”) entered into between Counsel and C2.
|
Name and Principal Position
|
Year
|
Salary
|
Bonus
|
Option
Awards
1
|
All Other
Compensation
2
|
Total
|
||||||||||||||||
|
Allan
Silber
|
2009
|
$ | 137,500 | $ | — | $ | 33,563 | $ | — | $ | 171,063 | |||||||||||
|
Chairman
of the Board and Chief
Executive
Officer
|
2008
|
137,500 | 137,500 | 33,563 | — | 308,563 | ||||||||||||||||
|
2007
|
137,500 | — | 33,563 | — | 171,063 | |||||||||||||||||
|
Stephen
Weintraub
|
2009
|
— | — | 12,375 | — | 12,375 | ||||||||||||||||
|
Executive
Vice President, Chief Financial Officer
|
2008
|
— | — | 12,375 | — | 12,375 | ||||||||||||||||
|
and
Corporate Secretary
|
2007
|
— | — | 12,375 | — | 12,375 | ||||||||||||||||
|
Jonathan
Reich
|
2009
|
393,750 | — | — | 27,068 | 420,818 | ||||||||||||||||
|
Co-CEO,
Counsel RB
|
2008
|
N/A | N/A | N/A | N/A | N/A | ||||||||||||||||
|
2007
|
N/A | N/A | N/A | N/A | N/A | |||||||||||||||||
|
Adam
Reich
|
2009
|
393,750 | — | — | 27,081 | 420,831 | ||||||||||||||||
|
Co-CEO,
Counsel RB
|
2008
|
N/A | N/A | N/A | N/A | N/A | ||||||||||||||||
|
2007
|
N/A | N/A | N/A | N/A | N/A | |||||||||||||||||
1
The
amounts reported in this column relate solely to compensation expense associated
with options issued in 2006. Please see the
“Grants of Plan-Based Awards for the
Year Ended December 31, 2006”
table, as included in our Annual Report on
Form 10-K for the year ended December 31, 2006, for details of these
options.
2
The
amounts reported in this column relate solely to health insurance premiums,
Social Security and Medicare.
Grants
of Plan-Based Awards
There
were no grants of plan-based awards to the Chief Executive Officer, the Chief
Financial Officer or the Counsel RB Co-CEO’s during the years ended December 31,
2007, 2008 and 2009.
Allan
Silber, the CEO of C2, is an employee of Counsel. As CEO of C2, he is
entitled to an annual salary of $137,500, plus a discretionary bonus of up to
100% of the base salary. No bonus has been awarded for
2009. Mr. Silber was awarded his full bonus entitlement in 2008 in
recognition of his involvement in the successful prosecution and settlement of
the Company’s patent infringement litigation. There were no bonus
awards in 2007.
37
Stephen
Weintraub, the CFO of C2, is an employee of Counsel. Mr. Weintraub
has no employment contract with C2. The cost of Mr. Weintraub’s
services to C2 is a component of the Agreement between C2 and
Counsel. The Agreement was first entered into in December 2004 and
successive Agreements have been entered into in each subsequent
year. Under the terms of the Agreement, C2 agrees to make payment to
Counsel for ongoing services provided to C2 by certain Counsel
personnel. The basis for such services charged is an allocation,
based on time incurred, of the cost of the base compensation paid by Counsel to
those employees providing services to C2. For the years ended
December 31, 2009 and 2008, the cost was $360,000. For the year ended
December 31, 2007, the cost was $225,000. The amounts due under the
Agreement are payable within 30 days following the respective year end, subject
to applicable restrictions. Any unpaid fee amounts bear interest at
10% per annum commencing on the day after such year end. In the event
of a change of control, merger or similar event of C2, all amounts owing,
including fees incurred up to the date of the event, will become due and payable
immediately upon the occurrence of such event. The Company expects
that Counsel will continue to provide these services in 2010 on the same cost
basis.
Outstanding
Equity Awards at Fiscal Year-End
The
following table sets forth the detail of outstanding equity awards, as regards
exercisable and unexercisable options, at December 31, 2009.
|
Name
|
Number of
Securities
Underlying
Unexercised
Options:
Exercisable
|
Number of
Securities
Underlying
Unexercised
Options:
Unexercisable
1
|
Option
Exercise
Price($/Sh)
|
Option
Expiration
Date
|
|||||||||
|
Allan
Silber
|
168,750 | 56,250 |
$
|
0.66 |
August
1, 2013
|
||||||||
|
Allan
Silber
|
56,250 | 18,750 | 1.11 |
August
1, 2013
|
|||||||||
|
Stephen
Weintraub
|
56,250 | 18,750 | 1.01 |
August
1,
2013
|
|||||||||
1
The
options vest 25% annually beginning on the first anniversary of the grant
date,
which
was August 1, 2006 for all options reported in this table.
There
were no adjustments or changes in the terms of any of the Company’s equity
awards in 2009.
Compensation
of Directors
The
following table sets forth the aggregate compensation for services rendered
during the fiscal year ended December 31, 2009 by each person serving as a
director.
|
Name
|
Fees Earned or Paid in Cash
|
Option Awards
1
|
Total
|
|||||||||
|
Henry
Y.L. Toh
|
$
|
43,000 |
$
|
4,664 |
$
|
47,664 | ||||||
|
Hal
B. Heaton
|
35,000 | 4,664 | 39,664 | |||||||||
|
Samuel
L. Shimer
|
24,000 | 4,664 | 28,664 | |||||||||
|
David
L. Turock
|
24,000 | 2,463 | 26,463 | |||||||||
1
The
options vest 25% annually beginning on the first anniversary of the grant
date. The amount reported in this column relates to compensation
expense associated with options issued in each year from 2005 to
2009. The table below provides information regarding the current year
compensation expense and grant date fair value of each option award underlying
the reported 2009 compensation expense.
38
|
DETAIL OF DIRECTOR OPTION AWARDS EXPENSE
|
||||||||||||||
|
Name
|
Grant Date
|
Number of
Options
Awarded
|
Grant Date Fair
Value of Option
Award
|
2009 Expense
|
||||||||||
|
Henry
Y. L. Toh
|
April
1, 2005
|
10,000 | $ | 3,600 | $ | 226 | ||||||||
|
April
3, 2006
|
10,000 | 3,300 | 825 | |||||||||||
|
April
2, 2007
|
10,000 | 4,600 | 1,150 | |||||||||||
|
March
31, 2008
|
10,000 | 8,700 | 2,175 | |||||||||||
|
March
31, 2009
|
10,000 | 1,500 | 288 | |||||||||||
| $ | 4,664 | |||||||||||||
|
Hal
B. Heaton
|
April
1, 2005
|
10,000 | $ | 3,600 | $ | 226 | ||||||||
|
April
3, 2006
|
10,000 | 3,300 | 825 | |||||||||||
|
April
2, 2007
|
10,000 | 4,600 | 1,150 | |||||||||||
|
March
31, 2008
|
10,000 | 8,700 | 2,175 | |||||||||||
|
March
31, 2009
|
10,000 | 1,500 | 288 | |||||||||||
| $ | 4,664 | |||||||||||||
|
Samuel
L. Shimer
|
April
1, 2005
|
10,000 | $ | 3,600 | $ | 226 | ||||||||
|
April
3, 2006
|
10,000 | 3,300 | 825 | |||||||||||
|
April
2, 2007
|
10,000 | 4,600 | 1,150 | |||||||||||
|
March
31, 2008
|
10,000 | 8,700 | 2,175 | |||||||||||
|
March
31, 2009
|
10,000 | 1,500 | 288 | |||||||||||
| $ | 4,664 | |||||||||||||
|
David
L. Turock
|
March
31, 2008
|
10,000 | 8,700 | $ | 2,175 | |||||||||
|
March
31, 2009
|
10,000 | 1,500 | 288 | |||||||||||
| $ | 2,463 | |||||||||||||
Each
director who is not employed by C2 or by Counsel receives a $20,000 per year
cash retainer, $1,000 per meeting attended in person or by telephone, and an
annual grant of stock options to purchase 10,000 shares of common stock, which
is awarded on March 31 or the next business day. In addition, the
Chairman of the Audit Committee receives a cash retainer of $10,000 per year,
Audit Committee members who are not the chair receive a cash retainer of $5,000
per year, and other committee chairpersons receive an annual cash retainer of
$2,000 per year. The directors are also eligible to receive options
under our stock option plans at the discretion of the Board of
Directors. No discretionary stock options were awarded during 2009,
2008 or 2007.
Compensation
Committee Interlocks and Insider Participation
The
Compensation Committee reviews and approves the compensation for executive
employees. The Compensation Committee Charter was first approved by
C2’s Board of Directors on February 12, 2003 and was subsequently revised on
December 9, 2005. The Compensation Committee Charter is available on
the Company’s website
www.c2global.com
.
According
to the Compensation Committee’s charter, the majority of the members must be
independent directors. The membership is currently comprised of
Messrs. Heaton (Chairman) and Toh, both independent directors. The
Compensation Committee held one meeting during the fiscal year ended December
31, 2009.
No
Compensation Committee members or other directors served:
|
|
·
|
as
a member of the compensation committee of another entity which has had an
executive officer who has served on our compensation
committee;
|
|
|
·
|
as
a director of another entity which has had an executive officer who has
served on our compensation committee;
or
|
|
|
·
|
as
a member of the compensation committee of another entity which has had an
executive officer who has served as one of our
directors.
|
39
Compensation
Committee Report
The
following paragraphs in this section constitute information required pursuant to
Section 407(e)(5) of Regulation S-K promulgated under the Securities Act. In
accordance with these rules, the information so provided is “”furnished”, not
“filed” with the SEC.
1. The
Compensation Committee has reviewed and discussed the Compensation Discussion
and Analysis (“CD&A”) set forth above with the management of the Company;
and
2. Based
on the review and discussions, the Compensation Committee recommended to the
Board of Directors that the CD&A be included in the Company’s Annual Report
on Form 10-K for the fiscal year ended December 31, 2009, and, as applicable,
the Company’s proxy statement.
By the Compensation
Committee
:
/s/ Hal. B.
Heaton
Hal B.
Heaton, Chairman
/s/ Henry Y.L.
Toh
Henry Y.
L. Toh
Date: March
31, 2010
40
Stock
Option Plans
At
December 31, 2009, the Company had five stock-based employee compensation plans,
which are described below. All share amounts disclosed below reflect
the effect of the 1-for-20 reverse stock split which was approved by the
stockholders on November 26, 2003.
1995 Director Stock Option
and Appreciation Rights Plan
The 1995
Director Stock Option and Appreciation Rights Plan (the “1995 Director Plan”)
provides for the issuance of incentive stock options, non-qualified stock
options and stock appreciation rights (“SARs”) to directors of the Company up to
12,500 shares of common stock (subject to adjustment in the event of stock
dividends, stock splits, and other similar events). If any incentive
option, non-qualified option or SAR terminates prior to exercise thereof and
during the duration of the 1995 Director Plan, the shares of common stock as to
which such option or right was not exercised will become available under the
1995 Director Plan for the grant of additional options or rights to any eligible
director. Each option is immediately exercisable for a period of ten
years from the date of grant. The Company has 12,500 shares of common
stock reserved for issuance under the 1995 Director Plan. As of
December 31, 2009 and 2008, there were no options outstanding under the 1995
Director Plan.
1995 Employee Stock Option
and Appreciation Rights Plan
The 1995
Employee Stock Option and Appreciation Rights Plan (the “1995 Employee Plan”)
provides for the grant of incentive stock options, non-qualified stock options,
and SARs of up to 20,000 shares of common stock (subject to adjustment in the
event of stock dividends, stock splits, and other similar
events). Directors of the Company are not eligible to participate in
the 1995 Employee Plan. The 1995 Employee Plan provides for the grant
of stock options, which qualify as incentive stock options under Section 422 of
the Internal Revenue Code, to be issued to officers who are employees and other
employees, as well as for the grant of non-qualified options to be issued to
officers, employees and consultants. In addition, SARs may be granted
in conjunction with the grant of incentive and non-qualified
options. To the extent that an incentive option or non-qualified
option is not exercised within the period of exercisability specified therein,
it will expire as to the then unexercisable portion. If any incentive
option, non-qualified option or SAR terminates prior to exercise thereof and
during the duration of the 1995 Employee Plan, the shares of common stock as to
which such option or right was not exercised will become available under the
1995 Employee Plan for the grant of additional options or rights to any eligible
employee. The shares of common stock subject to the 1995 Employee
Plan may be made available from either authorized but unissued shares, treasury
shares or both. The Company has 20,000 shares of common stock reserved for
issuance under the 1995 Employee Plan. As of December 31, 2009 and
2008, there were no options outstanding under the 1995 Employee
Plan.
1997 Recruitment Stock
Option Plan
In
October 2000, the stockholders of the Company approved an amendment of the 1997
Recruitment Stock Option Plan (the “1997 Plan”) which provides for the issuance
of incentive stock options, non-qualified stock options and SARs up to an
aggregate of 370,000 shares of common stock (subject to adjustment in the event
of stock dividends, stock splits, and other similar events). The
price at which shares of common stock covered by the option can be purchased is
determined by the Company’s Board of Directors; however, in all instances the
exercise price is never less than the fair market value of the Company’s common
stock on the date the option is granted.
As of
December 31, 2009, there were options to purchase 236,111 shares (2008 – 237,361
shares) of the Company’s common stock outstanding under the 1997
Plan. 56,250 of these options, with an exercise price of $0.66 per
share, were unvested at December 31, 2009 (2008 – 112,500). They will
vest in 2010. 168,750 options with an exercise price of $0.66 per
share were vested at December 31, 2009 (2008 – 112,500). 11,111
options with exercise prices of $1.40 to $111.26 per share were vested at
December 31, 2009 (2008 – 12,361 options with exercise prices of $1.40 to
$111.26 per share). The options with an exercise price of $0.66 must
be exercised within seven years of grant date and can only be exercised while
the option holder is an employee of the Company. The remaining
options must be exercised within ten years of grant date and can only be
exercised while the option holder is an employee of the Company. The
Company has not awarded any SARs under the 1997 Plan. During 2009, no
options to purchase shares of common stock were issued, and 1,250 options
expired. During 2008, no options to purchase shares of common stock
were issued, and 1,250 options expired. There were no exercises
during 2009 or 2008.
41
2000 Employee Stock Purchase
Plan
The 2000
Employee Stock Purchase Plan (the “Stock Purchase Plan”) provides for the
purchase of common stock, in the aggregate, up to 125,000 shares. The
purpose of the Stock Purchase Plan is to provide incentives for all eligible
employees of C2 (or any of its subsidiaries), who have been employees for at
least three months, to participate in stock ownership of C2 by acquiring or
increasing their proprietary interest in C2. The Stock Purchase Plan
is designed to encourage employees to remain in the employ of C2. It
is the intention of C2 to have the Stock Purchase Plan qualify as an “employee
stock purchase plan” within the meaning of Section 423 of the Internal Revenue
Code, as amended. This plan allows all eligible employees of the
Company to have payroll withholding of 1 to 15 percent of their
wages. The amounts withheld during a calendar quarter are then used
to purchase common stock at a 15 percent discount off the lower of the closing
sale price of the Company’s stock on the first or last day of each
quarter. This plan was effective beginning the third quarter of
2000. The Company issued 1,726 shares to employees based upon payroll
withholdings during 2001. There have been no issuances since
2001.
2003 Stock Option and
Appreciation Rights Plan
In
November 2003, the stockholders of the Company approved the 2003 Stock Option
and Appreciation Rights Plan (the “2003 Plan”) which provides for the issuance
of incentive stock options, non-qualified stock options and SARs up to an
aggregate of 2,000,000 shares of common stock (subject to adjustment in the
event of stock dividends, stock splits, and other similar
events). The price at which shares of common stock covered by the
option can be purchased is determined by the Company’s Board of Directors or a
committee thereof; however, in the case of incentive stock options the exercise
price shall not be less than the fair market value of the Company’s common stock
on the date the option is granted. As of December 31, 2009, there
were options to purchase 678,250 shares (2008 - 638,250 shares) of the Company’s
common stock outstanding under the 2003 Plan. The outstanding options
vest over four years at exercise prices ranging from $0.15 to $3.00 per
share. During 2009, 40,000 options (2008 – 40,000 options) were
granted. During 2009 and 2008 no options to purchase shares of common
stock were forfeited or expired. There were no options exercised
during 2009 and 2008, and no SARs have been issued under the 2003
Plan.
42
Please
see Item 5 for detail of the Company’s securities authorized for issuance under
equity compensation plans.
The
following table sets forth information regarding the ownership of our common
stock as of March 25, 2010 by: (i) each director; (ii) each of the Named
Executive Officers in the Summary Compensation Table; (iii) all executive
officers and directors of the Company as a group; and (iv) all those known by us
to be beneficial owners of more than five percent of our common
stock. As of March 25, 2010, there are 22,718,074 shares of common
stock and 592 shares of Series N Preferred stock issued and
outstanding. Each share of Series N Preferred Stock is entitled to 40
votes.
|
Name and Address of
Beneficial Owner (1)
|
Number of Shares
Beneficially Owned
(2)
|
Percentage
of Common Stock
Beneficially Owned
|
||||||
|
Allan
C. Silber
|
225,000 | (3) | * | % | ||||
|
Hal
B. Heaton
|
52,948 | (4) | * | % | ||||
|
Henry
Y.L. Toh
|
50,413 | (4) | * | % | ||||
|
Samuel
L. Shimer
|
45,000 | (5) | * | % | ||||
|
David
L. Turock
|
7,500 | (4) | * | % | ||||
|
Stephen
A. Weintraub
|
56,250 | (6) | * | % | ||||
|
Counsel
Corporation and subsidiaries
40
King Street West Suite 3200
Toronto,
Ontario M5H 3Y2
|
20,644,481 | 89 | % | |||||
|
All
Executive Officers and Directors as a Group (6 people)
|
437,111 | 2 | % | |||||
|
*
|
Indicates
less than one percent
|
|
(1)
|
Unless
otherwise noted, all listed shares of common stock are owned of record by
each person or entity named as beneficial owner and that person or entity
has sole voting and dispositive power with respect to the shares of common
stock owned by each of them. All addresses are c/o C2 Global
Technologies Inc. unless otherwise
indicated.
|
|
(2)
|
As
to each person or entity named as beneficial owners, that person’s or
entity’s percentage of ownership is determined based on the assumption
that any options or convertible securities held by such person or entity
which are exercisable or convertible within 60 days have been exercised or
converted, as the case may be.
|
|
(3)
|
Represents
shares of common stock issuable pursuant to options. Mr. Silber
is Chairman, Chief Executive Officer and President of Counsel, and a
beneficial owner of approximately 7,755,877 shares or 12.1% of the
outstanding common stock (11.0% of the outstanding voting shares) of
Counsel. Mr. Silber disclaims beneficial ownership of the
shares of C2’s common stock beneficially owned by
Counsel.
|
|
(4)
|
Represents
shares of common stock issuable pursuant to
options.
|
|
(5)
|
Represents shares of common stock
issuable pursuant to options. Mr. Shimer is a beneficial owner
of 819,011 shares in Counsel, which represents a 1.3% beneficial ownership
of Counsel. Mr. Shimer disclaims beneficial ownership of the shares of
C2’s common stock beneficially owned by
Counsel.
|
|
(6)
|
Represents
shares of common stock issuable pursuant to options. Mr.
Weintraub is Executive Vice President, Secretary and Chief Financial
Officer of Counsel and a beneficial owner of 466,901 shares in Counsel,
which represents less than 1% beneficial ownership of
Counsel. Mr. Weintraub disclaims beneficial ownership of the
shares of C2’s common stock beneficially owned by
Counsel.
|
There are
no arrangements, known to the Company, including any pledge by any person of
securities of the registrant or any of its parents, the operation of which may
at a subsequent date result in a change of control of the
registrant.
43
Transactions
with Management and Others
See Item
11 hereof for descriptions of the terms of employment, consulting and other
agreements between the Company and certain officers, directors and other related
parties.
Transactions
with Counsel
Collateralized
Loan Agreement
At
December 31, 2009 the Company was indebted to Counsel in the amount of $1,564,
as compared to $0 at December 31, 2008. The debt is secured by a
collateralized promissory note and loan agreement (the “Counsel
Loan”). The Counsel Loan, which was originally entered into during
the fourth quarter of 2003, accrues interest at 10% per annum compounded
quarterly from the date funds are advanced. The Counsel Loan has been
amended several times, most recently during the second quarter of 2009 when it
was converted into a demand loan. The Counsel Loan is secured by the
assets of the Company and is subject to certain events of default.
Counsel
Management Services
Since
December 2004, C2 and Counsel have entered into successive annual management
services agreements (the “Agreement”). Under the terms of the
Agreement, C2 agrees to make payment to Counsel for ongoing services provided to
C2 by several Counsel personnel. The basis for such services charged
is an allocation, based on time incurred, of the cost of the base compensation
paid by Counsel to those employees providing services to C2. For the
year ended December 31, 2009, the cost was $360. For the years ended
December 31, 2008 and 2007, the cost was $360 and $225,
respectively. The amounts due under the Agreement are payable within
30 days following the respective year end, subject to applicable
restrictions. Any unpaid fee amounts bear interest at 10% per annum
commencing on the day after such year end. In the event of a change
of control, merger or similar event of C2, all amounts owing, including fees
incurred up to the date of the event, will become due and payable immediately
upon the occurrence of such event. The Company expects that Counsel
will continue to provide these services in 2010 on the same cost
basis.
Director
Independence
As an
OTC-Bulletin Board company, we elect to comply with the “independence”
requirements under the Nasdaq Marketplace Rules. Pursuant to the
requirements, the Board undertook its annual review of director
independence. During this review, the Board considered transactions
and relationships between each director or any member of his or her immediate
family and C2 and its subsidiaries and affiliates. The purpose of
this review was to determine whether any such relationships or transactions
existed that were inconsistent with a determination that the director is
independent. As a result of this review, the Board
affirmatively determined that during 2009 Mr. Toh, Mr. Heaton, Mr. Shimer and
Mr. Turock are independent for purposes of the independence requirements as
defined under the Nasdaq Marketplace Rules. The Board further
determined that each of the foregoing directors met the independence
requirements needed to serve on the Board committees for which they
serve.
Fees paid
or expected to be paid to Deloitte & Touche LLP, our independent registered
chartered accountants for the fiscal periods ended December 31, 2009 and 2008,
are set forth below.
|
Year Ended December 31,
|
||||||||
|
2009
|
2008
|
|||||||
|
Audit
fees
|
$ | 100 | $ | 88 | ||||
|
Audit-related
fees
|
— | — | ||||||
|
Tax
fees
|
— | — | ||||||
|
All
other fees
|
— | — | ||||||
|
Total
|
$ | 100 | $ | 88 | ||||
Audit
Fees
Audit
fees are for professional services for the audit of our annual financial
statements for the years ended December 31, 2008 and 2009, the reviews of the
financial statements included in our quarterly reports on Form 10-Q for the
years ended December 31, 2008 and 2009, and services in connection with our
statutory and regulatory filings for the years ended December 31, 2008 and
2009.
44
Audit-Related
Fees
Audit
related fees are for assurance and related services that are reasonably related
to the audit and reviews of our financial statements for the years ended
December 31, 2008 and 2009, exclusive of the fees disclosed as Audit Fees
above. These fees include benefit plan audits and accounting
consultations.
Tax
Fees
Tax fees
are for services related to tax compliance, consulting and planning services for
the years ended December 31, 2008 and 2009 and included preparation of tax
returns, review of restrictions on net operating loss carryforwards and other
general tax services. For 2008 and 2009, these services were provided
by independent registered public accounting firms other than
Deloitte.
All
Other Fees
We did
not incur fees for any services, other than the fees disclosed above relating to
audit, audit-related and tax services, rendered during the years ended December
31, 2008 and 2009.
Audit
and Non-Audit Service Pre-Approval Policy
In
accordance with the requirements of the Sarbanes-Oxley Act of 2002 and the rules
and regulations promulgated thereunder, the Audit Committee has adopted an
informal approval policy to pre-approve services performed by the independent
registered public accounting firm. All proposals for services to be
provided by the independent registered public accounting firm, which must
include a detailed description of the services to be rendered and the amount of
corresponding fees, are submitted to the Chairman of the Audit Committee and the
Chief Financial Officer. The Chief Financial Officer authorizes
services that have been pre-approved by the Audit Committee. If there
is any question as to whether a proposed service fits within a pre-approved
service, the Audit Committee chair is consulted for a
determination. The Chief Financial Officer submits requests or
applications to provide services that have not been pre-approved by the Audit
Committee, which must include an affirmation by the Chief Financial Officer and
the independent registered public accounting firm that the request or
application is consistent with the SEC’s rules on auditor independence, to the
Audit Committee (or its Chairman or any of its other members pursuant to
delegated authority) for approval.
`
Audit Services.
Audit
services include the annual financial statement audit (including quarterly
reviews) and other procedures required to be performed by the independent
registered public accounting firm to be able to form an opinion on our financial
statements. The Audit Committee pre-approves specified annual audit
services engagement terms and fees and other specified audit
fees. All other audit services must be specifically pre-approved by
the Audit Committee. The Audit Committee monitors the audit services
engagement and may approve, if necessary, any changes in terms, conditions and
fees resulting from changes in audit scope or other items.
Audit-Related Services.
Audit-related services are assurance and related services that are
reasonably related to the performance of the audit or review of our financial
statements which historically have been provided to us by the independent
registered public accounting firm and are consistent with the SEC’s rules on
auditor independence. The Audit Committee pre-approves specified
audit-related services within pre-approved fee levels. All other
audit-related services must be pre-approved by the Audit Committee.
Tax Services.
The Audit
Committee pre-approves specified tax services that the Audit Committee believes
would not impair the independence of the independent registered public
accounting firm and that are consistent with SEC rules and
guidance. All other tax services must be specifically approved by the
Audit Committee.
All Other Services.
Other
services are services provided by the independent registered public accounting
firm that do not fall within the established audit, audit-related and tax
services categories. The Audit Committee pre-approves specified other
services that do not fall within any of the specified prohibited categories of
services.
45
|
|
(a)
|
The
following financial statements and those financial statement schedules
required by Item 8 hereof are filed as part of this
Report:
|
|
1.
|
Financial
Statements:
|
Report of
Independent Registered Chartered Accountants
Consolidated
Balance Sheets as of December 31, 2009 and 2008
Consolidated
Statements of Operations for the years ended December 31, 2009, 2008 and
2007
Consolidated
Statement of Changes in Stockholders’ Equity for the years ended December 31,
2009, 2008 and 2007
Consolidated
Statements of Cash Flows for the years ended December 31, 2009, 2008 and
2007
Notes to
Consolidated Financial Statements
|
2.
|
Financial
Statement Schedule:
|
Schedule
II – Valuation and Qualifying Accounts
All other
schedules are omitted because of the absence of conditions under which they are
required or because the required information is presented in the Financial
Statements or Notes thereto.
|
|
(b)
|
The
following exhibits are filed as part of this
Report:
|
|
Exhibit Number
|
Title of Exhibit
|
|
|
3.1(i)
|
Amended
and Restated Articles of Incorporation. (1)
|
|
|
3.2(ii)
|
Bylaws
as amended (2)
|
|
|
10.1*
|
1997
Recruitment Stock Option Plan. (3)
|
|
|
10.2*
|
2001
Stock Option and Appreciation Rights Plan. (4)
|
|
|
10.2.1*
|
2003
Stock Option and Appreciation Rights Plan. (5)
|
|
|
10.3
|
Common
Stock Purchase Warrant issued October 14, 2004. (7)
|
|
|
10.4*
|
Counsel
Management Agreement. (8)
|
|
|
10.5
|
Settlement
and License Agreement dated as of February 18, 2008.
(9)
|
|
|
10.6
|
Settlement
and License Agreement dated as of February 27, 2008.
(9)
|
|
|
10.7
|
Settlement
and License Agreement dated as of May 30, 2008. (10)
|
|
|
10.8
|
Settlement
and License Agreement dated as of September 25, 2008.
(11)
|
|
|
10.9
|
Stipulation
of Dismissal with Prejudice dated as of March 12, 2009.
(12)
|
|
|
10.10
|
LLC
Membership Interest Purchase Agreement among Greystone & Co. Holdings
LLC and Counsel RB Capital LLC, dated as of May 28, 2009.
(13)
|
|
|
10.11
|
Promissory
Note between Counsel RB Capital LLC and Greystone & Co. Holdings LLC,
dated as of May 28, 2009.
(13)
|
46
|
Exhibit Number
|
Title of Exhibit
|
|
|
10.12
|
Loan
and Security Agreement between Israel Discount Bank of New York (as Agent)
and Counsel RB Capital LLC, dated as of June 2, 2009.
(13)
|
|
|
10.13
|
Sixth
Amendment to Loan Agreement between C2 Global Technologies Inc. and
Counsel Corporation dated January 26, 2004, dated as of May 5, 2009.
(13)
|
|
|
10.14
|
Promissory
Note for $2,590,989.63 dated May 5, 2009 between C2 Global Technologies
Inc. and Counsel Corporation. (13)
|
|
|
10.15
|
Promissory
Note for $90,000.00 dated June 30, 2009 between C2 Global Technologies
Inc. and Counsel Corporation. (13)
|
|
|
10.16
|
Promissory
Note for $128,712.86 dated June 30, 2009 between C2 Global Technologies
Inc. and Counsel Corporation. (13)
|
|
|
10.17
|
Promissory
Note for $200,000.00 dated September 30, 2009 between C2 Global
Technologies Inc. and Counsel Corporation. (14)
|
|
|
10.18
|
Promissory
Note for $90,000.00 dated September 30, 2009 between C2 Global
Technologies Inc. and Counsel Corporation. (14)
|
|
|
10.19
|
Promissory
Note for $87,806.64 dated September 30, 2009 between C2 Global
Technologies Inc. and Counsel Corporation. (14)
|
|
|
10.20
|
Promissory
Note for $320,000.00 dated December 31, 2009 between C2 Global
Technologies Inc. and Counsel Corporation. (filed
herewith)
|
|
|
10.21
|
Promissory
Note for $90,000.00 dated December 31, 2009 between C2 Global Technologies
Inc. and Counsel Corporation. (filed herewith)
|
|
|
10.22
|
Promissory
Note for $129,950.17 dated December 31, 2009 between C2 Global
Technologies Inc. and Counsel Corporation. (filed
herewith)
|
|
|
14
|
C2
Global Technologies Inc. Code of Conduct. (6)
|
|
|
21
|
List
of subsidiaries. (filed herewith)
|
|
|
31.1
|
Certification
of the CEO pursuant to Rule 13a-14(a) under the Securities Exchange Act of
1934, as adopted pursuant to Section 302 of the Sarbanes-Oxley Act of 2002
(filed herewith)
|
|
|
31.2
|
Certification
of the CFO pursuant to Rule 13a-14(a) under the Securities Exchange Act of
1934, as adopted pursuant to Section 302 of the Sarbanes-Oxley Act of 2002
(filed herewith)
|
|
|
32.1
|
Certification
pursuant to 18 U.S.C 1350 as adopted pursuant to Section 906 of the
Sarbanes Oxley Act of 2002 (filed herewith)
|
|
|
32.2
|
Certification
pursuant to 18 U.S. C. 1350 as adopted pursuant to Section 906 of the
Sarbanes Oxley Act of 2002 (filed
herewith)
|
* Indicates
a management contract or compensatory plan required to be filed as an
exhibit.
47
|
(1)
|
Incorporated
by reference to our Quarterly Report on Form 10-QSB for the quarter ended
June 30, 1996, file number
0-17973.
|
|
(2)
|
Incorporated
by reference to our Quarterly Report on Form 10-Q for the period ended
September 30, 1998, file number
0-17973.
|
|
(3)
|
Incorporated
by reference to our Definitive Proxy Statement for the October 7, 1997
annual stockholder meeting.
|
|
(4)
|
Incorporated
by reference to our Definitive Proxy Statement for the September 7, 2001
annual stockholder meeting.
|
|
(5)
|
Incorporated
by reference to our Definitive Proxy Statement for the November 26, 2003
annual stockholder meeting.
|
|
(6)
|
Incorporated
by reference to our Annual Report on Form 10-K for the year ended December
31, 2003.
|
|
(7)
|
Incorporated
by reference to our Current Report on Form 8-K filed on October 20,
2004.
|
|
(8)
|
Incorporated
by reference to our Current Report on Form 8-K filed on January 6,
2005.
|
|
(9)
|
Incorporated
by reference to our Quarterly Report on Form 10-Q for the period ended
March 31, 2008.
|
|
(10)
|
Incorporated
by reference to our Quarterly Report on Form 10-Q for the period ended
June 30, 2008.
|
|
(11)
|
Incorporated
by reference to our Quarterly Report on Form 10-Q for the period ended
September 30, 2008.
|
|
(12)
|
Incorporated
by reference to our Annual Report on Form 10-K for the period ended
December 31, 2008.
|
|
(13)
|
Incorporated
by reference to our Quarterly Report on Form 10-Q for the period ended
June 30, 2009.
|
|
(14)
|
Incorporated
by reference to our Quarterly Report on Form 10-Q for the period ended
September 30, 2009.
|
48
SIGNATURES
In
accordance with Section 13 or 15(d) of the Securities Exchange Act of 1934, the
Registrant has duly caused this report to be signed on our behalf by the
undersigned, hereunto duly authorized.
|
C2
GLOBAL TECHNOLOGIES INC.
|
||
|
(Registrant)
|
||
|
Dated:
March 31, 2010
|
By:
|
/s/ Allan C. Silber
|
|
Allan
C. Silber, Chairman of the Board and Chief Executive
Officer
|
||
In
accordance with Section 13 of the Securities Exchange Act of 1934, this report
has been signed by the following persons on behalf of the registrant and in the
capacities and on the dates indicated.
|
Signature
|
Title
|
Date
|
||
|
/s/ Allan C. Silber
|
Chairman
of the Board of Directors and Chief
|
March
31, 2010
|
||
|
Allan
C. Silber
|
Executive
Officer
|
|||
|
/s/Stephen A. Weintraub
|
Executive
Vice President, Chief Financial Officer and
|
March
31, 2010
|
||
|
Stephen
A. Weintraub
|
Corporate
Secretary
|
|||
|
/s/ Catherine A. Moran
|
Vice
President of Accounting and Controller
|
March
31, 2010
|
||
|
Catherine
A. Moran
|
||||
|
/s/ Hal B. Heaton
|
Director
|
March
31, 2010
|
||
|
Hal
B. Heaton
|
||||
|
/s/ Samuel L. Shimer
|
Director
|
March
31, 2010
|
||
|
Samuel
L. Shimer
|
||||
|
/s/ Henry Y. L. Toh
|
Director
|
March
31, 2010
|
||
|
Henry
Y.L. Toh
|
||||
|
/s/ David L. Turock
|
Director
|
March
31, 2010
|
||
|
David
L. Turock
|
|
|
49
(c)
Financial Statement Schedules
The
following Schedules are included in our Financial Statements:
Schedule of Valuation and Qualifying
Accounts
50
INDEX
OF FINANCIAL STATEMENTS & SUPPLEMENTAL SCHEDULE
Title
of Document
|
Page
|
||
|
Report
of Independent Registered Chartered Accountants
|
F-2
|
|
|
Consolidated
Balance Sheets as of December 31, 2009 and 2008
|
F-3
|
|
|
Consolidated
Statements of Operations for the years ended December 31, 2009, 2008 and
2007
|
F-4
|
|
|
Consolidated
Statement of Changes in Stockholders’ Equity for the years ended December
31, 2009, 2008 and 2007
|
F-5
|
|
|
Consolidated
Statements of Cash Flows for the years ended December 31, 2009, 2008 and
2007
|
F-6
|
|
|
Notes
to Consolidated Financial Statements
|
F-8
|
|
|
Schedule
of Valuation and Qualifying Accounts
|
S-1
|
F-1
Report
of Independent Registered Chartered Accountants
To the
Board of Directors and Stockholders of
C2 Global
Technologies Inc.
Toronto,
Ontario, Canada
We have
audited the accompanying consolidated balance sheets of C2 Global Technologies
Inc. and subsidiaries (the “Company”) as of December 31, 2009 and 2008, and the
related consolidated statements of operations, stockholders' equity, and cash
flows for each of the three years in the period ended December 31,
2009. Our audits also included the financial statement schedule
listed in the Index at Item 15. These financial statements and the
financial statement schedule are the responsibility of the Company's
management. Our responsibility is to express an opinion on these
financial statements and financial statement schedule based on our
audits.
We
conducted our audits in accordance with the standards of the Public Company
Accounting Oversight Board (United States). Those standards require
that we plan and perform the audit to obtain reasonable assurance about whether
the financial statements are free of material misstatement. The
Company is not required to have, nor were we engaged to perform, an audit of its
internal control over financial reporting. Our audits included
consideration of internal control over financial reporting as a basis for
designing audit procedures that are appropriate in the circumstances, but not
for the purpose of expressing an opinion on the Company’s internal control over
financial reporting. Accordingly, we express no such
opinion. An audit includes examining, on a test basis, evidence
supporting the amounts and disclosures in the financial
statements. An audit also includes assessing the accounting
principles used and significant estimates made by management, as well as
evaluating the overall financial statement presentation. We believe
that our audits provide a reasonable basis for our opinion.
In our
opinion, such consolidated financial statements present fairly, in all material
respects, the financial position of C2 Global Technologies Inc. and subsidiaries
as of
December
31, 2009 and 2008, and the results of their operations and their cash flows for
each of the three years in the period ended December 31, 2009, in conformity
with accounting principles generally accepted in the United States of
America. Also, in our opinion, such financial statement schedule,
when considered in relation to the basic consolidated financial statements taken
as a whole, presents fairly, in all material respects, the information set forth
therein.
/s/ Deloitte & Touche
LLP
Deloitte
& Touche LLP
Independent
Registered Chartered Accountants
Licensed
Public Accountants
Toronto,
Canada
March 31,
2010
F-2
C2
GLOBAL TECHNOLOGIES INC. AND SUBSIDIARIES
CONSOLIDATED
BALANCE SHEETS
as
of December 31, 2009 and 2008
(In
thousands of $US, except share and per share amounts)
|
2009
|
2008
|
|||||||
|
ASSETS
|
||||||||
|
Current
assets:
|
||||||||
|
Cash
|
$ | 93 | $ | 4,076 | ||||
|
Accounts
receivable (net of $0 allowance for doubtful accounts)
|
1,000 | — | ||||||
|
Note
receivable (Note 6)
|
653 | — | ||||||
|
Deposits
|
300 | — | ||||||
|
Inventory
– equipment (Note 2)
|
442 | — | ||||||
|
Other
current assets
|
110 | 77 | ||||||
|
Deferred
income tax assets (Note 10)
|
729 | 875 | ||||||
|
Total
current assets
|
3,327 | 5,028 | ||||||
|
Other
assets:
|
||||||||
|
Inventory
– real estate (Note 2)
|
1,396 | — | ||||||
|
Asset
liquidation investments (Note 2)
|
3,943 | — | ||||||
|
Investments
(Note 5)
|
2,788 | 242 | ||||||
|
Goodwill
(Note 6)
|
173 | 173 | ||||||
|
Total
assets
|
$ | 11,627 | $ | 5,443 | ||||
|
LIABILITIES
AND STOCKHOLDERS’ EQUITY
|
||||||||
|
Current
liabilities:
|
||||||||
|
Accounts
payable and accrued liabilities (Note 6)
|
$ | 1,457 | $ | 472 | ||||
|
Income
taxes payable (Note 10)
|
26 | — | ||||||
|
Debt
payable to third parties (Note 7)
|
4,626 | — | ||||||
|
Debt
payable to a related party (Note 7)
|
1,564 | — | ||||||
|
Total
liabilities
|
7,673 | 472 | ||||||
|
Commitments
and contingencies (Notes 7 and 8)
|
||||||||
|
Stockholders’
equity:
|
||||||||
|
Preferred
stock, $10.00 par value, authorized 10,000,000 shares; issued and
outstanding 592 Class N shares at December 31, 2009 and 594 Class N shares
at December 31, 2008, liquidation preference of $592 at December 31, 2009
and $594 at December 31, 2008
|
6 | 6 | ||||||
|
Common
stock, $0.01 par value, authorized 300,000,000 shares; issued and
outstanding 22,718,074 shares at December 31, 2009 and 22,745,530 shares
at December 31, 2008
|
227 | 227 | ||||||
|
Additional
paid-in capital
|
274,706 | 274,761 | ||||||
|
Accumulated
deficit
|
(271,287 | ) | (270,023 | ) | ||||
|
Stockholders’
equity before non-controlling interest
|
3,652 | 4,971 | ||||||
|
Non-controlling
interest in subsidiary
|
302 | — | ||||||
|
Total
stockholders’ equity
|
3,954 | 4,971 | ||||||
|
Total
liabilities and stockholders’ equity
|
$ | 11,627 | $ | 5,443 | ||||
The
accompanying notes are an integral part of these consolidated financial
statements.
F-3
C2
GLOBAL TECHNOLOGIES INC. AND SUBSIDIARIES
CONSOLIDATED
STATEMENTS OF OPERATIONS
for
the years ended December 31, 2009, 2008 and 2007
(In
thousands of $US, except per share amounts)
|
2009
|
2008
|
2007
|
||||||||||
|
Revenue:
|
||||||||||||
|
Patent
licensing
|
$ | — | $ | 17,625 | $ | — | ||||||
|
Asset
liquidation (Note 2)
|
5,991 | — | — | |||||||||
|
Total
revenue
|
5,991 | 17,625 | — | |||||||||
|
Operating
costs and expenses:
|
||||||||||||
|
Patent
licensing
|
29 | 10,729 | — | |||||||||
|
Asset
liquidation (Note 2)
|
4,138 | — | — | |||||||||
|
Selling,
general and administrative
|
2,657 | 1,273 | 1,216 | |||||||||
|
Depreciation
and amortization
|
— | 20 | 20 | |||||||||
|
Total
operating costs and expenses
|
6,824 | 12,022 | 1,236 | |||||||||
| (833 | ) | 5,603 | (1,236 | ) | ||||||||
|
Earnings
of equity accounted asset liquidation investments (Note 2)
|
64 | — | — | |||||||||
|
Operating
income (loss)
|
(769 | ) | 5,603 | (1,236 | ) | |||||||
|
Other
income (expenses):
|
||||||||||||
|
Other
income (expense)
|
(88 | ) | 442 | (213 | ) | |||||||
|
Interest
expense – third party (Note 7)
|
(217 | ) | — | (12 | ) | |||||||
|
Interest
expense – related party (Note 7)
|
(108 | ) | (43 | ) | (184 | ) | ||||||
|
Total
other income (expenses)
|
(413 | ) | 399 | (409 | ) | |||||||
|
Income
(loss) from continuing operations before the undernoted
|
(1,182 | ) | 6,002 | (1,645 | ) | |||||||
|
Income
tax expense (recovery) (Note 10)
|
269 | 125 | (1,000 | ) | ||||||||
|
Earnings
(loss) of equity accounted investments (net of $0 tax) (Note
5)
|
252 | (38 | ) | 6 | ||||||||
|
Income
(loss) from continuing operations
|
(1,199 | ) | 5,839 | (639 | ) | |||||||
|
Loss
from discontinued operations
|
— | (12 | ) | (6 | ) | |||||||
|
Net
income (loss) and comprehensive income (loss)
|
(1,199 | ) | 5,827 | (645 | ) | |||||||
|
Net
(income) loss and comprehensive (income) loss attributable to
non-controlling interest
|
(65 | ) | — | — | ||||||||
|
Net
income (loss) and comprehensive income (loss) attributable to controlling
interest
|
$ | (1,264 | ) | $ | 5,827 | $ | (645 | ) | ||||
|
Weighted
average common shares outstanding
|
22,723 | 22,907 | 23,095 | |||||||||
|
Weighted
average preferred shares outstanding
|
1 | 1 | 1 | |||||||||
|
Earnings
(loss) per share – basic and diluted: (Note 4)
|
||||||||||||
|
Earnings
(loss) from continuing operations
|
||||||||||||
|
Common
shares
|
$ | (0.05 | ) | $ | 0.25 | $ | (0.03 | ) | ||||
|
Preferred
shares
|
N/A | $ | 10.19 | N/A | ||||||||
|
Earnings
(loss) from discontinued operations
|
||||||||||||
|
Common
shares
|
$ | — | $ | — | $ | — | ||||||
|
Preferred
shares
|
— | N/A | N/A | |||||||||
|
Net
earnings (loss)
|
||||||||||||
|
Common
shares
|
$ | (0.06 | ) | $ | 0.25 | $ | (0.03 | ) | ||||
|
Preferred
shares
|
N/A | $ | 10.19 | N/A | ||||||||
The
accompanying notes are an integral part of these consolidated financial
statements
F-4
C2
GLOBAL TECHNOLOGIES INC. AND SUBSIDIARIES
CONSOLIDATED
STATEMENT OF CHANGES IN STOCKHOLDERS’ EQUITY
for
the years ended December 31, 2009, 2008 and 2007
(In
thousands of $US, except share amounts)
|
Preferred stock
|
Common stock
|
Additional
paid-in
|
Accumulated
Equity
|
Non-
controlling
|
||||||||||||||||||||||||||||
|
Shares
|
Amount
|
Shares
|
Amount
|
capital
|
(Deficit)
|
interest
|
Total
|
|||||||||||||||||||||||||
|
Balance
at December 31, 2006
|
611 | $ | 6 | 23,084,850 | $ | 231 | $ | 274,499 | $ | (275,205 | ) | $ | — | $ | (469 | ) | ||||||||||||||||
|
Conversion
of Class N preferred stock to common stock
|
(4 | ) | — | 160 | — | — | — | — | — | |||||||||||||||||||||||
|
Conversion
of third party debt to common stock
|
— | — | 10,000 | — | 7 | — | — | 7 | ||||||||||||||||||||||||
|
Compensation
cost related to stock options
|
— | — | — | — | 166 | — | — | 166 | ||||||||||||||||||||||||
|
Net
loss
|
— | — | — | — | — | (645 | ) | — | (645 | ) | ||||||||||||||||||||||
|
Balance
at December 31, 2007
|
607 | 6 | 23,095,010 | 231 | 274,672 | (275,850 | ) | — | (941 | ) | ||||||||||||||||||||||
|
Conversion
of Class N preferred stock to common stock
|
(13 | ) | — | 520 | — | — | — | — | — | |||||||||||||||||||||||
|
Cancellation
of common stock
|
— | — | (350,000 | ) | (4 | ) | 4 | — | — | — | ||||||||||||||||||||||
|
Compensation
cost related to stock options
|
— | — | — | — | 85 | — | — | 85 | ||||||||||||||||||||||||
|
Net
income
|
— | — | — | — | — | 5,827 | — | 5,827 | ||||||||||||||||||||||||
|
Balance
at December 31, 2008
|
594 | 6 | 22,745,530 | 227 | 274,761 | (270,023 | ) | — | 4,971 | |||||||||||||||||||||||
|
Capital
contribution
|
— | — | — | — | — | — | 237 | 237 | ||||||||||||||||||||||||
|
Purchase
and cancellation of preferred and common stock (Note 12)
|
(2 | ) | — | (27,456 | ) | — | (126 | ) | — | — | (126 | ) | ||||||||||||||||||||
|
Compensation
cost related to stock options
|
— | — | — | — | 71 | — | — | 71 | ||||||||||||||||||||||||
|
Net
income (loss)
|
— | — | — | — | — | (1,264 | ) | 65 | (1,199 | ) | ||||||||||||||||||||||
|
Balance
at December 31, 2009
|
592 | $ | 6 | 22,718,074 | $ | 227 | $ | 274,706 | $ | (271,287 | ) | $ | 302 | $ | 3,954 | |||||||||||||||||
The
accompanying notes are an integral part of these consolidated financial
statements.
F-5
C2
GLOBAL TECHNOLOGIES INC. AND SUBSIDIARIES
CONSOLIDATED
STATEMENTS OF CASH FLOWS
for
the years ended December 31, 2009, 2008 and 2007
(In
thousands of $US)
|
2009
|
2008
|
2007
|
||||||||||
|
Cash
flows from operating activities:
|
||||||||||||
|
Net
income (loss) from continuing operations
|
$ | (1,199 | ) | $ | 5,839 | $ | (639 | ) | ||||
|
Adjustments
to reconcile net income (loss) to net cash provided by (used in) operating
activities:
|
||||||||||||
|
Accrued
interest added to principal of third party debt
|
61 | — | — | |||||||||
|
Amortization
of financing costs on debt payable to third party
|
112 | — | — | |||||||||
|
Accrued
interest added to principal of related party debt
|
108 | — | 184 | |||||||||
|
Stock-based
compensation expense
|
71 | 85 | 166 | |||||||||
|
Write-down
of equity accounted asset liquidation investments
|
212 | — | — | |||||||||
|
Earnings
(loss) of equity accounted investments
|
(252 | ) | 38 | (6 | ) | |||||||
|
Write-down
of inventory
|
113 | — | — | |||||||||
|
Gain
on sale of investments
|
(21 | ) | (425 | ) | (75 | ) | ||||||
|
Depreciation
and amortization
|
— | 20 | 20 | |||||||||
|
Amortization
of discount and debt issuance costs on convertible note
payable
|
— | — | 8 | |||||||||
|
Non-cash
cost of prepayment of third party debt
|
— | — | 224 | |||||||||
|
Changes
in operating assets and liabilities:
|
||||||||||||
|
Increase
in accounts receivable
|
(1,000 | ) | — | — | ||||||||
|
Increase
in note receivable
|
(653 | ) | — | — | ||||||||
|
Increase
in deposits
|
(300 | ) | — | — | ||||||||
|
Purchase
of inventory
|
(1,951 | ) | — | — | ||||||||
|
Investment
in asset liquidation investments
|
(4,155 | ) | — | — | ||||||||
|
Decrease
(increase) in other assets
|
(145 | ) | (60 | ) | (9 | ) | ||||||
|
Decrease
(increase) in deferred income tax assets
|
146 | 125 | (1,000 | ) | ||||||||
|
Increase
(decrease) in accounts payable and accrued liabilities
|
985 | 70 | (148 | ) | ||||||||
|
Increase
in income taxes payable
|
26 | — | — | |||||||||
|
Net
cash provided by (used in) operating activities by continuing
operations
|
(7,842 | ) | 5,692 | (1,275 | ) | |||||||
|
Net
cash used in operating activities by discontinued
operations
|
— | (12 | ) | (6 | ) | |||||||
|
Net
cash provided by (used in) operating activities by continuing and
discontinued operations
|
(7,842 | ) | 5,680 | (1,281 | ) | |||||||
|
Cash
flows from investing activities:
|
||||||||||||
|
Investment
in significantly influenced company
|
(2,631 | ) | — | — | ||||||||
|
Cash
distributions from significantly influenced companies
|
237 | 8 | 7 | |||||||||
|
Purchase
of investments
|
— | (125 | ) | (595 | ) | |||||||
|
Proceeds
from sale of investments
|
121 | 781 | 150 | |||||||||
|
Redemption
of investments
|
— | — | 1,100 | |||||||||
|
Net
cash provided by (used in) investing activities
|
(2,273 | ) | 664 | 662 | ||||||||
|
Cash
flows from financing activities:
|
||||||||||||
|
Proceeds
from issuance of debt payable to third parties
|
6,765 | — | — | |||||||||
|
Proceeds
from issuance of note payable to a related party
|
3,632 | — | 3,245 | |||||||||
|
Purchase
and cancellation of common and preferred shares
|
(126 | ) | — | — | ||||||||
|
Repayment
of debt payable to a third party
|
(2,200 | ) | — | — | ||||||||
|
Repayment
of notes payable to a related party
|
(2,176 | ) | (2,335 | ) | (1,100 | ) | ||||||
|
Non-controlling
interest contribution
|
237 | — | — | |||||||||
|
Repayment
of convertible note payable
|
— | — | (1,462 | ) | ||||||||
|
Net
cash provided by (used in) financing activities
|
6,132 | (2,335 | ) | 683 | ||||||||
|
Increase
(decrease) in cash
|
(3,983 | ) | 4,009 | 64 | ||||||||
|
Cash
at beginning of year
|
4,076 | 67 | 3 | |||||||||
|
Cash
at end of year
|
$ | 93 | $ | 4,076 | $ | 67 | ||||||
The
accompanying notes are an integral part of these consolidated financial
statements.
F-6
C2
GLOBAL TECHNOLOGIES INC. AND SUBSIDIARIES
CONSOLIDATED
STATEMENTS OF CASH FLOWS (continued)
for
the years ended December 31, 2009, 2008 and 2007
(In
thousands of $US)
|
2009
|
2008
|
2007
|
||||||||||
|
Supplemental
schedule of non-cash investing and financing activities:
|
||||||||||||
|
Conversion
of debt payable to a third party to common stock
|
$ | — | $ | — | $ | 7 | ||||||
|
Supplemental
cash flow information:
|
||||||||||||
|
Taxes
paid
|
96 | — | — | |||||||||
|
Interest
paid
|
42 | 43 | 21 | |||||||||
The
accompanying notes are an integral part of these consolidated financial
statements.
F-7
C2
GLOBAL TECHNOLOGIES INC. AND SUBSIDIARIES
NOTES
TO CONSOLIDATED FINANCIAL STATEMENTS
(in
thousands of $US, except share and per share amounts and where specifically
indicated)
The
consolidated financial statements include the accounts of C2 Global Technologies
Inc. together with its subsidiaries, including C2 Communications Technologies
Inc., C2 Investments Inc. and Counsel RB Capital LLC. These entities,
on a combined basis, are referred to as “C2”, the “Company”, “we” or “our” in
these financial statements. Our consolidated financial statements
were prepared in conformity with accounting principles generally accepted in the
United States of America (“GAAP”), as outlined in the FASB Accounting Standards
Codification (“ASC”) and include the assets, liabilities, revenues, and expenses
of all majority-owned subsidiaries over which C2 exercises
control. All significant intercompany accounts and transactions have
been eliminated upon consolidation.
C2 owns
certain patents, including two foundational patents in voice over internet
protocol (“VoIP”) technology – U.S. Patent Nos. 6,243,373 (the “VoIP Patent”)
and 6,438,124 (the “C2 Patent”) (together the “VoIP Patent Portfolio”), which it
licenses. The VoIP Patent, including a corresponding foreign patent
and related international patent applications, was acquired from a third party
in 2003. At the time of acquisition, the vendor of the VoIP Patent
was granted a first priority security interest in the patent in order to secure
C2’s obligations under the associated purchase agreement, as discussed in Note
9. The C2 Patent was developed by the Company.
Licensing
of intellectual property constitutes the Company’s Patent Licensing operating
segment. C2’s target market consists of carriers, equipment
manufacturers, service providers and end users in the internet protocol
telephone market who are using C2’s patented VoIP technologies by deploying VoIP
networks for phone-to-phone communications. The Company engages in
licensing agreements with third parties domestically and
internationally. The Company obtains licensing and royalty revenue
from the target market for its patents, with the assistance of outside counsel,
in order to realize value from its intellectual property.
In 2007,
the Company began investing in Internet-based e-commerce businesses through its
acquisitions of minority positions in MyTrade.com, Inc. (sold in 2007), Buddy
Media, Inc. (“Buddy Media”), LIMOS.com LLC (sold in 2008), and Knight’s Bridge
Capital Partners Internet Fund No. 1 GP LLC (“Knight’s Bridge GP”). A
portion of the Buddy Media investment was sold in the second quarter of 2009 for
a net gain of $21. In May 2009, the Company invested $2,621 to
indirectly acquire an approximate 5% interest in Polaroid Corporation, pursuant
to a Chapter 11 reorganization in a U.S. bankruptcy court. C2’s
interest is managed by Knight’s Bridge Capital Management L.P., an affiliate of
C2’s parent, Counsel Corporation (together with its subsidiaries,
“Counsel”). The Company’s investments are discussed in more detail in
Note 5.
In
February 2009 the Company established Counsel RB Capital LLC (“Counsel RB”),
which commenced operations in the second quarter of 2009. Counsel RB
is owned 75% by the Company and 25% by its Co-CEO’s. It specializes
in the acquisition and disposition of distressed and surplus assets throughout
the United States and Canada. Counsel RB’s operations are discussed
in more detail in Note 2. The operations of Counsel RB constitute the
Company’s Asset Liquidation operating segment. The Company’s segments
are discussed in more detail in Note 15.
Counsel
RB, which began operating in the second quarter of 2009, specializes in the
acquisition and disposition of distressed and surplus assets throughout the
United States and Canada, including industrial machinery and equipment, real
estate, inventories, accounts receivable and distressed debt. Counsel
RB’s primary business is the purchase of various types of assets with the intent
of subsequently reselling them at a profit. In addition, it also
arranges traditional asset disposition services such as on-site and webcast
auctions, liquidations and negotiated sales, for which it earns commission
revenue.
Counsel
RB’s asset liquidation transactions are generally conducted through two
different formats. GAAP requires that they be reported separately in
the consolidated financial statements.
Revenue
from transactions that Counsel RB conducts directly is reported as Asset
Liquidation revenue, and the associated direct costs are reported as Asset
Liquidation costs. At the balance sheet date, any unsold assets are
reported as Inventory, any outstanding accounts receivable are included in the
Company’s Accounts Receivable, and any associated liabilities are included in
the Company’s Accrued Liabilities. Although all inventory is expected
to be sold in less than one year, real estate inventory is not recorded as a
current asset.
F-8
Transactions
that involve Counsel RB acting jointly with one or more additional purchasers,
pursuant to a partnership, joint venture or limited liability company (“LLC”)
agreement (collectively, “Joint Ventures”), require that Counsel RB’s
proportionate share of the net income (loss) be reported as Earnings (Loss) of
Equity Accounted Asset Liquidation Investments. Although all of
Counsel RB’s investments in Joint Ventures are expected to be sold in less than
one year, they are reported on the balance sheet as non-current Asset
Liquidation Investments.
In June
2009, in order to acquire certain assets for the Company’s asset liquidation
business, Counsel RB acquired an arm’s length non-operating asset holding
company for approximately $5,900. The asset acquisition was
accomplished by entering into an LLC Membership Interest Purchase Agreement
dated as of May 28, 2009 (the “Agreement”). A portion of the assets
were acquired directly by Counsel RB and included real estate, equipment and
accounts receivable totaling $4,960. The remainder of the asset
acquisition was accomplished through a $940 investment in a Joint
Venture. Counsel RB began monetizing the assets during the second
quarter of 2009. The purchase price for the acquired assets was
payable as follows: (a) cash payments of approximately $2,900 were paid to or
credited by the vendor on the closing date; and (b) the balance of approximately
$3,000 was comprised of (i) a note payable to the vendor in the principal amount
of approximately $1,400, (ii) a credit facility in the amount of approximately
$1,400 and (iii) the Joint Venture’s assumption of debt, of which Counsel RB’s
portion was $200. The note and credit facility are discussed in more
detail in Note 7.
Use
of estimates
The
preparation of the Company’s financial statements in conformity with GAAP
requires management to make estimates and assumptions that affect the reported
amounts of assets and liabilities and the disclosure of contingent assets and
liabilities at the date of the financial statements, as well as the reported
amounts of revenues and expenses during the reporting
period. Management bases its estimates and judgments on historical
experience and various other factors that are believed to be reasonable under
the circumstances. Actual results could differ from those
estimates.
Significant
estimates include revenue recognition, purchase accounting (including the
ultimate recoverability of intangibles and other long-lived assets), accounts
receivable valuation, inventory valuation, valuation of investments, valuation
of goodwill and intangibles, valuation of deferred income tax assets,
liabilities, contingencies surrounding litigation, and stock-based
compensation. These estimates have the potential to significantly
impact our consolidated financial statements, either because of the significance
of the financial statement item to which they relate, or because they require
judgment and estimation due to the uncertainty involved in measuring, at a
specific point in time, events that are continuous in nature.
Cash
and cash equivalents
The
Company considers all highly liquid investments with an original maturity of
three months or less to be cash equivalents. The Company maintains
its cash and cash equivalents primarily with financial institutions in Toronto,
Canada. Counsel RB holds a minimum operating balance with a financial
institution in New York City. These accounts may from time to time
exceed federally insured limits. The Company has not experienced any
losses on such accounts. At December 31, 2009 and 2008, the Company
did not hold any cash equivalents.
Accounts
receivable
The
Company’s accounts receivable are primarily composed of accounts receivable
acquired by Counsel RB as a component of an asset acquisition or pursuant to an
asset disposition. They are recorded at their fair value at the
acquisition or disposition date. At each financial statement date the
fair value of the outstanding accounts receivable is evaluated, and an allowance
is recorded if the book value exceeds the fair value.
Inventory
The
Company’s inventory consists of assets acquired for resale by Counsel
RB. They are recorded at the lower of cost and net realizable
value. Inventory is normally expected to be sold within a one-year
operating cycle. At December 31, 2009 the Company recorded a write
down of $24 on a portion of its equipment inventory, and a write down of $89 on
a portion of its real estate inventory.
Goodwill
Goodwill,
which results from the difference between the purchase price and the fair value
of the net assets acquired, is not amortized but is tested for impairment at
least annually in accordance with GAAP. This testing is a two-step
process, in which the carrying amount of the reporting unit associated with the
goodwill is first compared to the reporting unit’s estimated fair
value. If the carrying amount of the reporting unit exceeds its
estimated fair value, the fair values of the reporting unit’s assets and
liabilities are analyzed to determine whether the goodwill of the reporting unit
has been impaired. An impairment loss is recognized to the extent
that the Company’s recorded goodwill exceeds its implied fair value as
determined by this two-step process. Goodwill, in addition to being
tested for impairment annually, is tested for impairment between annual tests if
an event occurs or circumstances change such that it is more likely than not
that the carrying amount of goodwill may be impaired.
F-9
At
December 31, 2009 the Company’s sole intangible asset requiring assessment is
the goodwill that relates to the Company’s Patent Licensing
segment. For the years ended December 31, 2009 and 2008, the Company
used a discounted cash flow analysis to value its patents and assess the value
of the associated goodwill.
No
goodwill impairment was present upon the performance of the impairment tests at
December 31, 2009 and 2008. See Note 6 for more detail regarding the
Company’s goodwill.
Asset
Liquidation Investments
Asset
liquidation transactions that involve the Company acting jointly with one or
more additional purchasers, pursuant to a Joint Venture agreement, require that
they be accounted for using the equity method of accounting wherein the
Company’s proportionate share of the Joint Venture’s net income (loss) be
reported in the consolidated statement of operations as Earnings (Loss) of
Equity Accounted Asset Liquidation Investments. At the balance sheet
date, the Company’s investments in Joint Ventures are reported in the
consolidated balance sheet as Asset Liquidation Investments. The
Company monitors the value of the Joint Venture’s underlying assets and
liabilities, and will record a writedown of its investments should the Company
conclude that there has been a decline in the value of the net
assets.
Investments
Equity
securities that do not have a readily determinable fair value, and equity
securities having underlying common stock that also does not have a readily
determinable fair value, are accounted for under the cost method when the
Company’s ownership interests do not allow it to exercise significant influence
over the entities in which it has invested. When the Company’s
ownership interests do allow it to exercise significant influence, the
investments are accounted for under the equity method.
The
Company monitors all of its investments for impairment by considering factors
such as the economic environment and market conditions, as well as the
operational performance of, and other specific factors relating to, the
businesses underlying the investments. The fair values of the
securities are estimated quarterly using the best available information as of
the evaluation date, including data such as the quoted market prices of
comparable public companies, market price of the common stock underlying
preferred stock, recent financing rounds of the investee, and other
investee-specific information. The Company will record an other than
temporary impairment in the carrying value of an investment should the Company
conclude that such a decline in value has occurred.
Impairments,
equity pick-ups, dividends and realized gains and losses on equity securities
are reported separately in the consolidated statements of
operations. See Note 5 for further discussion of the Company’s
investments.
Fair
Value of Financial Instruments
The fair
value of financial instruments is the amount at which the instruments could be
exchanged in a current transaction between willing parties, other than in a
forced sale or liquidation. At December 31, 2009 and 2008, the
carrying values of the Company’s cash, accounts receivable, note receivable,
deposits, accounts payable and accrued liabilities, third party debt and related
party debt approximate fair value. There are three levels within the
fair value hierarchy: Level 1 – quoted prices in active markets for
identical assets or liabilities; Level 2 – significant other observable inputs;
and Level 3 – significant unobservable inputs. The fair value
hierarchy does not apply to the financial instruments noted above, with the
exception of cash. The Company considers the fair value of cash to be
Level 1 within the hierarchy.
Although
the Company does not employ fair value accounting for any of its assets or
liabilities, in assessing the fair values of its financial instruments, the
Company applies the valuation principles required by GAAP.
Contingencies
The
Company is involved from time to time in various legal matters arising out of
its operations in the normal course of business. On a case by case
basis, the Company evaluates the likelihood of possible outcomes for this
litigation. Based on this evaluation, the Company determines whether
a liability accrual is appropriate. If the likelihood of a negative
outcome is probable, and the amount is estimable, the Company accounts for the
liability in the current period.
Patent
licensing revenue
To date,
patent licensing revenue has been in the form of one-time payments for past and
future use of the Company’s patented technology. These payments were
not contingent upon the occurrence or non-occurrence of any events, and the
parties had no further obligations or performance commitments, nor any
unilateral ability to rescind the agreement. The full payment amounts
were recognized as revenue in the period in which the agreements were
completed. In general, patent licensing revenue is recognized when
persuasive evidence of an arrangement exists, delivery has occurred or services
have been rendered, the Company’s price to the customer is fixed or
determinable, and collection of the resulting receivable is reasonably
assured. Revenues where collectability is not assured are recognized
when the total cash collections to be retained by the Company are
finalized.
F-10
Asset
liquidation revenue
Asset
liquidation revenue consists of Counsel RB’s proceeds from asset inventory
resale. Asset proceeds are derived from auctions and negotiated
sales. Revenue is recognized when persuasive evidence of an
arrangement exists, the amount of the proceeds is fixed, delivery terms are
arranged and collectability is reasonably assured.
Stock-based
compensation
The
Company calculates stock-based compensation using the fair value method, under
which the fair value of the options at the grant date is calculated using the
Black-Scholes Option Pricing Model, and subsequently expensed over the
appropriate term. The provisions of the Company’s stock-based
compensation plans do not require the Company to settle any options by
transferring cash or other assets, and therefore the Company classifies the
awards as equity. See Note 14 for further discussion of the Company’s
stock-based compensation.
Income taxes
The
Company recognizes deferred tax assets and liabilities for temporary differences
between the tax bases of assets and liabilities and the amounts at which they
are carried in the financial statements, based upon the enacted tax rates in
effect for the year in which the differences are expected to reverse. The
Company establishes a valuation allowance when necessary to reduce deferred tax
assets to the amount expected to be realized.
The
Company periodically assesses the value of its deferred tax assets, which have
been generated by a history of net operating and net capital losses, and
determines the necessity for a valuation allowance. The Company
evaluates which portion of the deferred tax assets, if any, will more likely
than not be realized by offsetting future taxable income, taking into
consideration any limitations that may exist on its use of its net operating and
net capital loss carryforwards. See Note 10 for further discussion of
the Company’s income taxes.
Segment
reporting
Since the
second quarter of 2009, the Company has operated in two business segments,
Patent Licensing and Asset Liquidation. The patent licensing segment
includes all operations relating to licensing of the Company’s intellectual
property. The asset liquidation segment includes the operations of
Counsel RB.
Discontinued
Operations
The
operations and related losses on operations sold, or identified as held for
sale, have been presented as discontinued operations in the Consolidated
Statements of Operations for all years presented. Gains are
recognized when realized.
Recent
accounting pronouncements
In June
2009, the FASB issued Accounting Standards Update 2009-01,
The
FASB Accounting
Standards Codification
TM
and the Hierarchy of Generally
Accepted Accounting Principles — a replacement of FASB Statement No. 162
(“ASU 2009-01”). ASU 2009-01 is intended to be the source of
authoritative U.S. GAAP for nongovernmental entities, and all of the content is
considered authoritative. As a result, the GAAP hierarchy now
includes only two levels of GAAP, authoritative and
nonauthoritative. ASU 2009-01 is effective for financial statements
issued for interim or annual periods ending after September 15,
2009. ASU 2009-01 does not change existing GAAP, and therefore there
was no change to the Company’s financial statements upon its adoption by the
Company in the third quarter of 2009.
In
December 2007, the FASB issued the Business Combinations Topic (“Business
Combinations”) of the ASC. Business Combinations replaces previously
issued guidance with respect to business combinations. It applies to
all transactions and events in which an entity obtains control over one or more
other businesses. Business Combinations substantially increases the
use of fair value and makes significant changes to the way companies account for
business combinations and non-controlling interests. Some of the more
significant requirements are that it requires more assets acquired and
liabilities assumed to be measured at fair value as of the acquisition date,
liabilities related to contingent consideration to be remeasured at fair value
in each subsequent reporting period, acquisition-related costs to be expensed,
and non-controlling interests in subsidiaries to be initially measured at fair
value and classified as a separate component of equity. Business
Combinations is effective for fiscal years beginning after December 15,
2008, with early adoption prohibited, and is to be applied prospectively, with
one exception relating to income taxes. The Company was required to
adopt Business Combinations effective January 1, 2009.
F-11
As the
Company did not acquire any businesses during 2009, the adoption of Business
Combinations has had no impact on the Company’s consolidated
statements. However, the Company founded Counsel RB and made
preliminary investments in it during the first quarter of 2009, and additional
investments during the remainder of the year. Because the Company
holds 75% of Counsel RB, the Company has consolidated Counsel RB in these
consolidated financial statements. As a result, the Company’s
financial statements include amounts related to the 25% non-controlling
interest.
In April
2009, the FASB amended the Fair Value of Financial Instruments Subsection of the
ASC to require publicly traded companies to make disclosures about fair value of
financial instruments for interim reporting periods as well as in annual
financial statements. The amendment also requires those disclosures
in summarized financial information at interim reporting periods. The
amendment is effective for financial statements issued after June 15, 2009, with
early application permitted. The Company adopted the amendment in the
quarter ending June 30, 2009, and has included the required disclosures in these
consolidated financial statements.
In April
2009, the FASB amended the guidance in the Investments – Debt and Equity
Securities Topic of the ASC regarding the recognition and presentation of other
than temporary impairments. Entities are now required to reflect
impairments that relate to credit losses in earnings, and impairments that
relate to other factors in other comprehensive income. The guidance is
effective for financial statements issued after June 15, 2009. As the
Company does not currently hold any debt securities, and its sole portfolio
investment is not considered to be other than temporarily impaired, the
Company’s adoption of the amendment in the quarter ended June 30, 2009 did
not have an impact on its financial statements.
In April
2009, the FASB issued guidance in the Fair Value Measurements and Disclosures
Topic of the ASC regarding the determination of when a market is not active and
whether a transaction is not orderly. The guidance also requires
disclosures in interim and annual periods of the inputs and valuation techniques
used to measure fair value and a discussion of changes in valuation techniques
and related inputs, if any, during the period. The new guidance is
effective for financial statements issued after June 15, 2009, with early
application permitted. As the Company’s investments are in private
companies for which no active market exists, or has existed in the past, its
adoption of the new guidance had no impact on its financial statements when it
was adopted in the quarter ended June 30, 2009.
In May
2009, the FASB issued the Subsequent Events Topic of the ASC (“Subsequent
Events”), which was subsequently amended in February 2010 when the FASB issued
ASU 2010-09
Subsequent Events
(Topic 855): Amendments to Certain Recognition and Disclosure
Requirements
(“ASU 2010-09”). Subsequent Events and ASU
2010-09 apply to all entities, and provide guidance on management’s assessment
of events that occur after the balance sheet date but before the issuance of the
financial statements. They distinguish between subsequent events that
should and should not be recognized in the financial statements, and require
disclosure of certain nonrecognized subsequent events. ASU 2010-09
specifically amended the disclosure requirements of Subsequent Events to state
that SEC filers (as defined in Subsequent Events) are exempted from disclosing
the date through which subsequent events have been evaluated. ASU
2010-09 also adds a definition of “revised financial statements”; upon revising
its financial statements, an entity is required to update its evaluation of
subsequent events through the date the revised financial statements are issued
or are available to be issued. Management is required to assess
subsequent events for both interim and annual reporting
periods. Subsequent Events and ASU 2010-09 are not expected to
significantly change practice because their guidance is similar to that in
previously-existing U.S. auditing literature for assessing and disclosing
subsequent events. Rather, they represent guidance directed
specifically to management. Subsequent Events is effective
prospectively for interim or annual financial statements issued after June 15,
2009, and was therefore adopted by the Company in the quarter ended June 30,
2009. ASU 2010-09 is effective upon issuance, and therefore was
adopted by the Company in its reporting for the year ended December 31,
2009.
In August
2009, the FASB issued Accounting Standards Update 2009-05,
Fair Value Measurements and
Disclosures (Topic 820)
(“ASU 2009-05”). ASU 2009-05 clarifies
that in circumstances in which a quoted price in an active market for the
identical liability is not available, a reporting entity is required to measure
fair value using either a valuation technique that uses the quoted price of the
identical liability when traded as an asset, or quoted prices for similar
liabilities or similar liabilities when traded as assets. Should this
information be unavailable, the entity is required to use another valuation
technique that is consistent with the principles of Topic 820. ASU
2009-05 is effective in the first interim or annual period after issuance, with
early adoption permitted. The Company’s adoption of ASU 2009-05 in
the third quarter of 2009 did not have a material impact on its financial
statements.
Future
accounting pronouncements
In June
2009, the FASB issued new guidance on “Accounting for Transfers of Financial
Assets”. It addresses concerns raised by the SEC, members of
Congress, and financial statement users about the accounting and disclosures
required by existing guidance in the wake of the subprime mortgage crisis and
the global credit market deterioration, and is intended to improve the
accounting and disclosure for transfers of financial assets. The new
guidance is effective for financial asset transfers occurring after the
beginning of an entity’s first fiscal year that begins after November 15, 2009,
with early adoption prohibited. The Company will therefore adopt it
on January 1, 2010. The Company does not anticipate that the new
guidance will have a material impact on its financial statements upon
adoption.
F-12
In June
2009, the FASB updated “Consolidation – Consolidation of Variable Interest
Entities” (“Consolidation”). The update amends the consolidation
guidance that applies to variable interest entities (“VIEs”), and will
significantly affect an entity’s overall consolidation analysis. The
amendments to the consolidation guidance affect all entities currently within
the scope of Consolidation as well as qualifying special-purpose entities that
are outside of its scope. An enterprise will need to reconsider its
previous conclusions regarding the entities that it consolidates, as the update
involves a shift to a qualitative approach that identifies which entities have
the power to direct the activities that most significantly impact the VIE’s
economic performance and the obligation to absorb its losses or the right to
receive benefits from it, as compared to the existing quantitative-based risks
and rewards calculation. The update also requires ongoing assessment
of whether an entity is the primary beneficiary of a VIE, modifies the
presentation of consolidated VIE assets and liabilities, and requires additional
disclosures. The updated guidance is effective as of the beginning of
an entity’s first fiscal year that begins after November 15, 2009, with early
adoption prohibited. The Company does not anticipate that the new
guidance will have a material impact on its financial statements upon its
adoption on January 1, 2010.
In
October 2009, the FASB issued Accounting Standards Update 2009-13,
Revenue Recognition
(“ASU
2009-13”). ASU 2009-13 amends the criteria for separating
consideration in multiple-deliverable revenue arrangements, and establishes a
hierarchy of selling prices to determine the selling price of each specific
deliverable. As part of this, ASU 2009-13 eliminates the residual
method for allocating revenue among the elements of an arrangement and requires
that consideration be allocated at the inception of an
arrangement. As well, it expands disclosure
requirements. ASU 2009-13 is effective for fiscal years beginning on
or after June 15, 2010, and therefore will be adopted by the Company on January
1, 2011. At December 31, 2009, the Company has no revenue generating
activities that would be impacted by the adoption of ASU 2009-13.
In
January 2010, the FASB issued Accounting Standards Update 2010-06,
Improving Disclosures About Fair
Value Measurements
(“ASU 2010-6”). ASU 2010-6 amends the
existing guidance to add new requirements for disclosures about transfers into
and out of Levels 1 and 2, and separate disclosures about purchases, sales,
issuances, and settlements relating to Level 3 measurements. It also
clarifies existing fair value disclosures about the level of disaggregation and
about inputs and valuation techniques used to measure fair value. As
well, it amends guidance on employers’ disclosures about postretirement benefit
plan assets to require that disclosures be provided by classes of assets instead
of by major categories of assets. With one exception, ASU 2010-6 is
effective for reporting periods, including interim periods, beginning after
December 15, 2009. The exception is that the requirement to provide
the Level 3 activity of purchases, sales, issuances, and settlements on a gross
basis is effective for fiscal years beginning after December 15,
2010. Early adoption is permitted. The Company will adopt
ASU 2010-6 on January 1, 2010. It does not currently expect that the
adoption of ASU 2010-6 will significantly impact its financial
statements.
The FASB,
the EITF and the SEC have issued other accounting pronouncements and regulations
during 2009 that will become effective in subsequent periods. The
Company’s management does not believe that these pronouncements will have a
significant impact on the Company’s financial statements at the time they become
effective.
The
Company is required, in periods in which it has net income, to calculate basic
earnings per share (“basic EPS”) using the two-class method. The
two-class method is required because the Company’s Class N preferred shares,
each of which is convertible to 40 common shares, have the right to receive
dividends or dividend equivalents should the Company declare dividends on its
common stock. Under the two-class method, earnings for the period,
net of any deductions for contractual preferred stock dividends and any earnings
actually distributed during the period, are allocated on a pro-rata basis to the
common and preferred stockholders. The weighted-average number of
common and preferred shares outstanding during the period is then used to
calculate basic EPS for each class of shares.
In
periods in which the Company has a net loss, basic loss per share is calculated
by dividing the loss attributable to common stockholders by the weighted-average
number of common shares outstanding during the period. The two-class
method is not used, because the preferred stock does not participate in
losses.
Options,
warrants and convertible debt are included in the calculation of diluted
earnings per share, since the instruments are assumed to be exercised or
converted, except when their effect would be anti-dilutive. For the
years ended December 31, 2009, 2008 and 2007, the net effect of including the
Company’s potential common shares is anti-dilutive, and therefore diluted EPS
equals basic EPS.
F-13
Potential
common shares that were not included in the computation of earnings (loss) per
share because they would have been anti-dilutive are as follows as at December
31:
|
2009
|
2008
|
2007
|
||||||||||
|
Assumed
conversion of Class N preferred stock
|
23,680 | 23,760 | 24,280 | |||||||||
|
Assumed
exercise of options and warrant to purchase shares of common
stock
|
994,027 | 1,979,027 | 1,975,749 | |||||||||
| 1,017,707 | 2,002,787 | 2,000,029 | ||||||||||
The
Company’s investments as of December 31 consisted of the following:
|
2009
|
2008
|
|||||||
|
Buddy
Media, Inc.
|
$ | 124 | $ | 224 | ||||
|
Knight’s
Bridge Capital Partners Internet Fund No. 1 GP LLC
|
18 | 18 | ||||||
|
Polaroid
|
2,646 | — | ||||||
|
Total
investments
|
$ | 2,788 | $ | 242 | ||||
Buddy
Media, Inc.
In
September 2007 the Company acquired 303,030 shares of convertible Series A
Preferred Stock of Buddy Media, Inc. (“Buddy Media”) for a purchase price of
$100. Buddy Media, a private company, is a leading developer of
applications for emerging new media platforms such as Facebook, MySpace and
other social media sites. In April 2008 the Company acquired 140,636
shares of convertible Series B Preferred Stock of Buddy Media for a purchase
price of $124. The Series B preferred shares are senior to the Series
A preferred shares, but otherwise have substantially equivalent terms and
conditions, including voting rights on an as-converted basis with the common
stock. On June 29, 2009 the Company sold its Series A Preferred Stock
to an unrelated third party for net proceeds of $121, thereby recognizing a gain
of $21. At all times the Company’s cumulative investment has remained
less than 5% of Buddy Media on an as-converted basis.
The
Company accounts for its investment under the cost method.
Based on
its analysis of Buddy Media’s financial statements and projections as at
December 31, 2009, the Company concluded that the investment’s cost is the best
available estimate of its fair value.
Knight’s
Bridge Capital Partners Internet Fund No. 1 GP LLC
In
December 2007 the Company acquired a one-third interest in Knight’s Bridge
Capital Partners Internet Fund No. 1 GP LLC (“Knight’s Bridge GP”), a private
company, for a purchase price of $20. The additional two-thirds
interest in Knight’s Bridge GP was acquired by parties affiliated with
Counsel. Knight’s Bridge GP is the general partner of Knight’s Bridge
Capital Partners Internet Fund No. 1 LP (the “Fund”). The Fund holds
investments in several non-public Internet-based e-commerce
businesses. As the general partner of the Fund, Knight’s Bridge GP
manages the Fund, in return for which it earns a 2% per annum management fee
with respect to the Fund’s invested capital. Knight’s Bridge GP also
has a 20% carried interest on any incremental realized gains from the Fund’s
investments.
The
Company accounts for its investment under the equity method. During
2008, the Company invested an additional $1 in Knight’s Bridge GP, recorded $5
as its share of Knight’s Bridge GP’s earnings, and received cash distributions
of $8. During 2009, the Company recorded $6 as its share of Knight’s
Bridge GP’s earnings, and received cash distributions of $5. At
December 31, 2009, the Company’s investment in Knight’s Bridge GP, net of
recorded earnings and cash distributions, was $18.
At each
balance sheet date, the Company estimates the fair value of its investment using
the best available information as of the evaluation date. Because
Knight’s Bridge GP is a closely-held, non-public entity, this valuation must be
based primarily on investee-specific information, which is a Level 3 input as
defined by GAAP. Knight’s Bridge GP’s value is directly linked to the
value of the Fund, which is also a non-public entity, whose value is linked to
the value of its investments. The Company will record an other than
temporary impairment of its equity investment in Knight’s Bridge GP in the event
the Company concludes that such impairment has occurred. It should be
noted that at December 31, 2009 the Company’s investment in Knight’s Bridge GP
is not material, and its exposure to potential losses from impairment of the
Fund’s investments is limited to approximately $2.
F-14
Based on
the Company’s analysis of Knight’s Bridge GP’s and the Fund’s financial
statements and projections as at December 31, 2009, the Company concluded that
there has been no other than temporary impairment in the fair value of its
investment, and that its cost is the best estimate of its fair
value.
Polaroid
Effective
May 5, 2009, the Company invested $2,621 to indirectly acquire an approximate 5%
interest in Polaroid Corporation, pursuant to a Chapter 11 reorganization in a
U.S. bankruptcy court. The investment was made as part of a joint
venture investor group (the “JV Group”) that includes both related parties and
non-related parties. The JV Group formed two operating companies
(collectively, “Polaroid”) to hold the acquired intellectual property (PLR IP
Holdings, LLC) and inventory (PLR Acquisition LLC). The Company, the
related parties and two of the unrelated parties formed KPL, LLC (“KPL” or the
“LLC”) to pool their individual investments in Polaroid. The pooled
investments total approximately $19 million of the aggregate purchase price of
approximately $55 million. KPL is managed by a related party,
Knight’s Bridge Capital Partners Management, L.P. (the “Management LP”), who
acts as the General Partner of the LLC.
C2’s
investment in the LLC has two components:
|
|
·
|
$530
of Class D units. These units are subject to a 2% annual
management fee, payable to the General Partner. The units have
a 10% per annum preferred return; any profits generated in addition to the
preferred return, subsequent to the return of invested capital, are
subject to the Management LP’s 20% carried interest. This
investment is approximately 1% of Polaroid and approximately 2.7% of the
LLC.
|
|
|
·
|
$2,091
to acquire Counsel’s rights and obligations as an indirect limited partner
(but not Counsel’s limited partnership interest) in Knight’s Bridge
Capital Partners Fund I, L.P. (“Knight’s Bridge Fund”), a related party,
with respect to the Polaroid investment. The investment in
these units is held by Knight’s Bridge Fund in the name of a Canadian
limited partnership (the “LP”) comprised of Counsel (95.24%) and several
parties related to Counsel. The $2,091 is Counsel’s share of
the LP’s investment and was funded by Counsel. Subsequent to
making the investment in the LP, Counsel sold, to C2, the economic benefit
of its indirect investment in Polaroid in return for a loan (under a
pre-existing loan facility that is discussed in more detail in Note 7 and
Note 11) bearing interest at 10% per annum. C2 is also
responsible for reimbursing Counsel for its share of the management fees,
which are 2% of the investment. The economic interest entitles
C2 to an 8% per annum preferred return; any profits generated in addition
to the preferred return, subsequent to the return of invested capital, are
subject to the general partner of the Knight’s Bridge Fund’s 20% carried
interest. This investment is approximately 3% of Polaroid and
approximately 10.8% of the LLC.
|
The
Company accounts for its investment in the LLC under the equity
method. During 2009, the Company recorded $246 as its cumulative
share of earnings. During 2009, subsequent to its initial investment,
the Company invested an additional $10 as its share of the management fees
referenced above. During the fourth quarter of 2009, the Company
received $232 of cash distributions from Polaroid, which were recorded as a
return of invested capital.
At
December 31, 2009, the Company estimates that its investment in Polaroid has a
fair value of approximately $3,492.
LIMOS.com
LLC
In
September 2007 the Company acquired 400,000 units of LIMOS.com, LLC
(“LIMOS.com”), an established provider of Internet-initiated leads for licensed
limousine operators, for a total purchase price of $400. This
represented an approximately 16% ownership interest. The Company
accounted for its investment in LIMOS.com under the equity method, and for the
period September 2007 to October 2008 recorded a net loss of $43. In
October 2008, the Company sold its interest in LIMOS.com for net proceeds of
$781 and realized a gain of $425, which was reported in Earnings of Equity
Investments in our consolidated financial statements.
The
Company’s note receivable of $653 was issued to a third party in connection with
an equipment sale by Counsel RB. The note bears interest at 6% and is
payable by the third party within one year.
F-15
The
Company’s goodwill of $173 relates to an investment in a subsidiary company that
holds certain of the Company’s patent rights and is included in the patent
licensing reporting unit.
Accounts
payable and accrued liabilities consisted of the following at December
31:
|
2009
|
2008
|
|||||||
|
Regulatory
and legal fees
|
$ | 628 | $ | 51 | ||||
|
Accounting,
auditing and tax consulting
|
89 | 95 | ||||||
|
Patent
licensing costs
|
— | 135 | ||||||
|
Due
to Joint Venture partners
|
522 | — | ||||||
|
Sales
and other taxes
|
62 | 62 | ||||||
|
Remuneration
and benefits
|
91 | 87 | ||||||
|
Other
|
65 | 42 | ||||||
| $ | 1,457 | $ | 472 | |||||
At
December 31, 2009, the Company’s outstanding debt was $6,190. Details
of the debt are as follows. At December 31, 2008 the Company had no
outstanding debt other than accounts payable and accrued
liabilities.
|
December 31,
2009
|
||||
|
Promissory
Note
|
$ | 1,413 | ||
|
Revolving
Credit Facility
|
3,213 | |||
| 4,626 | ||||
|
Related
party debt
|
1,564 | |||
| 6,190 | ||||
|
Less
current portion
|
6,190 | |||
|
Long-term
debt, less current portion
|
$ | — | ||
Promissory
note
In
connection with Counsel RB’s acquisition of assets in June 2009, Counsel RB
issued a promissory note with a principal amount of approximately $1.36 million
(the “Promissory Note”) to the vendor. The Promissory Note bears
interest at 6% annually, with both principal and interest payable one year from
the date of the issuance of the Promissory Note. Counsel RB may
pre-pay the Promissory Note in full at any time, without penalty. If
any payment required under the Promissory Note is not paid when due, or if any
default under the Promissory Note occurs, the entire principal amount and
accrued but unpaid interest will become immediately due and payable at the
option of the holder of the Promissory Note. The Promissory Note
contains other terms and provisions customary for agreements of this nature, and
has been guaranteed by both the Company and Counsel. At December 31,
2009 the balance of the Promissory Note, including accrued interest, was
$1,413.
Revolving
credit facility
Also in
connection with Counsel RB’s June 2009 asset acquisition, Counsel RB arranged a
revolving credit facility (the “Credit Facility”) with a U.S. bank under the
terms and provisions of a certain Loan and Security Agreement, dated as of June
2, 2009 (the “Loan Agreement”), in order to finance the acquisition of eligible
equipment for purposes of resale. The Credit Facility bears interest
at the greater of prime rate + 1.5%, or 5%, matures one year from the date of
closing of the acquisition, and has an initial balance of approximately US $1.4
million. The maximum borrowing available under the Credit Facility,
exclusive of the initial balance, is US $7.5 million, subject to Counsel RB
maintaining a 1:2 ratio of capital funds, i.e. the sum of the Company’s tangible
net worth plus subordinated indebtedness, as defined in the Loan Agreement, to
the outstanding balance. The amount of any advance is determined based upon the
value of the eligible assets being acquired. The Credit Facility
contains other terms and provisions customary for agreements of this nature, and
has been guaranteed by both the Company and Counsel. At December 31,
2009 the balance of the Credit Facility, including accrued interest, was $3,213,
and the Company was in compliance with all covenants of the
facility.
F-16
Related
party debt
During
2009, Counsel made net advances of $1,456 to the Company under an existing loan
facility (the “Counsel Loan”) that bears interest at 10% and is due on
demand. The primary reason for the advances was to fund the Company’s
investment in Polaroid, as discussed in Note 5. At December 31, 2009
the balance of the Counsel Loan, including accrued interest, was
$1,564.
Warrant
to purchase common stock
On
October 14, 2004, the Company issued an interest-bearing convertible note (the
“Note”) with a detachable warrant to a third party lender, in the principal
amount of $5,000, due October 14, 2007. In January 2007, as a result
of negotiations between the Company and the third party lender, the lender
converted a portion of its note into 10,000 common shares of the Company, and
the Company prepaid the remaining Note in full by paying 105% of the amount then
due. The Company incurred a net loss of $293, which was approximately
equal to the total of the interest expense and discount amortization that the
Company would have incurred by holding the debt to its contractual maturity of
October 14, 2007.
In
addition to the Note, the Company issued a common stock purchase warrant (the
“Warrant”) to the third party lender, entitling the lender to purchase up to one
million shares of common stock, subject to adjustment, at exercise prices
ranging from $1.00 to $1.20 per share. The Warrant entitled the
holder to purchase the stock through the earlier of (i) October 13, 2009 or (ii)
the date on which the average closing price for any consecutive ten trading
dates equalled or exceeded 15 times the exercise price.
The
Warrant was classified in equity in the Company’s financial
statements. At each financial statement date, the Company assessed
whether there were any contingent obligations with respect to the Warrant’s
registration payment arrangement. At every assessment date, the
Company’s conclusion was that payments relating to the registration payment
arrangement were not probable, and therefore the Company did not
record any liability in connection with such a payment. The Warrant
was never exercised, and it expired on October 13, 2009.
At
December 31, 2009, C2 has no commitments other than its accounts payable,
accrued liabilities and a lease on one of its offices, which expires February
28, 2014. The annual lease obligations are as shown
below:
|
2010
|
$ | 74 | ||
|
2011
|
74 | |||
|
2012
|
74 | |||
|
2013
|
74 | |||
|
2014
|
14 |
At
December 31, 2009, Counsel RB has guaranteed $200 mortgage debt held by a Joint
Venture in which it holds an investment. The mortgage debt is a
demand loan that bears interest at 6.5%.
In the
fourth quarter of 2003, C2 acquired the VoIP Patent from a third
party. Consideration provided was $100 plus a 35% residual payable to
the third party relating to the net proceeds from future licensing and/or
enforcement actions from the C2 VoIP Patent Portfolio. Net proceeds
are defined as amounts collected from third parties net of the direct costs
associated with putting the licensing or enforcement in place and related
collection costs.
In 2009
the Company recognized current income tax expense of $96, state income tax
expense of $26, and a net deferred income tax expense of $147. The
net deferred income tax expense is primarily due to a decrease in estimate of
the tax effect of available tax loss carryforwards expected to be utilized in
the 2010 year. In 2008 the Company recognized a net deferred income
tax expense of $125 as a result of a reversal of a deferred income tax recovery
of $1,000 recorded in 2007 offset by an additional net deferred income tax
recovery of $875 with respect to the tax effect of available tax loss carry
forwards expected to be utilized in 2009. The reported tax benefit
varies from the amount that would be provided by applying the statutory U.S.
Federal income tax rate to the income (loss) from continuing operations before
taxes for the following reasons:
F-17
|
2009
|
2008
|
2007
|
||||||||||
|
Expected
federal statutory tax expenses (benefit)
|
$ | (339 | ) | $ | 2,028 | $ | (554 | ) | ||||
|
Increase
(reduction) in taxes resulting from:
|
||||||||||||
|
State
income taxes
|
26 | — | — | |||||||||
|
Current
income tax expense
|
96 | — | — | |||||||||
|
Non-deductible
insurance premium
|
31 | 51 | 51 | |||||||||
|
Change
in valuation allowance attributable to continuing operations,
net
|
446 | (1,966 | ) | (508 | ) | |||||||
|
Other
|
9 | 12 | 11 | |||||||||
|
Deferred
income tax expense (recovery)
|
$ | 269 | $ | 125 | $ | (1,000 | ) | |||||
The net
change in the valuation allowance (after adjusting for changes in estimates to
uncertain tax positions), including discontinued operations, was an increase of
$446, a decrease of $1,961, and a decrease of $668 for the years ended 2009,
2008 and 2007, respectively.
At
December 31, 2009, after derecognizing uncertain tax positions as described
below, the Company had total net operating loss and net capital loss
carryforwards for federal income tax purposes of approximately $87,800 and
$34,600 respectively. The Company believes that it is more likely
than not that it will utilize at least approximately $2,144 of these tax losses
against estimated future income for tax purposes. The net operating
loss carryforwards expire between 2024 and 2029. The net capital loss
carryforwards expire in 2010 and 2011.
The
Company’s utilization of approximately $33,350 of its available net operating
loss carryforwards against future income for tax purposes is restricted pursuant
to the “change in ownership” rules in Section 382 of the Internal Revenue
Code. These rules, in general, provide that an ownership change
occurs when the percentage shareholdings of 5% direct or indirect stockholders
of a loss corporation have, in aggregate, increased by more than 50 percentage
points during the immediately preceding three years.
Restrictions
in net operating loss carryforwards occurred in 2001 as a result of the
acquisition of the Company by Counsel. Further restrictions may have
occurred as a result of subsequent changes in the share ownership and capital
structure of the Company and Counsel and disposition of business interests by
the Company. Pursuant to Section 382 of the Internal Revenue Code,
the annual usage of the Company’s net operating loss carryforwards was limited
to approximately $2,500 per annum until 2008 and $1,700 per annum thereafter.
There is no certainty that the application of these “change in ownership” rules
may not recur, resulting in further restrictions on the Company’s income tax
loss carry forwards existing at a particular time. In addition, further
restrictions, reductions in, or expiry of net operating loss and net capital
loss carryforwards may occur through future merger, acquisition and/or
disposition transactions or failure to continue a significant level of business
activities. Any such additional limitations could require the Company to pay
income taxes on its future earnings and record an income tax expense to the
extent of such liability, despite the existence of such tax loss
carryforwards.
The
Company is subject to state income tax in multiple jurisdictions. While the
Company had net operating loss carryforwards for state income tax purposes in
certain states where it previously conducted business, its available state tax
loss carryforwards may differ substantially by jurisdiction and, in general, are
subject to the same or similar restrictions as to expiry and usage described
above. In addition, in certain states the Company’s state tax loss carryforwards
which were attributable to the business of WXC Corp. ceased to be available to
the Company following the sale of the shares of this company in 2006. It is
possible that in the future, the Company may not have tax loss carryforwards
available to shield income which is attributable to a particular state from
being subject to tax in that particular state.
The
components of the deferred tax asset and liability as of December 31 (after
derecognizing uncertain tax positions) are as follows:
F-18
|
2009
|
2008
|
2007
|
||||||||||
|
Net
operating loss carry forwards
|
$ | 29,859 | $ | 28,420 | $ | 29,968 | ||||||
|
Net
capital loss carry forwards
|
11,788 | 11,691 | 11,835 | |||||||||
|
Acquired
in-process research and development and intangible assets
|
653 | 972 | 1,343 | |||||||||
|
Stock-based
compensation
|
118 | 105 | 88 | |||||||||
|
Start-up
costs
|
35 | — | — | |||||||||
|
Accrued
liabilities
|
7 | 7 | 7 | |||||||||
|
Reserve
for accounts receivable
|
2 | 2 | 2 | |||||||||
|
Other
|
363 | 17 | 57 | |||||||||
|
Valuation
allowance
|
(42,096 | ) | (40,339 | ) | (42,300 | ) | ||||||
|
Total
deferred tax assets
|
729 | 875 | 1,000 | |||||||||
|
Deferred
tax liabilities
|
— | — | — | |||||||||
|
Net
deferred tax assets
|
$ | 729 | $ | 875 | $ | 1,000 | ||||||
The
Company has claimed a valuation allowance at the end of the year sufficient to
reduce its net deferred tax asset to $729, the amount considered more likely
than not to be utilized. The Company had net deferred tax assets of
$875 and $1,000 as of December 31, 2008 and 2007, respectively, computed on the
same basis.
Uncertain
Tax Positions
The
accounting for uncertainty in income taxes requires a more-likely-than-not
threshold for financial statement recognition and measurement of tax positions
taken or expected to be taken in a tax return. Upon adoption of this
principle, effective January 1, 2007, the Company derecognized certain tax
positions that, upon examination, more likely than not would not have been
sustained as a recognized tax benefit. However, to date the adoption
has had no material effect on the Company’s financial position, operations or
cash flow. As a result of derecognizing uncertain tax positions, the
Company recorded a reduction in its deferred tax assets of approximately
$13,100, attributable to unrecognized tax benefits of $24,000 associated with
prior years’ tax losses, which are not expected to be available primarily due to
change of control usage restrictions, and a reduction in the rate of the tax
benefit associated with all of its tax attributes.
Due to
the Company’s historic policy of applying a valuation allowance against its
deferred tax assets, the effect of the above was an offsetting reduction in the
Company’s valuation allowance. Accordingly, the above reduction had
no net impact on the Company’s financial position, operations or cash
flow. As of December 31, 2009, the unrecognized tax benefit has been
determined to be $12,059, a decrease of $1,079 from the assessment as of
December 31, 2008. The decrease primarily reflects an adjustment of
the Company’s assessment of historical loss carryforwards that meet the “more
likely than not” threshold for usage in the future The following
table summarizes the activity related to gross unrecognized tax benefits of the
Company from January 1, 2009 to December 31, 2009:
|
Beginning
unrecognized tax benefit
|
13,138 | |||
|
Increase
(decrease) related to prior year positions
|
(1,079 | ) | ||
|
Increase
(decrease) related to current year positions
|
— | |||
|
Ending
unrecognized tax benefit
|
$ | 12,059 |
In the
unlikely event that these tax benefits are recognized in the future, there
should be no impact on the Company’s effective tax rate, unless recognition
occurs at a time when all of the Company’s historic tax loss carryforwards have
been utilized and the associated valuation allowance against the Company’s
deferred tax assets has been reversed. In such circumstances, the amount
recognized at that time should result in a reduction in the Company’s effective
tax rate.
The
Company’s policy is to recognize accrued interest and penalties related to
unrecognized tax benefits in income tax expense. Because the Company has tax
loss carryforwards in excess of the unrecognized tax benefits, the Company did
not accrue for interest and penalties related to unrecognized tax benefits
either upon the initial derecognition of uncertain tax positions or in the
current period.
It is
possible that the total amount of the Company’s unrecognized tax benefits will
significantly increase or decrease within the next 12 months. These
changes may be the result of future audits, the application of “change in
ownership” rules leading to further restrictions in tax losses arising from
changes in the capital structure of the Company and/or that of its parent
company Counsel, reductions in available tax loss carryforwards through future
merger, acquisition and/or disposition transactions, failure to continue a
significant level of business activities, or other circumstances not known to
management at this time. At this time, an estimate of the range of
reasonably possible outcomes cannot be made.
F-19
The
Company has a history of incurring annual tax losses since 1991. All
loss taxation years remain open for audit pending the application of the
respective tax losses against income in a subsequent taxation
year. In general, the statute of limitations expires three years from
the date that a company files a tax return applying prior year tax loss
carryforwards against income for tax purposes in the later year. The
Company applied historic tax loss carryforwards to offset debt forgiveness in
2006 and income for tax purposes in 2008, respectively. The 2005
through 2009 taxation years remain open for audit.
Transactions
with Counsel
At
December 31, 2009 the Company was indebted to Counsel in the amount of $1,564,
as compared to $0 at December 31, 2008. The debt is secured by a
collateralized promissory note and loan agreement (the “Counsel
Loan”). The Counsel Loan, which was originally entered into during
the fourth quarter of 2003, accrues interest at 10% per annum compounded
quarterly from the date funds are advanced. The Counsel Loan has been
amended several times, most recently during the second quarter of 2009 when it
was converted into a demand loan. The Counsel Loan is secured by the
assets of the Company and is subject to certain events of default.
Counsel
Management Services
Since
December 2004, C2 and Counsel have entered into successive annual management
services agreements (the “Agreement”). Under the terms of the
Agreement, C2 agrees to make payment to Counsel for ongoing services provided to
C2 by several Counsel personnel. The basis for such services charged
is an allocation, based on time incurred, of the cost of the base compensation
paid by Counsel to those employees providing services to C2. For the
year ended December 31, 2009, the cost was $360. For the years ended
December 31, 2008 and 2007, the cost was $360 and $225,
respectively. The amounts due under the Agreement are payable within
30 days following the respective year end, subject to applicable
restrictions. Any unpaid fee amounts bear interest at 10% per annum
commencing on the day after such year end. In the event of a change
of control, merger or similar event of C2, all amounts owing, including fees
incurred up to the date of the event, will become due and payable immediately
upon the occurrence of such event. The Company expects that Counsel
will continue to provide these services in 2010 on the same cost
basis.
ShareholderLitigation
At our
Adjourned Meeting of Stockholders held on December 30, 2003, our stockholders,
among other things, approved an amendment to our Articles of Incorporation,
deleting Article VI thereof (regarding liquidations, reorganizations, mergers
and the like). Stockholders who were entitled to vote at the meeting
and advised us in writing, prior to the vote on the amendment, that they
dissented and intended to demand payment for their shares if the amendment was
effectuated, were entitled to exercise their appraisal rights and obtain payment
in cash for their shares under Sections 607.1301 – 607.1333 of the Florida
Business Corporation Act (the “Florida Act”), provided their shares were not
voted in favor of the amendment. In January 2004, we sent appraisal
notices in compliance with Florida corporate statutes to all stockholders who
had advised us of their intention to exercise their appraisal
rights. The appraisal notices included our estimate of fair value of
our shares, at $4.00 per share on a post-split basis. Approximately
33 stockholders holding approximately 74,000 shares of our stock returned
completed appraisal notices indicating that they did not accept our
offer. Because we did not agree with the estimates submitted by the
dissenting stockholders, we sought a judicial determination of the fair value of
their common stock. On June 24, 2004, we filed suit against the
dissenting stockholders seeking a declaratory judgment, appraisal and other
relief in Florida. On February 4, 2005, the declaratory judgment
action was stayed pending the resolution of direct and derivative lawsuits filed
in California. This decision was made by the judge in the Florida
declaratory judgment action due to the similar nature of certain allegations
brought by the defendants in the declaratory judgment matter and the California
lawsuits. As a result of the June 2008 settlement of the derivative
and securities lawsuits in California, the stay of the Florida declaratory
judgment action was lifted. In the first quarter of 2009, the Company
completed an agreement with the holders of 27,221 of the 27,536 shares
(including common share equivalents) held by the remaining dissenting
stockholders, whereby the stockholders agreed to accept $4.60 per share in full
payment for their respective shares, for cancellation by the Company, and a
release of any other claims that they may have against the Company and
Counsel. In the third quarter of 2009, the Company completed a
similar agreement with the remaining dissenting stockholders, who agreed to
accept $5.00 per share under the same terms and conditions as described above,
as well as the payment of $1 of legal expenses that they had
incurred.
F-20
Intellectual
Property Enforcement Litigation
On August
27, 2009 the Company’s wholly-owned subsidiary, C2 Communications Technologies
Inc., filed a patent infringement lawsuit against PAETEC Corporation, Matrix
Telecom, Inc., Windstream Corporation, and Telephone and Data Systems,
Inc. The complaint was filed in the United States District Court for
the Eastern District of Oklahoma and alleges that the defendants’ services and
systems utilizing VoIP infringe the Company’s U.S. Patent No.
6,243,373. The complaint seeks an injunction, monetary damages and
costs. In the fourth quarter of 2009, the complaint against Matrix
Telecom, Windstream Corporation, and Telephone and Data Systems, Inc., was
dismissed without prejudice. Also in the fourth quarter of 2009, the
case was transferred to the Eastern District of Texas. A trial date
has not been set.
The
Company is involved in various other legal matters arising out of its operations
in the normal course of business, none of which are expected, individually or in
the aggregate, to have a material adverse effect on the Company.
Each
Class N preferred share has a voting entitlement equal to 40 common shares,
votes with the common stock on an as-converted basis and is senior to all other
preferred stock of the Company. Dividends, if any, will be paid on an
as-converted basis equal to common stock dividends. The value of each
Class N preferred share is $1,000, and each share is convertible to 40 common
shares at the rate of $25 per common share.
During
2009, none of the Company’s Class N preferred stock was converted into common
stock. During 2008, thirteen shares of preferred stock were converted
into 520 shares of common stock.
At
December 31, 2009 and 2008, of the 10,000,000 shares of preferred stock
authorized, 9,486,500 remain undesignated and unissued.
Stock-
Based Compensation Plans
At
December 31, 2009, the Company had five stock-based compensation plans, which
are described below.
1995
Director Stock Option and Appreciation Rights Plan
The 1995
Director Stock Option and Appreciation Rights Plan (the “1995 Director Plan”)
provides for the issuance of incentive stock options, non-qualified stock
options and stock appreciation rights (“SARs”) to directors of the Company up to
12,500 shares of common stock (subject to adjustment in the event of stock
dividends, stock splits, and other similar events). If any incentive
option, non-qualified option or SAR terminates prior to exercise thereof and
during the duration of the 1995 Director Plan, the shares of common stock as to
which such option or right was not exercised will become available under the
1995 Director Plan for the grant of additional options or rights to any eligible
director. Each option is immediately exercisable for a period of ten
years from the date of grant. The Company has 12,500 shares of common
stock reserved for issuance under the 1995 Director Plan. As of
December 31, 2009 and 2008, there were no options outstanding under the 1995
Director Plan.
1995
Employee Stock Option and Appreciation Rights Plan
The 1995
Employee Stock Option and Appreciation Rights Plan (the “1995 Employee Plan”)
provides for the grant of incentive stock options, non-qualified stock options,
and SARs of up to 20,000 shares of common stock (subject to adjustment in the
event of stock dividends, stock splits, and other similar
events). Directors of the Company are not eligible to participate in
the 1995 Employee Plan. The 1995 Employee Plan provides for the grant
of stock options, which qualify as incentive stock options under Section 422 of
the Internal Revenue Code, to be issued to officers who are employees and other
employees, as well as for the grant of non-qualified options to be issued to
officers, employees and consultants. In addition, SARs may be granted
in conjunction with the grant of incentive and non-qualified
options. To the extent that an incentive option or non-qualified
option is not exercised within the period of exercisability specified therein,
it will expire as to the then unexercisable portion. If any incentive
option, non-qualified option or SAR terminates prior to exercise thereof and
during the duration of the 1995 Employee Plan, the shares of common stock as to
which such option or right was not exercised will become available under the
1995 Employee Plan for the grant of additional options or rights to any eligible
employee. The shares of common stock subject to the 1995 Employee
Plan may be made available from either authorized but unissued shares, treasury
shares or both. The Company has 20,000 shares of common stock reserved for
issuance under the 1995 Employee Plan. As of December 31, 2009 and
2008, there were no options outstanding under the 1995 Employee
Plan.
F-21
1997
Recruitment Stock Option Plan
In
October 2000, the stockholders of the Company approved an amendment of the 1997
Recruitment Stock Option Plan (the “1997 Plan”) which provides for the issuance
of incentive stock options, non-qualified stock options and SARs up to an
aggregate of 370,000 shares of common stock (subject to adjustment in the event
of stock dividends, stock splits, and other similar events). The
price at which shares of common stock covered by the option can be purchased is
determined by the Company’s Board of Directors; however, in all instances the
exercise price is never less than the fair market value of the Company’s common
stock on the date the option is granted.
As of
December 31, 2009, there were options to purchase 236,111 shares (2008 – 237,361
shares) of the Company’s common stock outstanding under the 1997
Plan. 56,250 of these options, with an exercise price of $0.66 per
share, were unvested at December 31, 2009 (2008 – 112,500). They will
vest in 2010. 168,750 options with an exercise price of $0.66 per
share were vested at December 31, 2009 (2008 – 112,500). 11,111
options with exercise prices of $1.40 to $111.26 per share were vested at
December 31, 2009 (2008 – 12,361 options with exercise prices of $1.40 to
$111.26 per share). The options with an exercise price of $0.66 must
be exercised within seven years of grant date and can only be exercised while
the option holder is an employee of the Company. The remaining
options must be exercised within ten years of grant date and can only be
exercised while the option holder is an employee of the Company. The
Company has not awarded any SARs under the 1997 Plan. During 2009, no
options to purchase shares of common stock were issued, and 1,250 options
expired. During 2008, no options to purchase shares of common stock
were issued, and 1,250 options expired. There were no exercises
during 2009 or 2008.
2000
Employee Stock Purchase Plan
The 2000
Employee Stock Purchase Plan (the “Stock Purchase Plan”) provides for the
purchase of common stock, in the aggregate, up to 125,000 shares. The
purpose of the Stock Purchase Plan is to provide incentives for all eligible
employees of C2 (or any of its subsidiaries), who have been employees for at
least three months, to participate in stock ownership of C2 by acquiring or
increasing their proprietary interest in C2. The Stock Purchase Plan
is designed to encourage employees to remain in the employ of C2. It
is the intention of C2 to have the Stock Purchase Plan qualify as an “employee
stock purchase plan” within the meaning of Section 423 of the Internal Revenue
Code, as amended. This plan allows all eligible employees of the
Company to have payroll withholding of 1 to 15 percent of their
wages. The amounts withheld during a calendar quarter are then used
to purchase common stock at a 15 percent discount off the lower of the closing
sale price of the Company’s stock on the first or last day of each
quarter. This plan was effective beginning the third quarter of
2000. The Company issued 1,726 shares to employees based upon payroll
withholdings during 2001. There have been no issuances since
2001.
2003
Stock Option and Appreciation Rights Plan
In
November 2003, the stockholders of the Company approved the 2003 Stock Option
and Appreciation Rights Plan (the “2003 Plan”) which provides for the issuance
of incentive stock options, non-qualified stock options and SARs up to an
aggregate of 2,000,000 shares of common stock (subject to adjustment in the
event of stock dividends, stock splits, and other similar
events). The price at which shares of common stock covered by the
option can be purchased is determined by the Company’s Board of Directors or a
committee thereof; however, in the case of incentive stock options the exercise
price shall not be less than the fair market value of the Company’s common stock
on the date the option is granted. As of December 31, 2009, there
were options to purchase 678,250 shares (2008 - 638,250 shares) of the Company’s
common stock outstanding under the 2003 Plan. The outstanding options
vest over four years at exercise prices ranging from $0.15 to $3.00 per
share. During 2009, 40,000 options (2008 – 40,000 options) were
granted. During 2009 and 2008 no options to purchase shares of common
stock were forfeited or expired. There were no options exercised
during 2009 and 2008, and no SARs have been issued under the 2003
Plan.
Other
options
During
1997 and 2001, the Company issued options to purchase 60,500 shares of common
stock (10,500 of which were issued under the 1997 recruitment stock option plan)
to consultants at exercise prices ranging from $97.50 to $168.75 (repriced to
$78.00 on December 13, 1998), which was based on the closing price of the stock
at the grant date. During 2009 and 2008, there were no exercises,
expiries or forfeitures. The remaining options must be exercised
within ten years of the grant date. As of December 31, 2009 and 2008
there remained 833 options outstanding.
During
1998, the Company issued non-qualified options to purchase 46,750 shares of
common stock to certain executive employees at exercise prices ranging from
$51.26 to $62.50, which price was based on the closing price of the stock at the
grant date. The options must be exercised within ten years of the
grant date. During 2009, 5,000 options expired (2008 – 35,472
options), and none were exercised or forfeited. As of December 31,
2009 no options remained outstanding (2008 – 5,000).
F-22
During
1999, the Company issued non-qualified options to purchase 32,750 shares of
common stock to certain executive employees at exercise prices ranging from
$50.00 to $71.26, which price was based on the closing price of the stock at the
grant date. The options must be exercised within ten years of the grant
date. During 2009, 18,750 options expired (2008 – no options). No
options expired, were exercised or forfeited during 2008. As of December
31, 2009 no options remained outstanding (2008 – 18,750).
During
1999, the Company issued non-qualified options to purchase 10,000 shares of
common stock to a consultant at an exercise price of $60.00, which was based on
the closing price of the stock at the grant date. The fair value of the
options issued was recorded as deferred compensation of $300, which was
amortized over the expected period the services were to be provided. No
options expired, were exercised or forfeited during 2009 or 2008. The
options expire in 2010. As of December 31, 2009 and 2008 there remained
10,000 options outstanding.
During
2000, the Company issued non-qualified options to purchase 129,250 shares of
common stock to certain executive employees at exercise prices ranging from
$55.00 to $127.50, which price was based on the closing price of the stock at
the grant date. The options must be exercised within ten years of the
grant date. No options expired, were exercised or forfeited during 2009 or
2008. As of December 31, 2009 and 2008, there remained 68,833 options
outstanding.
Stock-Based
Compensation Expense
Total
compensation cost related to stock options in 2009, 2008 and 2007 was $71, $85
and $166, respectively. No tax benefit from stock-based compensation was
recognized in these years, as no options were exercised. The Company’s
stock-based compensation had no effect on its cash flows during the same
periods. Option holders are not entitled to receive dividends or dividend
equivalents.
During
2009, 2008 and 2007, the only options granted were 10,000 per year to each the
Company’s independent directors, in accordance with the terms of the 2003 Stock
Option and Appreciation Rights Plan. The fair value of each option grant was
estimated on the date of the grant using the Black-Scholes option pricing model
with the following assumptions:
|
2009
|
2008
|
2007
|
||||||||||
|
Risk-free
interest rate
|
1.37
|
%
|
1.80
|
%
|
4.51
|
%
|
||||||
|
Expected
life (years)
|
4.75
|
4.75
|
4.75
|
|||||||||
|
Expected
volatility
|
228.9
|
%
|
198.4
|
%
|
79.1
|
%
|
||||||
|
Expected
dividend yield
|
Zero
|
Zero
|
Zero
|
|||||||||
|
Expected
forfeitures
|
Zero
|
Zero
|
Zero
|
|||||||||
The
risk-free interest rates are those for U.S. Treasury constant maturities, for
terms matching the expected term of the option. The expected life of the
options is calculated according to the simplified method for estimating the
expected term of the options, based on the vesting period and contractual term
of each option grant, which are the same for all grants. For 2007,
expected volatility was based on the Company’s historical volatility in
conjunction with peer group volatility and relevant stock-price indices.
For 2008 and 2009, expected volatility was based on the Company’s historical
volatility and peer group volatility. As the Company’s stock is closely
held and thinly traded, the Company believes that incorporating peer group
information provides a better measure of expected volatility than the Company’s
stock price alone. The Company has never paid a dividend on its common
stock and therefore the expected dividend yield is zero.
The
following summarizes the changes in common stock options for the years ended
December 31, 2009, 2008 and 2007:
|
2009
|
2008
|
2007
|
||||||||||||||||||||||
|
Options
|
Weighted
Average
Exercise
Price
|
Options
|
Weighted
Average
Exercise
Price
|
Options
|
Weighted
Average
Exercise
Price
|
|||||||||||||||||||
|
Outstanding
at beginning of year
|
979,027 | $ | 7.73 | 975,749 | $ | 9.88 | 1,096,326 | $ | 19.51 | |||||||||||||||
|
Granted
|
40,000 | $ | 0.15 | 40,000 | $ | 0.90 | 30,000 | $ | 0.70 | |||||||||||||||
|
Exercised
|
— | $ | — | — | $ | — | — | $ | — | |||||||||||||||
|
Expired
|
(25,000 | ) | $ | 63.44 | (36,722 | ) | $ | 57.53 | (150,577 | ) | $ | 78.00 | ||||||||||||
|
Forfeited
|
— | $ | — | — | $ | — | — | $ | — | |||||||||||||||
|
Outstanding
at end of year
|
994,027 | $ | 6.02 | 979,027 | $ | 7.73 | 975,749 | $ | 9.88 | |||||||||||||||
|
Options
exercisable at year end
|
795,277 | $ | 7.35 | 681,527 | $ | 10.75 | 549,936 | $ | 16.89 | |||||||||||||||
|
Weighted-average
fair value of options granted during the year
|
$ | 0.15 | $ | 0.87 | $ | 0.46 | ||||||||||||||||||
F-23
As of
December 31, 2009, the total unrecognized stock-based compensation expense
related to unvested stock options was $62, which is expected to be recognized
over a weighted-average period of eight months.
At
December 31, 2009, the Company’s closing stock price was $0.15. All of the
outstanding options had exercise prices greater than or equal to
$0.15.
The
following summarizes the changes in unvested common stock options for the years
ending December 31, 2009, 2008 and 2007:
|
Options
|
Weighted
Average
Grant Date
Fair Value
|
|||||||
|
Unvested
at December 31, 2008
|
297,500 | $ | 0.54 | |||||
|
Granted
|
40,000 | $ | 0.15 | |||||
|
Vested
|
(138,750 | ) | $ | 0.52 | ||||
|
Expired
|
— | $ | — | |||||
|
Unvested
at December 31, 2009
|
198,750 | $ | 0.48 | |||||
|
Options
|
Weighted
Average
Grant
Date
Fair Value
|
|||||||
|
Unvested
at December 31, 2007
|
425,813 | $ | 0.51 | |||||
|
Granted
|
40,000 | $ | 0.87 | |||||
|
Vested
|
(168,313 | ) | $ | 0.54 | ||||
|
Expired
|
— | $ | — | |||||
|
Unvested
at December 31, 2008
|
297,500 | $ | 0.54 | |||||
|
Options
|
Weighted
Average
Grant Date
Fair Value
|
|||||||
|
Unvested
at December 31, 2006
|
596,625 | $ | 0.63 | |||||
|
Granted
|
30,000 | $ | 0.46 | |||||
|
Vested
|
(198,312 | ) | $ | 1.28 | ||||
|
Expired
|
(2,500 | ) | $ | — | ||||
|
Unvested
at December 31, 2007
|
425,813 | $ | 0.51 | |||||
The total
fair value of options vesting during the years ending December 31, 2009, 2008
and 2007 was $72, $91 and $171, respectively. The unvested options have no
associated performance conditions. Therefore, the Company expects that,
barring the departure of individual directors or employees, all of the unvested
options will vest according to the standard four-year timetable.
The
following table summarizes information about all stock options outstanding at
December 31, 2009:
|
Exercise price
|
Options
Outstanding
|
Weighted
Average
Remaining
Life (years)
|
Weighted
Average
Exercise
Price
|
Number
Exercisable
|
Weighted
Average
Remaining
Life (years)
|
Weighted
Average
Exercise
Price
|
||||||||||||||||||
|
$
0.15 to $ 1.39
|
750,000 | 3.28 | $ | 0.83 | 551,250 | 2.87 | $ | 0.88 | ||||||||||||||||
|
$
1.40 to $ 3.00
|
159,448 | 0.67 | $ | 2.94 | 159,448 | 0.67 | $ | 2.94 | ||||||||||||||||
|
$
6.88 to $ 15.62
|
2,965 | 1.02 | $ | 14.99 | 2,965 | 1.02 | $ | 14.99 | ||||||||||||||||
|
$48.76
to $ 71.26
|
78,083 | 0.02 | $ | 57.09 | 78,083 | 0.02 | $ | 57.09 | ||||||||||||||||
|
$78.00
to $127.50
|
3,531 | 0.56 | $ | 111.46 | 3,531 | 0.56 | $ | 111.46 | ||||||||||||||||
| 994,027 | 2.59 | $ | 6.02 | 795,277 | 2.13 | $ | 7.35 | |||||||||||||||||
F-24
Following
the disposition of its Telecommunications segment in the third quarter of 2005,
the Company operated in a single business segment, Patent Licensing. With
the commencement of Counsel RB’s operations in the second quarter of 2009, the
Company has diversified into a second segment, Asset Liquidation.
There are
no material inter-segment revenues. The Company’s business is conducted
principally in the U.S. The table below presents information about the
segments of the Company as of and for the year ended December 31,
2009:
|
For the Year Ended December 31, 2009
Reportable Segments
|
||||||||||||
|
Patent Licensing
|
Asset
Liquidation
|
Total
|
||||||||||
|
Revenues
from external customers
|
$ | — | $ | 5,991 | $ | 5,991 | ||||||
|
Earnings
from equity accounted asset liquidation investments
|
— | 64 | 64 | |||||||||
|
Other
income (expense)
|
— | (109 | ) | (109 | ) | |||||||
|
Interest
expense
|
— | 217 | 217 | |||||||||
|
Depreciation
and amortization
|
— | — | — | |||||||||
|
Segment
income (loss) from continuing operations
|
(62 | ) | 318 | 256 | ||||||||
|
Investment
in equity accounted asset liquidation investees
|
— | 3,943 | 3,943 | |||||||||
|
Segment
assets
|
201 | 7,842 | 8,043 | |||||||||
|
For the Year Ended December 31, 2008
Reportable Segments
|
||||||||||||
|
Patent Licensing
|
Asset
Liquidation
|
Total
|
||||||||||
|
Revenues
from external customers
|
$ | 17,625 | $ | — | $ | 17,625 | ||||||
|
Earnings
from equity accounted asset liquidation investments
|
— | — | — | |||||||||
|
Other
income (expense)
|
— | — | — | |||||||||
|
Interest
expense
|
— | — | — | |||||||||
|
Depreciation
and amortization
|
20 | — | 20 | |||||||||
|
Segment
income (loss) from continuing operations
|
6,797 | — | 6,797 | |||||||||
|
Investment
in equity accounted asset liquidation investees
|
— | — | — | |||||||||
|
Segment
assets
|
173 | — | 173 | |||||||||
|
For the Year Ended December 31, 2007
Reportable Segments
|
||||||||||||
|
Patent Licensing
|
Asset
Liquidation
|
Total
|
||||||||||
|
Revenues
from external customers
|
$ | — | $ | — | $ | — | ||||||
|
Earnings
from equity accounted asset liquidation investments
|
— | — | — | |||||||||
|
Other
income (expense)
|
— | — | — | |||||||||
|
Interest
expense
|
— | — | — | |||||||||
|
Depreciation
and amortization
|
20 | — | 20 | |||||||||
|
Segment
income (loss) from continuing operations
|
(201 | ) | — | (201 | ) | |||||||
|
Investment
in equity accounted asset liquidation investees
|
— | — | — | |||||||||
|
Segment
assets
|
193 | — | 193 | |||||||||
F-25
The
following table reconciles reportable segment information to the consolidated
financial statements of the Company:
|
Year ended
December 31,
2009
|
Year ended
December 31,
2008
|
Year ended
December 31,
2007
|
||||||||||
|
Total
other income (loss) for reportable segments
|
$ | (109 | ) | $ | — | $ | — | |||||
|
Unallocated
other income and earnings from equity investments from corporate
accounts
|
273 | 404 | (207 | ) | ||||||||
| $ | 164 | $ | 404 | $ | (207 | ) | ||||||
|
Total
interest expense for reportable segments
|
$ | 217 | $ | — | $ | — | ||||||
|
Unallocated
interest expense from third party debt
|
— | — | 12 | |||||||||
|
Unallocated
interest expense from related party debt
|
108 | 43 | 184 | |||||||||
| $ | 325 | $ | 43 | $ | 196 | |||||||
|
Total
depreciation and amortization for reportable segments
|
$ | — | $ | 20 | $ | 20 | ||||||
|
Other
unallocated depreciation from corporate assets
|
— | — | — | |||||||||
| $ | — | $ | 20 | $ | 20 | |||||||
|
Total
segment income (loss)
|
$ | 256 | $ | 6,797 | $ | (201 | ) | |||||
|
Other
income (loss)
|
273 | 404 | (207 | ) | ||||||||
|
Other
corporate expenses (primarily corporate level interest, general and
administrative expenses)
|
(1,459 | ) | (1,237 | ) | (1,231 | ) | ||||||
|
Income
tax expense (recovery)
|
269 | 125 | (1,000 | ) | ||||||||
|
Net
income (loss) from continuing operations
|
$ | (1,199 | ) | $ | 5,839 | $ | (639 | ) | ||||
|
Segment
assets
|
$ | 8,043 | $ | 173 | $ | 193 | ||||||
|
Intangible
assets not allocated to segments
|
— | — | — | |||||||||
|
Other
assets not allocated to segments
(1)
|
3,584 | 5,270 | 1,603 | |||||||||
| $ | 11,627 | $ | 5,443 | $ | 1,796 | |||||||
|
|
(1)
|
Other
assets not allocated to segments are corporate assets such as cash,
non-trade accounts receivable, prepaid insurance, investments and deferred
income tax assets.
|
The
Company has evaluated its operations during the period subsequent to December
31, 2009. There have been no material events requiring disclosure in this
Report.
F-26
Restatement
of Interim 2009 Financial Results
The
Company’s consolidated financial statements have been restated for the three and
six months ending June 30, 2009, and the three and nine months ending September
30, 2009, to include two corrections in the application of US GAAP. These
were (i) the recognition of patent licensing revenue in the three months ended
June 30, 2009, and (ii) the proportionate consolidation of the Company’s
interests in certain Joint Ventures (as defined in Note 2).
Patent
Licensing Revenue Recognition
In June
2009, the Company entered into a patent licensing agreement with an independent
third party in Korea. In connection with this agreement, the Company
recognized the initial revenue and associated costs in the quarter ended June
30, 2009. In the quarter ended September 30, 2009 C2’s management
determined that the collectability of the revenue was doubtful, and recorded an
allowance for doubtful accounts for the full amount of the revenue, net of the
associated costs. Although C2 and the third party had negotiated the
license price and terms, and persuasive evidence of an arrangement existed in
the form of a signed contract, which constituted delivery of the license,
collectability of the associated revenue was not sufficiently
assured.
As a
consequence, patent licensing revenue was overstated by $950 for the quarter and
six months ended June 30, 2009 and the nine months ended September 30,
2009. In addition, net income and earnings per share were overstated for
the quarter ended June 30, 2009 by $365 and $0.02, respectively, and understated
by the same amounts for the quarter ended September 30, 2009. There was no
net impact on net earnings (loss) and earnings (loss) per share for the nine
months ended September 30, 2009. The summarized quarterly data below
includes the effects of this restatement.
Asset
Liquidation Investments
In March
2010, during the Company’s audit of the consolidated financial statements for
the year ended December 31, 2009, C2’s management determined that the Company
had made an error in its reporting of its investments in Joint Ventures, and the
associated revenue and costs, in the quarters ended June 30 and September 30,
2009.
Counsel
RB’s asset liquidation transactions are generally conducted through two
different formats as described below. GAAP requires that they be reported
separately in the consolidated financial statements as follows:
(1)
Revenue from transactions that Counsel RB conducts directly is reported as Asset
Liquidation revenue, and the associated direct costs are reported as Asset
Liquidation costs. At the balance sheet date, any unsold assets are
reported as Inventory, any outstanding accounts receivable are included in the
Company’s Accounts Receivable, and any associated liabilities are included in
the Company’s Accrued Liabilities. Although all inventory is expected to
be sold in less than one year, real estate inventory is not recorded as a
current asset.
(2)
Transactions that involve Counsel RB’s investment in Joint Ventures require that
they be accounted for using the equity method of accounting wherein Counsel RB’s
proportionate share of the net income (loss) be reported as Earnings (Loss) of
Equity Accounted Asset Liquidation Investments. Although all of Counsel
RB’s investments in Joint Ventures are expected to be sold in less than one
year, they are reported on the balance sheet as non-current Asset Liquidation
Investments.
In the
quarters ended June 30 and September 30, 2009, the Company recorded its
proportionate share of the revenue and costs associated with its investments in
Joint Ventures as Asset Liquidation Revenue and Asset Liquidation Costs.
At June 30 and September 30, 2009, the Company recorded its proportionate share
of the Joint Ventures as allocations to accounts receivable, inventory, other
current assets, accounts payable and accrued liabilities, and debt payable to
third parties. All inventory was recorded as a current asset. As a
consequence, asset liquidation revenue was overstated by $3,067 and $79 for the
quarters ended June 30 and September 30, 2009, respectively. There was no
impact on net earnings (loss) and earnings (loss) per share for either of these
quarters. The summarized quarterly data below includes the effects of this
restatement.
F-27
Following
is a summary of the quarterly results of operations for the years ended December
31, 2009 and 2008.
|
March 31
|
June 30
(2009 restated)
|
September 30
(2009 restated)
|
December 31
|
|||||||||||||||
|
Net
sales
|
2009
|
$ | — | $ | 35 | $ | 1,869 | $ | 4,087 | |||||||||
|
2008
|
$ | 6,225 | $ | 1,900 | $ | 9,500 | $ | — | ||||||||||
|
Gross
profit
|
2009
|
$ | (1 | ) | $ | 426 | $ | 1,012 | $ | 451 | ||||||||
|
2008
|
$ | 3,041 | $ | 592 | $ | 3,403 | $ | (140 | ) | |||||||||
|
Operating
income (loss)
|
2009
|
$ | (388 | ) | $ | (282 | ) | $ | 419 | $ | (518 | ) | ||||||
|
2008
|
$ | 2,760 | $ | 307 | $ | 3,086 | $ | (550 | ) | |||||||||
|
Net
income (loss) from continuing operations
|
2009
|
$ | (379 | ) | $ | (259 | ) | $ | 308 | $ | (869 | ) | ||||||
|
2008
|
$ | 1,795 | $ | 311 | $ | 4,015 | $ | (282 | ) | |||||||||
|
Net
income (loss)
|
2009
|
$ | (342 | ) | $ | (253 | ) | $ | 244 | $ | (913 | ) | ||||||
|
2008
|
$ | 1,795 | $ | 305 | $ | 4,012 | $ | (285 | ) | |||||||||
|
Basic
and diluted income (loss) from continuing operations
per
common share
|
2009
|
$ | (0.02 | ) | $ | (0.01 | ) | $ | 0.01 | $ | (0.04 | ) | ||||||
|
2008
|
$ | 0.08 | $ | 0.01 | $ | 0.18 | $ | (0.01 | ) | |||||||||
|
Basic
and diluted income from continuing operations per preferred
share
|
2009
|
$ | N/A | $ | N/A | $ | 0.54 | $ | N/A | |||||||||
|
2008
|
$ | 3.11 | $ | 0.54 | $ | 7.05 | $ | N/A | ||||||||||
|
Basic
and diluted income (loss) per common share
|
2009
|
$ | (0.02 | ) | $ | (0.01 | ) | $ | 0.01 | $ | (0.04 | ) | ||||||
|
2008
|
$ | 0.08 | $ | 0.01 | $ | 0.18 | $ | (0.01 | ) | |||||||||
|
Basic
and diluted income per preferred share
|
2009
|
$ | N/A | $ | N/A | $ | 0.43 | $ | N/A | |||||||||
|
2008
|
$ | 3.11 | $ | 0.54 | $ | 7.05 | $ | N/A | ||||||||||
Following
is a summary of selected balance sheet information for the years ended December
31, 2009 and 2008.
|
March 31
|
June 30
(2009 restated)
|
September 30
(2009 restated)
|
December 31
|
|||||||||||||||
|
Current
assets
|
2009
|
$ | 4,491 | $ | 3,193 | $ | 4,682 | $ | 3,327 | |||||||||
|
2008
|
$ | 805 | $ | 1,013 | $ | 6,109 | $ | 5,028 | ||||||||||
|
Total
assets
|
2009
|
$ | 4,906 | $ | 9,411 | $ | 10,515 | $ | 11,627 | |||||||||
|
2008
|
$ | 1,511 | $ | 1,842 | $ | 7,447 | $ | 5,443 | ||||||||||
|
Current
liabilities
|
2009
|
$ | 438 | $ | 4,923 | $ | 5,703 | $ | 7,673 | |||||||||
|
2008
|
$ | 634 | $ | 636 | $ | 2,211 | $ | 472 | ||||||||||
|
Total
liabilities
|
2009
|
$ | 438 | $ | 4,923 | $ | 5,703 | $ | 7,673 | |||||||||
|
2008
|
$ | 634 | $ | 636 | $ | 2,211 | $ | 472 | ||||||||||
|
Total
shareholders’ equity
|
2009
|
$ | 4,468 | $ | 4,488 | $ | 4,812 | $ | 3,954 | |||||||||
|
2008
|
$ | 877 | $ | 1,206 | $ | 5,236 | $ | 4,971 | ||||||||||
F-28
C2
GLOBAL TECHNOLOGIES INC. AND SUBSIDIARIES
SCHEDULE
OF VALUATION AND QUALIFYING ACCOUNTS
|
Description
|
Balance at
Beginning
of Period
|
Charged to
Costs and
Expenses
|
Deductions
(a)
|
Other
|
Balance at
End of
Period
|
|||||||||||||||
|
Allowance
for doubtful accounts:
|
||||||||||||||||||||
|
December
31, 2007
|
$ | 6 | $ | — | $ | — | $ | — | $ | 6 | ||||||||||
|
December
31, 2008
|
$ | 6 | $ | — | $ | — | $ | — | $ | 6 | ||||||||||
|
December
31, 2009
|
$ | 6 | $ | — | $ | — | $ | — | $ | 6 | ||||||||||
|
(a)
|
Deductions
represents allowance amounts written off as uncollectible and recoveries
of previously reserved amounts.
|
S-1
TABLE OF CONTENTS
Part IItem 1. BusinessItem 1A. Risk FactorsItem 1B. Unresolved Staff CommentsItem 2. PropertiesItem 3. Legal ProceedingsItem 4. Submission Of Matters To A Vote Of Security HoldersPart IIItem 5. Market For Registrant S Common Equity, Related Stockholder Matters and Issuer Purchases Of Equity SecuritiesItem 5. Market For Registrant S Common Equity, Related Stockholder MattersItem 6. Selected Financial DataItem 7. Management S Discussion and Analysis Of Financial Condition and Results Of OperationsItem 7. Management S Discussion and Analysis Of Financial Condition and ResultsItem 7A. Quantitative and Qualitative Disclosures About Market RiskItem 8. Financial Statements and Supplementary DataItem 9. Changes in and Disagreements with Accountants on Accounting and Financial DisclosureItem 9. Changes in and Disagreements with Accountants on Accounting andItem 9a(t). Controls and ProceduresItem 9B. Other InformationPart IIIItem 10. Directors, Executive Officers and Corporate GovernanceItem 11. Executive CompensationItem 12. Security Ownership Of Certain Beneficial Owners and Management and Related Stockholder MattersItem 12. Security Ownership Of Certain Beneficial Owners and Management andItem 13. Certain Relationships and Related Transactions, and Director IndependenceItem 14. Principal Accountant Fees and ServicesPart IVItem 15. Exhibits and Financial Statement SchedulesNote 1 Description Of Business and Principles Of ConsolidationNote 2 Counsel Rb Capital LlcNote 3 Summary Of Significant Accounting PoliciesNote 4 Earnings (loss) Per ShareNote 5 InvestmentsNote 6 Composition Of Certain Financial Statement CaptionsNote 7 DebtNote 8 Commitments and GuaranteesNote 9 Patent Participation FeeNote 10 Income TaxesNote 11 Related Party TransactionsNote 12 Legal ProceedingsNote 13 Class N Preferred StockNote 14 Stock-based CompensationNote 15 Segment ReportingNote 16 Subsequent EventsNote 17 Summarized Quarterly Data (unaudited)