HARTE HANKS INC
10-Ks and 10-Qs
|
|
|
|
|
|
|
|
|
|
|
|
|
|
|
|
|
|
|
|
|
|
|
|
|
|
|
|
|
|
|
|
|
|
|
|
|
|
|
|
|
|
|
|
|
|
|
|
|
|
|
|
|
|
|
|
|
|
|
|
|
|
UNITED STATES
SECURITIES AND EXCHANGE COMMISSION
Washington, D.C. 20549
FORM 10-K
(Mark One)
ý
ANNUAL REPORT PURSUANT TO SECTION 13 OR 15(d) OF THE
SECURITIES EXCHANGE ACT OF 1934
For the fiscal year ended
December 31, 2015
o
TRANSITION REPORT PURSUANT TO SECTION 13 OR 15(d) OF
THE SECURITIES EXCHANGE ACT OF 1934
For the transition period from to
Commission file number 001-7120
HARTE HANKS, INC.
(Exact name of registrant as specified in its charter)
|
Delaware
|
|
74-1677284
|
|
(State or other jurisdiction of
|
|
(I.R.S. Employer
|
|
incorporation or organization)
|
|
Identification No.)
|
9601 McAllister Freeway, Suite 610, San Antonio, Texas 78216
(Address of principal executive offices) (Zip Code)
Registrant’s telephone number, including area code —
210-829-9000
Securities registered pursuant to Section 12(b) of the Act:
|
Title of each class
|
|
Name of each exchange on which registered
|
||
|
Common Stock
|
|
New York Stock Exchange
|
||
Securities registered pursuant to Section 12(g) of the Act:
None
Indicate by check mark if the registrant is a well-known seasoned issuer, as defined in Rule 405 of the Securities Act. Yes
o
No
ý
Indicate by check mark whether the registrant (1) has filed all reports required to be filed by Section 13 or 15(d) of the Securities Exchange Act of 1934 during the preceding 12 months (or for such shorter period that the registrant was required to file such reports), and (2) has been subject to such filing requirements for the past 90 days. Yes
ý
No
o
Indicate by check mark if the registrant is not required to file reports pursuant to Section 13 or Section 15(d) of the Act. Yes
o
No
ý
Indicate by check mark whether the registrant has submitted electronically and posted on its corporate website, if any, every Interactive Data File required to be submitted and posted pursuant to Rule 405 of Regulation S-T (Section 232.405 of this chapter) during the preceding 12 months (or for such shorter period that the registrant was required to submit and post such files). Yes
ý
No
o
Indicate by check mark if disclosure of delinquent filers pursuant to Item 405 of Regulation S-K (229.405 of this chapter) is not contained herein, and will not be contained, to the best of registrant’s knowledge, in definitive proxy or information statements incorporated by reference in Part III of this Form 10-K or any amendment to this Form 10-K.
ý
Indicate by check mark whether the registrant is a large accelerated filer, an accelerated filer or a non-accelerated filer. See definitions of “large accelerated filer,” “accelerated filer” and “small reporting company” in Rule 12b-2 of the Exchange Act
Large accelerated filer
o
Accelerated filer
x
Non-accelerated filer
o
(Do not check if a smaller
reporting company) Smaller reporting company
o
Indicate by check mark if the registrant is a shell company (as defined in Rule 12b-2 of the Act). Yes
o
No
ý
The aggregate market value of the voting and non-voting common equity held by non-affiliates computed by reference to the closing price ($5.96) as of the last business day of the registrant’s most recently completed second fiscal quarter (
June 30, 2015
), was approximately
$288,131,575
.
The number of shares outstanding of each of the registrant’s classes of common stock as of
January 31, 2016
was
61,266,978
shares of common stock, all of one class.
Documents incorporated by reference:
Portions of the Proxy Statement to be filed for the company’s
2016
Annual Meeting of Stockholders are incorporated by reference into Part III of this Form 10-K.
THIS ANNUAL REPORT ON FORM 10-K IS BEING DISTRIBUTED TO STOCKHOLDERS IN LIEU OF A SEPARATE ANNUAL REPORT PURSUANT TO RULE 14a-3(b) OF THE ACT AND SECTION 203.01 OF THE NEW YORK STOCK EXCHANGE LISTED COMPANY MANUAL.
Harte Hanks, Inc. and Subsidiaries
Table of Contents
Form 10-K Report
December 31, 2015
|
|
Page
|
|
|
|
|
|
|
|
|
|
|
|
|
|
|
|
||
2
INTRODUCTION
Harte Hanks, Inc. (Harte Hanks) partners with clients to deliver relevant, connected, and quality customer interactions. Our approach starts with discovery and learning, which leads to customer journey mapping, creative and content development, analytics, and data management, and ends with execution and support in a variety of digital and traditional channels. We produce engaging and memorable customer interactions to drive business results for our clients, develop better customer relationships, experiences, and defining interaction-led marketing.
Virtually all organizations rely on marketing to generate revenues and publicity. Many businesses have a chief-level executive responsible for marketing who is charged with combining data, technology, channels, and resources to demonstrate a return on marketing investment. This has led many businesses to use direct and targeted marketing, which offer accountability and measurability of marketing programs, allowing customer insight to be leveraged to create and accelerate value. Harte Hanks is a leader in highly targeted, multichannel marketing.
We are the successor to a newspaper business started by Houston Harte and Bernard Hanks in Texas in the early 1920s. In 1972, Harte Hanks went public and was listed on the New York Stock Exchange (NYSE). We became private in a leveraged buyout in 1984, and in 1993 we again went public and listed our common stock on the NYSE.
We provide public access to all reports filed with the Securities and Exchange Commission (SEC) under the Securities Exchange Act of 1934, as amended (the 1934 Act). These documents may be accessed free of charge on our website at
www.HarteHanks.com
. These documents are provided as soon as practical after they are filed with the SEC and may also be found at the SEC’s website at
www.sec.gov
. Additionally, we have adopted and posted on our website a code of ethics that applies to our principal executive officer, principal financial officer and principal accounting officer. Our website also includes our corporate governance guidelines and the charters for each of our audit, compensation, and nominating and corporate governance committees. We will provide a printed copy of any of the aforementioned documents to any requesting stockholder.
OUR BUSINESS
During 2014, we initiated a new strategy and revised our operational structure to suit that new strategy by organizing into two distinct operating divisions: Customer Interaction and Trillium Software. In accordance with ASC 280,
Segment Reporting,
we determined that under this new organizational structure, we will report the two operating divisions as two reportable segments — Customer Interaction and Trillium Software. Our reportable segments are described below.
Customer Interaction
Our Customer Interaction services offer a wide variety of integrated, multi-channel, data-driven solutions for top brands around the globe. We help our clients gain insight into their customers’ behaviors from their data and use that insight to create innovative multi-channel marketing programs to deliver a return on marketing investment. We believe our clients’ success is determined not only by how good their tools are, but how well we help them use the tools to gain insight and analyze their consumers. This results in a strong and enduring relationship between our clients and their customers which is key to being leaders in Customer Interaction. We offer a full complement of capabilities and resources to provide a broad range of marketing services, in media from direct mail to email, including:
|
•
|
Agency & Digital Services.
Our agency services are full-service, customer engagement agencies specializing in direct and digital communications for both consumer and business-to-business markets. With strategy, creative, and implementation services, we help marketers within targeted industries understand, identify, and engage prospects and customers in their channel of choice. Our digital solutions integrate online services within the marketing mix and include: search engine management, display, digital analytics, website development and design, digital strategy, social media, email, e-commerce, and interactive relationship management and a host of other services that support our core businesses.
|
3
|
•
|
Database Marketing Solutions and Business-to-Business Lead Generation.
We have successfully delivered marketing database solutions across various industries. Our solutions are built around centralized marketing databases with three core offerings: insight and analytics; customer data integration; and marketing communications tools. Our solutions enable organizations to build and manage customer communication strategies that drive new customer acquisition and retention and maximize the value of existing customer relationships. Through insight, we help clients identify models of their most profitable customer relationships and then apply these models to increase the value of existing customers while also winning profitable new customers. Through customer data integration, data from multiple sources comes together to provide a single customer view of client prospects and customers. Then we help clients apply their data and insights to the entire customer life cycle, to help clients sustain and grow their business, gain deeper customer insights, and continuously refine their customer resource management strategies and tactics.
|
|
•
|
Direct Mail.
As a full-service direct marketing provider and one of the largest mailing partners of the U.S. Postal Service (USPS), our operational mandate is to ensure creativity and quality, provide an understanding of the options available in technologies and segmentation strategies and capitalize on economies of scale with our variety of execution options. Our services include: digital printing, print on demand, advanced mail optimization, logistics and transportation optimization, tracking (including our proprietary prEtrak solution), commingling, shrink wrapping, and specialized mailings. We also maintain fulfillment centers where we provide custom kitting services, print on demand, product recalls, and freight optimization allowing our customers to distribute literature and other marketing materials.
|
|
•
|
Contact Centers.
We operate teleservice workstations around the globe providing advanced contact center solutions such as: speech, voice and video chat, integrated voice response, analytics, social cloud monitoring, and web self-service. We provide both inbound and outbound contact center services and support many languages with our strategically placed global locations for both consumer and business-to-business markets.
|
Many of our client relationships start with an offering from the list above on an individual solution basis or a combination of our offerings from across our portfolio of businesses.
Trillium Software
Trillium Software is a leading global enterprise data quality solutions provider. Our data quality specialists help organizations achieve increased business from their data management initiatives and existing business-critical processes by providing enterprise data profiling and data cleansing software and services. We offer industry-specific business solutions that help solve data problems experienced by financial services, banking, retail, healthcare, manufacturing, and risk professionals. Our full complement of technologies and services includes global data profiling, data cleansing, enrichment, and data linking for e-business, Big Data customer relationship management, data governance, enterprise resource planning, supply chain management, data warehouse, and other enterprise applications. Revenues from the Trillium Software segment are comprised primarily of perpetual software licenses, annual maintenance and professional services.
In
2015
,
2014
, and
2013
, Harte Hanks had revenues from continuing operations of
$495.3 million
,
$553.7 million
, and
$559.6 million
, respectively. Customer Interaction had revenues from continuing operations of
$444.2 million
,
$499.4 million
, and
$503.8 million
, respectively. Trillium Software had revenues from continuing operations of
$51.1 million
,
$54.2 million
, and
$55.8 million
, respectively.
Customers
Our services are marketed to specific industries or markets with services and software products tailored to each industry or market. We believe that we are generally able to provide services to new industries and markets by modifying our existing services and applications. We currently provide services primarily to the retail, technology, financial services, automotive and consumer brands, and pharmaceutical/healthcare vertical markets, in addition to a range of select markets. The largest client (measured in revenue) comprised
6%
of total revenues in
2015
. The largest 25 clients in terms of revenue comprised
57%
of total revenues in
2015
.
4
Sales and Marketing
Our Customer Interaction enterprise sales force sells a variety of solutions and services to address client’s targeted marketing needs. We maintain solution-specific sales forces and sales groups to sell our individual products and solutions. Our direct sales forces, with industry-specific knowledge and experience, emphasize the cross-selling of a full range of Customer Interaction direct marketing services and are supported by employees in each sector assigned to specific clients with industry specific expertise. We rely on our enterprise and solution sellers to primarily sell our products and services to new clients and task our employees supporting existing clients to expand our client relationship through additional solutions and products.
Trillium Software is marketed and sold world-wide through direct, reseller, and Original Equipment Manufacturers (OEMs) channels. Our primary sales channel is our direct sales force in North America, Europe, and Australia. Resellers covering over 40 countries serve to provide even wider coverage where we lack a direct sales presence. The Trillium Software System can also be obtained through a network of OEMs and integration partners. Our product is also available directly from our website in a cloud deployment method.
Facilities
Our services are provided at the following facilities, all of which are leased:
|
Domestic Offices
|
|
|
Austin, Texas
|
Maitland, Florida
|
|
Baltimore, Maryland
|
New York, New York
|
|
Burlington, Massachusetts
|
Oakland, California
|
|
Burlington, Vermont
|
San Antonio, Texas
|
|
Chicago, Illinois
|
San Diego, California
|
|
Deerfield Beach, Florida
|
San Francisco, California
|
|
East Bridgewater, Massachusetts
|
San Mateo, California
|
|
Fullerton, California
|
Shawnee, Kansas
|
|
Grand Prairie, Texas
|
Trevose, Pennsylvania
|
|
Jacksonville, Florida
|
Texarkana, Texas
|
|
Langhorne, Pennsylvania
|
Wilkes-Barre, Pennsylvania
|
|
|
|
|
International Offices
|
|
|
Böblingen, Germany
|
Manila, Philippines
|
|
Bristol, United Kingdom
|
Reading, United Kingdom
|
|
Hasselt, Belgium
|
Uxbridge, United Kingdom
|
Competition
Our business faces significant competition in all of its offerings and within each of its vertical markets. Direct marketing is a dynamic business, subject to rapid technological change, high turnover of client personnel who make buying decisions, client consolidations, changing client needs and preferences, continual development of competing products and services, and an evolving competitive landscape. Our competition comes from numerous local, national, and international direct marketing and advertising companies, and client internal resources, against whom we compete for individual projects, entire client relationships, and marketing expenditures. Competitive factors in our industry include the quality and scope of services, technical and strategic expertise, the perceived value of the services provided, reputation, and brand recognition. We also compete against print and electronic media and other forms of advertising for marketing and advertising dollars in general. Failure to continually improve our current processes, advance and upgrade our technology applications, and to develop new products and services in a timely and cost-effective manner, could result in the loss of our clients or prospective clients to current or future competitors. In addition, failure to gain market acceptance of new products and services could adversely affect our growth. Although we believe that our capabilities and breadth of services, combined with our U.S and international production capability, industry focus, and ability to offer a broad range of integrated services, enable us to compete effectively, our business results may be adversely impacted by competition. Please refer to Item 1A, “Risk Factors”, for additional information regarding risks related to competition.
5
Trillium Software likewise faces widely varied competitors, but the most frequent competition is a potential client’s own information technology staff, who may design and produce customized information quality solutions rather than seeking more robust, specialized, or scalable capabilities or software. Trillium Software also competes against large market makers (such as IBM, Oracle, and SAP) whose product offering are greater in breadth, if less capable in information quality alone. We also compete against about 40 niche providers of information quality software and services, whose sales focus is usually geared toward narrower markets.
Seasonality
Our revenues tend to be higher in the fourth quarter than in other quarters during a given year. This increased revenue is a result of overall increased marketing activity prior to and during the holiday season, primarily related to our retail vertical.
Discontinued Operations
Previously, Harte Hanks also provided shopper advertising opportunities through our Shoppers segment, which operated in certain California markets. On September 27, 2013 we sold the assets of our California Shoppers operations, The Pennysaver, for gross proceeds of $22.5 million. This transaction resulted in an after-tax loss of $12.4 million. Because Shoppers represented a distinct business unit with operations and cash flows that can clearly be distinguished, both operationally and for financial purposes, from the rest of Harte Hanks, the results of the Shoppers operations are reported as discontinued operations for all periods presented. Results of the remaining Harte Hanks business are reported as continuing operations. After this sale, Harte Hanks no longer has any Shoppers operations or circulation.
GOVERNMENT REGULATION
As a company conducting varied business activities for clients across diverse industries around the world, we are subject to a variety of domestic and international legal and regulatory requirements that impact our business, including, for example, regulations governing consumer protection, and unfair business practices, contracts, e-commerce, intellectual property, labor, and employment (especially wage and hour laws), securities, tax, and other laws that are generally applicable to commercial activities.
We are also subject to, or affected by, numerous local, national, and international laws, regulations, and industry standards that regulate direct marketing activities, including those that address privacy, data security, and unsolicited marketing communications. Examples of some of these laws and regulations that may be applied to, or affect, our business or the businesses of our clients include the following:
|
•
|
Federal and state laws governing the use of the internet and regulating telemarketing, including the U.S. Controlling the Assault of Non-Solicited Pornography and Marketing Act of 2003 (CAN-SPAM), which regulates commercial email and requires that commercial emails give recipients an opt-out method. Canada’s Anti-Spam Legislation (CASL) applies in a comparable manner for our activities in Canada. Telemarketing activities are regulated by, among other requirements, the Federal Trade Commission’s Telemarketing Sales Rule (TSR), the Federal Communications Commission’s Telephone Consumer Protection Act (TCPA), and various state do-not-call laws.
|
|
•
|
Federal and state laws governing the collection and use of personal data online and via mobile devices, including but not limited to the Federal Trade Commission Act and the Children's Online Privacy Protection Act, which seek to address consumer privacy and protection.
|
|
•
|
The U.S. Department of Commerce’s proposed Privacy Shield Framework, the Federal Trade Commission’s Protecting Consumer Privacy in an Era of Rapid Change policy, and the European Commission’s newly announced European General Data Protection Regulation (GDPR), each of which seeks to address consumer privacy, data protection, and technological advancements in relation to the collection or use of personal information.
|
6
|
•
|
A significant number of states in the U.S. have passed versions of data security or breach notification laws, which include required standards for data security and generally require timely notifications to affected persons in the event of data security breaches or other unauthorized access to certain types of protected personal data. With the increased attention security breaches have received, federal legislation may also be adopted and impose additional obligations.
|
|
•
|
The Fair Credit Reporting Act (FCRA), which governs, among other things, the sharing of consumer report information, access to credit scores, and requirements for users of consumer report information.
|
|
•
|
The Financial Services Modernization Act of 1999, or Gramm-Leach-Bliley Act (GLB), which, among other things, regulates the use for marketing purposes of non-public personal financial information of consumers that is held by financial institutions. Although Harte Hanks is not considered a financial institution, many of our clients are subject to the GLB. The GLB also includes rules relating to the physical, administrative, and technological protection of non-public personal financial information.
|
|
•
|
The Health Insurance Portability and Accountability Act of 1996 (HIPAA), which regulates the use of protected health information for marketing purposes and requires reasonable safeguards designed to prevent intentional or unintentional use or disclosure of protected health information.
|
|
•
|
The Fair and Accurate Credit Transactions Act of 2003 (FACT Act), which amended the FCRA and requires, among other things, consumer credit report notice requirements for creditors that use consumer credit report information in connection with risk-based credit pricing actions and also prohibits a business that receives consumer information from an affiliate from using that information for marketing purposes unless the consumer is first provided a notice and an opportunity to direct the business not to use the information for such marketing purposes, subject to certain exceptions.
|
|
•
|
The European Union (EU) data protection laws, including the comprehensive EU Directive on Data Protection (1995) (EU Directive), and the GDPR (which will replace the EU Directive once implemented), which imposes a number of obligations with respect to use of personal data, and includes a prohibition on the transfer of personal information from the EU to other countries that do not provide consumers with an “adequate” level of privacy or security. The EU standard for adequacy is generally stricter and more comprehensive than that of the U.S. and most other countries.
|
There are additional consumer protection, privacy and data security regulations in locations where we or our clients do business. These laws regulate the collection, use, disclosure, and retention of personal data and may require consent from consumers and grant consumers other rights, such as the ability to access their personal data and to correct information in the possession of data controllers. We and many of our clients also belong to trade associations that impose guidelines that regulate direct marketing activities, such as the Direct Marketing Association’s Commitment to Consumer Choice.
As a result of increasing public awareness and interest in individual privacy rights, data protection, information security, and environmental and other concerns regarding marketing communications, federal, state, and foreign governmental and industry organizations continue to consider new legislative and regulatory proposals that would impose additional restrictions on direct marketing services and products. Examples include data encryption standards, data breach notification requirements, consumer choice and consent restrictions, and increased penalties against offending parties, among others. In 2012 and 2013, several members of the U.S. Congress (in coordination with the Federal Trade Commission and consumer advocacy groups) initiated several inquiries regarding data brokerage, one of which was directed to us (among others). We anticipate that further inquiries and legislative proposals will be made which may affect the services we offer our clients.
In addition, our business may be affected by the impact of these restrictions on our clients and their marketing activities. These additional regulations could increase compliance requirements and restrict or prevent the collection, management, aggregation, transfer, use, or dissemination of information or data that is currently legally available. Additional regulations may also restrict or prevent current practices regarding unsolicited marketing communications. For example, many states have considered implementing do-not-mail legislation that could impact our business and the businesses of our clients and customers. In addition, continued public interest in individual privacy rights and data security may result in the adoption of further voluntary industry guidelines that could impact our direct marketing activities and business practices.
7
We cannot predict the scope of any new legislation, regulations, or industry guidelines or how courts may interpret existing and new laws. Additionally, enforcement priorities by governmental authorities may change and also impact our business either directly or through requiring our customers to alter their practices. Compliance with regulations is costly and time-consuming for us and our clients, and we may encounter difficulties, delays, or significant expenses in connection with our compliance. We may also be exposed to significant penalties, liabilities, reputational harm, and loss of business in the event that we fail to comply with applicable regulations. There could be a material adverse impact on our business due to the enactment or enforcement of legislation or industry regulations, the issuance of judicial or governmental interpretations, enforcement priorities of governmental agencies, or a change in customs arising from public concern over consumer privacy and data security issues.
INTELLECTUAL PROPERTY RIGHTS
Our intellectual property assets include trademarks and service marks that identify our company and our products and services, know-how, software, and other technology that we develop for our internal use and for license to clients and data and intellectual property licensed from third parties, such as commercial software and data providers. We generally seek to protect our intellectual property through a combination of license agreements and trademark, service mark, copyright, patent and trade secret laws, and domain name registrations and enforcement procedures. We also enter into confidentiality agreements with many of our employees, vendors, and clients and seek to limit access to and distribution of intellectual property and other proprietary information. We pursue the protection of our trademarks and other intellectual property in the U.S. and internationally.
Despite our efforts to protect our intellectual property, unauthorized parties may attempt to copy or otherwise obtain and use our proprietary information and technology. Monitoring unauthorized use of our intellectual property is difficult, and unauthorized use of our intellectual property may occur. We cannot be certain that patents or trademark registrations will be issued, nor can we be certain that any issued patents or trademark registrations will give us adequate protection from competing products. For example, issued patents may be circumvented or challenged and declared invalid or unenforceable. In addition, others may develop competing technologies or databases on their own. Moreover, there is no assurance that our confidentiality agreements with our employees or third parties will be sufficient to protect our intellectual property and proprietary information.
We may also be subject to infringement claims against us by third parties and may incur substantial costs and devote significant management resources in responding to such claims, as we did in 2013. We have been, and continue to be, obligated under some agreements to indemnify our clients as a result of claims that we infringe on the proprietary rights of third parties. These costs and distractions could cause our business to suffer. If any party asserts an infringement claim, we may need to obtain licenses to the disputed intellectual property. We cannot assure you, however, that we will be able to obtain these licenses on commercially reasonable terms or that we will be able to obtain any licenses at all. The failure to obtain necessary licenses or other rights may have an adverse affect on our ability to provide our products and services.
EMPLOYEES
As of
December 31, 2015
, Harte Hanks employed
5,529
full-time employees and
44
part-time employees, of which approximately
2,333
are based outside of the U.S., primarily in the Philippines. A portion of our workforce is provided to us through staffing companies. None of the workforce is represented by labor unions. We consider our relations with our employees to be good.
Cautionary Note Regarding Forward-Looking Statements
This report, including the Management’s Discussion and Analysis of Financial Condition and Results of Operations (MD&A), contains “forward-looking statements” within the meaning of the federal securities laws. All such statements are qualified by this cautionary note, which is provided pursuant to the safe harbor provisions of Section 27A of the Securities Act of 1933 (1933 Act) and Section 21E of the Securities Exchange Act of 1934 (1934 Act). Forward-looking statements may also be included in our other public filings, press releases, our website and oral and written presentations by management. Statements other than historical facts are forward-looking and may be identified by words such as “may,” “will,” “expects,” “believes,” “anticipates,” “plans,” “estimates,” “seeks,” “could,” “intends,” or words of similar meaning. Examples include statements regarding (1) our strategies and initiatives, (2) adjustments to our cost structure and other actions designed to respond to market conditions and improve our performance, and the anticipated
8
effectiveness and expenses associated with these actions, (3) our financial outlook for revenues, earnings per share, operating income, expense related to equity-based compensation, capital resources and other financial items, (4) expectations for our businesses and for the industries in which we operate, including the impact of economic conditions of the markets we serve on the marketing expenditures and activities of our clients and prospects, (5) competitive factors, (6) acquisition and development plans, (7) our stock repurchase program, (8) expectations regarding legal proceedings and other contingent liabilities, and (9) other statements regarding future events, conditions or outcomes.
These forward-looking statements are based on current information, expectations, and estimates and involve risks, uncertainties, assumptions, and other factors that are difficult to predict and that could cause actual results to vary materially from what is expressed in or indicated by the forward-looking statements. In that event, our business, financial condition, results of operations, or liquidity could be materially adversely affected, and investors in our securities could lose part or all of their investments. Some of these risks, uncertainties, assumptions, and other factors can be found in our filings with the SEC, including the factors discussed below in this Item 1A, “Risk Factors”, and any updates thereto in our Forms 10-Q. The forward-looking statements included in this report and those included in our other public filings, press releases, our website, and oral and written presentations by management are made only as of the respective dates thereof, and we undertake no obligation to update publicly any forward-looking statement in this report or in other documents, our website, or oral statements for any reason, even if new information becomes available or other events occur in the future.
In addition to the information set forth elsewhere in this report, including in the MD&A section, the factors described below should be considered carefully in making any investment decisions with respect to our securities. The risks described below are not the only ones we face or may face in the future. Additional risks and uncertainties that are not presently anticipated or that we may currently believe are immaterial could also impair our business operations and financial performance.
We have developed a new strategy, and the future success of our company will depend on its successful execution.
In 2014, we developed and announced our new strategy, and began executing against it. Capital constraints may limit our ability to pursue all elements of our strategy, and may force us to modify this strategy and its objectives. Our strategy will bring additional risks to the business (such as those associated with greater use of capital, development and acquisition of new products, and elimination of certain services and product lines) or magnify existing risks as our business priorities and objectives are adjusted. If our strategy is flawed, or if we fail to execute it well, our business and financial performance may be materially and adversely affected.
If our new leaders are unsuccessful, or if we lose key management and are unable to attract and retain the talent required for our business, our operating results could suffer.
In the past three years, we replaced many of our leaders, including our Chief Executive Officer (twice) and Chairman, and significantly reorganized our operational structures. If our new leaders fail in their new roles and responsibilities (and more generally if we are unable to attract new leaders with the necessary skills to manage our business) our business and its operating results may suffer. Further, our prospects depend in large part upon our ability to attract, train, and retain experienced technical, client services, sales, consulting, research and development, marketing, administrative, and management personnel. While the demand for personnel is dependent on employment levels, competitive factors, and general economic conditions, our recent business performance may diminish our attractiveness as an employer. The loss or prolonged absence of the services of these individuals could have a material adverse effect on our business, financial position, or operating results
.
9
Most of our client engagements are cancelable on short notice.
The marketing services we offer, and in particular for direct mail and contact center services, are generally terminable upon short notice by our clients, even if the term of the agreement (and the expected duration of services) is several or many years. Many of our customer agreements do not have minimum volume or revenue requirements, so clients may (and do) vary their actual orders from us over time based on their own business needs, their satisfaction with the quality and pricing of our services, and a variety of other competitive factors. In addition, the timing of particular jobs or types of jobs at particular times of year (such as mail programs supporting the holiday shopping season, or contact center programs supporting a specific event) may cause significant fluctuations in the operating results of our operations in any given quarter. We depend to some extent on sales to certain industries, such as the financial services, technology, and consumer retail. To the extent these industries experience downturns, the results of our operations may be adversely affected.
A large portion of our revenue is generated from a limited number of clients, and the loss of significant work from one or more of our clients could adversely affect our business.
Our ten largest clients collectively represented 38% of our revenues for 2015. These clients are concentrated in the consumer retail and technology industries, which are experiencing uneven economic performance. While we typically have multiple projects with our largest customers which would not all terminate at the same time, the loss of one or more of the projects or contracts with one of our largest clients could adversely affect our business, results of operations, and financial condition if the lost revenues were not replaced with profitable revenues from that client or other clients.
We face significant competition for individual projects, entire client relationships and advertising dollars in general.
Our Customer Interaction business faces significant competition in all of its offerings and within each of its vertical markets. Direct marketing is a dynamic business, subject to rapid technological change, high turnover of client personnel who make buying decisions, client consolidations, changing client needs and preferences, continual development of competing products and services, and an evolving competitive landscape. This competition comes from numerous local, national, and international direct marketing and advertising companies, and client internal resources, against whom we compete for individual projects, entire client relationships, and marketing expenditures by clients and prospective clients. We also compete against print and electronic media and other forms of advertising for marketing and advertising dollars in general. In addition, our ability to attract new clients and to retain existing clients may, in some cases, be limited by clients’ policies on or perceptions of conflicts of interest. These policies can prevent us from performing similar services for competing products or companies. Some of our clients have also sought to reduce the number of marketing vendors or use third-party procurement organizations, all of which increases pricing pressure, and may disadvantage us relative to our competitors. Our failure to improve our current processes or to develop new products and services could result in the loss of our clients to current or future competitors. In addition, failure to gain market acceptance of new products and services could adversely affect our growth.
Trillium Software faces widely varied competitors, many of whom have greater development resources, and market access. In addition, because Trillium Software offers specialized information quality solutions, competitors who offer a broad array of technology solutions — such as market makers and system integrators — have advantages for many potential clients, including a greater ability to bundle unrelated products to achieve a better price. Trillium Software also competes against niche providers of information quality software and services, so that despite our relative specialization on information quality solutions, some potential clients may nevertheless seek or prefer an even more-specific solution. If Trillium Software is unable to overcome these competitive disadvantages, it will adversely affect the company’s growth and financial performance.
10
Current and future competitors may have significantly greater financial and other resources than we do, and they may sell competing products and services at lower prices or at lower profit margins, resulting in pressures on our prices and margins.
The sizes of our competitors vary widely across market and service segments. Therefore, some of our competitors may have significantly greater financial, technical, marketing, or other resources than we do in any one or more of our market segments, or overall. As a result, our competitors may be in a position to respond more quickly than we can to new or emerging technologies, methodologies, and changes in customer requirements, or may devote greater resources than we can to the development, promotion, sale, and support of products and services. Moreover, new competitors or alliances among our competitors may emerge and potentially reduce our market share, revenue, or margins. Some of our competitors also may choose to sell products or services competitive to ours at lower prices by accepting lower margins and profitability, or may be able to sell products or services competitive to ours at lower prices given proprietary ownership of data, technical superiority, a broader or deeper product or experience set, or economies of scale. Price reductions or pricing pressure by our competitors could negatively impact our margins and results of operations, and could also harm our ability to obtain new customers on favorable terms. Competitive pricing pressures tend to increase in difficult or uncertain economic environments, due to reduced marketing expenditures of many of our clients and prospects, and the resulting impact on the competitive business environment for marketing service providers such as our company.
We must maintain technological competitiveness, continually improve our processes and develop and introduce new products and services in a timely and cost-effective manner.
We believe that our success depends on, among other things, maintaining technological competitiveness in our products, processing functionality, and software systems and services. Technology changes rapidly as makers of computer hardware, network systems, programming tools, computer and data architectures, operating systems, database technology, and mobile devices continually improve their offerings. Advances in information technology may result in changing client preferences for products and product delivery channels in our industry. The increasingly sophisticated requirements of our clients require us to continually improve our processes and provide new products and services in a timely and cost-effective manner (whether through development, license or acquisition). In particular, our Trillium Software business faces continuous pressure to update offerings to deliver the latest features and capabilities while maintaining accessibility on a wide variety of platforms. Our direct mail operations are also increasingly pressured by larger-scale competitors who are adopting technologies allowing them to more effectively customize mailed marketing materials. We may be unable to successfully identify, develop, and bring new and enhanced services and products to market in a timely and cost-effective manner, such services and products may not be commercially successful, and services, products, and technologies developed by others may render our services and products noncompetitive or obsolete.
Our success depends on our ability to consistently and effectively deliver our products and services to our clients
.
Our success depends on our ability to effectively and consistently staff and execute client engagements within the agreed upon time frame and budget. Depending on the needs of our clients, our engagements may require customization, integration, and coordination of a number of complex product and service offerings and execution across many facilities in our network. Moreover, in some of our engagements, we rely on subcontractors and other third parties to provide some of the services to our clients, and we cannot guarantee that these third parties will effectively deliver their services or that we will have adequate recourse against these third parties in the event they fail to effectively deliver their services. Other contingencies and events outside of our control may also impact our ability to provide our products and services. Our failure to effectively and timely staff, coordinate and execute our client engagements may adversely impact existing client relationships, the amount or timing of payments from our clients, our reputation in the marketplace and ability to secure additional business and our resulting financial performance. In addition, our contractual arrangements with our clients and other customers may not provide us with sufficient protections against claims for lost profits or other claims for damages.
11
Significant system disruptions, loss of data center capacity or interruption of telecommunication links could adversely affect our business and results of operations.
Our business is heavily dependent upon our ability to create, access, manipulate, and maintain large and complex databases. We operate several data centers to support our needs in this regard, as well as those of some of our clients. Our ability to protect our data centers against damage or interruption from fire, flood, tornadoes, power loss, telecommunications, or equipment failure or other disasters and events beyond our control is critical to our continued success. Our services are very dependent on links to telecommunication providers. We believe we have taken reasonable precautions to protect our data centers and telecommunication links from events that could interrupt our operations. Any damage to our data centers or any failure of our telecommunications links that causes loss of data center capacity or otherwise causes interruptions in our operations, however, could materially adversely affect our ability to quickly and effectively respond to our clients’ requirements, which could result in loss of their confidence, adversely impact our ability to attract new clients and force us to expend significant company resources to repair the damage. Such events could result in decreased revenues, net income, and earnings per share.
If we do not prevent security breaches and other interruptions to our infrastructure, we may be exposed to lawsuits, lose customers, suffer harm to our reputation, and incur additional costs.
The services we offer involve the transmission of large amounts of sensitive and proprietary information over public communications networks, as well as the processing and storage of confidential customer information. Unauthorized access, remnant data exposure, computer viruses, denial of service attacks, accidents, employee error or malfeasance, “social engineering” and “phishing” attacks, intentional misconduct by computer “hackers” and other disruptions can occur, and infrastructure gaps, hardware and software vulnerabilities, inadequate or missing security controls and exposed or unprotected customer data can exist that (i) interfere with the delivery of services to our customers, (ii) impede our customers' ability to do business, or (iii) compromise the security of systems and data, which exposes information to unauthorized third parties. We are a constant target of cyber attacks of varying degrees on a regular basis. Although we maintain insurance which may respond to cover some types of damages incurred by damage to, breaches of, or problems with, our information and telecommunications systems, such insurance is limited and expensive, and may not respond or be sufficient to offset the costs of such damages, and therefore such damages may materially harm our business.
We have recently experienced, and may experience in the future, reduced demand for our products and services because of general economic conditions, the financial conditions and marketing budgets of our clients and other factors that may impact the industry verticals that we serve.
Economic downturns and turmoil severely affect the marketing services industry. Throughout the most recent recession, as in prior economic downturns, our customers responded to weak economic conditions by reducing their marketing and software budgets, which are generally discretionary in nature and easier to reduce in the short-term than other expenses. Many of our customers have been slow to restore their marketing and software budgets to prior levels during a recovery, and may respond similarly to adverse economic conditions in the future. Our revenues are dependent on national, regional, and international economies and business conditions. A lasting economic recession or anemic recovery in the markets in which we operate (such as the recent recession and recovery) could have material adverse effects on our business, financial position, or operating results. Similarly, industry or company-specific factors may negatively impact our clients and prospective clients or their industries, and in turn result in reduced demand for our products and services, client insolvencies, collection difficulties or bankruptcy preference actions related to payments received from our clients. We may also experience reduced demand as a result of consolidation of clients and prospective clients in the industry verticals that we serve. See “Management’s Discussion and Analysis of Financial Condition and Results of Operations” in this Form 10-K for additional information about the adverse impact on our financial performance of the ongoing difficult economic environment in the U.S. and other economies.
We must effectively manage our costs to be successful. If we do not achieve our cost management objectives, our financial results could be adversely affected.
Our business plan and expectations for the future require that we effectively manage our cost structure, including our operating expenses and capital expenditures across our operations. To the extent that we do not accurately anticipate and effectively manage our costs, our financial results may be adversely affected in any economic climate and even more so during a prolonged recession, such as the recent economic downturn in the U.S. and elsewhere.
12
Privacy, information security and other regulatory requirements may prevent or impair our ability to offer our products and services.
We are subject to and affected by numerous laws, regulations, and industry standards that regulate direct marketing activities, including those that address privacy, data protection, information security, and marketing communications. Please refer to the section above entitled “Government Regulation” for additional information regarding some of these regulations.
As a result of increasing public awareness and interest in privacy rights, data protection and access, information security, environmental protection, and other concerns, national and local governments and industry organizations regularly consider and adopt new laws, rules, regulations, and guidelines that restrict or regulate marketing communications, services, and products. Examples include data encryption standards, data breach notification requirements, registration/licensing requirements (often with fees), consumer choice, notice, and consent restrictions and penalties for infractions, among others. We anticipate that additional restrictions and regulations will continue to be proposed and adopted in the future.
Our business may also be affected by the impact of these restrictions and regulations on our clients and their marketing activities. In addition, as we acquire new capabilities and deploy new technologies to execute our strategy, we may be exposed to additional types or layers of regulation. Current and future restrictions and regulations could increase compliance requirements and costs, and restrict or prevent the collection, management, aggregation, transfer, use or dissemination of information, or change the requirements therefore so as to require other changes to our business or that of our clients. Additional restrictions and regulations may limit or prohibit current practices regarding marketing communications and information quality solutions. For example, many states and countries have considered implementing do not contact legislation that could impact our business and the businesses of our clients and customers. In addition, continued public interest in privacy rights, data protection and access, and information security may result in the adoption of further industry guidelines that could impact our direct marketing activities and business practices.
We cannot predict the scope of any new laws, rules, regulation, or industry guidelines or how courts or agencies may interpret current ones. Additionally, enforcement priorities by governmental authorities will change over time, which may impact our business. Understanding the laws, rules, regulations, and guidelines applicable to specific client multichannel engagements and across many jurisdictions poses a significant challenge, as such laws, rules, regulations, and guidelines are often inconsistent or conflicting, and are sometimes at odds with client objectives. Our failure to properly comply with these regulatory requirements and client needs may materially and adversely affect our business. General compliance with privacy, data protection, and information security obligations is costly and time-consuming, and we may encounter difficulties, delays, or significant expenses in connection with our compliance, or because of our clients’ need to comply. We may be exposed to significant penalties, liabilities, reputational harm, and loss of business in the event that we fail to comply. We could suffer a material adverse impact on our business due to the enactment or enforcement of legislation or industry regulations affecting us and/or our clients, the issuance of judicial or governmental interpretations, changed enforcement priorities of governmental agencies, or a change in behavior arising from public concern over privacy, data protection, and information security issues.
Consumer perceptions regarding the privacy and security of their data may prevent or impair our ability to offer our products and services.
Various local, national, and international regulations, as well as industry standards, give consumers varying degrees of control as to how certain data regarding them is collected, used, and shared for marketing purposes. If, due to privacy, security, or other concerns, consumers exercise their ability to prevent or limit such data collection, use, or sharing, it may impair our ability to provide marketing to those consumers and limit our clients’ demand for our services. Additionally, privacy and security concerns may limit consumers’ willingness to voluntarily provide data to our customers or marketing companies. Some of our services depend on voluntarily provided data and therefore may be impaired without such data.
13
Our reputation and business results may be adversely impacted if we, or subcontractors upon whom we rely, do not effectively protect sensitive personal information of our clients and our clients’ customers.
Current privacy and data security laws and industry standards impact the manner in which we capture, handle, analyze, and disseminate customer and prospect data as part of our client engagements. In many instances, our client contracts also mandate privacy and security practices. If we fail to effectively protect and control sensitive personal information (such as personal health information, social security numbers, or credit card numbers) of our clients and their customers or prospects in accordance with these requirements, we may incur significant expense, suffer reputational harm, and loss of business, and, in certain cases, be subjected to regulatory or governmental sanctions or litigation. These risks may be increased due to our reliance on subcontractors and other third parties in providing a portion of our overall services in certain engagements. We cannot guarantee that these third parties will effectively protect and handle sensitive personal information or other confidential information, or that we will have adequate recourse against these third parties in that event.
We could fail to adequately protect our intellectual property rights and may face claims for intellectual property infringement.
Our ability to compete effectively depends in part on the protection of our technology, products, services, and brands through intellectual property right protections, including patents, copyrights, database rights, trade secrets, trademarks and domain name registrations, and enforcement procedures. The extent to which such rights can be protected and enforced varies by jurisdiction, and capabilities we procure through acquisitions may have less protection than would be desirable for the use or scale we intend or need. Litigation involving patents and other intellectual property rights has become far more common and expensive in recent years, and we face the risk of additional litigation relating to our use or future use of intellectual property rights of third parties. Third-party infringement claims and any related litigation against us could subject us to liability for damages, significantly increase our costs, restrict us from using and providing our technologies, products or services or operating our business generally, or require changes to be made to our technologies, products, and services. Please refer to the section above entitled “Intellectual Property Rights” for additional information regarding our intellectual property and associated risks.
Breaches of security, or the perception that e-commerce is not secure, could severely harm our business and reputation.
Business-to-business and business-to-consumer electronic commerce requires the secure transmission of confidential information over public networks. Some of our products and services are accessed through or are otherwise dependent on the internet. Security breaches in connection with the delivery of our products and services, or well-publicized security breaches that may affect us or our industry (such as database intrusion) could be severely detrimental to our business, operating results, and financial condition. We cannot be certain that advances in criminal capabilities, new discoveries in the field of cryptography, or other developments will not compromise or breach the technology protecting the information systems that deliver our products, services and proprietary database information.
Data
suppliers could withdraw data that we rely on for our products and services.
We purchase or license much of the data we use for ourselves and for our clients. There could be a material adverse impact on our business if owners of the data we use were to withdraw or curtail access to the data or materially restrict the authorized uses of their data. Data providers could withdraw their data if there is a competitive reason to do so, if there is pressure from the consumer community or if additional regulations are adopted restricting the use of the data. We also rely upon data from other external sources to maintain our proprietary and non-proprietary databases, including data received from customers and various government and public record sources. If a substantial number of data providers or other key data sources were to withdraw or restrict their data, if we were to lose access to data due to government regulation, or if the collection of data becomes uneconomical, our ability to provide products and services to our clients could be materially and adversely affected, which could result in decreased revenues, net income, and earnings per share.
14
We must successfully identify and evaluate acquisition targets and integrate acquisitions.
We frequently evaluate acquisition opportunities to expand our product and service offerings and geographic locations, including potential international acquisitions. Acquisition activities, even if not consummated, require substantial amounts of management time and can distract from normal operations. In addition, we have in the past and may in the future be unable to achieve the profitability goals, synergies and other objectives initially sought in acquisitions, and any acquired assets, data or businesses may not be successfully integrated into our operations. Acquisitions may result in the impairment of relationships with employees and customers. Moreover, although we review and analyze assets or companies we acquire, such reviews are subject to uncertainties and may not reveal all potential risks, and we may incur unanticipated liabilities and expenses as a result of our acquisition activities. The failure to identify appropriate candidates, to negotiate favorable terms, or to successfully integrate future acquisitions into existing operations could result in not achieving planned revenue growth and could negatively impact our net income and earnings per share.
We may be unable to make dispositions of assets on favorable terms.
In 2013 we sold the assets of our California Shoppers operations, The Pennysaver, resulting in a pre-tax loss of $21.4 million. In 2015 we sold our B2B research business resulting in a pre-tax loss of $9.5 million. We may in the future determine to divest certain assets or businesses consistent with our corporate strategy. However, the price we obtain for such assets or businesses will be driven by performance of those businesses and the current market demand for such assets, and we may not be able to realize a profit upon sale. If we are unable to dispose of businesses or assets in a timely manner or at profitable price, our business, net income, and earnings per share could be materially and adversely affected.
We are vulnerable to increases in postal rates and disruptions in postal services.
Our services depend on the USPS and other commercial delivery services to deliver products. Standard postage rates have increased in recent years (most recently in May 2015) and may continue to do so at frequent and unpredictable intervals. Postage rates influence the demand for our services even though the cost of mailings is typically borne by our clients and is not directly reflected in our revenues or expenses. Accordingly, future postal increases or disruptions in the operations of the USPS may have an adverse impact on us.
In addition, the USPS has had significant financial and operational challenges recently. In reaction, the USPS has proposed many changes in its services, such as delivery frequency and facility access. These changes, together with others that may be adopted, individually or in combination with other market factors, could materially and negatively affect our costs and ability to meet our clients’ expectations.
We are vulnerable to increases in paper prices.
Prices of print materials are subject to fluctuations. Increased paper costs could cause our customers to reduce spending on other marketing programs, or to shift to formats, sizes, or media which may be less profitable for us, in each case potentially materially affecting our revenues and profits.
Our financial results could be negatively impacted by impairments of goodwill or other intangible assets with indefinite useful lives.
In the third quarter of 2013 we recorded a non-cash impairment charge of $2.8 million related to a trade name intangible asset as a result of continuing revenue declines, an overall strategic assessment of the related operations, and management's evaluation of the business. In the third quarter of 2015, as a result of a sustained decline in our market capitalization below our book value of equity and recent operating performance, we performed an interim Step One impairment test of Customer Interaction and Trillium goodwill. As a result we recorded a non-cash impairment charge of $209.9 million in our Customer Interaction segment. As of
December 31, 2015
, the net book value of our goodwill and other intangibles represented approximately
$223.1 million
out of our total assets of
$414.6 million
. We test goodwill and other intangible assets with indefinite useful lives for impairment as of November 30 of each year and on an interim basis should factors or indicators become apparent that would require an interim test. A downward revision in the fair value of our reporting units or any of the other intangible assets could result in additional impairments and non-cash charges. Any such impairment charges could have a significant negative effect on our reported net income.
15
Our indebtedness may adversely impact our ability to react to changes in our business or changes in general economic conditions.
The amount of our indebtedness and the terms under which we have borrowed money under our credit facilities or other agreements could have significant consequences for our business. Our debt covenants require that we maintain certain financial measures and ratios. As a result of these covenants and ratios, we may be limited in the manner in which we can conduct our business, and we may be unable to engage in favorable business activities or finance future operations or capital needs. A failure to comply with these restrictions or to maintain the financial measures and ratios contained in the debt agreements could lead to an event of default that could result in an acceleration of outstanding indebtedness. In addition, the amount and terms of our indebtedness could:
|
•
|
limit our flexibility in planning for, or reacting to, changes in our business and the industries in which we operate, including limiting our ability to invest in our strategic initiatives, and, consequently, place us at a competitive disadvantage;
|
|
•
|
reduce the availability of our cash flows that would otherwise be available to fund working capital, capital expenditures, acquisitions, and other general corporate purposes; and
|
|
•
|
result in higher interest expense in the event of increases in interest rates, as discussed below under “Interest rate increases could affect our results of operations, cash flows, and financial position.”
|
We may incur additional indebtedness in the future and, if new debt is added to our current debt levels, the above risks could be increased. The company recently negotiated a new credit facility and used a portion of the proceeds to pay off the remaining obligation related to our previous credit facilities. The terms of future arrangements may be less favorable to the company than our current facilities. Any failure to obtain new financing arrangements on favorable terms could have a material and adverse effect on our liquidity position.
We are unlikely to declare cash dividends or repurchase our shares.
Although our board of directors has historically authorized the payment of quarterly cash dividends on our common stock, we recently announced that we would not declare further dividends in the future. In addition, although our board has authorized stock purchase programs (and we repurchased shares in 2015 and in prior years through these programs), we may discontinue doing so at any time and are unlikely to make any purchases in the near term. Decisions to pay dividends on our common stock or to repurchase our common stock will be based upon periodic determinations by our board that such dividends or repurchases are both in compliance with all applicable laws and agreements and in the best interest of our stockholders after considering our financial condition and results of operations, the price of our common stock, credit conditions, and such other factors as are deemed relevant by our board. The failure to pay a cash dividend or repurchase stock could adversely affect the market price of our common stock.
Interest
rate increases could affect our results of operations, cash flows and financial position.
Interest rate movements in Europe and the U.S. can affect the amount of interest we pay related to our debt and the amount we earn on cash equivalents. Our primary interest rate exposure is to interest rate fluctuations in Europe, specifically Eurodollar rates, due to their impact on interest related to our credit facilities. On
December 31, 2015
, we had
$77.3 million
of debt outstanding, all of which bore variable interest rates. We refinanced this debt in March 2016 under a facility that also bears variable rates. Our results of operations, cash flows, and financial position could be materially adversely affected by significant increases in interest rates. We also have exposure to interest rate fluctuations in the U.S., specifically money market, commercial paper, and overnight time deposit rates, as these affect our earnings on excess cash. Even with the offsetting increase in earnings on excess cash in the event of an interest rate increase, we cannot be assured that future interest rate increases will not have a material adverse impact on our business, financial position, or operating results.
We are subject to risks associated with operations outside the U.S.
Harte Hanks conducts business outside of the U.S. During
2015
, approximately
16.9%
of our revenues were derived from operations outside the United States, primarily Europe and Asia. We may expand our international operations in the future as part of our growth strategy. Accordingly, our future operating results could be negatively affected by a variety of factors, some of which are beyond our control, including:
16
|
•
|
social, economic, and political instability;
|
|
•
|
changes in local, national, and international legal requirements or policies resulting in burdensome government controls, tariffs, restrictions, embargoes, or export license requirements;
|
|
•
|
higher rates of inflation;
|
|
•
|
the potential for nationalization of enterprises;
|
|
•
|
less favorable labor laws that may increase employment costs and decrease workforce flexibility;
|
|
•
|
potentially adverse tax treatment;
|
|
•
|
less favorable foreign intellectual property laws that would make it more difficult to protect our intellectual property from misappropriation;
|
|
•
|
more onerous or differing data privacy and security requirements or other marketing regulations;
|
|
•
|
longer payment cycles; and
|
|
•
|
the differing costs and difficulties of managing international operations.
|
Our current credit facilities also contain covenants that limit to 20% the portion of our assets, revenue, and earnings that we can derive from our businesses outside of the U.S. Although we believe we could obtain a waiver or amendment of these covenants if our business outside the U.S. exceeded this level (whether through acquisitions or improved organic growth), we cannot guarantee that we will obtain a waiver or amendment, or that such a request may compel us to renegotiate our credit facilities at a time, or on terms, that are not favorable.
In addition, exchange rate movements may have an impact on our future costs or on future cash flows from foreign investments. We have not entered into any foreign currency forward exchange contracts or other derivative instruments to hedge the effects of adverse fluctuations in foreign currency exchange rates. The various risks that are inherent in doing business in the U.S. are also generally applicable to doing business anywhere else, and may be exacerbated by the difficulty of doing business in numerous sovereign jurisdictions due to differences in culture, laws, and regulations.
We must maintain effective internal controls.
In designing and evaluating our internal controls over financial reporting, we recognize that any internal control or procedure, no matter how well designed and operated, can provide only reasonable assurance of achieving desired control objectives and that no system of internal controls can be designed to provide absolute assurance of effectiveness. If we fail to maintain a system of effective internal controls, it could have a material adverse effect on our business, financial position, or operating results. Additionally, adverse publicity related to a failure in our internal controls over financial reporting could have a negative impact on our reputation and business.
Fluctuation in our
revenue
and operating results and other factors may impact the volatility of our stock price.
The price at which our common stock has traded in recent years has fluctuated greatly and has declined significantly. Our common stock price may continue to be volatile due to a number of factors including the following (some of which are beyond our control):
|
•
|
the impact of the uneven and lackluster economic recovery from the last recession, the overall strength of the economies of the markets we serve and general market volatility;
|
|
•
|
variations in our operating results from period to period and variations between our actual operating results and the expectations of securities analysts, investors, and the financial community;
|
|
•
|
unanticipated developments with client engagements or client demand, such as variations in the size, budget, or progress toward the completion of engagements, variability in the market demand for our services, client consolidations, and the unanticipated termination of several major client engagements;
|
17
|
•
|
announcements of developments affecting our businesses;
|
|
•
|
competition and the operating results of our competitors; and
|
|
•
|
other factors discussed elsewhere in this Item 1A, “Risk Factors.”
|
As a result of these and other factors, investors in our common stock may not be able to resell their shares at or above their original purchase price.
Our certificate of incorporation and bylaws contain anti-takeover protections that may discourage or prevent strategic transactions, including a takeover of our company, even if such a transaction would be beneficial to our stockholders
Provisions contained in our certificate of incorporation and bylaws, in conjunction with provisions of the Delaware General Corporation Law, could delay or prevent a third party from entering into a strategic transaction with us, even if such a transaction would benefit our stockholders. For example, our certificate of incorporation and bylaws provide for a staggered board of directors, do not allow written consents by stockholders, and have strict advance notice and disclosure requirements for nominees and stockholder proposals.
War
or terrorism could affect our business.
War, terrorism, or the threat thereof involving a market we serve could have a significant impact on our business, financial position, or operating results. War or the threat of war could substantially affect the levels of marketing expenditures by clients in each of our businesses, whether due to economic declines, decreased or slowed international trade, reactions to security risks, or other factors. In addition, each of our businesses could be affected by operation disruptions and a shortage of supplies and labor related to such a war or threat of war.
None.
Our business is conducted in facilities worldwide containing aggregate space of approximately 1.7 million square feet. All facilities are held under leases, which expire at dates through 2025.
Information regarding legal proceedings is set forth in Note I,
Commitments and Contingencies
, of the “Notes to Consolidated Financial Statements” and is incorporated herein by reference.
Not applicable.
18
Common Stock
Our common stock is listed on the NYSE (symbol: HHS). The reported high and low quarterly sales price ranges for
2015
and
2014
were as follows:
|
|
2015
|
2014
|
||||||||||||||
|
|
High
|
Low
|
High
|
Low
|
||||||||||||
|
First Quarter
|
$
|
8.10
|
|
$
|
7.27
|
|
$
|
8.84
|
|
$
|
6.71
|
|
||||
|
Second Quarter
|
7.79
|
|
5.96
|
|
8.89
|
|
6.66
|
|
||||||||
|
Third Quarter
|
6.00
|
|
3.40
|
|
7.27
|
|
6.37
|
|
||||||||
|
Fourth Quarter
|
4.31
|
|
3.23
|
|
7.74
|
|
5.68
|
|
||||||||
We paid a quarterly dividend of 8.5 cents per share in each quarter of
2015
and
2014
. Any actual dividend declaration can be made only upon, and subject to, approval of our Board of Directors, based on its business judgment.
As of
January 31, 2016
, there are approximately 2,010 holders of record.
Issuer Purchases of Equity Securities
The following table contains information about our purchases of equity securities during the fourth quarter of
2015
:
|
Period
|
Total Number
of Shares
Purchased (1)
|
Average Price
Paid per
Share
|
Total Number
of Shares
Purchased as
Part of a
Publicly
Announced
Plan (2)
|
Maximum
Dollar Amount
that May Yet
Be Spent
Under the
Plan
|
||||||||||
|
October 1 - 31, 2015
|
21,600
|
|
$
|
3.56
|
|
21,600
|
|
$
|
11,437,538
|
|
||||
|
November 1 - 30, 2015
|
—
|
|
$
|
—
|
|
—
|
|
$
|
11,437,538
|
|
||||
|
December 1 - 31, 2015
|
—
|
|
$
|
—
|
|
—
|
|
$
|
11,437,538
|
|
||||
|
Total
|
21,600
|
|
$
|
3.56
|
|
21,600
|
|
|
|
|||||
(1)
Total number of shares purchased includes shares, if any, (i) purchased as part of our publicly announced stock repurchase program, and (ii) pursuant to our 2005 Omnibus Incentive Plan and 2013 Omnibus Incentive Plan, withheld to pay withholding taxes and the exercise price in certain cashless exercises of stock options, and withheld to offset withholding taxes upon the vesting shares.
(2)
During the fourth quarter of
2015
, we purchased
21,600
shares of our common stock through our stock repurchase program that was publicly announced in August 2014. Under this program, from which shares can be purchased in the open market, our Board of Directors has authorized us to spend up to $20.0 million to repurchase shares of our outstanding common stock. As of
December 31, 2015
, we have repurchased
1,506,679
shares and spent
$8.6 million
under this authorization. Through
December 31, 2015
, we had repurchased a total of
67,887,989
shares at an average price of
$18.13
per share under this program and previously announced programs.
Comparison of Stockholder Returns
The material under this heading is not “soliciting material,” is not deemed “filed” with the SEC, and is not to be incorporated by reference into any filing under the 1933 Act or the 1934 Act, whether made before or after the date hereof and irrespective of any general incorporation language in such filing.
The following graph compares the cumulative total return of our common stock during the period December 31,
2010
to
December 31, 2015
with the Standard & Poor’s 500 Stock Index (S&P 500 Index) and with our peer group.
19
Our current peer group includes: Acxiom Corporation, Cenveo, Inc., Convergys Corp., Conversant, Inc., Dex Media, Inc., Digital River, Inc., Dun & Bradstreet Corporation, Forrester Research, Inc., Gartner, Inc., Informatica Corp., MDC Partners, Inc., Meredith Corp., Reach Local, Inc., Sykes Enterprises, Inc., and TeleTech Holdings, Inc.
The S&P Index includes 500 U.S. companies in the industrial, transportation, utilities, and financial sectors and is weighted by market capitalization. The peer groups are also weighted by market capitalization.
The graph depicts the results of investing $100 in our common stock, the S&P 500 Index and the peer groups at closing prices on December 31, 2010 and assumes the reinvestment of dividends.
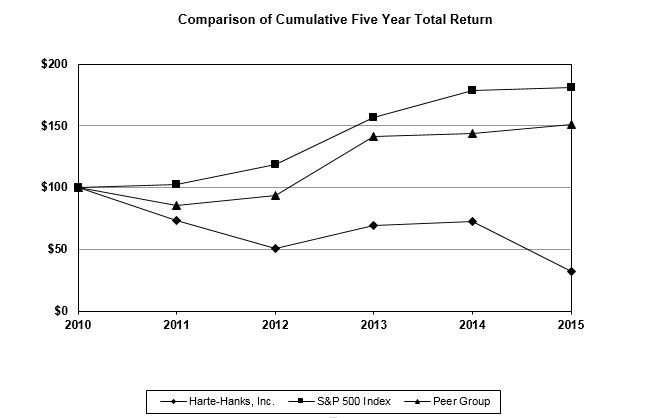
|
|
ANNUAL RETURN PERCENTAGE
Years Ending
|
||||||||||||||
|
Company Name / Index
|
Dec 2011
|
Dec 2012
|
Dec 2013
|
Dec 2014
|
Dec 2015
|
||||||||||
|
Harte Hanks, Inc.
|
-26.35
|
|
-30.94
|
|
36.62
|
|
3.88
|
|
-55.17
|
|
|||||
|
S&P 500 Index
|
2.11
|
|
16.00
|
|
32.39
|
|
13.69
|
|
1.38
|
|
|||||
|
Peer Group
|
-14.68
|
|
9.55
|
|
51.30
|
|
1.36
|
|
5.12
|
|
|||||
20
The following table sets forth our summary historical financial information for the periods ended and as of the dates indicated. You should read the following historical financial information along with “Management’s Discussion and Analysis of Financial Condition and Results of Operations” contained in this Form 10-K. The fiscal year financial information included in the table below for the years ended
December 31, 2015
,
2014
, and
2013
is derived from audited financial statements contained in this Form 10-K. Information for the years ended December 31,
2012
and
2011
was derived from previously filed Annual Reports on Form 10-K. All financial information presented below excludes amounts related to our discontinued Shoppers operations.
|
In thousands, except per share amounts
|
2015
|
2014
|
2013
|
2012
|
2011
|
|||||||||||||||
|
Statement of Comprehensive Income Data
|
|
|
|
|
|
|
|
|
|
|
||||||||||
|
Revenues
|
$
|
495,301
|
|
$
|
553,676
|
|
$
|
559,609
|
|
$
|
581,091
|
|
$
|
614,270
|
|
|||||
|
Operating expenses
|
|
|
|
|
|
|
|
|
|
|
||||||||||
|
Labor, production and distribution
|
404,163
|
|
446,094
|
|
443,524
|
|
450,771
|
|
476,086
|
|
||||||||||
|
Advertising, selling, general and administrative
|
54,530
|
|
51,900
|
|
54,937
|
|
51,729
|
|
50,483
|
|
||||||||||
|
Impairment of other intangible assets
|
209,938
|
|
—
|
|
2,750
|
|
—
|
|
—
|
|
||||||||||
|
Depreciation and amortization
|
14,245
|
|
14,920
|
|
15,737
|
|
15,922
|
|
15,442
|
|
||||||||||
|
Total operating expenses
|
682,876
|
|
512,914
|
|
516,948
|
|
518,422
|
|
542,011
|
|
||||||||||
|
Operating income (loss)
|
(187,575
|
)
|
40,762
|
|
42,661
|
|
62,669
|
|
72,259
|
|
||||||||||
|
Interest expense, net
|
4,759
|
|
2,559
|
|
2,998
|
|
3,484
|
|
2,941
|
|
||||||||||
|
Loss on sale
|
9,501
|
|
—
|
|
—
|
|
—
|
|
—
|
|
||||||||||
|
Other, net
|
1,007
|
|
897
|
|
46
|
|
2,993
|
|
781
|
|
||||||||||
|
Income tax expense (benefit)
|
(31,914
|
)
|
13,315
|
|
15,176
|
|
20,796
|
|
26,477
|
|
||||||||||
|
Income (loss) from continuing operations
|
$
|
(170,928
|
)
|
$
|
23,991
|
|
$
|
24,441
|
|
$
|
35,396
|
|
$
|
42,060
|
|
|||||
|
Earnings (loss) from continuing operations per common share—diluted
|
$
|
(2.77
|
)
|
$
|
0.38
|
|
$
|
0.39
|
|
$
|
0.56
|
|
$
|
0.67
|
|
|||||
|
Weighted-average common and common equivalent shares outstanding—diluted
|
61,643
|
|
62,658
|
|
62,812
|
|
63,148
|
|
63,552
|
|
||||||||||
|
Other Data
|
|
|
|
|
|
|
|
|
|
|
||||||||||
|
Cash dividends per share
|
$
|
0.34
|
|
$
|
0.34
|
|
$
|
0.26
|
|
$
|
0.43
|
|
$
|
0.32
|
|
|||||
|
Capital expenditures
|
$
|
11,574
|
|
$
|
11,265
|
|
$
|
15,873
|
|
$
|
13,461
|
|
$
|
22,336
|
|
|||||
|
Balance sheet data (at end of period)
|
|
|
|
|
|
|
|
|
|
|
||||||||||
|
Current assets
|
$
|
151,706
|
|
$
|
201,417
|
|
$
|
239,305
|
|
$
|
205,014
|
|
$
|
248,968
|
|
|||||
|
Property, plant and equipment, net
|
$
|
33,913
|
|
$
|
36,913
|
|
$
|
40,711
|
|
$
|
44,091
|
|
$
|
46,842
|
|
|||||
|
Goodwill and other intangibles, net
|
$
|
223,095
|
|
$
|
400,441
|
|
$
|
400,467
|
|
$
|
403,423
|
|
$
|
403,668
|
|
|||||
|
Total assets
|
$
|
414,621
|
|
$
|
644,177
|
|
$
|
685,536
|
|
$
|
706,212
|
|
$
|
703,997
|
|
|||||
|
Total debt
|
$
|
77,313
|
|
$
|
82,687
|
|
$
|
98,000
|
|
$
|
110,250
|
|
$
|
179,438
|
|
|||||
|
Total stockholders’ equity
|
$
|
140,316
|
|
$
|
326,676
|
|
$
|
349,054
|
|
$
|
328,164
|
|
$
|
446,355
|
|
|||||
21
Cautionary Note About Forward-Looking Statements
This report, including this Management’s Discussion and Analysis of Financial Condition and Results of Operations (MD&A), contains “forward-looking statements” within the meaning of the federal securities laws. All such statements are qualified by the cautionary note included under Item 1A above, which is provided pursuant to the safe harbor provisions of Section 27A of the 1933 Act and Section 21E of the 1934 Act. Actual results may vary materially from what is expressed in or indicated by the forward-looking statements.
Overview
The following MD&A section is intended to help the reader understand the results of operations and financial condition of Harte Hanks, Inc. (Harte Hanks). This section is provided as a supplement to, and should be read in conjunction with, our financial statements and the accompanying notes to the financial statements contained elsewhere in this report and our MD&A section, financial statements, and accompanying notes to financial statements in our
2015
Form 10-K. Our
2015
Form 10-K contains a discussion of other matters not included herein, such as disclosures regarding critical accounting policies and estimates, and contractual obligations.
Harte Hanks partners with clients to deliver relevant, connected, and quality customer interactions. Our approach starts with discovery and learning, which leads to customer journey mapping, creative and content development, analytics, and data management, and ends with execution and support in a variety of digital and traditional channels. We do something powerful: we produce engaging and memorable customer interactions to drive business results for our clients, which is why Harte Hanks is famous for developing better customer relationships and experiences and defining interaction-led marketing.
Our Customer Interaction services offer a wide variety of integrated, multi-channel, data-driven solutions for top brands around the globe. We help our clients gain insight into their customers’ behaviors from their data and use that insight to create innovative multi-channel marketing programs to deliver a return on marketing investment. We believe our clients’ success is determined not only by how good their tools are, but how well we help them use the tools to gain insight and analyze their consumers. This results in a strong and enduring relationship between our clients and their customers. We offer a full complement of capabilities and resources to provide a broad range of marketing services, in media from direct mail to email, including:
|
•
|
agency and digital services;
|
|
•
|
database marketing solutions and business-to-business lead generation;
|
|
•
|
direct mail; and
|
|
•
|
contact centers.
|
Revenues from the Customer Interaction segment represented approximately
90%
of our total revenues for the year ended
December 31, 2015
.
Trillium Software is a leading global enterprise data quality solutions provider. Our data quality specialists help organizations achieve increased business from their data management initiatives and existing business-critical processes by providing enterprise data profiling and data cleansing software and services. Trillium Software offers industry-specific business solutions that help solve data problems experienced by financial services, banking, retail, healthcare, manufacturing, and risk professionals. Our full complement of technologies and services includes global data profiling, data cleansing, enrichment, and data linking for e-business, Big Data, customer relationship management, data governance, enterprise resource planning, supply chain management, data warehouse, and other enterprise applications. Revenues from the Trillium Software segment are comprised primarily of perpetual software licenses, annual maintenance, and professional services, and represented approximately
10%
of our total revenues for the year ended
December 31, 2015
.
We derive revenues by providing Customer Interaction services and Trillium Software licensing sales and services.
22
General corporate expense consists primarily of pension and workers compensation expense related to employees of business operations we no longer own.
Previously, Harte Hanks also provided shopper advertising opportunities through our Shoppers segment, which operated in certain California markets. On September 27, 2013 we sold the assets of our Shoppers operations, The Pennysaver, for gross proceeds of $22.5 million. This transaction resulted in an after-tax loss of $12.4 million. Because Shoppers represented a distinct business unit with operations and cash flows that can clearly be distinguished, both operationally and for financial purposes, from the rest of Harte Hanks, the results of the Shoppers operations are reported as discontinued operations for all periods presented. Results of the remaining Harte Hanks business are reported as continuing operations. After this sale, Harte Hanks no longer has any Shoppers operations or circulation.
We are affected by the general, national, and international economic and business conditions in the markets where we and our customers operate. Marketing budgets are often discretionary in nature, and are easier to reduce in the short-term than other expenses in response to weak economic conditions. Our revenues are also affected by the economic fundamentals of each industry that we serve, various market factors, including the demand for services by our clients, and the financial condition of and budgets available to specific clients, among other factors. We remain committed to making the investments necessary to execute our multichannel strategy while also continuing to adjust our cost structure to reduce costs in the parts of the business that are not growing as fast. We believe these actions will improve our profitability in future periods.
Our principal operating expense items are labor, outsourced costs, and mail supply chain management.
Results of Continuing Operations
As discussed in Note O,
Discontinued Operations
, we sold the assets of our California Shoppers operations on September 27, 2013. Therefore, the operating results of our California Shoppers, including the loss on the sale, are reported as discontinued operations in the Consolidated Financial Statements, and are excluded from management’s discussion and analysis of financial condition and results of operations below.
Operating results from our continuing operations were as follows:
|
Year Ended December 31,
|
||||||||||||||||||
|
In thousands, except per share amounts
|
2015
|
% Change
|
2014
|
% Change
|
2013
|
|||||||||||||
|
Revenues
|
$
|
495,301
|
|
-10.5
|
%
|
$
|
553,676
|
|
-1.1
|
%
|
$
|
559,609
|
|
|||||
|
Operating expenses
|
682,876
|
|
33.1
|
%
|
512,914
|
|
-0.8
|
%
|
516,948
|
|
||||||||
|
Operating income (loss)
|
$
|
(187,575
|
)
|
-560.2
|
%
|
$
|
40,762
|
|
-4.5
|
%
|
$
|
42,661
|
|
|||||
|
Operating Margin
|
N/M
|
|
7.4
|
%
|
7.6
|
%
|
||||||||||||
|
Income (loss) from continuing operations
|
$
|
(170,928
|
)
|
-812.5
|
%
|
$
|
23,991
|
|
-1.8
|
%
|
$
|
24,441
|
|
|||||
|
Diluted EPS from continuing operations
|
$
|
(2.77
|
)
|
-828.9
|
%
|
$
|
0.38
|
|
-2.6
|
%
|
$
|
0.39
|
|
|||||
(N/M = Not Meaningful)
23
Year ended
December 31, 2015
vs. Year ended
December 31, 2014
Revenues
Overall revenues
decrease
d
$58.4 million
, to
$495.3 million
, in the year ended
December 31, 2015
compared to the year ended
December 31, 2014
. These results reflect the impact of decreased revenue from all of our verticals, with automotive and consumer brands representing the largest dollar decrease. Revenue from our retail and select markets verticals decreased
$15.4 million
, or
11.0%
, and
$7.3 million
, or
13.5%
, respectively, as the result of clients reducing mail volumes and database losses. Our auto and consumer brands vertical decreased
$16.9 million
, or
17.1%
, compared to the prior year, primarily from the loss of agency work with a luxury auto manufacturer. The decline of
$14.2 million
, or
10.9%
, in our technology vertical was primarily driven by the sale of our B2B research business. Our healthcare and pharmaceutical vertical decreased
$2.2 million
, or
4.4%
, and our financial services vertical decreased
$2.4 million
, or
3.0%
, compared to the year ended
December 31, 2014
.
Future revenue performance will depend on, among other factors, the overall strength of the national and international economies and how successful we are at maintaining and growing business with existing clients, acquiring new clients, and meeting client demands. We believe that, in the long-term, an increasing portion of overall marketing and advertising expenditures will be moved from other advertising media to the targeted media space, and that our business will benefit as a result. Targeted media advertising results can be more effectively tracked, enabling measurement of the return on marketing investment.
Operating Expenses
Overall operating expenses were
$682.9 million
in
2015
, compared to
$512.9 million
in
2014
. This
$170.0 million
year over year
increase
is a result of an impairment loss of
$209.9 million
related to goodwill associated with our Customer Interaction segment recorded in the third quarter of 2015. Excluding impairment, operating expenses
decrease
d
$40.0 million
, or
7.8%
, compared to
2014
. Labor costs
decrease
d
$18.3 million
, or
6.6%
, primarily due to reductions in expense from wages and severance costs recorded in 2014. Production and distribution costs
decrease
d
$23.6 million
, or
14.2%
, primarily driven by decreased lease expense, decreased fuel costs, and decreased outsourced costs resulting from decreased volumes. General and administrative expense increased
$2.6 million
, or
5.1%
, compared to the prior year, due to an increase in sales and marketing expense related to employment of additional sales force personnel. Depreciation and intangible asset and software amortization expense decreased slightly compared to the prior year.
Our largest cost components are labor, outsourced costs, and mail supply chain costs. Each of these costs is somewhat variable and tends to fluctuate with revenues and the demand for our services. Mail supply chain rates have increased over the last few years due to demand and supply issues within the transportation industry. Future changes in mail supply chain rates will continue to impact our total production costs and total operating expenses, and may have an impact on future demand for our supply chain management.
Postage costs of mailings are borne by our clients and are not directly reflected in our revenues or expenses.
Year ended
December 31, 2014
vs. Year ended
December 31, 2013
Revenues
Revenues decreased $5.9 million, to $553.7 million, in 2014 compared to 2013. These results reflect the impact of decreased revenues from all of our verticals except for select markets and automotive and consumer brands, with the retail vertical representing the largest dollar decrease. Revenues from our retail vertical declined 12.1% compared to the prior year, reflecting changes by two large customers to less expensive mailing formats. Compared to 2013, our healthcare and pharmaceutical vertical decreased 0.6%, high-tech declined 0.2% and our financial vertical decreased 3.4% over the prior year. Our select markets vertical increased 29.3%, primarily due to non-recurring streaming enrollment services from an existing contact center customer. Automotive and consumer brands increased 4.3%.
24
Operating Expenses
Overall operating expenses were $512.9 million in 2014, compared to $516.9 million in 2013. The $4.0 million decrease includes a $2.8 million decrease in labor costs, a $5.8 million decrease in selling, general and administrative, and a $0.6 million decrease in depreciation expense. These decreases are offset by an increase of $5.4 million in production and distribution expenses, compared to 2013.
Labor costs decreased $2.8 million, or 1.0%, primarily due to increased compensation expense in 2013 related to the retirement of our former Chairman and CEO. Production and distribution costs increased $5.4 million, or 3.3%, due to increased repairs and maintenance, lease termination expense, and pass through expenses. General and administrative expense, excluding the impairment charge, decreased $3.0 million, or 5.3%, compared to prior year, reflecting a decrease in professional services and workers’ compensation expense. Promotion expenses also decreased related to rebranding expense recorded in 2013. Depreciation and intangible asset and software amortization expense decreased slightly compared to the prior year.
Customer Interaction
Customer Interaction operating results were as follows:
|
|
Year Ended December 31,
|
|||||||||||||||||
|
In thousands
|
2015
|
% Change
|
2014
|
% Change
|
2013
|
|||||||||||||
|
Revenues
|
$
|
444,166
|
|
-11.1
|
%
|
$
|
499,444
|
|
-0.9
|
%
|
$
|
503,760
|
|
|||||
|
Operating expenses
|
641,186
|
|
36.5
|
%
|
469,664
|
|
-0.4
|
%
|
471,739
|
|
||||||||
|
Operating income (loss)
|
$
|
(197,020
|
)
|
N/M
|
|
$
|
29,780
|
|
-7.0
|
%
|
$
|
32,021
|
|
|||||
|
Operating margin
|
N/M
|
|
6.0
|
%
|
6.4
|
%
|
||||||||||||
Year ended
December 31, 2015
vs. Year ended
December 31, 2014
Revenues
Customer Interaction revenues
decrease
d
$55.3 million
, to
$444.2 million
, in the year ended
December 31, 2015
compared to the year ended
December 31, 2014
. These results reflect the impact of decreased revenue from all of our verticals. Revenue from our retail and select markets verticals decreased
$15.3 million
, or
11.2%
, and
$6.7 million
, or
14.1%
, respectively, as the result of clients reducing mail volumes and database losses. Our auto and consumer brands vertical decreased
$14.5 million
, or
17.0%
, compared to the prior year, primarily from the loss of agency work with a luxury auto manufacturer. The decline of
$15.5 million
, or
13.1%
, in our technology vertical was primarily driven by the sale of our B2B research business. Our healthcare and pharmaceutical vertical decreased
$2.0 million
, or
4.3%
, and our financial services vertical decreased
$1.2 million
, or
1.9%
, compared to the year ended
December 31, 2014
.
Revenues from our vertical markets are impacted by, among other things, the economic fundamentals of each industry, various market factors, including the demand for services by our clients, and the financial condition of and budgets available to specific clients.
Future revenue performance will depend on, among other factors, the overall strength of the national and international economies and how successful we are at maintaining and growing business with existing clients, acquiring new clients and meeting client demands. We believe that, in the long-term, an increasing portion of overall marketing and advertising expenditures will be moved from other advertising media to the targeted media space, and that our business will benefit as a result. Targeted media advertising results can be more effectively tracked, enabling measurement of the return on marketing investment.
Operating Expenses
Overall operating expenses were
$641.2 million
in
2015
, compared to
$469.7 million
in
2014
. This
$171.5 million
year over year
increase
is a result of an impairment loss of
$209.9 million
related to goodwill recorded in the third quarter of 2015. Excluding impairment, operating expenses decreased
$38.4 million
, or
8.2%
, compared to
2014
. Labor costs
decrease
d
$17.2 million
, or
6.9%
, primarily due to reductions in headcount and severance costs recorded in
25
2014. Production and distribution costs
decrease
d
$23.4 million
, or
14.1%
, primarily driven by decreased lease expense, decreased fuel costs, and decreased outsourced costs resulting from decreased volumes. General and administrative expense
increase
d
$2.7 million
, or
6.4%
, compared to the prior year, due to an increase in sales and marketing expense related to employment of additional sales force personnel. Depreciation and intangible asset and software amortization expense decreased slightly compared to the prior year.
Customer Interaction’s largest cost components are labor, outsourced costs, and mail supply chain costs. Each of these costs is somewhat variable and tends to fluctuate with revenues and the demand for our services. Mail supply chain rates have increased over the last few years due to demand and supply issues within the transportation industry. Future changes in mail supply chain rates will continue to impact our total production costs and total operating expenses, and may have an impact on future demand for our supply chain management.
Year ended
December 31, 2014
vs. Year ended
December 31, 2013
Revenues
Customer Interaction revenues decreased $4.3 million, or 0.9%, in the year ended 2014 compared to the year ended 2013. These results reflect the impact of our retail vertical decreasing by $19.9 million, or 12.8%, compared to the year ended December 2013, as the result of our clients continuing to change to lighter and less expensive print formats in response to postal service rate increases, client mail and database losses, and reduced contact center support services from an online retailer. In addition, our technology, auto and consumer brands, and select market verticals increased by $2.3 million, or 2.0%, $2.3 million, or 2.8%, and $11.9 million, or 32.1%, respectively. These increases were offset by a decrease in revenues in our financial services vertical of $1.0 million, or 1.5% primarily due to revenue from credit card and retail banking customers.
Operating Expenses
Customer Interaction operating expenses were
$469.7 million
in 2014, compared to
$471.7 million
in 2013. Labor costs
decrease
d
$0.5 million
, or
0.2%
, primarily due to reduced headcount and bonus expense. General and Administrative expense decreased
$6.1 million
, or
12.7%
, reflecting a decrease in professional services and workers comp expense. Depreciation and amortization expense
decrease
d
$0.8 million
, or
5.8%
, compared to 2013. Production and distribution costs
increase
d
$5.4 million
, or
3.4%
, due to increased repairs and maintenance, lease termination expense, and pass through expenses.
Trillium Software
Trillium Software operating results were as follows:
|
|
Year Ended December 31,
|
|||||||||||||||||
|
In thousands
|
2015
|
% Change
|
2014
|
% Change
|
2013
|
|||||||||||||
|
Revenues
|
$
|
51,135
|
|
-5.7
|
%
|
$
|
54,232
|
|
-2.9
|
%
|
$
|
55,849
|
|
|||||
|
Operating expenses
|
37,096
|
|
-9.3
|
%
|
40,885
|
|
1.1
|
%
|
40,453
|
|
||||||||
|
Operating income
|
$
|
14,039
|
|
5.2
|
%
|
$
|
13,347
|
|
-13.3
|
%
|
$
|
15,396
|
|
|||||
|
Operating Margin
|
27.5
|
%
|
24.6
|
%
|
27.6
|
%
|
||||||||||||
Year ended
December 31, 2015
vs. Year ended
December 31, 2014
Revenues
Trillium Software revenues
decrease
d
$3.1 million
, or
5.7%
, for the year ended
December 31, 2015
compared to the year ended
December 31, 2014
. This decrease was primarily related to decreased revenue from sales of software licenses and the related professional services and maintenance fees associated with those license sales.
Operating Expenses
Trillium Software operating expenses were
$37.1 million
in the year ended
December 31, 2015
, compared to
$40.9 million
in the year ended
December 31, 2014
. The decrease of
$3.8 million
reflected a decrease in labor expense of
26
$3.4 million
, or
12.6%
, primarily due to decreased employee headcount. Production and distribution, general and administrative, and depreciation and amortization expense all decreased slightly compared to the prior year.
Trillium Software’s largest cost component is software development, which is comprised primarily of labor.
Year ended
December 31, 2014
vs. Year ended
December 31, 2013
Revenues
Trillium Software revenues decreased $1.6 million, or 2.9%, for the year ended December 2014 compared to the year ended December 2013. This decrease was primarily related to decreased revenue from sales of software licenses and professional services from two large software licenses sold in the fourth quarter of 2013 to banks.
Operating Expenses
Trillium Software operating expenses were
$40.9 million
in the year ended
December 31, 2014
, compared to
$40.5 million
in the year ended
December 31, 2013
. The
increase
of
$0.4 million
reflects an increase in general and administration of
$0.9 million
, or
9.8%
, compared to the prior year, primarily due to increased professional services and an increase in bad debt expense. This was offset by decreases in labor, production, and depreciation and amortization expense.
Interest Expense, Net
Year ended
December 31, 2015
vs. Year ended
December 31, 2014
Interest expense
increased
$2.2 million
, or
86.0%
, in
2015
compared to
2014
. This was due to the interest accretion for the contingent consideration liability related to the purchase of 3Q Digital, Inc. See Note N,
Acquisition and Disposition
, in the Notes to Consolidated Financial Statements for further discussion on the purchase of 3Q Digital, Inc. This was offset slightly by a decreased debt balance as a result of scheduled principal payments on the 2011 Term Loan Facility.
Our debt at
December 31, 2015
and
2014
is described in Note C,
Long-Term Debt
, in the Notes to Consolidated Financial Statements.
Year ended
December 31, 2014
vs. Year ended
December 31, 2013
Interest expense decreased $0.4 million, or 14.6%, in 2014 compared to 2013, due to a decreased debt balance as a result of scheduled principal payments on the 2011 Term Loan Facility, as well as an increase in offsetting interest income due to an increased investment balance.
Other Income and Expense
Year ended
December 31, 2015
vs. Year ended
December 31, 2014
Other expense, net,
increased
$0.1 million
, or
12.3%
, compared to
2014
. This change was primarily due to net foreign currency transaction gains recognized in
2014
.
Year ended
December 31, 2014
vs. Year ended
December 31, 2013
Other expense, net, increased
$0.9 million
compared to 2013. This change is primarily due to a $0.9 million gain on the sale of our facility in Belgium in 2013.
Income Taxes
Year ended
December 31, 2015
vs. Year ended
December 31, 2014
Our
2015
income tax benefit of
$31.9 million
resulted in an effective income tax rate of
15.7%
. Unfavorably impacting our benefit is nondeductible goodwill associated with our impairment loss, nondeductible basis on the sale of operations, and foreign tax credit limitations on the dividends paid from foreign subsidiaries, the impact of which were
$36.7 million
,
27
$0.7 million
, and
$0.6 million
, respectively. Lastly, the unfavorable impact of state income taxes was principally offset by our ability to use tax credits, and to a lesser extent, the lower tax rates applied to our foreign operations. This compares to our
2014
income tax expense of
$13.3 million
that resulted in an effective income tax rate of
35.7%
. Benefiting our
2014
rate was a valuation allowance reversal associated with a recovery of previously remitted foreign tax, and having a greater proportion of our income in jurisdictions outside the United States having tax rates below 35%.
Year ended
December 31, 2014
vs. Year ended
December 31, 2013
Our
2014
income tax expense of
$13.3 million
resulted in an effective income tax rate of
35.7%
. Benefiting our expense was the reversal of $0.5 million of our prior year valuation allowance. This reversal was principally associated with the recovery of previously remitted foreign tax. Our rate also benefited from having a greater proportion of our income in jurisdictions outside of the United States having tax rates below 35%. This compares to our
2013
income tax expense of
$15.2 million
that resulted in an effective tax rate of
38.3%
. Unfavorably impacting our
2013
rate were state income taxes, the extent of which was reduced by favorable enacted legislation and the incremental tax resulting from our limitation in using foreign tax credits to fully offset the tax on foreign subsidiary dividends paid to our U.S. operations.
Income/Earnings Per Share from Continuing Operations
Year ended
December 31, 2015
vs. Year ended
December 31, 2014
We recorded a loss from continuing operations of
$170.9 million
and diluted loss per share from continuing operations of
$2.77
. These results compare to income from continuing operations of
$24.0 million
and diluted earnings per share from continuing operations of
$0.38
in
2014
. The decrease in income from continuing operations is primarily the result of an impairment loss of
$209.9 million
related to goodwill recorded in 2015.
Year ended
December 31, 2014
vs. Year ended
December 31, 2013
We recorded income from continuing operations of $24.0 million and diluted earnings per share from continuing operations of $0.38. These results compare to income from continuing operations of $24.4 million and diluted earnings per share from continuing operations of $0.39 in 2013. The decrease in income from continuing operations, excluding the impairment charge, is primarily a result of decreased operating income and general corporate expense.
Economic Climate and Impact on our Financial Statements
As discussed above, we sold the assets of the California Shoppers operations on September 27, 2013. The business and economic climate in California had a negative impact on our Shoppers’ operations and cash flows, and therefore, the cash proceeds received at sale. The loss on sale of these assets is reflected in the discontinued operations results throughout our financial statements. In addition, as a result of a significant decrease in forecasted revenues, management completed an evaluation of the Aberdeen Group trade name intangible asset as of September 30, 2013. A discounted cash flow model was used to calculate the fair value of the Aberdeen Group trade name. The significant assumptions used in this method included the (i) revenue growth rates for the Aberdeen Group, (ii) discount rate, (iii) tax rate, and (iv) royalty rate. As a consequence, we recorded a non-cash trade name intangible asset impairment charge of
$2.8 million
. The impairment charge is included in Intangible Asset Impairment in the Consolidated Statements of Comprehensive Income (Loss) for the year ended December 31, 2013.
As a result of a sustained decline in our market capitalization below our book value of equity and recent operating performance, the company completed an evaluation of the Customer Interaction and Trillium Software goodwill during the third quarter of 2015. The fair value of each reporting unit was estimated using both the income approach and market approach models. The fair value of our Customer Interaction reporting unit was estimated to be less than the carrying value, including goodwill. As a result, we recorded a non-cash goodwill impairment charge of
$209.9 million
. The impairment charge is included in Intangible Asset Impairment in the Consolidated Statements of Comprehensive Income (Loss) for the year ended December 31, 2015.
We cannot predict the impact on our business performance of the economic climate in the U.S. and other economies in which we operate, nor can we predict the impact of the economic climate in the industry in which we operate. Economic downturns and turmoil severely affect the marketing services industry. A deep or enduring economic recession in the U.S. or other markets we or our clients serve could have a material adverse effect on our business, financial position, or operating results.
28
Liquidity and Capital Resources
Sources and Uses of Cash
As of
December 31, 2015
, cash and cash equivalents were
$17.6 million
, decreasing from
$56.7 million
at
December 31, 2014
. This net decrease was a result of net cash provided by operating activities of
$30.9 million
, net cash used in investing activities of
$36.2 million
, net cash used in financing activities of
$31.9 million
, and the negative effect of exchange rate changes of
$2.0 million
.
Operating Activities
Net cash provided by operating activities in
2015
was
$30.9 million
, compared to
$25.6 million
for
2014
. The
$5.4 million
year-over-year increase was attributable to an increase of
$24.5 million
in net income excluding the impairment loss and loss on sale, a
$21.6 million
increase in changes within working capital assets,
$6.3 million
net increase in other, offset by a
$47.0 million
decrease in deferred income taxes.
For
2015
, our principal working capital changes, which directly affected net cash provided by operating activities, were as follows:
|
•
|
A decrease in accrued payroll attributable to the timing of normal payroll as well as a decrease in bonus and commission accruals;
|
|
•
|
A decrease in customer postage and program discounts attributable to customers utilizing lower postage cost alternatives;
|
|
•
|
An decrease in accounts receivable, net attributable to year to date revenue decline;
|
|
•
|
A decrease in deferred revenue and customer advances attributable to lower postage volume and deferred income related to database and software maintenance;
|
Investing Activities
Net cash used in investing activities was
$36.2 million
in
2015
compared to
$11.1 million
in
2014
. The
$25.1 million
decrease is primarily the result of the
$29.9 million
of net cash used for acquisitions, offset by proceeds of
$5.0 million
from the disposition of the B2B research business.
Financing Activities
Net cash used in financing activities was
$31.9 million
in
2015
compared to
$44.6 million
in
2014
. The
$12.7 million
decrease is attributable to a
$13.0 million
increase in borrowings and
$4.0 million
decrease in purchases of treasury stock, offset by
$3.1 million
in increased debt payments in
2015
.
Credit Facilities
On August 16, 2011, we entered into a five-year $122.5 million term loan facility (2011 Term Loan Facility) with Bank of America, N.A., as Administrative Agent. The 2011 Term Loan Facility matures on August 16, 2016. For each borrowing under the 2011 Term Loan Facility, we can generally choose to have the interest rate for that borrowing calculated based on either (i) the LIBOR rate (as defined in the 2011 Term Loan Facility) for the applicable interest period, plus a spread (ranging from 2.00% to 2.75% per annum) based on our total net funded debt-to-EBITDA ratio (as defined in the 2011 Term Loan Facility) then in effect; or (ii) the highest of (a) the Agent’s prime rate, (b) the BBA daily floating rate LIBOR, as determined by Agent for such date, plus 1.00%, and (c) the Federal Funds Rate plus 0.50%, plus a spread (ranging from 1.00% to 1.75% per annum) based on our total net funded debt-to-EBITDA ratio then in effect. We may elect to prepay the 2011 Term Loan Facility at any time without incurring any prepayment penalties. At
December 31, 2015
, we had
$64.3 million
outstanding under the 2011 Term Loan Facility.
On August 8, 2013, we entered into a three-year $80 million revolving credit facility with a $25 million letter of credit sub-facility and a $5 million swing line loan sub-facility (2013 Revolving Credit Facility) by amending and restating a similar revolving credit facility originally entered in 2010 (2010 Revolving Credit Facility). The 2013 Revolving Credit
29
Facility permits us to request up to a $15 million increase in the total amount of the facility, and matures on August 16, 2016. The 2013 Revolving Credit Facility replaced the 2010 Revolving Credit Facility, under which Harte Hanks had no borrowings as of August 8, 2013, except for letters of credit totaling approximately $9.5 million. For each borrowing under the 2013 Revolving Credit Facility, we can generally choose to have the interest rate for that borrowing calculated on either (i) the Eurodollar rate for the applicable interest period plus a spread which is determined based on our total net debt-to-EBITDA ratio then in effect, which ranges from 2.25% to 3.00% per annum; or (ii) the highest of (a) the Agent’s prime rate, (b) the Federal Funds Rate plus 0.50% per annum, and (c) Eurodollar rate plus 1.00% per annum, plus a spread which is determined based on our total debt-to-EBITDA ratio then in effect, which spread ranges from 1.25% to 2% per annum. We are also required to pay a quarterly commitment fee under the 2013 Revolving Credit Facility. The rate of which is applied to the amount equal to the difference of the total commitment amount under the 2013 Revolving Credit Facility less the aggregate amount of outstanding obligations under such facility. The commitment fee rate ranges from 0.50% to 0.55% per annum, depending on our total net debt-to-EBITDA ratio then in effect. In addition, we pay a letter of credit fee with respect to outstanding letters of credit. That fee is calculated by applying a rate equal to the spread applicable to Eurodollar based loans plus a fronting fee of 0.125% per annum to the average daily undrawn amount of the outstanding letters of credit. We may elect to prepay the 2013 Revolving Credit Facility at any time without incurring any prepayment penalties.
Under all of our credit facilities we are required to maintain an interest coverage ratio of not less than 2.75 to 1 and a total debt-to-EBITDA ratio of not more than 2.25 to 1. The credit facilities also contain customary covenants restricting our and our subsidiaries’ ability to:
|
•
|
authorize distributions, dividends, stock redemptions, and repurchases if a payment event of default has occurred and is continuing;
|
|
•
|
enter into certain merger or liquidation transactions;
|
|
•
|
grant liens;
|
|
•
|
enter into certain sale and leaseback transactions;
|
|
•
|
have foreign subsidiaries account for more than 20% of the consolidated revenue, consolidated EBITDA, or assets of Harte Hanks and its subsidiaries, in the aggregate;
|
|
•
|
enter into certain transactions with affiliates; and
|
|
•
|
allow the total indebtedness of Harte Hanks’ subsidiaries to exceed $20.0 million.
|
The credit facilities each also include customary covenants regarding reporting obligations, delivery of notices regarding certain events, maintaining our corporate existence, payment of obligations, maintenance of our properties and insurance thereon at customary levels with financially sound and reputable insurance companies, maintaining books and records and compliance with applicable laws. The credit facilities each also provide for customary events of default including nonpayment of principal or interest, breach of representations and warranties, violations of covenants, failure to pay certain other indebtedness, bankruptcy and material judgments and liabilities, certain violations of environmental laws or ERISA or the occurrence of a change of control. Our material domestic subsidiaries have guaranteed the performance of Harte Hanks under our credit facilities. As of
December 31, 2015
, we were in compliance with all of the covenants of our credit facilities.
On
March 10, 2016
, we entered into a secured credit facility with Wells Fargo Bank, N.A. as Administrative Agent. This facility consists of a maximum
$65.0 million
revolving credit facility, and a
$45.0 million
term loan facility (collectively, the 2016 Secured Credit Facilities). A portion of the proceeds from the 2016 Secured Credit Facilities was used to pay off the remaining obligation related to the 2011 Term Loan Facility and the 2013 Revolving Credit Facility. See Note C,
Long Term Debt,
of the Notes to Consolidated Financial Statements for further discussion.
30
Contractual Obligations
Contractual obligations at
December 31, 2015
are as follows:
|
In thousands
|
Total
|
2016
|
2017
|
2018
|
2019
|
2020
|
Thereafter
|
|||||||||||||||||||||
|
Debt
|
$
|
77,313
|
|
$
|
77,313
|
|
$
|
—
|
|
$
|
—
|
|
$
|
—
|
|
$
|
—
|
|
$
|
—
|
|
|||||||
|
Interest on term debt
(1)
|
934
|
|
934
|
|
—
|
|
—
|
|
—
|
|
—
|
|
—
|
|
||||||||||||||
|
Interest on revolver debt (2)
|
393
|
|
393
|
|
—
|
|
—
|
|
—
|
|
—
|
|
—
|
|
||||||||||||||
|
Operating leases
|
43,021
|
|
11,565
|
|
10,676
|
|
7,686
|
|
5,343
|
|
3,121
|
|
4,630
|
|
||||||||||||||
|
Capital leases
|
336
|
|
132
|
|
100
|
|
58
|
|
32
|
|
14
|
|
—
|
|
||||||||||||||
|
Unfunded pension plan benefit payments
|
16,958
|
|
1,542
|
|
1,611
|
|
1,603
|
|
1,593
|
|
1,685
|
|
8,924
|
|
||||||||||||||
|
Other long-term obligations
|
1,456
|
|
803
|
|
537
|
|
116
|
|
—
|
|
—
|
|
—
|
|
||||||||||||||
|
Total contractual cash obligations
|
$
|
140,411
|
|
$
|
92,682
|
|
$
|
12,924
|
|
$
|
9,463
|
|
$
|
6,968
|
|
$
|
4,820
|
|
$
|
13,554
|
|
|||||||
(1)
Future interest amounts were estimated using the
December 31, 2015
effective rate on our outstanding term facility debt of 2.4239%.
(2) Future interest amounts were estimated using the December 31, 2015 effective rate on our outstanding revolver facility debt of 4.7500%.
At
December 31, 2015
, we had total letters of credit in the amount of
$6.4 million
. No amounts were drawn against these letters of credit at
December 31, 2015
. These letters of credit renew annually and exist to support insurance programs relating to workers’ compensation, automobile and general liability as well as facility lease obligations. We had no other off-balance sheet arrangements at
December 31, 2015
.
Dividends
We paid a quarterly dividend of
8.5 cent
s per share in each quarter of
2015
. Any actual dividend declaration can be made only upon, and subject to, approval of our Board of Directors, based on its business judgment. Except for the one-time acceleration of the first quarter 2013 dividend, we have paid consecutive quarterly dividends since the first quarter of 1995.
Share Repurchase
During
2015
, we repurchased
0.9 million
shares of our common stock for
$4.6 million
under our current stock repurchase program that was publicly announced in August 2014. Under our current program we are authorized to spend up to
$20.0 million
to repurchase shares of our outstanding common stock. At
December 31, 2015
, we had authorization of
$11.4 million
under this program. From 1997 through
December 31, 2015
, we have repurchased
67.9 million
shares for an aggregate of
$1.2 billion
.
Outlook
We consider such factors as total cash and cash equivalents, current assets, current liabilities, total debt, revenues, operating income, cash flows from operations, investing activities and financing activities when assessing our liquidity.
Our primary sources of liquidity have been cash and cash equivalents on hand, cash generated from operating activities, and borrowings from our 2013 Revolving Credit Facility. Our management of cash is designed to optimize returns on cash balances and to ensure that it is readily available to meet our operating, investing, and financing requirements as they arise. Additional capital resources are also available from and provided through our 2013 Revolving Credit Facility, subject to the terms and conditions of that facility.
The amount of cash on hand and borrowings available under our 2013 Revolving Credit Facility are influenced by a number of factors, including fluctuations in our operating results, revenue growth, accounts receivable collections, working capital changes, capital expenditures, tax payments, share repurchases, pension plan contributions, acquisitions, and dividends.
As of
December 31, 2015
, we had
$60.6 million
of unused borrowing capacity under our 2013 Revolving Credit Facility (which matures on August 16, 2016) and a cash balance of
$17.6 million
. Based on our current operational plans, we
31
believe that our cash on hand, cash provided by operating activities, and availability under the 2016 Secured Credit Facilities will be sufficient to fund operations, anticipated capital expenditures, payments of principal and interest on our borrowings for the next 12 months. Nevertheless, we cannot predict the impact on our business performance of the economic climate in the U.S. and other economies in which we operate. A deep or enduring economic recession in the U.S. or other markets we or our clients serve could have a material adverse effect on our business, financial position or operating results.
Critical Accounting Policies
Critical accounting policies are defined as those that, in our judgment, are most important to the portrayal of our company’s financial condition and results of operations and which require complex or subjective judgments or estimates. The areas that we believe involve the most significant management estimates and assumptions are detailed below. Actual results could differ materially from those estimates under different assumptions and conditions. Historically, actual results have not differed significantly from our estimates.
Revenue Recognition
We recognize revenue when all of the following criteria are satisfied: (i) persuasive evidence of an arrangement exists; (ii) the price is fixed or determinable; (iii) collectability is reasonably assured; and (iv) the service has been performed or the product has been delivered.
Payments received in advance of the performance of services or delivery of the product are recorded as deferred revenue until such time as the services are performed or the product is delivered.
Our accounting policy for revenue recognition has an impact on our reported results and relies on certain estimates that require judgments on the part of management.
Revenue is derived from a variety of services and products, and may be billed at hourly rates, monthly rates, or a fixed price. For all sales, we require either a purchase order, a statement of work signed by the client, a written contract, or some other form of written authorization from the client.
Revenue from agency and creative services, analytical services, and market research is typically billed based on time and materials.
Revenue from email marketing, social media marketing, digital techniques such as search engine maximization ("SEM"), and other digital solutions is recognized as the work is performed. Revenue from these services is typically based on a fixed price or rate given to the client.
Revenue associated with new marketing database builds is deferred until complete or until client acceptance. Upon completion or acceptance, revenue and direct build costs are then recognized over the term of the related arrangement as the services are provided. Revenue from database and website hosting services is recognized ratably over the contractual hosting period. Pricing for database builds are typically based on a fixed price and hosting fees are typically based on a fixed price per month or per contract.
Revenue from database subscriptions is based on a fixed price and is recognized ratably over the term of the subscription. Revenue from stand-alone technology data sales is recognized at the time of delivery.
Revenue from services such as data processing, printing, personalization of communication pieces using laser and inkjet printing, targeted mail, and transportation logistics is recognized as the work is performed. Revenue from these services is typically based on a fixed price or rate given to the client. Postage costs of mailings in our direct mail business are borne by our clients and are not directly reflected in our revenues or expenses.
Revenue related to fulfillment and contact centers, including inbound and outbound calling, and email management, is also typically based on a fixed price per transaction or service provided. Revenue from these services is recognized as the service or activity is performed.
Revenue from software arrangements involving multiple elements is allocated to each element based on the vendor-specific objective evidence of fair values of the respective elements. For software sales with multiple elements (for example, software licenses with undelivered post-contract customer support or “PCS”), we allocate revenue to each
32
component of the arrangement using the residual value method based on the fair value of the undelivered elements. This means we defer revenue from the software sale equal to the fair value of the undelivered elements. The fair value of PCS is based upon separate sales of renewals to other clients. The fair value of services, such as training and consulting, is based upon separate sales of these services to other clients.
The revenue allocated to PCS is recognized ratably over the term of the support period. Revenue allocated to professional services is recognized as the services are performed. The revenue allocated to software products, including time-based software licenses, is recognized, if collection is probable, upon execution of a licensing agreement and shipment of the software, or ratably over the term of the license, depending on the structure and terms of the arrangement. If the licensing agreement is for a term of one year or less and includes PCS, we recognize the software and the PCS revenue ratably over the term of the license.
For certain non-software arrangements, we enter into contracts that include delivery of a combination of two or more of our service offerings. Such arrangements are divided into separate units of accounting, provided that the delivered element(s) has stand-alone value and objective and reliable evidence of the fair value of the undelivered element(s) exist(s).
When we are able to un-bundle the arrangement into separate units of accounting, revenue from each service is recognized separately, and in accordance with our revenue recognition policy for each element. If we are unable to un-bundle the arrangement into separate units of accounting, we apply one of the revenue recognition policies to the entire arrangement. This might impact the timing of revenue recognition, but would not change the total revenue recognized from the arrangement.
Taxes collected from customers and remitted to governmental authorities are not reflected in our revenues or expenses.
Allowance for Doubtful Accounts
We maintain our allowance for doubtful accounts at a balance adequate to reduce accounts receivable to the amount of cash expected to be realized upon collection. The methodology used to determine the minimum allowance balance is based on our prior collection experience and is generally related to the accounts receivable balance in various aging categories. The balance is also influenced by specific clients’ financial strength and circumstance. Accounts that are determined to be uncollectible are written off in the period in which they are determined to be uncollectible. Periodic changes to the allowance balance are recorded as increases or decreases to bad debt expense, which is included in the “Advertising, selling, general, and administrative” line of our Consolidated Statements of Comprehensive Income (Loss). We recorded bad debt expense of
$0.6 million
, $0.5 million, and $0.0 million for the years ended
December 31, 2015
,
2014
, and
2013
, respectively. At
December 31, 2015
and
2014
, our allowance for doubtful accounts was
$1.2 million
and
$1.2 million
, respectively. While we believe our reserve estimate to be appropriate, we may find it necessary to adjust the allowance for doubtful accounts if future bad debt expense exceeds the estimated reserve. Given the significance of accounts receivable to the consolidated financial statements, the determination of net realizable values is considered to be a critical accounting estimate.
33
Reserve for Healthcare, Workers’ Compensation, Automobile and General Liability
We are self-insured for our workers’ compensation, automobile, general liability, and a portion of our healthcare insurance. We make various subjective judgments about a number of factors in determining our reserve for healthcare, workers’ compensation, automobile, and general liability insurance, and the related expense. Our deductible for individual healthcare claims is
$0.3 million
. Our deductible for workers’ compensation is
$0.5 million
. We have a
$0.3 million
deductible for automobile and general liability claims. Our insurance administrator provides us with estimated loss reserves, based upon its experience dealing with similar types of claims, as well as amounts paid to date against these claims. We apply actuarial factors to both insurance estimated loss reserves and to paid claims and then determine reserve levels, taking into account these calculations. At
December 31, 2015
and
2014
, our reserve for healthcare, workers’ compensation, net, automobile, and general liability was
$6.1 million
and
$7.8 million
, respectively. If ultimate losses were 10% higher than our estimate at
December 31, 2015
, net income would be impacted by approximately
$0.4 million
, net of taxes. The amount that earnings would be impacted is dependent on the claim year and our deductible levels for that plan year. Periodic changes to the reserve for workers’ compensation, automobile, and general liability are recorded as increases or decreases to insurance expense, which is included in the “Advertising, selling, general, and administrative” line of our Consolidated Statements of Comprehensive Income (Loss). Periodic changes to the reserve for healthcare are recorded as increases or decreases to employee benefits expense, which is included in the “Labor” line of our Consolidated Statements of Comprehensive Income (Loss).
Goodwill and Other Intangible Assets
Goodwill is recorded to the extent that the purchase price of an acquisition exceeds the fair value of the identifiable net assets acquired. Other intangibles with definite and indefinite useful lives are recorded at fair value at the date of the acquisition. Under the provisions of FASB ASC 350,
Intangibles-Goodwill and Other
(ASC 350), goodwill is tested for impairment at least annually, or more frequently if events or circumstances indicate that it is "more likely than not" that goodwill might be impaired. We assess the impairment of our goodwill and other intangible assets by determining the fair value of each of our reporting units and comparing the fair value to the carrying value for each reporting unit. Determining fair value requires the exercise of significant judgments, including judgments about appropriate discount rates, the amount and timing of expected future cash flows, and perpetual growth rates.
We monitor potential triggering events, including changes in the business climate in which we operate, attrition of key personnel, the current volatility in the capital markets, the company’s market capitalization compared to our book value, our recent operating performance, and financial projections. During the third quarter of 2015 as a result of a sustained decline in our market capitalization below our book value of equity and recent operating performance, the company determined that a triggering event had occurred. In accordance with ASC 350, we determined that an interim Step One impairment test of Customer Interaction and Trillium Software goodwill was warranted. The fair value of each reporting unit was estimated using both the income approach and market approach models. The fair value of our Customer Interaction reporting unit was estimated to be less than the carrying value, including goodwill. The fair value of our Trillium Software reporting unit was estimated to be more than the carrying value, including goodwill. The company determined that the goodwill balance with respect to the Customer Interaction reporting unit was impaired and Step Two testing on that reporting unit balance was deemed necessary.
Step Two of the goodwill test consists of performing a hypothetical purchase price allocation, under which the estimated fair value of the reporting unit is allocated to its tangible and intangible assets based on their estimated fair values, with any residual amount being assigned to goodwill. During the Step Two analysis, book value was estimated to approximate fair value for all working capital items, as well as a number of insignificant assets and liabilities. Intangible assets related to trade names, customer relationships, and non-compete agreements were identified and the fair value of these intangible assets was estimated.
The models used to value the Customer Interaction reporting unit in Step One and the identified intangible assets in Step Two relied on management’s assumptions. These assumptions, which are significant to the calculated fair values, are considered Level 3 inputs under the fair value hierarchy established by ASC 350, as they are unobservable. The assumptions in the Step One test include discount rate, revenue growth rates, tax rates, and operating margins. In addition to these assumptions, the Step Two assumptions include customer attrition rates and royalty rates.
The impairment analysis indicated an impairment of Customer Interaction goodwill that is recorded in the Consolidated Statements of Comprehensive Income (Loss) in the third quarter of 2015 of
$209.9 million
and a corresponding
$36.8 million
tax benefit resulting in a net income impact of
$173.1 million
.
34
On April 14, 2015 the company sold its B2B research businesses, Aberdeen Group and Harte Hanks Market Intelligence (the "B2B research business”). The B2B research business asset group was a part of our Customer Interaction segment (see Note M,
Business Segments,
in the Notes to Consolidated Financial Statements). The allocated fair value to the B2B research business within the net book value of Customer Interaction goodwill was
$11.1 million
. In addition,
$2.3 million
of intangible assets with indefinite useful lives related to the Aberdeen Group trade name was written-off in conjunction with the sale of the B2B research business. These amounts were written-off and are reflected in the Loss on sale in the Other expenses section of the Condensed Consolidated Statements of Income (Loss). See Note N,
Acquisition and Disposition,
in the Notes to Consolidated Financial Statements for further discussion.
On March 16, 2015 the company acquired the stock of a privately-owned digital marketing agency. The company paid some consideration upon closing, with additional consideration payable upon the achievement of revenue performance goals over the three-year period following the closing. The company performed a valuation to determine the estimate of the total purchase consideration and to estimate values for the tangible and identifiable intangible assets. As a result of the calculation, we recorded
$41.8 million
in goodwill and
$4.8 million
of identified intangible assets with definite lives for customer relationships, trade names, and non-compete agreements.
During the second quarter of 2014, we determined our reporting units as Customer Interaction and Trillium Software. In this analysis, our goodwill was allocated to each reporting unit based on the estimated fair value of the reporting unit. We performed an impairment test immediately before and after the change in reporting units, utilizing this same methodology as our November 30 annual impairment test and no indication of impairment was identified.
On September 30, 2013, as a result of a significant decrease in forecasted revenues and an overall strategic assessment of the related operations, management completed an evaluation of the Aberdeen Group trade name. A discounted cash flow model was used to calculate the fair value of the Aberdeen trade name. The significant assumptions used in this method included the (i) revenue growth rates for Aberdeen, (ii) discount rate, (iii) tax rate, and (iv) royalty rate. These assumptions are considered Level 3 inputs under the fair value hierarchy established by FASB ASC 820,
Fair Value Measurements and Disclosures
. Harte Hanks recorded a non-cash trade name intangible asset impairment charge of
$2.8 million
. The impairment charge is included in Goodwill and intangible assets impairment in the Consolidated Statements of Comprehensive Income (Loss) in 2013.
We performed our annual goodwill impairment testing as of November 30, 2013. In 2013, overall fair value was compared to overall market capitalization. In addition, and consistent with prior periods, fair value was determined using a discounted cash flow model and a cash flow multiple model analysis. Based on the results of our November 30, 2013 impairment tests, we did not record any additional impairment losses in 2013 related to goodwill and other intangible assets.
At December
2015
,
2014
, and
2013
, the net book value of our goodwill was allocated to our reporting units as follows:
|
In thousands
|
2015
|
2014
|
2013
|
|||||||||
|
Operations
|
|
|
|
|
|
|
||||||
|
Customer Interaction
|
$
|
69,699
|
|
$
|
248,891
|
|
$
|
377,854
|
|
|||
|
Trillium Software
|
149,273
|
|
149,273
|
|
20,310
|
|
||||||
|
Total Goodwill
|
$
|
218,972
|
|
$
|
398,164
|
|
$
|
398,164
|
|
|||
The company continues to monitor potential triggering events, including changes in the business climate in which it operates, attrition of key personnel, the current volatility in the capital markets, the company’s market capitalization compared to its book value, the company’s recent operating performance, and the company’s financial projections. The occurrence of one or more triggering events could require additional impairment testing, which could result in additional impairment charges.
A summary of the critical assumptions utilized for our impairment testing in
2015
are outlined above. We believe this information provides relevant information to understand our goodwill impairment testing and evaluate our goodwill balances.
For the annual goodwill impairment tests performed in
2015
, because of the recent goodwill impairment analysis, and because no additional triggering events are considered to have occurred, the company determined that performing a qualitative assessment (Step Zero analysis) as of November was sufficient to determine if there were any indicators of impairment and whether further analysis was necessary. Management considered the following additional key
35
circumstances in its qualitative assessment to conclude that it was more likely than not that the fair value of the reporting units was greater than the carrying amounts, including goodwill for Customer Interaction and Trillium Software:
|
•
|
Macroeconomic conditions - no significant changes have occurred in the general economic conditions
|
|
•
|
Industry and market considerations - no significant changes have occurred in the environment in which Customer Interaction or Trillium Software operates
|
|
•
|
Cost Factors - no significant increases in labor, or other costs for Customer Interaction or Trillium Software that have had a negative effect on earnings and cash flows
|
|
•
|
Other events - the change in key leadership of Harte Hanks is not considered to have a negative impact on Customer Interaction or Trillium Software, and there have been no significant litigation or regulatory issues
|
|
•
|
Decrease in share price - there has been no significant decrease in the share price of Harte Hanks since the third quarter 2015 valuation
|
|
•
|
Balance sheet/book value - there have been no significant changes to Customer Interaction or Trillium Software balance sheet or book value since the third quarter 2015 valuation
|
The determination of the recoverability of goodwill requires significant judgment and estimates regarding future cash flows and fair values. These estimates are subject to change and could result in impairment losses being recognized in the future. If different reporting units or different valuation methodologies had been used, the impairment test results could have differed.
Income Taxes
We are subject to income taxes in the United States and numerous other jurisdictions. Significant judgment is required in determining our provision for income taxes and income tax assets and liabilities, including evaluating uncertainties in the application of accounting principles and complex tax laws.
We record a provision for income taxes for the anticipated tax consequences of the reported results of operations using the asset and liability method. Under this method, we recognize deferred tax assets and liabilities for the expected future tax consequences of temporary differences between the financial reporting and tax basis of assets and liabilities, as well as for operating loss and tax credit carryforwards. Deferred tax assets and liabilities are measured using the tax rates that are expected to apply to taxable income for the years in which those tax assets and liabilities are expected to be realized or settled. We record a valuation allowance to reduce our deferred tax assets to the net amount that we believe is more likely than not to be realized.
We recognize tax benefits from uncertain tax positions only if we believe that it is more likely than not that the tax position will be sustained on examination by the taxing authorities based on the technical merits of the position. Although we believe that we have adequately reserved for our uncertain tax positions, we can provide no assurance that the final tax outcome of these matters will not be materially different. We make adjustments to these reserves when facts and circumstances change, such as the closing of a tax audit or the refinement of an estimate. To the extent that the final tax outcome of these matters is different than the amounts recorded, such differences will affect the provision for income taxes in the period in which such determination is made and could have a material impact on our financial condition and operating results. The provision for income taxes includes the effects of any reserves that we believe are appropriate, as well as the related net interest and penalties.
Stock-based Compensation
Stock-based compensation cost is measured at the grant date based on the fair value of the award and is recognized as expense over the requisite service period. Determining the fair value of share-based awards requires judgment, including in some cases estimating expected term, volatility, and dividend yield. In addition, judgment is required in estimating the amount of stock-based awards that are expected to be forfeited. If actual results differ significantly from some of these estimates, stock-based compensation expense, and our results of operations could be materially impacted. For the years ended
December 31, 2015
,
2014
, and
2013
, we recorded total stock-based compensation expense of
$5.7 million
,
$4.1 million
, and
$5.7 million
, respectively.
36
Accounting for Contingent Consideration
As of
December 31, 2015
, in conjunction with the completion of the acquisition of 3Q Digital, Inc. (as described in Note N,
Acquisition and Disposition,
in the Notes to Consolidated Financial Statements), we recognize that the estimates and assumptions around management’s application of the earnout liability require that we add accounting for contingent consideration as a critical accounting policy. Management applies ASC 805 Business Combinations,
(Subtopic 30-25) Goodwill Recognition, Contingent Consideration.
We recognized the acquisition-date fair value of the contingent consideration as part of the consideration transferred in the exchange. The fair value of the contingent consideration arrangement was estimated by applying a multiple scenario approach. At
December 31, 2015
, our earnout liability was
$20.3 million
.
Recent Accounting Pronouncements
As discussed in Note A,
Significant Accounting Policies,
of the Notes to Consolidated Financial Statements, certain new financial accounting pronouncements have been issued which either have already been reflected in the accompanying consolidated financial statements, or will become effective for our financial statements at various dates in the future. The adoptions of these new accounting pronouncements have not and are not expected to have a material effect on our consolidated financial statements.
Market risk includes the risk of loss arising from adverse changes in market rates and prices. We face market risks related to interest rate variations and to foreign exchange rate variations. From time to time, we may utilize derivative financial instruments to manage our exposure to such risks.
We are exposed to market risk for changes in interest rates related to our credit facilities. Our earnings are affected by changes in short-term interest rates as a result of our credit facilities, which bear interest at variable rates based on LIBOR rates (effective 30 day LIBOR rate of 0.42% at December 31, 2015). Our five-year 2011 Term Loan Facility has a maturity date of August 16, 2016. At December 31, 2015, our debt balance related to the 2011 Term Loan Facility was $64.3 million. Our three-year $80 million 2013 Revolving Credit Facility also has a maturity date of August 16, 2016. At
December 31, 2015
, our debt balance related to the 2013 Revolving Credit Facility was $13.0 million.
Assuming the actual level of borrowings throughout
2015
, and assuming a one percentage point change in the average interest rates, we estimate that our net income for
2015
would have changed by approximately $0.5 million. Under our 2016 Revolving Credit Facility and 2016 Term Loan, we estimate that a one percentage point change in the average interest rate would have the same impact on our net income. Due to our overall debt level and cash balance at
December 31, 2015
, anticipated cash flows from operations, and the various financial alternatives available to us should there be an adverse change in interest rates, we do not believe that we currently have significant exposure to market risks associated with changing interest rates. At this time we have not entered into any interest rate swap or other derivative instruments to hedge the effects of adverse fluctuations in interest rates.
Our earnings are also affected by fluctuations in foreign currency exchange rates as a result of our operations in foreign countries. Our primary exchange rate exposure is to the Euro, British Pound Sterling, Australian Dollar and Philippine Peso. We monitor these risks throughout the normal course of business. The majority of the transactions of our U.S. and foreign operations are denominated in the respective local currencies. Changes in exchange rates related to these types of transactions are reflected in the applicable line items making up operating income in our Consolidated Statements of Comprehensive Income (Loss). Due to the current level of operations conducted in foreign currencies, we do not believe that the impact of fluctuations in foreign currency exchange rates on these types of transactions is significant to our overall annual earnings. A smaller portion of our transactions are denominated in currencies other than the respective local currencies. For example, intercompany transactions that are expected to be settled in the near-term are denominated in U.S. Dollars. Since the accounting records of our foreign operations are kept in the respective local currency, any transactions denominated in other currencies are accounted for in the respective local currency at the time of the transaction. Any foreign currency gain or loss from these transactions, whether realized or unrealized, results in an adjustment to income, which is recorded in “Other, net” in our Consolidated Statements of Comprehensive Income (Loss). Transactions such as these amounted to $0.2 million and $0.3 million in pre-tax currency transaction gains in 2015 and 2014, respectively. At this time we are not entered into any foreign currency forward exchange contracts or other derivative instruments to hedge the effects of adverse fluctuations in foreign currency exchange rates.
37
We do not enter into derivative instruments for any purpose other than cash flow hedging. We do not speculate using derivative instruments.
The Financial Statements required to be presented under Item 8 are presented in the Consolidated Financial Statements and the notes thereto beginning at page 43 of this Form 10-K (Financial Statements).
None.
As of the end of the period covered by this report, an evaluation was carried out under the supervision and with the participation of our management, including our Chief Executive Officer, Chief Financial Officer, and Chief Accounting Officer, of the effectiveness of the design and operation of our disclosure controls and procedures (as defined in Rule 13a-15(e) under the 1934 Act). It should be noted that, because of inherent limitations, our disclosure controls and procedures, however well designed and operated, can provide only reasonable, and not absolute, assurance that the objectives of the disclosure controls and procedures are met. Based upon that evaluation, the Chief Executive Officer, Chief Financial Officer, and Chief Accounting Officer concluded that the design and operation of these disclosure controls and procedures were effective, at the “reasonable assurance” level, to ensure information required to be disclosed by us in the reports that we file or submit under the 1934 Act is recorded, processed, summarized and reported within the time periods specified in the SEC rules and forms.
As of the end of the period covered by this report, an evaluation was carried out under the supervision and with the participation of our management, including our Chief Executive Officer, Chief Financial Officer, and Chief Accounting Officer, of our internal control over financial reporting to determine whether any changes occurred during the fourth quarter of
2015
that have materially affected, or are reasonably likely to materially affect, our internal control over financial reporting. Based on that evaluation, there were no changes in our internal control over financial reporting or in other factors that have materially affected or are reasonably likely to materially affect our internal control over financial reporting. We may make changes in our internal control processes from time to time in the future. It should also be noted that, because of inherent limitations, internal control over financial reporting may not prevent or detect misstatements, and controls may become inadequate because of changes in conditions or in the degree of compliance with the policies or procedures.
Management’s Report on Internal Control Over Financial Reporting and the Report of Independent Registered Public Accounting Firm on the Consolidated Financial Statements and Internal Control Over Financial Reporting are set forth in the Consolidated Financial Statements beginning on page 43.
None.
38
Some of the information required by Items 10 through 14 of this Part III is incorporated by reference from our definitive proxy statement to be filed for our
2016
annual meeting of stockholders (
2016
Proxy Statement), as indicated below. Our
2016
Proxy Statement will be filed with the SEC not later than 120 days after
December 31, 2015
. Because the
2016
Proxy Statement has not yet been finalized and filed, there may be certain discrepancies between the currently anticipated section headings specified below and the final section headings contained in the
2016
Proxy Statement.
Directors and Executive Officers
The information required by this item regarding our directors and executive officers will be set forth in our
2016
Proxy Statement under the caption “Directors and Executive Officers” which information is incorporated herein by reference.
Section 16(a) Compliance
The information to appear in our
2016
Proxy Statement under the caption “General Information - Section 16(a) Beneficial Ownership Reporting Compliance” is incorporated herein by reference.
Code of Ethics and Other Governance Information
The information required by this item regarding the Supplemental Code of Ethics for our Senior Financial Officers (Code of Ethics), audit committee financial experts, audit committee members and procedures for stockholder recommendations of nominees to our Board of Directors will be set forth in our
2016
Proxy Statement under the caption “Corporate Governance” which information is incorporated herein by reference.
Our Code of Ethics may be found on our website at
www.HarteHanks.com
“Corporate Governance” section of the “Investors” tab, and a printed copy of our Code of Ethics will be furnished without charge, upon written request to Harte Hanks, Inc., Attn: Corporate Secretary, 9601 McAllister Freeway, Suite 610, San Antonio, Texas 78216. In accordance with the rules of the NYSE and the SEC, we currently intend to disclose any future amendments to our Code of Ethics, or waivers from our Code of Ethics for our Chief Executive Officer, Chief Financial Officer and Chief Accounting Officer, by posting such information on our website (
www.HarteHanks.com
) within the time period required by applicable SEC and NYSE rules.
Management Certifications
In accordance with the Sarbanes-Oxley Act of 2002 and SEC rules thereunder, our Chief Executive Officer and Chief Financial Officer have signed certifications under Sarbanes-Oxley Section 302, which have been filed as exhibits to this Form 10-K. In addition, our Chief Executive Officer submitted the most recent annual certification to the NYSE under Section 303A.12(a) of the NYSE listing standards on June 9, 2015.
The information required by this item regarding the compensation of our “named executive officers” and directors and other required information will be set forth in our
2016
Proxy Statement under the captions “Executive Compensation,” and “Director Compensation,” which information is incorporated herein by reference. In accordance with the rules of the SEC, information to be contained in the
2016
Proxy Statement under the caption “Compensation Committee Report” is not deemed to be “filed” with the SEC or subject to the liabilities of the 1934 Act.
ITEM 12.
SECURITY OWNERSHIP OF CERTAIN BENEFICIAL OWNERS AND MANAGEMENT AND RELATED STOCKHOLDER MATTERS
Beneficial Ownership Tables
The information required by this item regarding security ownership of certain beneficial owners, management and directors will be set forth in our
2016
Proxy Statement under the caption “Security Ownership of Management and Principal Stockholders,” which information is incorporated herein by reference.
Equity Compensation Plan Information
The information required by this item regarding securities authorized for issuance under equity compensation plans will be set forth in our
2016
Proxy Statement under the caption “Executive Compensation - Equity Compensation Plan Information at Year-End
2015
,” which information is incorporated herein by reference.
39
Transactions with Related Persons
The information required by this item regarding transactions with related persons, including our policies and procedures for the review, approval or ratification of related person transactions that are required to be disclosed under the SEC’s rules and regulations, will be set forth in our
2016
Proxy Statement under the caption “Corporate Governance—Certain Relationships and Related Transactions,” which information is incorporated herein by reference.
Director Independence
The information required by this item regarding director independence will be set forth in our
2016
Proxy Statement under the caption “Corporate Governance—Independence of Directors,” which information is incorporated herein by reference.
The information required by this item regarding the audit committee’s pre-approval policies and procedures and the disclosures of fees billed by our principal independent auditor will be set forth in our
2016
Proxy Statement under the caption “Audit Committee and Independent Registered Public Accounting Firm,” which information is incorporated herein by reference.
40
|
ITEM 15.
|
|
EXHIBITS AND FINANCIAL STATEMENT SCHEDULES
|
|
15(a)(1)
|
|
Financial Statements
|
|
|
|
|
|
|
|
The financial statements filed as part of this report and referenced in Item 8 are presented in the Consolidated Financial Statements and the notes thereto beginning at page 43 of this Form 10-K (Financial Statements).
|
|
|
|
|
|
15(a)(2)
|
|
Financial Statement Schedules
|
|
|
|
All schedules for which provision is made in the applicable rules and regulations of the SEC have been omitted as the schedules are not required under the related instructions, are not applicable, or the information required thereby is set forth in the Consolidated Financial Statements or notes thereto.
|
|
|
|
|
|
15(a)(3)
|
|
Exhibits
|
|
|
|
|
|
|
|
The Exhibit Index following the Notes to Consolidated Financial Statements in this Form 10-K lists the exhibits that are filed or furnished, as applicable, as part of this Form 10-K.
|
41
SIGNATURES
Pursuant to the requirements of Section 13 or 15(d) of the Securities Exchange Act of 1934, Harte Hanks, Inc. has duly caused this report to be signed on its behalf by the undersigned, thereunto duly authorized.
|
HARTE HANKS, INC.
|
|
||
|
|
|
||
|
By:
|
/s/ Karen A. Puckett
|
|
|
|
|
Karen A. Puckett
|
|
|
|
|
President and Chief Executive Officer
|
|
|
|
Date:
|
March 14, 2016
|
||
Pursuant to the requirements of the Securities Exchange Act of 1934, this report has been signed below by the following persons on behalf of the registrant and in the capacities and on the dates indicated.
|
/s/ Karen A. Puckett
|
|
/s/ Douglas C. Shepard
|
|
Karen A. Puckett
|
|
Douglas C. Shepard
|
|
Director; President and
|
|
Executive Vice President and
|
|
Chief Executive Officer
|
|
Chief Financial Officer
|
|
Date: March 14, 2016
|
Date: March 14, 2016
|
|
|
|
|
|
|
/s/ Carlos M. Alvarado
|
|
/s/ Christopher M. Harte
|
|
Carlos M. Alvarado
|
|
Christopher M. Harte, Chairman
|
|
Vice President, Finance and
|
|
Date: March 14, 2016
|
|
Corporate Controller
|
|
|
|
Date: March 14, 2016
|
|
|
|
|
|
|
|
/s/ Stephen E. Carley
|
|
/s/ Scott C. Key
|
|
Stephen E. Carley, Director
|
|
Scott C. Key, Director
|
|
Date: March 14, 2016
|
Date: March 14, 2016
|
|
|
|
|
|
|
/s/ David L. Copeland
|
|
/s/ Judy C. Odom
|
|
David L. Copeland, Director
|
|
Judy C. Odom, Director
|
|
Date: March 14, 2016
|
|
Date: March 14, 2016
|
|
|
|
|
|
/s/ William F. Farley
|
|
|
|
William F. Farley, Director
|
|
|
|
Date: March 14, 2016
|
|
|
42
Harte Hanks, Inc. and Subsidiaries
Index to Consolidated Financial Statements
|
|
|
|
|
|
|
|
|
|
|
|
|
|
|
|
|
|
All schedules for which provision is made in the applicable rules and regulations of the SEC have been omitted as the schedules are not required under the related instructions, are not applicable, or the information required thereby is set forth in the consolidated financial statements or notes thereto.
43
Report of Independent Registered Public Accounting Firm
The Board of Directors and Stockholders
Harte Hanks, Inc.:
We have audited the accompanying consolidated balance sheets of Harte Hanks, Inc. and subsidiaries as of
December 31, 2015
and
2014
, and the related consolidated statements of comprehensive income (loss), changes in equity, and cash flows for each of the years in the three-year period ended
December 31, 2015
. We also have audited Harte Hanks, Inc.'s internal control over financial reporting as of
December 31, 2015
, based on criteria established in
Internal Control — Integrated Framework (2013)
, issued by the Committee of Sponsoring Organizations of the Treadway Commission. Harte Hanks, Inc.’s management is responsible for these consolidated financial statements, for maintaining effective internal control over financial reporting, and for its assessment of the effectiveness of internal control over financial reporting, included in the accompanying Management’s Report on Internal Control over Financial Reporting. Our responsibility is to express an opinion on these consolidated financial statements and an opinion on Harte Hanks, Inc.’s internal control over financial reporting based on our audits.
We conducted our audits in accordance with the standards of the Public Company Accounting Oversight Board (United States). Those standards require that we plan and perform the audits to obtain reasonable assurance about whether the financial statements are free of material misstatement and whether effective internal control over financial reporting was maintained in all material respects. Our audits of the consolidated financial statements included examining, on a test basis, evidence supporting the amounts and disclosures in the financial statements, assessing the accounting principles used and significant estimates made by management, and evaluating the overall financial statement presentation. Our audit of internal control over financial reporting included obtaining an understanding of internal control over financial reporting, assessing the risk that a material weakness exists, and testing and evaluating the design and operating effectiveness of internal control based on the assessed risk. Our audits also included performing such other procedures as we considered necessary in the circumstances. We believe that our audits provide a reasonable basis for our opinions.
A company’s internal control over financial reporting is a process designed to provide reasonable assurance regarding the reliability of financial reporting and the preparation of financial statements for external purposes in accordance with generally accepted accounting principles. A company’s internal control over financial reporting includes those policies and procedures that (1) pertain to the maintenance of records that, in reasonable detail, accurately and fairly reflect the transactions and dispositions of the assets of the company; (2) provide reasonable assurance that transactions are recorded as necessary to permit preparation of financial statements in accordance with generally accepted accounting principles, and that receipts and expenditures of the company are being made only in accordance with authorizations of management and directors of the company; and (3) provide reasonable assurance regarding prevention or timely detection of unauthorized acquisition, use, or disposition of the company’s assets that could have a material effect on the financial statements.
Because of its inherent limitations, internal control over financial reporting may not prevent or detect misstatements. Also, projections of any evaluation of effectiveness to future periods are subject to the risk that controls may become inadequate because of changes in conditions, or that the degree of compliance with the policies or procedures may deteriorate.
In our opinion, the consolidated financial statements referred to above present fairly, in all material respects, the financial position of Harte Hanks, Inc. and subsidiaries as of
December 31, 2015
and
2014
, and the results of their operations and their cash flows for each of the years in the three-year period ended
December 31, 2015
, in conformity with U.S. generally accepted accounting principles. Also in our opinion, Harte Hanks, Inc. maintained, in all material respects, effective internal control over financial reporting as of
December 31, 2015
, based on criteria established in
Internal Control — Integrated Framework (2013)
, issued by the Committee of Sponsoring Organizations of the Treadway Commission.
As discussed in Note A to the consolidated financial statements, Harte Hanks, Inc. has changed its method of accounting for deferred income taxes effective January 1, 2014 due to the adoption of FASB ASU 2015-17,
Balance Sheet Classification of Deferred Taxes.
Harte Hanks, Inc. acquired 3Q Digital, Inc. during 2015, and management excluded from its assessment of the effectiveness of Harte Hanks, Inc.'s internal control over financial reporting as of December 31, 2015, 3Q Digital, Inc.'s internal control over financial reporting associated with total assets of $7.0 million and total revenues of $17.9 million
44
included in the consolidated financial statements of Harte Hanks, Inc. and subsidiaries as of, and for, the year ended December 31, 2015. Our audit of internal control over financial reporting of Harte Hanks, Inc. also excluded an evaluation of the internal control over financial reporting of 3Q Digital, Inc.
|
/s/ KPMG LLP
|
|
|
|
|
|
San Antonio, Texas
|
|
March 14, 2016
|
45
Management’s Report on Internal Control Over Financial Reporting
We are responsible for the preparation and integrity of the consolidated financial statements appearing in our Annual Report. The consolidated financial statements were prepared in conformity with U.S. Generally Accepted Accounting Principles and include amounts based on management’s estimates and judgments. All other financial information in this report has been presented on a basis consistent with the information included in the consolidated financial statements.
We are also responsible for establishing and maintaining adequate internal control over financial reporting. We maintain a system of internal control that is designed to provide reasonable assurance as to the fair and reliable preparation and presentation of the consolidated financial statements, as well as to safeguard assets from unauthorized use or disposition.
Our control environment is the foundation for our system of internal control over financial reporting. It sets the tone of our organization and includes factors such as integrity and ethical values. Our internal control over financial reporting is supported by formal policies and procedures that are reviewed, modified and improved as changes occur in business conditions and operations.
The Audit Committee of the Board of Directors, which is composed solely of outside directors, meets periodically with members of management, the internal auditors and the independent auditors to review and discuss internal controls over financial reporting and accounting and financial reporting matters. Our independent registered public accounting firm and internal auditors report to the Audit Committee and accordingly have full and free access to the Audit Committee at any time.
We conducted an evaluation of the effectiveness of our internal control over financial reporting based on criteria established in
Internal Control — Integrated Framework
(2013)
issued by the Committee of Sponsoring Organizations of the Treadway Commission (COSO).This evaluation included review of the documentation of controls, evaluation of the design effectiveness of controls, testing of the operating effectiveness of controls and a conclusion on this evaluation.
Our evaluation of, and conclusion regarding, the effectiveness of our internal control over financial reporting excludes the internal control over financial reporting of 3Q Digital, Inc., which we acquired on March 16, 2015 (as described in Note N,
Acquisition and Disposition
, of the Notes to the Consolidated Financial Statements). The exclusion of 3Q Digital, Inc.'s internal control over financial reporting in our evaluation is associated with total assets of $7.0 million as of
December 31, 2015
and total revenues of $17.9 million included in our consolidated financial statements as of and for the year ended
December 31, 2015
. We plan to fully integrate 3Q Digital, Inc. into our internal control over financial reporting in 2016. Based on our evaluation, we concluded that our internal control over financial reporting was effective as of
December 31, 2015
.
KPMG LLP, an independent registered public accounting firm, has issued an audit report on our consolidated financial statements and the effectiveness of the company’s internal control over financial reporting, which is contained in this Annual Report on Form 10-K.
46
|
March 14, 2016
|
|
|
|
|
|
|
/s/ Karen A. Puckett
|
|
|
Karen A. Puckett
|
|
|
President and Chief Executive Officer
|
|
|
|
|
|
/s/ Douglas C. Shepard
|
|
|
Douglas C. Shepard
|
|
|
Executive Vice President and
|
|
|
Chief Financial Officer
|
|
|
|
|
|
/s/ Carlos M. Alvarado
|
|
|
Carlos M. Alvarado
|
|
|
Vice President, Finance and
|
|
|
Corporate Controller
|
47
Harte Hanks, Inc. and Subsidiaries Consolidated Balance Sheets
|
|
December 31,
|
|||||||
|
In thousands, except per share and share amounts
|
2015
|
2014
|
||||||
|
ASSETS
|
|
|
|
|
||||
|
Current assets
|
|
|
|
|
||||
|
Cash and cash equivalents
|
$
|
17,613
|
|
$
|
56,749
|
|
||
|
Accounts receivable
(less allowance for doubtful accounts of $1,249 at December 31, 2015 and $1,224 at December 31, 2014)
|
115,155
|
|
125,295
|
|
||||
|
Inventory
|
963
|
|
1,235
|
|
||||
|
Prepaid expenses
|
9,548
|
|
9,000
|
|
||||
|
Prepaid income tax
|
1,760
|
|
1,185
|
|
||||
|
Other current assets
|
6,667
|
|
7,953
|
|
||||
|
Total current assets
|
$
|
151,706
|
|
$
|
201,417
|
|
||
|
Property, plant and equipment
|
|
|
|
|
||||
|
Buildings and improvements
|
17,207
|
|
17,112
|
|
||||
|
Software
|
84,780
|
|
88,422
|
|
||||
|
Equipment and furniture
|
101,083
|
|
102,688
|
|
||||
|
Software development and equipment installations in progress
|
2,258
|
|
2,390
|
|
||||
|
Gross property, plant and equipment
|
205,328
|
|
210,612
|
|
||||
|
Less accumulated depreciation and amortization
|
(171,415
|
)
|
(173,699
|
)
|
||||
|
Net property, plant and equipment
|
33,913
|
|
36,913
|
|
||||
|
Goodwill
|
218,972
|
|
398,164
|
|
||||
|
Other intangible assets
(less accumulated amortization of $650 at December 31, 2015 and $9,774 at December 31, 2014)
|
4,123
|
|
2,277
|
|
||||
|
Other assets
(including deferred income taxes of $3,000 at December 31, 2015 and $2,055 at December 31, 2014)
|
5,907
|
|
5,406
|
|
||||
|
Total assets
|
$
|
414,621
|
|
$
|
644,177
|
|
||
|
LIABILITIES AND STOCKHOLDERS’ EQUITY
|
|
|
|
|
||||
|
Current liabilities
|
|
|
|
|
||||
|
Current maturities of long-term debt
|
$
|
3,000
|
|
$
|
18,375
|
|
||
|
Accounts payable
|
38,287
|
|
36,478
|
|
||||
|
Accrued payroll and related expenses
|
8,340
|
|
9,773
|
|
||||
|
Deferred revenue and customer advances
|
27,426
|
|
33,631
|
|
||||
|
Income taxes payable
|
1,246
|
|
2,462
|
|
||||
|
Customer postage and program deposits
|
12,513
|
|
17,120
|
|
||||
|
Other current liabilities
|
6,628
|
|
6,430
|
|
||||
|
Total current liabilities
|
97,440
|
|
124,269
|
|
||||
|
Long-term debt
|
74,313
|
|
64,312
|
|
||||
|
Pensions
|
55,491
|
|
65,156
|
|
||||
|
Contingent consideration
|
20,277
|
|
—
|
|
||||
|
Other long-term liabilities
(including deferred income taxes of $20,672 at December 31, 2015 and $56,510 at December 31, 2014)
|
26,784
|
|
63,764
|
|
||||
|
Total liabilities
|
$
|
274,305
|
|
$
|
317,501
|
|
||
|
Stockholders’ equity
|
|
|
|
|
||||
|
Common stock, $1 par value, 250,000,000 shares authorized 120,146,720 shares issued at December 31, 2015 and 119,606,551 shares issued at December 31, 2014
|
120,147
|
|
119,607
|
|
||||
|
Additional paid-in capital
|
353,050
|
|
346,239
|
|
||||
|
Retained earnings
|
973,538
|
|
1,165,707
|
|
||||
|
Less treasury stock, 58,879,742 shares at cost at December 31, 2015 and 57,832,362 shares at cost at December 31, 2014
|
(1,262,859
|
)
|
(1,257,648
|
)
|
||||
|
Accumulated other comprehensive loss
|
(43,560
|
)
|
(47,229
|
)
|
||||
|
Total stockholders’ equity
|
140,316
|
|
326,676
|
|
||||
|
Total liabilities and stockholders’ equity
|
$
|
414,621
|
|
$
|
644,177
|
|
||
See Accompanying Notes to Consolidated Financial Statements.
48
Harte Hanks, Inc. and Subsidiaries Consolidated Statements of Comprehensive Income (Loss)
|
|
Years Ended December 31,
|
|||||||||||
|
In thousands, except per share amounts
|
2015
|
2014
|
2013
|
|||||||||
|
Operating revenues
|
$
|
495,301
|
|
$
|
553,676
|
|
$
|
559,609
|
|
|||
|
Operating expenses
|
|
|
|
|
|
|
||||||
|
Labor
|
260,839
|
|
279,135
|
|
281,924
|
|
||||||
|
Production and distribution
|
143,324
|
|
166,959
|
|
161,600
|
|
||||||
|
Advertising, selling, general and administrative
|
54,530
|
|
51,900
|
|
54,937
|
|
||||||
|
Goodwill and intangible assets impairment
|
209,938
|
|
—
|
|
2,750
|
|
||||||
|
Depreciation, software and intangible asset amortization
|
14,245
|
|
14,920
|
|
15,737
|
|
||||||
|
Total operating expenses
|
682,876
|
|
512,914
|
|
516,948
|
|
||||||
|
Operating income (loss)
|
(187,575
|
)
|
40,762
|
|
42,661
|
|
||||||
|
Other expenses
|
|
|
|
|
|
|
||||||
|
Interest expense, net
|
4,759
|
|
2,559
|
|
2,998
|
|
||||||
|
Loss on sale
|
9,501
|
|
—
|
|
—
|
|
||||||
|
Other, net
|
1,007
|
|
897
|
|
46
|
|
||||||
|
|
15,267
|
|
3,456
|
|
3,044
|
|
||||||
|
Income (loss) from continuing operations before income taxes
|
(202,842
|
)
|
37,306
|
|
39,617
|
|
||||||
|
Income tax expense (benefit)
|
(31,914
|
)
|
13,315
|
|
15,176
|
|
||||||
|
Income (loss) from continuing operations
|
(170,928
|
)
|
23,991
|
|
24,441
|
|
||||||
|
Income from discontinued operations, net of income taxes
|
—
|
|
—
|
|
1,284
|
|
||||||
|
Loss on sales of discontinued operations, net of income taxes
|
—
|
|
—
|
|
(12,355
|
)
|
||||||
|
Loss from discontinued operations
|
—
|
|
—
|
|
(11,071
|
)
|
||||||
|
Net income (loss)
|
$
|
(170,928
|
)
|
$
|
23,991
|
|
$
|
13,370
|
|
|||
|
Basic earnings (loss) per common share
|
|
|
|
|
|
|
||||||
|
Continuing operations
|
$
|
(2.77
|
)
|
$
|
0.38
|
|
$
|
0.39
|
|
|||
|
Discontinued operations
|
—
|
|
—
|
|
(0.18
|
)
|
||||||
|
Basic earnings (loss) per common share
|
$
|
(2.77
|
)
|
$
|
0.38
|
|
$
|
0.21
|
|
|||
|
Weighted-average common shares outstanding
|
61,643
|
|
62,444
|
|
62,503
|
|
||||||
|
Diluted earnings (loss) per common share
|
|
|
|
|
|
|
||||||
|
Continuing operations
|
$
|
(2.77
|
)
|
$
|
0.38
|
|
$
|
0.39
|
|
|||
|
Discontinued operations
|
—
|
|
—
|
|
(0.18
|
)
|
||||||
|
Diluted earnings (loss) per common share
|
$
|
(2.77
|
)
|
$
|
0.38
|
|
$
|
0.21
|
|
|||
|
Weighted-average common and common equivalent shares outstanding
|
61,643
|
|
62,658
|
|
62,812
|
|
||||||
|
Other comprehensive income (loss), net of tax
|
|
|
|
|
|
|
||||||
|
Adjustment to pension liability
|
$
|
5,645
|
|
$
|
(17,281
|
)
|
$
|
22,152
|
|
|||
|
Foreign currency translation adjustments
|
(1,976
|
)
|
(1,830
|
)
|
(536
|
)
|
||||||
|
Total other comprehensive income (loss), net of tax
|
3,669
|
|
(19,111
|
)
|
21,616
|
|
||||||
|
Comprehensive income (loss)
|
$
|
(167,259
|
)
|
$
|
4,880
|
|
$
|
34,986
|
|
|||
See Accompanying Notes to Consolidated Financial Statements.
49
Harte Hanks, Inc. and Subsidiaries Consolidated Statements of Cash Flows
|
|
Years Ended December 31,
|
|||||||||||
|
In thousands
|
2015
|
2014
|
2013
|
|||||||||
|
Cash Flows from Operating Activities
|
|
|
|
|
|
|
||||||
|
Net income (loss)
|
$
|
(170,928
|
)
|
$
|
23,991
|
|
$
|
13,370
|
|
|||
|
Adjustments to reconcile net income (loss) to net cash provided by operating activities
|
|
|
|
|
|
|
||||||
|
Loss on sale
|
9,501
|
|
—
|
|
—
|
|
||||||
|
Income from discontinued operations
|
—
|
|
—
|
|
(1,284
|
)
|
||||||
|
Loss on sale of discontinued operations
|
—
|
|
—
|
|
12,355
|
|
||||||
|
Impairment of goodwill and intangible assets
|
209,938
|
|
—
|
|
2,750
|
|
||||||
|
Depreciation and software amortization
|
13,586
|
|
14,894
|
|
15,530
|
|
||||||
|
Intangible asset amortization
|
659
|
|
26
|
|
206
|
|
||||||
|
Stock-based compensation
|
5,733
|
|
4,055
|
|
5,744
|
|
||||||
|
Excess tax benefits from stock-based compensation
|
(14
|
)
|
—
|
|
(42
|
)
|
||||||
|
Net pension cost (payments)
|
(257
|
)
|
(2,860
|
)
|
784
|
|
||||||
|
Interest accretion on contingent consideration
|
2,337
|
|
—
|
|
—
|
|
||||||
|
Deferred income taxes
|
(41,235
|
)
|
5,798
|
|
1,744
|
|
||||||
|
Other, net
|
333
|
|
—
|
|
(2,606
|
)
|
||||||
|
Changes in operating assets and liabilities, net of acquisitions:
|
0
|
|
-5173
|
|
7630
|
|
||||||
|
Decrease (increase) in accounts receivable, net
|
10,187
|
|
(5,173
|
)
|
7,630
|
|
||||||
|
Decrease (increase) in inventory
|
272
|
|
51
|
|
(507
|
)
|
||||||
|
Decrease (increase) in prepaid expenses and other current assets
|
802
|
|
3,316
|
|
(2,536
|
)
|
||||||
|
Increase (decrease) in accounts payable
|
2,141
|
|
(278
|
)
|
(1,336
|
)
|
||||||
|
(Decrease) increase in other accrued expenses and liabilities
|
(12,550
|
)
|
(20,055
|
)
|
9,398
|
|
||||||
|
Other, net
|
438
|
|
1,796
|
|
(17,089
|
)
|
||||||
|
Net cash provided by continuing operations
|
30,943
|
|
25,561
|
|
44,111
|
|
||||||
|
Net cash provided by discontinued operations
|
—
|
|
—
|
|
15,461
|
|
||||||
|
Net cash provided by operating activities
|
30,943
|
|
25,561
|
|
59,572
|
|
||||||
|
Cash Flows from Investing Activities
|
||||||||||||
|
Acquisitions, net of cash acquired
|
(29,862
|
)
|
—
|
|
—
|
|
||||||
|
Dispositions, net of cash transferred
|
4,974
|
|
—
|
|
—
|
|
||||||
|
Purchases of property, plant and equipment
|
(11,574
|
)
|
(11,265
|
)
|
(15,873
|
)
|
||||||
|
Proceeds from the sale of property, plant and equipment
|
297
|
|
169
|
|
3,723
|
|
||||||
|
Net cash flows from investing activities within discontinued operations
|
—
|
|
—
|
|
22,500
|
|
||||||
|
Net cash provided by (used in) investing activities
|
(36,165
|
)
|
(11,096
|
)
|
10,350
|
|
||||||
|
Cash Flows from Financing Activities
|
||||||||||||
|
Borrowings
|
13,000
|
|
—
|
|
—
|
|
||||||
|
Repayment of borrowings
|
(18,375
|
)
|
(15,313
|
)
|
(12,250
|
)
|
||||||
|
Debt financing costs
|
—
|
|
—
|
|
(581
|
)
|
||||||
|
Issuance of common stock
|
(910
|
)
|
(481
|
)
|
512
|
|
||||||
|
Excess tax benefits from stock-based compensation
|
14
|
|
—
|
|
42
|
|
||||||
|
Purchase of treasury stock
|
(4,619
|
)
|
(8,661
|
)
|
(1,760
|
)
|
||||||
|
Issuance of treasury stock
|
193
|
|
1,307
|
|
135
|
|
||||||
|
Dividends paid
|
(21,241
|
)
|
(21,485
|
)
|
(16,121
|
)
|
||||||
|
Net cash used in financing activities
|
(31,938
|
)
|
(44,633
|
)
|
(30,023
|
)
|
||||||
|
Effect of exchange rate changes on cash and cash equivalents
|
(1,976
|
)
|
(1,830
|
)
|
(536
|
)
|
||||||
|
Net increase (decrease) in cash and cash equivalents
|
(39,136
|
)
|
(31,998
|
)
|
39,363
|
|
||||||
|
Cash and cash equivalents at beginning of year
|
56,749
|
|
88,747
|
|
49,384
|
|
||||||
|
Cash and cash equivalents at end of year
|
$
|
17,613
|
|
$
|
56,749
|
|
$
|
88,747
|
|
|||
See Accompanying Notes to Consolidated Financial Statements.
50
Harte Hanks, Inc. and Subsidiaries Consolidated Statements of Changes in Equity
|
In thousands, except per share amounts
|
Common
Stock
|
Additional
Paid-in
Capital
|
Retained
Earnings
|
Treasury
Stock
|
Accumulated
Other
Comprehensive
Income(loss)
|
Total
Stockholders’
Equity
|
||||||||||||||||||
|
Balance at December 31, 2012
|
$
|
118,737
|
|
$
|
341,586
|
|
$
|
1,165,952
|
|
$
|
(1,248,377
|
)
|
$
|
(49,734
|
)
|
$
|
328,164
|
|
||||||
|
Exercise of stock options and release of unvested shares
|
450
|
|
469
|
|
—
|
|
(407
|
)
|
—
|
|
512
|
|
||||||||||||
|
Net tax effect of stock options exercised and release of unvested shares
|
—
|
|
(2,606
|
)
|
—
|
|
—
|
|
—
|
|
(2,606
|
)
|
||||||||||||
|
Stock-based compensation
|
—
|
|
5,744
|
|
—
|
|
—
|
|
—
|
|
5,744
|
|
||||||||||||
|
Dividends paid ($0.225 per share)
|
—
|
|
—
|
|
(16,121
|
)
|
—
|
|
—
|
|
(16,121
|
)
|
||||||||||||
|
Treasury stock issued
|
—
|
|
(98
|
)
|
—
|
|
135
|
|
—
|
|
37
|
|
||||||||||||
|
Purchase of treasury stock
|
—
|
|
—
|
|
—
|
|
(1,662
|
)
|
—
|
|
(1,662
|
)
|
||||||||||||
|
Net income
|
—
|
|
—
|
|
13,370
|
|
—
|
|
—
|
|
13,370
|
|
||||||||||||
|
Other comprehensive income
|
—
|
|
—
|
|
—
|
|
—
|
|
21,616
|
|
21,616
|
|
||||||||||||
|
Balance at December 31, 2013
|
$
|
119,187
|
|
$
|
345,095
|
|
$
|
1,163,201
|
|
$
|
(1,250,311
|
)
|
$
|
(28,118
|
)
|
$
|
349,054
|
|
||||||
|
Exercise of stock options and release of unvested shares
|
420
|
|
(151
|
)
|
—
|
|
(750
|
)
|
—
|
|
(481
|
)
|
||||||||||||
|
Net tax effect of stock options exercised and release of unvested shares
|
—
|
|
(1,993
|
)
|
—
|
|
—
|
|
—
|
|
(1,993
|
)
|
||||||||||||
|
Stock-based compensation
|
—
|
|
4,055
|
|
—
|
|
—
|
|
—
|
|
4,055
|
|
||||||||||||
|
Dividends paid ($0.34 per share)
|
—
|
|
—
|
|
(21,485
|
)
|
—
|
|
—
|
|
(21,485
|
)
|
||||||||||||
|
Treasury stock issued
|
—
|
|
(767
|
)
|
—
|
|
1,307
|
|
—
|
|
540
|
|
||||||||||||
|
Purchase of treasury stock
|
—
|
|
—
|
|
—
|
|
(7,894
|
)
|
—
|
|
(7,894
|
)
|
||||||||||||
|
Net income
|
—
|
|
—
|
|
23,991
|
|
—
|
|
—
|
|
23,991
|
|
||||||||||||
|
Other comprehensive loss
|
—
|
|
—
|
|
—
|
|
—
|
|
(19,111
|
)
|
(19,111
|
)
|
||||||||||||
|
Balance at December 31, 2014
|
$
|
119,607
|
|
$
|
346,239
|
|
$
|
1,165,707
|
|
$
|
(1,257,648
|
)
|
$
|
(47,229
|
)
|
$
|
326,676
|
|
||||||
|
Exercise of stock options and release of unvested shares
|
540
|
|
(329
|
)
|
—
|
|
(1,120
|
)
|
—
|
|
(909
|
)
|
||||||||||||
|
Net tax effect of stock options exercised and release of unvested shares
|
—
|
|
1,742
|
|
—
|
|
—
|
|
—
|
|
1,742
|
|
||||||||||||
|
Stock-based compensation
|
—
|
|
5,733
|
|
—
|
|
—
|
|
—
|
|
5,733
|
|
||||||||||||
|
Dividends paid ($0.34 per share)
|
—
|
|
—
|
|
(21,241
|
)
|
—
|
|
—
|
|
(21,241
|
)
|
||||||||||||
|
Treasury stock issued
|
—
|
|
(335
|
)
|
—
|
|
528
|
|
—
|
|
193
|
|
||||||||||||
|
Purchase of treasury stock
|
—
|
|
—
|
|
—
|
|
(4,619
|
)
|
—
|
|
(4,619
|
)
|
||||||||||||
|
Net loss
|
—
|
|
—
|
|
(170,928
|
)
|
—
|
|
—
|
|
(170,928
|
)
|
||||||||||||
|
Other comprehensive income
|
—
|
|
—
|
|
—
|
|
—
|
|
3,669
|
|
3,669
|
|
||||||||||||
|
Balance at December 31, 2015
|
$
|
120,147
|
|
$
|
353,050
|
|
$
|
973,538
|
|
$
|
(1,262,859
|
)
|
$
|
(43,560
|
)
|
$
|
140,316
|
|
||||||
See Accompanying Notes to Consolidated Financial Statements.
51
Harte Hanks, Inc. and Subsidiaries Notes to Consolidated Financial Statements
Note A — Significant Accounting Policies
Consolidation
The accompanying consolidated financial statements present the financial position and the results of operations and cash flows of Harte Hanks, Inc. and its subsidiaries. All intercompany accounts and transactions have been eliminated in consolidation.
As used in this report, the terms “Harte Hanks,” “we,” “us,” or “our” may refer to Harte Hanks, Inc., one or more of our consolidated subsidiaries, or all of them taken as a whole.
Discontinued Operations
As discussed in Note O,
Discontinued Operations
, we sold the assets of our California Shoppers operations on September 27, 2013. The operating results and related balances of Shoppers, including the loss on the sale, are being reported as discontinued operations in the Consolidated Financial Statements. Unless otherwise stated, amounts related to the Shoppers operations are excluded from the Notes to Consolidated Financial Statements for all years presented.
Reclassification of Prior Year Amounts
Certain prior year amounts have been reclassified for comparative purposes. All 2013 amounts related to discontinued operations have been reclassified for comparative purposes.
The retrospective early adoption of ASU 2015-17,
Income Taxes (Topic 740): Balance Sheet Classification of Deferred Taxes,
resulted in the reclassification of current deferred tax assets to non-current on the company's consolidated balance sheet as of December 31, 2014.
Use of Estimates
The preparation of consolidated financial statements in conformity with U.S. generally accepted accounting principles (U.S. GAAP) requires management to make estimates and assumptions that affect the reported amounts of assets and liabilities and disclosure of contingent assets and liabilities at the date of the consolidated financial statements and the reported amounts of revenues and expenses during the reporting periods. Actual results and outcomes could differ from those estimates and assumptions. Such estimates include, but are not limited to, estimates related to pension accounting; estimates related to fair value for purposes of assessing goodwill, long-lived assets and intangible assets for impairment; estimates related to income taxes; and estimates related to contingencies. On an ongoing basis, management reviews its estimates based on currently available information. Changes in facts and circumstances could result in revised estimates and assumptions.
The “Labor” line in the Consolidated Statements of Comprehensive Income (Loss) includes all employee payroll and benefits, including stock-based compensation, along with temporary labor costs. The “Production and distribution” and “Advertising, selling, general and administrative” lines do not include labor, depreciation or amortization.
Revenue Recognition
We recognize revenue when all of the following criteria are satisfied: (i) persuasive evidence of an arrangement exists; (ii) the price is fixed or determinable; (iii) collectability is reasonably assured; and (iv) the service has been performed or the product has been delivered.
Payments received in advance of the performance of services or delivery of the product are recorded as deferred revenue until such time as the services are performed or the product is delivered.
Our accounting policy for revenue recognition has an impact on our reported results and relies on certain estimates that require judgments on the part of management.
Revenue is derived from a variety of services and products, and may be billed at hourly rates, monthly rates, or a fixed price. For all sales, we require either a purchase order, a statement of work signed by the client, a written contract, or some other form of written authorization from the client.
52
Revenue from agency and creative services, analytical services, and market research is typically billed based on time and materials.
Revenue from email marketing, social media marketing, digital marketing techniques such as search engine maximization ("SEM"), and other digital solutions is recognized as the work is performed. Revenue from these services is typically based on a fixed price or rate given to the client.
Revenue associated with new marketing database builds is deferred until complete or until client acceptance. Upon completion or acceptance, revenue and direct build costs are then recognized over the term of the related arrangement as the services are provided. Revenue from database and website hosting services is recognized ratably over the contractual hosting period. Pricing for database builds are typically based on a fixed price and hosting fees are typically based on a fixed price per month or per contract.
Revenue from technology database subscriptions is based on a fixed price and is recognized ratably over the term of the subscription. Revenue from stand-alone technology data sales is recognized at the time of delivery.
Revenue from services such as data processing, printing, personalization of communication pieces using laser and inkjet printing, targeted mail, and transportation logistics is recognized as the work is performed. Revenue from these services is typically based on a fixed price or rate given to the client. Postage costs of mailings in our direct mail business are borne by our clients and are not directly reflected in our revenues or expenses.
Revenue related to fulfillment and contact centers, including inbound and outbound calling and email management, is also typically based on a fixed price per transaction or service provided. Revenue from these services is recognized as the service or activity is performed.
Revenue from software arrangements involving multiple elements is allocated to each element based on the vendor-specific objective evidence of fair values of the respective elements. For software sales with multiple elements (for example, software licenses with undelivered post-contract customer support or “PCS”), we allocate revenue to each component of the arrangement using the residual value method based on the fair value of the undelivered elements. This means we defer revenue from the software sale equal to the fair value of the undelivered elements. The fair value of PCS is based upon separate sales of renewals to other clients. The fair value of services, such as training and consulting, is based upon separate sales of these services to other clients.
The revenue allocated to PCS is recognized ratably over the term of the support period. Revenue allocated to professional services is recognized as the services are performed. The revenue allocated to software products, including time-based software licenses, is recognized, if collection is probable, upon execution of a licensing agreement and shipment of the software or ratably over the term of the license, depending on the structure and terms of the arrangement. If the licensing agreement is for a term of a year or less and includes PCS, we recognize the software and the PCS revenue ratably over the term of the license.
For certain non-software arrangements, we enter into contracts that include delivery of a combination of our service offerings. Such arrangements are divided into separate units of accounting, provided that the delivered element(s) has stand-alone value and objective and reliable evidence of the fair value of the undelivered element(s) exist(s).
When we are able to un-bundle the arrangement into separate units of accounting, revenue from each service is recognized separately, and in accordance with our revenue recognition policy for each element. If we are unable to un-bundle the arrangement into separate units of accounting, we apply one of the revenue recognition policies to the entire arrangement. This might impact the timing of revenue recognition, but would not change the total revenue recognized from the arrangement.
Taxes collected from customers and remitted to governmental authorities are accounted for on a net basis and therefore are excluded from our revenues and expenses.
Cash Equivalents
All highly liquid investments with an original maturity of 90 days or less at the time of purchase are considered to be cash equivalents. Cash equivalents are carried at cost, which approximates fair value.
53
Allowance for Doubtful Accounts
We maintain our allowance for doubtful accounts at a balance adequate to reduce accounts receivable to the amount of cash expected to be realized upon collection. The methodology used to determine the minimum allowance balance is based on our prior collection experience and is generally related to the accounts receivable balance in various aging categories. The balance is also influenced by specific clients’ financial strength and circumstances and current market conditions. Accounts that are determined to be uncollectible are written off in the period in which they are determined to be uncollectible. Periodic changes to the allowance balance are recorded as increases or decreases to bad debt expense, which is included in the “Advertising, selling, general and administrative” line of our Consolidated Statements of Comprehensive Income (Loss). The changes in the allowance for doubtful accounts consisted of the following:
|
|
Year Ended December 31,
|
|||||||||||
|
In thousands
|
2015
|
2014
|
2013
|
|||||||||
|
Balance at beginning of year
|
$
|
1,224
|
|
$
|
1,729
|
|
$
|
2,574
|
|
|||
|
Increase in allowance charged to expense
|
630
|
|
(68
|
)
|
47
|
|
||||||
|
Account charges against the expense
|
(605
|
)
|
(437
|
)
|
(892
|
)
|
||||||
|
Balance at end of year
|
$
|
1,249
|
|
$
|
1,224
|
|
$
|
1,729
|
|
|||
Inventory
Inventory, consisting primarily of print materials and operating supplies, is stated at the lower of cost (first-in, first-out method) or market.
Property, Plant and Equipment
Property, plant and equipment are stated on the basis of cost. Depreciation is computed using the straight-line method over the estimated useful lives of the assets. The general ranges of estimated useful lives are:
|
Buildings and improvements
|
10
|
to
|
40 years
|
|
Software
|
3
|
to
|
10 years
|
|
Equipment and furniture
|
3
|
to
|
20 years
|
Long-lived assets such as property, plant and equipment are reviewed for impairment whenever events or changes in circumstances indicate that the carrying amount of an asset may not be recoverable. The carrying amount of a long-lived asset group is not recoverable if it exceeds the sum of the undiscounted cash flows expected to result from the use and eventual disposition of the asset group. We did not record an impairment of long-lived assets in
2015
,
2014
, or
2013
.
Property, plant and equipment includes capital lease assets. Capital lease assets at
December 31, 2015
and
2014
consisted of:
|
|
December 31,
|
|||||||
|
In thousands
|
2015
|
2014
|
||||||
|
Equipment and furniture
|
$
|
1,088
|
|
$
|
1,351
|
|
||
|
Less accumulated amortization
|
(767
|
)
|
(980
|
)
|
||||
|
Net book value
|
$
|
321
|
|
$
|
371
|
|
||
Amortization expense related to capital lease assets was
$0.1 million
,
$0.2 million
, and
$0.3 million
for the years ended
December 31, 2015
,
2014
, and
2013
, respectively.
Depreciation and amortization on property, plant and equipment was
$13.6 million
,
$14.7 million
and
$15.4 million
for the years ended
December 31, 2015
,
2014
, and
2013
, respectively.
Goodwill and Other Intangible Assets
Goodwill is not subject to amortization but is tested for impairment on an annual basis (or more frequently if impairment indicators arise). We have established November 30 as the date for our annual test for impairment of goodwill. Reporting units with goodwill are tested for impairment by first assessing qualitative factors to determine whether the existence of events or circumstances leads to a determination that is more likely than not that the fair value of the reporting unit is less than its carrying amount. If after assessing the totality of events or circumstances, or based on management's judgment, we determine it is more likely that not that the fair value of a reporting unit is less than its carrying amount,
54
a two-step impairment test is performed. The first step compares the fair value of the reporting unit (measured as the present value of expected future cash flows) to its carrying amount. If the fair value of the reporting units is less than its carrying amount, a second step is performed. In this step, the fair value of the reporting unit is less than its carrying amount, a second step is performed. In this step, the fair value of the reporting unit is allocated to its assets and liabilities to determine the implied fair value of goodwill, which is used to measure the impairment loss.
Our indefinite life intangibles are evaluated for impairment using a qualitative assessment. If it is more likely than not that the asset is impaired, the amount by which the carrying value exceeds the fair value is recorded as impairment expense.
Our acquired intangible assets are amortized on a straight-line basis over their estimated useful lives, which generally range from 7 to 40 years. Our acquired intangible assets do not have indefinite lives. Intangible assets are reviewed for impairment whenever events or changes in circumstances indicate the carrying amount of the intangible asset may not be recoverable. The carrying amount of an intangible asset is not recoverable if it exceeds the sum of the undiscounted cash flows expected to result from the use and eventual disposition of the asset. If it is determined that an impairment loss has occurred, the loss is measured as the amount by which the carrying amount of the intangible asset exceeds its fair value.
Goodwill is recorded to the extent that the purchase price of an acquisition exceeds the fair value of the identifiable net assets acquired. Other intangibles with definite and indefinite useful lives are recorded at fair value at the date of the acquisition. The company tests its goodwill and other intangible assets with indefinite useful lives for impairment as of November 30 of each year and as of an interim date should factors or indicators become apparent that would require an interim test. We have
two
reportable segments, which also represent our reporting units — Customer Interaction and Trillium Software. The company performs a qualitative assessment to determine whether fair value may be less than carrying value and, if necessary, assesses the impairment of its goodwill by determining the fair value of each of its reporting units and comparing the fair value to the carrying value for each reporting unit. Fair values of our reporting units and other intangibles with indefinite useful lives have been determined using discounted cash flow and cash flow multiple methodologies. Our overall market capitalization also was considered when evaluating the fair values of our reporting units. Intangible assets with definite useful lives are amortized over their respective estimated useful lives and reviewed for impairment if we believe that changes or triggering events have occurred that could have caused the carrying value of the intangible assets to exceed its fair value.
Under the provisions of FASB ASC 350, Intangibles-Goodwill and Other (ASC 350), goodwill is tested for impairment at least annually, or more frequently if events or circumstances indicate that it is “more likely than not” that goodwill might be impaired. Such events could include a significant change in business conditions, a significant negative regulatory outcome or other events that could negatively affect our business and financial performance. We perform our annual goodwill impairment assessment as of November 30th of each year for each of our reportable segments.
Income Taxes
Income taxes are accounted for under the asset and liability method. Deferred tax assets and liabilities are recognized for the future tax consequences attributable to differences between the financial statements carrying amounts of existing assets and liabilities and their respective tax basis and operating loss and tax credit carryforwards. Deferred tax assets and liabilities are measured using enacted tax rates expected to apply to taxable income in the years in which those temporary differences are expected to be recovered or settled. Valuation allowances have been established where we have assessed that it is more likely than not that certain deferred tax assets will not be realized. The effect on deferred tax assets and liabilities of a change in tax rates is recognized in income in the period that includes the enactment date. The company recognized the effect of income tax positions only if those positions are more likely than not of being sustained.
Earnings Per Share
Basic earnings per common share are based upon the weighted-average number of common shares outstanding during the period. Diluted earnings per common share are based upon the weighted-average number of common shares and dilutive common stock equivalents outstanding during the period. Dilutive common stock equivalents are calculated based on the assumed exercise of stock options and vesting of unvested shares using the treasury stock method.
55
Stock-Based Compensation
All share-based awards are recognized as operating expense in the “Labor” line of the Consolidated Statements of Comprehensive Income (Loss). Calculated expense is based on the fair values of the awards on the date of grant and is recognized over the requisite service period.
Reserve for Healthcare, Workers’ Compensation, Automobile and General Liability
We are self-insured for our workers’ compensation, automobile, general liability and the majority of our healthcare insurance. We make various subjective judgments about a number of factors in determining our reserve for healthcare, workers’ compensation, automobile and general liability insurance, and the related expense. Our deductible for individual healthcare claims is
$0.3 million
. Our deductible for workers’ compensation is
$0.5 million
. We have a
$0.3 million
deductible for automobile and general liability claims. Our insurance administrator provides us with estimated loss reserves, based upon its experience dealing with similar types of claims, as well as amounts paid to date against these claims. We apply actuarial factors to both insurance estimated loss reserves and to paid claims and then determine reserve levels, taking into account these calculations. At
December 31, 2015
and
2014
, our reserve for healthcare, workers’ compensation, net, automobile and general liability was
$6.1 million
and
$7.8 million
, respectively. Periodic changes to the reserve for workers’ compensation, automobile and general liability are recorded as increases or decreases to insurance expense, which is included in the “Advertising, selling, general and administrative” line of our Consolidated Statements of Comprehensive Income (Loss). Periodic changes to the reserve for healthcare are recorded as increases or decreases to employee benefits expense, which is included in the “Labor” line of our Consolidated Statements of Comprehensive Income (Loss).
Foreign Currencies
In most instances the functional currencies of our foreign operations are the local currencies. Assets and liabilities recorded in foreign currencies are translated in U.S. dollars at the exchange rate on the balance sheet date. Revenue and expenses are translated at average rates of exchange prevailing during a given month. Adjustments resulting from this translation are charged or credited to other comprehensive loss.
Geographic Concentrations
Depending on the needs of our clients, our services are provided in an integrated approach through more than
30
facilities worldwide, of which
6
are located outside of the U.S.
Information about the operations in different geographic areas:
|
|
Year Ended December 31,
|
|||||||||||
|
In thousands
|
2015
|
2014
|
2013
|
|||||||||
|
Revenue
(1)
|
|
|
|
|
|
|
||||||
|
United States
|
$
|
411,775
|
|
$
|
463,752
|
|
$
|
469,596
|
|
|||
|
Other countries
|
83,526
|
|
89,924
|
|
90,013
|
|
||||||
|
Total revenue
|
$
|
495,301
|
|
$
|
553,676
|
|
$
|
559,609
|
|
|||
|
|
December 31,
|
|||||||
|
In thousands
|
2015
|
2014
|
||||||
|
Property, plant and equipment
(2)
|
|
|
|
|
||||
|
United States
|
$
|
29,437
|
|
$
|
33,134
|
|
||
|
Other countries
|
4,476
|
|
3,779
|
|
||||
|
Total property, plant and equipment
|
$
|
33,913
|
|
$
|
36,913
|
|
||
|
(1)
|
Geographic revenues are based on the location of the service being performed.
|
|
(2)
|
Property, plant and equipment are based on physical location.
|
Recent Accounting Pronouncements
In November 2015, the FASB issued ASU 2015-17,
Income Taxes (Topic 740): Balance Sheet Classification of Deferred Taxes
, which requires entities with a classified balance sheet to present all deferred tax assets and liabilities as non-current. The ASU is effective for public business entities for interim and annual periods in fiscal years beginning after December 15, 2016. Early adoption is permitted. On December 31, 2015, we elected to early adopt retrospectively, thus reclassifying
$3.7 million
and
$5.1 million
of current deferred tax assets to non-current at December 31, 2015 and 2014, respectively.
56
In September 2015, the FASB issued ASU 2015-16,
Business Combinations: Simplifying the Accounting for Measurement-Period Adjustments
. The ASU requires that an acquirer recognize adjustments to provisional amounts that are identified during the measurement period after an acquisition within the reporting period they are determined. This is a change from the previous requirement that the adjustments be recorded retrospectively. The ASU also requires disclosure of the effect on earnings of changes in depreciation, amortization, or other income effects, if any, as a result of the adjustment to the provisional amounts, calculated as if the accounting had been completed at the acquisition dates. The ASU is effective for interim and annual periods beginning after December 15, 2015. Early adoption is permitted. The company has early adopted the ASU as of September 30, 2015. The adoption did not have a material impact on our consolidated financial statements.
In August 2015, the FASB issued ASU 2015-12,
Plan Accounting: Defined Benefit Pension Plans, Defined Contribution Pension Plans, Health and Welfare Benefit Plans. (Part II), Plan Investment Disclosures
, reduces complexities for employee benefit plan financial reporting and disclosure requirements. The ASU is effective for annual periods beginning after December 15, 2015. The company has early adopted the ASU as of December 31, 2015. The adoption did not have a material impact on our consolidated financial statements.
In April 2015, the FASB issued ASU 2015-05,
Intangibles-Goodwill and Other-Internal-Use Software (Subtopic 350-40): Customer’s Accounting for Fees Paid in a Cloud Computing Arrangement
, which provides explicit guidance to help companies evaluate the accounting for fees paid by a customer in a cloud computing arrangement. This ASU is effective for interim and annual periods beginning after December 15, 2015. An entity can elect to adopt the amendments either prospectively for all arrangements entered into or materially modified after the effective date, or retrospectively. Early adoption is permitted. The company has not yet selected a transition method nor has it determined the effect of the standard on its ongoing financial reporting; however, we do not expect the adoption to have a material impact on our consolidated financial statements.
In April 2015, the FASB issued ASU 2015-03,
Interest-Imputation of Interest (Subtopic 835-30): Simplifying the Presentation of Debt Issuance Costs
, which requires that debt issuance costs related to a recognized debt liability be presented in the balance sheet as a direct deduction from the carrying amount of that debt liability, consistent with debt discounts. The ASU is effective for annual periods beginning after December 15, 2015, and interim periods within those annual periods. The impact on the company will be a reclassification of debt issuance costs; however, we do not expect the adoption to have a significant impact on our consolidated financial statements.
In January 2015, the FASB issued ASU 2015-01,
Income Statement - Extraordinary and Unusual Items (Subtopic 225-20): Simplifying Income Statement Presentation by Eliminating the Concept of Extraordinary Items
, which eliminates the concept of extraordinary items from U.S. GAAP as part of its simplification initiative. The ASU does not affect disclosure guidance for events or transactions that are unusual in nature or infrequent in their occurrence. The ASU is effective for interim and annual periods in fiscal years beginning after December 15, 2015. The ASU allows prospective or retrospective application. Early adoption is permitted if applied from the beginning of the fiscal year of adoption. The effective date is the same for both public entities and all other entities. The impact on the company will be dependent on any transaction or event that is within the scope of the new guidance.
On May 28, 2014, the FASB issued ASU No. 2014-09,
Revenue from Contracts with Customers
, which requires an entity to recognize the amount of revenue to which it expects to be entitled for the transfer of promised goods or services to customers. The ASU will replace most existing revenue recognition guidance in U.S. GAAP when it becomes effective. The standard permits the use of either the retrospective or cumulative effect transition method. On July 9, 2015, the FASB decided to delay the effective date of the new revenue standard by one year. The new effective date is for fiscal years, and interim periods within those fiscal years, beginning after December 15, 2017. Early adoption is permitted beginning January 1, 2017 (original effective date of the ASU). The company is evaluating the effect that ASU 2014-09 will have on its consolidated financial statements and related disclosures. The company has not yet selected a transition method nor has it determined the effect of the standard on its ongoing financial reporting.
Note B — Fair Value of Financial Instruments
FASB ASC 820,
Fair Value Measurements and Disclosures
, (ASC 820) defines fair value as the price that would be received to sell an asset or paid to transfer a liability in an orderly transaction between market participants at the measurement date. ASC 820 also establishes a fair value hierarchy that prioritizes the inputs used in valuation methodologies into three levels:
Level 1
Quoted prices in active markets for identical assets or liabilities.
57
Level 2
Observable inputs other than Level 1 prices, such as quoted prices for similar assets or liabilities; quoted prices in markets that are not active; or other inputs that are observable or can be corroborated by observable market data for substantially the full term of the assets or liabilities.
Level 3
Unobservable inputs that are supported by little or no market activity and that are significant to the fair value of the assets or liabilities.
Because of their maturities and/or variable interest rates, certain financial instruments have fair values approximating their carrying values. These instruments include cash and cash equivalents, accounts receivable, and trade payables. The fair value of our outstanding debt is disclosed in Note C,
Long-Term Debt.
The fair value of the assets in our funded pension plan is disclosed in Note F,
Employee Benefit Plans.
The assumptions used to determine the fair value of our reporting units in Step One of our goodwill impairment test, the identified theoretical intangibles assets of our Customer Interaction reporting unit in Step Two of our goodwill impairment test, and the discounted cash flow model used to calculate the fair value of our Aberdeen Group trade name are disclosed in Note E,
Goodwill and Other Intangible Assets.
The summary of our acquisition related contingent consideration accounted for at fair value on a recurring basis is disclosed in Note N,
Acquisition and Disposition.
Our long-term debt obligations at year-end were as follows:
|
|
December 31,
|
|||||||
|
In thousands
|
2015
|
2014
|
||||||
|
2013 Revolving Credit Facility ($60.6 million capacity), due August 16, 2016
|
||||||||
|
Various interest rates based on Eurodollar rate (effective rate of 2.67% at December 31, 2015)
|
—
|
|
—
|
|
||||
|
Various interest rates based on the highest of (a) the Agent's prime rate, (b) the Federal Funds Rate plus 0.50% per annum, (c) Eurodollar rate plus 1.00% per annum, plus a spread with is determined based on our total debt-to-EBITDA ratio then in effect (effective rate of 4.75% at December 31, 2015)
|
13,000
|
|
—
|
|
||||
|
2011 Term Loan Facility, various interest rates based on LIBOR (effective rate of 2.42% at December 31, 2015), due August 16, 2016
|
64,313
|
|
82,687
|
|
||||
|
Total debt
|
$
|
77,313
|
|
$
|
82,687
|
|
||
|
Less current maturities
|
3,000
|
|
18,375
|
|
||||
|
Total long-term debt
|
$
|
74,313
|
|
$
|
64,312
|
|
||
The carrying values and estimated fair values of our outstanding debt at year-end were as follows:
|
|
December 31,
|
|||||||||||||||
|
|
2015
|
2014
|
||||||||||||||
|
In thousands
|
Carrying
Value
|
Fair
Value
|
Carrying
Value
|
Fair
Value
|
||||||||||||
|
Total debt
|
$
|
77,313
|
|
$
|
77,313
|
|
$
|
82,687
|
|
$
|
82,687
|
|
||||
The estimated fair values were calculated using market quotes for debt of the same remaining maturity and characteristics. These current rates are considered Level 2 inputs under the fair value hierarchy established by ASC 820,
Fair Value Measurement
.
58
Credit Facilities
On
August 16, 2011
, we entered into a
five
-year
$122.5 million
term loan facility (2011 Term Loan Facility) with Bank of America, N.A., as Administrative Agent. For each borrowing under the 2011 Term Loan Facility, we can generally choose to have the interest rate for that borrowing calculated based on either (i) the
LIBOR
rate (as defined in the 2011 Term Loan Facility) for the applicable interest period, plus a spread (ranging from
2.00%
to
2.75%
per annum) based on our total net funded debt-to-EBITDA ratio (as defined in the 2011 Term Loan Facility) then in effect; or (ii) the highest of (a) the
Agent’s prime rate
, (b) the
BBA daily floating rate LIBOR
, as determined by Agent for such date, plus
1.00%
, and (c) the
Federal Funds Rate
plus
0.50%
, plus a spread (ranging from
1.00%
to
1.75%
per annum) based on our total net funded debt-to-EBITDA ratio then in effect. We may elect to prepay the 2011 Term Loan Facility at any time without incurring any prepayment penalties.
On
August 8, 2013
, we entered into a
three
-year
$80 million
revolving credit facility, which includes a
$25 million
letter of credit sub-facility and a
$5 million
swing line loan sub-facility (2013 Revolving Credit Facility) with Bank of America, N.A. (as Administrative Agent, Swing Line Lender and L/C Issuer) and the other lenders party thereto. The 2013 Revolving Credit Facility permits us to request up to a
$15 million
increase in the total amount of the facility. The 2013 Revolving Credit Facility matures on August 16, 2016. We may elect to prepay the 2013 Revolving Credit Facility at any time without incurring any prepayment penalties.
For each borrowing under the 2013 Revolving Credit Facility, we can generally choose to have the interest rate for that borrowing calculated on either (i) the
Eurodollar rate
for the applicable interest period plus a spread which is determined based on our total net debt-to-EBITDA ratio then in effect, which ranges from
2.25%
to
3.00%
per annum; or (ii) the highest of (a) the
Agent’s prime rate
, (b) the
Federal Funds Rate
plus
0.50%
per annum or (c)
Eurodollar rate
plus
1.00%
per annum, plus a spread which is determined based on our total debt-to-EBITDA ratio then in effect, which spread ranges from
1.25%
to
2.00%
per annum.
We also pay a quarterly commitment fee under the 2013 Revolving Credit Facility, which is based on a rate applied to the difference between total commitment amount under the 2013 Revolving Credit Facility and the aggregate amount of outstanding obligations under such facility. The commitment fee rate ranges from
0.50%
to
0.55%
per annum, depending on our total net debt-to-EBITDA ratio then in effect.
In addition, we pay a letter of credit fee with respect to outstanding letters of credit. That fee is calculated by applying a rate equal to the spread applicable to Eurodollar based loans plus a fronting fee of
0.125%
per annum to the average daily undrawn amount of the outstanding letters of credit.
At
December 31, 2015
we had letters of credit totaling
$6.4 million
issued under the 2013 Revolving Credit Facility, decreasing the amount available for borrowing to
$60.6 million
. At
December 31, 2014
we had letters of credit totaling
$6.2 million
issued under the 2013 Revolving Credit Facility, decreasing the amount available for borrowing to
$73.8 million
.
Under both of our credit facilities, we are required to maintain an interest coverage ratio of not less than
2.75
to 1, and we must maintain a total debt-to-EBITDA ratio of not more than
2.25
to 1 under the 2013 Revolving Credit Facility and
3.00
to 1 under the 2011 Term Loan Facility. The credit facilities also contain customary covenants restricting our and our subsidiaries’ ability to:
|
•
|
authorize distributions, dividends, stock redemptions and repurchases if a payment event of default has occurred and is continuing;
|
|
•
|
enter into certain merger or liquidation transactions;
|
|
•
|
grant liens;
|
|
•
|
enter into certain sale and leaseback transactions;
|
|
•
|
have foreign subsidiaries account for more than
20%
of the assets, revenue, and earnings of Harte Hanks and its subsidiaries, in the aggregate;
|
|
•
|
enter into certain transactions with affiliates; and
|
|
•
|
allow the total indebtedness of Harte Hanks’ subsidiaries to exceed
$20.0 million
.
|
59
The credit facilities each also include customary covenants regarding reporting obligations, delivery of notices regarding certain events, maintaining our corporate existence, payment of obligations, maintenance of our properties and insurance thereon at customary levels with financially sound and reputable insurance companies, maintaining books and records and compliance with applicable laws. The credit facilities each also provide for customary events of default including nonpayment of principal or interest, breach of representations and warranties, violations of covenants, failure to pay certain other indebtedness, bankruptcy and material judgments and liabilities, certain violations of environmental laws or ERISA or the occurrence of a change of control. Our material domestic subsidiaries have guaranteed the performance of Harte Hanks under our credit facilities. As of
December 31, 2015
, we were in compliance with all of the covenants of our credit facilities.
The future minimum principal payments related to our debt at
December 31, 2015
are as follows:
|
In thousands
|
|
|||
|
2016
|
$
|
77,313
|
|
|
|
2017
|
—
|
|
||
|
2018
|
—
|
|
||
|
2019
|
—
|
|
||
|
2020
|
—
|
|
||
|
Thereafter
|
—
|
|
||
|
|
$
|
77,313
|
|
|
See below for discussion of current maturities of long-term debt reflected on the consolidated balance sheet for the period ending
December 31, 2015
.
Cash payments for interest were
$1.7 million
,
$2.5 million
, and
$2.8 million
for the years ended
December 31, 2015
,
2014
, and
2013
, respectively.
On
March 10, 2016
, we entered into a secured credit facility with Wells Fargo Bank, N.A. as Administrative Agent, consisting of a maximum
$65.0 million
revolving credit facility (the 2016 Revolving Credit Facility), and a
$45.0 million
term loan facility (the 2016 Term Loan, and collectively with the 2016 Revolving Credit Facility, the Secured Credit Facilities). The 2016 Secured Credit Facilities are secured by substantially all of the company's assets and its material domestic subsidiaries. The Secured Credit Facilities will be used for general corporate purposes, and was used to replace, and repay remaining outstanding balances on, the company's (i) 2013 Revolving Credit Facility, and (ii) 2011 Term Loan Facility. The credit and guarantee agreements related to the 2013 Revolving Credit Facility and 2011 Term Loan Facility will likewise be terminated.
The 2016 Revolving Credit Facility allows for loans up to the lesser of (a)
$65.0 million
or (b)
85.0%
of eligible domestic accounts receivable plus, subject to certain sublimits,
85.0%
of eligible foreign accounts receivable plus the lower of (i)
$15.0 million
or (ii)
85.0%
of eligible unbilled accounts receivable, all of which are subject to customary reserves and eligibility criteria. The outstanding amount of the 2016 Term Loan will be repayable, on a monthly basis, in an amount equal to 1/120th of the original principal amount of the 2016 Term Loan. Any amount remaining unpaid will be due and payable in full on the Maturity Date
March 10, 2021
. So long as an established amount of availability under the 2016 Revolving Credit Facility is maintained (described below), the 2016 Term Loan may be prepaid in whole or in part at any time, subject to prior written notice and payment of a prepayment premium (
3.0%
in the first year,
2.0%
in the second year, and
1.0%
in the third year) of the outstanding principal balance of the amount of the 2016 Term Loan prepaid during such year.
The Term Loan is subject to mandatory prepayments from the net proceeds of certain asset dispositions (subject to customary reinvestment exceptions), and the incurrence of certain indebtedness, which prepayments are subject to the prepayment premium. Additionally, if the leverage ratio is greater than
2.0
to
1
in 2016 or
1.75
to
1
in any subsequent year, the Term Loan is subject to mandatory prepayments in an amount equal to
50.0%
of the excess cash flow of Harte Hanks and its subsidiaries. Prepayments made with respect to excess cash flow are not subject to the prepayment premium. Voluntary prepayments of the 2016 Term Loan and mandatory prepayments of the 2016 Term Loan from excess cash flow are not permitted if availability under the 2016 Revolving Credit Facility is less than established amounts the greater of (1)
13.5%
of the maximum amount of the 2016 Revolving Credit Facility and (2)
$14.9 million
with respect to voluntary prepayments, and the greater of
10.0%
of the maximum amount of the 2016 Revolving Credit Facility and
$11.0 million
with respect to excess cash flow payments.
60
The loans under the Secured Credit Facilities will accrue interest at a rate equal to, at the company's option, (a) the base rate plus the applicable margin, or (b) the LIBOR rate (as defined and limited in the Secured Credit Facilities) plus the applicable margin. The base rate is the greatest of (a) the prime lending rate as publicly announced from time to time by Wells Fargo, (b) the federal funds rate plus
0.5%
, and (c) the LIBOR rate for one month interest plus
1.0%
per annum. The applicable margin for the 2016 Revolving Credit Facility is determined based upon the amount available to be borrowed under the 2016 Revolving Credit Facility in excess of trade payables aged in excess of historical levels and book overdrafts and ranges between
1.0
to
1.5%
for loans accruing interest at the base rate and
2.0
to
2.5%
for loans accruing interest at the LIBOR rate. The applicable margin for the 2016 Term Loan is
7.22%
for loans accruing interest at the LIBOR rate and
6.22%
for loans accruing interest at the base rate. We also pay an unused line of credit fee in an amount between
0.25
and
0.375%
on the unused capacity on the 2016 Revolving Credit Facility outstanding amount.
Under the Secured Credit Facilities, we are required to maintain certain financial covenants: a fixed charge coverage ratio of at least
1.0
to
1
for the 12 month period at each month through
June 30, 2016
and
1.1
to
1
for the 12 month period at each month end thereafter; a leverage ratio of
2.25
to
1.0
at each month end from
March 31, 2016
to
December 31, 2016
and
2.0
to
1
at each month end thereafter; a minimum rolling four quarter period ending recurring revenue amount of
$35.0 million
at each quarter end from
March 31, 2016
to
September 30, 2016
, and increasing quarterly from
$35.2 million
to
$42.8 million
each quarter thereafter; and capital expenditures not to exceed
$14.0 million
for the period from
March 10, 2016
to
December 31, 2016
, and each fiscal year thereafter.
The Secured Credit Facilities also contain customary covenants restricting the company and its subsidiaries’ ability to create, incur, assume or become liable to indebtedness; create, incur or assume liens; consummate acquisitions; liquidate, dissolve, suspend, or cease subsidiaries or a substantial portion of the business; convey, sell, lease, license, assign, transfer or dispose of assets; change the nature of business; make prepayments and amendments to other obligations and indebtedness; pay dividends and distributions and repurchase capital stock; modify accounting methods (other than as required by GAAP); make or acquire investments; enter into certain transactions with affiliates; use proceeds; issue equity interests; and amend, increase, fail to pay amounts due to, or terminate certain employee benefits, including a pension plan or multi-employer plan.
The Secured Credit Facilities include certain customary representations and warranties, affirmative covenants and events of default, including payment defaults, breach of representations and warranties, covenant defaults, cross-defaults to certain indebtedness, certain events of bankruptcy, certain events under ERISA, material judgments and a change of control. If an event of default occurs, the administrative agent, at the direction of the lenders under the Secured Credit Facilities, will be entitled to take various actions, including the acceleration of all amounts due under the Secured Credit Facilities and all actions permitted to be taken by a secured creditor.
Due to the financial covenants and other terms of the Secured Credit Facilities, Harte Hanks anticipates that it will no longer declare dividends or repurchase stock for the foreseeable future.
In accordance with ASC 470-10-45,
Debt, Other Presentation Matters,
because the Consolidated Balance Sheet is issued subsequent to
March 10, 2016
, and because a portion of the Secured Credit Facilities proceeds were used to pay off the 2011 Term Loan Facility and 2013 Revolving Credit Facility, total debt is reclassified to long-term debt as of
December 31, 2015
, except for the
$3.0 million
in current-maturities of long-term debt (which represents payments due in the next 12 months under the 2016 Secured Credit Facilities).
61
Note D — Income Taxes
The components of income tax expense (benefit) are as follows:
|
|
Year Ended December 31,
|
|||||||||||
|
In thousands
|
2015
|
2014
|
2013
|
|||||||||
|
Current
|
|
|
|
|
|
|
||||||
|
Federal
|
$
|
6,998
|
|
$
|
5,836
|
|
$
|
8,689
|
|
|||
|
State and Local
|
1,177
|
|
619
|
|
3,554
|
|
||||||
|
Foreign
|
1,146
|
|
1,062
|
|
1,189
|
|
||||||
|
Total Current
|
$
|
9,321
|
|
$
|
7,517
|
|
$
|
13,432
|
|
|||
|
Deferred
|
|
|
|
|
|
|
||||||
|
Federal
|
$
|
(38,278
|
)
|
$
|
2,862
|
|
$
|
3,532
|
|
|||
|
State and local
|
(2,912
|
)
|
2,177
|
|
(2,142
|
)
|
||||||
|
Foreign
|
(45
|
)
|
759
|
|
354
|
|
||||||
|
Total Deferred
|
$
|
(41,235
|
)
|
$
|
5,798
|
|
$
|
1,744
|
|
|||
|
Total income tax expense
|
$
|
(31,914
|
)
|
$
|
13,315
|
|
$
|
15,176
|
|
|||
The U.S. and foreign components of income from continuing operations before income taxes were as follows:
|
|
Year Ended December 31,
|
|||||||||||
|
In thousands
|
2015
|
2014
|
2013
|
|||||||||
|
United States
|
$
|
(205,435
|
)
|
$
|
29,962
|
|
$
|
33,143
|
|
|||
|
Foreign
|
2,593
|
|
7,344
|
|
6,474
|
|
||||||
|
Total income (loss) from continuing operations before income taxes
|
$
|
(202,842
|
)
|
$
|
37,306
|
|
$
|
39,617
|
|
|||
The differences between total income tax expense (benefit) and the amount computed by applying the statutory federal income tax rate to income before income taxes were as follows:
|
|
Year Ended December 31,
|
||||||||||||||||||||
|
In thousands
|
2015
|
Rate
|
2014
|
Rate
|
2013
|
Rate
|
|||||||||||||||
|
Computed expected income tax expense (benefit)
|
$
|
(70,995
|
)
|
35.0
|
%
|
$
|
13,057
|
|
35.0
|
%
|
$
|
13,866
|
|
35.0
|
%
|
||||||
|
Goodwill impairment basis difference
|
36,664
|
|
-18.1
|
%
|
—
|
|
—
|
%
|
—
|
|
—
|
%
|
|||||||||
|
Sold operations basis difference
|
686
|
|
-0.3
|
%
|
—
|
|
—
|
%
|
—
|
|
—
|
%
|
|||||||||
|
Net effect of state income taxes
|
857
|
|
-0.4
|
%
|
1,817
|
|
4.9
|
%
|
918
|
|
2.3
|
%
|
|||||||||
|
Foreign subsidiary dividend inclusions
|
557
|
|
-0.3
|
%
|
135
|
|
0.4
|
%
|
1,125
|
|
2.8
|
%
|
|||||||||
|
Foreign tax rate benefit
|
(90
|
)
|
—
|
%
|
(749
|
)
|
-2.0
|
%
|
(570
|
)
|
-1.4
|
%
|
|||||||||
|
Change in beginning of year valuation allowance
|
(153
|
)
|
0.1
|
%
|
(537
|
)
|
-1.4
|
%
|
(87
|
)
|
-0.2
|
%
|
|||||||||
|
Non deductible interest
|
715
|
|
-0.4
|
%
|
—
|
|
—
|
%
|
—
|
|
—
|
%
|
|||||||||
|
Other, net
|
(155
|
)
|
0.1
|
%
|
(408
|
)
|
-1.2
|
%
|
(76
|
)
|
-0.2
|
%
|
|||||||||
|
Income tax expense (benefit) for the period
|
$
|
(31,914
|
)
|
15.7
|
%
|
$
|
13,315
|
|
35.7
|
%
|
$
|
15,176
|
|
38.3
|
%
|
||||||
Total income tax expense (benefit) was allocated as follows:
|
|
Year Ended December 31,
|
|||||||||||
|
In thousands
|
2015
|
2014
|
2013
|
|||||||||
|
Continuing operations
|
$
|
(31,914
|
)
|
$
|
13,315
|
|
$
|
15,176
|
|
|||
|
Discontinued operations
|
—
|
|
—
|
|
(7,822
|
)
|
||||||
|
Stockholders’ equity
|
2,021
|
|
(9,527
|
)
|
17,373
|
|
||||||
|
Total
|
$
|
(29,893
|
)
|
$
|
3,788
|
|
$
|
24,727
|
|
|||
62
The tax effects of temporary differences that gave rise to significant portions of the deferred tax assets and deferred tax liabilities were as follows:
|
|
Year Ended December 31,
|
|||||||
|
In thousands
|
2015
|
2014
|
||||||
|
Deferred tax assets
|
|
|
||||||
|
Deferred compensation and retirement plan
|
$
|
22,884
|
|
$
|
25,432
|
|
||
|
Accrued expenses not deductible until paid
|
3,612
|
|
3,925
|
|
||||
|
Employee stock-based compensation
|
3,709
|
|
1,182
|
|
||||
|
Accrued payroll not deductible until paid
|
707
|
|
948
|
|
||||
|
Accounts receivable, net
|
1,208
|
|
1,175
|
|
||||
|
Other, net
|
417
|
|
280
|
|
||||
|
Federal net operating loss carryforwards
|
—
|
|
130
|
|
||||
|
Foreign net operating loss carryforwards
|
2,657
|
|
2,805
|
|
||||
|
State net operating loss carryforwards
|
1,956
|
|
2,010
|
|
||||
|
Foreign tax credit carryforwards
|
785
|
|
739
|
|
||||
|
Capital loss carryforwards
|
6,278
|
|
7,182
|
|
||||
|
Total gross deferred tax assets
|
44,213
|
|
45,808
|
|
||||
|
Less valuation allowances
|
(9,958
|
)
|
(10,933
|
)
|
||||
|
Net deferred tax assets
|
$
|
34,255
|
|
$
|
34,875
|
|
||
|
Deferred tax liabilities
|
|
|
|
|
||||
|
Property, plant and equipment
|
$
|
(6,154
|
)
|
$
|
(6,484
|
)
|
||
|
Goodwill and other intangibles
|
(45,212
|
)
|
(82,702
|
)
|
||||
|
Other, net
|
(561
|
)
|
(144
|
)
|
||||
|
Total gross deferred tax liabilities
|
(51,927
|
)
|
(89,330
|
)
|
||||
|
Net deferred tax liabilities
|
$
|
(17,672
|
)
|
$
|
(54,455
|
)
|
||
In assessing the realizability of deferred tax assets, we consider whether it is more likely than not that some portion or all of the deferred tax assets will not be realized. Based on the expectation of future taxable income and that the deductible temporary differences will offset existing taxable temporary differences, we believe it is more likely than not that we will realize the benefits of these deductible differences, net of the existing valuation allowances, at
December 31, 2015
and
2014
.
As discussed in Note A,
Significant Accounting Policies
, the FASB issued ASU No. 2015-17,
Balance Sheet Classification of Deferred Taxes,
which requires that deferred tax assets and liabilities be classified as non-current on the balance sheet rather than being separately presented as current and non-current portions. On
December 31, 2015
, we elected to early adopt ASU No. 2015-17 retrospectively, thus reclassifying
$3.7 million
and
$5.1 million
of deferred tax assets to non-current at
December 31, 2015
and
2014
, respectively.
We or one of our subsidiaries files income tax returns in the U.S. federal, U.S. state, and foreign jurisdictions. For U.S. federal, U.S. state, and foreign returns, we are no longer subject to tax examinations for years prior to
2011
.
63
A reconciliation of the beginning and ending amount of unrecognized tax benefit is as follows:
|
In thousands
|
|
|||
|
Balance at January 1, 2014
|
$
|
27
|
|
|
|
Additions for current year tax positions
|
—
|
|
||
|
Additions for prior year tax positions
|
—
|
|
||
|
Reductions for prior year tax positions
|
—
|
|
||
|
Lapse of statute
|
(27
|
)
|
||
|
Settlements
|
—
|
|
||
|
Balance at December 31, 2014
|
$
|
—
|
|
|
|
|
|
|
||
|
Additions for current year tax positions
|
$
|
—
|
|
|
|
Additions for prior year tax positions
|
761
|
|
||
|
Reductions for prior year tax positions
|
—
|
|
||
|
Lapse of statute
|
—
|
|
||
|
Settlements
|
—
|
|
||
|
Balance at December 31, 2015
|
$
|
761
|
|
|
Included in the balance as of
December 31, 2015
are
$0.8 million
of unrecognized tax benefits that, if recognized, would impact the effective tax rate. We anticipate that it is reasonably possible that we will have a reduction in the liability of up to
$0.8 million
during 2016 as a result of settlements.
We have elected to classify any interest and penalties related to income taxes within income tax expense in our Consolidated Statements of Comprehensive Income (Loss). We did
not
recognize any tax benefits for the reduction of accrued interest and penalties associated with the reduction of the liability for unrecognized tax benefits during the years ended
December 31, 2015
and
2014
. We did
not
have any interest and penalties accrued at
December 31, 2015
or
2014
.
As of
December 31, 2015
, we had net operating loss carryforwards that are available to reduce future taxable income and that will begin to expire in 2030. Our capital loss carryforwards that are available to reduce future capital gains will expire in 2018.
The valuation allowance for deferred tax assets was
$10.0 million
and
$10.9 million
at
December 31, 2015
and
2014
. The net change in valuation allowance was a decrease of
$0.9 million
in
2015
and an increase
$0.2 million
in
2014
. The valuation allowance at
December 31, 2015
and
2014
relates to net operating loss, capital loss, and foreign tax credit carryforwards, which are not expected to be realized.
Deferred income taxes have not been provided on the undistributed earnings of our foreign subsidiaries as these earnings have been, and under current plans will continue to be, permanently reinvested in these subsidiaries. As of
December 31, 2015
, the net cumulative undistributed earnings of these subsidiaries were approximately
$3.7 million
. If those earnings were not considered permanently reinvested, U.S. federal deferred income taxes would have been recorded, after consideration of U.S. foreign tax credits. However, it is not practicable to estimate the amount of additional taxes which may be payable upon the distribution of their cumulative earnings. As of
December 31, 2015
approximately
$4.5 million
of cash is located within certain foreign subsidiaries that if repatriated would require that we accrue and pay approximately
$2.1 million
in additional tax.
Cash payments for income taxes were
$10.1 million
,
$4.9 million
, and
$11.3 million
in
2015
,
2014
, and
2013
, respectively.
64
Note E — Goodwill and Other Intangible Assets
Goodwill is recorded to the extent that the purchase price of an acquisition exceeds the fair value of the identifiable net assets acquired. Other intangibles with definite and indefinite useful lives are recorded at fair value at the date of the acquisition. Under the provisions of FASB ASC 350,
Intangibles-Goodwill and Other
(ASC 350), goodwill is tested for impairment at least annually, or more frequently if events or circumstances indicate that it is "more likely than not" that goodwill might be impaired. We assess the impairment of our goodwill and other intangible assets by determining the fair value of each of our reporting units and comparing the fair value to the carrying value for each reporting unit. Determining fair value requires the exercise of significant judgments, including judgments about appropriate discount rates, the amount and timing of expected future cash flows, and perpetual growth rates.
We monitor potential triggering events, including changes in the business climate in which we operate, attrition of key personnel, the current volatility in the capital markets, the company’s market capitalization compared to our book value, our recent operating performance, and financial projections. During the third quarter of 2015 as a result of a sustained decline in our market capitalization below our book value of equity and recent operating performance, the company determined that a triggering event had occurred. In accordance with ASC 350, we determined that an interim Step One impairment test of Customer Interaction and Trillium Software goodwill was warranted. The fair value of each reporting unit was estimated using both the income approach and market approach models. The fair value of our Customer Interaction reporting unit was estimated to be less than the carrying value, including goodwill. The fair value of our Trillium Software reporting unit was estimated to be more than the carrying value, including goodwill. The company determined that the goodwill balance with respect to the Customer Interaction was impaired and Step Two testing on that reporting unit balance was deemed necessary.
Step Two of the goodwill test consists of performing a hypothetical purchase price allocation, under which the estimated fair value of the reporting unit is allocated to its tangible and intangible assets based on their estimated fair values, with any residual amount being assigned to goodwill. During the Step Two analysis, book value was estimated to approximate fair value for all working capital items, as well as a number of insignificant assets and liabilities. Intangible assets related to trade names, customer relationships and non-compete agreements were identified and the fair value of these intangible assets was estimated.
The models used to value the Customer Interaction reporting unit in Step One and the identified intangible assets in Step Two relied on management’s assumptions. These assumptions, which are significant to the calculated fair values, are considered Level 3 inputs under the fair value hierarchy established by ASC 350, as they are unobservable. The assumptions in the Step One test include discount rate, revenue growth rates, tax rates, and operating margins. In addition to these assumptions, the Step Two assumptions include customer attrition rates and royalty rates.
The impairment analysis indicated an impairment of Customer Interaction goodwill that is recorded in the Consolidated Statements of Comprehensive Income (Loss) in the third quarter of 2015 of
$209.9 million
and a corresponding
$36.8 million
tax benefit resulting in a net income impact of
$173.1 million
.
The changes in the carrying amount of goodwill are as follows:
|
In thousands
|
Customer Interaction
|
Trillium
|
Total
|
|||||||||
|
Balance at December 31, 2013
|
$
|
377,854
|
|
$
|
20,310
|
|
$
|
398,164
|
|
|||
|
Segment reallocation
|
$
|
(128,963
|
)
|
$
|
128,963
|
|
$
|
—
|
|
|||
|
Balance at December 31, 2014
|
$
|
248,891
|
|
$
|
149,273
|
|
$
|
398,164
|
|
|||
|
Purchase consideration
|
41,845
|
|
—
|
|
41,845
|
|
||||||
|
Disposition
|
(11,099
|
)
|
—
|
|
(11,099
|
)
|
||||||
|
Impairment
|
(209,938
|
)
|
—
|
|
(209,938
|
)
|
||||||
|
Balance at December 31, 2015
|
$
|
69,699
|
|
$
|
149,273
|
|
$
|
218,972
|
|
|||
On April 14, 2015 the company sold its B2B research businesses, Aberdeen Group and Harte Hanks Market Intelligence (the "B2B research business”). The B2B research business asset group was a part of our Customer Interaction segment (see Note M
, Business Segments
). The allocated fair value to the B2B research business within the net book value of Customer Interaction goodwill was
$11.1 million
. In addition,
$2.3 million
of intangible assets with indefinite useful lives related to the Aberdeen Group trade name was written off in conjunction with the sale of the B2B research business. These amounts were written off and are reflected in the Loss on sale in the Other expenses section of the
65
Condensed Consolidated Statements of Income (Loss). See Note N,
Acquisition and Disposition,
below for further discussion.
On March 16, 2015 the company acquired the stock of a privately-owned digital marketing agency. The company paid some consideration upon closing, with additional consideration payable upon the achievement of revenue performance goals over the three-year period following the closing. The company performed a valuation to determine the estimate of the total purchase consideration and to estimate values for the tangible and identifiable intangible assets. As a result of the calculation, we recorded
$41.8 million
in goodwill and
$4.8 million
of identified intangible assets with definite lives for for customer relationships, trade names and non-compete agreements.
During second quarter of 2014, we determined our reporting units as Customer Interaction and Trillium Software. In this analysis, our goodwill was allocated to each reporting unit based on the estimated fair value of the reporting unit. We performed an impairment test immediately before and after the change in reporting units, utilizing this same methodology as our November 30 annual impairment test and no indication of impairment was identified.
On September 30, 2013, as a result of a significant decrease in forecasted revenues and an overall strategic assessment of the related operations, management completed an evaluation of the Aberdeen Group trade name. A discounted cash flow model was used to calculate the fair value of the Aberdeen trade name. The significant assumptions used in this method included the (i) revenue growth rates for Aberdeen, (ii) discount rate, (iii) tax rate, and (iv) royalty rate. These assumptions are considered Level 3 inputs under the fair value hierarchy established by FASB ASC 820,
Fair Value Measurements and Disclosures
. Harte Hanks recorded a non-cash trade name intangible asset impairment charge of
$2.8 million
. The impairment charge is included in Impairment of other intangible assets in the Consolidated Statements of Comprehensive Income (Loss) in the third quarter of 2013.
We performed our annual goodwill impairment testing as of November 30,
2015
. We performed a step zero analysis, and overall fair value was compared to overall market capitalization. Based on the results of our November 30,
2015
impairment tests, we did not record any additional impairment losses in
2015
related to goodwill and other intangible assets. We did not record an impairment loss related to goodwill in 2014.
The company continues to monitor potential triggering events, including changes in the business climate in which it operates, attrition of key personnel, the current volatility in the capital markets, the company’s market capitalization compared to its book value, the company’s recent operating performance, and the company’s financial projections. The occurrence of one or more triggering events could require additional impairment testing, which could result in additional impairment charges in the future.
Other intangibles with indefinite useful lives relate to trade names associated with the Aberdeen Group acquisition in September 2006. These intangibles were written-off in conjunction with the sale of the B2B Research Business. The changes in the carrying amount of other intangibles with indefinite lives are as follows:
|
In thousands
|
|
|||
|
Balance at December 31, 2013
|
$
|
2,250
|
|
|
|
Acquisition
|
—
|
|
||
|
Impairment
|
—
|
|
||
|
Balance at December 31, 2014
|
$
|
2,250
|
|
|
|
Acquisition
|
—
|
|
||
|
Disposition
|
(2,250
|
)
|
||
|
Balance at December 31, 2015
|
$
|
—
|
|
|
Other intangibles with definite useful lives all relate to contact databases, client relationships, and non-compete agreements. Other intangible assets with definite useful lives are amortized on a straight-line basis over their respective estimated useful lives, typically a period of
2
to
10
years, and are reviewed for impairment whenever events or changes in circumstances indicate that the carrying amount of an asset may not be recoverable.
66
The changes in the carrying amount of other intangibles with definite lives are as follows:
|
In thousands
|
|
|||
|
Balance at December 31, 2013
|
$
|
53
|
|
|
|
Acquisition
|
—
|
|
||
|
Amortization
|
(26
|
)
|
||
|
Impairment
|
—
|
|
||
|
Balance at December 31, 2014
|
$
|
27
|
|
|
|
Disposition
|
(18
|
)
|
||
|
Acquisition
|
4,773
|
|
||
|
Amortization
|
(659
|
)
|
||
|
Impairment
|
—
|
|
||
|
Balance at December 31, 2015
|
$
|
4,123
|
|
|
Amortization expense related to other intangibles with definite useful lives was
$0.7 million
,
$0.0 million
, and
$0.2 million
for the years ended
December 31, 2015
,
2014
, and
2013
, respectively. Expected amortization expense for the next five years is as follows:
|
In thousands
|
|
|||
|
2016
|
$
|
821
|
|
|
|
2017
|
707
|
|
||
|
2018
|
627
|
|
||
|
2019
|
613
|
|
||
|
2020
|
613
|
|
||
|
Thereafter
|
742
|
|
||
|
|
$
|
4,123
|
|
|
Note F — Employee Benefit Plans
Prior to January 1, 1999, we maintained a defined benefit pension plan for which most of our employees were eligible (the Qualified Pension Plan). In conjunction with significant enhancements to our 401(k) plan, we elected to freeze benefits under the Qualified Pension Plan as of December 31, 1998.
In 1994, we adopted a non-qualified, unfunded, supplemental pension plan (Restoration Pension Plan) covering certain employees, which provides for incremental pension payments so that total pension payments equal those amounts that would have been payable from the principal pension plan were it not for limitations imposed by income tax regulation. The benefits under the Restoration Pension Plan were intended to provide benefits equivalent to our Qualified Pension Plan as if such plan had not been frozen.
Effective April 1, 2014, we froze benefits under our Restoration Pension Plan, which was accounted for as a curtailment of the plan in the second quarter of 2014. The curtailment resulted in a reduction of plan expense of
$0.4 million
during 2014 and a reduction in the projected benefit obligation of
$1.1 million
. This curtailment gain offsets the unrecognized loss held by the Restoration Pension Plan. The remaining portion of the unrecognized loss will then be amortized over the average life expectancy of all participants.
The overfunded or underfunded status of our defined benefit post-retirement plans is recorded as an asset or liability on our balance sheet. The funded status is measured as the difference between the fair value of plan assets and the projected benefit obligation. Periodic changes in the funded status are recognized through other comprehensive income. We currently measure the funded status of our defined benefit plans as of December 31, the date of our year-end consolidated balance sheets.
67
The status of the defined benefit pension plans at year-end was as follows:
|
|
Year Ended December 31,
|
|||||||
|
In thousands
|
2015
|
2014
|
||||||
|
Change in benefit obligation
|
|
|
|
|
||||
|
Benefit obligation at beginning of year
|
$
|
191,065
|
|
$
|
161,370
|
|
||
|
Service cost
|
—
|
|
100
|
|
||||
|
Interest cost
|
7,724
|
|
7,698
|
|
||||
|
Actuarial (gain) loss
|
(10,861
|
)
|
32,018
|
|
||||
|
Benefits paid
|
(9,213
|
)
|
(9,051
|
)
|
||||
|
Curtailments
|
—
|
|
(1,070
|
)
|
||||
|
Benefit obligation at end of year
|
$
|
178,715
|
|
$
|
191,065
|
|
||
|
Change in plan assets
|
|
|
|
|
||||
|
Fair value of plan assets at beginning of year
|
124,372
|
|
120,604
|
|
||||
|
Actual return on plan assets
|
982
|
|
6,887
|
|
||||
|
Contributions
|
5,541
|
|
5,932
|
|
||||
|
Benefits paid
|
(9,213
|
)
|
(9,051
|
)
|
||||
|
Fair value of plan assets at end of year
|
$
|
121,682
|
|
$
|
124,372
|
|
||
|
Funded status at end of year
|
$
|
(57,033
|
)
|
$
|
(66,693
|
)
|
||
The following amounts have been recognized in the Consolidated Balance Sheets at December 31:
|
In thousands
|
2015
|
2014
|
||||||
|
Other current liabilities
|
$
|
1,542
|
|
$
|
1,537
|
|
||
|
Pensions
|
55,491
|
|
65,156
|
|
||||
|
|
$
|
57,033
|
|
$
|
66,693
|
|
||
The following amounts have been recognized in accumulated other comprehensive loss, net of tax, at December 31:
|
In thousands
|
2015
|
2014
|
||||||
|
Net loss
|
$
|
43,915
|
|
$
|
49,560
|
|
||
|
Prior service cost
|
—
|
|
—
|
|
||||
|
|
$
|
43,915
|
|
$
|
49,560
|
|
||
We are not required to make and do not intend to make any contributions to our Qualified Pension Plan in
2016
. Based on current estimates we will not be required to make any contributions to our Qualified Pension Plan until 2018.
We are not required to make and do not intend to make any contributions to our Restoration Pension Plan in
2016
other than to the extent needed to cover benefit payments. We expect benefit payments under this supplemental pension plan to total approximately
$1.5 million
in
2016
. In the event of a change of control, as defined in the plan document, the Restoration Pension Plan is required to be fully funded.
The following information is presented for pension plans with an accumulated benefit obligation in excess of plan assets:
|
In thousands
|
2015
|
2014
|
||||||
|
Projected benefit obligation
|
$
|
178,715
|
|
$
|
191,065
|
|
||
|
Accumulated benefit obligation
|
$
|
178,715
|
|
$
|
191,065
|
|
||
|
Fair value of plan assets
|
$
|
121,682
|
|
$
|
124,372
|
|
||
The Restoration Pension Plan had an accumulated benefit obligation of
$26.4 million
and
$28.2 million
at
December 31, 2015
and
2014
, respectively.
68
The following table presents the components of net periodic benefit cost and other amounts recognized in other comprehensive income (loss) for both plans:
|
|
Year Ended December 31,
|
|||||||||||
|
In thousands
|
2015
|
2014
|
2013
|
|||||||||
|
Net Periodic Benefit Cost (Pre-Tax)
|
|
|
|
|
|
|
||||||
|
Service cost
|
$
|
—
|
|
$
|
100
|
|
$
|
343
|
|
|||
|
Interest cost
|
7,724
|
|
7,698
|
|
7,237
|
|
||||||
|
Expected return on plan assets
|
(8,637
|
)
|
(8,418
|
)
|
(7,383
|
)
|
||||||
|
Amortization of prior service cost
|
—
|
|
—
|
|
—
|
|
||||||
|
Recognized actuarial loss
|
6,228
|
|
3,654
|
|
6,687
|
|
||||||
|
Net periodic benefit cost
|
$
|
5,315
|
|
$
|
3,034
|
|
$
|
6,884
|
|
|||
|
Amounts Recognized in Other Comprehensive Income (Loss) (Pre-Tax)
|
|
|
|
|
|
|
||||||
|
Net (gain) loss
|
$
|
(9,408
|
)
|
$
|
28,802
|
|
$
|
(36,920
|
)
|
|||
|
Prior service cost
|
—
|
|
—
|
|
—
|
|
||||||
|
Total (benefit) cost recognized in other comprehensive loss
|
$
|
(9,408
|
)
|
$
|
28,802
|
|
$
|
(36,920
|
)
|
|||
|
Net (benefit) cost recognized in net periodic benefit cost and other comprehensive (income) loss
|
$
|
(4,093
|
)
|
$
|
31,836
|
|
$
|
(30,036
|
)
|
|||
The estimated net loss for the defined benefit pension plans that will be amortized from accumulated other comprehensive loss into net periodic benefit cost in
2016
is
$2.3 million
. The period over which the net loss from the Qualified Pension Plan is amortized into net periodic benefit cost has been changed effective in 2016 from the average future service of active participants (approximately
9
years) to the average future lifetime of all participants (approximately
24
years). This change reflects that the Qualified Pension Plan is frozen and that almost all of the plan's participants are not active employees.
The weighted-average assumptions used for measurement of the defined pension plans were as follows:
|
|
Year Ended December 31,
|
||||||||
|
|
2015
|
2014
|
2013
|
||||||
|
Weighted-average assumptions used to determine net periodic benefit cost
|
|
|
|
|
|
|
|||
|
Discount rate
|
4.13
|
%
|
4.94
|
%
|
4.15
|
%
|
|||
|
Expected return on plan assets
|
7.00
|
%
|
7.00
|
%
|
7.25
|
%
|
|||
|
Rate of compensation increase
|
N/A
|
|
N/A
|
|
3.00
|
%
|
|||
|
|
December 31,
|
|||||
|
|
2015
|
2014
|
||||
|
Weighted-average assumptions used to determine benefit obligations
|
|
|
|
|
||
|
Discount rate
|
4.49
|
%
|
4.13
|
%
|
||
|
Rate of compensation increase
|
N/A
|
|
N/A
|
|
||
The discount rate assumptions are based on current yields of investment-grade corporate long-term bonds. The expected long-term return on plan assets is based on the expected future average annual return for each major asset class within the plan’s portfolio (which is principally comprised of equity investments) over a long-term horizon. In determining the expected long-term rate of return on plan assets, we evaluated input from our investment consultants, actuaries, and investment management firms, including their review of asset class return expectations, as well as long-term historical asset class returns. Projected returns by such consultants and economists are based on broad equity and bond indices. Additionally, we considered our historical
15
-year compounded returns, which have been in excess of the forward-looking return expectations.
69
The funded pension plan assets as of
December 31, 2015
and
2014
, by asset category, are as follows:
|
In thousands
|
2015
|
%
|
2014
|
%
|
||||||||||
|
Equity securities
|
$
|
83,185
|
|
68
|
%
|
$
|
82,010
|
|
66
|
%
|
||||
|
Debt securities
|
32,726
|
|
27
|
%
|
32,381
|
|
26
|
%
|
||||||
|
Other
|
5,771
|
|
5
|
%
|
9,981
|
|
8
|
%
|
||||||
|
Total plan assets
|
$
|
121,682
|
|
100
|
%
|
$
|
124,372
|
|
100
|
%
|
||||
The current economic environment presents employee benefit plans with unprecedented circumstances and challenges, which, in some cases over the last several years, have resulted in large declines in the fair value of investments. The fair values presented have been prepared using values and information available as of
December 31, 2015
and
2014
.
The following tables present the fair value measurements of the assets in our funded pension plan:
|
In thousands
|
December 31,
2015 |
Quoted Prices
in Active Markets for
Identical Assets (Level 1) |
Significant
Other
Observable
Inputs
(Level 2)
|
Significant
Unobservable
Inputs
(Level 3)
|
||||||||||||
|
Equity securities
|
$
|
83,185
|
|
$
|
83,301
|
|
$
|
—
|
|
$
|
—
|
|
||||
|
Debt securities
|
32,726
|
|
32,726
|
|
—
|
|
—
|
|
||||||||
|
Other
|
5,771
|
|
—
|
|
5,771
|
|
—
|
|
||||||||
|
Total
|
$
|
121,682
|
|
$
|
116,027
|
|
$
|
5,771
|
|
$
|
—
|
|
||||
|
In thousands
|
December 31,
2014 |
Quoted Prices
in Active Markets for Identical Assets (Level 1) |
Significant
Other
Observable
Inputs
(Level 2)
|
Significant
Unobservable
Inputs
(Level 3)
|
||||||||||||
|
Equity securities
|
$
|
82,010
|
|
$
|
82,010
|
|
$
|
—
|
|
$
|
—
|
|
||||
|
Debt securities
|
32,381
|
|
32,381
|
|
—
|
|
—
|
|
||||||||
|
Other
|
9,981
|
|
—
|
|
9,981
|
|
—
|
|
||||||||
|
Total
|
$
|
124,372
|
|
$
|
114,391
|
|
$
|
9,981
|
|
$
|
—
|
|
||||
The investment policy for the Qualified Pension Plan focuses on the preservation and enhancement of the corpus of the plan’s assets through prudent asset allocation, quarterly monitoring and evaluation of investment results, and periodic meetings with investment managers.
The investment policy’s goals and objectives are to meet or exceed the representative indices over a full market cycle (
3
-
5
years). The policy establishes the following investment mix, which is intended to subject the principal to an acceptable level of volatility while still meeting the desired return objectives:
|
|
Target
|
Acceptable Range
|
Benchmark Index
|
|||||||
|
Domestic Equities
|
50.0
|
%
|
35
|
%
|
-
|
75%
|
S&P 500
|
|||
|
Large Cap Growth
|
22.5
|
%
|
15
|
%
|
-
|
30%
|
Russell 1000 Growth
|
|||
|
Large Cap Value
|
22.5
|
%
|
15
|
%
|
-
|
30%
|
Russell 1000 Value
|
|||
|
Mid Cap Value
|
5.0
|
%
|
5
|
%
|
-
|
15%
|
Russell Mid Cap Value
|
|||
|
Mid Cap Growth
|
0.0
|
%
|
0
|
%
|
-
|
10%
|
Russell Mid Cap Growth
|
|||
|
Domestic Fixed Income
|
35.0
|
%
|
15
|
%
|
-
|
50%
|
LB Aggregate
|
|||
|
International Equities
|
15.0
|
%
|
10
|
%
|
-
|
25%
|
MSC1 EAFE
|
|||
The funded pension plan provides for investment in various investment types. Investments, in general, are exposed to various risks, such as interest rate, credit, and overall market volatility risk. Due to the level of risk associated with investments, it is reasonably possible that changes in the value of investments will occur in the near term and may impact the funded status of the plan. To address the issue of risk, the investment policy places high priority on the preservation of the value of capital (in real terms) over a market cycle. Investments are made in companies with a minimum
five
-year operating history and sufficient trading volume to facilitate, under most market conditions, prompt
70
sale without severe market effect. Investments are diversified; reasonable concentration in any one issue, issuer, industry, or geographic area is allowed if the potential reward is worth the risk.
Investment managers are evaluated by the performance of the representative indices over a full market cycle for each class of assets. The Pension Plan Committee reviews, on a quarterly basis, the investment portfolio of each manager, which includes rates of return, performance comparisons with the most appropriate indices, and comparisons of each manager’s performance with a universe of other portfolio managers that employ the same investment style.
The expected future pension benefit payments for the next ten years as of
December 31, 2015
are as follows:
|
In thousands
|
|
|||
|
2016
|
$
|
9,418
|
|
|
|
2017
|
9,623
|
|
||
|
2018
|
9,801
|
|
||
|
2019
|
9,930
|
|
||
|
2020
|
10,296
|
|
||
|
2021-2025
|
56,274
|
|
||
|
|
$
|
105,342
|
|
|
We also sponsor a 401(k) retirement plan in which we match a portion of employees’ voluntary before-tax contributions. Under this plan, both employee and matching contributions vest immediately. Total 401(k) expense recognized in
2015
,
2014
, and
2013
was
$3.6 million
,
$3.8 million
, and
$3.9 million
, respectively.
Note G — Stockholders’ Equity
We paid a quarterly dividend of
$0.085
per share in each quarter of
2015
.
During
2015
, we repurchased
0.9 million
shares of our common stock for
$4.6 million
under our stock repurchase programs that were publicly announced in August of 2014 and 2012. Under the program announced in August 2014 our Board of Directors has authorized us to spend up to
$20.0 million
to repurchase shares of our outstanding common stock. As of
December 31, 2015
, we had authorization to spend
$11.4 million
to repurchase additional shares under this program. From 1997 through December
2015
, we have paid more than
$1.2 billion
to repurchase
67.9 million
shares under this program and previously announced programs.
During
2015
, we received
170,567
shares of our common stock, with an estimated market value of
$1.1 million
, in connection with vesting of shares as shares are returned to treasury to pay for an awardee’s tax obligation.
Note H — Stock-Based Compensation
Compensation expense for stock-based awards is based on the fair values of the awards on the date of grant and is recognized on a straight-line basis over the vesting period of the entire award in the “Labor” line of the Consolidated Statements of Comprehensive Income (Loss). For the years ended December 31,
2015
,
2014
, and
2013
, we recorded total stock-based compensation expense of
$5.7 million
,
$4.1 million
, and
$5.7 million
, respectively.
In September 2015 we granted equity awards to Karen Puckett as a material inducement for her to accept appointment as our Chief Executive Officer. In addition, in October 2015, we granted equity awards to our Chief Marketing Officer as a material inducement to his acceptance of such position. These option, restricted stock, and performance units awards were not submitted for stockholder approval, and were separately listed with the NYSE.
In July 2013 we granted equity awards to Robert Philpott as a material inducement for him to accept appointment as our Chief Executive Officer. These option, restricted stock, and performance unit awards were not submitted for stockholder approval, and were separately registered with the SEC and listed with the NYSE.
In May 2013 our stockholders approved the 2013 Omnibus Incentive Plan (2013 Plan), pursuant to which we may issue up to
5.0 million
shares of stock-based awards to directors, employees and consultants. The 2013 Plan replaced the stockholder-approved 2005 Omnibus Incentive Plan (2005 Plan), pursuant to which we issued equity securities to directors, officers, and key employees.
No
additional stock-based awards will be granted under the 2005 Plan, but
71
awards previously granted under the 2005 Plan will remain outstanding in accordance with their respective terms. As of
December 31, 2015
, there were
3.2 million
shares available for grant under the 2013 Plan.
Stock Options
Options granted as inducement awards have an exercise price equal to the market value of the common stock on the grant date. These options become exercisable in
25%
increments on the first through fourth anniversaries of their date of grant, and expire on the tenth anniversary of their date of grant. Options to purchase
1.0 million
shares were outstanding under the inducement awards at
December 31, 2015
, with exercise prices of either
$3.79
or
$4.26
per share.
Following the third quarter 2015 resignation of Mr. Philpott, vesting was accelerated on his unvested stock options (pursuant to the terms of his employment agreement and inducement award), for which we recognized
$0.5 million
of accelerated expense in July 2015.
Under the 2013 Plan, all options have been and will be granted at exercise prices equal to the market value of the common stock on the grant date. All such options are exercisable in
25%
increments on the first through fourth anniversaries of their date of grant, and expire on the
ten
th anniversary of their date of grant. As of
December 31, 2015
, 2013 Plan options to purchase
1.4 million
shares were outstanding with exercise prices ranging from
$4.67
to
$8.85
per share.
All options under the 2005 Plan were granted at exercise prices equal to the market value of the common stock on the grant date. All 2005 Plan options granted prior to 2011 become exercisable in
25%
increments on the second through fifth anniversaries of their date of grant and expire on the
ten
th anniversary of their date of grant. All options granted after 2011 become exercisable in
25%
increments on the first through fourth anniversaries of their date of grant, and expire on the
ten
th anniversary of their date of grant. As of
December 31, 2015
, 2005 Plan options to purchase
2.3 million
shares were outstanding with exercise prices ranging from
$6.04
to
$27.00
per share.
Options issued from January 2013 through March 2015 vest in full (to the extent not previously vested) upon a change in control, as defined in the applicable equity plan. Options granted to officers since April 2015 or before January 2013 vest in full (to the extent not previously vested) upon a change in control if such options are not assumed or replaced by a publicly-traded successor with an equivalent award (as such terms are defined in such officers’ change-in-control severance agreements). Additionally, 25% of the inducement options granted to Ms. Puckett will vest (if all are not previously vested) in the event her employment is terminated without cause, or if she terminates her employment for good reason (as such terms are defined in her employment agreement).
72
The following summarizes all stock option activity during the years ended
December 31, 2015
,
2014
, and
2013
:
|
In thousands
|
Number of
Shares
|
Weighted-
Average
Option
Price
|
Weighted-
Average
Remaining
Contractual
Term
(Years)
|
Aggregate
Intrinsic
Value
(Thousands)
|
|||||||||
|
Options outstanding at December 31, 2012
|
5,106,629
|
|
$
|
14.32
|
|
|
|
|
|||||
|
Granted in 2013
|
1,138,600
|
|
8.30
|
|
|
|
|
||||||
|
Exercised in 2013
|
(151,875
|
)
|
6.04
|
|
|
$
|
268
|
|
|||||
|
Unvested options forfeited in 2013
|
(762,062
|
)
|
11.97
|
|
|
|
|
||||||
|
Vested options expired in 2013
|
(1,085,580
|
)
|
13.47
|
|
|
|
|
||||||
|
Options outstanding at December 31, 2013
|
4,245,712
|
|
$
|
13.65
|
|
|
|
|
|||||
|
Granted in 2014
|
1,002,955
|
|
8.01
|
|
|
|
|
||||||
|
Exercised in 2014
|
(78,125
|
)
|
6.19
|
|
|
$
|
61
|
|
|||||
|
Unvested options forfeited in 2014
|
(437,984
|
)
|
8.72
|
|
|
|
|
||||||
|
Vested options expired in 2014
|
(268,537
|
)
|
17.83
|
|
|
|
|
||||||
|
Options outstanding at December 31, 2014
|
4,464,021
|
|
$
|
11.50
|
|
|
|
|
|||||
|
Granted in 2015
|
1,973,606
|
|
5.73
|
|
|
|
|
||||||
|
Exercised in 2015
|
(35,000
|
)
|
6.04
|
|
|
$
|
67
|
|
|||||
|
Unvested options forfeited in 2015
|
(660,733
|
)
|
7.96
|
|
|
|
|
||||||
|
Vested options expired in 2015
|
(1,139,148
|
)
|
14.89
|
|
|
|
|
||||||
|
Options outstanding at December 31, 2015
|
4,602,746
|
|
$
|
8.74
|
|
6.13
|
$
|
—
|
|
||||
|
Exercisable at December 31, 2015
|
1,779,288
|
|
$
|
12.73
|
|
3.99
|
$
|
—
|
|
||||
The aggregate intrinsic value at year end in the table above represents the total pre-tax intrinsic value that would have been received by the option holders if all of the in-the-money options were exercised on
December 31, 2015
. The pre-tax intrinsic value is the difference between the closing price of our common stock on
December 31, 2015
and the exercise price for each in-the-money option. This value fluctuates with the changes in the price of our common stock.
The following table summarizes information about stock options outstanding at
December 31, 2015
:
|
Range of
Exercise
Prices
|
Number
Outstanding
|
Weighted-
Average
Exercise
Price
|
Weighted-
Average
Remaining
Life (Years)
|
Number
Exercisable
|
Weighted-
Average
Exercise
Price
|
|||||||||||||||
|
$
|
0.00
|
|
-
|
6.99
|
1,605,866
|
|
$
|
4.72
|
|
3.54
|
221,520
|
|
$
|
6.10
|
|
|||||
|
$
|
7.00
|
|
-
|
10.99
|
1,984,405
|
|
$
|
8.02
|
|
6.58
|
545,293
|
|
$
|
8.41
|
|
|||||
|
$
|
11.00
|
|
-
|
11.99
|
397,000
|
|
$
|
11.90
|
|
3.95
|
397,000
|
|
$
|
11.90
|
|
|||||
|
$
|
12.00
|
|
-
|
15.99
|
306,350
|
|
$
|
14.40
|
|
3.14
|
306,350
|
|
$
|
14.40
|
|
|||||
|
$
|
16.00
|
|
-
|
24.49
|
50,000
|
|
$
|
17.30
|
|
2.00
|
50,000
|
|
$
|
17.30
|
|
|||||
|
$
|
24.50
|
|
-
|
28.85
|
259,125
|
|
$
|
25.90
|
|
0.39
|
259,125
|
|
$
|
25.90
|
|
|||||
|
4,602,746
|
|
$
|
8.74
|
|
6.13
|
1,779,288
|
|
$
|
12.73
|
|
||||||||||
73
The fair value of each option grant is estimated on the date of grant using the Black-Scholes Option-Pricing Model based on the following weighted-average assumptions used for grants during
2015
,
2014
, and
2013
:
|
|
Year Ended December 31,
|
||||||||
|
|
2015
|
2014
|
2013
|
||||||
|
Expected term (in years)
|
6.24
|
|
6.25
|
|
6.25
|
|
|||
|
Expected stock price volatility
|
40.60
|
%
|
47.10
|
%
|
46.59
|
%
|
|||
|
Risk-free interest rate
|
1.58
|
%
|
1.88
|
%
|
1.43
|
%
|
|||
|
Expected dividend yield
|
5.69
|
%
|
3.82
|
%
|
4.74
|
%
|
|||
Expected term is estimated using the simplified method, which takes into account vesting and contractual term. The simplified method is being used to calculate expected term instead of historical experience due to a lack of relevant historical data resulting from changes in option vesting schedules and changes in the pool of employees receiving option grants. Expected stock price volatility is based on the historical volatility from traded shares of our stock over the expected term. The risk-free interest rate is based on the rate of a zero-coupon U.S. Treasury instrument with a remaining term approximately equal to the expected term. Expected dividend yield is based on historical stock price movement and anticipated future annual dividends over the expected term. Future annual dividends over the expected term are estimated to be
$0.34
per share.
The weighted-average fair value of options granted during
2015
,
2014
, and
2013
was
$1.36
,
$2.59
, and
$2.35
, respectively. As of
December 31, 2015
, there was
$3.0 million
of total unrecognized compensation cost related to unvested stock options. This cost is expected to be recognized over a weighted average period of approximately
2.87 years
.
Unvested Shares
Unvested shares granted as inducement awards or under the 2013 Plan vest in three equal increments on the first three anniversaries of their date of grant. Unvested shares granted from January 2013 through March 2015 vest in full (to the extent not previously vested) upon a change in control, as defined in the applicable equity plan. Unvested shares granted to officers since April 2015 as inducement awards or under the 2013 Plan vest in full (to the extent not previously vested) upon a change in control if such unvested shares are not assumed or replaced by a publically-traded successor with an equivalent award (as such terms are defined in such officers’ change-in-control severance agreements).
Following the third quarter 2015 resignation of Mr. Philpott, vesting was accelerated on his unvested shares (pursuant to the terms of his employment agreement and inducement award), for which we recognized
$1.2 million
of accelerated expense in July 2015.
74
The following summarizes all unvested share activity during
2015
,
2014
, and
2013
:
|
|
Number of
Shares
|
Weighted-
Average Grant
Date Fair Value
|
|||||
|
Unvested shares outstanding at December 31, 2012
|
500,453
|
|
$
|
10.95
|
|
||
|
Granted in 2013
|
591,931
|
|
8.02
|
|
|||
|
Vested in 2013
|
(297,375
|
)
|
11.01
|
|
|||
|
Forfeited in 2013
|
(108,964
|
)
|
8.94
|
|
|||
|
Unvested shares outstanding at December 31, 2013
|
686,045
|
|
$
|
8.72
|
|
||
|
Granted in 2014
|
529,426
|
|
7.90
|
|
|||
|
Vested in 2014
|
(342,613
|
)
|
8.98
|
|
|||
|
Forfeited in 2014
|
(82,720
|
)
|
8.37
|
|
|||
|
Unvested shares outstanding at December 31, 2014
|
790,138
|
|
$
|
8.10
|
|
||
|
Granted in 2015
|
836,775
|
|
6.38
|
|
|||
|
Vested in 2015
|
(504,686
|
)
|
8.23
|
|
|||
|
Forfeited in 2015
|
(159,781
|
)
|
7.90
|
|
|||
|
Unvested shares outstanding at December 31, 2015
|
962,446
|
|
$
|
6.57
|
|
||
The fair value of each unvested share is estimated on the date of grant as the closing market price of our common stock on the date of grant. As of
December 31, 2015
, there was
$4.8 million
of total unrecognized compensation cost related to unvested shares. This cost is expected to be recognized over a weighted average period of approximately
2.03 years
.
Performance Stock Units
Under the inducement awards, the 2013 Plan, and the 2005 Plan performance stock units are a form of share-based award similar to unvested shares, except that the number of shares ultimately issued is based on our performance against specific performance goals over a three-year period. At the end of the performance period, the number of shares of stock issued will be determined by adjusting upward or downward from the maximum in a range between
0%
and
100%
. Unvested performance stock units granted from January 2013 through March 2015 vest in full at the 100% performance level upon a change in control, as defined in the applicable equity plan. Unvested performance stock units granted to officers since April 2015 as inducement awards or under the 2013 Plan vest in full upon a change in control if such unvested performance stock units are not assumed or replaced by a publicly-traded successor with an equivalent award (as such terms are defined in such officers’ change-in-control severance agreements).
75
The following summarizes all performance stock unit activity during
2015
,
2014
, and
2013
:
|
|
Number of
Shares
|
Weighted-
Average Grant-Date Fair Value
|
|||||
|
Performance stock units outstanding at December 31, 2012
|
239,700
|
|
$
|
10.25
|
|
||
|
Granted in 2013
|
333,000
|
|
7.76
|
|
|||
|
Settled in 2013
|
—
|
|
—
|
|
|||
|
Forfeited in 2013
|
(102,000
|
)
|
9.84
|
|
|||
|
Performance stock units outstanding at December 31, 2013
|
470,700
|
|
$
|
8.58
|
|
||
|
Granted in 2014
|
308,507
|
|
7.09
|
|
|||
|
Settled in 2014
|
—
|
|
—
|
|
|||
|
Forfeited in 2014
|
(175,533
|
)
|
9.30
|
|
|||
|
Performance stock units outstanding at December 31, 2014
|
603,674
|
|
$
|
7.61
|
|
||
|
Granted in 2015
|
669,839
|
|
4.30
|
|
|||
|
Settled in 2015
|
—
|
|
—
|
|
|||
|
Forfeited in 2015
|
(572,129
|
)
|
7.54
|
|
|||
|
Performance stock units outstanding at December 31, 2015
|
701,384
|
|
$
|
4.51
|
|
||
The fair value of each performance stock unit is estimated on the date of grant as the closing market price of our common stock on the date of grant, minus the present value of anticipated dividend payments. Periodic compensation expense is based on the current estimate of future performance against specific performance goals over a
three
-year period and is adjusted up or down based on those estimates. As of
December 31, 2015
, there was
$1.1 million
of total unrecognized compensation cost related to performance stock units. This cost is expected to be recognized over a weighted average period of approximately
2.83 years
.
Note I — Commitments and Contingencies
At
December 31, 2015
, we had letters of credit in the amount of
$6.4 million
issued under the 2013 Revolving Credit Facility.
No
amounts were drawn against these letters of credit at
December 31, 2015
. These letters of credit exist to support insurance programs relating to workers’ compensation, automobile, and general liability, and to offset liability relating to leasehold obligations.
In the normal course of our business, we are obligated under some agreements to indemnify our clients as a result of claims that we infringe on the proprietary rights of third parties. The terms and duration of these commitments vary and, in some cases, may be indefinite, and certain of these commitments do not limit the maximum amount of future payments we could become obligated to make there under; accordingly, our actual aggregate maximum exposure related to these types of commitments cannot be reasonably estimated. Historically, we have not been obligated to make significant payments for obligations of this nature, and no liabilities have been recorded for these obligations in our financial statements.
We are also currently subject to various other legal proceedings in the course of conducting our businesses and, from time to time, we may become involved in additional claims and lawsuits incidental to our businesses. In the opinion of management, after consultation with counsel, none of these matters is currently considered to be reasonably possible of resulting in a material adverse effect on our consolidated financial position or results of operations. Nevertheless, we cannot predict the impact of future developments affecting our pending or future claims and lawsuits and any resolution of a claim or lawsuit within a particular fiscal quarter may adversely impact our results of operations for that quarter. We expense legal costs as incurred, and all recorded legal liabilities are adjusted as required as better information becomes available to us. The factors we consider when recording an accrual for contingencies include, among others: (i) the opinions and views of our legal counsel, (ii) our previous experience, and (iii) the decision of our management as to how we intend to respond to the complaints.
76
Note J — Leases
We lease real estate and certain equipment under numerous lease agreements, most of which contain some renewal options. The total rent expense applicable to operating leases was
$14.5 million
,
$15.4 million
, and
$14.5 million
for the years ended
December 31, 2015
,
2014
, and
2013
, respectively.
Step rent provisions and escalation clauses, normal tenant improvements, rent holidays, and other lease concessions are taken into account in computing minimum lease payments. We recognize the minimum lease payments on a straight-line basis over the minimum lease term.
The future minimum rental commitments for all non-cancelable operating leases with terms in excess of one year as of
December 31, 2015
are as follows:
|
In thousands
|
|
|||
|
2016
|
$
|
11,565
|
|
|
|
2017
|
10,676
|
|
||
|
2018
|
7,686
|
|
||
|
2019
|
5,343
|
|
||
|
2020
|
3,121
|
|
||
|
Thereafter
|
4,630
|
|
||
|
|
$
|
43,021
|
|
|
We also lease certain equipment and software under capital leases. Our capital lease obligations at year-end were as follows:
|
In thousands
|
2015
|
2014
|
||||||
|
Current portion of capital leases
|
$
|
132
|
|
$
|
134
|
|
||
|
Long-term portion of capital leases
|
204
|
|
185
|
|
||||
|
Total capital lease obligation
|
$
|
336
|
|
$
|
319
|
|
||
The future minimum lease payments for all capital leases operating as of
December 31, 2015
are as follows:
|
In thousands
|
|
|||
|
2016
|
$
|
132
|
|
|
|
2017
|
100
|
|
||
|
2018
|
58
|
|
||
|
2019
|
32
|
|
||
|
2020
|
14
|
|
||
|
Thereafter
|
—
|
|
||
|
|
$
|
336
|
|
|
Note K — Earnings Per Share
In periods in which the company has net income, the company is required to calculate earnings per share using the two-class method. The two-class method is required because the company's unvested shares are considered participating securities. Participating securities have the right to receive dividends should the company declare dividends on its common stock. Under the two-class method, undistributed and distributed earnings are allocated on a pro-rata basis to the common and restricted stockholders. The weighted-average number of common and restricted shares outstanding during the period is then used to calculate EPS for each class of shares.
In periods in which the company has a net loss, basic loss per share is calculated using the treasury stock method. The treasury stock method is calculated by dividing the net loss by the weighted-average number of common shares outstanding during the period. The two-class is method is not used, because the two-class calculation is anti-dilutive.
77
Reconciliations of basic and diluted earnings per share (EPS) are as follows:
|
In thousands, except per share amounts
|
2015
|
2014
|
2013
|
|||||||||
|
Net Income (Loss)
|
|
|
|
|
|
|
||||||
|
Income (loss) from continuing operations
|
$
|
(170,928
|
)
|
$
|
23,991
|
|
$
|
24,441
|
|
|||
|
Income (loss) from discontinued operations
|
—
|
|
—
|
|
(11,071
|
)
|
||||||
|
Net income (loss)
|
$
|
(170,928
|
)
|
$
|
23,991
|
|
$
|
13,370
|
|
|||
|
Basic EPS
|
|
|
|
|
|
|
||||||
|
Weighted-average common shares outstanding used in earnings per share computations
|
61,643
|
|
62,444
|
|
62,503
|
|
||||||
|
Basic earnings (loss) per share
|
|
|
|
|
|
|
||||||
|
Continuing operations
|
$
|
(2.77
|
)
|
$
|
0.38
|
|
$
|
0.39
|
|
|||
|
Discontinued operations
|
—
|
|
—
|
|
(0.18
|
)
|
||||||
|
Basic earnings (loss) per share
|
$
|
(2.77
|
)
|
$
|
0.38
|
|
$
|
0.21
|
|
|||
|
Diluted EPS
|
|
|
|
|
|
|
||||||
|
Shares used in diluted earnings per share computations
|
61,643
|
|
62,658
|
|
62,812
|
|
||||||
|
Basic earnings (loss) per share
|
|
|
|
|
|
|
||||||
|
Continuing operations
|
$
|
(2.77
|
)
|
$
|
0.38
|
|
$
|
0.39
|
|
|||
|
Discontinued operations
|
—
|
|
—
|
|
(0.18
|
)
|
||||||
|
Basic earnings (loss) per share
|
$
|
(2.77
|
)
|
$
|
0.38
|
|
$
|
0.21
|
|
|||
|
Computation of Shares Used in Earnings Per Share Computations
|
|
|
|
|
|
|
||||||
|
Weighted-average common shares outstanding
|
61,643
|
|
62,444
|
|
62,503
|
|
||||||
|
Weighted-average common equivalent shares- dilutive effect of stock options and awards
|
—
|
|
214
|
|
309
|
|
||||||
|
Shares used in diluted earnings per share computations
|
61,643
|
|
62,658
|
|
62,812
|
|
||||||
For the purpose of calculating the shares used in the diluted EPS calculations,
4.2 million
,
4.1 million
, and
4.2 million
anti-dilutive options have been excluded from the EPS calculations for the years ended
December 31, 2015
,
2014
, and
2013
, respectively. There were
no
anti-dilutive unvested shares for the years ended
December 31, 2015
and
2013
, respectively, and
0.0 million
anti-dilutive unvested for the year ended
December 31, 2014
.
78
Note L — Comprehensive Income (Loss)
Comprehensive income (loss) for a period encompasses net income (loss) and all other changes in equity other than from transactions with our stockholders. Our comprehensive income (loss) was as follows:
|
|
Year Ended December 31,
|
|||||||||||
|
In thousands
|
2015
|
2014
|
2013
|
|||||||||
|
Net income (loss)
|
$
|
(170,928
|
)
|
$
|
23,991
|
|
$
|
13,370
|
|
|||
|
Other comprehensive income (loss):
|
|
|
|
|
|
|
||||||
|
Adjustment to pension liability
|
9,408
|
|
(28,802
|
)
|
36,920
|
|
||||||
|
Tax (expense) benefit
|
(3,763
|
)
|
11,521
|
|
(14,768
|
)
|
||||||
|
Adjustment to pension liability, net of tax
|
5,645
|
|
(17,281
|
)
|
22,152
|
|
||||||
|
Foreign currency translation adjustment
|
(1,976
|
)
|
(1,830
|
)
|
(536
|
)
|
||||||
|
Total other comprehensive income (loss)
|
$
|
3,669
|
|
$
|
(19,111
|
)
|
$
|
21,616
|
|
|||
|
Total comprehensive income (loss)
|
$
|
(167,259
|
)
|
$
|
4,880
|
|
$
|
34,986
|
|
|||
Changes in accumulated other comprehensive income (loss) by component are as follows:
|
In thousands
|
Defined Benefit
Pension Items
|
Foreign
Currency Items
|
Total
|
|||||||||
|
Balance at December 31, 2013
|
$
|
(32,279
|
)
|
$
|
4,161
|
|
$
|
(28,118
|
)
|
|||
|
Other comprehensive loss, net of tax, before reclassifications
|
—
|
|
(1,830
|
)
|
(1,830
|
)
|
||||||
|
Amounts reclassified from accumulated other comprehensive income (loss), net of tax
|
(17,281
|
)
|
—
|
|
(17,281
|
)
|
||||||
|
Net current period other comprehensive income (loss), net of tax
|
(17,281
|
)
|
(1,830
|
)
|
(19,111
|
)
|
||||||
|
Balance at December 31, 2014
|
$
|
(49,560
|
)
|
$
|
2,331
|
|
$
|
(47,229
|
)
|
|||
|
Other comprehensive loss, net of tax, before reclassifications
|
—
|
|
(1,976
|
)
|
(1,976
|
)
|
||||||
|
Amounts reclassified from accumulated other comprehensive income (loss), net of tax
|
5,645
|
|
—
|
|
5,645
|
|
||||||
|
Net current period other comprehensive income (loss), net of tax
|
5,645
|
|
(1,976
|
)
|
3,669
|
|
||||||
|
Balance at December 31, 2015
|
$
|
(43,915
|
)
|
$
|
355
|
|
$
|
(43,560
|
)
|
|||
Reclassification amounts related to the defined pension plans are included in the computation of net period pension benefit cost (see Note F,
Employee Benefit Plans)
.
Note M — Business Segments
During the second quarter of 2014, Harte Hanks began executing a new strategy causing us to leverage our operational structure by organizing into
two
distinct operating divisions: Customer Interaction and Trillium Software. In accordance with ASC 280,
Segment Reporting,
we determined that under this new organizational structure, we will report the
two
operating divisions as
two
reportable segments — Customer Interaction and Trillium Software. Our reportable segments are described below.
Customer Interaction
Our Customer Interaction services offer a wide variety of integrated, multi-channel, data-driven marketing service solutions for our customers. We derive revenues by offering a full complement of capabilities and resources to provide these services in media from direct mail to email, including:
|
•
|
agency and digital services;
|
|
•
|
database marketing solutions and business-to-business lead generation;
|
|
•
|
direct mail; and
|
79
|
•
|
contact centers.
|
Customer Interaction’s largest cost components are labor, outsourced costs, and mail supply chain costs. 2015 results reflect an impairment loss of
$209.9 million
related to goodwill associated with our Customer Interaction segment in the third quarter of 2015. 2013 results reflect an impairment loss of
$2.8 million
related to other intangible assets associated with our Aberdeen Group business recorded in the third quarter of 2013.
Trillium Software
Trillium Software is a leading enterprise data quality solutions provider. Our full complement of technologies and services includes global data profiling, data cleansing, enrichment, and data linking for e-business, customer relationship management, data governance, enterprise resource planning, supply chain management, data warehouse, and other enterprise applications. Revenues from the Trillium Software segment are comprised primarily of software, maintenance and professional services.
Trillium Software’s largest cost component is software development, which is comprised primarily of labor.
Corporate
General corporate expense consists primarily of pension and workers compensation expense related to employees from operations we no longer own.
80
|
|
Year Ended December 31,
|
|||||||||||
|
In thousands
|
2015
|
2014
|
2013
|
|||||||||
|
Operating revenues
|
|
|
|
|
|
|
||||||
|
Customer Interaction
|
$
|
444,166
|
|
$
|
499,444
|
|
$
|
503,760
|
|
|||
|
Trillium Software
|
51,135
|
|
54,232
|
|
55,849
|
|
||||||
|
Total operating revenues
|
$
|
495,301
|
|
$
|
553,676
|
|
$
|
559,609
|
|
|||
|
Operating income
|
|
|
|
|
|
|
||||||
|
Customer Interaction
|
$
|
(197,020
|
)
|
$
|
29,780
|
|
$
|
32,021
|
|
|||
|
Trillium Software
|
14,039
|
|
13,347
|
|
15,396
|
|
||||||
|
Corporate
|
(4,594
|
)
|
(2,365
|
)
|
(4,756
|
)
|
||||||
|
Total operating income
|
$
|
(187,575
|
)
|
$
|
40,762
|
|
$
|
42,661
|
|
|||
|
Income from continuing operations before income taxes
|
$
|
(187,575
|
)
|
$
|
40,762
|
|
$
|
42,661
|
|
|||
|
Interest expense, net
|
4,759
|
|
2,559
|
|
2,998
|
|
||||||
|
Loss on sale
|
9,501
|
|
—
|
|
—
|
|
||||||
|
Other, net
|
1,007
|
|
897
|
|
46
|
|
||||||
|
Total income from continuing operations before income taxes
|
$
|
(202,842
|
)
|
$
|
37,306
|
|
$
|
39,617
|
|
|||
|
Depreciation
|
|
|
|
|
|
|
||||||
|
Customer Interaction
|
$
|
11,717
|
|
$
|
12,859
|
|
$
|
13,477
|
|
|||
|
Trillium Software
|
1,869
|
|
2,035
|
|
2,053
|
|
||||||
|
Corporate
|
—
|
|
—
|
|
—
|
|
||||||
|
Total depreciation
|
$
|
13,586
|
|
$
|
14,894
|
|
$
|
15,530
|
|
|||
|
Other intangible amortization
|
|
|
|
|
|
|
||||||
|
Customer Interaction
|
$
|
656
|
|
$
|
26
|
|
$
|
206
|
|
|||
|
Trillium Software
|
3
|
|
—
|
|
—
|
|
||||||
|
Corporate
|
—
|
|
—
|
|
—
|
|
||||||
|
Total intangible amortization
|
$
|
659
|
|
$
|
26
|
|
$
|
206
|
|
|||
|
Capital expenditures
|
|
|
|
|
|
|
||||||
|
Customer Interaction
|
$
|
7,777
|
|
$
|
9,341
|
|
$
|
14,092
|
|
|||
|
Trillium Software
|
3,644
|
|
1,912
|
|
1,781
|
|
||||||
|
Corporate
|
153
|
|
12
|
|
—
|
|
||||||
|
Total capital expenditures
|
$
|
11,574
|
|
$
|
11,265
|
|
$
|
15,873
|
|
|||
|
|
Year Ended December 31,
|
|||||||
|
In thousands
|
2015
|
2014
|
||||||
|
Total assets
|
|
|
|
|
||||
|
Customer Interaction
|
$
|
231,635
|
|
$
|
436,561
|
|
||
|
Trillium Software
|
182,986
|
|
207,616
|
|
||||
|
Corporate
|
—
|
|
—
|
|
||||
|
Total assets
|
$
|
414,621
|
|
$
|
644,177
|
|
||
Note N — Acquisition and Disposition
On March 16, 2015, we completed the acquisition of 3Q Digital, Inc. The results of 3Q Digital, Inc.’s operations have been included in our consolidated financial statements since that date and are reported in the Customer Interaction segment. The initial purchase price was
$30.2 million
in cash. In addition, the purchase agreement includes a contingent consideration arrangement that requires us to pay the former owners of 3Q Digital, Inc. an additional cash payment depending on achievement of certain revenue growth goals. The potential undiscounted amount of all future payments
81
that could be required to be paid under the contingent consideration arrangement is between
$0
and
$35.0 million
in cash in 2018.
The intangible assets include customer relationships, trade names, and non-compete agreements.
The following tables summarize the consideration paid and the amounts of estimated fair value of the assets acquired and liabilities assumed at the acquisition date.
|
In thousands
|
|||
|
Cash consideration per purchase agreement
|
$
|
30,245
|
|
|
Estimated fair value of contingent consideration
|
17,940
|
|
|
|
Fair value of total consideration
|
$
|
48,185
|
|
|
In thousands
|
|||
|
Recognized amounts of tangible assets and liabilities:
|
|||
|
Current assets
|
$
|
4,135
|
|
|
Property and equipment
|
164
|
|
|
|
Other assets
|
389
|
|
|
|
Current liabilities
|
(822
|
)
|
|
|
Other liabilities
|
—
|
|
|
|
Total tangible assets and liabilities
|
$
|
3,866
|
|
|
Identifiable intangible assets
|
4,773
|
|
|
|
Goodwill (including deferred tax adjustment of $2,299)
|
41,845
|
|
|
|
Total
|
$
|
50,484
|
|
The fair value of the tangible net assets, identifiable intangible assets and goodwill recognized on acquisition is
$48.2 million
. The acquired intangible assets, which are being amortized, are as follows: customer relationships of
$4.3 million
(amortized over
seven
years), trade names and trademarks of
$0.3 million
(amortized over
two
years), and non-compete agreements of
$0.2 million
(amortized over
three
years).
A reconciliation of the beginning and ending accrued balances of the contingent consideration using significant unobservable inputs (Level 3) for the
twelve months ended
December 31, 2015
is as follows:
|
In thousands
|
|||
|
Contingent consideration at acquisition date
|
$
|
17,940
|
|
|
Accretion of interest
|
2,337
|
|
|
|
Accrued earnout liability as of December 31, 2015
|
$
|
20,277
|
|
The purchase price has been allocated based on the estimated fair values of assets described above and are subject to achievement of revenue goals. All future changes to the contingent consideration will be included in operations.
On April 14, 2015, Harte Hanks sold its B2B research business. The B2B research business represented less than
5%
of our total 2014 and 2013 revenues. As a result of the sale, the company recognized a pre-tax loss of
$9.5 million
in the second quarter of 2015. The related asset group does not meet the criteria to be classified as a component of an entity. As such, the related loss on sale is included in income before income taxes in the income statement in other expenses. The assets included both goodwill and intangible assets (see Note E,
Goodwill and Other Intangible Assets
). Future expenses are possible in future periods based upon certain working capital settlement provisions.
82
Note O — Discontinued Operations
We sold the assets of our California Shoppers operations to affiliates of OpenGate Capital Management, LLC (OpenGate) on September 27, 2013 for gross proceeds of approximately
$22.5 million
in cash. In addition, OpenGate agreed to assume certain liabilities associated with the Shoppers division. This transaction resulted in a loss on the sale of
$12.4 million
, net of
$9.0 million
of income tax benefit. This loss on sale includes transaction costs of approximately
$2.6 million
.
Because the Shoppers operations represented distinct business units with operations and cash flows that can clearly be distinguished, both operationally and for financial purposes, from the rest of Harte Hanks, the results of the Shoppers operations are reported as discontinued operations for all periods presented.
Results of the remaining Harte Hanks marketing services business are reported as continuing operations.
Summarized operating results for the Shoppers discontinued operations, through the dates of disposal, are as follows:
|
|
Year Ended December 31,
|
|||||||||||
|
In thousands
|
2015
|
2014
|
2013
|
|||||||||
|
Revenues
|
$
|
—
|
|
$
|
—
|
|
$
|
140,834
|
|
|||
|
Income from discontinued operations before impairment charges and income taxes
|
—
|
|
—
|
|
2,509
|
|
||||||
|
Loss on sale before income taxes
|
—
|
|
—
|
|
(21,402
|
)
|
||||||
|
Income tax benefit
|
—
|
|
—
|
|
7,822
|
|
||||||
|
Loss from discontinued operations
|
$
|
—
|
|
$
|
—
|
|
$
|
(11,071
|
)
|
|||
The major components of cash flows for the Shoppers discontinued operations are as follows:
|
|
Year Ended December 31,
|
|||||||||||
|
In thousands
|
2015
|
2014
|
2013
|
|||||||||
|
Loss from discontinued operations
|
$
|
—
|
|
$
|
—
|
|
$
|
(11,071
|
)
|
|||
|
Loss on sale
|
—
|
|
—
|
|
12,355
|
|
||||||
|
Deferred income taxes
|
—
|
|
—
|
|
10,594
|
|
||||||
|
Depreciation and software amortization
|
—
|
|
—
|
|
2,592
|
|
||||||
|
Other, net
|
—
|
|
—
|
|
2,619
|
|
||||||
|
Net cash provided by discontinued operations
|
$
|
—
|
|
$
|
—
|
|
$
|
17,089
|
|
|||
Note P — Selected Quarterly Data (Unaudited)
|
2015 Quarter Ended
|
2014 Quarter Ended
|
|||||||||||||||||||||||||||||||
|
In thousands, except per share amounts
|
December 31
|
September 30
|
June 30
|
March 31
|
December 31
|
September 30
|
June 30
|
March 31
|
||||||||||||||||||||||||
|
Revenues
|
$
|
129,815
|
|
$
|
121,968
|
|
$
|
122,345
|
|
$
|
121,173
|
|
$
|
146,518
|
|
$
|
134,121
|
|
$
|
140,310
|
|
$
|
132,727
|
|
||||||||
|
Operating income (loss)
|
6,792
|
|
(205,438
|
)
|
8,057
|
|
3,015
|
|
14,656
|
|
10,540
|
|
10,987
|
|
4,579
|
|
||||||||||||||||
|
Net income (loss)
|
2,543
|
|
(170,914
|
)
|
(4,172
|
)
|
1,615
|
|
10,089
|
|
6,420
|
|
5,637
|
|
1,845
|
|
||||||||||||||||
|
Basic earnings (loss) per share
|
$
|
0.04
|
|
$
|
(2.77
|
)
|
$
|
(0.07
|
)
|
$
|
0.03
|
|
$
|
0.16
|
|
$
|
0.10
|
|
$
|
0.09
|
|
$
|
0.03
|
|
||||||||
|
Diluted earnings (loss) per share
|
$
|
0.04
|
|
$
|
(2.77
|
)
|
$
|
(0.07
|
)
|
$
|
0.03
|
|
$
|
0.16
|
|
$
|
0.10
|
|
$
|
0.09
|
|
$
|
0.03
|
|
||||||||
Earnings per common share amounts are computed independently for each of the quarters presented. Therefore, the sum of the quarterly earnings per share amounts may not equal the quarterly earnings per share amounts or the annual earnings per share amounts.
83
Note Q — Subsequent Event
On
March 10, 2016
, we entered into a secured credit facility with Wells Fargo Bank, N.A. as Administrative Agent. This facility consists of a maximum
$65.0 million
revolving credit facility (the 2016 Revolving Credit Facility) and a
$45.0 million
term loan facility (the 2016 Term Loan, and collectively with the 2016 Revolving Credit Facility, the Secured Credit Facilities). See Note C for further discussion.
On March 4, 2016, Harte Hanks completed the purchase of substantially all of the assets of Denver-based Aleutian Consulting, Inc. (Aleutian) for
$3.5 million
. Aleutian, which will operate as Harte Hanks Consulting, provides go-to-market strategy consulting services combined with a proprietary fact-based, data-driven analytics approach. The historical results of Aleutian are not material to the company.
84
INDEX TO EXHIBITS
We are incorporating certain exhibits listed below by reference to other Harte Hanks filings with the Securities and Exchange Commission, which we have identified in parentheses after each applicable exhibit.
|
Exhibit
|
|
|
|
No.
|
|
Description of Exhibit
|
Acquisition and Dispositions
|
2.1
|
|
Asset Purchase Agreement, dated September 18, 2013, by and among Harte Hanks Shoppers, Inc., Southern Comprint Co. and Harte Hanks, Inc., on the one hand, and Pennysaver USA Publishing, LLC, Pennysaver USA Printing, LLC, Orbiter Properties, LLC and OpenGate Capital Management, LLC, on the other hand (filed as Exhibit 2.1 to the company’s Form 8-K dated September 19, 2013).
|
|
2.2
|
Agreement and Plan of Merger, dated March 16, 2015, among Harte Hanks, Inc., Harte Hanks Smart, Inc., 3Q Digital, Inc. and Maury Domengeaux, as representative to the stockholders of 3Q Digital, Inc. (filed as Exhibit 2.1
to the company's Form 10-Q dated May 7, 2015).
|
|
|
2.3
|
Membership Interest Purchase Agreement, dated April 14, 2015, between AMI Intermediate, LLC and Harte Hanks, Inc. relating to the sale of Aberdeen Group and Harte Hanks Market Intelligence (filed as Exhibit 2.2 to the company's Form 10-Q dated May 7, 2015).
|
|
Charter Documents
|
3(a)
|
|
Amended and Restated Certificate of Incorporation as amended through May 5, 1998 (filed as Exhibit 3(e) to the company’s Form 10-Q for the six months ended June 30, 1998).
|
|
|
|
|
|
3(b)
|
|
Fifth Amended and Restated Bylaws (filed as Exhibit 3.1 to the company’s Form 8-K dated December 4, 2015).
|
|
|
|
|
|
3(c)
|
|
Certificate of Amendment of Incorporation dated January 30, 2015 (filed as Exhibit 3.1 to the company’s Form 8-K dated January 30, 2015).
|
85
Credit Agreements
|
10.1(a)
|
|
Term Loan Agreement by and between Harte Hanks, Inc. and Wells Fargo Bank, N.A, as administrative agent, dated March 7, 2008 (filed as Exhibit 10.1 to the company’s Form 8-K dated March 7, 2008).
|
|
|
|
|
|
10.1(b)
|
|
Amended and Restated Credit Agreement, dated as of August 8, 2013, between Harte Hanks, Inc., each lender from time to time party thereto, and Bank of America, N. A., as administrative agent (filed as Exhibit 10.1 to the company’s Form 8-K, dated August 12, 2013).
|
|
|
|
|
|
10.1(c)
|
|
First Amendment to Term Loan Agreement dated as of August 12, 2010 between Harte Hanks, Inc., and Wells Fargo Bank, N. A., as Administrative Agent (filed as Exhibit 10.2 to the company’s Form 8-K, dated August 12, 2010).
|
|
|
|
|
|
10.1(d)
|
|
Term Loan Agreement dated as of August 16, 2011 between Harte Hanks, Inc., each lender from time to time party thereto, and Bank of America, N. A., as administrative agent (filed as Exhibit 10.1 to the company’s Form 8-K, dated August 16, 2011).
|
|
|
|
|
|
10.1(e)
|
|
First Amendment to Revolving Credit Agreement dated as of August 16, 2011 Between Harte Hanks, Inc., each lender from time to time party thereto, and Bank of America, N. A., as administrative agent (filed as Exhibit 10.2 to the company’s Form 8-K, dated August 16, 2011).
|
|
10.1(f)
|
|
Second Amendment to Term Loan Agreement dated as of August 16, 2011 Between Harte Hanks, Inc., each lender from time to time party thereto and Wells Fargo Bank, N.A., as administrative agent (filed as Exhibit 10.3 to the company’s Form 8-K, dated August 16, 2011).
|
|
|
|
|
|
10.1(g)
|
|
First Amendment to Term Loan Agreement, dated as of August 8, 2013, between Harte Hanks, Inc., each Subsidiary Guarantor (as defined in the Existing Term Loan Agreement), each lender from time to time party thereto, and Bank of America, N.A., as administrative agent (filed as Exhibit 10.2 to the company’s Form 8-K, dated August 12, 2013).
|
|
10.1(f)
|
Term Loan Agreement by and between Harte Hanks, Inc. and Wells Fargo Bank, as administrative agent, date March 10, 2016 (filed as Exhibit 10.1 to the company's Form 8-K dated March 11, 2016).
|
|
86
Management and Director Compensatory Plans and Forms of Award Agreements
|
10.2(a)
|
|
Harte Hanks, Inc. Restoration Pension Plan (As Amended and Restated Effective January 1, 2008) (filed as Exhibit 10.1 to the company’s Form 8-K dated June 27, 2008).
|
|
|
|
|
|
10.2(b)
|
|
Harte Hanks, Inc. Deferred Compensation Plan (As Amended and Restated Effective January 1, 2008) (filed as Exhibit 10.3 to the company’s Form 10-K dated June 27, 2008).
|
|
|
|
|
|
10.2(c)
|
|
Harte Hanks, Inc. 2005 Omnibus Incentive Plan (As Amended and Restated Effective February 13, 2009) (filed as Exhibit 10.1 to the company’s Form 8-K dated February 13, 2009).
|
|
|
|
|
|
10.2(d)
|
|
Amendment to Harte Hanks, Inc. 2005 Omnibus Incentive Plan, dated as of May 12, 2009 (incorporated by reference to Exhibit 4.4 to Harte Hanks Registration Statement on Form S-8, filed on May 12, 2009).
|
|
|
|
|
|
10.2(e)
|
|
Form of 2005 Omnibus Incentive Plan Non-Qualified Stock Option Agreement (filed as Exhibit 10.2(i) to the company’s Form 10-K dated March 7, 2012).
|
|
10.2(f)
|
|
Form of 2005 Omnibus Incentive Plan Bonus Stock Agreement (filed as Exhibit 10.2(j) to the company’s Form 10-K dated March 7, 2012).
|
|
|
|
|
|
10.2(g)
|
|
Form of 2005 Omnibus Incentive Plan Restricted Stock Award Agreement (filed as Exhibit 10.2(k) to the company’s Form 10-K dated March 7, 2012).
|
|
|
|
|
|
10.2(h)
|
|
Form of 2005 Omnibus Incentive Plan Performance Unit Award Agreement (filed as Exhibit 10.2(l) to the company’s Form 10-K dated March 7, 2012).
|
|
|
|
|
|
10.2(i)
|
|
Summary of Non-Employee Directors’ Compensation (included within the company’s Schedule of 14A proxy statement filed April 15, 2013).
|
|
|
|
|
|
10.2(j)
|
|
Harte Hanks, Inc. 2013 Omnibus Incentive Plan (filed as Annex A to the company’s Schedule 14A proxy statement filed April 15, 2013).
|
|
|
|
|
|
10.2(k)
|
|
Form of 2013 Omnibus Incentive Plan Non-Qualified Stock Option Agreement (filed as Exhibit 10.4 to the company’s Registration Statement on Form S-8 dated June 7, 2013).
|
|
10.2(l)
|
|
Form of 2013 Omnibus Incentive Plan Restricted Stock Award Agreement (General) (filed as Exhibit 10.1 to the company’s Registration Statement on Form S-8 dated June 7, 2013).
|
|
|
|
|
|
10.2(m)
|
|
Form of 2013 Omnibus Incentive Plan Restricted Stock Award Agreement (Director) (filed as Exhibit 10.2 to the company’s Registration Statement on Form S-8 dated June 7, 2013).
|
|
10.2(n)
|
|
Form of 2013 Omnibus Incentive Plan Performance Unit Award Agreement (filed as Exhibit 10.3 to the company’s Registration Statement on Form S-8 dated June 7, 2013).
|
|
|
|
|
|
10.2(o)
|
|
Form of Non-Qualified Stock Option Agreement between the company and Robert A. Philpott (filed as Exhibit 10.2 to the company’s 8-K dated June 11, 2013).
|
|
10.2(p)
|
|
Form of Restricted Stock Award Agreement between the company and Robert A. Philpott (filed as Exhibit 10.3 to the company’s 8-K dated June 11, 2013).
|
|
|
|
|
|
10.2(q)
|
|
Form of Performance Unit Award Agreement between the company and Robert A. Philpott (filed as Exhibit 10.4 to the company’s 8-K dated June 11, 2013).
|
|
10.2(r)
|
Form of Non-Qualified Stock Option Agreement between the company and Karen A. Puckett (filed as Exhibit 10.2 to the company's 8-K dated September 14, 2015).
|
|
|
10.2(s)
|
Form of Restricted Stock Award Agreement between the company and Karen A. Puckett (filed as Exhibit 10.3 to the company's 8-K dated September 14, 2015).
|
|
|
10.2(t)
|
Form of Performance Unit Award Agreement between the company and Karen A. Puckett (filed as Exhibit 10.4 to the company's 8-K dated September 14, 2015).
|
|
87
Executive Officer Employment-Related and Separation Agreements
|
10.3(a)
|
|
Form of Change of Control Severance Agreement between the company and its Corporate Officers (filed as Exhibit 10.1 to the company’s Form 8-K, dated March 19, 2015).
|
|
|
|
|
|
10.3(b)
|
|
Form of Employment Restrictions Agreement signed by the Corporate Officers of the company (filed as Exhibit 10.3 to the company’s Form 8-K dated March 15, 2011).
|
|
|
|
|
|
10.3 (c)
|
|
Transition and Consulting Agreement, dated as of July 25, 2011, Between the company and Peter E. Gorman (filed as Exhibit 10.1 to the Company’s Form 8-K dated July 26, 2011).
|
|
|
|
|
|
10.3 (d)
|
|
Transition Agreement dated July 30, 2012 between the company and Gary J. Skidmore (filed as Exhibit 10.2 to the company’s 8-K dated August 2, 2012)
|
|
|
|
|
|
10.3 (e)
|
|
Form of Indemnification Agreement for Directors and Officers (filed as Exhibit 10.1 to the company’s 8-K dated August 2, 2012)
|
|
|
|
|
|
10.3 (f)
|
|
Retirement & Consulting Agreement between the company and Larry D. Franklin dated June 7, 2013 (filed as Exhibit 10.5 to the company’s 8-K dated June 11, 2013).
|
|
|
|
|
|
10.3 (g)
|
|
Employment Agreement between the company and Robert A. Philpott dated June 8, 2013 (filed as Exhibit 10.1 to the company’s 8-K dated June 11, 2013).
|
|
|
|
|
|
10.3 (h)
|
|
Form of Severance Agreement between the company and certain of its officers (filed as Exhibit 10.6 to the company’s 8-K dated June 11, 2013).
|
|
|
|
|
|
10.3(i)
|
|
Executive Severance Policy applicable to the company’s executive officers and certain others (filed as Exhibit 10.1 to the company’s Form 8-K, dated January 30, 2015).
|
|
10.3(j)
|
Retention Bonus Agreement applicable to the company's executive officers (filed as Exhibit 10.1 to the company's Form 8-K, dated July 9, 2015).
|
|
|
10.3(k)
|
Employment Agreement between the company and Karen A. Puckett dated September 13, 2015 (filed as Exhibit 10.1 to the company's Form 8-K, dated September 14, 2015).
|
|
Other Exhibits
|
*21
|
|
Subsidiaries of Harte Hanks, Inc.
|
|
|
|
|
|
*23
|
|
Consent of KPMG LLP, Independent Registered Public Accounting Firm.
|
|
|
|
|
|
*31.1
|
|
Certification of Chief Executive Officer pursuant to Section 302 of the Sarbanes-Oxley Act of 2002.
|
|
|
|
|
|
*31.2
|
|
Certification of Chief Financial Officer pursuant to Section 302 of the Sarbanes-Oxley Act of 2002.
|
|
|
|
|
|
*32.1
|
|
Furnished Certification of Chief Executive Officer pursuant to 18 U.S.C Section 1350, as adopted pursuant to Section 906 of the Sarbanes-Oxley Act of 2002.
|
|
|
|
|
|
*32.2
|
|
Furnished Certification of Chief Financial Officer pursuant to 18 U.S.C Section 1350, as adopted pursuant to Section 906 of the Sarbanes-Oxley Act of 2002.
|
|
|
|
|
|
*101
|
|
XBRL Interactive Data Files.
|
*Filed or furnished herewith, as applicable
88
TABLE OF CONTENTS
Part IItem 1. BusinessItem 1A. Risk FactorsItem 1B. Unresolved Staff CommentsItem 2. PropertiesItem 3. Legal ProceedingsItem 4. Mine Safety DisclosuresPart IIItem 5. Market For Registrant S Common Equity, Related Stockholder Matters and Issuer Purchases Of Equity SecuritiesItem 6. Selected Financial DataItem 7. Management S Discussion and Analysis Of Financial Condition and Results Of OperationsItem 7A. Quantitative and Qualitative Disclosures About Market RiskItem 8. Financial Statements and Supplementary DataItem 9. Changes in and Disagreements with Accountants on Accounting and Financial DisclosureItem 9A. Controls and ProceduresItem 9B. Other InformationPart IIIItem 10. Directors, Executive Officers and Corporate GovernanceItem 11. Executive CompensationItem 12. Security Ownership Of Certain Beneficial Owners and Management and Related Stockholder MattersItem 13. Certain Relationships and Related Transactions, and Director IndependenceItem 14. Principal Accountant Fees and ServicesPart IVItem 15. Exhibits and Financial Statement Schedules