UNITED STATES
SECURITIES AND EXCHANGE COMMISSION
Washington, D.C. 20549
FORM 20-F
(Mark One)
|
o
|
REGISTRATION STATEMENT PURSUANT TO SECTION 12(b) OR (g) OF THE SECURITIES EXCHANGE ACT OF 1934
|
|
OR
|
|
|
x
|
ANNUAL REPORT PURSUANT TO SECTION 13 OR 15(d) OF THE SECURITIES EXCHANGE ACT OF 1934
|
|
For the fiscal year ended December 31, 2009
|
|
|
OR
|
|
|
o
|
TRANSITION REPORT PURSUANT TO SECTION 13 OR 15(d) OF THE SECURITIES EXCHANGE ACT OF 1934
|
|
For the transition period from ________________ to ________________
|
|
|
OR
|
|
|
o
|
SHELL COMPANY REPORT PURSUANT TO SECTION 13 OR 15(d) OF THE SECURITIES EXCHANGE ACT OF 1934
|
|
Date of event requiring this shell company report ________________
|
Commission file number: 000-51847
HI
MAX TECHNOLOGIES, INC.
(Exact name of Registrant as specified in its charter)
Not Applicable
(Translation of Registrant’s name into English)
CAYMAN ISLANDS
(Jurisdiction of incorporation or organization)
NO. 26, ZIH LIAN ROAD,
TREE VALLEY PARK
SINSHIH TOWN
SHIP, TAINAN COUNTY
74148
TAIWAN, REPUBLIC OF CHINA
(Address of principal executive offices)
Max Chan
Chief Financial Officer
Telephone: +886-2-2370-3999
E-mail: max_chan@himax.com.tw
Facsimile: +886-2-2314-0877
10F
, No. 1,
X
iangyang Road
Taipei
10046
Taiw
an
, Republic
o
f
China
(Name, Telephone, E-mail and/or Facsimile number and Address of Company Contact Person)
Securities registered or to be registered pursuant to Section 12(b) of the Act:
|
Title of each class
|
Name of each exchange on which registered
|
|
Ordinary Shares, par value $0.3 per ordinary share
|
The Nasdaq Global Select Market Inc.*
|
|
*
|
Not for trading, but only in connection with the listing on the Nasdaq Global Select Market, Inc. of American Depositary Shares representing such Ordinary Shares
|
Securities registered or to be registered pursuant to Section 12(g) of the Act: None
Securities for which there is a reporting obligation pursuant to Section 15(d) of the Act: None
Indicate the number of outstanding shares of each of the issuer’s classes of capital or common stock as of the close of the period covered by the annual report. 358,012,184 Ordinary Shares.
Indicate by check mark if the registrant is a well-known seasoned issuer, as defined in Rule 405 of the Securities Act.
o
Yes
x
No
If this report is an annual or transition report, indicate by check mark if the registrant is not required to file reports pursuant to Section 13 or 15(d) of the Securities Exchange Act of 1934.
o
Yes
x
No
Indicate by check mark whether the registrant (1) has filed all reports required to be filed by Section 13 or 15(d) of the Securities Exchange Act of 1934 during the preceding 12 months (or for such shorter period that the registrant was required to file such reports), and (2) has been subject to such filing requirements for the past 90 days.
x
Yes
o
No
Indicate by check mark whether the registrant is a large accelerated filer, an accelerated filer, or a non-accelerated filer. See definition of “accelerated filer and large accelerated filer” in Rule 12b-2 of the Exchange Act. (Check one):
|
Large accelerated filer
o
|
Accelerated filer
x
|
Non-accelerated filer
o
|
Indicate by check mark which basis of accounting the registrant has used to prepare the financial statements included in this filing:
|
U.S. GAAP
x
|
International Financial Reporting Standards as issued by the International Accounting Standards Board
o
|
Other
o
|
If “Other” has been checked in response to the previous question, indicate by check mark which financial statement item the registrant has elected to follow.
o
Item 17
o
Item 18
If this is an annual report, indicate by check mark whether the registrant is a shell company (as defined in Rule 12b-2 of the Exchange Act). o Yes
x
No
TABLE OF CONTENTS
|
Page
|
|
|
SPECIAL NOTE REGARDING FORWARD-LOOKING STATEMENTS
|
1
|
|
CERTAIN CONVENTIONS
|
1
|
|
PART I
|
3
|
|
ITEM 1. IDENTITY OF DIRECTORS, SENIOR MANAGEMENT AND ADVISERS
|
3
|
|
ITEM 2. OFFER STATISTICS AND EXPECTED TIMETABLE
|
3
|
|
ITEM 3. KEY INFORMATION
|
3
|
|
3.A. Selected Financial Data
|
3
|
|
3.B. Capitalization and Indebtedness
|
6
|
|
3.C. Reason for the Offer and Use of Proceeds
|
6
|
|
3.D. Risk Factors
|
6
|
|
ITEM 4. INFORMATION ON THE COMPANY
|
27
|
|
4.A. History and Development of the Company
|
27
|
|
4.B. Business Overview
|
29
|
|
4.C. Organizational Structure
|
49
|
|
4.D. Property, Plants and Equipment
|
51
|
|
ITEM 4A. UNRESOLVED STAFF COMMENTS
|
51
|
|
ITEM 5. OPERATING AND FINANCIAL REVIEW AND PROSPECTS
|
51
|
|
5.A. Operating Results
|
51
|
|
5.B. Liquidity and Capital Resources
|
66
|
|
5.C. Research and Development
|
67
|
|
5.D. Trend Information
|
67
|
|
5.E. Off-Balance Sheet Arrangements
|
68
|
|
5.F. Tabular Disclosure of Contractual Obligations
|
68
|
|
ITEM 6. DIRECTORS, SENIOR MANAGEMENT AND EMPLOYEES
|
69
|
|
6.A. Directors and Senior Management
|
69
|
|
6.B. Compensation of Directors and Executive Officers
|
71
|
|
6.C. Board Practices
|
72
|
|
6.D. Employees
|
74
|
|
6.E. Share Ownership
|
77
|
|
ITEM 7. MAJOR SHAREHOLDERS AND RELATED PARTY TRANSACTIONS
|
77
|
|
7.A. Major Shareholders
|
77
|
|
7.B. Related Party Transactions
|
78
|
|
7.C. Interests of Experts and Counsel
|
79
|
|
ITEM 8. FINANCIAL INFORMATION
|
80
|
|
8.A. Consolidated Statements and Other Financial Information
|
80
|
|
8.B. Significant Changes
|
81
|
|
ITEM 9. THE OFFER AND LISTING
|
81
|
|
9.A. Offer and Listing Details
|
81
|
|
9.B. Plan of Distribution
|
82
|
|
9.C. Markets
|
82
|
|
9.D. Selling Shareholders
|
82
|
|
9.E. Dilution
|
82
|
|
9.F. Expenses of the Issue
|
82
|
|
ITEM 10. ADDITIONAL INFORMATION
|
82
|
|
10.A. Share Capital
|
82
|
|
10.B. Memorandum and Articles of Association
|
83
|
|
10.C. Material Contracts
|
83
|
|
10.D. Exchange Controls
|
83
|
|
10.E. Taxation
|
84
|
|
10.F. Dividends and Paying Agents
|
86
|
|
10.G. Statement by Experts
|
86
|
|
10.H. Documents on Display
|
86
|
i
|
10.I. Subsidiary Information
|
86
|
|
ITEM 11. QUANTITATIVE AND QUALITATIVE DISCLOSURES ABOUT MARKET RISK
|
86
|
|
ITEM 12. DESCRIPTION OF SECURITIES OTHER THAN EQUITY SECURITIES
|
87
|
|
12.A. Debt Securities
|
87
|
|
12.B. Warrants and Rights
|
87
|
|
12.C. Other Securities
|
87
|
|
12.D. American Depositary Shares
|
87
|
|
PART II
|
89
|
|
ITEM 13. DEFAULTS, DIVIDEND ARREARAGES AND DELINQUENCIES
|
89
|
|
ITEM 14. MATERIAL MODIFICATIONS TO THE RIGHTS OF SECURITY HOLDERS AND USE OF PROCEEDS
|
89
|
|
ITEM 15. CONTROLS AND PROCEDURES
|
89
|
|
ITEM 16A. AUDIT COMMITTEE FINANCIAL EXPERT
|
90
|
|
ITEM 16B. CODE OF ETHICS
|
91
|
|
ITEM 16C. PRINCIPAL ACCOUNTANT FEES AND SERVICES
|
91
|
|
ITEM 16D. EXEMPTIONS FROM THE LISTING STANDARDS FOR AUDIT COMMITTEES
|
91
|
|
ITEM 16E. PURCHASES OF EQUITY SECURITIES BY THE ISSUER AND AFFILIATED PURCHASERS
|
91
|
|
ITEM 16F. CHANGE IN REGISTRANT’S CERTIFYING ACCOUNTANT
|
92
|
|
ITEM 16G. CORPORATE GOVERNANCE
|
92
|
|
PART III
|
93
|
|
ITEM 17. FINANCIAL STATEMENTS
|
93
|
|
ITEM 18. FINANCIAL STATEMENTS
|
93
|
|
ITEM 19. EXHIBITS
|
94
|
ii
SPECIAL NOTE REGARDING FORWARD-LOOKING STATEMENTS
This annual report on Form 20-F contains “forward-looking statements” within the meaning of Section 27A of the Securities Act of 1933, as amended, and Section 21E of the Securities Exchange Act of 1934, as amended, or the Exchange Act. Although these forward-looking statements, which may include statements regarding our future results of operations, financial condition, or business prospects, are based on our own information and information from other sources we believe to be reliable, you should not place undue reliance on these forward-looking statements, which apply only as of the date of this annual report. The words “anticipate,” “believe,” “expect,” “intend,” “plan,” “estimate” and similar expressions, as they relate to us, are intended to identify a number of these forward-looking statements. Our actual results of operations, financial condition or business prospects may differ materially from those expressed or implied in these forward-looking statements for a variety of reasons, including, among other things and not limited to, our anticipated growth strategies, our future business developments, results of operations and financial condition, our ability to develop new products, the expected growth of the display driver markets, the expected growth of end-use applications that use flat panel displays, particularly TFT-LCD panels, development of alternative flat panel display technologies, our ability to collect accounts receivable and manage inventory, changes in economic and financial market conditions, and other factors. For a discussion of these risks and other factors, please see “Item 3.D. Key Information—Risk Factors.”
CERTAIN CONVENTIONS
Unless otherwise indicated, all translations from U.S. dollars to NT dollars in this annual report were made at a rate of $1.00 to NT$31.95, the noon buying rate in The City of New York for cable transfers in NT dollars per U.S. dollar as certified for customs purposes by the Federal Reserve Bank of New York on December 31, 2009. No representation is made that the NT dollar amounts referred to herein could have been or could be converted into U.S. dollars at any particular rate or at all. On May 28, 2010, the noon buying rate was $1.00 to NT$32.00. Any discrepancies in any table between totals and sums of the amounts listed are due to rounding.
Unless otherwise indicated, in this annual report,
|
|
·
|
the terms “we,” “us,” “our company,” “our,” and “Himax” refer to Himax Technologies, Inc., its predecessor entities and subsidiaries;
|
|
|
·
|
the term “Himax Taiwan” refers to Himax Technologies Limited, our wholly owned subsidiary in Taiwan and our predecessor;
|
|
|
·
|
“shares” or “ordinary shares” refers to our ordinary shares, par value $0.3 per share;
|
|
|
·
|
“RSUs” refers to restricted share units;
|
|
|
·
|
“ADSs” refers to our American depositary shares, each of which represents two ordinary shares;
|
|
|
·
|
“ADRs” refers to the American depositary receipts that evidence our ADSs;
|
|
|
·
|
“TDRs” refers to our proposed Taiwan depositary receipts to be listed on the Taiwan Stock Exchange upon the successful completion of our Taiwan listing plan;
|
|
|
·
|
“ROC” or “Taiwan” refers to the island of Taiwan and other areas under the effective control of the Republic of China;
|
|
|
·
|
“PRC” or “China” for purposes of this annual report refers to the People’s Republic of China, excluding Taiwan and the special administrative regions of Hong Kong and Macau;
|
|
|
·
|
“AMOLED” refers to active matrix organic light-emitting diode;
|
|
|
·
|
“CMOS” refers to complementary metal oxide semiconductor;
|
|
|
·
|
“IC” refers to integrated circuit;
|
1
|
|
·
|
“LCOS” refers to liquid crystal on silicon;
|
|
|
·
|
“LED” refers to light-emitting diode;
|
|
|
·
|
“LTPS” refers to low temperature poly silicon;
|
|
|
·
|
“OLED” refers to organic light-emitting diode;
|
|
|
·
|
“TFT-LCD” refers to amorphous silicon thin film transistor liquid crystal display, or “a-Si TFT-LCD;”
|
|
|
·
|
“processed tape” refers to polyimide tape plated with copper foil that has a circuit formed within it, which is used in tape-automated bonding packaging;
|
|
|
·
|
“semiconductor manufacturing service providers” refers to third-party wafer fabrication foundries, gold bumping houses and assembly and testing houses;
|
|
|
·
|
“large-sized panels” refers to panels that are typically above ten inches in diagonal measurement;
|
|
|
·
|
“small and medium-sized panels” refers to panels that are typically around ten inches or less in diagonal measurement;
|
|
|
·
|
all references to “New Taiwan dollars,” “NT dollars” and “NT$” are to the legal currency of the ROC; and
|
|
|
·
|
all references to “dollars,” “U.S. dollars” and “$” are to the legal currency of the United States.
|
On August 10, 2009, we effected: (i) a stock split in the form of a stock dividend of 5,999 ordinary shares for each ordinary share held by shareholders of record, followed by a consolidation of every 3,000 ordinary shares into one ordinary share; (ii) a change of the par value of our ordinary shares from $0.0001 each to $0.3 each; and (iii) a change in our ADS ratio from one ADS representing one ordinary share to one ADS representing two ordinary shares. See “Item 7.A. Major Shareholders and Related Party Transactions—Major Shareholders” for more information. Unless otherwise indicated, all shares, per share and share equity data in this annual report have been retroactively adjusted to reflect the effect of the stock split and the change in par value for all periods presented.
2
Not applicable.
Not applicable.
3.A. Selected Financial Data
The selected consolidated statement of income data and selected consolidated cash flow data for the years ended December 31, 2007, 2008 and 2009 and the selected consolidated balance sheet data as of December 31, 2008 and 2009 are derived from our audited consolidated financial statements included herein, which were prepared in accordance with U.S. GAAP. The selected consolidated statement of income data and selected consolidated cash flow data for the years ended December 31, 2005 and 2006 and the selected consolidated balance sheet data as of December 31, 2005, 2006 and 2007 are derived from our audited consolidated financial statements that have not been included herein and were prepared in accordance with U.S. GAAP. Our consolidated financial statements include the accounts of Himax Technologies, Inc. and its subsidiaries as if we had been in existence for all years presented. As a result of our reorganization, 100% of our outstanding ordinary shares immediately prior to our initial public offering were owned by former shareholders of Himax Taiwan. See “Item 4.A. Information on the Company—History and Development of the Company.” In presenting our consolidated financial statements, the assets and liabilities, revenues and expenses of Himax Taiwan and its subsidiaries are included in our consolidated financial statements at their historical amounts for all periods presented. Our historical results do not necessarily indicate results expected for any future periods. The selected financial data set forth below should be read in conjunction with “Item 5. Operating and Financial Review and Prospects” and the consolidated financial statements and the notes to those statements included herein.
Certain prior year amounts have been reclassified to conform to the 2009 financial statement presentation. All shares, per share and share equity data set forth below have been retroactively adjusted to reflect the stock split and the change in par value effected on August 10, 2009 for all periods presented.
|
Year Ended December 31,
|
||||||||||||||||||||
|
2005
|
2006
|
2007
|
2008
|
2009
|
||||||||||||||||
|
(in thousands, except per share data)
|
||||||||||||||||||||
|
Consolidated Statement of Income Data:
|
||||||||||||||||||||
|
Revenues from third parties, net
|
$ | 217,420 | $ | 329,886 | $ | 371,267 | $ | 312,336 | $ | 245,075 | ||||||||||
|
Revenues from related parties, net
|
322,784 | 414,632 | 546,944 | 520,463 | 447,306 | |||||||||||||||
|
Costs and expenses
(1)
:
|
||||||||||||||||||||
|
Cost of revenues
|
419,380 | 601,565 | 716,163 | 628,693 | 550,556 | |||||||||||||||
|
Research and development
|
41,278 | 60,655 | 73,906 | 87,574 | 71,364 | |||||||||||||||
|
General and administrative
|
6,784 | 9,762 | 14,903 | 19,353 | 16,346 | |||||||||||||||
|
Bad debt expense
|
- | 187 | - | 25,305 | 218 | |||||||||||||||
|
Sales and marketing
|
4,762 | 6,783 | 9,334 | 11,692 | 10,360 | |||||||||||||||
|
Operating income
|
$ | 68,000 | $ | 65,566 | $ | 103,905 | $ | 60,182 | $ | 43,537 | ||||||||||
|
Net income
(2)
|
$ | 61,335 | $ | 74,953 | $ | 111,455 | $ | 72,724 | $ | 35,810 | ||||||||||
|
Net income attributable to Himax stockholders
|
$ | 61,558 | $ | 75,190 | $ | 112,596 | $ | 76,381 | $ | 39,650 | ||||||||||
3
|
Year Ended December 31,
|
||||||||||||||||||||
|
2005
|
2006
|
2007
|
2008
|
2009
|
||||||||||||||||
|
|
||||||||||||||||||||
|
Earnings per ordinary share attributable to Himax stockholders
(2)
:
|
||||||||||||||||||||
|
Basic
|
$ | 0.17 | $ | 0.20 | $ | 0.29 | $ | 0.20 | $ | 0.11 | ||||||||||
|
Diluted
|
$ | 0.17 | $ | 0.19 | $ | 0.29 | $ | 0.20 | $ | 0.11 | ||||||||||
|
Earnings per ADS attributable to Himax stockholders:
|
||||||||||||||||||||
|
Basic
|
$ | 0.35 | $ | 0.39 | $ | 0.57 | $ | 0.40 | $ | 0.21 | ||||||||||
|
Diluted
|
$ | 0.34 | $ | 0.39 | $ | 0.57 | $ | 0.40 | $ | 0.21 | ||||||||||
|
Weighted-average number of ordinary shares used in earnings per share computation:
|
||||||||||||||||||||
|
Basic
|
352,210 | 384,950 | 393,725 | 383,229 | 369,652 | |||||||||||||||
|
Diluted
|
361,317 | 390,180 | 395,043 | 383,753 | 370,229 | |||||||||||||||
|
Cash dividends declared per ordinary share
(3)
|
$ | 0.038 | $ | 0.000 | $ | 0.100 | $ | 0.175 | $ | 0.150 | ||||||||||
|
Cash dividends declared per ADS
|
$ | 0.075 | $ | 0.000 | $ | 0.200 | $ | 0.350 | $ | 0.300 | ||||||||||
|
Note: (1)
|
The amount of share-based compensation included in applicable costs and expenses categories is summarized as follows:
|
|
Year Ended December 31,
|
||||||||||||||||||||
|
2005
|
2006
|
2007
|
2008
|
2009
|
||||||||||||||||
|
(in thousands)
|
||||||||||||||||||||
|
Cost of revenues
|
$ | 188 | $ | 275 | $ | 422 | $ | 435 | $ | 264 | ||||||||||
|
Research and development
|
6,336 | 11,806 | 15,393 | 15,861 | 10,936 | |||||||||||||||
|
General and administrative
|
848 | 1,444 | 2,182 | 2,813 | 1,959 | |||||||||||||||
|
Sales and marketing
|
1,241 | 1,625 | 2,324 | 2,691 | 1,902 | |||||||||||||||
|
Total
|
$ | 8,613 | $ | 15,150 | $ | 20,321 | $ | 21,800 | $ | 15,061 | ||||||||||
Of the $20.3 million, $21.8 million and $15.1 million in share-based compensation in 2007, 2008 and 2009, $14.4 million, $12.7 million and $6.5 million were settled in cash, respectively.
|
(2)
|
Under the ROC Statute for Upgrading Industries, we are exempt from income taxes for income attributable to expanded production capacity or newly developed technologies. Based on the ROC statutory income tax rate of 25%, the effect of such tax exemption was an increase on net income and basic and diluted earnings per share attributable to our stockholders of $27.1 million, $0.07 and $0.07, respectively, for the year ended December 31, 2007, $25.2 million, $0.07 and $0.07, respectively, for the year ended December 31, 2008, and $9.4 million, $0.03 and $0.03, respectively, for the year ended December 31, 2009. A portion of these tax exemptions expired or will expire on March 31, 2009, December 31, 2010, December 31, 2012 and December 31, 2013.
|
|
(3)
|
The above cash dividends should not be considered representative of the dividends that would be paid in any future periods or our dividend policy. See “Item 8.A.8. Financial Information—Dividends and Dividend Policy” for more information on our dividends for the years from 2007 to 2010 and our dividend policy.
|
|
As of December 31,
|
||||||||||||||||||||
|
2005
|
2006
|
2007
|
2008
|
2009
|
||||||||||||||||
|
(in thousands)
|
||||||||||||||||||||
|
Consolidated Balance Sheet Data:
|
||||||||||||||||||||
|
Cash and cash equivalents
(1)
|
$ | 7,086 | $ | 109,753 | $ | 94,780 | $ | 135,200 | $ | 110,924 | ||||||||||
|
Accounts receivable, net
|
80,259 | 112,767 | 88,682 | 51,029 | 64,496 | |||||||||||||||
|
Accounts receivable from related parties, net
|
69,587 | 116,850 | 194,902 | 104,477 | 138,172 | |||||||||||||||
|
Inventories
|
105,004 | 101,341 | 116,550 | 96,921 | 67,768 | |||||||||||||||
|
Total current assets
|
300,056 | 466,715 | 538,272 | 434,650 | 423,797 | |||||||||||||||
|
Total assets
|
327,239 | 518,794 | 652,762 | 565,548 | 550,448 | |||||||||||||||
4
|
As of December 31,
|
||||||||||||||||||||
|
2005
|
2006
|
2007
|
2008
|
2009
|
||||||||||||||||
|
(in thousands)
|
||||||||||||||||||||
|
Accounts payable
|
105,801 | 120,407 | 147,221 | 53,720 | 88,079 | |||||||||||||||
|
Total current liabilities
(2)
|
160,784 | 153,279 | 185,048 | 90,143 | 120,651 | |||||||||||||||
|
Total liabilities
|
160,784 | 153,471 | 190,364 | 95,542 | 126,376 | |||||||||||||||
|
Ordinary shares
|
109,253 | 116,160 | 115,188 | 114,072 | 107,404 | |||||||||||||||
|
Total equity
(1)
|
166,455 | 365,323 | 462,398 | 470,006 | 424,072 | |||||||||||||||
|
Note:
|
(1)
|
Cash and cash equivalents as of December 31, 2006 increased significantly as compared to December 31, 2005. This increase was due primarily to net proceeds of $147.4 million received from our initial public offering in April 2006, which also caused the increase in total equity by the same amount.
|
|
|
(2)
|
Total current liabilities as of December 31, 2007 and 2008 were previously stated at $185,599 thousand and $91,630 thousand, respectively, and have been revised due to the reclassification of $551 thousand and $1,487 thousand, respectively, as non-current income taxes payable and other liabilities.
|
|
Year Ended December 31,
|
||||||||||||||||||||
|
2005
|
2006
|
2007
|
2008
|
2009
|
||||||||||||||||
|
(in thousands)
|
||||||||||||||||||||
|
Consolidated Cash Flow Data:
|
||||||||||||||||||||
|
Net cash provided by operating activities
|
$ | 12,464 | $ | 29,696 | $ | 77,162 | $ | 136,500 | $ | 73,630 | ||||||||||
|
Net cash used in investing activities
|
(25,363 | ) | (8,927 | ) | (25,019 | ) | (21,764 | ) | (7,255 | ) | ||||||||||
|
Net cash provided by (used in) financing activities
|
14,404 | 81,886 | (67,241 | ) | (74,350 | ) | (91,065 | ) | ||||||||||||
Exchange Rate Information
The following table sets forth the average, high, low and period-end noon buying rates between NT dollars and U.S. dollars for the periods indicated:
|
Noon Buying Rate
|
||||||||||||||||
|
Average
(1)
|
High
|
Low
|
Period-end
|
|||||||||||||
|
(NT dollars per U.S. dollar)
|
||||||||||||||||
|
Period
|
||||||||||||||||
|
2005
|
32.16 | 33.77 | 30.65 | 32.80 | ||||||||||||
|
2006
|
32.49 | 33.31 | 31.28 | 32.59 | ||||||||||||
|
2007
|
32.82 | 33.41 | 32.26 | 32.43 | ||||||||||||
|
2008
|
31.51 | 33.55 | 29.99 | 32.76 | ||||||||||||
|
2009
|
32.96 | 35.21 | 31.95 | 31.95 | ||||||||||||
|
November
|
32.32 | 32.58 | 32.12 | 32.20 | ||||||||||||
|
December
|
32.25 | 32.38 | 31.95 | 31.95 | ||||||||||||
|
2010
|
||||||||||||||||
|
January
|
31.87 | 32.04 | 31.65 | 31.94 | ||||||||||||
|
February
|
32.06 | 32.14 | 31.98 | 32.12 | ||||||||||||
|
March
|
31.83 | 32.04 | 31.70 | 31.73 | ||||||||||||
|
April
|
31.48 | 31.74 | 31.30 | 31.31 | ||||||||||||
|
May (through May 28)
|
31.83 | 32.33 | 31.40 | 32.00 | ||||||||||||
|
Source: Federal Reserve Bank of New York.
|
|
Note:
|
(1)
|
Annual averages are calculated by averaging month-end rates for the relevant year. Monthly averages are calculated by averaging daily rates for the relevant period.
|
5
Not applicable.
3.C. Reason for the Offer and Use of Proceeds
Not applicable.
3.D. Risk Factors
Risks Relating to Our Financial Condition and Business
We generate a substantial majority of our revenues from a few key customers, including Chimei Innolux Corporation, which is the surviving entity following the merger of three of our large customers. The increase in bargaining power of any of our key customers and the loss of, or a significant reduction in orders from, any of them could materially and adversely affect our operating results.
Our key customers in 2009 included Chi Mei Optoelectronics Corp., or CMO, and Samsung Electronics Taiwan Co., Ltd., or Samsung, which, together with their respective affiliates, accounted for approximately 64.3% and 7.2%, respectively, of our revenues in 2009. In November 2009, CMO, InnoLux Display Corporation, or Innolux, and TPO Displays Corporation, or TPO, which have been among our largest customers, agreed to conduct a merger of the three companies. The merger transaction was completed on March 18, 2010. Innolux is the surviving entity following the merger and is renamed Chimei Innolux Corporation, or Chimei Innolux. As over 50% of our revenues have historically been generated from CMO, our results of operations and financial condition will continue to be significantly linked to the purchase policy and success of Chimei Innolux. If Chimei Innolux seeks lower prices from us as a result of increased bargaining power, or if Chimei Innolux seeks a different purchase policy resulting in a lower amount of combined purchases from us, our business and financial results could be materially and adversely affected. Moreover, our relationship with Chimei Innolux may not be as close as our prior relationship with CMO because none of our directors hold a director or officer position at Chimei Innolux after the merger. In addition, our key customers, including Chimei Innolux, have been adversely affected by the impact of the global economic downturn in recent years. The loss of any of our key customers or a sharp reduction in sales to any of them would have a significant negative impact on our business and results of operations. Moreover, the financial health of our key customers will continue to materially impact our results of operations and financial condition. Our sales to these key customers are made pursuant to standard purchase orders rather than long-term contracts. Therefore, these customers may cancel or reduce orders more readily than if we had long-term purchase commitments from them. In the event of a cancellation, postponement, or reduction of an order, we would likely not be able to reduce operating expenses sufficiently so as to minimize the impact of the lost revenues. Alternatively, we may have excess inventory that we cannot sell, which would harm our operating results. We expect our reliance on sales to certain of our large customers, to continue in the foreseeable future. Therefore, our operating results will likely continue to depend on sales to a relatively small number of customers, as well as on the ability of such customers to sell products that incorporate our products.
Our suppliers may have increasing bargaining power as a result of industry consolidation, which could result in an increase in our average unit cost and a decrease in our profit margin.
There has been an increased level of industry consolidation among our suppliers since late 2009. As announced in September 2009 and completed in January 2010, Chartered Semiconductor Manufacturing Ltd., one of our foundry service providers, merged with Globalfoundries, one of the world’s largest semiconductor foundries. As announced in December 2009, Chipbond Technology Corporation, or Chipbond, and International Semiconductor Technology Ltd., or IST, both among our principal providers of gold bumping, assembly and testing and chip probe testing services, also recently completed their merger on April 1, 2010. Such merger and acquisition activities will likely increase the size and market power of the relevant suppliers and reduce the number of suppliers we could use. Suppliers would therefore be in a better position to bargain for higher prices for their services and products, which could result in an increase in our average unit cost. If we are unable to transfer any increase in average unit cost to our customers by selling at higher prices, our gross margin would decrease and our results of operations could be adversely affected.
6
The global economic downturn and financial crisis could negatively affect our business, results of operations and financial condition.
The global economic downturn and financial crisis that have been affecting global business, banking and financial sectors in recent years have also been affecting the semiconductor market. Our customers have reduced or delayed purchases of our products and may continue to alter their purchasing activities in response to economic uncertainty, weak consumer spending, concern about the stability of markets and lack of credit, among other factors. In addition, there could be a number of knock-on effects from such turmoil on our business, including insolvency of key suppliers resulting in product delays, inability of customers to obtain credit to finance purchases of our products or customer insolvencies, and other counterparty failures. Current uncertainty in global economic conditions also poses a risk to the overall economy that could impact our ability to manage commercial relationships with our customers and suppliers. Our revenues are susceptible to unexpected changes in global market conditions. If the severe global economic conditions continue or worsen, our results of operations and financial condition may be materially and adversely affected.
We derive substantially all of our net revenues from sales to the TFT-LCD panel industry, which is highly cyclical and subject to price fluctuations. Such cyclicality and price fluctuations could negatively impact our business or results of operations.
In 2008 and 2009, 94.9% and 93.3% of our revenues, respectively, were attributable to display drivers that were incorporated into TFT-LCD panels. We expect to continue to substantially depend on sales to the TFT-LCD panel industry for the foreseeable future. The TFT-LCD panel industry is intensely competitive and is vulnerable to cyclical market conditions. The average selling prices of TFT-LCD panels generally decline with time as a result of, among other factors, capacity ramp-up, technological advancements and cost reduction. The average selling prices of TFT-LCD panels could further decline for numerous reasons, including but not limited to the following:
|
|
·
|
lower-than-expected demand for end-use products that incorporate TFT-LCD panels;
|
|
|
·
|
a surge in manufacturing capacity due to the ramping up of new fabrication facilities and/or improvements in production yields; and
|
|
|
·
|
manufacturers operating at high levels of capacity utilization in order to reduce fixed costs per panel.
|
Beginning in the second half of 2008, as a result of the severe economic downturn, the TFT-LCD panel industry suffered from an over-supply and a decrease in the average selling price of TFT-LCD panels. Such environment continued as we entered 2009, resulting in significant downward pricing pressure on our products. There was a rebound in demand for TFT-LCD panels in the second quarter of 2009, but the growth in output of TFT-LCD panels has been limited by the shortage of certain components for TFT-LCD panels. In addition, the merger of certain of our major customers, including CMO, Innolux and TPO, could result in an increase in their bargaining power and therefore subject us to additional downward pricing pressure. We cannot assure you that in such periods in which we experience significant downward pricing pressure, we could sufficiently reduce costs to completely offset the loss of revenues. In addition, a severe and prolonged industry downturn could also result in higher risks in relation to the collectibility of our accounts receivable, the marketability and valuation of our inventories, the impairment of our tangible and intangible assets, and the stability of our supply chain. As a result, the cyclicality of the TFT-LCD panel industry could adversely affect our revenues, cost of revenues and results of operations.
The concentration of our accounts receivable and the extension of payment terms for certain of our customers exposes us to increased credit risk and could harm our operating results and cash flows.
As of December 31, 2009, our accounts receivable less allowance for sales returns and discounts from CMO and its affiliates were $137.0 million, which represented approximately 67.6% of our total accounts receivable less allowance for doubtful accounts, sales returns and discounts. The concentration of our accounts receivable exposes us to increased credit risk. For example, in 2008, we recognized a valuation allowance of $25.3 million for the probable credit loss relating to our customer Shanghai SVA-NEC Liquid Crystal Display Co. Ltd., or SVA-NEC, which represented more than 10% of our total accounts receivable outstanding as of December 31, 2008. This resulted in a bad debt expense of $25.3 million, which adversely and materially affected our results of operations for the year ended December 31, 2008. In addition, we have at times agreed to extend the payment terms for certain of
7
our third-party and related party customers. We may also agree to requests for the extension of payment terms in the future. As a result, a default by any such customer, a prolonged delay in the payment of accounts receivable or the extension of payment terms for our customers could adversely affect our cash flow, liquidity and our operating results.
Our customers may experience a decline in profitability or may not be profitable at all, which could adversely affect our results of operations and financial condition.
The TFT-LCD panel industry is highly competitive. TFT-LCD panel manufacturers, including our customers, experience significant pressure on prices and profit margins, due largely to growing industry capacity and fluctuations in demand for TFT-LCD panels. Some TFT-LCD panel manufacturers have greater access to capital or greater production, research and development, intellectual property, marketing or other resources than our customers, who may not be able to compete successfully and sustain their market positions. In addition, our customers’ business performance may fluctuate significantly due to a number of factors, many of which are beyond their control, including:
|
|
·
|
consumer demand and the general economic conditions;
|
|
|
·
|
the cyclical nature of both the TFT-LCD industry, including fluctuations in average selling prices, and its downstream industries;
|
|
|
·
|
the speed at which TFT-LCD panel manufacturers expand production capacity;
|
|
|
·
|
brand companies’ continued need for original equipment manufacturing services provided by TFT-LCD panel manufacturers;
|
|
|
·
|
access to raw materials, components, equipment and utilities on a timely and economical basis;
|
|
|
·
|
technological changes;
|
|
|
·
|
the rescheduling and cancellation of large orders;
|
|
|
·
|
access to funding on satisfactory terms; and
|
|
|
·
|
fluctuations in the currencies of TFT-LCD panels exporting countries against the U.S. dollar.
|
Unfavorable changes in any of the above factors may seriously harm our customers’ business, financial condition and results of operations. In such cases, our customers may seek to cut down their cost of components, including our products, since components generally account for a significant portion of the cost of TFT-LCD panels. Therefore, changes in our customers’ profitability would likely affect their demand for our products and our ability to sell our products at desirable prices. For example, starting from the middle of 2008, our customers generally experienced significant pressure on or a significant decline in prices and profit margins and therefore exerted strong downward pricing pressure on us as their supplier. Our customers continued to operate in a challenging business environment in 2009 and may experience a further decline in profitability or may not be profitable at all. This could adversely affect our profit margin, significantly reduce our profits and materially affect our results of operations and financial condition.
We depend on sales of display drivers used in TFT-LCD panels, and the limited potential for further growth in both the market size of display drivers and the market share of our display drivers or the absence of continued market acceptance of our display drivers could limit our growth in revenues or harm our business.
In 2008 and 2009, we derived 94.9% and 93.3% of our revenues from the sale of display drivers used for large-sized applications, mobile handset applications and consumer electronics applications, and we expect to continue to derive a substantial portion of our revenues from these or related products. In addition, we were one of the world’s largest suppliers of display drivers, particularly for large-sized TFT-LCD panel applications, in terms of revenues in 2009. As the display drivers industry and our display drivers business are relatively mature, there may be limited potential for the overall display drivers market to grow and for us to further grow our market share, which could limit our future growth in revenues. Failure to grow our unit shipments for display drivers, coupled with a general
8
decline in the average selling prices, could adversely and materially affect our results of operations. See also “—Risks Relating to Our Industry— The average selling prices of our products could decrease rapidly, which may negatively impact our revenues and operating results.” We expect to continue to derive a substantial portion of our revenues from the sale of display drivers. Therefore, the continued market acceptance of our display drivers is critical to our future success. Failure to grow or maintain our revenues generated from the sales of display drivers could adversely and materially affect our results of operations and financial condition.
Our strategy of expanding our product offerings to non-driver products may not be successful.
We have devoted, and intend to continue to devote, financial and management resources to the development, manufacturing and marketing of non-driver products, including, among others, timing controllers, TFT-LCD television and monitor chipsets, LCOS pico-projector solutions, power ICs, CMOS image sensors, and wafer level optics products. For example, in 2008, we formed strategic alliances with 3M to commercialize LCOS mobile projectors and with Wingtech Group to develop LCOS mobile projectors for the China market. We believe end products utilizing LCOS technology could potentially be a large market. LCOS technology, however, is at a relatively early stage of commercialization and has a relatively immature supply chain. Furthermore, producing LCOS products at acceptable yields has proven difficult. Therefore we cannot assure you that there will be market acceptance of these LCOS products, or that our strategic alliance with 3M or Wingtech Group will be successful.
Developing and commercializing each of our non-driver products requires a significant amount of management, engineering and monetary resources. Numerous uncertainties exist in developing new products and we cannot assure you that we will be able to develop our non-driver products successfully. The failure or delay in the development or commercialization of any of our non-driver products, the occurrence of any product defects or design flaws, or the low market acceptance of or demand for either our products or the end devices using our products may adversely affect our results of operations and growth prospects.
Technological innovation may reduce the number of display drivers typically required for each panel, thereby reducing the number of display drivers we are able to sell per panel. If such a reduction in demand is not offset by the general growth of the industry, growth in our market share or an increase in our average selling prices, our revenues may decline.
Except for certain small-sized panels, multiple display drivers are typically required for each panel to function. In order to reduce costs, TFT-LCD panel manufacturers generally seek to have display drivers with higher channel counts and new panel designs to reduce the number of display drivers required for each panel. We have been developing such innovative and cost-effective display driver solutions in order to grow our market share, attract additional customers, increase our average selling prices and capture new design wins. However, we cannot assure you that we will successfully achieve these goals. If we fail to do so and the number of display drivers typically required per panel decreases thereby reducing our unit shipments, our revenues may decline. Recently, TFT-LCD panel manufacturers have developed several panel designs to reduce the usage of display drivers, including gate in panel, or GIP, amorphous silicon gate, or ASG, or simply gateless designs, which integrate the gate driver function onto the glass and eliminate the need for gate drivers, as well as dual gate and triple gate panel designs, which would largely reduce the usage of source drivers. If such designs or technologies become widely adopted, demand for our display drivers may decrease significantly, which would adversely and materially affect our results of operations.
We face numerous challenges relating to our growth.
The scope and complexity of our business has grown significantly since our inception. Our growth has placed, and will continue to place, a strain on our management, personnel, systems and resources. If we are unable to manage our growth effectively, we may not be able to take advantage of market opportunities, execute our business plan or respond to competitive pressures. To successfully manage our growth, we believe we must effectively:
|
|
·
|
hire, train, integrate, retain and manage additional qualified engineers, senior managers, sales and marketing personnel and information technology personnel;
|
|
|
·
|
implement additional, and improve existing, administrative and operations systems, procedures and controls;
|
9
|
|
·
|
expand our accounting and internal audit team, including hiring additional personnel with U.S. GAAP and internal control expertise;
|
|
|
·
|
continue to expand and upgrade our design and product development capabilities;
|
|
|
·
|
manage multiple relationships with semiconductor manufacturing service providers, customers, suppliers and certain other third parties; and
|
|
|
·
|
continue to develop and commercialize non-driver products, including, among others, timing controllers, TFT-LCD television and monitor chipsets, LCOS projector solutions, power ICs, CMOS image sensors and wafer level optics products
.
|
Moreover, if our allocation of resources does not correspond with future demand for particular products, we could miss market opportunities, and our business and financial results could be materially and adversely affected. Therefore, we cannot assure you that we will be able to manage our growth effectively in the future.
Our quarterly revenues and operating results are difficult to predict, and if we do not meet quarterly financial expectations, our ADS price will likely decline.
Our quarterly revenues and operating results are difficult to predict. They have fluctuated in the past from quarter to quarter and may continue to do so in the future. Our operating results may in some quarters fall below market expectations, likely causing our ADS price to decline. Our quarterly revenues and operating results may fluctuate because of many factors, including:
|
|
·
|
our ability to accurately forecast shipments, average selling prices, cost of revenues, operating expenses, non-operating income/loss, foreign currency exchange rates, and tax rates;
|
|
|
·
|
our ability to transfer any increase in unit costs to our customers;
|
|
|
·
|
our ability to accurately perform various tests, estimations and projections, including with respect to the write-down on slow or obsolete inventories, the impairment of long-lived assets, the collectibility of accounts receivable, and the realizability of deferred tax assets;
|
|
|
·
|
our ability to successfully design, develop and introduce in a timely manner new or enhanced products acceptable to our customers;
|
|
|
·
|
changes in the relative mix in the unit shipments of our products, which may have significantly different average selling prices and cost of revenues as a percentage of revenues;
|
|
|
·
|
changes in share-based compensation;
|
|
|
·
|
the loss of one or more of our key customers;
|
|
|
·
|
decreases in the average selling prices of our products;
|
|
|
·
|
our accumulation and write-down of inventory;
|
|
|
·
|
the relative unpredictability in the volume and timing of customer orders;
|
|
|
·
|
shortages of other components used in the manufacture of TFT-LCD panels;
|
|
|
·
|
the risk of cancellation or deferral of customer orders in anticipation of our new products or product enhancements, or due to a reduction in demand of our customers’ end product;
|
|
|
·
|
changes in our payment terms with our customers and our suppliers;
|
|
|
·
|
our ability to negotiate favorable prices with customers and suppliers;
|
|
|
·
|
our ability to hedge foreign exchange risks;
|
10
|
|
·
|
changes in the available capacity of semiconductor manufacturing service providers;
|
|
|
·
|
the rate at which new markets emerge for new products under development;
|
|
|
·
|
the evolution of industry standards and technologies;
|
|
|
·
|
product obsolescence and our ability to manage product transitions;
|
|
|
·
|
increase in cost of revenues due to inflation;
|
|
|
·
|
our involvement in litigation or other types of disputes;
|
|
|
·
|
changes in general economic conditions, especially the impact of the global financial crisis on economic growth and consumer spending;
|
|
|
·
|
changes in our tax exemptions and applicable income tax regulations; and
|
|
|
·
|
natural disasters, particularly earthquakes and typhoons, or outbreaks of disease affecting countries where we conduct our business or where our products are manufactured, assembled or tested.
|
The factors listed above are difficult to foresee, and along with other factors, could seriously harm our business. We anticipate the rate of new orders may vary significantly from quarter to quarter. Our operating expenses and inventory levels are based on our expectations of future revenues, and our operating expenses are relatively fixed in the short term. Consequently, if anticipated sales and shipments in any quarter do not occur as expected, operating expenses and inventory levels could be disproportionately high, and our operating results for that quarter and, potentially, future quarters may be negatively impacted. Any shortfall in our revenues would directly impact our business. Our operating results are volatile and difficult to predict; therefore, you should not rely on the operating results of any one quarter as indicative of our future performance. Our operating results in future quarters may fall below the expectations of securities analysts and investors. In this event, our ADS price may decline significantly.
Our close relationship with Chimei Innolux could limit our potential to do business with Chimei Innolux’s competitors, which may cause us to lose opportunities to grow our business and expand our customer base.
Chimei Innolux, successor of CMO after its merger with Innolux and TPO, is one of our largest shareholders and CMO has been our largest customer since our inception. We expect to continue to maintain various contractual and other relationships with Chimei Innolux and its affiliates. Our close relationship with Chimei Innolux could limit our potential to do business with Chimei Innolux’s competitors or other TFT-LCD panel manufacturers, who may perceive that granting business to us could benefit Chimei Innolux. Our close relationship with Chimei Innolux may result in losing business opportunities or may prevent us from taking advantage of opportunities to grow our business and expand our customer base.
An adverse change to our relationship with Chimei Innolux could have a material adverse effect on our business.
Chimei Innolux is one of our largest shareholders, beneficially owning approximately 14.0% of our outstanding shares as of April 30, 2010. Chimei Innolux is also our largest customer, with combined revenues in 2009 from sales to CMO, Innolux and TPO, together with their respective affiliates, accounting for approximately 67.5% of our revenues. Our engineers work closely with Chimei Innolux’s engineers to design display drivers and other semiconductors used by Chimei Innolux and its affiliates or their customers. We have entered into various transactions with Chimei Innolux or CMO and its affiliates in the past, and we expect to continue to do so in the future. See “Item 7.B. Major Shareholders and Related Party Transactions—Related Party Transactions.” If our relationship with Chimei Innolux deteriorates for any reason, our business could be materially and adversely affected.
11
The strategic relationships between certain of our competitors and their customers and the development of in-house capabilities by TFT-LCD panel manufacturers may limit our ability to expand our customer base and our growth prospects.
Certain of our competitors have established or may establish strategic or strong relationships with TFT-LCD panel manufacturers that are also our existing or potential customers. Marketing our display drivers to such TFT-LCD panel manufacturers that have established relationships with our competitors may be difficult. Moreover, several TFT-LCD panel manufacturers have in-house design capabilities and therefore may not need to source semiconductor products from us. If our customers successfully develop in-house capabilities to design and develop semiconductors that can substitute our products, they would likely reduce or stop purchasing our products. In addition, we also face challenges in attracting new customers for our new products. To sell new products, we will likely need to target new market segments and new customers with whom we do not have current relationships, which may require different strategies and may present difficulties that we have not encountered before. Therefore, failure to broaden our customer base and attract new customers may limit our growth prospects.
We depend primarily on nine foundries to manufacture our wafers, and any failure to obtain sufficient foundry capacity or loss of any of the foundries we use could significantly delay our ability to ship our products, causing us to lose revenues and damage our customer relationships.
Access to foundry capacity is crucial to our business because we do not manufacture our own wafers, instead relying primarily on nine third-party foundries. The ability of a foundry to manufacture our semiconductor products is limited by its available capacity. Access to capacity is especially important due to the limited availability of the high-voltage CMOS process technology required for the manufacture of wafers used in display drivers. Many foundries did not expand capacity in 2009 as a result of the impact of the global financial crisis and therefore foundry capacity has been tight since the first quarter of 2010 while demand for foundry capacity has picked up. As we currently do not have any long-term supply arrangements with any third-party foundries to guarantee us access to a certain level of foundry capacity, if the primary third-party foundries that we rely upon are not able to meet our required capacity, or if our business relationships with these foundries are adversely affected, we would not be able to obtain the required capacity from these foundries to meet any increasing demand for our products and would have to seek alternative foundries, which may not be available on commercially reasonable terms, or at all, or which may expose us to risks associated with qualifying new foundries, as further discussed below. Our results of operations and business prospects could be adversely affected as a result of the foregoing.
We place wafer orders on the basis of our customers’ purchase orders and sales forecasts; however, any of the foundries we use can allocate capacity to other foundry customers and reduce deliveries to us on short notice. It could be that other foundry customers are larger and better financed than we are, or have supply agreements or better relationships with the foundries we use, and could induce these foundries to reallocate our capacity to them. The loss of any of the foundries we use or any shortfall in available foundry capacity could impair our ability to secure processed wafers, which could significantly delay our ability to ship our products, causing a loss of revenues and damages in our customer relationships.
The recent fluctuations in the prices of certain metals, chemicals and gasoline and the recent volatility of foreign exchange rates may have increased costs for foundries and semiconductor service providers. This increase in costs could limit their ability to continue to make the research and development investments needed to keep up with technological advances. Any increase in costs for foundries and semiconductor service providers we use could lead to an increase in our unit costs or could limit our ability to lower our unit costs. We cannot assure you that we will be able to continue to reduce our costs and maintain our profit margins.
Taiwan Semiconductor Manufacturing Company Limited, or TSMC, and Vanguard International Semiconductor Corporation, or Vanguard, historically manufactured substantially all of our wafers in the early years since our inception. In order to diversify our foundry sources, we have also used Macronix International Co., Ltd., or Macronix, Lite-on Semiconductor Corp., or Lite-on, Globalfoundries Singapore Pte., Ltd. (formerly Chartered Semiconductor Manufacturing Ltd.), or Globalfoundries Singapore, United Microelectronics Corporation, or UMC, Maxchip Electronics Corp., or Maxchip, Silicon Manufacturing Partners Pte., Ltd., or SMIC, and Shanghai Hua Hong NEC Electronics Company, Ltd., or HHNEC, to manufacture a portion of our products. As a result of outsourcing the manufacturing of our wafers, we face several significant risks, including:
12
|
|
·
|
failure to secure necessary manufacturing capacity, or being able to obtain required capacity only at higher costs;
|
|
|
·
|
risks of our proprietary information leaking to our competitors through the foundries we use;
|
|
|
·
|
limited control over delivery schedules, quality assurance and control, manufacturing yields and production costs;
|
|
|
·
|
the unavailability of, or potential delays in obtaining access to, key process technologies; and
|
|
|
·
|
financial risks of certain of our foundry suppliers, including those that are owned by ailing dynamic random access memory, or DRAM, companies.
|
In addition, in order to manufacture our display drivers used in TFT-LCD panels, we require foundries with high-voltage manufacturing process capacity. Of the limited number of foundries that offer this capability, some are owned by integrated device manufacturers which are also our competitors. As a result, our dependence on high-voltage foundries presents the following additional risks:
|
|
·
|
potential capacity constraints faced by the limited number of high-voltage foundries and the lack of investment in new and existing high-voltage foundries;
|
|
|
·
|
difficulty in attaining consistently high manufacturing yields from high-voltage foundries;
|
|
|
·
|
delay and time required (approximately one year) to qualify and ramp up production at new high voltage foundries; and
|
|
|
·
|
price increases.
|
As a result of these risks, we may be required to use foundries with which we have no established relationships, which could expose us to potentially unfavorable pricing, unsatisfactory quality or insufficient capacity allocation. Moreover, the scarcity and importance of high-voltage foundry capacity may necessitate us making investments in foundries in order to secure capacity, which would require us to substantially increase our capital outlays and possibly raise additional capital, which may not be available to us on satisfactory terms, if at all.
Shortages of processed tape used in the manufacturing of our products, increased costs of manufacturing such tape, or the loss of one of our suppliers of such tape may increase our costs or limit our revenues and impair our ability to ship our products on time.
There are a limited number of companies which supply the processed tape used to manufacture our semiconductor products, and we do not have binding long-term supply arrangements with processed tape suppliers that would guarantee us access to processed tape. Therefore, from time to time, shortages of such processed tape may occur. Since the first quarter of 2010, the supply of processed tape has been tight and it is uncertain whether any shortage of processed tape may occur in the near future. If any of the processed tape suppliers we rely upon experience difficulties in delivering processed tape or are unable to meet the prices, quality or services that we require, or if our business relationships with these suppliers weaken or deteriorate, we may not be able to locate alternative sources in a timely manner. Therefore, if shortages of processed tape were to occur, or if the costs of manufacturing such tape increases, we would incur additional costs or be unable to ship our products to our customers in a timely fashion, all of which could harm our business and our customer relationships and negatively impact our earnings. As a result of these risks, we may also be required to use processed tape suppliers with which we have no established relationships, which could expose us to potentially unfavorable pricing, unsatisfactory quality or insufficient capacity allocation. Moreover, the scarcity and importance of processed tape may necessitate us making investments in processed tape suppliers in order to secure adequate supply, which would require us to substantially increase our capital outlays and possibly raise additional capital, which may not be available to us on satisfactory terms, if at all.
13
The loss of, or our inability to secure sufficient capacity from, any of our third-party assembly and testing houses at reasonable and competitive prices could disrupt our shipments, harm our customer relationships and reduce our sales.
Access to third-party assembly and testing capacity is critical to our business because we do not have in-house assembly and testing capabilities for commercial production and instead rely on third-party service providers. Access to these services is especially important to our business because display drivers require specialized assembly and testing services. A limited number of third-party assembly and testing houses assemble and test substantially all of our current products. We do not have binding long-term supply arrangements with assembly and testing service providers that guarantee us access to our required capacity. Since the first quarter of 2010, assembly and testing capacity has been tight. If the primary assembly and testing service providers that we rely upon are not able to meet our requirements in price, quality, and service, or if our business relationships with these service providers were adversely affected, we would not be able to obtain the required capacity from such providers and would have to seek alternative providers, which may not be available on commercially reasonable terms, or at all. As a result, we do not directly control our product delivery schedules, assembly and testing costs and quality assurance and control. If any of these third-party assembly and testing houses experiences capacity constraints, financial difficulties, suffers any damage to its facilities or if there is any disruption of its assembly and testing capacity, we may not be able to obtain alternative assembly and testing services in a timely manner. Because of the amount of time we usually take to qualify assembly and testing houses, we may experience significant delays in product shipments if we are required to find alternative sources. Any problems that we may encounter with the delivery, quality or cost of our products could damage our reputation and result in a loss of customers and orders.
As a result of these risks, we may be required to use assembly and testing service providers with which we have no established relationships, which could expose us to potentially unfavorable pricing, unsatisfactory quality or insufficient capacity allocation. Moreover, the scarcity and importance of assembly and testing services may necessitate us making investments in assembly and testing service providers in order to secure capacity, which would require us to substantially increase our capital outlays and possibly raise additional capital, which may not be available to us on satisfactory terms, if at all.
Shortages of other key components for our customers’ products could decrease demand for our products.
Shortages of components and other materials that are critical to the design and manufacture of our customers’ products may limit our sales. These components and other materials include, but are not limited to, color filters, backlight modules, polarizers, printed circuit boards and glass substrates. In the past, companies that use our products in their production have experienced delays in the availability of key components from other suppliers. For example, in 2009, some TFT-LCD panel manufacturers experienced a shortage of certain components, notably glass substrates, while demand for TFT-LCD panels rebounded in the second quarter of 2009. The supply of glass substrates, backlight modules, polarizers, power ICs, among other things, has also been tight since the first quarter of 2010. In addition, c
omponent manufacturers
may
not
be able to increase or maintain their component supply because of labor shortage
in China
or otherwise, and may
shut down certain of their capacity
from time to time
because of weak
demand
,
which
may
increase the
i
nstability of time
ly
delivery
and the risk
of
short
a
ge
of components
.
Such
shortages of components and other materials critical to the design and manufacture of our customers’ products may cause a slowdown in demand for our products, resulting in a decrease in our sales and adversely affecting our results of operations. In addition, a
s
a result of uncertain demand conditions, our customer
s
may hesitate to build inventory on hand
and
tend to release o
rder
s
on short notice
.
We rely on the services of our key personnel, and if we are unable to retain our current key personnel and hire additional personnel, our ability to design, develop and successfully market our products could be harmed.
We rely upon the continued service and performance of a relatively small number of key personnel, including certain engineering, technical and senior management personnel. In particular, our engineers and other key technical personnel are critical to our future technological and product innovations. Competition for highly skilled engineers and other key technical personnel is intense in the semiconductor industry in general and in Taiwan’s flat panel semiconductor industry in particular. Moreover, our future success depends on the expansion of our senior management team and the retention of key employees such as Jordan Wu, our president and chief executive officer; Dr. Biing-Seng Wu, our chairman; Chih-Chung Tsai, our chief technology officer; and Max Chan, our chief financial officer. We rely on these individuals to manage our company, develop and execute our business strategies
14
and manage our relationships with key suppliers and customers. Any of these employees could leave our company with little or no prior notice and would be free to work with a competitor. We do not have “key person” life insurance policies covering any of our employees. The loss of any of our key personnel or our inability to attract or retain qualified personnel, whether engineers and others, could delay the development and introduction of new products and would have an adverse effect on our ability to sell our products as well as on our overall business and growth prospects. We may also incur increased operating expenses and be required to divert the attention of other senior executives away from their original duties to recruiting replacements for key personnel.
If we fail to forecast customer demand accurately, we may have excess or insufficient inventory, which may increase our operating costs and harm our business.
The lead time required by the semiconductor manufacturing service providers that we use to manufacture our products is typically longer than the lead time that our customers provide for delivery of our products to them. Therefore, to ensure availability of our products for our customers, we will typically ask our semiconductor manufacturing service providers to start manufacturing our products based on forecasts provided by our customers in advance of receiving their purchase orders. However, these forecasts are not binding purchase commitments, and we do not recognize revenues from these products until they are shipped to customers. Moreover, for the convenience of our customers, we may agree to ship our inventory to warehouses located near our customers, so that our products can be delivered to these customers more quickly. We may from time to time agree that title and risk of loss do not pass to our customer until the customer requests delivery of our products from such warehouses. In such cases, we will not recognize revenues from these products until the title and risk of loss have passed to our customers based on the shipping terms, which is generally when they are delivered to our customers from these warehouses. As a result, we incur inventory and manufacturing costs in advance of anticipated revenues.
The anticipated demand for our products may not materialize; therefore, manufacturing based on customer forecasts exposes us to risks of high inventory carrying costs, increased product obsolescence, and erosion of the products’ market value. For example, some of our customers might overstate their forecasts because of concerns that their semiconductor suppliers cannot deliver on their rush orders. If we overestimate demand for our display drivers or if purchase orders are cancelled or shipments delayed, we may incur excess inventory that we cannot sell, or may have to sell at low profit margins or even at a loss, which would harm our financial results. Conversely, if we underestimate demand, we may not have sufficient inventory and may lose market share and damage customer relationships, which also could harm our business. Obtaining additional supply in the face of product shortages may be costly or impossible, particularly in the short term, which could prevent us from fulfilling orders. These inventory risks are exacerbated by the high level of customization of our products, which limits our ability to sell excess inventory to other customers.
If we do not achieve additional design wins in the future, our ability to grow will be limited.
Our future success depends on our current and prospective customers’ designing our products into their products. To achieve design wins, we must design and deliver cost-effective, innovative, reliable and integrated products that are customized for our customers’ needs. Once a supplier’s products have been designed into a system, the panel manufacturer may be reluctant to change its source of components due to the significant costs and time associated with qualifying a new supplier. Accordingly, our failure to obtain additional design wins with panel manufacturers and to successfully design, develop and introduce new products and product enhancements could harm our business, financial condition and results of operations.
A design win is not a binding commitment by a customer to purchase our products and may not result in large volume orders of our products. Rather, it is a decision by a customer to use our products in the design process of that customer’s products. Customers can choose at any time to stop using our products in their designs or product development efforts. Moreover, even if our products were chosen to be incorporated into a customer’s products, our ability to generate significant revenues from that customer would depend on the commercial success of those products. Thus, a design win may not necessarily generate significant revenues if our customers’ products are not commercially successful.
Some of our semiconductor products are manufactured at only one foundry. If any foundry is unable to provide the capacity we need, does not deliver in a timely manner or the quality or pricing terms are not
15
acceptable to us, we may experience delays in shipping our products or have to incur additional costs, which could damage our customer relationships and result in reduced revenues and higher costs and expenses.
Although we use several foundries for different semiconductor products, certain of our products are manufactured at only one of these foundries. If any one of the foundries that we use for a specific product is unable to provide us with our required capacity, does not deliver in a timely manner or the quality or pricing terms are not acceptable to us, we could experience significant delays in receiving the product being manufactured for us by that foundry or incur additional costs to obtain substitutes. Also, if any of the foundries that we use experience financial difficulties or insolvency risks due to the impact of the global economic turmoil or any company-specific reasons or otherwise, if their operations are damaged or if there is any other disruption of their foundry operations, we may not be able to qualify an alternative foundry in a timely manner. If we choose to use a new foundry or process technology for a particular semiconductor product, we believe that it will take us several quarters to qualify the new foundry or process before we can begin shipping such products. If we cannot qualify a new foundry in a timely manner, we may experience a significant interruption in our supply of the affected products, which could reduce our revenues, increase our costs and expenses and damage our customer relationships.
Our products are complex and may require modifications to resolve undetected errors or failures in order for them to function with panels at the desired specifications, which could lead to higher costs, a loss of customers or a delay in market acceptance of our products.
Our products are highly complex and may contain undetected errors or failures when first introduced or as new versions are released. If our products are delivered with errors or defects, we could incur additional development, repair or replacement costs, and our credibility and the market acceptance of our products could be harmed. Defects could also lead to liability for defective products and lawsuits against us or our customers. We have agreed to indemnify some of our customers under some circumstances against liability from defects in our products. A successful product liability claim could require us to make significant damage payments.
Our display drivers comprise part of a complex panel manufactured by our customers. Our display drivers must operate according to specifications with the other components used by our customers in the panel manufacturing process. For example, during the panel manufacturing process, our display drivers are attached to the panel glass and must interoperate with the glass efficiently. If other components fail to operate efficiently with our display drivers, we may be required to incur additional development time and costs to improve the interoperability of our display drivers with the other components.
Our highly integrated products are difficult to manufacture without defects. The existence of defects in our products could increase our costs, decrease our sales and damage our customer relationships and our reputation.
The manufacture of our products is a complex process, and it is often difficult for semiconductor foundries to manufacture our products completely without defects. Minor deviations in the manufacturing process can cause substantial decreases in yield and quality. In particular, some of our products are highly integrated and incorporate mixed analog and digital signal processing and embedded memory technology, and this complexity makes it even more difficult to manufacture without defects.
The ability to manufacture products of acceptable quality depends on both product design and manufacturing process technology. Defective products can be caused by design, defective materials or component parts, or manufacturing difficulties. Thus, quality problems can be identified only by analyzing and testing our display drivers in a system after they have been manufactured. The difficulty in identifying defects is compounded by the uniqueness of the process technology used in each of the semiconductor foundries with which we have subcontracted to manufacture our products. Difficulties in achieving defect-free products due to the increasing complexity of display drivers and the panel system surrounding them may result in an increase in our costs and expenses and delays in the availability of our products. In addition, if the foundries that we use fail to deliver products of satisfactory quality in the volume and at the price required, we will be unable to meet our customers’ demand for our products or to sell those products at an acceptable profit margin, which could adversely affect our sales and margins and damage our customer relationships and our reputation.
16
We do not have long-term purchase commitments from our customers, which may result in significant uncertainty and volatility with respect to our revenues and could materially and adversely affect our results of operations and financial condition.
We do not have long-term purchase commitments from our customers; our sales are made on the basis of individual purchase orders. Our customers may also cancel or defer purchase orders. Our customers’ purchase orders may vary significantly from period to period, and it is difficult to forecast future order quantities. In addition, changes in our customers’ business may adversely affect the quantity of purchase orders that we receive. For example, if the merger of CMO, Innolux and TPO results in the discontinuation of a large number of our design-win projects or the discontinuation of those design-win projects with large sales quantities, we could be required to write off a substantial amount of inventory prepared based on forecasts provided by any of these customers. In the past, some of our customers have also significantly lowered their capacity utilization rates, reduced or canceled their orders of our products, and requested higher-than-usual price concession from us. We cannot assure you that any of our customers will continue to place orders with us in the future at the same level as in prior periods. We also cannot assure you that the volume of our customers’ orders will be consistent with our expectations when we plan our expenditures. Our results of operations and financial condition may thus be materially and adversely affected.
Potential conflicts of interest with Chimei Innolux may affect our sales decisions and allocations.
We have a close relationship with Chimei Innolux,
which is the surviving entity following the completion of the merger of
CMO, Innolux, and TPO on March 18, 2010. Chimei Innolux is currently one of our largest shareholders. Chimei Innolux or, prior to the merger, CMO has also been our largest customer since our inception. In addition, certain of our directors held key management positions at CMO prior to the merger. Jung-Chun Lin, our director, served as senior vice president of finance and administration at CMO. Dr. Biing-Seng Wu, our chairman, was also the vice chairman of the board of directors of CMO. We cannot assure you that our close relationship with Chimei Innolux and the resulting potential conflicts of interest will not affect our sales decisions or allocations or that potential conflicts of interest with respect to Chimei Innolux will be resolved in our favor.
Our corporate actions are substantially controlled by officers, directors, principal shareholders and affiliated entities who may take actions that are not in, or may conflict with, our or our public shareholders’ interests.
As of April 30, 2010, Jordan Wu and Dr. Biing-Seng Wu (who are brothers) beneficially owned approximately 7.2% and 19.0% of our ordinary shares, respectively, and Chimei Innolux beneficially owned approximately 14.0% of our ordinary shares. For information relating to the beneficial ownership of our ordinary shares, see “Item 7.A. Major Shareholders and Related Party Transactions—Major Shareholders.” These shareholders, acting together, could exert substantial influence over matters requiring approval by our shareholders, including electing directors and approving mergers or other business combination transactions. This concentration of ownership may also discourage, delay or prevent a change in control of our company, which could deprive our shareholders of an opportunity to receive a premium for their shares as part of a sale of our company and might reduce the price of our ADSs. Actions may be taken even if they were opposed by our other shareholders.
Assertions against us by third parties for infringement of their intellectual property rights could result in significant costs and cause our operating results to suffer.
The semiconductor industry is characterized by vigorous protection and pursuit of intellectual property rights and positions, which results in protracted and expensive litigation for many companies. We have received, and expect to continue to receive, notices of infringement of third-party intellectual property rights. We may receive claims from various industry participants alleging infringement of their patents, trade secrets or other intellectual property rights in the future. Any lawsuit resulting from such allegations could subject us to significant liability for damages and invalidate our proprietary rights. These lawsuits, regardless of their success, would likely be time-consuming and expensive to resolve and would divert management time and attention. Any potential intellectual property litigation also could force us to do one or more of the following:
|
|
·
|
stop selling products or using technology or manufacturing processes that contain the allegedly infringing intellectual property;
|
|
|
·
|
pay damages to the party claiming infringement;
|
17
|
|
·
|
attempt to obtain a license for the relevant intellectual property, which may not be available on commercially reasonable terms or at all; and
|
|
|
·
|
attempt to redesign those products that contain the allegedly infringing intellectual property with non-infringing intellectual property, which may not be possible.
|
The outcome of a dispute may result in our need to develop non-infringing technology or enter into royalty or licensing agreements. We have agreed to indemnify certain customers for certain claims of infringement arising out of the sale of our products. Any intellectual property litigation could have a material adverse effect on our business, operating results or financial condition.
Our ability to compete will be harmed if we are unable to protect our intellectual property rights adequately.
We believe that the protection o
f our intellectual property rights is, and will continue to be, important to the success of our business. We rely primarily on a combination of patent, trademark, trade secret and copyright laws and contractual restrictions to protect our intellectual pro
p
erty. These afford only limited protection. Despite our efforts to protect our proprietary rights, unauthorized parties may attempt to obtain, copy or use information that we regard as proprietary, such as product design and manufacturing process expertis
e
.
As of
May
31
, 2010
, we and our subsidiaries had
640
U.S.
patent applications pending,
846
Taiwan
patent applications pending and
549
patent applications pending in other jurisdictions, including the PRC,
Japan
,
Korea
and
Europe
.
Our pending patent applic
ations and any future applications may not result in issued patents or may not be sufficiently broad to protect our proprietary technologies.
Moreover, policing any unauthorized use of our products is difficult and costly, and we cannot be certain that the
measures
which
we have implemented will prevent misappropriation or unauthorized use of our technologies, particularly in foreign jurisdictions where the laws may not protect our proprietary rights as fully as
the laws of the
United States
do
. Others may
independently develop substantially equivalent intellectual property or otherwise gain access to our trade secrets or intellectual property. Our failure to protect our intellectual property effectively could harm our business.
Any future class action suit or other legal actions against us may have an adverse effect on our financial condition and operating results.
We were previously subject to a class action complaint, filed in the United States District Court for the Central District of California, for alleged violations of U.S. federal securities laws. The lawsuit asserted claims against us, our Chief Executive Officer Jordan Wu, our Chief Financial Officer Max Chan, certain of our directors, as well as CMO, for allegedly failing to disclose in our initial public offering registration statement and prospectus certain information concerning CMO’s inventory level prior to our initial public offering. We have successfully settled the dispute and paid a settlement of $1.2 million, pursuant to a settlement agreement approved by the court in September 2009. However, we may be subject to other legal actions, including potential future class action suits. The outcome of any future litigation proceedings is uncertain. Regardless of merit, litigation and other preparations undertaken to defend a legal action can be costly and may divert the attention of our management. We could also incur substantial monetary liabilities, which may have an adverse effect on our financial condition and operating results.
We may undertake acquisitions or investments to expand our business that may pose risks to our business and dilute the ownership of our existing shareholders, and we may not realize the anticipated benefits of these acquisitions or investments.
As part of our growth and product diversification strategy, we will continue to evaluate opportunities to acquire or invest in other businesses, intellectual property or technologies that would complement our current offerings, expand the breadth of markets we can address or enhance our technical capabilities. For example, on February 1, 2007, we acquired Wisepal Technologies, Inc., or Wisepal (which was renamed in February 2010 as Himax Semiconductor, Inc., or Himax Semiconductor), a fabless design company located in Taiwan that specializes in LTPS TFT-LCD drivers for small and medium-sized panels. Under the terms of the acquisition, we issued one ordinary share in exchange for 5.26 shares of Wisepal and we assumed all of the assets, liabilities and personnel of Wisepal. Acquisitions or investments that we have completed or potentially may make in the future, including our acquisition of Wisepal, entail a number of risks that could materially and adversely affect our business, operating and financial results, including:
18
|
|
·
|
problems integrating the acquired operations, technologies or products into our existing business and products;
|
|
|
·
|
diversion of management’s time and attention from our core business;
|
|
|
·
|
adverse effects on existing business relationships with customers;
|
|
|
·
|
the need for financial resources above our planned investment levels;
|
|
|
·
|
failures in realizing anticipated synergies;
|
|
|
·
|
difficulties in retaining business relationships with suppliers and customers of the acquired company;
|
|
|
·
|
risks associated with entering markets in which we lack experience;
|
|
|
·
|
potential loss of key employees of the acquired company;
|
|
|
·
|
potential write-offs of acquired assets;
|
|
|
·
|
potential expenses related to the depreciation of tangible assets and amortization of intangible assets; and
|
|
|
·
|
potential impairment charges related to the goodwill acquired.
|
Our failure to address these risks successfully may have a material adverse effect on our financial condition and results of operations. Any such acquisition or investment may require a significant amount of capital investment, which would decrease the amount of cash available for working capital or capital expenditures. In addition, if we use our equity securities to pay for acquisitions, the value of our ADSs and the underlying ordinary shares may be diluted. If we borrow funds to finance acquisitions, such debt instruments may contain restrictive covenants that can, among other things, restrict us from distributing dividends.
Risks Relating to Our Industry
The average selling prices of our products could decrease rapidly, which may negatively impact our revenues and operating results.
The price of each semiconductor product typically declines over its product life cycle, reflecting product obsolescence, decreased demand as customers shift to more advanced products, decreased unit costs due to advanced designs or improved manufacturing yields, and increased competition as more semiconductor suppliers are able to offer similar products. We may experience substantial period-to-period fluctuations in future operating results if our average selling prices decline. We may reduce the average unit price of our products in response to competitive pricing pressures, new product introductions by us or our competitors and other factors. The TFT-LCD panel market is highly cost sensitive, which may result in declining average selling prices of the components comprising TFT-LCD panels. We expect that these factors will create downward pressure on our average selling prices and operating results. To maintain acceptable operating results, we will need to develop and introduce new products and product enhancements on a timely basis and continue to reduce our costs. If we are unable to offset any reductions in our average selling prices by increasing our sales volumes and corresponding production cost reductions, or if we fail to develop and introduce new products and enhancements on a timely basis, our revenues and operating results will suffer.
The semiconductor industry, in particular semiconductors used in flat panel displays, is highly competitive, and we cannot assure you that we will be able to compete successfully against our competitors.
The semiconductor industry, in particular semiconductors used in flat panel displays, is highly competitive. Increased competition may result in pricing pressure, reduced profitability and loss of market share, any of which could seriously harm our revenues and results of operations. Competition principally occurs at the design stage, where a customer evaluates alternative design solutions that require display drivers. We continually face intense competition from fabless display driver companies as well as from integrated device manufacturers. Some of our competitors have substantially greater financial and other resources than we do with which to pursue engineering,
19
manufacturing, marketing and distribution of their products. As a result, they may be able to respond more quickly to changing customer demands or devote greater resources to the development, promotion and sales of their products than we can. Some of our competitors have manufacturing capabilities as well as in-house design operations that may give them significant advantages such as more research and development resources and the ability to attract highly skilled engineers. Furthermore,
some of our competitors are affiliated with, or are subsidiaries of, our panel manufacturer customers. These relationships may also give our competitors significant advantages such as early access to product roadmaps and design-in prioritie
s, which would allow them to respond more quickly to changing customer demands and achieve more design-wins than we can. In addition, even competitors with no such strategic associations with panel manufacturers may resort to price competition to maintain
their market share, which may impose pricing pressures on us, reduce our profitability or decrease our market share.
We cannot assure you that we will be able to increase or maintain our revenues and market share, or compete successfully against our current or future competitors in the semiconductor industry.
We may be adversely affected by the cyclicality of the semiconductor industry.
The semiconductor industry is highly cyclical and is characterized by constant and rapid technological change, product obsolescence and price erosion, evolving standards, short product life cycles and wide fluctuations in product supply and demand. The semiconductor industry has, from time to time, experienced significant downturns, often connected with, or in anticipation of, maturing product cycles of both semiconductor companies’ and their customers’ products and declines in general economic conditions. These downturns have been characterized by diminished product demand, production overcapacity, high inventory levels and accelerated erosion of average selling prices. Any future downturn may reduce our revenues and result in our having excess inventory. Furthermore, any upturn in the semiconductor industry could result in increased competition for access to limited third-party foundry, assembly and testing capacity. Failure to gain access to foundry, assembly and testing capacity could impair our ability to secure the supply of products that we need, which could significantly delay our ability to ship our products, cause a loss of revenues and damage our customer relationships.
We have a lengthy and expensive design-to-mass production cycle.
The cycle time from the design stage to mass production for display drivers is long and requires the investment of significant resources with each potential customer without any guarantee of sales. Our design-to-mass production cycle typically begins with a three to twelve-month semiconductor development stage and test period followed by a three to twelve-month end product development period by customers. This fairly lengthy cycle creates the risk that we may incur significant expenses but will be unable to realize meaningful sales. Moreover, prior to mass production, customers may decide to cancel the projects or change production specifications, resulting in sudden changes in our product specifications, further causing increased production time and costs. Failure to meet such specifications may delay the launch of our products.
Our business could be materially and adversely affected if we fail to anticipate changes in evolving industry standards, fail to achieve and maintain technological leadership in our industry or fail to develop and introduce new and enhanced products.
Our products are generally based on industry standards, which are continually evolving. The emergence of new industry standards could render our products or those of our customers unmarketable or obsolete and may require us to incur substantial unanticipated costs to comply with any such new standards. Likewise, the components used in the TFT-LCD panel industry are constantly changing with increased demand for improved features. Moreover, our past sales and profitability have resulted, to a significant extent, from our ability to anticipate changes in technology and industry standards and to develop and introduce new and enhanced products in a timely fashion. If we do not anticipate these changes in technologies and rapidly develop and introduce new and innovative technologies, we may not be able to provide advanced display semiconductors on competitive terms, and some of our customers may buy products from our competitors instead of from us. Our continued ability to adapt to such changes and anticipate future standards will be a significant factor in maintaining or improving our competitive position and our growth prospects. We cannot assure you that we will be able to anticipate evolving industry standards, successfully complete the design of our new products, have these products manufactured at acceptable manufacturing yields, or obtain significant purchase orders for these products to meet new standards or technologies. If we fail to anticipate changes in technology and to introduce new products that achieve market acceptance, our business and results of operations could be materially and adversely affected.
20
Risks Relating to Our Holding Company Structure
Our ability to receive dividends and other payments or funds from our subsidiaries may be restricted by commercial, statutory and legal restrictions, and thereby materially and adversely affect our ability to grow, fund investments, make acquisitions, pay dividends and otherwise fund and conduct our business.
We are a holding company and our assets consist mainly of our 100% ownership interest in Himax Taiwan. We receive cash from Himax Taiwan through intercompany borrowings. Himax Taiwan has not paid us cash dividends in the past. Nonetheless, dividends and interest on shareholder loans that we receive from our subsidiaries in Taiwan, if any, will be subject to withholding tax under ROC law. The ability of our subsidiaries to provide us with loans, pay dividends, repay any shareholder loans from us or make other distributions to us is restricted by, among other things, the availability of funds, the terms of various credit arrangements entered into by our subsidiaries, as well as statutory and other legal restrictions. In addition, while we have registered with the Central Bank of the ROC (Taiwan), or the Central Bank of ROC, for outward/inward remittance that would allow our subsidiaries located in Taiwan to provide us with loans, pay dividends, repay any shareholder loans from us or make other distributions to us, we cannot assure you that the relevant regulations will not change and that the ability of our subsidiaries to do so will not be restricted in the future. A Taiwan company is generally not permitted to distribute dividends or to make any other distributions to shareholders for any year in which it did not have either earnings or retained earnings (excluding reserves). In addition, before distributing a dividend to shareholders following the end of a fiscal year, the company must recover any past losses, pay all outstanding taxes and set aside 10% of its annual net income (less prior years’ losses and outstanding taxes) as a legal reserve until the accumulated legal reserve equals its paid-in capital, and may set aside a special reserve.
Any limitation on dividend payments by our subsidiaries could materially and adversely affect our ability to grow, finance capital expenditures, make acquisitions, pay dividends, and otherwise fund and conduct our business.
Our ability to make further investments in Himax Taiwan may be dependent on regulatory approvals. If Himax Taiwan is unable to receive the equity financing that it requires, its ability to grow and fund its operations may be materially and adversely affected.
Since Himax Taiwan is not a listed company, it generally depends on us to meet its equity financing requirements. Any capital contribution by us to Himax Taiwan may require the approval of the relevant ROC authorities such as the Investment Commission of the Ministry of Economic Affairs of the ROC, or the ROC Investment Commission. We may not be able to obtain any such approval in the future in a timely manner, or at all. If Himax Taiwan is unable to receive the equity financing that it requires, its ability to grow and fund its operations may be materially and adversely affected.
Political, Geographical and Economic Risks
Due to the location of our operations in Taiwan, we and many of our semiconductor manufacturing service providers, suppliers and customers are vulnerable to natural disasters and other events outside of our control, which may seriously disrupt our operations.
Most of our operations, and the operations of many of our semiconductor manufacturing service providers, suppliers and customers are located in Taiwan, which is vulnerable to natural disasters, in particular, earthquakes and typhoons. Our principal foundries and assembly and testing houses upon which we have relied to manufacture substantially all of our display drivers are located in Taiwan. In 2009, 79.2% of our revenues were derived from customers headquartered in Taiwan. As a result of this geographic concentration, disruption of operations at our facilities or the facilities of our semiconductor manufacturing service providers, suppliers and customers for any reason, including work stoppages, power outages, water supply shortages, fire, typhoons, earthquakes, contagious diseases or other natural disasters, could cause delays in production and shipments of our products. Any delays or disruptions could result in our customers seeking to source products from our competitors. Shortages or suspension of power supplies have occasionally occurred and have disrupted our operations. The occurrence of a power outage in the future could seriously hurt our business.
The manufacturing processes of TFT-LCD panels require a substantial amount of water and, as a result, the production operations of TFT-LCD panels may be seriously disrupted by water shortages. Our customers may
21
encounter droughts in areas where most of their current or future manufacturing sites are located. If a drought were to occur and our customers or the authorities were unable to source water from alternative sources in sufficient quantities, our customers may be required to shut down temporarily or to substantially reduce the operations of their fabs, which would seriously affect demand for our products. The occurrence of any of these events in the future could adversely affect our business.
Disruptions in Taiwan’s political environment could negatively affect our business and the market price of our ADSs.
Our principal executive offices and a substantial amount of our assets are located in Taiwan, and a substantial portion of our revenues is derived from our operations in Taiwan. Accordingly, our business, financial condition and results of operations and the market price of our ADSs may be affected by changes in ROC governmental policies, taxation, inflation or interest rates, and by social instability and diplomatic and social developments in or affecting Taiwan that are outside of our control.
Taiwan has a unique international political status. Since 1949, Taiwan and the PRC have been separately governed. The government of the PRC claims that it is the sole government in China and that Taiwan is part of China. Although significant economic and cultural relations have been established during recent years between Taiwan and the PRC, the PRC government has refused to renounce the possibility that it may at some point use force to gain control over Taiwan. Furthermore, the PRC government adopted an anti-secession law relating to Taiwan. Relations between the ROC and the PRC governments have been strained in recent years for a variety of reasons, including the PRC government’s position on the “One China” policy and tensions concerning arms sales to Taiwan by the United States government. Any tension between the ROC and the PRC, or between the United States and the PRC, could materially and adversely affect the market prices of our ADSs.
Fluctuations in exchange rates could result in foreign exchange losses and affect our results of operations.
Our functional and reporting currency is U.S. dolla
rs. In 200
9
, more than
99.0
% of our revenues and cost of revenues were denominated in U.S. dollars. However, we have foreign currency exposure and are primarily affected
by fluctuations in exchange rates between the U.S. dollar and the NT dollar. This is b
ecause a significant portion of our operating expenses (including for research and development, general and administrative, and sales and marketing expenses) are denominated in NT dollars and we maintain a portion of our cash in NT dollars for local worki
n
g capital purpo
se
s. For example, in December 2009
, approximately
45.9
% of our operating expenses were denominated in NT dollars, with a small percentage denominated in Japanese Yen, Korean Won and Chinese Renminbi, and the majority of the remainder in U.S.
dollars. Moreover, there are tax-related assets and liabilities on our balance sheet which are denominated in NT
dollars. The current global economic crisis may cause increased volatility in exchange rates. From time to time, we enter into forward contrac
ts to hedge our foreign currency exposure, but we cannot assure you that this will adequately protect us against the risk of exchange rate fluctuations and reduce the impact of potential foreign exchange losses. Any significant fluctuation to our disadvan
t
age in exchange rates would have an adverse effect on our results of operations and financial condition.
Changes in ROC tax laws would likely increase our tax expenditures and decrease our net income.
Pursuant to the ROC Statute for Upgrading Industries, which expired at the end of 2009, companies were entitled to tax credits for expenses relating to qualifying research and development, personnel training and purchases of qualifying machinery. The tax credits could be applied within a five-year period. The amount of tax credit that could be applied in any year is limited to 50% of the income tax payable for that year (with the exception of the final year when the remainder of the tax credit may be applied without limitation to the total amount of the income tax). Under the ROC Statute for Upgrading Industries, Himax Taiwan was granted tax credits by the ROC Ministry of Finance at rates set at a certain percentage of the amount utilized in qualifying research and development and personnel training expenses. The balance of unused investment tax credits totaled $32.7 million, $46.8 million and $
55.3
million as of December 31, 2007, 2008 and 2009, respectively. On May 12, 2010, the Industrial Innovation Act was promulgated in the ROC, which became effective on the same date except for the provision relating to tax incentives which went into effect retroactively on January 1, 2010. Compared to the ROC Statute for Upgrading Industries, the Industrial Innovation Act provides for a smaller amount of tax credits. The Industrial Innovation Act entitles companies to tax credits for research and development expenses related to innovation activities but limits the amount of tax credit to only up to 15% of the total research and development expenditure for the current year,
22
subject to a cap of 30% of the income tax payable for the current year. Moreover, any unused tax credits provided under the Industrial Innovation Act may not be carried forward. As a result, beginning in 2010, we expect to have a smaller amount of tax credits under the Industrial Innovation Act than would have been available under the ROC Statute for Upgrading Industries.
In addition, unlike the ROC Statute for Upgrading Industries, the Industrial Innovation Act no longer provides to companies deemed to be operating in important or strategic industries any tax exemption for income attributable to expanded production capacity or newly developed technologies. Pursuant to the ROC Statute for Upgrading Industries, beginning April 1, 2004, January 1, 2006 and January 1, 2008, Himax Taiwan became entitled to three preferential tax treatments, each for a period of five years, which expired or will expire on March 31, 2009, December 31, 2010 and December 31, 2012, respectively, and beginning January 1, 2009, Himax Semiconductor also became entitled to one preferential tax treatment for a period of five years, which will expire on December 31, 2013. As a result of these preferential tax treatments, income attributable to certain of our expanded production capacity or newly developed technologies has been tax exempt for the relevant periods. Based on the ROC statutory income tax rate of 25%, the effect of such tax exemption under the ROC Statute for Upgrading Industries was an increase on net income and basic and diluted earnings per share attributable to our stockholders of $27.1 million, $0.07 and $0.07, respectively, for the year ended December 31, 2007, $25.2 million, $0.07 and $0.07, respectively, for the year ended December 31, 2008, and $9.4 million, $0.03 and $0.03, respectively, for the year ended December 31, 2009. While the ROC Statute for Upgrading Industries expired at the end of 2009, under a grandfather clause we can continue to enjoy the five-year tax holiday since the relevant investment plans were approved by the ROC tax authority before the expiration of the Statute. However, as the tax exemption that expired on March 31, 2009 and the tax exemption that is scheduled to expire on December 31, 2010 account for a substantial portion of our total tax-exempted income under the ROC Statute for Upgrading Industries, our income tax expenses increased significantly in 2009 and may continue to increase significantly in the future.
We face risks related to health epidemics and outbreaks of contagious diseases, including H1N1 influenza, H5N1 influenza and Severe Acute Respiratory Syndrome, or SARS.
In recent years, there have been reports of outbreaks of a highly pathogenic influenza caused by the H1N1 virus, as well as an influenza caused by the H5N1 virus, in certain regions of Asia and other parts of the world. An outbreak of such contagious diseases in the human population could result in a widespread health crisis that could adversely affect the economies and financial markets of many countries, particularly in Asia. Additionally, a recurrence of SARS, a highly contagious form of atypical pneumonia, similar to the occurrence in 2003 which affected the PRC, Hong Kong, Taiwan, Singapore, Vietnam and certain other countries, would also have similar adverse effects. Since all of our operations and substantially all of our customers and suppliers are based in Asia (mainly Taiwan), an outbreak of H1N1 influenza, H5N1 influenza, SARS or other contagious diseases in Asia or elsewhere, or the perception that such an outbreak could occur, and the measures taken by the governments of countries affected, including the ROC and the PRC, could adversely affect our business, financial condition or results of operations.
Risks Relating to Our ADSs and Our Trading Market
The proposed issuance and offering of securities and listing on the Taiwan Stock Exchange may materially and adversely affect the liquidity and price of our ADSs and result in a dilution of your ADSs.
We are seeking a dual listing of our securities on the Taiwan Stock Exchange. See “Item 9.C. The Offer and Listing—Markets.” Upon the successful listing, our securities will become tradable in the form of TDRs on the Taiwan Stock Exchange and investors’ interest in our securities may shift away from the Nasdaq Global Select Market, on which our ADSs are traded, to the Taiwan Stock Exchange. We may not only have a loss of prospective investors for our ADSs, but existing holders of ADSs may also exchange their ADSs for TDRs for arbitrage or other reasons. As a result, the liquidity of our ADSs may be materially and adversely affected and our ADS price may become more volatile.
In addition, in connection with our proposed listing on the Taiwan Stock Exchange, we intend to issue new shares for the TDR offering. Your shareholding in our company is therefore subject to dilution in terms of your ownership percentage in our company. In addition, the TDRs could be issued at a discount to the prevailing trading price or fair market value of our ADSs, which could result in significant decreases in our ADS price.
23
The market price for our ADSs is volatile.
The market price for our ADSs is volatile and has ranged from a low of $1.32 to a high of $3.97 on the Nasdaq Global Select Market in 2009. The market price is subject to wide fluctuations in response to various factors, including the following:
|
|
·
|
actual or anticipated fluctuations in our quarterly operating results;
|
|
|
·
|
changes in financial estimates by securities research analysts;
|
|
|
·
|
fluctuations in the trading price of our TDRs upon listing on the Taiwan Stock Exchange;
|
|
|
·
|
conditions in the TFT-LCD panel market;
|
|
|
·
|
changes in the economic performance or market valuations of other display semiconductor companies;
|
|
|
·
|
announcements by us or our competitors of new products, acquisitions, strategic partnerships, joint ventures or capital commitments;
|
|
|
·
|
the addition or departure of key personnel;
|
|
|
·
|
fluctuations in exchange rates between the U.S. dollar and the NT dollar;
|
|
|
·
|
litigation related to our intellectual property and shareholders’ lawsuit; and
|
|
|
·
|
the release of lock-up or other transfer restrictions on our outstanding ADSs or sales of additional ADSs.
|
In addition, as a result of the worldwide financial crisis, global stock markets have experienced extreme price and volume fluctuations. This volatility has had a significant effect on the market prices of securities issued by many companies for reasons which may not be directly related to their operating performance, including but not limited to events such as tax-loss selling, mutual fund redemptions, hedge fund redemptions and margin calls. These market fluctuations may also materially and adversely affect the market price of our ADSs.
Future sales or perceived sales of securities by us, our executive officers, directors or major shareholders may hurt the price of our ADSs.
The market price of our ADSs could decline as a result of sales of ADSs or shares or the perception that these
sales could occur. As of
April
30
, 2010
, we had
355,531,454
outstanding shares and a significant number of o
ur shares were beneficially owned by certain major shareholders, including our directors and executive officers
.
See “Item 7.A. Major Shareholders and Related Party Transactions—Major Shareholders.”
If we, our executive officers, directors or our sharehold
ers sell ADSs or shares, the market price for our shares or ADSs could decline. Future sales, or the perception of future sales, of ADSs or shares by us, our executive officers, directors or existing shareholders could cause the market price of our ADSs t
o
decline.
The level of investor interest and trading in our ADSs could be affected by the lack of coverage by securities research analysts, the lack of investor materials in the Chinese language, and the time difference between New York and Taiwan.
We are currently only listed in the U.S. Investor interest in us may not be as strong as in U.S. companies or Taiwan companies that are listed in Taiwan both because we may not be adequately covered by securities research analyst reports and because of the lack of investor materials in the Chinese language. The lack of coverage could negatively impact investor interest and the level of trading in our ADSs. The interest of both existing and prospective Taiwan-based investors to hold and trade in our ADSs may be impacted by the lack of investor materials in the Chinese language and the time difference between New York and Taiwan. As a result, the liquidity of our ADSs and the valuation multiples may be lower than if we were listed on the Taiwan Stock Exchange.
24
Although publicly traded, the trading market in our ADSs has been substantially less liquid than the average stock quoted on the Nasdaq Global Select Market, and this low trading volume may adversely affect the price of our ADSs.
Although our ADSs are traded on the Nasdaq Global Select Market, the trading volume of our ADSs has generally been very low. Reported average daily trading volume in our ADSs was approximately 268,269 ADSs for the four months ended April 30, 2010 compared to approximately 529,478 ADSs for the year ended December 31, 2009. In addition, during the periods between November 8, 2007 and July 31, 2008 and between November 17, 2008 and May 25, 2010, we repurchased a total of approximately $33.1 million of our ADSs (approximately 7.7 million ADSs) and a total of approximately $45.2 million of our ADSs (approximately 17.5 million ADSs), respectively, from the open market pursuant to two authorized share buyback programs. The repurchased ADSs and their underlying ordinary shares with respect to these two periods reduced the number of our ordinary shares otherwise outstanding by approximately 7.9% for the first program and approximately 9.1% for the second program. Such share buyback programs or future share repurchases could negatively impact the average trading volume of our ADSs.
Limited trading volume will subject our ADSs to greater price volatility and may make it difficult for you to buy or sell your ADSs at a price that is attractive to you.
You may not have the same voting rights as the holders of our ordinary shares and may not receive voting materials sufficiently in advance to be able to exercise your right to vote.
Except as described in the deposit agreement, holders of our ADSs will not be able to exercise voting rights attaching to the shares evidenced by our ADSs on an individual basis. Holders of our ADSs will appoint the depositary or its nominee as their representative to exercise the voting rights attaching to the shares represented by the ADSs. In certain circumstances, however, the depositary shall refrain from voting and any voting instructions received from ADS holders shall lapse. Furthermore, in certain other circumstances, the depositary will give us a discretionary proxy to vote shares evidenced by ADSs. You may not receive voting materials sufficiently in advance to instruct the depositary to vote, and it is possible that you, or persons who hold their ADSs through brokers, dealers or other third parties, will not have the opportunity to exercise a right to vote.
You may not be able to participate in rights offerings and may experience dilution of your holdings as a result.
We may from time to time distribute rights to our shareholders, including rights to acquire our securities. Under the deposit agreement for the ADSs, the depositary will not offer those rights to ADS holders unless both the rights and the underlying securities to be distributed to ADS holders are either registered under the Securities Act, or exempt from registration under the Securities Act with respect to all holders of ADSs. We are under no obligation to file a registration statement with respect to any such rights or underlying securities or to endeavor to cause such a registration statement to be declared effective. In addition, we may not be able to take advantage of any exemptions from registration under the Securities Act. Accordingly, holders of our ADSs may be unable to participate in our rights offerings and may experience dilution in their holdings as a result.
You may be subject to limitations on transfer of your ADSs.
Your ADSs represented by the ADRs are transferable on the books of the depositary. However, the depositary may close its transfer books at any time or from time to time whenever it deems expedient in connection with the performance of its duties. In addition, the depositary may refuse to deliver, transfer or register transfers of ADSs generally when our books or the books of the depositary are closed, or at any time if we or the depositary deem it necessary or advisable to do so because of any requirement of law, any government, governmental body, commission, or any securities exchange on which our ADSs or our ordinary shares are listed, or under any provision of the deposit agreement or provisions of, or governing, the deposited securities or any meeting of our shareholders, or for any other reason.
We currently follow
home country practice in lieu of complying with
certain requirements of the Nasdaq Stock Market LLC. This may afford less protection to holders of our ordinary shares and ADSs.
Rule 5605 of the Marketplace Rules of the Nasdaq Stock Market LLC, or the Nasdaq Rules, requires listed companies to have, among others, a board of directors comprised of a majority of independent directors, the holding of regularly scheduled meetings at which only independent directors are present, a compensation committee, if any,
25
comprised solely of independent directors, and a nominations committee, if any, comprised solely of independent directors. As a foreign private issuer, however, we are permitted to, and we do, follow home country practice in lieu of the above requirements. See “Item 6.C. Directors, Senior Management and Employees—Board Practices” and “Item 16G. Corporate Governance” for more information on the
significant differences betw
een our corporate governance practices and those followed by
U.S.
companies under the Nasdaq Rules.
As a result, we have fewer board members exercising independent judgment, and there may be a decreased level of board oversight on the management of our company. The board members who are not independent may also cause a merger, consolidation, change of control or other transactions or actions without the consent of the independent directors, which may lead to a conflict with the interest of holders of our ordinary shares and ADSs. Holders of our ordinary shares and ADSs may therefore be afforded less protection.
Your ability to protect your rights through the United States federal courts may be limited, because we are incorporated under Cayman Islands law, conduct a substantial portion of our operations in Taiwan, and all of our directors and officers reside outside the United States.
We are incorporated in the
Cayman Islands
. A substantial portion of our operations is conducted in
Taiwan
through Himax
Taiwan
,
our wholly owned subsidiary, and substantially all of our assets are located in
Taiwan
. All of our directors and officers reside outside the
United States
, and a substantial portion of the assets of those persons
is
located outside the
United States
. As a
result, it may be difficult or impossible for you to bring an action against us or against these individuals in the
United States
in the event that you believe that your rights have been infringed under the securities laws or otherwise. Even if you are s
u
ccessful in bringing an action of this kind, the laws of the Cayman Islands and of
Taiwan
may render you unable to enforce a
United States
judgment against our assets or the assets of our directors and officers. There is no statutory recognition in the Ca
y
man Islands of judgments obtained in the United States, although
a final and conclusive judgment in the federal or state courts of the United States under which a sum of money is payable, other than a sum payable in respect of multiple damages, taxes, or other charges of a like nature or in respect of a fine or other penalty, may be subject to enforcement proceedings as debt in
the courts of the Cayman Islands
under the common law doctrine of obligation, provided that (a) such federal or state courts of the United States had proper jurisdiction over the parties subject to such judgment; (b) such federal or state courts of the United States did not contravene the rules of natural justice of the Cayman Islands; (c) such judgment was not obtained by fraud; (d) the enforcement of the judgment would not be contrary to the public policy of the Cayman Islands; (e) no new admissible evidence relevant to the action is submitted prior to the rendering of the judgment by the courts of the Cayman Islands; and (f) there is due compliance with the correct procedures under the laws of the Cayman Islands
.
As a result of all of the above, our public shareholders may have more difficulty in protecting their interests through actions against our management, directors or major shareholders than shareholders of a corporation incorporated in a jurisdiction in the United States would.
You may face difficulties in protecting your interests as a shareholder because judicial precedents regarding shareholders’ rights are more limited under Cayman Islands law than under U.S. law, and because Cayman Islands law generally provides less protection to shareholders than U.S. law.
Our corporate affairs are governed by our memorandum and articles of association, the Companies Law, Cap. 22 (Law 3 of 1961, as consolidated and revised) of the Cayman Islands, or the Cayman Islands Companies Law, and the common law of the Cayman Islands. The rights of shareholders to take action against directors, actions by minority shareholders and the fiduciary responsibilities of our directors to us under Cayman Islands law are to a large extent governed by the common law of the Cayman Islands. The common law of the Cayman Islands is derived in part from comparatively limited judicial precedent in the Cayman Islands as well as from English common law, which has persuasive, but not binding, authority on a court in the Cayman Islands. The rights of our shareholders and the fiduciary responsibilities of our directors under Cayman Islands law are not as clearly established as they would be under statutes or judicial precedent in some jurisdictions in the United States. In particular, the Cayman Islands have a less developed body of securities law than the United States. In addition, some U.S. states, such as Delaware, have more fully developed and judicially interpreted bodies of corporate law than the Cayman Islands.
For example, the Cayman Islands Companies Law differs from laws applicable to United States corporations and their shareholders in certain material respects which may affect shareholders’ rights and shareholders’ access to
26
information. These differences under the Cayman Islands Companies Law (as compared to Delaware law) include, though are not limited to, the following:
|
|
·
|
directors who are interested in a transaction do not have a statutory duty to disclose such interest and there are no provisions under
the
Cayman Islands Companies Law which render such director liable to the company for any profit realized pursuant to s
uch transaction
. Our articles of association, however, contain provisions that require our directors to disclose their interest in a transaction
;
|
|
|
·
|
dissenting shareholders do not have comparable appraisal rights if a scheme of arrangement is approved by the Grand Court of the Cayman Islands;
|
|
|
·
|
shareholders may not be able to bring class action or derivative action suits before a Cayman Islands court
except in certain exceptional circumstances
; and
|
|
|
·
|
unless otherwise provided under the memorandum and articles of association of the company, shareholders do not have the right to bring business before a meeting or call a meeting.
|
Moreover, certain of these differences in corporate law, including, for example, the fact that shareholders do not have the right to call a meeting or bring business to a meeting, may have anti-takeover effects, which could discourage, delay, or prevent the merger or acquisition of our company by means of a tender offer, a proxy contest or otherwise, which a shareholder may have considered in its best interest, and prevent the removal of incumbent officers and directors.
As a result of all of the above, public shareholders may have more difficulty in protecting their interests in the face of actions taken by management, members of the board of directors or controlling shareholders than they would have as public shareholders of a U.S. company.
Investor confidence and the market price of our ADSs may be adversely impacted if we or our independent registered public accountants conclude that our internal controls over financial reporting are not effective.
The Securities and Exchange Commission, or the SEC, as directed by Section 404 of the Sarbanes-Oxley Act of 2002, adopted rules requiring public companies to include in their Annual Report on Form 10-K or Form 20-F, as the case may be, a report of management on the company’s internal controls over financial reporting that contains an assessment by management of the effectiveness of the company’s internal controls over financial reporting. In addition, the company’s independent registered public accounting firm must report on the company’s internal control over financial reporting. Our management may conclude that our internal controls over financial reporting are not effective. Moreover, even if our management does conclude that our internal controls over financial reporting are effective, if our independent registered public accounting firm is not satisfied with our internal controls, the level at which our controls are documented, designed, operated or reviewed, or if our independent registered public accounting firm interprets the requirements, rules or regulations differently from us, then it may conclude that our internal controls over financial reporting are not effective. Furthermore, during the course of the evaluation, documentation and attestation, we may identify deficiencies that we may not be able to remedy in a timely manner. If we fail to achieve and maintain the adequacy of our internal controls, we may not be able to conclude that we have effective internal controls, on an ongoing basis, over financial reporting in accordance with the Sarbanes-Oxley Act. Furthermore, effective internal controls over financial reporting are necessary for us to produce reliable financial reports and are important to help prevent fraud. As a result, our failure to achieve and maintain effective internal controls over financial reporting could result in the loss of investor confidence in the reliability of our financial statements, which in turn could harm our business and negatively impact the trading price of our ADSs. In addition, we have incurred considerable costs and used significant management time and other resources in our effort to comply with Section 404 and other requirements of the Sarbanes-Oxley Act.
4.A. History and Development of the Company
Himax Taiwan, our predecessor, was incorporated on June 12, 2001 as a limited liability company under the laws of the ROC. On April 26, 2005, we established Himax Technologies Limited, an exempted company with
27
limited liability under the Cayman Islands Companies Law as a holding company to hold the shares of Himax Taiwan in connection with our reorganization and share exchange. On October 14, 2005, Himax Taiwan became our wholly owned subsidiary through a share exchange consummated pursuant to the ROC Business Mergers and Acquisitions Law through which we acquired all of the issued and outstanding shares of Himax Taiwan, and we issued ordinary shares to the shareholders of Himax Taiwan. Shareholders of Himax Taiwan received one of our ordinary shares in exchange for one Himax Taiwan common share. The share exchange was unanimously approved by shareholders of Himax Taiwan on June 10, 2005 with no dissenting shareholders and by the ROC Investment Commission on August 30, 2005 for our inbound investment in Taiwan, and on September 7, 2005 for our outbound investment outside of Taiwan. We effected this reorganization and share exchange to comply with ROC laws, which prohibit a Taiwan incorporated company not otherwise publicly listed in Taiwan from listing its shares on an overseas stock exchange. Our reorganization enables us to maintain our operations through our Taiwan subsidiary, Himax Taiwan, while allowing us to list our shares overseas through our holding company structure.
The common shares of Himax Taiwan were traded on the Emerging Stock Board from December 26, 2003 to August 10, 2005, under the stock code “3222.” Himax Taiwan’s common shares were delisted from the Emerging Stock Board on August 11, 2005. As a result of our reorganization, Himax Taiwan is no longer a Taiwan public company, and its common shares are no longer listed or traded on any trading markets.
On September 26, 2005, we changed our name to “Himax Technologies, Inc.,” and on October 17, 2005, Himax Taiwan changed its name to “Himax Technologies Limited” upon the approval of shareholders of both companies and amendments to the respective constitutive documents. We effected the name exchange in order to maintain continuity of operations and marketing under the trade name “Himax Technologies, Inc.,” which had been previously used by Himax Taiwan.
In February 2007, we completed the acquisition of Wisepal, or currently known as Himax Semiconductor, Inc., a fabless semiconductor company focusing on the development of LTPS TFT-LCD drivers for small and medium-sized applications. This transaction strengthened our competitive position in the small and medium-sized product areas and further diversified our technology and product offerings. From time to time, we have also made minority investments in various companies for strategic purposes in the ordinary course of business.
In March 2007, we established Himax Imaging, Inc., or Himax Imaging, which develops and markets CMOS image sensors with an initial focus on camera applications used in cell phones and notebook computers.
In October 2007, we formed Himax Media Solutions, Inc., or Himax Media Solutions, which oversees our TFT-LCD television and monitor chipset business with a focus on expanding market share in the global TFT-LCD television and monitor chipset market. In January 2008, Himax Media Solutions issued shares representing an interest of 19.9% in total to CMO, TPV Technology Limited, the world’s largest LCD monitor manufacturer and LCD TV ODM, and individuals including certain employees of CMO, TPV Technology Limited, Himax Media Solutions and Himax Taiwan.
On August 10, 2009, we effected: (i) a stock split in the form of a stock dividend of 5,999 ordinary shares for each ordinary share held by shareholders of record, followed by a consolidation of every 3,000 ordinary shares into one ordinary share; (ii) a change of the par value of our ordinary shares from $0.0001 each to $0.3 each; and (iii) a change in our ADS ratio from one ADS representing one ordinary share to one ADS representing two ordinary shares.
In November 2009, we filed a listing application with the Taiwan Stock Exchange to list our ordinary shares on its main board. We aborted such primary listing plan in May 2010 and are currently preparing an alternative application to list TDRs on the Taiwan Stock Exchange. See “Item 9.C. The Offer and Listing—Markets.”
Our principal executive offices are located at No. 26, Zih Lian Road, Tree Valley Park, Sinshih Township, Tainan County 74148, Taiwan, Republic of China. Our telephone number at this address is +886-6-505-0880. Our registered office in the Cayman Islands is located at Cricket Square, Hutchins Drive, P.O. Box 2681, Grand Cayman KY1-1111, Cayman Islands. Our telephone number at this address is +1-345-945-3901. In addition, we have regional offices in Hsinchu and Taipei, Taiwan; Foshan, Fuqing, Ningbo, Beijing, Shanghai, Shenzhen and Suzhou, China; Yokohama and Matsusaka, Japan; Cheonan-si, Chungcheongnam-do, South Korea; and Irvine, California, USA.
28
Investor inquiries should be dire
cted to our Investor Relations department, at
+886-2-
2370-3999
ext. 22618
or by
email
to
j
essie
_wang@himax.com.tw
.
Our website is www.himax.com.tw. The information contained on our website is not part of this annual report. Our agent for service of process in the United States is Puglisi & Associates located at 850 Library Avenue, Suite 204, Newark, Delaware 19711.
Our ADSs have been listed on the Nasdaq Global Select Market since March 31, 2006. Our ordinary shares are not listed or publicly traded on any trading markets.
4.B. Business Overview
We design, develop and market semiconductors that are critical components of flat panel displays. Our principal products are display drivers for large-sized TFT-LCD panels, which are primarily used in desktop monitors, notebook computers and televisions, and display drivers for small and medium-sized TFT-LCD panels, which are primarily used in mobile handsets and consumer electronics products such as netbook computers (typically ten inches or below in diagonal measurement), digital cameras, mobile gaming devices, portable DVD players, digital photo frame and car navigation displays. We also offer display drivers for panels using OLED technology and LTPS technology. In addition, we are expanding our product offerings to include non-driver products such as timing controllers, TFT-LCD television and monitor chipsets, LCOS projector solutions, power ICs, CMOS image sensors and wafer level optics products. Our customers are panel, television and module makers. We believe that our leading design and engineering expertise, combined with our focus on customer service and close relationships with semiconductor manufacturing service providers, has contributed to our success.
Industry Background
We operate in the flat panel display semiconductor industry. As our semiconductors are critical components of flat panel displays, our industry is closely linked to the trends and developments of the flat panel display industry.
Flat Panel Display Semiconductors
Flat panel displays require different semiconductors depending upon the display technologies and the applications. Some of the most important ones include the following:
|
|
·
|
Display Driver.
The display driver receives image data from the timing controller and delivers precise analog voltages or currents to create images on the display. The two main types of display drivers for a TFT-LCD panel are gate drivers and source drivers. Gate drivers turn on the transistor within each pixel cell on the horizontal line on the panel for data input at each row. Source drivers receive image data from the timing controller and generate voltage that is applied to the liquid crystal within each pixel cell on the vertical line on the panel for data input at each column. The combination determines the colors generated by each pixel. Typically multiple gate drivers and source drivers are installed separately on the panel. However, for certain small and medium-sized applications, gate drivers and source drivers are integrated into a single chip due to space and cost considerations. Large-sized panels typically have higher resolution and require more display drivers than small and medium-sized panels.
|
|
|
·
|
Timing Controller.
The timing controller receives image data and converts the format for the source drivers’ input. The timing controller also generates controlling signals for gate and source drivers. Typically, the timing controller is a discrete semiconductor in large-sized TFT-LCD panels. For certain small and medium-sized applications, however, the timing controller may be integrated with display drivers.
|
|
|
·
|
Scaler
. For certain displays, a scaler is installed to magnify or shrink image data in order for the image to fill the panel.
|
|
|
·
|
Operational Amplifier.
An operational amplifier supplies the reference voltage to source drivers in order to make their output voltage uniform.
|
|
|
·
|
Television Chipset
. Television flat panel displays require chipsets that typically contain all or some of the following components: an audio processor, analog interfaces, digital interfaces, a video processor, a channel receiver and a digital television decoder. See “—Products—TFT-LCD Television and Monitor
|
29
| Semiconductor Solutions—TFT-LCD Television and Monitor Chipsets” for a description of these components. |
|
|
·
|
LCOS microdisplay.
LCOS is a microprojection technology which can be applied in mobile projection devices.
|
|
|
·
|
Power IC.
Power ICs include certain drivers, amplifiers, DC to DC converters and other semiconductors designed to enhance power management, such as voltage regulation, voltage boosting and battery management.
|
|
|
·
|
CMOS Image Sensor.
The CMOS image sensor converts an optical image to an electric signal and is used mostly in camera-equipped applications.
|
|
|
·
|
Wafer level optics products.
Wafer level optics are optical products manufactured using semiconductor process on glass wafers. This innovative approach enables wafer level optics to feature small-form factor and high temperature resistance, making the surface-mount technology, or SMT, reflow process possible.
|
|
|
·
|
Others.
Flat panel displays also require multiple general purpose semiconductors such as memory, power converters and inverters.
|
Characteristics of the Display Driver Market
Although we operate in several distinct segments of the flat panel display semiconductor industry, our principal products are display drivers. Display drivers are critical components of flat panel displays. The display driver market has specific characteristics, including those discussed below.
Concentration of Panel Manufacturers
The global TFT-LCD panel industry consists of a small number of manufacturers, substantially all of which are based in Asia. In recent years, TFT-LCD panel manufacturers, in particular Taiwan- and Korea-based manufacturers, have invested heavily to establish, construct and ramp up additional fab capacity. The capital intensive nature of the industry often results in TFT-LCD panel manufacturers operating at a high level of capacity utilization in order to reduce unit costs. This tends to create a temporary oversupply of panels, which reduces the average selling price of panels and puts pricing pressure on display driver companies. Moreover, the concentration of panel manufacturers permits major panel manufacturers to exert pricing pressure on display driver companies such as us. The small number of panel manufacturers intensifies this as display driver companies, in addition to seeking to expand their customer base, must also focus on winning a larger percentage of such customers’ display driver requirements.
Customization Requirements
Each panel display has a unique pixel design to meet its particular requirements. To optimize the panel’s performance, display drivers have to be customized for each panel design. The most common customization requirement is for the display driver company to optimize the gamma curve of each display driver for each panel design. Display driver companies must work closely with their customers to develop semiconductors that meet their customers’ specific needs in order to optimize the performance of their products.
Mixed-Signal Design and High-Voltage CMOS Process Technology
Display drivers have specific design and manufacturing requirements that are not standard in the semiconductor industry. Some display drivers require mixed-signal design since they combine both analog and digital devices on a single semiconductor to process both analog signals and digital data. Manufacturing display drivers requires high-voltage CMOS process technology operating typically at 4.5 to 24 volts for source drivers and 10 to 50 volts for gate drivers, levels of voltage which are not standard in the semiconductor industry. For display drivers, the driving voltage must be maintained under a very high degree of uniformity, which can be difficult to achieve using standard CMOS process technology. However, manufacturing display drivers does not require very small-geometry semiconductor processes. Typically, the manufacturing process for large panel display drivers requires geometries between 0.13 micron and 1 micron because the physical dimensions of a high-voltage device do not allow for the
30
economical reduction in geometries below this range. We believe that there are a limited number of fabs with high-voltage CMOS process technology that are capable of high-volume manufacturing of display drivers.
Special Assembly and Testing Requirements
Manufacturing display drivers requires certain assembly and testing technologies and equipment that are not standard for other semiconductors and are offered by a limited number of providers. The assembly of display drivers typically uses either tape automated bonding, also known as TAB, or chip-on-glass, also known as COG, technologies. Display drivers also require gold bumping, which is a process in which gold bumps are plated onto each wafer to connect the die and the processed tape, in the case of TAB packages, and the glass, in the case of COG packages. TAB may utilize tape carrier package, also known as TCP, or chip on film, also known as COF. The type of assembly used depends on the panel manufacturer’s design, which is influenced by panel size and application and is typically determined by the panel manufacturers. Display drivers for large-sized applications typically require TAB package types and, to a lesser extent COG package types, whereas display drivers for mobile handsets and consumer electronics products typically require COG packages. The testing of display drivers also requires special testers that can support high-channel and high-voltage output semiconductors. Such testers are not standard in the semiconductor industry.
Supply Chain Management
The manufacturing of display drivers is a complex process and requires several manufacturing stages such as wafer fabrication, gold bumping and assembly and testing, and the availability of materials such as the processed tape used in TAB packaging. We refer to these manufacturing stages and material requirements collectively as the “supply chain.” Panel manufacturers typically operate at high levels of capacity utilization and require a reliable supply of display drivers. A shortage of display drivers, or a disruption to this supply, may disrupt panel manufacturers’ operations since replacement supplies may not be available on a timely basis or at all, given the customization of display drivers. As a result, a display driver company’s ability to deliver its products on a timely basis at the quality and quantity required is critical to satisfying its existing customers and winning new ones. Such supply chain management is particularly crucial to fabless display driver companies that do not have their own in-house manufacturing capacity. In the case of display drivers, supply chain management is further complicated by the high-voltage CMOS process technology and the special assembly and testing requirements that are not standard in the semiconductor industry. Access to this capacity also depends in part on display driver companies having received assurances of demand for their products since semiconductor manufacturing service providers require credible demand forecasts before allocating capacity among customers and investing to expand their capacity to support growth.
Need for Higher Level of Integration
The small form factor of mobile handsets and certain consumer electronics products restricts the space for components. Small and medium-sized panel applications typically require one or more source drivers, one or more gate drivers and one timing controller, which can be installed as separate semiconductors or as an integrated single-chip driver. Customers are increasingly demanding higher levels of integration in order to manufacture more compact panels, simplify the module assembly process and reduce unit costs. Display driver companies must be able to offer highly integrated chips that combine the source driver, gate driver and timing controller, as well as semiconductors such as memory, power circuit and image processors, into a single chip. Due to the size restrictions and stringent power consumption constraints of such display drivers, single-chip drivers are complex to design. For large-sized panel applications, integration is both more difficult to achieve and less important since size and weight are less of a priority.
Products
We have six principal product lines:
|
|
·
|
display drivers and timing controllers;
|
|
|
·
|
TFT-LCD television and monitor semiconductor solutions;
|
31
|
|
·
|
LCOS products;
|
|
|
·
|
power ICs;
|
|
|
·
|
CMOS image sensors; and
|
|
|
·
|
wafer level optics products.
|
We commenced volume shipments of our first source and gate drivers for large-sized panels in July 2001 and have developed a broad product portfolio of display drivers and timing controllers for use in large-sized TFT-LCD panels. We commenced volume shipments of our first display drivers for use in consumer electronics applications in April 2002, volume shipments of two-chip display drivers for mobile handsets in August 2003 and volume shipments of single-chip display drivers for mobile handsets in August 2004. In September 2004, we commenced volume shipments of our first television semiconductor solutions. We commenced shipping engineering samples of LCOS products in December 2003 and started volume shipments in June 2006.
We commenced shipping engineerin
g samples of power ICs in
October 2006
and started volume shipments in
January 2007. We commenced small quantity commercial shipments of our CMOS image sensor products in April 2009. We commenced small quantity commercial shipments of our wafer level optics products in December 2009.
Display Drivers and Timing Controllers
Display Driver Characteristics
Display drivers deliver precise analog voltages and currents that activate the pixels on panels. The following is a summary of certain display driver characteristics and their relationship to panel performance.
|
|
·
|
Resolution and Number of Channels.
Resolution refers to the number of pixels per line multiplied by the number of lines, which determines the level of fine detail within an image displayed on a panel. For example, a color display screen with 1,024 x 768 pixels has 1,024 red columns, 1,024 green columns and 1,024 blue columns for a total of 3,072 columns and 768 rows. The red, green and blue columns are commonly referred to as “RGB.” Therefore, the display drivers need to drive 3,072 column outputs and 768 row outputs. The number of display drivers required for each panel depends on the resolution of the panel and the number of channels per display driver. For example, an XGA (1,024 x 768 pixels) panel requires eight 384 channel source drivers (1,024 x 3 = 384 x 8) and three 256 channel gate drivers (768 = 256 x 3), while a full HD (1,920 x 1,080 pixels) panel requires eight 720 channel source drivers and four 270 channel gate drivers. The number of display drivers required can be reduced by using drivers with a higher number of channels. For example, a full HD panel can have six 960 channel source drivers instead of eight 720 channel source drivers. Thus, using display drivers with a higher number of channels can reduce the number of display drivers required for each panel, although display drivers with a higher number of channels typically have higher unit costs.
|
|
|
·
|
Color Depth.
Color depth is the number of colors that can be displayed on a screen, which is determined by the number of shades of a color, also known as grayscale, that can be shown by the panel. For example, a 6-bit source driver is capable of generating 2
6
x 2
6
x 2
6
= 2
18
, or 262K colors, and similarly, an 8-bit source driver is capable of generating 16 million colors. Typically, for TFT-LCD panels currently in commercial production, 262K, 16 million and 1 billion colors are supported by 6-bit, 8-bit and 10-bit source drivers, respectively.
|
|
|
·
|
Operational Voltage.
A display driver operates with two voltages: the input voltage (which enables it to receive signals from the timing controller) and the output voltage (which, in the case of source drivers, is applied to liquid crystals and, in the case of gate drivers, is used to switch on the TFT device). Source drivers typically operate at input voltages from 4.5 to 1.5 volts and output voltages between 4.5 to 24 volts. Gate drivers typically operate at input voltages from 3.3 to 1.5 volts and output voltages from 10 to 50 volts. Lower input voltage saves power and lowers electromagnetic interference, or EMI. Output voltage may be higher or lower depending on the characteristics of the liquid crystal (or diode), in the case of source drivers, or TFT device, in the case of gate drivers.
|
32
|
|
·
|
Gamma Curve.
The relationship between the light passing through a pixel and the voltage applied to it by the source driver is nonlinear and is referred to as the “gamma curve” of the source driver. Different panel designs and manufacturing processes require source drivers with different gamma curves. Display drivers need to adjust the gamma curve to fit the pixel design. Due to the materials and processes used in manufacturing, panels may contain certain imperfections which can be corrected by the gamma curve of the source driver, a process which is generally known as “gamma correction.” For certain types of liquid crystal, the gamma curves for RGB cells are significantly different and thus need to be independently corrected. Some advanced display drivers feature three independent gamma curves for RGB cells.
|
|
|
·
|
Driver Interface.
Driver interface refers to the connection between the timing controller and display drivers. Display drivers increasingly require higher bandwidth interface technology to address the larger data volume necessary for video images. Panels used for higher data transmission applications such as televisions require more advanced interface technology. The principal types of interface technologies are transistor-to-transistor logic, or TTL, reduced swing differential signaling, or RSDS, and mini-low voltage differential signaling, or mini-LVDS. Among these, RSDS and mini-LVDS were developed as low power, low noise and low amplitude methods for high-speed data transmission using fewer copper wires and resulting in lower EMI.
|
|
|
·
|
Package Type.
The assembly of display drivers typically uses TAB and COG package types. COF and TCP are two types of TAB packages, of which COF packages have become predominantly used in recent years. Customers typically determine the package type required according to their specific mechanical and electrical considerations. In general, display drivers for small-sized panels use COG package type whereas display drivers for large-sized panels primarily use TAB package types and, to a lesser extent, COG package types.
|
Large-Sized Applications
We provide source drivers, gate drivers and timing controllers for large-sized panels principally used in desktop monitors, notebook computers and televisions. Display drivers used in large-sized applications feature different key characteristics, depending on the end-use application. For example, the industry trend for large-sized applications is generally toward super high channel, low power consumption, low cost, thin and light form factor, touch function, higher data transmission rate and higher driving capabilities. Higher speed interface technologies are also key for 240Hz TV. Greater color depth, enhanced color through RGB independent gamma and 3D display are particularly important for advanced televisions and certain monitors.
In December 2007, we introduced the cascade modulated driver interface, or CDMI, technology, a patented technology for LED notebook panels, benefits of which include a thin and light form factor, lower material costs and lower power consumption and supports a resolution of up to 1,920 x 1,200 pixels.
In February 2009, we introduced timing controllers with the content adaptive brightness control, or CABC, technology. CABC technology controls backlight brightness intelligently by analyzing the content displayed to save power and enhance the contrast level while maintaining vivid display quality. Our algorithm enables a smooth adjustment in backlight brightness even when the content changes swiftly.
The table below sets forth the features of our products for large-sized applications:
|
Product
|
Features
|
|
|
TFT-LCD Source Drivers
|
·
|
384 to 1,032 output channels
|
|
·
|
6-bit (262K colors), 8-bit (16 million colors) or 10-bit (1 billion colors)
|
|
|
·
|
one gamma-type driver
|
|
|
·
|
three gamma-type drivers (RGB independent gamma curve to enhance color image)
|
|
|
·
|
output driver voltage ranging from 4.5V to 24V and support half VDDA
|
|
|
·
|
input logic voltage ranging from standard 3.3V to low power 1.5V
|
|
|
·
|
low power consumption and low EMI
|
33
|
Product
|
Features
|
|
|
·
|
support TCP, COF and COG package types
|
|
|
·
|
support TTL, RSDS, mini-LVDS (up to 330MHz), dual edge transistor-to-transistor logic, or DETTL, turbo RSDS, cascade modulated driver interface, or CMDI, and customized interface technologies
|
|
|
·
|
support dual gate and triple gate panel designs
|
|
|
TFT-LCD Gate Drivers
|
·
|
192 to 600 output channels
|
|
·
|
output driving voltage ranging from 10 to 50V
|
|
|
·
|
input logic voltage ranging from standard 3.3V to low power 1.5V
|
|
|
·
|
low power consumption
|
|
|
·
|
support TCP, COF and COG package types
|
|
|
·
|
support dual gate and triple gate panel designs
|
|
|
Timing Controllers
|
·
|
product portfolio supports a wide range of resolutions, from VGA (640 x 480 pixels) to full HD (1,920 x 1,080 pixels and 1,920 x 1,200 pixels)
|
|
·
|
support TTL, RSDS, mini-LVDS, DETTL, turbo RSDS, CMDI and customized output interface technologies
|
|
|
·
|
input logic voltage ranging from standard 3.3V to low power 1.5V
|
|
|
·
|
embedded overdrive function to improve response time
|
|
|
·
|
support CABC to save power and color engine to enhance color and sharpness
|
|
|
·
|
support TTL, LVDS and DisplayPort input interface technologies
|
Mobile Handset Applications
We offer display drivers for mobile handset displays that combine source driver, gate driver, timing controller, frame buffer and DC to DC circuits into a single chip in various display technologies, such as TFT-LCD, LTPS and AMOLED.
A
s
mobile handset
prices
remain
competitive,
mobile
display module
manufacturers continue to reduce cost and
seek
to source
cost-effective display drivers. By designing a finer channel pitch that features cost efficient processes, we have offered a smaller chip size and endeavor to provide handset display driver products with fewer external components to reduce the cost of materials for our customers.
The industry trend for mobile handset display drivers is generally toward display drivers that can support high-speed interfaces and have greater color depth and enhanced image quality as multimedia functions are increasingly incorporated into mobile handsets. In addition, the ability for mobile handsets to operate for long durations w
ithout recharging the battery
is of high value
. Thus, dis
play drivers with lower power consumption are desired
. W
e integrated our
proprietary low power driving circuits
and
CABC
technology
into
display drivers
in order to extend the battery life.
With new software platforms providing better access to the Internet, smartphones have gained greater popularity among consumers and enjoyed higher growth in recent years. This has also contributed to higher demand for mobile handset displays that have a larger size and higher resolution. We continue to offer innovative handset display driver products by providing one of the leading amorphous silicon WVGA (480 x 864 pixels) display drivers in the market.
The following table summarizes the features of our products for mobile handsets:
|
Product
|
|
Features
|
|
TFT-LCD Drivers
|
·
|
highly integrated single chip embedded with the source driver, gate driver, power circuit, timing controller and memory
|
|
·
|
suitable for a wide range of resolutions from QQVGA (128 x 160 pixels) to WVGA (480 x 864 pixels)
|
|
|
·
|
support 262K colors to 16 million colors
|
34
|
·
|
support RGB separated gamma adjustment
|
|
|
·
|
support CABC
|
|
|
·
|
support mobile display digital interface, or MDDI, and mobile industry processor interface, or MIPI
|
|
|
·
|
input logic voltage ranging from standard 3.3V to low power 1.65V
|
|
|
·
|
low power consumption and low EMI
|
|
|
·
|
utilize die shrink technology to reduce die size and cost
|
|
|
·
|
fewer external components to reduce costs
|
|
|
·
|
slimmer die for compact module to fit smaller mobile handset designs
|
|
|
·
|
application specific integrated circuits, or ASIC, can be designed to meet customized requirements (e.g., drivers without memory or drivers without gate driver embedded on the chip)
|
|
|
LTPS Drivers
|
·
|
highly integrated single chip embedded with the source driver, power circuit, timing controller and memory
|
|
·
|
suitable for a wide range of resolutions from QQVGA (128 x 160 pixels) to WVGA (480 x 864 pixels)
|
|
|
·
|
support 262K colors to 16 million colors
|
|
|
·
|
support RGB separated gamma adjustment
|
|
|
·
|
support CABC
|
|
|
·
|
support compact display port, or CDP, MDDI, and MIPI
|
|
|
·
|
input logic voltage ranging from standard 3.3V to low power 1.65V
|
|
|
·
|
utilize die shrink technology to reduce die size and cost
|
|
|
·
|
slimmer die for compact module
|
|
|
·
|
ASIC can be designed to meet customized requirements
|
|
|
(e.g., gateless or multi-bank output driver)
|
Consumer Electronics Products
We offer source drivers, gate drivers, timing controllers and integrated drivers for consumer electronics products such as netbook computers, digital cameras, digital video recorders, personal digital assistants, mobile gaming devices, portable DVD players, electronic book readers, or E-readers, digital photo frames and car navigation displays. We offer an extensive line of display drivers covering different applications, interfaces and channel output and levels of integration. Similar to mobile handsets, consumer electronics products are typically compact, battery-operated devices. Customers are increasingly demanding display drivers with smaller and more compact die sizes and higher levels of integration with the source driver, gate driver, timing controller, as well as more functional semiconductors such as memory, power circuit and image processors, into a single chip.
The industry trend for display drivers used in medium-sized consumer electronics products is toward higher channels and the integration of timing controllers with display drivers. The trend of display drivers used in small-sized consumer electronics products is toward single-chip solutions combining the source driver, gate driver, timing controller and power circuit into a single chip.
In 2009, we introduced our new electro-phoretic display solutions, including HX8701 (gate driver), HX8702 (source driver) and HX8704 (timing controller), for use in E-reader devices.
The following table summarizes the features of our products used in consumer electronics products:
|
Product
|
Features
|
|
|
TFT-LCD Source Drivers
|
·
|
240 to 1366 output channels
|
|
·
|
products for analog and digital interfaces
|
|
|
·
|
support 262K colors to 16.7 million colors
|
|
|
·
|
input logic voltage ranging from standard 3.3V to low power 2.3V
|
|
|
·
|
low power consumption and low EMI
|
|
|
TFT-LCD Gate Drivers
|
·
|
96 to 1200 output channels
|
35
|
Product
|
Features
|
|
|
·
|
input logic voltage ranging from standard 3.3V to low power 2.3V
|
|
|
·
|
output driving voltage ranging from 10 to 40V
|
|
|
TFT-LCD Integrated Drivers
|
·
|
highly integrated single chip embedded with source driver, gate driver, timing controller and power circuit
|
|
·
|
resolutions include WVGA (846 x 480 pixels), SVGA (800 x 600 pixels) and WSVGA (1,024 x 600 pixels)
|
|
|
·
|
products for analog or digital interfaces
|
|
|
·
|
low power consumption
|
|
|
·
|
CABC function integrated for backlight power saving
|
|
|
Timing Controllers
|
·
|
products for analog or digital interfaces
|
|
·
|
products for E-readers
|
|
|
·
|
support various resolutions from 280 x 220 pixels to 1024 x 600 pixels
|
TFT-LCD Television and Monitor Semiconductor Solutions
Himax Media Solutions, our subsidiary, provides TFT-LCD television and monitor semiconductor solutions. Set forth below are the various semiconductor components that may be utilized in flat-panel digital and analog televisions:
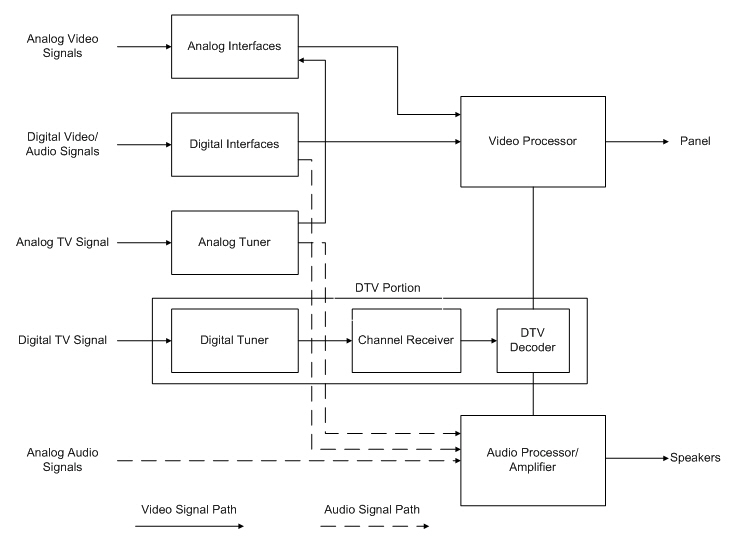
36
TFT-LCD Television and Monitor Chipsets
Television chipsets contain numerous components that process video and audio signals and thus enhance the image and audio qualities of televisions. Digital and analog televisions typically require some or all of these components:
|
|
·
|
Audio Processor/Amplifier.
Demodulates, processes and amplifies sound from television signals.
|
|
|
·
|
Analog Interfaces.
Convert analog video signals into digital video signals. Video decoder and analog-to-digital converter, or ADC, are included.
|
|
|
·
|
Digital Interfaces.
Receive digital signals via digital receivers. Digital visual interfaces, or DVI, and high-definition multimedia interfaces, or HDMI, are included.
|
|
|
·
|
Channel Receiver.
Demodulates input signals so that the output becomes compressed bit stream data.
|
|
|
·
|
DTV Decoder.
Converts video and audio signals from compressed bit stream data into regular video and audio signals.
|
|
|
·
|
Video Processor.
Performs the scaling function that magnifies or shrinks the image data in order to fit the panel’s resolution; provides real-time processing for improved color and image quality; converts output video from an interlaced format to a progressive format in order to eliminate jaggedness; and supports on-screen display and real-time video format transformation.
|
We are developing all of the above components and have shipped our analog TV single-chip solutions in volume. Our analog TV single-chip solutions are designed for use in televisions as well as LCOS applications
and our product portfolio includes high-performance chips that target high-end segments as well as cost-effective chips which target entry-level segments.
The following table summarizes the features of our video processors:
|
Product
|
Features
|
|
|
Analog TV Single-Chip Solutions
|
·
|
ideal for LCD TV, multi-function monitor TV and LCOS applications
|
|
·
|
integrated with high performance ADC, scaler and de-interlacer
|
|
|
·
|
built-in HDMI and DVI receiver
|
|
|
·
|
integrated with video decoder and 3D comb filter to support worldwide National Television System Committee, or NTSC, phase alternating line, or PAL, and sequential color with memory, or SECAM, standards
|
|
|
·
|
integrated with vertical blanking interval slicer for closed caption, viewer-control chip and teletext functions
|
|
|
·
|
built-in Himax 4th generation video engine which supports variable dynamic video enhancement features
|
|
|
·
|
built-in analog audio demodulator, audio processor and surround integrated high speed microprocessor control unit, or MCU
|
|
|
·
|
integrated with timing control for additional cost-down
|
|
|
·
|
output resolutions range from 640 x 480 pixels up to 1,920 x 1,080 pixels
|
|
|
Digital TV Integrated Solutions
|
·
|
embedded digital demodulators: ATSC, DVB-T, DVB-C, and DVMB
|
|
·
|
embedded analog demodulator: picture intermediate frequency for NTSC, PAL and SECAM
|
|
|
·
|
embedded multi-format video stream decoder: MPEG2, MPEG4, AVS, Real Video and H.264 up to full HD
|
|
|
·
|
embedded audio stream decoder: MPEG1 I/II/III and MPEG2 layer 2 I/II/III, Dolby audio coding 3, Dolby Digital Plus, advanced audio coding and Real Audio
|
37
|
Product
|
Features
|
|
|
·
|
embedded audio processor: sound retrieval system
|
|
|
·
|
embedded high performance RISC CPU
|
|
|
·
|
embedded 3D video processor
|
|
|
·
|
input resolution up to full HD (1,920 x 1,080 pixels)
|
|
|
·
|
output resolution up to full HD (1,920 x 1,080 pixels)
|
The following table summarizes the features of our monitor scaler solutions:
|
Product
|
Features
|
|
|
Monitor Scaler Integrated Solutions
|
·
|
ideal for monitor applications
|
|
·
|
integrated with high performance ADC, scaler and de-interlancer
|
|
|
·
|
built-in HDMI and DVI receiver
|
|
|
·
|
built-in audio digital-to-analog converter
|
|
|
·
|
built-in high performance color engine
|
|
|
·
|
integrated high speed MCU
|
|
|
·
|
integrated with timing control for additional cost-down
|
|
|
·
|
input/output resolutions range from 640 x 480 pixels up to 1,920 x 1,080 pixels
|
In December 2009, we announced the introduction of infinity color technology, or iCT, an innovative and proprietary image processing technology which enables significant power saving for TFT-LCD panels while enhancing image quality. TFT-LCD backlight, whether by using cold cathode fluorescent lamps or LEDs, typically maintains a constant brightness at all times, regardless of the displayed images. A commonly adopted technique in saving backlight power is CABC which dynamically adjusts the backlight and the contents. While this digital approach is able to save panel power, it leads to a loss in gray scales while adjusting the gamma curve, therefore resulting in a less satisfactory image quality. In contrast, iCT is an innovative mixed-mode image processing technology, which not only enhances image quality but also saves significant panel power.
In February 2010, we unveiled the innovative 2D to 3D conversion solution which can convert 2D images into the 3D format in real time. This compact solution can be implemented in a number of hardware platforms, such as notebook personal computers and televisions. Our algorithm utilizes human visual perception characteristics, which not only reveals more 3D details but may also offer a more comfortable and enjoyable viewing experience.
The following table summarizes the features of our iCT and 2D to 3D conversion solutions:
|
Product
|
Features
|
|
|
Power-Saving iCT Solutions
|
·
|
built-in single/dual path 8/10-bit LVDS receiver
|
|
·
|
support up to 1920x1080@75HZ resolution
|
|
|
·
|
built-in single/dual path 6/8-bit RSDS transmitter for low power consumption and low EMI
|
|
|
·
|
built-in single/dual 8/10-bit LVDS transmitter
|
|
|
·
|
built-in single/dual 6/8-bit 3/6-pair mini-LVDS transmitter
|
|
|
·
|
support polarity 1 or 1+2 line inversion mode and dual-gate/Z-inversion panel structure
|
|
|
·
|
embedded aging generator for simplifying TFT-LCD panel dynamic burn-in test
|
|
|
·
|
support low color shift, initial download from electrically-erasable programmable read-only memory, or EEPROM
|
|
|
·
|
support serial bus programming from scaler to select up to 4 different initial download value settings (depend on the size of EEPROM)
|
|
|
·
|
embedded 3D color engine, 10-bit gamma correction look-up table
|
|
|
·
|
programmable sRGB matrix coefficients
|
38
|
Product
|
Features
|
|
|
·
|
embedded dynamic analog gamma control, dynamic exposure adaptation control, CABC and over drive
|
|
|
·
|
support up to external 20+1-channel gamma buffer with 10-bit resolution control by 2-wire serial bus
|
|
|
2D to 3D Conversion Solutions
|
·
|
convert 2D video sequence to 3D video sequence for 3D display
|
|
·
|
enable virtual 3D experience on 2D display based on human 3D perception characteristics
|
|
|
·
|
use human perception based processing with better performance and fewer side effects
|
|
|
·
|
support 2D bypass mode, 2D to 3D converter mode and 3D bypass mode
|
|
|
·
|
support a wide range of display formatting and interface, including LVDS and TTL
|
|
|
·
|
support anaglyph, pattern retarder or micro-retarder and CheckerBoard 2-view 3D display
|
|
|
·
|
configurable stereoscopic density; support in-front-of-screen, behind-the-screen and on-the-screen configurations
|
|
|
·
|
support resolutions up to full HD
|
|
|
·
|
enable integration into existing TV, monitor, portable DVD, digital photo frame and other 3D display devices
|
|
|
·
|
support top-and-bottom, frame packing, side-by-side (full) and side-by-side (half) 3D formats
|
|
|
·
|
support dual LVDS, front/back quad LVDS, non-front/back quad LVDS and left/right parallel quad LVDS for output format
|
|
|
·
|
support 8-bit/10-bit LVDS for both input and output formats
|
LCOS Products
Himax LCOS microdisplays and the associated projector technologies are beginning mass production for, in particular, palm-size mobile projectors. Our design and manufacturing capabilities for LCOS microdisplays are conducted through our subsidiary, Himax Display, Inc., or Himax Display. In January 2008, we announced a strategic alliance with 3M, one of the world’s leading companies in optics technology, to commercialize the applications of LCOS mobile projectors. 3M developed proprietary projection optics which were incorporated with our proprietary color-filter LCOS microdisplays for a series of miniature projector modules. In August 2009, we introduced our LCOS microdisplays for use by the world’s first projector-embedded digital camera. Commercial applications of LCOS-embedded projectors are expected to see an increasing demand in consumer electronics market.
In addition to color-filter LCOS microdisplays, we have also developed color-sequential LCOS microdisplays, which are expected to commence mass production in 2010. The color-filter type has a simpler projection architecture with a white LED, while the color-sequential type requires three-color LEDs and can offer better colors. We designed the two types of microdisplays in a way that most of their optical components can be shared. With the production of these two types of LCOS microdisplays and the leverage of optical components, we are building up a broad product line-up of a variety of LCOS projector modules for various applications. The following table shows certain details of our LCOS microdisplays:
|
LCOS Microdisplays
|
Size and Resolution
|
Applications
|
||
|
Color-Filter LCOS Microdisplays
|
·
|
0.28” (320 x 240 pixels)
|
·
|
toy projectors / embedded projectors
|
|
·
|
0.38” (640 x 360 pixels)
|
·
|
entry-level video projectors
|
|
|
·
|
0.44” (640 x 480 pixels)
|
·
|
versatile projectors
|
|
|
·
|
0.59” (800 x 600 pixels)
|
·
|
multimedia projectors
|
|
|
Color-Sequential LCOS Microdisplays
|
·
|
0.22” (640 x 360 pixels)
|
·
|
toy projectors / embedded projectors
|
|
·
|
0.28” (852 x 480 pixels)
|
·
|
embedded projectors
|
|
|
·
|
0.38” (640 x 480 pixels)
|
·
|
versatile projectors
|
|
39
|
LCOS Microdisplays
|
Size and Resolution
|
Applications
|
||
|
·
|
0.37” (800 x 600 pixels)
|
·
|
multimedia projectors
|
|
|
·
|
0.37” (1366 x 768 pixels)
|
·
|
multimedia projectors
|
|
|
·
|
0.45” (1024 x 768 pixels)
|
·
|
multimedia projectors
|
In addition to LCOS microdisplays, we have also developed a series of low-power video processors for accessory and embedded projector applications. These low-power video processors are essential for battery-operated mobile projectors, such as mobile phone projectors, camera projectors and notebook projectors. Some of them are available in the market now, and we expect more to come.
Power ICs
Himax Analogic, Inc., or Himax Analogic, our subsidiary, has two major product lines: power management ICs and LED drivers.
Power Management ICs
A power management IC integrates several power components to fulfill system power requirements. It may include step-up or step-down pulse width modulation, or PWM, DC-to-DC converters, low-dropout regulators, or LDO regulators, voltage detectors, operational amplifiers, level shifters, or other components. For panel module applications, a power management IC provides a reliable and precise voltage for source drivers, gate drivers, timing controllers, and panel cells. Moreover, its built-in over-temperature and over-current protections help prevent components from being damaged under certain abnormal conditions. As integrating an increasing number of components into a power management IC is likely to be a continuing trend, we believe power management ICs will continue to be critical components of a TFT-LCD panel module.
|
Product
|
Features
|
|
|
Integrated Multi-Channel Power Solutions for Notebooks
|
·
|
2.5V to 5.5V input voltage range
|
|
·
|
16V, 2A power metal oxide semiconductor field-effect transistor, or MOSFET
|
|
|
·
|
step-up PWM converter
|
|
|
·
|
charge pump regulator
|
|
|
·
|
LDO regulator
|
|
|
·
|
voltage detector
|
|
|
·
|
gate pulse modulator
|
|
|
Integrated Multi-Channel Power Solutions for Monitors
|
·
|
2.5V to 6V input voltage range
|
|
·
|
20V, 4.2A power MOSFET
|
|
|
·
|
step-up PWM converter
|
|
|
·
|
charge pump regulator
|
|
|
·
|
programmable common voltage
|
|
|
·
|
level shifter
|
LED Drivers
The LED driver provides sufficient voltage and current to light up LED diodes. Moreover, in addition to turning LEDs on, the driver has to keep the brightness of LEDs uniform and stable. Therefore, voltage boosting and current sensing are the core functional blocks of a white LED driver.
|
Product
|
Features
|
|
|
WLED Drivers for NB
|
·
|
4.5V to 24V input voltage range
|
|
·
|
built-in 1.3MHz step-up PWM converter (max. boost voltage: 40V)
|
|
|
·
|
8 constant current source channels
|
|
|
·
|
capable of driving up to 11 LEDs in serial for each channel
|
40
|
Product
|
Features
|
|
|
WLED Drivers for LED TV
|
·
|
8V to 40V input voltage range
|
|
·
|
8-channel current sinks
|
|
|
·
|
Up to 80mA per channel
|
|
|
·
|
65V sustainable voltage for LED pins
|
CMOS Image Sensor Products
Our CMOS image sensor products are designed primarily for camera-equipped mobile devices such as mobile phones and notebook computers with a focus on low light image and video quality. The CMOS image sensor product line is developed by our subsidiary, Himax Imaging. With the product launch of 3 mega pixel, 2 mega pixel and VGA sensors and system-on-chip products in 2009, we have secured customer designs in both mobile phones and notebook applications and moved these products into production phase. We continue to expand our product portfolio with the successful introduction of a 1/6” format 1.3 mega pixel system-on-chip. All of our CMOS image sensors feature the UltraBright
TM
technology to achieve a better signal-to-noise ratio in the low light or video mode without a decreasing frame rate or increasing power consumption. We are committed to being a key player in this business with investments in experienced human resources, an efficient supply chain, and strategic technology developments and partnerships to further increase the performance and features of small pixel sensors.
The following table sets forth the features of our CMOS image sensor products:
|
Product
|
Features
|
|
|
3.4MP UltraBrightTM Color Image Sensor
|
·
|
1/4” format color type
|
|
·
|
QXGA resolution at 15 frames per second, support for 720p HD and D1 resolution at 30 frames per second
|
|
|
·
|
ClearVisionTM 80dB enhanced dynamic range mode compatible with standard color processing
|
|
|
·
|
on-chip 4-channel lens correction, defect removal
|
|
|
2.0MP UltraBrightTM Color Image Sensor
|
·
|
1/5” format color type
|
|
·
|
UXGA resolution at 18 frames per second, 720p HD resolution at 30 frames per second
|
|
|
·
|
on-chip 4-channel lens correction, defect removal
|
|
|
·
|
low noise, low power consumption
|
|
|
1.3MP BrightSenseTM System on Chip
|
·
|
1/6” format color type
|
|
·
|
SXGA resolution at 20 frames per second, 720p HD resolution at 30 frames per second
|
|
|
·
|
color processing pipeline with dynamic adjustments based on luminance and light color temperature
|
|
|
·
|
low noise, low power consumption
|
|
|
VGA UltraBrightTM System on Chip
|
·
|
1/10” format color type
|
|
|
·
|
VGA YUV output at 30 frames per second, QVGA at 60 frames per second
|
|
·
|
color processing pipeline including lens correction, defect correction, color de-mosaic, color correction, gamma control, saturation/hue adjustment, edge enhancement
|
|
|
·
|
automatic low light and frame rate control
|
|
|
·
|
multiple video formats including YUV422, RGB565, and ITU656
|
41
Wafer Level Optics Products
Wafer level optics are optical products manufactured using semiconductor process on wafers. This innovative approach enables wafer level optics to feature small-form factor and high temperature resistance, making the SMT reflow process possible. Currently, we offer products with resolutions from VGA up to 2 mega pixels mainly for portable electronic devices and notebooks.
Combining traditional optical lens design, precise mold control and semiconductor manufacturing expertise, our first VGA product has been adopted by certain tier-1 camera module makers and mobile phone brands. Our double-side manufacture process makes the lens structure more reductive and achieves better performance. In addition, our material is specially selected to increase the optical performance and stability of the lens.
The following table sets forth the features of our wafer level optics products:
|
Product
|
Features
|
|
|
VGA 1 element wafer level lens
|
·
|
For 1/10” VGA CIS (2.2~2.25μm pixel pitch)
|
|
·
|
One-element and two-surface design for cost-competitive market
|
|
|
·
|
Double-side manufacture process
|
|
|
·
|
Already in mass production
|
|
|
VGA 2 elements wafer level lens
|
·
|
For 1/10” VGA CIS (2.2~2.25μm pixel pitch)
|
|
·
|
Two-element and four-surface design for high-performance requirement
|
|
|
·
|
Double-side manufacture process
|
|
|
·
|
Lower profile
|
|
|
2M 2 elements wafer level lens
|
·
|
For 1/5” 2M CIS (1.75μm pixel pitch)
|
|
·
|
Two-element and four-surface design for cost-competitive market
|
|
|
·
|
Double-side manufacture process
|
|
|
2M 3 elements wafer level lens
|
·
|
For 1/5” 2M CIS (1.75μm pixel pitch)
|
|
·
|
Three-element and six-surface design for high-performance requirement
|
|
|
·
|
Double-side manufacture process
|
Core Technologies and Know-How
Driving System Technology.
Through our collaboration with panel manufacturers, we have developed extensive knowledge of circuit design, TFT-LCD driving systems, high-voltage processes and display systems, all of which are important to the design of high-performance TFT-LCD display drivers. Our engineers have in-depth knowledge of the driving system technology, which is the architecture for the interaction between the source driver, gate driver, timing controller and power systems as well as other passive components. We believe that our understanding of the entire driving system has strengthened our design capabilities. Our engineers are highly skilled in designing power efficient and compact display drivers that enhance the performance of TFT-LCD. We are leveraging our know-how of display drivers and driving system technology to develop display drivers for panels utilizing other technologies such as OLED.
High-Voltage CMOS Circuit Design.
Unlike most other semiconductors, TFT-LCD display drivers require a high output voltage of 3.3 to 50 volts. We have developed circuit design technologies using a high-voltage CMOS process that enables us to produce high-yield, reliable and compact drivers for high-volume applications. Moreover, our technologies enable us to keep the driving voltage at very high uniformity, which can be difficult to achieve when using standard CMOS process technology.
42
High-Bandwidth Interfaces.
In addition to high-voltage circuit design, TFT-LCD display drivers require high bandwidth transmission for video signals. We have applied several high-speed interfaces, including TTL, RSDS, mini-LVDS, DETTL, turbo RSDS and customized interfaces, in our display drivers. Moreover, we are developing additional driver interfaces for special applications with optimized speed, lower EMI and higher system stability.
Die Shrink and Low Power Technologies.
Our engineers are highly skilled in employing their knowledge of driving technology and high-voltage CMOS circuit design to shrink the die size of our display drivers while leveraging their understanding of driving technology and panel characteristics to design display drivers with low power consumption. Die size is an important consideration for applications with size constraints. Smaller die size also reduces the cost of the chip. Lower power consumption is important for many portable devices such as notebook computers, mobile handsets and consumer electronics products.
Customers
Our customers for display drivers are primarily panel manufacturers and mobile device module manufacturers, who in turn design and market their products to manufacturers of end-use products such as notebook computers, desktop monitors, televisions, mobile handsets and consumer electronics products. As of December 31, 2009, we sold our products to more than 100 customers. In 2007, 2008 and 2009, CMO and its affiliates accounted for 58.8%, 62.5% and
64.3
%
of ou
r revenues, respectively, and Samsung and its affiliates accounted for 3.7%, 6.5% and
7.2
% of our revenues, respectively. We expect that sales to
Chimei Innolux, as
CMO’s successor after its merger with Innolux and TPO, and Samsung and their respective affiliates, among other large customers, will continue to account for a substantial majority of our revenues in the near
term.
Set forth below (in alphabetical order) are our ten largest customers (and thei
r affiliates) based on revenues for the year ended December 31, 2009:
Chi Mei Optoelectronics Corp.
Chunghwa Picture Tubes, Ltd.
Funai Electric Co. Ltd.
HannStar Display Corporation
InfoVision Optoelectronics (Kunshan) CO., Ltd.
InnoLux Display Corporation
Perfect Display Limited
Samsung Electronics Taiwan Co., Ltd.
Taiwan Surface Mounting Technology Corp.
TPO Displays Corporation
Certain of our customers provide us with a long-term (twelve-month) forecast plus three-month rolling non-binding forecasts and confirm orders in about one month ahead of scheduled delivery. In general, purchase orders are not cancellable by either party, although from time to time we and our customers have agreed to amend the terms of such orders.
Sales and Marketing
We focus our sales and marketing strategy on establishing business and technology relationships principally with TFT-LCD panel manufacturers and also with panel manufacturers using LTPS or OLED technologies and also with mobile display module and mobile handset manufacturers in order to work closely with them on future semiconductor solutions that align with their product road maps. Our engineers collaborate with our customers’ engineers to create products that comply with their specifications and provide a high level of performance at competitive prices. Our end market for large-sized panels is concentrated around a limited number of major panel manufacturers. We have also commenced marketing our products directly to monitor, notebook and mobile device manufacturers so that our products can be qualified for their specifications and designed into their products.
We primarily sell our products through our direct sales teams located in Taiwan, China, South Korea and Japan. We also have dedicated sales teams for certain of our most important current or prospective customers. We have sales and technical support offices in T
ainan, Taiwan. We have regional offices in Hsinchu and Taipei, Taiwan; Foshan, Fuqing, Ningbo, Beijing, Shanghai, Shenzhen and Suzhou, China; Yokohama and Matsusaka, Japan; Cheonan-si, Chungcheongnam-do, South Korea; and Irvine, California, USA, all in close proximity to our customers. For certain products or regions we may from time to time sell our products through agents or
distributors.
43
Our sales and marketing team possesses a high level of technical expertise and industry knowledge used to support a lengthy and complex sales process. This includes a highly trained team of field applications engineers that provides technical support and assistance to potential and existing customers in designing, testing and qualifying display modules that incorporate our products. We believe that the depth and quality of this design support are key to improving customers’ time-to-market and maintaining a high level of customer satisfaction.
Manufacturing
We operate primarily in a fabless business model that utilizes substantially third-party foundry and assembly and testing capabilities. We leverage our experience and engineering expertise to design high-performance semiconductors and rely on semiconductor manufacturing service providers for wafer fabrication, gold bumping, assembly and testing. We also rely largely on third-party suppliers of processed tape used in TAB packaging. We engage foundries with high-voltage CMOS process technology for our display drivers and engage assembly and testing houses that specialize in TAB and COG packages, thereby taking advantage of the economies of scale and the specialization of such semiconductor manufacturing service providers. Our primarily fabless model enables us to capture certain financial and operational benefits, including reduced manufacturing personnel, capital expenditures, fixed assets and fixed costs. It also gives us the flexibility to use the technology and service providers that are the most suitable for any given product.
We operate a small fab under Himax Display primarily for performing certain manufacturing processes for our LCOS microdisplays. In order to further meet customers’ demand for higher quality, lower cost, and faster time-to-market, we have established an in-house color filter facility, which is scheduled to commence mass production in 2010. The color filter line is a critical and unique process for our proprietary single-panel color LCOS microdisplays. An in-house color filter facility enhances the competitiveness of our LCOS products and creates value for our customers. In addition, we have established an in-house wafer level optics facility, which commenced small-scale shipments in December 2009.
Manufacturing Stages
The diagram below sets forth the various stages in manufacturing display drivers according to the two different types of assembly utilized: TAB or COG. The assembly type depends primarily on the application and design of the panel and is determined by our customers.
44
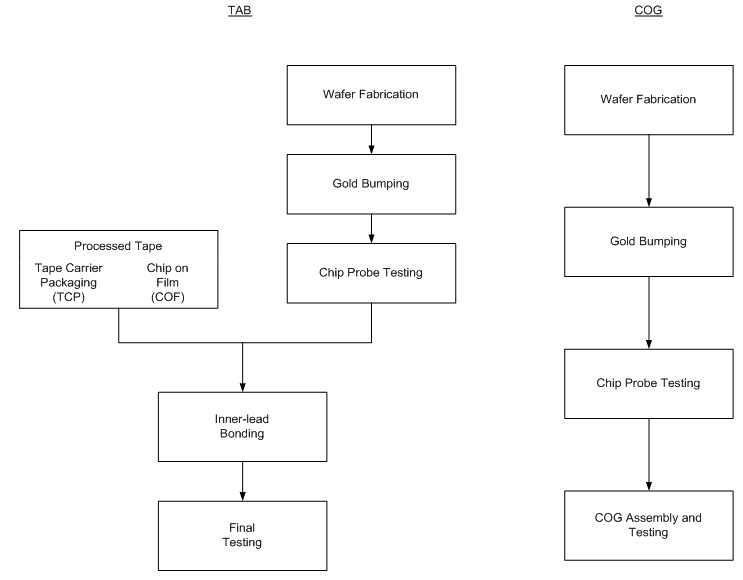
Wafer Fabrication
: Based on our design, the foundry provides us with fabricated wafers. Each fabricated wafer contains many chips, each known as a die.
Gold Bumping
: After the wafers are fabricated, they are delivered to gold bumping houses where gold bumps are plated on each wafer. The gold bumping process uses thin film metal deposition, photolithography and electrical plating technologies. The gold bumps are plated onto each wafer to connect the die to the processed tape, in the case of TAB package, or the glass, in the case of COG package.
Chip Probe Testing
: Each individual die is electrically tested, or probed, for defects. Dies that fail this test are discarded.
Assembly and Testing
: Our display drivers use two types of assembly technology: TAB or COG. Display drivers for large-sized applications typically require TAB package types and to a lesser extent COG package types, whereas display drivers for mobile handsets and consumer electronics products typically require COG package types.
TAB Assembly
We use two types of TAB technologies: TCP and COF. TCP and COF packages are both made of processed tape that is typically 35mm or 48mm wide, plated with copper foil and has a circuit formed within it. TCP and COF packages differ, however, in terms of their chip connections. With TCP packages, a hole is punched through the processed tape in the area of the chip, which is connected to a flying lead made of copper. In contrast, with COF packages, the lead is mounted directly on the processed tape and there is no flying lead. In recent years, COF packages have become predominantly used in TAB technology.
45
|
·
|
Inner-Lead Bonding
: The TCP and COF assembly process involves grinding the bumped wafers into their required thickness and cutting the wafers into individual dies, or chips. An inner lead bonder machine connects the chip to the printed circuit processed tape and the package is sealed with resin at high temperatures.
|
|
·
|
Final Testing
: The assembled display drivers are tested to ensure that they meet performance specifications. Testing takes place on specialized equipment using software customized for each product.
|
COG Assembly
COG assembly connects display drivers directly to LCD panels without the need for processed tape. COG assembly involves grinding the tested wafers into their required thickness and cutting the wafers into individual dies, or chips. Each individual die is picked and placed into a chip tray and is then visually or auto-inspected for defects. The dies are packed within a tray in an aluminum bag after completion of the inspection process.
Quality Assurance
We maintain a comprehensive quality assurance system. Using a variety of methods from conducting rigorous simulations during the circuit design process to evaluating supplier performance at various stages of our products’ manufacturing process, we seek to bring about improvements and achieve customer satisfaction. In addition to monitoring customer satisfaction through regular reviews, we implement extensive supplier quality controls so that the products we outsource achieve our high standards. Prior to engaging a third party as our supplier, we perform a series of audits on their operations, and upon engagement, we hold frequent quality assurance meetings with our suppliers to evaluate such factors as product quality, production costs, technological sophistication and timely delivery.
In November 2002, we received ISO 9001 certification, which was renewed in February 2008 and will expire in February 2011. In February 2006, we received ISO 14001:2004 certification, which was renewed in February 2009 and will expire in February 2012. In addition, in March 2007, we received IECQ QC 080000 certification, which was renewed in March 2010 and will expire in March 2013, and OHSAS 18001:2007 certification, which was renewed in February 2009 and will expire in February 2012.
Semiconductor Manufacturing Service Providers and Suppliers
Through our relationships with leading foundries, assembly, gold bumping and testing houses and processed tape suppliers, we believe we have established a supply chain that enables us to deliver high-quality products to our customers in a timely manner.
Access to semiconductor manufacturing service providers is critical as display drivers require high-voltage CMOS process technology and specialized assembly and testing services, all of which are different from industry standards. We have obtained our foundry services from TSMC, Vanguard, Macronix, Lite-on, Globalfoundries Singapore, SMIC and Maxchip in the past few years and have also recently established relationships with UMC and HHNEC. These are among a select number of semiconductor manufacturers that provide high-voltage CMOS process technology required for manufacturing display drivers. We engage assembly and testing houses that specialize in TAB and COG packages such as Chipbond, ChipMOS Technologies Inc., and Siliconware Precision Industries Co., Ltd.
We plan to strengthen our relationships with our existing semiconductor manufacturing service providers and diversify our network of such service providers in order to ensure access to sufficient cost-competitive and high-quality manufacturing capacity. We are selective in our choice of semiconductor manufacturing service providers. It takes a substantial amount of time to qualify alternative foundries, gold bumping, assembly and testing houses for production. As a result, we expect that we will continue to rely on limited number of semiconductor manufacturing service providers for a substantial portion of our manufacturing requirements in the near future.
46
The table below sets forth (in alphabetical order) our principal semiconductor manufacturing service providers and suppliers:
|
Wafer Fabrication
|
Gold Bumping
|
|
|
Globalfoundries Singapore Pte., Ltd. (formerly Chartered Semiconductor Manufacturing Ltd.)
|
Chipbond Technology Corporation
(1)
|
|
|
Lite-on Semiconductor Corp.
|
Chipmore International Trading Company Limited
|
|
|
Macronix International Co., Ltd.
|
Chipmore Technology Co., Ltd.
|
|
|
Maxchip Electronics Corp.
|
ChipMOS Technologies Inc.
|
|
|
Shanghai Hua Hong NEC Electronics Company, Ltd.
|
Siliconware Precision Industries Co., Ltd.
|
|
|
Silicon Manufacturing Partners Pte., Ltd.
|
||
|
Taiwan Semiconductor Manufacturing Company Limited
|
||
|
United Microelectronics Corporation
|
||
|
Vanguard International Semiconductor Corporation
|
|
Processed Tape for TAB Packaging
|
Assembly and Testing
|
|
|
Hitachi Cable Asia, Ltd. Taipei Branch
|
Ardentec Corporation
|
|
|
Mitsui Micro Circuits Taiwan Co., Ltd.
|
Chipbond Technology Corporation
(1)
|
|
|
Samsung Techwin Co., Ltd.
|
Chipmore International Trading Company Limited
|
|
|
Simpal Electronics Co., Ltd.
|
Chipmore Technology Co., Ltd.
|
|
|
Sumitomo Metal Mining Package Material Co., Ltd.
|
ChipMOS Technologies Inc.
|
|
|
Global Testing Corporation
|
||
|
Greatek Electronics Inc.
|
||
|
King Yuan Electronics Co., Ltd.
|
||
|
Siliconware Precision Industries Co., Ltd.
|
||
|
Taiwan IC Packaging Corporation
|
|
Chip Probe Testing
|
|
|
Ardentec Corporation
|
|
|
Chipbond Technology Corporation
(1)
|
|
|
Chipmore International Trading Company Limited
|
|
|
Chipmore Technology Co., Ltd.
|
|
|
ChipMOS Technologies Inc.
|
|
|
Global Testing Corporation
|
|
|
Greatek Electronics Inc.
|
|
|
King Yuan Electronics Co., Ltd.
|
|
|
Siliconware Precision Industries Co., Ltd.
|
|
Note:
|
(1)
|
Chipbond Technology Corporation and International Semiconductor Technology Ltd. were both among our principal providers of gold bumping, assembly and testing and chip probe testing services in 2009. These two companies merged on April 1, 2010. Chipbond is the surviving company following the merger.
|
Intellectual Property
As of May 31, 2010, we held a total of
645 patents, including 260
in Taiwan, 230 in the United States, 131 in China, 15 in Korea and 9 in Japan. The expiration dates of our patents range from 2019 to 20
29
. We also have a total of 846 pending patent applications in Taiwan, 640 in the United States and 549 in other jurisdictions, including the PRC, Japan, Korea and Europe. In addition, we have registered “Himax” and our lo
go as a trademark and service mark in Taiwan, China, Europe, Singapore, Korea and Japan and the United States.
Competition
The markets for our products are, in general, intensely competitive, characterized by continuous technological change, evolving industry standards, and declining average selling prices. We believe key factors that differentiate among the competition in our industry include:
|
·
|
customer relations;
|
47
|
·
|
product performance;
|
|
·
|
design customization;
|
|
·
|
development time;
|
|
·
|
product integration;
|
|
·
|
technical services;
|
|
·
|
manufacturing costs;
|
|
·
|
supply chain management;
|
|
·
|
economies of scale; and
|
|
·
|
broad product portfolio.
|
We continually face intense competition from fabless display driver companies, including Fitipower Integrate
d Technology, Inc., Ili Technology Corp., Lusem Co., Ltd, Novatek Microelectronics Corp., Ltd., Orise Technology Co., Ltd., Raydium Semiconductor Corporation, Sitronix Technology Co., Ltd. and Solomon Systech Limited. We also face competition from integrated device manufacturers, such as MagnaChip Semiconductor Ltd., Panasonic Corporation, NEC Electronics Corporation,
Renesas Technology Corp., Seiko Epson Corporation, Toshiba Corporation, Sanyo Electric Co., Ltd. and Rohm Co., Ltd. and panel manufacturers with in-house semiconductor design capabilities, such as Samsung Electronics Co., Ltd. and Sharp Corporation. The latter are both our competitors and customers.
Many of our competitors, some of which are affiliated or have established relationships with other panel manufacturers, have longer operating histories, greater brand recognition and significantly greater financial, manufacturing, technological, sales and marketing, human and other resources than we do. Additionally, we expect that as the flat panel semiconductor industry expands, more companies may enter and compete in our markets.
Our television semiconductor solutions compete against solutions offered by a significant number of semiconductor companies including Broadcom Corporation, Huaya Microelecronics Inc., Mediatek Corp., MStar Semiconductor, Inc., Novatek Microelectronics Corp., NXP Semiconductor, Realtek Semiconductor Corp., STMicroelectronics, Sunplus Technology Co., Trident Microsystems, Inc. and Zoran Corporation, among others, some of which focus solely on video processors or digital TV solutions and others that offer a more diversified portfolio. For 2D to 3D conversion solutions, we face competition from Dynamic Digital Depth Group plc, Prime Focus Ltd., In-three, Inc. and Sassoon Film Design.
For LCOS products, we face competition primarily from digital lighting processing, or DLP, projectors incorporating Texas Instruments Incorporated’s digital light processing technology. We also face competition from a few other mobile projector technologies, including Micron Technology (which acquired Displaytech Inc. in 2009 for its color-sequential ferroelectric liquid crystal on silicon, or FLCOS, projectors), Syndiant Inc., and Microvision, Inc., a company providing laser-scanning projector solutions.
For power ICs, we face competition from Taiwan companies including Richtek Technology Corporation, Global Mixed-mode Technology Inc., and Advanced Analog Technology, Inc. We also compete with worldwide suppliers such as Maxim Integrated Products, Inc.,
Texas Instruments Incorporated
and Rohm Co., Ltd.
For CMOS image sensor products, we face competition primarily from Aptina Imaging Corporation, Omnivision Technologies Inc., Samsung Electronics Co. Ltd., Sony Corporation and STMicroelectronics.
For wafer level optics products, we face competition primarily from Visera Technologies Company Ltd., Heptagon, Anteryon, Nemotek Technologies and Q-Technology Ltd.
48
Insurance
We maintain insurance policies on our buildings, equipment and inventories covering property damage and damage due to, among other events, fires, typhoons, earthquakes and floods. We maintain these insurance policies on our facilities and on transit of inventories. Additionally, we maintain director and officer liability insurance. We do not have insurance for business interruptions, nor do we have key person insurance.
Environmental Matters
The business of semiconductor design does not cause any significant pollution. Himax Taiwan maintains a color filter facility and a wafer level optics facility and Himax Display maintains a facility for our LCOS products, where we have taken the necessary steps to obtain the appropriate permits and believe that we are in compliance with the existing environmental laws and regulations in the ROC. We have entered into various agreements with certain customers whereby we have agreed to indemnify them, and in certain cases, their customers, for any claims made against them for hazardous material violations that are found in our products.
4.C. Organizational Structure
The following chart sets forth our corporate structure and ownership interest in each of our principal operating subsidiaries and affiliates as of May 31, 2010.
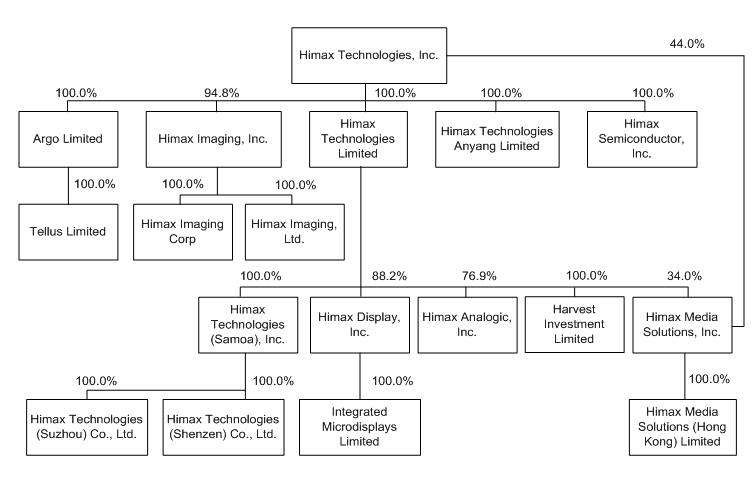
49
The following table sets forth summary information for our subsidiaries as of
May 31
, 2010.
|
Subsidiary
|
Main Activities
|
Jurisdiction of
Incorporation
|
Total Paid-in
Capital
|
Percentage of
Our Ownership
Interest
|
||||||
|
$ (in millions)
|
||||||||||
|
Himax Technologies Limited
|
IC design and sales
|
ROC
|
83.7
|
100.0%
|
||||||
|
Himax Technologies Anyang Limited
|
Sales
|
South Korea
|
0.5
|
100.0%
|
||||||
|
Himax Semiconductor, Inc. (formerly Wisepal Technologies, Inc.)
|
IC design and sales
|
ROC
|
11.4
|
100.0%
|
||||||
|
Himax Technologies (Samoa), Inc.
|
Investments
|
Samoa
|
2.5
|
100.0%
|
( 1) | |||||
|
Himax Technologies (Suzhou) Co., Ltd.
|
Sales
|
PRC
|
1.0
|
100.0%
|
(2) | |||||
|
Himax Technologies (Shenzhen) Co., Ltd.
|
Sales
|
PRC
|
1.5
|
100.0%
|
(2) | |||||
|
Himax Display, Inc.
|
IC design, manufacturing and sales
|
ROC
|
39.1
|
88.2%
|
(1) | |||||
|
Integrated Microdisplays Limited
|
IC design and sales
|
Hong Kong
|
1.1
|
88.2%
|
(3) | |||||
|
Himax Analogic, Inc.
|
IC design and sales
|
ROC
|
13.3
|
76.9%
|
(1) | |||||
|
Himax Imaging, Inc.
|
Investments
|
Cayman Islands
|
17.5
|
94.8%
|
||||||
|
Himax Imaging, Ltd.
|
IC design and sales
|
ROC
|
9.6
|
94.8%
|
(4) | |||||
|
Himax Imaging Corp.
|
IC design and sales
|
California, USA
|
8.2
|
94.8%
|
(4) | |||||
|
Argo Limited
|
Investments
|
Cayman Islands
|
9.0
|
100.0%
|
||||||
|
Tellus Limited
|
Investments
|
Cayman Islands
|
9.0
|
100.0%
|
(5) | |||||
|
Himax Media Solutions, Inc.
|
TFT-LCD television and monitor chipset operations
|
ROC
|
34.2
|
78.0%
|
(6) | |||||
|
Himax Media Solutions (Hong Kong) Limited
|
Investments
|
Hong Kong
|
0.0
|
(8) |
78.0%
|
(7) | ||||
|
Harvest Investment Limited
|
Investments
|
ROC
|
1.6
|
100.0%
|
1) | |||||
|
(1)
|
Indirectly, through our 100.0% ownership of Himax Technologies Limited.
|
|
(2)
|
Indirectly, through our 100.0% ownership of Himax Technologies (Samoa), Inc.
|
|
(3)
|
Indirectly, through our 88.2% ownership of Himax Display, Inc.
|
|
(4)
|
Indirectly, through our 94.8% ownership of Himax Imaging, Inc.
|
|
(5)
|
Indirectly, through our 100.0% ownership of Argo Limited.
|
|
(6)
|
Directly, as to 44.0%, and indirectly, as to 34.0% through our 100.0% ownership of Himax Technologies Limited.
|
|
(7)
|
Indirectly, through our 78.0% ownership of Himax Media Solutions, Inc.
|
|
(8)
|
Total paid-in capital is HK$10,000.
|
50
4.D. Property, Plants and Equipment
Our corporate headquarters are located at a 22,172 square meter facility within the Tree Valley Industrial Park in Tainan, Taiwan. The facility houses our research and development, engineering, sales and marketing, operations and general administrative staff. Construction of the facility was completed in October 2006, and the total land and construction costs amounted to approximately $25.8 million.
We also lease office space in Taipei and Hsinchu, Taiwan;
Suzhou, Shenzhen, Foshan, Fuqing, Beijing, Shanghai and Ningbo, China; Yokohama and Matsusaka, Japan; Cheonan-si, Chungcheongnam-do, South Korea; and Irvine, California, USA. In June 2008, we completed the relocation of the Taipei offices of our company, Himax Media Solutions and Himax Analogic. The lease contracts may be renewed upon expiration.
We own and operate under Himax Display a fab with 3,040 square meters of floor space in a building leased fr
om Chimei Innolux.
We have also established under Himax Taiwan an in-house wafer level optics facility, with 1,171 square meters of floor space in a building leased fr
om Chimei Innolux,
which commenced small-scale shipments in December 2009.
In addition, Himax Taiwan
owns and operates a fab with 1,431 square meters of floor space in a building leased fr
om Chimei Innolux
in Tainan
, where
it established an in-house color filter facility. The color filter line is a critical and unique process for our proprietary single-panel color LCOS microdisplays. An in-house color filter facility enhances the competitiveness of our LCOS products and creates value for our customers.
Not applicable.
5.A. Operating Results
Overview
We design, develop and market semiconductors that are critical components of flat panel displays. Our principal products are display drivers for large-sized TFT-LCD panels, which are used in desktop monitors, notebook computers and televisions, and display drivers for small and medium-sized TFT-LCD panels, which are used in mobile handsets and consumer electronics products such as netbook computers, digital cameras, mobile gaming devices, portable DVD players, digital photo frame and car navigation displays. We also offer display drivers for panels using OLED technology and LTPS technology. In addition, we are expanding our product offerings to include non-driver products such as timing controllers, TFT-LCD television and monitor chipsets, LCOS projector solutions, power ICs, CMOS image sensors and wafer level optics products. We primarily sell our display drivers to TFT-LCD panel manufacturers and mobile device module manufacturers, and we sell our television semiconductor solutions to television makers.
We commenced operations through our predecessor, Himax Taiwan, in June 2001. We must, among other things, continue to expand and diversify our customer base, broaden our product portfolio, achieve additional design wins and manage our costs to partially mitigate declining average selling prices in order to maintain our profitability. Moreover, we must continue to address the challenges of being a growing technology company, including hiring and retaining managerial, engineering, operational and financial personnel and implementing and improving our existing administrative, financial and operations systems.
We operate primarily in a fabless business model that utilizes substantially third-party foundry and assembly and testing capabilities. We leverage our experience and engineering expertise to design high-performance semiconductors and rely largely on third-party semiconductor manufacturing service providers for wafer fabrication, gold bumping, assembly and testing. We are able to take advantage of the economies of scale and the specialization of such semiconductor manufacturing service providers. Our primarily fabless model enables us to capture certain financial and operational benefits, including reduced manufacturing personnel, capital expenditures, fixed assets and
fixed costs. It also gives us the flexibility to use the technology and service providers that are the most suitable for any given product.
51
As our semiconductors are critical components of flat panel displays, our industry is closely linked to the trends and developments of the flat panel display industry, in particular, the TFT-LCD panel segment. Substantially all of our revenues in 2009 were derived from sales of display drivers that were eventually incorporated into TFT-LCD panels. We expect display drivers for TFT-LCD panels to continue to be our primary products. The TFT-LCD panel industry is intensely competitive and is vulnerable to cyclical market conditions. The average selling prices of TFT-LCD panels could decline for numerous reasons, which could in turn result in downward pricing pressure on our products. See “Item 3.D. Key Information—Risk Factors—Risks Relating to Our Financial Condition and Business—We derive substantially all of our net revenues from sales to the TFT-LCD panel industry, which is highly cyclical and subject to price fluctuations. Such cyclicality and price fluctuations could negatively impact our business or results of operations.”
Factors Affecting Our Performance
Our business, financial position and results of operations, as well as the period-to-period comparability of our financial results, are significantly affected by a number of factors, some of which are beyond our control, including:
|
·
|
average selling prices;
|
|
·
|
unit shipments;
|
|
·
|
product mix;
|
|
·
|
design wins;
|
|
·
|
cost of revenues and cost reductions;
|
|
·
|
supply chain management;
|
|
·
|
share-based compensation expenses;
|
|
·
|
signing bonuses; and
|
|
·
|
tax exemptions.
|
Average Selling Prices
Our performance is affected by the selling prices of each of our products. We price our products based on several factors, including manufacturing costs, life cycle stage of the product, competition, technical complexity of the product, size of the purchase order and our relationship with the customer. We typically are able to charge the highest price for a product when it is first introduced. Although from time to time we are able to raise our selling prices during times of supply constraints, our average selling prices typically decline over a product’s life cycle, which may be offset by changes in conditions in the semiconductor industry such as constraints in foundry capacity. The general trend in the semiconductor industry is for the average selling prices of semiconductors to decline over a product’s life cycle due to competition, production efficiencies, emergence of substitutes and technological obsolescence. Our cost reduction efforts also contribute to this decline in average selling prices. See “—Cost of Revenues and Cost Reductions.”
Our average selling prices are also affected by the cyclicality of the TFT-LCD panel industry. Any downward pricing pressure on TFT-LCD panel manufacturers could result in similar downward pricing pressure on us.
During periods of declining average selling prices for TFT-LCD panels, TFT-LCD panel manufacturers may also decrease capacity utilization and sell fewer panels, which could depress demand for our display drivers. For example, in the second half of 2008, as a result of the severe economic downturn and the weakening of consumer spending, there was an over-supply of large-sized TFT-LCD panels. Many TFT-LCD panel manufacturers experienced a decrease in prices of large-sized TFT-LCD panels and reduced capacity utilization significantly, which in turn resulted in strong downward pricing pressure on and a decrease in demand for our products, particularly in late 2008 and early 2009.
52
While there was a rebound in demand for TFT-LCD panels in the second quarter of 2009, the growth in output of TFT-LCD panels has been limited by the shortage of certain components for TFT-LCD panels. Our product pricing remained weak in 2009
. In addition, our average selling prices are affected by the size and bargaining power of our customers. The merger of CMO, Innolux and TPO could negatively affect our ability to maintain, if not raise, our selling prices. Our average selling prices are also affected by the packaging type our customers choose as well as the level of product integration. However, the impact of declining average selling prices on our profitability might be offset or mitigated to a certain extent by increased volume, as lower prices may then stimulate demand and thereby drive sales.
Unit Shipments
Our performance is also affected by the number of semiconductors we ship, or unit shipments. As our display drivers are critical components of flat panel displays, our unit shipments depend primarily on our customers’ panel shipments among other factors. Our unit shipments have grown since our inception primarily as a result of our increased market share with certain major customers and their increased shipments of panels. Our growth in unit shipments also reflected the demand for higher resolution panels which typically require more display drivers. However, the development of higher channel display drivers or new technologies, if successful, could potentially reduce the number of display drivers required for each panel while achieving the same resolution. If such technologies become commercially available, the market for our display drivers will be reduced and we could experience a decline in revenue and profit.
Product Mix
The proportion of our revenues that is generated from the sale of different product types, also referred to as product mix, also affects our average selling prices, revenues and profitability. Our products vary depending on, among other things, the number of output channels, the level of integration and the package type. Variations in each of these specifications could affect the average selling prices of such products. For example, the trend for display drivers for use in large-sized panels is toward products with a higher number of channels, which typically command higher average selling prices than traditional products with a lower number of channels. However, panels that use higher-channel display drivers typically require fewer display drivers per panel. As a result, our profitability will be affected adversely to the extent that the decrease in the number of display drivers required for each panel is not offset by increased total unit shipments and/or higher average selling prices for display drivers with a higher number of channels. The level of integration of our display drivers also affects average selling prices, as more highly integrated chips typically have higher selling prices. Additionally, average selling prices are affected by changes in the package types used by our customers. For example, the chip-on-glass package type typically has lower material costs because no processed tape is required.
Design Wins
Achieving design wins is important to our business, and it affects our unit shipments. Design wins occur when a customer incorporates our products into their product designs. There are numerous opportunities for design wins, including, but not limited to, when panel manufacturers:
|
·
|
introduce new models to improve the cost and/or performance of their existing products or to expand their product portfolio;
|
|
·
|
establish new fabs and seek to qualify existing or new components suppliers; and
|
|
·
|
replace existing display driver companies due to cost or performance reasons.
|
Design wins are not binding commitments by customers to purchase our products. However, we believe that achieving design wins is an important performance indicator. Our customers typically devote substantial time and resources to designing their products as well as qualifying their component suppliers and their products. Once our products have been designed into a system, the customer may be reluctant to change its component suppliers due to the significant costs and time associated with qualifying a new supplier or a replacement component. Therefore, we strive to work closely with current and prospective customers in order to anticipate their requirements and product road maps and achieve additional design wins.
53
Cost of Revenues and Cost Reductions
We strive to control our cost of revenues. Our cost of revenues as a percentage of total revenues in 2007, 2008 and 2009 was 78.0%, 75.5% and
79.5
%, respectively. In 2009, as a percentage of Himax Taiwan’s total manufacturing costs, the cost of wafer fabrication was
51.0
%, the cost of processed tape was
16.3
%, and the cost of assembly and testing was
32.3
%. As a result, our ability to manage our wafer fabrication costs, costs for processed tape and assembly and testing costs is critical to our performance. In addition, to mitigate declining average selling prices, we aim to reduce unit costs by, among other things:
|
·
|
improving product design (e.g., having smaller die size allows for a larger number of dies on each wafer, thereby reducing the cost of each die);
|
|
·
|
improving manufacturing yields through our close collaboration with our semiconductor manufacturing service providers; and
|
|
·
|
achieving better pricing from a diversified pool of semiconductor manufacturing service providers and suppliers, reflecting our ability to leverage our scale, volume requirements and close relationships as well as our strategy of sourcing from multiple service providers and suppliers.
|
Our cost of revenues may increase as a result of any failure to obtain sufficient foundry, assembly or testing capacity or any shortage of processed tape. Our cost of revenues is also affected by any changes in the competitive landscape and the bargaining power of our suppliers. There has been an increased level of industry consolidation among our suppliers since late 2009. As announced in September 2009 and completed in January 2010, Chartered Semiconductor Manufacturing Ltd., one of our foundry service providers, merged with Globalfoundries, one of the world’s largest semiconductor foundries. As announced in December 2009, Chipbond and IST, both among our principal providers of gold bumping, assembly and testing and chip probe testing services, also recently completed their merger on April 1, 2010. Such industry consolidation could result in an increase in bargaining power of our suppliers and increase the unit cost of products and services provided by them.
Supply Chain Management
Due to the competitive nature of the flat panel display industry and our customers’ need to maintain high capacity utilization in order to reduce unit costs per panel, any delays in the delivery of our products could significantly disrupt our customers’ operations. To deliver our products on a timely basis and meet the quality standards and technical specifications our customers require, we must have assurances of high-quality capacity from our semiconductor manufacturing service providers. We therefore strive to manage our supply chain by maintaining close relationships with our key semiconductor manufacturing service providers and strive to provide credible forecasts of capacity demand. Since the first quarter of 2010, foundry, assembly and testing capacity and processed tape supply have been tight. Any disruption to our supply chain could adversely affect our performance and could result in a loss of customers as well as potentially damage our reputation.
Share-Based Compensation Expenses
Our results of operations have been affected by, and we expect our results of operations to continue to be affected by, our share-based compensation expenses, which consist of charges taken relating to grants of mainly RSUs as well as nonvested shares to employees.
We adopted a long-term incentive plan in October 2005 which permits the grant of options or RSUs to our employees and non-employees where each unit represents two ordinary shares. The actual awards will be determined by our compensation committee. We recorded share-based compensation expenses under the long-term incentive plan totaling $20.1 million, $20.8 million and $
14.1
million in 2007, 2008 and 2009, respectively. See “—Critical Accounting Policies and Estimates—Share-Based Compensation Expenses.” Of the total share-based compensation expenses recognized, $14.4 million, $12.7 million and $
6.5
million in 2007, 2008 and 2009, respectively, were settled in cash. We have applied Accounting Standards Codification, or ASC, ASC 718,
Compensation—Stock Compensation
, to account for our share-based compensation plans. ASC 718 requires companies to measure and recognize compensation expense for all share-based payments at fair value.
54
Set forth below is a summary of our historical share-based compensation plans for the years ended December 31, 2007, 2008 and 2009 as reflected in our consolidated financial statements.
Restricted Share Units (RSUs).
We adopted a long-term incentive plan in October 2005.
We made grants of 6,694,411 RSUs to our employees on September 26, 2007. The vesting schedule for such RSU grants is as follows: 54.55% of the RSU grants vested immediately and was settled by cash in the amount of $14.4 million on the grant date, with the remainder vesting equally on each of September 30, 2008, 2009 and 2010, which have been or will be settled by our ordinary shares, subject to certain forfeiture events.
We made grants of 7,108,675 RSUs to our employees on September 29, 2008. The vesting schedule for such RSU grants is as follows: 60.64% of the RSU grants vested immediately and was settled by cash in the amount of $12.7 million on the grant date, with the remainder vesting equally on each of September 30, 2009, 2010 and 2011, which has been or will be settled by our ordinary shares, subject to certain forfeiture events.
We made grants of 3,577,686 RSUs to our employees on September 28, 2009. The vesting schedule for such RSU grants is as follows: 55.96% of the RSU grants vested immediately and was settled by cash in the amount of $6.5 million on the grant date, with the remainder vesting equally on each of September 30, 2010, 2011 and 2012, which will be settled by our ordinary shares, subject to certain forfeiture events.
The amount of share-based compensation expense with regard to the RSUs granted to our employees on September 26, 2007, September 29, 2008 and September 28, 2009 was $3.95, $2.95 and $3.25 per ordinary share, respectively, which was based on the trading price of our ADSs on that day.
Determining the fair value of our ordinary shares prior to our initial public offering requires making complex and subjective judgments regarding projected financial and operating results, our business risks, the liquidity of our shares and our operating history and prospects. We used the discounted cash flow approach in conjunction with the market value approach by assigning a different weight to each of the approaches to estimate the value of our company when the RSUs were granted. The discounted cash flow approach involves applying appropriate discount rates to estimated cash flows that are based on earnings forecasts. The market value approach incorporates certain assumptions including the market performance of comparable companies as well as our financial results and growth trends to derive our total equity value. The assumptions used in deriving the fair value are consistent with our business plan. These assumptions include: no material changes in the existing political, legal, fiscal and economic conditions in Taiwan; our ability to retain competent management, key personnel and technical staff to support our ongoing operation; and no material deviation in industry trends and market conditions from economic forecasts. These assumptions are inherently uncertain. The risks associated with achieving our forecasts were assessed in selecting the appropriate discount rate. If a different discount rate were used, the valuation and the amount of share-based compensation would have been different because the fair value of the underlying ordinary shares for the RSUs granted would be different.
Signing Bonuses
To complement our share-based compensation scheme, Himax Taiwan adopted a signing bonus system for newly recruited employees in the second half of 2006.
Employees are entitled to receive signing bonuses upon (i) the expiration of their probationary period and a satisfactory review by their supervisor, and (ii) execution of a formal “retention and signing bonus agreement.” If an employee leaves within 18 months (for any reason at all) of having commenced employment with Himax Taiwan, 100% of the signing bonus will be returned. If an employee leaves after 18 months but prior to 36 months after commencing employment with Himax Taiwan, 50% of the signing bonus will be returned.
In 2007, 2008 and 2009,
Himax Taiwan
pai
d $2.6 million, $2.7 million and $
0.5
million, respectively, in signing bonuses which were charged to earnings. Besides Himax Taiwan, signing bonuses were adopted by four, six and
six
subsidiaries in 2007, 2008 and 2009, respectively, and a total of $0.6 million, $1.0 million and $
0.4 million
, respectively, were paid to certain employees of our subsidiaries.
55
Tax Credits and Exemptions
Our results of operations have been affected by, and we expect our results of operations to continue to be affected by, tax credits and income tax exemptions available to us.
The ROC Statute for Upgrading Industries, which expired at the end of 2009, entitled companies to tax credits for expenses relating to qualifying research and development, personnel training and purchases of qualifying machinery. The tax credits could be applied within a five-year period. The amount of tax credit that could be applied in any year is limited to 50% of the income tax payable for that year (with the exception of the final year when the remainder of the tax credit may be applied without limitation to the total amount of the income tax). Under the ROC Statute for Upgrading Industries, Himax Taiwan was granted tax credits by the ROC Ministry of Finance at rates set at a certain percentage of the amount utilized in qualifying research and development, personnel training expenses and purchases of qualifying machinery. The balance of unused investment tax credits totaled $32.7 million, $46.8 million and $
55.3
million as of December 31, 2007, 2008 and 2009, respectively. On May 12, 2010, the Industrial Innovation Act was promulgated in the ROC, which became effective on the same date except for the provision relating to tax incentives which went into effect retroactively on January 1, 2010. Compared to the ROC Statute for Upgrading Industries, the Industrial Innovation Act provides for a smaller amount of tax credits. The Industrial Innovation Act entitles companies to tax credits for research and development expenses related to innovation activities but limits the amount of tax credit to only up to 15% of the total research and development expenditure for the current year, subject to a cap of 30% of the income tax payable for the current year. Moreover, any unused tax credits provided under the Industrial Innovation Act may not be carried forward. As a result, beginning in 2010, we expect to have a smaller amount of tax credits under the Industrial Innovation Act than would have been available under the ROC Statute for Upgrading Industries.
The ROC Statute for Upgrading Industries provided to companies deemed to be operating in important or strategic industries a five-year tax exemption for income attributable to expanded production capacity or newly developed technologies. Such expanded production capacity or newly developed technologies must be funded in whole or in part from either the initial capital investment made by a company’s shareholders, a subsequent capital increase or a capitalization of a company’s retained earnings. As a result of this statute, income attributable to certain of Himax Taiwan’s expanded production capacity is tax exempt for a period of five years,
effective on April 1, 2004, January 1, 2006 and January 1, 2008 and expiring on March 31, 2009, December 31, 2010 and December 31, 2012, respectively
. In addition, beginning January 1, 2009, Himax Semiconductor has also become entitled to a five-year tax exemption expiring on December 31, 2013.
While the ROC Statute for Upgrading Industries expired at the end of 2009, under a grandfather clause we can continue to enjoy the five-year tax holiday since the relevant investment plans were approved by the ROC tax authority before the expiration of the Statute.
Based on the ROC statutory income tax rate of 25%, the effect of such tax exemption was an increase on net income and basic and diluted earnings per share attributable to our stockholders of $27.1 million, $0.07and $0.07, respectively, for the year ended December 31, 2007, $25.2 million, $0.07 and $0.07, respectively, for the year ended December 31, 2008, and $9.4 million, $0.03 and $0.03, respectively, for the year ended December 31, 2009. As the tax exemption that expired on March 31, 2009 and the tax exemption that is scheduled to expire on December 31, 2010 account for a substantial portion of our total tax-exempted income under the ROC Statute for Upgrading Industries, our income tax expenses increased significantly in 2009 and may continue to increase significantly in the future. No such tax exemption is provided for under the newly adopted Industrial Innovation Act.
Revenues
We generate revenues primarily from sales of our display drivers. We have achieved significant revenue growth since our inception, due primarily to a significant increase in unit shipments, partially offset by the general trend of declining average selling prices of our products. Historically, we have generated revenues from sales of display drivers for large-sized applications, display drivers for mobile handsets and display drivers for consumer electronics products. In addition, our product portfolio includes operational amplifiers, timing controllers, TFT-LCD television and monitor chipsets, LCOS projector solutions, power ICs, CMOS image sensors and wafer level optics products.
56
The following table sets forth, for the periods indicated, our revenues by amount and our revenues as a percentage of revenues by each product line:
|
Year Ended December 31,
|
||||||||||||||||||||||||
|
2007
|
2008
|
2009
|
||||||||||||||||||||||
|
Amount
|
Percentage of
Revenues
|
Amount
|
Percentage of
Revenues
|
Amount
|
Percentage of
Revenues
|
|||||||||||||||||||
|
(in thousands, except percentages)
|
||||||||||||||||||||||||
|
Display drivers for large-sized applications
|
$ | 752,196 | 81.9 | % | $ | 651,504 | 78.2 | % | $ | 493,513 | 71.3 | % | ||||||||||||
|
Display drivers for mobile handsets applications
|
75,704 | 8.2 | 57,274 | 6.9 | 69,081 | 10.0 | ||||||||||||||||||
|
Display drivers for consumer electronics applications
|
66,634 | 7.3 | 81,866 | 9.8 | 83,527 | 12.1 | ||||||||||||||||||
|
Others
(1)
|
23,677 | 2.6 | 42,155 | 5.1 | 46,260 | 6.6 | ||||||||||||||||||
|
Total
|
$ | 918,211 | 100.0 | % | $ | 832,799 | 100.0 | % | $ | 692,381 | 100.0 | % | ||||||||||||
|
Note:
|
(1)
|
Includes, among other things, timing controllers, TFT-LCD television and monitor chipsets, LCOS projector solutions, power ICs, CMOS image sensors and wafer level optics products.
|
A limited number of customers account for substantially all our revenues. In each of 2007, 2008 and 2009, CMO and its affiliates accounted for over half of our revenues. The percentage of our total revenues generated from sales to CMO and its affiliates in 2007 and 2008 increased in those years as a result of its significant capacity expansion in 2007 and the first half of 2008. While sales to CMO and its affiliates decreased significantly in absolute terms in 2009 due to the impact of the global economic downturn, the percentage of our total revenues generated from sales to CMO and its affiliates continued to increase in 2009, primarily as a result of the significant decrease in sales in 2009 to SVA-NEC, our third largest customer in 2008. As the merger of CMO, Innolux and TPO was completed in March 2010, we expect to continue relying on sales to Chimei Innolux, the surviving entity following the merger, in 2010. The table below sets forth, for the periods indicated, our revenues generated from our most significant customers (including their respective affiliates) and such revenues as a percentage of our total revenues:
|
Year Ended December 31,
|
||||||||||||||||||||||||
|
2007
|
2008
|
2009
|
||||||||||||||||||||||
|
Amount
|
Percentage of
Revenues
|
Amount
|
Percentage of
Revenues
|
Amount
|
Percentage of
Revenues
|
|||||||||||||||||||
|
(in thousands, except percentages)
|
||||||||||||||||||||||||
|
CMO and its affiliates
(1)
|
$ | 539,737 | 58.8 | % | $ | 520,461 | 62.5 | % | $ | 445,245 | 64.3 | % | ||||||||||||
|
Samsung and its affiliates
|
34,375 | 3.7 | 54,138 | 6.5 | 50,184 | 7.2 | ||||||||||||||||||
|
CPT and its affiliates
|
66,694 | 7.3 | 32,673 | 3.9 | 17,023 | 2.5 | ||||||||||||||||||
|
SVA-NEC
|
76,774 | 8.4 | 52,101 | 6.3 | 3,365 | 0.5 | ||||||||||||||||||
|
Others
|
200,631 | 21.8 | 173,426 | 20.8 | 176,564 | 25.5 | ||||||||||||||||||
|
Total
|
$ | 918,211 | 100.0 | % | $ | 832,799 | 100.0 | % | $ | 692,381 | 100.0 | % | ||||||||||||
|
Note:
|
(1)
|
The above revenues from sales to CMO and its affiliates in 2007, 2008 and 2009 do not include any revenues from sales to Innolux or TPO or their respective affiliates. In 2007, 2008 and 2009, Innolux and its affiliates accounted for approximately 3.2%, 2.8% and 1.4% of our revenues, respectively, and TPO and its affiliates accounted for approximately 2.7%, 2.7% and 1.8% of our revenues, respectively.
|
SVA-NEC accounted for approximately 8.4%, 6.3% and 0.5% of our revenues in 2007, 2008 and 2009, respectively. As a result of its substantial reduction in fab utilization and its weak financial condition, our sales to SVA-NEC have decreased significantly since the fourth quarter of 2008 as compared to prior years. Beginning in March 2009, we have also required SVA-NEC to obtain guarantees by banks or third party customers in favor of us for the majority of new purchase orders. The sharp reduction in sales to SVA-NEC has had a negative and material impact on our business, results of operations, and financial condition in 2008 and 2009.
The global TFT-LCD panel market is highly concentrated, with only a limited number of TFT-LCD panel manufacturers producing large-sized TFT-LCD panels in high volumes. We sell large-sized panel display drivers to
57
many of these TFT-LCD panel manufacturers. Our revenues, therefore, will depend on our ability to capture an increasingly larger percentage of each panel manufacturer’s display driver requirements.
We derive substantially all of our revenues from sales to Asia-based customers whose end products are sold worldwide. In 2007, 2008 and 2009, approximately 85.5%, 77.6% and 79.2% of our revenues, respectively, were from customers headquartered in Taiwan. We believe that substantially all of our revenues will continue to be from customers located in Asia, where almost all of the TFT-LCD panel manufacturers and mobile device module manufacturers are located. As a result of the regional customer concentration, we expect to continue to be particularly subject to economic and political events and other developments that affect our customers in Asia. A substantial majority of our sales invoices are denominated in U.S. dollars.
Costs and Expenses
Our costs and expenses consist of cost of revenues, research and development expenses, general and administrative expenses, bad debt expense, sales and marketing expenses and share-based compensation expenses.
Cost of Revenues
The principal items of our cost of revenues are:
|
·
|
cost of wafer fabrication;
|
|
·
|
cost of processed tape used in TAB packaging;
|
|
·
|
cost of gold bumping, assembly and testing; and
|
|
·
|
other costs and expenses.
|
We outsource the manufacturing of our semiconductors and semiconductor solutions to semiconductor manufacturing service providers. The costs of wafer fabrication, gold bumping, assembly and testing depend on the availability of capacity and demand for such services. The wafer fabrication industry, in particular, is highly cyclical, resulting in fluctuations in the price of processed wafers depending on the available foundry capacity and the demand for foundry services.
Research and Development Expenses
Research and development expenses consist primarily of research and development employee salaries, including signing bonuses and related employee welfare costs, costs associated with prototype wafers, processed tape, mask and tooling sets, depreciation on research and development equipment and acquisition-related charges. We believe that we will need to continue to spend a significant amount on research and development in order to remain competitive. We expect to continue increasing our spending on research and development in absolute dollar amounts in the future as we continue to increase our research and development headcount and associated costs to pursue additional product development opportunities.
General and Administrative Expenses
General and administrative expenses consist primarily of salaries of general and administrative employees, including signing bonuses and related employee welfare costs, depreciation on buildings, office furniture and equipment, rent and professional fees. We anticipate that our general and administrative expenses will increase in absolute dollar amounts as we expand our operations, hire additional administrative personnel, incur depreciation expenses in connection with our headquarters at the Tree Valley Industrial Park, incur professional fees for filing patent applications and incur additional compliance costs required of a publicly listed company in the United States.
Bad Debt Expense
We evaluate our outstanding accounts receivable on a monthly basis for collectibility purposes. In establishing the required allowance, we consider our historical collection experience, current receivable aging and the current trend in the credit quality of our customers. We recognized bad debt expense of nil, $25.3 million, and $0.2 million
58
in 2007, 2008 and 2009, respectively. Our bad debt expense in 2008 related mainly to the uncollected accounts receivable outstanding from SVA-NEC.
Sales and Marketing Expenses
Our sales and marketing expenses consist primarily of salaries of sales and marketing employees, including signing bonuses and related employee welfare costs, amortization expenses for the acquired intangible assets related to the acquisition of Wisepal in 2007, travel expenses and product sample costs. We expect that our sales and marketing expenses will increase in absolute dollar amounts over the next several years. However, we believe that as we continue to achieve greater economies of scale and operating efficiencies, our sales and marketing expenses may decline over time as a percentage of our revenues.
Share-Based Compensation Expenses
Our share-based compensation expenses consist of various forms of share-based compensation that we have historically issued to our employees and consultants, as well as share-based compensation issued to employees, directors and service providers under our 2005 long-term incentive plan. We allocate such share-based compensation expenses to the applicable cost of revenues and expense categories as related services are performed. See note 15 to our consolidated financial statements. Historically our share-based compensation practice comprised grants of (i) bonus shares to employees, (ii) nonvested shares to employees, (iii) treasury shares to employees and (iv) shares to non-employees. Under the long-term incentive plan, we granted RSUs on December 30, 2005 to our employees and directors and again on September 29, 2006, September 26, 2007, September 29, 2008 and September 28, 2009 to our employees. Share-based compensation expenses recorded under the long-term incentive plan totaled $20.1 million, $20.8 million and $14.1 million in 2007, 2008 and 2009, respectively. See “—Critical Accounting Policies and Estimates—Share-Based Compensation” for further discussion of the accounting of such expenses.
Income Taxes
Since we and our direct and indirect subsidiaries are incorporated in different jurisdictions, we file separate income tax returns. Under the current laws of the Cayman Islands, we are not subject to income or capital gains tax. Additionally, dividend payments made by us are not subject to withholding tax in the Cayman Islands. We recognize income taxes at the applicable statutory rates in accordance with the jurisdictions where our subsidiaries are located and as adjusted for certain items including accumulated losses carried forward, non-deductible expenses, research and development tax credits, certain tax holidays, as well as changes in our deferred tax assets and liabilities.
Pursuant to the amendments to the ROC Income Tax Act adopted in May 2009, the income tax rate has been reduced from 25% to 20% effective January 1, 2010. ROC tax regulations require our ROC subsidiaries to pay an additional 10% tax on unappropriated earnings.
ROC law offers preferential tax treatments to industries that are encouraged by the ROC government. The ROC Statute for Upgrading Industries, which expired at the end of 2009, entitled companies to tax credits for expenses relating to qualifying research and development and personnel training expenses and purchases of qualifying machinery. The tax credits could be applied within a five-year period. The amount from the tax credit that could be applied in any year (with the exception of the final year when the remainder of the tax credit may be applied without limitation to the total amount of the income tax payable) is limited to 50% of the income tax payable for that year. Under the ROC Statute for Upgrading Industries, Himax Taiwan, Himax Semiconductor, Himax Display, Himax Analogic, Himax Media Solutions
and Himax Imaging, Ltd. were granted tax credits by the ROC Ministry of Finance at rates set at a certain percentage of the amount utilized in qualifying research and development and personnel training expenses. The balance of unused investment tax credits totaled $32.7 million, $46.8 million and $55.3 million as of December 31, 2007, 2008 and 2009, respectively. On May 12, 2010, the Industrial Innovation Act was promulgated in the ROC, which became effective on the same date except for the provision relating to tax incentives which went into effect retroactively on January 1, 2010. Compared to the ROC Statute for Upgrading Industries, the Industrial Innovation Act provides for a smaller amount of tax credits. The Industrial Innovation Act entitles companies to tax credits for research and development expenses related to innovation activities but limits the amount of tax credit to only up to 15% of the total research and development expenditure for the current year, subject to a cap of 30% of the income tax payable for the current year. Moreover, any unused tax credits provided
59
under the Industrial Innovation Act may not be carried forward. As a result, beginning in 2010, we expect to have a smaller amount of tax credits under the Industrial Innovation Act than would have been available under the ROC Statute for Upgrading Industries.
In addition, under the ROC Statute for Upgrading Industries and the applicable grandfather clause, income attributable to certain of Himax Taiwan’s expanded production capacity is tax exempt for a period of five years, effective on April 1, 2004, January 1, 2006 and January 1, 2008 and expiring on March 31, 2009, December 31, 2010 and December 31, 2012, respectively. In addition, beginning January 1, 2009, Himax Semiconductor is also entitled to a five-year tax exemption expiring on December 31, 2013. Based on the ROC statutory income tax rate of 25%, the effect of these tax exemptions on net income and basic and diluted earnings per ordinary share attributable to our stockholders for the year ended December 31, 2009 had been an increase of $9.4 million, $0.03 and $0.03, respectively. The tax exemption that expired on March 31, 2009 and the tax exemption that is scheduled to expire on December 31, 2010 account for a substantial proportion of our total tax-exempted income under the ROC Statute for Upgrading Industries. No such tax exemption is provided for under the newly adopted Industrial Innovation Act.
Critical Accounting Policies and Estimates
We believe the following critical accounting policies affect our more significant judgments and estimates used in the preparation of our consolidated financial statements.
Share-Based Compensation
Share-based compensation primarily consists of grants of nonvested or restricted shares of common stock, stock options and RSUs issued to employees. We have applied ASC 718 for our share-based compensation plans for all periods since the incorporation of Himax Taiwan in 2001. The cost of employee services received in exchange for share-based compensation is measured based on the grant-date fair value of the share-based instruments issued. The cost of employee services is equal to the grant-date fair value of shares issued to employees and is recognized in earnings over the service period. Share-based compensation expense estimates also take into account the number of shares awarded that management believes will eventually vest. We adjust our estimate for each period to reflect the current estimate of forfeitures. As of December 31, 2009, we based our share-based compensation cost on an assumed forfeiture rate of 10% per annum for RSUs issued in 2007 and 8.5% per annum for RSUs issued in 2008 and 2009 under our long-term incentive plan. If actual forfeitures occur at a lower rate, share-based compensation costs will increase in future periods.
For our issuance of RSUs in 2007, 2008 and 2009, the fair value of the ordinary shares underlying the RSUs granted to our employees was $3.95, $2.95 and $3.25 per share, respectively, which was the closing price of our ADSs on September 26, 2007, September 29, 2008 and September 28, 2009, respectively.
We record a reduction to revenues and accounts receivable by establishing a sales discount and return allowance for estimated sales discounts and product returns at the time revenues are recognized based primarily on historical discount and return rates. However, if sales discount and product returns for a particular fiscal period exceed historical rates, we may determine that additional sales discount and return allowances are required to properly reflect our estimated remaining exposure for sales discounts and product returns.
We evaluate our outstanding accounts receivable on a monthly basis for collectibility purposes. In establishing the required allowance, we consider our historical collection experience, current receivable aging and the current trend in the credit quality of our customers. In 2008, we recognized a valuation allowance of $25.3 million for the probable credit loss relating to SVA-NEC. Since around September 2008, SVA-NEC has delayed paying a large portion of our accounts receivable outstanding from them. Subsequently, in late February 2009, it was reported that
SVA Group,
the ultimate parent company of SVA-NEC, was in financial distress, and in late March 2009, the Shanghai municipal government set up a conservatorship committee to assist in SVA Group’s restructuring. We collected certain partial payments from SVA-NEC in 2009, but we believed it was probable that we would not be able to collect any of our remaining accounts receivable outstanding from SVA-NEC.
60
The movement in the allowance for doubtful accounts, sales returns and discounts for the years ended December 31, 2007, 2008 and 2009 are as follows:
Allowance for doubtful accounts
|
Year
|
Balance at
Beginning
of Year
|
Additions Charged to Expense
|
Amounts
Utilized
|
Balance at
End of Year
|
||||||||||||
|
(in thousands)
|
||||||||||||||||
|
December 31, 2007
|
$ | 187 | $ | - | $ | (187 | ) | $ | - | |||||||
|
December 31, 2008
|
$ | - | $ | 25,305 | $ | (8 | ) | $ | 25,297 | |||||||
|
December 31, 2009
|
$ | 25,297 | $ | 218 | $ | - | $ | 25,515 | ||||||||
Allowance for sales returns and discounts
|
Year
|
Balance at
Beginning
of Year
|
Additions Charged to Expense
|
Amounts
Utilized
|
Balance at
End of Year
|
||||||||||||
|
(in thousands)
|
||||||||||||||||
|
December 31, 2007
|
$ | 681 | $ | 1,705 | $ | (1,893 | ) | $ | 493 | |||||||
|
December 31, 2008
|
$ | 493 | $ | 1,657 | $ | (1,988 | ) | $ | 162 | |||||||
|
December 31, 2009
|
$ | 162 | $ | 2,391 | $ | (1,583 | ) | $ | 970 | |||||||
Inventory
Inventories are stated at the lower of cost or market value. Cost is determined using the weighted-average method. For work-in-process and manufactured inventories, cost consists of the cost of raw materials (primarily fabricated wafers and processed tape), direct labor and an appropriate proportion of production overheads. We also write down excess and obsolete inventory to its estimated market value based upon estimations about future demand and market conditions. If actual market conditions are less favorable than those projected by management, additional future inventory write-downs may be required which could adversely affect our operating results. Once written down, inventories are carried at this lower amount until sold or scrapped. If actual market conditions are more favorable, we may have higher operating income when such products are sold. Sales to date of such products have not had a significant impact on our operating income. The inventory write-downs in 2007, 2008 and 2009 were approximately $14.8 million, $18.0 million and $
13.6 million
, respectively, and were included in cost of revenues in our consolidated statements of income. The increase in inventory write-down in 2008 was generally attributable to the shorter-than-expected product life cycle for certain products, the overestimated market demand and significant changes in customers’ forecasts.
Impairment of Long-Lived Assets, Excluding Goodwill
We routinely review our long-lived assets that are held and used for impairment whenever events or changes in circumstances indicate that their carrying amounts may not be recoverable. The determination of recoverability is based on an estimate of undiscounted cash flows expected to result from the use of the asset and its eventual disposition. The estimate of cash flows is based upon, among other things, certain assumptions about expected future operating performance, average selling prices, utilization rates and other factors. If the sum of the undiscounted cash flows (excluding interest) is less than the carrying value, an impairment charge is recognized for the amount that the carrying value of the asset exceeds its fair value, based on the best information available, including discounted cash flow analysis. However, due to the cyclical nature of our industry and changes in our business strategy, market requirements, or the needs of our customers, we may not always be in a position to accurately anticipate declines in the utility of our equipment or acquired technology until they occur. We have not had any impairment charges on long-lived assets during the period from December 31, 2007 to December 31, 2009.
Business Combinations
When we acquire businesses, we allocate the purchase price to tangible assets and liabilities and identifiable intangible assets acquired. Any residual purchase price is recorded as goodwill. The allocation of the purchase price requires management to make significant estimates in determining the fair values of assets acquired and liabilities
61
assumed, especially with respect to intangible assets. These estimates are based on historical experience and information obtained from the management of the acquired companies. These estimates can include, but are not limited to, the cash flows that an asset is expected to generate in the future, the appropriate weighted-average cost of capital, and the synergistic benefits expected to be derived from the acquired business. These estimates are inherently uncertain and unpredictable. In addition, unanticipated events and circumstances may occur which may affect the accuracy or validity of such estimates.
Goodwill
We evaluate goodwill for impairment at least annually, and test for impairment between annual tests if an event occurs or circumstances change that would indicate that the carrying amount may be impaired. We consider the enterprise as a whole to be a single reporting unit for purposes of evaluating goodwill impairment. The goodwill impairment test is a two-step test. Under the first step, the fair value of the reporting unit is compared with its carrying value (including goodwill). If the fair value of the reporting unit is less than its carrying value, an indication of goodwill impairment exists for the reporting unit and we perform step two of the impairment test (measurement). Under step two, an impairment loss is recognized for any excess of the carrying amount of the reporting unit’s goodwill over the implied fair value of that goodwill. The implied fair value of goodwill is determined by allocating the fair value of the reporting unit in a manner similar to a purchase price allocation, in accordance with ASC 805
Business Combination
. The residual fair value after this allocation is the implied fair value of the reporting unit goodwill. In each of 2007, 2008 and 2009, we performed our impairment testing of goodwill and concluded that there was no goodwill impairment.
Product Warranty
Under our standard terms and conditions of sale, products sold are subject to a limited product quality warranty. We may receive warranty claims outside the scope of the standard terms and conditions. We provide for the estimated cost of product warranties at the time revenue is recognized based primarily on historical experience and any specifically identified quality issues. The movement in accrued warranty costs for the years ended December 31, 2007, 2008 and 2009 is as follows:
|
Year
|
Balance at Beginning
of Year
|
Additions Charged to Expense
|
Amount
Utilized
|
Balance at
End of Year
|
||||||||||||
|
(in thousands)
|
||||||||||||||||
|
December 31, 2007
|
$ | 630 | $ | 799 | $ | (1,094 | ) | $ | 335 | |||||||
|
December 31, 2008
|
$ | 335 | $ | 1,526 | $ | (1,612 | ) | $ | 249 | |||||||
|
December 31, 2009
|
$ | 249 | $ | 2,920 | $ | (2,490 | ) | $ | 679 | |||||||
The significant increases in provisions for product warranty costs and amount utilized for the year ended December 31, 2009 were due primarily to an increase in costs relating to the re-testing of inventories that had been stored in our warehouse for a longer period as a result of the global economic downturn in 2008.
Income Taxes
As part of the process of preparing our consolidated financial statements, our management is required to estimate income taxes and tax bases of assets and liabilities for us and our subsidiaries. This process involves estimating current tax exposure together with assessing temporary differences resulting from differing treatment of items for tax and accounting purposes and the amount of tax credits and tax loss carryforwards. These differences result in deferred tax assets and liabilities, which are included in the consolidated balance sheets. Management must then assess the likelihood that the deferred tax assets will be recovered from future taxable income, and, to the extent it believes that recovery is not more likely than not, a valuation allowance is provided.
In assessing the ability to realize deferred tax assets, our management considers whether it is more likely than not that some portion or all of the deferred tax assets will not be realized. The ultimate realization of deferred tax assets and therefore the determination of the valuation allowance is dependent upon the generation of future taxable income by the taxable entity during the periods in which those temporary differences become deductible.
62
Management considers the scheduled reversal of different liabilities, projected future taxable income, and tax planning strategies in determining the valuation allowance.
Upon initial adoption of ASC 740-10,
Income Tax
, on January 1, 2007, we recognize the effect of income tax positions only if those positions are more likely than not to be sustained. We have to recognize income tax expenses when the possibility of tax adjustments made by the tax authority are greater than 50% in the future period. Changes in income tax recognition or measurement of previous periods are reflected in the period in which the change in judgment occurs.
Prior to the adoption of ASC 740-10, we recognized the effect of income tax positions only if such positions were probable of being sustained. We recognize interest and penalties, if any, related to unrecognized tax benefits in income tax expense. We have accrued tax liabilities or reduced deferred tax assets to address potential exposures involving positions that are not considered to be more likely than not of being sustained based on the technical merits of the tax position as filed. A reconciliation of the beginning and ending amounts of uncertain tax positions is as follows:
|
Year ended December 31,
|
||||||||||||
|
2007
|
2008
|
2009
|
||||||||||
|
(in thousands)
|
||||||||||||
|
Balance at beginning of year
|
$ | 1,276 | $ | 3,968 | $ | 5,718 | ||||||
|
Increase related to prior year tax positions
|
503 | - | - | |||||||||
|
Decrease related to prior year tax positions
|
- | (1,780 | ) | - | ||||||||
|
Increase related to current year tax positions
|
2,189 | 3,555 | 2,587 | |||||||||
|
Effect of exchange rate change
|
- | (25 | ) | 145 | ||||||||
|
Balance at end of year
|
$ | 3,968 | $ | 5,718 | $ | 8,450 | ||||||
Except for Himax Taiwan, Himax Semiconductor, Himax Technologies Anyang Limited (based in South Korea), or Himax Anyang, Himax Technologies (Suzhou) Co., Ltd., Himax Technologies (Shenzhen) Co., Ltd., and Himax Imaging Corp., all other subsidiaries have generated tax losses since their inception and are not included in the consolidated tax filing with Himax Taiwan or other subsidiaries with taxable income. Valuation allowance of $12.3 million, $21.0 million and $28.4 million as of December 31, 2007, 2008 and 2009, respectively, was provided to reduce their deferred tax assets (consisting primarily of operating loss carryforwards and unused investment tax credits) to zero because management believes it is unlikely that these tax benefits will be realized. The additional provision of valuation allowance recognized for the years ended December 31, 2007, 2008 and 2009 was $6.0 million, $8.7 million and $7.4 million, respectively, as a result of increases in deferred tax assets originating in these years which we did not expect to realize.
Results of Operations
Our business has evolved rapidly and significantly since we commenced operations in 2001. Our limited operating history makes the prediction of future operating results very difficult. We believe that period-to-period comparisons of operating results should not be relied upon as indicative of future performance. On February 1, 2007, we acquired 100% of the outstanding ordinary shares of Wisepal, which is currently known as Himax Semiconductor. The results of Himax Semiconductor’s operations have been included in our consolidated financial statements since that date. The following table sets forth a summary of our consolidated statements of income as a percentage of revenues:
|
Year Ended December 31,
|
||||||||||||
|
2007
|
2008
|
2009
|
||||||||||
|
Revenues
|
100.0 | % | 100.0 | % | 100.0 | % | ||||||
|
Costs and expenses:
|
||||||||||||
|
Cost of revenues
|
78.0 | 75.5 | 79.5 | |||||||||
|
Research and development
|
8.0 | 10.5 | 10.3 | |||||||||
|
General and administrative
|
1.6 | 2.3 | 2.4 | |||||||||
|
Bad debt expense
|
0.0 | 3.0 | - | |||||||||
|
Sales and marketing
|
1.0 | 1.4 | 1.5 | |||||||||
63
|
Year Ended December 31,
|
||||||||||||
|
2007
|
2008
|
2009
|
||||||||||
|
Total costs and expenses
|
88.7 | 92.8 | 93.7 | |||||||||
|
Operating income
|
11.3 | 7.2 | 6.3 | |||||||||
|
Non-operating income
|
0.6 | 0.5 | - | |||||||||
|
Income tax expense (benefit)
|
(0.2 | ) | (1.0 | ) | 1.1 | |||||||
|
Net income
|
12.1 | 8.7 | 5.2 | |||||||||
|
Net loss attributable to noncontrolling interests
|
0.1 | 0.4 | 0.6 | |||||||||
|
Net income attributable to Himax stockholders
|
12.3 | 9.2 | 5.7 | |||||||||
Year Ended December 31, 2009 Compared to Year Ended December 31, 2008
Revenues
. Our revenues decreased 16.9% to $692.4 million in 2009 from $832.8 million in 2008. This decrease was attributable mainly to a 24.3% decrease in revenues from display drivers for large-sized applications to $493.5 million in 2009 from $651.5 million in 2008 primarily because of the significant decreases in sales to CMO and its affiliates and SVA-NEC in 2009. The decrease was partially offset by a 20.6% increase in revenues from display drivers for mobile handsets to $69.1 million in 2009 from $57.3 million in 2008 and a 9.7% increase in revenues from non-driver products to $46.3 million in 2009 from $42.2 million in 2008. Our average selling prices decreased 22.8% in 2009 as a result of the downward pricing pressure from TFT-LCD panel manufacturers in 2009. Such impact on our revenues was partially offset by a 7.6% increase in our unit shipments as a result of the rebound in demand for TFT-LCD panels in the second quarter of 2009.
Costs and Expenses.
Costs and expenses decreased 16.0% to $648.8 million in 2009 from $772.6 million in 2008. As a percentage of revenues, costs and expenses increased to 93.7% in 2009 compared to 92.8% in 2008.
|
·
|
Cost of Revenues.
Cost of revenues decreased 12.4% to $550.6 million in 2009 from $628.7 million in 2008. The decrease in cost of revenues was due primarily to a 18.6% decrease in average unit cost, partially offset by a 7.6% increase in unit shipments, as compared to 2008. The decrease in average unit cost was attributable primarily to our efforts to control cost though optimizing our supplier mix, improving design processes, increasing manufacturing yields and leveraging our scale and close relationship with semiconductor manufacturing service providers and suppliers. As a percentage of revenues, cost of revenues increased to 79.5% in 2009 from 75.5% in 2008.
|
|
·
|
Research and Development.
Research and development expenses decreased 18.5% to $71.4 million in 2009 from $87.6 million in 2008. This decrease was primarily attributable to decreases in salary expenses (including share-based compensation), mask and mold expenses, and wafer, tape and other related expenses. The decrease in salary expenses (including share-based compensation) was due primarily to the smaller amounts of performance-based bonus and signing bonus distributed in 2009, coupled with the weaker NT dollars against U.S. dollars in 2009. Our mask and mold expenses and wafer, tape and other related expenses decreased primarily as a result of our continued efforts in cost control and our more stringent decision making in approving research and development projects.
|
|
·
|
General and Administrative.
General and administrative expenses decreased 15.5% to $16.3 million in 2009 from $19.4 million in 2008, primarily as a result of a decrease in salary expenses (including share-based compensation), professional fees (including patent filing fees) and employee welfare expenses. The decrease in salary expenses (including share-based compensation) was due primarily to the smaller amounts of performance-based bonus and signing bonus distributed in 2009 and a smaller headcount of general and administrative staff, coupled with the weaker NT dollars against U.S. dollars in 2009.
|
|
·
|
Bad Debt Expense.
Bad debt expense decreased to $0.2 million in 2009 from $25.3 million in 2008. The significant bad debt expense in 2008 related mainly to the uncollected accounts receivable outstanding from SVA-NEC.
|
|
·
|
Sales and Marketing.
Sales and marketing expenses decreased 11.4% to $10.4 million in 2009 from $11.7 million in 2008, primarily as a result of a decrease in salary expenses (including share-based
|
64
|
|
compensation). The decrease in salary expenses was due primarily to a decrease in share-based compensation and lower average salaries.
|
Non-Operating Income.
We had non-operating income of $0.2 million in 2009 compared to $3.9 million in 2008. The primary component of our non-operating income in 2009 was interest income amounting to $0.8 million compared to $3.3 million in 2008. The 76.9% decrease in interest income was due primarily to lower interest rates in 2009. We also had a net loss on sale of marketable securities of $0.1 million in 2009 compared to a net gain on sale of marketable securities of $0.9 million in 2008 primarily because of the weaker NT dollar, in which the marketable securities were denominated, against the US dollar in 2009.
Income Tax Expense.
We had an income tax expense of $7.9 million in 2009 compared to an income tax benefit of $8.7 million in 2008. Our effective income tax rate changed from (13.6)% in 2008 to 18.1% in 2009. This change in our effective income tax rate was mainly attributable to (i) the expiration of one of our tax exemptions under the ROC Statute for Upgrading Industries on March 31, 2009; (ii) an increase in income tax expense in 2009 as a result of the adjustment made to our deferred tax assets and liabilities due to the reduction of the ROC income tax rate from 25% to 20% beginning in 2010; and (iii) a decrease in our tax base as our earnings before income taxes decreased to $43.7 million in 2009 from $64.0 million in 2008.
Net Income.
As a result of the foregoing, our net income decreased 50.8% to $35.8 million in 2009 from $72.7 million in 2008.
Year Ended December 31, 2008 Compared to Year Ended December 31, 2007
Revenues
. Our revenues decreased 9.3% to $832.8 million in 2008 from $918.2 million in 2007. This decrease was attributable mainly to a decrease in revenues from display drivers for large-sized applications, coupled with a decrease in revenues from display drivers for mobile handsets and partially offset by the increases in revenues from display drivers for consumer electronics products and non-driver products. The decrease in revenues was due primarily to a 17.2% decrease in our average selling prices, partially offset by a 9.6% increase in our unit shipments in 2008. The selling prices of our display drivers declined significantly in 2008, which was due primarily to the pricing pressure from TFT-LCD panel manufacturers as a result of the decline in the average selling prices of TFT-LCD panels in the second half of 2008. The increase in unit shipments was mainly attributable to the rapid capacity expansion and increased panel shipments for our customers in general primarily in the first half of 2008.
Costs and Expenses.
Costs and expenses decreased 5.1% to $772.6 million in 2008 from $814.3 million in 2007. As a percentage of revenues, costs and expenses increased to 92.8% in 2008 compared to 88.7% in 2007.
|
·
|
Cost of Revenues.
Cost of revenues decreased 12.2% to $628.7 million in 2008 from $716.2 million in 2007. The decrease in cost of revenues was due primarily to a 19.9% decrease in average unit cost, partially offset by a 9.6% increase in unit shipments. The decrease in average unit cost was attributable primarily to our change in product mix and our efforts to control cost though optimizing our supplier mix, improving design processes, increasing manufacturing yields and leveraging our scale and close relationship with semiconductor manufacturing service providers and suppliers. Inventory write-downs, which were included in cost of revenues, were $18.0 million in 2008 compared to $14.8 million in 2007.
The increase in inventory write-downs was generally attributable to the shorter-than-expected product life cycle, overestimated market demand and significant changes in customers’ forecasts.
As a percentage of revenues, cost of revenues decreased to 75.5% in 2008 from 78.0% in 2007.
|
|
·
|
Research and Development.
Research and development expenses increased 18.5% to $87.6 million in 2008 from $73.9 million in 2007. This increase was primarily attributable to the increases in salary expenses, including share-based compensation, mask and mold expenses and depreciation. The increase in salary expenses was due to an increase in headcount and higher average salaries. The increase in mask and mold expenses resulted primarily from our increased effort to undertake research and development projects and our migration of certain manufacturing processes. The increase in depreciation consisted primarily of the increased depreciation expense relating to our research and development equipment and software. Such increases were partially offset by a decrease in amortization because of the large write-off of in-process research and development assets in the amount of $1.6 million related to the acquisition of Wisepal in 2007, which we did not have in 2008.
|
65
|
·
|
General and Administrative.
General and administrative expenses increased 29.9% to $19.4 million in 2008 from $14.9 million in 2007, primarily as a result of an increase in salary expenses, including share-based compensation, professional fees and depreciation. The increase in salary expenses was due to an increase in headcount and higher average salaries. The increase in professional fees was mainly attributable to an increase in patent filing fees. The increase in depreciation consisted primarily of the increased depreciation expense relating to our office equipment and software.
|
|
·
|
Bad Debt Expense.
In 2008, we recognized bad debt expense of $25.3 million compared to nil in 2007. This bad debt expense related mainly to the uncollected accounts receivable outstanding from SVA-NEC.
|
|
·
|
Sales and Marketing.
Sales and marketing expenses increased 25.3% to $11.7 million in 2008 from $9.3 million in 2007, primarily as a result of an increase in salary expenses, including share-based compensation, and expenses of samples. The increase in salary expenses was due to an increase in headcount and higher average salaries. The expenses of samples increased primarily as a result of the increase in samples used for sales promotion.
|
Non-Operating Income.
We had non-operating income of $3.9 million in 2008 compared to $5.7 million in 2007. The primary component of our non-operating income was interest income amounting to $3.3 million and $5.4 million in 2008 and 2007, respectively. The 39.0% decrease in interest income was due primarily to lower interest rates in 2008.
Income Tax Benefit.
As a result of the foregoing, including the bad debt expense relating to SVA-NEC in 2008, our earnings before income taxes decreased significantly to $64.0 million in 2008 from $109.6 million in 2007, which resulted in a significant decrease in income tax expense in 2008. We had a net income tax benefit of $8.7 million in 2008 compared to $1.9 million in 2007, primarily as a result of the decrease in income tax expense in 2008. Our effective income tax rate changed from (1.7)% in 2007 to (13.6)% in 2008, which was due primarily to a greater proportion of tax free income earned compared to pre-tax income in 2008 primarily as a result of the decrease in earnings before income taxes in 2008.
Net Income.
As a result of the foregoing, our net income decreased to $72.7 million in 2008 from $111.5 million in 2007.
5.B. Liquidity and Capital Resources
The following table sets forth a summary of our cash flows for the periods indicated:
|
Year Ended December 31,
|
||||||||||||
|
2007
|
2008
|
2009
|
||||||||||
|
(in thousands)
|
||||||||||||
|
Net cash provided by operating activities
|
$ | 77,162 | $ | 136,500 | $ | 73,630 | ||||||
|
Net cash used in investing activities
|
(25,019 | ) | (21,764 | ) | (7,255 | ) | ||||||
|
Net cash used in financing activities
|
(67,241 | ) | (74,350 | ) | (91,065 | ) | ||||||
|
Net increase (decrease) in cash and cash equivalents
|
(14,973 | ) | 40,420 | (24,276 | ) | |||||||
|
Cash and cash equivalents at beginning of period
|
109,753 | 94,780 | 135,200 | |||||||||
|
Cash and cash equivalents at end of period
|
94,780 | 135,200 | 110,924 | |||||||||
As of December 31, 2009, we had $110.9 million in cash and cash equivalents.
Operating Activities
.
Net cash provided by operating activities in 2009 was $73.6 million compared to $136.5 million in 2008. This decrease in net cash provided by operating activities in 2009 was due primarily to a decrease in cash collected from customers as we had a relatively low accounts receivable balance at the beginning of the year and we extended the credit term for certain customers since late 2008 in view of the weakening market. The decrease in net cash provided by operating activities was also due to our lower gross margin in 2009, partially offset by a decrease in cash used in 2009 to pay for raw materials, assembly and testing process fees as compared to 2008. Net cash provided by operating activities in 2008 was $136.5 million compared to $77.2 million in 2007. This increase in net cash provided by operating activities in 2008 was due primarily to an increase in cash collected from customers in 2008, which was partially offset by an increase in cash used in 2008 to pay for raw materials, assembly and testing process fees purchased in the second half of 2007.
66
Investing Activities
. Net cash used in investing activities in 2009 was $
7.3
million compared to $21.8 million in 2008. This decrease in net cash used in investing activities in 2009 was due primarily to a decrease in cash used to
purchase property and equipment
and to invest in
non-marketable equity securities
. Net cash used in investing activities in 2008 was $21.8 million compared to $25.0 million in 2007. This decrease in net cash used in investing activities in 2008 was due primarily to a net cash inflow from purchases and disposal of available-for-sale marketable securities in 2008 as compared to a net cash outflow from purchases and disposal of available-for-sale marketable securities in 2007, partially offset by the fact that no cash was acquired in any acquisition in 2008 as compared to the acquisition of $6.2 million cash in the acquisition of Wisepal in 2007.
Financing Activities
.
Net cash used in financing activities in 2009 was $
91.1
million compared to $74.4 million in 2008. This increase in net cash used in financing activities in 2009 was due primarily to an increase in payments to acquire ordinary shares for retirement, partially offset by a decrease in distribution of cash dividends.
Net cash used in financing activities in 2008 was $74.4 million compared to $67.2 million in 2007. This change in net cash used in financing activities in 2008 was due primarily to an increase in distribution of cash dividends and a decrease in proceeds from the issuance of new shares by subsidiaries, partially offset by a decrease in payments to acquire ordinary shares for retirement.
Our liquidity could be negatively impacted by a decrease in demand for our products. Our products are subject to rapid technological change, among other factors, which could result in revenue variability in future periods. Further, we expect to continue increasing our headcount, especially in engineering and sales, to pursue growth opportunities and keep pace with changes in technology. Should demand for our products slow down or fail to grow as expected, our increased headcount would result in sustained losses and reductions in our cash balance. We have at times agreed to extend the payment terms for certain of our customers. Other customers have also requested extension of payment terms and we may grant such requests for extensions in the future. The extension of payment terms for our customers could adversely affect our cash flow, liquidity and our operating results.
We believe that our current cash and cash equivalents and cash flow from operations will be sufficient to meet our anticipated cash needs, including our cash needs for working capital and capital expenditures for the foreseeable future. We may, however, require additional cash resources due to higher than expected growth in our business or other changing business conditions or other future developments, including any investments or acquisitions we may decide to pursue.
5.C. Research and Development
Our research and development efforts focus on improving and enhancing our core technologies and know-how relating to the semiconductor solutions we offer to the flat panel display industry. In particular, we have committed a significant portion of our resources to the research and development of non-driver products because we believe in the long-term business prospects of such products and are committed to continuing to diversify our product portfolio. Although a significant portion of the resources at our integrated circuit design center are invested in advanced research for future products, we continue to invest in improving the performance and reducing the costs of our existing products. Our application engineers, who provide on-system verification of semiconductors and product specifications, and field application engineers, who provide on-site engineering support at our customers’ offices or factories, work closely with panel manufacturers to co-develop display solutions for their electronic devices. In 2007, 2008 and 2009, we incurred research and development expenses of $73.9 million, $87.6 million and $71.4 million, respectively, representing 8.0%, 10.5% and 10.3% of our revenues, respectively.
5.D. Trend Information
The flat panel display industry is highly cyclical and subject to price fluctuations and seasonality. Beginning in the second half of 2008, the worldwide financial crisis has adversely impacted the level of consumer spending. As a result, there was an over-supply of large-sized TFT-LCD panels. Many TFT-LCD panel manufacturers experienced a decrease in prices of large-sized TFT-LCD panels and reduced capacity utilization significantly, which in turn resulted in strong downward pricing pressure on and a decrease in demand for our products, particularly in late 2008 and early 2009. While there was a rebound in demand for TFT-LCD panels in the second quarter of 2009, the growth in output of TFT-LCD panels has been limited by the shortage of certain components for TFT-LCD panels. Our product pricing remained weak in 2009, and we expect 2010 will continue to be a challenging year for us.
67
In particular, many of our suppliers and many suppliers of other components of TFT-LCD panels have reduced their capacity utilization since the second half of 2008 and have not been able to expand their capacity quickly to meet the increased demand in 2010. In addition, there has been an increased level of industry consolidation among our suppliers since late 2009, including the merger of Chartered Semiconductor Manufacturing Ltd. and Globalfoundries and the merger of Chipbond and IST. Such industry consolidation could result in an increase in bargaining power of our suppliers. As a result of the foregoing, we may incur a higher unit cost for services provided by certain of our suppliers.
On March 18, 2010, CMO, Innolux and TPO completed their merger. We expect Chimei Innolux, the surviving entity following the merger, to be our largest customer and sales to Chimei Innolux will account for the majority of our revenues in 2010. While it remains unclear how the merger would affect our sales, business and operations, Chimei Innolux has begun to integrate the purchases of driver products by the three companies from us, which will likely result in an increase in their bargaining power and may therefore exert downward pricing pressure on our products.
End product designs have continued to trend toward lower cost, lower power consumption and thin and light form factor, which may have an adverse impact on our business. For example, there have been industry reports discussing the development of new panel designs to reduce the number of display drivers required per panel, such as GIP designs and dual gate and triple gate panel designs. Such reduction in the number of display drivers used could adversely impact our revenues.
For more trend information, see “Item 5.A. Operating and Financial Review and Prospects—Operating Results.”
5.E. Off-Balance Sheet Arrangements
As of December 31, 2009, we did not have any off-balance sheet guarantees, interest rate swap transactions or foreign currency forwards. We do not engage in trading activities involving non-exchange traded contracts. Furthermore, as of December 31, 2009, we did not have any interests in variable interest entities.
5.F. Tabular Disclosure of Contractual Obligations
The following table sets forth our contractual obligations as of December 31, 2009:
|
Payment Due by Period
|
||||||||||||||||||||
|
Total
|
Less than
1 year
|
1-3 years
|
3-5
years
|
More than
5 years
|
||||||||||||||||
|
(in thousands)
|
||||||||||||||||||||
|
Operating lease obligations
|
$ | 4,586 | 1,493 | 1,163 | 350 | 1,580 | ||||||||||||||
|
Purchase obligations
(1)
|
92,481 | 92,481 | - | - | - | |||||||||||||||
|
Other obligations
(2)
|
1,055 | 608 | 447 | - | - | |||||||||||||||
|
Total
|
$ | 98,122 | 94,582 | 1,610 | 350 | 1,580 | ||||||||||||||
|
Notes:
|
(1)
|
Includes obligations for purchase of equipment, computer software and machinery and wafer fabrication, raw material, supplies, assembly and testing services.
|
|
(2)
|
Includes obligations under license agreements and donations for laboratories commitments.
|
We lease office and building space pursuant to operating lease arrangements with unrelated third parties. In 2007, 2008 and 2009, rental expenses for operating leases amounted to $1.9 million, $1.2 million and $1.1 million, respectively. The lease arrangements will expire gradually from 2010 to 2012. As of December 31, 2009, we agreed to make future minimum lease payments of $1.0 million, $0.5 million and $6,000 in 2010, 2011 and 2012, respectively, under non-cancelable operating leases.
We have, from time to time, entered into contracts for the acquisition of equipment and computer software. As of December 31, 2009, the remaining commitments under such contracts were $3.8 million. These outstanding contracts had a total contract value of $5.0 million.
68
Pursuant to several wafer fabrication or assembly and testing service arrangements we entered into with service providers, we may be obligated to make payments for purchase orders made under such arrangements. As of December 31, 2009, our contractual obligations pursuant to such arrangements amounted to approximately $63.1 million.
As of December 31, 2009, we had obtained from banks an outstanding letter of credit amounting to $262,000 in connection with the purchase of machinery and equipment and a standby letter of credit amounting to $250,000 to secure our obligations under a license agreement.
We have also agreed to donate a total of NT$55.4 million ($1.7 million) to two top local universities in Taiwan for development of their laboratories. As of December 31, 2009, the remaining commitments were NT$24.0 million ($0.7 million).
Under the ROC Labor Standard Law, we established a defined benefit plan and were required to make monthly contributions to a pension fund in an amount equal to 2% of wages and salaries of our employees. Under the ROC Labor Pension Act, beginning on July 1, 2005, we are required to make a monthly contribution for employees that elect to participate in the new defined contribution plan of no less than 6% of the employee’s monthly wages, to the employee’s individual pension fund account. Substantially all participants in the defined benefit plan have elected to participate in the new defined contribution plan. Participants’ accumulated benefits under the defined benefit plan are not impacted by their election to change plans. We are required to make contributions to the defined benefit plan until it is fully funded. Total contributions to the new defined contribution plan in 2009 were $
1.3
million compared to $1.4 million and $967,000 in 2008 and 2007, respectively. Total contributions to the defined benefit plan and the new defined contribution plan in 2009 were $
1.5
million compared to $1.8 million and $1.3 million in 2008 and 2007, respectively. Such changes in contributions have not, and are not expected to have, a material effect on our cash flows or results of operations.
Inflation
Inflation in Taiwan has not had a material impact on our results of operations in recent years. However, an increase in inflation can lead to increases in our costs and lower our profit margins. According to the Directorate General of Budget, Accounting and Statistics, Executive Yuan, ROC, the change of consumer price index in Taiwan was 1.8%, 3.5% and (0.9)% in 2007, 2008 and 2009, respectively.
Recent Accounting Pronouncements
In October 2009, the FASB issued ASU 2009-13,
Revenue Recognition (Topic 605): Multiple-Deliverable Revenue Arrangement
(Emerging Issues Task Force Issue No. 08-1,
Revenue Arrangement with Multiple Deliverable
). ASU 2009-13 amends ASC 650-25 to eliminate the requirement that all undelivered elements have vendor specific objective evidence, or VSOE, of selling price or third party evidence, or TPE, of selling price before an entity can recognize the portion of an overall arrangement fee that is attributable to items that already have been delivered. In the absence of VSOE and TPE for one or more delivered or undelivered elements in a multiple-element arrangement, entities will be required to estimate the selling prices of those elements. The overall arrangement fee will be allocated to each element (both delivered and undelivered items) based on their relative selling prices, regardless of whether those selling prices are evidenced by VSOE or TPE or are based on the entity’s estimated selling price. Application of the “residual method” of allocating an overall arrangement fee between delivered and undelivered elements will no longer be permitted upon adoption of ASU 2009-13. Additionally, the new guidance will require entities to disclose more information about their multiple-element revenue arrangements. ASU 2009-13 is effective prospectively for revenue arrangements entered into or materially modified in fiscal years beginning on or after June 15, 2010. Early adoption is permitted. Management expects that the adoption of 2009-13 will not have a material impact on our consolidated financial statements.
6.A. Directors and Senior Management
Members of our board of directors may be elected by our directors or our shareholders. Our board of directors consists of seven directors, three of whom are independent directors within the meaning of Rule 5605(a)(2) of the
69
Nasdaq Rules. Other than Jordan Wu and Dr. Biing-Seng Wu, who are brothers, there are no family relationships between any of our directors and executive officers. The following table sets forth information regarding our directors and executive officers as of May 31, 2010. Unless otherwise indicated, the positions or titles indicated in the table below refer to Himax Technologies, Inc.
|
Directors and Executive Officers
|
Age
|
Position/Title
|
|
Dr. Biing-Seng Wu
|
52
|
Chairman of the Board
|
|
Jordan Wu
|
49
|
President, Chief Executive Officer and Director
|
|
Jung-Chun Lin
|
61
|
Director
|
|
Chih-Chung Tsai
|
54
|
Director, Chief Technology Officer, Senior Vice President
|
|
Dr. Chun-Yen Chang
|
72
|
Director
|
|
Dr. Yan-Kuin Su
|
61
|
Director
|
|
Yuan-Chuan Horng
|
58
|
Director
|
|
Max Chan
|
43
|
Chief Financial Officer
|
|
John Chou
|
51
|
Vice President, Quality & Reliability Assurance & Support Design Center
|
|
Norman Hung
|
52
|
Vice President, Sales and Marketing
|
Directors
Dr. Biing-Seng Wu
is the chairman of our board of directors. Prior to our reorganization in October 2005, Dr. Wu served as president, chief executive officer and a director of Himax Taiwan. Dr. Wu also served as the vice chairman of the board of directors of CMO prior to its merger with Innolux and TPO and is a director of Chi Lin Technology Co., Ltd., an electronics manufacturing service provider, Chi Mei El Corp., an OLED company, and Nexgen Mediatech Inc., a TFT-LCD television manufacturer. Dr. Wu has been active in the TFT-LCD panel industry for over 20 years and is a member of the boards of the Taiwan TFT-LCD Association and the Society for Information Display. Prior to joining CMO in 1998, Dr. Wu was senior director and plant director of Prime View International Co., Ltd., a TFT-LCD panel manufacturer, from 1993 to 1997, and a manager of Thin Film Technology Development at the Electronics Research & Service Organization/Industry Technology Research Institute, or ERSO/ITRI, of Taiwan. Dr. Wu holds a B.S. degree, an M.S. degree and a Ph.D. degree in electrical engineering from National Cheng Kung University. Dr. Wu is the brother of Mr. Jordan Wu, our president and chief executive officer.
Jordan Wu
is our president, chief executive officer and director. Prior to our reorganization in October 2005, Mr. Wu served as the chairman of the board of directors of Himax Taiwan, a position that he held since April 2003. Prior to joining Himax Taiwan, Mr. Wu served as chief executive officer of TV Plus Technologies, Inc. and chief financial officer and executive director of DVN Holdings Ltd. in Hong Kong. Prior to that, he was an investment banker at Merrill Lynch (Asia Pacific) Limited, Barclays de Zoete Wedd (Asia) Limited and Baring Securities, based in Hong Kong and Taipei. Mr. Wu holds a B.S. degree in mechanical engineering from National Taiwan University and an M.B.A. degree from the University of Rochester. Mr. Wu is the brother of Dr. Biing-Seng Wu, our chairman.
Jung-Chun Lin
is our director. Mr. Lin has been a director of Himax Taiwan since June 2001. He also served as senior vice president of finance and administration at CMO prior to its merger with Innolux and TPO and is the
chairman of the board of directors of NingBo Chi Mei Optoelectronics Ltd., or CMO-Ningbo, and chairman of the board of directors of NanHai Chi Mei Optoelectronics Ltd., or CMO-NanHai. Prior to joining CMO in 2000, Mr. Lin was vice president of Chi Mei Corporation and had been with Chi Mei Corporation since 1971. Mr. Lin holds a B.S. degree in accounting from National ChengChi University.
Chih-Chung Tsai
is our director, chief technology officer and senior vice president. Prior to joining Himax Taiwan, Mr. Tsai served as vice president of IC Design of Utron Technology from 1998 to 2001, manager and director of the IC Division of Sunplus Technology from 1994 to 1998, director of the IC Design Division of Silicon Integrated Systems Corp. from 1987 to 1993 and project leader at ERSO/ITRI from 1981 to 1987. Mr. Tsai holds a B.S. degree and an M.S. degree in electrical engineering from National Chiao Tung University.
70
Dr. Chun-Yen Chang
is our director. Prior to our reorganization in October 2005, he served as a supervisor of Himax Taiwan since December 2003. He was president of the National Chiao Tung University, or NCTU, of Taiwan from 1998 to 2006. Prior to that, he served as the director of the Microelectronics and Information Systems Research Center of NCTU from 1996 to 1998 and as the dean of both the College of Electrical Engineering and Computer Science of NCTU and the College of Engineering of NCTU from 1990 to 1994. Dr. Chang has been active in the semiconductor industry for over 40 years. He is a fellow of the Institute of Electrical and Electronics Engineers, Inc., or IEEE, a foreign associate of the National Academy of Engineering of the United States and a fellow of Academia Sinica of Taiwan. Dr. Chang holds a B.S. degree in electrical engineering from National Cheng Kung University and an M.S. degree and a Ph.D. degree in electrical engineering from NCTU.
Dr. Yan-Kuin Su
is our director. He is currently the president of Kun Shan University and also a professor of Department of Electrical Engineering, National Cheng Kung University since 1983. He is also a fellow of the Institute of Electrical and Electronics Engineers, Inc. Dr. Su holds a B.S. degree and an M.S. degree and a Ph.D. degree in Electrical Engineering of National Cheng Kung University.
Yuan-Chuan Horng
is our director. Prior to our reorganization in October 2005, Mr. Horng served as a director of Himax Taiwan from August 2004 to October 2005. Mr. Horng is the general manager of the Finance Department of China Steel Corporation, a position he has held since April 2000. He has held various accounting and finance positions at China Steel Corporation for over 30 years. Mr. Horng holds a B.A. degree in economics from Soochow University.
Other Executive Officers
Max Chan
is our chief financial officer. Mr. Chan is also a supervisor of Himax Semiconductor, Himax Imaging, Ltd., Himax Media Solutions and Harvest Investment Limited. Prior to our reorganization in October 2005, Mr. Chan served as director of the planning division of Himax Taiwan from June 2004 to October 2005. Prior to joining Himax Taiwan, he was treasury manager of Intel Capital, the strategic investment division of Intel Corporation in Taiwan from 2000 to 2004, senior associate of Credit Suisse First Boston Asia International (Cayman) Limited, Taiwan Branch in 2000 and a manager of the Overseas Direct Investment Department of China Development Industrial Bank from 1992 to 2000. Mr. Chan holds a B.S. degree in civil engineering and an M.B.A. degree in finance from National Taiwan University and an M.S. degree in business administration from the University of Illinois at Urbana-Champaign.
John Chou
is our vice president in charge of the Quality & Reliability Assurance & Support Design Center and also serves as a president and director of Himax Media Solutions and Himax Media Solutions (Hong Kong) Limited. Prior to joining Himax in 2005, Mr. Chou served as the director of the Application and Marketing Department at Pyramis Corp., a subsidiary and the semiconductor arm of Delta Electronics Inc., from August 2002 to April 2005. Mr. Chou was application manager at O2Micro, Inc., an integrated circuit design house, from 1997 to 2002 and design engineer and project manager at Philips Lighting Electronics from 1992 to 1996. Mr. Chou holds a B.S. degree in electrical engineering from National Cheng Kung University and an M.S. degree in electrical engineering from California State University, Los Angeles.
Norman Hung
is our vice president in charge of Sales and Marketing and also serves as a supervisor of Himax Analogic. From 2000 to 2006, Mr. Hung served as president of ZyDAS Technology Corp., a fabless integrated circuit design house. From 1999 to 2000, he served as vice president of Sales and Marketing for HiMARK Technology Inc., another fabless integrated circuit design house. Prior to that, from 1996 to 1998, Mr. Hung served as Director of Sales and Marketing for Integrated Silicon Solution, Inc. He has also served in various Marketing positions for Hewlett-Packard and Logitech. Mr. Hung holds a B.S. degree in electrical engineering from National Cheng Kung University and an executive M.B.A. degree from National Chiao Tung University.
6.B. Compensation of Directors and Executive Officers
For the year ended December 31, 2009, the aggregate cash compensation that we paid to our executive officers was approximately $0.7 million. The aggregate share-based compensation that we paid to our executive officers was approximately $1.4 million. No executive officer is entitled to any severance benefits upon termination of his or her employment with us.
71
For the year ended December 31, 2009, the aggregate cash compensation that we paid to our independent directors was approximately $
200,000
. The aggregate share-based compensation that we paid to our independent directors was nil.
The following table summarizes the RSUs that we granted in 2009 to our directors and executive officers under our 2005 long-term incentive plan. Each unit of RSU represents two ordinary shares after effected on August 10, 2009. See “Item 6.D. Directors, Senior Management and Employees—Employees––Share-Based Compensation Plans” for more details regarding our RSU grants.
|
Name
|
Total RSUs
Granted
|
Ordinary Shares
Underlying Vested
Portion of RSUs
|
Ordinary Shares
Underlying
Unvested Portion
of RSUs
|
|||||||||
|
Dr. Biing-Seng Wu
|
30,842 | 15,422 | 46,262 | |||||||||
|
Jordan Wu
|
61,684 | 30,842 | 92,526 | |||||||||
|
Jung-Chun Lin
|
- | - | - | |||||||||
|
Chi-Chung Tsai
|
61,684 | 30,842 | 92,526 | |||||||||
|
Dr. Chun-Yen Chang
|
- | - | - | |||||||||
|
Dr. Yan-Kuin Su
|
- | - | - | |||||||||
|
Yuan-Chuan Horng
|
- | - | - | |||||||||
|
Max Chan
|
24,615 | 12,308 | 36,922 | |||||||||
|
John Chou
|
36,136 | 18,068 | 54,204 | |||||||||
|
Norman Hung
|
34,288 | 17,144 | 51,432 | |||||||||
6.C. Board Practices
General
Our board of directors consists of seven directors, three of whom are independent directors within the meaning of Rule 5605(a)(2) of the Nasdaq Rules. We intend to follow home country practice that permits our board of directors to have less than a majority of independent directors in lieu of complying with Rule 5605(b)(1) of the Nasdaq Rules that require boards of U.S. companies to have a board of directors which is comprised of a majority of independent directors. Moreover, we intend to follow home country practice that permits our independent directors not to hold regularly scheduled meetings at which only independent directors are present in lieu of complying with Rule 5605(b)(2).
Committees of the Board of Directors
To enhance our corporate governance, we have established three committees under the board of directors: the audit committee, the compensation committee and the nominating and corporate governance committee. We have adopted a charter for each of the three committees. Each committee’s members and functions are described below.
Audit Committee.
Our audit committee currently consists of Yuan-Chuan Horng, Dr. Chun-Yen Chang and Dr. Yan-Kuin Su. Our board of directors has determined that all of our audit committee members are “independent directors” within the meaning of Rule 5605(a)(2) of the Nasdaq Rules and meet the criteria for independence set forth in Section 10A(m)(3)(B)(i) of the Exchange Act. Our audit committee will oversee our accounting and financial reporting processes and the audits of our financial statements. The audit committee will be responsible for, among other things:
|
·
|
selecting the independent auditors and pre-approving all auditing and non-auditing services permitted to be performed by the independent auditors;
|
|
·
|
reviewing with the independent auditors any audit problems or difficulties and management’s response;
|
|
·
|
reviewing and approving all proposed related party transactions, as defined in Item 404 of Regulation SK under the Securities Act;
|
72
|
·
|
discussing the annual audited financial statements with management and the independent auditors;
|
|
·
|
reviewing major issues as to the adequacy of our internal controls and any special audit steps adopted in light of material internal control deficiencies;
|
|
·
|
annually reviewing and reassessing the adequacy of our audit committee charter;
|
|
·
|
meeting separately and periodically with management and the independent auditors;
|
|
·
|
reporting regularly to the board of directors; and
|
|
·
|
such other matters that are specifically delegated to our audit committee by our board of directors from time to time.
|
Compensation Committee.
Our current compensation committee consists of Yuan-Chuan Horng, Dr. Yan-Kuin Su, Dr. Chun-Yen Chang and Jung-Chun Lin. Our compensation committee assists our board of directors in reviewing and approving the compensation structure, including all forms of compensation, relating to our directors and executive officers. Our chief executive officer may not be present at any committee meeting where his or her compensation is deliberated. We intend to follow home country practice that permits a compensation committee to contain a director who does not meet the definition of “independence” within the meaning of Rule 5605(a)(2) of the Nasdaq Rules. We intend to follow home country practice in lieu of complying with Rule 5605(d)(1)(B) and (2)(B) of the Nasdaq Rules which requires the compensation committees of U.S. companies to be comprised solely of independent directors. The compensation committee will be responsible for, among other things:
|
·
|
reviewing and making recommendations to our board of directors regarding our compensation policies and forms of compensation provided to our directors and officers;
|
|
·
|
reviewing and determining bonuses for our officers and other employees;
|
|
·
|
reviewing and determining share-based compensation for our directors, officers, employees and consultants;
|
|
·
|
administering our equity incentive plans in accordance with the terms thereof; and
|
|
·
|
such other matters that are specifically delegated to the compensation committee by our board of directors from time to time.
|
Nominating and Corporate Governance Committee
. Our nominating and corporate governance committee assists the board of directors in identifying individuals qualified to be members of our board of directors and in determining the composition of the board and its committees. Our current nominating and corporate governance committee consists of Yuan-Chuan Horng, Dr. Chun-Yen Chang, Dr. Yan-Kuin Su and Jung-Chun Lin. We intend to follow home country practice that permits a nominations committee to contain a director who does not meet the definition of “independence” within the meaning of Rule 5605(a)(2) of the Nasdaq Rules. We intend to follow home country practice in lieu of complying with Rule 5605(e)(1)(B) of the Nasdaq Rules that requires the nominations committees of U.S. companies be comprised solely of independent directors. Our nominating and corporate governance committee will be responsible for, among other things:
|
·
|
identifying and recommending to our board of directors nominees for election or re-election, or for appointment to fill any vacancy;
|
|
·
|
reviewing annually with our board of directors the current composition of our board of directors in light of the characteristics of independence, age, skills, experience and availability of service to us;
|
|
·
|
reviewing the continued board membership of a director upon a significant change in such director’s principal occupation;
|
73
|
·
|
identifying and recommending to our board of directors the names of directors to serve as members of the audit committee and the compensation committee, as well as the nominating and corporate governance committee itself;
|
|
·
|
advising the board periodically with respect to significant developments in the law and practice of corporate governance as well as our compliance with applicable laws and regulations, and making recommendations to our board of directors on all matters of corporate governance and on any corrective action to be taken; and
|
|
·
|
monitoring compliance with our code of business conduct and ethics, including reviewing the adequacy and effectiveness of our procedures to ensure proper compliance.
|
Terms of Directors and Officers
Under Cayman Islands law and our articles of association, each of our directors holds office until a successor has been duly elected or appointed, except where any director was appointed by the board of directors to fill vacancy on the board of directors or as an addition to the existing board, such director shall hold office until the next annual general meeting of shareholders at which time such director is eligible for re-election. Our directors are subject to periodic retirement and re-election by shareholders in accordance with our articles of association, resulting in their retirement and re-election at staggered intervals. At each annual general meeting, one-third of our directors are subject to retirement by rotation, or if their number is not a multiple of three, the number nearest to one-third but not exceeding one-third shall retire from office. Any retiring director is eligible for re-election. The chairman of our board of directors and/or the managing director will not be subject to retirement by rotation or be taken into account in determining the number of directors to retire in each year. Under this formula, assuming seven directors continue to serve on the board of directors, two directors will retire and be subject to re-election in each year beginning in 2010. Under our articles of association, which director will retire at each annual general meeting will be determined as follows: (i) any director who wishes to retire and not offer himself for re-election, (ii) if no director wishes to retire, the director who has been longest in office since his last re-election or appointment, and (iii) if two or more directors have served on the board the longest, then as agreed among the directors themselves or as determined by lot. Beginning in 2010, assuming that our board of directors continue to consist of seven directors, the term of each director (other than the chairman) will not exceed three years. All of our executive officers are appointed by our board of directors.
6.D. Employees
As of December 31, 2007, 2008 and 2009, we had 1,050, 1,214 and
1,229
employees, respectively. The following is a breakdown of our employees by function as of December 31, 2009:
|
Function
|
Number
|
|||
|
Research and development
(1)
|
792 | |||
|
Engineering and manufacturing
(2)
|
166 | |||
|
Sales and marketing
(3)
|
186 | |||
|
General and administrative
|
85 | |||
|
Total
|
1,229 | |||
|
Notes:
|
(1)
|
Includes semiconductor design engineers, application engineers, assembly and testing engineers
and quality control engineers.
|
|
|
(2)
|
Includes manufacturing personnel of Himax Display, our subsidiary focused on design and
manufacturing of LCOS products and liquid crystal injection services.
|
|
|
(3)
|
Includes field application engineers.
|
74
Share-Based Compensation Plans
Himax Technologies, Inc. 2005 Long-Term Incentive Plan
We adopted a long-term incentive plan in October 2005. The following description of the plan is intended to be a summary and does not describe all provisions of the plan.
Purpose of the Plan.
The purpose of the plan is to advance our interests and those of our shareholders by:
|
·
|
providing the opportunity for our employees, directors and service providers to develop a sense of proprietorship and personal involvement in our development and financial success and to devote their best efforts to our business; and
|
|
·
|
providing us with a means through which we may attract able individuals to become our employees or to serve as our directors or service providers and providing us a means whereby those individuals, upon whom the responsibilities of our successful administration and management are of importance, can acquire and maintain share ownership, thereby strengthening their concern for our welfare.
|
Type of Awards.
The plan provides for the grant of stock options and restricted share units.
Duration.
Generally, the plan will terminate five years from the effective date of the plan. After the plan is terminated, no awards may be granted, but any award previously granted will remain outstanding in accordance with the plan.
Administration.
The plan is administered by the compensation committee of our board of directors or any other committee designated by our board to administer the plan. Committee members will be appointed from time to time by, and will serve at the discretion of, our board. The committee has full power and authority to interpret the terms and intent of the plan or any agreement or document in connection with the plan, determine eligibility for awards and adopt such rules, regulations, forms, instruments and guidelines for administering the plan. The committee may delegate its duties or powers.
Number of Authorized Shares.
We have authorized a maximum of 36,153,854 shares to be issued under the plan. As of the date of this annual report, there were no stock options or restricted share units outstanding under the plan except as described under “—Restricted Share Units.”
Eligibility and Participation.
All of our employees, directors and service providers are eligible to participate in the plan. The committee may select from all eligible individuals those individuals to whom awards will be granted and will determine the nature of any and all terms permissible by law and the amount of each award.
Stock Options.
The committee may grant options to participants in such number, upon such terms and at any time as it determines. Each option grant will be evidenced by an award document that will specify the exercise price, the maximum duration of the option, the number of shares to which the option pertains, conditions upon which the option will become vested and exercisable and such other provisions which are not inconsistent with the plan.
The exercise price for each option will be:
|
·
|
based on 100% of the fair market value of the shares on the date of grant;
|
|
·
|
set at a premium to the fair market value of the shares on the day of grant; or
|
|
·
|
indexed to the fair market value of the shares on the date of grant, with the committee determining the index.
|
The exercise price on the date of grant must be at least equal to 100% of the fair market value of the shares on the date of grant.
Each option will expire at such time as the committee determines at the time of its grant; however, no option will be exercisable later than the 10th anniversary of its grant date. Notwithstanding the foregoing, for options
75
granted to participants outside the United States, the committee can set options that have terms greater than ten years.
Options will be exercisable at such times and be subject to such terms and conditions as the committee approves. A condition of the delivery of shares as to which an option will be exercised will be the payment of the exercise price. Subject to any governing rules or regulations, as soon as practicable after receipt of written notification of exercise and full payment, we will deliver to the participant evidence of book-entry shares or, upon his or her request, share certificates in an appropriate amount based on the number of shares purchased under the option(s). The committee may impose such restrictions on any shares acquired pursuant to the exercise of an option as it may deem advisable.
Each participant’s award document will set forth the extent to which he or she will have the right to exercise the options following termination of his or her employment or services.
We have not yet granted any stock options under the plan.
Restricted Share Units.
The committee may grant restricted share units to participants. Each grant will be evidenced by an award document that will specify the period(s) of restriction, the number of restricted share units granted and such other provisions as the committee determines.
Generally, restricted share units will become freely transferable after all conditions and restrictions applicable to such shares have been satisfied or lapse and restricted share units will be paid in cash, shares, or a combination, as determined by the committee.
The committee may impose such other conditions or restrictions on any restricted share units as it may deem advisable, including a requirement that participants pay a stipulated purchase price for each restricted share unit, restrictions based upon the achievement of specific performance goals and time-based restrictions on vesting.
A participant will have no voting rights with respect to any restricted share units.
Each award document will set forth the extent to which the participant will have the right to retain restricted share units following termination of his or her employment or services.
We made grants of 6,694,411 RSUs to our employees on September 26, 2007. The vesting schedule for such RSU grants is as follows: 54.55% of the RSU grants vested immediately and was settled by cash in the amount of $14.4 million on the grant date, with the remainder vesting equally on each of September 30, 2008, 2009 and 2010, subject to certain forfeiture events.
We made grants of 7,108,675 RSUs to our employees on September 29, 2008. The vesting schedule for such RSU grants is as follows: 60.64% of the RSU grants vested immediately and was settled by cash in the amount of $12.7 million on the grant date, with the remainder vesting equally on each of September 30, 2009, 2010 and 2011, which will be settled by our ordinary shares, subject to certain forfeiture events.
We made grants of 3,577,686 RSUs to our employees on September 28, 2009. The vesting schedule for such RSU grants is as follows: 55.96% of the RSU grants vested immediately and was settled by cash in the amount of $6.5 million on the grant date, with the remainder vesting equally on each of September 30, 2010, 2011 and 2012, which will be settled by our ordinary shares, subject to certain forfeiture events.
Dividend Equivalents.
Any participant selected by the committee may be granted dividend equivalents based on the dividends declared on shares that are subject to any award, to be credited as of dividend payment dates, during the period between the date the award is granted and the date the award is exercised, vests, or expires, as determined by the committee, provided that unvested RSUs are currently not entitled to dividend equivalents. Dividend equivalents will be converted to cash or additional shares by such formula and at such time and subject to such limitations as determined by the committee.
Transferability of Awards.
Generally, awards cannot be sold, transferred, pledged, assigned, or otherwise alienated or hypothecated, other than by will or by the laws of descent and distribution.
76
Adjustments in Authorized Shares.
In the event of any of the corporate events or transactions described in the plan, to avoid any unintended enlargement or dilution of benefits, the committee has the sole discretion to substitute or adjust the number and kind of shares that can be issued or otherwise delivered.
Forfeiture Events.
The committee may specify in an award document that the participant’s rights, payments and benefits with respect to an award will be subject to reduction, cancellation, forfeiture or recoupment upon the occurrence of certain specified events, in addition to any otherwise applicable vesting or performance conditions of an award.
If we are required to prepare an accounting restatement owing to our material noncompliance, as a result of misconduct, with any financial reporting requirement under the securities laws, then if the participant is one of the individuals subject to automatic forfeiture under Section 304 of the Sarbanes-Oxley Act of 2002, the participant will reimburse us the amount of any payment in settlement of an award earned or accrued during the twelve-month period following the first public issuance or filing with the SEC (whichever first occurred) of the financial document embodying such financial reporting requirement.
Amendment and Termination.
Subject to, and except as, provided in the plan, the committee has the sole discretion to alter, amend, modify, suspend, or terminate the plan and any award document in whole or in part. Amendments to the plan are subject to shareholder approval, to the extent required by law, or by stock exchange rules or regulations.
6.E. Share Ownership
The following table sets forth the beneficial ownership of our ordinary shares, as of April 30, 2010, by each of our directors and executive officers.
|
Name
|
Number
of Shares Owned
|
Percentage of Shares Owned
|
||||||
|
Dr. Biing-Seng Wu
|
67,592,344 | 19.0 | % | |||||
|
Jordan Wu
|
25,472,468 | 7.2 | % | |||||
|
Jung-Chun Lin
|
- | - | ||||||
|
Chih-Chung Tsai
|
6,161,812 | 1.7 | % | |||||
|
Dr. Chun-Yen Chang
|
1,599,614 | 0.4 | % | |||||
|
Dr. Yan-Kuin Su
|
- | - | ||||||
|
Yuan-Chuan Horng
|
916,104 | 0.3 | % | |||||
|
Max Chan
|
55,466 | * | ||||||
|
John Chou
|
221,884 | 0.1 | % | |||||
|
Norman Hung
|
197,444 | 0.1 | % | |||||
None of our directors or executive officers has voting rights different from other shareholders.
7.A. Major Shareholders
On August 10, 2009, we effected certain changes in our capital stock structure in order to meet the Taiwan Stock Exchange’s primary listing requirement that the par value of shares be NT$10 or $0.3 per share and in order to increase the number of outstanding ordinary shares to be listed on the Taiwan Stock Exchange. In particular, we increased our authorized share capital from $50,000 (divided into 500,000,000 shares of par value $0.0001 each) to $300,000,000 (divided into 3,000,000,000,000 shares of par value $0.0001 each) and distributed 5,999 bonus shares for each share of par value $0.0001 held by shareholders of record as of August 7, 2009. These were followed by a consolidation of every 3,000 shares of par value $0.0001 each into one ordinary share of par value $0.3 each. As a result, the number of ordinary shares outstanding was doubled and each of our ordinary shares had a par value of $0.3.
77
In connection with the above changes, we also changed our ADS ratio effective August 10, 2009 from one ADS representing one ordinary share to one ADS representing two ordinary shares. Such change in ADS ratio was intended to adjust for the net dilutive effect due to the bonus shares distribution and the shares consolidation so that each ADS would represent the same percentage ownership in our share capital immediately before and after the above changes. The number of ADSs also remained the same immediately before and after the above changes.
As of April 30, 2010,
355,531,454
of our shares were outstanding. We believe that, of such shares,
153,843,686
shares in the form of ADSs were held by approximately
10,702
holders in the United States as of April 30, 2010.
The following table sets forth information known to us with respect to the beneficial ownership of our shares as of April 30, 2010, the most recent practicable date, by (i) each shareholder known by us to beneficially own more than 5% of our shares and (ii) all directors and executive officers as a group.
|
Name of Beneficial Owner
|
Number of Shares
Beneficially Owned
|
Percentage of Shares
Beneficially Owned
|
||||||
|
Dr. Biing-Seng Wu
|
67,592,344 | 19.0% | ||||||
|
FMR LLC
(1)
|
56,404,948 | 15.9% | ||||||
|
Chimei Innolux
(2)
|
49,645,058 | 14.0% | ||||||
|
Jordan Wu
|
25,472,468 | 7.2% | ||||||
|
All directors and executive officers as a group
|
102,217,136 | 28.8% | ||||||
|
Note:
|
(1) |
According to the amendment to the Schedule 13G filed with the SEC on April 12, 2010, FMR LLC, together with its affiliates, beneficially owned
56,404,948
of our shares, some or all of which may include shares represented by our ADS, as of December 31, 2009. We do not have further information with respect to any changes in FMR LLC’s beneficial ownership of our shares subsequent to December 31, 2009.
|
|
(2)
|
As of April 30, 2010
, Chimei Innolux also beneficially owns an equity interest of approximately 6.6% in our subsidiary Himax Media Solutions.
|
We have a close relationship with Chimei Innolux, one of our major shareholders and a leading TFT-LCD panel manufacturer based in Taiwan and listed on the Taiwan Stock Exchange. Chimei Innolux’s primary focus is the manufacture of large-sized TFT-LCD panels for use in notebook computers, desktop monitors and LCD televisions. Chimei Innolux was formerly known as Innolux and is the surviving entity following the completion of the merger of
CMO, Innolux, and TPO on March 18, 2010.
Several of Himax Taiwan’s initial employees, including Dr. Biing-Seng Wu, our chairman, were former employees of CMO. CMO was Himax Taiwan’s largest shareholder at the time of its incorporation, and Chimei Innolux currently is one of our largest shareholders. Chimei Innolux or CMO has also been our largest customer since our inception. In 2009, sales to CMO (together with its affiliates) accounted for 64.3% of our revenues. Certain of our directors also held or hold key management positions at
CMO or
its affiliates. Dr. Biing-Seng Wu, our chairman, was the vice chairman of the board of directors of
CMO prior to the merger
. Jung-Chun Lin, our director, also held the position of
senior vice president of finance and administration at CMO prior to the merger and is the chairman of the board of directors of CMO-NingBo and CMO-NanHai
. We also have entered into various transactions with CMO and its affiliates as further described below.
None of our major shareholders has voting rights different from other shareholders. We are not aware of any arrangement that may, at a subsequent date, result in a change of control of our company.
7.B. Related Party Transactions
Chimei Innolux and Related Companies
Chimei Innolux
Innolux was one of our largest customers in 2009. Following the completion of its merger with CMO and TPO on March 18, 2010, Innolux is renamed Chimei Innolux and became one of our major shareholders. We sell display drivers to Chimei Innolux and its affiliates. We expect Chimei Innolux to become our largest customer in 2010.
78
CMO
We sold display drivers to CMO prior to its merger with Innolux and TPO. We generated net sales to CMO in the amount of $
101.6
million in 2009. Our receivables from such sales were $
30.4
million as of December 31, 2009.
We lease office space, facilities and inventory locations from CMO and certain of its subsidiaries. Rent and utility expenses resulting from such leases in 2009 were $0.7 million. The related payables as of December 31, 2009 were $0.2 million. As of December 31, 2009, we agreed to make future minimum lease payments of $3.0 million in aggregate under non-cancelable operating leases with these related parties.
In 2009, we purchased consumable and miscellaneous items amounting to $0.3 million from CMO and other related parties. The related payables as of December 31, 2009 were $7,000.
In 2009, our board approved a donation of approximately $150,000 to Chi Mei Culture Foundation, a non-profit organization affiliated with CMO, which is dedicated to the promotion of the arts and culture in Taiwan.
CMO-NingBo
CMO-NingBo is a subsidiary of Chimei Innolux. We sell display drivers to CMO-NingBo. We generated net sales to CMO-NingBo in the amount of
$230.3
million in 2009. Our receivables from such sales were $73.0 million as of December 31, 2009.
CMO-NanHai
CMO-NanHai is a subsidiary of Chimei Innolux. We sell display drivers to CMO-NanHai. We generated net sales to CMO-NanHai in the amount of $
86.6
million in 2009. Our receivables from such sales were $
27.1
million as of December 31, 2009.
NingBo Chi Hsin Electronics Ltd.
NingBo Chi Hsin Electronics Ltd., or Chi Hsin-NingBo, is a subsidiary of Chimei Innolux. We sell display drivers for certain audio and visual and mobile applications to Chi Hsin-NingBo. We generated net sales to Chi Hsin-NingBo in the amount of $
23.8
million in 2009. Our receivables from such sales were $
6.4 million
as of December 31, 2009.
Dongguan Chi Hsin Electronics Co., Ltd.
Dongguan Chi Hsin Electronics Co., Ltd., or Chi Hsin-Dongguan, is a subsidiary of Chimei Innolux. We sell display drivers for certain audio and visual and mobile applications to Chi Hsin-Dongguan. We generated net sales to Chi Hsin-Dongguan in the amount of $
2.8
million in 2009. Our receivables from such sales were $0.
3 million
as of December 31, 2009.
Amlink (Shanghai) Ltd.
Amlink (Shanghai) Ltd., or Amlink, is a subsidiary of Ampower Holding Ltd., which is an equity-method investee of Chimei Innolux. We sell timing controllers and operational amplifiers to Amlink. We generated net sales to Amlink in the amount of $1.9 million in 2009. Our receivables from such sales were $
1.0 million
as of December 31, 2009.
7.C. Interests of Experts and Counsel
Not applicable.
79
8.A. Consolidated Statements and Other Financial Information
8.A.1.
See “Item 18. Financial Statements” for our audited consolidated financial statements.
8.A.2.
See “Item 18. Financial Statements” for our audited consolidated financial statements, which cover the last three financial years.
8.A.3.
See page F-2 for the report of our independent registered public accounting firm.
8.A.4.
Not applicable.
8.A.5.
Not applicable.
8.A.6.
See Note 22 to our audited consolidated financial statements included in “Item 18. Financial Statements.”
8.A.7. Litigation
On July 30, 2007, a class action was filed in the United States District Court for the Central District of California entitled Vivian Oh v. Max Chan, CV07-04891-DDP. The suit was allegedly brought on behalf of purchasers of our ordinary shares pursuant and/or traceable to our initial public offering on or about March 30, 2006. The complaint named our Chief Financial Officer, Max Chan, as the sole defendant, alleging a breach of fiduciary duty and violations of Sections 11, 12(a)(2) and 15 of the Securities Act. The complaint sought damages in an unspecified amount, rescission of the initial public offering, and attorney’s fees and costs. On August 30, 2007, a similar class action was filed in the same court entitled Michael Pfeiffer v. Himax Technologies, Inc., Max Chan, and Jordan Wu, CV07-05468-JFW. The suit was allegedly brought on behalf of purchasers of our ADSs issued in our initial public offering. The complaint named us, our Chief Executive Officer, Jordan Wu, and our Chief Financial Officer, Max Chan, as defendants, alleging violations of Sections 11 and 15 of the Securities Act. The complaint sought damages in an unspecified amount and attorney’s fees and costs.
On October 3, 2007, the plaintiffs moved to consolidate the cases, appoint lead plaintiffs and approve lead plaintiffs’ selection of counsel. That motion was granted on February 5, 2008. Plaintiffs filed an amended complaint on February 25, 2008. The amended complaint again names as defendants us, Jordan Wu, and Max Chan, and adds Chairman Biing-Seng Wu, director Jung-Chun Lin and CMO as defendants. The amended complaint alleges that defendants violated Sections 11 and 15 of the Securities Act by failing to disclose certain facts related to CMO’s inventory. Plaintiffs seek unspecified damages, attorney’s fees and expenses, and rescission of the initial public offering.
On January 22, 2009, we entered into a settlement agreement to settle the class action lawsuit, which must be approved by the court, following notice to members of the settlement class. The court issued an order of preliminary approval on April 23, 2009 and issued an order on September 24, 2009 granting final approval of the settlement agreement. The settlement resulted in a dismissal of all claims against us and the other defendants. In entering into the settlement agreement, the defendants explicitly denied any liability or wrongdoing of any kind. The amount of the settlement is $1.2 million, which was fully covered by our insurance carrier.
8.A.8. Dividends and Dividend Policy
Subject to the Cayman Islands Companies Law, we may declare dividends in any currency, but no dividend may be declared in excess of the amount recommended by our board of directors. Whether our board of directors recommends any dividends and the form, frequency and amount of dividends, if any, will depend upon our future operations and earnings, capital requirements and surplus, general financial condition, contractual restrictions and other factors as the board of directors may deem relevant.
On October 30, 2007, we paid a cash dividend to our shareholders in the amount of approximately $39.7 million, or the equivalent of $0.200 per ADS. On June 27, 2008, we paid a cash dividend in the amount of $66.8 million, or the equivalent of $0.350 per ADS. In 2009, we paid a cash dividend on June 29, 2009 in the amount of $55.5 million, or the equivalent of $0.300 per ADS, and distributed a stock dividend on August 10, 2009 of 5,999
80
ordinary shares of par value $0.0001 for each ordinary share of par value $0.0001 held by shareholders of record as of August 7, 2009. For more information on the stock dividend distribution, see “Item 7.A. Major Shareholders and Related Party Transactions—Major Shareholders.” In addition, on May 20, 2010, our board of directors declared an annual cash dividend of $0.125 per share, or $0.250 per ADS, which is expected to be payable on August 13, 2010 to shareholders of record as of August 6, 2010. The ADS book will be closed for issuance and cancellation from August 2, 2010 to August 6, 2010. The dividends for any of these years should not be considered representative of the dividends that would be paid in any future periods or of our dividend policy.
Our ability to pay cash or stock dividends will depend, at least partially, upon the amount of funds received by us from our direct and indirect subsidiaries, which must comply with the laws and regulations of their respective countries and respective articles of association. We receive cash from Himax Taiwan through intercompany borrowings. Himax Taiwan has not paid us cash dividends in the past. In accordance with ROC laws and regulations and Himax Taiwan’s articles of incorporation, Himax Taiwan is permitted to distribute dividends after allowances have been made for:
|
·
|
payment of taxes;
|
|
·
|
recovery of prior years’ deficits, if any;
|
|
·
|
legal reserve (in an amount equal to 10% of annual net income after having deducted the above items until such time as its legal reserve equals the amount of its total paid-in capital);
|
|
·
|
special reserve based on relevant laws or regulations, or retained earnings, if necessary;
|
|
·
|
dividends for preferred shares, if any; and
|
|
·
|
cash or stock bonus to employees (in an amount less than 10% of annual net income) and remuneration for directors and supervisor(s) (in an amount less than 2% of the annual net income); after having deducted the above items, based on a resolution of the board of directors; if stock bonuses are paid to employees, the bonus may also be appropriated to employees of subsidiaries under the board of directors’ approval.
|
Furthermore, if Himax Taiwan does not record any net income for any year as determined in accordance with generally accepted accounting principles in Taiwan, it generally may not distribute dividends for that year.
Any dividend we declare will be paid to the holders of ADSs, subject to the terms of the deposit agreement, to the same extent as holders of our ordinary shares, to the extent permitted by applicable law and regulations, less the fees and expenses payable under the deposit agreement. Any dividend we declare will be distributed by the depositary bank to the holders of our ADSs. Cash dividends on our ordinary shares, if any, will be paid in U.S. dollars.
8.B. Significant Changes
Except as disclosed elsewhere in this annual report, we have not experienced any significant changes since the date of the annual financial statements.
9.A. Offer and Listing Details
Our ADSs have been quoted on the Nasdaq Global Select Market under the symbol “HIMX” since March 31, 2006. The table below sets forth, for the periods indicated, the high and low market prices and the average daily volume of trading activity on the Nasdaq Global Select Market for the shares represented by ADSs.
|
High
|
Low
|
Average Daily Trading Volume
|
||||||||||
|
(in thousand of ADSs)
|
||||||||||||
|
2006 (from March 31)
|
$ | 9.45 | $ | 4.21 | 813.4 | |||||||
|
2007
|
6.15 | 3.53 | 741.1 | |||||||||
|
2008
|
6.29 | 1.00 | 590.1 | |||||||||
81
|
High
|
Low
|
Average Daily Trading Volume
|
||||||||||
|
(in thousand of ADSs)
|
||||||||||||
|
First quarter
|
5.75 | 3.18 | 758.4 | |||||||||
|
Second quarter
|
6.29 | 4.55 | 590.7 | |||||||||
|
Third quarter
|
5.45 | 2.62 | 620.1 | |||||||||
|
Fourth quarter
|
3.07 | 1.00 | 399.2 | |||||||||
|
2009
|
3.97 | 1.32 | 529.5 | |||||||||
|
First quarter
|
3.27 | 1.32 | 328.5 | |||||||||
|
Second quarter
|
3.80 | 2.47 | 708.8 | |||||||||
|
Third quarter
|
3.97 | 2.91 | 544.8 | |||||||||
|
Fourth quarter
|
3.32 | 2.16 | 529.3 | |||||||||
|
November
|
2.71 | 2.16 | 721.2 | |||||||||
|
December
|
3.24 | 2.57 | 396.2 | |||||||||
|
2010
|
||||||||||||
|
First quarter
|
3.20 | 2.72 | 270.5 | |||||||||
|
January
|
3.20 | 2.77 | 259.7 | |||||||||
|
February
|
3.12 | 2.72 | 287.1 | |||||||||
|
March
|
3.19 | 2.90 | 265.8 | |||||||||
|
April
|
3.28 | 3.01 | 261.7 | |||||||||
|
May
|
3.22 | 2.66 | 638.4 | |||||||||
9.B. Plan of Distribution
Not applicable.
9.C. Markets
The principal trading market for our shares is the Nasdaq Global Select Market, on which our shares are traded in the form of ADSs.
In November 2009, we filed a listing application with the Taiwan Stock Exchange to list our ordinary shares on its main board, which has been recently aborted in May 2010. Pursuant to the amendments to the Criteria Governing the Offering and Issuance of Securities by Foreign Issuers in Taiwan, which went into effect on May 19, 2010, we have become eligible to list TDRs on the Taiwan Stock Exchange. A major benefit of TDR listing for us, as opposed to primary listing, is that we would likely incur lower maintenance costs of listing in Taiwan because of the limited additional compliance requirements. We are currently preparing an application to list TDRs on the Taiwan Stock Exchange as an alternative to our aborted primary listing plan.
9.D. Selling Shareholders
Not applicable.
9.E. Dilution
Not applicable.
9.F. Expenses of the Issue
Not applicable.
10.A. Share Capital
Not applicable.
82
10.B. Memorandum and Articles of Association
Our shareholders previously adopted the Amended and Restated Memorandum of Association on September 26, 2005 by a special resolution passed by the sole shareholder of our company and the Amended and Restated Articles of Association at an extraordinary shareholder meeting held on October 25, 2005, both of which were filed as an exhibit to our registration statement on Form F-1 (file no. 333-132372) with the SEC on March 13, 2006.
On August 6, 2009, our shareholders adopted the Second Amended and Restated Memorandum and Articles of Association at our annual general meeting which became effective on August 10, 2009 and were filed as exhibits to our current report on Form 6-K with the SEC on July 13, 2009. These were adopted primarily in connection with our proposed Taiwan listing to meet the Taiwan Stock Exchange’s primary listing requirement concerning protection of material shareholders rights under ROC’s Company Act and Securities Exchange Act. At the same time, our shareholders also adopted the Third Amended and Restated Memorandum and Articles of Association, which are filed as Exhibit 1.1 hereto and are substantially the same as the Amended and Restated Memorandum and Articles of Association of our company except that our authorized share capital is stated to be $300,000,000 divided into 1,000,000,000 shares of nominal or par value of $0.3 each, on the condition that it shall become effective if the application made by our company to list its ordinary shares on the Taiwan Stock Exchange is rejected or aborted. On May 20, 2010, the Third Amended and Restated Memorandum and Articles of Association became effective as a result of the abortion of our primary listing application to the Taiwan Stock Exchange.
We incorporate by reference into this annual report the description of our Amended and Restated Memorandum and Articles of Association (except for provisions relating to our authorized share capital) contained in our F-1 registration statement (File No. 333-132372) filed with the SEC on March 13, 2006. Such description sets forth a summary of certain provisions of our memorandum and articles of association as currently in effect, which is qualified in its entirety by reference to the full text of the Third Amended and Restated Memorandum and Articles of Association. As of the date of this annual report, our authorized share capital is $300,000,000 divided into 1,000,000,000 shares of nominal or par value of $0.3 each.
10.C. Material Contracts
We are not currently, and have not been in the last two years, party to any material contract, other than contracts entered into in the ordinary course of business.
10.D. Exchange Controls
We have extracted from publicly available documents the information presented in this section. The information below may be applicable because our wholly owned operating subsidiary, Himax Technologies Limited, is incorporated in the ROC. Please note that citizens of the PRC and entities organized in the PRC are subject to special ROC laws, rules and regulations, which are not discussed in this section.
The ROC’s Foreign Exchange Control Statute and regulations provide that all foreign exchange transactions must be executed by banks designated to handle foreign exchange transactions by the Central Bank of ROC. There is an annual limit on the amount of currency a Taiwanese entity may convert into, or out of, NT dollars other than for trade purposes. Current regulations favor trade-related foreign exchange transactions.
With regard to inward and outward remittances, approval by the Central Bank of ROC is generally required for any conversion exceeding, in aggregate in each calendar year, $50 million (or its equivalent) for companies and $5 million (or its equivalent) for Taiwanese and resident foreign individuals. A requirement is also imposed on all private enterprises to report all medium- and long-term foreign debt with the Central Bank of ROC.
In addition, a foreign person without an alien resident card or an unrecognized foreign entity may remit to and from Taiwan foreign currencies of up to $100,000 per remittance if required documentation is provided to ROC authorities. This limit applies only to remittances involving a conversion between NT dollars and U.S. dollars or other foreign currencies.
83
10.E. Taxation
Cayman Islands Taxation
The Cayman Islands currently levies no taxes on individuals or corporations based upon profits, income, gains or appreciation, and there is no taxation in the nature of inheritance tax or estate duty. There are no other taxes likely to be material to us levied by the Government of the Cayman Islands except for stamp duties which may be applicable on instruments executed in, or brought within the jurisdiction of the Cayman Islands. The Cayman Islands is not party to any double tax treaties. There are no exchange control regulations or currency restrictions in the Cayman Islands.
We have, pursuant to Section 6 of the Tax Concessions Law (1999 Revision) of the Cayman Islands, obtained an undertaking from the Governor-in-Council that:
(a) no law which is enacted in the Cayman Islands imposing any tax to be levied on profits, income or gains or appreciations shall apply to us or our operations;
(b) the aforesaid tax or any tax in the nature of estate duty or inheritance tax shall not be payable on our ordinary shares, debentures or other obligations.
The undertaking that we have obtained is for a period of 20 years from May 3, 2005.
United States Federal Income Taxation
The following is a description of the material U.S. federal income tax consequences to the U.S. Holders described below of owning and disposing of ordinary shares or ADSs, but it does not purport to be a comprehensive description of all tax considerations that may be relevant to a particular person’s decision to hold the securities. This discussion applies only to a U.S. Holder that holds ordinary shares or ADSs as capital assets for tax purposes. In addition, it does not describe all of the tax consequences that may be relevant in light of the U.S. Holder’s particular circumstances, including alternative minimum tax consequences and tax consequences applicable to U.S. Holders subject to special rules, such as:
|
·
|
certain financial institutions;
|
|
·
|
dealers or traders in securities who use a mark-to-market method of tax accounting;
|
|
·
|
persons holding ordinary shares or ADSs as part of a hedging transaction, straddle, wash sale, conversion transaction or integrated transaction or persons entering into a constructive sale with respect to the ordinary shares or ADSs;
|
|
·
|
persons whose functional currency for U.S. federal income tax purposes is not the U.S. dollar;
|
|
·
|
entities classified as partnerships for U.S. federal income tax purposes;
|
|
·
|
tax-exempt entities, including “individual retirement accounts” or “Roth IRAs”;
|
|
·
|
persons that own or are deemed to own ten percent or more of our voting stock;
|
|
·
|
persons who acquired our ordinary shares or ADSs pursuant to the exercise of an employee stock option or otherwise as compensation; or
|
|
·
|
persons holding ordinary shares or ADSs in connection with a trade or business conducted outside of the United States.
|
If an entity that is classified as a partnership for U.S. federal income tax purposes holds ordinary shares or ADSs, the U.S. federal income tax treatment of a partner will generally depend on the status of the partner and the activities of the partnership. Partnerships holding ordinary shares or ADSs and partners in such partnerships should consult their tax advisers as to the particular U.S. federal income tax consequences of holding and disposing of the ordinary shares or ADSs.
84
This discussion is based on the Internal Revenue Code of 1986, as amended, administrative pronouncements, judicial decisions and final, temporary and proposed Treasury regulations, all as of the date hereof. These laws are subject to change, possibly on a retroactive basis. It is also based in part on representations by the depositary and assumes that each obligation under the deposit agreement and any related agreement will be performed in accordance with its terms. Please consult your own tax adviser concerning the U.S. federal, state, local and non-U.S. tax consequences of owning and disposing of ordinary shares or ADSs in your particular circumstances.
As used herein, a “U.S. Holder” is a beneficial owner of ordinary shares or ADSs that is, for U.S. federal tax purposes: (i) a citizen or resident of the United States; (ii) a corporation, or other entity taxable as a corporation, created or organized in or under the laws of the United States or any political subdivision thereof; or (iii) an estate or trust the income of which is subject to U.S. federal income taxation regardless of its source.
In general, a U.S. Holder of ADSs will be treated for U.S. federal income tax purposes as the owner of the underlying ordinary shares represented by those ADSs. Accordingly, no gain or loss will be recognized if a U.S. Holder exchanges ADSs for the underlying ordinary shares represented by those ADSs.
The U.S. Treasury has expressed concerns that parties to whom American depositary shares are released before delivery of shares to the depositary (“pre-release”) may be taking actions that are inconsistent with the claiming of foreign tax credits for U.S. holders of American depositary shares. Such actions would also be inconsistent with the claiming of the reduced rate of tax, described below, applicable to dividends received by certain non-corporate U.S. holders. Accordingly, the availability of the reduced tax rate for dividends received by certain non-corporate U.S. Holders, described below, could be affected by actions taken by parties to whom ADSs are pre-released.
This discussion assumes that we are not, and will not become, a passive foreign investment company (as discussed below).
Taxation of Distributions
Distributions received by U.S. Holders with respect to the ordinary shares or ADSs, other than certain pro rata distributions of ordinary shares, will constitute foreign-source dividend income for U.S. federal income tax purposes to the extent paid out of our current or accumulated earnings and profits, as determined in accordance with U.S. federal income tax principles. We do not expect to maintain records of earnings and profits in accordance with U.S. federal income tax principles, and therefore it is expected that distributions will generally be reported to U.S. Holders as dividends. Subject to applicable limitations and the discussion above regarding concerns expressed by the U.S. Treasury, dividends paid by qualified foreign corporations to certain non-corporate U.S. Holders in taxable years beginning before January 1, 2011 may be taxable at favorable rates, up to a maximum rate of 15%. A foreign corporation is treated as a qualified foreign corporation with respect to dividends paid on stock that is readily tradable on a securities market in the United States, such as the Nasdaq Global Select Market, where our ADSs are traded. Our ordinary shares are not traded on a securities market in the United States. Non-corporate U.S. Holders of our ordinary shares or ADSs should consult their own tax advisers regarding their eligibility for taxation at such favorable rates and whether they are subject to any special rules that limit their ability to be taxed at such favorable rates. Corporate U.S. Holders will not be entitled to claim the dividends-received deduction with respect to dividends paid by us.
Sale and Other Disposition of Ordinary Shares or ADSs
A U.S. Holder will generally recognize U.S.-source capital gain or loss for U.S. federal income tax purposes on the sale or other disposition of ordinary shares or ADSs, which will be long-term capital gain or loss if the ordinary shares or ADSs were held for more than one year. The amount of gain or loss will be equal to the difference between the amount realized on the sale or other disposition and the U.S. Holder’s tax basis in the ordinary shares or ADSs.
Passive Foreign Investment Company Rules
We believe that we were not a passive foreign investment company (a “PFIC”) for U.S. federal income tax purposes for our taxable year ended December 31, 2009.
85
In general, a non-U.S. company will be a PFIC for U.S. federal income tax purposes for any taxable year in which (i) 75% or more of its gross income consists of passive income (such as dividends, interest, rents and royalties) or (ii) 50% or more of the average quarterly value of its assets consists of assets that produce, or are held for the production of, passive income. As PFIC status depends upon the composition of our income and assets and the market value of our assets (including, among other things, any equity investments in less than 25%-owned entities) from time to time, there can be no assurance that we will not be a PFIC for any taxable year.
If we were a PFIC for any taxable year during which a U.S. Holder held ordinary shares or ADSs, certain adverse U.S. federal income tax rules would apply on a sale or other disposition (including a pledge) of ordinary shares or ADSs by the U.S. Holder. In general, under those rules, gain recognized by the U.S. Holder on a sale or other disposition of ordinary shares or ADSs would be allocated ratably over the U.S. Holder’s holding period for the ordinary shares or ADSs. The amounts allocated to the taxable year of the sale or other disposition and to any year before we became a PFIC would be taxed as ordinary income. The amount allocated to each other taxable year would be subject to tax at the highest rate in effect for individuals or corporations, as appropriate for that taxable year, and an interest charge would be imposed on the tax attributable to such allocated amounts. Similar rules would apply to any distribution in respect of ordinary shares or ADSs to the extent in excess of 125% of the average of the annual distributions on ordinary shares or ADSs received by the U.S. Holder during the preceding three years or the U.S. Holder’s holding period, whichever is shorter. Certain elections may be available that would result in alternative treatments (such as mark-to-market treatment) of the ordinary shares or ADSs. U.S. Holders should consult their tax advisers to determine whether any of these elections would be available and, if so, what the consequences of the alternative treatments would be in their particular circumstances.
In addition, if we were a PFIC in a taxable year in which we pay a dividend or in the prior taxable year, the 15% dividend rate discussed above with respect to dividends received by certain non-corporate U.S. Holders would not apply.
Information Reporting and Backup Withholding
Payments of dividends and sales proceeds that are made within the United States or through certain U.S.-related financial intermediaries generally are subject to information reporting, and may be subject to backup withholding, unless the U.S. Holder is a corporation or other exempt recipient or, in the case of backup withholding, the U.S. Holder provides a correct taxpayer identification number and certifies that it is not subject to backup withholding. The amount of any backup withholding from a payment to a U.S. Holder will be allowed as a credit against the U.S. Holder’s U.S. federal income tax liability and may entitle the U.S. Holder to a refund, provided that the required information is timely furnished to the Internal Revenue Service.
10.F. Dividends and Paying Agents
Not applicable.
10.G. Statement by Experts
Not applicable.
10.H. Documents on Display
It is possible to read and copy documents referred to in this annual report that have been filed with the SEC at the SEC’s public reference rooms in Washington, D.C., New York and Chicago, Illinois. Please call the SEC at 1-800-SEC-0330 for further information on the reference rooms.
10.I. Subsidiary Information
Not applicable.
Interest Rate Risk.
Our exposure to interest rate risk for changes in interest rates is limited to the interest income generated by our cash deposited with banks.
86
Foreign Exchange Risk.
The U.S. dollar is our reporting currency. The U.S. dollar is also the functional currency for the majority of our operations. In 2009, more than 99.0% of our sales and cost of revenues were denominated in U.S. dollars. However, in December 2009, approximately 45.9% of our operating expenses were denominated in NT dollars, with a small percentage denominated in Japanese Yen, Korean Won and Chinese Renminbi, and the majority of the remainder denominated in U.S. dollars. We anticipate that we will continue to conduct substantially all of our sales in U.S. dollars. We do not believe that we have a material currency risk with regard to the NT dollar.
We believe the majority of any potential adverse foreign currency exchange impacts on our operating assets may be offset by a potential favorable foreign currency exchange impact on our operating liabilities. From time to time we have engaged in, and may continue to engage in, forward contracts to hedge against our foreign currency exposure.
As of December 31, 2009, no foreign currency exchange contracts are outstanding.
12.A. Debt Securities
Not applicable.
12.B. Warrants and Rights
Not applicable.
12.C. Other Securities
Not applicable.
12.D. American Depositary Shares
Fees and Charges Payable by ADS Holders
To any person to whom ADSs are issued or to whom a distribution is made in respect of ADS distributions pursuant to stock dividends or other free distributions of stock, bonus distributions, stock splits, rights distributions or other distributions, and for each surrender of ADSs for cancellation and withdrawal of deposited securities including cash distributions made pursuant to a cancellation or withdrawal, the fee in each case is a fee not in excess of $5.00 for each 100 ADSs, or any portion thereof, issued or surrendered. The depositary also charges a fee not in excess of $2.00 per 100 ADSs for distribution of cash proceeds pursuant to a cash dividend (so long as the charging of such fee is not prohibited by any exchange upon which the ADSs are listed), sale of rights and other entitlements not made pursuant to a cancellation or withdrawal or otherwise. The depositary may also charge an annual fee of $0.02 or less per ADS for the operation and maintenance costs in administering the facility, provided, however, that if the depositary imposes such fee, such fee, combined with any fee imposed for the distribution of cash proceeds pursuant to a cash dividend, shall not exceed $0.02 per ADS in any calendar year. In addition, holders, beneficial owners, persons depositing shares and persons surrendering ADSs for cancellation and withdrawal of deposited securities will be required to pay the following:
|
·
|
taxes and other governmental charges incurred by the depositary or the custodian on any ADSs or underlying shares, including any applicable interest and penalties thereon, and any stock transfer or other taxes and other governmental charges;
|
|
·
|
cable, telex, facsimile and electronic transmission and delivery expenses
|
|
·
|
transfer or registration fees for the registration of transfer of shares or other deposited securities with any applicable registrar in connection with the deposit or withdrawal of deposited securities and transfer of shares or other deposited securities to or from the name of the custodian, the depositary or any nominees upon the making of deposits and withdrawals;
|
|
·
|
expenses and charges of the depositary in connection with the conversion of foreign currency into U.S. dollars;
|
87
|
·
|
fees and expenses incurred by the depositary in connection with compliance with exchange control regulations and other regulatory requirements applicable to the shares, deposited securities, ADSs and ADRs;
|
|
·
|
fees and expenses incurred by the depositary in connection with the delivery of the deposited securities, including any fees of a central depository for securities in the local market, where applicable; and
|
|
·
|
any other additional fees, charges, costs or expenses that may be incurred by the depositary from time to time.
|
In the case of cash distributions, fees and charges of, and expenses incurred by, the depositary and taxes, duties or other governmental charges required to be withheld by the depositary, the custodian or our company are generally deducted from the cash being distributed. Service fees may be collected from holders of ADSs in a manner determined by the depositary with respect to ADSs registered in the name of investors (whether certificated or in book-entry form) and ADSs held in brokerage and custodian accounts (via The Depository Trust and Clearing Corporation, or DTC). In the case of distributions other than cash (i.e., stock dividends, rights, etc.), the depositary charges the applicable ADS record date holder concurrent with the distribution. In the case of ADSs registered in the name of the investor (whether certificated or in book-entry form), the depositary sends invoices to the applicable record date ADS holders.
In the case of ADSs held in brokerage and custodian accounts (via DTC), the depositary may, if permitted by the settlement systems provided by DTC, collect the fees through such settlement systems (whose nominee is the registered holder of the ADSs held in DTC) from the brokers and custodians holding ADSs in their DTC accounts. The brokers and custodians who hold their clients’ ADSs in DTC accounts in such case may in turn charge their clients’ accounts the amount of the service fees paid to the depositary.
If any tax or other governmental charge shall become payable by the depositary or the custodian with respect to any ADSs, ADRs or deposited securities, such tax or other governmental charge shall be payable by the holders and beneficial owners of ADSs to the depositary. The depositary, the custodian or our company may withhold or deduct from any distributions made in respect of deposited securities and may sell, by public or private sale, for the account of the holder and/or beneficial owner any or all of the deposited securities and apply such distributions and sale proceeds in payment of such taxes (including applicable interest and penalties) or charges, with the holder and the beneficial owner thereof remaining fully liable for any deficiency. The custodian may refuse the deposit of shares, and the depositary may refuse to issue ADSs, to deliver ADRs, register the transfer, split-up or combination of ADSs and the withdrawal of deposited securities, until payment in full of such tax, charge, penalty or interest is received.
Fees and Other Payments from the Depositary to Us
In August 2009, we received a payment of $1.3 million from the depositary relating to the ADR program, which was intended to cover certain of our expenses incurred in relation to the ADR program for the year, including:
|
·
|
legal, audit and other fees incurred in connection with preparation of Form 20-F and annual reports and ongoing SEC compliance and listing requirements;
|
|
·
|
director and officer insurance;
|
|
·
|
stock exchange listing fees;
|
|
·
|
roadshow expenses;
|
|
·
|
costs incurred by financial printer and share certificate printer;
|
|
·
|
postage for communications to ADR holders;
|
|
·
|
costs of retaining third party public relations, investor relations, and/or corporate communications advisory firms in the U.S.; and
|
|
·
|
costs incurred in connection with participation in retail investor shows and capital markets days.
|
88
Not applicable.
Not applicable.
Evaluation of Disclosure Controls and Procedures
Our chief executive officer and chief financial officer, after evaluating the effectiveness of our disclosure controls and procedures (as defined in Rule 13a-15(e) under the Exchange Act) as of the end of the period covered by this report, have concluded that based on the evaluation of these controls and procedures required by Rule 13a-15(b) of the Exchange Act, our disclosure controls and procedures were effective.
Management’s Report on Internal Control over Financial Reporting
Our management is responsible for establishing and maintaining adequate internal control over financial reporting. Our internal control over financial reporting is designed to provide reasonable assurance regarding the reliability of financial reporting and the preparation of financial statements for external purposes in accordance with U.S. GAAP.
Our internal control over financial reporting includes those policies and procedures that:
|
·
|
pertain to the maintenance of records that, in reasonable detail, accurately and fairly reflect our transactions and dispositions of our assets;
|
|
·
|
provide reasonable assurance that our transactions are recorded as necessary to permit preparation of our financial statements in accordance with U.S. GAAP, and that our receipts and expenditures are being made only in accordance with authorizations of our management and our directors; and
|
|
·
|
provide reasonable assurance regarding prevention or timely detection of unauthorized acquisition, use or disposition of our assets that could have a material effect on the financial statements.
|
Because of its inherent limitations, internal control over financial reporting may not prevent or detect misstatements. Projections of any evaluation of internal control effectiveness to future periods are subject to the risk that controls may become inadequate because of changes in conditions, or that the degree of compliance with the policies or procedures may deteriorate.
Management, with the participation of our chief executive and chief financial officers, assessed the effectiveness of our internal control over financial reporting (as defined in Rule 13a-15(f) under the Exchange Act) as of December 31, 2009 based on the criteria set forth in
Internal Control – Integrated Framework
issued by the Committee of Sponsoring Organizations of the Treadway Commission. Based on the assessment, our management believes that our internal control over financial reporting was effective as of December 31, 2009.
KPMG, an independent registered public accounting firm, has issued an audit report on the effectiveness of our internal control over financial reporting as of December 31, 2009, which is included below:
89
Report of Independent Registered Public Accounting Firm
The Board of Directors and Stockholders
Himax Technologies, Inc.:
We have audited Himax Technologies, Inc.’s internal control over financial reporting as of December 31, 2009, based on criteria established in
Internal Control – Integrated Framework
issued by the Committee of Sponsoring Organizations of the Treadway Commission (COSO). Himax Technologies, Inc.’s management is responsible for maintaining effective internal control over financial reporting, and for its assessment of the effectiveness of internal control over financial reporting, included in the accompanying Management’s Report on Internal Control over Financial Reporting. Our responsibility is to express an opinion on the company’s internal control over financial reporting based on our audits.
We conducted our audit in accordance with the standards of the Public Company Accounting Oversight Board (United States). Those standards require that we plan and perform the audit to obtain reasonable assurance about whether effective internal control over financial reporting was maintained in all material respects. Our audit included obtaining an understanding of internal control over financial reporting, assessing the risk that a material weakness exists, and testing and evaluating the design and operating effectiveness of internal control based on the assessed risk. Our audit also included performing such other procedures as we considered necessary in the circumstances. We believe that our audit provides a reasonable basis for our opinion.
A company’s internal control over financial reporting is a process designed to provide reasonable assurance regarding the reliability of financial reporting and the preparation of financial statements for external purposes in accordance with generally accepted accounting principles. A company’s internal control over financial reporting includes those policies and procedures that (1) pertain to the maintenance of records that, in reasonable detail, accurately and fairly reflect the transactions and dispositions of the assets of the company; (2) provide reasonable assurance that transactions are recorded as necessary to permit preparation of financial statements in accordance with generally accepted accounting principles, and that receipts and expenditures of the company are being made only in accordance with authorizations of management and directors of the company; and (3) provide reasonable assurance regarding prevention or timely detection of unauthorized acquisition, use, or disposition of the company’s assets that could have a material effect on the financial statements.
Because of its inherent limitations, internal control over financial reporting may not prevent or detect misstatements. Also, projections of any evaluation of effectiveness to future periods are subject to the risk that controls may become inadequate because of changes in conditions, or that the degree of compliance with the policies or procedures may deteriorate.
In our opinion, Himax Technologies, Inc. maintained, in all material respects, effective internal control over financial reporting as of December 31, 2009, based on criteria established in
Internal Control – Integrated Framework
issued by the COSO.
We also have audited, in accordance with the standards of the Public Company Accounting Oversight Board (United States), the consolidated balance sheets of Himax Technologies, Inc and subsidiaries as of December 31, 2009 and 2008, and the related consolidated statements of income, comprehensive income, equity and cash flows for each of the years in the three-year period ended December 31, 2009, and our report dated June 3, 2010 expressed an unqualified opinion on those consolidated financial statements.
/s/ KPMG
Taipei, Taiwan (the Republic of China)
June 3, 2010
Changes in Internal Control Over Financial Reporting
In 2009, no change in our internal control over financial reporting has occurred during the period covered by this annual report that has materially affected, or is reasonably likely to materially affect, our internal control over financial reporting.
Our board of directors has determined that Yuan-Chuan Horng is an audit committee financial expert, as that term is defined in Item 16A(b) of Form 20-F, and is independent for the purposes of Rule 5605(a)(2) of the Nasdaq Rules and Rule 10A-3 of the Exchange Act.
90
Our board of directors has adopted a code of business conduct and ethics that applies to our directors, officers and employees, including our principal executive officer, principal financial officer, principal accounting officer or controller and any other persons who perform similar functions for us. We will provide a copy of our code of business conduct and ethics without charge upon written request to:
Himax Technologies, Inc.
Human Resources Department
No. 26, Zih Lian Road, Tree Valley Park
Sinshih Township, Tainan County 74148
Taiwan, Republic of China
KPMG, our independent registered public accounting firm, began serving as our auditor upon the formation of our company in 2001.
Our audit committee is responsible for the oversight of KPMG’s work. The policy of our audit committee is to pre-approve all audit and non-audit services provided by KPMG, including audit services, audit-related services, tax services and other services.
We paid the following fees for professional services to KPMG for the years ended December 31, 2008 and 2009.
|
Year ended December 31,
|
||||||||
|
Services
|
2008
|
2009
|
||||||
|
Audit Fees
(1)
|
$ | 720,000 | $ | 786,000 | ||||
|
All Other Fees
(2)
|
12,000 | 17,000 | ||||||
|
Total
|
$ | 732,000 | $ | 803,000 | ||||
|
Note:
|
(1) |
Audit Fees. This category includes the audit of our annual financial statements and internal control over financial reporting, review of quarterly financial statements and services that are normally provided by the independent auditors in connection with statutory and regulatory filings or engagements for those fiscal years. This category also includes statutory audits required by the Tax Bureau of the ROC.
|
|
(2)
|
All Other Fees. This category consists of fees for the preparation of transfer pricing reports.
|
Not applicable.
On November 1, 2007, our board of directors authorized a share buyback program allowing us to repurchase up to $40.0 million of our ADSs in the open market or through privately negotiated transactions. We concluded this share buyback program in the first quarter of 2008 and repurchased a total of approximately $33.1 million of our ADSs (equivalent to approximately 7.7 million ADSs) from the open market.
On November 14, 2008, our board of directors authorized another share buyback program allowing us to repurchase up to $50.0 million of our ADSs in the open market or through privately negotiated transactions. As of May 31, 2010, we had repurchased a total of approximately $45.2 million of our ADSs (approximately 17.5 million ADSs) under this program from the open market.
91
The following table sets forth information regarding transactions completed under the two share buyback programs for each of the specified periods.
|
Period
|
(a) Total Number of ADSs Purchased
|
(b) Average Price Paid per ADS
|
(c) Total Number of ADSs Purchased as Part of Publicly Announced Plans or Programs
|
(d) Approximate Dollar Value of ADSs That May Yet Be Purchased Under the Plans or Programs
|
||||||||||||
|
2007 Share Buyback Program:
|
||||||||||||||||
|
November 8, 2007 to November 30, 2007
|
3,973,514 | $ | 4.38 | 3,973,514 | $ | 22,612,902 | ||||||||||
|
December 1, 2007 to December 31, 2007
|
2,595,594 | $ | 4.23 | 6,569,108 | $ | 11,633,090 | ||||||||||
|
January 1, 2008 to January 31, 2008
|
849,914 | $ | 4.24 | 7,419,022 | $ | 8,025,902 | ||||||||||
|
March 1, 2008 to March 18, 2008
|
224,128 | $ | 4.67 | 7,643,150 | $ | 6,980,313 | ||||||||||
|
July 1, 2008 to July 17, 2008
|
21,300 | $ | 4.21 | 7,664,450 | $ | 6,890,632 | ||||||||||
|
2008 Share Buyback Program:
|
||||||||||||||||
|
November 17, 2008 to November 30, 2008
|
561,411 | $ | 1.52 | 561,411 | $ | 49,144,319 | ||||||||||
|
December 1, 2008 to December 31, 2008
|
1,807,680 | $ | 1.35 | 2,369,091 | $ | 46,695,254 | ||||||||||
|
January 1, 2009 to January 31, 2009
|
1,243,903 | $ | 1.58 | 3,612,994 | $ | 44,728,654 | ||||||||||
|
February 1, 2009 to February 28, 2009
|
928,621 | $ | 1.70 | 4,541,615 | $ | 43,152,903 | ||||||||||
|
March 1, 2009 to March 31, 2009
|
643,884 | $ | 2.12 | 5,185,499 | $ | 41,785,487 | ||||||||||
|
April 1, 2009 to April 30, 2009
|
1,580,525 | $ | 2.73 | 6,766,024 | $ | 37,466,191 | ||||||||||
|
May 1, 2009 to May 18, 2009
|
734,939 | $ | 2.67 | 7,500,963 | $ | 35,501,073 | ||||||||||
|
July 8, 2009 to July 31, 2009
|
979,039 | $ | 3.63 | 8,480,002 | $ | 31,946,031 | ||||||||||
|
August 3, 2009 to August 31, 2009
|
1,734,252 | $ | 3.41 | 10,214,254 | $ | 26,029,399 | ||||||||||
|
September 1, 2009 to September 29, 2009
|
1,403,787 | $ | 3.36 | 11,618,041 | $ | 21,306,237 | ||||||||||
|
October 1, 2009 to October 30, 2009
|
1,574,538 | $ | 2.99 | 13,192,579 | $ | 16,590,908 | ||||||||||
|
November 2, 2009 to November 30, 2009
|
1,482,205 | $ | 2.44 | 14,674,784 | $ | 12,978,152 | ||||||||||
|
December 2, 2009 to December 31, 2009
|
819,558 | $ | 2.91 | 15,494,342 | $ | 10,597,029 | ||||||||||
|
January 22, 2010 to January 29, 2010
|
280,237 | $ | 2.95 | 15,774,579 | $ | 9,769,423 | ||||||||||
|
February 1, 2010 to February 26, 2010
|
752,978 | $ | 2.90 | 16,527,557 | $ | 7,586,933 | ||||||||||
|
March 2, 2010 to March 19, 2010
|
207,150 | $ | 2.99 | 16,734,707 | $ | 6,967,341 | ||||||||||
|
May 5, 2010 to May 25, 2010
|
780,239 | $ | 2.81 | 17,514,946 | $ | 4,772,512 | ||||||||||
Not applicable.
The Nasdaq Rules provide that foreign private issuers may follow home country practice in lieu of the corporate governance requirements
of the Nasdaq Stock Market LLC
, subject to certain exceptions and requirements and except to the extent that such exemptions would be contrary to U.S. federal securities laws and regulations. The significant differences between our corporate governance practices and those followed by U.S. companies under the Nasdaq Rules are summarized as follows:
|
·
|
We follow home country practice that permits our board of directors to have less than a majority of independent directors within the meaning of Rule 5605(a)(2) of the Nasdaq Rules, in lieu of complying with Rule 5605(b)(1) of the Nasdaq Rules that require boards of U.S. companies to have a board of directors which is comprised of a majority of independent directors.
|
|
·
|
We follow home country practice that permits our independent directors not to hold regularly scheduled meetings at which only independent directors are present in lieu of complying with Rule
5605
(b)(2).
|
|
·
|
We follow home country practice that permits a compensation committee to contain a director who does not meet the definition of “independence” within the meaning of Rule
5605(a)(2)
of the Nasdaq Rules, in
|
92
lieu of complying with Rule 5605(d)(1)(B) and (2)(B) of the Nasdaq Rules which requires the compensation committees of U.S. companies to be comprised solely of independent directors.
|
·
|
We follow home country practice that permits a nominations committee to contain a director who does not meet the definition of “independence” within the meaning of Rule 5605(a)(2) of the Nasdaq Rules, in lieu of complying with Rule 5605(e)(1)(B) of the Nasdaq Rules that requires the nominations committees of U.S. companies be comprised solely of independent directors.
|
We have elected to provide financial statements for fiscal year 2009 and the related information pursuant to Item 18.
Our consolidated financial statements and the report thereon by the independent auditors listed below are attached hereto as follows:
(a) Report of Independent Registered Public Accounting Firm dated June 3, 2010.
(b) Consolidated Balance Sheets of the Company and subsidiaries as of December 31, 2008 and 2009.
(c) Consolidated Statements of Income of the Company and subsidiaries for the years ended December 31, 2007, 2008 and 2009.
(d) Consolidated Statements of Comprehensive Income of the Company and subsidiaries for the years ended December 31, 2007, 2008 and 2009.
(e) Consolidated Statements of Equity of the Company and subsidiaries for the years ended December 31, 2007, 2008 and 2009.
(f) Consolidated Statements of Cash Flows of the Company and subsidiaries for the years ended December 31, 2007, 2008 and 2009.
(g) Notes to Consolidated Financial Statements of the Company and subsidiaries.
93
|
Exhibit Number
|
Description of Document
|
|
1.1
|
Third Amended and Restated Memorandum and Articles of Association of the Registrant, as currently in effect.
|
|
2.1
|
Registrant’s Specimen American Depositary Receipt (included in Exhibit 2.3).
|
|
2.2
|
Registrant’s Specimen Certificate for Ordinary Shares. (Incorporated by reference to Exhibit 4.2 from our Registration Statement on Form F-1 (file no. 333-132372) filed with the Securities and Exchange Commission on March 13, 2006.)
|
|
2.3
|
Form of Deposit Agreement among the Registrant, the depositary and holders of the American depositary receipts. (Incorporated by reference to Exhibit (a) from our Registration Statement on Form F-6 (file no. 333-132383) filed with the Securities and Exchange Commission on March 13, 2006.)
|
|
2.4
|
Form of Amendment No.1 to Deposit Agreement among the Registrant and the depositary. (Incorporated by reference to Exhibit (a)(2) from our Post Effective Amendment No. 1 to Form F-6 (file no. 333-132383) filed with the Securities and Exchange Commission on August 6, 2009.)
|
|
2.5
|
Share Exchange Agreement dated June 16, 2005 between Himax Technologies, Inc. and Himax Technologies Limited. (Incorporated by reference to Exhibit 4.4 from our Registration Statement on Form F-1 (file no. 333-132372) filed with the Securities and Exchange Commission on March 13, 2006.)
|
|
2.6
|
Letter of the ROC Investment Commission, Ministry of Economic Affairs dated August 30, 2005 relating to the approval of Himax Technologies, Inc.’s inbound investment in Taiwan. (Incorporated by reference to Exhibit 4.5 from our Registration Statement on Form F-1 (file no. 333-132372) filed with the Securities and Exchange Commission on March 13, 2006.)
|
|
2.7
|
Letter of the ROC Investment Commission, Ministry of Economic Affairs dated September 7, 2005 relating to the approval of Himax Technologies Limited’s outbound investment outside of Taiwan. (Incorporated by reference to Exhibit 4.6 from our Registration Statement on Form F-1 (file no. 333-132372) filed with the Securities and Exchange Commission on March 13, 2006.)
|
|
4.1
|
Himax Technologies, Inc. 2005 Long-Term Incentive Plan. (Incorporated by reference to Exhibit 10.1 from our Registration Statement on Form F-1 (file no. 333-132372) filed with the Securities and Exchange Commission on March 13, 2006.)
|
|
4.2
|
Plant Facility Service Agreement dated April 22, 2010 between Himax Display, Inc. and Chi Mei Innolux Corporation
|
|
8.1
|
List of Subsidiaries.
|
|
12.1
|
Certification of Jordan Wu, President and Chief Executive Officer of Himax Technologies, Inc., pursuant to Section 302 of the Sarbanes-Oxley Act of 2002.
|
|
12.2
|
Certification of Max Chan, Chief Financial Officer of Himax Technologies, Inc., pursuant to Section 302 of the Sarbanes-Oxley Act of 2002.
|
|
13.1
|
Certification pursuant to 18 U.S.C. Section 1350, as adopted pursuant to Section 906 of the Sarbanes-Oxley Act of 2002.
|
|
15.1
|
Consent of KPMG, Independent Registered Public Accounting Firm.
|
94
SIGNATURES
Pursuant to the requirements of Section 12 of the Securities Exchange Act of 1934, the registrant certifies that it meets all of the requirements for filing on Form 20-F and has duly caused this annual report to be signed on its behalf by the undersigned, thereunto duly authorized.
|
HIMAX TECHNOLOGIES, INC.
|
|||
| By: |
/s/ Jordan Wu
|
||
| Name: |
Jordan Wu
|
||
| Title: |
President and Chief Executive Officer
|
||
Date: June 3, 2010
95
HIMAX TECHNOLOGIES, INC.
INDEX TO CONSOLIDATED FINANCIAL STATEMENTS
|
Page
|
|
|
Report of Independent Registered Public Accounting Firm
|
F-2
|
|
Consolidated Balance Sheets as of December 31, 2008 and 2009
|
F-3
|
|
Consolidated Statements of Income for the Years Ended December 31, 2007, 2008 and 2009
|
F-5
|
|
Consolidated Statements of Comprehensive Income for the Years Ended December 31, 2007, 2008 and 2009
|
F-6
|
|
Consolidated Statements of Equity for the Years Ended December 31, 2007, 2008, and 2009
|
F-7
|
|
Consolidated Statements of Cash Flows for the Years Ended December 31, 2007, 2008 and 2009
|
F-10
|
|
Notes to Consolidated Financial Statements
|
F-12
|
HIMAX TECHNOLOGIES, INC. AND SUBSIDIARIES
Consolidated Financial Statements
December 31, 2007, 2008 and 2009
(With Report of Independent Registered
Public Accounting Firm Thereon)
F-1
Report of Independent Registered Public Accounting Firm
The Board of Directors and Stockholders
Himax Technologies, Inc.:
We have audited the accompanying consolidated balance sheets of Himax Technologies, Inc. (a Cayman Island Company) and subsidiaries as of December 31, 2008 and 2009, and the related consolidated statements of income, comprehensive income, equity and cash flows for each of the years in the three-year period ended December 31, 2009. These consolidated financial statements are the responsibility of the Company’s management. Our responsibility is to express an opinion on these consolidated financial statements based on our audits.
We conducted our audits in accordance with the standards of the Public Company Accounting Oversight Board (United States). Those standards require that we plan and perform the audit to obtain reasonable assurance about whether the financial statements are free of material misstatements. An audit includes examining, on a test basis, evidence supporting the amounts and disclosures in the financial statements. An audit also includes assessing the accounting principles used and significant estimates made by management, as well as evaluating the overall financial statements presentation. We believe that our audits provide a reasonable basis for our opinion.
In our opinion, the consolidated financial statements referred to above present fairly, in all material respects, the financial position of Himax Technologies, Inc. and subsidiaries as of December 31, 2008 and 2009, and the results of their operations and their cash flows for each of the years in the three-year period ended December 31, 2009, in conformity with U. S. generally accepted accounting principles.
As described in the Notes 2(n) and
14 to the consolidated financial statements, the Company adopted the measurement date provisions of Accounting Standards Codification (“ASC”) Subtopic 715-20 (“ASC 715-20”), “
Compensation-Retirement Benefits-Defined Benefit Plans”
, as of December 31, 2008.
As described in the Notes 2(s) to the consolidated financial statements, on January 1, 2009, the Company adopted ASC Subtopic 810-10 (SFAS No. 160),
“Noncontrolling Interests in Consolidated Financial Statements—an amendment of ARB No. 51”
.
We also have audited, in accordance with the standards of the Public Company Accounting Oversight Board (United States), Himax Technologies, Inc.’s internal control over financial reporting as of December 31, 2009, based on criteria established in
Internal Control – Integrated Framework
issued by the Committee of Sponsoring Organizations of the Treadway Commission (COSO), and our report dated June 3, 2010 expressed an unqualified opinion on the effectiveness of the Company’s internal control over financial reporting.
/s/ KPMG
Taipei, Taiwan (the Republic of China)
Taipei, Taiwan (the Republic of China)
June 3, 2010
F-2
HIMAX TECHNOLOGIES, INC. AND SUBSIDIARIES
December 31, 2008 and 2009
(in thousands of US dollars)
|
December 31,
|
||||||||
|
2008
|
2009
|
|||||||
|
Assets
|
||||||||
|
Current assets:
|
||||||||
|
Cash and cash equivalents
|
$ | 135,200 | 110,924 | |||||
|
Investments in marketable securities available-for-sale
|
13,870 | 10,730 | ||||||
|
Accounts receivable, less allowance for doubtful accounts, sales returns and discounts of $25,364 and $26,327 at December 31, 2008 and 2009, respectively
|
51,029 | 64,496 | ||||||
|
Accounts receivable from related parties, less allowance for sales returns and discounts of $95 and $158 at December 31, 2008 and 2009, respectively
|
104,477 | 138,172 | ||||||
|
Inventories
|
96,921 | 67,768 | ||||||
|
Deferred income taxes
|
21,446 | 17,491 | ||||||
|
Prepaid expenses and other current assets
|
11,707 | 14,216 | ||||||
|
Total current assets
|
434,650 | 423,797 | ||||||
|
Investments in non-marketable equity securities
|
11,619 | 11,619 | ||||||
|
Equity method investments
|
- | 586 | ||||||
|
Property, plant and equipment, net
|
55,111 | 51,586 | ||||||
|
Deferred income taxes
|
23,029 | 24,548 | ||||||
|
Goodwill
|
26,846 | 26,846 | ||||||
|
Intangible assets, net
|
10,965 | 8,872 | ||||||
|
Restricted marketable securities
|
2,160 | 1,094 | ||||||
|
Other assets
|
1,168 | 1,500 | ||||||
| 130,898 | 126,651 | |||||||
|
Total assets
|
$ | 565,548 | 550,448 | |||||
See accompanying notes to consolidated financial statements.
F-3
HIMAX TECHNOLOGIES, INC. AND SUBSIDIARIES
Consolidated Balance Sheets (Continued)
December 31, 2008 and 2009
(in thousands of US dollars, except share and per share data)
|
December 31,
|
||||||||
|
2008
|
2009
|
|||||||
|
Liabilities and Equity
|
||||||||
|
Current liabilities:
|
||||||||
|
Accounts payable
|
$ | 53,720 | 88,079 | |||||
|
Income taxes payable
|
15,455 | 14,147 | ||||||
|
Other accrued expenses and other current liabilities
|
20,968 | 18,425 | ||||||
|
Total current liabilities
|
90,143 | 120,651 | ||||||
|
Income taxes payable
|
474 | 902 | ||||||
|
Accrued pension liabilities
|
214 | 91 | ||||||
|
Deferred income taxes
|
3,224 | 2,217 | ||||||
|
Other liabilities
|
1,487 | 2,515 | ||||||
|
Total liabilities
|
95,542 | 126,376 | ||||||
|
Equity
|
||||||||
|
Himax Technologies, Inc. stockholders’ equity:
|
||||||||
|
Ordinary shares, US$0.3 par value, 1,000,000,000 shares authorized; 380,239,188 shares and 358,012,184
shares issued and outstanding at December 31, 2008 and 2009,
respectively
|
114,072 | 107,404 | ||||||
|
Additional paid-in capital
|
124,446 | 102,924 | ||||||
|
Accumulated other comprehensive income (loss)
|
(314 | ) | 4 | |||||
|
Unappropriated retained earnings
|
224,967 | 209,121 | ||||||
|
Total Himax Technologies, Inc. stockholders’ equity
|
463,171 | 419,453 | ||||||
|
Noncontrolling interests
|
6,835 | 4,619 | ||||||
|
Total equity
|
470,006 | 424,072 | ||||||
|
Commitments and contingencies
|
||||||||
|
Total liabilities and equity
|
$ | 565,548 | 550,448 | |||||
See accompanying notes to consolidated financial statements.
F-4
HIMAX TECHNOLOGIES, INC. AND SUBSIDIARIES
Consolidated Statements of Income
Years ended December 31, 2007, 2008 and 2009
(in thousands of US dollars, except per share data)
|
Year Ended December 31,
|
||||||||||||
|
2007
|
2008
|
2009
|
||||||||||
|
Revenues
|
||||||||||||
|
Revenues from third parties, net
|
$ | 371,267 | 312,336 | 245,075 | ||||||||
|
Revenues from related parties, net
|
546,944 | 520,463 | 447,306 | |||||||||
| 918,211 | 832,799 | 692,381 | ||||||||||
|
Costs and expenses:
|
||||||||||||
|
Cost of revenues
|
716,163 | 628,693 | 550,556 | |||||||||
|
Research and development
|
73,906 | 87,574 | 71,364 | |||||||||
|
General and administrative
|
14,903 | 19,353 | 16,346 | |||||||||
|
Bad debt expense
|
- | 25,305 | 218 | |||||||||
|
Sales and marketing
|
9,334 | 11,692 | 10,360 | |||||||||
|
Total costs and expenses
|
814,306 | 772,617 | 648,844 | |||||||||
|
Operating income
|
103,905 | 60,182 | 43,537 | |||||||||
|
Non operating income (loss):
|
||||||||||||
|
Interest income
|
5,433 | 3,315 | 766 | |||||||||
|
Gain (loss) on sale of marketable securities, net
|
112 | 913 | (87 | ) | ||||||||
|
Equity in
losses of equity method investees
|
- | - | (89 | ) | ||||||||
|
Foreign currency exchange losses, net
|
(319 | ) | (844 | ) | (510 | ) | ||||||
|
Interest expense
|
- | - | (3 | ) | ||||||||
|
Other income, net
|
464 | 469 | 111 | |||||||||
| 5,690 | 3,853 | 188 | ||||||||||
|
Earnings before income taxes
|
109,595 | 64,035 | 43,725 | |||||||||
|
Income tax expense (benefit)
|
(1,860 | ) | (8,689 | ) | 7,915 | |||||||
|
Net income
|
111,455 | 72,724 | 35,810 | |||||||||
|
Net loss attributable to noncontrolling interests
|
1,141 | 3,657 | 3,840 | |||||||||
|
Net income attributable to Himax Technologies, Inc. stockholders
|
$ | 112,596 | 76,381 | 39,650 | ||||||||
|
Basic earnings per ordinary share
attributable to Himax
Technologies, Inc.
stockholders
|
$ | 0.29 | 0.20 | 0.11 | ||||||||
|
Diluted earnings per ordinary share
attributable to Himax
Technologies, Inc.
stockholders
|
$ | 0.29 | 0.20 | 0.11 | ||||||||
See accompanying notes to consolidated financial statements.
F-5
HIMAX TECHNOLOGIES, INC. AND SUBSIDIARIES
Consolidated Statements of Comprehensive Income
Years ended December 31, 2007, 2008 and 2009
(in thousands of US dollars)
|
Year Ended December 31,
|
||||||||||||
|
2007
|
2008
|
2009
|
||||||||||
|
Net income
|
$ | 111,455 | 72,724 | 35,810 | ||||||||
|
Other comprehensive income (loss):
|
||||||||||||
|
Unrealized gains (losses) on securities, not subject to income tax:
|
||||||||||||
|
Unrealized holding gains (losses) on available-for-sale marketable securities arising during the period
|
208 | 943 | (193 | ) | ||||||||
|
Reclassification adjustment for realized losses (gains) included in net income
|
(112 | ) | (913 | ) | 87 | |||||||
|
Foreign currency translation adjustments, net of tax of $(6), $0 and $0 in 2007, 2008 and 2009
, respectively
|
202 | (295 | ) | 464 | ||||||||
|
Net unrecognized actuarial loss, net of tax of
$22,
$(20) and $(18)
in 2007, 2008
and 2009, respectively
|
(38 | ) | (67 | ) | (22 | ) | ||||||
|
Comprehensive income
|
111,715 | 72,392 | 36,146 | |||||||||
|
Comprehensive loss
attributable to noncontrolling interests
|
1,149 | 3,682 | 3,822 | |||||||||
|
Comprehensive income
attributable to Himax Technologies, Inc. stockholders
|
$ | 112,864 | 76,074 | 39,968 | ||||||||
See accompanying notes to consolidated financial statements.
F-6
HIMAX TECHNOLOGIES, INC. AND SUBSIDIARIES
Consolidated Statements of Equity
Years ended December 31, 2007, 2008 and 2009
(in thousands of US dollars and shares, except per share data)
|
Ordinary shares
|
Additional
|
Accumulated
other
|
Unappropriated
|
Total Himax
Technologies,
Inc. |
||||||||||||||||||||||||||||||||
|
Shares
|
Amount
|
paid-in
capital
|
Treasury
shares
|
comprehensive
income (loss ) |
retained
earnings |
stockholders’
equity
|
Noncontrolling
interests
|
Total
Equity
|
||||||||||||||||||||||||||||
|
Balance at January 1, 2007
|
387,200 | $ | 116,160 | 105,525 | - | (275 | ) | 142,517 | 363,927 | 1,396 | 365,323 | |||||||||||||||||||||||||
|
Issuance of ordinary shares in connection with the acquisition of Wisepal Technologies, Inc.
|
12,435 | 3,654 | 41,378 | - | - | - | 45,032 | - | 45,032 | |||||||||||||||||||||||||||
|
Ordinary shares to be issued in connection with the acquisition of Wisepal Technologies, Inc.
|
- | - | 1,687 | - | - | - | 1,687 | - | 1,687 | |||||||||||||||||||||||||||
|
Shares acquisition
|
(17,461 | ) | - | - | (39,207 | ) | - | - | (39,207 | ) | - | (39,207 | ) | |||||||||||||||||||||||
|
Shares retirement
|
- | (5,238 | ) | (33,969 | ) | 39,207 | - | - | - | - | - | |||||||||||||||||||||||||
|
Restricted stock granted
|
1,785 | 612 | (612 | ) | - | - | - | - | - | - | ||||||||||||||||||||||||||
|
Share-based compensation expenses
|
- | - | 5,883 | - | - | - | 5,883 | 12 | 5,895 | |||||||||||||||||||||||||||
|
New shares issued by subsidiaries
|
- | - | 833 | - | - | - | 833 | 10,981 | 11,814 | |||||||||||||||||||||||||||
|
Purchase of subsidiary shares from noncontrolling interests
|
- | - | - | - | - | - | - | (151 | ) | (151 | ) | |||||||||||||||||||||||||
|
Net unrecognized actuarial loss, net of tax of $22
|
- | - | - | - | (20 | ) | - | (20 | ) | (18 | ) | (38 | ) | |||||||||||||||||||||||
|
Unrealized holding gain on available-for-sale marketable securities
|
- | - | - | - | 86 | - | 86 | 10 | 96 | |||||||||||||||||||||||||||
|
Foreign currency translation adjustments, net of tax of $(6)
|
- | - | - | - | 202 | - | 202 | - | 202 | |||||||||||||||||||||||||||
|
Declaration of cash dividends, $0.100 per share
|
- | - | - | - | - | (39,710 | ) | (39,710 | ) | - | (39,710 | ) | ||||||||||||||||||||||||
|
Net income
|
- | - | - | - | - | 112,596 | 112,596 | (1,141 | ) | 111,455 | ||||||||||||||||||||||||||
|
Balance at December 31, 2007
|
383,959 | 115,188 | 120,725 | - | (7 | ) | 215,403 | 451,309 | 11,089 | 462,398 | ||||||||||||||||||||||||||
F-7
HIMAX TECHNOLOGIES, INC. AND SUBSIDIARIES
Consolidated Statements of Equity (Continued)
Years ended December 31, 2007, 2008 and 2009
(in thousands of US dollars and shares, except per share data)
|
Ordinary shares
|
Additional
|
Accumulated
other
|
Unappropriated
|
Total Himax
Technologies,
Inc. |
||||||||||||||||||||||||||||||||
|
Shares
|
Amount
|
paid-in
capital
|
Treasury
shares
|
comprehensive
income (loss ) |
retained
earnings |
stockholders’
equity
|
Noncontrolling
interests
|
Total
Equity
|
||||||||||||||||||||||||||||
|
Shares acquisition
|
(6,929 | ) | - | - | (8,372 | ) | - | - | (8,372 | ) | - | (8,372 | ) | |||||||||||||||||||||||
|
Shares retirement
|
- | (2,079 | ) | (6,293 | ) | 8,372 | - | - | - | - | - | |||||||||||||||||||||||||
|
Restricted stock granted
|
3,209 | 963 | (963 | ) | - | - | - | - | - | - | ||||||||||||||||||||||||||
|
Share-based compensation expenses
|
- | - | 8,937 | - | - | - | 8,937 | 149 | 9,086 | |||||||||||||||||||||||||||
|
New shares issued by subsidiary
|
- | - | 2,040 | - | - | - | 2,040 | (917 | ) | 1,123 | ||||||||||||||||||||||||||
|
Sale of subsidiary shares to noncontrolling interests
|
- | - | - | - | - | - | - | 196 | 196 | |||||||||||||||||||||||||||
|
Net unrecognized actuarial loss, net of tax of $(20)
|
- | - | - | - | (49 | ) | - | (49 | ) | (18 | ) | (67 | ) | |||||||||||||||||||||||
|
Unrealized holding gain (loss) on available-for-sale marketable securities
|
- | - | - | - | 36 | - | 36 | (6 | ) | 30 | ||||||||||||||||||||||||||
|
Foreign currency translation adjustments
|
- | - | - | - | (294 | ) | - | (294 | ) | (1 | ) | (295 | ) | |||||||||||||||||||||||
|
Declaration of cash dividends, $0.175 per share
|
- | - | - | - | - | (66,817 | ) | (66,817 | ) | - | (66,817 | ) | ||||||||||||||||||||||||
|
Net income
|
- | - | - | - | - | 76,381 | 76,381 | (3,657 | ) | 72,724 | ||||||||||||||||||||||||||
|
Balance at December 31, 2008
|
380,239 | 114,072 | 124,446 | - | (314 | ) | 224,967 | 463,171 | 6,835 | 470,006 | ||||||||||||||||||||||||||
See accompanying notes to consolidated financial statements.
F-8
HIMAX TECHNOLOGIES, INC. AND SUBSIDIARIES
Consolidated Statements of Equity (Continued)
Years ended December 31, 2007, 2008 and 2009
(in thousands of US dollars and shares, except per share data)
|
Ordinary shares
|
Additional
|
Accumulated
other
|
Unappropriated
|
Total Himax
Technologies,
Inc. |
||||||||||||||||||||||||||||||||
|
Shares
|
Amount
|
paid-in
capital
|
Treasury
shares
|
comprehensive
income (loss ) |
retained
earnings |
stockholders’
equity
|
Noncontrolling
interests
|
Total
Equity
|
||||||||||||||||||||||||||||
|
Shares acquisition
|
(26,251 | ) | - | - | (36,462 | ) | - | - | (36,462 | ) | - | (36,462 | ) | |||||||||||||||||||||||
|
Shares retirement
|
- | (7,875 | ) | (28,587 | ) | 36,462 | - | - | - | - | - | |||||||||||||||||||||||||
|
Restricted stock granted
|
4,024 | 1,207 | (1,207 | ) | - | - | - | - | - | - | ||||||||||||||||||||||||||
|
Share-based compensation expenses
|
- | - | 8,181 | - | - | - | 8,181 | 372 | 8,553 | |||||||||||||||||||||||||||
|
New shares issued by subsidiary
|
- | - | (207 | ) | - | - | - | (207 | ) | 1,234 | 1,027 | |||||||||||||||||||||||||
|
Sale (purchase) of subsidiary shares to (from) noncontrolling interests
|
- | - | 285 | - | - | - | 285 | (2 | ) | 283 | ||||||||||||||||||||||||||
|
Dilution gain of equity method investments
|
- | - | 13 | - | - | - | 13 | 2 | 15 | |||||||||||||||||||||||||||
|
Net unrecognized actuarial loss, net of tax of $(18)
|
- | - | - | - | (41 | ) | - | (41 | ) | 19 | (22 | ) | ||||||||||||||||||||||||
|
Unrealized holding loss on available-for-sale marketable securities
|
- | - | - | - | (105 | ) | - | (105 | ) | (1 | ) | (106 | ) | |||||||||||||||||||||||
|
Foreign currency translation adjustments
|
- | - | - | - | 464 | - | 464 | - | 464 | |||||||||||||||||||||||||||
|
Declaration of cash dividends, $0.150 per share
|
- | - | - | - | - | (55,496 | ) | (55,496 | ) | - | (55,496 | ) | ||||||||||||||||||||||||
|
Net income
|
- | - | - | - | - | 39,650 | 39,650 | (3,840 | ) | 35,810 | ||||||||||||||||||||||||||
|
Balance at December 31, 2009
|
358,012 | $ | 107,404 | 102,924 | - | 4 | 209,121 | 419,453 | 4,619 | 424,072 | ||||||||||||||||||||||||||
See accompanying notes to consolidated financial statements.
F-9
HIMAX TECHNOLOGIES, INC. AND SUBSIDIARIES
Years ended December 31, 2007, 2008 and 2009
(in thousands of US dollars)
|
Year Ended December 31,
|
||||||||||||
|
2007
|
2008
|
2009
|
||||||||||
|
Cash flows from operating activities:
|
||||||||||||
|
Net income
|
$ | 111,455 | 72,724 | 35,810 | ||||||||
|
Adjustments to reconcile net income to net cash provided by operating activities:
|
||||||||||||
|
Depreciation and amortization
|
10,260 | 12,318 | 13,795 | |||||||||
|
Bad debt expense
|
- | 25,305 | 218 | |||||||||
|
Write-off of in-process research and development
|
1,600 | - | - | |||||||||
|
Share-based compensation expenses
|
5,895 | 9,086 | 8,553 | |||||||||
|
Loss on disposal of property and equipment
|
223 | 89 | 43 | |||||||||
|
Gain on disposal of subsidiary shares, net
|
(418 | ) | (341 | ) | - | |||||||
|
Loss (gain) on disposal of marketable securities, net
|
(112 | ) | (913 | ) | 87 | |||||||
|
Equity in losses of equity method investees
|
- | - | 89 | |||||||||
|
Deferred income tax expense (benefit)
|
(14,618 | ) | (12,348 | ) | 1,447 | |||||||
|
Inventories write downs
|
14,824 | 18,028 | 13,622 | |||||||||
|
Changes in operating assets and liabilities:
|
||||||||||||
|
Accounts receivable
|
25,971 | 12,342 | (13,686 | ) | ||||||||
|
Accounts receivable from related parties
|
(78,044 | ) | 89,850 | (33,685 | ) | |||||||
|
Inventories
|
(29,602 | ) | 1,371 | 14,401 | ||||||||
|
Prepaid expenses and other current assets
|
(4,477 | ) | 8,012 | (2,299 | ) | |||||||
|
Accounts payable
|
26,232 | (93,301 | ) | 34,360 | ||||||||
|
Income taxes payable
|
7,481 | (3,206 | ) | (880 | ) | |||||||
|
Other accrued expenses and other current liabilities
|
492 | (2,516 | ) | 2,452 | ||||||||
|
Other liabilities
|
- | - | (697 | ) | ||||||||
|
Net cash provided by operating activities
|
77,162 | 136,500 | 73,630 | |||||||||
|
Cash flows from investing activities:
|
||||||||||||
|
Purchase of property and equipment
|
(18,998 | ) | (17,490 | ) | (10,592 | ) | ||||||
|
Proceeds from disposal of property and equipment
|
9 | 32 | 25 | |||||||||
|
Purchase of available-for-sale marketable securities
|
(52,476 | ) | (68,892 | ) | (34,248 | ) | ||||||
|
Disposal of available-for-sale marketable securities
|
46,303 | 71,172 | 39,263 | |||||||||
|
Cash acquired in acquisition, net of cash paid
|
6,161 | - | - | |||||||||
|
Proceeds from disposal of subsidiary shares to noncontrolling interests by Himax Technologies Limited
|
562 | 719 | 529 | |||||||||
|
Purchase of investments in non-marketable equity securities
|
(6,321 | ) | (4,481 | ) | - | |||||||
|
Purchase of equity method investments
|
- | - | (663 | ) | ||||||||
|
Purchase of subsidiary shares from noncontrolling interests
|
(295 | ) | (673 | ) | (243 | ) | ||||||
|
Refund from (increase in) refundable deposits
|
25 | (86 | ) | (217 | ) | |||||||
|
Increase in other assets
|
- | - | (7 | ) | ||||||||
|
Release (pledge) of restricted marketable securities
|
11 | (2,065 | ) | (1,002 | ) | |||||||
|
Purchase of intangible assets
|
- | - | (100 | ) | ||||||||
|
Net cash used in investing activities
|
(25,019 | ) | (21,764 | ) | (7,255 | ) | ||||||
See accompanying notes to consolidated financial statements.
F-10
HIMAX TECHNOLOGIES, INC. AND SUBSIDIARIES
Consolidated Statements of Cash Flows (Continued)
Years ended December 31, 2007, 2008 and 2009
(in thousands of US dollars)
|
Year Ended December 31,
|
||||||||||||
|
2007
|
2008
|
2009
|
||||||||||
|
Cash flows from financing activities:
|
||||||||||||
|
Distribution of cash dividends
|
$ | (39,710 | ) | (66,817 | ) | (55,496 | ) | |||||
|
Proceeds from issuance of new shares by subsidiaries
|
11,814 | 1,123 | 1,027 | |||||||||
|
Payments to acquire ordinary shares for retirement
|
(39,345 | ) | (8,656 | ) | (36,596 | ) | ||||||
|
Proceeds from borrowing of short-term debt
|
- | - | 80,000 | |||||||||
|
Repayment of short-term debt
|
- | - | (80,000 | ) | ||||||||
|
Net cash used in financing activities
|
(67,241 | ) | (74,350 | ) | (91,065 | ) | ||||||
|
Effect of foreign currency exchange rate changes on
cash and cash equivalents
|
125 | 34 | 414 | |||||||||
|
Net increase (decrease) in cash and cash equivalents
|
(14,973 | ) | 40,420 | (24,276 | ) | |||||||
|
Cash and cash equivalents at beginning of year
|
109,753 | 94,780 | 135,200 | |||||||||
|
Cash and cash equivalents at end of year
|
$ | 94,780 | 135,200 | 110,924 | ||||||||
|
Supplemental disclosures of cash flow information:
|
||||||||||||
|
Cash paid during the year for:
|
||||||||||||
|
Interest
|
$ | - | - | 3 | ||||||||
|
Income taxes
|
$ | 4,779 | 7,175 | 7,652 | ||||||||
See accompanying notes to consolidated financial statements.
F-11
HIMAX TECHNOLOGIES, INC. AND SUBSIDIARIES
Notes to Consolidated Financial Statements
December 31, 2007, 2008 and 2009
|
Note 1.
|
Background, Principal Activities and Basis of Presentation
|
Background
Himax Technologies, Inc. is a holding company located in the Cayman Islands. Following is general information about Himax Technologies, Inc.’s subsidiaries:
|
Jurisdiction of
|
Percentage of
Ownership
December 31,
|
|||||||||||
|
Subsidiary
|
Main activities
|
Incorporation
|
2008
|
2009
|
||||||||
|
Himax Technologies Limited
|
IC design and sales
|
ROC
|
100.00 | % | 100.00 | % | ||||||
|
Himax Technologies Anyang Limited
|
Sales
|
South Korea
|
100.00 | % | 100.00 | % | ||||||
|
Wisepal Technologies, Inc.
|
IC design and sales
|
ROC
|
100.00 | % | 100.00 | % | ||||||
|
Himax Technologies (Samoa), Inc.
|
Investments
|
Samoa
|
100.00 | % | 100.00 | % | ||||||
|
Himax Technologies (Suzhou), Co., Ltd.
|
Sales
|
PRC
|
100.00 | % | 100.00 | % | ||||||
|
Himax Technologies (Shenzhen), Co., Ltd.
|
Sales
|
PRC
|
100.00 | % | 100.00 | % | ||||||
|
Himax Display, Inc.
|
IC design, manufacturing and sales
|
ROC
|
89.49 | % | 88.73 | % | ||||||
|
Integrated Microdisplays Limited
|
IC design and sales
|
Hong Kong
|
89.49 | % | 88.73 | % | ||||||
|
Himax Analogic, Inc.
|
IC design and sales
|
ROC
|
75.59 | % | 77.56 | % | ||||||
|
Himax Imaging, Inc.
|
Investments
|
Cayman Islands
|
93.52 | % | 94.80 | % | ||||||
|
Himax Imaging, Ltd.
|
IC design and sales
|
ROC
|
93.52 | % | 94.80 | % | ||||||
|
Himax Imaging Corp.
|
IC design and sales
|
California, USA
|
93.52 | % | 94.80 | % | ||||||
|
Argo Limited
|
Investments
|
Cayman Islands
|
100.00 | % | 100.00 | % | ||||||
|
Tellus Limited
|
Investments
|
Cayman Islands
|
100.00 | % | 100.00 | % | ||||||
|
Himax Media Solutions, Inc.
|
TFT-LCD television and monitor chipset operations
|
ROC
|
79.44 | % | 77.91 | % | ||||||
|
Himax Media Solutions (Hong Kong) Limited
|
Investments
|
Hong Kong
|
79.44 | % | 77.91 | % | ||||||
F-12
HIMAX TECHNOLOGIES, INC. AND SUBSIDIARIES
Notes to Consolidated Financial Statements (Continued)
December 31, 2007, 2008 and 2009
Since March 2006, Himax Technologies, Inc.’s ordinary shares have been quoted on the NASDAQ Global Market under the symbol “HIMX” in the form of ADSs.
Principal Activities
Himax Technologies, Inc. and subsidiaries (collectively, the Company) designs, develops and markets semiconductors that are critical components of flat panel displays. The Company’s principal products are display drivers for large-sized thin film transistor liquid crystal displays (TFT-LCD) panels, which are used in desktop monitors, notebook computers and televisions, and
display drivers for small-and medium-sized TFT-LCD panels which are used
in mobile handsets, and consumer electronics products such as
netbook computers (with a display size of typically less than 10 inches), digital cameras, mobile gaming devices, portable DVD players, digital photo frame and car navigation displays. The Company also offers display drivers for panels using OLED technology and LTPS technology. In addition, the Company is expanding its product offerings to include non-driver products such as timing controllers, TFT-LCD television and monitor chipsets, LCOS projector solutions, power management ICs, CMOS image sensors and wafer level optics products. The Company’s customers are TFT-LCD panel manufacturers, mobile device module manufacturers and television makers.
Basis of Presentation
The accompanying consolidated financial statements of the Company have been prepared in conformity with US generally accepted accounting principles (“US GAAP”). On July 1, 2009, the Company adopted the Financial Accounting Standard Board (“FASB”) Accounting Standard Codification (“ASC”) 105-10 (“ASC 105-10”). ASC 105-10 established the FASB ASC as the source of authoritative accounting principles recognized by the FASB to be applied in the preparation of financial statements in conformity with US GAAP. All guidance contained in the Codification carries an equal level of authority. The Codification superseded all existing non-SEC accounting and reporting standards.
|
Note 2.
|
Summary of Significant Accounting Policies
|
|
(a)
|
Principles of Consolidation
|
The accompanying consolidated financial statements include the accounts and operations of the Himax Technologies, Inc. and all of its majority owned subsidiaries. All significant intercompany balances and transactions have been eliminated in consolidation.
F-13
HIMAX TECHNOLOGIES, INC. AND SUBSIDIARIES
Notes to Consolidated Financial Statements (Continued)
December 31, 2007, 2008 and 2009
|
(b)
|
Use of Estimates
|
The preparation of consolidated financial statements in conformity with US GAAP requires management to make estimates and assumptions relating to the reported amounts of assets and liabilities and disclosures of contingent assets and liabilities at the date of the consolidated financial statements and the reported amounts of revenue and expenses during the reporting period. Actual results could differ from those estimates. Significant items subject to such estimates and assumptions include the useful lives of property, plant and equipment and intangible assets; allowances for doubtful accounts and sales returns; the valuation of deferred income tax assets, property, plant and equipment, inventory, share-based compensation and potential impairment of intangible assets, goodwill, marketable securities and other equity investments; and liabilities for employee benefit obligations, and income tax uncertainties and other contingencies. The current economic environment has increased the degree of uncertainty inherent in those estimates and assumptions.
|
(c)
|
Cash and Cash Equivalents
|
The Company considers all highly liquid investments purchased with an original maturity of three months or less at the time of purchase to be cash equivalents. As of December 31, 2008 and 2009, the Company had $115,120 thousand and $87,600 thousand of cash equivalents, respectively, US dollar denominated time deposits with an original maturity of less than three months.
|
(d)
|
Investment Securities
|
As of December 31, 2008 and 2009, all of the Company’s investments in debt and marketable equity securities are classified as available-for-sale securities and are reported at fair value. Unrealized holding gains and losses, net of related taxes, are excluded from earnings and reported as a separate component of equity in accumulated other comprehensive income (loss) until realized. Available-for-sale securities, which mature or are expected to be sold in one year, are classified as current assets.
The cost of the securities sold is computed based on the moving average cost of each security held at the time of sale.
As of December 31, 2008 and 2009, the Company had $2,160 thousand and $1,094 thousand, respectively, of restricted marketable securities, consisting of negotiable certificate of deposits and New Taiwan dollar (NT$) and US dollar denominated time deposits with original maturities of more than three months, which had been pledged as collateral for purchase of raw materials, customs duties and guarantees for Government grants.
F-14
HIMAX TECHNOLOGIES, INC. AND SUBSIDIARIES
Notes to Consolidated Financial Statements (Continued)
December 31, 2007, 2008 and 2009
In April 2009, the FASB issued FSP FAS 115-2 and FAS 124-2,
Recognition and Presentation of Other-Than-Temporary Impairments
, which amends the recognition guidance for other-than-temporary impairments (OTTI) of debt securities and expands the financial statement disclosures for OTTI on debt and equity securities. When an other-than-temporary impairment has occurred, the amount of the other-than-temporary impairment recognized in earnings depends on whether a company intends to sell the security or more likely than not will be required to sell the security before recovery of its amortized cost basis less any current-period credit loss. If a company intends to sell the security or more likely than not will be required to sell the security before recovery of its amortized cost basis less any current-period credit loss, the other-than-temporary impairment is recognized in earnings equal to the entire difference between the investment’s amortized cost basis and its fair value at the balance sheet date. If a company does not intend to sell the security and it is not more likely than not that a company will be required to sell the security before recovery of its amortized cost basis less any current-period credit loss, the other-than-temporary impairment is separated into the amount representing the credit loss and the amount related to all other factors. The amount of the total other-than-temporary impairment related to the credit loss is recognized in earnings. The amount of the total other-than-temporary impairment related to other factors is recognized in other comprehensive income, net of applicable income taxes.
The Company adopted the FSP in 2009, which had no impact on the Company’s consolidated earnings or consolidated financial position.
Investments in non-marketable equity securities in which the
Company
does not have the ability to exercise significant influence over the operating and financial policies of the investee are stated at cost. Dividends, if any, are recognized into earnings when received.
Equity investments in entities where the
Company
has the ability to exercise significant influence over the operating and financial policy decisions of the investee, but does not have a controlling financial interest in the investee, are accounted for using the equity method. The
Company
’s share of the net income or net loss of an investee is recognized in earnings.
A decline in value of a security below cost that is deemed to be other than temporary results in an impairment to reduce the carrying amount to fair value. To determine whether any impairment is other-than-temporary, management considers all available information relevant to the collectibility of the security, including past events, current conditions, and reasonable and supportable forecasts, when developing estimates of cash flows to be collected. Evidence considered in this assessment includes the reasons for the impairment, the severity and duration of the impairment, changes in value subsequent to year-end, forecasted performance of the investee, and the general market condition in the geographic area or industry the investee operates in.
F-15
HIMAX TECHNOLOGIES, INC. AND SUBSIDIARIES
Notes to Consolidated Financial Statements (Continued)
December 31, 2007, 2008 and 2009
|
(e)
|
Allowance for Doubtful Accounts
|
An allowance for doubtful accounts is provided based on a review of collectability of accounts receivable on a monthly basis. In establishing the required allowance, management considers the historical collection experience, current receivable aging and the current trend in the credit quality of the Company’s customers. Management reviews its allowance for doubtful accounts quarterly. Account balance is charged off against the allowance after all means of collection have been exhausted and the potential for recovery is considered remote.
|
(f)
|
Inventories
|
Inventories primarily consist of raw materials, work-in-process and finished goods awaiting final assembly and test, and are stated at the lower of cost or market value. Cost is determined using the weighted-average method. For work-in-process and manufactured inventories, cost consists of the cost of raw materials (primarily fabricated wafer and processed tape), direct labor and an appropriate proportion of production overheads. The Company also writes down excess and obsolete inventories to their estimated market value based upon estimations about future demand and market conditions. If actual market conditions are less favorable than those projected by management, additional future inventory write-down may be required that could adversely affect the Company’s operating results. Once written down, inventories are carried at this lower amount until sold or scrapped. If actual market conditions are more favorable, the Company may have higher operating income when such products are sold. Sales to date of such products have not had a significant impact on the Company’s operating income.
|
(g)
|
Property, Plant and Equipment
|
Property, plant and equipment consists primarily of land purchased as the construction site of the Company’s new headquarters, and machinery and equipment used in the design and development of products, and is stated at cost. Depreciation on building and machinery and equipment commences when the asset is ready for its intended use and is calculated on the straight-line method over the estimated useful lives of the assets which range as follows: building 25 years, building improvements 4 to 16 years, machinery and equipment 2 to 6 years. Leasehold improvements are amortized on a straight line basis over the shorter of the lease term or the estimated useful life of the asset. Software is amortized on a straight line basis over the estimated useful lives ranging from 2 to 6 years.
F-16
HIMAX TECHNOLOGIES, INC. AND SUBSIDIARIES
Notes to Consolidated Financial Statements (Continued)
December 31, 2007, 2008 and 2009
|
(h)
|
Goodwill
|
Goodwill is an asset representing the future economic benefits arising from other assets acquired in the
business combination
of
the Company’s acquisition of Wisepal Technologies, Inc. in 2007 that are not individually identified and separately recognized.
Goodwill is reviewed for impairment at least annually in accordance with the provisions of ASC 350 (SFAS No. 142),
Goodwill and Other
. Impairment testing for goodwill is done at a reporting unit level, which for the Company is the enterprise as a whole. The goodwill impairment test is a two-step test. Under the first step, the fair value of the reporting unit is compared with its carrying value (including goodwill). If the fair value of the reporting unit is less than its carrying value, an indication of goodwill impairment exists for the reporting unit and the Company must perform step two of the impairment test (measurement). Under step two, an impairment loss is recognized for any excess of the carrying amount of the reporting unit’s goodwill over the implied fair value of that goodwill. The implied fair value of goodwill is determined by allocating the fair value of the reporting unit in a manner similar to a purchase price allocation, in accordance with ASC 805 (SFAS No. 141),
Business Combinations
. The residual fair value after this allocation is the implied fair value of the reporting unit goodwill. If the fair value of the reporting unit exceeds its carrying value, step two does not need to be performed. Management considers the enterprise as a whole to be the reporting unit for purpose of evaluating goodwill impairment and consequently, the Company’s market capitalization based on the quoted market price of the Company’s ordinary shares is a primary part of the fair value measurement, and is adjusted by management’s estimate of an appropriate control premium. In addition, other valuation techniques such the discounted present value of future cash flows, maybe be considered by management as necessary to validate in management’s estimation of the fair value of the Company using the adjusted market capitalization approach.
The Company performs its annual impairment review of goodwill at October 31, and when a triggering event occurs between annual impairment tests
.
During 2007, 2008 and 2009, management performed its impairment testing of goodwill and concluded that there was no impairment in all years.
|
(i)
|
Intangible Assets
|
Acquired intangible assets include patents, developed technology and customer relationship assets at December 31, 2008 and 2009. Intangible assets are amortized on a straight-line basis over the following estimated useful lives: patents 5 to 15 years, technology 5 to 7 years and customer relationship 7 years.
F-17
HIMAX TECHNOLOGIES, INC. AND SUBSIDIARIES
Notes to Consolidated Financial Statements (Continued)
December 31, 2007, 2008 and 2009
|
(j)
|
Impairment of Long-Lived Assets
|
The Company’s
long-lived assets, which consist of property, plant and equipment and intangible assets subject to amortization, are reviewed for impairment whenever events or changes in circumstances indicate that the carrying amount of an asset may not be recoverable. Recoverability of assets to be held and used is assessed by a comparison of the carrying amount of an asset to its estimated undiscounted future cash flows expected to be generated. If the carrying amount of an asset exceeds such estimated cash flows, an impairment charge is recognized for the amount by which the carrying amount of the asset exceeds its estimated fair value. Management generally determines fair value based on the estimated discounted future cash flows expected to be generated by the asset.
|
(k)
|
Revenue Recognition
|
The Company recognizes revenue from product sales when persuasive evidence of an arrangement exists, the product has been delivered, the price is fixed and determinable and collection is reasonably assured. The Company uses a binding purchase order as evidence of an arrangement. Management considers delivery to occur upon shipment provided title and risk of loss has passed to the customer based on the shipping terms, which is generally when the product is shipped to the customer from the Company’s facilities or the outsourced assembly and testing house. In some cases, title and risk of loss does not pass to the customer when the product is received by them. In these cases, the Company recognizes revenue at the time when title and risk of loss is transferred, assuming all other revenue recognition criteria have been satisfied. These cases include several inventory locations where the Company manages inventories for its customers, some of which inventories are at customer facilities. In such cases, revenue is not recognized when products are received at these locations; rather, revenue is recognized when customers take the inventories from the location for their use.
The Company records a reduction to revenue and accounts receivable by establishing a sales discount and return allowance for estimated sales discounts and product returns at the time revenue is recognized based primarily on historical discount and return rates. However, if sales discount and product returns for a particular fiscal period exceed historical rates, management may determine that additional sales discount and return allowances are required to properly reflect the Company’s estimated remaining exposure for sales discounts and product returns.
Sales taxes collected from customers and remitted to governmental authorities are accounted for on a net basis and therefore are excluded from revenues in the consolidated statements of income.
F-18
HIMAX TECHNOLOGIES, INC. AND SUBSIDIARIES
Notes to Consolidated Financial Statements (Continued)
December 31, 2007, 2008 and 2009
|
(l)
|
Product Warranty
|
Under the Company’s standard terms and conditions of sale, products sold are subject to a limited product quality warranty. The Company may receive warranty claims outside the scope of the standard terms and conditions. The Company provides for the estimated cost of product warranties at the time revenue is recognized based primarily on historical experience and any specifically identified quality issues.
|
(m)
|
Research and Development and Advertising Costs
|
The Company’s research and development and advertising expenditures are charged to expense as incurred. Advertising expenses for the years ended December 31, 2007, 2008 and 2009, were $8 thousand, $20 thousand and $21 thousand, respectively.
The Company recognizes government grants to fund research and development expenditures as a reduction of research and development expense in the accompanying consolidated statements of income based on the percentage of actual qualifying expenditures incurred to date to the most recent estimate of total expenditures for which they are intended to be compensated.
|
(n)
|
Employee Retirement Plan
|
The Company has established an employee noncontributory defined benefit retirement plan (the “Defined Benefit Plan”) covering full-time employees in the ROC.
The Company records annual amounts relating to its pension and postretirement plans based on calculations that incorporate various actuarial and other assumptions including discount rates, mortality, assumed rates of return, compensation increases, and turnover rates. Management reviews its assumptions on an annual basis and makes modifications to the assumptions based on current rates when it is appropriate to do so. The effect of modifications to those assumptions is recorded in accumulated other comprehensive income and amortized to net periodic cost over future periods using the corridor method. Management believes that the assumptions utilized in recording its obligations under its plans are reasonable based on its experience and market conditions.
The Company adopted the measurement date provisions of
ASC 715 (SFAS No. 158)
,
Compensation-Retirement Benefits
,
as of December 31, 2008 which
required plan assets and benefit obligations be measured as of the date of the Company’s fiscal year-end statement of financial position which are consistent with the Company’s prior policies and the adoption of the measurement provisions of
ASC 715
(SFAS No. 158) did not
impact the consolidated financial statements.
The Company has adopted a defined contribution plan covering full-time employees in the ROC
(the “Defined Contribution Plan”) beginning July 1, 2005 pursuant to ROC Labor Pension Act. Pension cost for a period is determined based on the contribution called for in that period. Substantially all participants in the Defined Benefit Plan have been provided the option of continuing to participate in the Defined Benefit Plan, or to participate in the Defined Contribution Plan on a prospective basis from July 1, 2005. Accumulated benefits attributed to participants that elect to change plans are not impacted by their election.
F-19
HIMAX TECHNOLOGIES, INC. AND SUBSIDIARIES
Notes to Consolidated Financial Statements (Continued)
December 31, 2007, 2008 and 2009
|
(o)
|
Income Taxes
|
Income taxes are accounted for under the asset and liability method. Deferred tax assets and liabilities are recognized for the future tax consequences attributable to differences between the carrying amounts of existing assets and liabilities in the financial statements and their respective tax bases, and operating loss and tax credit carryforwards. Deferred tax assets and liabilities are measured using enacted tax rates expected to apply to taxable income in the years in which those temporary differences are expected to be recovered or settled. The effect on deferred tax assets and liabilities of a change in tax rates is recognized in income in the period that includes the enactment date. A valuation allowance is recorded for deferred tax assets when it is more likely than not that some portion or all of the deferred tax assets will not be realized.
Beginning with the adoption of ASC 740-10 (FIN 48),
Income Taxes
, as of January 1, 2007, the Company recognizes the effect of income tax positions only if those positions are more likely than not of being sustained. Recognized income tax positions are measured at the largest amount that is greater than 50% likely of being realized. Changes in recognition or measurement are reflected in the period in which the change in judgment occurs. Prior to the adoption of ASC 740-10, the Company recognized the effect of income tax positions only if such positions were probable of being sustained. Upon the adoption of ASC 740-10 on January 1, 2007,
management conducted a comprehensive evaluation of its uncertain tax positions and concluded that it was not necessary for the Company to recognize any adjustments as a result of the initial adoption of
ASC 740-10
.
The Company records interest and penalties related to unrecognized tax benefits as income tax expense in the consolidated statement of income.
|
(p)
|
Foreign Currency Translation and Foreign Currency Transactions
|
The reporting currency of the Company is the United States dollar. The functional currency for the Company and its major operating subsidiaries is the United States dollar. Accordingly, the assets and liabilities of subsidiaries
whose functional currency is other than the United States dollar are included in the consolidation by translating the assets and liabilities into the reporting currency (the United States dollar) at the exchange rates applicable at the end of the reporting period. Equity accounts are translated at historical rates. The statements of income and cash flows are translated at the average exchange rates during the year. Translation gains or losses are accumulated as a separate component of equity in accumulated other comprehensive income (loss).
F-20
HIMAX TECHNOLOGIES, INC. AND SUBSIDIARIES
Notes to Consolidated Financial Statements (Continued)
December 31, 2007, 2008 and 2009
Foreign currency denominated monetary assets and liabilities are remeasured into functional currency at end-of-period exchange rates. Gains or losses from foreign currency transactions are included in other income (loss) in the accompanying consolidated statements of income.
|
(q)
|
Earnings Per Ordinary Share
|
Basic earnings per ordinary share is computed using the weighted average number of ordinary shares outstanding during the period. Diluted earnings per ordinary share is computed using the weighted average number of ordinary and diluted ordinary equivalent shares outstanding during the period. Ordinary equivalent shares consist of ordinary shares that are contingently issuable upon the vesting of unvested restricted share units (RSUs) granted to employees and independent directors and contingently issuable ordinary shares upon the achievement of specific milestones as of December 31, 2007 related to the acquisition of Wisepal Technologies, Inc.
As further described in the Note 16 (a) to the consolidated financial statements, in August 2009
a stock split in the form of a dividend was approved and executed
. All references in the accompanying consolidated financial statements and notes to the number of shares outstanding, per share amounts and share data of the Company
’s
ordinary shares have been retroactively adjusted to reflect the effect of these stock splits for all periods presented.
Basic and diluted earnings per ordinary share have been calculated as follows:
|
Year December 31,
|
||||||||||||
|
2007
|
2008
|
2009
|
||||||||||
|
Net income attributable to Himax Technologies, Inc. stockholders (in thousands)
|
$ | 112,596 | 76,381 | 39,650 | ||||||||
|
Denominator for basic earnings per ordinary share:
|
||||||||||||
|
Weighted average number of ordinary shares outstanding (in thousands)
|
393,725 | 383,229 | 369,652 | |||||||||
|
Basic earnings per ordinary share attributable to Himax Technologies, Inc. stockholders
|
$ | 0.29 | 0.20 | 0.11 | ||||||||
F-21
HIMAX TECHNOLOGIES, INC. AND SUBSIDIARIES
Notes to Consolidated Financial Statements (Continued)
December 31, 2007, 2008 and 2009
Contingently issuable ordinary shares underlying the unvested RSUs granted to employees and independent directors and contingently issuable ordinary shares related to acquisition are included in the calculation of diluted earnings per
ordinary
share based on treasury stock method. In 2007, the unvested 1,272,600 RSUs (represents 2,545,200 ordinary shares) which will vest during 2008 and 2009 were excluded as their effect would be anti-dilutive. In 2008, the unvested 3,122,590 RSUs (represents 6,245,180 ordinary shares) which will vest during 2009, 2010 and 2011 were excluded as their effect would be anti-dilutive. In 2009, the unvested 612,313 RSUs (represents 1,224,626 ordinary shares) which will vest in 2010 were excluded as their effect would be anti-dilutive.
|
Year December 31,
|
||||||||||||
|
2007
|
2008
|
2009
|
||||||||||
|
Net income attributable to Himax Technologies, Inc. stockholders (in thousands)
|
$ | 112,596 | 76,381 | 39,650 | ||||||||
|
Denominator for diluted earnings per ordinary share:
|
||||||||||||
|
Weighted average number of ordinary shares outstanding (in thousands)
|
393,725 | 383,229 | 369,652 | |||||||||
|
Unvested RSUs and contingent shares (in thousands)
|
1,318 | 524 | 577 | |||||||||
| 395,043 | 383,753 | 370,229 | ||||||||||
|
Diluted earnings per ordinary share
attributable to Himax Technologies, Inc. stockholders
|
$ | 0.29 | 0.20 | 0.11 | ||||||||
|
(r)
|
Share-Based Compensation
|
The Company accounts for its share-based compensation awards in accordance with ASC 718,
Compensation-Stock Compensation
. The cost of employee services received in exchange for share-based compensation is measured based on the grant-date fair value of the share-based instruments issued. The cost of employee services is equal to the grant-date fair value of shares issued to employees and is recognized in earnings over the service period. Compensation cost also considers the number of awards management believes will eventually vest. As a result, compensation cost is reduced by the estimated forfeitures. The estimate is adjusted each period to reflect the current estimate of forfeitures, and finally, the actual number of awards that vest.
F-22
HIMAX TECHNOLOGIES, INC. AND SUBSIDIARIES
Notes to Consolidated Financial Statements (Continued)
December 31, 2007, 2008 and 2009
|
(s)
|
Noncontrolling Interests
|
On January 1, 2009, the Company adopted ASC Subtopic 810-10 (SFAS No. 160),
Noncontrolling Interests in Consolidated Financial Statements—an amendment of ARB No. 51
, which requires certain changes to the presentation of the financial statements. This amendment requires noncontrolling interests (previously referred to as “minority interest”) to be classified in the consolidated statements of income as part of consolidated net income (loss of $(1,141) thousand, $(3,657) thousand and $(3,840) thousand for the years ended December 31, 2007, 2008 and 2009, respectively) and to include the accumulated amount of noncontrolling interests in the consolidated balance sheets as part of equity ($6,835 thousand and $4,619 thousand at December 31, 2008 and December 31, 2009, respectively). The amount previously reported as net income is now presented as net income attributable to Himax Technologies, Inc. stockholders. If a change in ownership of a consolidated subsidiary results in loss of control and deconsolidation, any retained ownership interests are remeasured with the gain or loss reported in net earnings.
The effects of changes in the Company’s ownership interests in its subsidiaries on Himax Technologies, Inc. equity are set forth as follows:
|
Year Ended December 31,
|
||||||||||||
|
2007
|
2008
|
2009
|
||||||||||
|
Net income attributable to Himax Technologies, Inc. stockholders
|
$ | 112,596 | 76,381 | 39,650 | ||||||||
|
Transfers (to) from the noncontrolling interests:
|
||||||||||||
|
Increase in Himax Technologies, Inc.’s paid-in capital for sale of shares of Himax Display, Himax Analogic and Himax Media Solutions
|
- | - | 285 | |||||||||
|
Increase in Himax Technologies, Inc.’s paid-in capital for new shares issued by Himax Display, Himax Media Solutions and Himax Analogic
|
833 | 2,040 | 35 | |||||||||
|
Decrease in Himax Technologies, Inc.’s paid-in capital for purchase of new shares issued by Himax Analogic
|
- | - | (242 | ) | ||||||||
|
Net transfers from noncontrolling interests
|
833 | 2,040 | 78 | |||||||||
|
Change from net income attributable to Himax Technologies, Inc. stockholders and transfers from noncontrolling interests
|
$ | 113,429 | 78,421 | 39,728 | ||||||||
F-23
HIMAX TECHNOLOGIES, INC. AND SUBSIDIARIES
Notes to Consolidated Financial Statements (Continued)
December 31, 2007, 2008 and 2009
|
(t)
|
Fair Value Measurements
|
On January 1, 2008, the Company adopted ASC 820 (SFAS No. 157),
Fair Value Measurements and Disclosures
, for fair value measurements of financial assets and financial liabilities and for fair value measurements of nonfinancial items that are recognized or disclosed at fair value in the financial statements on a recurring basis. ASC 820 (SFAS No. 157) defines fair value as the price that would be received to sell an asset or paid to transfer a liability in an orderly transaction between market participants at the measurement date. ASC 820 (SFAS No. 157) also establishes a framework for measuring fair value and expands disclosures about fair value measurements. See Note 18.
On January 1, 2009, the Company adopted ASC 820 (SFAS No. 157)
to fair value measurements of
nonfinancial assets and nonfinancial liabilities that are recognized or disclosed at fair value in the financial statements on a nonrecurring basis.
|
(u)
|
Recently Issued Accounting Pronouncements Not Yet Adopted
|
In October 2009, the FASB issued ASU 2009-13, Revenue Recognition (Topic 605): Multiple-Deliverable Revenue Arrangement (EITF Issue No. 08-1, Revenue Arrangement with Multiple Deliverable). ASU 2009-13 amends ASC 650-25 to eliminate the requirement that all undelivered elements have vendor specific objective evidence of selling price (“VSOE”) or third party evidence of selling price (“TPE”) before an entity can recognize the portion of an overall arrangement fee that is attributable to items that already have been delivered. In the absence of VSOE and TPE for one or more delivered or undelivered elements in a multiple-element arrangement, entities will be required to estimate the selling prices of those elements. The overall arrangement fee will be allocated to each element (both delivered and undelivered items) based on their relative selling prices, regardless of whether those selling prices are evidenced by VSOE or TPE or are based on the entity’s estimated selling price. Application of the “residual method” of allocating an overall arrangement fee between delivered and undelivered elements will no longer be permitted upon adoption of ASU 2009-13. Additionally, the new guidance will require entities to disclose more information about their multiple-element revenue arrangements. ASU 2009-13 is effective prospectively for revenue arrangements entered into or materially modified in fiscal years beginning on or after June 15, 2010. Early adoption is permitted. Management expects that the adoption of 2009-13 will not have a material impact on the Company’s consolidated financial statements.
Reclassifications
Certain prior year amounts have been reclassified to conform to the current year presentation.
F-24
HIMAX TECHNOLOGIES, INC. AND SUBSIDIARIES
Notes to Consolidated Financial Statements (Continued)
December 31, 2007, 2008 and 2009
|
Note 3.
|
Acquisition
|
On February 1, 2007, the Company acquired 100 percent of the outstanding ordinary shares of Wisepal Technologies, Inc. (“Wisepal”). The results of Wisepal’s operations have been included in the Company’s consolidated financial statements since that date. Wisepal is a display driver IC company primarily focuses on small-and medium-sized applications. As a result of the acquisition, the Company expects to diversify its product portfolio with more exposure towards small-and medium-sized products. It also expects to further strengthen the Company’s competitiveness in the display driver market with the addition of technology resources.
The aggregate purchase price was $46,971 thousand, consisting of 12,180,228 shares of the Company’s ordinary shares amounting to $43,021 thousand; 418,440 units of the Company’s RSUs (represents 836,880 ordinary shares) amounting to $2,011 thousand in exchange for Wisepal’s unvested stock option of which 127,283 units (represents 254,566 ordinary shares) vested immediately on the acquisition date; other direct acquisition cost of $252 thousand and a contingent consideration of 790,496 shares of the Company’s ordinary shares amounting to $1,687 thousand to be issued to the former parent company of Wisepal at US$0.0005 per ordinary share based on the purchase agreement. The value of the Company’s ordinary shares and the vested portion of the RSUs issued were determined based on the average market price of the Company’s ordinary shares over the 2-day period before and after the terms of the acquisition were agreed to and announced. The value of the additional contingent ordinary shares to be issued was determined based on the market price of the Company’s ordinary shares as of December 31, 2007.
The following table summarizes the allocation of the purchase price to the estimated fair values of the assets acquired and liabilities assumed at the date of acquisition.
|
At February 1, 2007
|
||||
|
(in thousands)
|
||||
|
Cash
|
$ | 6,413 | ||
|
Current assets, other than cash
|
3,037 | |||
|
Property and equipment
|
622 | |||
|
Intangible assets - in-process R&D
|
1,600 | |||
|
- others
|
14,300 | |||
|
Goodwill
|
26,878 | |||
|
Total assets acquired
|
52,850 | |||
|
Current liabilities
|
(1,332 | ) | ||
|
Deferred income taxes
|
(4,547 | ) | ||
|
Total liabilities assumed
|
(5,879 | ) | ||
|
Net assets acquired
|
$ | 46,971 | ||
F-25
HIMAX TECHNOLOGIES, INC. AND SUBSIDIARIES
Notes to Consolidated Financial Statements (Continued)
December 31, 2007, 2008 and 2009
Acquired tangible assets were valued at estimates of their current fair values. The valuation of acquired intangible assets was determined based on management’s estimates and consultation with an independent appraiser. Of the $15,900 thousand of the acquired intangible assets, $1,600 thousand was assigned to in-process R&D assets that had not yet reached technological feasibility and had no alternative future use and were written off at the date of acquisition. Those write-offs are included in research and development expenses in the accompanying consolidated statements of income. The remaining acquired intangible assets, all of which will be amortized, have a weighted-average useful life of approximately 7 years. The intangible assets that make up that amount include core and developed technology of $6,200 thousand (7-year weighted-average useful life) and customer relationships of $8,100 thousand (7-year weighted-average useful life). Himax paid a premium for this acquisition because of expected synergistic benefits, including the assembled workforce, and to broaden the supplier base to secure foundry capacity and optimize its foundry mix and further diversified its technology and product mix. Goodwill is not deductible for tax purpose.
The following unaudited pro forma results of operations for the year end December 31, 2007 is presented as though the acquisition occurred at the beginning of 2007 (dollars in thousand except per share amounts):
|
(unaudited
)
|
||||
|
Net revenues
|
$ | 919,105 | ||
|
Net income
|
$ | 112,406 | ||
|
Diluted earnings per ordinary share
|
$ | 0.28 | ||
|
Note 4.
|
Investments in Marketable Securities Available-for sale
|
Following is a summary of marketable securities as of December 31, 2008 and 2009:
|
December 31, 2008
|
||||||||||||||||
|
Aggregate
Cost
|
Gross
Unrealized
Gains
|
Gross
Unrealized
Losses
|
Aggregate
Market
Value
|
|||||||||||||
|
(in thousands)
|
||||||||||||||||
|
Time deposit with original maturities more than three months
|
$ | 151 | 2 | - | 153 | |||||||||||
|
Open-ended bond fund
|
13,564 | 153 | - | 13,717 | ||||||||||||
|
Total
|
$ | 13,715 | 155 | - | 13,870 | |||||||||||
F-26
HIMAX TECHNOLOGIES, INC. AND SUBSIDIARIES
Notes to Consolidated Financial Statements (Continued)
December 31, 2007, 2008 and 2009
|
|
December 31, 2009
|
|||||||||||||||
|
Aggregate
Cost
|
Gross
Unrealized
Gains
|
Gross
Unrealized
Losses
|
Aggregate
Market
Value
|
|||||||||||||
|
(in thousands)
|
||||||||||||||||
|
Time deposit with original maturities more than three months
|
$ | 2,212 | 6 | - | 2,218 | |||||||||||
|
Open-ended bond fund
|
8,469 | 43 | - | 8,512 | ||||||||||||
|
Total
|
$ | 10,681 | 49 | - | 10,730 | |||||||||||
The Company’s portfolio of available for sale marketable securities by contractual maturity or the expected holding period as of December 31, 2008 and 2009 is due in one year or less.
Information on sales of available for sale marketable securities for the years ended December 31, 2007, 2008 and 2009 is summarized below.
|
Period
|
Proceeds
from sales |
Gross
realized gains
|
Gross
realized losses
|
|||||||||
|
(in thousands)
|
||||||||||||
|
Year ended December 31, 2007
|
$ | 46,303 | 112 | - | ||||||||
|
Year ended December 31, 2008
|
$ | 71,172 | 1,060 | (147 | ) | |||||||
|
Year ended December 31, 2009
|
$ | 39,263 | 179 | (266 | ) | |||||||
|
Note 5.
|
Allowance for Doubtful Accounts, Sales Returns and Discounts
|
The activity in the allowance for doubtful accounts, sales returns and discounts for the years ended December 31, 2007, 2008 and 2009 follows:
Allowance for doubtful accounts
|
Period
|
Balance at beginning
of
year
|
Additions
|
Amounts
utilized
|
Balance at
end of
year
|
||||||||||||
|
(in thousands)
|
||||||||||||||||
|
For the year ended December 31, 2007
|
$ | 187 | - | (187 | ) | - | ||||||||||
|
For the year ended December 31, 2008
|
$ | - | 25,305 | (8 | ) | 25,297 | ||||||||||
|
For the year ended December 31, 2009
|
$ | 25,297 | 218 | - | 25,515 | |||||||||||
F-27
HIMAX TECHNOLOGIES, INC. AND SUBSIDIARIES
Notes to Consolidated Financial Statements (Continued)
December 31, 2007, 2008 and 2009
Allowance for sales returns and discounts
|
Period
|
Balance at beginning
of
year
|
Additions
|
Amounts
utilized
|
Balance at
end of
year
|
||||||||||||
|
(in thousands)
|
||||||||||||||||
|
For the year ended December 31, 2007
|
$ | 681 | 1,705 | (1,893 | ) | 493 | ||||||||||
|
For the year ended December 31, 2008
|
$ | 493 | 1,657 | (1,988 | ) | 162 | ||||||||||
|
For the year ended December 31, 2009
|
$ | 162 | 2,391 | (1,583 | ) | 970 | ||||||||||
|
Note 6.
|
Equity Method Investments
|
Investments accounted for under the equity method consist of 30% of the outstanding ordinary shares of
Hangzhou Crystal Display Technology Co., Ltd.
(
Crystal, newly incorporated in May, 2009
) that were purchased in June 2009 and 15.15% of the outstanding ordinary shares of
Shinyoptics Corp.
(
Shinyoptics, newly incorporated in July, 2009
) that purchased in September 2009. Both investees are LCOS project module companies. The Company has one third of the seats on
Shinyoptics’ board of directors
and therefore has the ability to exercise significant influence over the financial and operating policies of
Shinyoptics despite its 15.15% equity interest.
There is no difference between the Company’s cost and the Company’s share of net assets of equity method investees at December 31, 2009. The carrying amount of the investment in
Crystal and
Shinyoptics
were $284 thousand and $302 thousand at December 31, 2009, respectively. As of December 31, 2009, it was not practicable for management to estimate the fair value of the Company’s investments in
Crystal and
Shinyoptics
due to the lack of quoted market price and the inability to estimate the fair value without incurring excessive costs.
|
Note 7.
|
Inventories
|
As of December 31, 2008 and 2009, inventories consisted of the following:
|
December 31,
|
||||||||
|
2008
|
2009
|
|||||||
|
(in thousands)
|
||||||||
|
Finished goods
|
$ | 44,965 | 27,802 | |||||
|
Work in process
|
46,210 | 28,043 | ||||||
|
Raw materials
|
5,730 | 11,874 | ||||||
|
Supplies
|
16 | 49 | ||||||
| $ | 96,921 | 67,768 | ||||||
F-28
HIMAX TECHNOLOGIES, INC. AND SUBSIDIARIES
Notes to Consolidated Financial Statements (Continued)
December 31, 2007, 2008 and 2009
Inventory write-downs were $14,824 thousand, $18,028 thousand and $13,622 thousand for the years ended December 31, 2007, 2008 and 2009, respectively, and are included in cost of revenues.
|
Note 8.
|
Goodwill and Intangible Assets
|
|
(a)
|
Intangible Assets
|
|
December 31, 2008
|
|||||||||
|
Gross
carrying
amount
|
Weighted
average amortization period |
Accumulated
amortization
|
|||||||
|
(in thousands)
|
|||||||||
|
Technology
|
$ | 6,339 |
7 years
|
1,837 | |||||
|
Customer relationship
|
8,100 |
7 years
|
2,218 | ||||||
|
Patents
|
742 |
5 years
|
161 | ||||||
|
Total
|
$ | 15,181 | 4,216 | ||||||
|
December 31, 2009
|
|||||||||
|
Gross
carrying
amount
|
Weighted
average amortization period |
Accumulated
amortization
|
|||||||
|
(in thousands)
|
|||||||||
|
Technology
|
$ | 6,339 |
7 years
|
2,723 | |||||
|
Customer relationship
|
8,100 |
7 years
|
3,375 | ||||||
|
Patents
|
842 |
6 years
|
311 | ||||||
|
Total
|
$ | 15,281 | 6,409 | ||||||
Amortization expense for the years ended December 31, 2007, 2008 and 2009, was $1,972 thousand, $2,140 thousand and $2,193 thousand, respectively. Estimated amortization expense for the next five years is $2,198 thousand in 2010, $2,180 thousand in 2011, $2,126 thousand in 2012 and 2013, and $177 thousand in 2014.
|
(b)
|
Goodwill
|
Goodwill is tested for impairment annually or more frequently when events or circumstances indicate that the carrying value of a reporting unit more likely than not exceeds its fair value. The Company has a single reporting unit for goodwill impairment testing purposes, which is the enterprise as a whole.
F-29
HIMAX TECHNOLOGIES, INC. AND SUBSIDIARIES
Notes to Consolidated Financial Statements (Continued)
December 31, 2007, 2008 and 2009
During the fourth quarter of 2008,
the worldwide financial crisis has adversely
contributed to the decline in the Company’s quoted share price. At December 31, 2008, the market capitalization of the Company was lower than its equity book value.
Consequently, management performed an evaluation at the 2008 year-end to assess potential impairment of the Company’s goodwill based on the Company’s adjusted market capitalization at December 31, 2008. Specifically, management adjusted the Company’s market capitalization by an appropriate control premium to derive at the estimated fair value of the Company. Management believes that the control premium
represents the additional amount per share market participants would be willing to pay to obtain a controlling voting interest in the Company as a result of the ability to take advantage of synergies and other benefits.
To determine an appropriate control premium, management referenced MergerStat database and Standard Industrial Classification (SIC)
to identify comparable merger and acquisition transactions in 2008 in the Company’s industry. Management further believes that the control premium has increased under the current market conditions due to the significant volatility of the Company’s share price that may have distorted the market capitalization as a measure of fair value at 2008 year-end. Furthermore, management validated the results of adjusted market capitalization valuation approach with the results of an income approach of measuring the fair value of the Company. Based on management’s assessment,
the Company’s fair value exceeded the net book value of the Company at December 31, 2008
. At October 31, 2009, the annual goodwill impairment evaluation date, the fair value of the reporting unit, based on the quoted market price of the Company’s shares, is higher than its carrying amount. Therefore, management concluded that goodwill was not impaired.
|
Note 9.
|
Property, Plant and Equipment
|
|
December 31,
|
||||||||
|
2008
|
2009
|
|||||||
|
(in thousands)
|
||||||||
|
Land
|
$ | 10,154 | 10,154 | |||||
|
Building and improvements
|
16,828 | 17,084 | ||||||
|
Machinery
|
7,569 | 18,828 | ||||||
|
Research and development equipment
|
14,640 | 15,008 | ||||||
|
Software
|
9,526 | 9,875 | ||||||
|
Office furniture and equipment
|
5,972 | 6,107 | ||||||
|
Others
|
5,098 | 7,712 | ||||||
| 69,787 | 84,768 | |||||||
|
Accumulated depreciation and amortization
|
(23,827 | ) | (34,388 | ) | ||||
|
Prepayment for purchases of equipment
|
9,151 | 1,206 | ||||||
| $ | 55,111 | 51,586 | ||||||
Depreciation and amortization of these assets for 2007, 2008 and 2009, was $8,288 thousand, $10,178 thousand and $11,602 thousand, respectively.
F-30
HIMAX TECHNOLOGIES, INC. AND SUBSIDIARIES
Notes to Consolidated Financial Statements (Continued)
December 31, 2007, 2008 and 2009
|
Note 10.
|
Investments in Non-marketable Equity Securities
|
Following is a summary of such investments which are accounted for using the cost method as of December 31, 2008 and 2009:
|
December 31,
|
|||||||||
|
2008
|
2009
|
||||||||
|
(in thousands)
|
|||||||||
|
Chi Lin Technology Co. Ltd.
|
$ | 1,057 | 1,057 | ||||||
|
Jetronics International Corp.
|
1,600 | 1,600 | |||||||
|
C Company
|
8,962 | 8,962 | |||||||
| $ | 11,619 | 11,619 | |||||||
As of December 31, 2009, it was not practicable for management to estimate the fair values of the Company’s investments in equity Chi Lin Technology Co. Ltd., Jetronics International Corp., and C Company due to the lack of quoted market price and the inability to estimate the fair value without incurring excessive costs. However, despite the current global economic conditions, management identified no events or changes in circumstance that may significantly affect the Company’s ability to recoverability of the carrying values of these investments.
|
Note 11.
|
Other Accrued Expenses and Other Current Liabilities
|
|
December 31,
|
|||||||||
|
2008
|
2009
|
||||||||
|
(in thousands)
|
|||||||||
|
Accrued mask, mold fees and other expenses for RD
|
$ | 6,689 | 6,254 | ||||||
|
Payable for purchases of equipment
|
3,225 | 529 | |||||||
|
Accrued software maintenance
|
1,442 | 1,550 | |||||||
|
Accrued payroll and related expenses
|
2,649 | 2,951 | |||||||
|
Accrued litigation settlement and related costs
|
1,236 | - | |||||||
|
Accrued professional service fee
|
1,037 | 1,268 | |||||||
|
Accrued warranty costs
|
249 | 679 | |||||||
|
Accrued insurance, welfare expenses, etc.
|
4,441 | 5,194 | |||||||
| $ | 20,968 | 18,425 | |||||||
F-31
HIMAX TECHNOLOGIES, INC. AND SUBSIDIARIES
Notes to Consolidated Financial Statements (Continued)
December 31, 2007, 2008 and 2009
The movement in accrued warranty costs for the years ended December 31, 2007, 2008 and 2009 is as follows:
|
Period
|
Balance at beginning
of
year
|
Additions charged to
expense
|
Amounts
utilized
|
Balance at
end of
year
|
||||||||||||
|
(in thousands)
|
||||||||||||||||
|
Year ended December 31, 2007
|
$ | 630 | 799 | (1,094 | ) | 335 | ||||||||||
|
Year ended December 31, 2008
|
$ | 335 | 1,526 | (1,612 | ) | 249 | ||||||||||
|
Year ended December 31, 2009
|
$ | 249 | 2,920 | (2,490 | ) | 679 | ||||||||||
|
Note 12.
|
Unused Credit Lines
|
As of December 31, 2009, unused credit lines amounted to $46,199 thousand, which will expire between February 2010 and November 2010. Among which, $2,000 thousand expired in February 2010.
|
Note 13.
|
Government Grants
|
The Company entered into several contracts with
Department of Industrial Technology of Ministry of Economic Affairs (DOIT of MOEA) and Institute for Information Industry (III) during 2007, 2008 and 2009 primarily for the development of certain new leading products or technologies. Details of these contracts are summarized below:
|
Authority
|
Total
Grant
|
Execution Period
|
Product Description
|
|||
|
(in thousands)
|
||||||
|
DOIT of MOEA
|
NT$
|
22,670 (US$703)
|
August 2007 to July 2009
|
Display Port IC
|
||
|
DOIT of MOEA
|
30,240 (US$919)
|
October 2008 to September 2010
|
Multi-standard Decoder iDTV SOC
|
|||
|
III
|
1,860 (US$57)
|
March 2009 to November 2009
|
Himax Headquarter Excellent Program
|
Government grants recognized by the Company as a reduction of research and development expense and general and administrative expense in the accompanying consolidated statements of income in 2007, 2008 and 2009 were $108 thousand, $595 thousand and $534 thousand, respectively.
F-32
HIMAX TECHNOLOGIES, INC. AND SUBSIDIARIES
Notes to Consolidated Financial Statements (Continued)
December 31, 2007, 2008 and 2009
|
Note 14.
|
Retirement Plan
|
The Company has established a Defined Benefit Plan covering full-time employees in the ROC. In accordance with the Defined Benefit Plan, employees are eligible for retirement or are required to retire after meeting certain age or service requirements. Retirement benefits are based on years of service and the average salary for the six-month period before the employee’s retirement. Each employee earns two months of salary for each of the first fifteen years of service, and one month of salary for each year of service thereafter. The maximum retirement benefit is 45 months of salary. Retirement benefits are paid to eligible participants on a lump-sum basis upon retirement.
Defined Benefit Plan assets consist entirely of a Pension Fund (the “Fund”) denominated solely in cash, as mandated by ROC Labor Standard Law. The Company contributes an amount equal to 2% of wages and salaries paid every month to the Fund (required by law). The Fund is administered by a pension fund monitoring committee (the “Committee”) and is deposited in the Committee’s name in the Bank of Taiwan.
The Company’s pension fund is managed by a government-established institution with minimum return guaranteed by government and the fund asset is treated as cash category.
Beginning July 1, 2005, pursuant to the newly effective ROC Labor Pension Act, the Company is required to make a monthly contribution for full-time employees in the ROC that elected to participate in the Defined Contribution Plan at a rate no less than 6% of the employee’s monthly wages to the employees’ individual pension fund accounts at the ROC Bureau of Labor Insurance. Expense recognized in 2007, 2008 and 2009, based on the contribution called for was $1,066 thousand, $1,362 thousand and $1,354 thousand, respectively.
Substantially all participants in the Defined Benefits Plan had elected to participate in the Defined Contribution Plan. The transfer of participants to the Defined Contribution Plan did not have a material effect on the Company’s financial position or results of operations. Participants’ accumulated benefits under the Defined Benefit Plan are not impacted by their election to change the plans and their seniority remains regulated by ROC Labor Standard Law, such as the retirement criteria and the amount payable. The Company is required to make contribution for the Defined Benefit Plan until it is fully funded. Pursuant to relevant regulatory requirements, the Company expects to make a cash contribution of $255 thousand to its pension fund maintained with the Bank of Taiwan and $1,590 thousand to the employees’ individual pension fund accounts at the ROC Bureau of Labor Insurance in 2010.
F-33
HIMAX TECHNOLOGIES, INC. AND SUBSIDIARIES
Notes to Consolidated Financial Statements (Continued)
December 31, 2007, 2008 and 2009
The Company uses a measurement date of December 31, for the Defined Benefit Plan. The changes in projected benefit obligation, plan assets and details of the funded status of the Plan are as follows:
|
December 31,
|
||||||||
|
2008
|
2009
|
|||||||
|
(in thousands)
|
||||||||
|
Change in projected benefit obligation:
|
||||||||
|
Benefit obligation at beginning of year
|
$ | 1,090 | 1,243 | |||||
|
Service cost
|
- | - | ||||||
|
Interest cost
|
34 | 31 | ||||||
|
Actuarial loss
|
119 | 58 | ||||||
|
Benefit obligation at end of year
|
1,243 | 1,332 | ||||||
|
Change in plan assets:
|
||||||||
|
Fair value at beginning of year
|
1,129 | 1,581 | ||||||
|
Actual return on plan assets
|
45 | 11 | ||||||
|
Employer contribution
|
407 | 277 | ||||||
|
Fair value at end of year
|
1,581 | 1,869 | ||||||
|
Funded status
|
$ | 338 | 537 | |||||
|
Amounts recognized in the balance sheet consist of:
|
||||||||
|
Prepaid pension costs
|
$ | 552 | 628 | |||||
|
Accrued pension liabilities
|
(214 | ) | (91 | ) | ||||
|
Net amount recognized
|
$ | 338 | 537 | |||||
Amounts recognized in accumulated other comprehensive income was net actuarial loss of $376 thousand, $443 thousand and $465 thousand at December 31, 2007, 2008 and 2009, respectively.
The accumulated benefit obligation for the Defined Benefit Plan was $416 thousand and $461 thousand at December 31, 2008 and 2009, respectively. As of December 31, 2008 and 2009, no employee was eligible for retirement or was required to retire.
For the years ended December 31, 2007, 2008 and 2009, the net periodic pension cost consisted of the following:
|
Year Ended December 31,
|
||||||||||||
|
2007
|
2008
|
2009
|
||||||||||
|
(in thousands)
|
||||||||||||
|
Service cost
|
$ | 3 | - | - | ||||||||
|
Interest cost
|
26 | 34 | 31 | |||||||||
|
Expected return on plan assets
|
(20 | ) | (35 | ) | (40 | ) | ||||||
|
Net amortization
|
96 | 34 | 25 | |||||||||
|
Net periodic pension cost
|
$ | 105 | 33 | 16 | ||||||||
F-34
HIMAX TECHNOLOGIES, INC. AND SUBSIDIARIES
Notes to Consolidated Financial Statements (Continued)
December 31, 2007, 2008 and 2009
The net actuarial loss for the defined benefit pension plan that will be amortized from accumulated other comprehensive income into net periodic benefit cost in 2010 is $25 thousand.
At December 31, 2008 and 2009, the weighted-average assumptions used in computing the benefit obligation are as follows:
|
December 31,
|
||||||||||||
|
2008
|
2009
|
|||||||||||
|
Himax Taiwan,
Himax Media
Solutions,
Himax Display &
Himax Analogic |
Wisepal
|
Himax Taiwan,
Himax Media Solutions,
Himax Display, Himax
Analogic & Wisepal |
||||||||||
|
Discount rate
|
2.50% | 2.50% | 2.25% | |||||||||
|
Rate of increase in compensation levels
|
4.00% | 5.00% | 4.00% | |||||||||
For the years ended December 31, 2007, 2008 and 2009, the weighted average assumptions used in computing net periodic benefit cost are as follows:
|
Year Ended December 31,
|
||||||||||||||||||||
|
2007
|
2008
|
2009
|
||||||||||||||||||
|
Himax Display &
Himax Analogic |
Himax Taiwan,
Wisepal &
Himax Media Solutions |
Himax Taiwan,
Himax Media Solutions,
Himax
Display & Himax Analogic |
Wisepal
|
Himax Taiwan,
Himax Media Solutions,
Himax Display, Himax
Analogic
&
Wisepal
|
||||||||||||||||
|
Discount rate
|
3.00% | 3.00% | 2.50% | 2.50% | 2.25% | |||||||||||||||
|
Rate of increase in compensation levels
|
4.00% | 5.00% | 4.00% | 5.00% | 4.00% | |||||||||||||||
|
Expected long-term rate of return on pension assets
|
3.00% | 3.00% | 2.50% | 2.50% | 2.25% | |||||||||||||||
F-35
HIMAX TECHNOLOGIES, INC. AND SUBSIDIARIES
Notes to Consolidated Financial Statements (Continued)
December 31, 2007, 2008 and 2009
Management determines the discount rate and expected long-term rate of return on plan assets based on the yields of twenty year ROC central government bonds which is in line with the respective employees remaining service period and the historical long-term rate of return on the above mentioned Fund mandated by the ROC Labor Standard Law.
There are no benefits payments to be paid during the next ten years.
|
Note 15.
|
Share-Based Compensation
|
The amount of share-based compensation expenses included in applicable costs of sales and expense categories is summarized as follows:
|
Year Ended December 31,
|
||||||||||||
|
2007
|
2008
|
2009
|
||||||||||
|
(in thousands)
|
||||||||||||
|
Cost of revenues
|
$ | 422 | 435 | 264 | ||||||||
|
Research and development
|
15,393 | 15,861 | 10,936 | |||||||||
|
General and administrative
|
2,182 | 2,813 | 1,959 | |||||||||
|
Sales and marketing
|
2,324 | 2,691 | 1,902 | |||||||||
| $ | 20,321 | 21,800 | 15,061 | |||||||||
(a)
Long-term Incentive Plan
On October 25, 2005, the Company’s shareholders approved a long-term incentive plan. The plan permits the grants of options or RSUs to the Company’s employees, directors and service providers where each unit of RSU represents two ordinary shares of the Company (after recapitalization effected on August 10, 2009).
On December 30, 2005, the Company’s compensation committee made grants of 1,297,564 RSUs and 20,000 RSUs to the Company’s employees and independent directors, respectively. The vesting schedule for the RSUs granted to employees is as follows: 25% of the RSU grant vested immediately on the grant date, and a subsequent 25% will vest on each of September 30, 2006, 2007 and 2008, subject to certain forfeiture events. The vesting schedule for the RSUs granted to independent directors is as follows: 25% of the RSU grant vested immediately on the grant date, and a subsequent 25% will vest on each of June 30, 2006, 2007 and 2008, subject to certain forfeiture events.
On September 29, 2006, the Company’s compensation committee made grants of 3,798,808 RSUs to the Company’s employees. The vesting schedule for the RSUs is as follows: 47.29% of the RSUs grant vested immediately on the grant date and a subsequent 17.57% will vest on each of September 30, 2007, 2008 and 2009, subject to certain forfeiture events.
F-36
HIMAX TECHNOLOGIES, INC. AND SUBSIDIARIES
Notes to Consolidated Financial Statements (Continued)
December 31, 2007, 2008 and 2009
On September 26, 2007, the Company’s compensation committee made grants of 6,694,411 RSUs to the Company’s employees. The vesting schedule for the RSUs is as follows: 54.55% of the RSUs grant vested immediately on the grant date which were settled by cash amounting to $14,426 thousand, a subsequent 15.15% will vest on each of September 30, 2008, 2009 and 2010 which will be settled by the Company’s ordinary shares, subject to certain forfeiture events.
On September 29, 2008, the Company’s compensation committee made grants of 7,108,675 RSUs to the Company’s employees. The vesting schedule for the RSUs is as follows: 60.64% of the RSUs grant vested immediately on the grant date which were settled by cash amounting to $12,714 thousand, a subsequent 13.12% will vest on each of September 30, 2009, 2010 and 2011 which will be settled by the Company’s ordinary shares, subject to certain forfeiture events.
On September 28, 2009, the Company’s compensation committee made grants of 3,577,686 RSUs to the Company’s employees. The vesting schedule for the RSUs is as follows: 55.96% of the RSUs grant vested immediately on the grant date which were settled by cash amounting to $6,508 thousand, a subsequent 14.68% will vest on each of September 30, 2010, 2011 and 2012 which will be settled by the Company’s ordinary shares, subject to certain forfeiture events.
The amount of compensation expense from the long-term incentive plan was determined based on the estimated fair value and the market price of ADS (one ADS represents two ordinary shares) underlying the RSUs granted on the date of grant, which was $8.62 per ADS, $5.71 per ADS, $3.95 per ADS, $2.95 per ADS and $3.25 per ADS on December 30, 2005, September 29, 2006, September 26, 2007, September 29, 2008 and September 28, 2009, respectively.
Management is primarily responsible for estimating the fair value of the Company’s ordinary shares underlying the RSUs granted on December 30, 2005. When estimating fair value for such share prior to the Company’s IPO, management considers a number of factors, including contemporaneous valuations from an independent third-party appraiser. The share valuation methodologies used include the discounted cash flow approach and the market value approach where a different weight to each of the approaches is assigned to estimate the value of the Company when the RSUs were granted. The discounted cash flow approach involves applying appropriate discount rates to estimated cash flows that are based on earnings forecasts. The market value approach incorporates certain assumptions including the market performance of comparable companies as well as the Company’s financial results and business plan. These assumptions include: no material changes in the existing political, legal, fiscal and economic conditions in Taiwan; the Company’s ability to retain competent management, key personnel and technical staff to support its ongoing operations; and no material deviation in industry trends and market conditions from economic forecasts.
F-37
HIMAX TECHNOLOGIES, INC. AND SUBSIDIARIES
Notes to Consolidated Financial Statements (Continued)
December 31, 2007, 2008 and 2009
In December 2007, due to the carve-out of television semiconductor solutions business to incorporate Himax Media Solutions, Inc. (“Himax Media Solution”, a consolidated subsidiary), 145 employees were transferred from Himax Taiwan to Himax Media Solutions. 361,046 units of these employees’ unvested RSUs were cancelled in exchange for 3,416,714 nonvested shares of Himax Media Solutions’ ordinary share. See Note 15 (b)(iii) for further details of the modification of award.
RSUs activity under the long-term incentive plan during the periods indicated is as follows:
|
Number of Underlying
Shares for RSUs
|
Weighted
Average Grant
Date Fair Value
|
|||||||
|
Balance at January 1, 2007
|
2,508,143 | $ | 6.39 | |||||
|
Granted
|
6,694,411 | 3.95 | ||||||
|
Vested
|
(4,507,170 | ) | 4.46 | |||||
|
Cancelled
|
(361,046 | ) | 3.98 | |||||
|
Forfeited
|
(680,949 | ) | 5.27 | |||||
|
Balance at December 31, 2007
|
3,653,389 | 4.75 | ||||||
|
Granted
|
7,108,675 | 2.95 | ||||||
|
Vested
|
(5,914,336 | ) | 3.55 | |||||
|
Forfeited
|
(311,433 | ) | 4.10 | |||||
|
Balance at December 31, 2008
|
4,536,295 | 3.54 | ||||||
|
Granted
|
3,577,686 | 3.25 | ||||||
|
Vested
|
(4,014,338 | ) | 3.58 | |||||
|
Forfeited
|
(261,891 | ) | 3.57 | |||||
|
Balance at December 31, 2009
|
3,837,752 | 3.23 | ||||||
As of December 31, 2009, the total compensation cost related to the unvested RSUs not yet recognized was $10,012 thousand. The weighted-average period over which it is expected to be recognized is 1.99 years.
F-38
HIMAX TECHNOLOGIES, INC. AND SUBSIDIARIES
Notes to Consolidated Financial Statements (Continued)
December 31, 2007, 2008 and 2009
The allocation of compensation expenses from the RSUs granted to employees and independent directors under the long-term incentive plan is summarized as follows:
|
Year Ended December 31,
|
||||||||||||
|
2007
|
2008
|
2009
|
||||||||||
|
(in thousands)
|
||||||||||||
|
Cost of revenues
|
$ | 422 | 435 | 264 | ||||||||
|
Research and development
|
15,164 | 14,906 | 10,078 | |||||||||
|
G
eneral and
adm
inistrative
|
2,182 | 2,813 | 1,938 | |||||||||
|
Sales and marketing
|
2,323 | 2,671 | 1,853 | |||||||||
| $ | 20,091 | 20,825 | 14,133 | |||||||||
|
(b)
|
Nonvested Shares Issued to Employees
|
|
(i)
|
In September 2005, Himax Analogic granted nonvested shares of its ordinary shares to certain employees for their future service. The shares vested over four years after the grant date. The Company recognized compensation expenses of $59 thousand, $45 thousand, and $15 thousand in 2007, 2008 and 2009, respectively. Such compensation expense was recorded as research and development expenses in the accompanying consolidated statements of income with a corresponding increase to noncontrolling interests in the accompanying consolidated balance sheets. The fair value of shares on grant date was estimated based on the then most recent price of new shares issued to unrelated third parties, which was NT$10 (US$0.319) per share.
|
Nonvested share activity of this award during the period indicated is as follows:
|
Number of
Shares
|
Weighted Average Grant
Date Fair Value
|
|||||||
|
Balance at January 1, 2007
|
769,000 | $ | 0.319 | |||||
|
Forfeited
|
(66,000 | ) | 0.319 | |||||
|
Balance at December 31, 2007
|
703,000 | 0.319 | ||||||
|
Forfeited
|
(30,000 | ) | 0.319 | |||||
|
Balance at December 31, 2008
|
673,000 | 0.319 | ||||||
|
Forfeited
|
(15,000 | ) | 0.319 | |||||
|
Vested
|
(658,000 | ) | 0.319 | |||||
|
Balance at December 31, 2009
|
- | - | ||||||
As of December 31, 2009, the total compensation cost related to this award has been fully recognized.
F-39
HIMAX TECHNOLOGIES, INC. AND SUBSIDIARIES
Notes to Consolidated Financial Statements (Continued)
December 31, 2007, 2008 and 2009
|
(ii)
|
During September 2007 to December 2009, Himax Imaging Inc. (“Himax Imaging”, a consolidated subsidiary) granted nonvested shares of its ordinary shares to certain employees for their future service, and the employees must pay $0.15 or $0.3 (employees hired after March 1, 2009) per share. The shares vest over four years after the grant date. If employees leave Himax Imaging before completing the four year service period, they would sell these shares back to Himax Imaging at their original purchase price. The Company recognized compensation expenses of $56 thousand, $261 thousand and $340 thousand in 2007, 2008 and 2009, respectively. Such compensation expense was recorded as research and development expenses, general and administrative expense and sales and marketing expense in the accompanying consolidated statements of income with a corresponding increase to noncontrolling interests in the accompanying consolidated balance sheets. The fair value of shares on grant date was estimated based on the then most recent price of new shares issued, which was US$0.33 per share.
|
Nonvested share activity of this award during the period indicated is as follows:
|
Number of
Shares
|
Weighted Average Grant
Date Fair Value
|
|||||||
|
Balance at January 1, 2007
|
- | $ | - | |||||
|
Granted
|
5,559,000 | 0.33 | ||||||
|
Balance at December 31, 2007
|
5,559,000 | 0.33 | ||||||
|
Granted
|
1,258,000 | 0.33 | ||||||
|
Vested
|
(1,996,229 | ) | 0.33 | |||||
|
Forfeited
|
(250,000 | ) | 0.33 | |||||
|
Balance at December 31, 2008
|
4,570,771 | 0.33 | ||||||
|
Granted
|
2,253,000 | 0.33 | ||||||
|
Vested
|
(903,882 | ) | 0.33 | |||||
|
Forfeited
|
(271,000 | ) | 0.33 | |||||
|
Balance at December 31, 2009
|
5,648,889 | 0.33 | ||||||
As of December 31, 2009, the total compensation cost related to this award not yet recognized was $844 thousand. The weighted-average period over which it is expected to be recognized is 2.29 years.
F-40
HIMAX TECHNOLOGIES, INC. AND SUBSIDIARIES
Notes to Consolidated Financial Statements (Continued)
December 31, 2007, 2008 and 2009
|
(iii)
|
As stated in Note 15 (a) above, in December 2007, Himax Media Solutions granted 3,416,714 nonvested shares of its ordinary shares to 145 employees transferred from Himax Taiwan to exchange for 361,046 units of these employees’ unvested RSUs. The modification of equity award incurred an incremental compensation cost of $148 thousand for the excess of the fair value of the modified award issued over the fair value of the original unvested RSUs at the date of modification. The Company then added incremental compensation cost to the remaining unrecognized compensation cost of the original award at the date of modification and the total compensation cost are recognized as compensation expenses ratably over the requisite service period of the modified award.
|
The fair value of the original unvested RSUs was determined based on the average market price of the Company’s ordinary shares underlying the RSU at the modification dates occurred during the period from November 12, 2007 to November 16, 2007. The fair value of Himax Media Solutions’ nonvested shares at the modification date was determined based on the then most recent price of Himax Media Solutions’ new shares issued to unrelated third parties, which was NT$15 (US$0.464) per share.
The vesting schedule for the nonvested shares is as follows: 50% will vest on June 20, 2009 and the remaining 50% will vest on December 20, 2010. The Company recognized compensation expenses of $14 thousand, $432 thousand and $432 thousand in 2007, 2008 and 2009, respectively. Such compensation expense was recorded as sales and marketing expense and research and development expenses in the accompanying consolidated statements of income.
Nonvested share activity of this award during the period indicated is as follows:
|
Number of
Shares
|
Weighted Average Grant
Date Fair Value
|
|||||||
|
Balance at January 1, 2007
|
- | $ | - | |||||
|
Granted
|
3,416,714 | 0.464 | ||||||
|
Forfeited
|
(18,000 | ) | 0.464 | |||||
|
Balance at December 31, 2007
|
3,398,714 | 0.464 | ||||||
|
Forfeited
|
(376,189 | ) | 0.464 | |||||
|
Balance at December 31, 2008
|
3,022,525 | 0.464 | ||||||
|
Vested
|
(1,432,000 | ) | 0.464 | |||||
|
Forfeited
|
(469,525 | ) | 0.464 | |||||
|
Balance at December 31, 2009
|
1,121,000 | 0.464 | ||||||
F-41
HIMAX TECHNOLOGIES, INC. AND SUBSIDIARIES
Notes to Consolidated Financial Statements (Continued)
December 31, 2007, 2008 and 2009
As of December 31, 2009, the total compensation cost related to this award not yet recognized was $417 thousand. The weighted-average period over which it is expected to be recognized is 0.97 years.
|
(c)
|
RSUs issued in connection with the acquisition of Wisepal
|
As stated in Note 3, on February 1, 2007, the Company granted 418,440 units of RSUs in exchange for Wisepal’s unvested stock option where each unit of RSU represents two ordinary share of the Company. 127,283 RSUs
(represents 254,566 ordinary shares)
grant vested immediately on the acquisition date and a subsequent 10%, 33% and 27% of the RSU grant will vest on each of September 30, 2007, 2008 and 2009, respectively, subject to certain forfeiture events. Vested portion of the RSUs grant was included in the purchase cost of Wisepal while the unvested portion is treated as post-combination compensation expense. The value of the unvested portion of the RSUs grant amounted to $945 thousand which was determined based on the market price of the Company’s ordinary shares on the acquisition date. Such post-combination compensation expense is amortized to compensation expense on a straight-line basis over the requisite service period. The Company recognized compensation expenses of $94 thousand in 2007, which was recorded as research and development expenses in the accompanying consolidated statements of income. RSUs activity issued in connection with the acquisition of Wisepal
during the period indicated is as follows:
|
Number of Underlying
Shares for RSUs
|
Weighted Average Grant
Date Fair Value
|
|||||||
|
Balance at January 1, 2007
|
- | $ | - | |||||
|
Granted
|
418,440 | 7.064 | ||||||
|
Vested
|
(165,114 | ) | 7.064 | |||||
|
Forfeited
|
(200,760 | ) | 7.064 | |||||
|
Balance at December 31, 2007
|
52,566 | 7.064 | ||||||
|
Forfeited
|
(52,566 | ) | 7.064 | |||||
|
Balance at December 31, 2008
|
- | - | ||||||
F-42
HIMAX TECHNOLOGIES, INC. AND SUBSIDIARIES
Notes to Consolidated Financial Statements (Continued)
December 31, 2007, 2008 and 2009
|
(d)
|
Employee stock options
|
On December 20, 2007 and October 20, 2009, board of directors of Himax Media Solutions approved two plans, the 2007 plan and the 2009 plan, respectively, to grant stock options to certain employees. The two plans authorize grants to purchase up to 6,800,000 shares and 2,300,000 shares, respectively, of Himax Media Solutions’ authorized but unissued ordinary shares.
The exercise price is NT$15 (US$0.464)
and NT$10 (US
$0.311
)
, respectively
.
A
ll
option
s under the plan
s
have
fo
ur
-
year
terms
and
50%
, 25% and 25%
of each grant will become exercisable
subsequent to the second
, third and fourth
anniversary of the grant date
, respectively
.
The Company recognized compensation expenses of $7 thousand, $237 thousand and $141 thousand in 2007, 2008 and 2009, respectively. Such compensation expense was recorded as sales and marketing expense, general and administrative expense and research and development expenses in the accompanying consolidated statements of income.
At December 31, 2009, there were 304,500 and 1,000 additional shares available for Himax Media Solutions’ grant under the 2007 plan and the 2009 plan, respectively. The calculated value of each option award is estimated on the date of grant using the Black-Scholes option-pricing model that used the weighted average assumptions in the following table. Himax Media Solutions uses the simplified method to estimate the expected term of the options
as it does not have
sufficient
historical share option exercise experience and
the exercise data relating to employees of other companies is not easily obtainable
. Since Himax Media Solutions’ shares are not publicly traded and its shares are rarely traded privately, expected volatility is computed based on the average historical volatility of similar entities with publicly traded shares. The risk-free rates for the expected term of the options are based on the interest rate of 10 years and 5 years ROC central government bond at the time of grant for the 2007 plan and the 2009 plan, respectively.
|
2007
|
2009
|
|||||||
|
Valuation assumptions:
|
||||||||
|
Expected dividend yield
|
0 | % | 0 | % | ||||
|
Expected volatility
|
39.94 | % | 51.52 | % | ||||
|
Expected term (years)
|
4.375 | 4.375 | ||||||
|
Risk-free interest rate
|
2.4776 | % | 2 | % | ||||
F-43
HIMAX TECHNOLOGIES, INC. AND SUBSIDIARIES
Notes to Consolidated Financial Statements (Continued)
December 31, 2007, 2008 and 2009
Stock options activity during the periods indicated is as follows:
|
Number
of shares
|
Weighted
average
exercise
price
|
Weighted
average
remaining
contractual
term
|
||||||||||
|
Balance at January 1, 2007
|
- | $ | - | |||||||||
|
Granted
|
6,495,500 | 0.464 | ||||||||||
|
Forfeited
|
(5,000 | ) | 0.464 | |||||||||
|
Balance at December 31, 2007
|
6,490,500 | 0.464 | 4.375 | |||||||||
|
Forfeited
|
(823,000 | ) | 0.464 | |||||||||
|
Balance at December 31, 2008
|
5,667,500 | 0.464 | 3.375 | |||||||||
|
Granted
|
2,299,000 | 0.311 | ||||||||||
|
Exercised
|
- | - | ||||||||||
|
Forfeited
|
(1,193,500 | ) | 0.446 | |||||||||
|
Balance at December 31, 2009
|
6,773,000 | 0.416 | 2.826 | |||||||||
|
Exercisable at December 31, 2009
|
2,387,250 | 0.464 | ||||||||||
The weighted average grant date calculated value of the options granted in 2007 and 2009 were NT$5.4152 (US$0.168) and NT$1.3 (US$0.040), respectively.
|
Note 16.
|
Equity
|
|
(a)
|
Share capital
|
In
order to meet the Taiwan Stock Exchange
’
s listing requirement that the par value of
the Company
’
s ordinary
shares
should
be
an equivalent of
NT$10 per share and to increase the numb
er of outstanding ordinary shares,
on August 6, 2009,
the
Company
’
s a
nnual
g
eneral
shareholders
’
m
eeting approved
a
recapitalization plan as below:
|
(i)
|
Increase of authorized share capital
: to increase the authorized share capital of the
Company from US$50
thousand
divided into 500,000
thousand
shares of par value US$0.0001 each to US$300,000
thousand
divided into 3,000,000,000
thousand
shares of par value US$0.0001 each.
|
|
(ii)
|
Distribution
of
stock dividends
:
distribute 5,999 shares
of st
ock dividend
for each ordinary share
then outstanding
as of August 7, 2009 from the
additional paid-in capital
account
.
|
F-44
HIMAX TECHNOLOGIES, INC. AND SUBSIDIARIES
Notes to Consolidated Financial Statements (Continued)
December 31, 2007, 2008 and 2009
|
(iii)
|
Share
s
c
onsolidation:
immediately following the
issuance of stock dividend
,
every three thousand issued and unissued shares of p
ar value US$0.0001 each
are consolidated
into one
ordinary
share of US$0.3 par value each.
|
|
(iv)
|
Change of par value: change the par value of ordinary shares from US$0.0001 per share to US$0.3 per share
effect from August 10, 2009
.
|
Concurrently with the
r
ecapitalization plan,
the
ADS
was
change
d
to have one ADS represent two ordinary shares, as compared to the
previous
ratio
of
one ADS represent
s
one ordinary share.
As a result of the ADS ratio change, the percentage ownership of
the Company
’
s
share capit
al represented by each ADS, immediately before and after the recapitalization plan, will remain unchanged.
In accordance with the Company’s board of director’s resolution on November 2, 2006, the Company repurchased 7,885,835 ADSs and 2,161,636 ADSs in 2006 and 2007, respectively, from open market. On February 1, 2007, the Company announced the completion of its share buyback program. In total, the Company has repurchased $50 million or 10,047,471 ADSs in the open market at an average price of US$4.98 per ADS.
In accordance with the Company’s board of director’s resolution on November 1, 2007, the Company repurchased 6,569,108 ADSs and 1,095,342 ADSs in 2007 and 2008, respectively, from open market. In total, the Company has repurchased $33.1 million or 7,664,450 ADSs in the open market at an average price of US$4.32 per ADS.
In accordance with the Company
’
s board of director
’
s resolution on November
1
4, 2008, the Company authorized another new share buyback program. The program allows the Company to
repurchase up to $50 million of the Company
’
s ADSs for retirement. The Company repurchased
2,369,091
ADSs
and 13,125,251 ADSs in 2008 and 2009, respectively, from open market
.
F-45
HIMAX TECHNOLOGIES, INC. AND SUBSIDIARIES
Notes to Consolidated Financial Statements (Continued)
December 31, 2007, 2008 and 2009
|
(b)
|
Earnings distribution
|
As a holding company, the major asset of the Company is the 100% ownership interest in Himax Taiwan. Dividends received from the Company’s subsidiaries in Taiwan, if any, will be subjected to withholding tax under ROC law. The ability of the Company’s subsidiaries to pay dividends, repay intercompany loans from the Company or make other distributions to the Company may be restricted by the availability of funds, the terms of various credit arrangements entered into by the Company’s subsidiaries, as well as statutory and other legal restrictions. The Company’s subsidiaries in Taiwan are generally not permitted to distribute dividends or to make any other distributions to shareholders for any year in which it did not have either earnings or retained earnings (excluding reserve). In addition, before distributing a dividend to shareholders following the end of a fiscal year, a Taiwan company must recover any past losses, pay all outstanding taxes and set aside 10% of its annual net income (less prior years’ losses and outstanding taxes) as a legal reserve until the accumulated legal reserve equals its paid-in capital, and may set aside a special reserve.
The
accumulated
legal
and special
reserve provided by Himax
Taiwan
as of December 31
, 200
8
and 200
9
amounting
to $
32,368
thousand
and $
39,868
thousand,
respectively.
|
Note 17.
|
Income Taxes
|
Substantially all of the Company’s earnings from continuing operations before income taxes is derived from the operations in the ROC and, therefore, substantially all of the Company’s income tax expense (benefit) attributable to income from continuing operations is incurred in the ROC.
The statutory income tax rate in the ROC is 25%.
An additional 10% corporate income tax is assessed on undistributed income for the entities in the ROC, but only to the extent such income is not distributed or set aside as legal reserve before the end of the following year. The 10% surtax is recorded in the period the income is earned, and the reduction in the surtax liability is recognized in the period the distribution to shareholders or the setting aside of legal reserve is finalized in the following year.
T
he
tax base
of
the undistributed income surtax
is
“
net income under
ROC generally accepted accounting principles (ROC GAAP)”
, th
e tax effects of temporary differences between ROC GAAP and tax base are initially measured at the distributed tax rate of 25% and the tax effects of temporary differences that arise from the difference between US GAAP and ROC GAAP are measured at the undistributed tax rate of 31.8%.
Due to the enacted
changes in
the ROC Income Tax Acts in May, 2009
where
the income tax rate
will be
reduce
d
from 25% to 20% since 2010
,
the tax effects of temporary differences that arise from the difference between US GAAP and ROC GAAP are measured at the revised undistributed tax rate of 27.2%.
F-46
HIMAX TECHNOLOGIES, INC. AND SUBSIDIARIES
Notes to Consolidated Financial Statements (Continued)
December 31, 2007, 2008 and 2009
In accordance with the ROC Statute for Upgrading Industries, Himax Taiwan’s capital increase in 2003 and 2004 and Wisepal’s newly incorporated investment in 2004 related to the manufacturing of newly designed TFT-LCD driver was approved by the government authorities as a newly emerging, important and strategic industry. The incremental income derived from selling the above new product is tax exempt for a period of five years.
The Company is entitled to the following tax exemptions:
|
Date of investment
|
Tax exemption period
|
||
|
Himax Taiwan:
|
|||
|
September 1, 2003
|
April 1, 2004-March 31, 2009
|
||
|
October 29, 2003
|
January 1, 2006-December 31, 2010
|
||
|
September 20, 2004
|
January 1, 2008-December 31, 2012
|
||
|
Wisepal:
|
|||
|
August 26, 2004
|
January 1, 2009-December 31, 2013
|
Income tax expense (benefit) attributable to income from continuing operations before taxes consist of:
|
Year Ended December 31,
|
||||||||||||
|
2007
|
2008
|
2009
|
||||||||||
|
(in thousands)
|
||||||||||||
|
Current income tax expense
|
$ | 12,770 | 3,659 | 6,467 | ||||||||
|
Deferred income tax expense (benefit)
|
(14,630 | ) | (12,348 | ) | 1,448 | |||||||
|
Income tax expense (benefit)
|
$ | (1,860 | ) | (8,689 | ) | 7,915 | ||||||
The significant components of deferred income tax expense (benefit) attributable to income from continuing operations for the years ended December 31, 2007, 2008 and 2009 are as follows:
|
Year Ended December 31,
|
||||||||||||
|
2007
|
|
2008
|
2009
|
|||||||||
|
(in thousands)
|
||||||||||||
|
Deferred income tax benefit, exclusive of the effects of other components listed below
|
$ | (20,652 | ) | (21,056 | ) | (11,182 | ) | |||||
|
Adjustments to deferred tax assets and liabilities for changes in enacted tax laws and rates
|
- | (14 | ) | 5,224 | ||||||||
|
Increase in the beginning-of-the-year balance of the valuation allowance for deferred tax assets
|
6,022 | 8,722 | 7,406 | |||||||||
| $ | (14,630 | ) | (12,348 | ) | 1,448 | |||||||
F-47
HIMAX TECHNOLOGIES, INC. AND SUBSIDIARIES
Notes to Consolidated Financial Statements (Continued)
December 31, 2007, 2008 and 2009
The differences between expected income tax expense, computed based on the ROC statutory income tax rate of 25% and the actual income tax expense (benefit) as reported in the accompanying consolidated statements of income for the years ended December 31, 2007, 2008 and 2009 are summarized as follows:
|
Year Ended December 31,
|
||||||||||||
|
2007
|
2008
|
2009
|
||||||||||
|
(in thousands)
|
||||||||||||
|
Expected income tax expense
|
$ | 27,399 | 16,009 | 10,931 | ||||||||
|
Tax-exempted income
|
(27,099 | ) | (25,185 | ) | (9,377 | ) | ||||||
|
Tax on undistributed retained earnings
|
11,616 | 10,281 | 5,816 | |||||||||
|
Tax benefit resulting from setting aside legal reserve from prior year’s income
|
(689 | ) | (1,148 | ) | (953 | ) | ||||||
|
Adjustment to deferred tax assets and liabilities for enacted change in tax laws and rates
|
- | (14 | ) | 5,224 | ||||||||
|
Nontaxable gains on sale of marketable securities
|
(133 | ) | (313 | ) | (44 | ) | ||||||
|
Increase in investment tax credits
|
(20,597 | ) | (17,191 | ) | (13,809 | ) | ||||||
|
Increase in deferred tax asset valuation allowance
|
5,366 | 9,144 | 8,450 | |||||||||
|
Non-deductible share-based compensation expenses
|
260 | 298 | 458 | |||||||||
|
Provision for uncertain tax position in connection with share-based compensation expenses
|
217 | 367 | 416 | |||||||||
|
Decrease in unrecognized tax benefits related to prior year
uncertain
tax positions, net of its impact to tax-exempted income
|
- | (1,780 | ) | - | ||||||||
|
Foreign tax rate differential
|
(1,399 | ) | 537 | 1,184 | ||||||||
|
Variance from audits of prior years
’
income tax filings
|
3,000 | 441 | (538 | ) | ||||||||
|
Others
|
199 | (135 | ) | 157 | ||||||||
|
Actual income tax expense (benefit)
|
$ | (1,860 | ) | (8,689 | ) | 7,915 | ||||||
The basic and diluted earnings per ordinary share effect resulting from the income tax exemption for the years ended December 31, 2007, 2008 and 2009, is a $0.07, $0.07 and $0.03, increase to earnings per ordinary share, respectively.
F-48
HIMAX TECHNOLOGIES, INC. AND SUBSIDIARIES
Notes to Consolidated Financial Statements (Continued)
December 31, 2007, 2008 and 2009
The total income tax expense (benefit) for the years ended December 31, 2007, 2008 and 2009 was allocated as follows:
|
Year Ended December 31,
|
||||||||||||
|
2007
|
2008
|
2009
|
||||||||||
|
(in thousands)
|
||||||||||||
|
Income from c
ontinuin
g operations
|
$ | (1,860 | ) | (8,689 | ) | 7,915 | ||||||
|
Other comprehensive income (loss)
|
16 | (20 | ) | ( 18 | ) | |||||||
|
Tax benefit allocated to reduce goodwill
|
- | (32 | ) | - | ||||||||
|
Total income tax
expense (
benefit
)
|
$ | (1,844 | ) | (8,741 | ) | 7,897 | ||||||
As of December 31, 2008 and 2009, the components of deferred income tax assets (liabilities) were as follows:
|
December 31,
|
||||||||
|
2008
|
|
2009
|
||||||
|
(in thousands)
|
||||||||
|
Deferred tax assets:
|
||||||||
|
Inventory
|
$ | 6,735 | 4,133 | |||||
|
Allowance for doubtful accounts
|
5,917 | 4,678 | ||||||
|
Capitalized expense for tax purposes
|
102 | 36 | ||||||
|
Accrued compensated absences
|
114 | 59 | ||||||
|
Allowance for sales return, discounts and warranty
|
102 | 222 | ||||||
|
Unused investment tax credits
|
41,699 | 47,849 | ||||||
|
Unused loss carry-forward
|
10,903 | 14,006 | ||||||
|
Accrued pension cost
|
101 | 114 | ||||||
|
Other
|
282 | 337 | ||||||
|
Total gross deferred tax assets
|
65,955 | 71,434 | ||||||
|
Less: valuation allowance
|
(21,022 | ) | (28,428 | ) | ||||
|
Net deferred tax assets
|
44,933 | 43,006 | ||||||
|
Deferred tax liabilities:
|
||||||||
|
Unrealized foreign exchange gain
|
(10 | ) | - | |||||
|
Prepaid pension cost
|
(314 | ) | (332 | ) | ||||
|
Acquired intangible assets
|
(3,302 | ) | (2,269 | ) | ||||
|
Depreciation
|
(50 | ) | (62 | ) | ||||
|
Deferred shared based compensation
|
- | (518 | ) | |||||
|
Other
|
(6 | ) | (3 | ) | ||||
|
Total gross deferred tax liabilities
|
(3,682 | ) | (3,184 | ) | ||||
|
Net deferred tax assets
|
$ | 41,251 | 39,822 | |||||
F-49
HIMAX TECHNOLOGIES, INC. AND SUBSIDIARIES
Notes to Consolidated Financial Statements (Continued)
December 31, 2007, 2008 and 2009
As of December 31, 200
9
, the Company has not provided for income taxes on the undistributed earnings of approximately
$
404,
566
thousand
of its foreign subsidiaries since
the Company has specific plans to reinvest
these earnings indef
initely.
A deferred tax liability will be recognized when the Company can no longer demonstrate that it plans to indefinitely reinvest these undistributed earnings.
It is not practicable to estimate the amount of additional taxes that might be payable on
such undistributed earnings.
The valuation allowance for deferred tax assets as of January 1, 2007, 2008 and 2009 was $6,278 thousand, $12,300 thousand and $21,022 thousand, respectively. The net change in the valuation allowance for the years ended December 31, 2007, 2008 and 2009, was an increase of $6,022 thousand, $8,722 thousand and $7,406 thousand, respectively. The change in 2007 includes an increase of valuation allowance of $656 thousand, which was provided for the deferred tax assets attributable to the acquisition of Wisepal in February 2007.
In 2008, the Company allocated $32 thousand of tax benefit to reduce goodwill as a result of the release of valuation allowance that was initially established at the acquisition of Wisepal.
Effective
Ja
nuary 1, 2009, any
recognition of tax benefit related to
changes in the
valuation allowance for
acquired
deferred tax assets
should
be recorded in the consolidated statements of income under
ASC 805
(SFAS No. 141R)
,
Business Combinatio
n
.
In assessing the realizability of deferred tax assets, management considers whether it is more likely than not that some portion or all of the deferred tax assets will not be realized. The ultimate realization of deferred tax assets is dependent upon the generation of future taxable income during the periods in which those temporary differences become deductible and tax loss carryforwards utilizable. Management considers the scheduled reversal of deferred tax liabilities, projected future taxable income, and tax planning strategies in making this assessment. Based upon the level of historical taxable income and projections for future taxable income over the periods in which the deferred tax assets are deductible, management believes it is more likely than not that the Company will realize the benefits of the deferred tax assets, net of the valuation allowance at December 31, 2009. The amount of the deferred tax asset considered realizable, however, could be reduced in the near term if estimates of future taxable income during the carryforward period are reduced.
Each entity within the Company files separate standalone income tax return. Except for Himax Taiwan, Wisepal, Himax Anyang (Korea), Himax Technologies (Suzhou) Co., Ltd., Himax Technologies (Shenzhen) Co., Ltd., and Himax Imaging Corp., all other subsidiaries of the Company have generated tax losses since their inception, therefore, a valuation allowance of $21,022 thousand and $28,428 thousand as of December 31, 2008 and 2009, respectively, was provided to reduce their deferred tax assets (consisting primarily of operating loss carryforwards and unused investment tax credits) to zero because management believes it is unlikely that these tax benefits will be realized. The total tax loss carryforwards for these subsidiaries at December 31, 2009 was $70,322 thousand, which will expire if unused by 2019. The total unused investment tax credits for these subsidiaries at December 31, 2009 were $13,948 thousand, which will expire if unused by 2013.
F-50
HIMAX TECHNOLOGIES, INC. AND SUBSIDIARIES
Notes to Consolidated Financial Statements (Continued)
December 31, 2007, 2008 and 2009
As ROC Income Tax Acts has been amended in January 2009, the tax loss carryforwards in the preceding ten years would be deducted from tax income. That amendment is effective for the Company beginning 2009 and extends the period of tax loss carryforwards for certain subsidiaries.
According to the ROC Statute for Upgrading Industries, expired on December 31, 2009, the purchase of machinery for the automation of production, expenditure for research and development and training of professional personnel, each occurring before December 31, 2009, entitles the Company to tax credits. These credits may be applied over a period of five years. The amount of the credit that may be applied in any year, except the final year, is limited to 50% of the income tax payable for that year. There is no limitation on the utilization of the amount of investment tax credit to offset the income tax payable in the final year.
As of December 31, 2009, all of the Company’s unused investment tax credits of NT$1,768,599 thousand (US$55,286 thousand) reported for tax return purposes will expire if unused by 2013.
The Company adopted the provisions of
ASC 740-10 (
Interpretation 48
)
on January 1, 200
7
.
A reconciliation of the beginning and ending amount of unrecognized tax benefits is as follows:
|
For the year ended December 31,
|
||||||||||||
|
2007
|
2008
|
2009
|
||||||||||
|
(in thousands)
|
||||||||||||
|
Balance at beginning of year
|
$ | 1,276 | 3,968 | 5,718 | ||||||||
|
Increase related to prior year tax positions
|
503 | - | - | |||||||||
|
Decrease related to prior year tax positions
|
- | (1,780 | ) | - | ||||||||
|
Increase related to current year tax positions
|
2,189 | 3,555 | 2,587 | |||||||||
|
Effect of exchange rate change
|
- | (25 | ) | 145 | ||||||||
|
Balance at end of year
|
$ | 3,968 | 5,718 | 8,450 | ||||||||
Included in the balance of total unrecognized tax benefits at December 31, 2008 and 2009, are potential benefits of $5,434 thousand and $7,821 thousand, respectively that if recognized, would reduce the Company’s effective tax rate. No interest and penalties related to unrecognized tax benefits were recorded by the Company as of January 1, 2007 and for the years ended December 31, 2007, 2008 and 2009. The Company’s major taxing jurisdiction is Taiwan. Except for Wisepal, Himax Analogic and Himax Imaging, Ltd., whose income tax returns have been examined by the ROC tax authorities through 2007, all other Taiwan subsidiaries’ income tax returns have been examined and assessed by the ROC tax authorities through
2006.
The tax years 2007, 2008 and 2009 remain open to examination by the Taiwan tax authorities. Taiwanese entities are customarily examined by the tax authorities and it is possible that a future examination will result in a positive or negative adjustment to the Company's unrecognized tax benefits within the next 12 months; however, management is unable to estimate a range of the tax benefits or detriment as of December 31, 2008 and 2009.
F-51
HIMAX TECHNOLOGIES, INC. AND SUBSIDIARIES
Notes to Consolidated Financial Statements (Continued)
December 31, 2007, 2008 and 2009
|
Note 18.
|
Fair Value Measurement
|
|
(a)
|
Fair Value of Financial Instruments
|
The fair values of cash, cash equivalents, accounts receivable, accounts payable and accrued liabilities approximate their carrying values due to their relatively short maturities. Marketable securities consisting of open-ended bond funds are reported at fair value based on quoted market prices at the reporting date. Marketable securities consisting of time deposits with original maturities more than three months are determined using the discounted present value of expected cash flows. The fair value of equity method investments and cost method investments have not been estimated as there are no identified events or changes in circumstances that may have significant adverse effects on the carrying value of these investments, and it is not practicable to estimate their fair values.
|
(b)
|
Fair Value
Hierarchy
|
The Company adopted ASC 820 (SFAS No. 157) on January 1, 2008 for fair value measurements of financial assets and financial liabilities and for fair value measurements of nonfinancial items that are recognized or disclosed at fair value in the financial statements on a recurring basis. On January 1, 2009, the Company adopted the provisions of ASC 820 (SFAS No. 157) for fair value measurements of nonfinancial assets and nonfinancial liabilities that are recognized or disclosed at fair value in the financial statements on a nonrecurring basis. ASC 820 (SFAS No. 157) establishes a fair value hierarchy that prioritizes the inputs to valuation techniques used to measure fair value. The hierarchy gives the highest priority to unadjusted quoted prices in active markets for identical assets or liabilities (Level 1 measurements) and the lowest priority to measurements involving significant unobservable inputs (Level 3 measurements). The three levels of the fair value hierarchy are as follows:
|
(i)
|
Level 1 inputs are quoted prices (unadjusted) in active markets for identical assets or liabilities that the Company has the ability to access at the measurement date.
|
|
(ii)
|
Level 2 inputs are inputs other than quoted prices included within Level 1 that are observable for the asset or liability, either directly or indirectly.
|
|
(iii)
|
Level 3 inputs are unobservable inputs for the asset or liability.
|
The level in the fair value hierarchy within which a fair measurement in its entirety falls is based on the lowest level input that is significant to the fair value measurement in its entirety.
F-52
HIMAX TECHNOLOGIES, INC. AND SUBSIDIARIES
Notes to Consolidated Financial Statements (Continued)
December 31, 2007, 2008 and 2009
The following table presents the Company’s financial assets and liabilities that are measured at fair value on a recurring basis which were comprised of the following types of instruments at December 31, 2008 and 2009:
|
Fair Value Measurements at
December 31, 200
8
Using
|
||||||||||||
|
Level 1
|
Level 2
|
Level 3
|
||||||||||
|
(in thousands)
|
||||||||||||
|
Cash and cash equivalents:
|
||||||||||||
|
Time deposits with original maturities less than three months
|
$ | 115,120 | - | - | ||||||||
|
Marketable securities available-for-sale:
|
||||||||||||
|
Time deposit with original maturities more than three months
|
- | 153 | - | |||||||||
|
Open-ended bond fund
|
13,717 | - | - | |||||||||
|
Restricted marketable securities:
|
||||||||||||
|
Time deposits with original m
aturities of more than three months
|
- | 2,160 | - | |||||||||
|
Total
|
$ | 128,837 | 2,313 | - | ||||||||
|
Fair Value Measurements at
December 31, 2009
Using
|
||||||||||||
|
Level 1
|
Level 2
|
Level 3
|
||||||||||
|
(in thousands)
|
||||||||||||
|
Cash and cash equivalents:
|
||||||||||||
|
Time de
posit
s
with original maturities less than three months
|
$ | 87,600 | - | - | ||||||||
|
Marketable securities available-for-sale:
|
||||||||||||
|
Time deposit with original maturities more than three months
|
- | 2,218 | - | |||||||||
|
Open-ended bond fund
|
8,512 | - | - | |||||||||
|
Restricted marketable securities:
|
||||||||||||
|
Time deposits with original maturities of more than three months
|
- | 1,094 | - | |||||||||
|
Total
|
$ | 96,112 | 3 ,31 2 | - | ||||||||
Non-financial assets such as goodwill, intangible assets, and property, plant, and equipment are measured at fair value only when an impairment loss is recognized. No such impairments were recognized in 2007, 2008 and 2009.
F-53
HIMAX TECHNOLOGIES, INC. AND SUBSIDIARIES
Notes to Consolidated Financial Statements (Continued)
December 31, 2007, 2008 and 2009
|
Note 19.
|
Significant Concentrations
|
Financial instruments that currently subject the Company to concentrations of credit risk consist primarily of cash, cash equivalents, marketable securities and accounts receivable. The Company places its cash primarily in checking and saving accounts with reputable financial institutions. The Company has not experienced any material losses on deposits of the Company’s cash and cash equivalents. Marketable securities consist of time deposits with original maturities of greater than three months and investments in open-ended bond fund identified to fund current operations. All marketable securities are classified as available-for-sale.
The Company derived substantially all of its revenues from sales of display drivers that are incorporated into TFT-LCD panels. The TFT-LCD panel industry is intensely competitive and is vulnerable to cyclical market conditions and subject to price fluctuations. Management expects the Company to be substantially dependent on sales to the TFT-LCD panel industry for the foreseeable future.
The Company depends on its largest customer, CMO and its affiliates, which are a related parties to the Company, for a substantial majority of its revenues and the loss of, or a significant reduction in orders would significantly reduce the Company’s revenues and adversely impact the Company’s operating results. CMO and its affiliates accounted for approximately 58.8%, 62.5% and 64.3%, respectively, of the Company’s revenues in 2007, 2008 and 2009, and represented more than 10% of the Company’s total accounts receivable balance at December 31, 2008 and 2009. CMO and its affiliates accounted for approximately 67.2% and 67.6% of the Company’s total accounts receivable balance at December 31, 2008 and 2009, respectively.
In addition,
the Company
had accounts receivable of $27
.
9
million
and $
25.5
million
o
utstanding from SVA-NEC as of December 31, 2008
and 2009, respectively
.
S
ince the second half of 2008, SVA-NEC has delayed paying a large portion of its outstanding accounts receivable.
Due to
the
increasing concern about SVA-NEC
’
s financial condition,
t
he Company
recognized a provision for doubtful accounts receivable
of $25.3 million
for the year ended
December 31, 2008
.
The a
llowance for doubtful accounts
for SVA-NEC
’
s accounts receivable is
$25.3 million and $25.5 million as of December 31, 2008
and
2009, respectively.
The Company has at times agreed to extend the payment terms for certain of its customers. Other customers have also requested extension of payment terms, and the Company may grant such requests for extension in the future. As a result, a default by any such customer, a prolonged delay in the payment of accounts receivable, or the extension of payment terms for the Company’s customers would adversely affect the Company’s cash flow, liquidity and operating results. Management performs ongoing credit evaluations of each customer and adjusts credit policy based upon payment history and the customer’s credit worthiness, as determined by the review of their current credit information. See Notes 20 and 22 for additional information.
F-54
HIMAX TECHNOLOGIES, INC. AND SUBSIDIARIES
Notes to Consolidated Financial Statements (Continued)
December 31, 2007, 2008 and 2009
The Company focuses on design, development and marketing of its products and outsources all its semiconductor fabrication, assembly and test. The Company primarily depends on nine foundries to manufacture its wafer, and any failure to obtain sufficient foundry capacity or loss of any of the foundries it uses could significantly delay the Company’s ability to ship its products, cause the Company to lose revenues and damage the Company’s customer relationships.
There are a limited number of companies which supply processed tape used to manufacture the Company’s semiconductor products and therefore, from time to time, shortage of such processed tape may occur. If any of the Company’s suppliers experience difficulties in delivering processed tape used in its products, the Company may not be able to locate alternative sources in a timely manner. Moreover, if shortages of processed tape were to occur, the Company may incur additional costs or be unable to ship its products to customers in a timely manner, which could harm the Company’s business customer relationships and negatively impact its earnings.
A limited number of third-party assembly and testing houses assemble and test substantially all of the Company’s current products. As a result, the Company does not directly control its product delivery schedule, assembly and testing costs and quality assurance and control. If any of these assembly and testing houses experiences capacity constraints or financial difficulties, or suffers any damage to its facilities, or if there is any other disruption of its assembly and testing capacity, the Company may not be able to obtain alternative assembly and testing services in a timely manner. Because the amount of time the Company usually takes to qualify assembly and testing houses, the Company could experience significant delays in product shipments if it is required to find alternative sources. Any problems that the Company may encounter with the delivery, quality or cost of its products could damage the Company’s reputation and result in a loss of customers and orders.
|
Note 20.
|
Related-party Transactions
|
|
(a)
|
Name and relationship
|
|
Name of related parties
|
Relationship
|
|
|
Chi Mei Optoelectronics Corp. (CMO)
|
The Company’s Chairman represented on CMO’s Board of Directors
|
|
|
Chi Mei Optoelectronics Japan, Co., Ltd. (CMO-Japan)
|
Wholly owned subsidiary of CMO
|
|
|
Contrel Technology Co., Ltd. (Contrel)
|
Related party in substance
|
|
|
Ampower Technology Co., Ltd. (Ampower)
|
Related party in substance
|
|
|
Chi Mei Corporation (CMC)
|
Major shareholder of CMO
|
|
|
NEXGEN Mediatech Inc. (NEXGEN)
|
Related party in substance
|
|
|
Chi Lin Technology Co., Ltd. (Chi Lin Tech)
|
Related party in substance
|
F-55
HIMAX TECHNOLOGIES, INC. AND SUBSIDIARIES
Notes to Consolidated Financial Statements (Continued)
December 31, 2007, 2008 and 2009
|
Name of related parties
|
Relationship
|
|
|
NingBo Chi Mei Electronics Ltd. (CME-NingBo)
|
The subsidiary of CMO
|
|
|
NingBo Chi Mei Optoelectronics Ltd. (CMO-NingBo)
|
The subsidiary of CMO
|
|
|
Chi Mei EL Corporation (CMEL)
|
The subsidiary of CMO
|
|
|
NanHai Chi Mei Optoelectronics Ltd. (CMO- NanHai)
|
The subsidiary of CMO
|
|
|
Chi Hsin Electronics Corp. (Chi Hsin)
|
The subsidiary of CMO, which merged with CMO on May 31, 2009, CMO was the surviving company
|
|
|
Chi Mei Logistics Corp. (CMLC)
|
The subsidiary of CMO
|
|
|
NingBo Chi Mei Logistics Corp. (CMLC-NingBo)
|
The subsidiary of CMO
|
|
|
Dongguan Chi Hsin Electronics Co., Ltd. (Chi Hsin-Dongguan)
|
The subsidiary of CMO
|
|
|
NingBo ChiHsin Electronics Ltd. (Chi Hsin-NingBo)
|
The subsidiary of CMO
|
|
|
Fulintec Science Engineering Co., Ltd. (Fulintec)
|
The subsidiary of CMO
|
|
|
Amlink (Shanghai) Ltd. (Amlink)
|
Related party in substance
|
|
|
Linklinear Development Co, Ltd. (LDC)
|
Related party in substance
|
|
|
Shinyoptics Corp. (Shinyoptics)
|
Equity method investee of the Company
|
|
|
Hangzhou Crystal Display Technology Co., Ltd. (Crystal)
|
Equity method investee of the Company
|
F-56
HIMAX TECHNOLOGIES, INC. AND SUBSIDIARIES
Notes to Consolidated Financial Statements (Continued)
December 31, 2007, 2008 and 2009
|
(b)
|
Significant transactions with related parties
|
|
(i)
|
Revenues and accounts receivable
|
Revenues from related parties are summarized as follows:
|
Year Ended December 31,
|
||||||||||||
|
2007
|
2008
|
2009
|
||||||||||
|
(in thousands)
|
||||||||||||
|
CMO- NingBo
|
$ | 249,117 | 292,231 | 230,299 | ||||||||
|
CMO
|
281,766 | 143,132 | 101,569 | |||||||||
|
CMO- NanHai
|
7,141 | 69,865 | 86,612 | |||||||||
|
Chi Hsin- NingBo
|
- | 4,382 | 23,789 | |||||||||
|
Chi Hsin- Dongguan
|
- | 2,397 | 2,792 | |||||||||
|
Amlink
|
- | - | 1,933 | |||||||||
|
Chi Hsin
|
1,499 | 6,359 | 129 | |||||||||
|
Chi Lin Tech
|
7,162 | - | 60 | |||||||||
|
CMEL
|
214 | 288 | 45 | |||||||||
|
Crystal
|
- | - | 45 | |||||||||
|
Shinyoptics
|
- | - | 23 | |||||||||
|
CMO- Japan
|
- | 3 | 10 | |||||||||
|
Ampower
|
- | 2 | - | |||||||||
|
CME- NingBo
|
- | 1,804 | - | |||||||||
|
NEXGEN
|
45 | - | - | |||||||||
| $ | 546,944 | 520,463 | 447,306 | |||||||||
A breakdown by product type for sales to CMO and its affiliates is summarized as follows:
|
Year Ended December 31,
|
||||||||||||
|
2007
|
2008
|
2009
|
||||||||||
|
(in thousands)
|
||||||||||||
|
Display driver for large-size applications
|
$ | 536,610 | 498,771 | 417,099 | ||||||||
|
Display driver for consumer electronics applications
|
1,434 | 16,486 | 25,542 | |||||||||
|
Display driver for mobile handsets
|
771 | 4,029 | 1,487 | |||||||||
|
Others
|
922 | 1,175 | 1,117 | |||||||||
| $ | 539,737 | 520,461 | 445,245 | |||||||||
The sales prices CMO and its affiliates receive are comparable to those offered to unrelated third parties.
F-57
HIMAX TECHNOLOGIES, INC. AND SUBSIDIARIES
Notes to Consolidated Financial Statements (Continued)
December 31, 2007, 2008 and 2009
The related accounts receivable resulting from the above sales as of December 31, 2008 and 2009, were as follows:
|
December 31,
|
||||||||
|
2008
|
2009
|
|||||||
|
(in thousands)
|
||||||||
|
CMO- NingBo
|
$ | 56,241 | 73,029 | |||||
|
CMO
|
29,385 | 30,360 | ||||||
|
CMO- NanHai
|
18,029 | 27,088 | ||||||
|
Chi Hsin- NingBo
|
670 | 6,361 | ||||||
|
Amlink
|
- | 1,010 | ||||||
|
Chi Hsin- Dongguan
|
211 | 350 | ||||||
|
Chi Lin Tech
|
- | 63 | ||||||
|
Crystal
|
- | 45 | ||||||
|
Shinyoptics
|
- | 16 | ||||||
|
CMEL
|
3 | 8 | ||||||
|
Chi Hsin
|
32 | - | ||||||
|
CME- NingBo
|
1 | - | ||||||
|
|
104,572 | 138,330 | ||||||
|
Allowa
nce for sales returns and discounts
|
(95 | ) | (158 | ) | ||||
| $ | 104,477 | 138,172 | ||||||
The credit terms granted to
CMO and its
affiliates
ranged form 60
days
to 90 days,
and the credit terms granted to other related parties
ranged from
45
days to
60
days
. The
credit t
erms
offered to unrelated third parties
ranged from 30
days
to 1
50
days
.
|
(ii)
|
Property transactions
|
In 2008 and 2009, the Company purchased equipment amounting to $201 thousand and $67 thousand from Fulintec, respectively. As of December 31, 2008, the related prepayment and payable resulting from the aforementioned transaction were $27 thousand and $66 thousand, respectively. The purchase transaction in 2009 had been full paid as of December 31, 2009. Also in 2009, the Company sold equipment amounting to $9 thousand to Shinyoptics. As of December 31, 2009, the related receivables from the aforementioned transaction were $9 thousand.
F-58
HIMAX TECHNOLOGIES, INC. AND SUBSIDIARIES
Notes to Consolidated Financial Statements (Continued)
December 31, 2007, 2008 and 2009
|
(iii)
|
Lease
|
The Company entered into a lease contract with CMO, CMLC, CMLC-NingBo and CMO-NanHai for leasing office space, facilities and inventory locations. For the years ended December 31, 2007, 2008 and 2009, the related rent and utility expenses resulting from the aforementioned transactions amounted to $465 thousand, $634 thousand and $700 thousand, respectively, and were recorded as cost of revenue and operating expenses in the accompanying consolidated statements of income. As of December 31, 2008 and 2009, the related payables resulting from the aforementioned transactions amounted to $143 thousand and $152 thousand, respectively, and were recorded as other accrued expenses in the accompanying consolidated balance sheets.
As of December 31, 2009, future minimum lease payments under noncancelable operating leases with related parties are as follows:
|
Duration
|
Amount
|
|||
|
(in thousands)
|
||||
|
January 1, 2010~December 31, 2010
|
$ | 487 | ||
|
January 1, 2011~December 31, 2011
|
447 | |||
|
January 1, 2012~December 31, 2012
|
181 | |||
|
January 1, 2013~December 31, 2013
|
180 | |||
|
January 1, 2014~December 31, 2014
|
170 | |||
|
After January 1, 2015
|
1,580 | |||
| $ | 3,045 | |||
|
(iv)
|
Others
|
In 2007, 2008 and 2009, the Company purchased consumable and miscellaneous items amounting to $63 thousand, $146 thousand and $345 thousand, respectively, from CMO, CMC, Chi Lin Tech, NEXGEN, CMEL, Chi Hsin, Contrel, Fulintec and LDC, which were charged to cost of revenues and operating expenses. As of December 31, 2008 and 2009, the related payables resulting from the aforementioned transactions were $12 thousand and $7 thousand, respectively.
In 2007, 2008 and 2009, Chi Lin Tech provided IC bonding service on prototype panels for the Company’s research activities for a fee of $113 thousand, $73 thousand and $43 thousand, respectively, which was charged to research and development expense. As of December 31, 2008 and 2009, the related process fee payables resulting from the aforementioned transactions were $11 thousand and $6 thousand, respectively.
F-59
HIMAX TECHNOLOGIES, INC. AND SUBSIDIARIES
Notes to Consolidated Financial Statements (Continued)
December 31, 2007, 2008 and 2009
|
Note 21.
|
Commitments and Contingencies
|
|
(a)
|
As of December 31, 2008 and 2009, the Company entered into a license agreement which is secured by standby Letter of Credit by bank both amounting to $250 thousand. As of December 31, 2009, amount of outstanding letters of credit for the purchase of machinery and equipment was $262 thousand.
|
|
(b)
|
As of December 31, 2008, and 2009 the Company had entered into several contracts for the acquisition of equipment and computer software. Total contract prices amounted to $3,872 thousand and $5,010 thousand, respectively. As of December 31, 2008 and 2009, the remaining commitments were $3,710 thousand and $3,761 thousand, respectively.
|
|
(c)
|
The Company leases its office and buildings pursuant to operating lease arrangements with unrelated third parties. The lease arrangement will expire gradually from 2010 to 2012. As of December 31, 2008 and 2009, deposits paid amounted to $515 thousand and $662 thousand, respectively, and were recorded as refundable deposit in the accompanying consolidated balance sheets.
|
As of December 31, 2009, future minimum lease payments under noncancelable operating leases are as follows:
|
Duration
|
Amount
|
|||
|
(in thousands)
|
||||
|
January 1, 2010~December 31, 2010
|
$ | 1,006 | ||
|
January 1, 2011~December 31, 2011
|
529 | |||
|
January 1, 2012~December 31, 2012
|
6 | |||
| $ | 1,541 | |||
Rental expense for operating leases with unrelated third parties amounted to $1,852 thousand, $1,223 thousand and $1,149 thousand in 2007, 2008 and 2009, respectively.
|
(d)
|
The Company entered into several sales agent agreements, based on these agreements, the Company shall pay commissions at the rates ranging from 1.5% to 4% of the sales to customers in the specific territory or referred by agents as stipulated in these agreements.
|
|
(e)
|
In June 2007, the Company entered into a license agreement for the use of HDMI 1.3 receiver core relevant technology for product development. In accordance with the agreement, the Company was required to pay an initial license fee based on the progress of the project development and a royalty based on shipments. The license fee paid and charged to research and development expense in 2007 was $500 thousand. In 2007, 2008 and 2009, no royalty was paid.
|
F-60
HIMAX TECHNOLOGIES, INC. AND SUBSIDIARIES
Notes to Consolidated Financial Statements (Continued)
December 31, 2007, 2008 and 2009
|
(f)
|
The company has entered into two agreements to provide donations
for
laboratories with two top local universities in
Taiwan
.
The total d
onation amounts
based on the
modified agreements
amounted to
NT$
55.4
million ($1.
7
million).
As of December 31, 2009, the remaining commitments were NT$24.0 million ($0.7 million).
|
|
(g)
|
The Company from time to time is subject to claims regarding the proprietary use of certain technologies. Currently, management is not aware of any such claims that it believes could have a material adverse effect on the Company’s financial position or results of operations.
|
|
(h)
|
Since Himax Taiwan is not a listed company, it will depend on Himax Technologies, Inc. to meet its equity financing requirements in the future. Any capital contribution by Himax Technologies, Inc. to Himax Taiwan may require the approval of the relevant ROC authorities. The Company may not be able to obtain any such approval in the future in a timely manner, or at all. If Himax Taiwan is unable to receive the equity financing it requires, its ability to grow and fund its operations may be materially and adversely affected.
|
|
(i)
|
The Company has entered i
nto several wafer fabrication or assembly and testing service arrangements with service providers. The Company may be obligated to make payments for purchase orders entered into pursuant to these arrangements.
Contractual obligations resulted from above
arrangements approximate
$20,496
thousand and
$63,129
thousand as of December 31, 2008 and 2009, respectively.
|
|
Note 22.
|
Segment Information
|
The Company is engaged in the design, development and marketing of semiconductors for flat panel displays. Based on the Company’s internal organization structure and its internal reporting, management has determined that the Company does not have any operating segments as that term is defined in ASC 280 (SFAS No. 131), “
Segments Reporting”
.
Revenues from the Company’s major product lines are summarized as follow:
|
Year Ended December 31,
|
||||||||||||
|
2007
|
2008
|
2009
|
||||||||||
|
(in thousands)
|
||||||||||||
|
Display drivers for large-size applications
|
$ | 752,196 | 651,504 | 493,513 | ||||||||
|
Display drivers for mobile handsets applications
|
75,704 | 57,274 | 69,081 | |||||||||
|
Display drivers for consumer electronics applications
|
66,634 | 81,866 | 83,527 | |||||||||
|
Others
|
23,677 | 42,155 | 46,260 | |||||||||
| $ | 918,211 | 832,799 | 692,381 | |||||||||
F-61
HIMAX TECHNOLOGIES, INC. AND SUBSIDIARIES
Notes to Consolidated Financial Statements (Continued)
December 31, 2007, 2008 and 2009
The following tables summarize information pertaining to the Company’s revenues from customers in different geographic region (based on customer’s headquarter location):
|
Year Ended December 31,
|
||||||||||||
|
2007
|
2008
|
2009
|
||||||||||
|
(in thousands)
|
||||||||||||
|
Taiwan
|
$ | 785,334 | 646,011 | 548,384 | ||||||||
|
China
|
82,572 | 116,947 | 86,451 | |||||||||
|
Other Asia Pacific (Korea and Japan)
|
50,115 | 69,570 | 57,414 | |||||||||
|
Europe (Netherlands and France)
|
190 | 271 | 132 | |||||||||
| $ | 918,211 | 832,799 | 692,381 | |||||||||
The carrying values of the Company’s tangible long-lived assets are located in the following countries:
|
December 31,
|
||||||||
|
2008
|
2009
|
|||||||
|
(in thousands)
|
||||||||
|
Taiwan
|
$ | 53,822 | 50,254 | |||||
|
China
|
1,002 | 1,006 | ||||||
|
U.S.
|
282 | 296 | ||||||
|
Korea
|
5 | 30 | ||||||
| $ | 55,111 | 51,586 | ||||||
For the years ended December 31, 2007, 2008 and 2009, revenues from significant customer, CMO and its affiliates, a related party, which representing 10% or more of total revenue are $539,737 thousand, $520,461 thousand, and $445,245 thousand, respectively.
Accounts receivable from significant customers, those representing 10% or more of total accounts receivable for the respective periods, is summarized as follows:
|
December 31,
|
||||||||
|
2008
|
2009
|
|||||||
|
|
(in thousands)
|
|||||||
|
CMO and its affiliates, a related party
|
$ | 104,572 | 137,196 | |||||
|
SVA-NEC
|
27,947 | 25,524 | ||||||
| $ | 132,519 | 162,720 | ||||||
As of December 31, 2008 and 2009, allowance for doubtful accounts, sales returns and discounts for those accounts receivable was $25,392 thousand and $25,673 thousand, respectively.
F-62
HIMAX TECHNOLOGIES, INC. AND SUBSIDIARIES
Notes to Consolidated Financial Statements (Continued)
December 31, 2007, 2008 and 2009
|
Note 23.
|
Subsequent Events
|
|
(a)
|
Ordinary share buybacks
|
From January 1, 2010 to May 25, 2010, Himax Technologies, Inc. repurchased 2,020,604 ADSs (represents 4,041,208 ordinary shares) from the open market for total cash consideration of $5,845 thousand. Himax Technologies, Inc. has repurchased $45.7 million or 17,514,946 ADSs (represents 35,029,892 ordinary shares) in the open market at an average price of US$2.61 per ADS as of May 25, 2010. The repurchased ADSs and their underling ordinary shares were then cancelled, thereby reducing approximately 35.0 million shares or 9% of Himax Technologies, Inc.’s issued and outstanding ordinary shares.
|
(b)
|
Declaration of cash dividend
|
On May 20, 2010, the Company announced that the board of directors declared a cash dividend of US$0.125 per ordinary share of the Company. The dividend will be payable on August 13, 2010.
|
Note 24.
|
Himax Technologies, Inc. (the Parent Company only)
|
As a holding company, dividends received from Himax Technologies, Inc.’s subsidiaries in Taiwan, if any, will be subjected to withholding tax under ROC law as well as statutory and other legal restrictions.
The condensed separate financial information of Himax Technologies, Inc. is presented as follows:
Condensed Balance Sheets
|
December 31,
|
||||||||
|
2008
|
2009
|
|||||||
|
(in thousands)
|
||||||||
|
Cash
|
$ | 2,903 | 77 | |||||
|
Other current assets
|
2,015 | 1,898 | ||||||
|
Investment in non-marketable securities
|
1,600 | 1,600 | ||||||
|
Investments in subsidiaries
|
518,373 | 572,574 | ||||||
|
Total assets
|
$ | 524,891 | 576,149 | |||||
|
Current liabilities
|
$ | 1,720 | 1,296 | |||||
|
Debt borrowing from a subsidiary
|
60,000 | 155,400 | ||||||
|
Total equity
|
463,171 | 419,453 | ||||||
|
Total liabilities and equity
|
$ | 524,891 | 576,149 | |||||
Himax Technologies, Inc. had no guarantees as of December 31, 2008 and 2009.
F-63
HIMAX TECHNOLOGIES, INC. AND SUBSIDIARIES
Notes to Consolidated Financial Statements (Continued)
December 31, 2007, 2008 and 2009
Condensed Statements of Income
|
Year ended December 31,
|
||||||||||||
|
2007
|
2008
|
2009
|
||||||||||
|
(in thousands)
|
||||||||||||
|
Revenues
|
$ | - | - | - | ||||||||
|
Costs and expenses
|
(683 | ) | (1,162 | ) | (1,080 | ) | ||||||
|
Operating loss
|
(683 | ) | (1,162 | ) | (1,080 | ) | ||||||
|
Equity in earnings from subsidiaries
|
107,583 | 76,082 | 40,834 | |||||||||
|
Other non operating income (loss)
|
5,696 | 1,461 | (104 | ) | ||||||||
|
Earnings before income taxes
|
112,596 | 76,381 | 39,650 | |||||||||
|
Income taxes
|
- | - | - | |||||||||
|
Net Income
|
$ | 112,596 | 76,381 | 39,650 | ||||||||
Condensed Statements of Cash Flows
|
Year ended December 31,
|
||||||||||||
|
2007
|
2008
|
2009
|
||||||||||
|
(in thousands)
|
||||||||||||
|
Cash flows from operating activities:
|
||||||||||||
|
Net income
|
$ | 112,596 | 76,381 | 39,650 | ||||||||
|
Adjustments to reconcile net income to net cash provided by (used in) operating activities:
|
||||||||||||
|
Share-based compensation expense
|
5 | 22 | 24 | |||||||||
|
Equity in earnings from subsidiaries
|
(107,583 | ) | (76,082 | ) | (40,834 | ) | ||||||
|
Changes in operating assets and liabilities:
|
||||||||||||
|
Other current assets
|
16,821 | 330 | (826 | ) | ||||||||
|
Other accrued expenses and other current liabilities
|
(499 | ) | 78 | 654 | ||||||||
|
Net cash provided by (used in) operating activities
|
21,340 | 729 | (1,332 | ) | ||||||||
|
Net cash used in investing activities
|
(24,141 | ) | (8,481 | ) | (11,400 | ) | ||||||
|
Cash flows from financing activities:
|
||||||||||||
|
Distribution of cash dividends
|
(39,710 | ) | (66,817 | ) | (55,496 | ) | ||||||
|
Proceeds from borrowing of short-term debt
|
- | - | 80,000 | |||||||||
|
Repayment of short-term debt
|
- | - | (80,000 | ) | ||||||||
|
P
roceeds from issue of RSUs from a subsidiary
|
4,853 | 7,540 | 6,598 | |||||||||
|
Proceeds from debt from a subsidiary
|
- | 60,000 | 95,400 | |||||||||
|
Acquisitions of ordinary shares for retirement
|
(39,345 | ) | (8,656 | ) | (36,596 | ) | ||||||
|
Net cash provided by (used in) financing activities
|
(74,202 | ) | (7,933 | ) | 9,906 | |||||||
|
Net decrease in cash
|
(77,003 | ) | (15,685 | ) | (2,826 | ) | ||||||
|
Cash at beginning of year
|
95,591 | 18,588 | 2,903 | |||||||||
|
Cash at end of year
|
$ | 18,588 | 2,903 | 77 | ||||||||
|
Supplemental disclosures of cash flow information:
|
||||||||||||
|
Interest paid during the year:
|
$ | - | - | 3 | ||||||||
F-64
TABLE OF CONTENTS
Part IItem 1. Identity Of Directors, Senior Management and AdvisersItem 2. Offer Statistics and Expected TimetableItem 3. Key InformationItem 4. Information on The CompanyItem 4A. Unresolved Staff CommentsItem 5. Operating and Financial Review and ProspectsItem 6. Directors, Senior Management and EmployeesItem 7. Major Shareholders and Related Party TransactionsItem 8. Financial InformationItem 9. The Offer and ListingItem 10. Additional InformationItem 11. Quantitative and Qualitative Disclosures About Market RiskItem 12. Description Of Securities Other Than Equity SecuritiesPart IIItem 13. Defaults, Dividend Arrearages and DelinquenciesItem 14. Material Modifications To The Rights Of Security Holders and Use Of ProceedsItem 15. Controls and ProceduresItem 16A. Audit Committee Financial ExpertItem 16B. Code Of EthicsItem 16C. Principal Accountant Fees and ServicesItem 16D. Exemptions From The Listing Standards For Audit CommitteesItem 16E. Purchases Of Equity Securities By The Issuer and Affiliated PurchasersItem 16F. Change in Registrant S Certifying AccountantItem 16G. Corporate GovernancePart IIIItem 17. Financial StatementsItem 18. Financial StatementsItem 19. ExhibitsNote 1. Background, Principal Activities and Basis Of PresentationNote 2. Summary Of Significant Accounting PoliciesNote 3. AcquisitionNote 4. Investments in Marketable Securities Available-for SaleNote 5. Allowance For Doubtful Accounts, Sales Returns and DiscountsNote 6. Equity Method InvestmentsNote 7. InventoriesNote 8. Goodwill and Intangible AssetsNote 9. Property, Plant and EquipmentNote 10. Investments in Non-marketable Equity SecuritiesNote 11. Other Accrued Expenses and Other Current LiabilitiesNote 12. Unused Credit LinesNote 13. Government GrantsNote 14. Retirement PlanNote 15. Share-based CompensationNote 16. EquityNote 17. Income TaxesNote 18. Fair Value MeasurementNote 19. Significant ConcentrationsNote 20. Related-party TransactionsNote 21. Commitments and ContingenciesNote 22. Segment InformationNote 23. Subsequent EventsNote 24. Himax Technologies, Inc. (the Parent Company Only)