HOULIHAN LOKEY, INC.
10-Ks and 10-Qs
|
|
|
|
|
|
|
|
|
|
|
|
|
|
|
|
|
|
|
|
|
|
|
|
|
|
|
|
|
|
|
|
|
|
|
|
|
|
|
|
|
UNITED STATES
SECURITIES AND EXCHANGE COMMISSION
Washington, D.C. 20549
|
Form 10-K
|
|
x
|
ANNUAL REPORT PURSUANT TO SECTION 13 OR 15(d) OF THE SECURITIES EXCHANGE ACT OF 1934
|
For the fiscal year ended
March 31, 2019
OR
|
¨
|
TRANSITION REPORT PURSUANT TO SECTION 13 OR 15(d) OF THE SECURITIES EXCHANGE ACT OF 1934
|
For the transition period from __________ to ______________
Commission File Number: 001-37537
|
Houlihan Lokey, Inc.
(Exact name of registrant as specified in its charter)
|
||
|
Delaware
|
95-2770395
|
|
|
(State or other jurisdiction of
incorporation or organization)
|
(I.R.S. Employer
Identification Number)
|
|
10250 Constellation Blvd.
5
th
Floor
Los Angeles, California 90067
(Address of principal executive offices) (Zip Code)
(310) 788-5200
(Registrant’s telephone number, including area code)
N/A
(Former name, former address and former fiscal year, if changed since last report)
Securities registered pursuant to Section 12(b) of the Act:
|
Title of Each Class
|
Trading Symbol(s)
|
Name of each exchange on which registered
|
|
Class A Common Stock, par value $.001
|
HLI
|
New York Stock Exchange
|
Securities Registered pursuant to Section 12(g) of the Act: None
Indicate by check mark if the registrant is a well-known seasoned issuer, as defined in Rule 405 of the Securities Act. Yes
x
No
¨
Indicate by check mark if the registrant is not required to file reports pursuant to Section 13 or Section 15(d) of the Act. Yes
¨
No
x
Indicate by check mark whether the registrant: (1) has filed all reports required to be filed by Section 13 or 15(d) of the Securities Exchange Act of 1934 during the preceding 12 months (or for such shorter period that the registrant was required to file such reports), and (2) has been subject to such filing requirements for the past 90 days. Yes
x
No
¨
Indicate by check mark whether the registrant has submitted electronically every Interactive Data File required to be submitted pursuant to Rule 405 of Regulation S-T (§232.405 of this chapter) during the preceding 12 months (or for such shorter period that the registrant was required to submit such files). Yes
x
No
¨
Indicate by check mark whether the registrant is a large accelerated filer, an accelerated filer, a non-accelerated filer, or a smaller reporting company. See the definitions of “large accelerated filer,” “accelerated filer” and “smaller reporting company” in Rule 12b-2 of the Exchange Act.
|
Large accelerated filer
|
x
|
Accelerated filer
|
¨
|
|
Non-accelerated filer
|
¨
|
Smaller reporting company
|
¨
|
|
Emerging growth company
|
¨
|
||
If an emerging growth company, indicate by check mark if the registrant has elected not to use the extended transition period for complying with any new or revised financial accounting standards provided pursuant to Section 13(a) of the Exchange Act.
¨
Indicate by check mark whether the registrant is a shell company (as defined in Rule 12b-2 of the Exchange Act). Yes
¨
No
x
As of September 30, 2018, the aggregate market value of the voting and non-voting common equity held by non-affiliates was approximately $1,530 million.
As of May 20, 2019, the registrant had 38,404,438 shares of Class A common stock, $0.001 par value per share, and 27,835,457 shares of Class B common stock, $0.001 par value per share, outstanding.
DOCUMENTS INCORPORATED BY REFERENCE
Portions of the Registrant’s definitive proxy statement for its 2019 annual meeting of stockholders, which the Registrant anticipates will be filed no later than 120 days after the end of its fiscal year, are incorporated by reference in Part III of this Form 10‑K.
HOULIHAN LOKEY, INC. AND SUBSIDIARIES
TABLE OF CONTENTS
|
Page
|
||
|
|
||
|
|
||
|
|
||
|
|
||
PART I
Unless the context otherwise requires, as used in
this Annual Report on Form 10-K (
“
Form 10-K
”
)
, the terms the “Company,” “Houlihan Lokey, Inc.,” “Houlihan Lokey,” “HL,” "our firm,” “we,” “us” and “our” refer to (i) prior to the corporate reorganization described under “Organizational Structure,” Houlihan Lokey, Inc., a California corporation (“HL CA”), and (ii) following such corporate reorganization, Houlihan Lokey, Inc., a Delaware corporation (“HL DE”), and, in each case, unless otherwise stated, all of its subsidiaries. We use the term “ORIX USA” to refer to ORIX Corporation USA, a Delaware corporation and a wholly owned subsidiary of ORIX Corporation, a Japanese corporation. References to ORIX USA as a holder of our shares mean ORIX USA acting through its indirect wholly owned subsidiary, ORIX HLHZ Holding LLC, a Delaware limited liability company. We use the term “HL Holders” to refer to our current and former employees and members of our management who hold our Class B common stock through the Houlihan Lokey Voting Trust (the "HL Voting Trust"). We use the term “Fram” to refer to Fram Holdings, Inc., a Delaware corporation and formerly our indirect parent. References to the “IPO” mean our initial public offering in August 2015 of 12,075,000 shares of Houlihan Lokey, Inc. Class A common stock in connection with which HL CA reorganized its business. Our fiscal year ends on March 31st; references to fiscal
2019
, fiscal
2018
and fiscal
2017
are to the fiscal years ended
March 31, 2019
,
2018
and
2017
, respectively; references in this Form 10-K to years are to calendar years unless otherwise noted.
CAUTIONARY NOTE REGARDING FORWARD-LOOKING STATEMENTS
This Form 10-K contains forward-looking statements. All statements other than statements of historical fact contained in this Form 10-K may be forward-looking statements. Statements regarding our future results of operations and financial position, business strategy and plans and objectives of management for future operations are forward-looking statements. In some cases, you can identify forward-looking statements by terms such as “may,” “might,” “will,” “should,” “expects,” “plans,” “anticipates,” “could,” “targets,” “projects,” “contemplates,” “believes,” “estimates,” “intends,” “predicts,” “potential” or “continue,” or the negative of these terms or other similar expressions.
Forward-looking statements involve known and unknown risks, uncertainties and other important factors that may cause our actual results, performance or achievements to be materially different from any future results, performance or achievements expressed or implied by the forward-looking statements. We believe that these factors include, but are not limited to, the following:
•
our ability to retain our Managing Directors and our other senior professionals;
•
our ability to successfully identify, recruit and develop talent;
•
changing market conditions;
•
reputational risk;
•
our volatile revenue and profits on a quarterly basis;
•
risks associated with our acquisitions, joint ventures and strategic investments;
•
strong competition from other financial advisory and investment banking firms;
•
potential impairment of goodwill and other intangible assets, which represent a significant portion of our assets;
•
our ability to execute on our growth initiatives, business strategies or operating plans;
•
risks associated with the recent U.S. tax law changes;
•
risks associated with our international operations;
•
fluctuations in foreign currency exchange rates;
•
costs of compliance associated with broker-dealer, employment, labor, benefits and tax regulations;
•
our potential to offer new products within our existing lines of business or enter into new lines of business, which
may result in additional risks and uncertainties in our business;
•
operational risks;
•
extensive and evolving regulation of our business and the business of our clients;
•
substantial litigation risks;
•
cybersecurity and other security risks;
•
continuing contingent tax liabilities;
•
our dependence on fee-paying clients;
1
•
our clients' ability to pay us for our services;
•
our ability to generate sufficient cash in the future to service our indebtedness; and
•
other factors beyond our control.
We have based these forward-looking statements largely on our current expectations and projections about future events and financial trends that we believe may affect our business, financial condition and results of operations. Because forward-looking statements are inherently subject to risks and uncertainties, some of which cannot be predicted or quantified, you should not rely on these forward-looking statements as predictions of future events. The events and circumstances reflected in our forward-looking statements may not be achieved or occur and actual results could differ materially from those projected in the forward-looking statements. For information about other important factors that could adversely affect our future results, see “Risk Factors” in this Form 10-K.
These forward-looking statements speak only as of the date of this filing. Except as required by applicable law, we do not plan to publicly update or revise any forward-looking statements contained in this Form 10-K after we file this Form 10-K, whether as a result of any new information, future events or otherwise.
|
Item 1.
|
Business
|
Established in 1972, Houlihan Lokey, Inc., is a leading global independent investment bank with expertise in mergers and acquisitions (M&A), capital markets, financial restructurings and financial advisory services. Through our offices in the United States, Europe, Asia, Australia, and Dubai, we serve a diverse set of clients worldwide including corporations, financial sponsors and government agencies. We provide our financial professionals with an integrated platform that enables them to deliver meaningful and differentiated advice to our clients. We advise our clients on critical strategic and financial decisions, employing a rigorous analytical approach coupled with deep product and industry expertise. We market our services through our product areas, our industry groups and our Financial Sponsors group, serving our clients in three primary business practices: Corporate Finance (encompassing M&A and capital markets advisory), Financial Restructuring (both out-of-court and in formal bankruptcy or insolvency proceedings) and Financial Advisory Services (including financial opinions, and a variety of valuation and financial consulting services).
We are committed to a set of principles that serve as the backbone of our success. Independent advice and intellectual rigor, combined with consistent senior-level involvement, are hallmarks of our commitment to client service. Our entrepreneurial culture engenders our flexibility to collaborate across our business practices to provide world-class solutions for our clients. Our broad-based employee ownership serves to align the interests of employees and shareholders and further encourages a collaborative environment where our Corporate Finance, Financial Restructuring and Financial Advisory Services business practices work together productively and creatively to solve our clients’ most critical financial issues. We enter into businesses or offer services where we believe we can excel based on our expertise, analytical sophistication, industry focus and competitive dynamics. Finally, we remain independent and specialized, focusing on advisory products and market segments where our expertise is both differentiating and less subject to conflicts of interest arising from non-advisory products and services, and where we believe we can be a market leader in a particular segment. We do not lend or engage in any securities sales and trading operations or research which might conflict with our clients’ interests.
As of
March 31, 2019
, we had a team of 969 financial professionals across 21 offices globally and an additional office through our joint venture in Italy, serving more than 1,000 clients annually over the past several years, ranging from closely held companies to Fortune Global 500 corporations. Information on our segments is set forth in "Management’s Discussion and Analysis of Financial Condition and Results of Operations."
Our Advisory Services
We provide our financial professionals with an integrated platform that enables them to deliver meaningful and differentiated advice to our clients. We market our services through our three business practices described below, our industry groups and our Financial Sponsors group, who work collaboratively to deliver comprehensive solutions and seamless execution for our clients. This marketing effort is combined with an extensive network of referral relationships with law firms, consulting firms, accounting firms and other professional services firms that have been developed by our financial professionals who maintain those relationships as potential referral sources and direct clients across all of our business practices.
2
Corporate Finance
As of
March 31, 2019
, we had
108
Corporate Finance Managing Directors utilizing a collaborative, interdisciplinary approach to provide our clients with extensive industry and product expertise and global reach in a wide variety of M&A and capital markets transactions. We compete with boutique firms focused on particular industries or geographies as well as other global independent investment banks and bulge-bracket firms. A majority of our engagements relate to mid-cap transactions, which we believe is an attractive segment that is underserved by bulge-bracket investment banks. We believe that our deep sector expertise, significant senior banker involvement and attention, strong financial sponsor relationships and global platform provide a compelling value for our clients, engendering long-term relationships and providing a competitive advantage against our peers in this segment of the market.
We believe that through our industry groups we have a meaningful presence in every major industry segment, including: business services; consumer, food & retail; data & analytics; energy; financial institutions; healthcare; industrials; real estate, lodging & leisure; technology: and media & telecommunications. We continue to expand and deepen our specialized industry capabilities through a combination of internal promotion, external hires and acquisitions. While the majority of our engagements are in the United States, we continue to enhance our presence in other geographies, including Europe, Asia, Australia and Dubai and we believe there will be continued opportunities to grow in regions outside the United States.
Our Corporate Finance activities are comprised of two significant categories:
Mergers & Acquisitions:
We have extensive expertise in mergers, acquisitions, divestitures, and other related advisory services for a broad range of United States and international clients. Our Corporate Finance professionals have relationships with thousands of companies and financial sponsors, providing us with valuable insights into a wide variety of relevant markets.
Our M&A business consists primarily of sell-side and buy-side engagements. In particular, we believe we have developed a reputation in the marketplace as one of the most prolific sell-side advisors, consistently selling more companies under $1 billion than any competitor. We provide advice and services to a diverse set of parties, including public and private company executives, boards of directors, special committees and financial sponsors.
We believe our team of experienced and talented financial professionals is well positioned to provide advice across a wide range of M&A advisory services globally, including sell-side, buy-side, joint ventures, asset sales and divestitures that are less subject to conflicts of interest arising from non-advisory services. Our global industry group model with embedded M&A capabilities brings sector-specific knowledge, experience and relationships to our clients, allowing us to provide differentiated expert advice and connect buyers on a global basis.
Capital Markets Advisory:
We provide global financing solutions and capital-raising advisory services for a broad range of corporate and private equity clients across most industry sectors, from large, publicly-held, multinational corporations to financial sponsors to privately-held companies founded and run by entrepreneurs.
Our Capital Markets Advisory professionals leverage a wide array of longstanding, senior-level lender and investor relationships, including with traditional and non-traditional direct capital providers (such as institutional credit funds, commercial finance companies, business development companies, insurance companies, pension funds, mutual funds, global asset managers, special situations investors and structured equity providers). As the traditional syndicated capital markets have become increasingly complex and more regulated, the private capital markets have developed to provide an alternative source of flexible capital that can be tailored to meet clients’ needs.
We believe we excel in providing our clients with sophisticated and thoughtful advice and access to traditional and non-traditional capital providers in the private and public capital markets. Our objective is to help clients create a capital structure that enables them to achieve their strategic priorities on the best terms available in the market, which often involves raising more than one type of capital.
3
Financial Restructuring
As of
March 31, 2019
, we had
44
Financial Restructuring Managing Directors working around the globe, which we believe constitutes one of the largest restructuring groups in the investment banking industry. Our Financial Restructuring group has earned a reputation for being the advisor of choice for many of the largest and most complex restructurings, offering knowledge, experience and creativity to address challenging situations. We operate in all major worldwide markets as debt issuances have incre
ased around the world. Our Financial Restructuring professionals bring to bear deep expertise and experience in restructurings in the United States, Canada, Europe, Asia, Australia, the Middle East, Latin America and Africa. Given the depth and breadth of the team’s expertise and the high barriers to entry for this expertise and experience, international and multi-jurisdictional restructurings represent an attractive opportunity for our Financial Restructuring group.
The group employs an interdisciplinary approach to engagements, calling upon the expertise of our industry groups, Capital Markets Advisory group and Financial Sponsors group, and drawing on the worldwide resources of the Financial Restructuring team as each situation may require. The Financial Restructuring group has deep experience evaluating complex, highly leveraged situations. In addition to comprehensive financial restructurings, we work with distressed companies on changes of control, asset sales and other M&A and capital markets activities, many times involving the sale of a company or its assets quickly, and in contested or litigious settings on expedited timeframes. We advise companies undergoing financial restructuring and creditor constituencies at all levels of the capital structure, in both out-of-court negotiations and in formal bankruptcy or insolvency proceedings. Our experience, geographic diversity and size allow us to provide the immediate attention and staffing required for time-sensitive and mission-critical restructuring assignments, making us a valued partner for our clients.
Our dedicated team is active throughout business cycles. Our Financial Restructuring practice serves as a countercyclical hedge across macroeconomic cycles, with increasing levels of restructuring opportunities often occurring during periods when demand for M&A and capital markets advisory services may be reduced. In robust macro-economic environments, demand for the services of our Financial Restructuring team generally continues due to opportunities arising from secular and cyclical disruptions in certain industries. Our geographic diversity and global market leadership allow our Financial Restructuring group to maintain significant levels of activity even when the U.S. capital markets are vibrant.
Our broad base of clients and our extensive experience allow us to understand the dynamics of each restructuring situation and strengthen our negotiating strategies by providing us insight into the needs, attitudes and positions of all parties-in-interest. Our clients include companies, bondholder groups, financial institutions, banks and other secured creditor groups, trade creditors, official Chapter 11 creditors’ committees, equity holders, acquirers, equity sponsors and other parties-in-interest involved with financially challenged companies.
Our Financial Restructuring professionals work closely with our Corporate Finance and Financial Advisory Services professionals to provide holistic advice and services. In financial restructuring assignments, our team may represent the company, the creditors or other stakeholders.
Financial Advisory Services
As of
March 31, 2019
, we had
33
Managing Directors in our Financial Advisory Services group, which we believe represents one of the largest and most respected valuation and financial opinion practices in the United States. We have developed a reputation as a thought-leader in the field of valuation, and our professionals produce influential studies and publications, which are recognized and valued throughout the financial industry. We believe our extensive transaction expertise and leadership in these fields inspire the confidence of the financial executives, boards of directors, special committees, retained counsel, investors and business owners that we serve. We believe that our reputation for delivering an outstanding analytical product that will withstand legal or regulatory scrutiny coupled with our independence makes us the advisor of choice for clients seeking to obtain a complex valuation or transaction opinion.
Our core competencies in our Financial Advisory Services practice are our ability to analyze and value companies, security interests, and different types of assets, including intellectual property and liabilities, as well as our ability to analyze the financial aspects of transactions. We are organized around different service areas as each area has different regulatory or compliance specializations, different valuation guidelines as well as different marketing channels.
4
Our People
Our goal is to attract, develop and retain the best talent in our industry across all levels. We believe our compensation programs are competitive, offering a portion of compensation in deferred cash and a portion in deferred stock awards to provide incentives for our employees to remain with us. In addition, we strive to foster a collaborative environment to attract and retain employees, and we seek individuals who fit our culture of entrepreneurship, integrity, creativity and commitment to our clients. For over 20 years, we have emphasized broad employee ownership as a way to align the incentives of our employees and shareholders. As of
March 31, 2019
, we had approximately 565 present and former employee shareholders that collectively owned approximately 38% of our equity with no single employee owning more than 3% of our equity. We believe that a strong emphasis on cultural fit during our recruiting process combined with broad employee ownership results in high retention rates.
Our Managing Directors (other than our executive officers) are compensated based on their ability to deliver profitable revenues on a consistent basis to our firm, the quality of advice and execution provided to our clients, and their collaboration with their colleagues across industries, products and regions. We do not compensate on a commission-based pay model. Our compensation structure for junior financial professionals is based on a system of meritocracy whereby bankers are rewarded for past performance and expectation of future development, and compensation levels are tested against prevailing market compensation for bankers at similar levels.
The primary sources of recruitment for our junior financial professionals are leading undergraduate and graduate programs around the world. Our consistent hiring practices year after year have created partnerships with these institutions and resulted in a steady and high-quality pipeline of junior financial professionals. To supplement this annual class of new hires, we opportunistically and strategically hire professionals with experience and backgrounds relevant to our various businesses. Regardless of title, we place a high degree of emphasis on cultural fit, technical capability and individual character. When we hire junior financial professionals, we hire them directly into one of our business practices to enable them to begin to develop their relevant skill set from day one.
Across our firm, we devote significant time and resources to training and mentoring our employees to ensure every person achieves their highest possible potential. We strive to identify and cultivate future leaders within our firm and are committed to developing our brightest and most ambitious junior professionals into Managing Directors. This philosophy of investing in our people has been and will continue to be core to our culture and organization. As of
March 31, 2019
,
2018
and
2017
, we employed 1,354, 1,228 and 1,171 people, respectively, worldwide.
Competition
Our competitors are other investment banking and financial advisory firms. We compete on both a global and a regional basis, and on the basis of a number of factors, including industry knowledge, transaction execution skills, strength of client relationships, reputation and price. We believe our primary competitors vary by product and industry expertise and would include the following: for our Corporate Finance practice, Evercore Partners, Jefferies LLC, Lazard Ltd, Moelis & Company, N M Rothschild & Sons Limited, Piper Jaffray Companies, Robert W. Baird & Co. Incorporated, Stifel Financial Corp., William Blair & Company, L.L.C., and the bulge-bracket investment banking firms; for our Financial Restructuring practice, Evercore Partners, Lazard Ltd, Moelis & Company, N M Rothschild & Sons Limited and PJT Partners; and for our Financial Advisory Services practice, Duff & Phelps Corp., the “big four” accounting firms, and various global financial advisory firms.
We compete with all of the above as well as with regional and industry-focused boutique firms to attract and retain qualified employees. Our ability to continue to compete effectively in our business will depend upon our ability to attract new employees and retain our existing employees. We may be at a competitive disadvantage in certain situations with regard to certain of our competitors who are able to, and regularly do, provide financing or market making services that are often instrumental in effecting transactions.
5
Regulation
United States
Our business, as well as the financial services industry generally, is subject to extensive regulation in the United States and across the globe. As a matter of public policy, regulatory bodies in the United States and the rest of the world are charged with safeguarding the integrity of the securities and other financial markets and with protecting the interests of customers participating in those markets. In the United States, the Securities and Exchange Commission (the "SEC") is the federal agency responsible for the administration of the federal securities laws. Houlihan Lokey Capital, Inc. (“Houlihan Lokey Capital”), our wholly owned subsidiary, through which we conduct our Corporate Finance, Financial Restructuring and transaction opinion businesses in the United States, is registered as a broker-dealer with the SEC. Houlihan Lokey Capital is subject to regulation and oversight by the SEC. In addition, the Financial Industry Regulatory Authority, Inc. ("FINRA"), a self-regulatory organization that is subject to oversight by the SEC, adopts and enforces rules governing the conduct, and examines the activities, of its broker-dealer member firms, including Houlihan Lokey Capital. State securities regulators also have regulatory or oversight authority over Houlihan Lokey Capital in those states in which it does business.
Broker-dealers are subject to regulations that cover all aspects of the securities business, including sales methods, trade practices, the financing of customers’ purchases, capital structure, record-keeping and the conduct and qualifications of directors, officers and employees. In particular, as a registered broker-dealer and member of a self-regulatory organization, we are subject to the SEC’s uniform net capital rule, Rule 15c3-1. Rule 15c3-1 specifies the minimum level of net capital a broker-dealer must maintain and also requires that a significant part of a broker-dealer’s assets be kept in relatively liquid form. The SEC and FINRA impose rules that require notification when net capital falls below certain predefined criteria, limit the ratio of subordinated debt to equity in the regulatory capital composition of a broker-dealer and constrain the ability of a broker-dealer to expand its business under certain circumstances. Additionally, the SEC’s uniform net capital rule imposes certain requirements that may have the effect of prohibiting a broker-dealer from distributing or withdrawing capital and requiring prior notice to the SEC for certain withdrawals of capital.
Houlihan Lokey Financial Advisors, Inc. (“HLFA”), our wholly owned subsidiary, provides valuation services and related financial analyses of various businesses and types of assets which are used by clients in connection with mergers and acquisitions, divestitures, recapitalizations, dispute analysis, and estate, gift and income tax support. In rendering such analyses, HLFA does not: (i) make recommendations or provide advice with respect to the merits of any security or transaction, the suitability of transacting in any security, or any investment decision with respect to any security, or (ii) manage or hold client accounts, securities or funds. In addition to valuation and financial consulting and analytic services, HLFA provides dispute resolution and financial consulting services.
The USA PATRIOT Act of 2001 and the Treasury Department’s implementing federal regulations require us, as a “financial institution,” to establish and maintain an anti-money-laundering program. The Financial Crimes Enforcement Network (“FinCEN’’), a part of the United States Department of the Treasury, is charged with protecting the financial system from illicit use, combating money laundering, and promoting national security through financial intelligence. FinCEN’s customer due diligence rule requires certain financial institutions, including broker-dealers, to obtain, verify, and record certain client information, including, in some cases, beneficial ownership, as well as to maintain adequate internal controls to prevent and detect possible violations of anti-money laundering rules. In addition, in connection with its administration and enforcement of economic and trade sanctions based on United States foreign policy and national security goals, the Treasury Department’s Office of Foreign Assets Control (“OFAC”) publishes a list of individuals and companies owned or controlled by, or acting for or on behalf of, targeted countries. It also lists individuals, groups and entities, such as terrorists and narcotics traffickers, designated under programs that are not country-specific. Collectively, such individuals and companies are called “Specially Designated Nationals” (“SDNs”). Assets of SDNs are blocked, and we are generally prohibited from dealing with them. In addition, OFAC administers a number of comprehensive sanctions and embargoes that target certain countries, governments and geographic regions. We are generally prohibited from engaging in transactions involving any country, government, entity, or person that is subject to such comprehensive sanctions.
6
Certain parts of our business are subject to compliance with laws and regulations of United States federal and state governments, non-United States governments, their respective agencies and/or various self-regulatory organizations or exchanges relating to, among other things, the privacy of client information, and any failure to comply with these regulations could expose us to liability and/or reputational damage.
Europe
Our European advisory business is conducted primarily through our subsidiary, Houlihan Lokey EMEA, LLP, a limited liability partnership organized under the laws of England and Wales, with its main office in the United Kingdom and branches in France, Germany, Spain and Croatia.
Houlihan Lokey EMEA, LLP is authorized and regulated by the United Kingdom’s Financial Conduct Authority. The current UK regulatory regime is based upon the Financial Services and Markets Act 2000 (“FSMA”), together with secondary legislation and other rules made under FSMA. These rules govern our financial advisory business in the United Kingdom, including regulated activities, record keeping, approval standards for individuals, anti-money laundering and periodic reporting.
Houlihan Lokey EMEA, LLP has exercised the appropriate European financial services passport rights to provide cross-border services into all other members of the European Economic Area (the “EEA”) from the United Kingdom and to establish branches in France, Germany, Spain and Croatia. These “passport” rights derive from the pan-European regime established by the EU Markets in Financial Instruments Directive, which regulates the provision of investment services and activities throughout the EEA.
In June 2016, the United Kingdom voted to withdraw from the European Union (“Brexit”). The Article 50 European Union (EU) exit process was invoked by the UK government on March 2017. This provided for a two-year period at the end of which the United Kingdom was scheduled to leave the EU, and during which time the parties sought to negotiate the terms of their separation (“Exit Deal”). While an Exit Deal has not yet been finally agreed and ratified, the remaining EU27 member states have now agreed with the UK to delay Brexit until October 31, 2019 (at the latest), on the outstanding condition that the UK does not undermine the smooth running of the EU and its institutions. The date on which the UK leaves the EU also could be before October 31, 2019 if the UK and EU ratify an Exit Deal, which might provide for a further transitional period allowing for a managed regulatory realignment between the EU and UK. In order to mitigate the effects of Brexit on our European business, we have incorporated a new European hub entity in Germany, from which we plan to conduct our regulated business in the EU should it no longer be practicable to provide such services cross-border from the UK. We have filed an application with the relevant German regulatory authorities to conduct this business from the new German entity. Brexit may further impact our European business in ways that are unknown at this time and/or may result in costs that are indeterminate at this time.
Since the acquisition of our subsidiary Quayle Munro Limited (now renamed "Houlihan Lokey (Corporate Finance) Limited"), we have continued to operate its business through that entity. It is also authorized and regulated by the United Kingdom's Financial Conduct Authority and has exercised passport rights as referred to above to provide cross-border services into other EEA states where it provides services time to time. In addition to Houlihan Lokey (Corporate Finance) Limited, we provide corporate finance advisory services through other subsidiaries in Germany, the Netherlands and Spain as well as holding a joint venture interest in an entity providing such services in Italy.
Hong Kong
In Hong Kong, the Securities and Futures Commission (the “SFC”) regulates our subsidiary, Houlihan Lokey (China) Limited. The compliance requirements of the SFC include, among other things, various codes of conduct and certain capital requirements. The SFC licenses the activities of the officers, directors, employees of Houlihan Lokey (China) Limited, and requires the registration of such individuals as licensed representatives.
Australia
In July 2017, the Company purchased the remaining interest of Houlihan Lokey (Australia) Pty Limited ("HL Australia") that we did not previous own, which was historically operated as our joint venture in Australia. HL Australia is licensed and subject to regulation by the Australian Securities & Investments Commission and must also comply with applicable provisions of the Corporations Act 2001 and other Australian legal and regulatory requirements, including capital adequacy rules, customer protection rules, and compliance with other applicable trading and investment banking regulations.
7
Singapore
On April 26, 2017, the Monetary Authority of Singapore (“MAS”) acknowledged receipt of the lodgment by our subsidiary, Houlihan Lokey (Singapore) Private Limited, of the relevant form notifying MAS of its commencement of business as a person exempted from the requirement to hold a capital markets services license to carry on business in advising on corporate finance activities, with effect from March 6, 2017. As a result of such lodgment, Houlihan Lokey (Singapore) Private Limited is able to conduct business in Singapore as an “exempt corporate finance adviser,” subject to compliance with regulation governing such status as applicable from time to time in Singapore.
Dubai
Effective September 25, 2017, the Dubai Financial Services Authority ("DFSA") granted a license under Article 48 of the Regulatory Law 2004 to Houlihan Lokey (MEA Financial Advisory) Limited to carry on business providing certain regulated financial services from its office in the Dubai International Financial Centre. Such entity is subject to DFSA administered law and regulation (most notably as provided in the DFSA Rulebook), and individuals within it carrying out "licensed functions" (essentially senior management roles) are required to be approved by DFSA to so act.
Other
The United States and non-United States government agencies and self-regulatory organizations, as well as state securities commissions in the United States, are empowered to conduct periodic examinations and initiate administrative proceedings that can result in censure, fines, the issuance of cease-and-desist orders or the suspension or expulsion of a broker-dealer or its directors, officers or employees.
The United States Foreign Corrupt Practices Act of 1977 (the “FCPA”), the UK 2010 Bribery Act and similar laws to which we may be subject prohibit the payment of bribes to foreign government officials and political figures. The FCPA has a broad reach, covering all United States companies and citizens doing business abroad, and defining a foreign official to include not only those holding public office but also local citizens acting in an official capacity for or on behalf of foreign government-run or -owned organizations or public international organizations. The FCPA also requires maintenance of appropriate books and records and maintenance of adequate internal controls to prevent and detect possible FCPA violations. Similarly, the UK 2010 Bribery Act prohibits us from bribing, being bribed or making other prohibited payments to government officials or other persons to obtain or retain business or gain some other business advantage.
8
Organizational Structure
Overview
Houlihan Lokey, Inc. is a holding company that operates our business through its subsidiaries, the primary subsidiaries being Houlihan Lokey Capital, HLFA and Houlihan Lokey EMEA LLP, each of which is described above under “Regulation.”
The diagram below depicts our current organizational structure and the percentages are as of March 31, 2019:
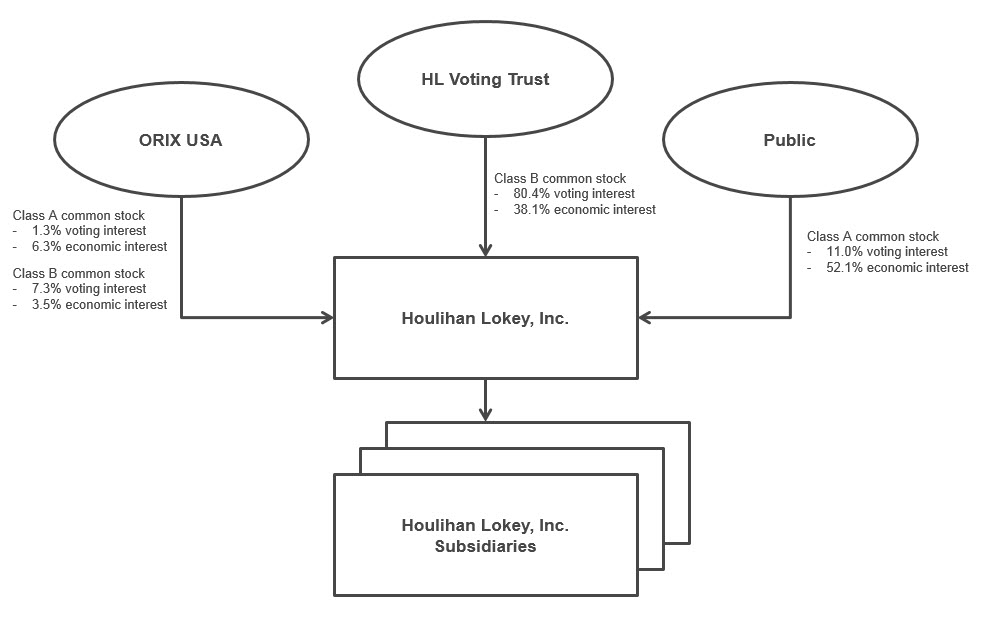
HL Voting Trust Agreement
In connection with the corporate reorganization and the IPO, we entered into the Voting Trust Agreement (the “HL Voting Trust Agreement”) dated as of August 18, 2015 with the HL Holders and the trustees of the HL Voting Trust. Pursuant to the HL Voting Trust Agreement, the trustees have the right to vote the shares of our common stock deposited by any HL Holder, together with any shares of Class B common stock acquired by such HL Holder, in their sole and absolute discretion on any matter, without fiduciary duties of any kind to the HL Holders. As of
March 31, 2019
, the HL Voting Trust controlled
approximately 80.4
%
of the total voting power of the Company.
9
Lock-Up Agreements
In connection with the corporate reorganization and subsequent grants of Class B common stock, each HL Holder depositing shares of our common stock into the HL Voting Trust also entered into an individual lock-up agreement with the Company. Under these lock-up agreements, shares of our common stock deposited into the HL Voting Trust and beneficially owned by the HL Holders generally were locked up for a period of three years following the effective date of the IPO, after which these shares become transferable in three equal installments on each of the third, fourth and fifth anniversary of the IPO;
provided
that shares of our common stock held by managing directors and certain senior corporate officers of the Company whose employment with us or any of our subsidiaries terminated prior to the third anniversary of the IPO for reasons other than death or disability generally are subject to transfer restrictions, and are ineligible to participate in any follow-on offerings, in each case, through the seventh anniversary of the IPO. Notwithstanding the foregoing, the lock-up agreements provide that:
•
up to 10% of each HL Holder’s shares held through the HL Voting Trust may be transferred for the purpose of charitable gifts and transfers to various family trusts for estate planning purposes, with any shares transferred under this exception reducing the number of shares that become transferable on the next transferability date; and
•
our board of directors may authorize sales in underwritten offerings in accordance with the terms of the registration rights agreement entered into between HL and the HL Holders; provided that any shares sold under this exception will reduce the number of shares that become transferable on the next transferability date.
Under the lock-up agreements, our board of directors may consent to exceptions to those transfer restrictions, subject to any limitations or conditions imposed by it.
Stockholders’ Agreement
In connection with the IPO, we entered into the Stockholders' Agreement dated as of August 18, 2015 (the "Stockholders' Agreement") with ORIX USA and the trustees of the HL Voting Trust. Pursuant to the Stockholders' Agreement, our board of directors initially consisted of eleven members, with ORIX USA and the trustees on behalf of the HL Voting Trust each having the right to recommend the nomination of four of the eleven board members. In August 2018, the Post-IPO Percentage Ownership (as defined in the Stockholders' Agreement) of ORIX USA decreased below 10%, as a result of which the number of director nominees that ORIX USA was entitled to recommend pursuant to the Stockholders’ Agreement was reduced to one and the number of director nominees that the trustees of the HL Voting Trust was entitled to recommend was increased to ten. On October 18, 2018, Ron K. Barger, Robert J.B. Lenhardt and Paul E. Wilson resigned from their positions as directors of the Company, effective as of such date. Each of Messrs. Barger, Lenhardt and Wilson were nominated by ORIX USA and had been elected as directors of the Company in accordance with the Stockholders’ Agreement. Effective immediately following the resignations described above, the remaining members of the Company’s board of directors (i) elected Paul Zuber to serve as an independent Class I director of the Company, until the 2019 Annual Meeting of Stockholders and until such time as his successor shall be duly elected and duly qualified or until his earlier death, resignation or removal and (ii) reduced the size of the board from eleven members to nine members. After the reduction of the number of board members, the trustees of the HL Voting Trust have the right to recommend the nomination of eight members of the Company's board of directors and ORIX USA is entitled to nominate one member of the Company’s board of directors. Hideto Nishitani continues to serve on the Company’s board of directors as a nominee of ORIX USA. In addition, under the Stockholders' Agreement, we have agreed with ORIX USA upon certain standards to be satisfied in order for shares of our common stock subject to individual lock-up agreements to participate in underwritten offerings.
10
Controlled Company
The HL Voting Trust and ORIX USA control a majority of the voting power of our outstanding common stock. As a result, we are a “controlled company” under the rules of the New York Stock Exchange. Under these rules, a company of which more than 50% of the voting power is held by an individual, group or another company is a “controlled company” and may elect not to comply with certain corporate governance standards, including the requirements that (i) a majority of our board of directors consist of independent directors and (ii) that our board of directors have compensation and nominating and corporate governance committees composed entirely of independent directors, as independence is defined in Rule 10A-3 of the Securities Exchange Act of 1934, as amended (the "Exchange Act") and under the New York Stock Exchange listing standards. We utilize, and intend to continue to utilize, these exemptions. As a result, although we have a fully independent audit committee as required by the New York Stock Exchange, we do not expect that the majority of our directors will be independent for some time. See “Risk Factors—Risks Related to Our Class A Common Stock—We are a “controlled company” within the meaning of the New York Stock Exchange listing standards and, as a result, qualify for, and rely on, exemptions from certain corporate governance requirements. Holders of Class A common stock do not have the same protections afforded to stockholders of companies that are subject to such requirements.” In the event that we cease to be a “controlled company” and our shares continue to be listed on the New York Stock Exchange, we will be required to comply with these provisions by the expiration of the applicable transition periods.
Market and Industry Data
The industry, market and competitive position data referenced throughout this Form 10-K are based on research, industry and general publications, including surveys and studies conducted by third parties. Industry rankings are as reported by Thomson Reuters unless otherwise noted. Thomson Reuters industry rankings are sourced through direct deal submissions from financial institutions coupled with research performed by Thomson Reuters analysts. Industry publications, surveys and studies generally state that they have been obtained from sources believed to be reliable. We have not independently verified such third party information. While we are not aware of any misstatements regarding any industry, market or similar data presented herein, such data involve uncertainties and are subject to change based on various factors, including those discussed under the headings “Cautionary Note Regarding Forward-Looking Statements” and “Risk Factors” in this Form 10-K.
In this Form 10-K, we use the term “independent investment banks” or “independent advisors” when referring to ourselves and other investment banks or financial advisors that are primarily focused on advisory services and that conduct no or limited commercial banking, lending, or securities sales and trading activities, which we believe are well positioned to provide uncompromised advice that is less subject to conflicts of interest arising from non-advisory services. In this Form 10-K, we use the term “mid-cap” when referring to transactions with a value below $1 billion and “large-cap” when referring to transactions with a value equal to or in excess of $1 billion.
Other Information
Our website address is www.hl.com. We make available free of charge in the Investor Relations section of our website (
http://investors.hl.com
) this Form 10-K, Quarterly Reports on Form 10-Q, Current Reports on Form 8-K and all amendments to those reports as soon as reasonably practicable after such material is electronically filed or furnished with the SEC pursuant to Section 13(a) or 15(d) of the Exchange Act. We also make available through our website other reports filed with or furnished to the SEC under the Exchange Act, including our Proxy Statements and reports filed by officers and directors under Section 16(a) of that Act, as well as various governance documents. From time to time, we may use our website as a channel of distribution of material company information. Financial and other material information regarding the Company is routinely posted on and accessible at
http://investors.hl.com
. We do not intend for information contained in our website to be part of this Form 10-K. The inclusion of our website address in this Form 10-K does not include or incorporate by reference the information on our website into this Form 10-K or any other document into which this Form 10-K is incorporated by reference.
Any materials we file with the SEC may be inspected without charge at the public reference facilities maintained by the SEC at 100 F Street, N.E., Washington, D.C. 20549, and copies of all or any part of this Form 10-K may be obtained from the SEC upon payment of the prescribed fee. Information on the operation of the public reference facilities may be obtained by calling the SEC at 1-800-SEC-0330. The SEC maintains a website that contains reports, proxy and information statements, and other information regarding registrants that file electronically with the SEC. The address of the site is
http://www.sec.gov
.
11
|
Item 1A.
|
Risk Factors
|
Risks Related to Our Business
Our ability to retain our Managing Directors and our other senior professionals is critical to the success of our business.
We depend on the efforts and reputations of our senior management and financial professionals. Our Managing Directors’ and other senior professionals’ reputations and relationships with clients and potential clients are critical elements in the success of our business. Our future success depends to a substantial degree on our ability to retain qualified management and financial professionals within our organization, including our Managing Directors. However, we may not be successful in our efforts to retain the required personnel as the market for qualified investment bankers is extremely competitive. Our investment bankers possess substantial experience and expertise and have strong relationships with our advisory clients. As a result, the loss of these financial professionals could jeopardize our relationships with clients and result in the loss of client engagements. For example, if our Managing Directors or other senior professionals, including our executive officers, or groups of professionals, were to join or form a competing firm, some of our current clients could choose to use the services of that competitor rather than our services. Managing Directors and other senior professionals have left Houlihan Lokey in the past and others may do so in the future, and the departure of any of these senior professionals may have an adverse impact on our business. Our compensation arrangements and post-employment restriction agreements with our Managing Directors and other professionals may not provide sufficient incentives or protections to prevent these professionals from resigning to join our competitors. In addition, some of our competitors have more resources than we do, which may allow them to attract some of our existing employees by offering superior compensation and benefits or otherwise. The departure of a number of Managing Directors or groups of senior professionals could have a material adverse effect on our business, financial condition and results of operations.
Our future growth will depend on, among other things, our ability to successfully identify, recruit and develop talent and will require us to commit additional resources.
Our business involves the delivery of professional services and is largely dependent on the talents and efforts of highly skilled individuals. Our future growth will depend on, among other things, our ability to successfully identify and recruit individuals and teams to join our firm. It typically takes time for these financial professionals to become profitable and effective. During that time, we may incur significant expenses and expend significant time and resources toward training, integration and business development aimed at developing this new talent. If we are unable to recruit and develop profitable financial professionals, we will not be able to implement our growth strategy, which ultimately could materially adversely affect our financial results.
In addition, sustaining growth will require us to commit additional management, operational and financial resources and to maintain appropriate operational and financial systems to adequately support expansion, especially in instances where we open new offices that may require additional resources before they become profitable. We may not be able to recruit and develop talent and manage our expanding operations effectively, and any failure to do so could materially adversely affect our ability to grow revenue and control our expenses.
Changing market conditions can adversely affect our business in many ways, including by reducing the volume of the transactions involving our business, which could materially reduce our revenue.
As a financial services firm, we are materially affected by conditions in the global financial markets and economic conditions throughout the world. Unfavorable market or economic conditions may adversely affect our businesses; in particular, where revenue generated is directly related to the volume and size of the transactions in which we are involved. For example, weak market or economic conditions may adversely affect our Corporate Finance and Financial Advisory Services groups because, in an economic downturn, the volume and size of transactions may decrease, thereby reducing the demand for our M&A, capital raising and opinion advisory services and increasing price competition among financial services companies seeking such engagements. Moreover, in the period following an economic downturn, the volume and size of transactions typically takes time to recover and lags a recovery in market and economic conditions. On the other hand, strong market or economic conditions may adversely affect our Financial Restructuring group. In a strong economic environment, the volume and size of recapitalization and restructuring transactions may decrease, thereby reducing the demand for the services provided by our Financial Restructuring business segment and increasing price competition among financial services companies seeking such engagements. Changes in market and economic conditions are expected to impact our businesses in different ways, and we may not be able to benefit from such changes. Further, our business, financial condition and results of operations could be adversely affected by changing market or economic conditions.
12
Our profitability may also be adversely affected by changes in market and economic conditions because we may not be able to reduce certain fixed costs within a time frame sufficient to match any decreases in revenue. The future market and economic climate may deteriorate because of many factors beyond our control, including rising interest rates or inflation, terrorism or political uncertainty.
We are subject to reputational and legal risk arising from, among other things, actual or alleged employee misconduct, conflicts of interest, failure to meet client expectations or cybersecurity breaches or other operational failures.
As a professional services firm, our ability to secure new engagements is substantially dependent on our reputation and the individual reputations of our financial professionals. Any factor that diminishes our reputation or that of our financial professionals, including not meeting client expectations or actual or alleged misconduct by our financial professionals, including misuse of confidential information, could make it substantially more difficult for us to attract new engagements and clients.
In addition, we face the possibility of an actual, potential or perceived conflict of interest where we represent a client on a transaction in which an existing client is a party. We may be asked by two potential clients to act on their behalf on the same transaction, including by two clients as potential buyers in the same acquisition transaction. In each of these situations, we face the risk that our current policies, controls and procedures may not timely identify or appropriately manage such conflicts of interest. Conflicts may also arise from investments or activities of employees outside their business activities on behalf of the Company. It is possible that actual, potential or perceived conflicts could give rise to client dissatisfaction, litigation or regulatory enforcement actions. Appropriately identifying and managing actual or perceived conflicts of interest is complex and difficult, and our reputation could be damaged if we fail, or appear to fail, to deal appropriately with one or more potential or actual conflicts of interest. Regulatory scrutiny of, or litigation in connection with, conflicts of interest could have a material adverse effect on our reputation which could materially adversely affect our business in a number of ways, including a reluctance of some potential clients and counterparties to do business with us.
Further, because we provide our services primarily in connection with significant or complex transactions, disputes or other matters that usually involve confidential and sensitive information or are adversarial, and because our work is the product of myriad judgments of our financial professionals and other staff operating under significant time and other pressures, we may not always perform to the standards expected by our clients. In addition, we may face reputational damage from, among other things, litigation against us, our failure to protect confidential information and/or breaches of our cybersecurity protections or other inappropriate disclosure of confidential information, including inadvertent disclosures.
There is also a risk that our employees could engage in misconduct that could adversely affect our business. If our employees were to improperly use or disclose confidential information provided by our clients, we could be subject to regulatory sanctions and legal liability and suffer serious harm to our reputation, financial position, current client relationships and ability to attract future clients. It is not always possible to deter employee misconduct, and the precautions we take to detect and prevent misconduct may not be effective in all cases. In addition, our financial professionals and other employees are responsible for the security of the information in our systems or under our control and for ensuring that non-public information is kept confidential. Should any employee not follow appropriate security measures, the improper release or use of confidential information could result. If our employees engage in misconduct or fail to follow appropriate security measures, we could be subject to legal liability and reputational harm, which could impair our ability to attract and retain clients and in turn materially adversely affect our business.
13
A substantial portion of our revenue is derived from advisory engagements in our Corporate Finance and Financial Restructuring business segments, including engagements under which our fees include a significant component based upon goals, such as the completion of a transaction. As a result, our revenue and profits are highly volatile on a quarterly basis and may cause the price of our Class A common stock to fluctuate and decline.
Revenue and profits derived from our Corporate Finance and Financial Restructuring business segments can be highly volatile. We derive a substantial portion of our revenue from advisory fees, which are mainly generated at key transaction milestones, such as closing, the timing of which is outside of our control. From time to time, we enter into engagement agreements under which our fees include a significant component based upon goals, such as the completion of a transaction. In many cases, for advisory engagements that do not result in the successful consummation of a transaction, we are not paid a fee other than the reimbursement of certain out-of-pocket expenses and, in some cases, a modest retainer, despite having devoted considerable resources to these transactions. The achievement of these contractually-defined goals is often impacted by factors outside of our control, such as market conditions and the decisions and actions of our clients and interested third parties. For example, a client could delay or terminate an acquisition transaction because of a failure to agree upon final terms with the counterparty, failure to obtain necessary regulatory consents or board or shareholder approvals, failure to secure necessary financing, adverse market conditions or because the target's business is experiencing unexpected financial problems. Anticipated bidders for client assets during a restructuring transaction may not materialize or our client may not be able to restructure its operations or indebtedness due to a failure to reach agreement with its principal creditors. Because these fees are contingent, revenue on such engagements, which is recognized when all revenue recognition criteria are met, is not certain and the timing of receipt is difficult to predict and may not occur evenly throughout the year.
We expect that we will continue to rely on advisory fees, including fees based upon goals, such as the completion of a transaction, for a substantial portion of our revenue for the foreseeable future. Accordingly, a decline in our advisory engagements or the market for advisory services would adversely affect our business. In addition, our financial results will likely fluctuate from quarter to quarter based on when fees are earned, and high levels of revenue in one quarter will not necessarily be predictive of continued high levels of revenue in future periods. Should these contingent fee arrangements represent a greater percentage of our business in the future, we may experience increased volatility in our working capital requirements and greater variations in our quarter-to-quarter results, which could affect the price of our Class A common stock. Because advisory revenue can be volatile and represents a significant portion of our total revenue, we may experience greater variations in our revenue and profits than other larger, more diversified competitors in the financial services industry. Fluctuations in our quarterly financial results could, in turn, lead to large adverse movements in the price of our Class A common stock or increased volatility in our stock price generally.
Our acquisitions, joint ventures and strategic investments may result in additional risks and uncertainties in our businesses.
In addition to recruiting and organic expansion, we have grown, and intend to continue to grow, our core businesses through acquisitions, joint ventures and strategic investments.
We regularly evaluate opportunities to acquire other businesses. Unless and until acquisitions of other businesses generate meaningful revenues, the purchase prices we pay to acquire such businesses could have a material adverse effect on our business, financial condition and results of operations. If we acquire a business, we may be unable to manage it profitably or successfully integrate its operations with our own. Moreover, we may be unable to realize the financial, operational, and other benefits we anticipate from acquisitions. Competition for future acquisition opportunities in our markets could increase the price we pay for businesses we acquire and could reduce the number of potential acquisition targets. Further, acquisitions may involve a number of special financial and business risks, including expenses related to any potential acquisition from which we may withdraw, diversion of our management's time, attention, and resources, decreased utilization during the integration process, loss of key acquired personnel, difficulties in integrating diverse corporate cultures, increased costs to improve or integrate personnel and financial, accounting, technology and other systems, including compliance with the Sarbanes-Oxley Act, dilutive issuances of equity securities, including convertible debt securities, the assumption of legal liabilities, amortization of acquired intangible assets, potential write-offs related to the impairment of goodwill and additional conflicts of interest. If we are unable to successfully manage these risks, we will not be able to implement our growth strategy, which ultimately could materially adversely affect our business, financial condition and results of operations.
In the case of joint ventures, we are subject to additional risks and uncertainties relating to governance and controls. For example, we may be dependent upon, and subject to, liability, losses or reputational damage relating to personnel, controls and systems that are not fully under our control. In addition, disagreements between us and our joint venture partners may negatively impact our business and profitability.
14
We face strong competition from other financial advisory firms, many of which have the ability to offer clients a wider range of products and services than those we offer, which could cause us to lose engagements to competitors and subject us to pricing pressures that could materially adversely affect our revenue and profitability.
The financial services industry is intensely competitive, highly fragmented and subject to rapid change, and we expect it to remain so. Our competitors are other investment banking and financial advisory firms. We compete on both a global and a regional basis, and on the basis of a number of factors, including depth of client relationships, industry knowledge, transaction execution skills, our range of products and services, innovation, reputation and price. In addition, in our business, there are usually no long-term contracted sources of revenue. Each revenue-generating engagement typically is separately solicited, awarded and negotiated. If we are unable to compete successfully with our existing competitors or with any new competitors, we will not be able to implement our growth strategy, which ultimately could materially adversely affect our business, financial condition and results of operations.
Our primary competitors include bulge-bracket institutions, many of which have far greater financial and other resources and greater name recognition than we do and have a greater range of products and services, more extensive marketing resources, larger customer bases, more managing directors to serve their clients' needs, as well as greater global reach and more established relationships with their customers than we have. These larger and better capitalized competitors may be better able to respond to changes in the investment banking market, to compete for skilled professionals, to finance acquisitions, to fund internal growth and to compete for market share generally, which puts us at a competitive disadvantage and could result in pricing pressures or loss of opportunities, which could materially adversely affect our revenue and profitability. In particular, we may be at a competitive disadvantage with regard to certain of our competitors who are able to, and often do, provide financing or market making services that are often a crucial component of the types of transactions on which we advise.
In addition to our larger competitors, over the last few years, a number of independent investment banks that offer independent advisory services have emerged, with several showing rapid growth. As these independent firms or new entrants into the market seek to gain market share there could be pricing pressures, which would adversely affect our revenue and earnings. We have experienced intense competition over obtaining advisory engagements in recent years, and we may experience further pricing pressures in our business in the future as some of our competitors may seek to obtain increased market share by reducing fees. In particular, when making proposals for fixed-fee engagements, we estimate the costs and timing for completing the engagements. These estimates reflect our best judgment regarding the efficiencies of our methodologies and financial professionals as we plan to deploy them on engagements. Any increased or unexpected costs or unanticipated delays in connection with the performance of fixed-fee engagements, including delays caused by factors outside our control, could make these contracts less profitable or unprofitable, which would have an adverse effect on our profit margin.
Goodwill and other intangible assets represent a significant portion of our assets, and an impairment of these assets could have a material adverse effect on our financial condition and results of operations.
Goodwill and other intangible assets represent a significant portion of our assets, and to
taled
$794.6 million
as of
March 31, 2019
. Goodwill is the excess of cost over the fair market value of net assets acquired in business combinations. We review goodwill and intangible assets at least annually for impairment. We may need to perform impairment tests more frequently if events occur or circumstances indicate that the carrying amount of these assets may not be recoverable. These events or circumstance
s could include a significant change in the business climate, attrition of key personnel, a prolonged decline in our stock price and market capitalization, legal factors, operating performance indicators, competition, sale or disposition of a significant portion of one of our businesses and other factors. Although we determined that it is not more likely than not that the fair values of our goodwill and intangible assets were less than their carrying values during our fiscal
2019
and fiscal
2018
, annual impairment reviews of indefinite-lived intangible assets or any future impairment of goodwill or other intangible assets would result in a non-cash charge against earnings, which would adversely affect our results of operations. The valuation of the reporting units requires judgment in estimating future cash flows, discount rates and other factors. In making these judgments, we evaluate the financial health of our reporting units, including such factors as market performance, changes in our client base and projected growth rates. Because these factors are ever changing, due to market and general business conditions, our goodwill and indefinite-lived intangible assets may be impaired in future periods.
15
We may be unable to execute on our growth initiatives, business strategies or operating plans.
We are executing on a number of growth initiatives, strategies and operating plans designed to enhance our business. For example, we intend to continue to expand our platform into new industry and product sectors, both organically and through acquisitions, and to expand our existing expertise into new geographies. The anticipated benefits from these efforts are based on several assumptions that may prove to be inaccurate. Moreover, we may not be able to complete successfully these growth initiatives, strategies and operating plans and realize all of the benefits, including growth targets and cost savings, we expect to achieve or it may be more costly to do so than we anticipate. A variety of factors could cause us not to realize some or all of the expected benefits. These factors include, among others: delays in the anticipated timing of activities related to such growth initiatives, strategies and operating plans; difficulty in competing in certain industries, product areas and geographies in which we have less experience than others; negative attention from any failed initiatives; and increased or unexpected costs in implementing these efforts.
Moreover, our continued implementation of these programs may disrupt our operations and performance. As a result, we may not realize the expected benefits from these plans. If, for any reason, the benefits we realize are less than our estimates or the implementation of these growth initiatives, strategies and operating plans adversely affect our operations or cost more or take longer to effectuate than we expect, or if our assumptions prove inaccurate, we will not be able to implement our growth strategy, whi
ch ultimately could materially adversely affect our business, financial condition and results of operations.
Recent U.S. tax legislation may materially adversely affect our financial condition, results of operations and cash flows.
Recently enacted U.S. tax legislation, the Tax Cuts and Jobs Act that was signed into law on December 22, 2017 (the “Tax Act”), has significantly changed the U.S. federal income taxation of U.S. corporations, including by reducing the U.S. corporate income tax rate, limiting interest deductions, permitting immediate expensing of certain capital expenditures, adopting elements of a territorial tax system, imposing a one-time transition tax (or “repatriation tax”) on all undistributed earnings and profits of certain U.S.-owned foreign corporations, revising the rules governing net operating losses and the rules governing foreign tax credits, and introducing new anti-base erosion provisions. In some instances, the legislation is unclear in many respects and could be subject to potential amendments and technical corrections, as well as interpretations and implementing regulations by the Department of the Treasury and Internal Revenue Service (“IRS”), any of which could lessen or increase certain adverse impacts of the legislation. Furthermore, in some instances, it is still unclear how these U.S. federal income tax changes will affect state and local taxation, which often uses federal taxable income as a starting point for computing state and local tax liabilities. Changes in tax law (including future Treasury notices or regulations related to the Tax Act) could adversely affect the Company’s tax expense or its effective income tax rate. We urge our investors to consult with their legal and tax advisors with respect to such legislation and the potential tax consequences of investing in our Class A common stock.
Our international operations are subject to
certain risks, which may affect our revenue.
In fiscal
2019
, we earned approximately
19%
of our revenue from our international operations. We intend to grow our no
n-United States business, including growth into new regions with which we have less familiarity and experience, and this growth is important to our overall success. In addition, many of our larger clients are non-United States entities. Our international operations carry special financial and business risks, which could include the following:
•
greater difficulties in managing and staffing foreign operations;
•
fluctuations in foreign currency exchange rates that could adversely affect our results;
•
unexpected changes in trading policies, regulatory requirements, tariffs and other barriers;
•
cultural and language barriers and the need to adopt different business practices in different geographic areas;
•
longer transaction cycles;
•
higher operating costs;
•
local labor conditions and regulations;
•
adverse consequences or restrictions on the repatriation of earnings;
•
potentially adverse tax consequences, such as trapped foreign losses;
•
potentially less stable political and economic environments;
•
terrorism, political hostilities, war and other civil disturbances or other catastrophic events that reduce
business activity; and
•
difficulty collecting fees.
16
As part of our day-to-day operations outside the United States, we are required to create compensation programs, employment policies, compliance policies and procedures and other administrative programs that comply with the laws of multiple countries. We also must communicate and monitor standards and directives across our global operations. Our failure to successfully manage and grow our geographically diverse operations could impair our ability to react quickly to changing business and market conditions and to enforce compliance with non-United States standards and procedures.
Any payment of distributions, loans or advances to and from our subsidiaries could be subject to restrictions on or taxation of, dividends or repatriation of earnings under applicable local law, monetary transfer restrictions, foreign currency exchange regulations in the jurisdictions in which our subsidiaries operate or other restrictions imposed by current or future agreements, including debt instruments, to which our non-United States subsidiaries may be a party. Our business, financial condition and/or results of operations could be adversely impacted, possibly materially, if we are unable to successfully manage these and other risks of international operations in a volatile environment. If our international business increases relative to our total business, these factors could have a more pronounced effect on our operating results or growth prospects.
In recent years, the United States Department of Justice and the SEC have devoted greater resources to enforcement of the FCPA. In addition, the United Kingdom has significantly expanded the reach of its anti-bribery laws. While we have developed and implemented policies and procedures designed to ensure strict compliance by us and our personnel with the FCPA and other anti-corruption laws, such policies and procedures may not be effective in all instances to prevent violations. Any determination that we have violated the FCPA or other applicable anti-corruption laws could subject us to, among other things, civil and criminal penalties, material fines, profit disgorgement, injunctions on future conduct, securities litigation and a general loss of investor confidence, any one of which could adversely affect our business prospects, financial condition, results of operations or the market value of our Class A common stock.
Fluctuations in foreign currency exchange rates could adversely affect our results.
Because our financial statements are denominated in United States dollars and we receive a portion of our net revenue in other currencies, we are exposed to fluctuations in foreign currencies. In addition, we pay certain of our expenses in such currencies. Fluctuations in foreign currency exchange rates led to a
net loss
in cash of
$8.7 million
for fiscal
2019
, compared to a
net gain
in cash of
$0.8 million
for fiscal
2018
. In particular, we are exposed to the Euro and the pound sterling, and the weakening of the Euro and other currencies relative to the United States dollar has had, and may continue to have, an adverse effect on our revenue. From time to time, we have entered into transactions to hedge our exposure to certain foreign currency fluctuations through the use of derivative instruments or other methods. Notwithstanding our entry into such hedge transactions, a depreciation of any of the currencies to which we are exposed relative to the United States dollar could result in an adverse impact to our business, financial condition, results of operations and/or cash flows.
The cost of compliance with international broker-dealer, employment, labor, benefits and tax regulations may adversely affect our business and hamper our ability to expand internationally.
Because we operate our business both in the United States and internationally, we are subject to many distinct securities, employment, labor, benefits and tax laws in each country in which we operate, including regulations affecting our employment practices and our relations with our employees and service providers. If we are required to comply with new regulations or new interpretations of existing regulations, or if we are unable to comply with these regulations or interpretations, our business could be adversely affected or the cost of compliance may make it difficult to expand into new international markets. Additionally, our competitiveness in international markets may be adversely affected by regulations requiring, among other things, the awarding of contracts to local contractors, the employment of local citizens and/or the purchase of services from local businesses or favoring or requiring local ownership.
We may enter into new lines of business, which may result in additional risks and uncertainties in our business.
We currently generate substantially all of our revenue from advisory services. However, while we have no current plans to do so, we may grow our business by entering into new lines of business other than advisory services. To the extent we enter into new lines of business, we will face numerous risks and uncertainties, including risks associated with actual or perceived conflicts of interest because we would no longer be limited to the advisory business, the possibility that we have insufficient expertise to engage in such activities profitably or without incurring inappropriate amounts of risk, the required investment of capital and other resources and the loss of clients due to the perception that we are no longer focusing on a core business.
17
Entry into certain lines of business may subject us to new laws and regulations with which we are not familiar, or from which we are currently exempt, and may lead to increased litigation and regulatory risk. In addition, certain aspects of our cost structure, such as costs for compensation, occupancy and equipment rentals, communication and information technology services, and depreciation and amortization will be largely fixed, and we may not be able to timely adjust these costs to match fluctuations in revenue related to our entering into new lines of business. If a new business generates insufficient revenue or if we are unable to efficiently manage our expanded operations, our business, financial condition and results of operations could be materially adversely affected.
We are subject to risks relating to our operations, including our information and technology, that could harm our business.
We operate a business that is highly dependent on information systems and technology. Any failure to keep accurate books and records can render us liable to disciplinary action by governmental and self-regulatory authorities, as well as to claims by our clients. We rely on third-party service providers for certain aspects of our business. Although we have yet to suffer any significant losses or other damages as a result of operational risks, any interruption or deterioration in the performance of these third parties or failures of their information systems and technology could impair our operations, affect our reputation and adversely affect our business.
In addition, a disaster or other business continuity problem, such as a pandemic, other man-made or natural disaster or disruption involving electronic communications or other services used by us or third parties with whom we conduct business, could lead us to experience operational challenges. The incidence and severity of catastrophes and other disasters are inherently unpredictable, and our inability to timely and successfully recover could materially disrupt our business and cause material financial loss, regulatory actions, reputational harm or legal liability.
Extensive and evolving regulation of our business and the business of our clients exposes us to the potential for significant penalties and fines due to compliance failures, increases our costs and may result in limitations on the manner in which our business is conducted.
As a participant in the financial services industry, we are subject to extensive regulation in the United States and internationally. We are subject to regulation by governmental and self-regulatory organizations in the jurisdictions in which we operate. As a result of market volatility and disruption in recent years, the United States and other governments have taken unprecedented steps to try to stabilize the financial system, including providing assistance to financial institutions and taking certain regulatory actions. The full extent of the effects of these actions and of legislative and regulatory initiatives (including the Dodd-Frank Wall Street Reform and Consumer Protection Act (the “Dodd-Frank Act”)) effected in connection with, and as a result of, such extraordinary disruption and volatility is uncertain, both as to the financial markets and participants in general, and as to us in particular.
Our ability to conduct business and our operating results, including compliance costs, may be adversely affected as a result of any new requirements imposed by the SEC, FINRA or other United States or foreign governmental regulatory authorities or self-regulatory organizations that regulate financial services firms or supervise financial markets. We may be adversely affected by changes in the interpretation or enforcement of existing laws and rules by these governmental authorities and self-regulatory organizations. In addition, some of our clients or prospective clients may adopt policies that exceed regulatory requirements and impose additional restrictions affecting their dealings with us. Accordingly, we may incur significant costs to comply with United States and international regulations. Our expenses incurred in complying with these regulatory requirements, including legal fees and fees paid to the SEC, FINRA and United States or foreign governmental regulatory authorities or self-regulatory organizations, have increased in recent years. We maintain an internal team that works full-time to develop and implement regulatory compliance policies and procedures, monitor business activities to ensure compliance with such policies and procedures and reports to senior management. This team also uses various software tracking and reporting systems and confers regularly with internal and outside legal counsel in the performance of its responsibilities. In addition, new laws or regulations or changes in enforcement of existing laws or regulations applicable to our clients may adversely affect our business. For example, changes in antitrust enforcement could affect the level of M&A activity and changes in applicable regulations could restrict the activities of our clients and their need for the types of advisory services that we provide to them.
18
Our failure to comply with applicable laws or regulations could result in adverse publicity and reputational harm as well as fines, suspensions of personnel or other sanctions, including revocation of any required registration of us or any of our subsidiaries and could impair executive retention or recruitment. In addition, any changes in the regulatory framework under which we operate could impose additional expenses or capital requirements on us, result in limitations on the manner in which our business is conducted, have an adverse impact upon our business, financial condition and results of operations and require substantial attention by senior management. In addition, our business is subject to periodic examination by various regulatory authorities, and we cannot predict the outcome of any such examinations.
New accounting standards could adversely affect future reported results.
Our accounting policies and methods are fundamental to how we record and report our financial condition and results of operations. The Financial Accounting Standards Board (the “FASB”) and the SEC have at times revised the financial accounting and reporting standards that govern the preparation of our financial statements. In addition, accounting standard setters and those who interpret the accounting standards may change or even reverse their previous interpretations or positions on how these standards should be applied. These changes can be hard to predict and can materially impact how we record and report our financial condition and results of operations. In some cases, we could be required to apply a new or revised standard retroactively, resulting in our restating prior period financial statements. For further discussion of some of our significant accounting policies and standards, see the “Critical Accounting Estimates” discussion within Item 7 in this report, and Note 2 of the Notes to Consolidated Financial Statements in this Form 10-K.
We face substantial litigation risks.
Our role as advisor to our clients involves complex analysis and the exercise of professional judgment, including rendering fairness opinions in connection with mergers and other transactions. Our activities, and particularly those of our Financial Advisory Services group, may subject us to the risk of significant legal liabilities to our clients and affected third parties, including shareholders of our clients who could bring securities class actions against us. In recent years, the volume of claims and amount of damages claimed in litigation and regulatory proceedings against financial services companies have been increasing. Litigation alleging that we performed below our agreed standard of care or breached any other obligations to a client or other parties could expose us to significant legal liabilities, particularly with respect to our Financial Advisory Services group, and, regardless of outcome, is often very costly, could distract our management and could damage our reputation. These risks often may be difficult to assess or quantify and their existence and magnitude often remain unknown for substantial periods of time. Our engagements typically include broad indemnities from our clients and provisions to limit our exposure to legal claims relating to our services, but these provisions may not protect us in all cases, including when we perform below our agreed standard of care or a client does not have the financial capacity to pay under the indemnity. As a result, we may incur significant legal expenses in defending against or settling litigation. In addition, we may have to spend a significant amount to adequately insure against these potential claims, or insurance coverage may not be available on commercial terms or at all. Substantial legal liability or significant regulatory action against us could have material adverse financial effects or cause significant reputational harm to us, which could seriously harm our business prospects, financial condition and results of operations.
Cyber-attacks or other security breaches could have a material adverse effect on our business.
Our clients typically provide us with sensitive and confidential information. We are dependent on information technology networks and systems to securely process, transmit and store such information and to communicate among our locations around the world and with our professional staff, clients, alliance partners and vendors. We may be subject to attempted security breaches and cyber-attacks and, while none have had a material impact to date, a successful breach could lead to shutdowns or disruptions of our systems or third-party systems on which we rely and potential unauthorized disclosure of sensitive or confidential information. Breaches of our security systems or third-party network security systems on which we rely could involve attacks that are intended to obtain unauthorized access to our proprietary information, client and third party information, destroy data or disable, degrade or sabotage our systems, often through the introduction of computer viruses, cyber-attacks and other means and could originate from a wide variety of sources, including unknown third parties outside the Company. If our systems or third-party systems on which we rely are compromised, do not operate properly or are disabled, we could suffer a disruption of our business, financial losses, liability to clients, regulatory sanctions and damage to our reputation.
19
We are subject to continuing contingent tax liabilities of ORIX USA.
As a result of the corporate reorganization prior to our IPO, certain tax liabilities of ORIX USA may have become our obligations. Under the Internal Revenue Code of 1986, as amended (the “Code”), and the related rules and regulations, each corporation that was a member of the ORIX USA consolidated United States federal income tax reporting group during any taxable period or portion of any taxable period ending on or before the completion of the corporate reorganization is jointly and severally liable for the United States federal income tax liability of the entire ORIX USA consolidated tax reporting group for that taxable period. As part of the corporate reorganization, we agreed with ORIX USA to allocate the responsibility for prior period taxes of the ORIX USA consolidated tax reporting group between us and ORIX USA. Thus, in the event that ORIX USA were to be assessed for taxes attributable to our business for any period, we would be required to compensate ORIX USA for such liability. In addition, if ORIX USA is unable to pay any prior period taxes for which it is responsible, we could be required to pay the entire amount of such taxes.
Our revenue in any given period is dependent on the number of fee-paying clients in such period and the size of transactions on which we are advising, and a significant reduction in the number of fee-paying clients in any given period could reduce our revenue and adversely affect our operating results in such period.
Our revenue in any given period is dependent on the number of fee-paying clients in such period and the size of transactions on which we are advising. We may lose clients as a result of the sale or merger of a client, a change in a client's senior management, competition from other financial advisors and financial institutions and other causes. A significant reduction in the number of fee-paying clients and/or the size of transactions on which we are advising in any given period could reduce our revenue and adversely affect our operating results in such period.
Our clients may be unable to pay us for our services.
We face the risk that certain clients may not have the financial resources to pay our agreed-upon advisory fees, including in the bankruptcy or insolvency context. Our clients include some companies that may from time to time encounter financial difficulties. If a client's financial difficulties become severe, the client may be unwilling or unable to pay our invoices in the ordinary course of business, which could adversely affect collections of both our accounts receivable and unbilled services. On occasion, some of our clients have entered bankruptcy, which has prevented us from collecting amounts owed to us. The bankruptcy of a number of our clients that, in the aggregate, owe us substantial accounts receivable could have a material adverse effect on our business, financial condition and results of operations. In addition, if a number of clients declare bankruptcy after paying us certain invoices, courts may determine that we are not properly entitled to those payments and may require repayment of some or all of the amounts we received, which could adversely affect our business, financial condition and results of operations. In addition, some fees earned from certain activities in our Financial Restructuring business segment are subject to approval by the United States Bankruptcy Courts and other interested parties, including United States Trustees, which have the ability to challenge the payment of those fees. Fees earned and reflected in our revenue may from time to time be subject to successful challenges, which could result in a reduction of revenue. Finally, certain clients may also be unwilling to pay our advisory fees in whole or in part, in which case we may have to incur significant costs to bring legal action to enforce our engagement agreements to obtain our advisory fees. We accrued bad debt expense of
$1,707
thousand in fiscal
2019
and
$2.0 million
in fiscal
2018
, related to uncollectible or doubtful accounts receivable.
We may not be able to generate sufficient cash in the future to service any future indebtedness.
As of March 31, 2019, we only had $31.2 million of debt and other liabilities, but may incur additional debt in the future. Our ability to make scheduled payments on or to refinance our debt obligations will depend on our business, financial condition and results of operations. We cannot provide assurance that we will maintain a level of cash flows from operating activities sufficient to permit us to pay the principal of, and interest on, our indebtedness. If our cash flows and capital resources are insufficient to fund our debt service obligations, we may be forced to reduce or delay investments and capital expenditures, or to sell assets, seek additional capital or restructure or refinance such indebtedness.
Our businesses, profitability and future prospects may be adversely affected by Brexit.
As discussed in “Business - Regulation” in Part I, Item 1 of this Form 10-K, as a result of the process spawned by Brexit, there is considerable uncertainty as to the regulatory framework that will govern transactions and business undertaken by our UK-based subsidiaries in the EU, both in the near term and the long term. As a result, we face numerous risks that could adversely affect how we conduct our businesses or our profitability and liquidity.
20
Our UK-based operating subsidiaries currently benefit from non-discriminatory access to EU clients through arrangements for cross-border “passporting” and the establishment of EU branches. It is uncertain whether these subsidiaries will continue to benefit from the existing access arrangements for financial services following October 31, 2019, the date on which the UK is scheduled to leave the EU, or on any other date that the UK leaves the EU. Further, in the event of Brexit (with or without an Exit Deal), there is uncertainty regarding the terms of the long-term trading relationship between the EU and the UK, including the terms of access to each other’s financial markets.
Operating in the EU through our new European hub entity in Germany could materially adversely affect the manner in which we operate certain businesses in Europe, require us to restructure certain of our operations and expose us to higher operational, regulatory and compliance costs, higher taxes, higher subsidiary-level capital and liquidity requirements, additional restrictions on intercompany transactions, and new restrictions on the ability of our subsidiaries to share personal data, including client data, all of which could adversely affect our liquidity and profitability.
Although we have invested significant resources to plan for and address Brexit, there can be no assurance that we will be able to successfully execute our strategy. In addition, even if we are able to successfully execute our strategy, we face the risk that Brexit could have a disproportionately adverse effect on our EU operations compared to some of our competitors who have more extensive pre-existing operations in the EU outside of the UK. In addition, Brexit has created an uncertain political and economic environment in the UK, and may create such environments in other EU-member states. Political and economic uncertainty has in the past led to, and the outcome of Brexit could lead to, declines in market liquidity and activity levels, volatile market conditions, a contraction of available credit, changes in interest rates or exchange rates, weaker economic growth and reduced business confidence all of which could adversely impact our business.
Risks Related to Our
Class A Common Stock
The dual class structure of our common stock and the ownership of our Class B common stock by ORIX USA and the HL Holders through the HL Voting Trust have the effect of concentrating voting control with ORIX USA and the HL Voting Trust for the foreseeable future, which limits the ability of our Class A common stockholders to influence corporate matters. We are controlled by ORIX USA and the HL Voting Trust, whose interests may differ from those of our Class A common stockholders.
Each share of our Class B common stock is entitled to ten votes per share, and each share of our Class A common stock is entitled to one vote per share. In February 2019, ORIX USA converted an additional 3,500,000 shares of Class B common stock to Class A common stock, resulting in ORIX USA owning, as of March 31, 2019, 4,109,721 shares of Class A common stock and 2,268,214 shares of Class B common stock. As a result of the greater number of votes per share attributed to our Class B common stock, as of March 31, 2019, ORIX USA and the HL Holders through the HL Voting Trust (which hold 24,929,520 shares of Class B common stock) collectively beneficially owned 31,307,455 shares of common stock representing approximately 47.9% of the economic interest, and control 89.0% of the voting power of our outstanding capital stock. ORIX USA and the HL Voting Trust will, for the foreseeable future, have significant influence over our corporate management and affairs, and will be able to control virtually all matters requiring stockholder approval. ORIX USA and the HL Voting Trust are collectively able, subject to applicable law and voting arrangements between them, to elect a majority of the members of our board of directors and control actions to be taken by us and our board of directors, including amendments to our amended and restated certificate of incorporation and bylaws and approval of significant corporate transactions, including mergers and sales of substantially all of our assets. The directors so elected will have the authority, subject to the terms of our indebtedness and applicable rules and regulations, to issue additional stock, implement stock repurchase programs, declare dividends and make other decisions. This concentrated control will limit the ability of holders of our Class A common stock to influence corporate matters for the foreseeable future and may materially adversely affect the market price of our Class A common stock. It is possible that the interests of ORIX USA and the HL Voting Trust may in some circumstances conflict with our interests and the interests of our other stockholders. For example, ORIX USA and the HL Voting Trust may have different tax positions or other differing incentives from other stockholders that could influence their decisions regarding whether and when to cause us to dispose of assets, incur new or refinance existing indebtedness or take other actions. Additionally, the holders of our Class B common stock may cause us to make strategic decisions or pursue acquisitions that could involve risks to holders of our Class A common stock or may not be in the best interests of holders of our Class A common stock.
21
The holders of our Class B common stock will also be entitled to a separate vote in the event we seek to amend our amended and restated certificate of incorporation to increase or decrease the par value of a class of our common stock or in a manner that alters or changes the powers, preferences or special rights of the Class B common stock in a manner that affects its holders adversely. Future transfers by holders of Class B common stock will generally result in those shares converting on a one-for-one basis to Class A common stock, which will have the effect, over time, of increasing the relative voting power of those holders of Class B common stock who retain their shares in the long-term.
We are a
“
controlled company
”
within the meaning of the New York Stock Exchange listing standards and, as a result, qualify for, and rely on, exemptions from certain corporate governance requirements. Holders of Class A common stock do not have the same protections afforded to stockholders of companies that are subject to such requirements.
ORIX USA and the HL Voting Trust control a majority of the voting power of our outstanding common stock. As a result, we qualify as a “controlled company” within the meaning of the corporate governance standards of the New York Stock Exchange. Under these rules, a listed company of which more than 50% of the voting power is held by an individual, group or another company is a “controlled company” and may elect not to comply with certain corporate governance requirements, including the requirement that a majority of the board of directors consist of independent directors, the requirement that we have a nominating and corporate governance committee that is composed entirely of independent directors, and the requirement that we have a compensation committee that is composed entirely of independent directors.
We intend to continue to rely on some or all of these exemptions. As a result, we do not have a majority of independent directors and our compensation and nominating and corporate governance committees do not consist entirely of independent directors. Accordingly, our stockholders do not have the same protections afforded to stockholders of companies that are subject to all of the corporate governance requirements of the New York Stock Exchange.
While we currently pay a quarterly cash dividend to our stockholders, we may change our dividend policy at any time and we may not continue to declare cash dividends.
Although we currently pay a quarterly cash dividend to our stockholders, we have no obligation to do so, and our dividend policy may change at any time. Returns on stockholders' investments will primarily depend on the appreciation, if any, in the price of our Class A common stock. The amount and timing of dividends, if any, are subject to capital availability and periodic determinations by our board of directors that cash dividends are in the best interest of our stockholders and are in compliance with all applicable laws and any other contractual agreements limiting our ability to pay dividends. Under our current debt obligations (as described herein) we are restricted from paying cash dividends in certain circumstances, and we expect these restrictions to continue in the future. Our ability to pay dividends may also be restricted by the terms of any future credit agreement or any future debt or preferred equity securities of ours or of our subsidiaries. Future dividends, including their timing and amount, may be affected by, among other factors: general economic and business conditions; our financial condition and operating results; our available cash and current anticipated cash needs; capital requirements; contractual, legal, tax and regulatory restrictions and implications on the payment of dividends by us to our stockholders; and such other factors as our board of directors may deem relevant.
Our dividend payments may change from time to time, and we may not continue to declare dividends in any particular amounts or at all. The reduction in or elimination of our dividend payments could have a negative effect on our stock price.
If securities analysts do not publish research or reports about our business or if they publish negative evaluations of our Class A common stock, the price of our Class A common stock could decline.
The trading market for our Class A common stock relies in part on the research and reports that industry or financial analysts publish about us or our business. We do not control these analysts. If one or more of the analysts covering our business downgrade their evaluations of our stock, the price of our Class A common stock could decline. If one or more of these analysts cease to cover our Class A common stock, we could lose visibility in the market for our stock, which in turn could cause our Class A common stock price to decline.
22
The trading price of our Class A common stock may be volatile or may decline regardless of our operating performance, which could cause the value of our Class A common stock to decline.
The market price for our Class A common stock is volatile, in part because of the limited number of shares of Class A common stock outstanding, and the limited trading history of the Class A common stock. In addition, the market price of our Class A common stock may fluctuate significantly in response to a number of factors, most of which we cannot control, including:
•
our operating and financial performance and prospects;
•
our quarterly or annual earnings or those of other companies in our industry;
•
the public’s reaction to our press releases, our other public announcements and our filings with the SEC;
•
quarterly variations in our operating results compared to market expectations;
•
changes in, or failure to meet, earnings estimates or recommendations by research analysts who track our common
shares or the stock of other companies in our industry;
•
adverse publicity about us, the industries we participate in or individual scandals;
•
announcements of new offerings by us or our competitors;
•
stock price performance of our competitors;
•
changes in the evaluations of our Class A common stock by research analysts
•
fluctuations in stock market prices and volumes;
•
default on our indebtedness;
•
actions by competitors;
•
changes in senior management or key personnel;
•
changes in financial estimates by securities analysts;
•
our status as a
“
controlled company
”
;
•
negative earnings or other announcements by us or other financial services companies;
•
downgrades in our credit ratings or the credit ratings of our competitors;
•
incurrence of indebtedness or issuances of capital stock;
•
global economic, legal and regulatory factors unrelated to our performance; and
•
the other factors listed in this
“
Risk Factors
”
section.
In addition, stock markets have experienced extreme price and volume fluctuations that have affected and continue to affect the market prices of equity securities of many companies in our industry. In the past, stockholders have instituted securities class action litigation following periods of market volatility. If we were involved in securities litigation, we could incur substantial costs and our resources and the attention of management could be diverted from our business.
Our share price may decline due to the large number of shares eligible for future sale.
The market price of our Class A common stock could decline as a result of sales of a large number of shares of Class A common stock available for sale upon conversion of Class B common stock or the perception that such sales could occur. These sales, or the possibility that these sales may occur, also might make it more difficult for us to sell equity securities in the future at a time and at a price that we deem appropriate.
All of our executive officers and the other HL Holders who have deposited their shares into the HL Voting Trust are subject to lock-up agreements that restrict their ability to transfer shares of our capital stock. These agreements restricted these holders’ ability to transfer shares of our capital stock until August 2018, subject to acceleration in certain circumstances. In August 2018, approximately 3.9 million shares were released from these restrictions. The shares of common stock held by HL Holders indirectly through the HL Voting Trust which remain subject to these restrictions will become transferable in two equal installments in each of August 2019 and 2020. In addition, shares of our common stock held by managing directors and certain senior corporate officers of the Company whose employment with the Company or a subsidiary thereof was terminated (other than due to a death or disability) before the third anniversary of the IPO are now subject to transfer restrictions for seven years following the IPO. As of
March 31, 2019
,
24,929,520
shares of our Class A common stock issuable upon conversion of outstanding Class B common stock are eligible for sale, subject to the restrictions under the lock-up agreements described above, and subject to certain restrictions under the Securities Act of 1933, as amended (the
“
Securities Act
”
). Stockholders who are subject to any of the lock-up agreements described above may be permitted to sell shares prior to the expiration of the applicable lock-up agreement in certain circumstances, including a secondary offering, or as a result of a waiver approved by the Board of Directors.
23
We will continue to incur increasing costs as a result of becoming a public company and in the administration of our organizational structure.
As a public company, we incur significant legal, accounting, insurance and other expenses that we did not previously incur as a private company, including costs associated with public company reporting requirements. We will continue to incur costs associated with the Sarbanes-Oxley Act and related rules implemented by the SEC. We also incur ongoing periodic expenses in connection with the administration of our organizational structure. The expenses incurred by public companies generally for reporting and corporate governance purposes have been increasing as a result of additional rules and regulations. We expect this to continue which will likely make some activities more time-consuming and costly, although we are currently unable to estimate these costs with any degree of certainty. These laws and regulations could also make it more difficult or costly for us to obtain certain types of insurance, including director and officer liability insurance, and we may be forced to accept reduced policy limits and coverage or incur substantially higher costs to obtain the same or similar coverage. These laws and regulations could also make it more difficult for us to attract and retain qualified persons to serve on our board of directors, our board committees or as our executive officers. Furthermore, if we are unable to satisfy our obligations as a public company, we could be subject to delisting of our common stock, fines, sanctions and other regulatory action and potentially civil litigation.
Failure to establish and maintain effective internal controls in accordance with Section 404 of the Sarbanes-Oxley Act could have a material adverse effect on our business and stock price.
We are required to comply with the SEC's rules implementing Sections 302 and 404 of the Sarbanes-Oxley Act, which require management to certify financial and other information in ou
r quarterly and annual reports and provide an annual management report on the effectiveness of controls over financial reporting. Our independent registered public accounting firm is now required to formally attest to the effectiveness of our internal controls over financial reporting pursuant to Section 404. Our independent registered public accounting firm may issue a report that is adverse in the event it is not satisfied with the level at which our controls are documented, designed or operating.
To comply with the requirements of being a public company, we hav
e undertaken various actions, and may need to take additional actions, such as implementing new internal controls and procedures and hiring additional accounting or internal audit staff. Testing and maintaining internal controls can divert our management's attention from other matters that are important to the operation of our business. A material weakness is a deficiency, or combination of deficiencies, in internal controls, such that there is a reasonable possibility that a material misstatement of the entity's financial statements will not be prevented, or detected and corrected on a timely basis. A significant deficiency is a deficiency, or combination of deficiencies, in internal controls that is less severe than a material weakness, yet important enough to merit attention by those charged with governance. Although we have not identified a material weakness in the past two fiscal years, in the future when evaluating our internal controls over financial reporting, we may identify material weaknesses that we may not be able to remediate in time to meet the applicable deadline imposed upon us for compliance with the requirements of Section 404. If we identify any material weaknesses in our internal controls over financial reporting or are unable to comply with the requirements of Section 404 in a timely manner or assert that our internal controls over financial reporting is ineffective, or if our independent registered public accounting firm is unable to express an opinion as to the effectiveness of our internal controls over financial reporting once, investors may lose confidence in the accuracy and completeness of our financial reports and the market price of our Class A common stock could be negatively affected, and we could become subject to investigations by the stock exchange on which our securities are be listed, the SEC or other regulatory authorities, which could require additional financial and management resources and could lead to a decline in our stock price.
24
Our anti-takeover provisions could prevent or delay a change in control of our Company, even if such change in control would be beneficial to our stockholders.
Provisions of our amended and restated certificate of incorporation and amended and restated bylaws, as well as provisions of Delaware law could discourage, delay or prevent a merger, acquisition or other change in control of our company, even if such change in control would be beneficial to our stockholders. Certain provisions of our amended and restated certificate of incorporation and our amended and restated bylaws that could prevent or delay a change in control of our company include:
•
the ability to issue “blank check” preferred stock, which could increase the number of outstanding shares and
thwart a takeover attempt;
•
a classified board of directors so that not all members of our board of directors are elected at one time;
•
the ability to remove directors only for cause;
•
no use of cumulative voting for the election of directors;
•
no ability of stockholders to call special meetings;
•
supermajority voting provisions for stockholder approval of amendments to our certificate of incorporation and
by-laws;
•
the requirement that, to the fullest extent permitted by law and unless we agree otherwise, certain proceedings
against or involving us or our directors, officers or employees be brought exclusively in the Court of Chancery in the State of Delaware;
•
the ability of stockholders to take action by written consent; and
•
advance notice and duration of ownership requirements for nominations for election to the board of directors or
for proposing matters that can be acted upon by stockholders at stockholder meetings.
These provisions could also discourage proxy contests and make it more difficult for our stockholders to elect directors of their choosing and cause us to take other corporate actions they desire. In addition, because our board of directors is responsible for appointing the members of our management team, these provisions could in turn affect any attempt by our stockholders to replace current members of our management team.
In addition, the General Corporation Law of the State of Delaware (the
“
DGCL
”
), to which we are subject, prohibits us, except under specified circumstances, from engaging in any mergers, significant sales of stock or assets or business combinations with any stockholder or group of stockholders who owns at least 15% of our common stock.
We may issue shares of preferred stock in the future, which could make it difficult for another company to acquire us or could otherwise adversely affect holders of our Class A common stock, which could depress the price of our Class A common stock.
Our amended and restated certificate of incorporation authorizes us to issue one or more series of preferred stock. Our board of directors has the authority to determine the preferences, limitations and relative rights of the shares of preferred stock and to fix the number of shares constituting any series and the designation of such series, without any further vote or action by our stockholders. Our preferred stock could be issued with voting, liquidation, dividend and other rights superior to the rights of our common stock. The potential issuance of preferred stock may delay or prevent a change in control of us, discourage bids for our Class A common stock at a premium to the market price, and materially and adversely affect the market price and the voting and other rights of the holders of our Class A common stock.
The provision of our amended and restated certificate of incorporation requiring exclusive venue in the Court of Chancery in the State of Delaware for certain types of lawsuits may have the effect of discouraging lawsuits against our directors, officers and stockholders.
Our amended and restated certificate of incorporation requires, to the fullest extent permitted by law, that (i) any derivative action or proceeding brought on our behalf, (ii) any action asserting a claim of breach of a fiduciary duty owed by any of our directors, officers or stockholders to us or our stockholders, (iii) any action asserting a claim arising pursuant to any provision of the DGCL or as to which the DGCL confers jurisdiction in the Court of Chancery of the State of Delaware or (iv) any action asserting a claim governed by the internal affairs doctrine will have to be brought only in the Court of Chancery in the State of Delaware, unless we agree otherwise. Although we believe this provision benefits us by providing increased consistency in the application of Delaware law in the types of lawsuits to which it applies, the provision may have the effect of discouraging lawsuits against our directors, officers and stockholders.
25
Item 1B. Unresolved Staff Comments
Not applicable.
Item 2. Properties
Our headquarters is located in leased offi
ce space at 10250 Constellation Boulevard, Los Angeles, California 90067. We lease the space in the United States for our offices in Atlanta, Chicago, Dallas, Houston, Minneapolis, Miami, New York, San Francisco and Washington D.C.; and internationally in Amsterdam, Beijing, Dubai, Frankfurt, Hong Kong, London, Madrid, Paris, Singapore, Sydney and Tokyo.
We do not own any real property. We consider these arrangements to be adequate for our present and future needs.
Item 3.
Legal Proceedings
In the ordinary course of business, from time to time the Company and its affiliates are involved in judicial or regulatory proceedings, arbitrations or mediations concerning matters arising in connection with the conduct of its businesses, including contractual and employment matters. In addition, government agencies and self-regulatory organizations conduct periodic examinations and initiate administrative proceedings regarding the Company’s business, including, among other matters, compliance, accounting and operational matters, that can result in censure, fine, the issuance of cease-and-desist orders or the suspension or expulsion of a broker-dealer or its directors, officers or employees. In view of the inherent difficulty of determining whether any loss in connection with such matters is probable and whether the amount of such loss can be reasonably estimated, particularly in cases where claimants seek substantial or indeterminate damages or where investigations and proceedings are in the early stages, the Company cannot estimate the amount of such loss or range of loss, if any, related to such matters, how or if such matters will be resolved, when they will ultimately be resolved, or what the eventual settlement, fine, penalty or other relief, if any, might be. Subject to the foregoing, the Company believes, based on current knowledge and after consultation with counsel, that it is not currently party to any material pending proceedings, individually or in the aggregate, the resolution of which would have a material effect on the Company. Where appropriate, provisions for losses are established in accordance with Accounting Standards Codification (ASC) 450, “Contingencies” when warranted. Once established, such provisions are adjusted when there is more information available or when an event occurs requiring a change.
Item 4.
Mine Safety Disclosures
Not applicable.
26
PART II
Item 5.
Market for Registrant’s Common Equity, Related Stockholder Matters and Issuer Purchases of Equity Securities
Our Class A common stock is traded on the New York Stock Exchange under the symbol “HLI.” There is no publicly traded market for our Class B common stock. Each share of Class B common stock may be converted into one share of Class A common stock at the option of its holder and will be converted automatically into one share of Class A common stock upon transfer thereof, subject to certain exceptions. Our fiscal year ends on March 31 of each year.
As of May 20, 2019, there were approximately six holders of record of our Class A common stock and two holders of record of our Class B common stock. This does not include the number of shareholders that hold shares in "street-name" through banks or broker-dealers or through the HL Voting Trust.
Dividend Payments and Dividend Policy
The Company has regularly declared and paid quarterly dividends and plans to continue paying regularly quarterly dividends.
The declaration and payment of any future dividends will be at the sole discretion of our board of directors. Our board of directors will take into account: general economic and business conditions; our financial condition and operating results; our available cash and anticipated cash needs; capital requirements; contractual, legal, tax and regulatory restrictions and implications on the payment of dividends by us to our stockholders; and such other factors as our board of directors may deem relevant.
Unregistered Sales of Equity Securities and Use of Proceeds
In December 2018, we issued an aggregate of 40,253 shares of Class B common stock at a price of $41.37 per share to certain former employees in connection with the acquisition of Leonardo & Co.
The foregoing issuance of unregistered equity securities did not involve any underwriters, underwriting discounts or commissions, or any public offering, and, to the extent any such issuances constituted a sale of unregistered equity securities, we believe that such transaction was originally exempt from the registration requirements of the Securities Act in reliance on Rule 701 promulgated under the Securities Act as a transaction pursuant to a compensatory benefit plan approved by our board of directors, or Section 4(a)(2) of the Securities Act and/or Rule 506(b) of Regulation D promulgated thereunder, as transactions by an issuer not involving a public offering, based in part on representations from the recipients regarding their investment intention, sophistication, net worth and access to information concerning us.
27
Stock Performance
The stock performance graph below compares the performance of an investment in our Class A common stock, from August 13, 2015 through March 29, 2019, with that of the S&P 500 Index and the S&P Financial Index. The graph assumes $100 was invested in each of our Class A common stock on August 13, 2015 (at the closing price on the first trading day following our initial public offering), the S&P 500 Index and the S&P Financial Index. It also assumes that dividends were reinvested on the date of payment without payment of any commissions. The performance shown in the graph represents past performance and should not be considered an indication of future performance.
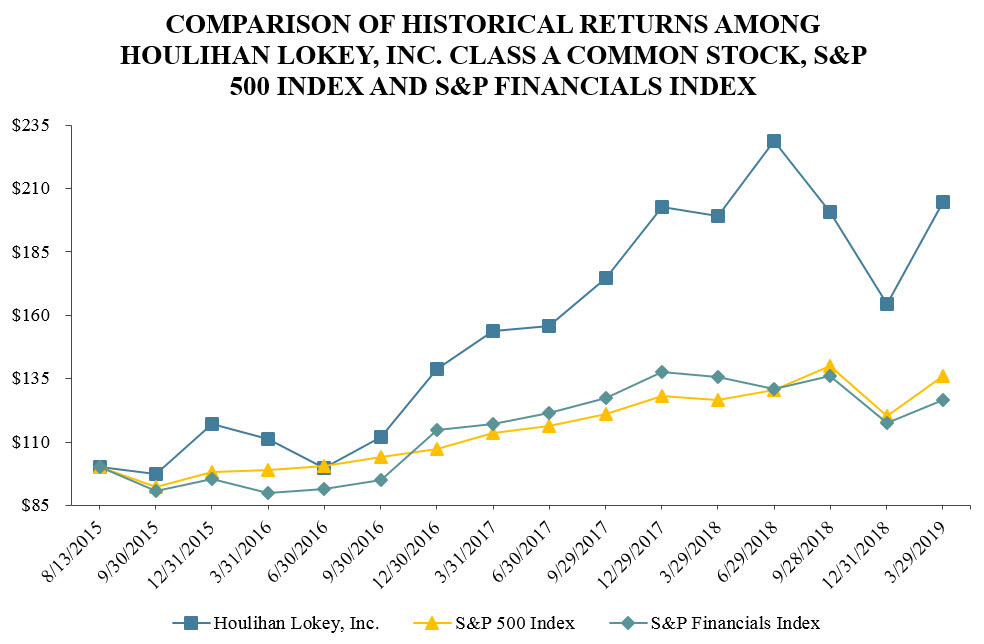
Purchases of Equity Securities
The following table summarizes all of the repurchases of Houlihan Lokey, Inc. equity securities during the quarter ended
March 31, 2019
:
|
Period
|
Total Number of Shares Purchased
|
|
Average Price Paid Per
Share
|
Total Number of Shares Purchased and Retired As Part of Publicly Announced Plans or Programs
|
|
Approximate Dollar Value of Shares That May Yet Be Purchased Under the Plans or Programs
(1)
|
|||||||
|
January 1, 2019 - January 31, 2019
|
—
|
|
—
|
|
—
|
|
—
|
|
|||||
|
February 1, 2019 - February 28, 2019
|
245
|
|
43.99
|
|
245
|
|
|
—
|
|
||||
|
March 1, 2019 - March 31, 2019
|
—
|
|
—
|
|
—
|
|
|
—
|
|
||||
|
Total
|
245
|
|
|
$
|
43.99
|
|
245
|
|
$
|
65,049,753
|
|
||
_______________________
(1) In July 2018, the board of directors authorized the repurchase of up to an additional $100 million of the Company's common stock (incremental to the $50 million repurchase program that was approved by our board in February 2017). The shares of Class A common stock repurchased through this program have been retired.
28
|
Item 6.
|
Selected Financial Data
|
The following selected financial and other data are derived from our audited consolidated financial statements. The selected financial and other data should be read together with “Item 7. Management’s Discussion and Analysis of Financial Condition and Results of Operations” and the financial statements and related notes included elsewhere in this Form 10-K.
|
($ in thousands)
|
Year ended March 31,
|
||||||||||
|
2019
|
2018
|
2017
|
|||||||||
|
Consolidated Statements of Operations Data:
|
|||||||||||
|
Revenues
|
$
|
1,084,385
|
|
$
|
963,364
|
|
$
|
872,091
|
|
||
|
Operating expenses:
|
|||||||||||
|
Employee compensation and benefits
|
692,073
|
|
636,631
|
|
582,244
|
|
|||||
|
Non-compensation expenses
|
172,785
|
|
112,287
|
|
107,852
|
|
|||||
|
Total operating expenses
|
864,858
|
|
748,918
|
|
690,096
|
|
|||||
|
Operating income
|
219,527
|
|
214,446
|
|
181,995
|
|
|||||
|
Other (income) expense, net
|
(4,793
|
)
|
(3,390
|
)
|
3,508
|
|
|||||
|
Income before provision for income taxes
|
224,320
|
|
217,836
|
|
178,487
|
|
|||||
|
Provision for income taxes
|
65,214
|
|
45,553
|
|
70,144
|
|
|||||
|
Net income
|
159,106
|
|
172,283
|
|
108,343
|
|
|||||
|
|
|||||||||||
|
Weighted average number of shares outstanding
|
|||||||||||
|
Basic
|
62,213,414
|
|
62,494,275
|
|
61,100,497
|
|
|||||
|
Diluted
|
65,846,132
|
|
66,324,093
|
|
66,579,130
|
|
|||||
|
|
|||||||||||
|
Net income attributable to Houlihan Lokey, Inc. per share
|
|||||||||||
|
Basic
|
$
|
2.56
|
|
$
|
2.76
|
|
$
|
1.77
|
|
||
|
Diluted
|
$
|
2.42
|
|
$
|
2.60
|
|
$
|
1.63
|
|
||
|
|
|||||||||||
|
Cash dividends per share
|
$
|
1.08
|
|
$
|
0.80
|
|
$
|
0.71
|
|
||
|
|
|||||||||||
|
Consolidated Balance Sheets Data:
|
|||||||||||
|
Cash and cash equivalents
|
$
|
285,746
|
|
$
|
206,723
|
|
$
|
300,314
|
|
||
|
Investment securities
(1)
|
125,258
|
|
209,319
|
|
—
|
|
|||||
|
Total assets
|
1,423,058
|
|
1,418,841
|
|
1,385,707
|
|
|||||
|
Long-term obligations
(2)
|
8,004
|
|
10,872
|
|
15,112
|
|
|||||
|
Total liabilities
|
531,729
|
|
566,028
|
|
655,252
|
|
|||||
|
Total stockholders' equity
|
891,329
|
|
852,813
|
|
726,617
|
|
|||||
_______________________
(1) Investment securities consists of corporate debt, certificates of deposit, and U.S. treasury securities with maturities less than one year.
(2) For further detail, please see Contractual Obligations included in Item 7. Management’s Discussion and Analysis of Financial Condition and Results of Operations.
29
|
Item 7.
|
Management’s Discussion and Analysis of Financial Condition and Results of Operations
|
This Management’s Discussion and Analysis of Financial Condition and Results of Operations should be read together with our historical financial statements and related notes included elsewhere in this Form 10-K. Actual results and the timing of events may differ significantly from those expressed or implied in any forward-looking statements due to a number of factors, including those set forth in the sections entitled “Risk Factors” and “Cautionary Note Regarding Forward-Looking Statements” and elsewhere in this Form 10-K.
Executive Overview
Established in 1972, Houlihan Lokey is a leading global independent investment bank with expertise in M&A, financings, financial restructurings and financial advisory services. Through our 21 locations in the United States, Europe, Middle East, and Asia and one location through our joint venture in Milan, we serve a diverse set of clients worldwide including corporations, financial sponsors, and government agencies. We advise our clients on critical strategic and financial decisions employing a rigorous analytical approach coupled with deep product and industry expertise.
We operate in three segments: Corporate Finance, Financial Restructuring and Financial Advisory Services. In our Corporate Finance business segment, we believe we are an established leader in M&A and capital markets advisory services. Through our Financial Restructuring business segment, we advise on some of the largest and most complex restructurings around the world. Our Financial Advisory Services business segment is one of the largest and most respected valuation, financial opinion and financial consulting practices in the United States.
As of March 31, 2019, we served our clients globally with 969 financial professionals, including 185 Managing Directors. We plan to continue to grow our firm across industry sectors, geographies and products to deliver quality advice and innovative solutions to our clients, both organically and through acquisitions. Acquisitions over the last several years include: Milestone Advisors in December 2012, which we combined with our existing financial institutions group to create a more robust platform; ArchPoint Partners LLC in March 2014, which significantly increased our expertise in the technology sector; Bridge Strategy Group, LLC in January 2015, which added strategic consulting to our current consulting capabilities for C-suite relationships; M.E.S.A. Securities, Inc. in June 2015, which increased our capabilities in the digital and traditional media sectors; McQueen Holdings Limited in September 2015, which increased our capacity in the consumer, food and retail sectors, particularly in Europe; Leonardo & Co. NV in November 2015 in Germany, the Netherlands and Spain, and a minority interest in a joint venture with the management team of Leonardo's investment banking operations in Italy (collectively, "Leonardo"), which enables us to provide a much greater breadth of services and coverage to our clients both in continental Europe and across the globe; Black Stone IP LLC in January 2017, which increased our capabilities in the intellectual property sector; Quayle Munro Limited in April 2018, which expanded our capabilities in the data and analytics sector; and BearTooth Advisors in May 2018, which provided us with a private equity fundraising advisory platform.
We generate revenues primarily from providing advisory services on transactions that are subject to individually negotiated engagement letters that set forth our fees. A significant portion of our engagements include Progress Fees (as defined herein) consisting of both periodic and milestone-related payments. The occurrence and timing of milestone-related payments, such as upon the closing of a transaction, are generally not within our control. Accordingly, revenue and net income in any period may not be indicative of full year results or the results of any other period and may vary significantly from year to year and quarter to quarter.
Corporate expenses represent expenses that are not allocated to individual business segments such as Office of the Executives, accounting, information technology, compliance and legal, marketing, human capital management and human resources, including related compensation expense for corporate employees.
Business Environment and Outlook
Economic and global financial conditions can materially affect our operational and financial performance. See “Risk Factors” for a discussion of some of the factors that can affect our performance.
30
Our fiscal year ends on March 31 of each year. Beginning in the fiscal year ended
March 31, 2019
, the Company prospectively changed the presentation of reimbursements of certain out-of-pocket expenses from a net presentation within operating expenses to a gross basis in revenues. For the fiscal
year ended
March 31, 2019
, we earned revenues of
$1,084.4 million
, an increase of
13%
from the
$963.4 million
earned during the fiscal
year ended
March 31, 2018
. For our fiscal
year ended
March 31, 2018
, revenues increased 10% over fiscal
year ended
March 31, 2017
revenues of
$872.1 million
. For the fiscal years ended March 31,
2019
,
2018
and
2017
, we earned revenues of
$205.5 million
,
$133.3 million
and
$111.6 million
, respectively, from our international operations.
Based on historical experience, we believe current economic conditions (high corporate cash balances and steady interest rates) provide a healthy environment for M&A and capital markets activities. In the United States, our dialogue with clients who are evaluating strategic alternatives remains good, and the availability of capital in the mid-cap space continues to be strong, which has the potential to fuel continued activity in M&A. In addition, in the current economic environment, companies and financial sponsors globally are pursuing M&A in order to drive greater efficiencies by reducing costs and increasing cash flows.
At the same time, we continue to experience demand for our Financial Restructuring services due to opportunities arising as a result of dislocations in certain geographies and industries. In addition, we are positioned to identify attractive opportunities in geographies where restructuring markets are just beginning to evolve, driven by increased external investment and continued development of financial and legal sophistication, such as India, China, other parts of Asia and the Middle East.
Key Financial Measures
Revenues
Revenues include fee revenues and reimbursements of expenses (see Note 2 included in part II, Item 8 of this Form 10-K). Revenues reflect revenues from our Corporate Finance (“CF”), Financial Restructuring (“FR”), and Financial Advisory Services (“FAS”) business segments that substantially consist of fees for advisory services.
Revenues for all three business segments are recognized upon satisfaction of the performance obligation and may be satisfied over time or at a point in time. The amount and timing of the fees paid vary by the type of engagement. In general, advisory fees are paid at the time an engagement letter is signed (“Retainer Fees”), during the course of the engagement (“Progress Fees”), or upon the successful completion of a transaction or engagement (“Completion Fees”).
Prior to April 1, 2018, the timing of the recognition of these various fees were generally recognized on a monthly basis, except in situations where there was uncertainty as to the timing of collection of the amount due. Progress Fees were recognized based on management’s estimates of the relative proportion of services provided through the financial reporting date to the total services required to be performed. Completion Fees were recognized only upon substantial completion of the contingencies stipulated by the engagement agreement. In some cases, approval of our fees is required from the courts or other regulatory authority; in these circumstances, the recognition of revenue was often deferred until approval was granted. However, if the fee that was going to be collected from the client was fixed and determinable, and the collectability of the fee was reasonably assured, there were instances when revenue recognition prior to such approval was appropriate under accounting principles generally accepted in the United States ("GAAP"). In instances when the revenue recognized on a specific engagement exceeded the amounts billed, unbilled work-in-process was recorded. Billed receivables were recorded as accounts receivable in the consolidated balance sheets.
On April 1, 2018, we adopted Accounting Standards Update (ASU) No. 2014-09,
Revenue from Contracts with Customers
, which requires an entity to recognize revenue as contractual services are transferred to customers in an amount that reflects the consideration to which the entity expects to be entitled in exchange for those services. The Company is using the modified retrospective method that also results in the Company prospectively changing the presentation of reimbursements of certain out-of-pocket expenses from a net presentation within non-compensation expenses to a gross basis in revenues. See Notes 2 and 3 included in Part II, Item 8 of this Form 10-K for a more detailed discussion.
31
Corporate Finance provides general financial advisory services in addition to advice on mergers and acquisitions and capital markets offerings. We advise public and private institutions on a wide variety of situations, including buy-side and sell-side transactions, as well as leveraged loans, private mezzanine debt, high-yield debt, initial public offerings, follow-ons, convertibles, equity private placements, private equity, and liability management transactions, and advise financial sponsors on all types of transactions. The majority of our Corporate Finance revenues consists of Completion Fees. A Corporate Finance transaction can fail to be completed for many reasons that are outside of our control. In these instances, our fees are generally limited to Retainer Fees and in some cases Progress Fees that may have been earned. Effective April 1, 2018, fees received prior to the completion of the transaction, including Retainer Fees and Progress Fees, are deferred within deferred income on the consolidated balance sheet and not recognized until effective completion of the related transaction.
Financial Restructuring provides advice to debtors, creditors and other parties-in-interest in connection with recapitalization/deleveraging transactions implemented both through bankruptcy proceedings and through out-of-court exchanges, consent solicitations or other mechanisms, as well as in distressed mergers and acquisitions and capital markets activities. Our Financial Restructuring business segment offers a wide range of advisory services to our clients, including: the structuring, negotiation, and confirmation of plans of reorganization; structuring and analysis of exchange offers; corporate viability assessment; litigation support and expert testimony; and procuring debtor-in-possession financing. Although atypical, a Financial Restructuring transaction can fail to be completed for many reasons that are outside of our control. In these instances, our fees are generally limited to the initial Retainer Fees and/or Progress Fees.
We recognize revenues on these engagements ratably as we believe that our performance obligation will be settled over time because the customer is simultaneously receiving the benefits of the services provided as we perform them.
Financial Advisory Services primarily provides valuations of various assets, including: companies; illiquid debt and equity securities; and intellectual property (among other assets and liabilities). These valuations are used for financial reporting, tax reporting, and other purposes. In addition, our Financial Advisory Services business segment renders fairness opinions in connection with mergers and acquisitions and other transactions, and solvency opinions in connection with corporate spin-offs and dividend recapitalizations, and other types of financial opinions. Also, our Financial Advisory Services business segment provides dispute resolution consulting services to clients where fees are usually based on the hourly rates of our financial professionals. Unlike our Corporate Finance or Financial Restructuring segments, the fees generated in our Financial Advisory Services segment are generally not contingent on the successful completion of a transaction.
Effective April 1, 2018, for engagements which require that an opinion be rendered, revenues are recognized when the opinion or service has been delivered to the client. However, certain engagements consist of advisory services where fees are based on the hourly rates of our financial professionals. Such revenues are recognized over time as the benefits of these advisory services are transferred to our clients throughout the course of the engagement and as a practical expedient, we have elected to use the ‘as-invoiced’ approach to recognize revenue.
Operating Expenses
Our operating expenses are classified as employee compensation and benefits expense and non-compensation expense; headcount is the primary driver of our operating expenses. Subsequent to the adoption of ASU No. 2014-09, Revenue from Contracts with Customers, the Company prospectively changed the presentation of reimbursements of certain out-of-pocket deal expenses from a net presentation within non-compensation expenses to a gross basis in revenues.
Employee Compensation and Benefits Expense.
Our employee compensation and benefits expense, which accounts for the majority of our operating expenses, is determined by management based on revenues earned, headcount, the competitiveness of the prevailing labor market, and anticipated compensation expectations of our employees. These factors may fluctuate, and as a result, our employee compensation and benefits expense may fluctuate materially in any particular period. Accordingly, the amount of employee compensation and benefits expense recognized in any particular period may not be consistent with prior periods or indicative of future periods.
32
Our employee compensation and benefits expense consists of base salary, payroll taxes, benefits, annual incentive compensation payable as cash bonus awards, deferred cash bonus awards, and the amortization of equity-based bonus awards. Base salary and benefits are paid ratably throughout the year. Our annual equity-based bonus awards include fixed share awards and fixed dollar awards as a component of the annual bonus awards for certain employees. These equity awards are generally subject to annual vesting requirements over a four-year period beginning at the date of grant, which occurs in the first quarter of each fiscal year; accordingly, expenses are amortized over the stated vesting period. In most circumstances, the unvested portion of these awards is subject to forfeiture should the employee depart from the Company. Cash bonuses, which are accrued monthly, are discretionary and dependent upon a number of factors including the Company's performance and are generally paid in the first fiscal quarter of each year with respect to prior year performance. Generally, a portion of the cash bonus is also deferred and paid in the third quarter of the fiscal year in which the bonus is awarded. In managing employee compensation and benefits expense, we focus on the ratio of our employee compensation and benefits expense to revenues (“Compensation Ratio”).
Non-Compensation Expense.
The balance of our operating expenses includes costs for travel, meals and entertainment, rent, depreciation and amortization, information technology and communications, professional fees, and other operating expenses. We refer to all of these expenses as non-compensation expenses. A portion of our non-compensation expenses fluctuates in response to changes in headcount.
Other (Income) Expenses, net
Other (income) expenses, net includes (i) interest income earned on non-marketable and investment securities, cash and cash equivalents, loans receivable from affiliates and employee loans, (ii) interest expense and/or gains or losses associated with our Revolving Credit Facility (defined herein), the loan payable to affiliate and loans payable to former shareholders, (iii) interest expense on the loan payable to non-affiliates, (iv) equity income and/or gains or losses from funds and partnership interests where we have more than a minor ownership interest or more than minor influence over operations but do not have a controlling interest and are not the primary beneficiary, and (v) gains or losses associated with changes in earnout liabilities.
Results of Consolidated Operations
The following is a discussion of our results of operations for the years ended
March 31, 2019
,
2018
and
2017
. For a more detailed discussion of the factors that affected the revenues and the operating expenses of our Corporate Finance, Financial Restructuring and Financial Advisory Services business segments in these periods, see "Business Segments" below.
|
|
Year ended March 31,
|
Year-over-Year Change
|
|||||||||||||||
|
($ in thousands)
|
2019
|
2018
|
2017
|
'18-'19
|
'17-'18
|
||||||||||||
|
Revenues
|
$
|
1,084,385
|
|
$
|
963,364
|
|
$
|
872,091
|
|
13
|
%
|
10
|
%
|
||||
|
Operating expenses:
|
|||||||||||||||||
|
Employee compensation and benefits
|
692,073
|
|
636,631
|
|
582,244
|
|
9
|
%
|
9
|
%
|
|||||||
|
Non-compensation expenses
|
172,785
|
|
112,287
|
|
107,852
|
|
54
|
%
|
4
|
%
|
|||||||
|
Total operating expenses
|
864,858
|
|
748,918
|
|
690,096
|
|
15
|
%
|
9
|
%
|
|||||||
|
Operating income
|
219,527
|
|
214,446
|
|
181,995
|
|
2
|
%
|
18
|
%
|
|||||||
|
Other (income) expense, net
|
(4,793
|
)
|
(3,390
|
)
|
3,508
|
|
N/M
|
|
N/M
|
|
|||||||
|
Income before provision for income taxes
|
224,320
|
|
217,836
|
|
178,487
|
|
3
|
%
|
22
|
%
|
|||||||
|
Provision for income taxes
|
65,214
|
|
45,553
|
|
70,144
|
|
43
|
%
|
(35
|
)%
|
|||||||
|
Net income attributable to Houlihan Lokey, Inc.
|
159,106
|
|
172,283
|
|
108,343
|
|
(8
|
)%
|
59
|
%
|
|||||||
_______________________
N/M = Not Meaningful
Year ended
March 31, 2019
versus
March 31, 2018
Revenues were
$1,084.4 million
for the
year ended
March 31, 2019
, compared with
$963.4 million
for the
year ended
March 31, 2018
, representing an
increase
of
13%
. For the
year ended
March 31, 2019
, Corporate Finance revenues
increased
15%
, Financial Restructuring revenues
increased
8%
, and Financial Advisory Services revenues
increased
13%
, compared with the
year ended
March 31, 2018
.
33
Operating expenses were
$864.9 million
for the
year ended
March 31, 2019
, compared with
$748.9 million
for the
year ended
March 31, 2018
, an
increase
of
15%
. Employee compensation and benefits expense, as a component of operating expenses, was
$692.1 million
for the
year ended
March 31, 2019
, compared with
$636.6 million
for the
year ended
March 31, 2018
, an
increase
of
9%
. The
increase
in employee compensation and benefits expense was primarily due to the increase in revenues for the fiscal year. The Compensation Ratio was
64%
for the
year ended
March 31, 2019
and
66%
for the
year ended
March 31, 2018
. Non-compensation expenses, as a component of operating expenses, were
$172.8 million
for the
year ended
March 31, 2019
, compared with
$112.3 million
for the
year ended
March 31, 2018
, an
increase
of
54%
. The
increase
in non-compensation expenses was primarily a result of (i) the recognition of reimbursements of out-of-pocket expenses as revenues rather than reporting non-compensation expense net of such amounts as was the case in the prior year period, (ii) higher rent expense primarily as a result of standard increases to base rent across several offices and duplicative rent and occupancy costs associated with an office move and consolidation in London, and (iii) higher professional fees and general operating expenses associated with the growth of the Company.
Other (income) expense, net was
$(4.8) million
for the
year ended
March 31, 2019
, compared with
$(3.4) million
for the
year ended
March 31, 2018
. The
decrease
in other (income) expense, net was primarily a result of (i) a gain from the reduction in an earnout liability associated with one of our acquisitions and (ii) higher interest income generated on higher cash balances throughout the year.
The provision for income taxes for the
year ended
March 31, 2019
was
$65.2 million
, which reflected an effective tax rate of
29.1%
. The provision for income taxes for the
year ended
March 31, 2018
was
$45.6 million
, which reflected an effective tax rate of
20.9%
. The
increase
in the effective tax rate was a result of the adoption of ASU 2016-09, Compensation - Stock Compensation, which resulted in a decrease to the provision for income taxes for the fiscal year ended March 31, 2018 due to the vesting of share awards that were accelerated during calendar year 2017, as well as the Tax Cuts and Jobs Act (the "Tax Act") that was enacted into law in December 2017 and created a rate benefit upon enactment in the fiscal year ended March 31, 2018 due to the Company’s re-measurement of deferred tax items.
Year Ended
March 31, 2018
versus
March 31, 2017
Revenues were $963.4 million for the year ended March 31, 2018, compared with $872.1 million for the year ended March 31, 2017, representing an increase of 10%. For the year ended March 31, 2018, Corporate Finance revenues increased 22%, Financial Restructuring revenues decreased 4%, and Financial Advisory Services revenues increased 8%, compared with the year ended March 31, 2017.
Operating expenses were $748.9 million for the year ended March 31, 2018, compared with $690.1 million for the year ended March 31, 2017, an increase of 9%. Employee compensation and benefits expense, as a component of operating expenses, was $636.6 million for the year ended March 31, 2018, compared with $582.2 million for the year ended March 31, 2017, an increase of 9%. The increase in employee compensation and benefits expense was primarily due to the increase in revenues for the fiscal year. The Compensation Ratio was 66% for the year ended March 31, 2018 and 67% for the year ended March 31, 2017. Non-compensation expenses, as a component of operating expenses, were $112.3 million for the year ended March 31, 2018, compared with $107.9 million for the year ended March 31, 2017, an increase of 4%. The increase in non-compensation expenses was primarily a result of higher general operating expenses. Acquisition-related amortization of intangible assets are a component of non-compensation expenses and were $1.7 million for the year ended March 31, 2018, compared with $3.1 million for the year ended March 31, 2017.
Other (income) expense, net was $(3.4) million for the year ended March 31, 2018, compared with $3.5 million for the year ended March 31, 2017. The increase in other (income) expense, net was primarily a result of (i) gains from our joint venture investments for the year ended March 31, 2018 compared with losses from our joint ventures for the year ended March 31, 2017, (ii) gains from the reduction in earnout liabilities associated with our acquisitions, and (iii) higher interest income generated on higher cash balances.
The provision for income taxes for the year ended March 31, 2018 was $45.6 million, which reflected an effective tax rate of 20.9%. The provision for income taxes for the year ended March 31, 2017 was $70.1 million, which reflected an effective tax rate of 39.3%. The decrease in the effective tax rate was a result of (i) the Tax Act that was enacted into law in December 2017 that resulted in a lower effective federal tax rate; the re-measurement of deferred tax assets and liabilities based on the new tax rate; a one-time deemed repatriation tax on foreign earnings, among other discrete items and (ii) the positive difference between the price of our stock at the time of vesting in October 2017 (accelerated from April/May 2018) and our stock price at the time of grant for the shares that vested.
34
Business Segments
The following table presents revenues, expenses and contributions from our continuing operations by business segment. The revenues by segment represents each segment's revenues, and the profit by segment represents profit for each segment before corporate expenses, other (income) expense, net, and income taxes.
|
|
Year ended March 31,
|
Year-over-Year Change
|
|||||||||||||||
|
($ in thousands)
|
2019
|
2018
|
2017
|
'18-'19
|
'17-'18
|
||||||||||||
|
Revenues by Segment
|
|
|
|||||||||||||||
|
Corporate Finance
|
$
|
607,333
|
|
$
|
528,643
|
|
$
|
434,558
|
|
15
|
%
|
22
|
%
|
||||
|
Financial Restructuring
|
317,774
|
|
294,142
|
|
307,595
|
|
8
|
%
|
(4
|
)%
|
|||||||
|
Financial Advisory Services
|
159,278
|
|
140,579
|
|
129,938
|
|
13
|
%
|
8
|
%
|
|||||||
|
Revenues
|
$
|
1,084,385
|
|
$
|
963,364
|
|
$
|
872,091
|
|
13
|
%
|
10
|
%
|
||||
|
Segment Profit
(1)
|
|
|
|
|
|
|
|||||||||||
|
Corporate Finance
|
$
|
193,603
|
|
$
|
177,575
|
|
$
|
119,739
|
|
9
|
%
|
48
|
%
|
||||
|
Financial Restructuring
|
83,607
|
|
73,691
|
|
92,831
|
|
13
|
%
|
(21
|
)%
|
|||||||
|
Financial Advisory Services
|
28,776
|
|
26,334
|
|
28,905
|
|
9
|
%
|
(9
|
)%
|
|||||||
|
Total Segment Profit
|
305,986
|
|
277,600
|
|
241,475
|
|
10
|
%
|
15
|
%
|
|||||||
|
Corporate Expenses
(2)
|
86,459
|
|
63,154
|
|
59,480
|
|
37
|
%
|
6
|
%
|
|||||||
|
Other (income) expense, net
|
(4,793
|
)
|
(3,390
|
)
|
3,508
|
|
41
|
%
|
(197
|
)%
|
|||||||
|
Income Before Provision for Income Taxes
|
$
|
224,320
|
|
$
|
217,836
|
|
$
|
178,487
|
|
3
|
%
|
22
|
%
|
||||
|
Segment Metrics:
|
|||||||||||||||||
|
Number of Managing Directors
(3)
|
|||||||||||||||||
|
Corporate Finance
|
108
|
|
92
|
|
87
|
|
17
|
%
|
6
|
%
|
|||||||
|
Financial Restructuring
|
44
|
|
42
|
|
43
|
|
5
|
%
|
(2
|
)%
|
|||||||
|
Financial Advisory Services
|
33
|
|
35
|
|
35
|
|
(6
|
)%
|
—
|
%
|
|||||||
|
Number of Closed Transactions/Fee Events
(4)
|
|||||||||||||||||
|
Corporate Finance
|
284
|
|
226
|
|
216
|
|
26
|
%
|
5
|
%
|
|||||||
|
Financial Restructuring
|
81
|
|
76
|
|
75
|
|
7
|
%
|
1
|
%
|
|||||||
|
Financial Advisory Services
|
1,377
|
|
1,339
|
|
1,236
|
|
3
|
%
|
8
|
%
|
|||||||
_______________________
N/M = Not Meaningful
(1) We adjust the compensation expense for a business segment in situations where an employee residing in one business segment is performing work in another business segment where the revenues are accrued. Segment Profit may vary significantly between periods depending on the levels of collaboration among the different segments.
(2) Corporate expenses represent expenses that are not allocated to individual business segments such as Office of the Executives, accounting, information technology, compliance, legal, marketing, human capital management, and human resources.
(3) As of period end.
(4) Fee Events applicable to FAS only; a Fee Event includes any engagement that involves revenue activity during the measurement period with a revenue minimum of $1,000.
Corporate Finance
Year ended
March 31, 2019
versus
March 31, 2018
Revenues for Corporate Finance were
$607.3 million
for the
year ended
March 31, 2019
, compared with
$528.6 million
for the
year ended
March 31, 2018
, representing an
increase
of
15%
. The
increase
in revenues was primarily a result of an increase in the number of transactions that closed during the year compared to the same period last year, coupled with the recognition of reimbursements of out-of-pocket expenses as revenues.
Segment profit for Corporate Finance was
$193.6 million
for the
year ended
March 31, 2019
, compared with
$177.6 million
for the
year ended
March 31, 2018
, representing an
increase
of
9%
. The
increase
in segment profit was a result of the
increase
in revenues and lower compensation expenses as a percentage of revenues.
35
Year Ended
March 31, 2018
versus
March 31, 2017
Revenues for Corporate Finance were $528.6 million for the year ended March 31, 2018, compared with $434.6 million for the year ended March 31, 2017, representing an increase of 22%. The increase in revenues was primarily a result of an increase in the average transaction fee on closed deals for the year ended March 31, 2018, compared with the year ended March 31, 2017.
Segment profit for Corporate Finance was $177.6 million for the year ended March 31, 2018, compared with $119.7 million for the year ended March 31, 2017, representing an increase of 48%. The increase in segment profit was a result of the increase in revenues, and lower compensation and non-compensation expenses as a percentage of revenues.
Financial Restructuring
Year ended
March 31, 2019
versus
March 31, 2018
Revenues for Financial Restructuring were
$317.8 million
for the
year ended
March 31, 2019
, compared with
$294.1 million
for the
year ended
March 31, 2018
, representing an
increase
of
8%
. The
increase
in revenues was primarily driven by higher average transaction fees and an increase in the number of closed transactions for the fiscal year.
Segment profit for Financial Restructuring was
$83.6 million
for the
year ended
March 31, 2019
, compared with
$73.7 million
for the
year ended
March 31, 2018
, an
increase
of
13%
. The
increase
in segment profit was a result of the
increase
in revenues and lower compensation expenses as a percentage of revenues.
Year Ended
March 31, 2018
versus
March 31, 2017
Revenues for Financial Restructuring were $294.1 million for the year ended March 31, 2018, compared with $307.6 million for the year ended March 31, 2017, representing a decrease of 4%. The decrease in revenues was primarily driven by a decline in retainers and monthly fees, partially offset by a slight increase in average fee per closed transaction and the number of closed transactions.
Segment profit for Financial Restructuring was $73.7 million for the year ended March 31, 2018, compared with $92.8 million for the year ended March 31, 2017, a decrease of 21%. The decrease in segment profit was a result of the decrease in revenues, and higher compensation and non-compensation expenses as a percentage of revenues.
Financial Advisory Services
Year ended
March 31, 2019
versus
March 31, 2018
Revenues for Financial Advisory Services were
$159.3 million
for the
year ended
March 31, 2019
, compared with
$140.6 million
for the
year ended
March 31, 2018
, representing an
increase
of
13%
. The
increase
in revenues was primarily a result of strong performance by our dispute resolution consulting, transaction advisory, and tax and financial reporting product lines.
Segment profit for Financial Advisory Services was
$28.8 million
for the
year ended
March 31, 2019
, compared with
$26.3 million
for the
year ended
March 31, 2018
, representing a
increase
of
9%
. The
increase
in segment profit was a result of the increase in revenues and lower compensation expenses as a percentage of revenues.
Year Ended
March 31, 2018
versus
March 31, 2017
Revenues for Financial Advisory Services were $140.6 million for the year ended March 31, 2018, compared with $129.9 million for the year ended March 31, 2017, representing an increase of 8%. The increase in revenues was primarily a result of strong performance by our transaction advisory, portfolio valuation, and technology and intellectual property advisory product lines.
Segment profit for Financial Advisory Services was $26.3 million for the year ended March 31, 2018, compared with $28.9 million for the year ended March 31, 2017, representing a decrease of 9%. The decrease in profitability was primarily a result of higher non-compensation expenses as a percentage of revenues.
36
Corporate Revenues and Expenses
Year ended
March 31, 2019
versus
March 31, 2018
Corporate expenses were
$86.5 million
for the
year ended
March 31, 2019
, compared with
$63.2 million
for the
year ended
March 31, 2018
, representing an
increase
of
37%
. This
increase
was primarily a result of higher employee compensation and benefits expense, coupled with higher non-compensation expenses, when compared with the
year ended
March 31, 2018
. Corporate expenses include expenses that are not allocated to individual business segments such as Office of the Executives, accounting, information technology, compliance and legal, marketing, human capital management, and human resources, including related employee compensation and benefits expense for corporate employees.
Year Ended
March 31, 2018
versus
March 31, 2017
Corporate expenses were $63.2 million for the year ended March 31, 2018, compared with $59.5 million for the year ended March 31, 2017, representing an increase of 6%. This increase was primarily a result of higher employee compensation and benefits expense, offset by a decrease in non-compensation expenses compared with the year ended March 31, 2017.
Liquidity and Capital Resources
Our current assets comprise cash, short term investment securities, receivables from affiliates, income taxes receivable, accounts receivable and unbilled work in process related to fees earned from providing advisory services. Our current liabilities include deferred income, accounts payable and accrued expenses, including accrued employee compensation expenses and current portion of loan obligations.
Our cash and cash equivalents include cash held at banks. We have not experienced any losses in our cash accounts. We maintain moderate levels of cash on hand in support of regulatory requirements for our registered broker-dealer. At
March 31, 2019
, we had
$168.4 million
of cash in foreign subsidiaries. In August 2015, prior to the consummation of the IPO, we paid a dividend to our shareholders and we repaid in full a receivable from ORIX USA. A portion of the dividend was paid to ORIX USA in the form of a
$45.0 million
note (the "ORIX Note") that bore interest at an annual rate of LIBOR plus 165 basis points and was payable quarterly. Beginning on June 30, 2016, the Company began making required quarterly repayments of principal in the amount of $7.5 million, with the remaining principal amount due on the second anniversary of the completion of the IPO. On May 23, 2017, the remaining $15 million of the ORIX Note was repaid with interest and without penalty. Excess cash on hand in our U.K. subsidiary had been generally maintained in a receivable owned by ORIX Global Capital Ltd. (“OGC”), a U.K. subsidiary of ORIX Corporation (the “Cash Management Agreement”). OGC paid interest to us under the Cash Management Agreement at an annual rate of LIBOR plus 165 basis points, calculated and payable monthly. In May 2016, OGC notified the Company that it would no longer be accepting deposits under the agreement and repaid all outstanding amounts. In June 2017, we began investing our excess cash to generate interest income. Our excess cash may be invested from time to time in short term investments, including treasury securities, commercial paper, certificates of deposit and investment grade corporate debt securities. Please refer to Note 6 included in part II, Item 8 of this Form 10-K for further detail.
On November 16, 2015, we issued the loan payable to non-affiliates in connection with the Leonardo transaction, which is a EUR 14.0 million note bearing interest at an annual rate of 1.50% and is payable on November 16, 2040. Under certain circumstances, the note may be paid in part or in whole over a five-year period in equal annual installments. In each of January 2017, December 2017, and December 2018, we paid a portion of this loan in the amount of EUR
2.9 million
. The remaining principal balance of the loan as of
March 31, 2019
was
$6.6 million
, which included foreign currency translation adjustments and unpaid interest.
As of
March 31, 2019
, our unrestricted cash and cash equivalents and investment securities were
$411.0 million
. As of
March 31, 2019
, we had
$0.4 million
in restricted cash. Restricted cash consisted of the letter of credit issued for our Frankfurt office.
Our liquidity is highly dependent upon cash receipts from clients which in turn are generally dependent upon the successful completion of transactions as well as the timing of receivables collections, which typically occur within 60 days of billing. As of
March 31, 2019
, net accounts receivable were
$70.8 million
. As of
March 31, 2019
, unbilled work in process was
$71.9 million
.
Subsequent to the end of fiscal
2019
, our Board of Directors declared a quarterly cash dividend of $0.31 per share of common stock, payable on June 14, 2019 to shareholders of record as of the close of business on June 3, 2019.
37
As of
March 31, 2019
and
March 31, 2018
, our unrestricted cash and cash equivalents including investment securities were as follows:
|
March 31, 2019
|
March 31, 2018
|
||||||
|
Cash and cash equivalents
|
$
|
285,746
|
|
$
|
206,723
|
|
|
|
Investment securities
|
125,258
|
|
209,319
|
|
|||
|
Total unrestricted cash and cash equivalents including investment securities
|
$
|
411,004
|
|
$
|
416,042
|
|
|
As of
March 31, 2019
and
March 31, 2018
, our restricted cash was
$0.4 million
and
$93.5 million
, respectively. The restricted cash at the end of fiscal 2019 represents a deposit in support of a letter of credit issued for our Frankfurt office. The restricted cash at the end of fiscal 2018 represents the proceeds received from the issuance of shares in secondary public offerings and required to be set aside under a contractual agreement with a related party in conjunction with forward purchase obligations. The restricted cash was released when the related forward purchase liability was paid off on April 5, 2018.
Our liquidity is highly dependent upon cash receipts from clients which in turn are generally dependent upon the successful completion of transactions as well as the timing of receivables collections, which typically occur within 60 days of billing. As of
March 31, 2019
and
March 31, 2018
, net accounts receivables were
$70.8 million
and
$77.3 million
, respectively. As of
March 31, 2019
and
March 31, 2018
, unbilled work in process were
$71.9 million
and
$45.9 million
, respectively.
We currently maintain a revolving line of credit pursuant to a loan agreement, dated as of August 18, 2015, by and among Houlihan Lokey, certain domestic subsidiaries of Houlihan Lokey party thereto and Bank of America, N.A., which provides for a revolving line of credit of $75.0 million (the “Revolving Credit Facility”). As of
March 31, 2019
, there were no outstanding borrowings under the Revolving Credit Facility. Borrowings under the Revolving Credit Facility require payments of interest at the annual rate of LIBOR plus 1.00%. The loan agreement requires compliance with certain loan covenants including but not limited to the maintenance of minimum earnings before interest, taxes, depreciation and amortization of no less than $120 million as of the end of any quarterly 12-month period and certain leverage ratios including a consolidated leverage ratio of less than 1.50 to 1.00 and a consolidated fixed charge coverage ratio of greater than 1.25 to 1.00, as of the end of any quarterly 12-month period. As of
March 31, 2019
, we were, and expect to continue to be, in compliance with such covenants. On July 28, 2017, we entered into a First Amendment to Credit Agreement which extended the maturity of the revolving line of credit from August 18, 2017 to August 18, 2019 and did not change any other material terms of the Revolving Credit Facility.
38
Cash Flows
Our operating cash flows are primarily influenced by the amount and timing of receipt of advisory fees and the payment of operating expenses, including payments of incentive compensation to our employees. We pay a significant portion of our incentive compensation during the first and third quarters of each fiscal year. A summary of our operating, investing, and financing cash flows is as follows:
|
Year ended March 31,
|
|||||||||||
|
($ in thousands)
|
2019
|
2018
|
2017
|
||||||||
|
Cash provided by (used in)
|
|||||||||||
|
Operating activities:
|
|||||||||||
|
Net income
|
$
|
159,106
|
|
$
|
172,283
|
|
$
|
108,343
|
|
||
|
Non-cash charges
|
60,918
|
|
48,894
|
|
46,125
|
|
|||||
|
Other operating activities
|
4,250
|
|
29,470
|
|
97,552
|
|
|||||
|
Total operating activities
|
224,274
|
|
250,647
|
|
252,020
|
|
|||||
|
Investing activities
(1)
|
6,459
|
|
(218,584
|
)
|
(1,653
|
)
|
|||||
|
Financing activities
|
(236,138
|
)
|
(225,311
|
)
|
80,168
|
|
|||||
|
Effects of exchange rate changes on cash and cash equivalents
|
(8,703
|
)
|
785
|
|
(4,018
|
)
|
|||||
|
Net increase (decrease) in cash and cash equivalents
|
(14,108
|
)
|
(192,463
|
)
|
326,517
|
|
|||||
|
Cash, cash equivalents, and restricted cash—beginning of year
|
300,223
|
|
492,686
|
|
166,169
|
|
|||||
|
Cash, cash equivalents, and restricted cash—end of year
|
$
|
286,115
|
|
$
|
300,223
|
|
$
|
492,686
|
|
||
_______________________
(1) Includes
$125,258
of investment securities. See note 6 for further details on these investments.
Year ended
March 31, 2019
Operating activities resulted in a
net inflow
of
$224.3 million
for fiscal 2019, which was lower than the prior year due primarily to lower net income for the year. Investing activities resulted in a
net inflow
of
$6.5 million
primarily attributable to sale or maturities of investment securities. Financing activities resulted in a
net outflow
of
$236.1 million
primarily related to (i) dividend distributions, (ii) settlement of forward purchase contracts, and (iii) share repurchases.
Year ended
March 31, 2018
Operating activities resulted in a net inflow of $250.6 million for fiscal 2018, which was higher than the prior year due primarily to increased earnings for the period. Investing activities resulted in a net outflow of $218.6 million primarily attributable to capital expenditures and purchases of investment securities. Financing activities resulted in a net outflow of $225.3 million primarily related to proceeds from the issuance of Class A shares through our public offering, offset by (i) dividend distributions, (ii) settlement of forward purchase contracts, and (iii) payments to settle employee tax obligations on share-based awards.
Year ended
March 31, 2017
Operating activities resulted in a net inflow of $252.0 million for fiscal 2017, which was higher than the prior year due to (i) increased earnings for the period, (ii) higher accruals for bonuses, and (iii) increased accounts payable, accrued expenses, and income taxes payable. Investing activities resulted in a net outflow of $1.7 million primarily attributable to capital expenditures, offset by a decrease in receivables from affiliates. Financing activities resulted in a net inflow of $80.2 million primarily related to proceeds from the issuance of Class A shares through our public offering, offset by (i) dividend distributions, (ii) repayment of loans to affiliates and non-affiliates, and (iii) redemptions of loans payable to former shareholders.
39
Contractual Obligations
The following table summarizes our payment obligations and commitments as of
March 31, 2019
.
|
($ in thousands)
|
Payment Due by Period
|
||||||||||||||||||
|
Total
|
Less than
1 Year
|
1 to 3
Years
|
3 to 5
Years
|
More than 5 Years
|
|||||||||||||||
|
Operating Leases
|
$
|
148,268
|
|
$
|
28,640
|
|
$
|
49,056
|
|
$
|
29,544
|
|
$
|
41,028
|
|
||||
|
Loans payable to former shareholders
|
$
|
2,047
|
|
$
|
654
|
|
$
|
854
|
|
$
|
232
|
|
$
|
307
|
|
||||
|
Loan payable to non-affiliate
(1)
|
$
|
6,610
|
|
$
|
—
|
|
$
|
—
|
|
$
|
—
|
|
$
|
6,610
|
|
||||
|
Other Liabilities
|
$
|
22,532
|
|
$
|
2,515
|
|
$
|
—
|
|
$
|
13,841
|
|
$
|
6,176
|
|
||||
_______________________
(1) Under certain circumstances, the note may be paid in part or in whole over a five year period in equal annual installments.
In connection with certain acquisitions, certain employees may be entitled to deferred consideration, primarily in the form of retention payments, should certain service and/or performance conditions be met in the future. As a result of these conditions, such deferred consideration would be expensed as compensation in current and future periods and has been accrued as liabilities on the Consolidated Balance Sheets as of March 31, 2019.
The following table shows the expected future deferred consideration payable under these agreements assuming the applicable service and/or performance conditions are met:
|
($ in thousands)
|
||||||||
|
Year Ended March 31,
|
Service Condition Only
(1)
|
Performance & Service Condition
(2)
|
||||||
|
2020
|
$
|
4,752
|
|
$
|
5,550
|
|
||
|
2021
|
4,559
|
|
4,491
|
|
||||
|
2022
|
4,559
|
|
2,728
|
|
||||
|
2023
|
760
|
|
455
|
|
||||
|
2024
|
—
|
|
20,400
|
|
||||
|
Total
|
$
|
14,630
|
|
$
|
33,624
|
|
||
_______________________
(1) Assumes full payment of service condition deferred consideration. Payment to any individual is not required if they are not an employee on a certain measurement date in each fiscal year.
(2) Assumes full payment or accrual of performance and service condition deferred consideration. In certain cases, payment to an individual is contingent on the receipt of cash associated with certain assignments that were completed prior to the acquisition, and that individual being employed on the performance measurement date. In certain cases, payment to an individual is contingent on the performance of the acquired company operating within HLI and that individual being employed on the performance measurement date.
Off-Balance Sheet Arrangements
We do not invest in any off-balance sheet vehicles that provide liquidity, capital resources, market or credit risk support, or engage in any activities that expose us to any liability that is not reflected in our consolidated financial statements except for certain stand-by letters of credit and bank guarantees with Bank of America in support of various office leases totaling approximately $0.7 million.
Critical Accounting Policies and Estimates
We believe that the critical accounting policies and practices included below are both most important to the portrayal of the company's financial condition and results, and require management's most difficult, subjective, or complex judgments, often as a result of the need to make estimates about the effects of matters that are inherently uncertain. For a discussion of these and other significant accounting policies and their impact on our consolidated financial statements, see Note 2 included in part II, Item 8 of this Form 10-K.
40
The preparation of consolidated financial statements and related disclosures in conformity with GAAP requires management to make estimates and assumptions that affect the reported amounts of assets and liabilities and disclosure of contingent assets and liabilities at the date of the financial statements, and the reported amounts of revenues and expenses during the reporting period. Actual results may differ from those estimates. Estimates and assumptions are reviewed periodically, and the effects of revisions are reflected in the period for which they are determined to be necessary.
Recognition of Revenue
In May 2014, the Financial Accounting Standards Board (FASB) issued ASU No. 2014-09,
Revenue from Contracts with Customers
, which requires an entity to recognize revenue to depict the transfer of promised goods or services to customers in an amount that reflects the consideration to which the entity expects to be entitled in exchange for those goods or services. The Company adopted the standard effective April 1, 2018 and under the new standard, we recognize revenue from contracts with customers upon satisfaction of our performance obligations by transferring the promised services to the customers. A service is transferred to a customer when the customer obtains control of and derives benefit from that service. Revenue from a performance obligation satisfied over time is recognized by measuring our progress in satisfying the performance obligation in a manner that depicts the transfer of the services to the customer.
Revenues from Corporate Finance engagements primarily consist of fees generated in connection with advisory services related to mergers and acquisitions, capital markets, and other corporate finance transactions. Advisory fees from these engagements are recognized at a point in time when the related transaction has been effectively closed. At this time, the Company has transferred control of the promised service and the customer obtains control. Corporate Finance contracts generally contain a variety of specified services that may be capable of being distinct, but they are not distinct within the context of the contract as the various services are inputs to the combined output of successfully advising on a specific transaction. Effective April 1, 2018, fees received prior to the completion of the transaction including retainers and progress fees are deferred within deferred income in the consolidated balance sheets and not recognized until the performance obligation is satisfied, or when the transaction is deemed by management to be terminated. Management’s judgment is required in determining when a transaction is considered to be terminated.
Revenues from Financial Restructuring engagements primarily consist of fees generated in connection with advisory services to debtors, creditors and other parties-in-interest involving recapitalization or deleveraging transactions implemented both through bankruptcy proceedings and through out-of-court exchanges, consent solicitations or other mechanisms, as well as in distressed mergers and acquisition and capital market activities. Advisory fees from restructuring engagements are recognized over time
using a time elapsed measure of progress
as our clients simultaneously receive and consume the benefits of those services as they are provided.
Revenues from Financial Advisory Services engagements primarily consist of fees generated in connection with valuation services and rendering fairness, solvency and financial opinions. Revenues are recognized at a point in time as these engagements include a singular objective that does not transfer any notable value to the Company’s clients until the reports or opinions have been rendered and delivered to the client. However, certain engagements consist of advisory services where fees are usually based on the hourly rates of our financial professionals. Such revenues are recognized over time as the benefits of these advisory services are transferred to the Company’s clients throughout the course of the engagement and, as a practical expedient, the Company has elected to use the ‘as-invoiced’ approach to recognize revenue.
The Company adopted the new revenue recognition standard using the modified retrospective method that resulted in the Company prospectively changing the presentation of reimbursements of certain out-of-pocket expenses from a net presentation within non-compensation expenses to a gross basis in revenues. See Note 3 included in Part II, Item 8 of this Form 10-K for a more detailed discussion.
41
Operating Expenses
The majority of our operating expenses relates to compensation and benefits for employees, which includes the amortization of the relevant portion of our share-based incentive awards. We account for share-based payments in accordance with Financial Accounting Standards Board ASC 718, "
Compensation—Stock Compensation
". We grant employees awards that vest subject to continued employment in good standing. Employee compensation and benefits expense is accrued if it is probable that the condition will be achieved and is not accrued if it is not probable that the condition will be achieved. The fair value of awards that vest from one to five years are amortized over the vesting period or requisite substantive service period, as required by ASC 718. See Note 10 included in Part II, Item 8 of this Form 10-K for a more detailed discussion.
Other examples of operating expenses include: travel, meals and entertainment; rent; depreciation and amortization; professional fees, which relate primarily to outside legal and consulting fees and employee training costs; information technology and communication costs; and other operating expenses, which include such items as business license and registration fees, non-income-related taxes, and charitable contributions.
Accounts Receivable
The allowance for doubtful accounts on receivables reflects management's best estimate of probable inherent losses determined principally on the basis of historical experience and review of uncollected revenues and is recorded through a provision for bad debts in the accompanying consolidated statements of comprehensive income. Amounts deemed to be uncollectible are written off against the allowance for doubtful accounts.
Provision for Income Taxes
Prior to the IPO, ORIX USA and its subsidiaries, including the Company, filed consolidated federal income tax returns and separate returns in state and local jurisdictions and did so for fiscal year 2016 through the date of the IPO. The Company reported income tax expense as if it filed separate returns in all jurisdictions. Following the IPO, the Company files a consolidated federal income tax return separate from ORIX USA, as well as consolidated and separate returns in state and local jurisdictions, and the Company reports income tax expense on this basis.
Goodwill and Intangible Assets
Goodwill represents an acquired company's acquisition cost over the fair value of acquired net tangible and intangible assets. Goodwill is the net asset representing the future economic benefits arising from other assets acquired in a business combination that are not individually identified and separately recognized. Intangible assets identified and accounted for include trade names and marks, backlog, developed technologies, and customer relationships. Those intangible assets with finite lives, including backlog and customer relationships, are amortized over their estimated useful lives. We have a deferred tax liability in the amount of approximately $52 and $51 million for fiscal 2019 and fiscal 2018, respectively, related to trade names.
During fiscal
2019
,
2018
and
2017
, goodwill was reviewed for impairment in accordance with ASU No. 2011-08,
Testing Goodwill for Impairment
, which permits us to make a qualitative assessment of whether it is more likely than not that one of our reporting unit's fair value is less than its carrying amount before applying the two-step goodwill impairment test. If we conclude that it is not more likely than not that the fair value of the reporting unit is less than its carrying amount, then we would not be required to perform the two-step impairment test for that reporting unit. If the assessment indicates that it is more likely than not that the reporting unit's fair value is less than its carrying value, we must test further for impairment utilizing a two-step process. Step 1 compares the estimated fair value of the reporting unit with its carrying value, including goodwill. If the carrying value of the reporting unit exceeds the estimated fair value, an impairment exists and is measured in Step 2 as the excess of the recorded amount of goodwill over the implied fair value of goodwill resulting from the valuation of the reporting unit. Impairment testing of goodwill requires a significant amount of judgment in assessing qualitative factors and estimating the fair value of the reporting unit, if necessary. The fair value is determined using an estimated market value approach, which considers estimates of future after-tax cash flows, including a terminal value based on market earnings multiples, discounted at an appropriate market rate. During the annual impairment reviews, management concluded that it is not more likely than not that our fair value is less than its carrying amount and no further impairment testing was considered necessary.
42
During fiscal
2019
,
2018
, and
2017
, indefinite-lived intangible assets were reviewed for impairment in accordance with ASU 2012-02,
Testing Indefinite-lived Intangible Assets for Impairment
, which provides us the option to perform a qualitative assessment. If it is more likely than not that the asset is impaired, the amount that the carrying value exceeds the fair value is recorded as an impairment expense. During the annual impairment review of indefinite-lived intangible assets, we determined that it is not more likely than not that the fair values were less than the carrying values.
Intangible assets subject to amortization are reviewed for impairment whenever events or changes in circumstances indicate that the carrying amount of an asset may not be recoverable. If circumstances require a long-lived asset or asset group (inclusive of other long-lived assets) be tested for possible impairment, we first compare undiscounted cash flows expected to be generated by that asset or asset group to its carrying amount. If the carrying amount of the long-lived asset or asset group is not recoverable on an undiscounted cash flow basis, an impairment is recognized to the extent that the carrying amount exceeds its fair value. Fair value is determined through various valuation techniques including discounted cash flow models, quoted market values and third-party independent appraisals, as considered necessary. To date, no events or changes in circumstances were identified that indicated that the carrying amount of the finite-lived intangible assets were not recoverable.
Recent Accounting Developments
For a more detailed discussion of recently issued accounting developments and their impact or potential impact on our consolidated financial statements, see note 2 included in Part II, Item 8 of this Form 10-K.
43
Item 7A.
Quantitative and Qualitative Disclosures about Market Risk
Market Risk and Credit Risk
Our business is not capital intensive and we generally do not issue debt or invest in derivative instruments. As a result, we are not subject to significant market risk (including interest rate risk) or credit risk (except in relation to receivables). We maintain our cash and cash equivalents with financial institutions with high credit ratings. Although these deposits are generally not insured, management believes we are not exposed to significant credit risk due to the financial position of the depository institutions in which those deposits are held.
Our cash and cash equivalents are denominated in U.S. dollars, pound sterling
, euros, Australian dollars, Hong Kong dollars, Chinese yuan, Japanese yen, Singapore dollars and Arab Emirate Dirham and we face foreign currency risk in our cash balances and other assets and liabilities held in accounts outside the United States due to potential currency movements and the associated foreign currency translation accounting requirements.
Risks Related to Cash and Short Term Investments
Our cash is maintained in U.S. and non-U.S. bank accounts. We have exposure to foreign exchange risks through all of our international affiliates. However, we believe our cash is not subject to any material interest rate risk, equity price risk, credit risk or other market risk. Consistent with our past practice, we expect to maintain our cash in bank accounts or highly liquid securities.
Exchange Rate Risk
The exchange rate of the U.S. dollar relative to the currencies in the non-U.S. countries in which we operate may have an effect on the reported value of our non-U.S. dollar denominated or based assets and liabilities and, therefore, be reflected as a change in other comprehensive income. Our non-U.S. assets and liabilities that are sensitive to exchange rates consist primarily of trade payables and receivables, work in progress, and cash. For the years ended
March 31, 2019
,
2018
and
2017
, the net impact of the fluctuation of foreign currencies in other comprehensive income within the consolidated statements of comprehensive income was
$(16.3) million
,
$8.0 million
and
$(7.3) million
, respectively.
In addition, the reported amounts of our revenues and expenses may be affected by movements in the rate of exchange between the currencies in the non-U.S. countries in which we operate and the United States dollar, affecting our operating results. We have analyzed our potential exposure to changes in the value of the U.S. dollar relative to the pound sterling and euro, the primary currencies of our European operations, by performing a sensitivity analysis on our net income, and determined that while our earnings are subject to fluctuations from changes in foreign currency rates, at this time we do not believe we face any material risk in this respect.
From time to time, we enter into transactions to hedge our exposure to certain foreign currency fluctuations through the use of derivative instruments or other methods. As of
March 31, 2019
,
2018
and
2017
, we have foreign currency forward contracts between the euro and pound sterling outstanding with aggregate notional value of approximately EUR
1.5 million
, 9 million, and 5 million. Gains (losses) in relation to the fair value of the foreign currency forward contracts have been included in other operating expenses of
$(1)
,
$90
, and
$58
during the twelve months ended
March 31, 2019
,
2018
, and
2017
, respectively.
In summary, we have been impacted by changes in exchange rates and the potential impact of future currency fluctuation will increase as our international expansion continues. The magnitude of this impact will depend on the timing and volume of revenues and expenses of, and the amounts of assets and liabilities in, our foreign subsidiaries along with the timing of changes in the relative value of the U.S. dollar to the currencies of the non-U.S. countries in which we operate.
Credit Risk
We regularly review our accounts receivable and allowance for doubtful accounts by considering factors such as historical experience, credit quality, age of the accounts receivable and recoverable expense balances, and the current economic conditions that may affect a customer’s ability to pay such amounts owed to us. We maintain an allowance for doubtful accounts that, in our opinion, provides for an adequate reserve to cover losses that may be incurred.
44
Item 8.
Financial Statements and Supplementary Data
HOULIHAN LOKEY, INC. AND SUBSIDIARIES
|
Index to Consolidated Financial Statements
|
Page
|
45
Report of Independent Registered Public Accounting Firm
To the Stockholders and Board of Directors
Houlihan Lokey, Inc.:
Opinion on the Consolidated Financial Statements
We have audited the accompanying consolidated balance sheets of Houlihan Lokey, Inc. and subsidiaries (the Company) as of March 31, 2019 and 2018, the related consolidated statements of comprehensive income, stockholders’ equity, and cash flows for each of the years in the three-year period ended March 31, 2019, and the related notes and financial statement Schedule II - Valuation and Qualifying Accounts (collectively, the consolidated financial statements). In our opinion, the consolidated financial statements present fairly, in all material respects, the financial position of the Company as of March 31, 2019 and 2018, and the results of its operations and its cash flows for each of the years in the three-year period ended March 31, 2019, in conformity with U.S. generally accepted accounting principles.
We also have audited, in accordance with the standards of the Public Company Accounting Oversight Board (United States) (PCAOB), the Company’s internal control over financial reporting as of March 31, 2019, based on criteria established in
Internal Control - Integrated Framework (2013)
issued by the Committee of Sponsoring Organizations of the Treadway Commission, and our report dated May 23, 2019 expressed an unqualified opinion on the effectiveness of the Company’s internal control over financial reporting.
Basis for Opinion
These consolidated financial statements are the responsibility of the Company’s management. Our responsibility is to express an opinion on these consolidated financial statements based on our audits. We are a public accounting firm registered with the PCAOB and are required to be independent with respect to the Company in accordance with the U.S. federal securities laws and the applicable rules and regulations of the Securities and Exchange Commission and the PCAOB.
We conducted our audits in accordance with the standards of the PCAOB. Those standards require that we plan and perform the audit to obtain reasonable assurance about whether the consolidated financial statements are free of material misstatement, whether due to error or fraud. Our audits included performing procedures to assess the risks of material misstatement of the consolidated financial statements, whether due to error or fraud, and performing procedures that respond to those risks. Such procedures included examining, on a test basis, evidence regarding the amounts and disclosures in the consolidated financial statements. Our audits also included evaluating the accounting principles used and significant estimates made by management, as well as evaluating the overall presentation of the consolidated financial statements. We believe that our audits provide a reasonable basis for our opinion.
/s/ KPMG LLP
We have served as the Company’s auditor since 2006.
Los Angeles, California
May 23, 2019
46
Report of Independent Registered Public Accounting Firm
To the Stockholders and Board of Directors
Houlihan Lokey, Inc.:
Opinion on Internal Control Over Financial Reporting
We have audited Houlihan Lokey, Inc.’s and subsidiaries’ (the Company) internal control over financial reporting as of March 31, 2019, based on criteria established in
Internal Control - Integrated Framework (2013)
issued by the Committee of Sponsoring Organizations of the Treadway Commission. In our opinion, the Company maintained, in all material respects, effective internal control over financial reporting as of March 31, 2019, based on criteria established in
Internal Control - Integrated Framework (2013)
issued by the Committee of Sponsoring Organizations of the Treadway Commission.
We also have audited, in accordance with the standards of the Public Company Accounting Oversight Board (United States) (PCAOB), the consolidated balance sheets of the Company as of March 31, 2019 and 2018, the related consolidated statements of comprehensive income, stockholders’ equity, and cash flows for each of the years in the three-year period ended March 31, 2019, and the related notes and financial statement Schedule II - Valuation and Qualifying Accounts (collectively, the consolidated financial statements), and our report dated May 23, 2019 expressed an unqualified opinion on those consolidated financial statements.
Basis for Opinion
The Company’s management is responsible for maintaining effective internal control over financial reporting and for its assessment of the effectiveness of internal control over financial reporting, included in the accompanying Management’s Report on Internal Control Over Financial Reporting. Our responsibility is to express an opinion on the Company’s internal control over financial reporting based on our audit. We are a public accounting firm registered with the PCAOB and are required to be independent with respect to the Company in accordance with the U.S. federal securities laws and the applicable rules and regulations of the Securities and Exchange Commission and the PCAOB.
We conducted our audit in accordance with the standards of the PCAOB. Those standards require that we plan and perform the audit to obtain reasonable assurance about whether effective internal control over financial reporting was maintained in all material respects. Our audit of internal control over financial reporting included obtaining an understanding of internal control over financial reporting, assessing the risk that a material weakness exists, and testing and evaluating the design and operating effectiveness of internal control based on the assessed risk. Our audit also included performing such other procedures as we considered necessary in the circumstances. We believe that our audit provides a reasonable basis for our opinion.
Definition and Limitations of Internal Control Over Financial Reporting
A company’s internal control over financial reporting is a process designed to provide reasonable assurance regarding the reliability of financial reporting and the preparation of financial statements for external purposes in accordance with generally accepted accounting principles. A company’s internal control over financial reporting includes those policies and procedures that (1) pertain to the maintenance of records that, in reasonable detail, accurately and fairly reflect the transactions and dispositions of the assets of the company; (2) provide reasonable assurance that transactions are recorded as necessary to permit preparation of financial statements in accordance with generally accepted accounting principles, and that receipts and expenditures of the company are being made only in accordance with authorizations of management and directors of the company; and (3) provide reasonable assurance regarding prevention or timely detection of unauthorized acquisition, use, or disposition of the company’s assets that could have a material effect on the financial statements.
Because of its inherent limitations, internal control over financial reporting may not prevent or detect misstatements. Also, projections of any evaluation of effectiveness to future periods are subject to the risk that controls may become inadequate because of changes in conditions, or that the degree of compliance with the policies or procedures may deteriorate.
/s/ KPMG LLP
Los Angeles, California
May 23, 2019
47
HOULIHAN LOKEY, INC. AND SUBSIDIARIES
CONSOLIDATED BALANCE SHEETS
($ in thousands, except share data and par value)
|
As of March 31,
|
|||||||
|
2019
|
2018
|
||||||
|
Assets:
|
|||||||
|
Cash and cash equivalents
|
$
|
285,746
|
|
$
|
206,723
|
|
|
|
Restricted cash (note 2)
|
369
|
|
93,500
|
|
|||
|
Investment securities (amortized cost of $124,828 and $209,319 as of March 31, 2019, and March 31, 2018)
|
125,258
|
|
209,319
|
|
|||
|
Accounts receivable, net of allowance for doubtful accounts of $4,255 and $8,844 as of March 31, 2019, and March 31, 2018, respectively
|
70,830
|
|
77,259
|
|
|||
|
Unbilled work in process, net of allowance for doubtful accounts of $1,341 and $2,547 as of March 31, 2019, and March 31, 2018, respectively
|
71,891
|
|
45,862
|
|
|||
|
Receivable from affiliates
|
8,631
|
|
8,732
|
|
|||
|
Property and equipment, net of accumulated depreciation $43,313 and $37,078 as of March 31, 2019, and March 31, 2018, respectively
|
31,034
|
|
32,146
|
|
|||
|
Goodwill and other intangibles, net
|
794,604
|
|
723,310
|
|
|||
|
Other assets
|
34,695
|
|
21,990
|
|
|||
|
Total assets
|
$
|
1,423,058
|
|
$
|
1,418,841
|
|
|
|
Liabilities and Stockholders' Equity
|
|||||||
|
Liabilities:
|
|||||||
|
Accrued salaries and bonuses
|
$
|
404,717
|
|
$
|
377,901
|
|
|
|
Accounts payable and accrued expenses
|
55,048
|
|
40,772
|
|
|||
|
Deferred income
|
27,812
|
|
3,620
|
|
|||
|
Income taxes payable
|
7,759
|
|
9,967
|
|
|||
|
Deferred income taxes
|
5,204
|
|
22,180
|
|
|||
|
Forward purchase liability
|
—
|
|
93,500
|
|
|||
|
Loans payable to former shareholders
|
2,047
|
|
3,036
|
|
|||
|
Loan payable to non-affiliate
|
6,610
|
|
8,825
|
|
|||
|
Other liabilities
|
22,532
|
|
6,227
|
|
|||
|
Total liabilities
|
$
|
531,729
|
|
$
|
566,028
|
|
|
|
Commitments and contingencies (note 16)
|
|
|
|
|
|||
|
Stockholders' equity:
|
|||||||
|
Class A common stock, $0.001 par value. Authorized 1,000,000,000 shares; issued and outstanding 38,200,802 and 30,604,405 shares as of March 31, 2019, and March 31, 2018, respectively
|
38
|
|
31
|
|
|||
|
Class B common stock, $0.001 par value. Authorized 1,000,000,000 shares; issued and outstanding 27,197,734 and 37,187,932 shares as of March 31, 2019, and March 31, 2018, respectively
|
27
|
|
37
|
|
|||
|
Treasury stock, at cost; 0 and 2,000,000 shares as of March 31, 2019, and March 31, 2018, respectively
|
—
|
|
(93,500
|
)
|
|||
|
Additional paid-in capital
|
645,090
|
|
753,077
|
|
|||
|
Retained earnings
|
276,468
|
|
207,124
|
|
|||
|
Accumulated other comprehensive loss
|
(30,294
|
)
|
(13,956
|
)
|
|||
|
Total stockholders' equity
|
891,329
|
|
852,813
|
|
|||
|
Total liabilities and stockholders' equity
|
$
|
1,423,058
|
|
$
|
1,418,841
|
|
|
See accompanying notes to consolidated financial statements.
48
HOULIHAN LOKEY, INC. AND SUBSIDIARIES
CONSOLIDATED STATEMENTS OF COMPREHENSIVE INCOME
($ in thousands, except per share data)
|
Year Ended March 31,
|
|||||||||||
|
2019
|
2018
|
2017
|
|||||||||
|
Revenues
(1)
|
$
|
1,084,385
|
|
$
|
963,364
|
|
$
|
872,091
|
|
||
|
Operating expenses:
|
|||||||||||
|
Employee compensation and benefits
|
692,073
|
|
636,631
|
|
582,244
|
|
|||||
|
Travel, meals, and entertainment
|
42,862
|
|
26,445
|
|
21,707
|
|
|||||
|
Rent
|
38,672
|
|
28,560
|
|
27,094
|
|
|||||
|
Depreciation and amortization
|
14,475
|
|
7,905
|
|
8,853
|
|
|||||
|
Information technology and communications
|
21,512
|
|
18,481
|
|
17,628
|
|
|||||
|
Professional fees
(2)
|
23,035
|
|
17,117
|
|
13,073
|
|
|||||
|
Other operating expenses, net
(3)
|
32,229
|
|
13,779
|
|
19,497
|
|
|||||
|
Total operating expenses
|
864,858
|
|
748,918
|
|
690,096
|
|
|||||
|
Operating income
|
219,527
|
|
214,446
|
|
181,995
|
|
|||||
|
Other (income) expenses, net
(4)
|
(4,793
|
)
|
(3,390
|
)
|
3,508
|
|
|||||
|
Income before provision for income taxes
|
224,320
|
|
217,836
|
|
178,487
|
|
|||||
|
Provision for income taxes
|
65,214
|
|
45,553
|
|
70,144
|
|
|||||
|
Net income
|
159,106
|
|
172,283
|
|
108,343
|
|
|||||
|
Other comprehensive income, net of tax:
|
|||||||||||
|
Foreign currency translation adjustments
|
(16,338
|
)
|
7,961
|
|
(7,304
|
)
|
|||||
|
Comprehensive income
|
$
|
142,768
|
|
$
|
180,244
|
|
$
|
101,039
|
|
||
|
|
|||||||||||
|
Attributable to Houlihan Lokey, Inc. common stockholders:
|
|||||||||||
|
Weighted average shares of common stock outstanding:
|
|||||||||||
|
Basic
|
62,213,414
|
|
62,494,275
|
|
61,100,497
|
|
|||||
|
Fully Diluted
|
65,846,132
|
|
66,324,093
|
|
66,579,130
|
|
|||||
|
Net income per share of common stock (note 13)
|
|||||||||||
|
Basic
|
$
|
2.56
|
|
$
|
2.76
|
|
$
|
1.77
|
|
||
|
Fully Diluted
|
$
|
2.42
|
|
$
|
2.60
|
|
$
|
1.63
|
|
||
|
1.
|
including related party revenue of
$8,819
,
$3,006
, and
$7,504
during the
years ended
March 31, 2019
,
2018
, and
2017
respectively.
|
|
2.
|
including related party professional fees of
$0
,
$0
, and
$269
during the
years ended
March 31, 2019
,
2018
, and
2017
respectively.
|
|
3.
|
including related party income of
$482
,
$286
, and
$461
during the
years ended
March 31, 2019
,
2018
, and
2017
respectively; and including realized foreign currency translation gain of
$671
,
$5,123
, and
$309
during the
years ended
March 31, 2019
,
2018
, and
2017
respectively.
|
|
4.
|
including related party interest income of
$96
,
$110
, and
$33
during the
years ended
March 31, 2019
,
2018
, and
2017
, respectively, and related party interest expense of
$0
,
$62
, and
$806
during
years ended
March 31, 2019
,
2018
, and
2017
, respectively. The Company recognized (gain) loss related to investments in unconsolidated entities of
$(609)
,
$(3,210)
, and
$3,839
during
years ended
March 31, 2019
,
2018
, and
2017
, respectively.
|
See accompanying notes to consolidated financial statements.
49
HOULIHAN LOKEY, INC. AND SUBSIDIARIES
CONSOLIDATED STATEMENTS OF CHANGES IN STOCKHOLDERS' EQUITY
Years ended
March 31, 2019
,
2018
and
2017
($ in thousands)
|
Class A - shares
|
Class B - shares
|
Treasury Stock
|
|||||||||||||||||||||||||||||||||||
|
Shares
|
$
|
Shares
|
$
|
Shares
|
$
|
Additional paid-in capital
|
Retained earnings
|
Accumulated other comprehensive income (loss)
|
Stock subscriptions receivable
|
Total stockholders' equity
|
|||||||||||||||||||||||||||
|
Balances - April 1, 2016
|
12,084,524
|
|
$
|
12
|
|
53,219,303
|
|
$
|
53
|
|
—
|
|
—
|
|
637,332
|
|
28,623
|
|
(14,613
|
)
|
(247
|
)
|
$
|
651,160
|
|
||||||||||||
|
Shares issued
|
—
|
|
—
|
|
1,858,864
|
|
2
|
|
—
|
|
—
|
|
5,152
|
|
0
|
|
—
|
|
—
|
|
5,154
|
|
|||||||||||||||
|
Stock compensation vesting (note 13)
|
—
|
|
—
|
|
—
|
|
—
|
|
—
|
|
—
|
|
39,357
|
|
0
|
|
—
|
|
—
|
|
39,357
|
|
|||||||||||||||
|
Share redemptions (note 14)
|
—
|
|
—
|
|
(71,913
|
)
|
—
|
|
—
|
|
—
|
|
(330
|
)
|
0
|
|
—
|
|
—
|
|
(330
|
)
|
|||||||||||||||
|
Dividends
|
—
|
|
—
|
|
—
|
|
—
|
|
—
|
|
—
|
|
—
|
|
(47,883
|
)
|
—
|
|
—
|
|
(47,883
|
)
|
|||||||||||||||
|
Stock subscriptions receivable redeemed
|
—
|
|
—
|
|
—
|
|
—
|
|
—
|
|
—
|
|
—
|
|
0
|
|
—
|
|
123
|
|
123
|
|
|||||||||||||||
|
Secondary offering
|
9,200,000
|
|
9
|
|
(9,200,000
|
)
|
(9
|
)
|
—
|
|
—
|
|
193,572
|
|
—
|
|
—
|
|
—
|
|
193,572
|
|
|||||||||||||||
|
Shares subject to forward purchase agreement
|
—
|
|
—
|
|
6,900,000
|
|
7
|
|
(6,900,000
|
)
|
(193,572
|
)
|
(7
|
)
|
—
|
|
—
|
|
—
|
|
(193,572
|
)
|
|||||||||||||||
|
Conversion of Class B to Class A shares
|
733,150
|
|
1
|
|
(733,150
|
)
|
(1
|
)
|
—
|
|
—
|
|
—
|
|
—
|
|
—
|
|
—
|
|
—
|
|
|||||||||||||||
|
Shares issued to non-employee directors
|
9,137
|
|
—
|
|
—
|
|
—
|
|
—
|
|
—
|
|
—
|
|
—
|
|
—
|
|
—
|
|
—
|
|
|||||||||||||||
|
Shares repurchased/forfeited
|
—
|
|
—
|
|
(1,089,805
|
)
|
(1
|
)
|
—
|
|
—
|
|
(27,308
|
)
|
—
|
|
—
|
|
—
|
|
(27,309
|
)
|
|||||||||||||||
|
Excess tax benefits
|
—
|
|
—
|
|
—
|
|
—
|
|
—
|
|
—
|
|
6,982
|
|
—
|
|
—
|
|
—
|
|
6,982
|
|
|||||||||||||||
|
Adjustment of noncontrolling interest to redeemable value
|
—
|
|
—
|
|
—
|
|
—
|
|
—
|
|
—
|
|
—
|
|
(1,676
|
)
|
—
|
|
—
|
|
(1,676
|
)
|
|||||||||||||||
|
Net income
|
—
|
|
—
|
|
—
|
|
—
|
|
—
|
|
—
|
|
—
|
|
108,343
|
|
—
|
|
—
|
|
108,343
|
|
|||||||||||||||
|
Change in unrealized translation
|
—
|
|
—
|
|
—
|
|
—
|
|
—
|
|
—
|
|
—
|
|
—
|
|
(7,304
|
)
|
—
|
|
(7,304
|
)
|
|||||||||||||||
|
Total comprehensive income
|
—
|
|
—
|
|
—
|
|
—
|
|
—
|
|
—
|
|
—
|
|
108,343
|
|
(7,304
|
)
|
—
|
|
101,039
|
|
|||||||||||||||
|
Balances - March 31, 2017
|
22,026,811
|
|
$
|
22
|
|
50,883,299
|
|
$
|
51
|
|
(6,900,000
|
)
|
$
|
(193,572
|
)
|
$
|
854,750
|
|
$
|
87,407
|
|
$
|
(21,917
|
)
|
$
|
(124
|
)
|
$
|
726,617
|
|
|||||||
See accompanying notes to consolidated financial statements.
50
HOULIHAN LOKEY, INC. AND SUBSIDIARIES
CONSOLIDATED STATEMENTS OF CHANGES IN STOCKHOLDERS' EQUITY
Years ended
March 31, 2019
,
2018
and
2017
($ in thousands)
|
Class A - shares
|
Class B - shares
|
Treasury Stock
|
|||||||||||||||||||||||||||||||||||
|
Shares
|
$
|
Shares
|
$
|
Shares
|
$
|
Additional paid-in capital
|
Retained earnings
|
Accumulated other comprehensive income (loss)
|
Stock subscriptions receivable
|
Total stockholders' equity
|
|||||||||||||||||||||||||||
|
Balances - April 1, 2017
|
22,026,811
|
|
$
|
22
|
|
50,883,299
|
|
$
|
51
|
|
(6,900,000
|
)
|
(193,572
|
)
|
$
|
854,750
|
|
$
|
87,407
|
|
$
|
(21,917
|
)
|
$
|
(124
|
)
|
$
|
726,617
|
|
||||||||
|
Shares issued
|
—
|
|
—
|
|
1,331,370
|
|
1
|
|
—
|
|
—
|
|
7,984
|
|
—
|
|
—
|
|
—
|
|
7,985
|
|
|||||||||||||||
|
Stock compensation vesting (note 13)
|
—
|
|
—
|
|
—
|
|
—
|
|
—
|
|
—
|
|
41,900
|
|
—
|
|
—
|
|
—
|
|
41,900
|
|
|||||||||||||||
|
Dividends
|
—
|
|
—
|
|
—
|
|
—
|
|
—
|
|
—
|
|
—
|
|
(51,305
|
)
|
—
|
|
—
|
|
(51,305
|
)
|
|||||||||||||||
|
Stock subscriptions receivable redeemed
|
—
|
|
—
|
|
—
|
|
—
|
|
—
|
|
—
|
|
—
|
|
—
|
|
—
|
|
124
|
|
124
|
|
|||||||||||||||
|
Secondary offering
|
7,750,000
|
|
8
|
|
(7,750,000
|
)
|
(8
|
)
|
—
|
|
—
|
|
93,500
|
|
—
|
|
—
|
|
—
|
|
93,500
|
|
|||||||||||||||
|
Retirement of shares upon settlement of forward purchase agreement
|
—
|
|
—
|
|
(6,900,000
|
)
|
(7
|
)
|
6,900,000
|
|
193,572
|
|
(193,565
|
)
|
—
|
|
—
|
|
—
|
|
—
|
|
|||||||||||||||
|
Shares subject to forward purchase agreement
|
—
|
|
—
|
|
2,000,000
|
|
2
|
|
(2,000,000
|
)
|
(93,500
|
)
|
(2
|
)
|
—
|
|
—
|
|
—
|
|
(93,500
|
)
|
|||||||||||||||
|
Conversion of Class B to Class A shares
|
1,252,242
|
|
1
|
|
(1,252,242
|
)
|
(1
|
)
|
—
|
|
—
|
|
—
|
|
—
|
|
—
|
|
—
|
|
—
|
|
|||||||||||||||
|
Shares issued to non-employee directors
|
5,589
|
|
—
|
|
—
|
|
—
|
|
—
|
|
—
|
|
—
|
|
—
|
|
—
|
|
—
|
|
—
|
|
|||||||||||||||
|
Shares purchased and retired under repurchase program
|
(430,237
|
)
|
—
|
|
—
|
|
—
|
|
—
|
|
—
|
|
(15,139
|
)
|
—
|
|
—
|
|
—
|
|
(15,139
|
)
|
|||||||||||||||
|
Other shares repurchased/forfeited
|
—
|
|
—
|
|
(1,124,495
|
)
|
(1
|
)
|
—
|
|
—
|
|
(36,351
|
)
|
—
|
|
—
|
|
—
|
|
(36,352
|
)
|
|||||||||||||||
|
Adjustment of noncontrolling interest to redeemable value
|
—
|
|
—
|
|
—
|
|
—
|
|
—
|
|
—
|
|
—
|
|
(1,261
|
)
|
—
|
|
—
|
|
(1,261
|
)
|
|||||||||||||||
|
Net income
|
—
|
|
—
|
|
—
|
|
—
|
|
—
|
|
—
|
|
—
|
|
172,283
|
|
—
|
|
—
|
|
172,283
|
|
|||||||||||||||
|
Change in unrealized translation
|
—
|
|
—
|
|
—
|
|
—
|
|
—
|
|
—
|
|
—
|
|
—
|
|
7,961
|
|
—
|
|
7,961
|
|
|||||||||||||||
|
Total comprehensive income
|
—
|
|
—
|
|
—
|
|
—
|
|
—
|
|
—
|
|
—
|
|
172,283
|
|
7,961
|
|
—
|
|
180,244
|
|
|||||||||||||||
|
Balances - March 31, 2018
|
30,604,405
|
|
$
|
31
|
|
37,187,932
|
|
$
|
37
|
|
(2,000,000
|
)
|
$
|
(93,500
|
)
|
$
|
753,077
|
|
$
|
207,124
|
|
$
|
(13,956
|
)
|
$
|
—
|
|
$
|
852,813
|
|
|||||||
See accompanying notes to consolidated financial statements.
51
HOULIHAN LOKEY, INC. AND SUBSIDIARIES
CONSOLIDATED STATEMENTS OF CHANGES IN STOCKHOLDERS' EQUITY
Years ended
March 31, 2019
,
2018
and
2017
($ in thousands)
|
Class A - shares
|
Class B - shares
|
Treasury Stock
|
|||||||||||||||||||||||||||||||||||
|
Shares
|
$
|
Shares
|
$
|
Shares
|
$
|
Additional paid-in capital
|
Retained earnings
|
Accumulated other comprehensive income (loss)
|
Stock subscriptions receivable
|
Total stockholders' equity
|
|||||||||||||||||||||||||||
|
Balances - April 1, 2018
|
30,604,405
|
|
$
|
31
|
|
37,187,932
|
|
$
|
37
|
|
(2,000,000
|
)
|
$
|
(93,500
|
)
|
$
|
753,077
|
|
$
|
207,124
|
|
$
|
(13,956
|
)
|
$
|
—
|
|
$
|
852,813
|
|
|||||||
|
Cumulative effect of the change in accounting principle related to revenue recognition from contracts with clients, net of tax
|
—
|
|
—
|
|
—
|
|
—
|
|
—
|
|
—
|
|
—
|
|
(19,347
|
)
|
—
|
|
—
|
|
(19,347
|
)
|
|||||||||||||||
|
Shares issued
|
—
|
|
—
|
|
1,208,074
|
|
1
|
|
—
|
|
—
|
|
9,257
|
|
—
|
|
—
|
|
—
|
|
9,258
|
|
|||||||||||||||
|
Stock compensation vesting (note 14)
|
—
|
|
—
|
|
—
|
|
—
|
|
—
|
|
—
|
|
47,575
|
|
—
|
|
—
|
|
—
|
|
47,575
|
|
|||||||||||||||
|
Class B shares sold
|
525,217
|
|
—
|
|
(525,217
|
)
|
—
|
|
—
|
|
—
|
|
—
|
|
—
|
|
—
|
|
—
|
|
—
|
|
|||||||||||||||
|
Dividends
|
—
|
|
—
|
|
—
|
|
—
|
|
—
|
|
—
|
|
—
|
|
(70,415
|
)
|
—
|
|
—
|
|
(70,415
|
)
|
|||||||||||||||
|
Secondary offering
|
3,000,000
|
|
3
|
|
(3,000,000
|
)
|
(3
|
)
|
—
|
|
—
|
|
—
|
|
—
|
|
—
|
|
—
|
|
—
|
|
|||||||||||||||
|
Retired shares upon settlement of forward purchase agreement
|
—
|
|
—
|
|
(2,000,000
|
)
|
(2
|
)
|
2,000,000
|
|
93,500
|
|
(93,498
|
)
|
—
|
|
—
|
|
—
|
|
—
|
|
|||||||||||||||
|
Conversion of Class B to Class A shares
|
5,545,724
|
|
6
|
|
(5,545,724
|
)
|
(6
|
)
|
—
|
|
—
|
|
—
|
|
—
|
|
—
|
|
—
|
|
—
|
|
|||||||||||||||
|
Shares issued to non-employee directors (note 14)
|
6,570
|
|
—
|
|
—
|
|
—
|
|
—
|
|
—
|
|
187
|
|
—
|
|
—
|
|
—
|
|
187
|
|
|||||||||||||||
|
Shares purchased and retired under repurchase program
|
(784,114
|
)
|
(1
|
)
|
—
|
|
—
|
|
—
|
|
—
|
|
(34,974
|
)
|
—
|
|
—
|
|
—
|
|
(34,975
|
)
|
|||||||||||||||
|
Other shares repurchased/forfeited
|
(697,000
|
)
|
(1
|
)
|
(127,331
|
)
|
—
|
|
—
|
|
—
|
|
(36,534
|
)
|
—
|
|
—
|
|
—
|
|
(36,535
|
)
|
|||||||||||||||
|
Net income
|
—
|
|
—
|
|
—
|
|
—
|
|
—
|
|
—
|
|
—
|
|
159,106
|
|
—
|
|
—
|
|
159,106
|
|
|||||||||||||||
|
Change in unrealized translation
|
—
|
|
—
|
|
—
|
|
—
|
|
—
|
|
—
|
|
—
|
|
—
|
|
(16,338
|
)
|
—
|
|
(16,338
|
)
|
|||||||||||||||
|
Total comprehensive income
|
—
|
|
—
|
|
—
|
|
—
|
|
—
|
|
—
|
|
—
|
|
159,106
|
|
(16,338
|
)
|
—
|
|
142,768
|
|
|||||||||||||||
|
Balances - March 31, 2019
|
38,200,802
|
|
$
|
38
|
|
27,197,734
|
|
$
|
27
|
|
—
|
|
$
|
—
|
|
$
|
645,090
|
|
$
|
276,468
|
|
$
|
(30,294
|
)
|
$
|
—
|
|
$
|
891,329
|
|
|||||||
See accompanying notes to consolidated financial statements.
52
HOULIHAN LOKEY, INC. AND SUBSIDIARIES
CONSOLIDATED STATEMENTS OF CASH FLOWS
($ in thousands)
|
Year Ended March 31,
|
|||||||||||
|
2019
|
2018
|
2017
|
|||||||||
|
Cash flows from operating activities:
|
|||||||||||
|
Net income
|
$
|
159,106
|
|
$
|
172,283
|
|
$
|
108,343
|
|
||
|
Adjustments to reconcile net income to net cash provided by operating activities:
|
|||||||||||
|
Deferred tax benefit
|
(10,687
|
)
|
(6,569
|
)
|
(6,093
|
)
|
|||||
|
Provision for bad debts
|
1,707
|
|
1,983
|
|
4,008
|
|
|||||
|
Unrealized gains on investment securities
|
(430
|
)
|
—
|
|
—
|
|
|||||
|
Depreciation and amortization
|
14,475
|
|
7,905
|
|
8,853
|
|
|||||
|
Contingent consideration valuation
|
(708
|
)
|
(1,536
|
)
|
—
|
|
|||||
|
Compensation expense – restricted share grants (note 14)
|
56,561
|
|
47,111
|
|
39,357
|
|
|||||
|
Changes in operating assets and liabilities:
|
|||||||||||
|
Accounts receivable
|
21,611
|
|
(18,202
|
)
|
(5,527
|
)
|
|||||
|
Unbilled work in process
|
(26,029
|
)
|
11,875
|
|
(6,382
|
)
|
|||||
|
Other assets
|
(12,706
|
)
|
(1,703
|
)
|
3,745
|
|
|||||
|
Accrued salaries and bonuses
|
18,868
|
|
34,556
|
|
82,046
|
|
|||||
|
Accounts payable and accrued expenses
|
11,542
|
|
392
|
|
13,499
|
|
|||||
|
Deferred income
|
(6,661
|
)
|
(31
|
)
|
(1,970
|
)
|
|||||
|
Income taxes receivable/payable
|
(2,375
|
)
|
2,583
|
|
12,141
|
|
|||||
|
Net cash provided by operating activities
|
224,274
|
|
250,647
|
|
252,020
|
|
|||||
|
Cash flows from investing activities:
|
|||||||||||
|
Purchases of investment securities
|
(146,969
|
)
|
(209,319
|
)
|
—
|
|
|||||
|
Sales or maturities of investment securities
|
231,460
|
|
—
|
|
—
|
|
|||||
|
Acquisition of business, net of cash acquired
|
(71,407
|
)
|
(2,701
|
)
|
(3,725
|
)
|
|||||
|
Receivables from affiliates
|
101
|
|
1,155
|
|
16,495
|
|
|||||
|
Purchase of property and equipment, net
|
(6,726
|
)
|
(7,719
|
)
|
(14,423
|
)
|
|||||
|
Net cash provided by (used in) investing activities
|
6,459
|
|
(218,584
|
)
|
(1,653
|
)
|
|||||
|
Cash flows from financing activities:
|
|||||||||||
|
Dividends paid
|
(66,928
|
)
|
(52,081
|
)
|
(55,293
|
)
|
|||||
|
Settlement of forward purchase contract
|
(93,500
|
)
|
(192,372
|
)
|
—
|
|
|||||
|
Shares retired under stock repurchase program
|
(34,975
|
)
|
(15,139
|
)
|
—
|
|
|||||
|
Other share repurchases
|
(34,588
|
)
|
(2,936
|
)
|
—
|
|
|||||
|
Payments to settle employee tax obligations on share-based awards
|
(1,947
|
)
|
(33,419
|
)
|
(22,756
|
)
|
|||||
|
Proceeds from issuance of Class A shares placed in escrow
|
—
|
|
93,500
|
|
193,565
|
|
|||||
|
Earnouts paid
|
(1,923
|
)
|
—
|
|
(964
|
)
|
|||||
|
Stock subscriptions receivable redeemed
|
—
|
|
124
|
|
123
|
|
|||||
|
Loans payable to former shareholders redeemed
|
(989
|
)
|
(2,446
|
)
|
(11,256
|
)
|
|||||
|
Repayments of loans to affiliates
|
—
|
|
(15,000
|
)
|
(30,000
|
)
|
|||||
|
Borrowings from non-affiliates
|
—
|
|
—
|
|
65,000
|
|
|||||
|
Repayments of loans to non-affiliates
|
(1,475
|
)
|
(1,661
|
)
|
(65,000
|
)
|
|||||
|
Excess tax benefits
|
—
|
|
—
|
|
6,982
|
|
|||||
|
Other financing activities
|
187
|
|
(3,881
|
)
|
(233
|
)
|
|||||
|
Net cash (used in) provided by financing activities
|
(236,138
|
)
|
(225,311
|
)
|
80,168
|
|
|||||
|
Effects of exchange rate changes on cash and cash equivalents
|
(8,703
|
)
|
785
|
|
(4,018
|
)
|
|||||
|
(Decrease) increase in cash, cash equivalents, and restricted cash
|
(14,108
|
)
|
(192,463
|
)
|
326,517
|
|
|||||
|
Cash, cash equivalents, and restricted cash – beginning of period
|
300,223
|
|
492,686
|
|
166,169
|
|
|||||
|
Cash, cash equivalents, and restricted cash – end of period
|
$
|
286,115
|
|
$
|
300,223
|
|
$
|
492,686
|
|
||
|
Supplemental disclosures of noncash activities:
|
|
||||||||||
|
Shares issued via vesting of liability classified awards
|
$
|
5,005
|
|
$
|
—
|
|
$
|
4,754
|
|
||
|
Shares issued as consideration for acquisitions
|
1,744
|
|
7,797
|
|
457
|
|
|||||
|
Debt forgiven as consideration of acquisitions
|
—
|
|
1,894
|
|
—
|
|
|||||
|
Fully depreciated assets written off
|
—
|
|
38
|
|
829
|
|
|||||
|
Cash acquired through acquisitions
|
$
|
16,141
|
|
$
|
—
|
|
$
|
—
|
|
||
|
Cash paid during the year:
|
|||||||||||
|
Interest
|
$
|
977
|
|
$
|
656
|
|
$
|
1,621
|
|
||
|
Taxes
|
82,464
|
|
47,629
|
|
57,286
|
|
|||||
See accompanying notes to consolidated financial statements.
53
HOULIHAN LOKEY, INC. AND SUBSIDIARIES
Notes to Consolidated Financial Statements
(All tables and balance disclosures are in thousands, except share data or otherwise stated)
(1) BACKGROUND
Houlihan Lokey, Inc. ("Houlihan Lokey," or "HL, Inc." also referred to as the "Company," "we," "our," or "us") is a Delaware corporation that controls the following primary subsidiaries:
|
•
|
Houlihan Lokey Capital, Inc., a California corporation ("HL Capital, Inc."), a wholly owned direct subsidiary of HL, Inc., is registered as a broker-dealer under Section 15(b) of the Securities Exchange Act of 1934 and a member of the Financial Industry Regulatory Authority, Inc.
|
|
•
|
Houlihan Lokey Financial Advisors, Inc., a California corporation ("HL FA, Inc."), is a wholly owned direct subsidiary of HL, Inc.
|
|
•
|
Houlihan Lokey EMEA, LLP, a limited liability partnership registered in England ("HL EMEA, LLP"), is an indirect subsidiary of HL, Inc. HL EMEA, LLP is regulated by the Financial Conduct Authority in the United Kingdom ("U.K.").
|
On August 18, 2015, the Company successfully completed an initial public offering ("IPO") of its Class A common stock.
Prior to a corporate reorganization that was consummated immediately prior to the closing of the IPO, the Company was incorporated in California as Houlihan Lokey, Inc., a California corporation ("HL CA"), and was a wholly owned indirect subsidiary of Fram Holdings, Inc., a Delaware corporation ("Fram"), which, in turn, was a majority owned subsidiary of ORIX Corporation USA (formerly ORIX USA Corporation), a Delaware corporation ("ORIX USA"), with the remaining minority interest being held by Company employees ("HL Holders"). ORIX USA and the HL Holders held their interests in HL CA indirectly through their ownership of Fram. On July 24, 2015, HL CA merged with and into HL, Inc., with HL, Inc. as the surviving entity. In connection with the IPO, the HL Holders deposited their shares of HL, Inc. Class B common stock into a voting trust (the "HL Voting Trust") and own such common stock through the HL Voting Trust. Houlihan Lokey separated from Fram and as a result, HL, Inc. common stock is held directly by ORIX USA (through ORIX HLHZ Holding, LLC, its wholly owned subsidiary), the HL Voting Trust, for the benefit of the HL Holders, non-employee directors, and public shareholders.
In addition, prior to the consummation of the IPO, the Company distributed to its existing owners a dividend of
$270.0 million
, consisting of (i) a short-term note in the aggregate amount of
$197.2 million
, which was repaid immediately after the consummation of the IPO, and was allocated
$94.5 million
to ORIX USA and
$102.7 million
to the HL Holders, (ii) a note to ORIX USA in the amount of
$45.0 million
(see note 10), and (iii) certain of our non-operating assets to certain of the HL Holders (consisting of non-marketable minority equity interests in
four
separate businesses that ranged in carrying value from
$2.5 million
to
$11.0 million
, and were valued in the aggregate at approximately
$22.8 million
as of June 30, 2015), together with
$5.0 million
in cash to be used to complete a potential additional investment and in the administration of these assets in the future. All issued and outstanding Fram shares were converted to HL, Inc. common stock at a ratio of
10.425
shares for each share of Fram stock. Immediately following the IPO, there were
two
classes of authorized HL, Inc. common stock: Class A common stock and Class B common stock. The rights of the holders of Class A common stock and Class B common stock are identical, except with respect to voting and conversion rights. Each share of Class A common stock is entitled to
one
vote per share, and each share of Class B common stock is entitled to
ten
votes per share. Each share of Class B common stock may be converted into
one
share of Class A common stock at the option of its holder and will be automatically converted into
one
share of Class A common stock upon transfer thereof, subject to certain exceptions. As of
March 31, 2019
, there were
34,036,141
Class A shares held by the public,
54,940
Class A shares held by non-employee directors, and
4,109,721
Class A shares held by ORIX USA. In addition, there were
24,929,520
Class B shares held by the HL Voting Trust, and
2,268,214
Class B shares held by ORIX USA.
The Company did not receive any proceeds from the sale of its Class A common stock in the IPO.
Expenses related to the corporate reorganization and IPO recorded in the consolidated statements of comprehensive income include the following:
|
•
|
$14,045
,
$14,153
and
$14,330
of compensation expenses associated with the amortization of restricted stock granted in connection with the IPO for the
years ended
March 31, 2019
,
2018
, and
2017
, respectively; amortization expense of restricted stock granted in connection with the IPO is being recognized over a
four
and one-half year vesting period; and
|
54
HOULIHAN LOKEY, INC. AND SUBSIDIARIES
Notes to Consolidated Financial Statements
(All tables and balance disclosures are in thousands, except share data or otherwise stated)
|
•
|
$10,273
,
$10,764
and
$11,873
of compensation expenses associated with the accrual of certain deferred cash payments granted in connection with the IPO for the
years ended
March 31, 2019
,
2018
, and
2017
, respectively; accrual expense of deferred cash payments granted in connection with the IPO is being recognized over a four and one-half year vesting period.
|
On February 14, 2017, pursuant to a registered underwritten public offering, we issued and sold
6,000,000
shares of our Class A common stock and certain of our former and current employees and members of our management (the “Selling Stockholders”) sold
2,000,000
shares of our Class A common stock, in each case, at a price to the public of
$29.25
per share (the “February 2017 Follow-on Offering”). On March 15, 2017, we issued and sold an additional
900,000
shares of Class A common stock and the Selling Stockholders sold an additional
300,000
shares of Class A common stock in connection with the underwriters’ exercise in full of their option to purchase additional shares in the February 2017 Follow-on Offering.
In connection with, and prior to, the February 2017 Follow-on Offering, on February 6, 2017, we entered into a Forward Share Purchase Agreement (the "February 2017 Forward Share Purchase Agreement"), with an indirect wholly owned subsidiary of ORIX USA pursuant to which we agreed to repurchase from ORIX USA on April 5, 2017 the number of shares of our Class B common stock equal to the number of shares of our Class A common stock sold by us in the February 2017 Follow-on Offering (including any shares sold upon the exercise by the underwriters of their option to purchase additional shares of our Class A common stock) for a purchase price per share equal to the public offering price in the February 2017 Follow-on Offering less underwriting discounts and commissions. The cash proceeds from the February 2017 Follow-on Offering that were used to consummate the purchase pursuant to the February 2017 Forward Share Purchase Agreement were held in an escrow account as of March 31, 2017 and presented as restricted cash as discussed in note 2. On April 5, 2017 we settled the transaction provided for in the February 2017 Forward Share Purchase Agreement and acquired
6,900,000
shares of Class B common stock from ORIX USA using the net proceeds we received from the February 2017 Follow-on Offering. In accordance with the terms of the February 2017 Forward Share Purchase Agreement, the purchase price per share was reduced by the per share amount of the dividend paid to ORIX USA on the shares of our Class B common stock subject to the February 2017 Forward Share Purchase Agreement prior to the settlement of such transaction. As the February 2017 Forward Share Purchase Agreement required physical settlement by purchase of a fixed number of shares in exchange for cash, the
6,900,000
shares that were purchased are excluded from the Company's calculation of basic and diluted earnings per share in the Company's financial statements for the year ended March 31, 2017. In addition, as the agreement provides for the refund of any dividends paid during the term on the underlying Class A common stock, such shares are not classified as participating securities and the Company does not apply the two-class method for calculating its earnings per share.
On October 25, 2017, pursuant to a registered underwritten public offering, ORIX USA sold
1,750,000
shares of our Class A common stock and certain of our former and current employees and members of our management sold
1,750,000
shares of our Class A common stock, in each case, at a price to the public of
$42.00
per share, and such transaction closed on October 30, 2017 (the "October 2017 Follow-on Offering"). On November 3, 2017, ORIX USA sold an additional
125,000
shares of Class A common stock and our former and current employees and members of our management sold an additional
125,000
shares of Class A common stock in connection with the underwriters’ partial exercise of their option to purchase additional shares in the offering.
On March 12, 2018, pursuant to a registered underwritten public offering, we issued and sold
2,000,000
shares of our Class A common stock and certain of our former and current employees and members of our management sold
2,000,000
shares of our Class A common stock, in each case, at a price to the public of
$47.25
per share (the “March 2018 Follow-on Offering”).
55
HOULIHAN LOKEY, INC. AND SUBSIDIARIES
Notes to Consolidated Financial Statements
(All tables and balance disclosures are in thousands, except share data or otherwise stated)
In connection with, and prior to, the March 2018 Follow-on Offering, on January 26, 2018, we entered into a Forward Share Purchase Agreement (the "January 2018 Forward Share Purchase Agreement"), with an indirect wholly owned subsidiary of ORIX USA pursuant to which we agreed to purchase from ORIX USA on April 5, 2018 the number of shares of our Class B common stock equal to the number of shares of our Class A common stock sold by us in the March 2018 Follow-on Offering for a purchase price per share equal to the public offering price in the March 2018 Follow-on Offering less underwriting discounts and commissions. The cash proceeds from the March 2018 Follow-on Offering that were used to consummate the purchase pursuant to the January 2018 Forward Share Purchase Agreement were held in an escrow account as of March 31, 2018 and presented as restricted cash as discussed in note 2. On April 5, 2018 we settled the transaction provided for in the January 2018 Forward Share Purchase Agreement and acquired
2,000,000
shares of Class B common stock from ORIX USA using the net proceeds we received from the March 2018 Follow-on Offering. In January 2018 and April 2017 Forward Share Purchase Agreement required physical settlement by purchase of a fixed number of shares in exchange for cash, the
2,000,000
and
6,900,000
shares that were purchased are excluded from the Company's calculation of basic and diluted earnings per share in the Company's financial statements for the years ended March 31, 2018 and 2017. In addition, as the agreement provided for the refund of any dividends paid during the term on the underlying Class A common stock, such shares were not classified as participating securities and the Company does not apply the two-class method for calculating its earnings per share.
Expenses related to the February 2017 Follow-on Offering and the February 2017 Forward Share Purchase Agreement included in the consolidated statements of comprehensive income include
$1,633
of professional service and other third-party fees and expenses during the year ended March 31, 2017.
Expenses related to the October 2017 Follow-on Offering and the March 2018 Follow-on Offering and the January 2018 Forward Share Purchase Agreement included in the consolidated statements of comprehensive income include
$2,084
of professional service and other third-party fees and expenses during the year ended March 31,
2018
.
In April 2018, the Company completed the acquisition of Quayle Munro Limited, an independent advisory firm that provides corporate finance advisory services to companies underpinned by data & analytics, content, software, and services.
In May 2018, the Company completed the acquisition of BearTooth Advisors, an independent advisory business providing strategic advisory and placement agency services to alternative investment managers.
On June 4, 2018, pursuant to a registered underwritten public offering, ORIX USA sold
1,985,983
shares of our Class A common stock and certain of our former and current employees and members of our management sold
1,014,017
shares, in each case, at a price to the public of
$49.15
per share (the "June 2018 Follow-on Offering"). Concurrently with the closing of the offering, the Company repurchased from ORIX USA
697,000
shares of Class A common stock at a price per share of
$49.11
.
Expenses related to the June 2018 Follow-on Offering included in the consolidated statements of comprehensive income include
$498
of professional service and other third-party fees and expenses during the year ended
March 31, 2019
.
The Company offers financial services and financial advice to a broad clientele located throughout the United States of America, Europe, the Middle East, and the Asia-Pacific region. The Company has U.S. offices in Los Angeles, San Francisco, Chicago, New York City, Minneapolis, McLean (Virginia), Dallas, Houston, Miami, and Atlanta as well as foreign offices in London, Paris, Frankfurt, Madrid, Amsterdam, Dubai, Sydney, Tokyo, Hong Kong, Beijing and Singapore. Together, the Company and its subsidiaries form an organization that provides financial services to meet a wide variety of client needs. The Company concentrates its efforts toward the earning of professional fees with focused services across the following
three
business segments:
|
•
|
Corporate Finance provides general financial advisory services in addition to advice on mergers and acquisitions and capital markets offerings. We advise public and private institutions on a wide variety of situations, including buy-side and sell-side transactions, as well as leveraged loans, private mezzanine debt, high-yield debt, initial public offerings, follow-ons, convertibles, equity private placements, private equity, and liability management transactions, and advise financial sponsors on all types of transactions. The majority of our Corporate Finance revenues consists of fees paid upon the successful completion of the transaction or engagement ("Completion Fees"). A Corporate Finance transaction can fail to be completed for many reasons that are outside of our control. In these instances, our fees are generally limited to the fees paid at the time an engagement letter is signed ("Retainer Fees") and in some cases fees paid during the course of the engagement ("Progress Fees") that may have been received.
|
56
HOULIHAN LOKEY, INC. AND SUBSIDIARIES
Notes to Consolidated Financial Statements
(All tables and balance disclosures are in thousands, except share data or otherwise stated)
|
•
|
Financial Restructuring provides advice to debtors, creditors and other parties-in-interest in connection with recapitalization/deleveraging transactions implemented both through bankruptcy proceedings and through out-of-court exchanges, consent solicitations or other mechanisms, as well as in distressed mergers and acquisitions and capital markets activities. Our Financial Restructuring business segment offers a wide range of advisory services to our clients, including: the structuring, negotiation, and confirmation of plans of reorganization; structuring and analysis of exchange offers; corporate viability assessment; litigation support and expert testimony; and procuring debtor-in-possession financing. Although atypical, a Financial Restructuring transaction can fail to be completed for many reasons that are outside of our control. In these instances, our fees are generally limited to the initial Retainer Fees and/or Progress Fees.
|
|
•
|
Financial Advisory Services primarily provides valuations of various assets, including: companies; illiquid debt and equity securities; and intellectual property (among other assets and liabilities). These valuations are used for financial reporting, tax reporting, and other purposes. In addition, our Financial Advisory Services business segment renders fairness opinions in connection with mergers and acquisitions and other transactions, and solvency opinions in connection with corporate spin-offs and dividend recapitalizations, and other types of financial opinions. Also, our Financial Advisory Services business segment provides dispute resolution consulting services to clients where fees are usually based on the hourly rates of our financial professionals. Unlike our Corporate Finance or Financial Restructuring segments, the fees generated in our Financial Advisory Services segment are generally not contingent on the successful completion of a transaction.
|
(2) SUMMARY OF SIGNIFICANT ACCOUNTING POLICIES
|
(a)
|
Basis of Presentation
|
The accompanying consolidated financial statements have been prepared in accordance with accounting principles generally accepted in the United States ("GAAP") and pursuant to the rules and regulations of the United States Securities and Exchange Commission (the "SEC") and include all information and footnotes required for financial statement presentation, and include all disclosures required under GAAP for annual financial statements.
|
(b)
|
Principles of Consolidation
|
The consolidated financial statements include the accounts of the Company and its subsidiaries where it has a controlling financial interest. All significant intercompany balances and transactions have been eliminated in consolidation.
The Company carries its investments in unconsolidated entities over which it has significant influence but does not control using the equity method, and includes its ownership share of the income and losses in other (income) expense, net in the consolidated statements of comprehensive income.
|
(c)
|
Use of Estimates
|
The preparation of the consolidated financial statements in conformity with GAAP requires management to make estimates and assumptions that affect the reported amounts of assets and liabilities at the date of the consolidated financial statements. Management estimates and assumptions also affect the reported amounts of revenues and expenses during the reporting period, and disclosure of contingent assets and liabilities at the reporting date. These estimates and assumptions are based on management’s best estimates and judgment. Management evaluates its estimates and assumptions on an ongoing basis using historical experience and other factors, including the current economic environment, which management believes to be reasonable under the circumstances. Management adjusts such estimates and assumptions when facts and circumstances dictate. As future events and their effects cannot be determined with precision, actual results could differ significantly from these estimates. Items subject to such estimates and assumptions include: the allowance for doubtful accounts; the valuation of deferred tax assets, goodwill, accrued expenses, and share based compensation; the allocation of goodwill and other assets across the reporting units (segments); and reserves for income tax uncertainties and other contingencies.
|
(d)
|
Recognition of Revenue
|
Revenues consist of fee revenues from advisory services and reimbursed costs incurred in fulfilling the contract. Revenues reflect revenues from our Corporate Finance (“CF”), Financial Restructuring (“FR”), and Financial Advisory Services (“FAS”) business segments.
57
HOULIHAN LOKEY, INC. AND SUBSIDIARIES
Notes to Consolidated Financial Statements
(All tables and balance disclosures are in thousands, except share data or otherwise stated)
Revenues for all
three
business segments are recognized upon satisfaction of the performance obligation and may be satisfied over time or at a point in time. The amount and timing of the fees paid vary by the type of engagement.
In May 2014, the Financial Accounting Standards Board (FASB) issued Accounting Standards Update ("ASU") No. 2014-09,
Revenue from Contracts with Customers
, which requires an entity to recognize revenue to depict the transfer of promised goods or services to customers in an amount that reflects the consideration to which the entity expects to be entitled in exchange for those goods or services. The Company adopted the standard effective April 1, 2018 and under the new standard, we recognize revenue from contracts with customers upon satisfaction of our performance obligations by transferring the promised services to the customers. A service is transferred to a customer when the customer obtains control of and derives benefit from that service. Revenue from a performance obligation satisfied over time is recognized by measuring our progress in satisfying the performance obligation in a manner that depicts the transfer of the services to the customer.
The amount of revenue recognized reflects the consideration we expect to be entitled to in exchange for those promised services (i.e., the “transaction price”). In determining the transaction price, we consider multiple factors, including the effects of variable consideration. Variable consideration is included in the transaction price only to the extent it is probable that a significant reversal in the amount of cumulative revenue recognized will not occur when the uncertainties with respect to the amount are resolved. In determining when to include variable consideration in the transaction price, we consider the range of possible outcomes, the predictive value of our past experiences, the time period of when uncertainties expect to be resolved and the amount of consideration that is susceptible to factors outside of our influence, such as market volatility or the judgment and actions of third parties. The substantial majority of the Company’s advisory fees (i.e., the success related Completion Fees) are considered variable and constrained as they are contingent upon a future event which includes factors outside of our control (e.g., completion of a transaction or third party emergence from bankruptcy or approval by the court).
Revenues from Corporate Finance engagements primarily consist of fees generated in connection with advisory services related to mergers and acquisitions, capital markets, and other corporate finance transactions. Completion Fees from these engagements are recognized at a point in time when the related transaction has been effectively closed. At that time, the Company has transferred control of the promised service and the customer obtains control. Corporate Finance contracts generally contain a variety of promised services that may be capable of being distinct, but they are not distinct within the context of the contract as the various services are inputs to the combined output of successfully brokering a specific transaction. Effective April 1, 2018, fees received prior to the completion of the transaction, including Retainer Fees and Progress Fees, are deferred within deferred income in the consolidated balance sheets and not recognized until the performance obligation is satisfied, or when the transaction is deemed by management to be terminated. Management’s judgment is required in determining when a transaction is considered to be terminated. Prior to April 1, 2018, these various fees were generally recognized on a monthly basis, except in situations where there was uncertainty as to the timing of collection of the amount due. Progress Fees were recognized based on management’s estimates of the relative proportion of services provided through the financial reporting date to the total services required to be performed.
Revenues from Financial Restructuring engagements primarily consist of fees generated in connection with advisory services to debtors, creditors and other parties-in-interest involving recapitalization or deleveraging transactions implemented both through bankruptcy proceedings and through out-of-court exchanges, consent solicitations or other mechanisms, as well as in distressed mergers and acquisitions and capital markets activities. Retainer Fees and Progress Fees from restructuring engagements are recognized over time
using a time elapsed measure of progress
as our clients simultaneously receive and consume the benefits of those services as they are provided. Completion Fees from these engagements are recognized at a point in time when the related transaction has been effectively closed. At that time, the Company has transferred control of the promised service and the customer obtains control.
Revenues from Financial Advisory Services engagements primarily consist of fees generated in connection with valuation services and rendering fairness, solvency and financial opinions. Revenues are recognized at a point in time as these engagements include a singular objective that does not transfer any notable value to the Company’s clients until the opinions have been rendered and delivered to the client. However, certain engagements consists of advisory services where fees are usually based on the hourly rates of our financial professionals. Such revenues are recognized over time as the benefits of these advisory services are transferred to the Company’s clients throughout the course of the engagement and as a practical expedient, the Company has elected to use the ‘as-invoiced’ approach to recognize revenue.
Taxes, including value added taxes, collected from customers and remitted to governmental authorities are accounted for on a net basis, and therefore, are excluded from revenue in the consolidated statements of comprehensive income.
58
HOULIHAN LOKEY, INC. AND SUBSIDIARIES
Notes to Consolidated Financial Statements
(All tables and balance disclosures are in thousands, except share data or otherwise stated)
|
(e)
|
Operating Expenses
|
The majority of the Company’s operating expenses are related to compensation for employees, which includes the amortization of the relevant portion of the Company’s share-based incentive plans (note 14). Other examples of operating expenses include: travel, meals and entertainment; rent; depreciation and amortization; information technology and communication; professional fees and other operating expenses, which include such items as office expenses, business license and registration fees, non-income-related taxes, legal expenses, related-party support services, and charitable contributions.
|
(f)
|
Translation of Foreign Currency Transactions
|
The reporting currency for the consolidated financial statements of the Company is the U.S. dollar. The assets and liabilities of subsidiaries whose functional currency is other than the U.S. dollar are included in the consolidation by translating the assets and liabilities at the reporting period-end exchange rates; however, revenues and expenses are translated using the applicable exchange rates determined on a monthly basis throughout the year. Resulting translation adjustments are reported as a separate component of accumulated other comprehensive loss, net of applicable taxes.
From time to time, we enter into transactions to hedge our exposure to certain foreign currency fluctuations through the use of derivative instruments or other methods. As of
March 31, 2019
,
2018
, and
2017
, we entered into a foreign currency forward contract between the euro and pound sterling with an aggregate notional value of approximately EUR
1.5 million
,
9 million
, and
5 million
. The fair value representing a (loss) gain included in other operating expenses of
$(1)
,
$90
, and
$58
during the twelve months ended
March 31, 2019
,
2018
, and
2017
, respectively.
|
(g)
|
Property and Equipment
|
Property and equipment are stated at cost. Repair and maintenance charges are expensed as incurred and costs of renewals or improvements are capitalized at cost.
Depreciation on furniture and office equipment is provided on a straight-line basis over the estimated useful lives of the respective assets. Leasehold improvements are depreciated over the lesser of the lease term or estimated useful life.
|
(h)
|
Cash and Cash Equivalents and Restricted Cash
|
Cash and cash equivalents include cash held at banks and highly liquid investments with original maturities of three months or less. At
March 31, 2019
and
2018
, the Company had cash balances with banks in excess of insured limits. The Company has not experienced any losses in its cash accounts and believes it is not exposed to any significant credit risk with respect to cash and cash equivalents.
In November 2016, the FASB issued ASU No. 2016-18, Statement of Cash Flows: Restricted Cash. The amendments in this ASU require restricted cash and restricted cash equivalents to be included with the cash and cash equivalents balances when reconciling the beginning-of-period and end-of-period amounts shown on the statements of cash flows. ASU 2016-18 is effective for interim and annual reporting periods beginning after December 15, 2017 (fiscal year ending March 31, 2019 for the Company) with early adoption permitted. In April 2018, the Company adopted ASU No. 2016-18 and it did not have a material impact on the Company's operating results and financial position.
The following table provides a reconciliation of cash, cash equivalents, and restricted cash reported within the consolidated balance sheets that sum to the total of the same such amounts shown in the consolidated statements of cash flows.
|
March 31, 2019
|
March 31, 2018
|
||||||
|
Cash and cash equivalents
|
$
|
285,746
|
|
$
|
206,723
|
|
|
|
Restricted cash
|
369
|
|
93,500
|
|
|||
|
Total cash, cash equivalents, and restricted cash
|
$
|
286,115
|
|
$
|
300,223
|
|
|
Restricted cash as of March 31, 2018 consisted of cash received from the issuance of shares in the March 2018 Follow-on Offering, which is required to be set aside pursuant to the January 2018 Forward Share Purchase Agreement (notes 1 and 3). The restriction lapsed when the related forward purchase liability was paid off. Restricted cash as of March 31, 2019 consisted of a letter of credit issued for our Frankfurt office.
59
HOULIHAN LOKEY, INC. AND SUBSIDIARIES
Notes to Consolidated Financial Statements
(All tables and balance disclosures are in thousands, except share data or otherwise stated)
|
(i)
|
Investment Securities
|
Investment securities consist of corporate debt, U.S. Treasury, and certificates of deposit with original maturities over 90 days. As of December 31, 2018, the Company has reclassified its investment securities from held-to-maturity to trading as it may sell them with the intent to recognize short-term gains or losses and records them at fair market value. As of the date of transfer, the amortized cost of the investment securities was
$40,944
and net unrealized gain of
$16
was included in other operating expense, net in the accompanying consolidated statements of comprehensive income.
|
(j)
|
Accounts Receivable
|
The allowance for doubtful accounts on receivables reflects management’s best estimate of probable inherent losses determined principally on the basis of historical experience and review of uncollected revenues and is recorded through provision for bad debts which is included in other operating expenses, net in the accompanying consolidated statements of comprehensive income. Amounts deemed to be uncollectible are written off against the allowance for doubtful accounts.
|
(k)
|
Income Taxes
|
Prior to the IPO, ORIX USA and its subsidiaries, including the Company, filed consolidated federal income tax returns and separate returns in state and local jurisdictions and did so for fiscal year 2016 through the date of the IPO. The Company reported income tax expense as if it filed separate returns in all jurisdictions. Following the IPO, the Company files a consolidated federal income tax return separate from ORIX USA, as well as consolidated and separate returns in state and local jurisdictions, and the Company reports income tax expense on this basis.
We account for income taxes in accordance with ASC Topic 740, Income Taxes, which requires the recognition of tax benefits or expenses on temporary differences between the financial reporting and tax basis of our assets and liabilities. Deferred tax assets and liabilities are recognized for future tax consequences attributable to differences between the financial reporting basis and the tax basis of the Company’s assets and liabilities. The measurement of the deferred items is based on enacted tax laws and applicable tax rates. A valuation allowance related to a deferred tax asset is recorded if it is more likely than not that some portion or all of the deferred tax asset will not be realized.
The Company utilized a comprehensive model to recognize, measure, present, and disclose in its financial statements any uncertain tax positions that have been taken or are expected to be taken on a tax return. The impact of an uncertain tax position that is more likely than not of being sustained upon audit by the relevant taxing authority must be recognized at the largest amount that is more likely than not to be sustained. No portion of an uncertain tax position will be recognized if the position has less than a 50% likelihood of being sustained. Interest expense and penalties related to income taxes are included in the provision for income taxes in the accompanying consolidated statements of comprehensive income.
Recently enacted U.S. tax legislation, the Tax Cuts and Jobs Act, was signed into law on December 22, 2017 (the "Tax Act"). On the same day, the SEC staff issued Staff Accounting Bulletin No. 118 (“SAB 118”), which provides guidance on accounting for the tax effects of the Tax Act. SAB 118 provides a measurement period that should not extend beyond one year from the Tax Act enactment date for companies to complete the accounting under ASC 740. In accordance with SAB 118, a company must reflect the income tax effects of those aspects of the Tax Act for which the accounting under ASC 740 is complete. To the extent that a company’s accounting for certain income tax effects of the Tax Act is incomplete but it is able to determine a reasonable estimate, it must record a provisional estimate in the financial statements. If a company cannot determine a provisional estimate to be included in the financial statements, it should continue to apply ASC 740 on the basis of the provisions of the tax laws that were in effect immediately before the enactment of the Tax Act.
In accordance with SAB 118, the Company made estimates and recorded provisional amounts for the Tax Act during the year ended March 31, 2018, including re-measurement of deferred tax assets and liabilities as well as the one-time deemed repatriation transition tax (the “Toll Charge”) on certain un-repatriated earnings of non-U.S. subsidiaries. As of the quarter ended December 31, 2018, the Company finalized the provisional estimates made under SAB 118. In particular, we revised the provisional estimate made for the Toll Charge obligation and recognized additional tax expense of
$1,313
resulting in an insignificant impact to the effective tax rate. The Company included these adjustments within income tax expense from continuing operations. No material adjustments were made in the quarter ended March 31, 2019.
60
HOULIHAN LOKEY, INC. AND SUBSIDIARIES
Notes to Consolidated Financial Statements
(All tables and balance disclosures are in thousands, except share data or otherwise stated)
The Global Intangible Low-Taxed Income tax (“GILTI inclusion”) can be recognized in the financial statements through an accounting policy election by either recording a period cost (permanent item) or providing deferred income taxes stemming from certain basis differences that are expected to result in GILTI inclusion. The Company has elected to account for the tax impacts of the GILTI inclusion as a period cost. The Company’s estimated tax impact as a result of the Tax Act was based upon the information and guidance available as of March 31, 2019.
|
(l)
|
Goodwill and Intangible Assets
|
Goodwill represents an acquired company’s acquisition cost over the fair value of acquired net tangible and intangible assets. Goodwill is the net asset representing the future economic benefits arising from other assets acquired in a business combination that are not individually identified and separately recognized. Intangible assets identified and accounted for include tradenames and marks, backlog, developed technologies, and customer relationships. Those intangible assets with finite lives, including backlog and customer relationships, are amortized over their estimated useful lives.
When HL CA was acquired by Fram in January 2006, approximately
$392,600
of goodwill and
$192,210
of indefinite-lived intangible assets were generated and recognized. In accordance with ASC Topic 805, Business Combinations, since HL CA was wholly owned by Fram, this goodwill and all other purchase accounting-related adjustments were pushed down to the Company’s reporting level. Through both foreign and domestic acquisitions made directly by HL CA and the Company since 2006, additional goodwill of approximately
$202,212
, inclusive of foreign currency translations has been recognized.
Goodwill is reviewed annually for impairment and more frequently if potential impairment indicators exist. Goodwill is reviewed for impairment in accordance with ASU No. 2011-08, Testing Goodwill for Impairment, and amended by ASU 2017-04, Simplifying the Test for Goodwill Impairment which permits management to make a qualitative assessment as to whether one of its reporting unit’s fair value is less than its carrying amount. An impairment charge would be recognized for the amount by which the carrying amount exceeds the reporting unit’s fair value. Impairment testing of goodwill requires a significant amount of judgment in assessing qualitative factors and estimating the fair value of the reporting unit, if necessary. The fair value is determined using an estimated market value approach, which considers estimates of future after tax cash flows, including a terminal value based on market earnings multiples, discounted at an appropriate market rate. As of
March 31, 2019
,
2018
, and
2017
, management concluded that it was not more likely than not that the Company’s reporting units’ fair value was less than their carrying amount and no further impairment testing had been considered necessary.
Indefinite-lived intangible assets are reviewed annually for impairment in accordance with ASU 2012-02, Testing Indefinite-lived Intangible Assets for Impairment, which provides management the option to perform a qualitative assessment. If it is more likely than not that the asset is impaired, the amount that the carrying value exceeds the fair value is recorded as an impairment expense. As of
March 31, 2019
,
2018
, and
2017
, management concluded that it was not more likely than not that the fair values were less than the carrying values.
Intangible assets subject to amortization are reviewed for impairment whenever events or changes in circumstances indicate that the carrying amount of an asset may not be recoverable. If circumstances require a long-lived asset or asset group (inclusive of other long-lived assets) be tested for possible impairment, management first compares undiscounted cash flows expected to be generated by that asset or asset group to its carrying amount. If the carrying amount of the long-lived asset or asset group is not recoverable on an undiscounted cash flow basis, an impairment is recognized to the extent that the carrying amount exceeds its fair value. Fair value is determined through various valuation techniques including discounted cash flow models, quoted market values and third-party independent appraisals, as considered necessary. As of
March 31, 2019
,
2018
, and
2017
, no events or changes in circumstances were identified that indicated that the carrying amount of the finite-lived intangible assets were not recoverable.
61
HOULIHAN LOKEY, INC. AND SUBSIDIARIES
Notes to Consolidated Financial Statements
(All tables and balance disclosures are in thousands, except share data or otherwise stated)
|
(m)
|
Recent Accounting Pronouncements
|
In May 2014, the FASB issued ASU No. 2014-09, Revenue from Contracts with Customers, which requires an entity to recognize revenue to depict the transfer of promised goods or services to customers in an amount that reflects the consideration to which the entity expects to be entitled in exchange for those goods or services. An entity should also disclose sufficient quantitative and qualitative information to enable users of financial statements to understand the nature, amount, timing, and uncertainty of revenue and cash flows arising from contracts with customers. In August 2015, the FASB issued ASU No. 2015-14, Revenue from Contracts with Customers, Deferral of Effective Date which deferred the effective date of the new standard to annual and interim periods within that reporting period beginning after December 15, 2017 (fiscal year ending March 31, 2019 for the Company). The Company adopted the standard effective April 1, 2018 using the modified retrospective method which requires the recognition of a cumulative-effect adjustment as of that date. Results for periods beginning after March 31, 2018 are presented under the new revenue and cost recognition guidance, while prior period amounts were not restated and continue to be reported in accordance with the Company's previous revenue and cost recognition policies. The Company applied the new standard to contracts that have not yet been completed as of the adoption date. The Company’s adoption efforts included the identification of revenue within the scope of the standard and the evaluation of revenue contracts.
Upon adoption, the Company recorded a cumulative effect adjustment that resulted in a reduction in retained earnings of
$19.3 million
, a reduction in deferred tax liabilities of
$6.9 million
and an increase to deferred income of
$26.2 million
. This cumulative adjustment was related to certain engagements for which revenue was being recognized over time prior to adoption which are now recognized point-in-time under the new standard. See notes 2(d) and 3 for further information.
In February 2016, the FASB issued ASU No. 2016-02, Leases. The amendments in this ASU requires lessees to recognize right-of-use assets and lease liabilities in the consolidated balance sheets for all leases with terms longer than 12 months. For leases with a term of 12 months or less, a lessee is permitted to make an accounting policy election by class of underlying asset not to recognize a right-of-use asset and lease liability. Additionally, when measuring assets and liabilities arising from a lease, optional payments should be included only if the lessee is reasonably certain to exercise an option to extend the lease, exercise a purchase option, or not exercise an option to terminate the lease. In addition, this ASU requires expanded disclosures about the nature and terms of lease agreements. ASU 2016-02 is effective for interim and annual reporting periods beginning after December 15, 2018 (year ending March 31, 2020 for the Company). The Company adopted this ASU in April 2019 under a modified retrospective approach. The impact of adopting this ASU is expected to result in right of use asset and lease liability of approximately
$150
million on the Company's consolidated statements of financial condition as of April 1, 2019. See note 16 for a summary of our undiscounted minimum rental commitments under operating leases as of
March 31, 2019
.
In August 2016, the FASB issued ASU No. 2016-15, Statement of Cash Flows: Classification of Certain Cash Receipts and Cash Payments. The amendments in this ASU address the classification of certain cash receipts and cash payments in the statement of cash flows as well as the presentation and disclosure of restricted cash. ASU 2016-15 is effective for interim and annual reporting periods beginning after December 15, 2017 (fiscal year ending March 31, 2019 for the Company). The Company adopted guidance effective April 1, 2018 and its application did not result in changes to any classification in the consolidated statements of cash flows, and did not have a material impact on our consolidated financial position or results of operations.
In November 2016, the FASB issued ASU No. 2016-18, Restricted cash. The amendments in this ASU address the classification and presentation of changes in restricted cash and restricted cash equivalents in the statement of cash flows. Under the new guidance, an entity should include the amounts generally described as restricted cash and restricted cash equivalents with cash and cash equivalents when reconciling the beginning-of-period and end-of period total amounts shows on the statement of cash flows. The Company adopted guidance effective April 1, 2018 and its application did not result in changes to the classification and presentation of changes in restricted cash and restricted cash equivalents in the consolidated statements of cash flows, and did not have a material impact on our consolidated financial position or results of operations.
62
HOULIHAN LOKEY, INC. AND SUBSIDIARIES
Notes to Consolidated Financial Statements
(All tables and balance disclosures are in thousands, except share data or otherwise stated)
In January 2017, the FASB issued ASU No. 2017-04, Intangible - Goodwill and Other: Simplifying the Test for Goodwill Impairment. The amendments in this ASU do not change the guidance on Step 1 of the goodwill impairment test but eliminates the requirement to calculate an implied goodwill value using Step 2. An entity should recognize an impairment charge for the amount by which the carrying amount exceeds the reporting unit’s fair value but should not exceed the total amount of goodwill allocated to that reporting unit. Also, an entity still has the option to perform the qualitative assessment for a reporting unit to determine if the quantitative impairment test is necessary. ASU No. 2017-04 is effective for interim and annual reporting periods beginning after December 15, 2019 (fiscal year ending March 31, 2021 for the Company) with early adoption permitted. The Company adopted guidance effective April 1, 2018 and its application did not have a material impact on the consolidated financial statements and related disclosures.
In January 2017, the FASB issued ASU 2017-01, Business Combinations (Topic 805): Clarifying the Definition of a Business. The clarified guidance provides a more defined framework to use in determining when a set of assets and activities constitute a business. The clarified definition was effective for the Company on April 1, 2018 and was applied on a prospective basis. Application of this guidance did not have an effect on the consolidated financial statements and related disclosures.
In May 2017, the FASB issued ASU 2017-09, Compensation—Stock Compensation (Topic 718): Scope of Modification Accounting, which clarifies when changes to the terms or conditions of share-based payment awards require an entity to apply modification accounting. The amended guidance states an entity should account for the effects of a modification unless certain criteria are met which include that the modified award has the same fair value, vesting conditions and classification as the original award. The guidance is first effective for our fiscal year beginning April 1, 2019 on a prospective basis; however, early adoption is permitted. Given that this guidance applies to specific transactions and would only become relevant in certain circumstances, we are unable to estimate the impact, if any, this new guidance may have on our financial position.
(3) REVENUE RECOGNITION
The Company adopted the new revenue recognition standard effective April 1, 2018, which requires an entity to recognize revenue to depict the transfer of promised goods or services to customers in an amount that reflects the consideration to which the entity expects to be entitled in exchange for those goods or services. The Company is using the modified retrospective method that results in the Company prospectively changing the presentation of reimbursements of certain out-of-pocket expenses from a net presentation within non-compensation expenses to a gross basis in revenues. This resulted in an increase in both revenues and related out-of-pocket expenses of approximately
$33.6 million
for the
year ended
March 31, 2019
.
63
HOULIHAN LOKEY, INC. AND SUBSIDIARIES
Notes to Consolidated Financial Statements
(All tables and balance disclosures are in thousands, except share data or otherwise stated)
The following table summarizes the effects of adopting the new revenue recognition standard on the Company’s consolidated statements of comprehensive income for the
years ended
March 31, 2019
.
|
As reported
|
Excluding adoption of ASC 606
|
Adjustments
|
|||||||||
|
Revenues
|
$
|
1,084,385
|
|
$
|
1,050,405
|
|
$
|
33,980
|
|
||
|
Operating expenses:
|
|||||||||||
|
Employee compensation and benefits
|
692,073
|
|
692,024
|
|
49
|
|
|||||
|
Travel, meals, and entertainment
|
42,862
|
|
28,865
|
|
13,997
|
|
|||||
|
Rent
|
38,672
|
|
38,672
|
|
—
|
|
|||||
|
Depreciation and amortization
|
14,475
|
|
14,475
|
|
—
|
|
|||||
|
Information technology and communications
|
21,512
|
|
20,555
|
|
957
|
|
|||||
|
Professional fees
|
23,035
|
|
19,038
|
|
3,997
|
|
|||||
|
Other operating expenses
|
32,229
|
|
17,391
|
|
14,838
|
|
|||||
|
Total operating expenses
|
864,858
|
|
831,020
|
|
33,838
|
|
|||||
|
Income before provision for income taxes
|
224,320
|
|
224,178
|
|
142
|
|
|||||
|
Provision for income taxes
|
65,214
|
|
65,173
|
|
41
|
|
|||||
|
Net income
|
$
|
159,106
|
|
$
|
159,005
|
|
$
|
101
|
|
||
Disaggregation of Revenue
The Company disaggregates revenue based on its business segment and geographical area results and believes that the same information provides a reasonable representation of how performance obligations relate to the nature, amount, timing and uncertainty of revenue and cash flows. See note 17.
Contract Balances
The timing of revenue recognition may differ from the timing of payment by customers. The Company records a receivable when revenue is recognized prior to payment and there is an unconditional right to payment. Alternatively, when payment precedes the provision of the related services, the Company records deferred income (contract liability) until the performance obligations are satisfied.
Costs incurred in fulfilling advisory contracts with point-in-time revenue recognition are recorded as a contract asset when the costs (i) relate directly to a contract, (ii) generate or enhance resources of the Company that will be used in satisfying performance obligations, and (iii) are expected to be recovered. The Company amortizes the contract asset costs related to fulfilling a contract based on recognition of fee revenue for the corresponding contract. As the Company is prospectively changing the presentation of costs incurred in fulfilling advisory contracts from a net presentation within non-compensation expenses to a gross basis in revenues, the Company records a contract liability for the reimbursable costs incurred until the fee revenue is recognized.
Costs incurred in fulfilling an advisory contract with over-time revenue recognition are expensed as incurred.
64
HOULIHAN LOKEY, INC. AND SUBSIDIARIES
Notes to Consolidated Financial Statements
(All tables and balance disclosures are in thousands, except share data or otherwise stated)
The change in the Company’s contract assets and liabilities during the period primarily reflects the timing difference between the Company’s performance and the customer’s payment. The following table provides information about receivables, contract assets, and contract liabilities from contracts with customers:
|
Balance as of
April 1, 2018 (4) |
(Decrease)/Increase
|
Balance as of
March 31, 2019 |
|||||||||
|
Receivables
(1)
|
$
|
77,259
|
|
$
|
(12,462
|
)
|
$
|
64,797
|
|
||
|
Unbilled work in process
(2)
|
$
|
45,862
|
|
$
|
26,029
|
|
$
|
71,891
|
|
||
|
Contract Assets
(1)
|
$
|
4,675
|
|
$
|
1,358
|
|
$
|
6,033
|
|
||
|
Contract Liabilities
(3)
|
$
|
30,872
|
|
$
|
(3,060
|
)
|
$
|
27,812
|
|
||
_______________________
(1) Included in accounts receivable in the
March 31, 2019
consolidated balance sheet
(2) Included in unbilled work in process in the
March 31, 2019
consolidated balance sheet
(3) Deferred income in the
March 31, 2019
consolidated balance sheet
(4) See note 2 (m)
As a practical expedient, the Company does not disclose information about remaining performance obligations pertaining to (i) contracts that have an original expected duration of one year or less and/or (ii) contracts where the variable consideration is allocated entirely to a wholly unsatisfied promise to transfer a distinct service that is or forms part of a single performance obligation. The transaction price allocated to remaining unsatisfied or partially unsatisfied performance obligations with an original expected duration exceeding one year was not material at
March 31, 2019
.
4) RELATED‑PARTY TRANSACTIONS
The Company provides financial advisory services to ORIX USA and its affiliates and certain other related parties, and received fees for these services totaling approximately
$8,819
,
$3,006
, and
$7,504
during the
years ended
March 31, 2019
,
2018
, and
2017
, respectively.
The Company provides certain management and administrative services for the Company's unconsolidated entities and receives fees for these services. The Company received fees of
$482
,
$286
, and
$461
during the
years ended
March 31, 2019
,
2018
, and
2017
, respectively.
In connection with the IPO, ORIX USA and the Company entered into a Transition Services Agreement, pursuant to which ORIX USA provided services for Sarbanes-Oxley compliance, internal audit, and other services for specified fees. Expenses incurred by the Company related to these services were
$0
,
$0
, and
$269
for the years ended
March 31, 2019
,
2018
, and
2017
, respectively, which are included in professional fees in the accompanying consolidated statements of comprehensive income. To the extent that ORIX USA and its affiliates pay for expenses of the Company, ORIX USA is reimbursed for such payments by the Company.
Interest income earned by the Company related to cash balances held by the affiliate of ORIX USA was
$0
,
$0
and
$33
for the
years ended
March 31, 2019
,
2018
and
2017
, respectively.
In November 2015, the Company entered into a joint venture arrangement with Leonardo & Co. NV, a European-based investment banking firm ("Leonardo"), in relation to Leonardo's Italian business by means of acquisition of a minority (
49%
) interest. In conjunction with this transaction, a subsidiary of the Company loaned the joint venture EUR
5,500
(
$6,492
and
$6,034
as of
March 31, 2019
and
2018
, respectively) which is included in receivables from affiliates and which bears interest at
1.5%
and matures no later than November 2025. Interest income earned by the Company related to this receivable from affiliate was approximately
$96
,
$97
, and
$90
during the
years ended
March 31, 2019
,
2018
, and
2017
, respectively. Included in receivables from affiliates is also reimbursable third party costs incurred on behalf of Leonardo totaling approximately
$2,139
and
$2,698
as of
March 31, 2019
, and
2018
, respectively.
65
HOULIHAN LOKEY, INC. AND SUBSIDIARIES
Notes to Consolidated Financial Statements
(All tables and balance disclosures are in thousands, except share data or otherwise stated)
As described in note 1 above, in connection with, and prior to, the February 2017 Follow-on Offering, on February 6, 2017, the Company entered into the February 2017 Forward Share Purchase Agreement, pursuant to which the Company agreed to repurchase from ORIX USA on April 5, 2017 the number of shares of our Class B common stock equal to the number of shares of our Class A common stock sold by the Company in the February 2017 Follow-on Offering (including any shares sold upon the exercise by the underwriters of their option to purchase additional shares of our Class A common stock) for a purchase price per share equal to the public offering price in the February 2017 Follow-on Offering less underwriting discounts and commissions. On April 5, 2017, the Company settled the transaction provided for in the February 2017 Forward Share Purchase Agreement and acquired
6,900,000
shares of Class B common stock from ORIX USA using the net proceeds we received from the February 2017 Follow-on Offering and the shares were retired. In accordance with the terms of the February 2017 Forward Share Purchase Agreement, the purchase price per share under the February 2017 Forward Share Purchase Agreement was reduced by the per share amount of the dividend paid to ORIX USA on the shares of our Class B common stock subject to the February 2017 Forward Share Purchase Agreement prior to the settlement of the transaction.
In July 2017, the Company purchased the remaining interest of Houlihan Lokey (Australia) Pty Limited ("HL Australia"), which was historically operating as our joint venture in Australia. As part of the consideration paid, a loan receivable from certain principals of the joint venture was forgiven. In addition, as a result of the acquisition we eliminated from our consolidated financial statements as of
March 31, 2019
a loan agreement entered into with HL Australia in February 2017 for AUD
2,500
(
$2,001
as of July 31, 2017) which bore interest at
2.0%
and was previously included in receivables from affiliates. Interest income earned by the Company related to this receivable from affiliate was approximately
$0
and
$13
during the
years ended
March 31, 2019
and
2018
, respectively.
In connection with, and prior to, the March 2018 Follow-on Offering, on January 26, 2018, the Company entered into the January 2018 Forward Share Purchase Agreement, pursuant to which the Company agreed to repurchase from ORIX USA on April 5, 2018 the number of shares of our Class B common stock equal to the number of shares of our Class A common stock sold by the Company in the March 2018 Follow-on Offering for a purchase price per share equal to the public offering price in the March 2018 Follow-on Offering less underwriting discounts and commissions. On April 5, 2018, the Company settled the transaction provided for in the January 2018 Forward Share Purchase Agreement and acquired
2,000,000
shares of Class B common stock from ORIX USA using the net proceeds we received from the March 2018 Follow-on Offering and the shares were retired. In accordance with the terms of the January 2018 Forward Share Purchase Agreement, the purchase price per share under the January 2018 Forward Share Purchase Agreement was reduced by the per share amount of the dividend paid to ORIX USA on the shares of our Class B common stock subject to the January 2018 Forward Share Purchase Agreement prior to the settlement of the transaction.
As described in note 1 above, on June 4, 2018, pursuant to the June 2018 Follow-on Offering, ORIX USA sold
1,985,983 shares
of our Class A common stock and certain of our former and current employees and members of our management sold
1,014,017 shares
, in each case, at a price to the public of
$49.15
per share. Concurrently with the closing of the offering, the Company repurchased from ORIX USA
697,000 shares
of Class A Common Stock at a purchase price per share of
$49.11
.
In the accompanying consolidated balance sheet, the Company carried accounts receivable and unbilled work in progress from related parties totaling approximately
$3
and
$21
as of
March 31, 2019
and
2018
, respectively. The Company also deferred income from related parties for service fees totaling
$34
and
$25
as of
March 31, 2019
and
2018
, respectively.
Other assets in the accompanying consolidated balance sheets includes loans receivable from certain employees of
$15,228
and
$7,489
as of
March 31, 2019
and
2018
, respectively.
66
HOULIHAN LOKEY, INC. AND SUBSIDIARIES
Notes to Consolidated Financial Statements
(All tables and balance disclosures are in thousands, except share data or otherwise stated)
(5) FAIR VALUE MEASUREMENTS AND FINANCIAL INSTRUMENTS
The Company utilizes valuation techniques that maximize the use of observable inputs and minimize the use of unobservable inputs to the extent possible. The Company determines fair value based on assumptions that market participants would use in pricing an asset or liability in the principal or most advantageous market. When considering market participant assumptions in fair value measurements, the following fair value hierarchy distinguishes between observable and unobservable inputs, which are categorized in one of the following levels in accordance with ASC Topic 820,
Fair Value Measurement
:
|
•
|
Level 1 Inputs: Unadjusted quoted prices in active markets for identical assets or liabilities accessible to the reporting entity at the measurement date.
|
|
•
|
Level 2 Inputs: Other than quoted prices included in Level 1 inputs that are observable for the asset or liability, either directly or indirectly, for substantially the full term of the asset or liability.
|
|
•
|
Level 3 Inputs: Unobservable inputs for the asset or liability used to measure fair value to the extent that observable inputs are not available, thereby allowing for situations in which there is little, if any, market activity for the asset or liability at measurement date.
|
For Level 3 investments in which pricing inputs are unobservable and limited market activity exists, management's determination of fair value is based on the best information available, may incorporate management's own assumptions and involves a significant degree of judgment.
The following methods and assumptions were used by the Company in estimating fair value disclosures:
Certificates of deposit
: Fair values for certificates of deposit are based upon a discounted cash flow approach.
Corporate debt securities
: All fair value measurements are obtained from a third-party pricing service and are not adjusted by management.
U.S. Treasury securities
: Fair values for U.S. treasury securities are based on quoted prices from recent trading activity of identical or similar securities. All fair value measurements are obtained from a third-party pricing service and are not adjusted by management.
The following table presents information about the Company's financial assets, and indicate the fair value hierarchy of the valuation techniques utilized by the Company to determine such fair values:
|
March 31, 2019
|
|||||||||||||||
|
Level I
|
Level II
|
Level III
|
Total
|
||||||||||||
|
Corporate debt securities
|
$
|
—
|
|
$
|
116,577
|
|
$
|
—
|
|
$
|
116,577
|
|
|||
|
U.S. Treasury securities
|
—
|
|
8,681
|
|
—
|
|
8,681
|
|
|||||||
|
Total asset measured at fair value
|
$
|
—
|
|
$
|
125,258
|
|
$
|
—
|
|
$
|
125,258
|
|
|||
|
March 31, 2018
|
|||||||||||||||
|
Level I
|
Level II
|
Level III
|
Total
|
||||||||||||
|
Certificates of deposit
|
$
|
—
|
|
$
|
10,106
|
|
$
|
—
|
|
$
|
10,106
|
|
|||
|
Corporate debt securities
|
—
|
|
183,578
|
|
—
|
|
183,578
|
|
|||||||
|
U.S. Treasury securities
|
—
|
|
15,582
|
|
—
|
|
15,582
|
|
|||||||
|
Total asset measured at fair value
|
$
|
—
|
|
$
|
209,266
|
|
$
|
—
|
|
$
|
209,266
|
|
|||
67
HOULIHAN LOKEY, INC. AND SUBSIDIARIES
Notes to Consolidated Financial Statements
(All tables and balance disclosures are in thousands, except share data or otherwise stated)
In certain cases, the inputs used to measure fair value may fall into different levels of the fair value hierarchy. In such cases, the determination of which category within the fair value hierarchy is appropriate for any given investment is based on the level of input that is most significant to the fair value measurement. The Company's assessment of the significance of a particular input to the fair value measurement in its entirety requires judgment and consideration of factors specific to the instrument.
The Company had no transfers between fair value levels for the year ended
March 31, 2019
.
The fair values of the financial instruments represent the amounts that would be received to sell assets or that would be paid to transfer liabilities in an orderly transaction between market participants as of a specified date. Fair value measurements maximize the use of observable inputs; however, in situations where there is little, if any, market activity for the asset or liability at the measurement date, the fair value measurement reflects the Company’s own judgments about the assumptions that market participants would use in pricing the asset or liability. Those judgments are developed by the Company based on the best information available in the circumstances, including expected cash flows and appropriately risk-adjusted discount rates, as well as available observable and unobservable inputs.
The carrying value of cash and cash equivalents, restricted cash, accounts receivable, unbilled work in process, receivables from affiliates, accounts payable and accrued expenses, deferred income and other liabilities approximates fair value due to the short maturity of these instruments.
The carrying value of the loans to employees included in other assets, loans payable to former shareholders and an unsecured loan which is included in loan payable to non-affiliates, approximates fair value due to the variable interest rate borne by those instruments.
(6) INVESTMENT SECURITIES
As of March 31, 2018, the Company classified its investment securities as held-to-maturity. As of December 31, 2018, the Company has reclassified its investment securities from held-to-maturity to trading and measures them at fair value in the consolidated balance sheets. Unrealized holding gains and losses for trading securities are included in other operating expense, net in the accompanying consolidated statements of comprehensive income.
The amortized cost, gross unrealized gains (losses), and fair value of securities were as follows:
|
March 31, 2019
|
|||||||||||||||
|
Amortized Cost
|
Gross Unrealized Gains
|
Gross Unrealized (Losses)
|
Fair Value
|
||||||||||||
|
Corporate debt securities
|
$
|
116,220
|
|
$
|
372
|
|
$
|
(15
|
)
|
$
|
116,577
|
|
|||
|
U.S. Treasury Securities
|
8,608
|
|
73
|
|
—
|
|
8,681
|
|
|||||||
|
Total securities with unrealized gains
|
$
|
124,828
|
|
$
|
445
|
|
$
|
(15
|
)
|
$
|
125,258
|
|
|||
|
March 31, 2018
|
|||||||||||||||
|
Amortized Cost
|
Gross Unrealized Gains
|
Gross Unrealized (Losses)
|
Fair Value
|
||||||||||||
|
Corporate debt securities
|
$
|
183,632
|
|
$
|
13
|
|
$
|
(67
|
)
|
$
|
183,578
|
|
|||
|
Certificate of deposit
|
10,106
|
|
—
|
|
—
|
|
10,106
|
|
|||||||
|
U.S. Treasury Securities
|
15,581
|
|
11
|
|
(10
|
)
|
15,582
|
|
|||||||
|
Total securities with unrealized gains
|
$
|
209,319
|
|
$
|
24
|
|
$
|
(77
|
)
|
$
|
209,266
|
|
|||
68
HOULIHAN LOKEY, INC. AND SUBSIDIARIES
Notes to Consolidated Financial Statements
(All tables and balance disclosures are in thousands, except share data or otherwise stated)
Scheduled maturities of the Company's debt securities within the investment securities portfolio were as follows:
|
March 31, 2019
|
March 31, 2018
|
||||||||||||||
|
Amortized Cost
|
Estimated Fair Value
|
Amortized Cost
|
Estimated Fair Value
|
||||||||||||
|
Due within one year
|
$
|
96,109
|
|
$
|
96,175
|
|
$
|
209,319
|
|
$
|
209,266
|
|
|||
|
Due within years two through five
|
28,719
|
|
29,083
|
|
—
|
|
—
|
|
|||||||
|
Total debt within the investment securities portfolio
|
$
|
124,828
|
|
$
|
125,258
|
|
$
|
209,319
|
|
$
|
209,266
|
|
|||
(7) ALLOWANCE FOR DOUBTFUL ACCOUNTS
|
Year Ended
March 31,
|
|||||||
|
2019
|
2018
|
||||||
|
Balance-beginning
|
$
|
11,391
|
|
$
|
11,199
|
|
|
|
Provision for bad debt
|
1,707
|
|
1,983
|
|
|||
|
Write-off of uncollectible accounts
|
(7,502
|
)
|
(1,791
|
)
|
|||
|
Balance-ending
|
$
|
5,596
|
|
$
|
11,391
|
|
|
(8) PROPERTY AND EQUIPMENT
Property and equipment, net of accumulated depreciation consist of the following:
|
Useful Lives
|
March 31, 2019
|
March 31, 2018
|
|||||||
|
Equipment
|
5 Years
|
$
|
7,916
|
|
$
|
6,653
|
|
||
|
Furniture and fixtures
|
5 Years
|
19,445
|
|
19,189
|
|
||||
|
Leasehold improvements
|
10 Years
|
34,370
|
|
31,916
|
|
||||
|
Computers and software
|
3 Years
|
11,499
|
|
10,346
|
|
||||
|
Other
|
N/A
|
1,117
|
|
1,120
|
|
||||
|
Total cost
|
74,347
|
|
69,224
|
|
|||||
|
Less: accumulated depreciation
|
(43,313
|
)
|
(37,078
|
)
|
|||||
|
Total net book value
|
$
|
31,034
|
|
$
|
32,146
|
|
|||
Additions to property and equipment during the
years ended
March 31, 2019
and
2018
were primarily related to costs incurred to furnish new leased office space and refurbish existing space, and acquisitions.
Depreciation expense of
$8,434
,
$6,195
, and
$5,708
was recognized during the
years ended
March 31, 2019
,
2018
, and
2017
, respectively.
69
HOULIHAN LOKEY, INC. AND SUBSIDIARIES
Notes to Consolidated Financial Statements
(All tables and balance disclosures are in thousands, except share data or otherwise stated)
(9) GOODWILL AND OTHER INTANGIBLE ASSETS
Goodwill and other intangibles consist of the following.
|
Useful Lives
|
March 31, 2019
|
March 31, 2018
|
|||||||
|
Goodwill
|
Indefinite
|
$
|
594,812
|
|
$
|
528,889
|
|
||
|
Tradename-Houlihan Lokey
|
Indefinite
|
192,210
|
|
192,210
|
|
||||
|
Other intangible assets
|
Varies
|
18,614
|
|
15,464
|
|
||||
|
Total cost
|
805,636
|
|
736,563
|
|
|||||
|
Less: accumulated amortization
|
(11,032
|
)
|
(13,253
|
)
|
|||||
|
Total net book value (before taxes)
|
794,604
|
|
723,310
|
|
|||||
|
Deferred tax liability
|
(51,676
|
)
|
(50,541
|
)
|
|||||
|
Total net book value
|
$
|
742,928
|
|
$
|
672,769
|
|
|||
Goodwill attributable to the Company’s business segments is as follows:
|
Business Segments
|
April 1, 2018
|
Changes
(1)
|
March 31, 2019
|
||||||||
|
Corporate Finance
|
$
|
273,812
|
|
$
|
66,470
|
|
$
|
340,282
|
|
||
|
Financial Restructuring
|
163,362
|
|
(547
|
)
|
162,815
|
|
|||||
|
Financial Advisory Services
|
91,715
|
|
—
|
|
91,715
|
|
|||||
|
Total
|
$
|
528,889
|
|
$
|
65,923
|
|
$
|
594,812
|
|
||
_______________________
(1) Changes were related to the acquisitions discussed in note 1 and foreign currency translation adjustments.
Amortization expense of approximately
$6,041
,
$1,710
, and
$3,145
was recognized for the
years ended
March 31, 2019
,
2018
, and
2017
, respectively. The estimated future amortization for finite-lived intangible assets for each of the next five years are as follows:
|
Year Ended March 31,
|
|||
|
2020
|
$
|
6,294
|
|
|
2021
|
711
|
|
|
|
2022
|
157
|
|
|
|
2023
|
7
|
|
|
|
2024
|
7
|
|
|
70
HOULIHAN LOKEY, INC. AND SUBSIDIARIES
Notes to Consolidated Financial Statements
(All tables and balance disclosures are in thousands, except share data or otherwise stated)
(10) LOANS PAYABLE
In August 2015, prior to the IPO the Company paid a dividend to its shareholders, a portion of which was paid to ORIX USA in the form of a
$45.0 million
note that bore interest at a rate of LIBOR plus
165 basis points
or
4.36%
and
4.31%
as of
March 31, 2019
and
2018
, respectively. The Company paid interest on the note of
$0
,
$62
and
$806
for the
years ended
March 31, 2019
,
2018
, and 2017, respectively. Beginning on June 30, 2016, the Company was required to make quarterly repayments of principal in the amount of
$7.5 million
, with the remaining principal amount due on the second anniversary of the completion of the IPO. The loan was repaid in full in May 2017.
In August 2015, the Company entered into a revolving line of credit with Bank of America, N.A., which allows for borrowings of up to
$75.0 million
and originally matured in August 2017. On July 28, 2017, the Company extended the maturity date of the revolving credit facility to August 18, 2019 (or if such date is not a business day, the immediately preceding business day). The agreement governing this facility provides that borrowings bear interest at an annual rate of LIBOR plus
1.00%
, commitment fees apply to unused amounts, and contains debt covenants which require that the Company maintain certain financial ratios. As of
March 31, 2019
,
no
principal was outstanding under the line of credit. The Company paid interest and unused commitment fees of
$228
,
$228
and
$400
for the
years ended
March 31, 2019
,
2018
, and 2017, respectively, under the line of credit.
Prior to the IPO, Fram maintained certain loans payable to former shareholders consisting of unsecured notes payable, which were transferred to the Company in conjunction with the IPO. The interest rate on the individual notes was
3.92%
and
3.10%
as of
years ended
March 31, 2019
and
2018
, respectively, and the maturity dates range from 2019 to 2027. The Company incurred interest expense on these notes of
$96
,
$124
and
$203
for the
years ended
March 31, 2019
,
2018
, and 2017, respectively.
An acquisition made in January 2015 included non-contingent consideration with a carrying value of
$226
as of each of
March 31, 2019
and March 31, 2018, which is included in other liabilities in the accompanying consolidated balance sheets.
In November 2015, the Company acquired the investment banking operations of Leonardo in Germany, the Netherlands, and Spain, and made a
49%
investment in Leonardo's operations in Italy. Total consideration included an unsecured loan of EUR
14.0 million
payable on November 16, 2040, which is included in loan payable to non-affiliates in the accompanying consolidated balance sheets. Under certain circumstances, the note may be paid in part or in whole over a five year period in equal annual installments. This loan bears interest at an annual rate of
1.50%
. In each of January 2017, December 2017 and December 2018, we paid a portion of this loan in the amount of EUR
2.9 million
. The Company incurred interest expense on this loan of
$131
,
$179
and
$213
for the
years ended
March 31, 2019
,
2018
, and
2017
, respectively.
An acquisition made in January 2017 included non-contingent consideration with a carrying value of
$1,983
and
$1,918
as of
March 31, 2019
and
2018
, respectively, which is included in other liabilities in the accompanying consolidated balance sheets.
In April 2018, the Company acquired Quayle Munro Limited. Total consideration included non-interest bearing unsecured convertible loans totaling GBP
10.5 million
payable on May 31, 2022, which is included in other liabilities in the accompanying consolidated balance sheet. Under certain circumstances, the notes may be exchanged for Company stock over a three year period in equal annual installments starting on May 31, 2020. The Company incurred imputed interest expense on these notes of
$325
for the year ended
March 31, 2019
.
In May 2018, the Company acquired BearTooth Advisors. Total consideration included an unsecured note of
$2.8 million
bearing interest at an annual rate of
2.88%
and payable on May 21, 2048.
See note 16 for aggregated 5-year maturity table on loans payable.
71
HOULIHAN LOKEY, INC. AND SUBSIDIARIES
Notes to Consolidated Financial Statements
(All tables and balance disclosures are in thousands, except share data or otherwise stated)
(11) OTHER COMPREHENSIVE INCOME AND ACCUMULATED OTHER COMPREHENSIVE LOSS
The only component of other comprehensive income relates to foreign currency translation adjustments of
$(16,338)
,
$7,961
, and
$(7,304)
for the
years ended
March 31, 2019
,
2018
, and
2017
, respectively. The change in foreign currency translation was impacted by the vote in the U.K. to withdraw from the European Union. We are currently in a period in which the terms of withdrawal are being negotiated and there may be impact on our European business that are unknown at this time. We believe the change in foreign currency translation will become more volatile, but we do not expect this to have a material impact on our operating results and financial position.
Accumulated other comprehensive loss at
March 31, 2019
,
2018
, and
2017
was comprised of the following:
|
Balance, April 1, 2016
|
$
|
(14,613
|
)
|
|
Foreign currency translation adjustments
|
(7,304
|
)
|
|
|
Balance, March 31, 2017
|
$
|
(21,917
|
)
|
|
Foreign currency translation adjustments
|
7,961
|
|
|
|
Balance, March 31, 2018
|
$
|
(13,956
|
)
|
|
Foreign currency translation adjustments
|
(16,338
|
)
|
|
|
Balance, March 31, 2019
|
$
|
(30,294
|
)
|
(12) INCOME TAXES
The Company’s provision for income taxes was
$65,214
,
$45,553
, and
$70,144
for the
years ended
March 31, 2019
,
2018
, and
2017
, respectively. This represents effective tax rates of
29.1%
,
20.9%
, and
39.3%
for the
years ended
March 31, 2019
,
2018
, and
2017
, respectively.
The primary drivers of the Company’s effective tax rate being higher than the federal statutory rate of
21.0%
for the year ended
March 31, 2019
were the provision for state taxes, certain non-deductible expenses including limits on deductibility of executive compensation under IRC Section 162(m), limits on the deductibility of certain meal and entertainment expense items, and the movement in uncertain tax positions. The increase in the Company’s tax rate during the year ended
March 31, 2019
relative to the year ended
March 31, 2018
was primarily as a result of ASU 2016-09, Compensation - Stock Compensation, which resulted in a decrease to the provision for income taxes due to the vesting of share awards that were accelerated during the calendar year ended December 31, 2017, as well as the Tax Act that created a rate benefit upon enactment in the 2018 fiscal year due to the Company’s re-measurement of deferred tax items.
The Tax Act reduced the U.S. federal corporate tax rate from
35.0%
to
21.0%
for all corporations effective for tax years beginning after December 31, 2017. For fiscal year companies, the change in law requires the application of a blended rate, which in the Company’s case is approximately
31.5%
for the fiscal year ending
March 31, 2018
. Beginning with the fiscal year ended
March 31, 2019
, the applicable statutory rate is
21.0%
.
72
HOULIHAN LOKEY, INC. AND SUBSIDIARIES
Notes to Consolidated Financial Statements
(All tables and balance disclosures are in thousands, except share data or otherwise stated)
The provision (benefit) for income taxes on operations for the years ended
March 31, 2019
,
2018
, and
2017
is comprised of the following approximate values:
|
March 31, 2019
|
March 31, 2018
|
March 31, 2017
|
|||||||||
|
Current:
|
|||||||||||
|
Federal
|
$
|
47,101
|
|
$
|
34,638
|
|
$
|
60,024
|
|
||
|
State and local
|
22,094
|
|
9,768
|
|
12,686
|
|
|||||
|
Foreign
|
6,706
|
|
7,716
|
|
3,527
|
|
|||||
|
Subtotal
|
75,901
|
|
52,122
|
|
76,237
|
|
|||||
|
Deferred:
|
|||||||||||
|
Federal
|
(10,665
|
)
|
(2,398
|
)
|
(7,262
|
)
|
|||||
|
State and local
|
(1,997
|
)
|
(646
|
)
|
(962
|
)
|
|||||
|
Foreign
|
1,975
|
|
(3,525
|
)
|
2,131
|
|
|||||
|
Subtotal
|
(10,687
|
)
|
(6,569
|
)
|
(6,093
|
)
|
|||||
|
Total
|
$
|
65,214
|
|
$
|
45,553
|
|
$
|
70,144
|
|
||
The provision for income taxes on operations for the years ended
March 31, 2019
,
2018
, and
2017
is reconciled to the income taxes computed at the statutory federal income tax rate (computed by applying the federal corporate rate of
21.0%
for 2019,
31.5%
for 2018 and
35%
for 2017 to consolidated operating income before provision for income taxes) as follows:
|
March 31, 2019
|
March 31, 2018
|
March 31, 2017
|
||||||||||||||||||
|
Federal income tax provision computed at statutory rate
|
$
|
47,107
|
|
21.0
|
%
|
$
|
68,618
|
|
31.5
|
%
|
$
|
62,470
|
|
35.0
|
%
|
|||||
|
State and local taxes, net of federal tax effect
|
12,944
|
|
5.8
|
%
|
7,600
|
|
3.5
|
%
|
8,139
|
|
4.6
|
%
|
||||||||
|
Tax impact from foreign operations
|
(2,098
|
)
|
(0.9
|
)%
|
(3,972
|
)
|
(1.8
|
)%
|
(1,741
|
)
|
(1.0
|
)%
|
||||||||
|
Nondeductible expenses
|
3,797
|
|
1.7
|
%
|
1,414
|
|
0.6
|
%
|
1,422
|
|
0.8
|
%
|
||||||||
|
Nondeductible public offering-related expenses
|
—
|
|
—
|
%
|
—
|
|
—
|
%
|
562
|
|
0.3
|
%
|
||||||||
|
Stock compensation
|
(8
|
)
|
—
|
%
|
(16,173
|
)
|
(7.4
|
)%
|
—
|
|
—
|
%
|
||||||||
|
Uncertain tax positions, true-up items, and other
|
2,159
|
|
0.9
|
%
|
(1,203
|
)
|
(0.6
|
)%
|
(708
|
)
|
(0.4
|
)%
|
||||||||
|
Enactment of the Tax Act
|
1,313
|
|
0.6
|
%
|
(10,731
|
)
|
(4.9
|
)%
|
—
|
|
—
|
%
|
||||||||
|
Total
|
$
|
65,214
|
|
29.1
|
%
|
$
|
45,553
|
|
20.9
|
%
|
$
|
70,144
|
|
39.3
|
%
|
|||||
73
HOULIHAN LOKEY, INC. AND SUBSIDIARIES
Notes to Consolidated Financial Statements
(All tables and balance disclosures are in thousands, except share data or otherwise stated)
Deferred income taxes arise principally from temporary differences between book and tax recognition of income, expenses, and losses relating to financing and other transactions. The deferred income taxes on the accompanying consolidated balance sheets at
March 31, 2019
,
2018
, and
2017
comprise the following:
|
March 31, 2019
|
March 31, 2018
|
March 31, 2017
|
|||||||||
|
Deferred tax assets:
|
|||||||||||
|
Deferred compensation expense/accrued bonus
|
$
|
48,501
|
|
$
|
32,358
|
|
$
|
57,379
|
|
||
|
Allowance for doubtful accounts
|
675
|
|
2,347
|
|
4,920
|
|
|||||
|
US foreign tax credits
|
2,523
|
|
3,865
|
|
—
|
|
|||||
|
Other, net
|
7,789
|
|
11,271
|
|
11,235
|
|
|||||
|
Total deferred tax assets
|
59,488
|
|
49,841
|
|
73,534
|
|
|||||
|
Deferred tax asset valuation allowance
|
(11,369
|
)
|
(13,334
|
)
|
(10,984
|
)
|
|||||
|
Total deferred tax assets
|
48,119
|
|
36,507
|
|
62,550
|
|
|||||
|
Deferred tax liabilities:
|
|
||||||||||
|
Intangibles
|
(51,676
|
)
|
(50,541
|
)
|
(77,184
|
)
|
|||||
|
Accounts receivable and work in process
|
(1,647
|
)
|
(8,146
|
)
|
(16,562
|
)
|
|||||
|
Total deferred tax liabilities
|
(53,323
|
)
|
(58,687
|
)
|
(93,746
|
)
|
|||||
|
Net deferred tax liabilities
|
$
|
(5,204
|
)
|
$
|
(22,180
|
)
|
$
|
(31,196
|
)
|
||
A valuation allowance is required when it is more likely than not that some portion of the deferred tax assets will not be realized. The Company has determined that deferred tax assets related to US foreign tax credits and certain foreign deferred tax assets are not likely to be realized. The Company’s credit carryforwards as of March 31, 2019 were primarily driven as a result of U.S. Tax Reform. The Company assessed the realizability of these foreign tax credits based on currently enacted and proposed legislation issued by the U.S. Department of Treasury and the Internal Revenue Service, and recorded a full valuation allowance of
$2,523
and
$3,865
against these assets for March 31, 2019 and 2018, respectively. The Company does not expect to utilize these foreign tax credits in the future as the Company does not currently project future foreign source income. In addition, certain deferred tax assets related to tax deductible goodwill from previous acquisitions and net operating losses generated from these deductions were not more likely than not realizable; therefore, the Company maintained valuation allowances for March 31, 2019, 2018 and 2017 of
$8,846
,
$9,469
and
$10,984
, respectively.
As of
March 31, 2019
,
2018
, and
2017
, the Company had recorded liabilities for interest and penalties related to uncertain tax positions in the amounts of
$1,093
,
$934
, and
$816
net of any future tax benefit of such interest, respectively. Unrecognized tax positions totaled
$4,960
,
$4,563
and
$3,694
as of
March 31, 2019
, and
2018
, and
2017
, respectively. If the income tax impacts from these tax positions are ultimately realized, such realization would affect the income tax provision and effective tax rate.
A reconciliation of the unrecognized tax position for the year ended
March 31, 2019
,
2018
, and
2017
is as follows:
|
March 31, 2019
|
March 31, 2018
|
March 31, 2017
|
|||||||||
|
Unrecognized tax position at the beginning of the year
|
$
|
4,563
|
|
$
|
3,694
|
|
$
|
1,024
|
|
||
|
Increases related to prior year tax positions
|
1,210
|
|
1,033
|
|
2,670
|
|
|||||
|
Decreases related to prior year tax positions
|
(813
|
)
|
(164
|
)
|
—
|
|
|||||
|
Unrecognized tax position at the end of the year
|
$
|
4,960
|
|
$
|
4,563
|
|
$
|
3,694
|
|
||
In the next 12 months, certain uncertain tax positions may reverse as the related statutes expire, but the Company does not anticipate a material change.
74
HOULIHAN LOKEY, INC. AND SUBSIDIARIES
Notes to Consolidated Financial Statements
(All tables and balance disclosures are in thousands, except share data or otherwise stated)
Prior to the IPO, the Company filed as a member of the ORIX USA consolidated federal income tax group and did so through the date of the IPO for fiscal 2016. Following the IPO, the Company files a consolidated federal income tax return separate from ORIX USA, as well as consolidated and separate returns in state and local jurisdictions. As of March 31, 2019, all of the federal income tax returns filed since 2016 by ORIX USA that include the Company as a subsidiary or were filed by the Company are still subject to adjustment upon audit. The Company is currently under New York State audit for the years ended March 31, 2016 and March 31, 2017. The Company also files combined and separate income tax returns in many states, which are also open to adjustment. Additionally, ORIX USA is currently under California audit for the years ended March 31, 2012, March 31, 2013 and March 31, 2014, Illinois audit for the years ended March 31, 2013, March 31, 2014, and March 31, 2015, and Minnesota audit for the years ended March 31, 2013, March 31, 2014, March 31, 2015 and March 31, 2016.
(13) NET INCOME PER SHARE ATTRIBUTABLE TO COMMON SHAREHOLDERS
The calculations of basic and diluted net income per share attributable to holders of shares of common stock are presented below.
|
Twelve Months Ended March 31,
|
|||||||||||
|
2019
|
2018
|
2017
|
|||||||||
|
Numerator:
|
|||||||||||
|
Net income attributable to holders of shares of common stock—basic
|
$
|
159,106
|
|
$
|
172,283
|
|
$
|
108,343
|
|
||
|
Net income attributable to holders of shares of common stock—diluted
|
$
|
159,106
|
|
$
|
172,283
|
|
$
|
108,343
|
|
||
|
Denominator:
|
|||||||||||
|
Weighted average shares of common stock outstanding—basic
|
62,213,414
|
|
62,494,275
|
|
61,100,497
|
|
|||||
|
Weighted average number of incremental shares issuable from unvested restricted stock and restricted stock units, as calculated using the treasury stock method
|
3,632,718
|
|
3,829,818
|
|
5,478,633
|
|
|||||
|
Weighted average shares of common stock outstanding—diluted
|
65,846,132
|
|
66,324,093
|
|
66,579,130
|
|
|||||
|
Net income per share attributable to holders of shares of common stock
|
|||||||||||
|
Basic
|
$
|
2.56
|
|
$
|
2.76
|
|
$
|
1.77
|
|
||
|
Diluted
|
$
|
2.42
|
|
$
|
2.60
|
|
$
|
1.63
|
|
||
(14) EMPLOYEE BENEFIT PLANS
|
(a)
|
Defined Contribution Plans
|
The Company sponsors a 401(k) defined contribution savings plan for its domestic employees and defined contribution retirement plans for its international employees. The Company contributed approximately
$2,765
,
$2,018
and
$2,321
during the
years ended
March 31, 2019
,
2018
and
2017
, respectively, to these defined contribution plans.
|
(b)
|
Share-Based Incentive Plans
|
During the period HL CA was a subsidiary of Fram, certain employees were granted restricted shares of Fram. Compensation expense related to these shares was recorded at the HL CA level as it was related to services provided by its employees. Under its 2006 incentive plan (the "2006 Incentive Plan"), Fram granted restricted share awards to employees of the Company as a component of annual incentive pay and occasionally in conjunction with new hire employment agreements. Under the 2006 Incentive Plan, awards typically vested after
three
years of service from the date of grant. Forfeitures of unvested share awards are recognized as they occur. Prior to the IPO, the grant-date fair value of each award was determined by Fram's board of directors as discussed further below. In addition, the stock grants to employees of the Company in connection with the IPO were made under the 2006 Incentive Plan.
75
HOULIHAN LOKEY, INC. AND SUBSIDIARIES
Notes to Consolidated Financial Statements
(All tables and balance disclosures are in thousands, except share data or otherwise stated)
Following the IPO, additional awards of restricted shares have been and will be made under the Amended and Restated Houlihan Lokey, Inc. 2016 Incentive Award Plan (the "2016 Incentive Plan"), which became effective in August 2015 and was amended in October 2017. Under the 2016 Incentive Plan, it is anticipated that the Company will continue to grant cash and equity-based incentive awards to eligible service providers in order to attract, motivate, and retain the talent necessary to operate the Company's business. Equity-based incentive awards issued under the 2016 Incentive Plan generally vest over a
four
-year period. An aggregate of
30,820
restricted shares of Class A common stock were granted under the 2016 Incentive Plan to (i)
two
independent directors in August 2015 at
$21.00
per share, (ii)
two
independent directors in the first quarter of fiscal 2017 at
$25.21
per share, (iii)
one
independent director in the first quarter of fiscal 2017 at
$23.93
per share, (iv)
three
independent directors in the first quarters of fiscal 2018 and 2019 at
$33.54
and
$44.50
per share, respectively, and (v)
one
independent director in the third quarter of fiscal 2019 at
$42.41
per share.
In March 2016, the FASB issued ASU No. 2016-09 which simplified several aspects of the accounting for share-based payment transactions, including the income tax consequences, classification of awards as either equity or liabilities and classification in the statement of cash flows. The Company adopted ASU 2016-09 in the first quarter of fiscal 2018. The changes that impacted the Company included a requirement that excess tax benefits and deficiencies be recognized as a component of provision for income taxes on the consolidated statements of comprehensive income rather than additional paid-in capital on the consolidated statements of changes in stockholders' equity as required in the previous guidance. Under the transition provisions, we have applied this new guidance prospectively with respect to excess tax benefits arising from vesting of share awards and such awards are no longer presented within financing activities in the consolidated statements of cash flows and are included the change in income taxes payable as an operating activity in the consolidated statements of cash flows for the year ended March 31, 2018. During the year ended
March 31, 2019
excess tax benefits of
$8
were recorded as a component of the provision for income taxes and an operating activity on the Consolidated Statements of Cash Flows. The adoption of ASU 2016-09 resulted in a decrease to the provision for income taxes due to the vesting of share awards that were accelerated on February 14, 2017. The decrease to the provision occurred in the first quarter of fiscal 2018 because the Company’s tax deduction is delayed to its tax year that corresponds to the tax year that the employees report the taxable income. In addition, there was an additional decrease to the provision due to the vesting of share awards that were accelerated on October 21, 2017. As required under the transition provisions, we reclassified, on a retrospective basis, a cash outflow of
$22,756
related to the settlement of share-based awards in satisfaction of withholding tax requirements from operating activities to financing activities for the year ended March 31, 2017.
The share awards are classified as equity awards at the time of grant unless the number of shares granted is unknown. Awards that are settleable in shares based upon a future determinable stock price are classified as a liability until the price is established and the resulting number of shares is known, at which time they are re-classified from liabilities to equity awards. Activity in equity classified share awards which relate to the 2006 Incentive Plan and the 2016 Incentive Plan during the
years ended
March 31, 2019
and
2018
is as follows:
|
Nonvested share awards
|
Shares
|
Weighted average
grant date
fair value
|
||||
|
Balance at April 1, 2017
|
3,626,270
|
|
$
|
22.35
|
|
|
|
Granted
|
1,235,779
|
|
34.86
|
|
||
|
Vested
|
(1,023,078
|
)
|
24.03
|
|
||
|
Forfeited
|
(984,078
|
)
|
24.60
|
|
||
|
Balance at March 31, 2018
|
2,854,893
|
|
$
|
26.39
|
|
|
|
Granted
|
1,069,436
|
|
49.32
|
|
||
|
Vested
|
(76,702
|
)
|
48.78
|
|
||
|
Shares repurchased/forfeited
|
(83,643
|
)
|
33.91
|
|
||
|
Balance at March 31, 2019
|
3,763,984
|
|
$
|
32.29
|
|
|
76
HOULIHAN LOKEY, INC. AND SUBSIDIARIES
Notes to Consolidated Financial Statements
(All tables and balance disclosures are in thousands, except share data or otherwise stated)
Activity in liability classified share awards during the
years ended
March 31, 2019
and
2018
is as follows:
_______________________
|
Awards settleable in shares
|
Fair value
|
||
|
Balance at April 1, 2017
|
$
|
12,743
|
|
|
Offer to grant
|
9,637
|
|
|
|
Share price determined-converted to cash payments
|
(6,040
|
)
|
|
|
Share price determined-transferred to equity grants
(1)
|
—
|
|
|
|
Forfeited
|
(847
|
)
|
|
|
Balance at March 31, 2018
|
$
|
15,493
|
|
|
Offer to grant
|
12,432
|
|
|
|
Share price determined-converted to cash payments
|
(300
|
)
|
|
|
Share price determined-transferred to equity grants
(1)
|
(4,705
|
)
|
|
|
Forfeited
|
(1,244
|
)
|
|
|
Balance at March 31, 2019
|
$
|
21,676
|
|
(1)
96,778
and
0
shares for the years ended
March 31, 2019
and
2018
, respectively.
Compensation expenses for the Company associated with both equity and liability classified awards totaled
$56,562
,
$47,111
, and
$45,059
for the
years ended
March 31, 2019
,
2018
, and
2017
, respectively. At
March 31, 2019
, there was
$77,348
of total unrecognized compensation cost related to unvested share awards granted under both the 2006 Incentive Plan and 2016 Incentive Plan. That cost is expected to be recognized over a weighted average period of
1.4 years
.
On February 14, 2017, in connection with the February 2017 Follow-on Offering discussed in notes 1 and 4, the Company accelerated the vesting of certain awards that were due to vest in April and May 2017. On October 30, 2017, in connection with the October 2017 Follow-on Offering discussed in notes 1 and 4, the Company accelerated the vesting of certain awards that were due to vest in April and May 2018. Under the terms of both the 2006 Incentive Plan and 2016 Incentive Plan, upon the vesting of awards, shares may be withheld to meet the minimum statutory tax withholding requirements. The Company satisfied such obligations upon vesting by retiring
704,528
shares upon the accelerated vesting of
1,907,890
shares and
806,248
shares upon the accelerated vesting of
1,737,461
shares in February 2017 and October 2017, respectively.
On October 19, 2017, our board of directors approved an amendment (the “Amendment”) to the 2016 Incentive Plan reducing the number of shares of common stock available for issuance under the 2016 Incentive Plan by approximately
12.2 million
shares. Under the Amendment, the aggregate number of shares of common stock that are available for issuance under awards granted pursuant to the 2016 Incentive Plan is equal to the sum of (i)
8.0 million
and (ii) any shares of our Class B common stock that are subject to awards under our 2006 Incentive Plan that terminate, expire or lapse for any reason after October 19, 2017.
The number of shares available for issuance will be increased annually beginning on April 1, 2018 and ending on April 1, 2025, by an amount equal to the lowest of:
|
•
|
6,540,659
shares of our Class A common stock and Class B common stock;
|
|
•
|
Six
percent of the shares of Class A common stock and Class B common stock outstanding on the final day of the immediately preceding fiscal year; and
|
|
•
|
such smaller number of shares as determined by our board of directors.
|
Prior to the IPO, the Fram board of directors determined the fair value of the shares using input from a third party, which used a combination of historical and forecasted results and market data. The methods used to estimate the fair value of Fram shares included the market approach and the income approach. Under the market approach, fair value was determined by multiplying revenues of comparable public companies by the relevant valuation multiple, adjusted for any differences with the referenced comparable. Under the income approach, fair value was determined by converting future cash flows to a single present amount (discounted) using current expectations about those future amounts. The significant assumptions used to develop the fair value estimates included the discount rate (
11.5%
for 2015) used under the income approach and revenue multiples (
0.9
x -
4.4
x for 2015) used under the market approach.
77
HOULIHAN LOKEY, INC. AND SUBSIDIARIES
Notes to Consolidated Financial Statements
(All tables and balance disclosures are in thousands, except share data or otherwise stated)
(15) STOCKHOLDERS' EQUITY
|
(a)
|
Class A Common Stock
|
In conjunction with the Company's IPO,
12,075,000
Class A shares were sold to the public by existing shareholders and
9,524
Class A shares were issued to non-employee directors. During the year ended March 31, 2017, an additional
9,200,000
Class A shares were sold to the public in the February 2017 Follow-on Offering as discussed in note 1,
9,137
shares were issued to non-employee directors, and
733,150
shares were converted from Class B to Class A. Each share of Class A common stock is entitled to
one
vote per share. During the year ended March 31, 2018,
5,589
shares were issued to non-employee directors, and
1,252,242
shares were converted from Class B to Class A, in October and November 2017 an additional
3,750,000
Class A shares, and in March 2018 an additional
4,000,000
shares were sold to the public in the October 2017 and March 2018 Follow-on Offerings as discussed in note 1. As of
March 31, 2019
, there were
4,109,720
shares of Class A common stock held by ORIX USA. Each share of Class A common stock is entitled to
one
vote per share.
|
(b)
|
Class B Common Stock
|
Each share of Class B common stock may be converted into
one
share of Class A common stock at the option of its holder and will be automatically converted into
one
share of Class A common stock upon transfer thereof, subject to certain exceptions. In April 2017, the Company settled its
$192,372
forward purchase obligation with a related party and the funds held in escrow were released and the related
6,900,000
Class B shares were retired. In March 2018 and April 2017, the Company repurchased from employees
68,504
and
71,913
shares, respectively of Class B common stock received pursuant to contractual arrangements entered into in connection with a prior acquisition. In April 2018, the Company settled its
$93,500
forward purchase obligation with a related party and the funds held in escrow were released and the related
2,000,000
Class B shares were retired. As of
March 31, 2019
there were
24,929,520
Class B shares held by the HL Voting Trust and
2,268,214
Class B shares held by ORIX USA. Each share of Class B common stock is entitled to
ten
votes per share.
|
(c)
|
Dividends
|
Previously declared dividends related to unvested shares of
$8,006
and
$3,983
were unpaid as of
March 31, 2019
and
2018
, respectively.
|
(d)
|
Stock subscriptions receivable
|
Employees of the Company periodically issued notes receivable to the Company documenting loans made by the Company to such employees for the purchase of restricted shares of the Company.
|
(e)
|
Share repurchase program
|
In February 2017, the board of directors authorized the repurchase of up to
$50.0 million
of the Company's Class A common stock. In May 2017, the Company entered into a stock buyback program with a third-party financial institution to purchase shares of common stock. In July 2018, the board of directors authorized the repurchase of up to
$100 million
of the Company's common stock. During the twelve months ended
March 31, 2019
and 2018, the Company repurchased and retired
1,481,114
and
430,237
shares of its outstanding common stock at a weighted average price of
$46.97
and
$35.17
per share, excluding commissions, for an aggregate purchase price of
$69,563
and
$15,131
.
(16) COMMITMENTS AND CONTINGENCIES
The Company has been named in various legal actions arising in the normal course of business. In the opinion of the Company, in consultation with legal counsel, the final resolutions of these matters are not expected to have a material adverse effect on the Company’s financial condition, operations and cash flows.
78
HOULIHAN LOKEY, INC. AND SUBSIDIARIES
Notes to Consolidated Financial Statements
(All tables and balance disclosures are in thousands, except share data or otherwise stated)
Our obligation under the loan payable to affiliate is subordinated to our obligations under the revolving credit facility with Bank of America, N.A. The scheduled aggregate repayments of the loan payable to affiliate included in other liabilities in the accompanying consolidated balance sheets, the loans payable to former shareholders, and the loan payable to non-affiliates are as follows:
|
Year Ended March 31,
|
|||
|
2020
|
$
|
3,169
|
|
|
2021
|
575
|
|
|
|
2022
|
280
|
|
|
|
2023
|
14,042
|
|
|
|
2024
|
31
|
|
|
|
2025 and thereafter
|
13,092
|
|
|
|
Total
|
$
|
31,189
|
|
The Company also provides routine indemnifications relating to certain real estate (office) lease agreements under which it may be required to indemnify property owners for claims and other liabilities arising from the Company’s use of the applicable premises. In addition, the Company guarantees the performance of its subsidiaries under certain office lease agreements. The terms of these obligations vary, and because a maximum obligation is not explicitly stated, the Company has determined that it is not possible to make an estimate of the maximum amount that it could be obligated to pay under such contracts. Based on historical experience and evaluation of specific indemnities, management believes that judgments, if any, against the Company related to such matters are not likely to have a material effect on the consolidated financial statements. Accordingly, the Company has not recorded any liability for these obligations as of
March 31, 2019
or
2018
.
An acquisition made in January 2017 included contingent consideration with a carrying value of
$0
and
$4,085
as of
March 31, 2019
and 2018, respectively, which is included in other liabilities in the accompanying consolidated balance sheets.
Straight-line rent expense under noncancelable operating lease arrangements and the related operating expenses were approximately
$38,672
,
$27,799
, and
$26,205
for the
years ended
March 31, 2019
,
2018
, and
2017
, respectively. The approximate future minimum annual noncancelable rental commitments required under these agreements with initial terms in excess of one year are as follows:
|
Year Ended March 31,
|
|||
|
2020
|
$
|
28,640
|
|
|
2021
|
26,703
|
|
|
|
2022
|
22,353
|
|
|
|
2023
|
18,339
|
|
|
|
2024
|
11,205
|
|
|
|
2025 and thereafter
|
41,028
|
|
|
|
Total
|
$
|
148,268
|
|
79
HOULIHAN LOKEY, INC. AND SUBSIDIARIES
Notes to Consolidated Financial Statements
(All tables and balance disclosures are in thousands, except share data or otherwise stated)
(17) SEGMENT AND GEOGRAPHICAL INFORMATION
The Company’s reportable segments are described in note 1 and each are individually managed and provide separate services which require specialized expertise for the provision of those services. Revenues by segment represent fees earned on the various services offered within each segment. Segment profit represents each segment’s profit, which consists of segment revenues, less (1) direct expenses including compensation, employee recruitment, travel, meals and entertainment, professional fees, and bad debt and (2) expenses allocated by headcount such as communications, rent, depreciation and amortization, and office expense. The corporate expense category includes costs not allocated to individual segments, including charges related to incentive compensation and share-based payments to corporate employees, as well as expenses of senior management and corporate departmental functions managed on a worldwide basis, including Office of the Executives, accounting, human resources, human capital management, marketing, information technology, and compliance and legal. The following tables present information about revenues, profit and assets by segment and geography.
|
Year ended March 31,
|
|||||||||||
|
2019
|
2018
|
2017
|
|||||||||
|
Revenues by segment:
|
|||||||||||
|
Corporate Finance
|
$
|
607,333
|
|
$
|
528,643
|
|
$
|
434,558
|
|
||
|
Financial Restructuring
|
317,774
|
|
294,142
|
|
307,595
|
|
|||||
|
Financial Advisory Services
|
159,278
|
|
140,579
|
|
129,938
|
|
|||||
|
Revenues
|
$
|
1,084,385
|
|
$
|
963,364
|
|
$
|
872,091
|
|
||
|
Segment profit
(1)
|
|
|
|
||||||||
|
Corporate Finance
|
$
|
193,603
|
|
$
|
177,575
|
|
$
|
119,739
|
|
||
|
Financial Restructuring
|
83,607
|
|
73,691
|
|
92,831
|
|
|||||
|
Financial Advisory Services
|
28,776
|
|
26,334
|
|
28,905
|
|
|||||
|
Total segment profit
|
305,986
|
|
277,600
|
|
241,475
|
|
|||||
|
Corporate expenses
(2)
|
86,459
|
|
63,154
|
|
59,480
|
|
|||||
|
Other (income) expense, net
|
(4,793
|
)
|
(3,390
|
)
|
3,508
|
|
|||||
|
Income before provision for income taxes
|
$
|
224,320
|
|
$
|
217,836
|
|
$
|
178,487
|
|
||
_______________________
(1) We adjust the compensation expense for a business segment in situations where an employee residing in one business segment is performing work in another business segment where the revenues are accrued. Segment profit may vary significantly between periods depending on the levels of collaboration among the different segments.
(2) Corporate expenses represent expenses that are not allocated to individual business segments such as Office of the Executives, accounting, information technology, compliance, legal, marketing, human capital management, and human resources.
|
Assets by segment:
|
March 31,
|
||||||||||
|
2019
|
2018
|
2017
|
|||||||||
|
Corporate Finance
|
$
|
397,069
|
|
$
|
337,584
|
|
$
|
316,561
|
|
||
|
Financial Restructuring
|
184,364
|
|
185,486
|
|
193,275
|
|
|||||
|
Financial Advisory Services
|
127,021
|
|
126,034
|
|
121,640
|
|
|||||
|
Total segment assets
|
708,454
|
|
649,104
|
|
631,476
|
|
|||||
|
Corporate assets
|
714,604
|
|
769,737
|
|
754,231
|
|
|||||
|
Total assets
|
$
|
1,423,058
|
|
$
|
1,418,841
|
|
$
|
1,385,707
|
|
||
80
HOULIHAN LOKEY, INC. AND SUBSIDIARIES
Notes to Consolidated Financial Statements
(All tables and balance disclosures are in thousands, except share data or otherwise stated)
|
Revenues by geography:
|
March 31,
|
||||||||||
|
2019
|
2018
|
2017
|
|||||||||
|
United States
|
$
|
878,840
|
|
$
|
830,079
|
|
$
|
760,450
|
|
||
|
International
|
205,545
|
|
133,285
|
|
111,641
|
|
|||||
|
Total revenues
|
$
|
1,084,385
|
|
$
|
963,364
|
|
$
|
872,091
|
|
||
|
Income before provision for income taxes by geography:
|
March 31,
|
||||||||||
|
2019
|
2018
|
2017
|
|||||||||
|
United States
|
$
|
176,850
|
|
$
|
185,380
|
|
$
|
154,268
|
|
||
|
International
|
47,470
|
|
32,456
|
|
24,219
|
|
|||||
|
Total income before provision for income taxes
|
$
|
224,320
|
|
$
|
217,836
|
|
$
|
178,487
|
|
||
|
Assets by geography
|
March 31,
|
||||||||||
|
2019
|
2018
|
2017
|
|||||||||
|
United States
|
$
|
1,021,975
|
|
$
|
957,897
|
|
$
|
964,273
|
|
||
|
International
|
401,083
|
|
460,944
|
|
421,434
|
|
|||||
|
Total assets
|
$
|
1,423,058
|
|
$
|
1,418,841
|
|
$
|
1,385,707
|
|
||
(18) SUBSEQUENT EVENTS
On April 30, 2019, the board of directors of the Company declared a regular quarterly cash dividend of
$0.31
per share for holders of record as of June 3, 2019 and payable on June 14, 2019.
81
SUPPLEMENTAL FINANCIAL INFORMATION
Consolidated Quarterly Results of Operations (Unaudited)
|
($ in thousands, except per share data)
|
For the Three Months Ended
|
||||||||||||||
|
June 30, 2018
|
September 30, 2018
|
December 31, 2018
|
March 31, 2019
|
||||||||||||
|
Revenues
|
$
|
220,002
|
|
$
|
274,992
|
|
$
|
298,013
|
|
$
|
291,378
|
|
|||
|
Total operating expenses
|
179,874
|
|
218,817
|
|
235,754
|
|
230,413
|
|
|||||||
|
Operating income
|
40,128
|
|
56,175
|
|
62,259
|
|
60,965
|
|
|||||||
|
Net income attributable to Houlihan Lokey, Inc.
|
$
|
29,682
|
|
$
|
40,119
|
|
$
|
43,957
|
|
$
|
45,348
|
|
|||
|
Net income per share of common stock:
|
|||||||||||||||
|
Basic
|
$
|
0.47
|
|
$
|
0.64
|
|
$
|
0.71
|
|
$
|
0.74
|
|
|||
|
Diluted
|
$
|
0.45
|
|
$
|
0.61
|
|
$
|
0.67
|
|
$
|
0.69
|
|
|||
|
Dividends declared per share of common stock
|
$
|
0.27
|
|
$
|
0.27
|
|
$
|
0.27
|
|
$
|
0.31
|
|
|||
|
For the Three Months Ended
|
|||||||||||||||
|
June 30, 2017
|
September 30, 2017
|
December 31, 2017
|
March 31, 2018
|
||||||||||||
|
Revenues
|
$
|
217,491
|
|
$
|
242,183
|
|
$
|
258,937
|
|
$
|
244,753
|
|
|||
|
Total operating expenses
|
170,618
|
|
188,857
|
|
204,452
|
|
184,991
|
|
|||||||
|
Operating income
|
46,873
|
|
53,326
|
|
54,485
|
|
59,762
|
|
|||||||
|
Net income attributable to Houlihan Lokey, Inc.
|
$
|
39,244
|
|
$
|
33,357
|
|
$
|
61,583
|
|
$
|
38,099
|
|
|||
|
|
|
|
|
||||||||||||
|
Net income per share of common stock:
|
|||||||||||||||
|
Basic
|
$
|
0.63
|
|
$
|
0.54
|
|
$
|
0.98
|
|
$
|
0.61
|
|
|||
|
Diluted
|
$
|
0.59
|
|
$
|
0.50
|
|
$
|
0.93
|
|
$
|
0.58
|
|
|||
|
Dividends declared per share of common stock
|
$
|
0.20
|
|
$
|
0.20
|
|
$
|
0.20
|
|
$
|
0.20
|
|
|||
Schedule II—Valuation and Qualifying Accounts
March 31, 2018, 2017 and 2016
Allowance for Uncollectible Accounts
|
($ in thousands)
|
|||
|
Balance – April 1, 2016
|
$
|
7,844
|
|
|
Provision for bad debts
|
4,008
|
|
|
|
Write-off of uncollectible accounts
|
(653
|
)
|
|
|
Balance – March 31, 2017
|
$
|
11,199
|
|
|
Provision for bad debts
|
1,983
|
|
|
|
Write-off of uncollectible accounts
|
(1,791
|
)
|
|
|
Balance – March 31, 2018
|
$
|
11,391
|
|
|
Provision for bad debts
|
1,707
|
|
|
|
Write-off of uncollectible accounts
|
(7,502
|
)
|
|
|
Balance – March 31, 2019
|
$
|
5,596
|
|
82
Item 9. Changes in and Disagreements with Accountants on Accounting and Financial Disclosure
None.
Item 9A. Controls and Procedures
Evaluation of Disclosure Controls and Procedures
Our management, with the participation of our chief executive officer and chief financial officer, evaluated, as of the end of the period covered by this Annual Report on Form 10-K, the effectiveness of our disclosure controls and procedures (as defined in Rules 13a-15(e) and 15d-15(e) under the Exchange Act. Based on that evaluation, our chief executive officer and chief financial officer concluded that our disclosure controls and procedures were effective at the reasonable assurance level as of
March 31, 2019
.
Management’s Annual Report on Internal Control over Financial Reporting
Management is responsible for establishing and maintaining adequate internal control over financial reporting for the Company, as defined in Rules 13a-15(f) and 15d-15(f) under the Exchange Act.
The Company’s system of internal control is designed to provide reasonable assurance regarding the reliability of financial reporting and preparation of the Company’s financial statements for external reporting purposes in accordance with GAAP. The Company’s management, including the chief executive officer and chief financial officer, assessed the effectiveness of the Company’s internal control over financial reporting as of
March 31, 2019
. In conducting its assessment, management used the criteria issued by the Committee of Sponsoring Organizations of the Treadway Commission on Internal Control-Integrated Framework (2013 Framework). Based on this assessment, management concluded that, as of
March 31, 2019
, the Company’s internal control over financial reporting was effective based on those criteria.
In designing and evaluating our disclosure controls and procedures, management, including the chief executive officer and chief financial officer, recognizes that any controls and procedures, no matter how well designed and operated, can provide only reasonable, not absolute, assurance of achieving the desired control objectives. In addition, the design of disclosure controls and procedures must reflect the fact that there are resource constraints and that management is required to apply judgment in evaluating the benefits of possible controls and procedures relative to their costs. Because of the inherent limitations in all control systems, no evaluation of controls can provide absolute assurance that all control issues and instances of fraud, if any, have been detected.
The Company’s management assessed the effectiveness of the Company’s internal control over financial reporting as of
March 31, 2019
. In making this assessment, the Company’s management used the criteria set forth by the Committee of Sponsoring Organizations of the Treadway Commission's
2013 Internal Control - Integrated Framework
. Based on its assessment, management believes that, as of
March 31, 2019
, the Company’s internal control over financial reporting is effective based on those criteria.
The Company’s independent registered public accounting firm, KPMG LLP, has issued an audit report on the Company’s internal control over financial reporting. This report appears on page 47 of this report.
Changes in Internal Control Over Financial Reporting
There was no change in our internal control over financial reporting (as defined in Rules 13a-15(f) and 15d-15(f) under the Exchange Act) identified in connection with the evaluation of our internal control over financial reporting performed during the fiscal quarter ended
March 31, 2019
that has materially affected, or is reasonably likely to materially affect, our internal control over financial reporting.
Item 9B. Other Information
None.
83
PART III
Item 10. Directors, Executive Officers and Corporate Governance
Information relating to this Item 10 is incorporated by reference to the Company's definitive proxy statement to be filed with the SEC no later than 120 days after the end of the fiscal year covered by this Form 10-K.
Item 11. Executive Compensation
Information relating to this Item 11 is incorporated by reference to the Company's definitive proxy statement to be filed with the SEC no later than 120 days after the end of the fiscal year covered by this Form 10-K.
Item 12. Security Ownership of Certain Beneficial Owners and Management and Related Stockholder Matters
Information relating to this Item 12 is incorporated by reference to the Company's definitive proxy statement to be filed with the SEC no later than 120 days after the end of the fiscal year covered by this Form 10-K.
Item 13. Certain Relationships and Related Transactions, and Director Independence
Information relating to this Item 13 is incorporated by reference to the Company's definitive proxy statement to be filed with the SEC no later than 120 days after the end of the fiscal year covered by this Form 10-K.
Item 14. Principal Accounting Fees and Services
Information relating to this Item 14 is incorporated by reference to the Company's definitive proxy statement to be filed with the SEC no later than 120 days after the end of the fiscal year covered by this Form 10-K.
84
PART IV
Item 15. Exhibits, Financial Statement Schedules
Financial Statements
The consolidated financial statements required to be filed in the Form 10-K are listed in Part II, Item 8 hereof.
Financial Statement Schedules
See "Index to Consolidated Financial Statements" in this Form 10-K listed in Part II, Item 8 hereof.
Exhibits
A list of exhibits is set forth on the Exhibit Index immediately following the signature page of this Form 10-K, and is incorporated herein by reference.
The agreements and other documents filed as exhibits to this report are not intended to provide factual information or other disclosure other than with respect to the terms of the agreements or other documents themselves, and you should not rely on them for that purpose. In particular, any representations and warranties made by us in these agreements or other documents were made solely within the specific context of the relevant agreement or document and may not describe the actual state of affairs as of the date they were made or at any other time.
Item 16. Form 10-K Summary
None.
SIGNATURES
Pursuant to the requirements of the Securities Exchange Act of 1934, the registrant has duly caused this report to be signed on its behalf by the undersigned, thereunto duly authorized.
|
HOULIHAN LOKEY, INC.
|
||
|
Date: May 24, 2019
|
By:
|
/s/ SCOTT L. BEISER
|
|
Name:
|
Scott L. Beiser
|
|
|
Title:
|
Chief Executive Officer
|
|
Each of the officers and directors of Houlihan Lokey, Inc. whose signature appears below, in so signing, also makes, constitutes and appoints each of Scott L. Beiser, J. Lindsey Alley, Christopher M. Crain and Charles A. Yamarone, and each of them, his or her true and lawful attorneys-in-fact and agents, with full power to act separately and full power of substitution, for him or her in any and all capacities, to execute and cause to be filed with the SEC any and all amendments (including post-effective amendments) to this Annual Report on Form 10-K, with all exhibits thereto and all other documents in connection therewith and to perform any acts necessary to be done in order to file such documents, and hereby ratifies and confirms all that said attorneys-in-fact or their substitute or substitutes may do or cause to be done by virtue hereof.
85
Pursuant to the requirements of the Securities Exchange Act of 1934, this report has been signed below by the following persons in the capacities on the dates indicated.
|
HOULIHAN LOKEY, INC.
|
|
|
Date: May 24, 2019
|
/s/ SCOTT L. BEISER
|
|
Scott L. Beiser
|
|
|
Chief Executive Officer
|
|
|
(Principal Executive Officer)
|
|
|
Date: May 24, 2019
|
/s/ J. LINDSEY ALLEY
|
|
J. Lindsey Alley
|
|
|
Chief Financial Officer
|
|
|
(Principal Financial and Accounting Officer)
|
|
|
Date: May 24, 2019
|
/s/ IRWIN N. GOLD
|
|
Irwin N. Gold
|
|
|
Executive Chairman and Director
|
|
|
Date: May 24, 2019
|
/s/ SCOTT J. ADELSON
|
|
Scott J. Adelson
|
|
|
Co-President and Director
|
|
|
Date: May 24, 2019
|
/s/ DAVID A. PREISER
|
|
David A. Preiser
|
|
|
Co-President and Director
|
|
|
Date: May 24, 2019
|
/s/ JACQUELINE B. KOSECOFF
|
|
Jacqueline B. Kosecoff
|
|
|
Director
|
|
|
Date: May 24, 2019
|
/s/ HIDETO NISHITANI
|
|
Hideto Nishitani
|
|
|
Director
|
|
|
Date: May 24, 2019
|
/s/ ROBERT A. SCHRIESHEIM
|
|
Robert A. Schriesheim
|
|
|
Director
|
|
|
Date: May 24, 2019
|
/s/ BENNET VAN DE BUNT
|
|
Bennet Van de Bunt
|
|
|
Director
|
|
|
Date: May 24, 2019
|
/s/ PAUL A. ZUBER
|
|
Paul A. Zuber
|
|
|
Director
|
|
86
Exhibit Index
|
Incorporated by Reference
|
|||||||
|
Exhibit
Number
|
Exhibit Description
|
Form
|
File No.
|
Exhibit
|
Filing
Date
|
Filed / Furnished
Herewith
|
|
|
Amended and Restated Certificate of Incorporation of the Company, dated August 18, 2015
|
8-K
|
333-205610
|
3.1
|
8/21/15
|
|||
|
Amended and Restated Bylaws of the Company, dated August 18, 2015
|
8-K
|
333-205610
|
3.2
|
8/21/15
|
|||
|
Voting Trust Agreement, dated as of August 18, 2015, by and among the Company, the holders of shares of Class B common stock party thereto, and each trustee named therein
|
8-K
|
333-205610
|
9.1
|
8/21/15
|
|||
|
Amendment No. 1 to the Voting Trust Agreement, dated as of August 28, 2015, by and among the Company and the Trustees
|
8-K
|
333-205610
|
9.1
|
8/28/15
|
|||
|
Amendment No. 2 to the Voting Trust Agreement, dated as of October 18, 2018, by and among the Company and the Trustees
|
8-K
|
001-37537
|
9.1
|
10/19/18
|
|||
|
Stockholders' Agreement, dated as of August 18, 2015, by and among the Company and the holders identified therein
|
8-K
|
333-205610
|
10.1
|
8/21/15
|
|||
|
First Amendment to Credit Agreement, dated as of July 28, 2017, among Houlihan Lokey, Inc., the Guarantors party thereto and Bank of America, N.A.
|
8-K
|
001-37537
|
10.1
|
8/2/17
|
|||
|
Amended and Restated Houlihan Lokey, Inc. 2016 Incentive Award Plan
|
8-K
|
001-37537
|
10.1
|
9/25/17
|
|||
|
Amendment to Amended and Restated Houlihan Lokey, Inc. 2016 Incentive Award Plan
|
8-K
|
001-37537
|
10.1
|
10/20/17
|
|||
|
Registration Rights Agreement, dated as of August 18, 2015, by and between the Company and ORIX HLHZ Holding, LLC
|
8-K
|
333-205610
|
10.2
|
8/21/15
|
|||
|
Form of HL Lock- up Agreement
|
S-1
|
333-205610
|
10.2
|
7/10/15
|
|||
|
Registration Rights Agreement, dated as of August 18, 2015, by and among the Company and the stockholders party thereto
|
8-K
|
333-205610
|
10.3
|
8/21/15
|
|||
|
Transition Services Agreement, dated as of August 18, 2015, by and between ORIX USA, LP and the Company
|
8-K
|
333-205610
|
10.4
|
8/21/15
|
|||
|
Amended and Restated Subordinated Promissory Note, effective as of August 18, 2015, issued by the Company to ORIX USA Corporation
|
8-K
|
333-205610
|
10.5
|
8/21/15
|
|||
|
Credit Agreement, dated as of August 18, 2015, by and among the Company, certain domestic subsidiaries of the Company party thereto and Bank of America, N.A.
|
8-K
|
333-205610
|
10.6
|
8/21/15
|
|||
|
Amended and Restated Tax Sharing Agreement, dated as of August 18, 2015, by and among ORIX USA Corporation, HL Transitory Merger Company, Inc., the Company, and all corporations that are as of this date eligible to file a consolidated return as a member of the affiliated group of ORIX USA Corporation within the meaning of Section 1504(a) of the Internal Revenue Code of 1986, as amended, including ORIX Commercial Alliance Corporation, ORIX Real Estate Capital, Inc., and ORIX Capital Markets, LLC
|
8-K
|
333-205610
|
10.7
|
8/21/15
|
|||
|
Cash Management Agreement, entered into on August 18, 2015, by and between Houlihan Lokey Capital (Holdings) Ltd. And ORIX Global Capital, Ltd
|
8-K
|
333-205610
|
10.8
|
8/21/15
|
|||
|
Form of Indemnification Agreement between Houlihan Lokey, Inc. and its directors and executive officers
|
S-1/A
|
333-205610
|
10.8
|
7/27/15
|
|||
87
|
Incorporated by Reference
|
|||||||
|
Exhibit
Number
|
Exhibit Description
|
Form
|
File No.
|
Exhibit
|
Filing
Date
|
Filed / Furnished
Herewith
|
|
|
Guarantee Agreement, dated as of August 18, 2015, by and between Houlihan Lokey Capital (Holdings) Ltd. and ORIX USA Corporation
|
8-K
|
333-205610
|
10.9
|
8/21/15
|
|||
|
10.15
‡
|
Houlihan Lokey, Inc. Second Amended and Restated 2006 Incentive Compensation Plan
|
S-1/A
|
333-205610
|
10.9
|
8/3/15
|
||
|
Letter Agreement, dated as of August 18, 2015, by and among the Company, ORIX USA Corporation and Fram Holdings, LLC
|
8-K
|
333-205610
|
10.10
|
8/21/15
|
|||
|
10.17
‡
|
Form of Restricted Stock Award Grant Notice and Restricted Stock Award Agreement under the Houlihan Lokey, Inc. Second Amended and Restated 2006 Incentive Compensation Plan
|
S-1/A
|
333-205610
|
10.10
|
8/3/15
|
||
|
10.18
‡
|
Form of Deferred Restricted Stock Award Grant Notice and Agreement under the Houlihan Lokey, Inc. Second Amended and Restated 2006 Incentive Compensation Plan
|
S-1/A
|
333-205610
|
10.11
|
8/3/15
|
||
|
10.19
‡
|
Form of Restricted Stock Award Agreement under the Houlihan Lokey, Inc. 2016 Incentive Award Plan
|
S-1/A
|
333-206337
|
10.13
|
8/3/15
|
||
|
10.20
‡
|
Form of Restricted Stock Unit Award Agreement under the Houlihan Lokey, Inc. 2016 Incentive Award Plan
|
S-1/A
|
333-206337
|
10.14
|
8/3/15
|
||
|
10.21
‡
|
Houlihan Lokey, Inc. Director Compensation Program
|
10-Q
|
001-37537
|
10.1
|
8/9/18
|
||
|
10.22
‡
|
Notice to Fram Holdings, Inc. Second Amended and Restated 2006 Incentive Compensation Plan Equity Award Holders
|
S-1/A
|
333-205610
|
10.19
|
8/3/15
|
||
|
Subsidiaries of Registrant
|
*
|
||||||
|
Consent of Independent Public Accountants
|
*
|
||||||
|
Rule 13a-14(a) / 15d-14(a) Certification of Chief Executive Officer
|
*
|
||||||
|
Rule 13a-14(a) / 15d-14(a) Certification of Chief Financial Officer
|
*
|
||||||
|
Section 1350 Certification of Chief Executive Officer
|
**
|
||||||
|
Section 1350 Certification of Chief Financial Officer
|
**
|
||||||
|
101.INS
|
XBRL Instance Document
|
**
|
|||||
|
101.SCH
|
XBRL Taxonomy Extension Schema Document
|
**
|
|||||
|
101.CAL†
|
XBRL Taxonomy Extension Calculation Linkbase Document
|
**
|
|||||
|
101.DEF
|
XBRL Taxonomy Extension Definition Linkbase Document
|
**
|
|||||
|
101.LAB†
|
XBRL Taxonomy Extension Label Linkbase Document
|
**
|
|||||
|
101.PRE
|
XBRL Taxonomy Extension Presentation Linkbase Document
|
**
|
|||||
|
*
|
Filed herewith.
|
|
**
|
Furnished herewith.
|
|
†
|
In accordance with Rule 406T of Regulation S-T, this interactive data file is deemed not filed or part of a registration statement or prospectus for purposes of Sections 11 or 12 of the Securities Act of 1933, as amended, is deemed not filed for purposes of Section 18 of the Exchange Act of 1934, as amended, and otherwise is not subject to liability under these sections
|
|
‡
|
Indicates a management contract or compensation plan or arrangement.
|
88
TABLE OF CONTENTS
Part IItem 1. BusinessItem 1A. Risk FactorsItem 1B. Unresolved Staff CommentsItem 2. PropertiesItem 3. Legal ProceedingsItem 4. Mine Safety DisclosuresPart IIItem 5. Market For Registrant S Common Equity, Related Stockholder Matters and Issuer Purchases Of Equity SecuritiesItem 6. Selected Financial DataItem 7. Management S Discussion and Analysis Of Financial Condition and Results Of OperationsItem 7A. Quantitative and Qualitative Disclosures About Market RiskItem 8. Financial Statements and Supplementary DataItem 9. Changes in and Disagreements with Accountants on Accounting and Financial DisclosureItem 9A. Controls and ProceduresItem 9B. Other InformationPart IIIItem 10. Directors, Executive Officers and Corporate GovernanceItem 11. Executive CompensationItem 12. Security Ownership Of Certain Beneficial Owners and Management and Related Stockholder MattersItem 13. Certain Relationships and Related Transactions, and Director IndependenceItem 14. Principal Accounting Fees and ServicesPart IVItem 15. Exhibits, Financial Statement SchedulesItem 16. Form 10-k Summary