HOOKER FURNITURE CORP
10-Ks and 10-Qs
|
|
|
|
|
|
|
|
|
|
|
|
|
|
|
|
|
|
|
|
|
|
|
|
|
|
|
|
|
|
|
|
|
|
|
|
|
|
|
|
|
|
|
|
|
|
|
|
|
|
|
|
|
|
|
|
UNITED STATES
SECURITIES AND EXCHANGE COMMISSION
Washington, DC 20549
Form 10-K
Annual Report Pursuant to Section 13 or 15(d) of the Securities Exchange Act of 1934
For the fiscal year ended
February 3, 2013
Commission file number
000-25349
HOOKER FURNITURE CORPORATION
(Exact name of registrant as specified in its charter)
| Virginia | 54-0251350 |
| ( State or other jurisdiction of incorporation or organization) | (I.R.S. Employer Identification Number) |
440 East Commonwealth Boulevard, Martinsville, VA 24112
(Address of principal executive offices, Zip Code)
(276) 632-0459
(Registrant’s telephone number, including area code)
Securities registered pursuant to Section 12(b) of the Act:
| Title of Each Class |
Name of Each Exchange
on Which Registered
|
| Common Stock, no par value | NASDAQ Global Select Market |
Securities registered pursuant to Section 12(g) of the Act:
None
Indicate by check mark if the registrant is a well-known seasoned issuer, as defined in Rule 405 of the Securities Act. Yes
o
No
x
Indicate by check mark if the registrant is not required to file reports pursuant to Section 13 or Section 15(d) of the Act. Yes
o
No
x
Indicate by check mark whether the registrant (1) has filed all reports required to be filed by Section 13 or 15(d) of the Securities Exchange Act of 1934 during the preceding 12 months (or for such shorter period that the registrant was required to file such reports), and (2) has been subject to such filing requirements for the past 90 days. Yes
x
No
o
Indicate by check mark whether the registrant has submitted electronically and posted on its corporate Web site, if any, every Interactive Data File required to be submitted and posted pursuant to Rule 405 of Regulation S-T (§232.405 of this chapter) during the preceding 12 months (or for such shorter period that the registrant was required to submit and post such files). Yes
x
No
o
Indicate by check mark if disclosure of delinquent filers pursuant to Item 405 of Regulation S-K (§229.405 of this chapter) is not contained herein, and will not be contained, to the best of registrant’s knowledge, in definitive proxy or information statements incorporated by reference in Part III of this Form 10-K or any amendment to this Form 10-K.
o
Indicate by check mark whether the registrant is a large accelerated filer, an accelerated filer, a non-accelerated filer, or a smaller reporting company. See the definitions of “large accelerated filer,” “accelerated filer” and “smaller reporting company” in Rule 12b-2 of the Exchange Act. (Check one):
|
Large accelerated Filer
o
|
Accelerated Filer
x
|
|
Non-accelerated Filer
o
|
Smaller reporting company
o
|
|
(Do not check if a smaller reporting company)
|
Indicate by check mark whether the registrant is a shell company (as defined in Rule 12b-2 of the Act). Yes
o
No
x
State the aggregate market value of the voting and non-voting common equity held by non-affiliates computed by reference to the price at which the common equity was last sold, or the average bid and asked price of such common equity, as of the last business day of the registrant’s most recently completed second fiscal quarter: $125.5 million.
Indicate the number of shares outstanding of each of the registrant’s classes of common stock as of April 17, 2013:
| Common stock, no par value | 10,746,106 |
| (Class of common stock) | (Number of shares) |
Documents incorporated by reference: Portions of the registrant’s definitive Proxy Statement for its Annual Meeting of Shareholders scheduled to be held June 4, 2013 are incorporated by reference into Part III.
Hooker
Furniture
Corporation
TABLE OF CONTENTS
|
Part I
|
Page
|
|
|
Item 1.
|
3
|
|
|
Item 1A.
|
9
|
|
|
Item 1B.
|
13
|
|
|
Item 2.
|
14
|
|
|
Item 3.
|
14
|
|
|
Item 4.
|
14
|
|
|
15
|
||
|
Part II
|
||
|
Item 5.
|
16
|
|
|
Item 6.
|
18
|
|
|
Item 7.
|
19
|
|
|
Item 7A.
|
37
|
|
|
Item 8.
|
37
|
|
|
Item 9.
|
38
|
|
|
Item 9A.
|
38
|
|
|
Item 9B.
|
38
|
|
|
Part III
|
||
|
Item 10.
|
39
|
|
|
Item 11.
|
39
|
|
|
Item 12.
|
39
|
|
|
Item 13.
|
39
|
|
|
Item 14.
|
39
|
|
|
Part IV
|
||
|
Item 15.
|
40
|
|
|
43
|
||
|
F-1
|
||
Hooker Furniture Corporation
Hooker Furniture Corporation (the “Company”, “we,” “us” and “our”) is a home furnishings marketing and logistics company offering worldwide sourcing of residential casegoods and upholstery, as well as domestically-produced custom leather and fabric-upholstered furniture. We were incorporated in Virginia in 1924 and are ranked among the nation’s top 10 largest publicly traded furniture sources, based on 2011 shipments to U.S. retailers, according to a 2012 survey published by
Furniture Today
,
a leading trade publication. We are a key resource for residential wood and metal furniture (commonly referred to as “casegoods”) and upholstered furniture. Our major casegoods product categories include home entertainment, home office, accent, dining and bedroom furniture under the Hooker Furniture brand. Our residential upholstered seating companies include Hickory, N.C.-based Bradington-Young (acquired in 2003), a specialist in upscale motion and stationary leather furniture and Bedford, Va.-based Sam Moore Furniture (acquired in 2007), a specialist in upscale occasional chairs, settees, sofas and sectional seating with an emphasis on cover-to-frame customization. An extensive selection of designs and formats along with finish and cover options in each of these product categories makes us a comprehensive resource for retailers primarily targeting the upper-medium price range. Our principal customers are retailers of residential home furnishings that are broadly dispersed throughout the United States. Our customers also include home furniture retailers in Canada and in more than 20 other countries internationally. Our customers include independent furniture stores, specialty retailers, department stores, catalog and internet merchants, interior designers and national and regional chains.
Strategy and Mission
Our mission is to “enrich the lives of the people we touch,” using the following strategy:
|
§
|
To offer world-class style, quality and product value as a complete residential wood, metal and upholstered furniture resource through excellence in product design, manufacturing, global sourcing, marketing, logistics, sales and customer service.
|
|
§
|
To be an industry leader in sales growth and profitability performance, providing an outstanding investment for our shareholders and contributing to the well-being of our customers, employees, suppliers and community.
|
|
§
|
To nurture the relationship-focused, team-oriented and honor-driven corporate culture that has distinguished our company for nearly 90 years.
|
Segments
We have two reportable segments: casegoods and upholstery.
Home furnishings sales account for all of our net sales. The percentages of net sales provided by each of our segments for the fifty-three week fiscal year ended February 3, 2013, and the fifty-two week fiscal years that ended January 29, 2012 and January 30, 2011 were as follows:
|
Segment Sales as a Percentage of Consolidated Net Sales
|
||||||||||||
|
Fiscal Year
|
||||||||||||
|
2013
|
2012
|
2011
|
||||||||||
|
Casegoods segment
|
65 | % | 66 | % | 66 | % | ||||||
|
Upholstery segment
|
35 | % | 34 | % | 34 | % | ||||||
|
Total
|
100 | % | 100 | % | 100 | % | ||||||
Products
Our product lines cover most major style categories, including European and American traditional, contemporary, transitional, urban, country, casual and cottage designs. We offer furniture in a variety of materials, such as various types of wood, metal, leather and fabric, as well as veneer and other natural woven products, often accented with marble, stone, slate, glass, ceramic, brass and/or hand-painted finishes. Products are designed to be attractive to consumers both as individual furniture pieces and as pieces within whole-home collections. Our furniture is designed and marketed both as stand-alone products and as part of a group of products within multi-piece groups or broader collections offering a unifying style, design theme and finish.
Major casegoods product categories include home entertainment, home office, accent, dining and bedroom furniture which are marketed under the Hooker Furniture brand name, as well as “private label” products marketed under a retailer’s brand name. Our casegoods are typically designed for and marketed in the medium to upper-medium price range.
Bradington-Young markets its products under the Bradington-Young and Seven Seas by Bradington-Young brand names and offers a broad variety of residential leather and fabric upholstered furniture and specializes in leather reclining and motion chairs, sofas, club chairs and executive desk chairs. Bradington-Young offers approximately 200 leather selections and over 200 fabric selections for domestically produced upholstered furniture. Generally, Bradington-Young-branded products are domestically produced, while Seven Seas by Bradington-Young branded products are imported and targeted at the medium and upper-medium price ranges.
Sam Moore Furniture’s products are marketed under the Sam Moore brand name and offer upscale occasional chairs, sofas and other seating with an emphasis on fabric-to-frame customization in the upper-medium to high-end price niches. Sam Moore offers approximately 300 different styles of upholstered products in over 550 fabric selections and over 30 leather selections, including customer supplied upholstery coverings commonly referred to as “COM” or customer-owned material. Domestically produced upholstered furniture is targeted at the upper-medium and upper price ranges.
In an effort to broaden the appeal of our line to both consumers and retailers, over the past few years we have offered a “good-better-best” merchandising assortment. Broadening our merchandising price range has made us a more complete resource for our established dealers and has provided new opportunities with retailers who are positioned above or below our historical price niche. While still adding some starting price points in most categories, we continue to focus on the upper-medium price points and styling through premium, high-styled collections.
During the first half of fiscal 2014, we expect to launch “H Contract”, a new division of our company. H Contract will supply upholstered seating and casegoods to upscale senior living facilities throughout the country. Under the direction of a 20-year health care furniture veteran, this division will work with designers specializing in the contract industry to provide functional furniture for senior living facilities that meets the style and comfort expectations of today’s retirees.
During fiscal 2014, we also expect to launch our “Homeware” product line. Homeware is being developed to address the needs of younger and more mobile furniture customers, as well as those living in urban or smaller spaces. Homeware will feature modular upholstered and casegoods products designed to be assembled in minutes by the consumer, with no tools or hardware required. We expect to market the products online and by catalog and ship these products by parcel delivery services directly to the consumer’s residence. Using patented connectors designed by an experienced furniture engineer and designer, we expect the consumer will be able to assemble and disassemble these products in minutes, moving them easily from residence to residence, room to room, or up staircases and elevators in high-rise apartment and condominium complexes. In addition, alternative design elements, arm and leg styles and covers will allow consumers to transform the furnishings as their tastes and life stages evolve.
Product Life Cycle
The product life cycle for home furnishings continues to shorten as consumers demand innovative new features, functionality, style, finishes, and fabrics that will enhance their lifestyle while providing value and durability. New styles in each of our product categories are designed and developed semi-annually to replace discontinued products and collections, and in some cases, to enter new product or style categories. Our collaborative product design process begins with the marketing team identifying customer needs and trends and then conceptualizing product ideas and features. A variety of sketches are produced, usually by independent designers, from which prototype furniture pieces are built. We invite some of our independent sales representatives and a representative group of retailers to view and critique these prototypes. Based on this input, we may modify the designs and then prepare samples for full-scale production. We generally introduce new product styles at the International Home Furnishings Market held each Fall and Spring in High Point, N.C., and support new product launches with promotions, public relations, product brochures, point-of-purchase consumer catalogs and materials and online marketing through our websites, as well as social media marketing through venues such as Facebook
®
, Twitter
®
, Pinterest
®
and YouTube
®
. The flexibility of both our global sourcing business model and the quick delivery times provided by our domestic upholstery manufacturing presence give us the ability to offer a wide range of styles, items and price points to a variety of retailers serving a range of consumer markets. Based on sales and market acceptance, we believe our products represent good value, and that the style and quality of our furniture compares favorably with more premium-priced products.
Sourcing
Imported Products
We have sourced products from foreign manufacturers since 1986. Imported casegoods and upholstered furniture together accounted for approximately 73% of net sales in fiscal 2013, 76% of net sales in fiscal 2012 and 75% of net sales in fiscal 2011. We import finished furniture in a variety of styles, materials and product lines. We believe the best way to leverage our financial strength and differentiate our import business from the industry is through innovative and collaborative design, extensive product lines, compelling products, value, consistent quality, excellent customer service, easy ordering and quick delivery through world-class global logistics and distribution systems.
We import products primarily from China, Vietnam and Indonesia. Because of the large number and diverse nature of the foreign factories from which we source our imported products, we have significant flexibility in the placement of products in any particular factory or country. Factories located in China and Vietnam are our primary resource for imported furniture. In fiscal 2013, imported products sourced from China accounted for approximately 80% of import purchases. The factory in China from which we directly source the most product, accounted for approximately 50% of our worldwide purchases of imported product. A disruption in our supply chain from this factory, or from China or Vietnam in general, could significantly compromise our ability to fill customer orders for products manufactured at that factory or in that country. If such a disruption were to occur, we believe that we would have sufficient inventory currently on hand and in transit to our U.S. warehouses in Martinsville, VA to adequately meet demand for approximately five and a half months, with up to an additional three and a half months available for immediate shipment from our primary Asian warehouse. Also, with the broad spectrum of product we offer, we believe that, in some cases, buyers could be offered similar product available from alternative sources. We believe we could, most likely at higher cost, source most of the products currently sourced in China or Vietnam from factories in other countries and could produce certain upholstered products domestically at our own factories. However, supply disruptions and delays on selected items could occur for up to five to six months. If we were to be unsuccessful in obtaining those products from other sources or at a comparable cost, then a disruption in our supply chain from our largest import furniture supplier, or from China or Vietnam in general, could decrease our sales, earnings and liquidity. Given the capacity available in China, Vietnam and other low-cost producing countries, we believe the risks from these potential supply disruptions are manageable.
Our imported furniture business is subject to the usual risks inherent in importing products manufactured abroad, including, but not limited to, supply disruptions and delays, currency exchange rate fluctuations, economic and political developments and instability, as well as the laws, policies and actions of foreign governments and the United States affecting trade, including tariffs.
Manufacturing and Raw Materials
At February 3, 2013, we operated approximately 465,000 square feet of manufacturing and supply plant capacity in North Carolina and Virginia for our domestic upholstered furniture production. We consider the machinery and equipment at these locations to be generally modern and well-maintained.
We believe there is a viable future for domestically produced upholstery, particularly in the upper and upper-medium price points, which provide two key competitive advantages compared to imported upholstery:
|
§
|
the ability to offer customized upholstery combinations to the upscale consumer and interior design trade; and
|
|
§
|
the ability to offer quick four to six-week product delivery of custom products.
|
Significant materials used in manufacturing upholstered furniture products include leather, fabric, foam, wooden frames and metal mechanisms. Most of the leather is imported from Italy, South America and China, and is purchased as full hides and cut and sewn in our facilities or is purchased as pre-cut and sewn kits processed by our vendors to our pattern specifications.
We believe that our sources for raw materials are adequate and that we are not dependent on any one supplier. Hooker’s five largest suppliers accounted for approximately 40% of our raw materials supply purchases for domestic upholstered furniture manufacturing operations in fiscal 2013. One supplier accounted for approximately 14% of our raw material purchases. Should disruptions with this supplier occur, we believe we could successfully source these products from other suppliers without significant disruptions to our operations.
Marketing
We utilize approximately 80,000 square feet of showroom space at the International Home Furnishings Market in High Point, N.C. to introduce new products and collections and increase sales of existing products during the furniture industry’s Spring and Fall international furniture pre-markets and markets. In the past, this space was divided into two showrooms, one for the casegoods segment and another for the upholstery segment. During fiscal 2013, we moved into one slightly smaller but more favorably located showroom which allows us to present our new products, collections and marketing programs in a more coordinated and efficient manner. We support new product launches with promotions, public relations, product brochures, point-of-purchase consumer catalogs and materials and online marketing through our websites, as well as social media marketing through venues such as Facebook
®
, Twitter
®
, Pinterest
®
and YouTube
®
. We schedule purchases of imported furniture and the production of domestically manufactured upholstered furniture based upon actual and anticipated orders and product acceptance at the Spring and Fall markets.
Realizing that the emerging young “millennial” consumer’s shopping preferences are vastly different from our core “baby boomer” customers, and in response to a shift of volume and shopping activity to the Internet, we launched a new retailer partnership program in late fiscal 2013 to help our retailers realign their business models to these new retail realities. “P3” is an integrated, strategic and web-centric retail partnership program. Through P3, we are assisting our retailers in setting up local e-marketing and e-commerce through an online “iStore.” In addition to the build-out of the iStore, the P3 program also offers ongoing training and service, as well as financial and marketing support. The first of these iStores went live in March of 2013.
Warehousing and Distribution
We sell our branded products through over 65 independent North American sales representatives and 3 foreign sales representatives, primarily to retailers of residential home furnishings, who are broadly dispersed throughout the United States, as well as home furniture retailers located in Canada and over 20 countries around the world. The types of retailers we service include independent furniture retailers, department stores, national membership clubs, regional chain stores, catalog merchandisers and E-retailers. We also work directly with several large customers to develop private-label products exclusively for those customers.
We sold to approximately 3,600 customers during fiscal 2013. No single customer accounted for more than 3.5% of our sales in 2013. No significant part of our business is dependent upon a single customer, the loss of which would have a material effect on our business. However, the loss of several of our major customers could have a material impact on our business. In addition to our broad domestic customer base, over 4% of our sales in fiscal 2013 were to international customers. We believe our broad network of retailers and independent sales representatives reduces our exposure to regional recessions and allows us to capitalize on emerging trends in channels of distribution.
We distribute furniture to retailers from our distribution centers and warehouses in Virginia and North Carolina and directly from Asia via our Container Direct from factory program. We have a warehousing and distribution arrangement in China with our largest supplier of imported products. Our warehouse and distribution facility in China is owned by the supplier and operated by the supplier and a third party utilizing a global warehouse management system that updates daily our central inventory management and order processing systems. Under the Container Direct program, we offer directly to retailers in the U.S. a focused and in-stock mix of over 350 of our best selling items sourced from our largest suppliers. The program features an internet-based product ordering system and a delivery notification system that is easy to use and available to pre-registered dealers. In addition, we also ship containers directly from a variety of other suppliers in Asia. We strive to provide imported and domestically produced furniture on-demand for our dealers. During fiscal year 2013, we shipped 71% of all casegoods orders and approximately 60% of all upholstery orders within 30 days of order receipt. It is our policy and industry practice to allow order cancellation for casegoods up to the time of shipment; therefore, customer orders for casegoods are not firm. However, domestically produced upholstered products are predominantly custom-built and shipped within six to eight weeks after an order is received and consequently, cannot be cancelled once the leather or fabric has been cut.
For imported products, Hooker generally negotiates firm pricing with its foreign suppliers in U.S. Dollars, typically for a term of at least one year. We accept the exposure to exchange rate movements beyond these negotiated periods. We do not use derivative financial instruments to manage this risk but could choose to do so in the future. Since we transact our imported product purchases in U.S. Dollars, a relative decline in the value of the U.S. Dollar could increase the price we pay for imported products beyond the negotiated periods. We generally expect to reflect substantially all of the effects of any price increases from suppliers in the prices we charge for imported products. These price changes could adversely impact sales volume and profit margin during affected periods. Conversely, a relative increase in the value of the U.S. Dollar could decrease the cost of imported products and favorably impact net sales and profit margins during affected periods. See also “Item 7A. Quantitative and Qualitative Disclosures About Market Risk.”
Working Capital Practices
The following describes our working capital practices:
Inventory:
We generally import casegoods inventory and certain upholstery items to stock in order to meet the delivery requirements of our customers, our internal in-stock goals and minimum
purchase requirements from our sourcing partners. We do not inventory significant amounts of domestically produced upholstery, as most of these products are built to order and are shipped shortly after their manufacture.
Accounts receivable:
Substantially all of our trade accounts receivable are due from retailers and dealers that sell residential home furnishings, which consist of a large number of entities with a broad geographic dispersion. We regularly perform credit evaluations of our customers and generally do not require collateral. For qualified customers, we offer payment terms, generally requiring payment 30 days from shipment. However, we may offer extended payment terms in certain circumstances, including to promote sales of our products. Our upholstery segment factors substantially all of its receivables, in most cases on a non-recourse basis.
Accounts payable:
Payment for our imported products is generally due either fourteen days after our quality audit inspections are complete or upon invoice presentation, which typically occurs at time of shipment. Payment terms for domestic raw materials and non-inventory related charges vary, but are generally 30 days from invoice date.
Order Backlog
At February 3, 2013, our backlog of unshipped orders for our casegoods and upholstery segments was $16.6 million or approximately 6.0 weeks of casegoods sales and $10.4 million or approximately 7.0 weeks of upholstery sales, respectively. We consider unshipped order backlogs to be one helpful indicator of sales for the upcoming 30-day period, but because of our relatively quick delivery and our cancellation policy, we do not consider order backlogs to be a reliable indicator of expected long-term business.
Seasonality
In general, the summer months are the slowest for both of our operating segments, especially for leather upholstery sales in our upholstery segment. We believe that consumer home furnishings purchases are driven by an array of factors, including general economic conditions such as:
|
§
|
consumer confidence;
|
|
§
|
availability of consumer credit;
|
|
§
|
energy and other commodity prices; and
|
|
§
|
housing and mortgage markets
;
|
as well as lifestyle-driven factors such as changes in:
|
§
|
fashion trends;
|
|
§
|
disposable income; and
|
|
§
|
household formation and turnover.
|
Competition
The furniture industry is highly competitive and includes a large number of foreign and domestic manufacturers and importers, none of which dominates the market in our price points. While the markets in which we compete include a large number of relatively small and medium-sized manufacturers, certain competitors have substantially greater sales volumes and financial resources than we do. U.S. imports of furniture produced overseas, such as from China, have stabilized in recent years; however, some overseas companies have increased their presence in the U.S. during that period, both through wholesale distributors based in the U.S. and direct shipments to U.S. retailers.
The primary competitive factors for home furnishings in our price points include price, style, availability, service, quality and durability. We believe our design capabilities, ability to import and/or manufacture upholstered furniture, product value, longstanding customer and supplier relationships, significant distribution and inventory capabilities, ease of ordering, financial strength, experienced management and customer support are significant competitive advantages.
Employees
As of February 3, 2013, we had approximately 600 full-time employees. None of our employees are represented by a labor union. We consider our relations with our employees to be good.
Patents and Trademarks
The Hooker Furniture, Bradington-Young, Sam Moore and Opus Designs by Hooker Furniture trade names represent many years of continued business. We believe these trade names are well-recognized and associated with quality and service in the furniture industry. We also own a number of patents and trademarks, both domestically and internationally, none of which is considered to be material.
Hooker, the “H” logo, Bradington-Young, the “B-Y” logo, Sam Moore, H Contract, Homeware, Sam Moore Furniture Industries, Sam Moore Furniture, LLC, America’s Premier Chair Specialist, America’s Chairmaker for over 70 Years, Opus Designs by Hooker Furniture, Rhapsody, Abbott Place, Beladora, Belle Vista, Felton, Grandover, Harbour Pointe, Mélange, Primrose Hill, Sanctuary, North Hampton, Kemperton, Kendra, Legends, Summerglen, Trilogy, Vineyard, Villagio, Chatham, Brookhaven, Belle Grove, Villa Grande, Villa Florence, Fairview, Mirabel, Danforth, Small Office Solutions, Preston Ridge, Ava, Wexford Square, Waverly Place, Sectional Sofas by Design, Accommodations, Seven Seas, Seven Seas Seating, SmartLiving ShowPlace, SmartWorks Home Office, SmartWorks Home Center and The Great Entertainers are trade names or trademarks of Hooker Furniture Corporation.
Governmental Regulations
Our company is subject to U.S. federal, state, and local laws and regulations in the areas of safety, health, and environmental pollution controls, as well as U.S. and international trade laws and regulations. Compliance with these laws and regulations has not in the past had any material effect on our earnings, capital expenditures, or competitive position; however, the effect of compliance in the future cannot be predicted. We believe we are in material compliance with applicable U.S. and international laws and regulations.
Additional Information
You may visit us online at www.hookerfurniture.com, www.bradington-young.com, and www.sammoore.com. We make available, free of charge through our website, our annual report on Form 10-K, quarterly reports on Form 10-Q, current reports on Form 8-K, amendments to those reports, and other documents as soon as practical after they are filed with or furnished to the Securities and Exchange Commission. A free copy of our annual report on Form 10-K may also be obtained by contacting Robert W. Sherwood, Vice President - Credit, Secretary and Treasurer at BSherwood@hookerfurniture.com or by calling 276-632-2133.
Forward-Looking Statements
Certain statements made in this report, including under “Item 1 - Business” and “Item 7 - Management’s Discussion and Analysis of Financial Condition and Results of Operations,” and in the notes to the consolidated financial statements included in this report are not based on historical facts, but are forward-looking statements. These statements reflect our reasonable judgment with respect to future events and typically can be identified by the use of forward-looking terminology such as “believes,” “expects,” “projects,” “intends,” “plans,” “may,” “will,” “should,” “would,” “could” or “anticipates,” or the negative thereof, or other variations thereon, or comparable terminology, or by discussions of strategy. Forward-looking statements are subject to risks and uncertainties that could cause actual results to differ materially from those in the forward-looking statements. Those risks and uncertainties include but are not limited to:
|
§
|
general economic or business conditions, both domestically and internationally, and instability in the financial and credit markets, including their potential impact on our (i) sales and operating costs and access to financing or (ii) customers and suppliers and their ability to obtain financing or generate the cash necessary to conduct their respective businesses;
|
|
§
|
disruptions involving our vendors or the transportation and handling industries, particularly those affecting imported products, including customs issues, labor stoppages, strikes or slowdowns and the availability of shipping containers and cargo ships;
|
|
§
|
disruptions affecting our Henry County, Virginia warehouses and corporate headquarters facilities;
|
|
§
|
price competition in the furniture industry;
|
|
§
|
changes in domestic and international monetary policies and fluctuations in foreign currency exchange rates affecting the price of our imported products and raw materials;
|
|
§
|
the cyclical nature of the furniture industry, which is particularly sensitive to changes in consumer confidence, the amount of consumers’ income available for discretionary purchases, and the availability and terms of consumer credit;
|
|
§
|
risks associated with the cost of imported goods, including fluctuation in the prices of purchased finished goods and transportation and warehousing costs;
|
|
§
|
adverse political acts or developments in, or affecting, the international markets from which we import products, including duties or tariffs imposed on those products;
|
|
§
|
risks associated with domestic manufacturing operations, including fluctuations in capacity utilization and the prices and availability of key raw materials, as well as changes in transportation, warehousing and domestic labor costs and environmental compliance and remediation costs;
|
|
§
|
our ability to successfully implement our business plan to increase sales and improve financial performance;
|
|
§
|
the direct and indirect costs associated with the implementation of our Enterprise Resource Planning system, including costs resulting from unanticipated disruptions to our business;
|
|
§
|
achieving and managing growth and change, and the risks associated with new business lines, acquisitions, restructurings, strategic alliances and international operations;
|
|
§
|
risks associated with distribution through third-party retailers, such as non-binding dealership arrangements;
|
|
§
|
capital requirements and costs;
|
|
§
|
competition from non-traditional outlets, such as catalog and internet retailers and home improvement centers;
|
|
§
|
changes in consumer preferences, including increased demand for lower-quality, lower-priced furniture due to declines in consumer confidence and/or discretionary income available for furniture purchases and the availability of consumer credit; and
|
|
§
|
higher than expected costs associated with product quality and safety, including regulatory compliance costs related to the sale of consumer products and costs related to defective or non-compliant products.
|
Any forward-looking statement that we make speaks only as of the date of that statement, and we undertake no obligation, except as required by law, to update any forward-looking statements whether as a result of new information, future events or otherwise.
Our business is subject to a variety of risks. The risk factors detailed below should be considered in conjunction with the other information contained in this annual report on Form 10-K. If any of these risks actually materialize, our business, financial condition and future prospects could be negatively impacted. These risks are not the only ones we face. There may be additional risks that are presently unknown to us or that we currently believe to be immaterial that could affect our business.
We rely on offshore sourcing, particularly from China, for predominantly all of our casegoods furniture products and for a significant portion of our upholstered products. Consequently:
|
§
|
A disruption in supply from China or from our most significant Chinese supplier could adversely affect our ability to timely fill customer orders for these products and decrease our sales, earnings and liquidity.
|
In fiscal 2013, imported products sourced from China accounted for approximately 80% of our import purchases and the factory in China from which we directly source the largest portion of our import products accounted for approximately 50% of our worldwide purchases of imported products. A disruption in our supply chain from this factory, or from China in general, could significantly impact our ability to fill customer orders for products manufactured at that factory or in that country. If such a disruption were to occur, we believe that we would have sufficient inventory currently on hand and in transit to our U.S. warehouses in Martinsville, VA to adequately meet demand for approximately five and a half months with up to an additional three and a half months available for immediate shipment from our warehouses in Asia. We believe that we could, most likely at higher cost, source most of the products currently sourced in China from factories in other countries and could produce certain upholstered products domestically at our own factories. However, supply disruptions and delays on selected items could occur for up to five to six months before remedial measures could be implemented. If we were to be unsuccessful in obtaining those products from other sources or at comparable cost, a disruption in our supply chain from our largest import furniture supplier, or from China in general, could decrease our sales, earnings and liquidity.
|
§
|
Our dependence on non-U.S. suppliers could, over time, adversely affect our ability to service customers, which could decrease our sales, earnings and liquidity.
|
We rely exclusively on non-U.S. suppliers for our casegoods furniture products and for a significant portion of our upholstered products. Our non-U.S. suppliers may not provide goods that meet our quality, design or other specifications in a timely manner and at a competitive price. If our suppliers do not meet our specifications, we may need to find alternative vendors, potentially at a higher cost, or may be forced to discontinue products. Also, delivery of goods from non-U.S. vendors may be delayed for reasons not typically encountered for domestically manufactured furniture, such as shipment delays caused by customs issues, labor issues, port-related issues such as weather, congestion or port equipment, decreased availability of shipping containers and/or the inability to secure space aboard shipping vessels to transport our products. Our failure to timely fill customer orders due to an extended business interruption for a major non-U.S. supplier, or due to transportation issues, could negatively impact existing customer relationships and decrease our sales, earnings and liquidity.
|
§
|
Our inability to accurately forecast demand for our imported products could cause us to purchase too much, too little or the wrong mix of inventory, which could decrease our sales, earnings and liquidity.
|
Manufacturing and delivery lead times for our imported products necessitate that we make forecasts and assumptions regarding current and future demand for these products. If our forecasts and assumptions are inaccurate, we may purchase excess or insufficient amounts of inventory. If we purchase too much or the wrong mix of inventory, we may be forced to sell it at lower margins, which could decrease sales, earnings and liquidity. If we purchase too little or the wrong mix of inventory, we may not be able to fill customer orders and may lose market share and weaken or damage customer relationships which could decrease our sales, earnings and liquidity.
|
§
|
Supplier transitions due to cost or quality competitiveness could result in longer lead times and shipping delays, which could decrease our sales, earnings and liquidity.
|
Inflation concerns, (and to a lesser extent quality and supplier viability concerns), affecting some of our imported product suppliers located in China have prompted us to source more of our products from lower cost and/or higher quality suppliers located in other Asian countries, such as Vietnam and Indonesia; and we expect this transition away from suppliers located in China to continue. This transition involves significant planning and coordination by and between the Company and our new suppliers in these countries. Despite our best efforts and those of our new sourcing partners, these transition efforts are likely to result in longer lead times and shipping delays, which could decrease our sales, earnings and liquidity.
|
§
|
Changes in the value of the U.S. Dollar compared to the currencies for the countries from which we obtain our products could adversely affect our sales, earnings and liquidity.
|
For imported products, we generally negotiate firm pricing with our foreign suppliers in U.S. Dollars, typically for periods of at least one year. We accept the exposure to exchange rate movements beyond these negotiated periods. We do not use derivative financial instruments to manage this risk but could choose to do so in the future. Since we transact our imported product purchases in U.S. Dollars, a relative decline in the value of the U.S. Dollar could increase the price we must pay for imported products beyond the negotiated periods. These price changes could decrease our sales, earnings and liquidity during affected periods.
|
§
|
We are subject to changes in foreign government regulations and in the political, social and economic climates of the countries from which we source our products, which could decrease our sales, earnings and liquidity.
|
Changes in political, economic, and social conditions, as well as in the laws and regulations in the foreign countries from which we source our products could decrease our sales, earnings and liquidity. These changes could make it more difficult to provide products and service to our customers or could increase the cost of those products. International trade regulations and policies of the United States and the countries from which we source finished products could adversely affect us. Imposition of trade sanctions relating to imports, taxes, import duties and other charges on imports affecting our products could increase our costs and decrease our earnings. For example since 2004, the U.S. Department of Commerce has imposed tariffs on wooden bedroom furniture coming into the United States from China. In this case, none of the rates imposed have been of sufficient magnitude to alter our import strategy in any meaningful way; however, these and other tariffs are subject to review and could be implemented or increased in the future.
A disruption affecting our Henry County, Virginia warehouse, distribution or headquarters facilities could disrupt our business and decrease our sales, earnings and liquidity.
Our Henry County, Virginia facilities are critical to our success. Our Henry County, Virginia warehouses housed approximately 51% of our consolidated inventories at February 3, 2013, with approximately 28% stored at our Central Distribution Center (CDC) facility also located in Henry County, Virginia. During fiscal 2013, approximately 55% of our invoiced sales were shipped out of our Henry County, VA facilities, with 40% shipped out of the CDC. Additionally, our corporate headquarters, which houses all of our corporate administration, sourcing, sales, finance, product design, customer service and traffic functions for our imported products is located in this area. Any disruption affecting the CDC facility or a combination of our other facilities in this area, for even a relatively short period of time, could adversely affect our ability to ship our imported furniture products and disrupt our business, which could decrease our sales, earnings and liquidity.
The implementation of our Enterprise Resource Planning system could disrupt our business which could decrease our sales, earnings and liquidity.
We are in the process of implementing a Company-wide Enterprise Resource Planning (ERP) system. Our ERP system implementation may not result in improvements that outweigh its costs and may disrupt our operations. Our inability to mitigate existing and future disruptions could decrease our sales, earnings and liquidity. The ERP system implementation subjects us to substantial costs and inherent risks associated with migrating from our legacy systems. These costs and risks could include, but are not limited to:
|
§
|
significant capital and operating expenditures;
|
|
§
|
disruptions to our domestic and international supply chains;
|
|
§
|
inability to fill customer orders accurately and on a timely basis, or at all;
|
|
§
|
inability to process payments to suppliers, vendors and associates accurately and in a timely manner;
|
|
§
|
disruption of our internal control structure;
|
|
§
|
inability to fulfill our SEC or other governmental reporting requirements in a timely or accurate manner;
|
|
§
|
inability to fulfill federal, state and local tax filing requirements in a timely or accurate manner; and
|
|
§
|
increased demands on management and staff time to the detriment of other corporate initiatives.
|
The interruption or failure of our information systems or information technology infrastructure could adversely impact our business, which could decrease our sales, earnings and liquidity.
Our information systems (software) and information technology (hardware) infrastructure platforms and those of third parties providing these services to us, facilitate and support every facet of our business, including the sourcing of raw materials and finished goods, planning, manufacturing, warehousing, customer service, shipping, accounting and human resources. Our systems and those of third parties providing services to us are vulnerable to disruption or damage caused by a variety of factors including, but not limited to, power disruptions or outages, natural disasters, computer system or network failures, viruses or malware, physical or electronic break-ins, unauthorized access and cyber-attacks. If these information systems are interrupted or fail, our operations may be adversely affected, which could decrease our sales, earnings and liquidity.
If demand for our domestically manufactured upholstered furniture declines and we respond by realigning manufacturing, our near-term earnings could decrease.
Our domestic manufacturing operations make only upholstered furniture. A decline in demand for our domestically produced upholstered furniture could result in the realignment of domestic manufacturing operations and capabilities and the implementation of cost savings programs. These programs could include the consolidation and integration of facilities, functions, systems and procedures. We may decide to source certain products from other suppliers instead of continuing to manufacture them. These realignments and cost savings programs typically involve initial upfront costs and could result in decreases in our near-term earnings before the expected cost savings are realized, if they are realized at all. We may not always accomplish these actions as quickly as anticipated and may not fully achieve the expected cost savings.
We may experience impairment of our long-lived assets, which would decrease our earnings and net worth.
Accounting rules require that long-lived assets be tested for impairment when circumstances indicate, but at least annually. At February 3, 2013 we had $24.1 million in net long-lived assets, consisting primarily of property, plant and equipment, trademarks and trade names. The outcome of impairments testing could result in the write-down of all or a portion of the value of these assets. A write-down of our assets would, in turn, reduce our earnings and net worth. Over the past three fiscal years, we have written down an aggregate of approximately $2.2 million in long lived assets. It is possible that we will have additional write-downs in the future, resulting in additional reductions to our earnings and net worth. Factors which may lead to additional write-downs of our long lived assets include, but are not limited to:
|
§
|
A significant decrease in the market value of a long-lived asset;
|
|
§
|
A significant adverse change in the extent or manner in which a long-lived asset group is being used, or in its physical condition;
|
|
§
|
A significant adverse change in the legal factors or in the business climate that could affect the value of a long-lived asset, including an adverse action or assessment by a regulator;
|
|
§
|
An accumulation of costs significantly in excess of the amount originally expected to acquire or construct a long-lived asset;
|
|
§
|
A current period operating or cash flow loss or a projection or forecast that demonstrates continuing losses associated with a long-lived asset’s use; and
|
|
§
|
A current expectation that more-likely-than-not, a long-lived asset will be sold or otherwise disposed of significantly before the end of its previously estimated useful life.
|
We may not be able to maintain or raise prices in response to inflation and increasing costs.
Competitive and market forces could prohibit future successful price increases for our products in order to offset increased costs of finished goods, raw materials, freight and other product-related costs, which could decrease our earnings and liquidity.
Economic downturns could result in decreased sales, earnings and liquidity.
The furniture industry is particularly sensitive to cyclical variations in the general economy and to uncertainty regarding future economic prospects. Home furnishings are generally considered a postponable purchase by most consumers. Economic downturns could affect consumer spending habits by decreasing the overall demand for home furnishings. These events could also impact retailers, our primary customers, possibly resulting in a decrease in our sales, earnings and liquidity. Changes in interest rates, consumer confidence, new housing starts, existing home sales, the availability of consumer credit and geopolitical factors have particularly significant effects on us. A recovery in our sales could lag significantly behind a general recovery in the economy after an economic downturn due to the postponable nature and relatively significant cost of home furnishings purchases.
We may lose market share due to competition, which likely would decrease our sales, earnings and liquidity.
The furniture industry is very competitive and fragmented. We compete with numerous domestic and foreign residential furniture sources. Some competitors have greater financial resources than we have and often offer extensively advertised, well-recognized, branded products. Competition from foreign sources has increased dramatically over the past decade. We may not be able to meet price competition or otherwise respond to competitive pressures, including increases in supplier and production costs. Also, due to the large number of competitors and their wide range of product offerings, we may not be able to continue to differentiate our products (through value and styling, finish and other construction techniques) from those of our competitors. In addition, some large furniture retailers are sourcing directly from Asian furniture factories. Over time, this practice may expand to smaller retailers. As a result, we are continually subject to the risk of losing market share, which could decrease our sales, earnings and liquidity.
Failure to anticipate or timely respond to changes in fashion and consumer tastes could adversely impact our business and decrease sales, earnings and liquidity.
Furniture is a styled product and is subject to rapidly changing fashion trends and consumer tastes, as well as to increasingly shorter product life cycles. If we fail to anticipate or promptly respond to these changes we may lose market share or be faced with the decision of whether to sell excess inventory at reduced prices. This could decrease our sales, earnings and liquidity.
A loss of several large customers through business consolidations, failures or other reasons could result in a decrease in sales, earnings and liquidity.
The loss of several of our major customers through business consolidations, failures or otherwise, could materially adversely affect our sales, earnings and liquidity. Lost sales may be difficult to replace. Amounts owed to us by a customer whose business fails, or is failing, may become uncollectible and we could lose future sales which could decrease our sales, earnings and liquidity.
Our ability to grow and maintain sales and earnings depends on the successful execution of our business strategies.
We are primarily a residential furniture design, sourcing, marketing and logistics company with domestic upholstery manufacturing capabilities. Our ability to grow and maintain sales and earnings depends on the continued correct selection and successful execution and refinement of our overall business strategies and business systems for designing, marketing, sourcing, distributing and servicing our products. We must also make good decisions about product mix and inventory availability targets. Since we are completely dependent on non-U.S. suppliers for all of our casegoods furniture products and a significant portion for our upholstered products, we must continue to enhance relationships and business systems that allow us to continue to work more efficiently and effectively with our global sourcing suppliers. We must also continue to evaluate the appropriate mix between domestic manufacturing and foreign sourcing for upholstered products. All of these factors affect our ability to grow and maintain sales, earnings and liquidity.
Fluctuations in the price, availability or quality of raw materials for our domestically manufactured upholstered furniture could cause manufacturing delays, adversely affect our ability to provide goods to our customers or increase costs, any of which could decrease our sales, earnings and liquidity.
We use various types of wood, leather, fabric, foam and other filling material, high carbon spring steel, bar and wire stock and other raw materials in manufacturing upholstered furniture. We depend on outside suppliers for raw materials and must obtain sufficient quantities of quality raw materials from these suppliers at acceptable prices and in a timely manner. We do not have long-term supply contracts with our suppliers. Unfavorable fluctuations in the price, quality or availability of required raw materials could negatively affect our ability to meet the demands of our customers. The inability to meet customers’ demands could result in the decreased sales, earning and liquidity. We may not always be able to pass along price increases in raw materials to our customers due to competition and market pressures.
We may engage in acquisitions and investments in companies, form strategic alliances and pursue new business lines. These activities could disrupt our business, dilute our earnings per share, decrease the value of our common stock and decrease our earnings and liquidity.
We may acquire or invest in businesses that offer complementary products and that we believe offer competitive advantages. However, we may fail to identify significant liabilities or risks that could negatively affect us or result in our paying more for the acquired company or assets than they are worth. We may also have difficulty assimilating the operations and personnel of an acquired business into our current operations. Acquisitions may disrupt or distract management from our ongoing business. We may pay for future acquisitions using cash, stock, the assumption of debt, or a combination of these. Future acquisitions could result in dilution to existing shareholders and to earnings per share and decrease the value of our common stock. We may pursue new business lines in which we have limited or no experience or expertise. These pursuits may require substantial capital investment. They may fail outright or fail to produce an adequate return, which could decrease our earnings and liquidity.
None.
Set forth below is information with respect to our principal properties. We believe all of these properties are well-maintained and in good condition. During fiscal 2013, we estimate our upholstery plants operated at approximately 79% of capacity on a one-shift basis. All our production facilities are equipped with automatic sprinkler systems. All facilities maintain modern fire and spark detection systems, which we believe are adequate. We have leased certain warehouse facilities for our distribution and import operations on a short and medium-term basis. We expect that we will be able to renew or extend these leases or find alternative facilities to meet our warehousing and distribution needs at a reasonable cost. All facilities set forth below are active and operational, representing approximately 2.1 million square feet of owned space, leased space or properties utilized under third-party operating agreements.
|
Location
|
Segment Use
|
Primary Use
|
Approximate Size in Square Feet
|
Owned or Leased
|
|||||
| Martinsville, Va. |
Both segments
|
Corporate Headquarters
|
43,000 |
Owned
|
|||||
|
Martinsville, Va.
|
Both segments
|
Distribution and Imports
|
580,000 |
Owned
|
|||||
|
Martinsville, Va.
|
Casegoods
|
Distribution
|
189,000 |
Owned
|
|||||
|
Martinsville, Va.
|
Casegoods
|
Customer Support Center
|
146,000 |
Owned
|
|||||
|
Martinsville, Va.
|
Both segments
|
Distribution
|
300,000 |
Leased (1)
|
|||||
|
High Point, N.C.
|
Both segments
|
Showroom
|
80,000 |
Leased (2)
|
|||||
|
Cherryville, N.C.
|
Upholstery
|
Manufacturing Supply Plant
|
53,000 |
Owned (3)
|
|||||
|
Hickory, N.C.
|
Upholstery
|
Manufacturing
|
91,000 |
Owned (3)
|
|||||
|
Hickory, N.C.
|
Upholstery
|
Manufacturing and Offices
|
36,400 |
Leased (3) (4)
|
|||||
|
Bedford, Va.
|
Upholstery
|
Manufacturing and Offices
|
327,000 |
Owned (5)
|
|||||
|
(1) Lease expires March 31, 2014. May be expanded or contracted by 100,000 square feet on a month-to-month basis.
|
|
(2) Lease expires October 31, 2016.
|
|
(3) Comprise the principal properties of Bradington-Young LLC.
|
|
(4) Lease expires December 15, 2014 and provides for 2 one-year extensions at our election.
|
|
(5) Comprise the principal properties of Sam Moore Furniture LLC.
|
Set forth below is information regarding principal properties we utilize that are owned and operated by third parties.
| Location | Segment Use | Primary Use | Approximate Size in Square Feet | |||||
|
Guangdong, China
|
Casegoods
|
Distribution
|
210,000 | (1) | ||||
|
(1) This property is subject to an operating agreement that expires on July 31, 2013.
|
|
|
We expect to renew the agreement for an additional year.
|
None.
None.
EXECUTIVE
OFFICERS OF
HOOKER FURNITURE CORPORATION
Hooker Furniture’s executive officers and their ages as of April 19, 2013 and the year each joined the company are as follows:
|
Name
|
Age
|
Position
|
Year Joined Company
|
|||
|
Paul B. Toms, Jr.
|
58
|
Chairman and Chief Executive Officer
|
1983
|
|||
|
Paul A. Huckfeldt
|
55
|
Vice President - Finance and Accounting and
Chief Financial Officer
|
2004
|
|||
|
Alan D. Cole
|
63
|
President
|
2007
|
|||
|
Michael W. Delgatti, Jr.
|
59
|
President - Hooker Upholstery, Executive Vice President
Corporate Sales
|
2009
|
Paul B. Toms, Jr. has been Chairman and Chief Executive Officer since December 2000 and also served as President for most of the period from November 2006 to August 2011. Mr. Toms was President and Chief Operating Officer from December 1999 to December 2000, Executive Vice President - Marketing from 1994 to December 1999, Senior Vice President - Sales and Marketing from 1993 to 1994, and Vice President - Sales from 1987 to 1993. Mr. Toms joined the Company in 1983 and has been a Director since 1993.
Paul A. Huckfeldt
has been Vice President - Finance and Accounting since December 2010 and Chief Financial Officer since January 31, 2011. Mr. Huckfeldt served as Corporate Controller and Chief Accounting Officer from January 2010 to January 2011, Manager of Operations Accounting from March 2006 to December 2009 and led the Company’s Sarbanes-Oxley implementation and subsequent compliance efforts from April 2004 to March 2006.
Alan D. Cole
has been President since August 2011. Prior to his promotion, he served as President – Hooker Upholstery from August 2008 to August 2011 and as Executive Vice President – Upholstery Operations from April 2007 to August 2008. Prior to joining the Company, Mr. Cole was President and Chief Executive Officer of Schnadig Corporation, a manufacturer and marketer of a full line of medium-priced home furnishings from 2004 to 2006. Mr. Cole has been President of Parkwest LLC, a real estate development firm from 2002 to the present. Mr. Cole also served as a member of the Company’s Board of Directors in 2003.
Michael W. Delgatti, Jr.
has been President – Hooker Upholstery since August 2011 and Executive Vice-President of Corporate Sales since September 2012. Mr. Delgatti joined the Company in January of 2009 as Executive Vice-President of Hooker Upholstery. Prior to that, Mr. Delgatti served as Executive Vice- President – Sales and Marketing at Southern Furniture Company, a privately-held manufacturer of upholstered furniture, from September 2007 to January 2009 and served as Executive Vice-President-Upholstery and Occasional at Broyhill Furniture, a subsidiary of Furniture Brands International, from June 2005 through August 2007.
Hooker Furniture Corporation
Our stock is traded on the NASDAQ Global Select Market under the symbol “HOFT”. The table below sets forth the high and low sales prices per share for our common stock and the dividends per share we paid with respect to our common stock for the periods indicated.
|
Sales Price Per Share
|
Dividends
|
|||||||||||
|
High
|
Low
|
Per Share
|
||||||||||
|
October 29, 2012 - February 3, 2013
|
$ | 15.19 | $ | 13.27 | $ | 0.10 | ||||||
|
July 30, - October 28, 2012
|
13.77 | 11.35 | 0.10 | |||||||||
|
April 30, - July 29, 2012
|
12.82 | 10.01 | 0.10 | |||||||||
|
January 30 - April 29, 2012
|
13.99 | 11.37 | 0.10 | |||||||||
|
October 31, 2011 - January 29, 2012
|
$ | 12.38 | $ | 9.01 | $ | 0.10 | ||||||
|
August 1 - October 30, 2011
|
10.86 | 7.96 | 0.10 | |||||||||
|
May 2 - July 31, 2011
|
12.50 | 8.25 | 0.10 | |||||||||
|
January 31 - May 1, 2011
|
14.10 | 11.50 | 0.10 | |||||||||
As of February 3, 2013, we had approximately 2,800 beneficial shareholders. In the past, we generally paid dividends on our common stock on or about the last day of February, May, August and November, when declared by the Board of Directors, to shareholders of record approximately two weeks earlier. However, beginning in fiscal 2014, we expect that any future regular quarterly dividends will be paid and declared in the months of March, June, September, and December, in order to more closely coincide with our fiscal quarters. Although we presently intend to continue to declare cash dividends on a quarterly basis for the foreseeable future, the determination as to the payment and the amount of any future dividends will be made by the Board of Directors from time to time and will depend on our then-current financial condition, capital requirements, results of operations and any other factors then deemed relevant by the Board of Directors.
Purchase of Equity Securities by the Issuer and Affiliated Purchasers
During the fiscal 2013 first quarter, our Board of Directors authorized the repurchase of up to $12.5 million of the Company’s common shares. During the second and third quarters of fiscal 2013, we used an aggregate of $671,000 to purchase 57,700 shares of our common stock at an average price of $11.63 per share. No shares were purchased during the fiscal 2013 fourth quarter. Approximately $11.8 million remains available under the board’s authorization. For additional information regarding this repurchase authorization, see the “Share Repurchase Authorization” section in Management’s Discussion and Analysis of Financial Condition and Results of Operations.
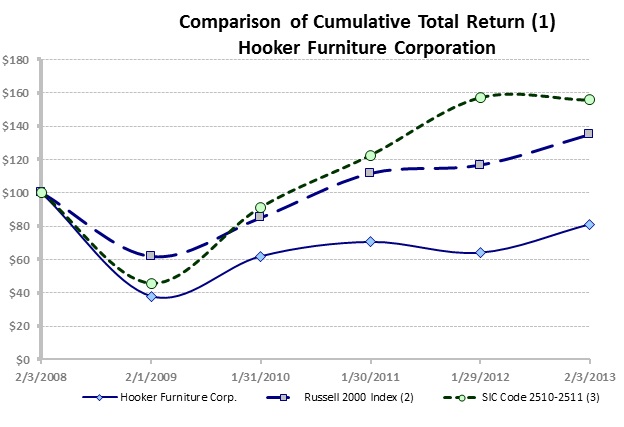
Performance Graph
The following graph compares cumulative total shareholder return for the Company with a broad performance indicator, the Russell 2000
®
Index, and an industry index, the Household Furniture Index, for the period from February 3, 2008 to February 3, 2013.
|
(1)
|
The graph shows the cumulative total return on $100 invested at the beginning of the measurement period in our common stock or the specified index, including reinvestment of dividends.
|
|
(2)
|
The Russell 2000
®
Index, prepared by Frank Russell Company, measures the performance of the 2,000 smallest companies out of the 3,000 largest U.S. companies based on total market capitalization.
|
|
(3)
|
Household Furniture Index as prepared by Zacks Investment Research, Inc. consists of SIC Codes 2510 and 2511. At April 9, 2013, Zacks Investment Research, Inc. reported that these two SIC Codes consisted of Bassett Furniture Industries, Inc., Bestar, Inc., Chromcraft Revington, Inc., Dorel Industries, Inc., Ethan Allen Interiors, Inc., First Choice Products Inc,, Flexsteel Industries, Inc., Furniture Brands International, Inc., Hooker Furniture Corporation, La-Z-Boy, Inc., Leggett & Platt, Inc., Rowe Companies, Sealy Corp., Select Comfort Corp., Stanley Furniture Company, Inc. and Tempur Pedic International, Inc.
|
The following selected financial data for each of our last five fiscal years has been derived from our audited, consolidated financial statements. The selected financial data should be read in conjunction with the consolidated financial statements, including the related notes, and Management’s Discussion and Analysis of Financial Condition and Results of Operations included elsewhere in this report.
|
Fiscal Year Ended (1)
|
||||||||||||||||||||
|
February 3,
|
January 29,
|
January 30,
|
January 31,
|
February 1,
|
||||||||||||||||
|
2013
|
2012
|
2011
|
2010
|
2009
|
||||||||||||||||
|
(In thousands, except per share data)
|
||||||||||||||||||||
|
Income Statement Data:
|
||||||||||||||||||||
|
Net sales
|
$ | 218,359 | $ | 222,505 | $ | 215,429 | $ | 203,347 | $ | 261,162 | ||||||||||
|
Cost of sales
|
165,813 | 173,642 | 168,547 | 154,931 | 200,878 | |||||||||||||||
|
Gross profit
|
52,546 | 48,863 | 46,882 | 48,416 | 60,284 | |||||||||||||||
|
Selling and adminstrative expenses
|
39,606 | 40,375 | 41,022 | 41,956 | 45,980 | |||||||||||||||
|
Restructuring charges (credits) (2)
|
- | - | 1,403 | - | (951 | ) | ||||||||||||||
|
Goodwill and intangible asset impairment charges (3)
|
- | 1,815 | 396 | 1,274 | 4,914 | |||||||||||||||
|
Operating income
|
12,940 | 6,673 | 4,061 | 5,186 | 10,341 | |||||||||||||||
|
Other income (expense), net
|
53 | 272 | 108 | (99 | ) | 323 | ||||||||||||||
|
Income before income taxes
|
12,993 | 6,945 | 4,169 | 5,087 | 10,664 | |||||||||||||||
|
Income taxes
|
4,367 | 1,888 | 929 | 2,079 | 3,754 | |||||||||||||||
|
Net income
|
8,626 | 5,057 | 3,240 | 3,008 | 6,910 | |||||||||||||||
|
Per Share Data:
|
||||||||||||||||||||
|
Basic and diluted earnings per share
|
$ | 0.80 | $ | 0.47 | $ | 0.30 | $ | 0.28 | $ | 0.62 | ||||||||||
|
Cash dividends per share
|
0.40 | 0.40 | 0.40 | 0.40 | 0.40 | |||||||||||||||
|
Net book value per share (4)
|
12.19 | 11.78 | 11.78 | 11.86 | 12.06 | |||||||||||||||
|
Weighted average shares outstanding (basic)
|
10,745 | 10,762 | 10,757 | 10,753 | 11,060 | |||||||||||||||
|
Balance Sheet Data:
|
||||||||||||||||||||
|
Cash and cash equivalents
|
$ | 26,342 | $ | 40,355 | $ | 16,623 | $ | 37,995 | $ | 11,804 | ||||||||||
|
Trade accounts receivable
|
28,272 | 25,807 | 27,670 | 25,894 | 30,261 | |||||||||||||||
|
Inventories
|
49,872 | 34,136 | 57,438 | 36,176 | 60,248 | |||||||||||||||
|
Working capital
|
92,200 | 89,534 | 89,297 | 87,894 | 91,261 | |||||||||||||||
|
Total assets
|
155,823 | 149,171 | 150,411 | 149,099 | 153,467 | |||||||||||||||
|
Long-term debt (including current maturites)
|
- | - | - | - | 5,218 | |||||||||||||||
|
Shareholders' equity
|
131,045 | 127,113 | 126,770 | 127,592 | 129,710 | |||||||||||||||
|
(1)
|
Our fiscal years end on the Sunday closest to January 31. The fiscal years presented above all had 52 weeks, except for the fiscal year ended February 3, 2013, which had 53 weeks.
|
|
(2)
|
We have closed facilities in order to reduce and ultimately eliminate our domestic wood furniture manufacturing capacity and to consolidate our domestic leather upholstered furniture operations. As a result, we recorded restructuring charges and credits, principally for severance and asset impairment, as follows:
|
|
a)
|
in fiscal 2011 we recorded a charge of $1.4 million pretax ($874,000 after tax, or $0.08 per share) related to the consolidation and transfer of Bradington-Young’s Cherryville, NC manufacturing facility and offices to Hickory, NC; and
|
|
b)
|
in fiscal 2009 we recorded credits of $951,000 pretax ($592,000 after tax, or $0.05 per share) to reverse previously accrued employee benefits and environmental costs not expected to be paid with respect to the closing and sale of our Martinsville, VA casegoods manufacturing facility.
|
|
(3)
|
Based on our annual impairment analyses, we have recorded the following goodwill and intangible asset impairment charges:
|
|
a)
|
in fiscal 2012, we recorded intangible asset charges of $1.8 million pretax ($1.1 million after tax or $0.10 per share) on our Bradington-Young trade name;
|
|
b)
|
in fiscal 2011, we recorded intangible asset impairment charges of $396,000 pretax ($247,000 after tax, or $0.02 per share) on our Opus Designs by Hooker Furniture trade name;
|
|
c)
|
in fiscal 2010, we recorded intangible asset impairment charges of $661,000 pretax ($412,000 after tax, or $0.04 per share) on our Opus Designs by Hooker Furniture trade name and $613,000 pretax ($382,000 after tax, or $0.04 per share) on our Bradington-Young trade name; and
|
|
d)
|
in fiscal 2009, we recorded intangible asset impairment charges of $3.8 million pretax ($2.5 million after tax, or $0.22 per share), primarily related to the write-off of goodwill resulting from the acquisition of Opus Designs in 2007 and of Bradington-Young in 2003, and $1.1 million ($685,000 after tax, or $0.06 per share) to write down the Bradington-Young trade name.
|
|
(4)
|
Net book value per share is derived by dividing “shareholders’ equity” by the number of common shares issued and outstanding, excluding unvested restricted shares, all determined as of the end of each fiscal period.
|
The following discussion should be read in conjunction with the selected financial data and the consolidated financial statements, including the related notes, contained elsewhere in this annual report. All references to the Company in this discussion refer to the Company and its consolidated subsidiaries, unless specifically referring to segment information. Unless otherwise indicated, amounts shown in tables are in thousands, except for share and per share data.
Our fiscal years end on the Sunday closest to January 31, in some years (generally once every six years) the fourth quarter will be fourteen weeks long and the fiscal year will consist of fifty-three weeks. For example, the 2013 fiscal year that ended on February 3, 2013 was a 53-week fiscal year. Our quarterly periods are based on thirteen-week “reporting periods” (which end on a Sunday) rather than quarterly periods consisting of three calendar months. As a result, each quarterly period generally is thirteen weeks, or 91 days, long, except as noted above.
The financial statements filed as part of this annual report on Form 10-K include the:
|
§
|
fifty-three week period that began January 30, 2012 and ended on February 3, 2013 (fiscal 2013);
|
|
§
|
fifty-two week period that began January 31, 2011 and ended on January 29, 2012 (fiscal 2012); and
|
|
§
|
fifty-two week period that began February 1, 2010 and ended on January 30, 2011 (fiscal 2011).
|
Nature of Operations
Hooker Furniture Corporation (the “Company”, “we,” “us” and “our”) is a home furnishings marketing and logistics company offering worldwide sourcing of residential casegoods and upholstery, as well as domestically-produced custom leather and fabric-upholstered furniture. We were incorporated in Virginia in 1924 and are ranked among the nation’s top 10 largest publicly traded furniture sources, based on 2011 shipments to U.S. retailers, according to a 2012 survey published by
Furniture Today
a leading trade publication. We are a key resource for residential wood and metal furniture (commonly referred to as “casegoods”) and upholstered furniture. Our major casegoods product categories include home entertainment, home office, accent, dining and bedroom furniture under the Hooker Furniture brand. Our residential upholstered seating companies include Hickory, N.C.-based Bradington-Young (acquired in 2003), a specialist in upscale motion and stationary leather furniture and Bedford, Va.-based Sam Moore Furniture (acquired in 2007), a specialist in upscale occasional chairs, settees, sofas and sectional seating with an emphasis on cover-to-frame customization. An extensive selection of designs and formats along with finish and cover options in each of these product categories makes us a comprehensive resource for residential furniture retailers, primarily targeting the upper-medium price range. Our principal customers are retailers of residential home furnishings that are broadly dispersed throughout the United States. Our customers also include home furniture retailers in Canada and in over 20 other countries internationally. Our customers include independent furniture stores, specialty retailers, department stores, catalog and internet merchants, interior designers and national and regional chains.
Overview
Consumer home furnishings purchases are driven by an array of factors, including general economic conditions such as:
|
§
|
consumer confidence;
|
|
§
|
fashion trends;
|
|
§
|
availability of consumer credit;
|
|
§
|
energy and other commodity prices; and
|
|
§
|
housing and mortgage markets
;
|
as well as lifestyle-driven factors such as changes in:
|
§
|
disposable income;
|
|
§
|
household formation and turnover; and
|
|
§
|
family size.
|
The residential home furnishings industry experienced a significant and persistent decline in demand for its products from 2008 to 2010. Current economic and economic-related factors, such as high unemployment, relatively weak consumer confidence and changing consumer priorities have resulted in a somewhat depressed retail environment for discretionary home furnishings and related purchases. The extended weakness in housing and housing-related industries is beginning to show signs of sustained recovery; however, we expect any recovery in home furnishings to be slow and inconsistent due to the relatively high cost and postponable nature of many home furnishing product purchases.
Results for our domestic upholstery operations, which have significantly higher overhead and fixed costs than our import operations, have been particularly affected by the decline in demand for home furnishings and, except for the first, third and fourth quarters of fiscal 2013, have experienced operating losses since our fiscal 2009 second quarter. Extensive cost reduction efforts over that time have mitigated the losses and have resulted in our upholstery segment returning to operating profitability for fiscal 2013.
Our lower overhead, variable-cost import operations have driven our profitability over the last few years and provide us with the flexibility to respond to changing demand by adjusting inventory purchases from suppliers. Our import model also requires that we transition sourcing among suppliers, often located in different countries or regions, when quality concerns or inflationary pressures diminish the value proposition offered by our current suppliers.
The following are the primary factors that affected our consolidated results of operations for fiscal 2013.
|
§
|
Out-of-stock positions on several key imported items, groups and collections negatively impacted sales and profitability, especially during the first half of fiscal 2013;
|
|
§
|
The sourcing transition from some of our vendors in China to vendors in other Asian countries resulted in longer lead times. Related shipping delays negatively impacted sales and profitability in the first-half of fiscal 2013, and to a lesser extent during the second half of fiscal 2013;
|
|
§
|
Decreased product discounting negatively impacted sales and unit volume in both segments, but drove gross margin improvement. Product discounting and sales volume was higher in the comparable prior-year periods in order to reduce excess and slow-moving inventory;
|
|
§
|
Selling and administrative expenses decreased in absolute terms during fiscal 2013 and were flat as a percentage of net sales due to the factors described below; and
|
|
§
|
Our upholstery segment returned to operating profitability in fiscal 2013 after reporting operating losses since the fiscal 2009 second quarter.
|
Results of Operations
The following table sets forth the percentage relationship to net sales of certain items for the annual periods included in the consolidated statements of income:
|
Fifty-three
|
||||||||||||
|
weeks ended
|
Fifty-two weeks ended
|
|||||||||||
|
February 3,
|
January 29,
|
January 30,
|
||||||||||
|
2013
|
2012
|
2011
|
||||||||||
|
Net sales
|
100.0 | % | 100.0 | % | 100.0 | % | ||||||
|
Cost of sales
|
75.9 | 78.0 | 78.0 | |||||||||
|
Casualty loss
|
- | - | 1.0 | |||||||||
|
Insurance recovery
|
- | - | (0.8 | ) | ||||||||
|
Gross profit
|
24.1 | 22.0 | 21.8 | |||||||||
|
Selling and administrative expenses
|
18.1 | 18.1 | 19.0 | |||||||||
|
Restructuring charges
|
- | - | 0.7 | |||||||||
|
Intangible asset impairment charges
|
- | 0.8 | 0.2 | |||||||||
|
Operating income
|
5.9 | 3.0 | 1.9 | |||||||||
|
Other income, net
|
0.1 | 0.1 | 0.1 | |||||||||
|
Income before income taxes
|
6.0 | 3.1 | 1.9 | |||||||||
|
Income taxes
|
2.0 | 0.8 | 0.4 | |||||||||
|
Net income
|
4.0 | 2.3 | 1.5 | |||||||||
Fiscal 2013 Compared to Fiscal 2012
Net Sales
|
Fifty-three weeks ended
|
Fifty-two weeks ended | |||||||||||||||||||||||
|
February 3, 2013
|
January 29, 2012
|
$ Change
|
% Change
|
|||||||||||||||||||||
| % Net Sales | % Net Sales | |||||||||||||||||||||||
|
Casegoods
|
$ | 141,064 | 64.6 | % | $ | 147,927 | 66.5 | % | $ | (6,863 | ) | -4.6 | % | |||||||||||
|
Upholstery
|
77,295 | 35.4 | % | 74,578 | 33.5 | % | $ | 2,717 | 3.6 | % | ||||||||||||||
|
Consolidated
|
$ | 218,359 | 100.0 | % | $ | 222,505 | 100.0 | % | $ | (4,146 | ) | -1.9 | % | |||||||||||
|
Unit Volume
|
FY13 % Increase vs. FY12
|
Average Selling Price
|
FY13 % Increase vs. FY12
|
|||||||
|
Casegoods
|
(19.7 | %) |
Casegoods
|
17.8 | % | |||||
|
Upholstery
|
(4.25 | %) |
Upholstery
|
7.9 | % | |||||
|
Consolidated
|
(15.8 | %) |
Consolidated
|
15.7 | % | |||||
The decrease in consolidated net sales was principally due to lower unit volume, particularly in our casegoods segment, partially offset by higher average selling prices in both segments. The casegoods sales decrease was driven by out-of-stock positions on several key items, groups and collections in the first half of the 2013 fiscal year and decreased discounting. The out-of-stock positions were primarily due to overly-aggressive inventory reductions that began in fiscal 2012 and continued into the fiscal 2013 first six months. To a lesser extent and consistent with our fiscal 2012 fourth quarter, vendor shifts from China to other Asian countries resulted in the delay of several well-placed new casegoods collections and negatively impacted fiscal 2013 first six month sales. These vendor shifts contributed to the out-of-stock positions and increased the demand for our best-selling, in-stock products. This accelerated demand cycle hastened the out-of-stock position on best sellers. Sales of imported products in fiscal 2012 were driven by heavy discounting, intended to reduce inventory of slow selling and discontinued products. Upholstery net sales increased compared to the same prior-year period, primarily due to increased average selling prices, partially offset by lower unit volume.
Because we report on a fiscal year that ends on the Sunday closest to January 31st of each year, the 2013 fiscal year was one week longer than the comparable 2012 fiscal year. The following table presents average net sales per shipping day in thousands for the 2013 and 2012 fiscal years:
|
Average Net Sales Per Shipping Day
|
||||||||||||
|
Fifty-three weeks ended
|
%
|
Fifty-two weeks ended
|
||||||||||
|
February 3, 2013
|
Change
|
January 29, 2012
|
||||||||||
|
Casegoods
|
$ | 553 | -6.1 | % | $ | 589 | ||||||
|
Upholstery
|
303 | 1.9 | % | 297 | ||||||||
|
Consolidated
|
$ | 856 | -3.8 | % | $ | 886 | ||||||
|
Shipping Days
|
255 | 251 | ||||||||||
Gross Profit
|
Fifty-three weeks ended
|
Fifty-two weeks ended
|
|||||||||||||||||||||||
|
February 3, 2013
|
January 29, 2012
|
$ Change
|
% Change
|
|||||||||||||||||||||
| % Net Sales | % Net Sales | |||||||||||||||||||||||
|
Casegoods
|
$ | 38,054 | 27.0 | % | $ | 37,550 | 25.4 | % | $ | 504 | 1.3 | % | ||||||||||||
|
Upholstery
|
14,492 | 18.8 | % | 11,313 | 15.2 | % | 3,179 | 28.1 | % | |||||||||||||||
|
Consolidated
|
$ | 52,546 | 24.1 | % | $ | 48,863 | 22.0 | % | $ | 3,683 | 7.5 | % | ||||||||||||
As a percentage of net sales, consolidated gross margin increased primarily due to decreased discounting in both segments and lower domestic upholstery manufacturing costs, as a percentage of net sales, partially offset by modestly higher costs on some of our imported products. The higher levels of product discounting in fiscal 2012 were primarily due to efforts to reduce slow-moving inventory levels. In absolute terms, consolidated gross profit increased primarily due to improved upholstery segment performance, partially offset by the decline in casegoods net sales discussed above.
Selling and Administrative Expenses
|
Fifty-three weeks ended
|
Fifty-two weeks ended | |||||||||||||||||||||||
|
February 3, 2013
|
January 29, 2012
|
$ Change
|
% Change
|
|||||||||||||||||||||
| % Net Sales | % Net Sales | |||||||||||||||||||||||
|
Casegoods
|
$ | 26,102 | 18.5 | % | $ | 26,905 | 18.2 | % | $ | (803 | ) | -3.0 | % | |||||||||||
|
Upholstery
|
13,504 | 17.5 | % | 13,470 | 18.1 | % | 34 | 0.3 | % | |||||||||||||||
|
Consolidated
|
$ | 39,606 | 18.1 | % | $ | 40,375 | 18.1 | % | $ | (769 | ) | -1.9 | % | |||||||||||
Casegoods selling and administrative expenses increased as a percentage of net sales primarily due to the net sales decrease discussed above, but decreased in absolute terms, primarily due to:
|
§
|
increased amounts billed to our imported upholstery division for its share of administrative costs compared to prior periods;
|
|
§
|
lower contribution expense, due to lower levels of distressed inventory;
|
|
§
|
lower bad debt expense due to favorable collections experience;
|
|
§
|
reduced advertising and sample expenses, due to cost-cutting measures; and
|
|
§
|
lower sales and design commissions, due to lower net sales.
|
These expense improvements were partially offset by increases in:
|
§
|
bonus expense, due to the reversal of an accrual for long-term performance grant awards in the comparable prior-year period;
|
|
§
|
salary expense, primarily due to an executive promotion and other salary increases; and
|
|
§
|
fees for professional services, due to additional fees for several corporate initiatives.
|
Upholstery selling and administrative expenses decreased as a percentage of net sales, primarily due to decreases in:
|
§
|
salary expense, due to an executive promotion to a corporate position and cost reduction efforts undertaken in fiscal 2012;
|
|
§
|
benefits expense due to decreased headcount and lower health claims; and
|
|
§
|
sample and advertising expenses, due to cost-cutting measures.
|
These decreases were partially offset by an increase in the upholstery segment’s share of Company-wide administrative costs.
Operating Income
| Fifty-three weeks ended | Fifty-two weeks ended | |||||||||||||||||||||||
|
February 3, 2013
|
January 29, 2012
|
$ Change
|
% Change
|
|||||||||||||||||||||
| % Net Sales | % Net Sales | |||||||||||||||||||||||
|
Casegoods
|
$ | 11,953 | 8.5 | % | $ | 10,644 | 7.2 | % | $ | 1,309 | 12.3 | % | ||||||||||||
|
Upholstery
|
987 | 1.3 | % | (3,971 | ) | -5.3 | % | 4,958 | 124.9 | % | ||||||||||||||
|
Consolidated
|
$ | 12,940 | 5.9 | % | $ | 6,673 | 3.0 | % | $ | 6,267 | 93.9 | % | ||||||||||||
Operating profitability increased both as a percentage of net sales and in absolute terms, due to the factors discussed above. The upholstery segment returned to operating profitability during the 2013 fiscal first quarter and, despite a modest operating loss in the fiscal 2013 second quarter, posted an operating profit for fiscal 2013. The upholstery segment has returned to operating profitability due to operational improvements and due to the non-recurrence of intangible asset impairment charges in fiscal 2013. During the fourth quarter of fiscal 2012, our upholstery segment recorded a non-cash charge of $1.8 million ($1.1 million, or $0.10 per share, after tax) to write-down the value of the Bradington-Young trade name. We wrote down the carrying value of the Bradington-Young trade name because of operating losses incurred in that division through fiscal 2012.
The following table reconciles operating income as a percentage of net sales (“operating margin”) to operating margin excluding intangible asset impairment charges as a percentage of net sales for each period. Operating margin excluding the impact of intangible asset impairment charges is a “non-GAAP” financial measure. We provide this information because we believe it is useful to investors in evaluating our ongoing operations. This non-GAAP financial measure is intended to provide insight into our operating margin and should be evaluated in the context in which it is presented. This measure is not intended to reflect our overall financial results.
|
GAAP to Non-GAAP Operating Margin Reconciliation
|
||||||||
|
Fifty-Three Weeks Ended
|
Fifty-Two Weeks Ended
|
|||||||
|
February 3,
|
January 29,
|
|||||||
|
2013
|
2012
|
|||||||
|
Consolidated operating margin, including FY12 intangible asset impairment charges
|
5.9 | % | 3.0 | % | ||||
|
Intangible asset impairment charges
|
- | 0.8 | % | |||||
|
Consolidated operating margin, excluding FY12 intangible asset impairment charges
|
5.9 | % | 3.8 | % | ||||
Other income, net
|
Fifty-three weeks ended
|
Fifty-two weeks ended | |||||||||||||||||||||||
|
February 3, 2013
|
January 29, 2012
|
$ Change
|
% Change
|
|||||||||||||||||||||
| % Net Sales |
`
|
% Net Sales | ||||||||||||||||||||||
|
Casegoods
|
$ | 579 | 0.4 | % | $ | 755 | 0.5 | % | $ | (176 | ) | -23.3 | % | |||||||||||
|
Upholstery
|
(526 | ) | -0.7 | % | (483 | ) | -0.7 | % | (43 | ) | -8.9 | % | ||||||||||||
|
Consolidated
|
$ | 53 | 0.1 | % | $ | 272 | 0.1 | % | $ | (219 | ) | -80.5 | % | |||||||||||
The decrease in other income, net is primarily due to decreased interest earned on anti-dumping duty refunds and decreased finance charges we charged on past due invoices to our customers.
Income Taxes
| Fifty-three weeks ended | Fifty-two weeks ended | |||||||||||||||||||||||
|
February 3, 2013
|
January 29, 2012
|
$ Change
|
% Change
|
|||||||||||||||||||||
| % Net Sales | % Net Sales | |||||||||||||||||||||||
|
Consolidated income tax expense
|
$ | 4,367 | 2.0 | % | $ | 1,888 | 0.8 | % | $ | 2,479 | 131.4 | % | ||||||||||||
|
Effective Tax Rate
|
33.6 | % | 27.2 | % | ||||||||||||||||||||
We recorded income tax expense of $4.4 million during fiscal 2013, compared to $1.9 million for fiscal 2012, due primarily to an increase in pre-tax income. Our effective tax rate rose to 33.6% from 27.2%. The effective rate in fiscal 2013 was higher than in fiscal 2012 mainly because our income was higher and the dollar value of the favorable permanent differences we recognize each year (officers’ life insurance, distributions received from our offshore insurance affiliate and charitable contributions of inventory) remained fairly constant in dollar terms, but as a percentage of income the benefit was significantly smaller.
Net Income and Earnings Per Share
| Fifty-three weeks ended | Fifty-two weeks ended | |||||||||||||||||||||||
|
February 3, 2013
|
January 29, 2012
|
$ Change
|
% Change
|
|||||||||||||||||||||
|
Net Income
|
% Net Sales | % Net Sales | ||||||||||||||||||||||
|
Consolidated
|
$ | 8,626 | 4.0 | % | $ | 5,057 | 2.3 | % | $ | 3,569 | 70.6 | % | ||||||||||||
|
Earnings per share
|
$ | 0.80 | $ | 0.47 | ||||||||||||||||||||
Fiscal 2012 Compared to Fiscal 2011
Net Sales
|
Fifty-two weeks ended
|
||||||||||||||||||||||||
|
January 29, 2012
|
January 30, 2011
|
$ Change
|
% Change
|
|||||||||||||||||||||
| % Net Sales | % Net Sales | |||||||||||||||||||||||
|
Casegoods
|
$ | 147,927 | 66.5 | % | $ | 143,157 | 66.5 | % | $ | 4,770 | 3.3 | % | ||||||||||||
|
Upholstery
|
74,578 | 33.5 | % | 72,272 | 33.5 | % | $ | 2,306 | 3.2 | % | ||||||||||||||
|
Consolidated
|
$ | 222,505 | 100.0 | % | $ | 215,429 | 100.0 | % | $ | 7,076 | 3.3 | % | ||||||||||||
|
Unit Volume
|
FY12 % Increase vs. FY11
|
Average Selling Price
|
FY12 % Increase vs. FY11
|
|||||||
|
Casegoods
|
1.4 | % |
Casegoods
|
2.1 | % | |||||
|
Upholstery
|
1.3 | % |
Upholstery
|
3.4 | % | |||||
|
Consolidated
|
1.4 | % |
Consolidated
|
2.5 | % | |||||
The consolidated net sales increase was principally due to increased unit volume and average selling prices across both our casegoods and upholstery segments. In particular, the increase in net sales for the upholstery segment reflects increases in fabric upholstery average selling price and unit volume of 7.3% and 4.2%, respectively, compared to the prior fiscal year, with such increases primarily due to the mix of products shipped.
Gross Income and Margin
|
Fifty-two weeks ended
|
||||||||||||||||||||||||
|
January 29, 2012
|
January 30, 2011
|
$ Change
|
% Change
|
|||||||||||||||||||||
| % Net Sales | % Net Sales | |||||||||||||||||||||||
|
Casegoods
|
$ | 37,550 | 25.4 | % | $ | 37,642 | 26.3 | % | $ | (92 | ) | -0.2 | % | |||||||||||
|
Upholstery
|
11,313 | 15.2 | % | 9,240 | 12.8 | % | 2,073 | 22.4 | % | |||||||||||||||
|
Consolidated
|
$ | 48,863 | 22.0 | % | $ | 46,882 | 21.8 | % | $ | 1,981 | 4.2 | % | ||||||||||||
Casegoods gross margins decreased as compared to the prior fiscal year primarily due to increased product discounting, partially offset by lower freight costs on imported products during the second half of fiscal 2012. As a percentage of net sales, product discounting increased approximately 200 basis points over the prior fiscal year, primarily due to a conscious effort to reduce excess inventory. Upholstery margins increased primarily due to cost reduction efforts and higher fabric upholstery selling prices, partially offset by increased raw material costs and a casualty loss expense of $181,000 related to a sprinkler malfunction at one of our warehouses during the 2012 fiscal year.
Selling and Administrative Expenses
|
Fifty-two weeks ended
|
||||||||||||||||||||||||
|
January 29, 2012
|
January 30, 2011
|
$ Change
|
% Change
|
|||||||||||||||||||||
| % Net Sales | % Net Sales | |||||||||||||||||||||||
|
Casegoods
|
$ | 26,905 | 18.2 | % | $ | 27,897 | 19.5 | % | $ | (992 | ) | -3.6 | % | |||||||||||
|
Upholstery
|
13,470 | 18.1 | % | 13,125 | 18.2 | % | 345 | 2.6 | % | |||||||||||||||
|
Consolidated
|
$ | 40,375 | 18.1 | % | $ | 41,022 | 19.0 | % | $ | (647 | ) | -1.6 | % | |||||||||||
Fiscal 2012 selling and administrative expense decreased in our casegoods segment, primarily due to:
|
§
|
Lower salary related costs, due to:
|
|
o
|
an insurance gain of $610,000 on Company-owned life insurance due to the death of a former executive during the fiscal 2012 first quarter;
|
|
o
|
realignments in our officer group; and
|
|
o
|
the reversal of an accrual for long-term incentive compensation during the first quarter of fiscal 2012;
|
|
§
|
Lower advertising supplies expense and sample expense, due to cost reduction measures;
|
|
§
|
Lower depreciation and amortization expense, primarily due to decreased information systems spending on our legacy systems in anticipation of the implementation of our current ERP project; and
|
|
§
|
Lower bad debt expense, due to adjustments in our accounts receivable reserves to reflect favorable collection trends.
|
These decreased expenses were partially offset by higher sales and design commissions due to increased sales, a charge to write-off a note receivable and a charge to write down leasehold improvements related to the relocation and consolidation of our showroom space at the International Home Furnishings Center.
Fiscal 2012 selling and administrative expenses increased as compared to the prior year in our upholstery segment primarily due to:
|
§
|
Increased commissions and sales incentives due to higher sales and initiatives to drive sales volume growth;
|
|
§
|
A charge to write down leasehold improvements related to the relocation and consolidation of our showroom space at the International Home Furnishings Center; and
|
|
§
|
Increased sample expense incurred for swatches for new leather and fabric upholstery offerings.
|
These increased expenses were partially offset by decreased market expense due to cost reduction efforts and decreased advertising expense due to cost cutting measures.
Operating Income and Margin
|
Fifty-two weeks ended
|
||||||||||||||||||||||||
|
January 29, 2012
|
January 30, 2011
|
$ Change
|
% Change
|
|||||||||||||||||||||
| % Net Sales | % Net Sales | |||||||||||||||||||||||
|
Casegoods
|
$ | 10,644 | 7.2 | % | $ | 9,348 | 6.5 | % | $ | 1,296 | 13.9 | % | ||||||||||||
|
Upholstery
|
(3,971 | ) | -5.3 | % | (5,287 | ) | -7.3 | % | 1,316 | 24.9 | % | |||||||||||||
|
Consolidated
|
$ | 6,673 | 3.0 | % | $ | 4,061 | 1.9 | % | $ | 2,612 | 64.3 | % | ||||||||||||
During the fourth quarter of fiscal 2012, our upholstery segment recorded a non-cash charge of $1.8 million ($1.1 million, or $0.10 per share, after tax) to write-down the value of the Bradington-Young trade name. We wrote down the carrying value of the Bradington-Young trade name because of operating losses in that division over the last few years. See note 7 to the consolidated financial statements on page F-16 for more information about this charge.
Fiscal 2012 operating profitability increased year over year compared to fiscal 2011 due to the factors discussed above, despite the charges to write-down intangibles assets. The following table reconciles operating margin to operating margin excluding restructuring and impairment charges as a percentage of net sales for each period:
|
GAAP to Non-GAAP Operating Margin Reconciliation
|
||||||||
|
Fifty-Two Weeks Ended
|
||||||||
|
January 29,
|
January 30,
|
|||||||
|
2012
|
2011
|
|||||||
|
Consolidated operating margin, including restructuring and impairment charges
|
3.0 | % | 1.9 | % | ||||
|
Intangible asset impairment charges
|
0.8 | 0.2 | ||||||
|
Restructuring charges
|
- | 0.7 | ||||||
|
Consolidated operating margin, excluding restructuring and impairment charges
|
3.8 | % | 2.8 | % | ||||
Operating margin excluding the impact of restructuring and impairment charges is a “non-GAAP” financial measure. We provide this information because we believe it is useful to investors in evaluating our ongoing operations. This Non-GAAP financial measure is intended to provide insight into our operating margin and should be evaluated in the context in which it is presented. This measure is not intended to reflect our overall financial results.
Other income, net
|
Fifty-two weeks ended
|
||||||||||||||||||||||||
|
January 29, 2012
|
January 30, 2011
|
$ Change
|
% Change
|
|||||||||||||||||||||
| % Net Sales | % Net Sales | |||||||||||||||||||||||
|
Casegoods
|
$ | 755 | 0.5 | % | $ | 625 | 0.5 | % | $ | 130 | 20.8 | % | ||||||||||||
|
Upholstery
|
(483 | ) | -0.7 | % | (517 | ) | -0.7 | % | 34 | 6.6 | % | |||||||||||||
|
Consolidated
|
$ | 272 | 0.1 | % | $ | 108 | 0.1 | % | $ | 164 | 151.9 | % | ||||||||||||
The increase in other income, net is primarily due to interest earned on a federal tax refund and anti-dumping duty refunds and increased other miscellaneous income.
Income Taxes
|
Fifty-two weeks ended
|
||||||||||||||||||||||||
|
January 29, 2012
|
January 30, 2011
|
$ Change
|
% Change
|
|||||||||||||||||||||
| % Net Sales | % Net Sales | |||||||||||||||||||||||
|
Consolidated income tax expense
|
$ | 1,888 | 0.8 | % | $ | 929 | 0.4 | % | $ | 959 | 103.2 | % | ||||||||||||
|
Effective Tax Rate
|
27.2 | % | 22.3 | % | ||||||||||||||||||||
We recorded income tax expense of $1.9 million during fiscal 2012, compared to $929,000 for fiscal 2011, due primarily to an increase in pre-tax income. Our effective tax rate rose to 27.2% from 22.3%. The effective rate in fiscal 2012 was higher than in fiscal 2011 mainly because we successfully obtained an abatement of a large federal tax penalty during fiscal 2011, we received a smaller benefit on charitable contributions of inventory during fiscal 2012 and the amount of subpart F income allocated from our former captive insurance arrangement was significantly smaller in fiscal 2012. Additionally, in fiscal 2012, the impact of permanent book-tax differences resulted in a smaller improvement in our effective tax rate because of the larger amount of income compared to fiscal 2011.
Net Income and Earnings Per Share
|
Fifty-two weeks ended
|
||||||||||||||||||||||||
|
January 29, 2012
|
January 30, 2011
|
$ Change
|
% Change
|
|||||||||||||||||||||
|
Net Income
|
% Net Sales | % Net Sales | ||||||||||||||||||||||
|
Consolidated
|
$ | 5,057 | 2.3 | % | $ | 3,240 | 1.5 | % | $ | 1,818 | 56.1 | % | ||||||||||||
|
Earnings per share
|
$ | 0.47 | $ | 0.30 | ||||||||||||||||||||
Financial Condition, Liquidity and Capital Resources
Balance Sheet and Working Capital
The following chart shows changes in our total assets, current assets, current liabilities, net working capital and working capital ratio:
|
|
||||||||||||
|
February 3, 2013
|
January 29, 2012
|
$ Change
|
||||||||||
|
Total Assets
|
$ | 155,823 | $ | 149,171 | $ | 6,652 | ||||||
|
Cash
|
$ | 26,342 | $ | 40,355 | $ | (14,013 | ) | |||||
|
Trade Receivables
|
28,272 | 25,807 | 2,465 | |||||||||
|
Inventories
|
49,872 | 34,136 | 15,736 | |||||||||
|
Prepaid Expenses & Other
|
5,181 | 4,194 | 987 | |||||||||
|
Total Current Assets
|
$ | 109,667 | $ | 104,492 | $ | 5,175 | ||||||
|
Trade accounts payable
|
$ | 11,620 | $ | 9,233 | $ | 2,387 | ||||||
|
Accrued salaries, wages and benefits
|
3,316 | 3,855 | (539 | ) | ||||||||
|
Other accrued epenses
|
2,531 | 1,870 | 661 | |||||||||
|
Total current liabilities
|
$ | 17,467 | $ | 14,958 | $ | 2,509 | ||||||
|
Net working capital
|
$ | 92,200 | $ | 89,534 | $ | 2,666 | ||||||
|
Working capital ratio
|
6.3 to 1
|
7.0 to 1
|
||||||||||
Total assets increased year-over-year between fiscal 2013 and fiscal 2012, due to increased inventories, trade receivables and prepaid expenses and other current assets, partially offset by decreased cash.
Fiscal 2013 net working capital (current assets less current liabilities) increased compared to the 2012 fiscal year, primarily due to:
|
§
|
increased inventories due to restocking efforts;
|
|
§
|
increased trade receivables due to increased sales near the end of the fiscal year; and
|
|
§
|
increased prepaid expenses and other due to an increase in deferred taxes.
|
These changes were partially offset by:
|
§
|
decreased cash balances; and
|
|
§
|
increased trade accounts payable due to increased inventory purchases.
|
Summary Cash Flow Information – Operating, Investing and Financing Activities
|
Fifty-Three Weeks Ended
|
Fifty-Two Weeks Ended
|
|||||||||||
|
February 3,
|
January 29,
|
January 30,
|
||||||||||
|
2013
|
2012
|
2011
|
||||||||||
|
Net cash (used in) provided by operating activities
|
$ | (3,333 | ) | $ | 32,276 | $ | (15,459 | ) | ||||
|
Net cash used in investing activities
|
(4,623 | ) | (4,229 | ) | (1,601 | ) | ||||||
|
Net cash used in financing activities
|
(6,057 | ) | (4,315 | ) | (4,312 | ) | ||||||
|
Net (decrease) increase in cash and cash equivalents
|
$ | (14,013 | ) | $ | 23,732 | $ | (21,372 | ) | ||||
During fiscal 2013, $14 million cash on hand funded $3.3 million operating activities, cash dividends of $5.4 million, $671,000 for the purchase and retirement of common stock, capital expenditures of $4.1 million related to our business operating systems and facilities and premiums paid on Company-owned life insurance policies of $902,000. Company-owned life insurance policies are in place to compensate us for the loss of key employees, to facilitate business continuity and to serve as a funding mechanism for certain executive benefits.
During fiscal 2012, $32.3 million in cash generated from operations funded an increase in cash and cash equivalents of $23.7 million, cash dividends of $4.3 million, capital expenditures of $3.8 million related to our business operating systems and facilities and premiums paid on Company-owned life insurance policies of $1.1 million.
During fiscal year 2011, cash-on-hand, insurance proceeds received on a warehouse casualty loss of $1.7 million, and proceeds received under Company-owned life insurance policies of $1.7 million were used to fund $15.5 million in operating cash usage (primarily to fund increased inventory purchases in anticipation of higher sales), cash dividends of $4.3 million, premiums paid on Company-owned life insurance policies of $1.3 million and capital expenditures to maintain and enhance our business operating systems and facilities of $2.0 million.
Investing activities consumed $4.6 million in fiscal 2013 compared to $4.2 million in fiscal 2012. In fiscal 2013, we invested $4.1 million in property, plant and equipment and $902,000 in Company-owned life insurance premium payments. These payments were partially offset by $303,000 in proceeds received on sales of property and equipment.
Investing activities consumed $4.2 million in fiscal 2012 compared to $1.6 million in fiscal 2011. In fiscal 2012, we invested $3.8 million in property, plant and equipment and $1.1 million in Company-owned life insurance premium payments. These payments were partially offset by $560,000 in proceeds received on Company-owned life insurance.
Investing activities consumed $1.6 million in fiscal 2011 compared to $1.1 million consumed in fiscal 2010. In fiscal 2011, we invested $2.0 million in property, plant and equipment and $1.3 million for Company-owned life insurance premium payments, partially offset by $1.7 million proceeds received from Company-owned life insurance policies.
Financing activities consumed $6.1 million in fiscal 2013 compared to $4.3 million in fiscal 2012. In fiscal 2013, we made $5.4 million in dividends payment and paid $671,000 for the purchase and retirement of common stock. Fiscal 2013 dividends increased due to a change made to more closely align dividend declarations and payments to our fiscal quarters. This change resulted in five dividend payments in fiscal 2013, as compared to four dividend payments in both the 2012 and 2011 fiscal years.
Financing activities consumed $4.3 million in both fiscal 2012 and fiscal 2011 and consisted entirely of dividend payments.
Liquidity, Financial Resources and Capital Expenditures
Our loan agreement with Bank of America, N.A., which is scheduled to expire on July 31, 2013, includes the following terms:
|
§
|
A $15.0 million unsecured revolving credit facility, up to $3.0 million of which can be used to support letters of credit;
|
|
§
|
A floating interest rate, adjusted monthly, based on LIBOR, plus an applicable margin based on the ratio of our funded debt to our EBITDA (each as defined in the agreement);
|
|
§
|
A quarterly unused commitment fee, based on our ratio of funded debt to EBITDA; and
|
|
§
|
No pre-payment penalty.
|
The loan agreement includes customary representations and warranties and requires us to comply with customary covenants, including, among other things, the following financial covenants:
|
§
|
Maintain a tangible net worth of at least $95.0 million;
|
|
§
|
Limit capital expenditures to no more than $15.0 million during any fiscal year; and
|
|
§
|
Maintain a ratio of funded debt to EBITDA not exceeding 2.0:1.0.
|
We were in compliance with each of these financial covenants at February 3, 2013 and expect to remain in compliance with existing covenants for the foreseeable future.
During the fiscal 2013 second quarter we amended our loan agreement to reduce the minimum required tangible net worth from $108 million to $95 million, primarily to provide additional flexibility to purchase our common shares under a share repurchase authorization approved by our board in April 2012. The loan agreement does not restrict our ability to pay cash dividends on, or repurchase shares of our common stock, subject to complying with the financial covenants under the agreement.
As of February 3, 2013, we had an aggregate $13.2 million available under our revolving credit facility to fund working capital needs. Standby letters of credit in the aggregate amount of $1.8 million, used to collateralize certain insurance arrangements and for imported product purchases, were outstanding under the revolving credit facility as of February 3, 2013. There were no additional borrowings outstanding under the revolving credit facility on February 3, 2013.
We are currently in negotiations with Bank of America, N.A. and other lenders to extend or replace our credit facility and expect to have a new agreement in place before the expiration of our current loan agreement on July 31, 2013.
We factor substantially all of our domestic upholstery accounts receivable, in most cases without recourse to us. We factor these receivables because factoring:
|
§
|
allows us to outsource the administrative burden of the credit and collections functions for our upholstery operations;
|
|
§
|
allows us to transfer the collection risk associated with the majority of our domestic upholstery receivables to the factor; and
|
|
§
|
provides us with an additional, potential source of short-term liquidity.
|
We believe that we have the financial resources (including available cash and cash equivalents, expected cash flow from operations, lines of credit and the cash surrender value of Company-owned life insurance) needed to meet business requirements for the foreseeable future, including capital expenditures, and working capital, as well as to pay dividends on our common stock. Cash flow from operations is highly dependent on incoming order rates and our operating performance.
We expect to spend between $2.5 million to $4.5 million in capital expenditures during fiscal year 2014 to maintain and enhance our operating systems and facilities. Of these estimated amounts, we expect to spend between $1.5 million to $2.0 million on the implementation of our ERP system in our upholstery segment.
Enterprise Resource Planning
Our new Enterprise Resource Planning (ERP) system became operational for our casegoods and imported upholstery units early in the third quarter of fiscal 2013, after nearly two years of design, planning, conversion and training efforts by our associates and consultants. We spent approximately $6.8 million on the first phase of the project. In fiscal 2013, $3.0 million was capitalized into property, plant and equipment in the long-term assets portion of our consolidated statement of financial position. In fiscal 2013, 2012 and 2011, $1.4 million, $1.6 million and $853,000 was expensed, respectively, and appears in the selling and administrative expense sections of our consolidated statements of operations.
Conversion efforts began for our domestic upholstery units early in the fiscal 2014 first quarter, with full implementation scheduled to be completed during fiscal 2015. Once all our business units are operational on the ERP platform, we expect to realize operational efficiencies and cost savings by presenting a single face to our customers and leveraging best practices across the organization.
To complete the ERP system implementation as anticipated, we expect to expend significant financial and human resources. We anticipate spending approximately $4.5 million in additional funds over the remainder of this project, with a significant amount of time invested by our associates.
We refer you to Item “1A. Risk Factors” included in this report for a more complete discussion of the risks involved in our ERP system conversion and implementation.
Share Repurchase Authorization
During the fiscal 2013 first quarter, our board of directors authorized the repurchase of up to $12.5 million of the Company’s common shares. The authorization does not obligate us to acquire a specific number of shares during any period and does not have an expiration date, but it may be modified, suspended or discontinued at any time at the discretion of our board of directors. Repurchases may be made from time to time in the open market, or through privately negotiated transactions or otherwise, in compliance with applicable laws, rules and regulations, and subject to our cash requirements for other purposes, compliance with the covenants under the loan agreement for our revolving credit facility and other factors we deem relevant. We have entered into a trading plan under Rule 10b-18 and Rule 10b5-1 of the Securities Exchange Act of 1934 for effecting some or all of the purchases under this repurchase authorization. The trading plan contains provisions that could restrict the amount and timing of purchases. We can terminate this plan at any time. In fiscal 2013, we used approximately $671,000 of the authorization to purchase 57,700 of our common shares (at an average price of $11.63 per share), with approximately $11.8 million remaining available for future purchases under the authorization as of the end of the 2013 fiscal year.
Port Workers Strike
Sales of imported finished goods comprised approximately 73.0% of our sales in fiscal 2013. We receive most of our imported finished goods through the East Coast port of Norfolk, VA. On August 22, 2012, contract negotiations for a new collective bargaining agreement between the United States Maritime Alliance, which represents the shipping industry, and the International Longshoremen’s Association (ILA), whose members work in deep sea ports around the East and Gulf Coasts of the United States, were suspended. However, negotiations were extended and the parties reached a new six-year collective bargaining agreement on March 14, 2013. This agreement was ratified by ILA members on April 9, 2013.
More than 75% of our imported finished goods are shipped from the ports of Hong Kong and Yantian. Near the end of March 2013, dockworkers at the Port of Hong Kong began to strike to demand a pay increase and a collective bargaining relationship with the container terminal operator Hong Kong International Terminals (HIT). HIT operates five terminals at the port of Hong Kong. The Hong Kong labor department is involved to try to resolve the situation. A prolonged strike would likely disrupt the flow of inventory to us and our customers and decrease our sales, earnings and liquidity. Yantian is an alternative port of origin for shipments from the supplier-owned warehouse dedicated to our inventory, and for most of our other suppliers in southern China, and can be utilized at the same cost as Hong Kong, which may help to mitigate the impact on our business from any lengthy work stoppage there. Other southern Chinese ports – such as Zhongshan - may offer additional options, though likely at higher cost.
Dividends
At its March 19, 2013 meeting, our board of directors declared a quarterly cash dividend of $0.10 per share, payable on April 12, 2013 to shareholders of record at March 29, 2013.
Commitments and Contractual Obligations
As of February 3, 2013, our commitments and contractual obligations were as follows:
|
Cash Payments Due by Period (In thousands)
|
||||||||||||||||||||
|
Less than
|
More than
|
|||||||||||||||||||
|
1 Year
|
1-3 Years
|
3-5 Years
|
5 years
|
Total
|
||||||||||||||||
|
Deferred compensation payments
(1)
|
$ | 379 | $ | 1,406 | $ | 1,334 | $ | 8,301 | $ | 11,420 | ||||||||||
|
Operating leases
(2)
|
1,265 | 1,514 | 301 | - | 3,080 | |||||||||||||||
|
Other long-term obligations
(3)
|
1,169 | 245 | - | - | 1,414 | |||||||||||||||
|
Total contractual cash obligations
|
$ | 2,813 | $ | 3,165 | $ | 1,635 | $ | 8,301 | $ | 15,914 | ||||||||||
|
(1)
|
These amounts represent estimated cash payments to be paid to participants in our supplemental retirement income plan or “SRIP” through fiscal year 2038, which is 15 years after the last current SRIP participant is assumed to have retired. The present value of these benefits (the actuarially derived projected benefit obligation for this plan) was approximately $7.4 million at February 3, 2013 and is shown on our consolidated balance sheets, with $379,000 recorded in current liabilities and $7.1 million recorded in long-term liabilities. In addition, the monthly retirement benefit for each participant, regardless of age, would become fully vested and the present value of that benefit would be paid to each participant in a lump sum upon a change in control of the Company as defined in the plan. See note 9 to the consolidated financial statements beginning on page F-17 for additional information about the SRIP.
|
|
(2)
|
These amounts represent estimated cash payments due under operating leases for office equipment, warehouse equipment and real estate utilized in our operations. See Item 2 “Properties,” for a description of our leased real estate.
|
|
(3)
|
These amounts represent estimated cash payments due under various long-term service and support agreements, for items such as warehouse management services, information technology support and human resources related consulting and support.
|
Standby letters of credit in the aggregate amount of $1.8 million, used to collateralize certain insurance arrangements and for imported product purchases, were outstanding under our revolving credit facility as of February 3, 2013. There were no additional borrowings outstanding under the revolving credit line on February 3, 2013.
Recently Issued Accounting Pronouncements
In July 2012, the Financial Accounting Standards Board (“FASB”) issued Accounting Standards Update (“ASU”) 2012-02,
Testing Indefinite-Lived Intangible Assets for Impairment
(ASU 2012-02), which amended the guidance in ASU 2011-08 to simplify the testing of indefinite-lived intangible assets other than goodwill for impairment. ASU 2012-02 becomes effective for annual and interim impairment tests performed for fiscal years beginning on or after September 15, 2012 and earlier adoption is permitted. We will adopt ASU 2012-02 at the beginning of our fiscal 2014 fiscal year which begins on February 4, 2013. The adoption of ASU 2012-02 is not expected to have a material impact on our financial statements.
In January 2013, the FASB issued Accounting Standards Update No. 2013-01,
Clarifying the Scope of Disclosures about Offsetting Assets and Liabilities.
The ASU limits the scope of the new balance sheet offsetting disclosures to derivatives, repurchase agreements, and securities lending transactions to the extent that they are offset in the financial statements or subject to an enforceable master netting arrangement or similar agreement. The disclosures are required irrespective of whether the transactions are offset in the statement of financial position. The disclosure requirements are effective for annual reporting periods beginning on or after January 1, 2013, and interim periods within those annual periods. We will adopt ASU 2013-01 at the beginning of our fiscal 2014 fiscal year which begins on February 4, 2013. The adoption of ASU 2013-01 is not expected to have a material impact on our financial statements.
Fiscal 2013 in Review
In our fiscal 2012 annual report on Form 10-K, we outlined the following goals for fiscal 2013:
|
§
|
Continue to develop the “right” product, in other words, the product the consumer wants at a price he or she is willing to pay;
|
|
§
|
Align our import supplier base with our product standards for quality, delivery, value and cost by:
|
|
□
|
continuing to develop existing successful supplier relationships,
|
|
□
|
exiting non-compliant suppliers for more promising supplier relationships in existing or new locations, and
|
|
□
|
developing our Asian supply-team to reduce product quality issues and costs;
|
|
§
|
Achieve upholstery segment profitability;
|
|
§
|
Build on fiscal 2012 casegoods volume and profitability increases; and
|
|
§
|
Implement our corporate Enterprise Resource Planning system for our casegoods segment and substantially complete ERP implementation for our upholstery segment.
|
How did we perform?
|
1.
|
Right product
- We ended fiscal 2013 with strong order backlogs in both segments, increased upholstery net sales, the successful launch and reception of the Sam Moore sofa program and the Rhapsody casegoods collection.
|
|
2.
|
Alignment of import supplier base
- We established representative offices in two new Asian locations, transitioned a portion of our casegoods production to these new locations, exited eight underperforming suppliers, and reduced casegoods returns and allowances expense by 25%.
|
|
3.
|
Achieve upholstery segment profitability
- Our upholstery segment achieved profitability, realizing $987,000 in operating profit during fiscal 2013.
|
|
4.
|
Build on fiscal 2012 casegoods volume and profitability increases
- While stock outs due to vendor transitions, aggressive inventory reductions and lower international sales dampened casegoods volume, the casegoods segment achieved increased gross and net profits and ended fiscal 2013 with improved sales momentum.
|
|
5.
|
ERP Implementation
- ERP implementation for our casegoods segment and imported upholstery segment went live over Labor Day weekend in 2012. However, implementation efforts for our upholstery segment did not begin in earnest until January of 2013, as we worked to refine the new system for the casegoods segment after initial implementation. Based on our experiences in Phase I, we extended the expected Phase II target implementation date to fiscal 2015 to allow the appropriate time and attention necessary to implement without a significant business disruption, consistent with the successful implementation of Phase I .
|
Strategy
Our strategy is to offer world-class style, quality and product value as a complete residential casegoods and upholstered furniture resource through excellence in product design, global sourcing, manufacturing, logistics, sales, marketing and customer service. We strive to be an industry leader in sales growth and profitability performance, thereby providing an outstanding investment for our shareholders and contributing to the well-being of our customers, employees, suppliers and communities. Additionally, we strive to nurture the relationship-focused, team-oriented and honor-driven corporate culture that has distinguished our company for over 88 years.
In order to successfully execute our strategy in fiscal 2014, we must:
|
1.
|
Continue to develop the “right” product; in other words, the product the consumer wants at a price the customer is willing to pay;
|
|
2.
|
Continue to refine our import supplier base with our product standards for quality, delivery, value and cost by:
|
|
a.
|
continuing to develop existing successful supplier relationships,
|
|
b.
|
continuing to develop our Asian supply-team to reduce product quality issues and costs; and
|
|
c.
|
exiting non-compliant suppliers for more promising supplier relationships in existing or new locales, if necessary.
|
|
3.
|
Build on upholstery segment profitability by continuing to focus on labor efficiency, cost reduction projects and volume increases driven by new and updated products and improved volume at key retailers;
|
|
4.
|
Improve casegoods volume and build on its profitability increases by continued focus on offering strong product lines, limit discounting through improved inventory management and growing our international business; and
|
|
5.
|
Work towards implementing our ERP in our domestic upholstery operation in fiscal 2015.
|
In addition to these goals, we intend to:
|
§
|
Build on our fiscal 2013 efforts to connect directly with our consumers
. In fiscal 2013, we ran two major advertising campaigns in House Beautiful® magazine featuring our highly regarded Rhapsody collection. Rhapsody has been a top seller for us since its introduction at the April 2012 High Point Market and is a perfect match for the high end consumers who make up House Beautiful’s readership. To maintain a dialog with consumers, we continue to reach out through social media and have expanded our social media presence to include Facebook® pages and advertising for Bradington-Young and Sam Moore. And to help our dealers connect with their customers, we launched a preferred dealer program to support marketing efforts by our key retailers, including assistance building an on-line presence in their local markets using our iStore technology.
|
|
§
|
Expand into the senior living market.
During the first half of fiscal 2014, we expect to launch our “H Contract” - to connect with the burgeoning senior living market, a market typically comprised of housing communities and facilities for retirement-aged adults. This division will supply upholstered seating and casegoods to upscale senior living facilities throughout the country. Under the direction of a 20-year health care furniture veteran, this division will work with designers specializing in this industry segment to provide functional furniture for senior living facilities that meets newer retirees’ expectations for style and fashion.
|
|
§
|
Launch our new Homeware line.
To address the needs of the younger furniture customer we plan to launch Homeware. This line will feature modular upholstered and casegoods products designed to be assembled by the consumer and shippable by parcel delivery services, allowing for ease of purchase, setup and delivery, especially for on-line and catalog shoppers. Using patented connectors designed by an experienced furniture engineer and designer, our goal is for the consumer to be able to assemble and disassemble these products in minutes, without tools. We expect a launch date for the initial Homeware product line in the summer of 2013.
|
Outlook
Most economic indicators suggest that economic recovery in the United States is well underway. Evidence of this recovery includes continued increases in household wealth, consumer confidence, disposable income and retail sales, including furniture store sales, as well as continued improvement in housing activity, which we believe to be a leading indicator for furniture sales. However, we believe many consumers continue to be hesitant to commit to major purchases, such as furniture, due to persistent high unemployment levels and concerns about the domestic economy, high U.S. national and consumer debt levels and persistent U.S. federal budget deficits. Based on these positive and negative factors, as well as what we are seeing in the home furnishings marketplace, we expect retail furniture demand to improve, but modestly, as we progress through fiscal 2014.
In light of current conditions, we continue to focus on the goals outlined above, which include:
|
§
|
pursuing additional distribution channels;
|
|
§
|
controlling costs;
|
|
§
|
adjusting our product pricing on our main-line products in order to improve margins;
|
|
§
|
achieving proper inventory levels, while optimizing product availability on best-selling items;
|
|
§
|
sourcing product from more competitive locations and from more quality conscious sourcing partners;
|
|
§
|
offering an array of new products and designs, which we believe will help generate additional sales; and
|
|
§
|
upgrading and refining our information systems capabilities to support our business.
|
We have seen significant improvement in our upholstery segment results in the past year thanks to higher sales volume and to a number of cost control initiatives. The upholstery segment has higher fixed costs than our casegoods segment, due to the upholstery segment’s domestic manufacturing operations, as well as one-time start-up costs for the introduction of Sam Moore’s successful fully upholstered sofa line during the 2013 fiscal year. To mitigate the impact of sales declines in recent years, we have continued to streamline our upholstery operations by improving efficiency, reducing overhead and evaluating our operating costs and capacity to better match costs to current sales volume levels. Further significant cost reductions in our upholstery segment will be challenging. While we are encouraged by recent increases in sales and incoming orders, if we are unable to continue to increase and maintain sales in our upholstery segment, particularly sales of domestically produced upholstery, additional capacity reductions may be necessary. If undertaken, these capacity reductions would likely result in restructuring and asset impairment charges, which would lower our consolidated net earnings in the short-term (for the quarterly and annual periods in which we recognize the charges) and adversely affect our consolidated balance sheets for the periods then ended. Further capacity reductions also would increase the ratio of fixed to variable costs in our upholstery segment which would create pricing and cost absorption challenges.
Environmental Matters
Hooker Furniture is committed to protecting the environment. As a part of our business operations, our manufacturing sites generate non-hazardous and hazardous wastes; the treatment, storage, transportation and disposal of which are subject to various local, state and national laws relating to protecting the environment. We are in various stages of investigation, remediation or monitoring of alleged or acknowledged contamination at current or former manufacturing sites for soil and groundwater contamination, none of which we believe is material to our results of operations or financial position. Our policy is to record monitoring commitments and environmental liabilities when expenses are probable and can be reasonably estimated. The costs associated with our environmental responsibilities, compliance with federal, state and local laws regulating the discharge of materials into the environment, or costs otherwise relating to the protection of the environment, have not had and are not expected to have a material effect on our financial position, results of operations, capital expenditures or competitive position.
We participate in a voluntary industry-wide environmental stewardship program referred to as Enhancing Furniture’s Environmental Culture or “EFEC.” In September of fiscal 2010, the American Home Furnishings Alliance granted us initial EFEC registration, recognizing the successful company-wide implementation of the EFEC program, which includes the successful reduction of water and electricity usage, recycling efforts to reduce landfill use and the implementation of a community outreach program. Since our initial registration we have:
|
§
|
recycled over 350,000 pounds of paper, cardboard and plastic;
|
|
§
|
reduced electricity usage by an average of 12% per year; and
|
|
§
|
reduced natural gas usage by an average of 9% per year.
|
We are inspected annually by the EFEC organization in order to maintain our registration under this program and are currently certified through January 2014.
We face a number of significant risks and uncertainties, as more fully discussed in Item 1A, “Risk Factors” beginning on page 9 and in our “Forward Looking Statements” beginning on page 8. Despite these risks and uncertainties, we believe that our business model and strategy offer a unique opportunity to successfully deliver shareholder value in the coming fiscal year.
Critical Accounting Policies and Estimates
Hooker Furniture’s significant accounting policies are described in “Note 1 – Summary of Significant Accounting Policies” to the consolidated financial statements beginning at page F-1 in this report. The preparation of financial statements in conformity with U.S. generally accepted accounting principles requires us to make estimates and assumptions in certain circumstances that affect amounts reported in the accompanying financial statements and related notes. In preparing these financial statements, we have made our best estimates and judgments of certain amounts included in the financial statements, giving due consideration to materiality. We do not believe that actual results will deviate materially from our estimates related to our accounting policies described below. However, because application of these accounting policies involves the exercise of judgment and the use of assumptions as to future uncertainties, actual results could differ materially from these estimates.
Allowance for Doubtful Accounts
. We evaluate the adequacy of our allowance for doubtful accounts at the end of each quarter. In performing this evaluation, we analyze the payment history of our significant past due accounts, subsequent cash collections on these accounts and comparative accounts receivable aging statistics. Based on this information, along with consideration of the general condition of the economy, we develop what we consider to be a reasonable estimate of the uncollectible amounts included in accounts receivable. This estimate involves significant judgment and actual uncollectible amounts may differ materially from our estimate.
Valuation of Inventories.
We value all of our inventories at the lower of cost (using the last-in, first-out (“LIFO”) method) or market. LIFO cost for all of our inventories is determined using the dollar-value, link-chain method. This method allows for the more current cost of inventories to be reported in cost of sales, while the inventories reported on the balance sheet consist of the costs of inventories acquired earlier, subject to adjustment to the lower of cost or market. Hence, if prices are rising, the LIFO method will generally lead to higher cost of sales and lower profitability as compared to the first-in, first-out (“FIFO”) method. We evaluate our inventory for excess or slow moving items based on recent and projected sales and order patterns. We establish an allowance for those items when the estimated market or net sales value is lower than their recorded cost. This estimate involves significant judgment and actual values may differ materially from our estimate.
Income Taxes.
At times, tax law and generally accepted accounting principles differ in the treatment of certain income and expense items. These items may be excluded or included in taxable income at different times than is required for GAAP or “book” reporting purposes. These differences may be permanent or temporary in nature.
We determine our annual effective income tax rate based on forecasted pre-tax book income and forecasted permanent book and tax differences. The rate is established at the beginning of the year and is evaluated on a quarterly basis. We consider the level and mix of income of our separate legal entities, statutory tax rates, business credits available in the various jurisdictions in which we operate and permanent tax differences. Significant judgment is required in evaluating tax positions that affect the annual tax rate. Any changes to the forecasted information may cause adjustments to the effective rate. Additional tax, interest and penalties associated with uncertain tax positions are recognized in tax expense on a quarterly basis.
To the extent that any book and tax differences are temporary in nature, that is, the book realization will occur in a different period than the tax realization, a deferred tax asset or liability is established. To the extent that a deferred tax asset is created, we evaluate our ability to realize this asset. If we determine that we will not be able to fully utilize deferred tax assets, we establish a valuation reserve. In assessing the realization of deferred tax assets, we consider whether it is more likely than not that some portion or all of the deferred tax assets will be realized. The ultimate realization of deferred tax assets is dependent upon the generation of future taxable income during the periods in which those temporary differences reverse.
Restructuring and Impairment of Long-Lived Assets
Tangible Assets
We regularly review our property, plant and equipment for indicators of impairment, as specified in the Property, Plant and Equipment topic of the Accounting Standards Codification. Although not exhaustive, this accounting guidance lists potential indicators of impairment, which we use to facilitate our review. These potential indicators of impairment include:
|
§
|
A significant decrease in the market value of the long-lived asset;
|
|
§
|
A significant adverse change in the extent or manner in which a long-lived asset group is being used, or in its physical condition;
|
|
§
|
A significant adverse change in the legal factors or in the business climate that could affect the value of a long-lived asset, including an adverse action or assessment by a regulator;
|
|
§
|
An accumulation of costs significantly in excess of the amount originally expected to acquire or construct a long-lived asset;
|
|
§
|
A current period operating or cash flow loss or a projection or forecast that demonstrates continuing losses associated with the long-lived asset’s use; and
|
|
§
|
A current expectation that more-likely-than-not, a long-lived asset will be sold or otherwise disposed of significantly before the end of its previously estimated useful life.
|
The impairment test for our property, plant and equipment requires us to assess the recoverability of the value of the assets by comparing their net carrying value to the sum of undiscounted estimated future cash flows directly associated with and arising from use and eventual disposition of the assets. We principally use our internal forecasts to estimate the undiscounted future cash flows used in our impairment analyses. These forecasts are subjective and are largely based on management’s judgment, primarily due to the changing industry in which we compete; changing consumer tastes, trends and demographics; and the current economic environment. We monitor changes in these factors as part of the quarter-end review of these assets. While our forecasts have been reasonably accurate in the past, during periods of economic instability, uncertainty, or rapid change within our industry, we may not be able to accurately forecast future cash flows from our long-lived assets and our future cash flows may be diminished. Therefore, our estimates and assumptions related to the viability of our long-lived assets may change, and are reasonably likely to change in future periods. These changes could adversely affect our consolidated statements of operations and consolidated statements of financial position. As of February 3, 2013, the fair value of our property, plant and equipment was substantially in excess of its carrying value.
When we conclude that any of these assets is impaired, the asset is written down to its fair value. Any impaired assets that we expect to dispose of by sale are measured at the lower of their carrying amount or fair value, less estimated cost to sell; are no longer depreciated; and are reported separately as “assets held for sale” in the consolidated balance sheets, if we expect to dispose of the assets in one year or less.
The costs to dispose of these assets are recognized when we commit to a plan of disposal. Severance and related benefits to be paid to terminated employees affected by the facility closings are recorded in the period when management commits to a plan of termination. We recognize liabilities for these exit and disposal activities at fair value in the period in which the liability is incurred. Asset impairment charges related to the closure of facilities are based on our best estimate of expected sales prices, less related selling expenses for assets to be sold. The recognition of asset impairment and restructuring charges for exit and disposal activities requires significant judgment and estimates by management. We reassess our accrual of restructuring and asset impairment charges each reporting period. Any change in estimated restructuring and related asset impairment charges is recognized in the period during which the change occurs.
Intangible Assets
We own certain indefinite-lived intangible assets related to Bradington-Young, Sam Moore and Opus Designs by Hooker. We may acquire additional amortizable assets and/or indefinite lived intangible assets in future asset purchases or business combinations. The principal indefinite-lived intangible assets are trademarks and trade names, which are not amortized but are tested for impairment annually or more frequently if events or circumstances indicate that the asset might be impaired. The fair value of the indefinite-lived intangible assets is determined based on the estimated earnings and cash flow capacity of those assets. The impairment test consists of a comparison of the fair value of the indefinite-lived intangible assets with their carrying amount. If the carrying amount of the indefinite-lived intangible assets exceeds their fair value, an impairment loss is recognized in an amount equal to that excess.
Trade names are tested for impairment annually as of the first day of our fiscal fourth quarter or more frequently if events or changes in circumstances indicate that the asset might be impaired. Circumstances that could indicate a potential impairment include, but are not limited to:
|
§
|
a significant adverse change in the economic or business climate either within the furniture industry or the national or global economy;
|
|
§
|
significant changes in demand for our products;
|
|
§
|
loss of key personnel; and
|
|
§
|
the likelihood that a reporting unit or significant portion of a reporting unit will be sold or otherwise disposed of.
|
The assumptions used to determine the fair value of our intangible assets are highly subjective and judgmental and include long term growth rates, sales volumes, projected revenues, assumed royalty rates and factors used to develop an applied discount rate. If the assumptions that we use in these calculations differ from actual results, we may realize additional impairment on our intangible assets which may have a material, adverse effect on our consolidated results of operations and consolidated balance sheets.
During the fiscal 2012 fourth quarter, we recorded a $1.8 million ($1.1 million after tax, or $0.10 per share) intangible asset impairment charge to write down the value of our upholstery segment’s Bradington-Young trade name, due to operating losses in that division over preceding years and near-term performance expectations. Despite this charge, we believe we have taken the proper steps to adjust capacity and reduce the cost structure at Bradington-Young and expect it to continue to contribute to consolidated profitability.
At January 3, 2013, the fair value of our Bradington-Young trade name exceeded its carrying value by approximately $79,000, and the fair value of our Sam Moore trade name was approximately $535,000 in excess of its carrying value.
Concentrations of Sourcing Risk
We source imported products through over 28 different vendors, from 28 separate factories, located in seven countries. Because of the large number and diverse nature of the foreign factories from which we can source our imported products, we have some flexibility in the placement of products in any particular factory or country.
Factories located in China are an important resource for Hooker Furniture. In fiscal year 2013, imported products sourced from China accounted for approximately 80% of import purchases, and the factory in China from which we directly source the most product accounted for approximately 50% of our worldwide purchases of imported product. A sudden disruption in our supply chain from this factory, or from China in general, could significantly impact our ability to fill customer orders for products manufactured at that factory or in that country. If such a disruption were to occur, we believe that we would have sufficient inventory currently on hand in and in transit to our U.S. warehouses in Martinsville, VA to adequately meet demand for approximately five and a half months, with an additional three and a half months available for immediate shipment from our Asia warehouse. Also, with the broad spectrum of product we offer, we believe that, in some cases, buyers could be offered similar product available from alternative sources. We believe that we could, most likely at higher cost, source most of the products currently sourced in China from factories in other countries and could produce certain upholstered products domestically at our own factories. However, supply disruptions and delays on selected items could occur for five to six months. If we were to be unsuccessful in obtaining those products from other sources, or at comparable cost, then a sudden disruption in the supply chain from our largest import furniture supplier, or from China in general, could have a short-term material adverse effect on our results of operations. Given the capacity available in China and other low-cost producing countries, we believe the risks from these potential supply disruptions are manageable
.
We are exposed to market risk from foreign currency exchange rates, which could impact our results of operations or financial condition. We manage our exposure to this risk through our normal operating activities.
For imported products, we generally negotiate firm pricing denominated in U.S. Dollars with our foreign suppliers, typically for periods of at least one year. We accept the exposure to exchange rate movements beyond these negotiated periods. We do not use derivative financial instruments to manage this risk, but could choose to do so in the future. Most of our imports are purchased from suppliers located in China. The Chinese currency floats within a limited range in relation to the U.S. Dollar, resulting in exposure to foreign currency exchange rate fluctuations.
Since we transact our imported product purchases in U.S. Dollars, a relative decline in the value of the U.S. Dollar could increase the price we pay for imported products beyond the negotiated periods. We generally expect to reflect substantially all of the effect of any price increases from suppliers in the prices we charge for imported products. However, these changes could adversely impact sales volume or profit margins during affected periods.
Amounts outstanding under our revolving credit facility would bear interest at variable rates. In the past, we have entered into swap agreements to hedge against the potential impact of increases in interest rates on our floating-rate debt instruments. There was no outstanding balance under our revolving credit facility as of February 3, 2013, other than standby letters of credit in the amount of $1.8 million. Therefore, a fluctuation in market interest rates of one percentage point (or 100 basis points) would not have a material impact on our results of operations or financial condition.
Our consolidated financial statements listed in Item 15(a), and which begin on page F-1, of this report are incorporated herein by reference and are filed as a part of this report.
Certain Non-GAAP Financial Measures
In our Annual Report to Shareholders (of which this annual report on Form 10-K is a part), under the heading “Financial Highlights,” we reported net income and earnings per share both including and excluding the impact of restructuring and asset impairment charges. In this Form 10-K in Management’s Discussion and Analysis of Financial Condition and Results of Operations, under the headings “Results of Operations Fiscal 2013 Compared to Fiscal 2012” and “Results of Operations Fiscal 2012 Compared to Fiscal 2011”, we have reported operating income margin both including and excluding the impact of restructuring and asset impairment charges.
The net income, earnings per share and operating income margin figures excluding the impact of the items specified above are “non-GAAP” financial measures. We provide this information because we believe it is useful to investors in evaluating our ongoing operations. Non-GAAP financial measures provide insight into this selected financial information and should be evaluated in the context in which they are presented. These measures are of limited usefulness in evaluating our overall financial results presented in accordance with GAAP and should be considered in conjunction with the consolidated financial statements, including the related notes, and Management’s Discussion and Analysis of Financial Condition and Results of Operations included elsewhere in this report.
ITEM
9.
CHANGES IN AND DISAGREEMENTS WITH ACCOUNTANTS ON ACCOUNTING AND FINANCIAL DISCLOSURE
None.
Evaluation of Disclosure Controls and Procedures
Our management, with the participation of our principal executive officer and principal financial officer, evaluated the effectiveness of our disclosure controls and procedures as of the end of the fiscal quarter ended February 3, 2013. Based on this evaluation, our principal executive officer and principal financial officer have concluded that our disclosure controls and procedures are effective to provide reasonable assurance that information required to be disclosed in the reports that we file or submit under the Securities Exchange Act of 1934, as amended, is accumulated and communicated to the Company’s management, including our principal executive officer and principal financial officer, as appropriate to allow timely decisions regarding required disclosure and are effective to provide reasonable assurance that such information is recorded, processed, summarized and reported within the time periods specified in the Securities and Exchange Commission’s rules and forms.
Management’s Annual Report on Internal Control over Financial Reporting
In accordance with Section 404 of the Sarbanes-Oxley Act and SEC rules thereunder, management has conducted an assessment of our internal control over financial reporting as of February 3, 2013. Management’s report regarding that assessment is included on page F-2 of this report, with our consolidated financial statements, and is incorporated herein by reference.
Report of Registered Public Accounting Firm
Our independent registered public accounting firm, KPMG LLP, audited the consolidated financial statements included in this annual report on Form 10-K and has issued an audit report on the effectiveness of our internal control over financial reporting. KPMG’s report is included on page F-4 of this report, with our consolidated financial statements, and is incorporated herein by reference.
Changes in Internal Control over Financial Reporting
As discussed above, early in the fiscal 2013 third quarter we implemented a new Enterprise Resource Planning (ERP) system in our casegoods segment and the imported upholstery unit of our upholstery segment. This implementation did not result in material changes to our internal controls over financial reporting (ICFR). However, where appropriate, during the fiscal 2013 third and fourth quarters, we modified the design and documentation of internal controls, processes and procedures relating to the new system in order to replace or supplement our existing set of ICFR. These system changes were not undertaken in response to any actual or perceived deficiencies in our ICFR.
There have been no other changes in our internal control over financial reporting for our fourth quarter ended February 3, 2013, that have materially affected, or are reasonably likely to materially affect, our internal control over financial reporting.
None.
Hooker Furniture Corporation
In accordance with General Instruction G (3) of Form 10-K, most of the information called for by Items 10, 11, 12, 13 and 14 of Part III is incorporated by reference to the Company’s definitive Proxy Statement for its Annual Meeting of Shareholders scheduled to be held June 4, 2013 (the “2013 Proxy Statement”), as set forth below.
Information relating to Hooker Furniture’s directors will be set forth under the caption “Proposal One Election of Directors” in the 2013 Proxy Statement and is incorporated herein by reference.
Information relating to the executive officers of the Company is included in Part I of this report under the caption “Executive Officers of Hooker Furniture Corporation” and is incorporated herein by reference.
Information relating to compliance with Section 16(a) of the Exchange Act will be set forth under the caption “Section 16(a) Beneficial Ownership Reporting Compliance” in the 2013 Proxy Statement and is incorporated herein by reference.
Information relating to the code of ethics that applies to Hooker Furniture’s principal executive officer, principal financial officer, principal accounting officer or controller, or persons performing similar functions will be set forth under the caption “Code of Business Conduct and Ethics” in the 2013. Proxy Statement and is incorporated herein by reference.
Information relating to material changes, if any, in the procedures by which shareholders may recommend nominees to Hooker Furniture’s Board of Directors will be set forth under the caption “Procedures for Shareholder Recommendations of Director Nominees” in the 2013 Proxy Statement and is incorporated herein by reference.
Information relating to the Audit Committee of Hooker Furniture’s Board of Directors, including the composition of the Audit Committee and the Board’s determinations concerning whether certain members of the Audit Committee are “financial experts” as that term is defined under Item 407(d)(5) of Regulation S-K will be set forth under the captions “Corporate Governance” and “Audit Committee” in the 2013 Proxy Statement and is incorporated herein by reference.
Information relating to this item will be set forth under the captions “Report of the Compensation Committee,” “Executive Compensation” and “Director Compensation” in the 2013 Proxy Statement and is incorporated herein by reference.
ITEM
12.
SECURITY OWNERSHIP OF CERTAIN BENEFICIAL OWNERS AND MANAGEMENT AND RELATED SHAREHOLDER MATTERS
Information relating to this item will be set forth under the captions “Equity Compensation Plan Information” and “Security Ownership of Certain Beneficial Owners and Management” in the 2013 Proxy Statement and is incorporated herein by reference.
Information relating to this item will be set forth in the last paragraph under the caption “Audit Committee” and the caption “Corporate Governance” in the 2013 Proxy Statement and is incorporated herein by reference.
Information relating to this item will be set forth under the caption “Proposal Two Ratification of Selection of Independent Registered Public Accounting Firm” in the 2013 Proxy Statement and is incorporated herein by reference.
Hooker Furniture Corporation
(a) Documents filed as part of this report on Form 10-K:
(1)
The following financial statements are included in this report on Form 10-K:
Management’s Report on Internal Control Over Financial Reporting
Reports of Independent Registered Public Accounting Firm
Consolidated Balance Sheets as of February 3, 2013 and January 29, 2012.
Consolidated Statements of Income for the fifty-three weeks ended February 3, 2013 and fifty-two weeks ended January 29, 2012 and January 30, 2011.
Consolidated Statements of Comprehensive Income for the fifty-three weeks ended February 3, 2013 and fifty-two weeks ended January 29, 2012 and January 30, 2011.
Consolidated Statements of Cash Flows for the fifty-three weeks ended February 3, 2013 and fifty-two weeks ended January 29, 2012 and January 30, 2011.
Consolidated Statements of Shareholders’ Equity for the fifty-three weeks ended February 3, 2013 and the fifty-two weeks ended January 29, 2012 and January 30, 2011.
Notes to Consolidated Financial Statements
(2)
Financial Statement Schedules:
Financial Statement Schedules have been omitted because the information required has been separately disclosed in the consolidated financial statements or related notes.
(b)
Exhibits:
|
3.1
|
Amended and Restated Articles of Incorporation of the Company, as amended March 28, 2003 (incorporated by reference to Exhibit 3.1 of the Company’s Form 10-Q (SEC File No. 000-25349) for the quarter ended February 28, 2003)
|
|
3.2
|
Amended and Restated Bylaws of the Company (incorporated by reference to Exhibit 3.2 to the Company’s Form 10-Q ((SEC File No. 000-25349) for the quarter ended August 31, 2006)
|
|
4.1
|
Amended and Restated Articles of Incorporation of the Company (See Exhibit 3.1)
|
|
4.2
|
Amended and Restated Bylaws of the Company (See Exhibit 3.2)
|
|
Pursuant to Regulation S-K, Item 601(b)(4)(iii), instruments evidencing long-term debt not exceeding 10% of the Company’s total assets have been omitted and will be furnished to the Securities and Exchange Commission upon request.
|
|
|
10.1(a)
|
Form of Executive Life Insurance Agreement dated December 31, 2003, between the Company and certain of its executive officers (incorporated by reference to Exhibit 10.1 of the Company’s Form 10-Q (SEC File No. 000-25349) for the quarter ended February 29, 2004)*
|
|
|
|
|
10.1(b)
|
Form of Outside Director Restricted Stock Agreement (incorporated by reference to Exhibit 99.1 of the Company’s Current Report on Form 8-K (SEC File No. 000-25349) filed on January 17, 2006)*
|
|
10.1(c)
|
2010 Amendment and Restatement of the Hooker Furniture Corporation 2005 Stock Incentive Plan (incorporated by reference to Appendix A of the Company’s Definitive Proxy Statement dated March 7, 2010 (SEC File No. 000-25349))*
|
|
10.1(d)
|
2010 Amended and Restated Hooker Furniture Corporation Supplemental Retirement Income Plan, dated as of June 8, 2010 (incorporated by reference to Exhibit 10.1 of the Company’s Form 10-Q (SEC File No. 000-25349) for the quarter ended October 31, 2010)*
|
|
10.1(e)
|
Summary of Annual Base Salary, Annual Cash Incentive Compensation and Long-Term Incentive Awards for Named Executive Officers (incorporated by reference to the Company’s Forms 8-K (SEC File No. 000-25349) filed on January 17, 2013)
|
|
10.1(f)
|
Form of Time-Based Restricted Stock Unit Agreement (incorporated by reference to Exhibit 10.1 of the Company’s Current Report on Form 8-K (SEC File No. 000-25349) filed on February 13, 2012)*
|
|
10.1(g)
|
Form of Performance Grant Agreement (incorporated by reference to Exhibit 10.2 of the Company’s Current Report on Form 8-K (SEC File No. 000-25349) filed on February 13, 2012)*
|
|
10.1(h)
|
Employment Agreement, dated June 15, 2007, between Alan D. Cole and the Company (incorporated by reference to Exhibit 10.1(h) of the Company’s Annual Report on Form 10-K (SEC File No. 000-25349) filed on April 16, 2008)*
|
|
10.1(i)
|
Amendment to Employment Agreement, dated June 3, 2008, between Alan D. Cole and the Company (incorporated by reference to Exhibit 10.1 of the Company’s Current Report on Form 8-K (SEC File No. 000-25349) filed on June 5, 2008)*
|
|
|
|
|
10.1(j)
|
Employment Agreement, dated January 22, 2010, between Arthur G. Raymond, Jr. and the Company (incorporated by reference to Exhibit 10.1(h) of the Company’s Form 10-K (SEC File No. 000-25349) filed on April 15, 2010)*
|
|
10.1(k)
|
Employment Agreement, dated August 22, 2011, between Michael W. Delgatti, Jr. and the Company*
|
|
10.1(l)
|
Restricted Stock Unit Agreement, dated as of September 7, 2011, between Michael W. Delgatti, Jr. and the Company (incorporated by reference to Exhibit 10.1(m) of the Company’s Form 10-K (SEC File No. 000-25349) filed on April 12, 2013)*
|
|
10.2(a)
|
Loan Agreement, dated as of December 7, 2010, between Bank of America, N.A. and the Company (incorporated by referenced to Exhibit 10.1 of the Company’s Current Report on Form 8-K (SEC File No. 000-25349) filed on December 8, 2010.
|
|
10.2(b)
|
Amendment No. 1 to Loan Agreement, dated as of May 18, 2012, between Bank of America, N.A. and the Company (incorporated by referenced to Exhibit 10.1 of the Company’s Quarterly Report on Form 10-Q (SEC File No. 000-25349) filed on June 6, 2012
|
|
21
|
List of Subsidiaries:
|
|
Bradington-Young LLC, a Virginia limited liability company
|
|
|
Sam Moore Furniture LLC, a Virginia limited liability company
|
|
|
23
|
|
|
31.1
|
|
|
31.2
|
|
|
32.1
|
|
|
101
|
The following financial statements from the Company's Annual Report on Form 10-K for the fiscal year ended February 3, 2013, formatted in Extensible Business Reporting Language (“XBRL”): (i) consolidated balance sheets, (ii) consolidated statements of operations, (iii) consolidated statements of comprehensive income, (iv) consolidated statements of cash flows, (v) consolidated statements of shareholders’ equity and (vi) the notes to the consolidated financial statements, tagged as blocks of text (filed herewith) #
|
*Management contract or compensatory plan
#Under Rule 406T of Regulation S-T, this exhibit is deemed not filed or part of a registration statement or prospectus for purposes of Sections 11 or 12 of the Securities Act of 1933, as amended, is deemed not filed for purposes of Section 18 of the Securities and Exchange Act of 1934, as amended, and otherwise is not subject to liability under those sections
Pursuant to the requirements of Section 13 or 15(d) of the Securities Exchange Act of 1934, the registrant has duly caused this report to be signed on its behalf by the undersigned, thereunto duly authorized.
| HOOKER FURNITURE CORPORATION | |||
|
April 19, 2013
|
By:
|
/s/ Paul B. Toms, Jr. | |
|
Paul B. Toms, Jr.
|
|||
|
Chairman and Chief Executive Officer
|
|||
Pursuant to the requirements of the Securities Exchange Act of 1934, this report has been signed below by the following persons on behalf of the registrant and in the capacities and on the dates indicated.
|
Signature
|
Title
|
Date
|
||
|
/s/ Paul B. Toms, Jr.
|
Chairman, Chief Executive Officer and
|
April 19, 2013
|
||
|
Paul B. Toms, Jr.
|
Director (Principal Executive Officer)
|
|||
|
/s/ Paul A. Huckfeldt
|
Vice President - Finance and Accounting
|
April 19, 2013
|
||
|
Paul A. Huckfeldt
|
and Chief Financial Officer (Principal Financial and Accounting Officer)
|
|||
|
|
||||
|
/s/ W. Christopher Beeler, Jr.
|
Director
|
April 19, 2013
|
||
|
W. Christopher Beeler, Jr.
|
||||
|
/s/ John L. Gregory, III
|
Director
|
April 19, 2013
|
||
|
John L. Gregory, III
|
||||
|
/s/ E. Larry Ryder
|
Director
|
April 19, 2013
|
||
|
E. Larry Ryder
|
||||
|
/s/ Mark F. Schreiber
|
Director
|
April 19, 2013
|
||
|
Mark F. Schreiber
|
||||
|
/s/ David G. Sweet
|
Director
|
April 19, 2013
|
||
|
David G. Sweet
|
||||
|
/s/ Henry G. Williamson, Jr.
|
Director
|
April 19, 2013
|
||
|
Henry G. Williamson, Jr.
|
HOOKER
FURNITURE CORPORATION AND SUBSIDIARIES
INDEX TO CONSOLIDATED FINANCIAL STATEMENTS
|
Page
|
|
|
F-2
|
|
|
F-3
|
|
|
F-5
|
|
|
F-6
|
|
|
F-7
|
|
|
F-8
|
|
|
F-9
|
|
|
F-10
|
MANAGEMENT’S
REPORT ON INTERNAL CONTROL OVER FINANCIAL REPORTING
To the Shareholders of
Hooker Furniture Corporation
Martinsville, Virginia
Management is responsible for establishing and maintaining adequate internal control over financial reporting, as defined in Securities Exchange Act Rule 13a-15(f). Under the supervision and with the participation of management, including the principal executive officer and principal financial officer, the Company conducted an evaluation of the effectiveness of its internal control over financial reporting based on the framework in
Internal Control—Integrated Framework
issued by the Committee of Sponsoring Organizations of the Treadway Commission (COSO). Based on the Company’s evaluation under that framework, management concluded that the Company’s internal control over financial reporting was effective as of February 3, 2013. The effectiveness of the Company’s internal control over financial reporting as of February 3, 2013 has been audited by KPMG LLP, the Company’s independent registered public accounting firm, as stated in their report which is included herein.

Paul B. Toms, Jr.
Chairman and Chief Executive Officer
(Principal Executive Officer)
April 19, 2013

Paul A. Huckfeldt
Vice President – Finance and Accounting
and Chief Financial Officer
(Principal Financial and Accounting Officer)
April 19, 2013
Report of
Independent
Registered Public Accounting Firm
The Board of Directors and Shareholders
Hooker Furniture Corporation:
We have audited Hooker Furniture Corporation’s internal control over financial reporting as of February 3, 2013, based on criteria established in
Internal Control – Integrated Framework
issued by the Committee of Sponsoring Organizations of the Treadway Commission (COSO). Hooker Furniture Corporation’s management is responsible for maintaining effective internal control over financial reporting and for its assessment of the effectiveness of internal control over financial reporting, included in the accompanying Management’s Report on Internal Controls over Financial Reporting. Our responsibility is to express an opinion on the Company’s internal control over financial reporting based on our audit.
We conducted our audit in accordance with the standards of the Public Company Accounting Oversight Board (United States). Those standards require that we plan and perform the audit to obtain reasonable assurance about whether effective internal control over financial reporting was maintained in all material respects. Our audit included obtaining an understanding of internal control over financial reporting, assessing the risk that a material weakness exists, and testing and evaluating the design and operating effectiveness of internal control based on the assessed risk. Our audit also included performing such other procedures as we considered necessary in the circumstances. We believe that our audit provides a reasonable basis for our opinion.
A company’s internal control over financial reporting is a process designed to provide reasonable assurance regarding the reliability of financial reporting and the preparation of financial statements for external purposes in accordance with generally accepted accounting principles. A company’s internal control over financial reporting includes those policies and procedures that (1) pertain to the maintenance of records that, in reasonable detail, accurately and fairly reflect the transactions and dispositions of the assets of the company; (2) provide reasonable assurance that transactions are recorded as necessary to permit preparation of financial statements in accordance with generally accepted accounting principles, and that receipts and expenditures of the company are being made only in accordance with authorizations of management and directors of the company; and (3) provide reasonable assurance regarding prevention or timely detection of unauthorized acquisition, use, or disposition of the company’s assets that could have a material effect on the financial statements.
Because of its inherent limitations, internal control over financial reporting may not prevent or detect misstatements. Also, projections of any evaluation of effectiveness to future periods are subject to the risk that controls may become inadequate because of changes in conditions, or that the degree of compliance with the policies or procedures may deteriorate.
In our opinion, Hooker Furniture Corporation maintained, in all material respects, effective internal control over financial reporting as of February 3, 2013, based on criteria established in
Internal Control – Integrated Framework
issued by the Committee of Sponsoring Organizations of the Treadway Commission.
We also have audited, in accordance with the standards of the Public Company Accounting Oversight Board (United States), the consolidated balance sheets of Hooker Furniture Corporation and subsidiaries as of February 3, 2013 and January 29, 2012, and the related consolidated statements of income, comprehensive income, cash flows, and shareholders’ equity for each of the years in the three-year period ended February 3, 2013, and our report dated April 19, 2013 expressed an unqualified opinion on those consolidated financial statements.
/s/ KPMG LLP
Charlotte, North Carolina
April 19, 2013
Report of Independent Registered Public Accounting Firm
The Board of Directors and Shareholders
Hooker Furniture Corporation:
We have audited the accompanying consolidated balance sheets of Hooker Furniture Corporation and subsidiaries as of February 3, 2013 and January 29, 2012, and the related consolidated statements of income, comprehensive income, cash flows, and shareholders’ equity for each of the years in the three-year period ended February 3, 2013. These consolidated financial statements are the responsibility of the Company’s management. Our responsibility is to express an opinion on these consolidated financial statements based on our audits.
We conducted our audits in accordance with the standards of the Public Company Accounting Oversight Board (United States). Those standards require that we plan and perform the audit to obtain reasonable assurance about whether the financial statements are free of material misstatement. An audit includes examining, on a test basis, evidence supporting the amounts and disclosures in the financial statements. An audit also includes assessing the accounting principles used and significant estimates made by management, as well as evaluating the overall financial statement presentation. We believe that our audits provide a reasonable basis for our opinion.
In our opinion, the consolidated financial statements referred to above present fairly, in all material respects, the financial position of Hooker Furniture Corporation and subsidiaries as of February 3, 2013 and January 29, 2012, and the results of their operations and their cash flows for each of the years in the three-year period ended February 3, 2013, in conformity with U.S. generally accepted accounting principles.
We also have audited, in accordance with the standards of the Public Company Accounting Oversight Board (United States), Hooker Furniture Corporation’s internal control over financial reporting as of February 3, 2013, based on criteria established in
Internal Control – Integrated Framework
issued by the Committee of Sponsoring Organizations of the Treadway Commission (COSO), and our report dated April 19, 2013 expressed an unqualified opinion on the effectiveness of the Company’s internal control over financial reporting.
/s/ KPMG LLP
Charlotte, North Carolina
April 19, 2013
|
As of
|
February 3,
|
January 29,
|
||||||
|
2013
|
2012
|
|||||||
|
Assets
|
||||||||
|
Current assets
|
||||||||
|
Cash and cash equivalents
|
$ | 26,342 | $ | 40,355 | ||||
|
Trade accounts receivable, less allowance for doubtful
accounts of
$1,249
and $1,632 on each respective date
|
28,272 | 25,807 | ||||||
|
Inventories
|
49,872 | 34,136 | ||||||
|
Prepaid expenses and other current assets
|
3,569 | 3,182 | ||||||
|
Deferred taxes
|
1,612 | 1,012 | ||||||
|
Total current assets
|
109,667 | 104,492 | ||||||
|
Property, plant and equipment, net
|
22,829 | 21,669 | ||||||
|
Intangible assets
|
1,257 | 1,257 | ||||||
|
Cash surrender value of life insurance policies
|
17,360 | 16,217 | ||||||
|
Deferred taxes
|
4,494 | 5,114 | ||||||
|
Other assets
|
216 | 422 | ||||||
|
Total assets
|
$ | 155,823 | $ | 149,171 | ||||
|
Liabilities and Shareholders’ Equity
|
||||||||
|
Current liabilities
|
||||||||
|
Trade accounts payable
|
$ | 11,620 | $ | 9,233 | ||||
|
Accrued salaries, wages and benefits
|
3,316 | 3,855 | ||||||
|
Other accrued expenses
|
2,531 | 792 | ||||||
|
Accrued dividends
|
- | 1,078 | ||||||
|
Total current liabilities
|
17,467 | 14,958 | ||||||
|
Deferred compensation
|
7,311 | 7,100 | ||||||
|
Total liabilities
|
24,778 | 22,058 | ||||||
|
Shareholders’ equity
|
||||||||
|
Common stock, no par value,
20,000
shares authorized,
10,746
and 10,793
shares issued and outstanding on each date
|
17,360 | 17,262 | ||||||
|
Retained earnings
|
113,483 | 109,742 | ||||||
|
Accumulated other comprehensive income
|
202 | 109 | ||||||
|
Total shareholders’ equity
|
131,045 | 127,113 | ||||||
|
Total liabilities and shareholders’ equity
|
$ | 155,823 | $ | 149,171 | ||||
See accompanying Notes to Consolidated Financial Statements.
HOOKER FURNITURE
CORPORATION
AND SUBSIDIARIES
(In thousands, except per share data)
|
For The
|
||||||||||||
|
53 Weeks Ended
|
52 Weeks Ended
|
|||||||||||
|
February 3,
|
January 29,
|
January 30,
|
||||||||||
|
2013
|
2012
|
2011
|
||||||||||
|
Net sales
|
$ | 218,359 | $ | 222,505 | $ | 215,429 | ||||||
|
Cost of sales
|
165,813 | 173,642 | 168,047 | |||||||||
|
Casualty loss
|
- | - | 2,208 | |||||||||
|
Insurance recovery
|
- | - | (1,708 | ) | ||||||||
|
Total cost of sales
|
165,813 | 173,642 | 168,547 | |||||||||
|
Gross profit
|
52,546 | 48,863 | 46,882 | |||||||||
|
Selling and administrative expenses
|
39,606 | 40,375 | 41,022 | |||||||||
|
Restructuring charges
|
- | - | 1,403 | |||||||||
|
Intangible asset impairment charges
|
- | 1,815 | 396 | |||||||||
|
Operating income
|
12,940 | 6,673 | 4,061 | |||||||||
|
Other income, net
|
53 | 272 | 108 | |||||||||
|
Income before income taxes
|
12,993 | 6,945 | 4,169 | |||||||||
|
Income taxes
|
4,367 | 1,888 | 929 | |||||||||
|
Net income
|
$ | 8,626 | $ | 5,057 | $ | 3,240 | ||||||
|
Earnings per share:
|
||||||||||||
|
Basic and diluted
|
$ | 0.80 | $ | 0.47 | $ | 0.30 | ||||||
|
Weighted average shares outstanding:
|
||||||||||||
|
Basic
|
10,745 | 10,762 | 10,757 | |||||||||
|
Diluted
|
10,775 | 10,790 | 10,770 | |||||||||
|
Cash dividends declared per share
|
$ | 0.40 | $ | 0.40 | $ | 0.40 | ||||||
See accompanying Notes to Consolidated Financial Statements.
HOOKER FURNITURE
CORPORATION
AND SUBSIDIARIES
CONSOLIDATED STATEMENTS OF COMPREHENSIVE INCOME
(In thousands)
|
53 Weeks Ended
|
52 Weeks Ended
|
|||||||||||
|
February 3,
|
January 29,
|
January 30,
|
||||||||||
|
2013
|
2012
|
2011
|
||||||||||
|
Net Income
|
$ | 8,626 | $ | 5,057 | $ | 3,240 | ||||||
|
Other comprehensive income (loss):
|
||||||||||||
|
Amortization of actuarial gains
|
145 | (803 | ) | 266 | ||||||||
|
Income tax effect on amortization of actuarial gains
|
(51 | ) | 303 | (100 | ) | |||||||
|
Adjustments to net periodic benefit cost
|
94 | (500 | ) | 166 | ||||||||
|
Comprehensive Income
|
$ | 8,720 | $ | 4,557 | $ | 3,406 | ||||||
See accompanying Notes to Consolidated Financial Statements.
HOOKER FURNITURE
CORPORATION
AND SUBSIDIARIES
CONSOLIDATED STATEMENTS OF CASH FLOWS
(In thousands)
|
For The
|
||||||||||||
|
53 Weeks Ended
|
52 Weeks Ended
|
|||||||||||
|
February 3,
|
January 29,
|
January 30,
|
||||||||||
|
2013
|
2012
|
2011
|
||||||||||
|
Cash flows from operating activities
|
||||||||||||
|
Cash received from customers
|
$ | 215,982 | $ | 224,577 | $ | 213,850 | ||||||
|
Cash paid to suppliers and employees
|
(216,379 | ) | (190,365 | ) | (226,986 | ) | ||||||
|
Insurance proceeds received on casualty loss
|
- | - | 1,708 | |||||||||
|
Income taxes paid, net
|
(2,901 | ) | (1,987 | ) | (3,938 | ) | ||||||
|
Interest / (paid) received, net
|
(35 | ) | 51 | (93 | ) | |||||||
|
Net cash (used in) / provided by operating activites
|
(3,333 | ) | 32,276 | (15,459 | ) | |||||||
|
Cash flows from investing activities
|
||||||||||||
|
Purchases of property, plant, and equipment
|
(4,061 | ) | (3,805 | ) | (2,010 | ) | ||||||
|
Proceeds received on notes receivable
|
37 | 35 | 31 | |||||||||
|
Proceeds from the sale of property and equipment
|
303 | 125 | - | |||||||||
|
Premiums paid on life insurance policies
|
(902 | ) | (1,144 | ) | (1,346 | ) | ||||||
|
Proceeds received on life insurance policies
|
- | 560 | 1,724 | |||||||||
|
Net cash used in investing activities
|
(4,623 | ) | (4,229 | ) | (1,601 | ) | ||||||
|
Cash flows from financing activities
|
||||||||||||
|
Cash dividends paid
|
(5,386 | ) | (4,315 | ) | (4,312 | ) | ||||||
|
Purchase and retirement of common stock
|
(671 | ) | - | - | ||||||||
|
Net cash used in financing activities
|
(6,057 | ) | (4,315 | ) | (4,312 | ) | ||||||
|
Net (decrease) / increase in cash and cash equivalents
|
(14,013 | ) | 23,732 | (21,372 | ) | |||||||
|
Cash and cash equivalents at the beginning of the year
|
40,355 | 16,623 | 37,995 | |||||||||
|
Cash and cash equivalents at the end of the year
|
$ | 26,342 | $ | 40,355 | $ | 16,623 | ||||||
|
Reconciliation of net income to net cash (used in) / provided by
operating activities:
|
||||||||||||
|
Net income
|
$ | 8,626 | $ | 5,057 | $ | 3,240 | ||||||
|
Depreciation and amortization
|
2,566 | 2,566 | 2,848 | |||||||||
|
Non-cash restricted stock & performance awards
|
465 | (38 | ) | 225 | ||||||||
|
Asset impairment charges
|
- | 1,815 | 396 | |||||||||
|
Restructuring charge
|
- | - | 1,403 | |||||||||
|
Loss on disposal of property
|
32 | 108 | 118 | |||||||||
|
Provision for doubtful accounts
|
61 | 361 | 674 | |||||||||
|
Gain on life insurance policies
|
(680 | ) | (565 | ) | (577 | ) | ||||||
|
Deferred income tax expense (benefit)
|
20 | (35 | ) | (1,872 | ) | |||||||
|
Changes in assets and liabilities:
|
||||||||||||
|
Trade accounts receivable
|
(2,526 | ) | 1,502 | (2,451 | ) | |||||||
|
Inventories
|
(15,736 | ) | 23,302 | (21,262 | ) | |||||||
|
Prepaid expenses and other current assets
|
172 | 450 | (185 | ) | ||||||||
|
Trade accounts payable
|
2,387 | (2,552 | ) | 1,360 | ||||||||
|
Accrued salaries, wages, and benefits
|
(539 | ) | 429 | 967 | ||||||||
|
Accrued income taxes
|
1,444 | (63 | ) | (1,136 | ) | |||||||
|
Other accrued expenses (income)
|
295 | (256 | ) | 293 | ||||||||
|
Deferred compensation
|
80 | 195 | 500 | |||||||||
|
Net cash (used in)/provided by operating activities
|
$ | (3,333 | ) | $ | 32,276 | $ | (15,459 | ) | ||||
See accompanying Notes to Consolidated Financial Statements
HOOKER FURNITURE
CORPORATION
AND SUBSIDIARIES
CONSOLIDATED STATEMENTS OF SHAREHOLDERS' EQUITY
(In thousands, except per share data)
For the 52 Week Periods Ended January 30, 2011 and January 29, 2012 and the 53 Week Period Ended February 3, 2013
|
Accumulated
|
||||||||||||||||||||
|
Other
|
Total
|
|||||||||||||||||||
|
Common Stock
|
Retained
|
Comprehensive
|
Shareholders'
|
|||||||||||||||||
|
Shares
|
Amount
|
Earnings
|
Income
|
Equity
|
||||||||||||||||
|
Balance at January 31, 2010
|
10,775 | $ | 17,076 | $ | 110,073 | $ | 443 | $ | 127,592 | |||||||||||
|
Net income
|
- | - | 3,240 | - | 3,240 | |||||||||||||||
|
Unrealized gain on deferred compensation
|
- | - | - | 166 | 166 | |||||||||||||||
|
Cash dividends paid and accrued ($0.40 per share)
|
- | - | (4,312 | ) | - | (4,312 | ) | |||||||||||||
|
Restricted stock grants, net of forfeitures
|
7 | - | - | - | - | |||||||||||||||
|
Restricted stock compensation cost
|
- | 85 | - | - | 85 | |||||||||||||||
|
Balance at January 30, 2011
|
10,782 | $ | 17,161 | $ | 109,000 | $ | 609 | $ | 126,770 | |||||||||||
|
Net income
|
- | - | 5,057 | - | 5,057 | |||||||||||||||
|
Unrealized loss on deferred compensation
|
- | - | - | (500 | ) | (500 | ) | |||||||||||||
|
Cash dividends paid and accrued ($0.40 per share)
|
- | - | (4,315 | ) | - | (4,315 | ) | |||||||||||||
|
Restricted stock grants, net of forfeitures
|
11 | - | - | - | - | |||||||||||||||
|
Restricted stock compensation cost
|
- | 101 | - | - | 101 | |||||||||||||||
|
Balance at January 29, 2012
|
10,793 | $ | 17,262 | $ | 109,742 | $ | 109 | $ | 127,113 | |||||||||||
|
Net income
|
- | - | 8,626 | - | 8,626 | |||||||||||||||
|
Unrealized loss on deferred compensation
|
- | - | - | 94 | 94 | |||||||||||||||
|
Cash dividends paid and accrued ($0.40 per share)
|
- | - | (4,307 | ) | - | (4,307 | ) | |||||||||||||
|
Purchase and retirement of common stock
|
(58 | ) | (93 | ) | (578 | ) | - | (671 | ) | |||||||||||
|
Restricted stock grants, net of forfeitures
|
11 | - | - | - | - | |||||||||||||||
|
Restricted stock compensation cost
|
- | 191 | - | - | 191 | |||||||||||||||
|
Balance at February 3, 2013
|
10,746 | $ | 17,360 | $ | 113,483 | $ | 202 | $ | 131,045 | |||||||||||
See accompanying Notes to Consolidated Financial Statements.
Nature of Business
Hooker Furniture Corporation and subsidiaries (the “Company,” “we,” “us” and “our”) design, import, manufacture and market residential household furniture for sale to wholesale and retail merchandisers located principally in North America.
Consolidation
The consolidated financial statements include the accounts of Hooker Furniture Corporation and our wholly owned subsidiaries. All material intercompany accounts and transactions have been eliminated in consolidation. All references to the Company refer to the Company and our consolidated subsidiaries, unless specifically referring to segment information. For comparative purposes, certain amounts in the consolidated financial statements and notes have been reclassified to conform to the fiscal 2013 presentation.
Segments
We are organized into two operating segments – casegoods furniture and upholstered furniture. The upholstery segment consists of Bradington-Young LLC and Sam Moore Furniture.
Cash and Cash Equivalents
We temporarily invest unused cash balances in a high quality, diversified money market fund that provides for daily liquidity and pays dividends monthly. Cash equivalents are stated at cost plus accrued interest, which approximates fair value.
Trade Accounts Receivable
Substantially all of our trade accounts receivable are due from retailers and dealers that sell residential home furnishings, which consist of a large number of entities with a broad geographic dispersion. We continually perform credit evaluations of our customers and generally do not require collateral. Our upholstered furniture subsidiaries factor substantially all of their receivables on a non-recourse basis. Accounts receivable are reported net of allowance for doubtful accounts.
Fair Value Measurements
We utilize valuation techniques that maximize the use of observable inputs and minimize the use of unobservable inputs to the extent possible. We determine fair value based on assumptions that market participants would use in pricing an asset or liability in the principal or most advantageous market. When considering market participant assumptions in fair value measurements, the following fair value hierarchy distinguishes between observable and unobservable inputs, which are categorized in one of the following levels:
|
§
|
Level 1 Inputs: Unadjusted quoted prices in active markets for identical assets or liabilities accessible to the reporting entity at the measurement date.
|
|
§
|
Level 2 Inputs: Observable inputs other than quoted prices included in Level 1 inputs that are observable for the asset or liability, either directly or indirectly, for substantially the full term of the asset or liability.
|
|
§
|
Level 3 Inputs: Unobservable inputs for the asset or liability used to measure fair value to the extent that observable inputs are not available, thereby allowing for situations in which there is little, if any, market activity for the asset or liability at measurement date.
|
Fair Value of Financial Instruments
The carrying value for each of our financial instruments (consisting of cash and cash equivalents, trade accounts receivable and payable, and accrued liabilities) approximates fair value because of the short-term nature of those instruments.
Inventories
All inventories are stated at the lower of cost, using the last-in, first-out (LIFO) method, or the market value.
Property, Plant and Equipment
Property, plant and equipment are stated at cost, less allowances for depreciation. Provision for depreciation has been computed at annual rates that will amortize the cost of the depreciable assets over their estimated useful lives.
Impairment of Long-Lived Assets
Long-lived assets, such as property, plant and equipment, are evaluated for impairment annually or more frequently when events or changes in circumstances indicate that the carrying amount of the assets may not be recoverable through the estimated undiscounted future cash flows from the use of those assets. When any such impairment exists, the related assets are written down to fair value. Long-lived assets to be disposed of by sale are measured at the lower of their carrying amount or fair value less estimated cost to sell, are no longer depreciated, and are reported separately as “assets held for sale” in the consolidated balance sheets.
Intangible Assets
We own certain indefinite-lived intangible assets related to our upholstery segment. We may acquire additional amortizable assets and/or indefinite lived intangible assets in future asset purchases or business combinations. Our principal indefinite-lived intangible assets are trademarks and trade names which are not amortized but are tested for impairment annually or more frequently if events or circumstances indicate that the asset might be impaired. The fair value of our indefinite-lived intangible assets is determined based on the estimated earnings and cash flow capacity of those assets. The impairment test consists of a comparison of the fair value of the indefinite-lived intangible assets with their carrying amount. If the carrying amount of the indefinite-lived intangible assets exceeds their fair value, an impairment loss is recognized in an amount equal to that excess.
Trade names are tested for impairment annually as of the first day of our fiscal fourth quarter or more frequently if events or changes in circumstances indicate that the asset might be impaired. Circumstances that could indicate a potential impairment include:
|
§
|
a significant adverse change in the economic or business climate either within the furniture industry or the national or global economy;
|
|
§
|
significant changes in demand for our products;
|
|
§
|
loss of key personnel; or
|
|
§
|
the likelihood that a reporting unit or significant portion of a reporting unit will be sold or otherwise disposed of.
|
The assumptions used to determine the fair value of our intangible assets are highly subjective, involve significant judgment and include long term growth rates, sales volumes, projected revenues, assumed royalty rates and various factors used to develop an applied discount rate. If the assumptions that we use in these calculations differ from actual results, we may realize additional impairment on our intangible assets which may have a material adverse effect on our consolidated results of operations and consolidated balance sheets.
Cash Surrender Value of Life Insurance Policies
We own eighty-seven life insurance policies on certain of our current and former executives and other key employees. These policies have a carrying value of $17.4 million and a face value of approximately $38.0 million. Proceeds from the policies are used to fund certain employee benefits and for other general corporate purposes. We account for life insurance as a component of employee benefits cost. Consequently the cost of the coverage and any resulting gains or losses related to those insurance policies are recorded as a decrease or increase to operating income. Cash payments that increase the cash surrender value of these policies are classified as investing outflows on the Consolidated Statements of Cash Flows, with amounts paid in excess of the increase in cash surrender value included in operating activities. Gains on life insurance policies, which typically occur at the time the policy is redeemed, are included in the reconciliation of net income to net cash used in or provided by operating activities.
Revenue Recognition
Our sales revenue is recognized when title and the risk of loss pass to the customer, which typically occurs at the time of shipment. In some cases however, title does not pass until the shipment is delivered to the customer. Sales are recorded net of allowances for trade promotions, estimated product returns, rebate advertising programs and other discounts.
Cost of Sales
The major components of cost of sales are:
|
§
|
raw materials and supplies used in our domestically manufactured products;
|
|
§
|
labor, utility and overhead costs associated with our domestically manufactured products;
|
|
§
|
the cost of imported products purchased for resale;
|
|
§
|
the cost of our foreign import operations;
|
|
§
|
charges or credits associated with our inventory reserves;
|
|
§
|
warehousing and certain shipping and handling costs; and
|
|
§
|
all other costs required to be classified as cost of sales.
|
Selling and Administrative Expenses
The major components of our selling and administrative expenses are:
|
§
|
the cost of our marketing and merchandising efforts, including showroom expenses;
|
|
§
|
sales and designs commissions;
|
|
§
|
the costs of administrative support functions including, executive management, information technology, human resources, finance; and
|
|
§
|
all other costs required to be classified as selling and administrative expenses.
|
Advertising
We offer advertising programs to qualified dealers under which we may provide signage, catalogs and other marketing support to our customers and may reimburse advertising and other costs incurred by our customers in connection with promoting our products. The cost of these programs does not exceed the fair value of the benefit received. We charge the cost of point-of-purchase materials (including signage and catalogs) to selling and administrative expense as incurred. Advertising costs charged to selling and administrative expense for fiscal years 2013, 2012 and 2011 were $2.3 million, $2.2 million and $2.4 million, respectively. The costs for other advertising allowance programs are charged against net sales. We also have arrangements with some customers to reimburse them for a portion of their advertising costs, which provides advertising benefits to us. Costs for these arrangements are expensed as incurred and are netted against revenues in our consolidated statements of operations and comprehensive income.
Income Taxes
At times, tax law and generally accepted accounting principles differ in the treatment of certain income and expense items. These items may be excluded or included in taxable income at different times than is required for GAAP or “book” reporting purposes. These differences may be permanent or temporary in nature.
We determine our annual effective income tax rate based on forecasted pre-tax book income and forecasted permanent book and tax differences. The rate is established at the beginning of the year and is evaluated on a quarterly basis. We consider the level and mix of income of our separate legal entities, statutory tax rates, business credits available in the various jurisdictions in which we operate and permanent tax differences. Significant judgment is required in evaluating tax positions that affect the annual tax rate. Any changes to the forecasted information may cause adjustments to the effective rate. Additional tax, interest and penalties associated with uncertain tax positions are recognized in tax expense on a quarterly basis.
To the extent that any book and tax differences are temporary in nature, that is, the book realization will occur in a different period than the tax realization, a deferred tax asset or liability is established. To the extent that a deferred tax asset is created, we evaluate our ability to realize this asset. If we determine that we will not be able to fully utilize deferred tax assets, we establish a valuation reserve. In assessing the realization of deferred tax assets, we consider whether it is more likely than not that some portion or all of the deferred tax assets will be realized. The ultimate realization of deferred tax assets is dependent upon the generation of future taxable income during the periods in which those temporary differences reverse.
Earnings Per Share
We use the two class method to compute basic earnings per share. Under this method we allocate earnings to common stock and participating securities according to their participation rights in dividends declared and undistributed earnings and divide the income available to each class by the weighted average number of common shares for the period in each class. Unvested restricted stock grants to our non-employee directors are considered participating securities because the shares have the right to receive non-forfeitable dividends. Because the participating shares have no obligation to share in net losses, we do not allocate losses to our common stock in this calculation.
Diluted earnings per share reflect the potential dilutive effect of securities that could share in our earnings. Restricted stock awarded to non-employee members of the board of directors and restricted stock units granted to employees that have not yet vested are considered when computing diluted earnings per share. We use the treasury stock method to determine the dilutive effect of both unvested restricted stock and unvested restricted stock units. Shares of unvested restricted stock and unvested restricted stock units
under a stock-based compensation arrangement are considered options for purposes of computing diluted earnings per share and are considered outstanding shares as of the grant date for purposes of computing diluted earnings per share even though their exercise may be contingent upon vesting. Those stock-based awards are included in the diluted earnings per share computation even if the non-employee director may be required to forfeit the stock at some future date, or no shares may ever be issued to the employees. Unvested restricted stock and unvested restricted stock units are not included in outstanding common stock in computing basic earnings per share.
Use of Estimates
The preparation of financial statements in conformity with U.S. generally accepted accounting principles requires us to make estimates and assumptions that affect the reported amounts of: (i) assets and liabilities, including disclosures regarding contingent assets and liabilities at the dates of the financial statements; and (ii) revenue and expenses during the reported periods. Significant items subject to such estimates and assumptions include the useful lives of fixed assets; allowance for doubtful accounts; deferred tax assets; the valuation of fixed assets; our supplemental retirement income plan; and stock-based compensation. These estimates and assumptions are based on our best judgments. We evaluate these estimates and assumptions on an ongoing basis using historical experience and other factors, including the current economic environment, which we believe to be reasonable under the circumstances. We adjust our estimates and assumptions as facts and circumstances dictate. Actual results could differ from our estimates.
Our fiscal years end on the Sunday closest to January 31. In some years, generally once every six years, the fourth quarter will be fourteen weeks long and the fiscal year will consist of fifty-three weeks. For example, the 2013 fiscal year that ended on February 3, 2013 was a 53-week fiscal year. Our quarterly periods are based on thirteen-week “reporting periods,” which end on Sundays. As a result, each quarterly period generally will be thirteen weeks, or 91 days long, except as noted above.
In the notes to the consolidated financial statements, references to the:
|
§
|
2013 fiscal year and comparable terminology mean the fiscal year that began January 30, 2012 and ended February 3, 2013;
|
|
§
|
2012 fiscal year and comparable terminology mean the fiscal year that began January 31, 2011 and ended January 29, 2012; and
|
|
§
|
2011 fiscal year and comparable terminology mean the fiscal year that began February 1, 2010 and ended January 30, 2011;
|
The activity in the allowance for doubtful accounts was:
|
Fifty-Three Weeks Ended
|
Fifty-Two Weeks Ended
|
|||||||||||
|
February 3,
|
January 29,
|
January 30,
|
||||||||||
|
2013
|
2012
|
2011
|
||||||||||
|
Balance at beginning of year
|
$ | 1,632 | $ | 2,082 | $ | 1,938 | ||||||
|
Non-cash charges to cost and expenses
|
61 | 361 | 674 | |||||||||
|
Less uncollectible receivables written off, net of recoveries
|
(444 | ) | (811 | ) | (530 | ) | ||||||
|
Balance at end of year
|
$ | 1,249 | $ | 1,632 | $ | 2,082 | ||||||
|
February 3,
|
January 29,
|
|||||||
|
2013
|
2012
|
|||||||
|
Trade accounts receivable
|
$ | 22,712 | $ | 21,261 | ||||
|
Receivable from factor
|
6,809 | 6,178 | ||||||
|
Allowance for doubtful accounts
|
(1,249 | ) | (1,632 | ) | ||||
|
Accounts receivable
|
$ | 28,272 | $ | 25,807 | ||||
“Receivable from factor” represents amounts due with respect to factored accounts receivable. We factor substantially all of our domestic upholstery accounts receivable, in most cases without recourse to us.
Under our factoring agreement, invoices for domestic upholstery products are generated and transmitted to our customers, with copies to the factor on a daily basis, as products are shipped to our customers. The factor collects the amounts due and remits collected funds, less factoring fees, to us semi-weekly. We retain ownership of the accounts receivable until the invoices are 90 days past due. At that time, the factor pays us the net invoice amount, less factoring fees, and takes ownership of the accounts receivable. The factor is then entitled to collect the invoices on its own behalf and retain any subsequent remittances. The invoiced amounts are reported as accounts receivable on our consolidated balance sheets, generally when title to the merchandise passes to our customer until payment is received from the factor.
A limited number of domestic upholstery accounts receivable are factored with recourse to us. The amounts of these receivables at February 3, 2013 and January 29, 2012 were $58,000 and $135,000, respectively. If the factor is unable to collect the amounts due, invoices are returned to us for collection. We include an estimate of potentially uncollectible amounts for these receivables in our calculation of our allowance for doubtful accounts.
|
February 3,
|
January 29,
|
|||||||
|
2013
|
2012
|
|||||||
|
Finished furniture
|
$ | 58,584 | $ | 42,656 | ||||
|
Furniture in process
|
688 | 580 | ||||||
|
Materials and supplies
|
8,478 | 7,942 | ||||||
|
Inventories at FIFO
|
67,750 | 51,178 | ||||||
|
Reduction to LIFO basis
|
(17,878 | ) | (17,042 | ) | ||||
|
Inventories
|
$ | 49,872 | $ | 34,136 | ||||
If the first-in, first-out (FIFO) method had been used in valuing all inventories, net income would have been $9.2 million in fiscal 2013, $6.0 million in fiscal 2012, and $5.1 million in fiscal 2011.
As of February 3, 2013, we held $7.3 million in inventory (approximately 4.7% of total assets) outside of the United States, all in China. As of January 29, 2012, we held $7.8 million in inventory (approximately 5.3% of total assets) outside of the United States, all in China.
|
Depreciable Lives
|
February 3,
|
January 29,
|
|||||||||
|
(In years)
|
2013
|
2012
|
|||||||||
|
Computer software and hardware
|
3 - 10 | $ | 22,203 | $ | 26,347 | ||||||
|
Buildings and land improvements
|
15 - 30 | 23,680 | 24,501 | ||||||||
|
Machinery and equipment
|
10 | 3,663 | 3,708 | ||||||||
|
Leasehold improvements
|
5 | 2,801 | 777 | ||||||||
|
Furniture and fixtures
|
3 - 8 | 1,989 | 1,653 | ||||||||
|
Other
|
5 | 600 | 763 | ||||||||
|
Total depreciable property at cost
|
54,936 | 57,749 | |||||||||
|
Less accumulated depreciation
|
34,559 | 41,117 | |||||||||
|
Total depreciable property, net
|
20,377 | 16,632 | |||||||||
|
Land
|
1,152 | 1,357 | |||||||||
|
Construction-in-progress
|
1,300 | 3,680 | |||||||||
|
Property, plant and equipment, net
|
$ | 22,829 | $ | 21,669 | |||||||
Leasehold improvements increased $2.0 million to $2.8 million at February 3, 2013, primarily due to the capitalization of improvements to our new High Point, NC showroom during the fiscal 2013 first quarter.
The buildings and land improvements, machinery and equipment and land fixed asset categories decreased at February 3, 2013, primarily due to the sale of our former Cherryville, NC upholstery manufacturing facility during the fiscal 2013 second quarter.
The $1.3 million in construction-in-process at February 3, 2013 is made up primarily of expenses to support our continued ERP conversion efforts and technological upgrades in our import and upholstery operations. In connection with the implementation of our new ERP system, we disposed of approximately $6 million of computer software which will no longer be used. Most of this software was fully depreciated; therefore, we also wrote off a corresponding amount of accumulated depreciation and amortization, resulting in a loss of $78,000 recorded in the selling and administrative line of our consolidated statements of income for the fiscal year ended February 3, 2013.
No significant property, plant or equipment was held outside of the United States at either February 3, 2013 or January 29, 2012.
Capitalized Software Costs
Certain costs incurred in connection with developing or obtaining computer software for internal use are capitalized. These costs are amortized over periods of ten years or less. Capitalized software is reported as a component of computer software and hardware above and on the property, plant, and equipment line of our consolidated balance sheets. The activity in capitalized software costs was:
|
Fifty-Three Weeks Ended
|
Fifty-Two Weeks Ended
|
|||||||||||
|
February 3,
|
January 29,
|
January 30,
|
||||||||||
|
2013
|
2012
|
2011
|
||||||||||
|
Balance beginning of year
|
$ | 618 | $ | 1,519 | $ | 2,493 | ||||||
|
Purchases
|
2,814 | 11 | 63 | |||||||||
|
Amortization expense
|
(533 | ) | (912 | ) | (1,037 | ) | ||||||
|
Disposals
|
(69 | ) | - | - | ||||||||
|
Balance end of year
|
$ | 2,830 | $ | 618 | $ | 1,519 | ||||||
|
February 3,
|
January 29,
|
||||||||
|
Segment
|
2013
|
2012
|
|||||||
|
Non-amortizable Intangible Assets
|
|||||||||
|
Trademarks and trade names - Bradington-Young
|
Upholstery
|
$ | 861 | $ | 861 | ||||
|
Trademarks and trade names - Sam Moore
|
Upholstery
|
396 | 396 | ||||||
|
Total trademarks and trade names
|
1,257 | 1,257 | |||||||
We recorded certain intangible assets related to the acquisitions of Bradington-Young and Sam Moore. The trademarks and trade names have indefinite useful lives and consequently are not subject to amortization for financial reporting purposes but are tested for impairment annually or more frequently if events or circumstances indicate that the asset might be impaired. See “Note 1 – Summary of Significant Accounting Policies: Intangible Assets.”
Trademarks and trade names are related to the acquisitions of Bradington-Young and Sam Moore. In conjunction with our evaluation of the cash flows generated by the reporting units, we evaluated the carrying value of trademarks and trade names using the relief from royalty method, which values the trademark/trade name by estimating the savings achieved by ownership of the trademark/trade name when compared to licensing the mark/name from an independent owner. The inputs used in the trademark/trade name analyses are considered Level 3 fair value measurements. Our fiscal 2012 trademark/trade name analysis lead us to conclude certain of our trademarks/trade names were impaired. Consequently, we recorded impairment charges on these intangible assets as follows:
|
Fifty-Three Weeks Ended
|
Fifty-Two Weeks Ended
|
Fifty-Two Weeks Ended
|
||||||||||
|
February 3,
|
January 29,
|
January 30,
|
||||||||||
|
2013
|
2012
|
2011
|
||||||||||
|
Trade mark/trade name impairment charges:
|
||||||||||||
|
Bradington-Young
|
$ | - | $ | 1,815 | $ | - | ||||||
|
Opus Designs by Hooker Furniture
|
- | - | 396 | |||||||||
|
Total trade mark/trade name impairment
|
$ | - | $ | 1,815 | $ | 396 | ||||||
These impairment charges are included in “intangible asset impairment charges” in our consolidated statements of operations.
Our loan agreement with Bank of America, N.A., which is scheduled to expire on July 31, 2013, includes the following terms:
|
§
|
A $15.0 million unsecured revolving credit facility, up to $3.0 million of which can be used to support letters of credit;
|
|
§
|
A floating interest rate, adjusted monthly, based on LIBOR, plus an applicable margin based on the ratio of our funded debt to our EBITDA (each as defined in the agreement);
|
|
§
|
A quarterly unused commitment fee, based on our ratio of funded debt to EBITDA; and
|
|
§
|
No pre-payment penalty.
|
The loan agreement includes customary representations and warranties and requires us to comply with customary covenants, including, among other things, the following financial covenants:
|
§
|
Maintain a tangible net worth of at least $95.0 million;
|
|
§
|
Limit capital expenditures to no more than $15.0 million during any fiscal year; and
|
|
§
|
Maintain a ratio of funded debt to EBITDA not exceeding 2.0:1.0.
|
We were in compliance with each of these financial covenants at February 3, 2013 and expect to remain in compliance with existing covenants for the foreseeable future.
During the fiscal 2013 second quarter we amended our loan agreement to reduce the minimum required tangible net worth from $108 million to $95 million, primarily to provide additional flexibility to purchase our common shares under a share repurchase authorization approved by our board in April 2012. The loan agreement does not restrict our ability to pay cash dividends on, or repurchase shares of our common stock, subject to complying with the financial covenants under the agreement.
As of February 3, 2013, we had an aggregate $13.2 million available under our revolving credit facility to fund working capital needs. Standby letters of credit in the aggregate amount of $1.8 million, used to collateralize certain insurance arrangements and for imported product purchases, were outstanding under the revolving credit facility as of February 3, 2013. There were no additional borrowings outstanding under the revolving credit facility on February 3, 2013.
We are currently in negotiations with Bank of America, N.A. and other lenders to extend or replace our credit facility and expect to have a new agreement in place before the expiration of our current loan agreement on July 31, 2013.
Employee Savings Plans
We sponsor a tax-qualified 401(k) retirement plan covering substantially all employees. This plan assists employees in meeting their savings and retirement planning goals through employee salary deferrals and discretionary employer matching contributions. Company contributions to the plan amounted to $575,000 in fiscal 2013, $602,000 in fiscal 2012 and $571,000 in fiscal 2011.
Executive Benefits
We provide salary continuation and supplemental executive retirement benefits to certain management employees under a supplemental retirement income plan (“SRIP”). The SRIP provides monthly payments to participants or their designated beneficiaries based on a participant’s “final average monthly earnings” and “specified percentage” participation level as defined in the plan, subject to a vesting schedule that may vary for each participant. The benefit is payable for a 15-year period following the participant’s termination of employment due to retirement, disability or death. In addition, the monthly retirement benefit for each participant, regardless of age, becomes fully vested and the present value of that benefit is paid to each participant in a lump sum upon a change in control of the Company as defined in the plan. The SRIP is unfunded and all benefits are payable solely from the general assets of the Company. The plan liability is based on the aggregate actuarial present value of the vested benefits to which participating employees are currently entitled, but based on the employees’ expected dates of separation or retirement.
Summarized plan information as of each fiscal year-end (the measurement date) is as follows:
|
Fifty-Three Weeks Ended
|
Fifty-Two Weeks Ended
|
|||||||
|
February 3,
|
January 29,
|
|||||||
|
2013
|
2012
|
|||||||
|
Change in benefit obligation:
|
||||||||
|
Beginning projected benefit obligation
|
$ | 7,569 | $ | 6,537 | ||||
|
Service cost
|
255 | 525 | ||||||
|
Interest cost
|
297 | 337 | ||||||
|
Benefits paid
|
(485 | ) | (307 | ) | ||||
|
Actuarial (gain) loss
|
(201 | ) | 477 | |||||
|
Ending projected benefit obligation (funded status)
|
$ | 7,435 | $ | 7,569 | ||||
|
Accumulated benefit obligation
|
$ | 7,306 | $ | 7,238 | ||||
|
Amount recognized in the consolidated balance sheets:
|
||||||||
|
Current liabilities
|
$ | 379 | $ | 469 | ||||
|
Non-current liabilities
|
7,056 | 7,100 | ||||||
|
Total
|
$ | 7,435 | $ | 7,569 | ||||
|
Other changes recognized in accumulated other comprehensive income
|
||||||||
|
Net gain arising during period
|
(58 | ) | (326 | ) | ||||
|
Net periodic benefit cost
|
552 | 862 | ||||||
|
Total recognized in net periodic benefit cost and
accumulated other comprehensive income
|
$ | 494 | $ | 536 | ||||
|
Fifty-Three Weeks Ended
|
Fifty-Two Weeks Ended
|
|||||||||||
|
February 3,
|
January 29,
|
January 30,
|
||||||||||
|
2013
|
2012
|
2011
|
||||||||||
|
Net periodic benefit cost
|
||||||||||||
|
Service cost
|
$ | 255 | $ | 525 | $ | 583 | ||||||
|
Interest cost
|
297 | 337 | 340 | |||||||||
|
Net periodic benefit cost
|
$ | 552 | $ | 862 | $ | 923 | ||||||
|
Assumptions used to determine net periodic benefit cost:
|
||||||||||||
|
Discount rate (Moody's Composite Bond Rate)
|
4.0 | % | 5.25 | % | 5.5 | % | ||||||
|
Increase in future compensation levels
|
4.0 | % | 4.0 | % | 4.0 | % | ||||||
|
Estimated Future Benefit Payments:
|
||||||||||||
|
Fiscal 2014
|
$ | 379 | ||||||||||
|
Fiscal 2015
|
703 | |||||||||||
|
Fiscal 2016
|
703 | |||||||||||
|
Fiscal 2017
|
703 | |||||||||||
|
Fiscal 2018
|
631 | |||||||||||
|
Fiscal 2019 through Fiscal 2023
|
3,480 | |||||||||||
At February 3, 2013, $202,000, net of tax of $115,000, was in accumulated other comprehensive income. At January 29, 2012, $115,000, net of tax of $64,000, was in accumulated other comprehensive income.
We also provide a life insurance program for certain executives. The life insurance program provides death benefit protection for these executives during employment up to age 65. Coverage under the program declines when he attains age 60 and automatically terminates when he attains age 65 or terminates employment with us for any reason, other than death, whichever occurs first. The life insurance policies funding this program are owned by the Company with a specified portion of the death benefits payable under those policies endorsed to the insured executives’ designated beneficiaries.
Performance Grants
From time to time, the Compensation Committee of our board of directors may award performance grants to certain senior executives under the Company’s Stock Incentive Plan. Payments under these awards are based on our achieving specified performance targets during a designated performance period. In addition, each executive must remain continuously employed with the Company through the end of the performance period. Typically, performance grants can be paid in cash, shares of the Company’s common stock, or both, at the discretion of the Compensation Committee at the time payment is made.
Outstanding performance grants are classified as liabilities since the (i) settlement amount for each grant is not known until after the applicable performance period is completed and (ii) settlement of the grants may be made in common stock, cash or a combination of both. The estimated cost of each grant is recorded as compensation expense over its performance period when it becomes probable that the applicable performance targets will be achieved. The expected cost of the performance grants is revalued each reporting period. As assumptions change regarding the expected achievement of performance targets, a cumulative adjustment is recorded and future compensation expense will increase or decrease based on the currently projected performance levels. If we determine that it is not probable that the minimum performance thresholds for outstanding performance grants will be met, no further compensation cost will be recognized and any previously recognized compensation cost will be reversed.
During fiscal 2011, the Compensation Committee awarded two performance grants to certain senior executives for the two and three fiscal-year periods ending January 29, 2012 and February 3, 2013, respectively. At January 30, 2011, we concluded that it was unlikely that the minimum performance thresholds for the performance grants for the two fiscal-year period ending January 29, 2012 would be met and, consequently, we reversed accruals related to those performance grants. During fiscal 2012, we determined that it was unlikely that the minimum performance thresholds for the performance grants for the fiscal three-year period ending February 3, 2013 would be met and, consequently, we reversed accruals related to those performance grants. The performance grants awarded in fiscal 2011 expired without payment because the minimum performance thresholds were not achieved.
During fiscal 2013, the Compensation Committee awarded performance grants for the 2013 and 2014 fiscal years. These awards have three-year performance periods ending on January 25, 2015 and January 15, 2016, respectively. At February 3, 2013, $273,000 was accrued in the accrued salaries, wages and benefits section of our consolidated statements of financial position for the fiscal 2013 performance grants. The performance period for the fiscal 2014 performance awards did not begin until our fiscal 2014 commenced on February 4, 2013. Therefore, no amounts are accrued for these awards at February 3, 2013.
The Stock Incentive Plan permits incentive awards of restricted stock, restricted stock units, stock appreciation rights and performance grants to key employees. A maximum of 750,000 shares of the Company’s common stock is authorized for issuance under the Stock Incentive Plan. The Stock Incentive Plan also provides for annual restricted stock awards to non-employee directors. We have issued restricted stock awards to our non-employee directors since January 2006.
We account for restricted stock awards as “non-vested equity shares” until the awards vest or are forfeited. Restricted stock awards to non-employee directors vest if the director remains on the board through a 36-month service period and may vest earlier upon certain events specified in the plan. The fair value of each share of restricted stock is the market price of our stock on the grant date. The weighted average grant-date fair value of restricted stock awards issued during fiscal years 2013, 2012 and 2011 was $10.38, $9.83, and $11.60 per share, respectively.
The restricted stock awards outstanding as of February 3, 2013 had an aggregate grant-date fair value of $305,000, after taking vested and forfeited restricted shares into account. As of February 3, 2013, we have recognized non-cash compensation expense of approximately $161,000 related to these non-vested awards and $341,000 for awards that have vested. The remaining $143,000 of grant-date fair value for unvested restricted stock awards outstanding at February 3, 2013 will be recognized over the remaining vesting periods for these awards.
For each restricted common stock issuance, the following table summarizes restricted stock activity, including the weighted average issue price of those shares on the grant date, the fair value of each grant of restricted stock on the grant date, compensation expense recognized for the unvested shares of restricted stock for each grant and the remaining fair value of the unvested shares of restricted stock for each grant as of February 3, 2013:
|
Whole
|
Grant-Date
|
Aggregate
|
Compensation
|
Grant-Date Fair Value
|
||||||||||||||||
|
Number of
|
Fair Value
|
Grant-Date
|
Expense
|
Unrecognized At
|
||||||||||||||||
|
Shares
|
Per Share
|
Fair Value
|
Recognized
|
Febuary 3, 2013
|
||||||||||||||||
|
Awards outstanding balance at January 31, 2010
|
$ | 341 | ||||||||||||||||||
|
Restricted shares Issued on June 11, 2010
|
7,325 | $ | 11.60 | $ | 85 | 76 | $ | 9 | ||||||||||||
|
Restricted shares Issued on June 10, 2011
|
11,165 | $ | 9.83 | 110 | 61 | 49 | ||||||||||||||
|
Restricted shares Issued on June 5, 2012
|
10,573 | $ | 10.38 | 110 | 24 | 85 | ||||||||||||||
|
Awards outstanding at February 3, 2013:
|
29,063 | $ | 305 | $ | 161 | $ | 143 | |||||||||||||
We awarded time -based restricted stock units to certain senior executives during the 2012 and 2013 fiscal years. Each restricted stock unit, or “RSU”,
entitles the executive to receive one share of the Company’s common stock if he remains continuously employed with the Company through the end of a three-year service period. The RSUs may be paid in shares of the Company’s common stock, cash or both, at the discretion of the Compensation Committee. The RSUs are accounted for as “non-vested stock grants.” Similar to the restricted stock grants issued to our non-employee directors, RSU compensation expense is recognized ratably over the applicable service period. However, unlike restricted stock grants, no shares are issued, or other payment made, until the end of the applicable service period (commonly referred to as “cliff vesting”) and grantees are not entitled to receive dividends on their RSUs during that time. The fair value of each RSU is the market price of a share of our common stock on the grant date, reduced by the present value of the dividends expected to be paid on a share of our common stock during the applicable service period, discounted at the appropriate risk-free rate. The following table presents RSU activity for the years ended February 3, 2013 and January 29, 2012, adjusted for forfeitures:
|
Whole
|
Grant-Date
|
Aggregate
|
Compensation
|
Grant-Date Fair Value
|
||||||||||||||||
|
Number of
|
Fair Value
|
Grant-Date
|
Expense
|
Unrecognized At
|
||||||||||||||||
|
Units
|
Per Unit
|
Fair Value
|
Recognized
|
February 3, 2013
|
||||||||||||||||
|
RSUs Awarded on September 7, 2011
|
10,684 | $ | 8.21 | $ | 88 | $ | 42 | $ | 46 | |||||||||||
|
RSUs Awarded on February 9, 2012
|
11,846 | $ | 11.95 | 140 | 55 | 85 | ||||||||||||||
|
RSUs Awarded on January 15, 2013
|
9,823 | $ | 13.66 | 134 | - | 134 | ||||||||||||||
|
Awards outstanding at Febuary 3, 2013:
|
32,353 | $ | 362 | $ | 97 | $ | 265 | |||||||||||||
No compensation expense was recognized in fiscal 2013 for the RSUs awarded on January 15, 2013, because the performance period related to those awards did not begin until the start of the 2014 fiscal year on February 4, 2013.
We refer you to the Earnings Per Share disclosure in Note 1-Summary of Significant Accounting Policies, above, for more detailed information concerning the calculation of earnings per share.
We have issued restricted stock awards to non-employee members of the board of directors since 2006 and restricted stock units (RSUs) to certain senior executives since fiscal 2012, under the Company’s Stock Incentive Plan. We expect to continue to grant these types of awards annually in the future. The following table sets forth the number of outstanding restricted stock awards and restricted stock units, net of forfeitures and vested shares, as of the fiscal year-end dates indicated:
|
February 3,
|
January 29,
|
January 30,
|
||||||||||
|
2013
|
2012
|
2011
|
||||||||||
|
Restricted shares
|
29,063 | 21,321 | 20,630 | |||||||||
|
Restricted stock units
|
32,353 | 10,684 | - | |||||||||
| 61,416 | 32,005 | 20,630 | ||||||||||
All restricted shares awarded that have not yet vested are considered when computing diluted earnings per share. Unlike the restricted stock grants issued to our non-employee directors, the transfer of ownership of our RSUs occurs after the three-year vesting period; however, RSUs are also considered when computing diluted earnings per share.
The following table sets forth the computation of basic and diluted earnings per share:
|
Fifty-Three Weeks Ended
|
Fifty-Two Weeks Ended
|
|||||||||||
|
February 3,
|
January 29,
|
January 30,
|
||||||||||
|
2013
|
2012
|
2011
|
||||||||||
|
Net income
|
$ | 8,626 | $ | 5,057 | $ | 3,240 | ||||||
|
Less: Dividends on unvested restricted shares
|
11 | 11 | 9 | |||||||||
|
Net earnings allocated to unvested restricted stock
|
23 | 13 | - | |||||||||
|
Earnings available for common shareholders
|
$ | 8,592 | $ | 5,033 | $ | 3,231 | ||||||
|
Weighted average shares outstanding for basic
earnings per share
|
10,745 | 10,762 | 10,757 | |||||||||
|
Dilutive effect of unvested restricted stock awards
|
30 | 28 | 13 | |||||||||
|
Weighted average shares outstanding for diluted
earnings per share
|
10,775 | 10,790 | 10,770 | |||||||||
|
Basic earnings per share
|
$ | 0.80 | $ | 0.47 | $ | 0.30 | ||||||
|
Diluted earnings per share
|
$ | 0.80 | $ | 0.47 | $ | 0.30 | ||||||
Our provision for income taxes was as follows for the periods indicated:
|
Fifty-Three Weeks Ended
|
Fifty-Two Weeks Ended
|
|||||||||||
|
February 3,
|
January 29,
|
January 30,
|
||||||||||
|
2013
|
2012
|
2011
|
||||||||||
|
Current expense
|
||||||||||||
|
Federal
|
$ | 3,894 | $ | 1,687 | $ | 2,450 | ||||||
|
Foreign
|
50 | 54 | 50 | |||||||||
|
State
|
403 | 182 | 301 | |||||||||
|
Total current expense
|
4,347 | 1,923 | 2,801 | |||||||||
|
Deferred taxes
|
||||||||||||
|
Federal
|
(35 | ) | (87 | ) | (1,735 | ) | ||||||
|
State
|
55 | 52 | (137 | ) | ||||||||
|
Total deferred taxes
|
20 | (35 | ) | (1,872 | ) | |||||||
|
Income tax expense
|
$ | 4,367 | $ | 1,888 | $ | 929 | ||||||
Total tax expense for the fiscal year ended February 3, 2013 was $4.4 million, of which
$4.3 million was allocated to continuing operations and $51,000 was allocated to Other Comprehensive Income.
Total tax expense for fiscal 2012 was $1.6 million, of which $1.9 million was allocated to continuing operations and $303,000 benefit was allocated to Other Comprehensive Income. Total tax expense for fiscal 2011 was $1.0 million, of which $929,000 was allocated to continuing operations and $100,000 was allocated to Other Comprehensive Income.
The effective income tax rate differed from the federal statutory tax rate as follows for the periods indicated:
|
Fifty-Three Weeks Ended
|
Fifty-Two Weeks Ended
|
|||||||||||
|
February 3,
|
January 29,
|
January 30,
|
||||||||||
|
2013
|
2012
|
2011
|
||||||||||
|
Income taxes at statutory rate
|
34.0 | % | 34.0 | % | 35.0 | % | ||||||
|
Increase (decrease) in tax rate resulting from:
|
||||||||||||
|
State taxes, net of federal benefit
|
2.1 | 2.3 | 2.2 | |||||||||
|
Change in deferred tax rates
|
1.6 | |||||||||||
|
Non-cash charitable contribution of appreciated inventory
|
(0.3 | ) | (0.9 | ) | (3.2 | ) | ||||||
|
Officer's life insurance
|
(3.1 | ) | (5.9 | ) | (6.8 | ) | ||||||
|
Captive insurance disbursement
|
(0.9 | ) | (1.9 | ) | (2.4 | ) | ||||||
|
Subpart F Income
|
0.0 | 0.2 | 2.2 | |||||||||
|
Penalty
|
0.1 | 0.0 | (4.2 | ) | ||||||||
|
Other
|
0.1 | (0.6 | ) | (0.5 | ) | |||||||
|
Effective income tax rate
|
33.6 | % | 27.2 | % | 22.3 | % | ||||||
The tax effects of temporary differences that give rise to significant portions of the deferred tax assets and liabilities for the period indicated were:
|
February 3,
|
January 29,
|
|||||||
|
2013
|
2012
|
|||||||
|
Assets
|
||||||||
|
Deferred compensation
|
$ | 3,319 | $ | 3,144 | ||||
|
Allowance for bad debts
|
455 | 729 | ||||||
|
State income taxes
|
153 | 173 | ||||||
|
Property, plant and equipment
|
220 | 404 | ||||||
|
Intangible assets
|
989 | 1,270 | ||||||
|
Charitable contribution carryforward
|
745 | 954 | ||||||
|
Inventories
|
447 | - | ||||||
|
Other
|
245 | 197 | ||||||
| Total deferred tax assets | 6,573 | 6,871 | ||||||
| Valuation allowance | (139 | ) | (139 | ) | ||||
| 6,434 | 6,732 | |||||||
| Liabilities | ||||||||
|
Inventories
|
- | 263 | ||||||
|
Employee benefits
|
328 | 343 | ||||||
| Total deferred tax liabilities | 328 | 606 | ||||||
| Net deferred tax asset without AOCI | 6,106 | 6,126 | ||||||
| Deferred tax liability in AOCI | (115 | ) | (64 | ) | ||||
|
Total net deferred tax asset
|
$ | 5,991 | $ | 6,062 | ||||
At February 3, 2013 and January 29, 2012, our net deferred tax asset was $6.0 million and $6.1 million, respectively.
Except for certain state net operating losses being carried forward (against which a valuation allowance was established in fiscal 2010), we expect to fully utilize the remaining deferred tax assets in future periods when the amounts become deductible.
We acquired state income tax credits in our fiscal year ending January 2007. When we determined that we would be unable to use a portion of the credits, we sold that portion and have been using the rest to offset state taxable income to the maximum allowable extent in each succeeding year (generally $100,000 or $50,000 per year as adjusted annually by the state). We used the final amount of remaining credits to offset state taxable income in fiscal 2013; therefore, the deferred tax asset relating to these credits is no longer reflected on our balance sheet.
Current accounting standards prescribe a recognition threshold and measurement attribute for the financial statement recognition and measurement of a tax position taken or expected to be taken in a tax return. The guidance also addresses de-recognition, classification, interest and penalties, accounting in interim periods and disclosures.
We had no material unrecognized tax benefits at February 3, 2013 or January 29, 2012, and there were no material increases or decreases in unrecognized tax benefits during the 2013, 2012 or 2011 fiscal years.
We have elected to classify interest and penalties recognized with respect to unrecognized tax benefits as income tax expense. During fiscal 2010 the Internal Revenue Service assessed a late payment penalty of $100,000, which we recognized as current tax expense. During fiscal 2011 we successfully requested to have the penalty abated. The abatement of the penalty is reflected as a $100,000 reduction in fiscal 2011 federal income tax expense. No interest or penalties were accrued as of February 3, 2013 or January 29, 2012.
Tax years beginning January 31, 2010, through February 3, 2013 remain subject to examination by federal and state taxing authorities.
During fiscal 2011, we recorded $1.4 million pretax ($874,000 after tax, or $0.08 per share) in restructuring and asset impairment charges related to the consolidation of Bradington-Young’s Cherryville, NC manufacturing facility to Hickory, NC.
Pretax restructuring charges and credits decreased operating income by 0.9% of net sales in fiscal 2011.
Restructuring and charges are included in the “restructuring charges” line of our consolidated statements of income.
The following table sets forth the significant components of and activity related to the accrued restructuring charges for fiscal years 2011, 2012 and 2013:
|
Severance and
|
Asset
|
Pretax
|
After-tax
|
|||||||||||||||||
|
Related Benefits
|
Impairment
|
Other
|
Amount
|
Amount
|
||||||||||||||||
|
Accrued balance at January 31, 2010
|
- | - | 38 | 38 | ||||||||||||||||
|
Restructuring charges accrued during fiscal 2011
|
275 | 1,128 | 1,403 | (874 | ) | |||||||||||||||
|
Non-cash charges
|
(1,128 | ) | (1,128 | ) | ||||||||||||||||
|
Cash payments
|
(112 | ) | (7 | ) | (119 | ) | ||||||||||||||
|
Accrued balance at January 30, 2011
|
$ | 163 | $ | - | $ | 31 | $ | 194 | ||||||||||||
|
Restructuring charges accrued during fiscal 2012
|
- | - | - | |||||||||||||||||
|
Non-cash charges
|
- | - | - | |||||||||||||||||
|
Cash payments
|
(163 | ) | (16 | ) | (179 | ) | ||||||||||||||
|
Accrued balance at January 29, 2012
|
$ | - | $ | - | $ | 15 | $ | 15 | ||||||||||||
|
Restructuring charges accrued during fiscal 2013
|
- | - | - | |||||||||||||||||
|
Non-cash charges
|
- | - | - | |||||||||||||||||
|
Cash payments
|
(5 | ) | (5 | ) | ||||||||||||||||
|
Accrued balance at February 3, 2013
|
$ | - | $ | - | $ | 10 | $ | 10 | ||||||||||||
The $10,000 balance in accrued restructuring charges at February 3, 2013 relates to continuing environmental monitoring at two former casegoods factories.
We are organized in two reportable segments – casegoods and upholstered furniture. The upholstery segment consists of Bradington-Young LLC and Sam Moore Furniture.
We typically assess segment performance using the following metrics:
|
§
|
Net sales volume,
|
|
§
|
Gross profit and gross profit margin as a percentage of net sales,
|
|
§
|
Operating income and operating income margin as a percentage of net sales, and
|
|
§
|
Incoming order rates.
|
The following table presents segment information for each of the following three fiscal years:
|
Fifty-Three Weeks Ended
|
Fifty-Two Weeks Ended
|
|||||||||||
|
February 3, 2013
|
January 29, 2012
|
January 30, 2011
|
||||||||||
|
Net Sales
|
||||||||||||
|
Casegoods
|
$ | 141,064 | $ | 147,927 | $ | 143,157 | ||||||
|
Upholstery
|
77,295 | 74,578 | 72,272 | |||||||||
|
Consolidated
|
$ | 218,359 | $ | 222,505 | $ | 215,429 | ||||||
|
Gross Profit & Margin
|
||||||||||||
|
Casegoods
|
$ | 38,054 | $ | 37,550 | $ | 37,642 | ||||||
|
Upholstery
|
14,492 | 11,313 | 9,240 | |||||||||
|
Consolidated
|
$ | 52,546 | $ | 48,863 | $ | 46,882 | ||||||
|
Operating Income
|
||||||||||||
|
Casegoods
|
$ | 11,953 | $ | 10,644 | $ | 9,348 | ||||||
|
Upholstery
|
987 | (3,971 | ) | (5,287 | ) | |||||||
|
Consolidated
|
$ | 12,940 | $ | 6,673 | $ | 4,061 | ||||||
|
Capital Expenditures
|
||||||||||||
|
Casegoods
|
$ | 3,156 | $ | 2,979 | $ | 1,185 | ||||||
|
Upholstery
|
905 | 826 | 825 | |||||||||
|
Consolidated
|
$ | 4,061 | $ | 3,805 | $ | 2,010 | ||||||
|
Depreciation & Amortization
|
||||||||||||
|
Casegoods
|
$ | (1,671 | ) | $ | (1,717 | ) | $ | (1,918 | ) | |||
|
Upholstery
|
(895 | ) | (849 | ) | (930 | ) | ||||||
|
Consolidated
|
$ | (2,566 | ) | $ | (2,566 | ) | $ | (2,848 | ) | |||
|
As of February 3, 2013
|
As of January 29, 2012
|
|||||||||||
|
Total Assets
|
||||||||||||
|
Casegoods
|
$ | 124,509 | $ | 119,645 | ||||||||
|
Upholstery
|
31,314 | 29,526 | ||||||||||
|
Consolidated
|
$ | 155,823 | $ | 149,171 | ||||||||
No significant long-lived assets were held outside the United States at either February 3, 2013 or January 29, 2012. International customers accounted for 4.4% of consolidated net sales in fiscal 2013, 5.0% of consolidated net sales in fiscal 2012 and 4.1% of consolidated net sales in fiscal 2011.
We lease warehousing facilities, showroom space, and office and computer equipment under leases expiring over the next five years. Rent expense was $2.0 million in fiscal 2013, $2.2 million in fiscal 2012 and $2.0 million in fiscal 2011. Future minimum annual
commitments under leases and operating agreements are $2.4 million in fiscal 2014, $1.1 million in fiscal 2015, $627,000 in fiscal 2016, $301,000 in fiscal 2017 and $0 in fiscal 2018.
We had letters of credit outstanding totaling $1.8 million on February 3, 2013. We utilize letters of credit to collateralize certain imported inventory purchases and certain insurance arrangements.
In the ordinary course of our business, we may become involved in legal proceedings involving contractual and employment relationships, product liability claims, intellectual property rights and a variety of other matters. We do not believe that any pending legal proceedings will have a material impact on our financial position or results of operations.
We source imported products through over 28 different vendors, from 28 separate factories, located in four Asian countries. Because of the large number and diverse nature of the foreign factories from which we can source our imported products, we have some flexibility in the placement of products in any particular factory or country.
Factories located in China are an important resource for Hooker Furniture. In fiscal year 2013, imported products sourced from China accounted for approximately 80% of import purchases, and the factory in China from which we directly source the most product accounted for approximately 50% of our worldwide purchases of imported product. A disruption in our supply chain from this factory, or from China in general, could significantly impact our ability to fill customer orders for products manufactured at that factory or in that country.
|
Fiscal Quarter
|
|||||||||||||||||
|
First
|
Second
|
Third
|
Fourth
|
||||||||||||||
|
2013
|
|||||||||||||||||
|
Net sales
|
$ | 51,730 | $ | 50,185 | $ | 56,803 | $ | 59,641 | |||||||||
|
Cost of sales
|
40,808 | 38,920 | 43,243 | 42,842 | |||||||||||||
|
Gross profit
|
10,922 | 11,265 | 13,560 | 16,799 | |||||||||||||
|
Selling and administrative expenses
|
9,394 | 8,943 | 9,781 | 11,488 | |||||||||||||
|
Intangible asset impairment charges
|
- | - | - | - | |||||||||||||
|
Net income
|
1,020 | 1,474 | 2,434 | 3,698 | |||||||||||||
|
Basic and diluted earnings (loss) per share
|
$ | 0.09 | $ | 0.14 | $ | 0.23 | $ | 0.34 | |||||||||
|
2012
|
|||||||||||||||||
|
Net sales
|
$ | 58,393 | $ | 55,574 | $ | 54,180 | $ | 54,358 | |||||||||
|
Cost of sales
|
47,360 | 43,411 | 41,443 | 41,428 | |||||||||||||
|
Gross profit
|
11,033 | 12,163 | 12,737 | 12,930 | |||||||||||||
|
Selling and administrative expenses
|
10,286 | 9,669 | 10,031 | 10,389 | |||||||||||||
|
Intangible asset impairment charges
|
- | - | - | 1,815 |
(a)
|
||||||||||||
|
Net income
|
523 | 1,646 | 2,260 | 628 | |||||||||||||
|
Basic and diluted earnings (loss) per share
|
$ | 0.05 | $ | 0.15 | $ | 0.21 | $ | 0.06 |
|
(a) During the fiscal 2012 fourth quarter, we recorded asset impairment charges of $1.8 million pretax ($1.1 million after tax or $0.10 per share), on our Bradington-Young trade name.
|
Earnings per share for each fiscal quarter is derived using the weighted average number of shares outstanding during that quarter. Earnings per share for each fiscal year is derived using the weighted average number of shares outstanding on an annual basis. Consequently, the sum of earnings per share for the quarters of a fiscal year may not equal earnings per share for the full fiscal year.
At its March 19, 2013 meeting, our board of directors declared a quarterly cash dividend of $0.10 per share, payable on April 12, 2013 to shareholders of record at March 29, 2013.
TABLE OF CONTENTS
Part IItem 1. BusinessItem 1A. Risk FactorsItem 1B. Unresolved Staff CommentsItem 2. PropertiesItem 3. Legal ProceedingsItem 4. Mine Safety DisclosuresPart IIItem 5. Market For Registrant S Common Equity, Related Shareholder Matters and Issuer Purchases Of Equity SecuritiesItem 6. Selected Financial DataItem 7. Management S Discussion and Analysis Of Financial Condition and Results Of OperationsItem 7A. Quantitative and Qualitative Disclosures About Market RiskItem 8. Financial Statements and Supplementary DataItem 9. Changes in and Disagreements with Accountants on Accounting and Financial DisclosureItem 9A. Controls and ProceduresItem 9B. Other InformationPart IIIItem 10. Directors, Executive Officers and Corporate GovernanceItem 11. Executive CompensationItem 12. Security Ownership Of Certain Beneficial Owners and Management and Related Shareholder MattersItem 13. Certain Relationships and Related Transactions, and Director IndependenceItem 14. Principal Accounting Fees and ServicesPart IVItem 15. Exhibits and Financial Statement SchedulesNote 1 Summary Of Significant Accounting PoliciesNote 2 Fiscal YearNote 3 Allowance For Doubtful AccountsNote 4 Accounts ReceivableNote 5 InventoriesNote 6 Property, Plant and EquipmentNote 7 Intangible AssetsNote 8 Long-term DebtNote 9 Employee Benefit PlansNote 10 Share-based CompensationNote 11 Earnings Per ShareNote 12 Income TaxesNote 13 Restructuring and Asset Impairment ChargesNote 14 Segment InformationNote 15 Commitments, Contingencies and Off Balance Sheet ArrangementsNote 16 Concentrations Of Sourcing RiskNote 17 Consolidated Quarterly Data (unaudited)Note 18 Subsequent Events