HONEYWELL INTERNATIONAL INC
10-Qs and 10-Ks
PROXIES
UNITED STATES
SECURITIES AND EXCHANGE COMMISSION
Washington, D.C. 20549
Form
10-Q
__________________
OF THE SECURITIES EXCHANGE ACT OF 1934
For the quarterly period ended
September 30, 2023
OR
OF THE SECURITIES EXCHANGE ACT OF 1934
For the transition period from ______ to _____
Commission file number
1-8974

(Exact name of registrant as specified in its charter)
|
|
|
||||||||||
|
(State or other jurisdiction of
incorporation or organization) |
(I.R.S. Employer
Identification No.) |
||||||||||
|
|
|
||||||||||
|
|
|
||||||||||
| (Address of principal executive offices) | (Zip Code) | ||||||||||
|
|
|
||||||||||
| (Registrant’s telephone number, including area code) | |||||||||||
Securities registered pursuant to Section 12(b) of the Act:
| Title of each class | Trading Symbol(s) | Name of each exchange on which registered | ||||||||||||
|
|
|
|
||||||||||||
|
|
|
|
||||||||||||
|
|
|
|
||||||||||||
|
|
|
|
||||||||||||
|
|
|
|
||||||||||||
|
|
|
|
||||||||||||
|
|
|
|
||||||||||||
Indicate by check mark whether the Registrant (1) has filed all reports required to be filed by Section 13 or 15(d) of the Securities Exchange Act of 1934 during the preceding 12 months (or for such shorter period that the Registrant was required to file such reports), and (2) has been subject to such filing requirements for the past 90 days.
Yes
x
No
☐
Indicate by check mark whether the Registrant has submitted electronically every Interactive Data File required to be submitted pursuant to Rule 405 of Regulation S-T (§232.405 of this chapter) during the preceding 12 months (or for such shorter period that the Registrant was required to submit such files).
Yes
x
No
☐
Indicate by check mark whether the Registrant is a large accelerated filer, an accelerated filer, a non-accelerated filer, a smaller reporting company, or an emerging growth company. See definitions of “large accelerated filer,” “accelerated filer,” “smaller reporting company,” and “emerging growth company” in Rule 12b-2 of the Exchange Act.
|
|
x
|
Accelerated filer |
☐
|
||||||||
| Non-accelerated filer |
☐
|
Smaller reporting company |
|
||||||||
| Emerging growth company |
|
||||||||||
If an emerging growth company, indicate by check mark if the Registrant has elected not to use the extended transition period for complying with any new or revised financial accounting standards provided pursuant to Section 13(a) of the Exchange Act.
☐
Indicate by check mark whether the Registrant is a shell company (as defined in Rule 12b-2 of the Exchange Act). Yes
☐
No
x
There were
659,250,644
shares of Common Stock outstanding at September 30, 2023.
TABLE OF CONTENTS
| PART I | ||||||||
| ITEM 1 | ||||||||
|
Consolidated Statement of Operations (unaudited) –
Three and Nine
Months Ended
September 30, 2023,
and
2022
|
||||||||
|
Consolidated Statement of Comprehensive Income (unaudited) –
Three and Nine
Months Ended
September 30, 2023,
and
2022
|
||||||||
|
Consolidated Balance Sheet (unaudited) –
September 30, 2023,
and
December 31, 2022
|
||||||||
|
Consolidated Statement of Cash Flows (unaudited) –
Nine Months Ended September 30, 2023,
and
2022
|
||||||||
|
Consolidated Statement of Shareowners' Equity (unaudited) –
Three and Nine
Months Ended
September 30, 2023,
and
2022
|
||||||||
| ITEM 2 | ||||||||
| ITEM 3 | ||||||||
| ITEM 4 | ||||||||
| PART II | ||||||||
| ITEM 1 | ||||||||
| ITEM 1A | ||||||||
| ITEM 2 | ||||||||
| ITEM 4 | ||||||||
| ITEM 5 | ||||||||
| ITEM 6 | ||||||||
CAUTIONARY STATEMENT ABOUT FORWARD-LOOKING STATEMENTS
We describe many of the trends and other factors that drive our business and future results in the section titled Management’s Discussion and Analysis of Financial Condition and Results of Operations and in other parts of this report (including Part II, Item 1A Risk Factors). Such discussions contain forward-looking statements within the meaning of Section 21E of the Securities Exchange Act of 1934, as amended (the Exchange Act). Forward-looking statements are those that address activities, events, or developments that management intends, expects, projects, believes, or anticipates will or may occur in the future. They are based on management’s assumptions and assessments in light of past experience and trends, current economic and industry conditions, expected future developments, and other relevant factors, many of which are difficult to predict and outside of our control. They are not guarantees of future performance, and actual results, developments, and business decisions may differ significantly from those envisaged by our forward-looking statements. We do not undertake to update or revise any of our forward-looking statements, except as required by applicable securities law. Our forward-looking statements are also subject to material risks and uncertainties, including ongoing macroeconomic and geopolitical risks, such as lower GDP growth or recession, capital markets volatility, inflation, and certain regional conflicts, that can affect our performance in both the near- and long-term. In addition, no assurance can be given that any plan, initiative, projection, goal, commitment, expectation, or prospect set forth in this Form 10-Q can or will be achieved. These forward-looking statements should be considered in light of the information included in this report and our other filings with the Securities and Exchange Commission (SEC), including, without limitation, the Risk Factors, as well as the description of trends and other factors in Management’s Discussion and Analysis of Financial Condition and Results of Operations, set forth in this report and our 2022 Annual Report on Form 10-K. Any forward-looking plans described herein are not final and may be modified or abandoned at any time.
1
Honeywell International Inc.
ABOUT HONEYWELL
Honeywell International Inc. (Honeywell, we, us, our, or the Company) is an integrated operating company serving a broad range of industries and geographies around the world. Our portfolio of solutions is uniquely positioned to blend physical products with software to serve customers worldwide with aerospace products and services, energy efficient products and solutions for businesses, specialty chemicals, electronic and advanced materials, process technology for refining and petrochemicals, and productivity, sensing, safety, and security technologies for buildings and industries. Our products and solutions enable a safer, more comfortable, and more productive world, enhancing the quality of life of people around the globe. The Honeywell brand dates back to 1906, and the Company was incorporated in Delaware in 1985.
Our Annual Report on Form 10-K, Quarterly Reports on Form 10-Q, Current Reports on Form 8-K, and any amendments to those reports, are available free of charge on our Investor Relations website (investor.honeywell.com) under the heading Financials (see SEC Filings) immediately after they are filed with, or furnished to, the SEC. Honeywell uses our Investor Relations website as a means of disclosing information which may be of interest or material to our investors and for complying with disclosure obligations under Regulation FD. Accordingly, investors should monitor our Investor Relations website, in addition to following our press releases, SEC filings, public conference calls, webcasts, and social media. Information contained on or accessible through, including any reports available on, our website is not a part of, and is not incorporated by reference into, this Quarterly Report on Form 10-Q or any other report or document we file with the SEC. Any reference to our website in this Form 10-Q is intended to be an inactive textual reference only.
2
Honeywell International Inc.
PART I. FINANCIAL INFORMATION
The financial statements and related notes as of September 30, 2023, should be read in conjunction with the financial statements for the year ended December 31, 2022, contained in the Company's 2022 Annual Report on Form 10-K.
FINANCIAL STATEMENTS AND SUPPLEMENTARY DATA
HONEYWELL INTERNATIONAL INC.
CONSOLIDATED STATEMENT OF OPERATIONS
(Unaudited)
| Three Months Ended September 30, | Nine Months Ended September 30, | ||||||||||||||||||||||
| 2023 | 2022 | 2023 | 2022 | ||||||||||||||||||||
| (Dollars in millions, except per share amounts) | |||||||||||||||||||||||
| Product sales | $ |
|
$ |
|
$ |
|
$ |
|
|||||||||||||||
| Service sales |
|
|
|
|
|||||||||||||||||||
| Net sales |
|
|
|
|
|||||||||||||||||||
| Costs, expenses and other | |||||||||||||||||||||||
| Cost of products sold |
|
|
|
|
|||||||||||||||||||
| Cost of services sold |
|
|
|
|
|||||||||||||||||||
| Total Cost of products and services sold |
|
|
|
|
|||||||||||||||||||
| Research and development expenses |
|
|
|
|
|||||||||||||||||||
| Selling, general and administrative expenses |
|
|
|
|
|||||||||||||||||||
| Other (income) expense |
(
|
(
|
(
|
(
|
|||||||||||||||||||
| Interest and other financial charges |
|
|
|
|
|||||||||||||||||||
| Total costs, expenses and other |
|
|
|
|
|||||||||||||||||||
| Income before taxes |
|
|
|
|
|||||||||||||||||||
| Tax expense |
|
|
|
|
|||||||||||||||||||
| Net income |
|
|
|
|
|||||||||||||||||||
| Less: Net income (loss) attributable to noncontrolling interest |
|
(
|
|
(
|
|||||||||||||||||||
| Net income attributable to Honeywell | $ |
|
$ |
|
$ |
|
$ |
|
|||||||||||||||
| Earnings per share of common stock—basic | $ |
|
$ |
|
$ |
|
$ |
|
|||||||||||||||
| Earnings per share of common stock—assuming dilution | $ |
|
$ |
|
$ |
|
$ |
|
|||||||||||||||
The Notes to Consolidated Financial Statements are an integral part of this statement.
3
Honeywell International Inc.
HONEYWELL INTERNATIONAL INC.
CONSOLIDATED STATEMENT OF COMPREHENSIVE INCOME
(Unaudited)
| Three Months Ended September 30, | Nine Months Ended September 30, | ||||||||||||||||||||||
| 2023 | 2022 | 2023 | 2022 | ||||||||||||||||||||
| (Dollars in millions) | |||||||||||||||||||||||
| Net income | $ |
|
$ |
|
$ |
|
$ |
|
|||||||||||||||
| Other comprehensive income (loss), net of tax | |||||||||||||||||||||||
| Foreign exchange translation adjustment |
|
(
|
(
|
(
|
|||||||||||||||||||
| Pension and other postretirement benefit adjustments |
(
|
(
|
(
|
(
|
|||||||||||||||||||
| Changes in fair value of available for sale investments |
|
|
|
(
|
|||||||||||||||||||
| Cash flow hedges recognized in other comprehensive income (loss) |
|
|
|
|
|||||||||||||||||||
| Less: Reclassification adjustment for gains included in net income |
|
|
|
|
|||||||||||||||||||
| Changes in fair value of cash flow hedges |
|
|
|
|
|||||||||||||||||||
| Other comprehensive income (loss), net of tax |
|
(
|
(
|
(
|
|||||||||||||||||||
| Comprehensive income |
|
|
|
|
|||||||||||||||||||
| Less: Comprehensive income (loss) attributable to the noncontrolling interest |
(
|
(
|
|
(
|
|||||||||||||||||||
| Comprehensive income attributable to Honeywell | $ |
|
$ |
|
$ |
|
$ |
|
|||||||||||||||
The Notes to Consolidated Financial Statements are an integral part of this statement.
4
Honeywell International Inc.
HONEYWELL INTERNATIONAL INC.
CONSOLIDATED BALANCE SHEET
(Unaudited)
| September 30, 2023 | December 31, 2022 | ||||||||||
| (Dollars in millions) | |||||||||||
| ASSETS | |||||||||||
| Current assets | |||||||||||
| Cash and cash equivalents | $ |
|
$ |
|
|||||||
| Short-term investments |
|
|
|||||||||
|
Accounts receivable, less allowances of $
|
|
|
|||||||||
| Inventories |
|
|
|||||||||
| Other current assets |
|
|
|||||||||
| Total current assets |
|
|
|||||||||
| Investments and long-term receivables |
|
|
|||||||||
| Property, plant and equipment—net |
|
|
|||||||||
| Goodwill |
|
|
|||||||||
| Other intangible assets—net |
|
|
|||||||||
| Insurance recoveries for asbestos-related liabilities |
|
|
|||||||||
| Deferred income taxes |
|
|
|||||||||
| Other assets |
|
|
|||||||||
| Total assets | $ |
|
$ |
|
|||||||
| LIABILITIES | |||||||||||
| Current liabilities | |||||||||||
| Accounts payable | $ |
|
$ |
|
|||||||
| Commercial paper and other short-term borrowings |
|
|
|||||||||
| Current maturities of long-term debt |
|
|
|||||||||
| Accrued liabilities |
|
|
|||||||||
| Total current liabilities |
|
|
|||||||||
| Long-term debt |
|
|
|||||||||
| Deferred income taxes |
|
|
|||||||||
| Postretirement benefit obligations other than pensions |
|
|
|||||||||
| Asbestos-related liabilities |
|
|
|||||||||
| Other liabilities |
|
|
|||||||||
| Redeemable noncontrolling interest |
|
|
|||||||||
| SHAREOWNERS’ EQUITY | |||||||||||
| Capital—common stock issued |
|
|
|||||||||
| —additional paid-in capital |
|
|
|||||||||
| Common stock held in treasury, at cost |
(
|
(
|
|||||||||
| Accumulated other comprehensive loss |
(
|
(
|
|||||||||
| Retained earnings |
|
|
|||||||||
| Total Honeywell shareowners’ equity |
|
|
|||||||||
| Noncontrolling interest |
|
|
|||||||||
| Total shareowners’ equity |
|
|
|||||||||
| Total liabilities, redeemable noncontrolling interest and shareowners’ equity | $ |
|
$ |
|
|||||||
The Notes to Consolidated Financial Statements are an integral part of this statement.
5
Honeywell International Inc.
HONEYWELL INTERNATIONAL INC.
CONSOLIDATED STATEMENT OF CASH FLOWS
(Unaudited)
| Nine Months Ended September 30, | |||||||||||
| 2023 | 2022 | ||||||||||
| (Dollars in millions) | |||||||||||
| Cash flows from operating activities | |||||||||||
| Net income | $ |
|
$ |
|
|||||||
| Less: Net income (loss) attributable to noncontrolling interest |
|
(
|
|||||||||
| Net income attributable to Honeywell |
|
|
|||||||||
| Adjustments to reconcile net income attributable to Honeywell to net cash provided by (used for) operating activities | |||||||||||
| Depreciation |
|
|
|||||||||
| Amortization |
|
|
|||||||||
| Gain on sale of non-strategic businesses and assets |
|
(
|
|||||||||
| Repositioning and other charges |
|
|
|||||||||
| Net payments for repositioning and other charges |
(
|
(
|
|||||||||
| NARCO Buyout payment |
(
|
|
|||||||||
| Pension and other postretirement income |
(
|
(
|
|||||||||
| Pension and other postretirement benefit payments |
(
|
(
|
|||||||||
| Stock compensation expense |
|
|
|||||||||
| Deferred income taxes |
|
|
|||||||||
| Other |
(
|
|
|||||||||
| Changes in assets and liabilities, net of the effects of acquisitions and divestitures | |||||||||||
| Accounts receivable |
(
|
(
|
|||||||||
| Inventories |
(
|
(
|
|||||||||
| Other current assets |
|
|
|||||||||
| Accounts payable |
|
(
|
|||||||||
| Accrued liabilities |
(
|
(
|
|||||||||
| Net cash provided by operating activities |
|
|
|||||||||
| Cash flows from investing activities | |||||||||||
| Capital expenditures |
(
|
(
|
|||||||||
| Proceeds from disposals of property, plant and equipment |
|
|
|||||||||
| Increase in investments |
(
|
(
|
|||||||||
| Decrease in investments |
|
|
|||||||||
| Receipts from Garrett Motion Inc. |
|
|
|||||||||
| Receipts (payments) from settlements of derivative contracts |
|
|
|||||||||
| Cash paid for acquisitions, net of cash acquired |
(
|
(
|
|||||||||
| Net cash provided by (used for) investing activities |
(
|
|
|||||||||
| Cash flows from financing activities | |||||||||||
| Proceeds from issuance of commercial paper and other short-term borrowings |
|
|
|||||||||
| Payments of commercial paper and other short-term borrowings |
(
|
(
|
|||||||||
| Proceeds from issuance of common stock |
|
|
|||||||||
| Proceeds from issuance of long-term debt |
|
|
|||||||||
| Payments of long-term debt |
(
|
(
|
|||||||||
| Repurchases of common stock |
(
|
(
|
|||||||||
| Cash dividends paid |
(
|
(
|
|||||||||
| Other |
(
|
(
|
|||||||||
| Net cash used for financing activities |
(
|
(
|
|||||||||
| Effect of foreign exchange rate changes on cash and cash equivalents |
(
|
(
|
|||||||||
| Net decrease in cash and cash equivalents |
(
|
(
|
|||||||||
| Cash and cash equivalents at beginning of period |
|
|
|||||||||
| Cash and cash equivalents at end of period | $ |
|
$ |
|
|||||||
The Notes to Consolidated Financial Statements are an integral part of this statement.
6
Honeywell International Inc.
HONEYWELL INTERNATIONAL INC.
CONSOLIDATED STATEMENT OF SHAREOWNERS' EQUITY
(Unaudited)
| Three Months Ended September 30, | Nine Months Ended September 30, | ||||||||||||||||||||||||||||||||||||||||||||||
| 2023 | 2022 | 2023 | 2022 | ||||||||||||||||||||||||||||||||||||||||||||
| Shares | $ | Shares | $ | Shares | $ | Shares | $ | ||||||||||||||||||||||||||||||||||||||||
| (In millions, except per share amounts) | |||||||||||||||||||||||||||||||||||||||||||||||
| Common stock, par value |
|
|
|
|
|
|
|
|
|||||||||||||||||||||||||||||||||||||||
| Additional paid-in capital | |||||||||||||||||||||||||||||||||||||||||||||||
| Beginning balance |
|
|
|
|
|||||||||||||||||||||||||||||||||||||||||||
| Issued for employee savings and option plans |
|
|
|
|
|||||||||||||||||||||||||||||||||||||||||||
| Stock-based compensation expense |
|
|
|
|
|||||||||||||||||||||||||||||||||||||||||||
| Ending balance |
|
|
|
|
|||||||||||||||||||||||||||||||||||||||||||
| Treasury stock | |||||||||||||||||||||||||||||||||||||||||||||||
| Beginning balance |
(
|
(
|
(
|
(
|
(
|
(
|
(
|
(
|
|||||||||||||||||||||||||||||||||||||||
| Reacquired stock or repurchases of common stock |
(
|
(
|
(
|
(
|
(
|
(
|
(
|
(
|
|||||||||||||||||||||||||||||||||||||||
| Issued for employee savings and option plans |
|
|
|
|
|
|
|
|
|||||||||||||||||||||||||||||||||||||||
| Ending balance |
(
|
(
|
(
|
(
|
(
|
(
|
(
|
(
|
|||||||||||||||||||||||||||||||||||||||
| Retained earnings | |||||||||||||||||||||||||||||||||||||||||||||||
| Beginning balance |
|
|
|
|
|||||||||||||||||||||||||||||||||||||||||||
| Net income attributable to Honeywell |
|
|
|
|
|||||||||||||||||||||||||||||||||||||||||||
| Dividends on common stock |
(
|
(
|
(
|
(
|
|||||||||||||||||||||||||||||||||||||||||||
| Ending balance |
|
|
|
|
|||||||||||||||||||||||||||||||||||||||||||
| Accumulated other comprehensive income (loss) | |||||||||||||||||||||||||||||||||||||||||||||||
| Beginning balance |
(
|
(
|
(
|
(
|
|||||||||||||||||||||||||||||||||||||||||||
| Foreign exchange translation adjustment |
|
(
|
(
|
(
|
|||||||||||||||||||||||||||||||||||||||||||
| Pension and other postretirement benefit adjustments |
(
|
(
|
(
|
(
|
|||||||||||||||||||||||||||||||||||||||||||
| Changes in fair value of available for sale investments |
|
|
|
(
|
|||||||||||||||||||||||||||||||||||||||||||
| Changes in fair value of cash flow hedges |
|
|
|
|
|||||||||||||||||||||||||||||||||||||||||||
| Ending balance |
(
|
(
|
(
|
(
|
|||||||||||||||||||||||||||||||||||||||||||
| Noncontrolling interest | |||||||||||||||||||||||||||||||||||||||||||||||
| Beginning balance |
|
|
|
|
|||||||||||||||||||||||||||||||||||||||||||
| Net income (loss) attributable to noncontrolling interest |
|
(
|
|
(
|
|||||||||||||||||||||||||||||||||||||||||||
| Foreign exchange translation adjustment |
(
|
(
|
(
|
(
|
|||||||||||||||||||||||||||||||||||||||||||
| Dividends paid |
(
|
(
|
(
|
(
|
|||||||||||||||||||||||||||||||||||||||||||
| Contributions from noncontrolling interest holders |
|
|
|
|
|||||||||||||||||||||||||||||||||||||||||||
| Ending balance |
|
|
|
|
|||||||||||||||||||||||||||||||||||||||||||
| Total shareowners' equity |
|
|
|
|
|
|
|
|
|||||||||||||||||||||||||||||||||||||||
| Cash dividends per share of common stock | $ |
|
$ |
|
$ |
|
$ |
|
|||||||||||||||||||||||||||||||||||||||
The Notes to Consolidated Financial Statements are an integral part of this statement.
7
Honeywell International Inc.
HONEYWELL INTERNATIONAL INC.
NOTES TO CONSOLIDATED FINANCIAL STATEMENTS
(Unaudited)
(Dollars in tables in millions, except per share amounts)
NOTE 1.
BASIS OF PRESENTATION
In the opinion of management, the accompanying unaudited Consolidated Financial Statements reflect all adjustments necessary to present fairly the financial position, results of operations, cash flows, and shareowners' equity of Honeywell International Inc. and its consolidated subsidiaries (Honeywell or the Company) for the periods presented. The interim results of operations and cash flows should not necessarily be taken as indicative of the entire year.
Honeywell reports its quarterly financial information using a calendar convention; the first, second, and third quarters are consistently reported as ending on March 31, June 30, and September 30, respectively. It is Honeywell's practice to establish actual quarterly closing dates using a predetermined fiscal calendar, which requires Honeywell's businesses to close their books on a Saturday in order to minimize the potentially disruptive effects of quarterly closing on the Company's business processes. The effects of this practice are generally not significant to reported results for any quarter and only exist within a reporting year. In the event differences in actual closing dates are material to year-over-year comparisons of quarterly or year-to-date results, Honeywell will provide appropriate disclosures. Honeywell's actual closing dates for the three and nine months ended September 30, 2023, and 2022, were September 30, 2023, and October 1, 2022, respectively.
NOTE 2.
SUMMARY OF SIGNIFICANT ACCOUNTING POLICIES
The accounting policies of the Company are set forth in Note 1 Summary of Significant Accounting Policies of Notes to Consolidated Financial Statements in the Company’s 2022 Annual Report on Form 10-K. The Company includes herein certain updates to those policies.
RECLASSIFICATIONS
Certain prior year amounts are reclassified to conform to the current year presentation.
Historically, the Company included Company-sponsored costs and costs that relate to contracts with customers for research and development projects as a component of Cost of products and services sold on the Consolidated Statement of Operations. Effective January 1, 2023, the Company began classifying Company-sponsored costs for research and development projects as a separate financial statement line item, titled Research and development expenses, on the Consolidated Statement of Operations and recast prior period results for this reclassification. This reclassification had no impact on the Company's net income, earnings per share, cash flows, segment reporting, or financial position. The Company revised historical periods to reflect this change in presentation.
SUPPLY CHAIN FINANCING
Amounts outstanding related to SCF programs are included in Accounts payable in the Consolidated Balance Sheet. Accounts payable included approximately $
1,076
million and $
992
million as of September 30, 2023, and December 31, 2022, respectively. The impact of these programs is not material to the Company's overall liquidity.
8
Honeywell International Inc.
HONEYWELL INTERNATIONAL INC.
NOTES TO CONSOLIDATED FINANCIAL STATEMENTS
(Unaudited)
(Dollars in tables in millions, except per share amounts)
RECENT ACCOUNTING PRONOUNCEMENTS
The Company considers the applicability and impact of all Accounting Standards Updates (ASUs) issued by the Financial Accounting Standards Board (FASB). ASUs not listed below were assessed and determined to be either not applicable or are expected to have minimal impact on the Company's Consolidated Financial Statements.
In September 2022, the FASB issued ASU 2022-04,
Liabilities—Supplier Finance Programs (Topic 405): Disclosure of Supplier Finance Program Obligations
, to enhance the transparency of supplier finance programs. The new standard requires annual disclosure of the key terms of the program, a description of where in the financial statements amounts outstanding under the program are presented, a rollforward of such amounts, and interim disclosure of amounts outstanding as of the end of each period. The guidance does not affect recognition, measurement, or financial statement presentation of supplier finance programs. The ASU is effective on January 1, 2023, except for the rollforward, which is effective on January 1, 2024. The Company adopted this guidance on January 1, 2023, with the exception of the rollforward that will be effective beginning January 1, 2024. The adoption of this standard does not have a material impact on the Company’s Consolidated Financial Statements.
In October 2021, the FASB issued ASU 2021-08,
Business Combinations (Topic 805)
:
Accounting for Contract Assets and Contract Liabilities from Contracts with Customers
, which requires contract assets and contract liabilities acquired in a business combination to be recognized and measured by the acquirer on the acquisition date in accordance with ASC 606, Revenue from Contracts with Customers. This ASU should be applied prospectively to acquisitions occurring on or after the effective date of December 15, 2022, and early adoption is permitted. The Company adopted this guidance on January 1, 2022. The adoption of this standard does not have a material impact on the Company’s Consolidated Financial Statements.
In March 2020, the FASB issued ASU 2020-04,
Reference Rate Reform (Topic 848): Facilitation of the Effects of Reference Rate Reform on Financial Reporting
, which provides optional expedients and exceptions for applying generally accepted accounting principles to contracts, hedging relationships, and other transactions affected by the transition away from reference rates expected to be discontinued to alternative reference rates. In January 2021, the FASB issued ASU 2021-01,
Reference Rate Reform (Topic 848): Scope
, to expand the scope of this guidance to include derivatives. The guidance was effective upon issuance and may be applied prospectively to contract modifications made and hedging relationships entered into on or before December 31, 2022. In December 2022, the FASB issued ASU 2022-06,
Reference Rate Reform (Topic 848): Deferral of the Sunset Date of Topic 848
, which extends the period of time entities can utilize the reference rate reform relief guidance under ASU 2020-04 from December 31, 2022, to December 31, 2024.
The Company will apply the guidance to impacted transactions during the transition period.
The adoption of this standard does not have a material impact on the Company’s Consolidated Financial Statements.
NOTE 3.
ACQUISITIONS AND DIVESTITURES
ACQUISITIONS
On August 25, 2023, the Company acquired
100
% of the outstanding equity interests of SCADAfence, a provider of operational technology and Internet of Things cybersecurity solutions for monitoring large scale networks, for total consideration of $
52
million, net of cash acquired. The business is included in the Performance Materials and Technologies reportable business segment. The assets and liabilities acquired with SCADAfence are included in the Consolidated Balance Sheet as of September 30, 2023, including $
17
million of intangible assets and $
42
million of goodwill, which is not deductible for tax purposes. The purchase accounting is subject to final adjustment, primarily for the value of intangible assets, amounts allocated to goodwill, and tax balances.
On June 30, 2023, the Company acquired
100
% of the outstanding equity interests of Compressor Controls Corporation, a turbomachinery services and controls company based in the United States, for total cash consideration of $
671
million, net of cash acquired. The business is included in the Performance Materials and Technologies reportable business segment. The assets and liabilities acquired with Compressor Controls Corporation are included in the Consolidated Balance Sheet as of September 30, 2023, including $
314
million of intangible assets and $
311
million allocated to goodwill, which is deductible for tax purposes. The identifiable intangible assets primarily include customer relationships amortized over an estimated life of
15
years using an excess earnings amortization method. The purchase accounting is subject to final adjustment, primarily for the valuation of intangible assets, amounts allocated to goodwill, and tax balances.
On January 18, 2022, the Company acquired
100
% of the issued and outstanding shares of US Digital Designs, Inc., a leading provider of technologies for first responders, for total consideration of $
186
million. The business is included within the Honeywell Building Technologies reportable business segment. The Company finalized the evaluation for the fair value of all the assets and liabilities acquired with US Digital Designs, Inc. during the first quarter of 2023. Management recorded intangible assets of $
53
million and allocated $
129
million to goodwill, which is deductible for tax purposes.
9
Honeywell International Inc.
HONEYWELL INTERNATIONAL INC.
NOTES TO CONSOLIDATED FINANCIAL STATEMENTS
(Unaudited)
(Dollars in tables in millions, except per share amounts)
DIVESTITURES
For the nine months ended September 30, 2023, the Company completed
no
divestitures.
NOTE 4.
REVENUE RECOGNITION AND CONTRACTS WITH CUSTOMERS
The Company has a comprehensive offering of products and services, including software and technologies, that are sold to a variety of customers in multiple end markets.
See the following disaggregated revenue table and related discussions by reportable business segment for details:
| Three Months Ended September 30, | Nine Months Ended September 30, | ||||||||||||||||||||||
| 2023 | 2022 | 2023 | 2022 | ||||||||||||||||||||
| Aerospace | |||||||||||||||||||||||
| Commercial Aviation Original Equipment | $ |
|
$ |
|
$ |
|
$ |
|
|||||||||||||||
| Commercial Aviation Aftermarket |
|
|
|
|
|||||||||||||||||||
| Defense and Space |
|
|
|
|
|||||||||||||||||||
| Net Aerospace sales |
|
|
|
|
|||||||||||||||||||
| Honeywell Building Technologies | |||||||||||||||||||||||
| Products |
|
|
|
|
|||||||||||||||||||
| Building Solutions |
|
|
|
|
|||||||||||||||||||
| Net Honeywell Building Technologies sales |
|
|
|
|
|||||||||||||||||||
| Performance Materials and Technologies | |||||||||||||||||||||||
| UOP |
|
|
|
|
|||||||||||||||||||
| Process Solutions |
|
|
|
|
|||||||||||||||||||
| Advanced Materials |
|
|
|
|
|||||||||||||||||||
| Net Performance Materials and Technologies sales |
|
|
|
|
|||||||||||||||||||
| Safety and Productivity Solutions | |||||||||||||||||||||||
| Sensing and Safety Technologies |
|
|
|
|
|||||||||||||||||||
| Productivity Solutions and Services |
|
|
|
|
|||||||||||||||||||
| Warehouse and Workflow Solutions |
|
|
|
|
|||||||||||||||||||
| Net Safety and Productivity Solutions sales |
|
|
|
|
|||||||||||||||||||
| Corporate and All Other |
|
|
|
|
|||||||||||||||||||
| Net sales | $ |
|
$ |
|
$ |
|
$ |
|
|||||||||||||||
10
Honeywell International Inc.
HONEYWELL INTERNATIONAL INC.
NOTES TO CONSOLIDATED FINANCIAL STATEMENTS
(Unaudited)
(Dollars in tables in millions, except per share amounts)
Honeywell Building Technologies
– A global provider of products, software, solutions, and technologies that enable building owners and occupants to ensure their facilities are safe, energy efficient, sustainable, and productive. Honeywell Building Technologies products and services include advanced software applications for building control and optimization; sensors, switches, control systems, and instruments for energy management; access control; video surveillance; fire products; and installation, maintenance, and upgrades of systems. Honeywell Forge solutions enable the Company's customers to digitally manage buildings, connecting data from different assets to enable smart maintenance, improve building performance, and even protect from incoming security threats.
Performance Materials and Technologies
– A global provider in developing and manufacturing high-quality performance chemicals and materials, process technologies, and automation solutions. The reportable business segment is comprised of Process Solutions, UOP, and Advanced Materials. Process Solutions provides automation control, instrumentation, advanced software, and related services for the oil and gas, refining, pulp and paper, industrial power generation, chemicals and petrochemicals, biofuels, life sciences, and metals, minerals, and mining industries. Through its smart energy products, Process Solutions enables utilities and distribution companies to deploy advanced capabilities to improve operations, reliability, and environmental sustainability. UOP provides process technology, products, including catalysts and adsorbents, equipment, and consulting services that enable customers to efficiently produce gasoline, diesel, jet fuel, petrochemicals, and renewable fuels for the petroleum refining, gas processing, petrochemical, and other industries. Advanced Materials manufactures a wide variety of high-performance products, including materials used to manufacture end products such as bullet-resistant armor, nylon, computer chips, and pharmaceutical packaging, and provides reduced and low global warming potential materials based on hydrofluoro-olefin technology. In the industrial environment, Honeywell Forge solutions enable integration and connectivity to provide a holistic view of operations and turn data into clear actions to maximize productivity and efficiency. Honeywell Forge's cybersecurity capabilities help identify risks and act on cyber-related incidents, together enabling improved operations and protecting processes, people, and assets.
Safety and Productivity Solutions
– A global provider of products and software that improve productivity, workplace safety, and asset performance to customers around the globe. Sensing and Safety Technologies products include personal protective equipment (PPE), apparel, gear, and footwear; gas detection technology; custom-engineered sensors, switches, and controls for sensing and productivity solutions; and cloud-based notification and emergency messaging. Productivity Solutions and Services products and services include mobile devices and software for computing, data collection, and thermal printing; and software-based data and asset management productivity solutions. Warehouse and Workflow Solutions products and services include system design and simulation, automation solutions, performance optimization software, and lifecycle services to enable accuracy, productivity, and predictability of warehouse operations. Honeywell Forge solutions digitally automate processes to improve efficiency while reducing downtime and safety costs.
Corporate and All Other
–
Corporate and All Other includes revenue from Honeywell's majority-owned investment in Quantinuum. Through Quantinuum, Honeywell provides a wide range of service offerings of fully integrated quantum computing hardware and software solutions.
For a summary by disaggregated product and services sales for each reportable business segment, refer to Note 17 Segment Financial Data.
The Company recognizes revenue arising from performance obligations outlined in contracts with its customers that are satisfied at a point in time and over time.
The disaggregation of the Company's revenue based off timing of recognition is as follows:
| Three Months Ended September 30, | Nine Months Ended September 30, | ||||||||||||||||||||||
| 2023 | 2022 | 2023 | 2022 | ||||||||||||||||||||
| Products, transferred point in time |
|
% |
|
% |
|
% |
|
% | |||||||||||||||
| Products, transferred over time |
|
|
|
|
|||||||||||||||||||
| Net product sales |
|
|
|
|
|||||||||||||||||||
| Services, transferred point in time |
|
|
|
|
|||||||||||||||||||
| Services, transferred over time |
|
|
|
|
|||||||||||||||||||
| Net service sales |
|
|
|
|
|||||||||||||||||||
| Net sales |
|
% |
|
% |
|
% |
|
% | |||||||||||||||
11
Honeywell International Inc.
HONEYWELL INTERNATIONAL INC.
NOTES TO CONSOLIDATED FINANCIAL STATEMENTS
(Unaudited)
(Dollars in tables in millions, except per share amounts)
CONTRACT BALANCES
Contract balances are classified as assets or liabilities on a contract-by-contract basis at the end of each reporting period.
The following table summarizes the Company's contract assets and liabilities balances:
| 2023 | 2022 | ||||||||||
| Contract assets—January 1 | $ |
|
$ |
|
|||||||
| Contract assets—September 30 |
|
|
|||||||||
| Change in contract assets—increase (decrease) | $ |
|
$ |
|
|||||||
| Contract liabilities—January 1 | $ |
(
|
$ |
(
|
|||||||
| Contract liabilities—September 30 |
(
|
(
|
|||||||||
| Change in contract liabilities—decrease (increase) | $ |
|
$ |
|
|||||||
| Net change | $ |
|
$ |
|
|||||||
For the three and nine months ended September 30, 2023, the Company recognized revenue of $
333
million and $
1,814
million, respectively, that was previously included in the beginning balance of contract liabilities. For the three and nine months ended September 30, 2022, the Company recognized revenue of $
362
million and $
1,633
million, respectively, that was previously included in the beginning balance of contract liabilities.
Contract assets included $
2,377
million and $
2,265
million of unbilled balances under long-term contracts as of September 30, 2023, and December 31, 2022, respectively. These amounts are billed in accordance with the terms of customer contracts to which they relate.
When contracts are modified to account for changes in contract specifications and requirements, the Company considers whether the modification either creates new or changes the existing enforceable rights and obligations. Contract modifications for goods or services and not distinct from the existing contract, due to the significant integration with the original good or service provided, are accounted for as if they were part of that existing contract. The effect of a contract modification on the transaction price and the Company's measure of progress for the performance obligation to which it relates, is recognized as an adjustment to revenue (either as an increase in or a reduction of revenue) on a cumulative catch-up basis. When the modifications include additional performance obligations that are distinct and at relative stand-alone selling price, they are accounted for as a new contract and performance obligation, which are recognized prospectively.
PERFORMANCE OBLIGATIONS
A performance obligation is a promise in a contract to transfer a distinct good or service to the customer and is defined as the unit of account. A contract’s transaction price is allocated to each distinct performance obligation and recognized as revenue when, or as, the performance obligation is satisfied. When the Company's contracts with customers require highly complex integration or manufacturing services that are not separately identifiable from other promises in the contracts and, therefore, not distinct, then the entire contract is accounted for as a single performance obligation. In situations when the Company's contracts include distinct goods or services that are substantially the same and have the same pattern of transfer to the customer over time, they are recognized as a series of distinct goods or services. For any contracts with multiple performance obligations, the Company allocates the contract’s transaction price to each performance obligation based on the estimated relative stand-alone selling price of each distinct good or service in the contract. For product sales, each product sold to a customer typically represents a distinct performance obligation. In such cases, the observable stand-alone sales are used to determine the stand-alone selling price.
Performance obligations are satisfied as of a point in time or over time. Performance obligations are supported by contracts with customers, providing a framework for the nature of the distinct goods, services or bundle of goods and services. The timing of satisfying the performance obligation is typically indicated by the terms of the contract.
12
Honeywell International Inc.
HONEYWELL INTERNATIONAL INC.
NOTES TO CONSOLIDATED FINANCIAL STATEMENTS
(Unaudited)
(Dollars in tables in millions, except per share amounts)
The following table outlines the Company's remaining performance obligations disaggregated by reportable business segment:
| September 30, 2023 | |||||
| Aerospace | $ |
|
|||
| Honeywell Building Technologies |
|
||||
| Performance Materials and Technologies |
|
||||
| Safety and Productivity Solutions |
|
||||
|
Corporate and All Other
1
|
|
||||
| Total performance obligations | $ |
|
|||
|
1
|
The remaining performance obligations within Corporate and All Other relate to the Quantinuum business. | |||||||
Performance obligations recognized as of September 30, 2023, will be satisfied over the course of future periods. The Company's disclosure of the timing for satisfying the performance obligation is based on the requirements of contracts with customers. However, from time to time, these contracts may be subject to modifications, impacting the timing of satisfying the performance obligations. Performance obligations expected to be satisfied within one year and greater than one year are
59
% and
41
%, respectively.
The timing of satisfaction of the Company's performance obligations does not significantly vary from the typical timing of payment. Typical payment terms of the Company's fixed price over time contracts include progress payments based on specified events or milestones or based on project progress. For some contracts, the Company may be entitled to receive an advance payment.
The Company applied the practical expedient for certain revenue streams to exclude the value of remaining performance obligations for (i) contracts with an original expected term of one year or less or (ii) contracts for which the Company recognizes revenue in proportion to the amount the Company has the right to invoice for services performed.
NOTE 5.
REPOSITIONING AND OTHER CHARGES
A summary of net repositioning and other charges follows:
| Three Months Ended September 30, | Nine Months Ended September 30, | ||||||||||||||||||||||
| 2023 | 2022 | 2023 | 2022 | ||||||||||||||||||||
| Severance | $ |
|
$ |
|
$ |
|
$ |
|
|||||||||||||||
| Asset impairments |
|
|
|
|
|||||||||||||||||||
| Exit costs |
|
|
|
|
|||||||||||||||||||
| Reserve adjustments |
(
|
(
|
(
|
(
|
|||||||||||||||||||
| Total net repositioning charges |
|
|
|
|
|||||||||||||||||||
| Asbestos-related charges, net of insurance and reimbursements |
|
|
|
|
|||||||||||||||||||
| Probable and reasonably estimable environmental liabilities, net of reimbursements |
|
|
|
|
|||||||||||||||||||
| Other charges |
(
|
|
(
|
|
|||||||||||||||||||
| Total net repositioning and other charges | $ |
|
$ |
|
$ |
|
$ |
|
|||||||||||||||
The following table summarizes the pre-tax distribution of total net repositioning and other charges by classification in the Consolidated Statement of Operations:
| Three Months Ended September 30, | Nine Months Ended September 30, | ||||||||||||||||||||||
| 2023 | 2022 | 2023 | 2022 | ||||||||||||||||||||
| Cost of products and services sold | $ |
|
$ |
|
$ |
|
$ |
|
|||||||||||||||
| Selling, general and administrative expenses |
|
|
|
|
|||||||||||||||||||
| Other (income) expense |
|
(
|
|
|
|||||||||||||||||||
| Total net repositioning and other charges | $ |
|
$ |
|
$ |
|
$ |
|
|||||||||||||||
13
Honeywell International Inc.
HONEYWELL INTERNATIONAL INC.
NOTES TO CONSOLIDATED FINANCIAL STATEMENTS
(Unaudited)
(Dollars in tables in millions, except per share amounts)
The following table summarizes the pre-tax amount of total net repositioning and other charges by reportable business segment. These amounts are excluded from segment profit as described in Note 17 Segment Financial Data:
| Three Months Ended September 30, | Nine Months Ended September 30, | ||||||||||||||||||||||
| 2023 | 2022 | 2023 | 2022 | ||||||||||||||||||||
| Aerospace | $ |
|
$ |
(
|
$ |
|
$ |
|
|||||||||||||||
| Honeywell Building Technologies |
|
|
|
|
|||||||||||||||||||
| Performance Materials and Technologies |
|
|
|
|
|||||||||||||||||||
| Safety and Productivity Solutions |
|
|
|
|
|||||||||||||||||||
| Corporate and All Other |
|
|
|
|
|||||||||||||||||||
| Total net repositioning and other charges | $ |
|
$ |
|
$ |
|
$ |
|
|||||||||||||||
NET REPOSITIONING CHARGES
In the three months ended September 30, 2023, the Company recognized gross repositioning charges totaling $
87
million, including severance costs of $
35
million related to workforce reductions of
1,567
manufacturing and administrative positions primarily in the Company's Honeywell Building Technologies and Safety and Productivity Solutions reportable business segments. The workforce reductions were related to productivity and ongoing functional transformation initiatives. The repositioning charges included asset impairments of $
16
million primarily related to the write-down of certain assets within the Company's Safety and Productivity Solutions reportable business segment and corporate function. The repositioning charges also included exit costs of $
36
million related to current period costs incurred for closure obligations associated with site transitions primarily in the Company's Performance Materials and Technologies and Safety and Productivity Solutions reportable business segments. Also, $
23
million of previously established reserves, primarily for severance, were returned to income due to higher than expected voluntary exits and adjustments to the scope of previously announced repositioning actions.
In the three months ended September 30, 2022, the Company recognized gross repositioning charges totaling $
68
million, including severance costs of $
43
million related to workforce reductions of
1,276
manufacturing and administrative positions primarily in the Company's Safety and Productivity Solutions reportable business segment. The workforce reductions were related to the Company's productivity and ongoing functional transformation initiatives. The repositioning charges included asset impairments of $
5
million related to the write-down of certain manufacturing equipment. The repositioning charges also included exit costs of $
20
million related to current period costs incurred for closure obligations associated with site transitions in the Company's Safety and Productivity Solutions and Aerospace reportable business segments.
In the nine months ended September 30, 2023, the Company recognized gross repositioning charges totaling $
256
million, including severance costs of $
121
million related to workforce reductions of
4,128
manufacturing and administrative positions primarily in the Company's Safety and Productivity Solutions and Honeywell Building Technologies reportable business segments. The workforce reductions were primarily related to productivity and ongoing functional transformation initiatives. The repositioning charges included asset impairments of $
37
million related to the write-down of certain assets within the Company's Safety and Productivity Solutions reportable business segment. The repositioning charges also included exit costs of $
98
million related to current period costs incurred for closure obligations associated with site transitions across all of the Company's reportable business segments and corporate function. Also, $
40
million of previously established reserves, primarily for severance, were returned to income due to higher than expected voluntary exits and adjustments to the scope of previously announced repositioning actions.
In the nine months ended September 30, 2022, the Company recognized gross repositioning charges totaling $
306
million, including asset impairments of $
153
million for the write-down of certain manufacturing equipment, primarily related to closing and relocating the production of certain respiratory manufacturing from a U.S.-based facility to a non-U.S. facility in the Company's Safety and Productivity Solutions reportable business segment. The repositioning charges included exit costs of $
78
million primarily related to current period exit costs incurred for new and previously approved repositioning projects and closure obligations associated with site transitions in the Company's Performance Materials and Technologies and Aerospace reportable business segments. The repositioning charges also included severance costs of $
75
million related to workforce reductions of
2,940
manufacturing and administrative positions across the Company's reportable business segments. The workforce reductions related to cost savings actions taken in connection with the Company's productivity and ongoing functional transformation initiatives and to site transitions to more cost-effective locations. Also, $
54
million of previously established reserves, primarily for severance, were returned to income due to higher than expected voluntary exits and adjustments to the scope of previously announced repositioning actions.
14
Honeywell International Inc.
HONEYWELL INTERNATIONAL INC.
NOTES TO CONSOLIDATED FINANCIAL STATEMENTS
(Unaudited)
(Dollars in tables in millions, except per share amounts)
The following table summarizes the status of the Company's total repositioning reserves:
|
Severance
Costs |
Asset
Impairments |
Exit
Costs |
Total | ||||||||||||||||||||
|
Balance at December 31, 2022
|
$ |
|
$ |
|
$ |
|
$ |
|
|||||||||||||||
| Charges |
|
|
|
|
|||||||||||||||||||
| Usage—cash |
(
|
|
(
|
(
|
|||||||||||||||||||
| Usage—noncash |
|
(
|
|
(
|
|||||||||||||||||||
| Foreign currency translation |
|
|
|
|
|||||||||||||||||||
| Adjustments |
(
|
(
|
(
|
(
|
|||||||||||||||||||
|
Balance at September 30, 2023
|
$ |
|
$ |
|
$ |
|
$ |
|
|||||||||||||||
Certain repositioning projects will recognize exit costs in future periods when the actual liability is incurred. Such exit costs incurred in the nine months ended September 30, 2023, and 2022, were $
40
million and $
46
million, respectively.
OTHER CHARGES
During the nine months ended September 30, 2023, the Company recorded a fair value adjustment, within Asbestos-related charges, net of insurance and reimbursements in the table above and Other (income) expense on the Consolidated Statement of Operations, related to HWI Net Sale Proceeds (as defined in Note 11 Fair Value Measurements) and reduced the estimate by $
11
million. See Note 11 Fair Value Measurements and Note 14 Commitments and Contingencies for further discussion.
During the three months ended September 30, 2022, the Company recognized a net reduction of Other charges previously recognized of $
16
million. The Other charges included costs incurred related to the Wind down of operations in Russia. The reduction of Other charges primarily related to a favorable foreign exchange revaluation on an intercompany loan with a Russian affiliate, in addition to the recovery of outstanding accounts receivable previously reserved against, recorded to Other (income) expense and Selling, general and administrative expense on the Consolidated Statement of Operations, respectively. This was partially offset by the recognition of an additional expense for called guarantees recorded to Other (income) expense on the Consolidated Statement of Operations.
During the nine months ended September 30, 2022, the Company recognized $
291
million of Other charges. The Other charges included costs incurred related to the initial suspension (the Suspension) and Wind down of businesses and operations in Russia. These costs impacted all reportable business segments, with the most significant impact within the Performance Materials and Technologies reportable business segment. The Other charges included costs recorded in Cost of products sold, Selling, general and administrative expenses, or Other (income) expense on the Consolidated Statement of Operations. For the nine months ended September 30, 2022, Cost of products and services sold included $
60
million primarily related to inventory reserves and the write-down of other assets, Selling, general and administrative included $
183
million primarily related to reserves against outstanding accounts receivable and contract assets, impairment of intangible assets, the write-down of other assets, and employee severance, and Other (income) expense included $
48
million related to foreign exchange revaluation on an intercompany loan with a Russian affiliate, impairment of property, plant and equipment, and expenses for called guarantees. For the nine months ended September 30, 2022, the Other charges did not include a $
2
million tax valuation allowance recorded to Tax expense on the Consolidated Statement of Operations, directly attributable to the Company's Wind down of businesses and operations in Russia.
Given the uncertainty inherent in the Company's remaining obligations related to contracts with Russian counterparties, the Company does not believe it is possible to develop estimates of reasonably possible loss in excess of current accruals for these matters (other than as specifically set forth above). Based on available information to date, the Company’s estimate of potential future losses or other contingencies related to the wind down of activities, including any guarantee payments or any litigation costs or as otherwise related to the Company's wind down in Russia, could adversely affect the Company's consolidated results of operations in the periods recognized but would not be material with respect to the Company's consolidated financial position. See Note 14 Commitments and Contingencies for a discussion of the recognition and measurement of estimate for contingencies.
NOTE 6.
INCOME TAXES
15
Honeywell International Inc.
HONEYWELL INTERNATIONAL INC.
NOTES TO CONSOLIDATED FINANCIAL STATEMENTS
(Unaudited)
(Dollars in tables in millions, except per share amounts)
NOTE 7.
INVENTORIES
| September 30, 2023 | December 31, 2022 | ||||||||||
| Raw materials | $ |
|
$ |
|
|||||||
| Work in process |
|
|
|||||||||
| Finished products |
|
|
|||||||||
| Total Inventories | $ |
|
$ |
|
|||||||
NOTE 8.
LONG-TERM DEBT AND CREDIT AGREEMENTS
| September 30, 2023 | December 31, 2022 | ||||||||||
|
|
$ |
|
$ |
|
|||||||
|
|
|
|
|||||||||
|
|
|
|
|||||||||
|
|
|
|
|||||||||
|
|
|
|
|||||||||
|
|
|
|
|||||||||
|
|
|
|
|||||||||
|
|
|
|
|||||||||
|
|
|
|
|||||||||
|
|
|
|
|||||||||
|
|
|
|
|||||||||
|
|
|
|
|||||||||
|
|
|
|
|||||||||
|
|
|
|
|||||||||
|
|
|
|
|||||||||
|
|
|
|
|||||||||
|
|
|
|
|||||||||
|
|
|
|
|||||||||
|
|
|
|
|||||||||
|
|
|
|
|||||||||
|
|
|
|
|||||||||
|
|
|
|
|||||||||
|
|
|
|
|||||||||
|
|
|
|
|||||||||
|
|
|
|
|||||||||
|
Industrial development bond obligations, floating rate maturing at various dates through 2037
|
|
|
|||||||||
|
|
|
|
|||||||||
|
|
|
|
|||||||||
|
Other (including capitalized leases),
|
|
|
|||||||||
| Fair value of hedging instruments |
(
|
(
|
|||||||||
| Debt issuance costs |
(
|
(
|
|||||||||
| Total Long-term debt and current related maturities |
|
|
|||||||||
| Less: Current maturities of long-term debt |
|
|
|||||||||
| Total Long-term debt | $ |
|
$ |
|
|||||||
16
Honeywell International Inc.
HONEYWELL INTERNATIONAL INC.
NOTES TO CONSOLIDATED FINANCIAL STATEMENTS
(Unaudited)
(Dollars in tables in millions, except per share amounts)
On May 17, 2023, the Company issued $
750
million
4.25
% Senior Notes due 2029 and $
1.0
billion
4.50
% Senior Notes due 2034 (collectively, the 2023 USD Notes). The Company may redeem the 2023 USD Notes at any time, and from time to time, in whole or in part, at the Company's option at the applicable redemption price. The offering provided gross proceeds of $
1.8
billion, offset by $
20
million in discount and closing costs related to the offering.
On May 17, 2023, the Company issued €
650
million
3.50
% Senior Notes due 2027 and €
500
million
3.75
% Senior Notes due 2032 (collectively, the 2023 Euro Notes). The Company may redeem the 2023 Euro Notes at any time, and from time to time, in whole or in part, at the Company's option at the applicable redemption price. The offering provided gross proceeds of $
1.2
billion, offset by $
12
million in discount and closing costs related to the offering.
The 2023 USD Notes and 2023 Euro Notes are senior unsecured and unsubordinated obligations of the Company and rank equally with each other and with all of the Company's existing and future senior unsecured debt and senior to all of the Company's subordinated debt. The Company intends to use the proceeds from the issuances for the repayment of commercial paper and general corporate purposes.
On February 22, 2023, the Company repaid its
1.30
% Euro notes due 2023.
On March 20, 2023, the Company entered into a $
1.5
billion
364
-day credit agreement (the
364
-Day Credit Agreement) and a $
4.0
billion amended and restated
five-year
credit agreement (the
5
-Year Credit Agreement). The
364
-Day Credit Agreement replaced the $
1.5
billion
364
-day credit agreement dated as of March 24, 2022, which was terminated in accordance with its terms effective March 20, 2023. Amounts borrowed under the
364
-Day Credit Agreement are required to be repaid no later than March 18, 2024, unless (i) Honeywell elects to convert all then outstanding amounts into a term loan, upon which such amounts shall be repaid in full on March 18, 2025, or (ii) the
364
-Day Credit Agreement is terminated earlier pursuant to its terms. The
5
-Year Credit Agreement amended and restated the previously reported $
4.0
billion amended and restated
five-year
credit agreement dated as of March 24, 2022. Commitments under the
5
-Year Credit Agreement can be increased pursuant to the terms of the
5
-Year Credit Agreement to an aggregate amount not to exceed $
4.5
billion. The
364
-Day Credit Agreement and
5
-Year Credit Agreement are maintained for general corporate purposes.
As of September 30, 2023, there were
no
outstanding borrowings under the
364
-Day Credit Agreement or the
5
-Year Credit Agreement.
NOTE 9.
LEASES
The Company's operating and finance lease portfolio is described in Note 10 Leases of Notes to Consolidated Financial Statements in the Company's 2022 Annual Report on Form 10-K.
Supplemental cash flow information related to leases was as follows:
| Nine Months Ended September 30, | |||||||||||
| 2023 | 2022 | ||||||||||
| Right-of-use assets obtained in exchange for lease obligations | |||||||||||
| Operating leases | $ |
|
$ |
|
|||||||
| Finance leases |
|
|
|||||||||
17
Honeywell International Inc.
HONEYWELL INTERNATIONAL INC.
NOTES TO CONSOLIDATED FINANCIAL STATEMENTS
(Unaudited)
(Dollars in tables in millions, except per share amounts)
Supplemental balance sheet information related to leases was as follows:
| September 30, 2023 | December 31, 2022 | ||||||||||
| Operating leases | |||||||||||
| $ |
|
$ |
|
||||||||
|
|
|
||||||||||
|
|
|
||||||||||
| Total operating lease liabilities |
|
|
|||||||||
| Financing leases | |||||||||||
| Property, plant and equipment |
|
|
|||||||||
| Accumulated depreciation |
(
|
(
|
|||||||||
| Property, plant and equipment—net |
|
|
|||||||||
|
|
|
||||||||||
|
|
|
||||||||||
| Total financing lease liabilities | $ |
|
$ |
|
|||||||
NOTE 10.
DERIVATIVE INSTRUMENTS AND HEDGING TRANSACTIONS
Honeywell's foreign currency, interest rate, credit, and commodity price risk management policies are described in Note 11 Derivative Instruments and Hedging Transactions of Notes to Consolidated Financial Statements in the Company's 2022 Annual Report on Form 10-K.
The following table summarizes the notional amounts and fair values of the Company’s outstanding derivatives by risk category and instrument type within the Consolidated Balance Sheet as of September 30, 2023, and December 31, 2022:
| Notional | Fair Value Asset | Fair Value (Liability) | |||||||||||||||||||||||||||||||||
| September 30, 2023 | December 31, 2022 | September 30, 2023 | December 31, 2022 | September 30, 2023 | December 31, 2022 | ||||||||||||||||||||||||||||||
| Derivatives in fair value hedging relationships | |||||||||||||||||||||||||||||||||||
| Interest rate swap agreements | $ |
|
$ |
|
$ |
|
$ |
|
$ |
(
|
$ |
(
|
|||||||||||||||||||||||
| Derivatives in cash flow hedging relationships | |||||||||||||||||||||||||||||||||||
| Foreign currency exchange contracts |
|
|
|
|
|
(
|
|||||||||||||||||||||||||||||
| Commodity contracts |
|
|
|
|
|
(
|
|||||||||||||||||||||||||||||
| Derivatives in net investment hedging relationships | |||||||||||||||||||||||||||||||||||
| Cross currency swap agreements |
|
|
|
|
|
|
|||||||||||||||||||||||||||||
| Total derivatives designated as hedging instruments |
|
|
|
|
(
|
(
|
|||||||||||||||||||||||||||||
| Derivatives not designated as hedging instruments | |||||||||||||||||||||||||||||||||||
| Foreign currency exchange contracts |
|
|
|
|
(
|
(
|
|||||||||||||||||||||||||||||
| Total derivatives at fair value | $ |
|
$ |
|
$ |
|
$ |
|
$ |
(
|
$ |
(
|
|||||||||||||||||||||||
All derivative assets are presented in Other current assets or Other assets. All derivative liabilities are presented in Accrued liabilities or Other liabilities.
In addition to the foreign currency derivative contracts designated as net investment hedges, certain of the Company's foreign currency denominated debt instruments are designated as net investment hedges. The carrying value of those debt instruments designated as net investment hedges, which includes the adjustment for the foreign currency transaction gain or loss on those instruments, was $
5,880
million and $
3,836
million as of September 30, 2023, and December 31, 2022, respectively.
18
Honeywell International Inc.
HONEYWELL INTERNATIONAL INC.
NOTES TO CONSOLIDATED FINANCIAL STATEMENTS
(Unaudited)
(Dollars in tables in millions, except per share amounts)
The following table sets forth the amounts recorded in the Consolidated Balance Sheet related to cumulative basis adjustments for fair value hedges:
| Carrying Amount of Hedged Item | Cumulative Amount of Fair Value Hedging Adjustment Included in the Carrying Amount of Hedged Item | ||||||||||||||||||||||
| September 30, 2023 | December 31, 2022 | September 30, 2023 | December 31, 2022 | ||||||||||||||||||||
| $ |
|
$ |
|
$ |
(
|
$ |
(
|
||||||||||||||||
The following tables summarize the location and impact to the Consolidated Statement of Operations related to derivative instruments:
| Three Months Ended September 30, 2023 | |||||||||||||||||||||||||||||||||||
| Net Sales |
Cost of
Products Sold |
Cost of
Services Sold |
Selling,
General and Administrative Expenses |
Other
(Income) Expense |
Interest and Other
Financial Charges |
||||||||||||||||||||||||||||||
| $ |
|
$ |
|
$ |
|
$ |
|
$ |
(
|
$ |
|
||||||||||||||||||||||||
| Gain or (loss) on cash flow hedges | |||||||||||||||||||||||||||||||||||
| Foreign currency exchange contracts | |||||||||||||||||||||||||||||||||||
| Amount reclassified from accumulated other comprehensive income (loss) into income |
|
|
|
|
|
|
|||||||||||||||||||||||||||||
| Gain or (loss) on fair value hedges | |||||||||||||||||||||||||||||||||||
| Interest rate swap agreements | |||||||||||||||||||||||||||||||||||
| Hedged items |
|
|
|
|
|
|
|||||||||||||||||||||||||||||
| Derivatives designated as hedges |
|
|
|
|
|
(
|
|||||||||||||||||||||||||||||
| Gain or (loss) on derivatives not designated as hedging instruments | |||||||||||||||||||||||||||||||||||
| Foreign currency exchange contracts |
|
|
|
|
|
|
|||||||||||||||||||||||||||||
| Three Months Ended September 30, 2022 | |||||||||||||||||||||||||||||||||||
| Net Sales |
Cost of
Products Sold |
Cost of
Services Sold |
Selling,
General and Administrative Expenses |
Other
(Income) Expense |
Interest and Other
Financial Charges |
||||||||||||||||||||||||||||||
| $ |
|
$ |
|
$ |
|
$ |
|
$ |
(
|
$ |
|
||||||||||||||||||||||||
| Gain or (loss) on cash flow hedges | |||||||||||||||||||||||||||||||||||
| Foreign currency exchange contracts | |||||||||||||||||||||||||||||||||||
| Amount reclassified from accumulated other comprehensive income (loss) into income |
|
|
|
(
|
|
|
|||||||||||||||||||||||||||||
| Gain or (loss) on fair value hedges | |||||||||||||||||||||||||||||||||||
| Interest rate swap agreements | |||||||||||||||||||||||||||||||||||
| Hedged items |
|
|
|
|
|
|
|||||||||||||||||||||||||||||
| Derivatives designated as hedges |
|
|
|
|
|
(
|
|||||||||||||||||||||||||||||
| Gain or (loss) on net investment hedges | |||||||||||||||||||||||||||||||||||
| Foreign currency exchange contracts | |||||||||||||||||||||||||||||||||||
| Amount excluded from effectiveness testing recognized in earnings using an amortization approach |
|
|
|
|
|
|
|||||||||||||||||||||||||||||
| Gain or (loss) on derivatives not designated as hedging instruments | |||||||||||||||||||||||||||||||||||
| Foreign currency exchange contracts |
|
|
|
|
|
|
|||||||||||||||||||||||||||||
19
Honeywell International Inc.
HONEYWELL INTERNATIONAL INC.
NOTES TO CONSOLIDATED FINANCIAL STATEMENTS
(Unaudited)
(Dollars in tables in millions, except per share amounts)
| Nine Months Ended September 30, 2023 | |||||||||||||||||||||||||||||||||||
| Net Sales |
Cost of
Products Sold |
Cost of
Services Sold |
Selling,
General and Administrative Expenses |
Other
(Income) Expense |
Interest and Other
Financial Charges |
||||||||||||||||||||||||||||||
| $ |
|
$ |
|
$ |
|
$ |
|
$ |
(
|
$ |
|
||||||||||||||||||||||||
| Gain or (loss) on cash flow hedges | |||||||||||||||||||||||||||||||||||
| Foreign currency exchange contracts | |||||||||||||||||||||||||||||||||||
| Amount reclassified from accumulated other comprehensive income (loss) into income |
|
|
|
|
|
|
|||||||||||||||||||||||||||||
| Gain or (loss) on fair value hedges | |||||||||||||||||||||||||||||||||||
| Interest rate swap agreements | |||||||||||||||||||||||||||||||||||
| Hedged items |
|
|
|
|
|
|
|||||||||||||||||||||||||||||
| Derivatives designated as hedges |
|
|
|
|
|
(
|
|||||||||||||||||||||||||||||
| Gain or (loss) on derivatives not designated as hedging instruments | |||||||||||||||||||||||||||||||||||
| Foreign currency exchange contracts |
|
|
|
|
|
|
|||||||||||||||||||||||||||||
| Nine Months Ended September 30, 2022 | |||||||||||||||||||||||||||||||||||
| Net Sales |
Cost of
Products Sold |
Cost of
Services Sold |
Selling,
General and Administrative Expenses |
Other
(Income) Expense |
Interest and Other
Financial Charges |
||||||||||||||||||||||||||||||
| $ |
|
$ |
|
$ |
|
$ |
|
$ |
(
|
$ |
|
||||||||||||||||||||||||
| Gain or (loss) on cash flow hedges | |||||||||||||||||||||||||||||||||||
| Foreign currency exchange contracts | |||||||||||||||||||||||||||||||||||
| Amount reclassified from accumulated other comprehensive income (loss) into income |
|
|
|
(
|
|
|
|||||||||||||||||||||||||||||
| Gain or (loss) on fair value hedges | |||||||||||||||||||||||||||||||||||
| Interest rate swap agreements | |||||||||||||||||||||||||||||||||||
| Hedged items |
|
|
|
|
|
|
|||||||||||||||||||||||||||||
| Derivatives designated as hedges |
|
|
|
|
|
(
|
|||||||||||||||||||||||||||||
| Gain or (loss) on net investment hedges | |||||||||||||||||||||||||||||||||||
| Foreign currency exchange contracts | |||||||||||||||||||||||||||||||||||
| Amount excluded from effectiveness testing recognized in earnings using an amortization approach |
|
|
|
|
|
|
|||||||||||||||||||||||||||||
| Gain or (loss) on derivatives not designated as hedging instruments | |||||||||||||||||||||||||||||||||||
| Foreign currency exchange contracts |
|
|
|
|
|
|
|||||||||||||||||||||||||||||
The following table summarizes the amounts of gain or (loss) on net investment hedges recognized in Accumulated other comprehensive income (loss):
| Three Months Ended September 30, | Nine Months Ended September 30, | ||||||||||||||||||||||
| 2023 | 2022 | 2023 | 2022 | ||||||||||||||||||||
| Euro-denominated long-term debt | $ |
|
$ |
|
$ |
|
$ |
|
|||||||||||||||
| Euro-denominated commercial paper |
|
|
|
|
|||||||||||||||||||
| Cross currency swap agreements |
|
|
(
|
|
|||||||||||||||||||
| Foreign currency exchange contracts |
|
|
|
|
|||||||||||||||||||
20
Honeywell International Inc.
HONEYWELL INTERNATIONAL INC.
NOTES TO CONSOLIDATED FINANCIAL STATEMENTS
(Unaudited)
(Dollars in tables in millions, except per share amounts)
NOTE 11.
FAIR VALUE MEASUREMENTS
The accounting guidance for fair value measurements and disclosures establishes a three-level fair value hierarchy:
•
Level 1 - Inputs are based on quoted prices in active markets for identical assets and liabilities.
•
Level 2 - Inputs are based on observable inputs other than quoted prices in active markets for identical or similar assets and liabilities.
•
Level 3 - One or more inputs are unobservable and significant.
Financial and nonfinancial assets and liabilities are classified in their entirety based on the lowest level of input that is significant to the fair value measurement.
The following table sets forth the Company’s financial assets and liabilities that were accounted for at fair value on a recurring basis:
| September 30, 2023 | December 31, 2022 | ||||||||||||||||||||||||||||||||||||||||||||||
| Level 1 | Level 2 | Level 3 | Total | Level 1 | Level 2 | Level 3 | Total | ||||||||||||||||||||||||||||||||||||||||
| Assets | |||||||||||||||||||||||||||||||||||||||||||||||
| Foreign currency exchange contracts | $ |
|
$ |
|
$ |
|
$ |
|
$ |
|
$ |
|
$ |
|
$ |
|
|||||||||||||||||||||||||||||||
| Available for sale investments |
|
|
|
|
|
|
|
|
|||||||||||||||||||||||||||||||||||||||
| Interest rate swap agreements |
|
|
|
|
|
|
|
|
|||||||||||||||||||||||||||||||||||||||
| Cross currency swap agreements |
|
|
|
|
|
|
|
|
|||||||||||||||||||||||||||||||||||||||
| Investments in equity securities |
|
|
|
|
|
|
|
|
|||||||||||||||||||||||||||||||||||||||
| Right to HWI Net Sale Proceeds |
|
|
|
|
|
|
|
|
|||||||||||||||||||||||||||||||||||||||
| Total assets | $ |
|
$ |
|
$ |
|
$ |
|
$ |
|
$ |
|
$ |
|
$ |
|
|||||||||||||||||||||||||||||||
| Liabilities | |||||||||||||||||||||||||||||||||||||||||||||||
| Foreign currency exchange contracts | $ |
|
$ |
|
$ |
|
$ |
|
$ |
|
$ |
|
$ |
|
$ |
|
|||||||||||||||||||||||||||||||
| Interest rate swap agreements |
|
|
|
|
|
|
|
|
|||||||||||||||||||||||||||||||||||||||
| Commodity contracts |
|
|
|
|
|
|
|
|
|||||||||||||||||||||||||||||||||||||||
| Total liabilities | $ |
|
$ |
|
$ |
|
$ |
|
$ |
|
$ |
|
$ |
|
$ |
|
|||||||||||||||||||||||||||||||
The foreign currency exchange contracts, interest rate swap agreements, cross currency swap agreements, and commodity contracts are valued using broker quotations, or market transactions in either the listed or over-the-counter markets. As such, these derivative instruments are classified within level 2. The Company also holds investments in commercial paper, certificates of deposits, time deposits, and corporate debt securities that are designated as available for sale. These investments are valued using published prices based on observable market data. As such, these investments are classified within level 2.
The Company holds certain available for sale investments in U.S. government securities and investments in equity securities. These investments are valued utilizing published prices based on quoted market pricing, which are classified within level 1.
The carrying value of cash and cash equivalents, trade accounts and notes receivables, payables, commercial paper, and other short-term borrowings approximates fair value.
As part of the NARCO Buyout (see Note 14 Commitments and Contingencies for definition), Honeywell holds a right to proceeds from the definitive sale agreement pursuant to which HarbisonWalker International Holdings, Inc. (HWI), the reorganized and renamed entity that emerged from the NARCO Bankruptcy, was acquired by an affiliate of Platinum Equity, LLC (HWI Sale). The right to these proceeds is considered a financial instrument. The significant input for the valuation of this right is unobservable, and as such, is classified within level 3.
The HWI Sale closed on February 16, 2023. During the nine months ended September 30, 2023, Honeywell received $
275
million of proceeds from the HWI Sale (HWI Net Sale Proceeds), of which $
256
million was received during the first quarter of 2023 and $
19
million during the second quarter of 2023. Additionally, during the second quarter of 2023, the Company recorded a fair value adjustment for the HWI Net Sale Proceeds and reduced the estimate by $
11
million. The fair value of the remaining HWI Net Sale Proceeds as of September 30, 2023, represents contingent consideration to be paid in future periods if certain conditions under the definitive sale agreement for the HWI Sale are met.
21
Honeywell International Inc.
HONEYWELL INTERNATIONAL INC.
NOTES TO CONSOLIDATED FINANCIAL STATEMENTS
(Unaudited)
(Dollars in tables in millions, except per share amounts)
The following table sets forth a reconciliation of beginning and ending balances of assets and liabilities that were accounted for at fair value using level 3 measurements:
| Three Months Ended September 30, 2023 | Nine Months Ended September 30, 2023 | ||||||||||
| Balance at beginning of period | $ |
|
$ |
|
|||||||
| Receipt of HWI Net Sale Proceeds |
|
(
|
|||||||||
| Fair value adjustment of HWI Net Sale Proceeds |
|
(
|
|||||||||
| Balance at end of period | $ |
|
$ |
|
|||||||
The following table sets forth the Company’s financial assets and liabilities that were not carried at fair value:
| September 30, 2023 | December 31, 2022 | ||||||||||||||||||||||
|
Carrying
Value |
Fair
Value |
Carrying
Value |
Fair
Value |
||||||||||||||||||||
| Assets | |||||||||||||||||||||||
| Long-term receivables | $ |
|
$ |
|
$ |
|
$ |
|
|||||||||||||||
| Liabilities | |||||||||||||||||||||||
| Long-term debt and related current maturities | $ |
|
$ |
|
$ |
|
$ |
|
|||||||||||||||
The Company determined the fair value of the long-term receivables by utilizing transactions in the listed markets for identical or similar assets. As such, the fair value of these receivables is considered level 2.
NOTE 12.
EARNINGS PER SHARE
The details of the earnings per share calculations for the three and nine months ended September 30, 2023, and 2022, are as follows (shares in millions):
| Three Months Ended September 30, | Nine Months Ended September 30, | ||||||||||||||||||||||
| Basic | 2023 | 2022 | 2023 | 2022 | |||||||||||||||||||
| Net income attributable to Honeywell | $ |
|
$ |
|
$ |
|
$ |
|
|||||||||||||||
| Weighted average shares outstanding |
|
|
|
|
|||||||||||||||||||
| Earnings per share of common stock—basic | $ |
|
$ |
|
$ |
|
$ |
|
|||||||||||||||
| Three Months Ended September 30, | Nine Months Ended September 30, | ||||||||||||||||||||||
| Assuming Dilution | 2023 | 2022 | 2023 | 2022 | |||||||||||||||||||
| Net income attributable to Honeywell | $ |
|
$ |
|
$ |
|
$ |
|
|||||||||||||||
| Average shares | |||||||||||||||||||||||
| Weighted average shares outstanding |
|
|
|
|
|||||||||||||||||||
| Dilutive securities issuable—stock plans |
|
|
|
|
|||||||||||||||||||
| Total weighted average diluted shares outstanding |
|
|
|
|
|||||||||||||||||||
| Earnings per share of common stock—assuming dilution | $ |
|
$ |
|
$ |
|
$ |
|
|||||||||||||||
The diluted earnings per share calculations exclude the effect of stock options when the cost to exercise an option exceeds the average market price of the common shares during the period. For the three and nine months ended September 30, 2023, the weighted average number of stock options excluded from the computations were
4.6
million and
4.4
million, respectively. For the three and nine months ended September 30, 2022, the weighted average number of stock options excluded from the computations were
5.5
million and
3.6
million, respectively.
As of September 30, 2023, and 2022, the total shares outstanding were
659.3
million and
672.3
million, respectively, and as of September 30, 2023, and 2022, total shares issued were
957.6
million.
22
Honeywell International Inc.
HONEYWELL INTERNATIONAL INC.
NOTES TO CONSOLIDATED FINANCIAL STATEMENTS
(Unaudited)
(Dollars in tables in millions, except per share amounts)
NOTE 13.
ACCUMULATED OTHER COMPREHENSIVE INCOME (LOSS)
CHANGES IN ACCUMULATED OTHER COMPREHENSIVE INCOME (LOSS) BY COMPONENT
|
Foreign
Exchange Translation Adjustment |
Pension
and Other Postretirement Benefit Adjustments |
Changes in Fair
Value of Available for Sale Investments |
Changes in
Fair Value of Cash Flow Hedges |
Total | |||||||||||||||||||||||||
| Balance at December 31, 2022 | $ |
(
|
$ |
(
|
$ |
(
|
$ |
|
$ |
(
|
|||||||||||||||||||
| Other comprehensive income (loss) before reclassifications |
(
|
|
|
|
(
|
||||||||||||||||||||||||
| Amounts reclassified from accumulated other comprehensive income (loss) |
|
(
|
|
(
|
(
|
||||||||||||||||||||||||
| Net current period other comprehensive income (loss) |
(
|
(
|
|
|
(
|
||||||||||||||||||||||||
| Balance at September 30, 2023 | $ |
(
|
$ |
(
|
$ |
(
|
$ |
|
$ |
(
|
|||||||||||||||||||
|
Foreign
Exchange Translation Adjustment |
Pension
and Other Postretirement Benefit Adjustments |
Changes in Fair
Value of Available for Sale Investments |
Changes in
Fair Value of Cash Flow Hedges |
Total | |||||||||||||||||||||||||
| Balance at December 31, 2021 | $ |
(
|
$ |
(
|
$ |
|
$ |
(
|
$ |
(
|
|||||||||||||||||||
| Other comprehensive income (loss) before reclassifications |
(
|
|
(
|
|
(
|
||||||||||||||||||||||||
| Amounts reclassified from accumulated other comprehensive income (loss) |
(
|
(
|
|
(
|
(
|
||||||||||||||||||||||||
| Net current period other comprehensive income (loss) |
(
|
(
|
(
|
|
(
|
||||||||||||||||||||||||
| Balance at September 30, 2022 | $ |
(
|
$ |
(
|
$ |
(
|
$ |
|
$ |
(
|
|||||||||||||||||||
NOTE 14.
COMMITMENTS AND CONTINGENCIES
ENVIRONMENTAL MATTERS
Honeywell's environmental matters are described in Note 19 Commitments and Contingencies of Notes to Consolidated Financial Statements in the Company's 2022 Annual Report on Form 10-K.
The following table summarizes information concerning the Company's recorded liabilities for environmental costs:
|
Balance at December 31, 2022
|
$ |
|
|||
|
|
|||||
| Environmental liability payments |
(
|
||||
|
Balance at September 30, 2023
|
$ |
|
|||
Environmental liabilities are included in the following balance sheet accounts:
| September 30, 2023 | December 31, 2022 | ||||||||||
| $ |
|
$ |
|
||||||||
|
|
|
||||||||||
| Total environmental liabilities | $ |
|
$ |
|
|||||||
23
Honeywell International Inc.
HONEYWELL INTERNATIONAL INC.
NOTES TO CONSOLIDATED FINANCIAL STATEMENTS
(Unaudited)
(Dollars in tables in millions, except per share amounts)
The Company does not currently possess sufficient information to reasonably estimate the amounts of environmental liabilities to be recorded upon future completion of studies, litigation, or settlements, and neither the timing nor the amount of the ultimate costs associated with environmental matters can be determined, although they could be material to the Company's consolidated results of operations and operating cash flows in the periods recognized or paid. However, considering the Company's past experience and existing reserves, the Company does not expect that environmental matters will have a material adverse effect on its consolidated financial position.
In conjunction with the Resideo Technologies, Inc. (Resideo) spin-off, the Company entered into an indemnification and reimbursement agreement with a Resideo subsidiary, pursuant to which Resideo’s subsidiary has an ongoing obligation to make cash payments to Honeywell in amounts equal to
90
% of Honeywell’s annual net spending for environmental matters at certain sites as defined in the agreement. The amount payable to Honeywell in any given year is subject to a cap of $
140
million, and the obligation will continue until the earlier of December 31, 2043, or December 31 of the third consecutive year during which the annual payment obligation is less than $
25
million.
Reimbursements associated with this agreement are collected from Resideo quarterly and were $
105
million in the nine months ended September 30, 2023, and offset operating cash outflows incurred by the Company. As the Company incurs costs for environmental matters deemed probable and reasonably estimable related to the sites covered by the indemnification and reimbursement agreement, a corresponding receivable from Resideo for
90
% of such costs is also recorded. This receivable amount recorded in the nine months ended September 30, 2023, was $
136
million. As of September 30, 2023, Other current assets and Other assets included $
140
million and $
505
million, respectively, for the short-term and long-term portion of the receivable amount due from Resideo under the indemnification and reimbursement agreement.
ASBESTOS MATTERS
Honeywell is named in asbestos-related personal injury claims related to North American Refractories Company (NARCO), which was sold in 1986, and the Bendix Friction Materials (Bendix) business, which was sold in 2014.
The following tables summarize information concerning NARCO and Bendix asbestos-related balances:
ASBESTOS-RELATED LIABILITIES
| Bendix | NARCO | Total | |||||||||||||||
| December 31, 2022 | $ |
|
$ |
|
$ |
|
|||||||||||
| Accrual for update to estimated liability |
|
|
|
||||||||||||||
| Change in estimated cost of future claims |
|
|
|
||||||||||||||
| Asbestos-related liability payments |
(
|
(
|
(
|
||||||||||||||
| NARCO Buyout |
|
(
|
(
|
||||||||||||||
| September 30, 2023 | $ |
|
$ |
|
$ |
|
|||||||||||
INSURANCE RECOVERIES FOR ASBESTOS-RELATED LIABILITIES
| Bendix | NARCO | Total | |||||||||||||||
| December 31, 2022 | $ |
|
$ |
|
$ |
|
|||||||||||
| Probable insurance recoveries related to estimated liability |
|
|
|
||||||||||||||
| Insurance receipts for asbestos-related liabilities |
(
|
(
|
(
|
||||||||||||||
| September 30, 2023 | $ |
|
$ |
|
$ |
|
|||||||||||
24
Honeywell International Inc.
HONEYWELL INTERNATIONAL INC.
NOTES TO CONSOLIDATED FINANCIAL STATEMENTS
(Unaudited)
(Dollars in tables in millions, except per share amounts)
NARCO and Bendix asbestos-related balances are included in the following balance sheet accounts:
| September 30, 2023 | December 31, 2022 | ||||||||||
| Other current assets | $ |
|
$ |
|
|||||||
| Insurance recoveries for asbestos-related liabilities |
|
|
|||||||||
| Total insurance recoveries for asbestos-related liabilities | $ |
|
$ |
|
|||||||
| Accrued liabilities | $ |
|
$ |
|
|||||||
| Asbestos-related liabilities |
|
|
|||||||||
|
Total asbestos-related liabilities
1
|
$ |
|
$ |
|
|||||||
| 1 |
As of December 31, 2022, Accrued liabilities included the Buyout Amount, as described and defined below, agreed upon between Honeywell and the Trust. The Buyout Amount does not represent an asbestos-related liability.
|
|||||||
NARCO Products
– NARCO manufactured high-grade, heat-resistant, refractory products for various industries. Honeywell’s predecessor, Allied Corporation, owned NARCO from 1979 to 1986. Allied Corporation sold the NARCO business in 1986 and entered into a cross-indemnity agreement which included an obligation to indemnify the purchaser for asbestos claims. NARCO ceased manufacturing asbestos containing products in 1980 and filed for bankruptcy in January 2002, at which point in time all then current and future NARCO asbestos claims were stayed against both NARCO and Honeywell pending the reorganization of NARCO. The Company established its initial liability for NARCO asbestos claims in 2002.
NARCO emerged from bankruptcy in April 2013, at which time a federally authorized 524(g) trust was established to evaluate and resolve all existing NARCO asbestos claims (the Trust). Both Honeywell and NARCO are protected by a permanent channeling injunction barring all present and future individual actions in state or federal courts and requiring all asbestos-related claims based on exposure to NARCO asbestos-containing products to be made against the Trust (Channeling Injunction). The NARCO Trust Agreement and the NARCO Trust Distribution Procedures set forth the structure and operating rules of the Trust, and established Honeywell’s evergreen funding obligations.
On November 18, 2022, Honeywell entered into a definitive agreement with the Trust and certain other parties, which was subsequently amended on November 20, 2022 (Amended Buyout Agreement).
Pursuant to the terms of the Amended Buyout Agreement, Honeywell agreed to make a one-time, lump sum payment in the amount of $
1.325
billion to the Trust (Buyout Amount), subject to certain deductions as described in the Amended Buyout Agreement and in exchange for the release by the Trust of Honeywell from all further and future obligations of any kind related to the Trust and/or any claimants who were exposed to asbestos-containing products manufactured, sold, or distributed by NARCO or its predecessors (the Honeywell Obligations) (the NARCO Buyout). In accordance with the Amended Buyout Agreement, the economic rights of the Trust in respect of the net proceeds from the HWI Sale (as defined in Note 11 Fair Value Measurements) inured to the benefit of Honeywell.
On December 8, 2022, the Bankruptcy Court issued an order that (A) approved the Amended Buyout Agreement, and (B) declared that the Channeling Injunction will remain in full force and effect without modification, dissolution, or termination.
On December 14, 2022, HWI (as defined in Note 11 Fair Value Measurements) entered into a definitive sale agreement for the sale of HWI to an affiliate of Platinum Equity, LLC subject to the terms set forth in the agreement.
On January 30, 2023, the Company paid the Buyout Amount to the Trust, the parties closed the transactions contemplated in the Amended Buyout Agreement, and Honeywell was released from the Honeywell Obligations. Honeywell continues to have the right to collect proceeds in connection with its NARCO asbestos-related insurance policies.
On February 16, 2023, the HWI Sale closed. Pursuant to the Amended Buyout Agreement, during the nine months ended September 30, 2023, Honeywell received $
275
million of proceeds from the HWI sale. See Note 11 Fair Value Measurements for further information on the related proceeds and remaining amount under the Amended Buyout Agreement.
For additional information, see the Company's Annual Report on Form 10-K, filed with the SEC on February 10, 2023, under Note 19 Commitments and Contingencies.
25
Honeywell International Inc.
HONEYWELL INTERNATIONAL INC.
NOTES TO CONSOLIDATED FINANCIAL STATEMENTS
(Unaudited)
(Dollars in tables in millions, except per share amounts)
Bendix Products
– Bendix manufactured automotive brake linings that contained chrysotile asbestos in an encapsulated form. Claimants consist largely of individuals who allege exposure to asbestos from brakes from either performing or being in the vicinity of individuals who performed brake replacements.
The following tables present information regarding Bendix-related asbestos claims activity:
|
Nine Months Ended
September 30, |
Years Ended
December 31, |
||||||||||||||||
| 2023 | 2022 | 2021 | |||||||||||||||
| Claims unresolved at the beginning of period |
|
|
|
||||||||||||||
| Claims filed |
|
|
|
||||||||||||||
| Claims resolved |
(
|
(
|
(
|
||||||||||||||
| Claims unresolved at the end of period |
|
|
|
||||||||||||||
| September 30, | December 31, | ||||||||||||||||
| Disease Distribution of Unresolved Claims | 2023 | 2022 | 2021 | ||||||||||||||
| Mesothelioma and other cancer claims |
|
|
|
||||||||||||||
| Nonmalignant claims |
|
|
|
||||||||||||||
| Total claims |
|
|
|
||||||||||||||
Honeywell has experienced average resolution values per claim excluding legal costs as follows:
| Years Ended December 31, | |||||||||||||||||||||||||||||
| 2022 | 2021 | 2020 | 2019 | 2018 | |||||||||||||||||||||||||
| (in whole dollars) | |||||||||||||||||||||||||||||
| Mesothelioma and other cancer claims | $ |
|
$ |
|
$ |
|
$ |
|
$ |
|
|||||||||||||||||||
| Nonmalignant claims | $ |
|
$ |
|
$ |
|
$ |
|
$ |
|
|||||||||||||||||||
While resolution values moved higher and lower over the years for Bendix-related asbestos claims, such resolution values may continue to increase over the near term in light of recent asbestos litigation trends. It is not possible to predict whether resolution values for Bendix-related asbestos claims will increase, decrease, or stabilize in the future.
The Consolidated Financial Statements reflect an estimated liability for resolution of asserted (claims filed as of the financial statement date) and unasserted Bendix-related asbestos claims, which exclude the Company’s ongoing legal fees to defend such asbestos claims which will continue to be expensed as they are incurred.
The Company reflects the inclusion of all years of epidemiological disease projection through 2059 when estimating the liability for unasserted Bendix-related asbestos claims. Such liability for unasserted Bendix-related asbestos claims is based on historic and anticipated claims filing experience and dismissal rates, disease classifications, and resolution values in the tort system for the previous five years. The Company valued Bendix asserted and unasserted claims using average resolution values for the previous five years. The Company updates the resolution values used to estimate the cost of Bendix asserted and unasserted claims during the fourth quarter each year.
The Company's insurance receivable corresponding to the liability for settlement of asserted and unasserted Bendix asbestos claims reflects coverage which is provided by a large number of insurance policies written by dozens of insurance companies in both the domestic insurance market and the London excess market. Based on the Company's ongoing analysis of the probable insurance recovery, insurance receivables are recorded in the financial statements simultaneous with the recording of the estimated liability for the underlying asbestos claims. This determination is based on the Company's analysis of the underlying insurance policies, historical experience with insurers, ongoing review of the solvency of insurers, judicial determinations relevant to insurance programs, and consideration of the impacts of any settlements reached with the Company's insurers.
26
Honeywell International Inc.
HONEYWELL INTERNATIONAL INC.
NOTES TO CONSOLIDATED FINANCIAL STATEMENTS
(Unaudited)
(Dollars in tables in millions, except per share amounts)
PETROBRAS AND UNAOIL MATTERS
On December 19, 2022, the Company reached a comprehensive resolution to the investigations by the U.S. Department of Justice (DOJ), the Securities and Exchange Commission (SEC), and certain Brazilian authorities (Brazilian Authorities) relating to the Company's use of third parties who previously worked for the Company's UOP business in Brazil in relation to a project awarded in 2010 for Petróleo Brasileiro S.A. (Petrobras). The investigations focused on the Company’s compliance with the U.S. Foreign Corrupt Practices Act and similar Brazilian laws (UOP Matters). The comprehensive resolution also resolves DOJ and SEC investigations relating to a matter involving a foreign subsidiary’s prior contract with Unaoil S.A.M. in Algeria executed in 2011 (the Unaoil Matter).
In connection with the comprehensive resolution, (i) the Company agreed to pay a total equivalent of $
202.7
million, which payment occurred in January 2023, to the DOJ, the SEC, and the Brazilian Authorities, collectively, in penalties, disgorgement, and prejudgment interest, (ii) the Company’s subsidiary, UOP, LLC (UOP), entered into a three-year Deferred Prosecution Agreement with the DOJ for charges related to the UOP Matters, (iii) UOP entered into leniency agreements with the Brazilian authorities related to the UOP Matter in Brazil, and (iv) the Company entered into an agreement with the SEC that resolves allegations relating to the UOP Matters and the Unaoil Matter. Pursuant to these agreements, the Company agreed to undertake certain compliance measures and compliance reporting obligations. These agreements entirely resolve the Petrobras and Unaoil investigations.
OTHER MATTERS
The Company is subject to a number of other lawsuits, investigations, and disputes (some of which involve substantial amounts claimed) arising out of the conduct of the Company's business, including matters relating to commercial transactions, government contracts, product liability, prior acquisitions and divestitures, employee benefit plans, intellectual property, and environmental, health, and safety matters. The Company recognizes liabilities for any contingency that is probable of occurrence and reasonably estimable. The Company continually assesses the likelihood of adverse judgments or outcomes in such matters, as well as potential ranges of probable losses (taking into consideration any insurance recoveries), based on a careful analysis of each matter with the assistance of outside legal counsel and, if applicable, other experts.
Given the uncertainty inherent in litigation and investigations, the Company does not believe it is possible to develop estimates of reasonably possible loss (or a range of possible loss) in excess of current accruals for commitment and contingency matters, including those discussed in this Note 14. Considering the Company's past experience and existing accruals, the Company does not expect the outcome of such matters, either individually or in the aggregate, to have a material adverse effect on the Company's consolidated financial position. Because most contingencies are resolved over long periods of time, potential liabilities are subject to change due to new developments, changes in settlement strategy or the impact of evidentiary requirements, which could cause the Company to pay damage awards or settlements (or become subject to equitable remedies) that could have a material adverse effect on the Company's consolidated results of operations or operating cash flows in the periods recognized or paid.
NOTE 15.
PENSION BENEFITS
Net periodic pension benefit (income) cost for the Company's significant pension plans included the following components:
| U.S. Plans | |||||||||||||||||||||||
| Three Months Ended September 30, | Nine Months Ended September 30, | ||||||||||||||||||||||
| 2023 | 2022 | 2023 | 2022 | ||||||||||||||||||||
| Service cost | $ |
|
$ |
|
$ |
|
$ |
|
|||||||||||||||
| Interest cost |
|
|
|
|
|||||||||||||||||||
| Expected return on plan assets |
(
|
(
|
(
|
(
|
|||||||||||||||||||
| Amortization of prior service (credit) cost |
(
|
(
|
(
|
(
|
|||||||||||||||||||
| Net periodic benefit income | $ |
(
|
$ |
(
|
$ |
(
|
$ |
(
|
|||||||||||||||
27
Honeywell International Inc.
HONEYWELL INTERNATIONAL INC.
NOTES TO CONSOLIDATED FINANCIAL STATEMENTS
(Unaudited)
(Dollars in tables in millions, except per share amounts)
| Non-U.S. Plans | |||||||||||||||||||||||
| Three Months Ended September 30, | Nine Months Ended September 30, | ||||||||||||||||||||||
| 2023 | 2022 | 2023 | 2022 | ||||||||||||||||||||
| Service cost | $ |
|
$ |
|
$ |
|
$ |
|
|||||||||||||||
| Interest cost |
|
|
|
|
|||||||||||||||||||
| Expected return on plan assets |
(
|
(
|
(
|
(
|
|||||||||||||||||||
| Net periodic benefit income | $ |
(
|
$ |
(
|
$ |
(
|
$ |
(
|
|||||||||||||||
During the three and nine months ended September 30, 2023, the Company repurchased $
100
million of outstanding Honeywell shares of common stock from the Honeywell U.S. Pension Plan Master Trust. The Company completed
no
repurchases of outstanding Honeywell shares of common stock from the Honeywell U.S. Pension Plan Master Trust during 2022.
NOTE 16.
OTHER (INCOME) EXPENSE
| Three Months Ended September 30, | Nine Months Ended September 30, | ||||||||||||||||||||||
| 2023 | 2022 | 2023 | 2022 | ||||||||||||||||||||
| Interest income | $ |
(
|
$ |
(
|
$ |
(
|
$ |
(
|
|||||||||||||||
| Pension ongoing income—non-service |
(
|
(
|
(
|
(
|
|||||||||||||||||||
| Other postretirement income—non-service |
(
|
(
|
(
|
(
|
|||||||||||||||||||
| Equity income of affiliated companies |
(
|
(
|
(
|
(
|
|||||||||||||||||||
| Gain on sale of non-strategic businesses and assets |
|
(
|
|
(
|
|||||||||||||||||||
| Foreign exchange |
|
|
|
|
|||||||||||||||||||
| Expense related to UOP Matters |
|
|
|
|
|||||||||||||||||||
| Expense (benefit) related to Russia-Ukraine Conflict |
|
(
|
(
|
|
|||||||||||||||||||
| Net expense related to the NARCO Buyout and HWI |
|
|
|
|
|||||||||||||||||||
| Other, net |
|
|
|
|
|||||||||||||||||||
| Total Other (income) expense | $ |
(
|
$ |
(
|
$ |
(
|
$ |
(
|
|||||||||||||||
For more information on the Net expense related to the NARCO Buyout and HWI Sale, see Notes 5 Repositioning and Other Charges, 11 Fair Value Measurements, and 14 Commitments and Contingencies.
28
Honeywell International Inc.
HONEYWELL INTERNATIONAL INC.
NOTES TO CONSOLIDATED FINANCIAL STATEMENTS
(Unaudited)
(Dollars in tables in millions, except per share amounts)
NOTE 17.
SEGMENT FINANCIAL DATA
Honeywell globally manages its business operations through
four
reportable business segments. Segment information is consistent with how management reviews the businesses, makes investing and resource allocation decisions, and assesses operating performance.
Honeywell’s senior management evaluates segment performance based on segment profit. Each segment’s profit is measured as segment income (loss) before taxes excluding general corporate unallocated expense, interest and other financial charges, stock compensation expense, pension and other postretirement income (expense), repositioning and other charges, and other items within Other (income) expense.
In October 2023, the Company announced a realignment, expected to be effective in the first quarter of 2024, of its business units comprising its Performance Materials and Technologies and Safety and Productivity Solutions reportable business segments by forming
two
new reportable business segments: Industrial Automation and Energy and Sustainability Solutions. Industrial Automation will include Sensing and Safety Technologies, Productivity Solutions and Services, and Warehouse and Workflow Solutions, which are currently included in Safety and Productivity Solutions, in addition to Process Solutions, which is currently included in Performance Materials and Technologies. Energy and Sustainability Solutions will include UOP and Advanced Materials, which are currently included in Performance Materials and Technologies. Further, as part of the realignment, the Company will rename its Aerospace and Honeywell Building Technologies reportable business segments to Aerospace Technologies and Building Automation, respectively. Following the realignment, the Company’s reportable business segments will be Aerospace Technologies, Industrial Automation, Building Automation, and Energy and Sustainability Solutions. The realignment will not impact the Company’s historical consolidated financial position, results of operations, or cash flows. The Company expects to report its financial performance based on this realignment effective with the first quarter of 2024.
29
Honeywell International Inc.
HONEYWELL INTERNATIONAL INC.
NOTES TO CONSOLIDATED FINANCIAL STATEMENTS
(Unaudited)
(Dollars in tables in millions, except per share amounts)
| Three Months Ended September 30, | Nine Months Ended September 30, | ||||||||||||||||||||||
| 2023 | 2022 | 2023 | 2022 | ||||||||||||||||||||
| Net sales | |||||||||||||||||||||||
| Aerospace | |||||||||||||||||||||||
| Products | $ |
|
$ |
|
$ |
|
$ |
|
|||||||||||||||
| Services |
|
|
|
|
|||||||||||||||||||
| Net Aerospace sales |
|
|
|
|
|||||||||||||||||||
| Honeywell Building Technologies | |||||||||||||||||||||||
| Products |
|
|
|
|
|||||||||||||||||||
| Services |
|
|
|
|
|||||||||||||||||||
| Net Honeywell Building Technologies sales |
|
|
|
|
|||||||||||||||||||
| Performance Materials and Technologies | |||||||||||||||||||||||
| Products |
|
|
|
|
|||||||||||||||||||
| Services |
|
|
|
|
|||||||||||||||||||
| Net Performance Materials and Technologies sales |
|
|
|
|
|||||||||||||||||||
| Safety and Productivity Solutions | |||||||||||||||||||||||
| Products |
|
|
|
|
|||||||||||||||||||
| Services |
|
|
|
|
|||||||||||||||||||
| Net Safety and Productivity Solutions sales |
|
|
|
|
|||||||||||||||||||
| Corporate and All Other | |||||||||||||||||||||||
| Services |
|
|
|
|
|||||||||||||||||||
| Net Corporate and All Other sales |
|
|
|
|
|||||||||||||||||||
| Net sales | $ |
|
$ |
|
$ |
|
$ |
|
|||||||||||||||
| Segment profit | |||||||||||||||||||||||
| Aerospace | $ |
|
$ |
|
$ |
|
$ |
|
|||||||||||||||
| Honeywell Building Technologies |
|
|
|
|
|||||||||||||||||||
| Performance Materials and Technologies |
|
|
|
|
|||||||||||||||||||
| Safety and Productivity Solutions |
|
|
|
|
|||||||||||||||||||
| Corporate and All Other |
(
|
(
|
(
|
(
|
|||||||||||||||||||
| Total segment profit |
|
|
|
|
|||||||||||||||||||
| Interest and other financial charges |
(
|
(
|
(
|
(
|
|||||||||||||||||||
|
Stock compensation expense
1
|
(
|
(
|
(
|
(
|
|||||||||||||||||||
|
Pension ongoing income
2
|
|
|
|
|
|||||||||||||||||||
|
Other postretirement income
2
|
|
|
|
|
|||||||||||||||||||
|
Repositioning and other charges
3
|
(
|
(
|
(
|
(
|
|||||||||||||||||||
|
Other
4
|
|
|
|
(
|
|||||||||||||||||||
| Income before taxes | $ |
|
$ |
|
$ |
|
$ |
|
|||||||||||||||
|
1
|
Amounts included in Selling, general and administrative expenses. | |||||||
|
2
|
Amounts included in Cost of products and services sold, Selling, general and administrative expenses (service cost component) and Other (income) expense (non-service cost component). | |||||||
|
3
|
Amounts included in Cost of products and services sold, Selling, general and administrative expenses, and Other (income) expense. | |||||||
|
4
|
Amounts include the other components of Other (income) expense not included within other categories in this reconciliation. Equity income of affiliated companies is included in segment profit. | |||||||
30
Honeywell International Inc.
HONEYWELL INTERNATIONAL INC.
NOTES TO CONSOLIDATED FINANCIAL STATEMENTS
(Unaudited)
(Dollars in tables in millions, except per share amounts)
NOTE 18.
SUBSEQUENT EVENTS
31
Honeywell International Inc.
ITEM 2. MANAGEMENT'S DISCUSSION AND ANALYSIS OF FINANCIAL CONDITION AND RESULTS OF OPERATIONS
(Dollars in tables and graphs in millions, except per share amounts)
The following Management's Discussion and Analysis of Financial Condition and Results of Operations is intended to help the reader understand the results of operations and financial condition of Honeywell International Inc. and its consolidated subsidiaries (Honeywell, we, us, our, or the Company) for the three and nine months ended September 30, 2023. The financial information as of September 30, 2023, should be read in conjunction with the Consolidated Financial Statements for the year ended December 31, 2022, contained in our 2022 Annual Report on Form 10-K. See Note 3 Acquisitions and Divestitures of Notes to Consolidated Financial Statements for a discussion of acquisition and divestiture activity during the nine months ended September 30, 2023.
Certain prior year amounts are reclassified to conform to the current year presentation.
BUSINESS UPDATE
Historically, we included Company-sponsored costs and costs that relate to contracts with customers for research and development projects as a component of Cost of products and services sold on the Consolidated Statement of Operations. Effective January 1, 2023, we began classifying Company-sponsored costs for research and development projects as a separate financial statement line item, titled Research and development expenses, on the Consolidated Statement of Operations, and recast prior period results for this reclassification. This reclassification had no impact on net income, earnings per share, cash flows, segment reporting, or financial position. We revised historical periods to reflect this change in presentation.
In October 2023, the Company announced a realignment,
expected to be effective in the first quarter of 2024,
of its business units comprising its Performance Materials and Technologies and Safety and Productivity Solutions reportable business segments by forming two new reportable business segments: Industrial Automation and Energy and Sustainability Solutions. Industrial Automation will include Sensing and Safety Technologies, Productivity Solutions and Services, and Warehouse and Workflow Solutions, which are currently included in Safety and Productivity Solutions, in addition to Process Solutions, which is currently included in Performance Materials and Technologies. Energy and Sustainability Solutions will include UOP and Advanced Materials, which are currently included in Performance Materials and Technologies. Further, as part of the realignment, the Company will rename its Aerospace and Honeywell Building Technologies reportable business segments to Aerospace Technologies and Building Automation, respectively. Following the realignment, the Company’s reportable business segments will be Aerospace Technologies, Industrial Automation, Building Automation, and Energy and Sustainability Solutions.
The realignment will not impact the Company’s historical consolidated financial position, results of operations, or cash flows.
The Company expects to report its financial performance based on this realignment effective with the first quarter of 2024.
MACROECONOMIC CONDITIONS
We continue to monitor the impacts of ongoing macroeconomic conditions and geopolitical events. In the third quarter of 2023, material inflation continued to moderate. While we see signs of relief in supply chains for semiconductors and logistics, we continue to experience supply chain constraints, including labor shortages in the Aerospace supply base, and inflationary cost pressures in manufacturing labor. We continue to leverage previously implemented short-term and long-term mitigation strategies.
Our mitigation strategies include pricing actions, longer term planning for constrained materials, material supply tracking tools, and direct engagement with key suppliers to meet customer demand. Our relationships with primary and secondary suppliers allow us to reliably source key components and raw materials. Where we cannot procure key components or raw materials, we consider altering existing products and develop new products to satisfy customer needs. Alterations to existing products and the development of new products undergo product quality controls and engineering qualification, prior to releasing to our customers. In addition, we assist our suppliers facing manufacturing challenges by committing our own resources to their sites and facilities. We believe these mitigation strategies enable us to reduce supply risk, accelerate new product innovation, and expand our penetration in the markets we serve. Additionally, due to the strenuous quality controls and product qualification we perform on a new or altered product, we do not expect these mitigation strategies to impact product quality or reliability.
The Russia-Ukraine conflict continues to create volatility in global financial and energy markets and contribute to supply chain shortages adding to the inflationary pressures in the global economy. We actively collaborate with our suppliers to minimize impacts of supply shortages on our manufacturing capabilities and implement strategies to reduce our reliance on natural gas at critical sites in Europe.
32
Honeywell International Inc.
To date, our strategies successfully mitigated our exposure to these conditions. However, if we are not successful in sustaining these strategies, these macroeconomic conditions could have a material adverse effect on our consolidated results of operations, or operating cash flows.
33
Honeywell International Inc.
RESULTS OF OPERATIONS
Consolidated Financial Results
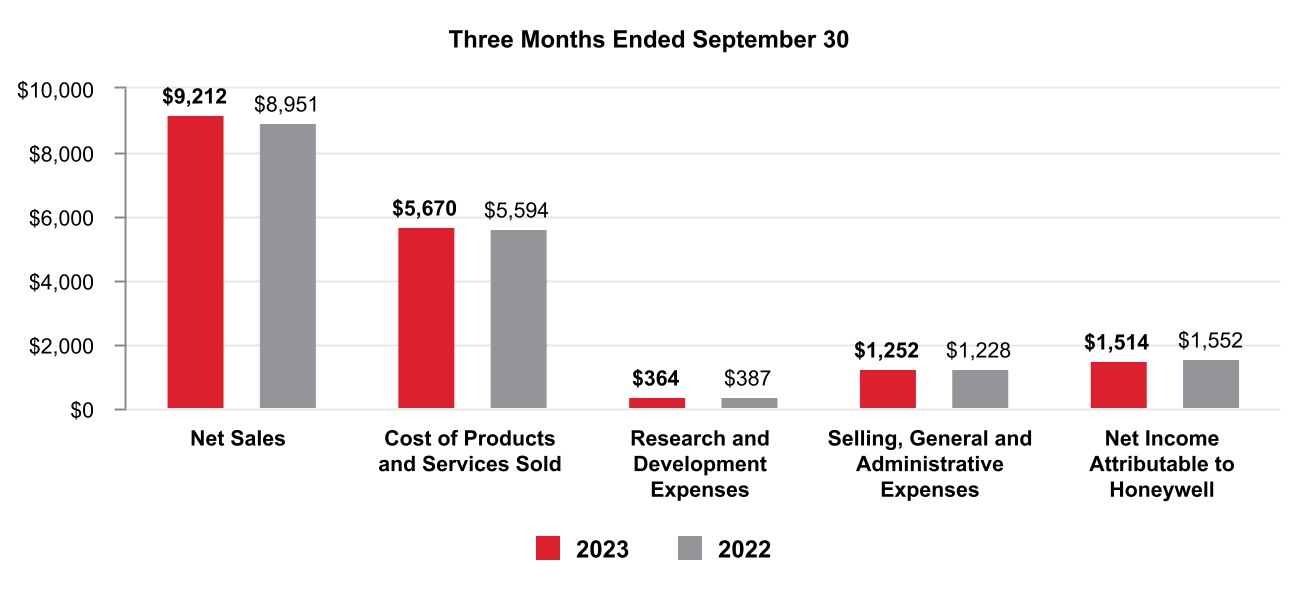
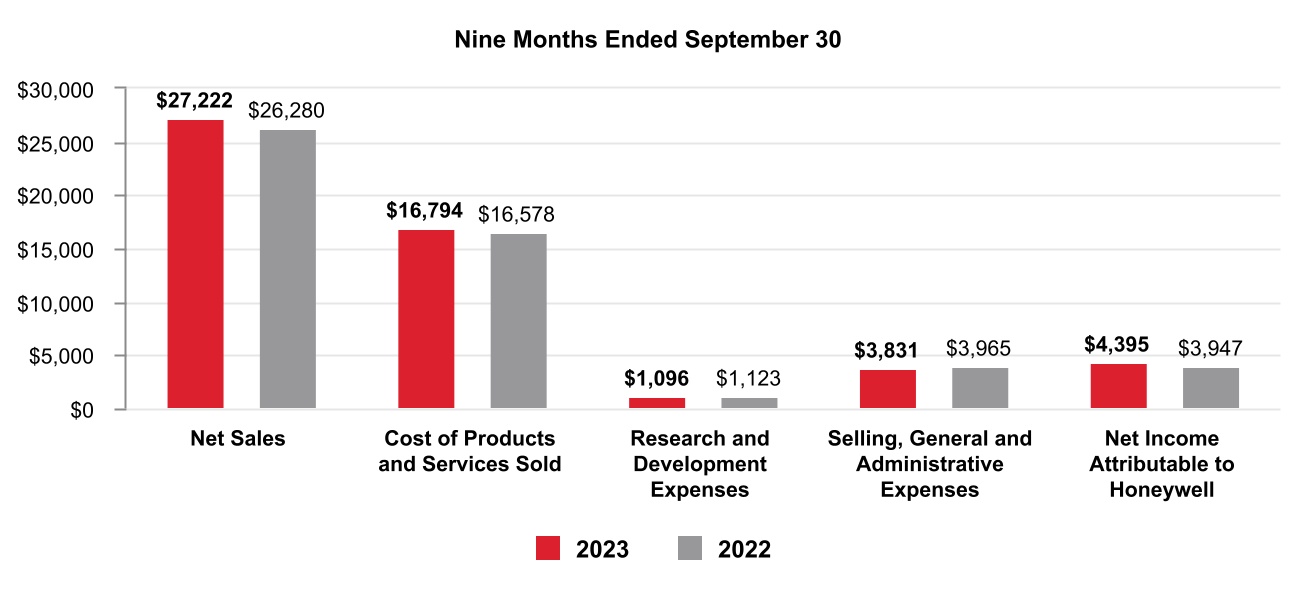
34
Honeywell International Inc.
Net Sales by Segment

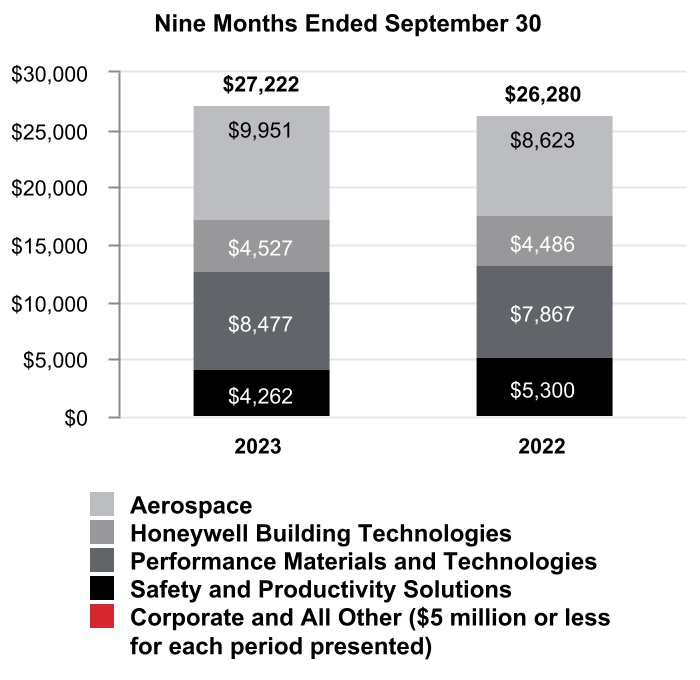
35
Honeywell International Inc.
Segment Profit by Segment
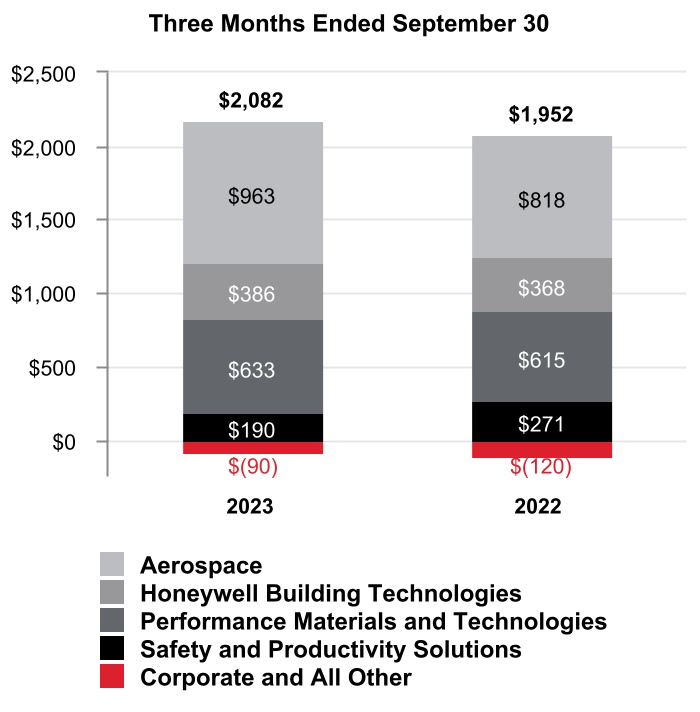
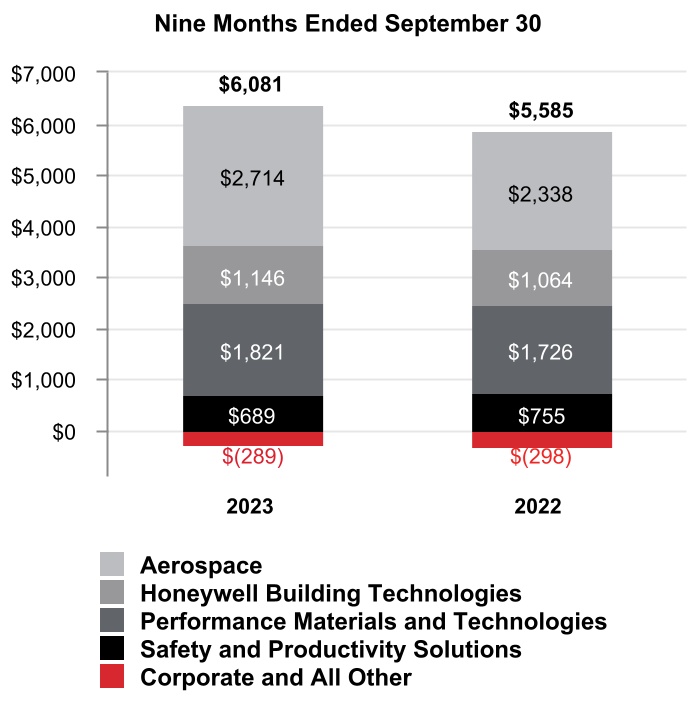
36
Honeywell International Inc.
CONSOLIDATED OPERATING RESULTS
Net Sales
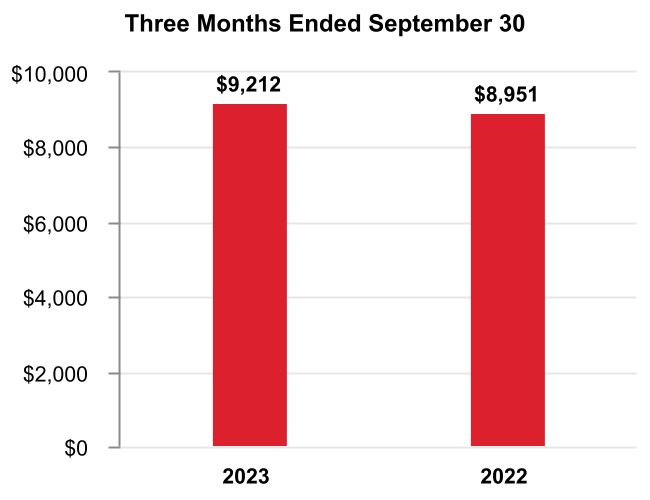
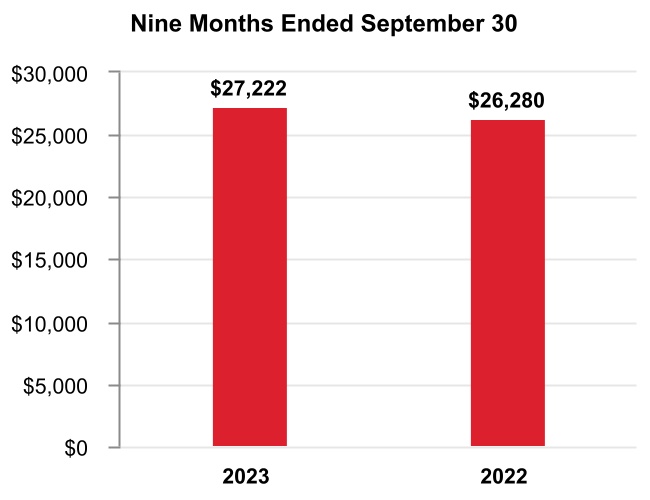
The change in Net sales was attributable to the following:
|
Q3 2023 vs. Q3 2022
|
Year to Date 2023 vs. 2022 | ||||||||||
| Volume | (1)% | 1% | |||||||||
| Price | 3% | 4% | |||||||||
| Foreign currency translation | —% | (1)% | |||||||||
| Acquisitions, divestitures, and other, net | 1% | —% | |||||||||
| Total % change in Net sales | 3% | 4% | |||||||||
A discussion of Net sales by reportable business segment can be found in the Review of Business Segments section of this Management's Discussion and Analysis.
Q3 2023 compared with Q3 2022
Net sales increased due to the following:
•
Increased pricing, and
•
The acquisition of Compressor Controls Corporation during the second quarter 2023,
•
Partially offset by lower sales volumes.
YTD 2023 compared with YTD 2022
Net sales increased due to the following:
•
Increased pricing, and
•
Higher sales volumes,
•
Partially offset by the unfavorable impact of foreign currency translation, driven by the strengthening of the U.S. Dollar against the currencies in certain of our international markets, primarily the Chinese Renminbi, Canadian Dollar, Turkish Lira, Egyptian Pound, and Australian Dollar.
37
Honeywell International Inc.
Cost of Products and Services Sold
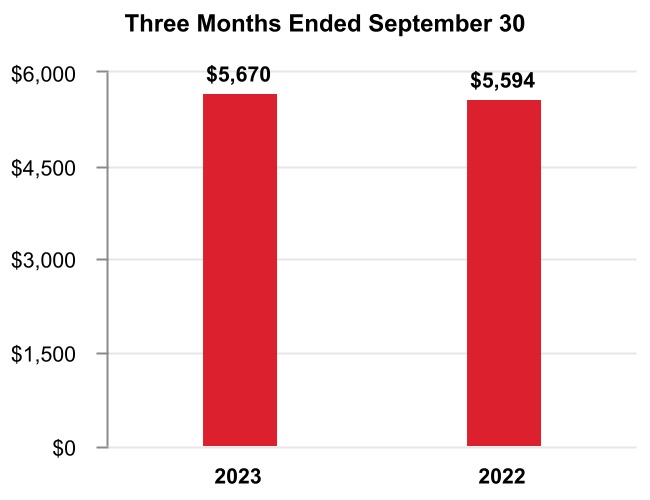
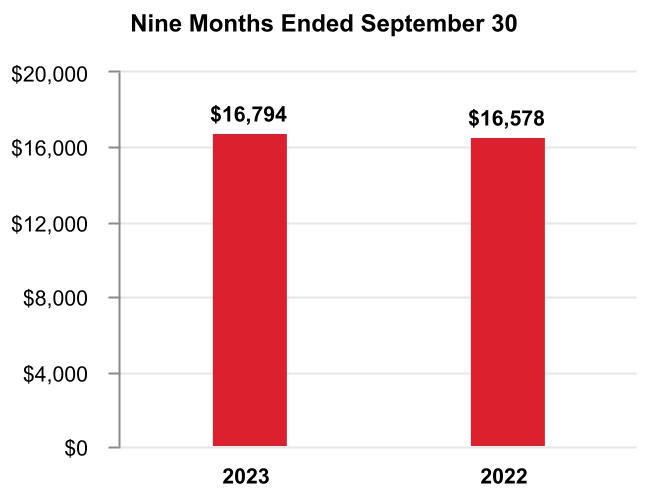
Q3 2023 compared with Q3 2022
Cost of products and services sold increased due to the following:
•
Higher direct and indirect material costs and higher labor costs of approximately $0.2 billion or 4%,
•
Partially offset by higher productivity of approximately $0.1 billion or 2%.
YTD 2023 compared with YTD 2022
Cost of products and services sold increased due to the following:
•
Higher direct and indirect material costs and higher labor costs of approximately $0.6 billion or 4%,
•
Partially offset by lower sales volumes of higher margin products of approximately $0.3 billion or 2%, and lower repositioning and other charges of approximately $0.2 billion or 1%, which included prior year charges attributable to suspending and winding down our businesses and operations in Russia.
Gross Margin


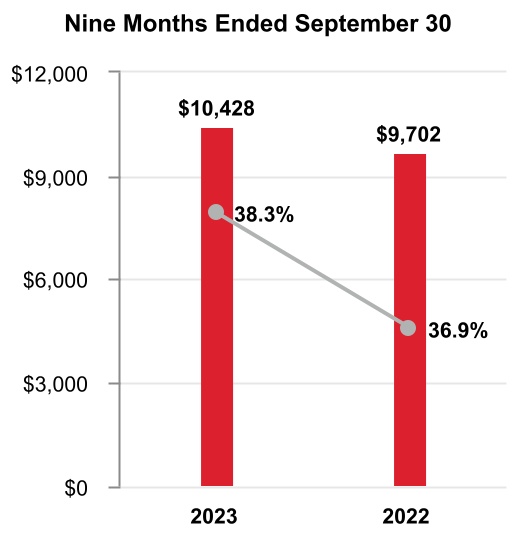
Q3 2023 compared with Q3 2022
Gross margin increased by approximately $0.2 billion and gross margin percentage increased 90 basis points to 38.4% compared to 37.5% for the same period of 2022.
YTD 2023 compared with YTD 2022
Gross margin increased by approximately $0.7 billion and gross margin percentage increased 140 basis points to 38.3% compared to 36.9% for the same period of 2022.
38
Honeywell International Inc.
Research and Development Expenses
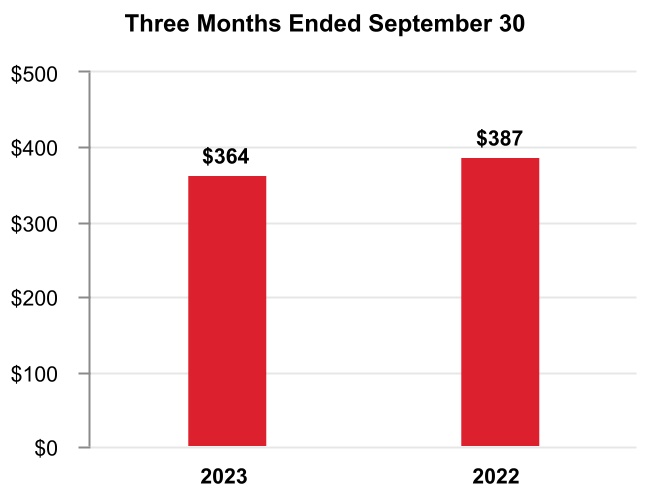

Q3 2023 compared with Q3 2022
Research and development expenses slightly decreased.
YTD 2023 compared with YTD 2022
Research and development expenses were flat.
Selling, General and Administrative Expenses

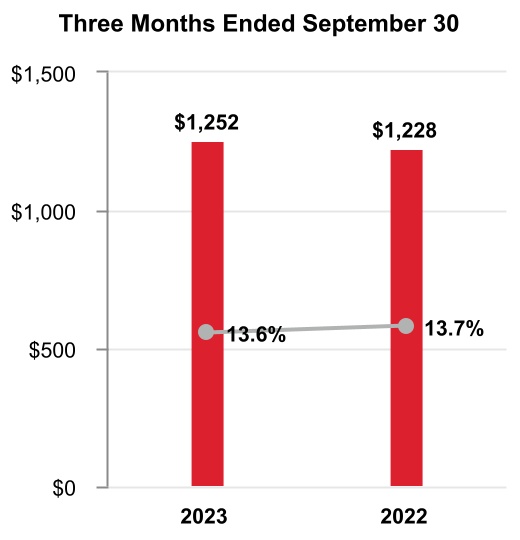
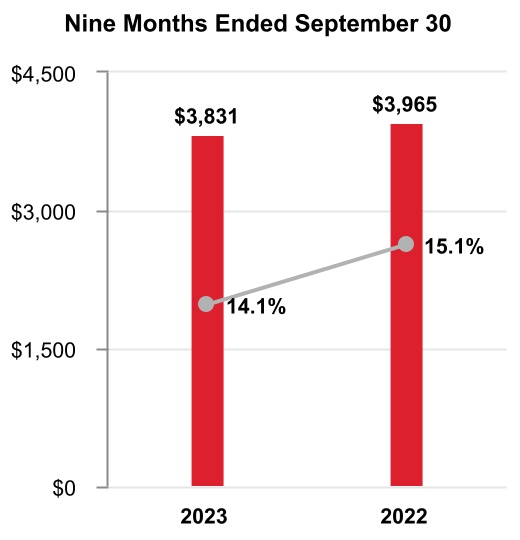
Q3 2023 compared with Q3 2022
Selling, general and administrative expenses increased due to the following:
•
Higher labor costs of approximately $0.1 billion or 8%,
•
Partially offset by higher productivity of approximately $0.1 billion or 8%.
YTD 2023 compared to YTD 2022
Selling, general and administrative expenses decreased due to the following:
•
Lower repositioning and other charges of approximately $0.1 billion or 3%, which included prior year charges attributable to suspending and winding down our businesses and operations in Russia, and
•
Higher productivity of approximately $0.1 billion or 3%,
•
Partially offset by higher labor costs of approximately $0.1 billion or 3%.
39
Honeywell International Inc.
Other (Income) Expense
| Three Months Ended September 30, | Nine Months Ended September 30, | ||||||||||||||||||||||
| 2023 | 2022 | 2023 | 2022 | ||||||||||||||||||||
| Other (income) expense | $ | (247) | $ | (337) | $ | (715) | $ | (846) | |||||||||||||||
Q3 2023 compared with Q3 2022
Other income decreased due to the following:
•
Lower pension and other postretirement income.
YTD 2023 compared with YTD 2022
Other income decreased due to the following:
•
Lower pension and other postretirement income of approximately $0.4 billion,
•
Partially offset by higher interest income of approximately $0.2 billion and prior year charges attributable to suspending and winding down our businesses and operations in Russia and UOP Matters of approximately $0.1 billion.
Tax Expense
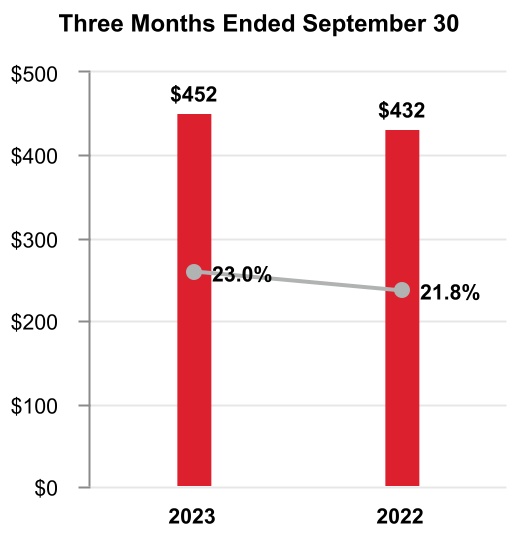
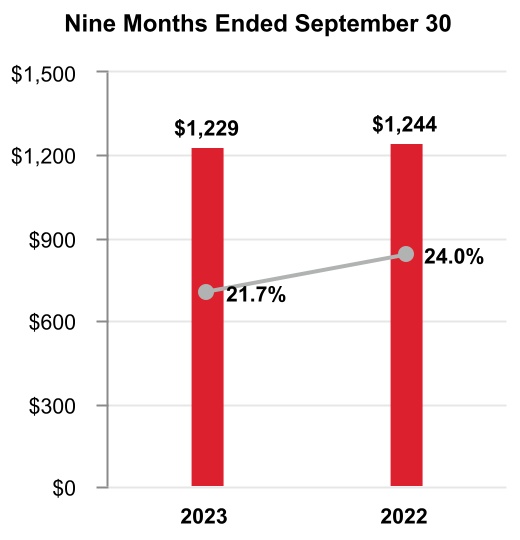
Q3 2023 compared with Q3 2022
The effective tax rate increased due to lower benefits resulting from the resolution of foreign tax matters, increased valuation allowance expense, and other accrued tax expense, partially offset by benefits of taxes on non-U.S. earnings representing an aggregate 120 basis point increase.
YTD 2023 compared with YTD 2022
The effective tax rate decreased due to benefits of taxes on non-U.S. earnings and lower repositioning related expenses, partially offset by other accrued taxes representing an aggregate 230 basis point decrease.
40
Honeywell International Inc.
Net Income Attributable to Honeywell
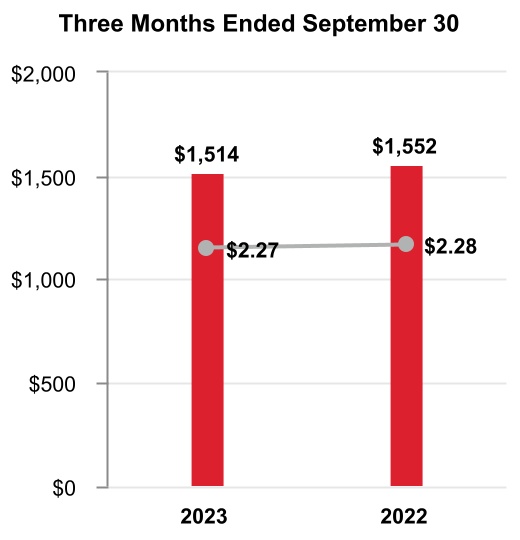
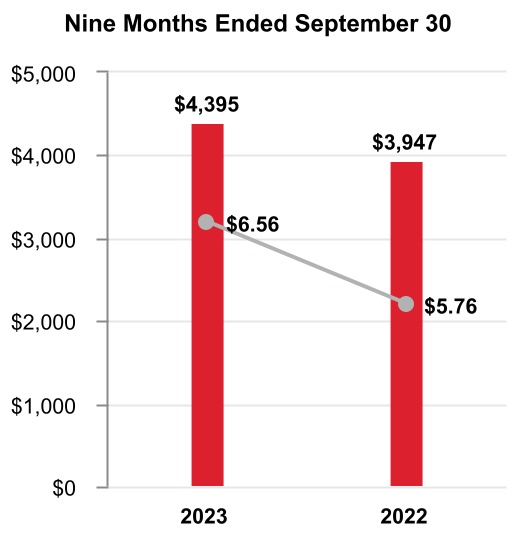
Q3 2023 compared to Q3 2022
Earnings per share of common stock–assuming dilution decreased due to the following:
•
Lower pension and other postretirement income which impacted earnings per share by $0.14 after tax, and
•
Higher interest expense which impacted earnings per share by $0.13 after tax,
•
Partially offset by higher segment profit which impacted earnings per share by $0.15 after tax, higher interest income which impacted earnings per share by $0.06 after tax, and the favorable impact of lower share count which impacted earnings per share by $0.04 after tax.
YTD 2023 compared to YTD 2022
Earnings per share of common stock–assuming dilution increased due to the following:
•
Higher segment profit which impacted earnings per share by $0.55 after tax,
•
Lower repositioning and other charges, including charges attributable to suspending and winding down our businesses and operations in Russia, which impacted earnings per share by $0.53 after tax,
•
Higher interest income which impacted earnings per share by $0.18 after tax,
•
The favorable impact of lower share count which impacted earnings per share by $0.14 after tax, and
•
Partially offset by lower pension and other postretirement income which impacted earnings per share by $0.41 after tax, and higher interest expense which impacted earnings per share by $0.32 after tax.
41
Honeywell International Inc.
REVIEW OF BUSINESS SEGMENTS
We globally manage our business operations through four reportable business segments: Aerospace, Honeywell Building Technologies, Performance Materials and Technologies, and Safety and Productivity Solutions.
AEROSPACE
Net Sales
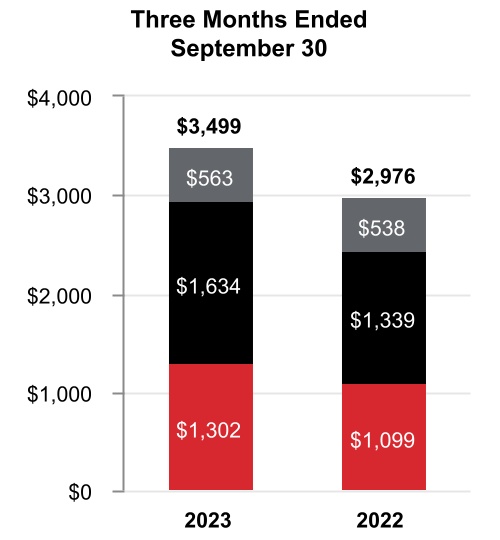

|
Three Months Ended
September 30, |
Nine Months Ended
September 30, |
||||||||||||||||||||||||||||||||||
| 2023 | 2022 |
%
Change |
2023 | 2022 |
%
Change |
||||||||||||||||||||||||||||||
| Net sales | $ | 3,499 | $ | 2,976 | 18 | % | $ | 9,951 | $ | 8,623 | 15 | % | |||||||||||||||||||||||
| Cost of products and services sold | 2,145 | 1,818 | 6,122 | 5,230 | |||||||||||||||||||||||||||||||
| Selling, general and administrative and other expenses | 391 | 340 | 1,115 | 1,055 | |||||||||||||||||||||||||||||||
| Segment profit | $ | 963 | $ | 818 | 18 | % | $ | 2,714 | $ | 2,338 | 16 | % | |||||||||||||||||||||||
|
2023 vs. 2022
|
|||||||||||||||||||||||
|
Three Months Ended
September 30, |
Nine Months Ended
September 30, |
||||||||||||||||||||||
| Factors Contributing to Year-Over-Year Change |
Net
Sales |
Segment
Profit |
Net
Sales |
Segment
Profit |
|||||||||||||||||||
|
Organic
1
|
18 | % | 18 | % | 16 | % | 17 | % | |||||||||||||||
| Foreign currency translation | — | % | — | % | (1) | % | (1) | % | |||||||||||||||
| Acquisitions, divestitures, and other, net | — | % | — | % | — | % | — | % | |||||||||||||||
| Total % change | 18 | % | 18 | % | 15 | % | 16 | % | |||||||||||||||
| 1 |
Organic sales % change, presented for all of our reportable business segments, is defined as the change in Net sales, excluding the impact on sales from foreign currency translation and acquisitions, net of divestitures, for the first 12 months following the transaction date. We believe this non-GAAP measure is useful to investors and management in understanding the ongoing operations and analysis of ongoing operating trends.
|
|||||||
Q3 2023 compared to Q3 2022
Sales increased $523 million due to higher organic sales of $298 million in Commercial Aviation Aftermarket driven by higher sales volumes in air transport due to an increase in flight hours and higher organic sales of $202 million in Defense and Space driven by higher sales volumes due to increased shipments.
Segment profit increased $145 million and segment margin percentage was flat at 27.5% compared to the same period of 2022.
42
Honeywell International Inc.
YTD 2023 compared to YTD 2022
Sales increased $1,328 million due to higher organic sales of $890 million in Commercial Aviation Aftermarket driven by higher sales volumes in air transport due to an increase in flight hours and higher organic sales of $292 million in Defense and Space driven by higher sales volumes due to increased shipments.
Segment profit increased $376 million and segment margin percentage increased 20 basis points to 27.3% compared to 27.1% for the same period of 2022.
HONEYWELL BUILDING TECHNOLOGIES
Net Sales
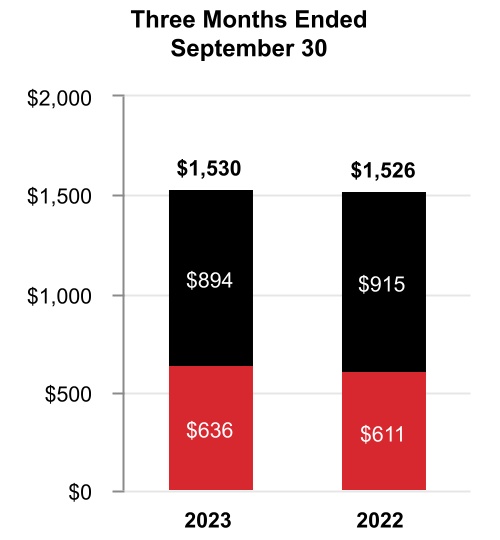
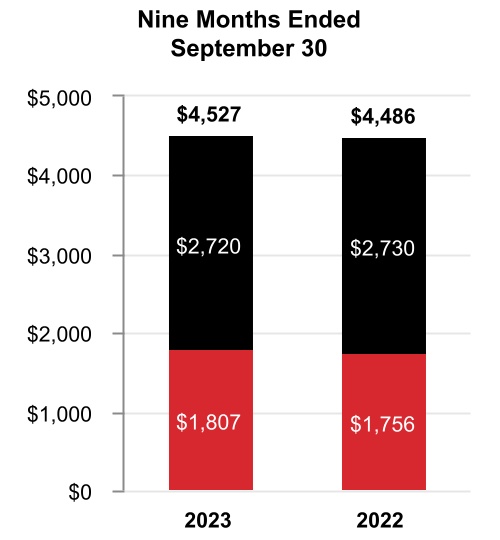
|
Three Months Ended
September 30, |
Nine Months Ended
September 30, |
||||||||||||||||||||||||||||||||||
| 2023 | 2022 |
%
Change |
2023 | 2022 |
%
Change |
||||||||||||||||||||||||||||||
| Net sales | $ | 1,530 | $ | 1,526 | — | % | $ | 4,527 | $ | 4,486 | 1 | % | |||||||||||||||||||||||
| Cost of products and services sold | 829 | 835 | 2,430 | 2,447 | |||||||||||||||||||||||||||||||
| Selling, general and administrative and other expenses | 315 | 323 | 951 | 975 | |||||||||||||||||||||||||||||||
| Segment profit | $ | 386 | $ | 368 | 5 | % | $ | 1,146 | $ | 1,064 | 8 | % | |||||||||||||||||||||||
|
2023 vs. 2022
|
|||||||||||||||||||||||
|
Three Months Ended
September 30, |
Nine Months Ended
September 30, |
||||||||||||||||||||||
| Factors Contributing to Year-Over-Year Change |
Net
Sales |
Segment
Profit |
Net
Sales |
Segment
Profit |
|||||||||||||||||||
| Organic | — | % | 3 | % | 3 | % | 9 | % | |||||||||||||||
| Foreign currency translation | — | % | 2 | % | (2) | % | (1) | % | |||||||||||||||
| Acquisitions, divestitures, and other, net | — | % | — | % | — | % | — | % | |||||||||||||||
| Total % change | — | % | 5 | % | 1 | % | 8 | % | |||||||||||||||
Q3 2023 compared to Q3 2022
Sales were flat due to higher organic sales of $27 million in Building Solutions driven by increased pricing in building projects and services, offset by lower organic sales of $27 million in Products driven by lower sales volumes.
Segment profit increased $18 million and segment margin percentage increased 110 basis points to 25.2% compared to 24.1% for the same period of 2022.
43
Honeywell International Inc.
YTD 2023 compared to YTD 2022
Sales increased $41 million due to higher organic sales o
f $111 million
in Building Solutions driven by increased pricing in building projects and services and higher organic sales of
$25 million
in Products driven by increased pricing, partially offset by the unfavorable impact of foreign currency translation of
$97 million.
Segment profit increased $82 million and segment margin percentage increased 160 basis points to 25.3% compared to 23.7% for the same period of 2022.
PERFORMANCE MATERIALS AND TECHNOLOGIES
Net Sales
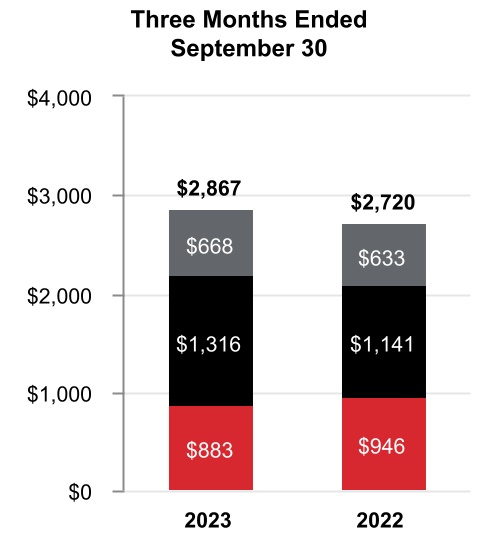
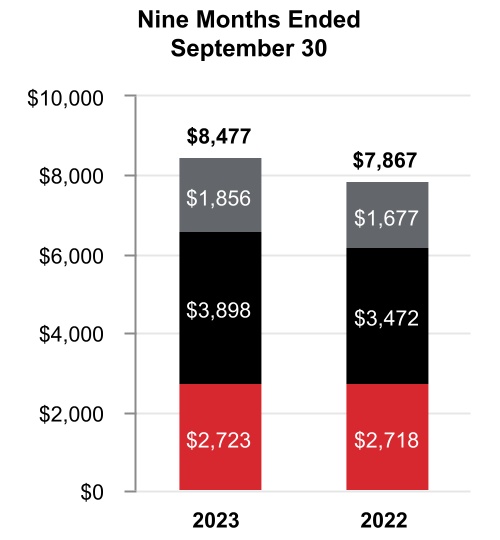
|
Three Months Ended
September 30, |
Nine Months Ended
September 30, |
||||||||||||||||||||||||||||||||||
| 2023 | 2022 |
%
Change |
2023 | 2022 |
%
Change |
||||||||||||||||||||||||||||||
| Net sales | $ | 2,867 | $ | 2,720 | 5 | % | $ | 8,477 | $ | 7,867 | 8 | % | |||||||||||||||||||||||
| Cost of products and services sold | 1,787 | 1,694 | 5,314 | 4,860 | |||||||||||||||||||||||||||||||
| Selling, general and administrative and other expenses | 447 | 411 | 1,342 | 1,281 | |||||||||||||||||||||||||||||||
| Segment profit | $ | 633 | $ | 615 | 3 | % | $ | 1,821 | $ | 1,726 | 6 | % | |||||||||||||||||||||||
|
2023 vs. 2022
|
|||||||||||||||||||||||
|
Three Months Ended
September 30, |
Nine Months Ended
September 30, |
||||||||||||||||||||||
| Factors Contributing to Year-Over-Year Change |
Net
Sales |
Segment
Profit |
Net
Sales |
Segment
Profit |
|||||||||||||||||||
| Organic | 3 | % | 1 | % | 8 | % | 6 | % | |||||||||||||||
| Foreign currency translation | 1 | % | 1 | % | (1) | % | (1) | % | |||||||||||||||
| Acquisitions, divestitures, and other, net | 1 | % | 1 | % | 1 | % | 1 | % | |||||||||||||||
| Total % change | 5 | % | 3 | % | 8 | % | 6 | % | |||||||||||||||
Q3 2023 compared to Q3 2022
Sales increased $147 million due to higher organic sales of
$127 million in Process Solutions driven by increased demand in projects and lifecycle solutions and services and higher organic sales of $37 million in UOP driven by increased pricing, partially offset by lower organic sales of $71 million
in Advanced Materials driven by lower sales volumes.
Segment profit increased $18 million and segment margin percentage decreased 50 basis points to 22.1% compared to 22.6% for the same period of 2022.
44
Honeywell International Inc.
YTD 2023 compared to YTD 2022
Sales increased $610 million due to higher organic sales of $435 million in Process Solutions driven by increased demand in projects and lifecycle solutions and services and higher organic sales of $187 million in UOP driven by growth in gas processing and refining catalyst shipments, partially offset by the unfavorable impact of foreign currency translation of $68 million.
Segment profit increased $95 million and segment margin percentage decreased 40 basis points to 21.5% compared to 21.9% for the same period of 2022.
SAFETY AND PRODUCTIVITY SOLUTIONS
Net Sales
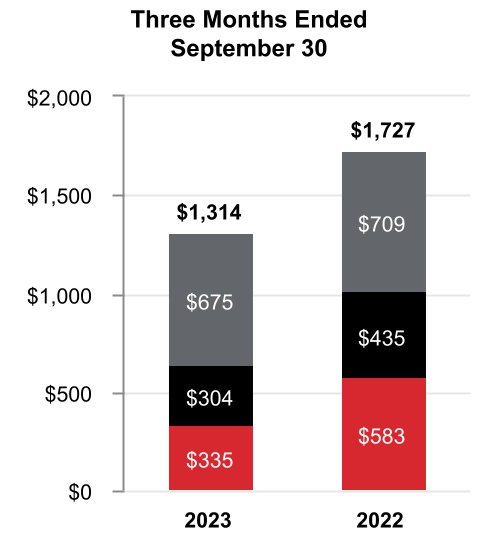
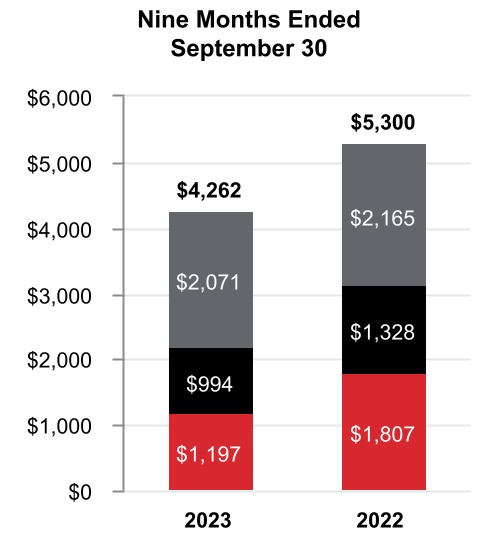
|
Three Months Ended
September 30, |
Nine Months Ended
September 30, |
||||||||||||||||||||||||||||||||||
| 2023 | 2022 |
%
Change |
2023 | 2022 |
%
Change |
||||||||||||||||||||||||||||||
| Net sales | $ | 1,314 | $ | 1,727 | (24) | % | $ | 4,262 | $ | 5,300 | (20) | % | |||||||||||||||||||||||
| Cost of products and services sold | 827 | 1,134 | 2,661 | 3,519 | |||||||||||||||||||||||||||||||
| Selling, general and administrative and other expenses | 297 | 322 | 912 | 1,026 | |||||||||||||||||||||||||||||||
| Segment profit | $ | 190 | $ | 271 | (30) | % | $ | 689 | $ | 755 | (9) | % | |||||||||||||||||||||||
|
2023 vs. 2022
|
|||||||||||||||||||||||
|
Three Months Ended
September 30, |
Nine Months Ended
September 30, |
||||||||||||||||||||||
| Factors Contributing to Year-Over-Year Change |
Net
Sales |
Segment
Profit |
Net
Sales |
Segment
Profit |
|||||||||||||||||||
| Organic | (25) | % | (31) | % | (19) | % | (8) | % | |||||||||||||||
| Foreign currency translation | 1 | % | 1 | % | (1) | % | (1) | % | |||||||||||||||
| Acquisitions, divestitures, and other, net | — | % | — | % | — | % | — | % | |||||||||||||||
| Total % change | (24) | % | (30) | % | (20) | % | (9) | % | |||||||||||||||
Q3 2023 compared to Q3 2022
Sales decreased $413 million due to lower organic sales of $250 million in Warehouse and Workflow Solutions driven by lower demand for projects and lower organic sales of $136 million in Productivity Solutions and Services driven by lower demand for products.
Segment profit decreased $81 million and segment margin percentage decreased 120 basis points to 14.5% compared to 15.7% for the same period in 2022.
45
Honeywell International Inc.
YTD 2023 compared to YTD 2022
Sales decreased $1,038 million due to lower organic sales of $610 million in Warehouse and Workflow Solutions driven by lower demand for projects and lower organic sales of $329 million in Productivity Solutions and Services driven by lower demand for products.
Segment profit decreased $66 million and segment margin percentage increased 200 basis points to 16.2% compared to 14.2% for the same period in 2022.
CORPORATE AND ALL OTHER
Corporate and All Other primarily includes unallocated corporate costs, interest expense on holding-company debt, and the controlling majority-owned interest in Quantinuum. Corporate and All Other is not a separate reportable business segment as segment reporting criteria is not met. The Company continues to monitor the activities in Corporate and All Other to determine the need for further reportable business segment disaggregation.
REPOSITIONING CHARGES
See Note 5 Repositioning and Other Charges of Notes to Consolidated Financial Statements for a discussion of our repositioning actions and related charges incurred in the nine months ended September 30, 2023, and 2022. Cash spending related to our repositioning actions was $218 million in the nine months ended September 30, 2023, and was funded through operating cash flows.
46
Honeywell International Inc.
LIQUIDITY AND CAPITAL RESOURCES
(Dollars in tables in millions)
We manage our businesses to maximize operating cash flows as the primary source of liquidity. Each of our businesses is focused on increasing operating cash flows through revenue growth, margin expansion, and improved working capital turnover. Additional sources of liquidity include U.S. cash balances, and the ability to access non-U.S. cash balances, short-term debt from the commercial paper market, long-term borrowings, committed credit lines, and access to the public debt and equity markets.
CASH
As of September 30, 2023, and December 31, 2022, we held $7.9 billion and $10.1 billion, respectively, of cash and cash equivalents, including our short-term investments. We monitor the third-party depository institutions that hold our cash and cash equivalents on a daily basis. Our emphasis is primarily safety of principal and secondarily maximizing yield of those funds. We diversify our cash and cash equivalents among counterparties to minimize exposure to any one counterparty.
As of September 30, 2023, $5.4 billion of the Company’s cash, cash equivalents, and short-term investments were held by non-U.S. subsidiaries. We do not have material amounts related to any jurisdiction subject to currency control restrictions that impact our ability to access and repatriate such amounts. Under current laws, we do not expect taxes on repatriation or restrictions on amounts held outside of the U.S. to have a material effect on our overall liquidity.
CASH FLOW SUMMARY
Our cash flows from operating, investing, and financing activities, as reflected in the Consolidated Statement of Cash Flows, are summarized as follows:
| Nine Months Ended September 30, | |||||||||||||||||
| 2023 | 2022 | Variance | |||||||||||||||
| Cash and cash equivalents at beginning of period | $ | 9,627 | $ | 10,959 | $ | (1,332) | |||||||||||
| Operating activities | |||||||||||||||||
| Net income attributable to Honeywell | 4,395 | 3,947 | 448 | ||||||||||||||
| Noncash adjustments | 1,112 | 1,202 | (90) | ||||||||||||||
| Changes in working capital | (696) | (1,415) | 719 | ||||||||||||||
| NARCO Buyout payment | (1,325) | — | (1,325) | ||||||||||||||
| Other operating activities | (1,101) | (826) | (275) | ||||||||||||||
| Net cash provided by operating activities | 2,385 | 2,908 | (523) | ||||||||||||||
| Net cash provided by (used for) investing activities | (754) | 540 | (1,294) | ||||||||||||||
| Net cash used for financing activities | (3,427) | (6,609) | 3,182 | ||||||||||||||
| Effect of exchange rate changes on cash and cash equivalents | (61) | (349) | 288 | ||||||||||||||
| Net decrease in cash and cash equivalents | (1,857) | (3,510) | 1,653 | ||||||||||||||
| Cash and cash equivalents at end of period | $ | 7,770 | $ | 7,449 | $ | 321 | |||||||||||
Cash related to operating activities decreased by $523 million driven by the payment pursuant to the North American Refractories Company (NARCO) Amended Buyout Agreement and payment for the settlement of UOP Matters. This was partially offset by cash generated from operations, which included a favorable impact of working capital and the HWI Net Sale Proceeds. The favorable impact of working capital was driven by a $461 million increase in Accounts payable, due to increased material receipts and lower disbursements, and a $316 million decrease in Accounts receivable, due to higher cash receipts. See Note 14 Commitments and Contingencies of Notes to the Consolidated Financial Statements for additional information on the NARCO Amended Buyout Agreement, HWI Net Sale Proceeds, and UOP Matters.
Cash related to investing activities decreased by $1,294 million due to a $561 million decrease in cash receipts from settlements of derivative contracts related to foreign exchange risk management activities, $538 million increase in cash paid for acquisitions, and $409 million cash receipts from Garrett Motion Inc. (Garrett) in 2022, partially offset by $354 million net decrease in investments, as maturing short-term investments were moved into cash deposits.
47
Honeywell International Inc.
Cash related to financing activities increased by $3,182 million due to a $2,983 million increase in proceeds from the issuance of long-term debt, $640 million decrease in repurchases of common stock, and $408 million decrease in payments of long-term debt, partially offset by $743 million decrease in net proceeds from the issuance of commercial paper and $116 million increase in cash dividends paid.
CASH REQUIREMENTS AND ASSESSMENT OF CURRENT LIQUIDITY
In addition to our normal operating cash requirements, we expect our principal future cash requirements will be to fund capital expenditures, share repurchases, dividends, strategic acquisitions, and debt repayments. On April 24, 2023, the Board of Directors authorized the repurchase of up to $10 billion of Honeywell common stock, including approximately $2.1 billion of remaining availability under the previously announced $10 billion share repurchase authorization. During the nine months ended September 30, 2023, we repurchased common stock of $2,187 million. Refer to the section titled Liquidity and Capital Resources of our 2022 Form 10-K for a discussion of our expected capital expenditures, share repurchases, and dividends for 2023.
We continually seek opportunities to improve our liquidity and working capital efficiency, which includes the extension of payment terms with our suppliers and transfer of our trade receivables to unaffiliated financial institutions on a true sale basis. The impact of these programs is not material to our overall liquidity.
We continue to assess the relative strength of each business in our portfolio as to strategic fit, market position, profit, and cash flow contribution in order to identify target investment and acquisition opportunities in order to upgrade our combined portfolio. We identify acquisition candidates that will further our strategic plan and strengthen our existing core businesses. We also identify businesses that do not fit into our long-term strategic plan based on their market position, relative profitability, or growth potential. These businesses are considered for potential divestiture, restructuring, or other repositioning actions, subject to regulatory constraints.
In early 2023, we made payments of approximately $1.5 billion in connection with the NARCO Buyout and UOP Matters. Pursuant to the NARCO Amended Buyout Agreement, we are entitled to receive proceeds related to the HWI Sale. During the nine months ended September 30, 2023, we received proceeds from the HWI Sale in the amount of $275 million. These payments and receipts have not materially impacted our liquidity position. See Note 11 Fair Value Measurements of Notes to Consolidated Financial Statements for additional discussion related to the fair value of future proceeds from the HWI Sale.
Based on past performance and current expectations, we believe that our operating cash flows will be sufficient to meet our future operating cash needs. Our available cash, committed credit lines, and access to the public debt and equity markets provide additional sources of short-term and long-term liquidity to fund current operations, debt maturities, and future investment opportunities.
See Note 8 Long-term Debt and Credit Agreements of Notes to Consolidated Financial Statements for additional discussion of items impacting our liquidity.
BORROWINGS
We leverage a variety of debt instruments to manage our overall borrowing costs. As of September 30, 2023, and December 31, 2022, our total borrowings were $20.3 billion and $19.6 billion, respectively.
| September 30, 2023 | December 31, 2022 | ||||||||||
| Commercial paper | $ | 1,931 | $ | 2,715 | |||||||
| Variable rate notes | 22 | 22 | |||||||||
| Fixed rate notes | 18,677 | 17,086 | |||||||||
| Other | 230 | 267 | |||||||||
| Fair value of hedging instruments | (323) | (287) | |||||||||
|
Debt issuance costs
|
(251) | (233) | |||||||||
| Total borrowings | $ | 20,286 | $ | 19,570 | |||||||
A primary source of liquidity is our ability to access the corporate bond markets. Through these markets, we issue a variety of long-term fixed rate notes, in a variety of currencies, to manage our overall funding costs.
Another primary source of liquidity is our ability to access the commercial paper market. Commercial paper notes are sold at a discount or premium and have a maturity of not more than 365 days from date of issuance. Borrowings under the commercial paper program are available for general corporate purposes as well as for financing acquisitions.
48
Honeywell International Inc.
We also have the following revolving credit agreements:
•
A $1.5 billion 364-day credit agreement (the 364-Day Credit Agreement) with a syndicate of banks, dated as of March 20, 2023. Amounts borrowed under the 364-Day Credit Agreement are required to be repaid no later than March 18, 2024, unless (i) we elect to convert all then outstanding amounts into a term loan, upon which such amounts shall be repaid in full on March 18, 2025, or (ii) the 364-Day Credit Agreement is terminated earlier pursuant to its terms. The 364-Day Credit Agreement replaced the previously reported $1.5 billion 364-day credit agreement dated as of March 24, 2022, which was terminated in accordance with its terms effective March 20, 2023. As of September 30, 2023, there were no outstanding borrowings under our 364-Day Credit Agreement.
•
A $4.0 billion five-year credit agreement (the 5-Year Credit Agreement) with a syndicate of banks, dated as of March 20, 2023. Commitments under the 5-Year Credit Agreement can be increased pursuant to the terms of the 5-Year Credit Agreement to an aggregate amount not to exceed $4.5 billion. The 5-Year Credit Agreement amended and restated the previously reported $4.0 billion amended and restated five-year credit agreement dated as of March 24, 2022. As of September 30, 2023, there were no outstanding borrowings under our 5-Year Credit Agreement.
We also have a current shelf registration statement filed with the Securities and Exchange Commission (SEC) under which we may issue additional debt securities, common stock, and preferred stock that may be offered in one or more offerings on terms to be determined at the time of the offering. We anticipate that net proceeds of any offering would be used for general corporate purposes, including repayment of existing indebtedness, share repurchases, capital expenditures, and acquisitions.
CREDIT RATINGS
Our ability to access the global debt capital markets and the related cost of these borrowings is affected by the strength of our credit rating and market conditions. Our credit ratings are periodically reviewed by the major independent debt-rating agencies. As of September 30, 2023, S&P Global Inc. (S&P), Fitch Ratings Inc. (Fitch), and Moody’s Investor Service (Moody's) have ratings on our debt set forth in the table below:
| S&P | Fitch | Moody's | |||||||||||||||
| Outlook | Stable | Stable | Positive | ||||||||||||||
| Short-term | A-1 | F1 | P1 | ||||||||||||||
| Long-term | A | A | A2 | ||||||||||||||
On September 20, 2023, Moody's affirmed all credit ratings of the Company and revised their credit rating outlook from stable to positive.
OTHER MATTERS
LITIGATION
We are subject to a number of lawsuits, investigations, and claims (some of which involve substantial amounts) arising out of the conduct of our business. See Note 14 Commitments and Contingencies of Notes to Consolidated Financial Statements for further discussion of environmental, asbestos, and other litigation matters.
CRITICAL ACCOUNTING ESTIMATES
There have been no material changes to our Critical Accounting Estimates presented in our 2022 Annual Report on Form 10-K. For a discussion of the Company’s Critical Accounting Estimates, see the section titled Critical Accounting Estimates in our 2022 Annual Report on Form 10-K.
RECENT ACCOUNTING PRONOUNCEMENTS
See Note 2 Summary of Significant Accounting Policies of Notes to Consolidated Financial Statements for a discussion of recent accounting pronouncements.
49
Honeywell International Inc.
ITEM 3. QUANTITATIVE AND QUALITATIVE DISCLOSURES ABOUT MARKET RISKS
For a discussion of the Company’s quantitative and qualitative disclosures about market risks, see the section titled Quantitative and Qualitative Disclosures About Market Risks in our 2022 Annual Report on Form 10-K. As of September 30, 2023, there has been no material change in this information.
ITEM 4. CONTROLS AND PROCEDURES
Honeywell management, including the Chief Executive Officer and Chief Financial Officer, conducted an evaluation of the effectiveness of our disclosure controls and procedures (as defined in Rules 13a-15(e) or 15d-15(e) promulgated under the Securities Exchange Act of 1934, as amended (Exchange Act)) as of the end of the period covered by this Quarterly Report on Form 10-Q. Based upon that evaluation, the Chief Executive Officer and the Chief Financial Officer concluded that such disclosure controls and procedures were effective as of the end of the period covered by this Quarterly Report on Form 10-Q to ensure information required to be disclosed in the reports that Honeywell files or submits under the Exchange Act is recorded, processed, summarized, and reported within the time periods specified in the SEC's rules and forms, and that it is accumulated and communicated to our management, including our Chief Executive Officer, our Chief Financial Officer, and our Controller, as appropriate, to allow timely decisions regarding required disclosure. There were no changes that materially affected, or are reasonably likely to materially affect, Honeywell’s internal control over financial reporting that occurred during the period covered by this Quarterly Report on Form 10-Q.
50
Honeywell International Inc.
PART II. OTHER INFORMATION
ITEM 1. LEGAL PROCEEDINGS
We are subject to a number of lawsuits, investigations, and claims (some of which involve substantial amounts) arising out of the conduct of our business. See a discussion of environmental, asbestos, and other litigation matters in
Note
14
Commitments and Contingencies of Notes to Consolidated Financial Statements
.
There were no matters requiring disclosure pursuant to the requirement to disclose certain environmental matters involving potential monetary sanctions in excess of $300,000.
ITEM 1A. RISK FACTORS
There have been no material changes to our Risk Factors presented in our 2022 Annual Report on Form 10-K under the section titled Risk Factors. For further discussion of our Risk Factors, refer to the section titled Risk Factors in our 2022 Annual Report on Form 10-K.
ITEM 2. UNREGISTERED SALES OF EQUITY SECURITIES, USE OF PROCEEDS, AND ISSUER PURCHASES OF EQUITY SECURITIES
On April 24, 2023, the Board of Directors authorized the repurchase of up to $10 billion of Honeywell common stock, including approximately $2.1 billion of remaining availability under the previously announced $10 billion share repurchase authorization. The repurchase authorization does not have an expiration date and may be amended or terminated by the Board of Directors at any time without prior notice.
Repurchases may be made through a variety of methods, which could include open market purchases, accelerated share repurchase transactions, negotiated block transactions, 10b5-1 plans, other transactions that may be structured through investment banking institutions or privately negotiated, or a combination of the foregoing. Honeywell presently expects to repurchase outstanding shares from time to time (i) to offset the dilutive impact of employee stock-based compensation plans, including option exercises, restricted unit vesting, and matching contributions under our savings plans, and (ii) to reduce share count via share repurchases as and when attractive opportunities arise. The amount and timing of future repurchases may vary depending on market conditions and the level of operating, financing, and other investing activities.
During the quarter ended September 30, 2023, Honeywell purchased 5,267,030 shares of its common stock, par value $1 per share. As of September 30, 2023, $8.6 billion remained available for additional share repurchases. The following table summarizes our purchases of Honeywell's common stock for the quarter ended September 30, 2023:
| Issuer Purchases of Equity Securities | ||||||||||||||
| Period |
Total
Number of Shares Purchased |
Average
Price Paid per Share |
Total Number
of Shares Purchased as Part of Publicly Announced Plans or Programs |
Approximate Dollar
Value of Shares that May Yet Be Purchased Under Plans or Programs (Dollars in millions) |
||||||||||
| July 1-31, 2023 | 733,713 | $207.14 | 733,713 | $9,490 | ||||||||||
| August 1-31, 2023 | 2,631,818 | $189.40 | 2,631,818 | $8,992 | ||||||||||
| September 1-30, 2023 | 1,901,499 | $189.30 | 1,901,499 | $8,632 | ||||||||||
51
Honeywell International Inc.
ITEM 4. MINE SAFETY DISCLOSURES
One of our wholly-owned subsidiaries has a placer claim for and operates a chabazite ore surface mine in Arizona. Information concerning mine safety and other regulatory matters associated with this mine is required by Section 1503(a) of the Dodd-Frank Wall Street Reform and Consumer Protection Act and Item 104 of Regulation S-K and is included in Exhibit 95 to this quarterly report.
ITEM 5. OTHER INFORMATION
EQUITY TRADING PLAN ELECTIONS
Certain executive officers and directors of the Company may execute purchases and sales of the Company's common stock through Rule 10b5-1 and non-Rule 10b5-1 equity trading plans.
During the three months ended September 30, 2023, none of our executive officers or directors
adopted
,
terminated,
or modified a Rule 10b5-1 equity trading plan, or
adopted
,
terminated
, or modified any "non-Rule 10b5-1 trading arrangement" (as defined in Item 408(c) of Regulation S-K).
52
Honeywell International Inc.
ITEM 6. EXHIBITS
| Exhibit No. | Description | |||||||
| 31.1 | ||||||||
| 31.2 | ||||||||
| 32.1 | ||||||||
| 32.2 | ||||||||
| 95 | ||||||||
| 101.INS | Inline XBRL Instance Document (the instance document does not appear in the Interactive Data File because its XBRL tags are embedded within the Inline XBRL document) | |||||||
| 101.SCH | Inline XBRL Taxonomy Extension Schema (filed herewith) | |||||||
| 101.CAL | Inline XBRL Taxonomy Extension Calculation Linkbase (filed herewith) | |||||||
| 101.DEF | Inline XBRL Taxonomy Extension Definition Linkbase (filed herewith) | |||||||
| 101.LAB | Inline XBRL Taxonomy Extension Label Linkbase (filed herewith) | |||||||
| 101.PRE | Inline XBRL Taxonomy Extension Presentation Linkbase (filed herewith) | |||||||
| 104 | Cover Page Interactive Data File (formatted as inline XBRL and contained in Exhibit 101) | |||||||
53
Honeywell International Inc.
SIGNATURES
Pursuant to the requirements of the Securities Exchange Act of 1934, the Registrant has duly caused this report to be signed on its behalf by the undersigned thereunto duly authorized.
| HONEYWELL INTERNATIONAL INC. | ||||||||
| Date: October 26, 2023 | By: | /s/ Robert D. Mailloux | ||||||
|
Robert D. Mailloux
Vice President and Controller (on behalf of the Registrant and as the Registrant’s Principal Accounting Officer) |
||||||||
54
Honeywell International Inc.
TABLE OF CONTENTS
Part I. Financial InformationprintNote 1. Basis Of PresentationprintNote 2. Summary Of Significant Accounting PoliciesprintNote 3. Acquisitions and DivestituresprintNote 4. Revenue Recognition and Contracts with CustomersprintNote 5. Repositioning and Other ChargesprintNote 6. Income TaxesprintNote 7. InventoriesprintNote 8. Long-term Debt and Credit AgreementsprintNote 9. LeasesprintNote 10. Derivative Instruments and Hedging TransactionsprintNote 11. Fair Value MeasurementsprintNote 12. Earnings Per ShareprintNote 13. Accumulated Other Comprehensive Income (loss)printNote 14. Commitments and ContingenciesprintNote 15. Pension BenefitsprintNote 16. Other (income) ExpenseprintNote 17. Segment Financial DataprintNote 18. Subsequent EventsprintItem 2. Management's Discussion and Analysis Of Financial Condition and Results Of OperationsprintItem 3. Quantitative and Qualitative Disclosures About Market RisksprintItem 4. Controls and ProceduresprintPart II. Other InformationprintItem 1. Legal ProceedingsprintItem 1A. Risk FactorsprintItem 2. Unregistered Sales Of Equity Securities, Use Of Proceeds, and Issuer Purchases Of Equity SecuritiesprintItem 4. Mine Safety DisclosuresprintItem 5. Other InformationprintItem 6. Exhibitsprint