HOPE BANCORP INC
10-Ks and 10-Qs
|
|
|
|
|
|
|
|
|
|
|
|
|
|
|
|
|
|
|
|
|
|
|
|
|
|
|
|
|
|
|
|
|
|
|
|
|
|
|
|
|
|
|
|
|
|
|
UNITED STATES
SECURITIES AND EXCHANGE COMMISSION
WASHINGTON, D.C. 20549
_______________________________
FORM 10-K
_______________________________
|
ANNUAL REPORT PURSUANT TO SECTION 13 OR 15(d) OF
THE SECURITIES EXCHANGE ACT OF 1934
|
For the fiscal year ended December 31, 2018
Commission File Number 000-50245
________________________________________
HOPE BANCORP, INC.
(Exact name of registrant as specified in its charter)
_________________________________________
|
Delaware
|
95-4849715
|
|
(State or other jurisdiction of incorporation or organization)
|
(I.R.S. Employer Identification No.)
|
|
3200 Wilshire Boulevard, Suite 1400,
Los Angeles, California
|
90010
|
|
(Address of principal executive offices)
|
(Zip Code)
|
(213) 639-1700
(Registrant’s telephone number, including area code)
Securities registered pursuant to Section 12(b) of the Act:
|
Title of class
|
Name of exchange on which registered
|
|
Common Stock, par value $0.001 per share
|
NASDAQ Global Select Market
|
Securities registered pursuant to Section 12(g) of the Act: None
_________________________________________________
Indicate by check mark if the registrant is a well-known seasoned issuer, as defined in Rule 405 of the Securities Act.
Yes
x
No
o
Indicate by check mark if the registrant is not required to file reports pursuant to Section 13 or Section 15(d) of the Act. Yes
o
No
x
Indicate by check mark whether the Registrant (1) has filed all reports required to be filed by Section 13 or 15(d) of the Securities Exchange Act of 1934 during the preceding 12 months (or for such shorter period that the Registrant was required to file such reports), and (2) has been subject to such filing requirements for the past 90 days. Yes
x
No
o
Indicate by check mark whether the registrant has submitted electronically every Interactive Data File required to be submitted pursuant to Rule 405 of Regulation S-T (§232.405 of this chapter) during the preceding 12 months (or for such shorter period that the registrant was required to submit and post such files).
x
Yes
o
No
Indicate by check mark if disclosure of delinquent filers pursuant to Item 405 of Regulation S-K (§229.405 of this chapter) is not contained herein, and will not be contained, to the best of registrant’s knowledge, in definitive proxy or information statements incorporated by reference in Part III of this Form 10-K or any amendment to this Form 10-K
x
Indicate by check mark whether the registrant is a large accelerated filer, an accelerated filer, a non-accelerated filer, smaller reporting company, or an emerging growth company. See definition of “large accelerated filer,” “accelerated filer,” “smaller reporting company,” and “emerging growth company” in Rule 12b-2 of the Exchange Act.
|
Large accelerated filer
|
x
|
Accelerated filer
|
o
|
|
|
Non-accelerated filer
|
o
|
(Do not check if a smaller reporting company)
|
Smaller reporting company
|
o
|
|
Emerging growth company
|
o
|
|||
If an emerging growth company, indicate by check mark if the registrant has elected not to use the extended transition period for complying with any new or revised financial accounting standards provided pursuant to Section 13(a) of the Exchange Act.
o
Indicate by check mark whether the registrant is a shell company (as defined in Rule 12b-2 of the Act). Yes
o
No
x
The aggregate market value of the common stock held by non-affiliates of the registrant based upon the closing sale price of the common stock as of the last business day of the registrant’s most recently completed second fiscal quarter, June 30, 2018, as reported on the NASDAQ Global Select Market, was approximately $
2,228,005,491
.
Number of shares outstanding of the registrant’s common stock as of
February 25, 2019
:
126,642,148
Documents Incorporated by Reference: The information required in Part III, Items 10 through 14 is incorporated herein by reference to the registrant’s definitive proxy statement for the 2019 annual meeting of stockholders which will be filed with the Securities and Exchange Commission within 120 days of the registrant’s fiscal year end.
Table of Contents
|
Page
|
||
|
Forward-Looking Information
|
||
|
PART I
|
||
|
Item 1.
|
Business
|
|
|
General
|
||
|
Mergers and Acquisitions
|
||
|
Business Overview
|
||
|
Lending Activities
|
||
|
Investing Activities
|
||
|
Deposit Activities
|
||
|
Borrowing Activities
|
||
|
Market Area and Competition
|
||
|
Economic Conditions, Government Policies and Legislation
|
||
|
Supervision and Regulation
|
||
|
Employees
|
||
|
Item 1A.
|
Risk Factors
|
|
|
Item 1B.
|
Unresolved Staff Comments
|
|
|
Item 2.
|
Properties
|
|
|
Item 3.
|
Legal Proceedings
|
|
|
Item 4.
|
Mine Safety Disclosures
|
|
|
PART II
|
||
|
Item 5.
|
Market for Registrant’s Common Equity, Related Stockholder Matters and Issuer Purchases of Equity Securities
|
|
|
Item 6.
|
Selected Financial Data
|
|
|
Item 7.
|
Management’s Discussion and Analysis of Financial Condition and Results of Operations
|
|
|
Item 7A.
|
Quantitative and Qualitative Disclosures about Market Risk
|
|
|
Item 8.
|
Financial Statements and Supplementary Data
|
|
|
Item 9.
|
Changes in and Disagreements with Accountants on Accounting and Financial Disclosure
|
|
|
Item 9A.
|
Controls and Procedures
|
|
|
Item 9B.
|
Other Information
|
|
|
PART III
|
||
|
Item 10.
|
Directors, Executive Officers and Corporate Governance
|
|
|
Item 11.
|
Executive Compensation
|
|
|
Item 12.
|
Security Ownership of Certain Beneficial Owners and Management and Related Stockholder Matters
|
|
|
Item 13.
|
Certain Relationships and Related Transactions, and Director Independence
|
|
|
Item 14.
|
Principal Accountant Fees and Services
|
|
|
PART IV
|
||
|
Item 15.
|
Exhibits and Financial Statement Schedules
|
|
|
Item 16.
|
Form 10-K Summary
|
|
2
Forward-Looking Information
Certain statements in this Annual Report on Form 10-K constitute forward-looking statements within the meaning of Section 27A of the Securities Act of 1933, as amended (the “Securities Act”) and Section 21E of the Securities Exchange Act of 1934, as amended (the “Exchange Act”). These forward-looking statements relate to, among other things, expectations regarding the business environment in which we operate, projections of future performance, and our business strategies, objectives and vision. Forward-looking statements include, but are not limited to, statements preceded by, followed by or that include the words “will,” “believes,” “expects,” “anticipates,” “intends,” “plans,” “estimates,” “may” or similar expressions. With respect to any such forward-looking statements Hope Bancorp, Inc. claims the protection provided for in the Private Securities Litigation Reform Act of 1995. These statements involve risks and uncertainties. Our actual results, performance or achievements may differ significantly from the results, performance or achievements expressed or implied in any forward-looking statements. The risks and uncertainties include: deterioration in economic conditions in our areas of operation; interest rate risk associated with volatile interest rates and related asset-liability matching risk; liquidity risks; risk of significant non-earning assets, and net credit losses that could occur, particularly in times of weak economic conditions or times of rising interest rates; and regulatory risks associated with current and future regulations. For a more detailed discussion of factors that might cause such a difference, see Item 1A, “Risk Factors” herein. Hope Bancorp, Inc. does not undertake, and specifically disclaims any obligation, to update any forward looking statements to reflect the occurrence of events or circumstances after the date of such statements except as required by law.
PART I
Item 1.
BUSINESS
General
Hope Bancorp, Inc. (“Hope Bancorp” on a parent-only basis, and the “Company,” “we” or “our” on a consolidated basis with the Bank of Hope) is a bank holding company headquartered in Los Angeles, California. The Company was incorporated in Delaware in the year 2000. Previously known as BBCN Bancorp Inc., the Company changed its name to Hope Bancorp at the time of the merger with Wilshire Bancorp Inc. (“Wilshire”) on July 29, 2016. We offer commercial and retail banking loan and deposit products through our wholly-owned subsidiary, Bank of Hope (formerly BBCN Bank), a California state-chartered bank (the “Bank” or “Bank of Hope”). The Bank primarily focuses its business in ethnic communities in California, New Jersey and New York City, Chicago, Houston, Dallas, Seattle and Washington, D.C. metropolitan areas. Our headquarters are located at 3200 Wilshire Boulevard, Suite 1400, Los Angeles, California 90010, and our telephone number at that address is (213) 639-1700.
Hope Bancorp exists primarily for the purpose of holding the stock of the Bank and other subsidiaries it may acquire or establish. Bank of Hope’s deposits are insured by the Federal Deposit Insurance Corporation (the “FDIC”), up to applicable limits.
We file reports with the Securities and Exchange Commission (the “SEC”), which include annual reports on Form 10-K, quarterly reports on Form 10-Q and current reports on Form 8-K, as well as proxy and information statements in connection with our stockholders’ meetings. The SEC maintains a website that contains the reports, proxy and information statements and other information regarding issuers that file electronically with the SEC. The address of the website is www.sec.gov. Our website address is www.bankofhope.com. Electronic copies of our annual reports on Form 10-K, quarterly reports on Form 10-Q, current reports on Form 8-K, and other information and reports we file with the SEC and amendments to those reports, are available free of charge by visiting the Investor Relations section of our website. These reports are generally posted as soon as reasonably practicable after they are electronically filed with the SEC. None of the information on or hyperlinked from the Company’s website is incorporated into this Annual Report on Form 10-K.
Mergers and Acquisitions
On July 29, 2016, we completed the acquisition of Wilshire, previously headquartered in Los Angeles, California. With the completion of the acquisition, 35 branches in California, New York, New Jersey, Texas, Alabama, and Georgia were added to our existing branch network in addition to six loan production offices. Some of these branch locations and loan production offices were subsequently closed as part of our consolidation plan. Our current consolidated network consists of 63 branches and 11 loan production offices.
The Wilshire acquisition was accounted for in accordance with Accounting Standard Codification (“ASC”) 805 “Business Combinations,” and the assets and liabilities of Wilshire were recorded at fair value at the date of acquisition. The fair value of assets acquired from Wilshire totaled approximately $4.63 billion and goodwill recorded from acquisitions consummated in 2016 totaled $359.0 million.
3
Business Overview
Our principal business activities are conducted through the Bank and primarily consist of earning interest on loans and investment securities that are primarily funded by customer deposits and other borrowings. Operating revenues consist of the difference between interest received and interest paid, gains and losses on the sale of financial assets, and fees earned for financial services provided to our customers. Interest rates are highly sensitive to many factors that are beyond our control, such as general economic conditions, new legislation and the policies of various governmental and regulatory authorities. Although our business may vary with local and national economic conditions, such variations are not generally seasonal in nature.
Through our current network of 63 branches and 11 loan production offices, we offer core business banking products for small and medium-sized businesses and individuals. We accept deposits and originate a variety of loans, including commercial business loans, commercial real estate loans, trade finance loans, Small Business Administration (“SBA”) loans, auto loans, single-family mortgages, warehouse lines of credit, personal loans, and credit cards. We offer cash management services to our business customers, which include remote deposit capture, lock box, and ACH origination services. We offer comprehensive investment and wealth management services to high-net-worth clients. We also offer a mobile banking application for smart devices that extends access to banking services, such as mobile deposits and bill payment, for our customers at all times. In an effort to better meet our customers’ needs, our mini-market branches generally offer hours from 9 a.m. to 6 p.m. Most of our branches offer 24-hour automated teller machines (“ATMs”). We also offer debit card services to all customers. In addition, most of our branches offer foreign exchanges services, safe deposit boxes, and other customary bank services. Our website at www.bankofhope.com offers internet banking services and applications in both English and Korean.
Lending Activities
Commercial Business Loans
We provide commercial loans to businesses for various purposes such as for working capital, purchasing inventory, debt refinancing, business acquisitions, and other business related financing needs. Commercial loans are typically classified as (1) short-term loans (or lines of credit) or (2) long-term loans (or term loans to businesses). Short-term loans are often used to finance current assets such as inventory and accounts receivable and typically have terms of one year with interest paid monthly on the outstanding balance with the principal balance due at maturity. Long-term loans typically have terms of five to seven years with principal and interest paid monthly. The credit worthiness of our borrowers is determined before a loan is originated and is periodically reviewed to ascertain whether credit quality changes have occurred. Commercial business loans are typically collateralized by the borrower’s business assets and/or real estate. We seek to establish deposit relationships with all of our commercial business loan customers.
Our commercial business loan portfolio includes trade finance loans from our Corporate Banking Center, which generally serves businesses involved in international trade activities. These loans are typically collateralized by business assets and are used to meet the short-term working capital needs (accounts receivable and inventory financing) of our borrowers. Our International Operations Department issues and advises on letters of credit for export and import businesses. The underwriting procedure for this type of credit is the same as for commercial business loans. We offer the following types of letters of credit to customers:
|
•
|
Commercial: An undertaking by the issuing bank to pay for a commercial transaction.
|
|
•
|
Standby: An undertaking by the issuing bank to pay for the non-performance of the applicant customer.
|
|
•
|
Revocable: Letter of credit that can be modified or cancelled by the issuing bank at any time with notice to the beneficiary (does not provide the beneficiary with a firm promise of payment).
|
|
•
|
Irrevocable: Letter of credit that cannot be altered or cancelled without mutual consent of all parties.
|
|
•
|
Sight: Letter of credit requiring payment upon presentation of conforming shipping documents.
|
|
•
|
Usance: Letter of credit that allows the buyer to delay payment up to a designated number of days after presentation of shipping documents.
|
|
•
|
Import: Letter of credit issued to assist customers in purchasing goods from overseas.
|
|
•
|
Export: Letter of credit issued to assist customers in selling goods overseas.
|
|
•
|
Transferable: Letter of credit that allows the beneficiary to transfer its drawing (payment) rights, in part or full, to another.
|
|
•
|
Non-transferable: Letter of credit that does not allow the beneficiary to transfer their right, in part or full, to another.
|
4
Our trade finance services include the issuance and negotiation of letters of credit, as well as the handling of documentary collections. On the export side, we provide advice and negotiation of commercial letters of credit and we transfer and issue back-to-back letters of credit. We also provide importers with trade finance lines of credit, which allow for the issuance of commercial letters of credit and the financing of documents received under such letters of credit, as well as documents received under documentary collections. Exporters are assisted through export lines of credit as well as through immediate financing of clean documents presented under export letters of credit.
We provide commercial equipment lease financing through a relationship with a third-party leasing company. Equipment leasing loans are generally capital leases with maturities up to five years.
We also provide warehouse lines of credit to mortgage loan originators. The lines of credit are used by these originators to fund mortgages which are then pledged to the Bank as collateral until the mortgage loans are sold and the lines of credit are paid down. The typical duration of these lines of credit from the time of funding to pay-down ranges from 10-30 days. Although collateralized by mortgage loans, the structure of warehouse lending agreements results in the commercial and industrial loan treatment for these types of loans.
Commercial Real Estate Loans
Real estate loans are extended for the purchase and refinance of commercial real estate and are generally secured by first deeds of trust. The maturities on the majority of such loans are generally five to seven years with a 25-year principal amortization schedule and a balloon payment due at maturity. We offer both fixed and floating rate commercial real estate loans. It is our general policy to restrict commercial real estate loan amounts to 75% of the appraised value of the property at the date of origination.
We originate loans to finance construction projects including one-to-four family residences, multifamily residences, senior housing, and commercial projects. Residential construction loans are due upon the sale of the completed project and are generally collateralized by first liens on the real estate and have floating interest rates. Construction loans are considered to have higher risks than other loans due to the ultimate repayment being sensitive to interest rate changes, governmental regulation of real property, and the availability of long-term financing. Economic conditions may also impact our ability to recover our investment in construction loans. Adverse economic conditions may negatively impact the real estate market, which could affect the borrowers’ ability to complete and sell the project. Additionally, the fair value of the underlying collateral may fluctuate as market conditions change. As construction loans make up only a small percentage of the total loan portfolio, these loans are not further broken down into classes.
Small Business Administration Loans
We extend loans partially guaranteed by the SBA. We primarily extend SBA loans known as SBA 7(a) loans and SBA 504 loans. SBA 7(a) loans are typically extended for working capital needs, purchase of inventory, purchase of machinery and equipment, debt refinance, business acquisitions, start-up financing, or to purchase or construct owner-occupied commercial property. SBA 7(a) loans are typically term loans with maturities up to 10 years for loans not secured by real estate and up to 25 years for real estate secured loans. SBA loans are fully amortizing with monthly payments of principal and interest. SBA 7(a) loans are typically floating rate loans that are secured by business assets and/or real estate. Depending on the loan amount, each loan is typically guaranteed 75% to 85% by the SBA, with a maximum gross loan amount to any one small business borrower of $5.0 million and a maximum SBA guaranteed amount of $3.75 million.
We are generally able to sell the guaranteed portion of the SBA 7(a) loans in the secondary market at a premium, while earning servicing fee income on the sold portion over the remaining life of the loan. In addition to the interest yield earned on the unguaranteed portion of the SBA 7(a) loans that are not sold, we can recognize income from gains on sales and from loan servicing on the SBA 7(a) loans that are sold. Although we have historically sold the guaranteed portion of SBA 7(a) loans that we originated, we recently made the decision to retain these loans due to the decline in premiums offered in the secondary market. Therefore, for the time being, we will be retaining these loans and earn interest income on the guaranteed portion of SBA loans as well the unguaranteed portions.
SBA 504 loans are typically extended for the purpose of purchasing owner-occupied commercial real estate or long-term capital equipment. SBA 504 loans are typically extended for up to 20 years or the life of the asset being financed. SBA 504 loans are financed as a participation loan between the Bank and the SBA through a Certified Development Company (“CDC”). Generally, the loans are structured to give the Bank a 50% first deed of trust (“TD”), the CDC a 40% second TD, and the remaining 10% is funded by the borrower. Interest rates for first TD Bank loans are subject to normal bank commercial rates and terms, and the second TD CDC loans are fixed for the life of the loans based on certain indices.
5
All of our SBA loans are originated through our SBA Loan Departments. The SBA Loan Departments are staffed by loan officers who provide assistance to qualified businesses. The Bank has been designated as an SBA Preferred Lender, which is the highest designation awarded by the SBA. This designation generally facilitates a more efficient marketing and approval process for SBA loans. We have attained SBA Preferred Lender status nationwide.
Consumer Loans
Our consumer loans consist of single-family mortgages, home equity, auto loans, and personal loans, with a majority of our consumer loan portfolio currently consisting of single-family mortgages secured by a first deed of trust on single family residences under a variety of loan products including fixed-rate and adjustable-rate mortgages with either 30-year or 15-year terms. Adjustable rate mortgage loans are also offered with flexible initial and periodic adjustments ranging from five to seven years.
Investing Activities
The main objective of our investment strategy is to provide a source of on-balance sheet liquidity while providing a means to manage our interest rate risk, and to generate an adequate level of interest income without taking undue risks. Subject to various restrictions, our investment policy permits investment in various types of securities, certificates of deposit (“CDs”), and federal funds sold. Our investment portfolio has consisted of government sponsored agency bonds, mortgage-backed securities, collateralized mortgage obligations (“CMOs”), corporate securities, municipal securities, and mutual funds. For a detailed breakdown of our investment portfolio, see Item 7 “Management’s Discussion and Analysis of Financial Condition and Results of Operations – Financial Condition – Investment Security Portfolio.”
Our securities are classified for accounting purposes as available for sale. We do not maintain held to maturity or trading investment portfolios. Securities purchased to meet investment-related objectives, such as liquidity management or interest rate risk and which may be sold as necessary to implement management strategies, are designated as available for sale at the time of purchase.
Deposit Activities
We attract both short-term and long-term deposits from the general public by offering a wide range of deposit products and services. Through our branch network, we provide our banking customers with personal and business checking accounts, money market accounts, savings accounts, time deposit accounts, individual retirement accounts, 24-hour ATMs, internet banking and bill-pay, remote deposit capture, lock boxes, and ACH origination services. In addition to our retail and business deposits, we obtain both secured and unsecured wholesale deposits including public deposits such as State of California Treasurer’s time deposits, brokered money market and time deposits, and deposits gathered from outside of the Bank’s normal market area through deposit listing services.
FDIC-insured deposits are our primary source of funds. As part of our asset-liability management, we analyze our retail and wholesale deposit maturities and interest rates to monitor and manage our cost of funds, to the extent feasible in the context of changing market conditions, as well as to promote stability in our supply of funds. For additional information on deposits, see Item 7 “Management’s Discussion and Analysis of Financial Condition and Results of Operations – Financial Condition – Deposits.”
Borrowing Activities
When we have more funds than required for our reserve requirements or short-term liquidity needs, we may sell federal funds to other financial institutions. Conversely, when we have less funds than required, we may borrow funds from the Federal Home Loan Bank of San Francisco (the “FHLB”), the Federal Reserve Bank of San Francisco (“the Federal Reserve Bank”), or our correspondent banking relationships. In addition, we may borrow from the FHLB on a longer term basis to provide funding for certain loan or investment securities strategies, as well as asset-liability management strategies.
The FHLB functions in a reserve credit capacity for qualifying financial institutions. As a member, we are required to own capital stock in the FHLB and may apply for advances from the FHLB on an unsecured basis or by utilizing qualifying loans and certain securities as collateral. The FHLB offers a full range of borrowing programs on its advances, with terms ranging from one day to thirty years, at competitive market rates. A prepayment penalty is usually imposed for early repayment of these advances. Information concerning FHLB advances and other borrowings is included in Note 9 of “Notes to Consolidated Financial Statements.”
We may also borrow from the Federal Reserve Bank. The maximum amount that we may borrow from the Federal Reserve Bank’s discount window is up to 95% of the outstanding principal balance of the qualifying loans and the fair value of the securities that we pledge.
6
Long-Term Debt
At December 31, 2018, nine wholly-owned subsidiary grantor trusts (“Trusts”) had issued $126.0 million of pooled trust preferred securities (“Trust Preferred Securities”). The Trust Preferred Securities accrue and pay distributions periodically at specified annual rates as provided in the related indentures for the securities. The Trusts used the net proceeds from the offering of the Trust Preferred Securities to purchase a like amount of subordinated debentures (the “Debentures”) issued by us. The Debentures are the sole assets of the trusts. Our obligations under the Debentures and related documents, taken together, constitute a full and unconditional guarantee by us of the obligations of the trusts. The Trust Preferred Securities are mandatorily redeemable upon the maturity of the Debentures (which have maturity dates ranging from 2033 to 2037), or upon earlier redemption as provided in the indentures. We have the right to redeem the Debentures in whole (but not in part) on a quarterly basis at a specified redemption price. We also have the right to defer interest on the Debentures for up to five years.
In 2018, we issued $217.5 million aggregate principal amount of 2.00% convertible senior notes maturing on May 15, 2038 in a private offering to investors. Holders of the convertible notes can convert to shares of our common stock at a specified conversion rate at any time on or after February 15, 2023. Prior to February 15, 2023, the convertible notes cannot be converted unless under certain specified scenarios. The convertible notes can be settled in entirely cash, stock, or a combination of stock and cash at our option. We have the right to call the convertible notes on or after May 20, 2023 and holder of the notes can put the note on certain dates on or after May 15, 2023. The convertible notes were issued as part of our plan to repurchase shares of our common stock. Subsequent to the issuance of the convertible notes, we repurchased $150.0 million in common stock during 2018.
Market Area and Competition
We currently have 63 banking offices in areas having high concentrations of Korean-Americans, of which 35 are located in the Los Angeles, Orange County, Oakland and Silicon Valley (Santa Clara County) areas of California, 10 are located in the New York City metropolitan area and New Jersey, six are in the Chicago metropolitan area, four are in the Seattle metropolitan area, four are in Texas, two are in Virginia, one is in Alabama, and one is in Georgia. We also have 11 loan production offices located in Dallas, Seattle, Atlanta, Denver, Portland, Fremont, and Southern California and a representative office in Seoul, South Korea. The banking and financial services industry generally, and in our market areas specifically, is highly competitive. The increasingly competitive environment is a result primarily of strong competition among the banks servicing the Korean-American community, changes in regulations, changes in technology and product delivery systems, and consolidation among financial services companies. In addition, federal legislation may have the effect of further increasing the pace of consolidation within the financial services industry. See “Supervision and Regulation.”
We compete for loans, deposits, and customers with other commercial banks, savings and loan associations, securities and brokerage companies, mortgage companies, insurance companies, marketplace finance platforms, money market funds, credit unions, and other non-bank financial service providers. Many of these competitors are much larger in total assets and capitalization, have greater access to capital markets, are more widely recognized, have broader geographic scope, and offer a broader range of financial services than we do.
Economic Conditions, Government Policies and Legislation
Our profitability, like that of most financial institutions, depends, among other things, on interest rate differentials. In general, the difference between the interest expense on interest bearing liabilities, such as deposits, borrowings, and debt, and the interest income on our interest earning assets, such as loans we extend to our customers and securities held in our investment portfolio, as well as the level of noninterest bearing deposits, have a significant impact on our profitability. Interest rates are highly sensitive to many factors that are beyond our control, such as the economy, inflation, unemployment, consumer spending, and political changes and events. The impact that future changes in domestic and foreign economic and political conditions might have on our performance cannot be predicted.
Our business is also influenced by the monetary and fiscal policies of the federal government and the policies of regulatory agencies, particularly the Board of Governors of the Federal Reserve System (the “FRB”). The FRB implements national monetary policies (with objectives such as curbing inflation or preventing recession) through its open-market operations in U.S. government securities, by adjusting the required level of reserves for depository institutions subject to its reserve requirements, and by varying the targeted federal funds and discount rates applicable to borrowings by depository institutions. The actions of the FRB in these areas influence the growth of bank loans, investments, and deposits and also affect interest rates earned on interest earning assets and paid on interest bearing liabilities. The nature and impact on Hope Bancorp, and the Bank, of future changes in monetary and fiscal policies cannot be predicted.
7
From time to time, legislation and regulations are enacted or adopted which have the effect of increasing the cost of doing business, limiting, or expanding permissible activities, or affecting the competitive balance between banks and other financial services providers. Proposals to change the laws and regulations governing the operations and taxation of banks, bank holding companies, financial holding companies, and other financial institutions and financial services providers are frequently made in the U.S. Congress, in state legislatures, and by various regulatory agencies. These proposals may result in changes in banking statutes and regulations and our operating environment in substantial and unpredictable ways. If enacted, such legislation could increase the cost of doing business, limit permissible activities, or affect the competitive balance among banks, savings associations, credit unions, and other financial institutions. We cannot predict whether any of this potential legislation will be enacted, and if enacted, the effect that it, or any implementing regulations, would have on our financial condition or results of operations. See “Supervision and Regulation.”
Supervision and Regulation
General
Hope Bancorp and the Bank are subject to extensive regulation and supervision under state and federal banking laws. This regulatory framework covers substantially all of the business activities of Hope Bancorp and the Bank. In the exercise of their supervisory and examination authority, the bank regulatory agencies have recently emphasized capital planning and stress testing, liquidity management, enterprise risk management, corporate governance, anti-money laundering compliance, information technology adequacy, cybersecurity preparedness, vendor management, and fair lending and other consumer compliance obligations. The federal and state regulatory systems are intended primarily for the protection of depositors, customers, the FDIC deposit insurance fund (the “DIF”) and the banking system as a whole, rather than for the protection of shareholders or other investors.
The following summarizes certain laws and regulations that apply to Hope Bancorp and the Bank. These descriptions of statutes and regulations and their possible effects do not purport to be complete descriptions of all of the provisions of those statutes and regulations and their possible effects on us, nor do they purport to identify every statute and regulation that may apply to us.
Bank Holding Company Regulation
Hope Bancorp is a registered bank holding company. As a bank holding company, is subject to regulation, supervision and regular examination by the FRB under the Bank Holding Company Act. Hope Bancorp is also required to file periodic reports of its operations with the FRB and other such reports as the FRB may require.
Bank holding companies are required to maintain certain levels of capital (See “Capital Adequacy Requirements”) and must serve as a source of financial and managerial strength to subsidiary banks and commit resources as necessary to support each subsidiary bank. FRB regulations and polices limit the dividends a bank holding company may pay to its shareholders and the amount of its shares that it may repurchase. (See “Dividends and Stock Repurchases”.) FRB rules and policies also regulate provisions of certain bank holding company debt and the FRB may impose interest ceilings and reserve requirements on such debt and require prior approval to purchase or redeem debt securities in certain situations.
The FRB may require a bank holding company to terminate an activity or terminate control of or liquidate or divest certain subsidiaries, affiliates or investments if the FRB believes the activity or the control of the subsidiary or affiliate constitutes a significant risk to the financial safety, soundness or stability of any bank subsidiary. Under certain circumstances, the FRB could, for example, prohibit Hope Bancorp from paying dividends or repurchasing is common stock on the basis that doing would be an unsafe or unsound banking practice.
The activities in which a bank holding company may engage are limited to those activities determined by the FRB to be so closely related to banking or managing or controlling banks as to be a proper incident thereto. Bank holding companies that elect and retain “financial holding company” status pursuant to the Gramm-Leach-Bliley Act of 1999 (the “GLBA”) may also engage in broader securities, insurance, merchant banking and other activities that are determined to be “financial in nature” or are incidental or complementary to activities that are financial in nature. To elect and retain financial holding company status, a bank holding company and all depository institution subsidiaries of a bank holding company must be considered well capitalized and meet certain other requirements. Hope Bancorp has not elected financial holding company status and neither Hope Bancorp nor the Bank has engaged in any activities determined by the FRB to be financial in nature or incidental or complementary to activities that are financial in nature.
8
A bank holding company must seek approval from the FRB prior to acquiring all or substantially all of the assets of any bank or bank holding company or the ownership or control of voting shares of any bank or bank holding company if, after giving effect to such acquisition, it would own or control, directly or indirectly, more than 5 percent of a bank. Under the Bank Merger Act, the prior approval of the FDIC is required for the Bank to merge with another bank or purchase all or substantially all of the assets or assume any of the deposits of another FDIC-insured depository institution. Federal banking regulators review competitive, management, financial, compliance and other factors when considering applications for these approvals. Similar California or other state banking agency approvals may also be required.
The Company is also a bank holding company within the meaning of Section 3700 of the California Financial Code. Therefore, the Bank and any of its subsidiaries are subject to examination by, and may be required to file reports with, the DBO. DBO approvals are also required for certain mergers and acquisitions
Bank Regulation
The Bank is a California state-chartered bank whose deposit accounts are insured by the FDIC, up to applicable limits. As such, the Bank is subject to regulation, supervision and regular examination by the California Department of Business Oversight (the “DBO”) and the FDIC. In addition, while the Bank is not a member of the FRB, the Bank is subject to certain regulations of the FRB.
Federal and state laws and regulations applicable to banks regulate, among other things, the scope of their business, their investments, their reserves against deposits, lending activities, servicing and foreclosing on loans, borrowings, capital requirements, certain check-clearing activities, dividends, branching, and mergers and acquisitions. California banks are also subject to statutes and regulations including FRB Regulation O and Federal Reserve Act Sections 23A and 23B and Regulation W, which restrict or limit loans or extensions of credit to “insiders”, including officers, directors, and principal shareholders, and loans or extension of credit by banks to affiliates or purchases of assets from affiliates, including parent bank holding companies, except pursuant to certain exceptions and only on terms and conditions at least as favorable to those prevailing for comparable transactions with unaffiliated parties. The Dodd-Frank Act expanded definitions and restrictions on transactions with affiliates and insiders under Sections 23A and 23B and also lending limits for derivative transactions, repurchase agreements and securities lending and borrowing transactions.
Under the Federal Deposit Insurance Act (“FDI Act”) and the California Financial Code, California state chartered commercial banks may generally engage in any activity permissible for national banks. Therefore, the Bank may form subsidiaries to engage in the many so-called “closely related to banking” or “nonbanking” activities commonly conducted by national banks in operating subsidiaries or by subsidiaries of bank holding companies. Further, California state chartered banks may conduct certain financial activities permitted under GLBA in a “financial subsidiary” to the same extent as a national bank, provided the bank is and remain
s
well-capitalized, well-managed and in satisfactory compliance with the Community Reinvestment Act (the “CRA”). The Bank currently conducts no non-banking or financial activities through subsidiaries.
Capital Adequacy Requirements
Hope Bancorp and the Bank are subject to similar regulatory capital requirements administered by their primary federal supervisory banking agencies. Pursuant to the Dodd-Frank Wall Street Reform and Consumer Protection Act (the “Dodd-Frank Act”), the federal banking agencies have adopted capital rules (the “New Capital Rules”) based on the Basel III Accord. The New Capital Rules became effective on January 1, 2015, subject to certain phase-in provisions. The New Capital Rules are risk-based, meaning that the levels of capital required vary based on the perceived degree of risk associated with a banking organization’s balance sheet assets, such as loans and investment securities, and those recorded as off-balance sheet items, such as commitments, letters of credit, and recourse arrangements. Bank holding companies and banks engaged in significant trading activity may also be subject to the market risk capital guidelines and be required to incorporate additional market and interest rate risk components into their risk-based capital standards. The classifications and, therefore, the required capital amounts are also subject to qualitative judgments by regulators about components, risk-weighting, and other factors.
9
The New Capital Rules (i) introduce a new capital measure called “common equity Tier 1 and a related regulatory capital ratio of common equity Tier 1 to risk‑weighted assets, (ii) specify that Tier 1 capital consists of common equity Tier 1 and “additional Tier 1 capital” instruments meeting certain requirements, (iii) mandate that most deductions and adjustments to regulatory capital measures be made to common equity Tier 1 and not to the other components of capital, and (iv) expand the scope of the deductions from and adjustments to capital compared to prior capital rules. The New Capital Rules also changed the risk-weights of certain assets used to calculate the risk-based capital ratios, such as those for high volatility commercial real estate acquisition, development and construction loans, certain past due non-residential mortgage loans and certain mortgage-backed and other securities exposure. The New Capital Rules also change the permitted composition of Tier 1 capital to exclude trust preferred securities (subject to certain grandfathering exceptions for organizations like Hope Bancorp, which had less than $15 billion in assets as of December 31, 2009), mortgage servicing rights and certain deferred tax assets and to include unrealized gains and losses on available for sale debt and equity securities (unless the organization opts out of including such unrealized gains and losses).
Under the New Capital Rules, the minimum capital ratios applicable to Hope Bancorp and the Bank are as follows:
|
•
|
4.5% common equity Tier 1 to risk‑weighted assets;
|
|
•
|
6.0% Tier 1 capital (that is, common equity Tier 1 plus additional Tier 1 capital) to risk‑weighted assets;
|
|
•
|
8.0% total capital (that is, Tier 1 capital plus Tier 2 capital) to risk‑weighted assets; and
|
|
•
|
4.0% Tier 1 capital to average consolidated assets as reported on regulatory financial statements (known as the “leverage ratio”). (To be considered well-capitalized under the Prompt Corrective Action framework, the Bank must maintain a minimum Tier 1 leverage ratio of at least 5%.)
|
At December 31, 2018, the respective capital ratios of Hope Bancorp and the Bank exceeded the minimum percentage requirements to generally be deemed “well-capitalized” for bank regulatory purposes. See “Management’s Discussion and Analysis of Financial Condition and Results of Operations.”
The New Capital Rule create an additional “capital conservation buffer” of 2.5% of risk-weighted assets above the regulatory minimum capital ratios. If Hope Bancorp and the Bank do not maintain capital sufficient to satisfy the capital conservation buffer, they would face restrictions in their ability to pay dividends, repurchase shares and pay discretionary bonuses. The capital conservation buffer was phased in in increments of 0.625% beginning in 2015 through January 1, 2019.
Including the capital conservation buffer of 2.5%, which was fully phased in as of January 1, 2019, the minimum ratios for a banking organization to be considered “well capitalized” for bank regulatory purposes are as follows: (i) a common equity Tier 1 capital ratio of 7.0%, (ii) a Tier 1 capital ratio of 8.5% and (iii) a total capital ratio of 10.5%. Management believes that, as of December 31, 2018, Hope Bancorp and the Bank met all requirements under the New Capital Rules applicable to them on a fully phased-in basis as if such requirements were then in effect, including the capital conservation buffer.
While the New Capital Rules set higher regulatory capital standards for Hope Bancorp and the Bank, bank regulators may also continue their past policies of expecting banks to maintain additional capital beyond the new minimum requirements. The implementation of the New Capital Rules or more stringent requirements to maintain higher levels of capital or to maintain higher levels of liquid assets could adversely impact the Company’s net income and return on equity, restrict the ability to pay dividends or executive bonuses and require the raising of additional capital.
The Bank is also subject to capital adequacy requirements under the California Financial Code.
See “Management’s Discussion and Analysis of Financial Condition and Results of Operations.”
Increased Supervision and Regulation for Bank Holding Companies with Consolidated Assets of More than $10 Billion
As a banking organization with consolidated assets exceeding $10 billion, the Company is subject to heightened supervision and regulation imposed by the Dodd-Frank Act, such as the following:
|
•
|
We are subject to periodic examination by the Consumer Finance Protection Bureau (“CFPB”) with respect to compliance with federal consumer laws. Although we were previously subject to regulations issued by the CFPB, the Bank’s primary federal regulatory, the FDIC, previously had responsibility for our consumer compliance exams. See “Consumer Finance Protection Bureau.”
|
|
•
|
We are subject to the maximum permissible interchange fee for swipe transactions, equal to no more than 21 cents plus 5 basis points of the transaction value for many types of debit interchange transactions.
|
|
•
|
We calculate our FDIC deposit assessment base using a performance score and a loss-severity score system described below in “Deposit Insurance.”
|
10
|
•
|
We are subject to the “Volcker Rule,” which generally restricts us from engaging in activities that are considered proprietary trading and from sponsoring or investing in certain entities, including hedge or private equity funds that are considered covered funds. While Hope Bancorp and the Bank had no investment positions or relationships at December 31, 2018 that were subject to the Volcker Rule, we may be subject to the compliance and recording keeping provisions of this rule.
|
The Dodd-Frank Act requires banking organizations with consolidated assets exceeding $10 billion to establish board-level risk committees and to perform annual stress tests. The Economic Growth, Regulatory Relief, and Consumer Protection Act enacted in 2018 raises the asset thresholds for these requirements to $50 billion and $100 billion, respectively.
Many aspects of the Dodd-Frank Act continue to be subject to rule-making and have yet to take full effect, making it difficult to anticipate the overall financial impact on the Company, its customers or the financial industry generally. Provisions in the legislation that affect deposit insurance assessments, payment of interest on demand deposits and interchange fees could increase the costs associated with deposits as well as place limitations on certain revenues those deposits may generate.
Prompt Corrective Action
The FDI Act requires the federal bank regulatory agencies to take “prompt corrective action” with respect to a depository institution that does not meet certain capital adequacy standards, including requiring the prompt submission of an acceptable capital restoration plan. Depending on the bank’s capital ratios, the agencies’ regulations define five categories in which an insured depository institution will be placed: well-capitalized, adequately capitalized, undercapitalized, significantly undercapitalized, and critically undercapitalized. At each successive lower capital category, an insured bank is subject to more restrictions, including restrictions on the bank’s activities, operational practices or the ability to pay dividends or executive bonuses.
The prompt corrective action standards were revised to conform with the New Capital Rules. Under current standards, in order to be generally considered well-capitalized for bank regulatory purposes, the Bank is required maintain the following minimum capital ratios: a common equity Tier 1 ratio of 6.5%, a Tier 1 ratio of 8%, a total capital ratio of 10% and a leverage ratio of 5%. A bank meeting the minimum capital ratios required to be considered well-capitalized, adequately capitalized, or undercapitalized may, however, may be treated as though it were in the next lower capital category if the appropriate federal banking agency, after notice and opportunity for hearing, determines that an unsafe or unsound condition or practice warrants such treatment.
The federal banking agencies also may require banks and bank holding companies subject to enforcement actions to maintain capital ratios in excess of the minimum ratios otherwise generally required to be deemed well capitalized for bank regulatory purposes, in which case institutions may no longer be deemed to be well capitalized and may therefore be subject to certain restrictions such as on taking brokered deposits.
Consumer Compliance Laws
The Bank must comply with numerous federal and state consumer protection statutes and implementing regulations, including, but not limited to, the Fair Debt Collection Practices Act, the Fair Credit Reporting Act, the Equal Credit Opportunity Act, the Truth in Lending Act, the Fair Housing Act, the Home Mortgage Disclosure Act, the Real Estate Settlement Procedures Act, the National Flood Insurance Act, the California Homeowner Bill of Rights and various federal and state privacy protection laws, including the Telephone Consumer Protection Act, and CAN-SPAM Act. The Bank and Hope Bancorp are also subject to federal and state laws prohibiting unfair or fraudulent business practices, untrue or misleading advertising and unfair competition.
These laws and regulations mandate certain disclosure and reporting requirements and regulate the manner in which financial institutions must deal with customers when taking deposits, making loans, servicing, collecting and foreclosure of loans, and providing other services. Failure to comply with these laws and regulations can subject the Bank to various penalties, including but not limited to enforcement actions, injunctions, fines or criminal penalties, punitive damages to consumers, and the loss of certain contractual rights.
Community Reinvestment Act
The Bank is subject to the Community Reinvestment Act (“CRA”), which requires federal banking regulators to evaluate the record of a financial institution in meeting the credit needs of its local communities, including low and moderate income neighborhoods. The federal banking agencies consider a financial institution’s compliance with the CRA into account when considering regulatory applications for mergers and other expansionary activities. The Bank received a “Satisfactory” rating in the most recent public disclosure of CRA performance evaluation released by the FDIC in 2018, which states that the Bank’s CRA performance under the Lending, Investment, and Service Tests supports the overall rating.
11
USA PATRIOT Act and Anti-Money Laundering Laws
Under the USA PATRIOT Act of 2001, financial institutions are subject to prohibitions against specified financial transactions and account relationships, as well as enhanced due diligence standards that are intended to prevent and detect the use of the United States financial system for money laundering and terrorist financing activities. The act requires financial institutions, including banks, to establish anti-money laundering programs, including employee training and independent audit requirements, meet minimum standards specified by the act, follow minimum standards for customer identification and maintenance of customer identification records, and regularly compare customer lists against lists of suspected terrorists, terrorist organizations and money launderers.
The Bank Secrecy Act (the “BSA”) establishes requirements for recordkeeping and reporting by banks and other financial institutions that are intended to help identify the source, volume and movement of currency and other monetary instruments into and out of the United States in order to help detect and prevent money laundering connected with drug trafficking, terrorism and other criminal activities. Under the BSA and related regulations, banking institutions must file suspicious activity reports and maintain programs designed to assure and monitor compliance with certain recordkeeping and reporting requirements regarding currency transactions. The programs must include systems and internal controls to assure ongoing compliance, provide for independent testing of such systems and compliance and provide appropriate personnel training.
Loans to One Borrower
Under California law, the Bank’s ability to make aggregate secured and unsecured loans to borrower is limited to 25% and 15%, respectively, of the Bank’s unimpaired capital and surplus. The Bank has established internal loan limits that are lower than the legal lending limits for a California bank.
Deposit Insurance
The FDIC is an independent federal agency that insures deposits, up to prescribed statutory limits, of federally insured banks and savings institutions, and safeguards the safety and soundness of the depository institutions. The FDIC insures our customer deposits through the DIF up to prescribed limits. The FDIC may terminate a depository institution’s deposit insurance upon a finding that the institution’s financial condition is unsafe or unsound, or that the institution has engaged in unsafe or unsound practices that pose a risk to the DIF or that may prejudice the interest of the bank’s depositors. The termination of the Bank’s deposit insurance would result in the revocation of the Bank’s charter by the DBO.
We are generally unable to control the amount of assessments that we pay for FDIC insurance, which can be affected by the cost of bank failures to the FDIC, among other factors. The Dodd-Frank Act revised the FDIC’s DIF management authority by setting requirements for the Designated Reserve Ratio (the DIF balance divided by estimated insured deposits) and redefining the assessment base which is used to calculate banks’ quarterly assessments. The amount of FDIC assessments paid by each DIF member institution is based on its asset size and its relative risk of default as measured by regulatory capital ratios and other supervisory factors.
In 2016, the FDIC adopted a rule increasing the DIF’s minimum reserve ratio to 1.35% as required by the Dodd Frank Act. As required by the Dodd-Frank Act, the costs of increasing the DIF’s reserve ratio from 1.15% to 1.35% was borne by depository institutions with total consolidated assets of $10 billion or more, which had an impact on the Bank’s deposit insurance assessments because the Bank exceeded $10 billion in assets. In 2018, the FDIC reached the minimum reserve ratio of 1.35% and as a result the FDIC does not currently assesses a surcharge on banks with total assets in excess of $10 billion. Any future changes in FDIC insurance assessments may have a material and adverse effect on our earnings and could have a material adverse effect on the value of, or market for, our common stock.
Safety and Soundness Standards; Regulatory Enforcement Authority
The federal and California bank regulatory agencies have extensive discretion in connection with their supervisory and enforcement activities and examination policies, including policies with respect to the classification of assets and the establishment of appropriate loan loss reserves for regulatory purposes. The federal bank regulatory agencies have adopted guidelines to assist in identifying and addressing potential safety and soundness concerns before an institution’s capital becomes impaired. The guidelines establish operational and managerial standards generally relating to: (1) internal controls, information systems, and internal audit systems; (2) loan documentation; (3) credit underwriting; (4) interest-rate exposure; (5) asset growth and asset quality; and (6) compensation, fees, and benefits. Further, the regulatory agencies have adopted safety and soundness guidelines for asset quality and for evaluating and monitoring earnings to ensure that earnings are sufficient for the maintenance of adequate capital and reserves.
12
If, as a result of an examination, the FRB, the FDIC or the DBO should determine that the financial condition, capital resources, asset quality, earnings prospects, management, liquidity, or other aspects of the Company’s or the Bank’s operations are unsatisfactory or that the Company or the Bank or management is violating or has violated any law or regulation, these agencies have the authority to:
|
•
|
Require affirmative action to correct any conditions resulting from any violation or practice;
|
|
•
|
Direct an increase in capital and the maintenance of higher specific minimum capital ratios, which could preclude the Hope Bancorp or the Bank from being deemed well capitalized which, in the case of the Bank, would restrict its ability to accept certain brokered deposits, for example;
|
|
•
|
Restrict Hope Bancorp’s or the Bank’s growth geographically, by products and services, or by mergers and acquisitions;
|
|
•
|
Enter into or issue informal or formal enforcement actions, including required board resolutions, memoranda of understanding, written agreements and consent or cease and desist orders or prompt corrective action orders to take corrective action and cease unsafe and unsound practices;
|
|
•
|
Assess civil money penalties;
|
|
•
|
Require prior approval of senior executive officer or director changes; remove officers and directors and assess civil monetary penalties; and
|
|
•
|
Terminate FDIC insurance, revoke the charter and/or take possession of and close and liquidate the Bank or appoint the FDIC as receiver.
|
Dividends and Stock Repurchases
Hope Bancorp’s ability to pay dividends or repurchase shares of its common stock is subject to restrictions set forth in the Delaware General Corporation Law. The Delaware General Corporation Law provides that a Delaware corporation may pay dividends or repurchase its shares either (i) out of the corporation’s surplus (as defined by Delaware law), or (ii) if there is no surplus, out of the corporation’s net profits for the fiscal year in which the dividend is declared and/or the preceding fiscal year. It is the FRB’s policy, however, that bank holding companies should generally pay dividends on common stock only out of income available over the past year, and only if prospective earnings retention is consistent with the organization’s expected future needs and financial condition. FRB policy requires that a banking holding company must notify the FRB its repurchase or redemption of shares would cause a net reduction of in the amount of such capital instrument outstanding at the beginning of the quarter in which the redemption or repurchase occurs. It is also the FRB’s policy that bank holding companies should not maintain dividend levels or repurchase shares in amounts that would that undermine their ability to be a source of strength to its banking subsidiaries. The FRB also discourages dividend payment ratios that are at maximum allowable levels unless both asset quality and capital are very strong. In addition, if Hope Bancorp does not maintain an adequate capital conservation buffer under the New Capital Rules, its ability to pay dividends to or repurchase shares from shareholders may be restricted.
The Bank is a legal entity that is separate and distinct from Hope Bancorp. Hope Bancorp depends the Bank’s payment of dividends as primary source of cash for use in Hope Bancorp’s operations, Hope Bancorp’s payment of dividends to shareholders and Hope Bancorp’s stock repurchases. The Bank’s ability to pay dividends to Hope Bancorp is subject to provisions of the California Financial Code that limit the amount available for cash dividends to the lesser of a bank’s retained earnings or net income for its last three fiscal years (less any distributions to shareholders made during such period). Where the above test is not met, cash dividends may still be paid, with the prior approval of the DBO, in an amount not exceeding the greatest of (1) retained earnings of the bank; (2) the net income of the bank for its last fiscal year; or (3) the net income of the bank for its current fiscal year. The Bank’s ability to pay cash dividends to Hope Bancorp will also depend upon management’s assessment of future capital requirements, contractual restrictions, and other factors. If the Bank does not maintain an adequate capital conservation buffer under the New Capital Rules, the Bank may face restrictions on its ability to pay dividends to Hope Bancorp.
Consumer Financial Protection Bureau
The Dodd-Frank Act created the CFPB as an independent entity within the FRB with broad rulemaking, supervisory and enforcement authority over consumer financial products and services, including deposit products, residential mortgages, home-equity loans and credit cards. The bureau’s functions include investigating consumer complaints, conducting market research, rulemaking, supervising and examining bank consumer transactions, and enforcing rules related to consumer financial products and services. CFPB regulations and guidance apply to all financial institutions and banks with $10 billion or more in assets are subject to examination by the CFPB. Banks with less than $10 billion in assets continue to be examined for compliance by their primary federal banking agency. The Bank is subject to examination by the CFPB. The CFPB has the authority to bring formal and informal enforcement actions against the Bank similar to those that may be brought by the federal banking regulators discussed above.
13
In 2014, the CFPB adopted revisions to Regulation Z, which implement the Truth in Lending Act, pursuant to the Dodd-Frank Act, and apply to consumer mortgages. The revisions mandate specific underwriting criteria for home loans in order for creditors to make a reasonable, good faith determination of a consumer’s ability to repay and establish certain protections from liability under the requirements for “qualified mortgages” that meet certain specific standards. As required by the Dodd-Frank Act, the CFPB also promulgated TILA-RESPA Integrated Disclosure (”TRID”) rules which became effective in 2015 and require new mortgage disclosures. The Bank believes it has fully implemented the TRID requirements.
Employees
As of
December 31, 2018
, we had 1,494 full-time equivalent employees compared to 1,470 full-time equivalent employees at December 31, 2017. None of our employees are represented by a union or covered by a collective bargaining agreement. Management believes that its relations with its employees are good.
14
|
Item 1A.
|
RISK FACTORS
|
In the course of conducting its business operations, we are exposed to a variety of risks, some of which are inherent in the financial services industry and others of which are more specific to its own business. The following discussion addresses the most significant risks that could affect our business, financial condition, liquidity, results of operations, and capital position. The risks and uncertainties described below are not the only ones we face. Additional risks and uncertainties not presently known to us or that we currently deem immaterial may also affect our business. If any of these known or unknown risks or uncertainties actually occurs, our business, financial condition and results of operations may be materially and adversely effected. In that event, the market price for our common stock will likely decline.
Economic conditions in the markets in which we operate may adversely affect our loan portfolio and reduce the demand for our services
. We focus our business primarily in Korean-American communities in California, the greater New York City, Chicago, Houston and Dallas, and Seattle metropolitan areas, New Jersey, Virginia, Alabama, and Georgia. Adverse economic conditions in our market areas could potentially have a material adverse impact on the quality of our business. A renewed economic slowdown in the markets in which we operate currently and in the future may have any or all of the following consequences, any of which may reduce our net income and adversely affect our financial condition:
|
•
|
loan delinquencies may increase;
|
|
•
|
problem assets and foreclosures may increase;
|
|
•
|
the level and duration of deposits may decline;
|
|
•
|
demand for our products and services may decline; and
|
|
•
|
collateral for loans may decline in value below the principal amount owed by the borrower.
|
We have a high level of loans secured by real estate collateral. A downturn in the real estate market may seriously impair our loan portfolio
. As of
December 31, 2018
, approximately 80% of our loan portfolio consisted of loans secured by various types of real estate (including 1-4 family residential loans in our consumer loan portfolio). Following the financial crisis of 2008, there was a general slowdown in the economy and declines in the value of real estate. Although the economy has rebounded and real estate prices have gradually recovered from their earlier low levels, it is possible that there will be renewed deterioration in the real estate market generally and in commercial real estate values in particular. Such developments may result in additional loan charge-offs and provisions for loan losses, which may have a material and adverse effect on our net income and capital levels.
Our commercial loan and commercial real estate loan portfolios expose us to risks that may be greater than the risks related to our other loans.
Our loan portfolio includes commercial loans and commercial real estate loans, which are secured by hotels and motels, shopping/retail centers, service station and car wash, industrial and warehouse properties, and other types of commercial properties. Commercial and commercial real estate loans carry more risk as compared to other types of lending, because they typically involve larger loan balances often concentrated with a single borrower or groups of related borrowers.
Accordingly, charge-offs on commercial and commercial real estate loans may be larger on a per loan basis than those incurred with our residential or consumer loan portfolios. In addition, these loans expose a lender to greater credit risk than loans secured by residential real estate. The payment experience on commercial real estate loans that are secured by income producing properties are typically dependent on the successful operation of the related real estate project and thus, may subject us to adverse conditions in the real estate market or to the general economy. The collateral securing these loans typically cannot be liquidated as easily as residential real estate. If we foreclose on these loans, our holding period for the collateral typically is longer than residential properties because there are fewer potential purchasers of the collateral.
Unexpected deterioration in the credit quality of our commercial or commercial real estate loan portfolios would require us to increase our provision for loan losses, which would reduce our profitability and could materially adversely affect our business, financial condition, results of operations and prospects.
In addition, with respect to commercial real estate loans, federal and state banking regulators are examining commercial real estate lending activity with heightened scrutiny and may require banks with higher levels of commercial real estate loans to implement more stringent underwriting, internal controls, risk management policies and portfolio stress testing, as well as possibly higher levels of allowances for losses and capital levels as a result of commercial real estate lending growth and exposures. Because a significant portion of our loan portfolio is comprised of commercial real estate loans, the banking regulators may require us to maintain higher levels of capital than we would otherwise be expected to maintain, which could limit our ability to leverage our capital and have a material adverse effect on our business, financial condition, results of operations and prospects.
15
Our allowance for loan losses may not cover our actual loan losses
. If our actual loan losses exceed the amount we have allocated for estimated probable incurred losses, our business will be adversely affected. We attempt to limit the risk that borrowers will fail to repay loans by carefully underwriting our loans, but losses nevertheless occur in the ordinary course of business operations. We create allowances for estimated loan losses through provisions that are recorded as reductions in income in our accounting records. We base these allowances on estimates of the following:
|
•
|
historical experience with our loans;
|
|
•
|
evaluation of current economic conditions and other factors;
|
|
•
|
reviews of the quality, mix and size of the overall loan portfolio;
|
|
•
|
reviews of delinquencies; and
|
|
•
|
the quality of the collateral underlying our loans.
|
If our allowance estimates are inadequate, we may incur losses, our financial condition may be materially and adversely affected and we may be required to try and raise additional capital to enhance our capital position. In addition, various regulatory agencies, as an integral part of their examination process, periodically review the adequacy of our allowance. These agencies may require us to establish additional allowances based on their judgment of the information available at the time of their examinations. No assurance can be given that we will not sustain loan losses in excess of present or future levels of the allowance for loan losses or that regulatory agencies will not require us to increase our allowance thereby impacting our profitability.
Changes in interest rates affect our profitability
. The interest rate risk inherent in our lending, investing, and deposit taking activities is a significant market risk to us and our business. We derive our income mainly from the difference or “spread” between the interest earned on loans, securities and other interest earning assets, and interest paid on deposits, borrowings and other interest bearing liabilities. In general, the wider the spread, the more net interest income we earn. When market rates of interest change, the interest we receive on our assets and the interest we pay on our liabilities will fluctuate. This can cause decreases in our spread and can greatly affect our income. In addition, interest rate fluctuations can affect how much money we may be able to lend. There can be no assurance that we will be successful in minimizing the potentially adverse effects of changes in interest rates.
If we lose key employees, our business may suffer
. There is intense competition for experienced and highly qualified personnel in the Korean-American banking industry and the banking industry more broadly. Our future success depends on the continued employment of existing senior management personnel. If we lose key employees temporarily or permanently, it may hurt our business. We may be particularly hurt if our key employees, including any of our executive officers, became employed by our competitors in the Korean-American banking industry.
Environmental laws may force us to pay for environmental problems
. The cost of cleaning up or paying damages and penalties associated with environmental problems may increase our operating expenses. When a borrower defaults on a loan secured by real property, we often purchase the property in foreclosure or accept a deed to the property surrendered by the borrower. We may also take over the management of commercial properties whose owners have defaulted on loans. We also lease premises where our branches and other facilities are located, all where environmental problems may exist. Although we have lending, foreclosure and facilities guidelines that are intended to exclude properties with an unreasonable risk of contamination, hazardous substances may exist on some of the properties that we own, lease, manage or occupy. We may face the risk that environmental laws may force us to clean up the properties at our expense. The cost of cleaning up a property may exceed the value of the property. We may also be liable for pollution generated by a borrower’s operations if we take a role in managing those operations after a default. We may find it difficult or impossible to sell contaminated properties.
We are exposed to the risks of natural disasters
. A significant portion of our operations is concentrated in Southern California, which is an earthquake and fire prone region. A major earthquake or fire may result in material loss to us. A significant percentage of our loans are and will be secured by real estate. Many of our borrowers may suffer uninsured property damage, experience interruption of their businesses or lose their jobs after an earthquake or fire. Those borrowers might not be able to repay their loans, and the collateral for such loans may decline significantly in value. Unlike a bank with operations that are more geographically diversified, we are vulnerable to greater losses if an earthquake, fire, flood, mudslide or other natural catastrophe occurs in Southern California.
An increase in nonperforming assets would reduce our income and increase our expenses
. If the level of nonperforming assets increases in the future, it may adversely affect our operating results and financial condition. Nonperforming assets are mainly loans on which the borrowers are not making their required payments. Nonperforming assets also include loans that have been restructured to permit the borrower to make payments and real estate that has been acquired through foreclosure or deed in lieu of foreclosure of unpaid loans. To the extent that assets are nonperforming, we have less earning assets generating interest income and an increase in credit related expenses, including provisions for loan losses.
16
We may experience adverse effects from acquisitions
. We have acquired other banking companies and bank offices in the past, and will consider additional acquisitions as opportunities arise. If we do not adequately address the financial and operational risks associated with acquisitions of other companies, we may incur material unexpected costs and disruption of our business. Future acquisitions may increase the degree of such risks.
Risks involved in acquisitions of other companies include:
|
•
|
the risk of failure to adequately evaluate the asset quality of the acquired company;
|
|
•
|
difficulty in assimilating the operations, technology and personnel of the acquired company;
|
|
•
|
diversion of management’s attention from other important business activities;
|
|
•
|
difficulty in maintaining good relations with the loan and deposit customers of the acquired company;
|
|
•
|
inability to maintain uniform and effective operating standards, controls, procedures and policies;
|
|
•
|
potentially dilutive issuances of equity securities or the incurrence of debt and contingent liabilities; and
|
|
•
|
amortization of expenses related to acquired intangible assets that have finite lives.
|
Liquidity risks may impair our ability to fund operations and jeopardize our financial condition
. Liquidity is essential to our business. An inability to raise funds through deposits, borrowings, the sale of loans, and other sources may have a material adverse effect on our liquidity. Our access to funding sources in amounts adequate to finance our activities may be impaired by factors that affect us specifically or the financial services industry in general. Factors that may detrimentally impact our access to liquidity sources include a decrease in the level of our business activity due to a market downturn or adverse regulatory action against us. Our ability to acquire deposits or borrow may also be impaired by factors that are not specific to us, such as a disruption of the financial markets or negative views and expectations about the prospects for the banking industry or the general financial services industry as a whole.
Increases in the level of our problem assets, occurrence of operating losses or a failure to comply with requirements of the agencies which regulate us may result in regulatory actions against us which may materially and adversely affect our business and the market price of our common stock
. The DBO, the FDIC, and the FRB each have authority to take actions to require that we comply with applicable regulatory capital requirements, cease engaging in what they perceive to be unsafe or unsound practices or make other changes in our business. Among others, the corrective measures that such regulatory authorities may take include requiring us to enter into informal or formal agreements regarding our operations, the issuance of cease and desist orders to refrain from engaging in unsafe and unsound practices, removal of officers and directors and the assessment of civil monetary penalties. See “Item 1. Business – Supervision and Regulation” for a further description of such regulatory powers.
Changes in accounting standards may affect how we record and report our financial condition and results of operations
. Our accounting policies and methods are fundamental to how we record and report our financial condition and results of operations. From time to time, the Financial Accounting Standards Board and SEC change the financial accounting and reporting standards that govern the preparation of our financial statements. These changes and their impacts on us can be hard to predict and may result in unexpected and materially adverse impacts on our reported financial condition and results of operations.
For example, in June 2016, the Financial Accounting Standards Board issued ASU 2016-13, Financial Instruments - Credit Losses (Topic 326): Measurement of Credit Losses on Financial Instruments. ASU 2016-13 requires banking organizations to determine the adequacy of their allowance for loan losses with an expected loss model, which is referred to as the current expected credit loss (“CECL”) model. Under the CECL model, banking organizations will be required to present certain financial assets carried at amortized cost, such as loans held for investment and held-to-maturity debt securities, at the net amount expected to be collected. The measurement of expected credit losses is to be based on information about past events, including historical experience, current conditions, and reasonable and supportable forecasts that affect the collectability of the reported amount. This measurement will take place at the time the financial asset is first added to the balance sheet and periodically thereafter. This differs significantly from the “incurred loss” model required under current GAAP, which delays recognition until it is probable a loss has been incurred. Adoption of the CECL model will significantly change the manner in which the Company determines the adequacy of its allocation for loan losses. ASU 2016-13 is expected to be effective for public business entities for fiscal years after December 15, 2019. The Company is evaluating the impact the CECL model will have on its accounting, but the Company may recognize a one-time cumulative-effect adjustment to the allowance for loan losses as of the beginning of the first reporting period in which the new standard is effective. The Company cannot yet determine the magnitude of any such one-time cumulative adjustment or of the overall impact of the new standard on its financial condition or results of operations. The federal banking regulators have adopted a rule that gives a banking organization the option to phase in over a three-year period the day-one adverse effects of CECL on its regulatory capital.
17
We face a risk of noncompliance and enforcement action with the Bank Secrecy Act and other anti-money laundering statutes and regulations.
The Bank Secrecy Act, the USA PATRIOT Act of 2001, and other laws and regulations require financial institutions, among other duties, to institute and maintain an effective anti-money laundering program and file suspicious activity and currency transaction reports as appropriate. The federal Financial Crimes Enforcement Network is authorized to impose significant civil money penalties for violations of those requirements and has recently engaged in coordinated enforcement efforts with the individual federal banking regulators, as well as the U.S. Department of Justice, Drug Enforcement Administration, and Internal Revenue Service. We are also subject to increased scrutiny of compliance with the rules enforced by the Office of Foreign Assets Control and compliance with the Foreign Corrupt Practices Act. If our policies, procedures and systems are deemed deficient, we would be subject to liability, including fines and regulatory actions, which may include restrictions on our ability to pay dividends and the necessity to obtain regulatory approvals to proceed with certain aspects of our business plan. Failure to maintain and implement adequate programs to combat money laundering and terrorist financing could also have serious reputational consequences for us. Any of these results could materially and adversely affect our business, financial condition and results of operations.
The occurrence of fraudulent activity, breaches or failures of our information security controls or cybersecurity-related incidents could have a material adverse effect on our business.
As a financial institution, we are susceptible to fraudulent activity, information security breaches and cybersecurity-related incidents that may be committed against us or our clients, which may result in financial losses or increased costs to us or our clients, disclosure or misuse of our information or our client information, misappropriation of assets, privacy breaches against our clients, litigation, or damage to our reputation. Such fraudulent activity may take many forms, including check fraud, electronic fraud, wire fraud, phishing, social engineering, and other dishonest acts. Information security breaches and cybersecurity-related incidents may include fraudulent or unauthorized access to systems used by us or our clients, denial or degradation of service attacks, and malware, or other cyber-attacks. In recent periods, there continues to be a rise in electronic fraudulent activity, security breaches, and cyber-attacks within the financial services industry, especially in the commercial banking sector due to cyber criminals targeting commercial bank accounts. Consistent with industry trends, we have also experienced an increase in attempted electronic fraudulent activity, security breaches and cybersecurity-related incidents in recent periods. Moreover, in recent periods, several large corporations, including financial institutions and retail companies, have suffered major data breaches, in some cases exposing not only confidential and proprietary corporate information, but also sensitive financial and other personal information of their customers and employees and subjecting them to potential fraudulent activity. Some of our clients may have been affected by these breaches, which increase their risks of identity theft, credit card fraud and other fraudulent activity that could involve their accounts with us.
Information pertaining to us and our clients is maintained, and transactions are executed, on the networks and systems of us, our clients and certain of our third party partners, such as our online banking or reporting systems. The secure maintenance and transmission of confidential information, as well as execution of transactions over these systems, are essential to protect us and our clients against fraud and security breaches and to maintain our clients’ confidence. Breaches of information security also may occur, and in infrequent cases have occurred, through intentional or unintentional acts by those having access to our systems or our clients’ or counterparties’ confidential information, including employees. In addition, increases in criminal activity, levels and sophistication, advances in computer capabilities, new discoveries, vulnerabilities in third-party technologies (including browsers and operating systems) or other developments could result in a compromise or breach of the technology, processes and controls that we use to prevent fraudulent transactions and to protect data about us, our clients and underlying transactions, as well as the technology used by our clients to access our systems. Although we have developed, and continue to invest in, systems and processes that are designed to detect and prevent security breaches and cyber-attacks and periodically test our security, our inability to anticipate, or failure to adequately mitigate, breaches of security could result in: losses to us or our clients; our loss of business and/or clients; damage to our reputation; the incurrence of additional expenses; disruption to our business; our inability to grow our online services or other businesses; additional regulatory scrutiny or penalties; or our exposure to civil litigation and possible financial liability - any of which could have a material adverse effect on our business, financial condition and results of operations.
More generally, publicized information concerning security and cyber-related problems could inhibit the use or growth of electronic or web-based applications or solutions as a means of conducting commercial transactions. Such publicity may also cause damage to our reputation as a financial institution. As a result, our business, financial condition and results of operations could be adversely affected.
We are subject to operational risks relating to our technology and information systems
. The continued efficacy of our technology and information systems, related operational infrastructure and relationships with third party vendors in our ongoing operations is integral to our performance. Failure of any of these resources, including but not limited to operational or systems failures, interruptions of client service operations and ineffectiveness of or interruption in third party data processing or other vendor support, may cause material disruptions in our business, impairment of customer relations and exposure to liability for our customers, as well as action by bank regulatory authorities.
18
Our business reputation is important and any damage to it may have a material adverse effect on our business
. Our reputation is very important for our business, as we rely on our relationships with our current, former, and potential clients and stockholders in the communities we serve. Any damage to our reputation, whether arising from regulatory, supervisory or enforcement actions, matters affecting our financial reporting or compliance with SEC and exchange listing requirements, negative publicity, our conduct of our business or otherwise may have a material adverse effect on our business.
As we expand outside our California markets, we may encounter additional risks that may adversely affect us
. Currently, the majority of our offices are located in California, but we also have offices in the New York City, Chicago, Houston, Dallas, and Seattle metropolitan areas, New Jersey, Virginia, Alabama, and Georgia. Over time, we may seek to establish offices to serve Korean-American communities in other parts of the United States as well. In the course of these expansion activities, we may encounter significant risks, including unfamiliarity with the characteristics and business dynamics of new markets, increased marketing and administrative expenses and operational difficulties arising from our efforts to attract business in new markets, manage operations in noncontiguous geographic markets, comply with local laws and regulations and effectively and consistently manage our non-California personnel and business. If we are unable to manage these risks, our operations may be materially and adversely affected.
Adverse conditions in South Korea or globally may adversely affect our business
. A substantial number of our customers have economic and cultural ties to South Korea and, as a result, we are likely to feel the effects of adverse economic and political conditions there. If economic or political conditions in South Korea deteriorate, we may, among other things, be exposed to economic and transfer risk, and may experience an outflow of deposits by our customers with connections to South Korea. Transfer risk may result when an entity is unable to obtain the foreign exchange needed to meet its obligations or to provide liquidity. This may materially and adversely impact the recoverability of investments in or loans made to such entities. Adverse economic conditions in South Korea may also negatively impact asset values and the profitability and liquidity of our customers who operate in this region. In addition, a general overall decline in global economic conditions may materially and adversely affect our profitability and overall results of operations.
Our use of appraisals in deciding whether to make loans secured by real property does not ensure that the value of the real property collateral will be sufficient to repay our loans
. In considering whether to make a loan secured by real property, we require an appraisal of the property. However, an appraisal is only an estimate of the value of the property at the time the appraisal is made and requires the exercise of a considerable degree of judgment. If the appraisal does not accurately reflect the amount that may be obtained upon sale or foreclosure of the property, whether due to a decline in property value after the date of the original appraisal or defective preparation of the appraisal, we may not realize an amount equal to the indebtedness secured by the property and as a result, we may suffer losses.
Governmental regulation and regulatory actions against us may further impair our operations or restrict our growth.
We are subject to significant governmental supervision and regulation. These regulations affect our lending practices, capital structure, investment practices, dividend policy and growth, among other things. Congress and federal regulatory agencies continually review banking laws, regulations and policies for possible changes. Statutes and regulations affecting our business may be changed at any time and the interpretation of these statutes and regulations by examining authorities may also change. In addition, regulations may be adopted which increase our deposit insurance premiums and enact special assessments which could increase expenses associated with running our business and adversely affect our earnings.
There can be no assurance that such statutes and regulations, any changes thereto or to their interpretation will not adversely affect our business. In particular, these statutes and regulations, and any changes thereto, could subject us to additional costs (including legal and compliance costs), limit the types of financial services and products we may offer and/or increase the ability of non-banks to offer competing financial services and products, among other things. In addition to governmental supervision and regulation, we are subject to changes in other federal and state laws, including changes in tax laws, which could materially affect us and the banking industry generally. We are subject to the rules, regulations of, and examination by the FRB, the FDIC and the DBO, and the CFPB. In addition, we are subject to the rules and regulation of the Nasdaq Stock Market and the SEC and are subject to enforcement actions and other punitive actions by these agencies. If we fail to comply with federal and state regulations, the regulators may limit our activities or growth, impose fines on us or in the case of our bank regulators, ultimately require our bank to cease its operations. Bank regulations can hinder our ability to compete with financial services companies that are not regulated in the same manner or are less regulated. Federal and state bank regulatory agencies regulate many aspects of our operations. These areas include:
|
•
|
the capital that must be maintained;
|
|
•
|
the kinds of activities that can be engaged in;
|
|
•
|
the kinds and amounts of investments that can be made;
|
|
•
|
the locations of offices;
|
|
•
|
insurance of deposits and the premiums that we must pay for this insurance;
|
|
•
|
procedures and policies we must adopt;
|
19
|
•
|
conditions and restrictions on our executive compensation; and
|
|
•
|
how much cash we must set aside as reserves for deposits.
|
In addition, bank regulatory authorities have the authority to bring enforcement actions against banks and bank holding companies, including the Bank and Hope Bancorp, for unsafe or unsound practices in the conduct of their businesses or for violations of any law, rule or regulation, any condition imposed in writing by the appropriate bank regulatory agency or any written agreement with the authority. Enforcement actions against us could include a federal conservatorship or receivership for the bank, the issuance of additional orders that could be judicially enforced, the imposition of civil monetary penalties, the issuance of directives to enter into a strategic transaction, whether by merger or otherwise, with a third party, the termination of insurance of deposits, the issuance of removal and prohibition orders against institution-affiliated parties, and the enforcement of such actions through injunctions or restraining orders. In addition, as we have grown beyond $10 billion in assets, we are subject to enhanced CFPB examination as well as required to perform more comprehensive stress-testing on our business and operations.
SBA lending is an important part of our business. Our SBA lending program is dependent upon the federal government, and we face specific risks associated with originating SBA loans.
Our SBA lending program is dependent upon the federal government. As an SBA Preferred Lender, we enable our clients to obtain SBA loans without being subject to the potentially lengthy SBA approval process necessary for lenders that are not SBA Preferred Lenders. The SBA periodically reviews the lending operations of participating lenders to assess, among other things, whether the lender exhibits prudent risk management. When weaknesses are identified, the SBA may request corrective actions or impose enforcement actions, including revocation of the lender’s Preferred Lender status. If we lose our status as a Preferred Lender, we may lose some or all of our customers to lenders who are SBA Preferred Lenders, and as a result we could experience a material adverse effect to our financial results. Any changes to the SBA program, including changes to the level of guarantee provided by the federal government on SBA loans, may also have a material adverse effect on our business.
We historically sold the guaranteed portion of our SBA 7(a) loans in the secondary market, but during the end of 2018, we made the decision to retain most of the SBA 7(a) loans that we originate due to the low premiums being offered in the secondary market. These sales of SBA 7(a) loans have historically resulted in both premium income for us at the time of sale, and created a stream of future servicing income. We may not be able to continue originating these loans or return to selling them in the secondary market. Furthermore, even if we are able to continue originating and return to selling SBA 7(a) loans in the secondary market, we might not continue to realize premiums upon the sale of the guaranteed portion of these loans. When we sell the guaranteed portion of our SBA 7(a) loans, we incur credit risk on the non-guaranteed portion of the loans, and if a customer defaults on the non-guaranteed portion of a loan, we share any loss and recovery related to the loan pro-rata with the SBA. If the SBA establishes that a loss on an SBA guaranteed loan is attributable to significant technical deficiencies in the manner in which the loan was originated, funded or serviced by us, the SBA may seek recovery of the principal loss related to the deficiency from us, which could materially adversely affect our business, financial condition, results of operations and prospects.
The laws, regulations and standard operating procedures that are applicable to SBA loan products may change in the future. We cannot predict the effects of these changes on our business and profitability. Because government regulation greatly affects the business and financial results of all commercial banks and bank holding companies and especially our organization, changes in the laws, regulations and procedures applicable to SBA loans could adversely affect our ability to operate profitably
.
Our stock price may be volatile, which may result in substantial losses for our stockholders
. The market price of our common stock may be subject to fluctuations in response to a number of factors, including:
|
•
|
issuing new equity securities;
|
|
•
|
the amount of our common stock outstanding and the trading volume of our stock;
|
|
•
|
actual or anticipated changes in our future financial performance;
|
|
•
|
changes in financial performance estimates by us or by securities analysts;
|
|
•
|
competitive developments, including announcements by us or our competitors of new products or services or acquisitions, strategic partnerships, joint ventures or capital commitments;
|
|
•
|
the operating and stock performance of our competitors;
|
|
•
|
changes in interest rates;
|
|
•
|
changes in key personnel;
|
|
•
|
changes in economic conditions that affect the Bank’s performance; and
|
|
•
|
changes in legislation or regulations that affect the Bank.
|
20
We may raise additional capital, which could have a dilutive effect on the existing holders of our common stock and adversely affect the market price of our common stock.
We periodically evaluate opportunities to access capital markets, taking into account our financial condition, regulatory capital ratios, business strategies, anticipated asset growth and other relevant considerations. It is possible that future acquisitions, organic growth or changes in regulatory capital requirements could require us to increase the amount or change the composition of our current capital, including our common equity. For all of these reasons and others, and always subject to market conditions, we may issue additional shares of common stock or other capital securities in public or private transactions.
The issuance of additional common stock, debt, or securities convertible into or exchangeable for our common stock or that represent the right to receive common stock, or the exercise of such securities, could be substantially dilutive to holders of our common stock. Holders of our common stock have no preemptive or other rights that would entitle them to purchase their pro rata share of any offering of shares of any class or series and, therefore, such sales or offerings could result in dilution of the ownership interests of our stockholders.
We may reduce or discontinue the payment of dividends on common stock.
Our stockholders are only entitled to receive such dividends as our Board may declare out of funds legally available for such payments. Although we have historically declared cash dividends on our common stock, we are not required to do so and may reduce or eliminate our common stock dividend in the future. Our ability to pay dividends to our stockholders is subject to the restrictions set forth in Delaware law, by the FRB, and by certain covenants contained in our subordinated debentures. Notification to the FRB is also required prior to our declaring and paying a cash dividend to our stockholders during any period in which our quarterly and/or cumulative twelve-month net earnings are insufficient to fund the dividend amount, among other requirements. We may not pay a dividend if the FRB objects or until such time as we receive approval from the FRB or we no longer need to provide notice under applicable regulations. In addition, we may be restricted by applicable law or regulation or actions taken by our regulators, now or in the future, from paying dividends to our stockholders. We cannot provide assurance that we will continue paying dividends on our common stock at current levels or at all. A reduction or discontinuance of dividends on our common stock could have a material adverse effect on our business, including the market price of our common stock.
The conditional conversion features of the convertible notes issued by the Company, if met, may adversely affect our financial condition and operating results.
In the event the conditional conversion features of the convertible notes issued by the Company are met, holders of convertible notes will be entitled to convert the notes at any time during specified periods at their option. If one or more holders elect to convert their notes, unless we elect to satisfy our conversion obligation by delivering solely shares of our common stock (other than paying cash in lieu of delivering any fractional share), we would be required to settle a portion or all of our conversion obligation through the payment of cash, which could adversely affect our liquidity.
We may not have the ability to raise the funds necessary to settle conversions of the convertible notes in cash or to repurchase the convertible notes if holders of the convertible note exercise their repurchase rights or upon a fundamental change, and our future debt may contain limitations on our ability to pay cash upon conversion or repurchase of the convertible notes.
Holders of the convertible notes will have the right to require us to repurchase all or a portion of their convertible notes on certain specified dates or upon the occurrence of a fundamental change at a repurchase price equal to 100% of the principal amount of the convertible notes to be repurchased, plus accrued and unpaid special interest, if any. We may not have enough available cash or be able to obtain financing at the time we are required to repurchase convertible notes surrendered or pay cash with respect to the convertible notes being converted if we elect not to issue shares, which could harm our reputation and affect the trading price of our common stock.
The value of our securities in our investment portfolio may decline in the future.
The fair value of our investment securities may be adversely affected by market conditions, including changes in interest rates, implied credit spreads, and the occurrence of any events adversely affecting the issuer of particular securities in our investments portfolio or any given market segment or industry in which we are invested. We analyze our securities on a quarterly basis to determine if an other-than-temporary impairment has occurred. The process for determining whether impairment is other-than-temporary usually requires complex, subjective judgments about the future financial performance of the issuer in order to assess the probability of receiving all contractual principal and interest payments on the security. Because of changing economic and market conditions affecting issuers, we may be required to recognize other-than-temporary impairment in future periods, which could have a material adverse effect on our business, financial condition, or results of operations.
If we fail to maintain an effective system of internal controls and disclosure controls and procedures, we may not be able to accurately report our financial results or prevent fraud
. Effective internal control over financial reporting and disclosure controls and procedures are necessary for us to provide reliable financial reports, effectively prevent fraud and to operate successfully as a public company. If we cannot provide reliable financial reports or prevent fraud, our reputation and business would be harmed. In addition, failure in our internal control over financial reporting and disclosure controls and procedures could cause us to fail to meet the continued listing requirements of the Nasdaq Global Select Market and, as a result, adversely impact the liquidity and trading price of our securities.
21
Anti-takeover provisions in our charter documents and applicable federal and state law may limit the ability of another party to acquire us, which could cause our stock price to decline.
Various provisions of our charter documents could delay or prevent a third-party from acquiring us, even if doing so might be beneficial to our shareholders. These include, among other things, advance notice requirements to submit stockholder proposals at stockholder meetings and the authorization to issue “blank check” preferred stock by action of the Board of Directors acting alone, thus without obtaining stockholder approval. In addition, applicable provisions of federal and state law require regulatory approval in connection with certain acquisitions of our common stock and supermajority voting provisions in connection with certain transactions. In particular, both federal and state law limit the acquisition of ownership of, generally, 10% or more of our common stock without providing prior notice to the regulatory agencies and obtaining prior regulatory approval or non-objection or being able to rely on an exemption from such requirement. Collectively, these provisions of our charter documents and applicable federal and state law may prevent a merger or acquisition that would be attractive to stockholders and could limit the price investors would be willing to pay in the future for our common stock.
Our common stock is equity and therefore is subordinate to our subsidiaries’ indebtedness and preferred stock.
Our common stock constitutes equity interests and does not constitute indebtedness. As such, common stock will rank junior to all current and future indebtedness and other non-equity claims on us with respect to assets available to satisfy claims against us, including in the event of our liquidation. We may, and the bank and our other subsidiaries may also, incur additional indebtedness from time to time and may increase our aggregate level of outstanding indebtedness. Additionally, holders of common stock are subject to the prior dividend and liquidation rights of any holders of our preferred stock that may be outstanding from time to time. The Board of Directors is authorized to cause us to issue additional classes or series of preferred stock without any action on the part of our stockholders. If we issue preferred shares in the future that have a preference over our common stock with respect to the payment of dividends or upon liquidation, or if we issue preferred shares with voting rights that dilute the voting power of the common stock, then the rights of holders of our common stock or the market price of our common stock could be materially adversely affected.
Our common stock is not insured and you could lose the value of your entire investment.
An investment in our common stock is not a deposit and is not insured against loss by any government agency.
Implementation of the various provisions of the Dodd-Frank Act-in particular provisions that are applicable to banks and bank holding companies with $10 billion or more in assets-may delay the receipt of regulatory approvals and increase our operating costs or otherwise have a material effect on our financial condition, results of operations and stock price.
The Dodd-Frank Wall Street Reform and Consumer Protection Act (the “Dodd-Frank Act”) enacted in 2010 significantly changes the bank regulatory structure and affects the lending, deposit, investment, trading and operating activities of financial institutions and their holding companies. The Dodd-Frank Act requires various federal agencies to adopt a broad range of new implementing rules and regulations and to prepare numerous studies and reports for Congress. The federal agencies are given significant discretion in drafting the implementing rules and regulations, and the rule-making process is still underway.
Several requirements in the Dodd-Frank Act for new banking regulations are applicable to certain banks and bank holding companies with $10 billion or more in assets. As a result of the merger, we surpassed this threshold, and these provisions, subject to a phase in period, will significantly increase compliance and operating costs and otherwise may have a significant impact on our business, financial condition, results of operations and stock price. Such provisions include the following:
|
•
|
The Dodd-Frank Act created the CFPB, which has broad powers to supervise and enforce consumer protection laws. The CFPB has broad rule-making authority for a wide range of consumer protection laws that apply to all banks, including the authority to prohibit “unfair, deceptive or abusive” acts and practices. The CFPB has examination and enforcement authority over all banks with more than $10 billion in assets, and accordingly has assumed examination and enforcement authority over us post-merger.
|
|
•
|
The Dodd-Frank Act increased the authority of the FRB to examine us and our non-bank subsidiaries and gave the FRB the authority to establish rules regarding interchange fees charged for an electronic debit transaction by a payment card issuer that, together with its affiliates, has assets of $10 billion or more, and to enforce a new statutory requirement that such fees be reasonable and proportional to the actual cost of a transaction to the issuer (the “Durbin Amendment”). By regulation, the FRB has limited the fees for such a transaction to the sum of 21 cents plus five basis points times the value of the transaction, plus up to one cent for fraud prevention costs. The effect of the Durbin Amendment has significantly lowered our interchange or “swipe” revenue, but such lower fees are not expected to have a material adverse effect on our results of operations.
|
|
•
|
The Dodd-Frank Act established 1.35% as the minimum Designated Reserve Ratio (“DRR”). The FDIC has determined that the DRR should be 2.0% and has adopted a plan under which it will meet the statutory minimum DRR of 1.35% by the statutory deadline of September 30, 2020. The Dodd-Frank Act requires the FDIC to offset the effect of the increase in the statutory minimum DRR to 1.35% from the former statutory minimum of 1.15% on institutions with assets less than $10 billion. As a result of the merger, we are no longer entitled to benefit from the offset.
|
22
It is difficult to predict the overall compliance cost of these provisions, which became effective (with phase-in periods) when the merger was consummated. Compliance with these provisions will require additional staffing, engagement of external consultants and other operating costs that could have a material adverse effect on our future financial condition, results of operations and stock price.
23
|
Item
1B.
|
UNRESOLVED STAFF COMMENTS
|
None.
|
Item 2.
|
PROPERTIES
|
Our principal executive offices are located at 3200 Wilshire Blvd., Suite 1400, Los Angeles, California 90010. As of
December 31, 2018
, we operated full-service branches at 56 leased and seven owned facilities, and we operated loan production offices at 11 leased facilities. Expiration dates of our leases range from 2019 to 2030. We believe our present facilities are suitable and adequate for our current operating needs.
|
Item 3.
|
LEGAL PROCEEDINGS
|
In the normal course of business, we are involved in various legal claims. We have reviewed all legal claims against us with counsel and have taken into consideration the views of such counsel as to the potential outcome of the claims. Accrued loss contingencies for all legal claims totaled approximately $755 thousand at
December 31, 2018
. It is reasonably possible we may incur losses in addition to the amounts we have accrued. However, at this time, we are unable to estimate the range of additional losses that are reasonably possible because of a number of factors, including the fact that certain of these litigation matters are still in their early stages and involve claims for which, at this point, we believe have little to no merit. Management has considered these and other possible loss contingencies and does not expect the amounts to be material to any of the consolidated financial statements.
|
Item 4.
|
MINE SAFETY DISCLOSURES
|
Not applicable.
24
Part II
|
Item 5.
|
MARKET FOR REGISTRANT’S COMMON EQUITY, RELATED STOCKHOLDER MATTERS AND ISSUER PURCHASES OF EQUITY SECURITIES
|
Our common stock is traded on the NASDAQ Global Select Market under the symbol “HOPE.”
The closing price for our common stock on the NASDAQ Global Select Market on
February 25, 2019
was $14.68 per share.
As of
February 25, 2019
, there were 1,200 stockholders of record of our common stock.
Stock Performance Graph
The following graph compares the yearly percentage change in the cumulative total shareholder return (stock price appreciation plus reinvested dividends) on our common stock with (i) the cumulative total return of the NASDAQ Composite Index, (ii) the cumulative total return of the S&P Small Cap 600 Index, (iii) a published index comprised of banks and thrifts selected by SNL Financial LLC, and (iv) the cumulative total return of the S&P 500 Index. The graph assumes an initial investment of $100 and reinvestment of dividends. Points on the graph represent the performance as of the last business day of each of the years indicated. The graph is not indicative of future price performance. The graph does not constitute soliciting material and shall not be deemed filed or incorporated by reference into any filing by Hope Bancorp under the Securities Act of 1933, as amended, or the Securities Exchange Act of 1934, as amended, except to the extent that we may specifically incorporate this graph by reference.
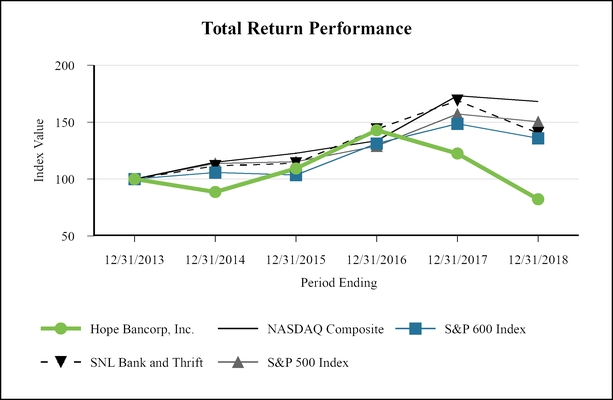
ASSUMES $100 INVESTED ON DECEMBER 31, 2013
ASSUMES DIVIDENDS REINVESTED
FISCAL YEAR ENDING DECEMBER 31, 2018
|
|
Period Ending
|
||||||||||
|
Stock/Index
|
12/31/2013
|
12/31/2014
|
12/31/2015
|
12/31/2016
|
12/31/2017
|
12/31/2018
|
|||||
|
Hope Bancorp, Inc.
|
$100.00
|
$88.77
|
$109.30
|
$143.04
|
$122.44
|
$82.21
|
|||||
|
NASDAQ Composite
|
$100.00
|
$114.75
|
$122.74
|
$133.62
|
$173.22
|
$168.30
|
|||||
|
S&P 600 Index
|
$100.00
|
$105.76
|
$103.67
|
$131.20
|
$148.56
|
$135.96
|
|||||
|
SNL Bank and Thrift
|
$100.00
|
$111.63
|
$113.89
|
$143.78
|
$169.07
|
$140.45
|
|||||
|
S&P 500 Index
|
$100.00
|
$113.69
|
$115.26
|
$129.05
|
$157.22
|
$150.33
|
|||||
Share Repurchase Program
On April 26, 2018, our Board of Directors approved a share repurchase program that authorized the repurchase of up to $100.0 million in common stock. We completed the repurchase of $100.0 million in common stock in July 2018. Subsequently on September 20, 2018, the Board of Directors approved another share repurchase program that authorized the repurchase of up to $50.0 million in common stock. We completed the repurchase of $50.0 million in common stock in November 2018. Altogether, we repurchased approximately 9.0 million shares totaling $150.0 million in 2018 at an average weighted price of $16.65.
The following table summarizes share repurchase activities during the fourth quarter of 2018:
|
Period
|
Total Number of Shares Purchased
|
Average Price Paid per Share
|
Total Number of Shares Purchased as Part of Publicly Announced Program
|
Approximate Dollar Value of Shares that May Yet Be Purchased Under the Program
|
||||||||||
|
(Dollars in thousands)
|
||||||||||||||
|
October 1, 2018 to October 31, 2018
|
1,296,969
|
|
$
|
14.00
|
|
1,296,969
|
|
$
|
31,798
|
|
||||
|
November 1, 2018 to November 30, 2018
|
2,139,788
|
|
14.83
|
|
2,139,788
|
|
—
|
|
||||||
|
December 1, 2018 to December 31, 2018
|
—
|
|
—
|
|
—
|
|
—
|
|
||||||
|
Total
|
3,436,757
|
|
$
|
14.52
|
|
3,436,757
|
|
|
|
|||||
25
|
Item 6.
|
SELECTED FINANCIAL DATA
|
The following table presents selected financial and other data for each of the years in the five-year period ended
December 31, 2018
. The information below should be read in conjunction with, the more detailed information included elsewhere herein, including our Audited Consolidated Financial Statements and Notes thereto.
|
|
As of or For The Year Ended December 31,
|
||||||||||||||||||
|
|
2018
|
2017
|
2016
|
2015
|
2014
|
||||||||||||||
|
|
(Dollars in thousands, except share and per share data)
|
||||||||||||||||||
|
Income Statement Data:
|
|||||||||||||||||||
|
Interest income
|
$
|
650,172
|
|
$
|
572,104
|
|
$
|
421,934
|
|
$
|
313,660
|
|
$
|
302,657
|
|
||||
|
Interest expense
|
162,245
|
|
90,724
|
|
58,579
|
|
40,618
|
|
36,060
|
|
|||||||||
|
Net interest income
|
487,927
|
|
481,380
|
|
363,355
|
|
273,042
|
|
266,597
|
|
|||||||||
|
Provision for loan losses
|
14,900
|
|
17,360
|
|
9,000
|
|
8,000
|
|
12,638
|
|
|||||||||
|
Net interest income after provision for loan losses
|
473,027
|
|
464,020
|
|
354,355
|
|
265,042
|
|
253,959
|
|
|||||||||
|
Noninterest income
|
60,180
|
|
66,415
|
|
51,819
|
|
43,691
|
|
44,187
|
|
|||||||||
|
Noninterest expense
|
277,726
|
|
266,601
|
|
214,975
|
|
153,384
|
|
151,624
|
|
|||||||||
|
Income before income tax provision
|
255,481
|
|
263,834
|
|
191,199
|
|
155,349
|
|
146,522
|
|
|||||||||
|
Income tax provision
|
65,892
|
|
124,389
|
|
77,452
|
|
63,091
|
|
57,907
|
|
|||||||||
|
Net income
|
$
|
189,589
|
|
$
|
139,445
|
|
$
|
113,747
|
|
$
|
92,258
|
|
$
|
88,615
|
|
||||
|
Per Common Share Data:
|
|
||||||||||||||||||
|
Earnings - basic
|
$
|
1.44
|
|
$
|
1.03
|
|
$
|
1.10
|
|
$
|
1.16
|
|
$
|
1.11
|
|
||||
|
Earnings - diluted
|
$
|
1.44
|
|
$
|
1.03
|
|
$
|
1.10
|
|
$
|
1.16
|
|
$
|
1.11
|
|
||||
|
Book value (period end)
|
$
|
15.03
|
|
$
|
14.23
|
|
$
|
13.72
|
|
$
|
11.79
|
|
$
|
11.10
|
|
||||
|
Cash dividends declared per common share
|
$
|
0.54
|
|
$
|
0.50
|
|
$
|
0.45
|
|
$
|
0.42
|
|
$
|
0.35
|
|
||||
|
Number of common shares outstanding (period end)
|
126,639,912
|
|
135,511,891
|
|
135,240,079
|
|
79,566,356
|
|
79,503,552
|
|
|||||||||
|
Balance Sheet Data—At Period End:
|
|||||||||||||||||||
|
Assets
|
$
|
15,305,952
|
|
$
|
14,206,717
|
|
$
|
13,441,422
|
|
$
|
7,912,648
|
|
$
|
7,140,330
|
|
||||
|
Securities available for sale
|
$
|
1,846,265
|
|
$
|
1,720,257
|
|
$
|
1,556,740
|
|
$
|
1,010,556
|
|
$
|
792,523
|
|
||||
|
Loans receivable, net of unearned loan fees and discounts (excludes loans held for sale)
|
$
|
12,098,115
|
|
$
|
11,102,575
|
|
$
|
10,543,332
|
|
$
|
6,248,341
|
|
$
|
5,565,192
|
|
||||
|
Deposits
|
$
|
12,155,656
|
|
$
|
10,846,609
|
|
$
|
10,642,035
|
|
$
|
6,340,976
|
|
$
|
5,693,452
|
|
||||
|
FHLB advances and federal funds purchased
|
$
|
821,280
|
|
$
|
1,227,593
|
|
$
|
754,290
|
|
$
|
530,591
|
|
$
|
480,975
|
|
||||
|
Subordinated debentures
|
$
|
101,929
|
|
$
|
100,853
|
|
$
|
99,808
|
|
$
|
42,327
|
|
$
|
42,158
|
|
||||
|
Convertible notes, net
|
$
|
194,543
|
|
$
|
—
|
|
$
|
—
|
|
$
|
—
|
|
$
|
—
|
|
||||
|
Stockholders’ equity
|
$
|
1,903,211
|
|
$
|
1,928,255
|
|
$
|
1,855,473
|
|
$
|
938,095
|
|
$
|
882,773
|
|
||||
|
Average Balance Sheet Data:
|
|
||||||||||||||||||
|
Assets
|
$
|
14,749,166
|
|
$
|
13,648,963
|
|
$
|
10,342,063
|
|
$
|
7,389,530
|
|
$
|
6,830,244
|
|
||||
|
Securities available for sale
|
$
|
1,772,080
|
|
$
|
1,679,468
|
|
$
|
1,276,068
|
|
$
|
871,010
|
|
$
|
713,775
|
|
||||
|
Gross loans, including loans held for sale
|
$
|
11,547,022
|
|
$
|
10,642,349
|
|
$
|
8,121,897
|
|
$
|
5,846,658
|
|
$
|
5,355,243
|
|
||||
|
Deposits
|
$
|
11,628,177
|
|
$
|
10,751,886
|
|
$
|
8,232,984
|
|
$
|
5,879,704
|
|
$
|
5,439,920
|
|
||||
|
Stockholders’ equity
|
$
|
1,910,224
|
|
$
|
1,907,746
|
|
$
|
1,342,954
|
|
$
|
912,609
|
|
$
|
848,443
|
|
||||
26
|
|
As of or For The Year Ended December 31,
|
||||||||||||||||||
|
|
2018
|
2017
|
2016
|
2015
|
2014
|
||||||||||||||
|
|
(Dollars in thousands)
|
||||||||||||||||||
|
Selected Performance Ratios:
|
|||||||||||||||||||
|
Return on average assets
(1)
|
1.29
|
%
|
1.02
|
%
|
1.10
|
%
|
1.25
|
%
|
1.30
|
%
|
|||||||||
|
Return on average stockholders’ equity
(2)
|
9.92
|
%
|
7.31
|
%
|
8.47
|
%
|
10.11
|
%
|
10.44
|
%
|
|||||||||
|
Average stockholders’ equity to average assets
|
12.95
|
%
|
13.98
|
%
|
12.99
|
%
|
12.35
|
%
|
12.42
|
%
|
|||||||||
|
Dividend payout ratio
(dividends per share/earnings per share) |
37.58
|
%
|
48.54
|
%
|
40.86
|
%
|
36.21
|
%
|
31.53
|
%
|
|||||||||
|
Net interest spread
(3)
|
3.04
|
%
|
3.46
|
%
|
3.49
|
%
|
3.62
|
%
|
3.88
|
%
|
|||||||||
|
Net interest margin
(4)
|
3.53
|
%
|
3.80
|
%
|
3.75
|
%
|
3.88
|
%
|
4.13
|
%
|
|||||||||
|
Yield on interest earning assets
(5)
|
4.71
|
%
|
4.51
|
%
|
4.36
|
%
|
4.46
|
%
|
4.68
|
%
|
|||||||||
|
Cost of interest bearing liabilities
(6)
|
1.67
|
%
|
1.05
|
%
|
0.87
|
%
|
0.84
|
%
|
0.80
|
%
|
|||||||||
|
Efficiency ratio
(7)
|
50.67
|
%
|
48.67
|
%
|
51.78
|
%
|
48.43
|
%
|
48.79
|
%
|
|||||||||
|
Regulatory Capital Ratios:
|
|||||||||||||||||||
|
Hope Bancorp:
|
|||||||||||||||||||
|
Common Equity Tier 1
|
11.44
|
%
|
12.30
|
%
|
12.10
|
%
|
12.08
|
%
|
12.96
|
%
|
|||||||||
|
Tier 1 Leverage
|
10.55
|
%
|
11.54
|
%
|
11.49
|
%
|
11.53
|
%
|
11.62
|
%
|
|||||||||
|
Tier 1 risk-based
|
12.21
|
%
|
13.11
|
%
|
12.92
|
%
|
12.67
|
%
|
13.64
|
%
|
|||||||||
|
Total risk-based
|
12.94
|
%
|
13.82
|
%
|
13.64
|
%
|
13.80
|
%
|
14.80
|
%
|
|||||||||
|
Bank of Hope:
|
|||||||||||||||||||
|
Common Equity Tier 1
|
13.63
|
%
|
12.95
|
%
|
12.75
|
%
|
12.56
|
%
|
13.44
|
%
|
|||||||||
|
Tier 1 Leverage
|
11.76
|
%
|
11.40
|
%
|
11.33
|
%
|
11.43
|
%
|
11.45
|
%
|
|||||||||
|
Tier I risk-based
|
13.63
|
%
|
12.95
|
%
|
12.75
|
%
|
12.56
|
%
|
13.44
|
%
|
|||||||||
|
Total risk-based
|
14.36
|
%
|
13.66
|
%
|
13.46
|
%
|
13.69
|
%
|
14.61
|
%
|
|||||||||
|
Asset Quality Data:
|
|||||||||||||||||||
|
Nonaccrual loans
|
$
|
53,286
|
|
$
|
46,775
|
|
$
|
40,074
|
|
$
|
40,801
|
|
$
|
46,353
|
|
||||
|
Loans 90 days or more past due and still accruing
(8)
|
1,529
|
|
407
|
|
305
|
|
375
|
|
361
|
|
|||||||||
|
Restructured loans (accruing)
|
50,410
|
|
67,250
|
|
48,874
|
|
47,984
|
|
57,128
|
|
|||||||||
|
Total nonperforming loans
|
105,225
|
|
114,432
|
|
89,253
|
|
89,160
|
|
103,842
|
|
|||||||||
|
Other real estate owned
|
7,754
|
|
10,787
|
|
21,990
|
|
21,035
|
|
21,938
|
|
|||||||||
|
Total nonperforming assets
|
$
|
112,979
|
|
$
|
125,219
|
|
$
|
111,243
|
|
$
|
110,195
|
|
$
|
125,780
|
|
||||
|
Asset Quality Ratios:
|
|||||||||||||||||||
|
Nonaccrual loans to loans receivable
|
0.44
|
%
|
0.42
|
%
|
0.38
|
%
|
0.65
|
%
|
0.83
|
%
|
|||||||||
|
Nonperforming loans to loans receivable
|
0.87
|
%
|
1.03
|
%
|
0.85
|
%
|
1.43
|
%
|
1.87
|
%
|
|||||||||
|
Nonperforming assets to total assets
|
0.74
|
%
|
0.88
|
%
|
0.83
|
%
|
1.39
|
%
|
1.76
|
%
|
|||||||||
|
Nonperforming assets to loans receivable and
other real estate owned
|
0.93
|
%
|
1.13
|
%
|
1.05
|
%
|
1.76
|
%
|
2.25
|
%
|
|||||||||
|
Allowance for loan losses to loans receivable
|
0.77
|
%
|
0.76
|
%
|
0.75
|
%
|
1.22
|
%
|
1.22
|
%
|
|||||||||
|
Allowance for loan losses to nonaccrual loans
|
173.70
|
%
|
180.74
|
%
|
197.99
|
%
|
187.27
|
%
|
146.18
|
%
|
|||||||||
|
Allowance for loan losses to nonperforming loans
|
87.96
|
%
|
73.88
|
%
|
88.90
|
%
|
85.70
|
%
|
65.25
|
%
|
|||||||||
|
Allowance for loan losses to nonperforming assets
|
81.92
|
%
|
67.51
|
%
|
71.32
|
%
|
69.34
|
%
|
53.87
|
%
|
|||||||||
|
Net charge-offs (recoveries) to average loans receivable
|
0.06
|
%
|
0.11
|
%
|
0.07
|
%
|
(0.01
|
)%
|
0.23
|
%
|
|||||||||
|
(1)
|
Net income divided by average assets.
|
|
(2)
|
Net income divided by average stockholders’ equity.
|
|
(3)
|
Difference between the average yield earned on interest earning assets and the average rate paid on interest bearing liabilities.
|
|
(4)
|
Net interest income expressed as a percentage of average interest earning assets.
|
|
(5)
|
Interest income divided by average interest earning assets.
|
|
(6)
|
Interest expense divided by average interest bearing liabilities.
|
|
(7)
|
Noninterest expense divided by the sum of net interest income plus noninterest income.
|
|
(8)
|
Excludes acquired credit impaired loans totaling $14.1 million, $18.1 million, $19.6 million, $12.2 million, and $30.4 million as of December 31, 2018, 2017, 2016, 2015, and 2014, respectively.
|
27
|
Item 7.
|
MANAGEMENT’S DISCUSSION AND ANALYSIS OF FINANCIAL CONDITION AND RESULTS OF OPERATIONS
|
You should read the following discussion and analysis of our financial condition and results of operations together with our Consolidated Financial Statements and accompanying notes presented elsewhere in this Report. This discussion and analysis contains forward-looking statements that involve risks, uncertainties and assumptions. Our actual results may differ materially from those anticipated in these forward-looking statements as a result of many factors, including those set forth under Item 1A “Risk Factors” and elsewhere in this Report. Please see the “Forward Looking Information” immediately preceding Part I of this Report.
Overview
We offer a full range of commercial and retail banking loan and deposit products through Bank of Hope. We have 63 banking offices in California, New York/New Jersey, Illinois, Washington, Texas, Virginia, Alabama, and Georgia. We have 11 loan production offices located in Atlanta, Dallas, Denver, Portland, Seattle, Fremont, and in Southern California We offer our banking services through our network of banking offices and loan production offices to our customers who typically are small to medium-sized businesses in our market areas. We accept deposits and originate a variety of loans including commercial business loans, commercial real estate loans, trade finance loans, SBA loans, and consumer loans.
Our results are affected by economic conditions in our markets and to a lesser degree in South Korea. A decline in economic and business conditions in our market areas or in South Korea may have a material adverse impact on the quality of our loan portfolio or the demand for our products and services, which in turn may have a material adverse effect on our financial condition and results of operations.
Our principal business involves earning interest on loans and investment securities that are funded primarily by customer deposits and other borrowings. Our operating income and net income are derived primarily from the difference between interest income received from interest earning assets and interest expense paid on interest bearing liabilities and, to a lesser extent, from fees received in connection with servicing loan and deposit accounts and income from the sale of loans. Historically, we sold most the guaranteed portion of SBA loans we originated on the secondary market, but due to the reduced premiums received on secondary market for SBA guaranteed sales, we made the decision to retain the loans on our balance sheet. Our major expenses are the interest we pay on deposits and borrowings, provisions for loan losses and general operating expenses, which primarily consist of salaries and employee benefits, occupancy costs, and other operating expenses. Interest rates are highly sensitive to many factors that are beyond our control, such as changes in the national economy and in the related monetary policies of the FRB, inflation, unemployment, consumer spending and political changes and events. We cannot predict the impact that these factors and future changes in domestic and foreign economic and political conditions might have on our performance.
Mergers and Acquisitions
On January 23, 2017, we announced the signing of a definitive agreement and plan of merger (the “U & I Merger Agreement”) with U & I Financial Corporation (“U & I”) pursuant to which U & I would have merged with and into Hope Bancorp with Hope Bancorp as the surviving corporation. As part of the merger, UniBank, a wholly-owned subsidiary of U & I, would have merged with and into the Bank. Subsequently on September 15, 2017, we announced the termination of the proposed merger with U & I as regulatory approval had not been obtained. The Mutual Termination Agreement provides, among other things, that each party will bear its own costs and expenses in connection with the terminated transaction, without penalties or termination fees. In connection with the termination, the parties have provided mutual releases to one another relating to the merger transaction.
On July 29, 2016, we completed the merger with Wilshire Bancorp, Inc (“Wilshire”). Through the merger, we acquired Wilshire’s thirty-five full-service branch offices, twenty-two of which were located in California, eight in New York and New Jersey, three in Texas, and one of each in Georgia and Alabama. Under the terms of the Merger Agreement, Wilshire shareholders had the right to receive 0.7034 of a share of our common stock in exchange for each share of Wilshire common stock they own in a 100% stock-for-stock transaction.
Each acquisition was accounted for as an acquisition in accordance with the acquisition method of accounting as detailed in Accounting Standards Codification (“ASC”) 805,
Business Combinations
. The acquisition method of accounting requires an acquirer to recognize the assets acquired, the liabilities assumed, and any non-controlling interest in the acquiree based on their fair values as of the date of acquisition. This process is heavily reliant on measuring and estimating the fair values of all the assets and liabilities of the acquired entities. To the extent we did not have the requisite expertise to determine the fair values of the assets acquired and liabilities assumed, we engaged third party valuation specialists to assist us in determining such values.
28
Critical Accounting Policies
Our financial statements are prepared in accordance with generally accepted accounting principles in the United States of America (“GAAP”) and generally accepted practices within the banking industry. The financial information contained within these statements is, to a significant extent, financial information that is based on approximate measures of the financial effects of transactions and events that have already occurred. All of our significant accounting policies are described in Note 1 of our Consolidated Financial Statements presented elsewhere in this Report and are essential to understanding Management’s Discussion and Analysis of Financial Condition and Results of Operations. GAAP requires management to make estimates and judgments that affect the reported amounts of assets and liabilities, revenues and expenses, and related disclosures of contingent assets and liabilities at the date of our financial statements. Actual results may materially and adversely differ from these estimates under different assumptions or conditions.
The following is a summary of the more subjective and complex accounting estimates and principles affecting the financial condition and results reported in our financial statements. In each area, we have identified the variables we believe to be the most important in the estimation process. We use the best information available to us to make the estimations necessary to value the related assets and liabilities in each of these areas.
Business Combinations
Mergers and acquisitions are accounted for in accordance with ASC 805 “Business Combinations” using the acquisition method of accounting. Assets and liabilities acquired and assumed are generally recorded at their fair values as of the date of the transaction. The excess of purchase price over the fair value of assets acquired and liabilities assumed is recorded as goodwill. Significant estimates and judgments are involved in the fair valuation and purchase price allocation process. Critical accounting policies related to acquired loans is discussed in more detail below under “Acquired Loans and Purchase Credit Impaired Loans”.
Investment Securities
The fair values of investment securities are generally determined by quoted market prices obtained from independent external broker or external pricing services providers who have experience in valuing these securities. We perform a monthly analysis on the broker quotes received from third parties to assess whether the prices represent a reasonable estimate of the fair value. The procedures include, but are not limited to, initial and on-going review of third party pricing methodologies as well as independent auditors’ reports from the third party regarding its controls over valuation of financial instruments, review of pricing trends and monitoring of trading volumes. We also compare the market prices obtained from one source to another reputable independent external broker or independent external pricing service provider for the reasonableness of the initial market prices obtained on a quarterly basis. We did not adjust any of the prices provided to us by the independent pricing services at
December 31, 2018
or
2017
.
We evaluate securities for other-than-temporary impairment on at least a quarterly basis, and more frequently when economic or market concerns warrant such evaluation. Consideration is given to the financial condition and near-term prospects of the issuer; the length of time and the extent to which the fair value has been less than cost, and our intention to sell, or whether it is more likely than not that we will be required to sell, a security in an unrealized loss position before recovery of its amortized cost basis. In analyzing an issuer’s financial condition, we consider whether the securities are issued by the federal government or its agencies, whether downgrades by bond rating agencies have occurred, and the results of reviews of the issuer’s financial condition. We do not believe that we had any investment securities available for sale with unrealized losses that would be deemed to be other-than-temporarily impaired as of
December 31, 2018
. Investment securities are discussed in more detail under “Financial Condition—Investment Securities Portfolios” below.
Allowance for Loan Losses
Accounting for the allowance for loan losses involves significant judgments and assumptions by management, which has a material impact on the carrying value of net loans. The judgments and assumptions used by management are based on historical data and management’s analysis of other qualitative factors, including the current economic environment as described under “Financial Condition—Allowance for Loan Losses” below.
Purchased Credit Impaired (“PCI”) Loans
In accordance with ASC 310-30, PCI loans were aggregated into pools based on individually evaluated common risk characteristics and expected cash flows were estimated on a pool basis. Each pool is accounted for as a single asset with a single interest rate, cumulative loss rate and cash flow expectation. A loan will be removed from a pool of loans at its carrying value only if the loan is sold or foreclosed, assets are received in satisfaction of the loan or the loan is written off.
29
The cash flows expected to be received over the life of the pools were estimated by management with the assistance of a third party valuation specialist. These cash flows were utilized in calculating the carrying values of the pools and underlying loans, book yields, effective interest income and impairment, if any, based on actual and projected events. Default rates, loss severity and prepayment speeds assumptions are periodically reassessed and updated within the accounting model to update the expectation of future cash flows. The excess of the cash expected to be collected over the pool’s carrying value is considered to be the accretable yield and is recognized as interest income over the estimated life of the loan pool using the effective interest yield method. The accretable yield will change due to changes in the timing and amounts of expected cash flows. Changes in the accretable yield are disclosed quarterly.
The excess of the contractual balances due over the cash flows expected to be collected is considered to be nonaccretable difference. The nonaccretable difference represents our estimate of the credit losses expected to occur and was considered in determining the fair value of the loans as of their acquisition date. Subsequent to their acquisition date, any increases in expected cash flows over those expected at the acquisition date in excess of fair value are adjusted through the accretable difference on a prospective basis. Any subsequent decreases in expected cash flows over those expected at their acquisition date are recognized by recording a provision for loan losses.
PCI loans that met the criteria for nonaccrual of interest prior to the acquisition are considered performing upon acquisition, regardless of whether the customer is contractually delinquent, if we can reasonably estimate the timing and amount of the expected cash flows on such loans and if we expect to collect the new carrying value of the loans in full. As such, we no longer consider the loan to be nonaccrual or nonperforming and accrue interest on these loans, including the impact of any accretable discount. We have determined that we can reasonably estimate future cash flows on any such acquired loans that are past due 90 days or more and on which we are accruing interest and we expect to fully collect the carrying value of the loans.
Goodwill
We assess goodwill for impairment annually. Before applying the two-step goodwill impairment test, in accordance with ASC 350 “
Intangibles - Goodwill and Other”
, we make a qualitative assessment of whether it is more likely than not that a reporting unit’s fair value is less than its carrying amount. If we conclude that it is not more likely than not that the fair value of a reporting unit is less than its carrying amount, we do not perform the two-step impairment test. We assessed certain qualitative factors to determine whether impairment was likely including: our market capitalization, capital adequacy, continued performance compared to peers, and continued improvement in asset quality trends, among others. Based on our qualitative assessment, we were not required to perform the two-step impairment test as of
December 31, 2018
.
Goodwill may also be tested for impairment on an interim basis if circumstances change or an event occurs between annual tests that would more likely than not reduce the fair value of the reporting unit below its carrying amount. Significant judgment is applied when goodwill is assessed for impairment. This judgment includes developing cash flow projections, selecting appropriate discount rates, identifying relevant market comparables, incorporating general economic and market conditions and selecting an appropriate control premium. The selection and weighting of the various fair value techniques may result in a higher or lower fair value. Judgment is applied in determining the weighting that is most representative of fair value.
Income Taxes
The provision for income taxes is based on income reported for financial statement purposes, and differs from the amount of taxes currently payable, since certain income and expense items are reported for financial statement purposes in different periods than those for tax reporting purposes. Taxes are discussed in more detail in Note 11 to our Consolidated Financial Statements presented elsewhere in this Report. Accrued taxes represent the net estimated amount due or to be received from taxing authorities. In estimating accrued taxes, we assess the relative merits and risks of the appropriate tax treatment of transactions taking into account statutory, judicial, and regulatory guidance in the context of our tax position. We account for income taxes using the asset and liability approach, the objective of which is to establish deferred tax assets and liabilities for the temporary differences between the financial reporting basis and the tax basis of our assets and liabilities at enacted tax rates expected to be in effect when such amounts are realized or settled. Deferred tax assets are reduced by a valuation allowance when, in the opinion of management, it is more likely than not that some portion, or all, of the deferred tax asset will not be realized. In assessing the realization of deferred tax assets, management evaluates both positive and negative evidence, including the existence of any cumulative losses in the current year and the prior two years, the amount of taxes paid in available carry-back years, the forecasts of future income and taxable income, applicable tax planning strategies, and assessments of current and future economic and business conditions. This analysis is updated quarterly and adjusted as necessary.
30
Section 382 of the Internal Revenue Code imposes a limitation (“382 Limitation”) on a corporation’s ability to use any net unrealized built in losses and other tax attributes, such as net operating loss and tax credit carry-forwards, when it undergoes a 50% ownership change over a designated testing period not to exceed three years (“382 Ownership Change”). As a result of the acquisition on July 29, 2016, Wilshire Bancorp underwent a 382 Ownership Change resulting in a 382 Limitation to its net operating loss and tax credit carry-forwards. Wilshire Bancorp did not have a net unrealized built in loss as of the 382 Ownership Change date. Given the applicable 382 Limitation, we expect to fully utilize Wilshire Bancorp’s net operating loss and tax credit carry-forwards before expiration. However, future transactions, such as issuances of common stock or sales of shares of our stock by certain holders of our shares, including persons who have held, currently hold or may accumulate in the future 5% or more of our outstanding common stock for their own account, could trigger a future Section 382 Ownership Change, which could limit our use of these tax attributes.
On December 22, 2017, the U.S. government enacted comprehensive tax legislation commonly referred to as the Tax Cuts and Jobs Act (“Tax Act”). Among other changes, the Tax Act reduces the U.S. federal corporate tax rate from 35% to 21%. We reasonably estimated the effects of the Tax Act and recorded a provisional amount increasing income tax expense by $25.4 million for the year ended December 31, 2017 in accordance with SEC Staff Accounting Bulletin No. 118 (“SAB 118”). This amount is comprised of the re-measurement of federal net deferred tax assets and impairment of the low-income housing investment, resulting from the permanent reduction in the U.S. statutory corporate tax rate to 21% from 35%. As required by SAB 118, we continued to reassess and refine the effects of the Tax Act on its deferred tax amounts during 2018. As a result, we recorded an income tax expense of $442 thousand during the year ended December 31, 2018. As of December 31, 2018, we have completed the accounting for the income tax effects of the Tax Act. See Note 11 to the consolidated financial statements for further details.
31
Results of Operations
Operations Summary
Our most significant source of income is net interest income, which is the difference between our interest income and our interest expense. Generally, interest income is generated from the loans we extend to our customers and from investments, and interest expense is generated from interest bearing deposits our customers have with us and from borrowings that we may have, such as FHLB advances, federal funds purchased, convertible notes, and subordinated debentures. Our ability to generate profitable levels of net interest income is largely dependent on our ability to manage the levels of interest earning assets and interest bearing liabilities, and the rates received or paid on them, as well as our ability to maintain sound asset quality and appropriate levels of capital and liquidity. As mentioned above, interest income and interest expense may fluctuate based on factors beyond our control, such as economic or political conditions.
We attempt to minimize the effect of interest rate fluctuations on net interest margin by monitoring our interest sensitive assets and our interest sensitive liabilities. Net interest income can be affected by a change in the composition of assets and liabilities, such as replacing higher yielding loans with a like amount of lower yielding investment securities. Changes in the level of nonaccrual loans and changes in volume and interest rates can also affect net interest income. Volume changes are caused by differences in the level of interest earning assets and interest bearing liabilities. Interest rate changes result from differences in yields earned on assets and rates paid on liabilities.
The other source of our income is noninterest income, including service charges and fees on deposit accounts, loan servicing fees, fees from trade finance activities, net gains on sale of loans that were held for sale and investment securities available for sale, and other income and fees. Our noninterest income can be reduced by charges for other than temporary impairment on investment securities.
In addition to interest expense, our income is impacted by provisions for loan losses and noninterest expense, primarily salaries and benefits and occupancy expense. The following table presents our condensed consolidated statements of income and the increases year over year.
|
|
Year Ended December 31, 2018
|
Increase (Decrease)
|
Year Ended December 31, 2017
|
Increase
|
Year Ended December 31, 2016
|
||||||||||||||||||||
|
Amount
|
%
|
Amount
|
%
|
||||||||||||||||||||||
|
(Dollars in thousands)
|
|||||||||||||||||||||||||
|
Interest income
|
$
|
650,172
|
|
$
|
78,068
|
|
14
|
%
|
$
|
572,104
|
|
|
$150,170
|
|
36
|
%
|
$
|
421,934
|
|
||||||
|
Interest expense
|
162,245
|
|
71,521
|
|
79
|
%
|
90,724
|
|
32,145
|
|
55
|
%
|
58,579
|
|
|||||||||||
|
Net interest income
|
487,927
|
|
6,547
|
|
1
|
%
|
481,380
|
|
118,025
|
|
32
|
%
|
363,355
|
|
|||||||||||
|
Provision for loan losses
|
14,900
|
|
(2,460
|
)
|
(14
|
)%
|
17,360
|
|
8,360
|
|
93
|
%
|
9,000
|
|
|||||||||||
|
Noninterest income
|
60,180
|
|
(6,235
|
)
|
(9
|
)%
|
66,415
|
|
14,596
|
|
28
|
%
|
51,819
|
|
|||||||||||
|
Noninterest expense
|
277,726
|
|
11,125
|
|
4
|
%
|
266,601
|
|
51,626
|
|
24
|
%
|
214,975
|
|
|||||||||||
|
Income before income tax provision
|
255,481
|
|
(8,353
|
)
|
(3
|
)%
|
263,834
|
|
72,635
|
|
38
|
%
|
191,199
|
|
|||||||||||
|
Income tax provision
|
65,892
|
|
(58,497
|
)
|
(47
|
)%
|
124,389
|
|
46,937
|
|
61
|
%
|
77,452
|
|
|||||||||||
|
Net income
|
$
|
189,589
|
|
$
|
50,144
|
|
36
|
%
|
$
|
139,445
|
|
$
|
25,698
|
|
23
|
%
|
$
|
113,747
|
|
||||||
Net Income
Our net income was $
189.6 million
for
2018
compared to
$139.4 million
for
2017
and
$113.7 million
for
2016
. Our earnings per common share based on fully diluted shares were
$1.44
,
$1.03
, and
$1.10
for
2018
,
2017
, and
2016
, respectively. The return on average assets was
1.29%
,
1.02%
, and
1.10%
and the return on average stockholders’ equity was
9.92%
,
7.31%
, and
8.47%
for
2018
,
2017
, and
2016
, respectively. The increase in net income for 2018 compared to 2017 was due to the reduction in tax provision expense as a result of the Tax Cuts and Jobs Act which reduced the corporate federal income tax rate from 35% to 21% starting on January 1, 2018.
32
Impact of Acquisitions
The comparability of our operating results is affected by our acquisition of Wilshire Bancorp in July 2016. We acquired $4.63 billion in total assets from Wilshire at the time of the acquisition. The acquisition was accounted for using the acquisition method of accounting and, accordingly, Wilshire’s operating results have been included in the consolidated financial statements from the acquisition date. Financial information for the years 2018 and 2017 reflect full years of combined operations subsequent to the merger with Wilshire, while 2016 reflects seven months of stand-alone operations and five months of combined operations.
Income before income tax provision for the year ended December 31, 2018, 2017, and 2016 were impacted by the accretion of discounts and the amortization of premiums relating to past acquisitions. The following table summarizes the accretion and amortization adjustments that are included in net income for the periods indicated below:
|
Year Ended December 31,
|
||||||||||||
|
2018
|
2017
|
2016
|
||||||||||
|
(Dollars in thousands)
|
||||||||||||
|
Accretion on purchased non-impaired loans
|
$
|
11,715
|
|
$
|
18,372
|
|
$
|
9,330
|
|
|||
|
Accretion on purchased credit-impaired loans
|
21,837
|
|
21,542
|
|
15,817
|
|
||||||
|
Amortizations of premium on low income housing tax credits
|
(338
|
)
|
(338
|
)
|
(127
|
)
|
||||||
|
Amortization of premiums on acquired FHLB borrowings
|
1,413
|
|
1,597
|
|
973
|
|
||||||
|
Accretion of discounts on acquired subordinated debt
|
(1,076
|
)
|
(1,045
|
)
|
(539
|
)
|
||||||
|
Amortization of premiums on acquired time deposits and savings
|
1
|
|
4,903
|
|
5,857
|
|
||||||
|
Amortization of core deposit intangibles
|
(2,461
|
)
|
(2,703
|
)
|
(1,732
|
)
|
||||||
|
Total acquisition accounting adjustments
|
$
|
31,091
|
|
$
|
42,328
|
|
$
|
29,579
|
|
|||
|
Merger-related expenses
|
7
|
|
(1,781
|
)
|
(16,914
|
)
|
||||||
|
Total
|
$
|
31,098
|
|
$
|
40,547
|
|
$
|
12,665
|
|
|||
33
Net Interest Margin and Net Interest Rate Spread
We analyze our earnings performance using, among other measures, net interest spread and net interest margin. The net interest spread represents the difference between the weighted average yield earned on interest earning assets and average rate paid on interest bearing liabilities. Net interest income, when expressed as a percentage of average total interest earning assets, is referred to as the net interest margin. Our net interest margin is affected by changes in the yields earned on assets and rates paid on liabilities, as well as the ratio of the amounts of interest earning assets to interest bearing liabilities.
Interest rates charged on our loans are affected principally by the demand for such loans, the supply of money available for lending purposes, the interest rate environment, and other competitive factors. These factors are in turn affected by general economic conditions and other factors beyond our control, such as federal economic policies, the general supply of money in the economy, legislative tax policies, governmental budgetary matters, and the actions of the FRB.
The following table presents our net interest margin, net interest rate spread, and our condensed consolidated average balance sheet information, together with interest rates earned and paid on the various sources and uses of funds, for the periods indicated:
|
|
Year Ended December 31,
|
|||||||||||||||||||||||||||||||
|
|
2018
|
2017
|
2016
|
|||||||||||||||||||||||||||||
|
|
Average
Balance
|
Interest
Income/
Expense
|
Average
Yield/
Rate
|
Average
Balance
|
Interest
Income/
Expense
|
Average
Yield/
Rate
|
Average
Balance
|
Interest
Income/
Expense
|
Average
Yield/
Rate
|
|||||||||||||||||||||||
|
|
(Dollars in thousands)
|
|||||||||||||||||||||||||||||||
|
INTEREST EARNING ASSETS:
|
||||||||||||||||||||||||||||||||
|
Loans
(1)(2)(3)
|
$
|
11,547,022
|
|
$
|
594,103
|
|
5.15
|
%
|
$
|
10,642,349
|
|
$
|
529,760
|
|
4.98
|
%
|
$
|
8,121,897
|
|
$
|
392,127
|
|
4.83
|
%
|
||||||||
|
Securities
(3)
|
1,772,080
|
|
45,342
|
|
2.56
|
%
|
1,679,468
|
|
36,917
|
|
2.20
|
%
|
1,276,068
|
|
25,442
|
|
1.99
|
%
|
||||||||||||||
|
FRB and FHLB stock and
other investments
|
487,922
|
|
10,727
|
|
2.20
|
%
|
360,086
|
|
5,427
|
|
1.51
|
%
|
281,824
|
|
4,365
|
|
1.55
|
%
|
||||||||||||||
|
Total interest earning assets
|
13,807,024
|
|
650,172
|
|
4.71
|
%
|
12,681,903
|
|
572,104
|
|
4.51
|
%
|
9,679,789
|
|
421,934
|
|
4.36
|
%
|
||||||||||||||
|
Total noninterest earning assets
|
942,142
|
|
967,060
|
|
662,274
|
|
||||||||||||||||||||||||||
|
Total assets
|
$
|
14,749,166
|
|
$
|
13,648,963
|
|
$
|
10,342,063
|
|
|||||||||||||||||||||||
|
INTEREST BEARING LIABILITIES:
|
||||||||||||||||||||||||||||||||
|
Deposits:
|
||||||||||||||||||||||||||||||||
|
Demand, interest bearing
|
$
|
3,276,815
|
|
43,252
|
|
1.32
|
%
|
$
|
3,490,440
|
|
31,856
|
|
0.91
|
%
|
2,587,548
|
|
21,136
|
|
0.82
|
%
|
||||||||||||
|
Savings
|
229,608
|
|
1,889
|
|
0.82
|
%
|
268,292
|
|
1,354
|
|
0.50
|
%
|
234,332
|
|
1,282
|
|
0.55
|
%
|
||||||||||||||
|
Time deposits
|
5,107,698
|
|
89,817
|
|
1.76
|
%
|
4,037,259
|
|
41,692
|
|
1.03
|
%
|
3,219,484
|
|
25,673
|
|
0.80
|
%
|
||||||||||||||
|
Total interest bearing deposits
|
8,614,121
|
|
134,958
|
|
1.57
|
%
|
7,795,991
|
|
74,902
|
|
0.96
|
%
|
6,041,364
|
|
48,091
|
|
0.80
|
%
|
||||||||||||||
|
FHLB advances and
federal funds purchased
|
870,124
|
|
15,127
|
|
1.74
|
%
|
787,119
|
|
10,706
|
|
1.36
|
%
|
619,557
|
|
7,560
|
|
1.22
|
%
|
||||||||||||||
|
Convertible notes, net
|
123,040
|
|
5,797
|
|
4.65
|
%
|
—
|
|
—
|
|
—
|
%
|
—
|
|
—
|
|
—
|
%
|
||||||||||||||
|
Other borrowings
|
97,455
|
|
6,363
|
|
6.44
|
%
|
96,363
|
|
5,116
|
|
5.24
|
%
|
64,165
|
|
2,928
|
|
4.49
|
%
|
||||||||||||||
|
Total interest bearing liabilities
|
9,704,740
|
|
162,245
|
|
1.67
|
%
|
8,679,473
|
|
90,724
|
|
1.05
|
%
|
6,725,086
|
|
58,579
|
|
0.87
|
%
|
||||||||||||||
|
Noninterest bearing liabilities and equity:
|
||||||||||||||||||||||||||||||||
|
Noninterest bearing demand deposits
|
3,014,056
|
|
2,955,895
|
|
2,191,620
|
|
||||||||||||||||||||||||||
|
Other liabilities
|
120,146
|
|
105,849
|
|
82,403
|
|
||||||||||||||||||||||||||
|
Stockholders’ equity
|
1,910,224
|
|
1,907,746
|
|
1,342,954
|
|
||||||||||||||||||||||||||
|
Total liabilities and stockholders’ equity
|
$
|
14,749,166
|
|
$
|
13,648,963
|
|
$
|
10,342,063
|
|
|||||||||||||||||||||||
|
Net interest income
|
$
|
487,927
|
|
$
|
481,380
|
|
$
|
363,355
|
|
|||||||||||||||||||||||
|
Net interest margin
|
3.53
|
%
|
3.80
|
%
|
3.75
|
%
|
||||||||||||||||||||||||||
|
Net interest spread
(4)
|
3.04
|
%
|
3.46
|
%
|
3.49
|
%
|
||||||||||||||||||||||||||
|
Cost of funds
(5)
|
1.28
|
%
|
0.78
|
%
|
0.66
|
%
|
||||||||||||||||||||||||||
|
Cost of deposits
|
1.16
|
%
|
0.70
|
%
|
0.58
|
%
|
||||||||||||||||||||||||||
(1) Interest income on loans includes accretion of net deferred loan origination fees and costs, prepayment fees received on loan pay-offs and accretion of discounts on acquired loans. See the table below for detail.
(2) Average balances of loans are net of deferred loan origination fees and costs and include nonaccrual loans and loans held for sale.
(3) Interest income and yields are not presented on a tax-equivalent basis.
(4) Yield on interest earning assets minus cost of interest bearing liabilities.
(5) Yield on interest bearing liabilities and noninterest bearing deposits.
34
The following table presents net loan origination fees, loan prepayments fee income, interest reversed for nonaccrual loans, and discount accretion income included as part of loan interest income for the years indicated:
|
Year ended December 31,
|
Net Loan Origination Fees
|
Loan Prepayment Fee Income
|
Interest Reversed for Nonaccrual Loans, Net of Income Recognized
|
Accretion of Discounts on Acquired Loans
|
||||||||||||
|
(Dollars in thousands)
|
||||||||||||||||
|
2018
|
$
|
1,492
|
|
$
|
2,603
|
|
$
|
(590
|
)
|
$
|
33,552
|
|
||||
|
2017
|
$
|
1,485
|
|
$
|
3,963
|
|
$
|
(419
|
)
|
$
|
39,914
|
|
||||
|
2016
|
$
|
1,798
|
|
$
|
3,491
|
|
$
|
(483
|
)
|
$
|
25,147
|
|
||||
Net Interest Income
Net interest income was
$487.9 million
for
2018
, compared to
$481.4 million
for
2017
and
$363.4 million
for
2016
. Changes in net interest income are a function of changes in interest rates and volume of interest earning assets and interest bearing liabilities. The table below sets forth information regarding the changes in interest income and interest expense for the periods indicated. The total change for each category of interest earning assets and interest bearing liabilities is segmented into the change attributable to variations in volume (changes in volume multiplied by the old rate) and the change attributable to variations in interest rates (changes in rates multiplied by the old volume). Nonaccrual loans are included in average loans used to compute this table.
|
|
For the year ended December 31,
|
||||||||||||||||||||||
|
|
2018 Compared to 2017
|
2017 Compared to 2016
|
|||||||||||||||||||||
|
|
Net
Increase
|
Change due to
|
Net
Increase
|
Change due to
|
|||||||||||||||||||
|
|
Rate
|
Volume
|
Rate
|
Volume
|
|||||||||||||||||||
|
|
(Dollars in thousands)
|
||||||||||||||||||||||
|
INTEREST INCOME:
|
|||||||||||||||||||||||
|
Interest and fees on loans
|
$
|
64,343
|
|
$
|
18,225
|
|
$
|
46,118
|
|
$
|
137,633
|
|
$
|
12,512
|
|
$
|
125,121
|
|
|||||
|
Interest on securities
|
8,425
|
|
6,305
|
|
2,120
|
|
11,475
|
|
2,810
|
|
8,665
|
|
|||||||||||
|
Interest on other investments
|
5,300
|
|
2,988
|
|
2,312
|
|
1,062
|
|
(120
|
)
|
1,182
|
|
|||||||||||
|
TOTAL INTEREST INCOME
|
$
|
78,068
|
|
$
|
27,518
|
|
$
|
50,550
|
|
$
|
150,170
|
|
$
|
15,202
|
|
$
|
134,968
|
|
|||||
|
INTEREST EXPENSE:
|
|||||||||||||||||||||||
|
Interest on demand deposits
|
$
|
11,396
|
|
$
|
13,451
|
|
$
|
(2,055
|
)
|
$
|
10,720
|
|
$
|
2,697
|
|
$
|
8,023
|
|
|||||
|
Interest on savings
|
535
|
|
753
|
|
(218
|
)
|
72
|
|
(104
|
)
|
176
|
|
|||||||||||
|
Interest on time deposits
|
48,125
|
|
34,943
|
|
13,182
|
|
16,019
|
|
8,608
|
|
7,411
|
|
|||||||||||
|
Interest on FHLB advances and federal funds purchased
|
4,421
|
|
3,206
|
|
1,215
|
|
3,146
|
|
937
|
|
2,209
|
|
|||||||||||
|
Convertible notes, net
|
5,797
|
|
—
|
|
5,797
|
|
—
|
|
—
|
|
—
|
|
|||||||||||
|
Interest on other borrowings
|
1,247
|
|
1,188
|
|
59
|
|
2,188
|
|
545
|
|
1,643
|
|
|||||||||||
|
TOTAL INTEREST EXPENSE
|
$
|
71,521
|
|
$
|
53,541
|
|
$
|
17,980
|
|
$
|
32,145
|
|
$
|
12,683
|
|
$
|
19,462
|
|
|||||
|
NET INTEREST INCOME
|
$
|
6,547
|
|
$
|
(26,023
|
)
|
$
|
32,570
|
|
$
|
118,025
|
|
$
|
2,519
|
|
$
|
115,506
|
|
|||||
Net interest income before provision for loan losses increased by
$6.5 million
, or
1%
, during
2018
. The increase was primarily due to an increase in average interest earning assets by 9% during the year which resulted in an increase of
$50.6 million
in interest income due to volume. Interest bearing liabilities increased by 12% for 2018 compared to the previous year which resulted in an increase of $18.0 million in interest expense due to volume. Interest expense change in 2018 compared to 2017 due to change in rate amounted to $53.5 million mostly due to the increase in interest rates in 2018 and repricing of deposits. Although yields on interest earnings assets increased for 2018 compared to 2017, the increase was offset by the increase in cost of deposits for the same period.
Net interest income before provision for loan losses increased by $118.0 million, or 32%, during 2017. The increase was primarily due to an increase in average interest earning assets by 31% during the year which resulted in an increase of $135.0 million in interest income due to volume. Interest bearing liabilities increased by 29% for 2017 compared to the previous year, which resulted in an increase of $19.5 million in interest expense due to volume. Although yields on interest earnings assets increased for 2017 compared to 2016, the increase was largely offset by the increase in cost of deposits for the same period.
35
Average interest earnings assets and liabilities for 2018 and 2017 included the full year impact from assets acquired and liabilities assumed from Wilshire, while average interest earnings assets and liabilities for 2016 included only five months of asset and liability balances acquired from Wilshire.
Interest Income
Interest income was
$650.2 million
for
2018
, compared to
$572.1 million
for
2017
and
$421.9 million
for
2016
. The yield on average interest earning assets was
4.71%
for
2018
, compared to
4.51%
for
2017
and
4.36%
for
2016
.
Comparison of
2018
with
2017
The increase in interest income of
$78.1 million
, or
14%
, for
2018
compared to
2017
was primarily a result of the growth in total loans and investments. The increase in interest income was primarily attributable to the increase in loans as a result of higher rates on new originations as well as an increase in loan rates for variable rate loans. Average total loans increased by $904.7 million in 2018 compared to 2017 and total investments and FHLB stock and other investments together increased $220.4 million in the same period. Discount accretion income on acquired loans decreased in 2018 totaling $33.6 million compared to $39.9 million for 2017.
Comparison of 2017 with
2016
The increase in interest income of $150.2 million, or 36%, for 2017 compared to 2016 was primarily a result of the growth in total loans and investments. The increase in 2017 was a result of both organic growth and the full year impact of the assets acquired from Wilshire compared to only a five month impact of assets acquired from Wilshire for 2016. Average total loans increased $2.52 billion in 2017 compared to 2016, and total investments increased $403.4 million in the same period. Discount accretion income on acquired loans increased in 2017 totaling $39.9 million compared to $25.1 million for 2016. Accretion income on loans acquired from Wilshire was recognized throughout the entire year in 2017, whereas in 2016, accretion income was recorded in only the last five months of the year subsequent to the acquisition in July 2016.
Interest Expense
Deposits
Interest expense on deposits was
$135.0 million
for
2018
compared to
$74.9 million
for
2017
and
$48.1 million
for
2016
. The average cost of deposits was 1.16% for
2018
, compared to 0.70% for
2017
and 0.58% for
2016
. The average cost of interest bearing deposits was 1.57% for 2018, compared to 0.96% for
2017
and 0.80% for
2016
.
Comparison of
2018
with
2017
The increase in interest expense on total deposits of $60.1 million, or 80%, for
2018
compared to
2017
was due to an increase in interest bearing deposit accounts, particularly an increase in time deposits accounts, in addition to an overall increase in rates offered in 2018. Federal funds rates were increased by 25 basis points by the Federal Open Market Committee (“FOMC”) in March 2018, June 2018, September 2018, and December 2018. As a result of the interest rate hikes in 2018, many of our deposits were priced higher and time deposits were renewed and opened at higher interest rates increasing our total cost of deposits for 2018. The average balance of noninterest bearing deposits accounted for 26% of total average deposits at
December 31, 2018
compared to 27% at
December 31, 2017
. During 2018, we issued $217.5 million in convertible notes (carried at a discount) which also contributed to the increase in interest expense for 2018 compared to 2017. The convertible notes have a coupon rate of 2.00%, but the accretion of discount and capitalization of issuance costs contributes to the increase in cost of convertible notes.
Comparison of 2017 with
2016
The increase in interest expense on total deposits of $26.8 million, or 56%, for 2017, compared to 2016 was due to an increase in interest bearing liabilities in addition to an overall increase in rates offered in 2017. Federal funds rates was increased by the Federal Open Market Committee (“FOMC”) in June of 2017 and again in December of 2017. As of result of the 25 basis point increase in interest rates in June 2017, many of our deposits were priced higher and time deposits were renewed and opened at higher interest rates increasing our total cost of deposits for 2017. In addition, average deposits for 2017 included a full year of balances assumed from Wilshire while 2016 only reflected five months of assumed deposits in the average deposit balance. The average balance of noninterest bearing deposits accounted for 27% of total average deposits at December 31, 2017 compared to 27% at December 31, 2016.
FHLB Advances and Federal Funds Purchased
FHLB advances and federal funds purchased include borrowings from the FHLB and federal funds purchased. As part of our asset-liability management, we utilize FHLB advances to supplement our deposit source of funds. Therefore, there may be fluctuations in these balances depending on the short-term liquidity and longer-term financing needs of the Bank.
36
Average FHLB advances and federal funds purchased were
$870.1 million
in
2018
, compared to
$787.1 million
in
2017
and
$619.6 million
in
2016
. Interest expense on FHLB advances was
$15.1 million
for
2018
compared to
$10.7 million
for
2017
and
$7.6 million
for
2016
. The average cost of FHLB advances was
1.74%
for
2018
, compared to
1.36%
for
2017
and
1.22%
for
2016
. The average cost of FHLB advances includes the amortization of premiums recorded on advances acquired from prior acquisitions. Total amortization FHLB premiums for
2018
was $1.4 million, compared to $1.6 million in
2017
and $973 thousand in 2016. During 2018, we repaid $465.0 million in FHLB advances with an average rate of 1.61% and borrowed $130.0 million in advances with an average rate of 2.39%.
We did not have federal funds purchased at December 31, 2018 and December 31, 2016. At December 31, 2017, we had $69.9 million in federal funds purchased included in average FHLB advances and federal funds purchased, which were all fully repaid during the first quarter of 2018.
Convertible Debt
During the second quarter of 2018, we issued $217.5 million in senior convertible notes. The carrying balance of our convertible notes are net of discount to be amortized and issuance costs to be capitalized. The cost of our convertible notes for 2018 was 4.65%. We had no convertible notes outstanding in 2017 or 2016. The cost of our convertible notes consists of the 2.00% coupon rate, the non-cash conversion option rate, and the issuance cost capitalization rate. After the fifth year, the cost of the convertible notes will decline as the non-cash conversion discount will be fully amortized and the issuance costs will be fully capitalized leaving the coupon rate as the only remaining cost.
Other Borrowings
Other borrowings include subordinated debentures which bear interest at 3-month LIBOR plus a designated spread. With the acquisition of Wilshire, we assumed four subordinated debentures at a fair value of $56.9 million. There were no other changes in our balance of subordinated debentures during 2017 or 2018, aside for the increases related to the discount accretion on subordinated debentures acquired from previous acquisitions. The average rate on other borrowing increased to 6.44% for 2018 compared to 5.24% for 2017 and 4.49% for 2016. The increase in cost of other borrowings in 2017 and 2018 was due to the increase in the 3-month LIBOR rate.
Provision for Loan Losse
s
The provision for loan losses reflects our judgment of the current period cost associated with credit risk inherent in our loan portfolio. The loan loss provision for each period is dependent upon many factors, including loan growth, net charge-offs, changes in the composition of the loan portfolio, delinquencies, assessments by management, third parties’ and regulators’ examination of the loan portfolio, the value of the underlying collateral on problem loans and the general economic conditions in our market areas. Specifically, the provision for loan losses represents the amount charged against current period earnings to achieve an allowance for loan losses that, in our judgment, is adequate to absorb probable incurred losses inherent in our loan portfolio. Periodic fluctuations in the provision for loan losses result from management’s assessment of the adequacy of the allowance for loan losses; however, actual loan losses may vary in material respects from current estimates. If the allowance for loan losses is inadequate, we may be required to record additional loan loss provision, which may have a material adverse effect on our business and our financial condition
.
Comparison of
2018
with
2017
The provision for loan losses was $14.9 million for
2018
, a decrease of $2.5 million, or 14%, from
$17.4 million
for
2017
. The decrease in provision for loan losses for 2018 compared to 2017 was largely due the reduction in net charge-offs for 2018 compared to 2017. The allowance for loan losses requirement increased only slightly in 2018 to 0.77% of total loans compared to 0.76% of total loans for 2017. The reduction in net charge-offs for 2018 resulted in a reduction in reduction in provision for loans losses required to replenish the allowance for loan losses for the year. Net charge offs totaled $6.9 million for 2018 compared to $12.2 million for 2017.
Comparison of 2017 with
2016
The provision for loan losses was $17.4 million for 2017, an increase of $8.4 million, or 93%, from $9.0 million for 2016. The provision was calculated based on net charge offs of $12.2 million during the year and an increase in the required allowance for loan losses primarily due to an increase in loan volume which also contributed to the increase in provision.
See “Financial Condition—Allowance for Loan Losses” for a description of our methodology for determining the allowance for loan losses
.
37
Noninterest Incom
e
Noninterest income is primarily comprised of service charges on deposit accounts, net gains on sales of SBA and residential mortgage loans, and other fees and income. Noninterest income was
$60.2 million
for
2018
compared to
$66.4 million
for
2017
and
$51.8 million
for
2016
.
Comparison of
2018
with
2017
The decrease in noninterest income for
2018
over
2017
primarily reflected decreases in service charges on deposit accounts, loan servicing fees, and net gain on sales of SBA and other loans.
Service charges on deposits decreased $2.1 million, or 10%, to $18.6 million due mostly to a decrease of $1.2 million in non-sufficient funds collected from business and personal accounts and a decrease of $758 thousand in analysis fees charged on demand deposits accounts.
Loan servicing fees decreased by $737 thousand, or 13.6%, to $4.7 million in 2018 compared to $5.4 million in 2017. The decrease in loan servicing fees in 2018 was primarily a result of an increase in payoffs of loans we service. When loans that we service are paid off, the remaining unamortized servicing asset originally recorded is charged against servicing fees reducing our overall fee income.
Net gains on sales of SBA loans decreased by $3.1 million, or 24%, to $9.7 million in 2018 from $12.8 million in 2017. The volume of sales of SBA loans and the net gains recorded from the sales largely depends on the production of SBA loans which decreased during in 2018. During the fourth quarter of 2018, we made the decision discontinue the practice of regularly selling the guaranteed portion of SBA loans on the secondary market and to retain these loans on our balance sheet due to the decline in premiums offered in the secondary market for the guaranteed portions SBA loans. SBA loans sold totaled $159.8 million in 2018 compared to $177.4 million in 2017.
Other income and fees increased by $625 thousand, or 4.2%, to $15.4 million in 2018 from $14.8 million in 2017. Other income and fees are comprised of loan recoveries on pre-merger charged-off loans, fair value changes of equity investments, swap fee income, gain/losses on sale of fixed assets, income from bank owned life insurance, and miscellaneous income. The increase in 2018 was largely due to an increase in the fair value of equity investments and recoveries on pre-merger charged off loans, offset by a decline in swap fee income, gain on sale of fixed assets, and miscellaneous income.
Comparison of 2017 with
2016
The increase in noninterest income for 2017 over 2016 primarily reflected increases in service charges on deposit accounts, loan servicing fees, net gain on sales of SBA loans, and other income and fees. These increases were largely due to the increase in operations from the acquisition of Wilshire.
Service charges on deposits increased $4.7 million, or 29%, to $20.6 million due mostly to an increase of $2.8 million in analysis fees charged on demand deposits accounts and an increase of $1.3 million in non-sufficient funds collected from business and personal accounts. The increase in deposits service charges in 2017 was largely due to the full year impact of the increase in deposits from the acquisition of Wilshire.
Loan servicing fees increased by $1.9 million, or 54%, to $5.4 million in 2017 compared to $3.5 million in 2016. The increase in loan servicing fees in 2017 was primarily a result of an increase in sales of residential loans and SBA loans in 2016 and 2017. We earn servicing fees on loans we continue to service subsequent to the sales of the loans. As more loans continue to be sold, our servicing fees continue to increase until the loans are paid off.
Net gains on sales of SBA loans increased by $4.0 million, or 46%, to $12.8 million in 2017 from $8.8 million in 2016. The volume of sales of SBA loans and the net gains recorded from the sales are primarily driven by the production of SBA loans which increased during in 2017. SBA loans sold totaled $177.4 million in 2017 compared to $116.1 million in 2016. The increase in SBA loans sold in 2017 was due to the full year operations of the combined bank after the acquisition of Wilshire, while 2016 represented only five months of combined operations.
Other income and fees increased by $3.1 million, or 27% in 2017 compared to 2016. Loan recoveries on pre-merger charged-off loans and miscellaneous income increased $1.2 million in 2017 and gains on sale of fixed assets increased by $1.0 million in 2017 compared to the previous year mostly due to the sale of a building and associated land at the end of 2017.
38
A breakdown of noninterest income by category is shown below
:
|
|
Year Ended December 31, 2018
|
Increase
(Decrease)
|
Year Ended December 31, 2017
|
Increase
(Decrease)
|
Year Ended December 31, 2016
|
||||||||||||||||||||
|
(Dollars in thousands)
|
Amount
|
%
|
Amount
|
%
|
|||||||||||||||||||||
|
Service fees on deposit accounts
|
$
|
18,551
|
|
$
|
(2,068
|
)
|
(10
|
)%
|
$
|
20,619
|
|
$
|
4,655
|
|
29
|
%
|
$
|
15,964
|
|
||||||
|
International service fees
|
4,371
|
|
(123
|
)
|
(3
|
)%
|
4,494
|
|
801
|
|
22
|
%
|
3,693
|
|
|||||||||||
|
Loan servicing fees, net
|
4,696
|
|
(737
|
)
|
(14
|
)%
|
5,433
|
|
1,914
|
|
54
|
%
|
3,519
|
|
|||||||||||
|
Wire transfer fees
|
4,934
|
|
(123
|
)
|
(2
|
)%
|
5,057
|
|
731
|
|
17
|
%
|
4,326
|
|
|||||||||||
|
Net gains on sales of SBA loans
|
9,708
|
|
(3,066
|
)
|
(24
|
)%
|
12,774
|
|
4,024
|
|
46
|
%
|
8,750
|
|
|||||||||||
|
Net gains on sales of other loans
|
2,485
|
|
(442
|
)
|
(15
|
)%
|
2,927
|
|
7
|
|
—
|
%
|
2,920
|
|
|||||||||||
|
Net gains on sales or called securities available for sale
|
—
|
|
(301
|
)
|
(100
|
)%
|
301
|
|
(649
|
)
|
(68
|
)%
|
950
|
|
|||||||||||
|
Other income and fees
|
15,435
|
|
625
|
|
4
|
%
|
14,810
|
|
3,113
|
|
27
|
%
|
11,697
|
|
|||||||||||
|
Total noninterest income
|
$
|
60,180
|
|
$
|
(6,235
|
)
|
(9
|
)%
|
$
|
66,415
|
|
$
|
14,596
|
|
28
|
%
|
$
|
51,819
|
|
||||||
Noninterest Expense
Noninterest expense is primarily comprised of salaries and benefit expense, occupancy expense, furniture and equipment expense, advertising expenses, data processing and communications expenses, professional fees, investment in affordable housing partnership expenses, and other expenses. Noninterest expense was
$277.7 million
for
2018
, compared to
$266.6 million
for
2017
and
$215.0 million
for
2016
. The increases in noninterest expenses were
$11.1 million
, or
4%
, for
2018
compared to
2017
, and
$51.6 million
, or 24%, for
2017
compared to
2016
.
Noninterest expense as a percentage of average assets for
2018
was 1.88% compared to 1.95% for
2017
and 2.08% for
2016
.
Comparison of
2018
with
2017
The increase in noninterest expense for
2018
over
2017
was due mostly to increases in salaries and employee benefits, occupancy expenses, data processing expenses, professional fees, Federal Deposit Insurance Corporation (“FDIC”) assessment expenses, credit related expenses, and branch restructuring costs, partially offset by a decline in investment in affordable housing partnership expenses, OREO expenses, merger and integration expenses, and other expenses.
Salaries and employee benefits totaled
$153.5 million
for
2018
, an increase of
$8.9 million
, or
6%
, compared to
$144.7 million
for
2017
. The increase was comprised of a $10.1 million increase in employee salary expenses and a decrease of $1.2 million in employee benefits. These increases reflect increases in the number of full-time equivalent employees to 1,494 at
December 31, 2018
, from 1,470 at
December 31, 2017
, as well as an increase in commission and other types of compensation. During the third quarter of 2018, we restructured our incentive compensation plans, which lowered our bonus accruals for the second half of 2018, offsetting a portion of the salaries and benefits increase due to the rise in employees. In order to improve our deposit mix, our incentive compensation plan was restructured so that a more significant portion of the incentive compensation is now tied to core deposit gathering.
Occupancy expense increased $1.8 million, or 6%, to $30.4 million for
2018
compared to $28.6 million for
2017
. The increase in occupancy expense was due mostly to an increase in lease expenses as a result of annual rent escalations for 2018.
Data processing and communications expenses increased $2.1 million, or 17%, to $14.2 million for
2018
compared to $12.2 million for
2017
. The increase in deposit and loan accounts in 2018 compared to 2017, led to an increase in the total number of deposit and loan transactions which resulted in higher data processing expenses paid for 2018 compared to 2017. During the fourth quarter of 2018, we renegotiated our contract with our core banking platform provider, whose fees make up a significant portion of our data processing and communications expenses. As a result of the newly negotiated contract, our fees related to the use of the third party core banking system will be reduced in future periods.
Professional fees increased $1.3 million, or 9%, to $16.3 million for
2018
compared to $15.0 million for
2017
. Compliance requirements as a result of exceeding $10 billion in total assets has resulted in additional spending to improve upon our infrastructure in fields related to IT, accounting, compliance, and risk management. For 2018, management chose to deploy a portion of the savings in tax provision that resulted from the reduction in the corporate tax rate to improve certain key areas with the assistance of third party consultants. Professional fees for 2018 also included fees paid to third parties for assistance with the upcoming implementation of the new accounting standard for current expected credit loss and implementation of the new lease accounting standard.
39
Investments in affordable housing partnership expenses decreased $1.8 million, or 13%, to $12.1 million for
2018
compared to $13.9 million for
2017
. In 2017, we recorded an impairment of $3.3 million on our investments in affordable housing partnerships after an analysis of the individual investment carrying values compared to their expected future tax benefits. We did not record an impairment on our investments in affordable housing partnerships in 2018 which resulted in a decline in investments in affordable housing partnership expenses. We make investments in affordable housing partnerships and receive Community Reinvestment Act credit and tax credits which reduces our overall tax provision expense. Investments in affordable housing partnership expenses that are not impairment related are based on the performance of the underlying investment. We receive updated financial information for our affordable housing partnerships investments and record losses based on the performance of the investment. These losses will eventually be offset by tax credits which reduce our tax provision expense. Investments in affordable housing partnerships increased from $81.0 million at December 31, 2017 to $92.0 million at December 31, 2018.
FDIC assessment expenses increased $1.4 million, or 27%, to $6.6 million for 2018 compared to $5.2 million for 2017. The FDIC assessment premium utilizes an initial base assessment rate which is calculated as a percentage of our average consolidated total assets less average tangible equity. In addition to the initial assessment base, adjustments are added based on our regulatory rating and certain financial measures. The increase in consolidated assets resulted in additional FDIC assessment premiums paid in 2018 compared to 2017. During the fourth quarter, the FDIC reached the minimum reserve ratio of 1.35% and announced it would no longer assess the large institution surcharge (surcharge on institution in excess of $10 billion in consolidated assets). As a result, we experienced a small decline in our FDIC assessment expense for the fourth quarter of 2018.
Credit related expenses increased $2.3 million, or 392%, to $2.9 million for 2018 compared to $582 thousand for 2017.
Credit related expenses increased in 2018 compared to 2017 largely due to a decrease in provision reversals for off balance sheet unfunded commitments. For 2018, credit for off balance sheet unfunded commitments totaled $100 thousand compared to a credit off balance sheet unfunded commitments of $2.4 million for 2017. Reserves for off balance sheet unfunded commitments at December 31, 2018 totaled $736 thousand compared to $836 thousand at December 31, 2017.
OREO expenses decreased $2.9 million, or 94%, to $187 thousand in 2018 compared to $3.1 million in 2017. The decrease in OREO expense in 2018 was due to a reduction in OREO valuation expenses and a reduction in expenses related to the maintenance of OREO during the year. With the reduction in OREO balance, the related expenses have declined. The total balance of OREO at December 31, 2018 was $7.8 million compared to $10.8 million at December 31, 2017.
In December 2018, we incurred a restructuring charge of $1.7 million, related to our branch rationalization plan which was announced in December 2018. The branch rationalization plan is still subject to regulatory non-objection and is expected to be implemented by the second quarter of 2019. The branch rationalization plan will impact six of our branch offices across the country. With the consolidation of these branches, we project approximately $1.9 million in pretax cost savings on an annual basis. The $1.7 million in restructuring costs consisted of $229 thousand in salaries and benefit expenses, $957 thousand in occupancy expense, and $488 thousand in other various expenditures. There were no branch restructuring costs for 2017.
In 2018 we recorded a $7 thousand reversal to merger and integration expenses resulting in a decrease $1.8 million to total merger and integration expenses for 2018 compared to 2017. Merger and integration expenses for 2017 consisted of remaining expenses related to the merger with Wilshire and expenses for the terminated merger with U & I Financial Corp.
Other expenses decreased $1.1 million, or 7%, to $15.6 million in 2018 compared to $16.8 million in 2017. The decrease in other expenses was due to the decline in various other expenses in 2018 compared to the previous year.
Comparison of 2017 with
2016
The increase in noninterest expense for 2017 over 2016 was due mostly to increases in salaries and employee benefits, occupancy expenses, furniture and equipment, advertising and marketing, professional fees, and investment in affordable housing partnership expenses partially offset by a decline in merger and integration expenses and credit related expenses. Most noninterest expense line items aside from merger and integration expenses and credit related expense increased in 2017 compared to 2016 as expenses for 2017 represented a full year of combined operations after the merger with Wilshire, while 2016 represented only five months of combined operations and related expenditures.
Salaries and employee benefits totaled $144.7 million for 2017, an increase of $36.7 million, or 34%, compared to $107.9 million for 2016. The increase was comprised of a $28.2 million increase in employee salary expenses and an increase of $8.5 million in employee benefits. These increases primarily reflect increases in the number of full-time equivalent employees to 1,470 at December 31, 2017, from 1,372 as of December 31, 2016. The increase in salaries and employee benefits was due to an increase in full-time employees and because 2017 reflected a full year of combined expenses including staff acquired from Wilshire while 2016 reflected salary and benefit expenses for only the last five months of combined operations.
40
Occupancy expense increased $4.0 million, or 16%, to $28.6 million for 2017 compared to $24.6 million for 2016. With the acquisition of Wilshire, we assumed 35 branches offices and six loan production offices. Although some of these locations were subsequently closed in accordance with our branch consolidation plan, the remaining lease locations contributed to the overall increase in occupancy expenses for 2017 compared to 2016. The increase in expenses for 2017 was due to the full year of expenditure for leases acquired from Wilshire while 2016 expenditures included Wilshire related lease expenses for only the last five months of the year.
Furniture and equipment expenses increased $2.9 million, or 25%, to $14.6 million for 2017 compared to $11.7 million for 2016. The increase in these expenses in 2017 compared to the previous year was due to the full year of combined furniture and equipment expenses after the merger with Wilshire compared to only five months of expenses after the merger with Wilshire in 2016.
Advertising and marketing expenses increased $3.0 million, or 40%, to $10.3 million for 2017 compared to $7.3 million in 2016. Advertising and marketing expenses for 2017 included $1.5 million in fees paid to sponsor the Ladies Professional Golf Association (“LPGA”) Bank of Hope Founders Cup event for the first time in March 2017. The remaining increase in 2017 was due to a full year of expenses for the combined entity after the merger with Wilshire compared to five months of combined expenses for 2016.
Professional fees increased $8.4 million, or 128%, to $15.0 million for 2017 compared to $6.6 million for 2016. The increase in professional fees for 2017 compared 2016 was due to an increase in predecessor external auditor fees as well as additional consulting costs associated with new compliance requirements as a result of exceeding $10 billion in total assets. We also had an increase in legal fees for 2017 compared 2016, due mostly to fees related to the proposed merger with U & I Financial Corp. which was terminated in September 2017.
Investments in affordable housing partnership expenses increased $9.8 million, or 238%, to $13.9 million for 2017 compared to $4.1 million in 2016. In 2017, we recorded an impairment of $3.3 million on our investments in affordable housing partnerships after an analysis of the individual investment carrying values compared to their expected future tax benefits. We also recorded an impairment of $1.6 million as a direct result of the Tax Act, which reduced the corporate tax rate to 21%. The impairment that resulted due to the tax reform, was recorded as an increase in tax provision expense. Investments in affordable housing partnerships increased from $70.1 million at December 31, 2016 to $81.0 million at December 31, 2017.
Credit related expenses decreased $2.4 million, or 80%, to $582 thousand for 2017 compared to $3.0 million for 2016. Credit related expenses declined in 2017 compared to 2016 largely due to a $2.8 million provision reversal for off balance sheet unfunded commitments recorded during the third quarter of 2017. Updated information related to off balance sheet unfunded commitments and utilization rates used in the calculation of the allowance for unfunded commitments resulted in a $2.8 million reduction in the required allowance for the third quarter of 2017. Reserves for off balance sheet unfunded commitments at December 31, 2017 totaled $836 thousand compared to $3.2 million at December 31, 2016.
Merger and integration expenses decreased $15.1 million, or 89%, to $1.8 million for 2017 compared to $16.9 million for 2016. The decline in merger and integration expenses was due to a decline in expenses related to the merger with Wilshire. The bulk of merger and integration expenses for 2016 were for advisory and legal fees associated with the acquisition of Wilshire. With the merger completed in 2016, these expenses were greatly reduced in 2017. Merger and integration expense for 2017 mostly consisted of remaining expenses related to the merger with Wilshire but also included expenses for the now terminated merger with U & I Financial Corp.
Other expenses increased $2.0 million, or 13%, to $16.8 million in 2017 compared to $14.8 million in 2016. Amortization of core deposit intangible included in other expenses increased $1.0 million from $1.7 million in 2016 to $2.7 million in 2017. The increase in other expenses for 2017 was due to a full year of combined other expenses after the merger with Wilshire compared to only five months of combined expenses recorded for 2016.
41
A breakdown of noninterest expense by category is provided below
:
|
|
Year Ended December 31, 2018
|
Increase (Decrease)
|
Year Ended December 31, 2017
|
Increase (Decrease)
|
Year Ended December 31, 2016
|
||||||||||||||||||||
|
(Dollars in thousands)
|
Amount
|
%
|
Amount
|
%
|
|||||||||||||||||||||
|
Salaries and employee benefits
|
$
|
153,523
|
|
$
|
8,854
|
|
6
|
%
|
$
|
144,669
|
|
$
|
36,725
|
|
34
|
%
|
$
|
107,944
|
|
||||||
|
Occupancy
|
30,371
|
|
1,784
|
|
6
|
%
|
28,587
|
|
4,013
|
|
16
|
%
|
24,574
|
|
|||||||||||
|
Furniture and equipment
|
14,902
|
|
259
|
|
2
|
%
|
14,643
|
|
2,917
|
|
25
|
%
|
11,726
|
|
|||||||||||
|
Advertising and marketing
|
9,414
|
|
(867
|
)
|
(8
|
)%
|
10,281
|
|
2,961
|
|
40
|
%
|
7,320
|
|
|||||||||||
|
Data processing and communications
|
14,232
|
|
2,053
|
|
17
|
%
|
12,179
|
|
776
|
|
7
|
%
|
11,403
|
|
|||||||||||
|
Professional fees
|
16,286
|
|
1,332
|
|
9
|
%
|
14,954
|
|
8,398
|
|
128
|
%
|
6,556
|
|
|||||||||||
|
Investment in affordable housing partnerships expenses
|
12,066
|
|
(1,796
|
)
|
(13
|
)%
|
13,862
|
|
9,762
|
|
238
|
%
|
4,100
|
|
|||||||||||
|
FDIC assessments
|
6,572
|
|
1,399
|
|
27
|
%
|
5,173
|
|
1,008
|
|
24
|
%
|
4,165
|
|
|||||||||||
|
Credit related expenses
|
2,863
|
|
2,281
|
|
392
|
%
|
582
|
|
(2,372
|
)
|
(80
|
)%
|
2,954
|
|
|||||||||||
|
OREO expense, net
|
187
|
|
(2,913
|
)
|
(94
|
)%
|
3,100
|
|
608
|
|
24
|
%
|
2,492
|
|
|||||||||||
|
Branch restructuring costs
|
1,674
|
|
1,674
|
|
100
|
%
|
—
|
|
—
|
|
—
|
%
|
—
|
|
|||||||||||
|
Merger and integration expense
|
(7
|
)
|
(1,788
|
)
|
N/A
|
|
1,781
|
|
(15,133
|
)
|
(89
|
)%
|
16,914
|
|
|||||||||||
|
Other
|
15,643
|
|
(1,147
|
)
|
(7
|
)%
|
16,790
|
|
1,963
|
|
13
|
%
|
14,827
|
|
|||||||||||
|
Total noninterest expense
|
$
|
277,726
|
|
$
|
11,125
|
|
4
|
%
|
$
|
266,601
|
|
$
|
51,626
|
|
24
|
%
|
$
|
214,975
|
|
||||||
Income Tax Provision
The provision for income taxes for
2018
was
$65.9 million
, compared to
$124.4 million
in
2017
and
$77.5 million
in
2016
. The effective income tax rate was
25.79%
for
2018
compared to
47.15%
for
2017
and
40.51%
for
2016
. On December 22, 2017, the U.S. government enacted comprehensive tax legislation commonly referred to as the Tax Cuts and Jobs Act which among other changes, reduces the U.S. federal corporate tax rate from 35% to 21%. As a result of the Tax Act, our overall tax rate declined for 2018 compared to 2017. For 2017, we had to reassess our net deferred tax assets and investments in affordable housing partnerships at the lower tax rate. This resulted in additional tax provision expenses of $25.4 million for 2017 increasing the tax rate compared to 2016. See Note 11 of Notes to Consolidated Financial Statements for more detailed information on income taxes.
42
Financial Condition
Our total assets were
$15.31 billion
at
December 31, 2018
compared to
$14.21 billion
at
December 31, 2017
, an increase of $1.10 billion, or 8% year over year. The increase in assets for 2018 compared to 2017 was principally due to the increase in loans from higher loan originations in 2018 as well as an increase in investment securities due to purchases throughout the year.
Loan Portfolio
We offer a variety of products designed to meet the credit needs of our borrowers. Our lending activities primarily consist of commercial real estate loans, commercial business loans, trade finance, and consumer loans. Gross loans receivable rose by $995.5 million to
$12.10 billion
at
December 31, 2018
from
$11.10 billion
at
December 31, 2017
. The remaining discount on acquired loans at December 31, 2018 totaled $65.6 million compared to $85.5 million at December 31, 2017.
We experienced an increase in all loan types except for construction loans in 2018 compared to the previous year. The rates of interest charged on adjustable rate loans are set at specified spreads based on the prime lending rate and LIBOR rates and vary as the prime lending rate and LIBOR rates varies. Approximately 38% of our total loans were adjustable rate loans at
December 31, 2018
compared to 43% at
December 31, 2017
. Commercial real estate loans as a percentage to total loans declined to 71% for 2018 compared to 76% for 2017 due to the increase in commercial and consumer loans which make up a larger percentage of our loan portfolio for 2018 compared to the previous year. The increase consumer loans for 2018 compared to 2017 was due to the increase in origination for 1-4 family residential loans.
With certain exceptions, we are permitted under applicable law to make unsecured loans to single borrowers (including certain related persons and entities) in aggregate amounts of up to 15% of the sum of our total capital and our allowance for loan losses (as defined for regulatory purposes) at the Bank level and certain capital notes and debentures issued by us, if any. As of
December 31, 2018
, our lending limit was approximately $341.2 million per borrower for unsecured loans. For lending limit purposes, a secured loan is defined as a loan secured by collateral having a current fair value of at least 100% of the amount of the loan or extension of credit at all times and satisfying certain other requirements. In addition to unsecured loans, we are permitted to make such collateral-secured loans in an additional amount up to 10% (for a total of 25%) of our total capital and the allowance for loan losses for a total limit of approximately $568.6 million to one borrower as of
December 31, 2018
. The largest aggregate amount of loans that the Bank had outstanding to any one borrower and related entities was $150.8 million, of which the entire amount was performing and in good standing at
December 31, 2018
.
The following table shows the composition of our loan portfolio by type of loan on the dates indicated:
|
|
December 31,
|
|||||||||||||||||||||||||||||||||
|
|
2018
|
2017
|
2016
|
2015
|
2014
|
|||||||||||||||||||||||||||||
|
|
Amount
|
%
|
Amount
|
%
|
Amount
|
%
|
Amount
|
%
|
Amount
|
%
|
||||||||||||||||||||||||
|
(Dollars in thousands)
|
||||||||||||||||||||||||||||||||||
|
Loan portfolio composition:
|
||||||||||||||||||||||||||||||||||
|
Commercial real estate loans:
|
||||||||||||||||||||||||||||||||||
|
Residential
|
$
|
51,197
|
|
—
|
%
|
$
|
49,774
|
|
—
|
%
|
$
|
57,884
|
|
1
|
%
|
$
|
33,797
|
|
—
|
%
|
$
|
21,415
|
|
—
|
%
|
|||||||||
|
Commercial
|
8,395,327
|
|
69
|
%
|
8,142,036
|
|
73
|
%
|
7,842,573
|
|
75
|
%
|
4,912,655
|
|
78
|
%
|
4,324,349
|
|
78
|
%
|
||||||||||||||
|
Construction
|
275,076
|
|
2
|
%
|
316,412
|
|
3
|
%
|
254,113
|
|
2
|
%
|
123,030
|
|
2
|
%
|
94,086
|
|
2
|
%
|
||||||||||||||
|
Total commercial real estate loans
|
8,721,600
|
|
71
|
%
|
8,508,222
|
|
76
|
%
|
8,154,570
|
|
78
|
%
|
5,069,482
|
|
80
|
%
|
4,439,850
|
|
80
|
%
|
||||||||||||||
|
Commercial business
|
2,127,630
|
|
18
|
%
|
1,780,869
|
|
16
|
%
|
1,832,021
|
|
17
|
%
|
980,153
|
|
16
|
%
|
903,621
|
|
16
|
%
|
||||||||||||||
|
Trade finance
|
197,190
|
|
2
|
%
|
166,664
|
|
2
|
%
|
154,928
|
|
1
|
%
|
99,163
|
|
2
|
%
|
134,762
|
|
2
|
%
|
||||||||||||||
|
Consumer and other
|
1,051,486
|
|
9
|
%
|
647,102
|
|
6
|
%
|
403,470
|
|
4
|
%
|
102,573
|
|
2
|
%
|
89,849
|
|
2
|
%
|
||||||||||||||
|
Total loans outstanding
|
12,097,906
|
|
100
|
%
|
11,102,857
|
|
100
|
%
|
10,544,989
|
|
100
|
%
|
6,251,371
|
|
100
|
%
|
5,568,082
|
|
100
|
%
|
||||||||||||||
|
Less: deferred loan costs (fees)
|
209
|
|
(282
|
)
|
(1,657
|
)
|
(3,030
|
)
|
(2,890
|
)
|
||||||||||||||||||||||||
|
Gross loans receivable
|
12,098,115
|
|
11,102,575
|
|
10,543,332
|
|
6,248,341
|
|
5,565,192
|
|
||||||||||||||||||||||||
|
Less: allowance for loan losses
|
(92,557
|
)
|
(84,541
|
)
|
(79,343
|
)
|
(76,408
|
)
|
(67,758
|
)
|
||||||||||||||||||||||||
|
Loans receivable, net
|
$
|
12,005,558
|
|
$
|
11,018,034
|
|
$
|
10,463,989
|
|
$
|
6,171,933
|
|
$
|
5,497,434
|
|
|||||||||||||||||||
43
Commercial Real Estate Loans
Our commercial real estate loans consist primarily of loans secured by deeds of trust on commercial real estate, including SBA loans secured by commercial real estate. It is our general policy to restrict commercial real estate loan amounts to 75% of the appraised value of the property at the time of loan funding. We offer both fixed and floating interest rate loans. The maturities on such loans are generally up to seven years (with payments determined on the basis of principal amortization schedules of up to 25 years and a balloon payment due at maturity). Real estate loans secured by non-consumer residential real estate comprise less than 1% of the total loan portfolio (consumer residential mortgage loans are classified separately and included in consumer loans). Construction loans are also a small portion of the total real estate portfolio, comprising approximately 2% of total loans outstanding. Total real estate loans, consisting primarily of commercial real estate loans, increased
$213.4 million
or,
3%
, to
$8.72 billion
at
December 31, 2018
from
$8.51 billion
at
December 31, 2017
. Although commercial real estate originations declined slightly in 2018 compared to 2017, the decline in payoff and pay-downs resulted in a small increase in commercial real estate loans for 2018 compared to 2017.
Other Loans
Commercial business loans include term loans to businesses, lines of credit, trade finance facilities, commercial SBA loans, equipment leasing loans, and warehouse lines of credit. Business term loans are generally provided to finance business acquisitions, working capital, and/or equipment purchases. Lines of credit are generally provided to finance short-term working capital needs. Trade finance facilities are generally provided to finance import and export activities. SBA loans are provided to small businesses under the U.S. SBA guarantee program. Short-term credit facilities (payable within one year) typically provide for periodic interest payments, with principal payable at maturity. Term loans (usually 5 to 7 years) normally provide for monthly payments of both principal and interest. SBA commercial loans usually have a longer maturity (7 to 10 years). These credits are reviewed on a periodic basis, and most loans are secured by business assets and/or real estate. Warehouse lines of credit are utilized by mortgage originators to fund mortgages which are then pledged to the Bank as collateral until the mortgage loans are sold and the lines of credit are paid down. The typical duration of these lines of credit from the time of funding to pay-down ranges from 10-30 days. Although collateralized by mortgage loans, the structure of warehouse lending agreements results in the commercial business classification for warehouse lines of credit. During
2018
, commercial business loans increased
$346.8 million
, or
19%
, to
$2.13 billion
at
December 31, 2018
from
$1.78 billion
at
December 31, 2017
. The increase in commercial business loans was due to an increase in commercial lines of credit and commercial term loans. Consumer loans comprise approximately
9%
of the total loan portfolio. Most of our consumer loan portfolio, approximately 95%, consists of single-family mortgages, but also include automobile loans, home equity lines and loans, signature term loans and lines of credit, and credit card loans. Consumer loans increased
$404.4 million
, or
62%
, to
$1.05 billion
at
December 31, 2018
from
$647.1 million
at
December 31, 2017
. The increase in consumer loans was due primarily to the increase in originations of single-family mortgages in 2018.
We provide lines of credit to business customers usually on an annual renewal basis. We normally do not make loan commitments in material amounts for periods in excess of one year.
The following table shows our loan commitments and letters of credit outstanding at the dates indicated:
|
|
December 31,
|
||||||||||||||||||
|
|
2018
|
2017
|
2016
|
2015
|
2014
|
||||||||||||||
|
(Dollars in thousands)
|
|||||||||||||||||||
|
Commitments to extend credit
|
$
|
1,712,032
|
|
$
|
1,526,981
|
|
$
|
1,592,221
|
|
$
|
802,251
|
|
$
|
586,714
|
|
||||
|
Standby letters of credit
|
69,763
|
|
74,748
|
|
63,753
|
|
45,083
|
|
41,987
|
|
|||||||||
|
Other commercial letters of credit
|
65,822
|
|
74,147
|
|
52,125
|
|
36,256
|
|
37,439
|
|
|||||||||
|
Total
|
$
|
1,847,617
|
|
$
|
1,675,876
|
|
$
|
1,708,099
|
|
$
|
883,590
|
|
$
|
666,140
|
|
||||
Nonperforming Assets
Nonperforming assets consist of nonaccrual loans, accruing loans that are 90 days or more past due, accruing restructured loans, and OREO.
Loans are placed on nonaccrual status when they become 90 days or more past due, unless the loan is both well-secured and in the process of collection. Loans may be placed on nonaccrual status earlier if the full and timely collection of principal or interest becomes uncertain. When a loan is placed on nonaccrual status, unpaid accrued interest is charged against interest income. Loans are charged off when collection of the loan is determined to be unlikely. Loans are restructured when, for economic or legal reasons related to the borrower’s financial difficulties, the Bank grants a concession to the borrower that it would not otherwise consider. OREO consists of real estate acquired by the Bank through foreclosure or similar means, including by deed from the owner in lieu of foreclosure, and is held for future sale.
44
Nonperforming assets were
$113.0 million
at
December 31, 2018
compared to
$125.2 million
at
December 31, 2017
. Nonperforming assets at
December 31, 2018
decreased from nonperforming assets at
December 31, 2017
due to the decreases in accruing restructured loans and OREO which was partially offset by an increase in nonaccrual loans . The following table illustrates the composition of nonperforming assets and nonperforming loans by legacy loans (loans originated by us) and acquired loans (excluding PCI loans) as of the dates indicated:
|
|
December 31,
|
||||||||||||||||||
|
2018
|
2017
|
2016
|
2015
|
2014
|
|||||||||||||||
|
(Dollars in thousands)
|
|||||||||||||||||||
|
Nonaccrual loans
|
$
|
53,286
|
|
$
|
46,775
|
|
$
|
40,074
|
|
$
|
40,801
|
|
$
|
46,353
|
|
||||
|
Loans past due 90 days or more and still accruing
|
1,529
|
|
407
|
|
305
|
|
375
|
|
361
|
|
|||||||||
|
Accruing restructured loans
|
50,410
|
|
67,250
|
|
48,874
|
|
47,984
|
|
57,128
|
|
|||||||||
|
Total nonperforming loans
|
105,225
|
|
114,432
|
|
89,253
|
|
89,160
|
|
103,842
|
|
|||||||||
|
Other real estate owned
|
7,754
|
|
10,787
|
|
21,990
|
|
21,035
|
|
21,938
|
|
|||||||||
|
Total nonperforming assets
|
$
|
112,979
|
|
$
|
125,219
|
|
$
|
111,243
|
|
$
|
110,195
|
|
$
|
125,780
|
|
||||
|
Nonaccrual loans:
|
|||||||||||||||||||
|
Legacy Portfolio
|
$
|
42,248
|
|
$
|
28,235
|
|
$
|
28,944
|
|
$
|
28,469
|
|
$
|
28,815
|
|
||||
|
Acquired Portfolio
|
11,038
|
|
18,540
|
|
11,130
|
|
12,332
|
|
17,538
|
|
|||||||||
|
Total nonaccrual loans
|
$
|
53,286
|
|
$
|
46,775
|
|
$
|
40,074
|
|
$
|
40,801
|
|
$
|
46,353
|
|
||||
|
Nonperforming loans:
|
|||||||||||||||||||
|
Legacy Portfolio
|
$
|
75,859
|
|
$
|
77,305
|
|
$
|
74,890
|
|
$
|
73,422
|
|
$
|
83,609
|
|
||||
|
Acquired Portfolio
|
29,366
|
|
37,127
|
|
14,363
|
|
15,738
|
|
20,233
|
|
|||||||||
|
Total nonperforming loans
|
$
|
105,225
|
|
$
|
114,432
|
|
$
|
89,253
|
|
$
|
89,160
|
|
$
|
103,842
|
|
||||
45
Maturity of Loans
The following table illustrates the maturity distribution intervals of loans outstanding as of
December 31, 2018
.
|
|
December 31, 2018
|
||||||||||||||
|
|
Loans Maturing
|
||||||||||||||
|
Within One
Year
|
After One to
Five Years
|
After Five
Years
|
Total Loans
Outstanding
|
||||||||||||
|
(Dollars in thousands)
|
|||||||||||||||
|
Real estate loans:
|
|||||||||||||||
|
Residential
|
$
|
9,163
|
|
$
|
33,077
|
|
$
|
8,957
|
|
$
|
51,197
|
|
|||
|
Commercial
|
687,026
|
|
3,542,013
|
|
4,166,288
|
|
8,395,327
|
|
|||||||
|
Construction
|
239,559
|
|
35,517
|
|
—
|
|
275,076
|
|
|||||||
|
Total real estate loans
|
935,748
|
|
3,610,607
|
|
4,175,245
|
|
8,721,600
|
|
|||||||
|
Commercial business loans
|
991,328
|
|
587,999
|
|
548,303
|
|
2,127,630
|
|
|||||||
|
Trade finance loans
|
188,460
|
|
8,730
|
|
—
|
|
197,190
|
|
|||||||
|
Consumer loans
|
35,156
|
|
18,275
|
|
998,055
|
|
1,051,486
|
|
|||||||
|
Total loans outstanding
|
$
|
2,150,692
|
|
$
|
4,225,611
|
|
$
|
5,721,603
|
|
$
|
12,097,906
|
|
|||
|
Fixed interest rate*
|
$
|
530,413
|
|
$
|
2,937,063
|
|
$
|
4,088,661
|
|
$
|
7,556,137
|
|
|||
|
Variable interest rate
|
1,620,279
|
|
1,288,548
|
|
1,632,942
|
|
4,541,769
|
|
|||||||
|
Total loans outstanding
|
$
|
2,150,692
|
|
$
|
4,225,611
|
|
$
|
5,721,603
|
|
$
|
12,097,906
|
|
|||
* Includes hybrid loans (loans with fixed interest rates for a specified period and then convert to variable interest rates) in fixed interest rate periods as of
December 31, 2018
.
Concentrations
Our lending activities are predominately in California, New Jersey and the New York City, Houston, Dallas, Chicago, and Seattle metropolitan areas. At
December 31, 2018
, loans from California represented
68.1%
of the total loans outstanding and loans from New York and New Jersey represented
13.9%
. The remaining
18.0%
of total loans outstanding represented loans from other states. Although we have a diversified loan portfolio, a substantial portion of the loan portfolio and credit performance depends on the economic stability of Southern California. Within the California market, most of our business activity is with customers located within Southern California (
59.0%
). Therefore, our exposure to credit risk is significantly affected by changes in the economy in the Southern California area. Within our commercial real estate loan portfolio, the largest industry concentrations are retail building (
20.1%
), hotel/motel (
19.4%
), gas station & car wash (
11.2%
), and industrial & warehouse (
10.4%
). Within our commercial and industrial loan portfolio, the largest industry concentrations are wholesalers (
25.3%
), manufacturing (
13.9%
), retail trade (
13.6%
), and services (
8.2%
).
Allowance for Loan Losses
The Bank has implemented a multi-faceted process to identify, manage, and mitigate the credit risks that are inherent in the loan portfolio. For new loans, each loan application package is fully analyzed by experienced reviewers and approvers. In accordance with current lending approval authority guidelines, a majority of loans are approved by the Management Loan Committee (“MLC”) and Directors Loan Committee (“DLC”). For existing loans, the Bank maintains a systematic loan review program, which includes internally conducted reviews and periodic reviews by external loan review consultants. Based on these reviews, loans are graded as to their overall credit quality, which is measured based on: payment capacity and collateral documentation; proper lien perfection; proper approval by loan committee(s); adherence to any loan agreement covenants; compliance with internal policies and procedures, and with laws and regulations; adequacy and strength of repayment sources including borrower or collateral generated cash flow; payment performance; and liquidation value of the collateral. We closely monitor loans that management has determined require further supervision because of the loan size, loan structure, and/or specific circumstances of the borrower.
When principal or interest on a loan is 90 days or more past due, a loan is generally placed on nonaccrual status unless it is considered to be both well-secured and in the process of collection. Further, a loan is considered a loss in whole or in part when (1) it appears that loss exposure on the loan exceeds the collateral value for the loan, (2) servicing of the unsecured portion has been discontinued, or (3) collection is not anticipated due to the borrower’s financial condition and general economic conditions in the borrower’s industry. Any loan or portion of a loan judged by management to be uncollectible is charged against the allowance for loan losses, while any recoveries are credited to the allowance.
46
The allowance for loan losses was
$92.6 million
at
December 31, 2018
, compared to
$84.5 million
at
December 31, 2017
. We recorded provisions for loan losses of
$14.9 million
in
2018
compared to
$17.4 million
in
2017
, and
$9.0 million
in
2016
. During
2018
, we charged off
$10.9 million
in loans outstanding and recovered
$4.0 million
in loans previously charged off. Total Criticized Loans, or loan rated special mention, substandard, doubtful, or loss at
December 31, 2018
totaled
$481.4 million
compared to
$568.5 million
at
December 31, 2017
. The allowance for loan losses was
0.77%
of gross loans at
December 31, 2018
compared to
0.76%
at
December 31, 2017
. In addition to allowance for loan losses, we had $736 thousand in allowances for unfunded loan commitments as of
December 31, 2018
, compared to $836 thousand as of
December 31, 2017
.
For loans not classified as impaired loans, general loan loss allowances are provided to cover probable and incurred losses. The allowance is determined based first on a quantitative analysis using a loss migration methodology. The loans are classified by type and loan grade and the historical loss migration is tracked for the various stratifications. We further segregate these stratifications between loans accounted for under the amortized cost method (referred to as “Legacy Loans”) and loans previously acquired (referred to as “Acquired Loans”), as acquired loans were originally recorded at fair value with no carryover of the related allowance for loan losses. See “Financial Condition—Allowance for Loan Losses Methodology” for a detailed description of our loan loss methodology.
Impaired loans as defined by ASC 310-10-35, totaled
$104.0 million
and
$114.3 million
, as of
December 31, 2018
and
December 31, 2017
, respectively, with specific allowances of
$4.8 million
and
$5.3 million
, respectively. The MLC, DLC, and the Management ALLL Committee of the Bank all review the adequacy of the allowance for loan losses on at least a quarterly basis and more frequently as needed. Based upon these evaluations and internal and external reviews of the overall quality of our loan portfolio, we believe that the allowance for loan losses was adequate to absorb estimated probable incurred losses inherent in the loan portfolio as of
December 31, 2018
. However, no assurances can be given that the Bank will not experience further losses in excess of the allowance, which may require additional future provisions for loan losses.
The following table presents total nonaccrual and delinquent loans (loans past due 30 to 89 days) as of the dates indicated:
|
December 31,
|
|||||||||||||||||||
|
2018
|
2017
|
2016
|
2015
|
2014
|
|||||||||||||||
|
|
(Dollars in thousands)
|
||||||||||||||||||
|
Real estate—Residential
|
$
|
—
|
|
$
|
—
|
|
$
|
679
|
|
$
|
—
|
|
$
|
—
|
|
||||
|
Real estate—Commercial
|
38,260
|
|
33,838
|
|
37,649
|
|
28,085
|
|
34,051
|
|
|||||||||
|
Real estate—Construction
|
—
|
|
1,300
|
|
2,813
|
|
1,369
|
|
1,521
|
|
|||||||||
|
Commercial business
|
21,187
|
|
25,546
|
|
13,076
|
|
15,893
|
|
12,875
|
|
|||||||||
|
Trade finance
|
2,697
|
|
—
|
|
2,556
|
|
1,731
|
|
3,194
|
|
|||||||||
|
Consumer and other
|
18,235
|
|
10,451
|
|
1,643
|
|
2,087
|
|
1,211
|
|
|||||||||
|
Total Nonaccrual and Delinquent Loans
|
$
|
80,379
|
|
$
|
71,135
|
|
$
|
58,416
|
|
$
|
49,165
|
|
$
|
52,852
|
|
||||
|
Nonaccrual loans included above
|
$
|
53,286
|
|
$
|
46,775
|
|
$
|
40,074
|
|
$
|
40,801
|
|
$
|
46,353
|
|
||||
We categorize loans into risk categories based on relevant information about the ability of borrowers to service their debt including but not limited to: current financial information, historical payment experience, credit documentation, public information, and current economic trends. We analyze loans individually by classifying the loans as to credit risk. This analysis includes all non-homogeneous loans. Homogeneous loans are not risk rated and credit risk is analyzed largely by the number of days past due.
This analysis is performed on at least a quarterly basis. We use the following definitions for risk ratings:
|
•
|
Pass: Loans that meet a preponderance or more of our underwriting criteria and evidence an acceptable level of risk.
|
|
•
|
Special Mention: Loans that have potential weaknesses that deserve management’s close attention. If left uncorrected, these potential weaknesses may result in deterioration of the repayment prospects for the loan or of the institution’s credit position at some future date.
|
|
•
|
Substandard: Loans classified as substandard are inadequately protected by the current net worth and paying capacity of the borrower or of the collateral pledged, if any. Loans so classified have a well-defined weakness or weaknesses that jeopardize the repayment of the debt. They are characterized by the distinct possibility that the institution will sustain some loss if the deficiencies are not corrected.
|
|
•
|
Doubtful/Loss: Loans classified as doubtful have all the weaknesses inherent in those classified as substandard with the added characteristic that the weaknesses make collection or repayment in full, on the basis of currently existing facts, conditions, and values, highly questionable and improbable.
|
47
Loans assigned a risk rating of Special Mention, Substandard, Doubtful, or Loss are referred to as Criticized Loans and loans assigned a risk rating of Substandard, Doubtful, or Loss are separately referred to as Classified Loans. The following table provides the detail of Criticized Loans by risk rating as of the dates indicated:
|
December 31,
|
|||||||||||||||||||
|
2018
|
2017
|
2016
|
2015
|
2014
|
|||||||||||||||
|
(Dollars in thousands)
|
|||||||||||||||||||
|
Special Mention
|
$
|
163,089
|
|
$
|
214,891
|
|
$
|
243,656
|
|
$
|
104,186
|
|
$
|
122,335
|
|
||||
|
Substandard
|
317,915
|
|
353,222
|
|
311,106
|
|
201,362
|
|
221,875
|
|
|||||||||
|
Doubtful/Loss
|
412
|
|
362
|
|
1,949
|
|
2,214
|
|
2,187
|
|
|||||||||
|
Total Criticized Loans
|
$
|
481,416
|
|
$
|
568,475
|
|
$
|
556,711
|
|
$
|
307,762
|
|
$
|
346,397
|
|
||||
The following table shows the provision for loan losses, the amount of loans charged off, and recoveries on loans previously charged off together with the balance in the allowance for loan losses at the beginning and end of each year, the amount of average and total loans outstanding as well as other pertinent ratios as of the dates and for the years indicated:
|
At or For The Year Ended December 31,
|
|||||||||||||||||||
|
2018
|
2017
|
2016
|
2015
|
2014
|
|||||||||||||||
|
(Dollars in thousands)
|
|||||||||||||||||||
|
LOANS:
|
|||||||||||||||||||
|
Average loans receivable, including loans held for sale (net of deferred fees)
|
$
|
11,547,022
|
|
$
|
10,642,349
|
|
$
|
8,121,897
|
|
$
|
5,846,658
|
|
$
|
5,355,243
|
|
||||
|
Total loans receivables, excluding loans held for sale (net of deferred fees)
|
12,098,115
|
|
11,102,575
|
|
10,543,332
|
|
6,248,341
|
|
5,565,192
|
|
|||||||||
|
ALLOWANCE:
|
|||||||||||||||||||
|
Balance—beginning of year
|
84,541
|
|
79,343
|
|
76,408
|
|
67,758
|
|
67,320
|
|
|||||||||
|
Loans charged off:
|
|||||||||||||||||||
|
Commercial real estate
|
6,726
|
|
3,142
|
|
910
|
|
741
|
|
2,726
|
|
|||||||||
|
Commercial business and trade finance
|
2,891
|
|
13,300
|
|
7,293
|
|
3,530
|
|
14,933
|
|
|||||||||
|
Consumer and other loans
|
1,258
|
|
968
|
|
757
|
|
641
|
|
100
|
|
|||||||||
|
Total loans charged off
|
10,875
|
|
17,410
|
|
8,960
|
|
4,912
|
|
17,759
|
|
|||||||||
|
Less recoveries:
|
|||||||||||||||||||
|
Commercial real estate
|
1,028
|
|
212
|
|
1,187
|
|
1,947
|
|
963
|
|
|||||||||
|
Commercial business and trade finance
|
2,892
|
|
4,996
|
|
1,614
|
|
3,011
|
|
4,366
|
|
|||||||||
|
Consumer and other loans
|
71
|
|
40
|
|
94
|
|
604
|
|
230
|
|
|||||||||
|
Total loan recoveries
|
3,991
|
|
5,248
|
|
2,895
|
|
5,562
|
|
5,559
|
|
|||||||||
|
Net loans charged off (recovered)
|
6,884
|
|
12,162
|
|
6,065
|
|
(650
|
)
|
12,200
|
|
|||||||||
|
Provision for loan losses
|
14,900
|
|
17,360
|
|
9,000
|
|
8,000
|
|
12,638
|
|
|||||||||
|
Balance—end of year
|
$
|
92,557
|
|
$
|
84,541
|
|
$
|
79,343
|
|
$
|
76,408
|
|
$
|
67,758
|
|
||||
|
RATIOS:
|
|||||||||||||||||||
|
Net loan charge-offs (recoveries) to average loans
|
0.06
|
%
|
0.11
|
%
|
0.07
|
%
|
(0.01
|
)%
|
0.23
|
%
|
|||||||||
|
Allowance for loan losses to total loans receivable
|
0.77
|
%
|
0.76
|
%
|
0.75
|
%
|
1.22
|
%
|
1.22
|
%
|
|||||||||
|
Net loan charge-offs (recoveries) to allowance for loan losses
|
7.44
|
%
|
14.39
|
%
|
7.64
|
%
|
(0.85
|
)%
|
18.01
|
%
|
|||||||||
|
Net loan charge-offs (recoveries) to provision for loan losses
|
46.20
|
%
|
70.06
|
%
|
67.39
|
%
|
(8.13
|
)%
|
96.53
|
%
|
|||||||||
|
Allowance for loan losses to nonperforming loans
|
87.96
|
%
|
73.88
|
%
|
88.90
|
%
|
85.70
|
%
|
65.25
|
%
|
|||||||||
48
Allowance for Loan Losses Methodology
We maintain an allowance for loan losses to provide for estimated probable losses that are inherent in our loan portfolio. The allowance is based on our regular quarterly assessments. Our methodologies for measuring the appropriate level of the allowance include the combination of: (1) a quantitative historical loss migration analysis (“Migration Analysis”) for pools of loans and a qualitative analysis of subjective factors and (2) a specific allowance method for impaired loans.
The following table reflects our allocation of the allowance for loan losses by loan category and the ratio of each loan category to total loans as of the dates indicated:
|
December 31,
|
||||||||||||||||||||||||||||||||||
|
|
2018
|
2017
|
2016
|
2015
|
2014
|
|||||||||||||||||||||||||||||
|
|
Amount of allowance for loan losses
|
Percent of loans to total loans
|
Amount of allowance for loan losses
|
Percent of loans to total loans
|
Amount of allowance for loan losses
|
Percent of loans to total loans
|
Amount of allowance for loan losses
|
Percent of loans to total loans
|
Amount of allowance for loan losses
|
Percent of loans to total loans
|
||||||||||||||||||||||||
|
|
(Dollars in thousands)
|
|||||||||||||||||||||||||||||||||
|
Loan Type
|
||||||||||||||||||||||||||||||||||
|
Real estate
—
residential
|
$
|
112
|
|
—
|
%
|
$
|
88
|
|
—
|
%
|
$
|
209
|
|
1
|
%
|
$
|
230
|
|
—
|
%
|
$
|
146
|
|
—
|
%
|
|||||||||
|
Real estate
—
commercial
|
55,890
|
|
69
|
%
|
57,664
|
|
73
|
%
|
49,917
|
|
75
|
%
|
54,505
|
|
78
|
%
|
46,535
|
|
78
|
%
|
||||||||||||||
|
Real estate
—
construction
|
765
|
|
2
|
%
|
930
|
|
3
|
%
|
1,621
|
|
2
|
%
|
917
|
|
2
|
%
|
667
|
|
2
|
%
|
||||||||||||||
|
Commercial business
|
27,765
|
|
18
|
%
|
20,755
|
|
16
|
%
|
23,547
|
|
17
|
%
|
16,547
|
|
16
|
%
|
16,471
|
|
16
|
%
|
||||||||||||||
|
Trade finance
|
719
|
|
2
|
%
|
1,716
|
|
2
|
%
|
1,897
|
|
1
|
%
|
3,592
|
|
2
|
%
|
3,456
|
|
2
|
%
|
||||||||||||||
|
Consumer and other
|
7,306
|
|
9
|
%
|
3,388
|
|
6
|
%
|
2,152
|
|
4
|
%
|
617
|
|
2
|
%
|
483
|
|
2
|
%
|
||||||||||||||
|
Total
|
$
|
92,557
|
|
100
|
%
|
$
|
84,541
|
|
100
|
%
|
$
|
79,343
|
|
100
|
%
|
$
|
76,408
|
|
100
|
%
|
$
|
67,758
|
|
100
|
%
|
|||||||||
The adequacy of the allowance for loan losses is determined by management based upon an evaluation and review of the credit quality of the loan portfolio, consideration of historical loan loss migration experience, relevant internal and external factors that affect the collection of a loan, and other pertinent factors.
The Migration Analysis is a formula methodology based on the Bank’s actual historical net charge off experience for each loan pool and loan risk grade (Pass, Special Mention, Substandard and Doubtful). The migration analysis is centered on the Bank’s internal credit risk rating system. Our internal and external credit reviews are used to determine and validate loan risk grades. This credit review system takes into consideration factors such as: borrower’s background and experience; historical and current financial condition; credit history and payment performance; economic conditions and their impact on various industries; type, fair value, and volatility of the value of collateral; lien position; and the financial strength of any guarantors.
A general loan loss allowance is provided on loans not specifically identified as impaired (“non-impaired loans”). For non- impaired loans, including loans acquired without credit deterioration, the allowance is determined first based on a quantitative analysis using a loss migration methodology. The loans are classified by type and loan grade and the historical loss migration is tracked for the various stratifications. Loss experience is quantified for a specified period determined by management and then weighted to give more weight to the most recent periods. That loss experience is then applied to the stratified portfolio at the end of each quarter. As of December 31, 2018, we utilized nineteen non-homogeneous loan pools in the quantitative analysis process. The non-impaired commercial real estate loan portfolio was stratified into fourteen different loan pools based on property types and the non-impaired commercial and industrial loan portfolio was stratified into five different loan pools based on loan type in order to allocate historic loss experience to more granular loan pools.
Additionally, in order to systematically quantify the credit risk impact of other trends and changes within the loan portfolio, the Bank utilizes qualitative adjustments to the Migration Analysis within established parameters. The parameters for making adjustments are established under a Credit Risk Matrix that provides seven possible scenarios for each of the factors below. The matrix allows for up to three positive (major, moderate and minor), three negative (major, moderate and minor), and one neutral credit risk scenarios within each factor for each loan type pool. Generally, the factors are considered to have no significant impact (neutral) to our historical migration ratios. However, if information exists to warrant adjustment to the Migration Analysis, changes are made in accordance with the established parameters supported by narrative and/or statistical analysis. The Credit Risk Matrix and the nine possible scenarios enable the Bank to qualitatively adjust the Loss Migration Ratio or individual specific reserve allocations by as much as 50 basis points in either direction (positive or negative) for each loan type pool. This matrix considers the following nine factors, which are patterned after the guidelines provided under the Federal Financial Institutions Examination Council (“FFIEC”) Interagency Policy Statement on the Allowance for Loan and Lease Losses:
49
|
•
|
Changes in lending policies and procedures, including underwriting standards and collection, charge-off and recovery practices.
|
|
•
|
Changes in national and local economic and business conditions and developments, including the condition of various market segments.
|
|
•
|
Changes in the nature and volume of the loan portfolio.
|
|
•
|
Changes in the experience, ability and depth of lending management and staff.
|
|
•
|
Changes in the trends of the volume and severity of past due and classified loans and changes in trends in the volume of nonaccrual loans, troubled debt restructurings and other loan modifications.
|
|
•
|
Changes in the quality of our loan review system and the degree of oversight by the Directors.
|
|
•
|
Changes in the value of underlying collateral for collateral dependent loans.
|
|
•
|
The existence and effect of any concentrations of credit, and changes in the level of such concentrations.
|
|
•
|
The effect of external factors such as competition and legal and regulatory requirements on the level of estimated losses in our loan portfolio.
|
We also establish specific loss allowances for loans where we have identified potential credit risk conditions or circumstances related to a specific individual credit. The specific allowance amounts are determined by a method prescribed by ASC 310-10-35-22,
Measurement of Impairment
. The loans identified as impaired are accounted for in accordance with one of the three acceptable valuation methods: 1) the present value of future cash flows discounted at the loan’s effective interest rate; 2) the loan’s observable market price; or 3) the fair value of the collateral, if the loan is collateral dependent. For the collateral dependent impaired loans, we obtain an appraisal to determine the amount of impairment as of the date that the loan became impaired. The appraisals are based on an “as is” valuation. To ensure that appraised values remain current, we generally obtain either an internally prepared evaluation report or an updated appraisal every twelve months from a qualified independent appraiser. If the fair value of the collateral, less cost to sell, is less than the recorded amount of the loan, we then recognize impairment by creating or adjusting an existing valuation allowance with a corresponding charge to the provision for loan losses. If an impaired loan is expected to be collected through liquidation of the collateral, the loan is deemed to be collateral dependent and the amount of impairment is charged off against the allowance for loan losses.
We consider a loan to be impaired when it is probable that not all amounts due (principal and interest) will be collectible in accordance with the contractual terms of the loan agreement. Factors considered by management in determining impairment include payment status, collateral value and the probability of collecting scheduled principal and interest payments when due. Loans that experience insignificant payment delays and payment shortfalls generally are not classified as impaired. The significance of payment delays and payment shortfalls is determined on a case-by-case basis by taking into consideration all of the circumstances surrounding the loan and the borrower, including the length of the delay, the reasons for the delay, the borrower’s prior payment record and the amount of the shortfall in relation to the principal and interest owed.
For commercial business loans, real estate loans and certain consumer loans, we base the measurement of loan impairment on the present value of the expected future cash flows, discounted at the loan’s effective interest rate or on the fair value of the loan’s collateral if the loan is collateral dependent. The scope for evaluation of individual impairment includes all loans greater than $500 thousand risk graded Substandard, Doubtful, Loss, or classified as troubled debt restructurings (“TDRs”). Management evaluates most consumer loans for impairment on a collective basis because these loans generally have smaller balances and are homogeneous in the underwriting of terms and conditions and in the types of collateral. If a loan is deemed to be impaired, the amount of the impairment is supported by a specific allowance amount which is included in the allowance for loan losses through a charge to the provision for loan losses.
Impaired loans at
December 31, 2018
were
$104.0 million
, a net decrease of $10.3 million from
$114.3 million
at
December 31, 2017
. This net decrease in impaired loans is due primarily to payoffs and charge-offs of impaired loans in 2018.
Investment Security Portfolio
The main objectives of our investment strategy are to provide sources of liquidity while managing our interest rate risk and to generate an adequate level of interest income without taking undue risks. Our investment policy permits investments in various types of securities, certificates of deposits, and federal funds sold in compliance with various restrictions in the policy. All of our investment securities are classified as available for sale. The securities for which we have the ability and intent to hold to maturity may be classified as held to maturity securities. However, we do not currently maintain a held-for-maturity or trading portfolio.
50
Our available for sale securities totaled
$1.85 billion
at
December 31, 2018
, compared to
$1.72 billion
at
December 31, 2017
. We had no securities that were categorized as held to maturity at
December 31, 2018
or
2017
. We had securities that were called or paid down totaling
$221.6 million
and purchased
$393.6 million
in securities during the year. At
December 31, 2018
, we had a carrying balance of $354.6 million in securities that were pledged to secure public deposits, or for other purposes required or permitted by law. $336.8 million in securities were pledged in the State of California time deposit program, $6.8 million was pledged at the United State Department of Justice, and $11.1 million were pledged for other public deposits. At December 31, 2017, we had $22.0 million in mutual funds that were categorized as available for sale securities that were subsequently reclassified as equity investments in accordance with the adoption of ASU 2016-01 on January 1, 2018.
Our investment portfolio consists of government sponsored enterprise (“GSE”) bonds, mortgage backed securities (“MBS”), collateralized mortgage obligations (“CMOs”), corporate securities, and municipal securities.
Our available for sale securities portfolio is primarily invested in residential CMOs and residential and commercial MBS, which combined to represent
96%
and 94% of our total available for sale portfolio as of
December 31, 2018
and
2017
, respectively. At
December 31, 2018
and
2017
, all of our CMOs and MBS were issued by the Government National Mortgage Association (“GNMA”), Fannie Mae (“FNMA”), or Freddie Mac (“FHLMC”), which guarantee the contractual cash flows of these investments. All of our corporate and municipal securities at December 31, 2018 were rated as investment grade.
The following table presents the amortized cost, estimated fair value, and net unrealized gain and losses on our investment securities as of the dates indicated:
|
|
December 31,
|
||||||||||||||||||||||
|
|
2018
|
2017
|
|||||||||||||||||||||
|
|
Amortized
Cost
|
Estimated
Fair
Value
|
Net
Unrealized
Loss
|
Amortized
Cost
|
Estimated
Fair
Value
|
Net Unrealized
Loss
|
|||||||||||||||||
|
|
(Dollars in thousands)
|
||||||||||||||||||||||
|
Debt securities:
|
|||||||||||||||||||||||
|
U.S. Government agency and U.S. Government sponsored enterprises:
|
|
|
|||||||||||||||||||||
|
CMOs
|
$
|
914,710
|
|
$
|
895,122
|
|
$
|
(19,588
|
)
|
$
|
856,193
|
|
$
|
838,709
|
|
$
|
(17,484
|
)
|
|||||
|
MBS:
|
|
|
|||||||||||||||||||||
|
Residential
|
415,659
|
|
402,605
|
|
(13,054
|
)
|
477,676
|
|
471,214
|
|
(6,462
|
)
|
|||||||||||
|
Commercial
|
481,081
|
|
469,126
|
|
(11,955
|
)
|
308,046
|
|
301,365
|
|
(6,681
|
)
|
|||||||||||
|
Corporate securities
|
5,000
|
|
3,826
|
|
(1,174
|
)
|
4,997
|
|
4,475
|
|
(522
|
)
|
|||||||||||
|
Municipal securities
|
77,168
|
|
75,586
|
|
(1,582
|
)
|
82,542
|
|
82,537
|
|
(5
|
)
|
|||||||||||
|
Total debt securities
|
$
|
1,893,618
|
|
$
|
1,846,265
|
|
$
|
(47,353
|
)
|
$
|
1,729,454
|
|
$
|
1,698,300
|
|
$
|
(31,154
|
)
|
|||||
|
Mutual funds*
|
—
|
|
—
|
|
—
|
|
22,425
|
|
21,957
|
|
(468
|
)
|
|||||||||||
|
Total
|
$
|
1,893,618
|
|
$
|
1,846,265
|
|
$
|
(47,353
|
)
|
$
|
1,751,879
|
|
$
|
1,720,257
|
|
$
|
(31,622
|
)
|
|||||
* Mutual funds were reclassified as equity investments in accordance with ASU 2016-01 on January 1, 2018.
51
The following table summarizes the maturity of securities based on carrying value and their related weighted average yield (non-tax equivalent) at
December 31, 2018
:
|
|
Within One Year
|
After One But
Within Five Years
|
After Five But
Within Ten Years
|
After Ten Years
|
Total
|
|||||||||||||||||||||||||||||
|
|
Amount
|
Yield
|
Amount
|
Yield
|
Amount
|
Yield
|
Amount
|
Yield
|
Amount
|
Yield
|
||||||||||||||||||||||||
|
|
(Dollars in thousands)
|
|||||||||||||||||||||||||||||||||
|
CMOs*
|
$
|
—
|
|
—
|
%
|
$
|
2,354
|
|
1.49
|
%
|
$
|
5,383
|
|
1.82
|
%
|
$
|
887,385
|
|
2.59
|
%
|
$
|
895,122
|
|
2.59
|
%
|
|||||||||
|
MBS:
|
|
|
||||||||||||||||||||||||||||||||
|
Residential*
|
—
|
|
—
|
%
|
5,388
|
|
1.71
|
%
|
66,286
|
|
1.88
|
%
|
330,931
|
|
2.56
|
%
|
402,605
|
|
2.43
|
%
|
||||||||||||||
|
Commercial*
|
—
|
|
—
|
%
|
7,251
|
|
1.88
|
%
|
310,609
|
|
3.11
|
%
|
151,266
|
|
2.48
|
%
|
469,126
|
|
2.89
|
%
|
||||||||||||||
|
Corporate Securities
|
—
|
|
—
|
%
|
—
|
|
—
|
%
|
—
|
|
—
|
%
|
3,826
|
|
3.61
|
%
|
3,826
|
|
3.61
|
%
|
||||||||||||||
|
Municipal Securities
|
761
|
|
4.07
|
%
|
17,669
|
|
2.28
|
%
|
27,901
|
|
2.19
|
%
|
29,255
|
|
2.90
|
%
|
75,586
|
|
2.50
|
%
|
||||||||||||||
|
Total
|
$
|
761
|
|
4.07
|
%
|
$
|
32,662
|
|
2.04
|
%
|
$
|
410,179
|
|
2.83
|
%
|
$
|
1,402,663
|
|
2.58
|
%
|
$
|
1,846,265
|
|
2.63
|
%
|
|||||||||
* Investments in U.S. Government agency and U.S. Government sponsored enterprises
The following table shows our investments with gross unrealized losses and their estimated fair values, aggregated by investment category and length of time that individual securities have been in a continuous unrealized loss position, at
December 31, 2018
:
|
|
Less than 12 months
|
12 months or longer
|
Total
|
|||||||||||||||||||||||||||||
|
Description of
Securities
|
Number of
Securities
|
Fair Value
|
Gross
Unrealized
Losses
|
Number of
Securities
|
Fair Value
|
Gross
Unrealized
Losses
|
Number of
Securities
|
Fair Value
|
Gross
Unrealized
Losses
|
|||||||||||||||||||||||
|
|
|
(Dollars in thousands)
|
||||||||||||||||||||||||||||||
|
CMOs*
|
1
|
|
$
|
8,041
|
|
$
|
(28
|
)
|
93
|
|
$
|
700,095
|
|
$
|
(21,101
|
)
|
94
|
|
$
|
708,136
|
|
$
|
(21,129
|
)
|
||||||||
|
MBS:
|
||||||||||||||||||||||||||||||||
|
Residential*
|
4
|
|
19,973
|
|
(37
|
)
|
45
|
|
363,334
|
|
(13,064
|
)
|
49
|
|
383,307
|
|
(13,101
|
)
|
||||||||||||||
|
Commercial*
|
3
|
|
38,494
|
|
(218
|
)
|
27
|
|
312,428
|
|
(12,761
|
)
|
30
|
|
350,922
|
|
(12,979
|
)
|
||||||||||||||
|
Corporate securities
|
—
|
|
—
|
|
—
|
|
1
|
|
3,826
|
|
(1,174
|
)
|
1
|
|
3,826
|
|
(1,174
|
)
|
||||||||||||||
|
Municipal securities
|
13
|
|
5,528
|
|
(83
|
)
|
32
|
|
42,444
|
|
(1,897
|
)
|
45
|
|
47,972
|
|
(1,980
|
)
|
||||||||||||||
|
Total
|
21
|
|
$
|
72,036
|
|
$
|
(366
|
)
|
198
|
|
$
|
1,422,127
|
|
$
|
(49,997
|
)
|
219
|
|
$
|
1,494,163
|
|
$
|
(50,363
|
)
|
||||||||
* Investments in U.S. Government agency and U.S. Government sponsored enterprises
ASC 320 requires an entity to assess whether the entity has the intent to sell a debt security or more likely than not will be required to sell the debt security before its anticipated recovery. If either of these conditions is met, an entity must recognize an other than temporary impairment (“OTTI”). If an entity does not intend to sell the debt security and will not be required to sell the debt security, the entity must consider whether it will recover the amortized cost basis of the security. If the present value of expected cash flows is less than the amortized cost basis of the security, OTTI shall be considered to have occurred. OTTI is then separated into the amount of the total impairment related to credit losses and the amount of the total impairment related to all other factors. An entity determines the impairment related to credit losses by comparing the present value of cash flows expected to be collected from the security with the amortized cost basis of the security. OTTI related to the credit loss is then recognized in earnings. OTTI related to all other factors is recognized in other comprehensive income.
ASC 320 requires an entity to assess whether the entity plans to sell an equity security and does not expect the fair value of the equity security to recover by the time of the sale. If both of these conditions are met, an entity must recognize OTTI when the decision to sell is made. The entity considers facts and circumstances present at the time of assessment, which include the consideration of general market conditions, and the duration and extent to which the fair value is below cost. OTTI related to equity securities is recognized in earnings.
52
We evaluate securities for OTTI on at least a quarterly basis, and more frequently when economic or market concerns warrant such evaluation. Consideration is given to the financial condition and near-term prospects of the issuer, the length of time and the extent to which the fair value of the securities has been less than our cost for the securities, and our intention to sell, or whether it is more likely than not that we will be required to sell, a security in an unrealized loss position before recovery of its amortized cost basis. In analyzing an issuer’s financial condition, we consider whether the securities are issued by the federal government or its agencies, whether downgrades by bond rating agencies have occurred, and the results of reviews of the issuer’s financial condition.
We consider the losses on our investments in an unrealized loss position at
December 31, 2018
to be temporary based on: 1) the likelihood of recovery; 2) the information available to us relative to the extent and duration of the decline in market value; and 3) our intention not to sell, and our determination that it is more likely than not that we will not be required to sell, a security in an unrealized loss position before recovery of its amortized cost basis. The increase in the net unrealized loss position can be attributed to the change in Treasury yields due to the increases in interest rates at
December 31, 2018
compared to rates at
December 31, 2017
.
Equity Investments
On January 1, 2018, we adopted ASU 2016-01 and reclassified $22.0 million in mutual funds classified as available for sale and other investments to equity investments. As of
December 31, 2018
, equity investments totaled $49.8 million. Equity investments as of
December 31, 2018
included $23.4 million in equity investments with readily determinable fair values and $26.4 million in equity investments without readily determinable fair values.
Equity investments with readily determinable fair values at
December 31, 2018
consisted of mutual funds totaling $21.5 million and $1.9 million in equity stock. Changes to the fair value of equity investments with readily determinable fair values is recorded in other noninterest income.
Equity investments without readily determinable fair values at
December 31, 2018
included $25.1 million in Community Reinvestment Act investments, $1.0 million in Community Development Financial Institutions investments, and $370 thousand in correspondent bank stock. Equity investments without readily determinable fair values are carried at cost, less impairment, and adjustments are made to the carrying balance based on observable price changes. There were no impairments or observable price changes for these investments during year ended
December 31, 2018
.
Deposits
Deposits are our primary source of funds for loans and investments. We offer a wide variety of deposit account products to commercial and consumer customers. Total deposits increased to
$12.16 billion
at
December 31, 2018
from
$10.85 billion
at
December 31, 2017
.
The increase in deposits during
2018
was primarily due to an increase in time deposits partially offset by a decline in money market and NOW accounts. At
December 31, 2018
, we had $1.57 billion in brokered time deposits, money market, and interest checking accounts and $300.0 million in California State Treasurer deposits compared to $797.1 million in brokered deposits and $300.0 million in California State Treasurer deposits at
December 31, 2017
. The brokered deposits represented approximately 12.9% of our total deposits as of
December 31, 2018
compared to 7.3% as of
December 31, 2017
. The California State Treasurer deposits have up to three and six months maturities with a weighted average interest rate of 2.34% and 1.37% at
December 31, 2018
and
December 31, 2017
, respectively.
Although our deposits may vary with local and national economic conditions, we do not believe that our deposits are seasonal in nature. The following table sets forth the balances of our deposits by category for the periods indicated:
|
|
December 31,
|
|||||||||||||||||||
|
|
2018
|
2017
|
2016
|
|||||||||||||||||
|
|
Amount
|
Percent
|
Amount
|
Percent
|
Amount
|
Percent
|
||||||||||||||
|
|
(Dollars in thousands)
|
|||||||||||||||||||
|
Demand, noninterest bearing
|
$
|
3,022,633
|
|
25
|
%
|
$
|
2,998,734
|
|
27
|
%
|
$
|
2,900,241
|
|
27
|
%
|
|||||
|
Demand, interest bearing
|
3,036,653
|
|
25
|
%
|
3,332,703
|
|
31
|
%
|
3,401,446
|
|
32
|
%
|
||||||||
|
Savings
|
225,746
|
|
2
|
%
|
240,509
|
|
2
|
%
|
301,906
|
|
3
|
%
|
||||||||
|
Time deposit of more than $250,000
|
1,773,430
|
|
14
|
%
|
1,279,108
|
|
12
|
%
|
1,077,024
|
|
10
|
%
|
||||||||
|
Other time deposits
|
4,097,194
|
|
34
|
%
|
2,995,555
|
|
28
|
%
|
2,961,418
|
|
28
|
%
|
||||||||
|
Total Deposits
|
$
|
12,155,656
|
|
100
|
%
|
$
|
10,846,609
|
|
100
|
%
|
$
|
10,642,035
|
|
100
|
%
|
|||||
53
The following table presents the maturity schedules of our time deposits, for the years indicated:
|
|
December 31,
|
|||||||||||||||||||
|
|
2018
|
2017
|
2016
|
|||||||||||||||||
|
|
Amount
|
Percentage
|
Amount
|
Percentage
|
Amount
|
Percentage
|
||||||||||||||
|
|
(Dollars in thousands)
|
|||||||||||||||||||
|
Three months or less
|
$
|
1,626,890
|
|
28
|
%
|
$
|
857,761
|
|
20
|
%
|
$
|
1,006,581
|
|
25
|
%
|
|||||
|
Over three months through six months
|
1,165,674
|
|
20
|
%
|
1,075,202
|
|
25
|
%
|
719,986
|
|
18
|
%
|
||||||||
|
Over six months through twelve months
|
2,390,715
|
|
41
|
%
|
1,923,003
|
|
45
|
%
|
1,761,056
|
|
43
|
%
|
||||||||
|
Over twelve months
|
687,345
|
|
11
|
%
|
418,697
|
|
10
|
%
|
550,819
|
|
14
|
%
|
||||||||
|
Total time deposits
|
$
|
5,870,624
|
|
100
|
%
|
$
|
4,274,663
|
|
100
|
%
|
$
|
4,038,442
|
|
100
|
%
|
|||||
The following table indicates the maturity schedules of our time deposits in amounts of more than $250,000 as of
December 31, 2018
:
|
|
Amount
|
Percentage
|
|||||
|
(Dollars in thousands)
|
|||||||
|
Three months or less
|
$
|
571,535
|
|
32
|
%
|
||
|
Over three months through six months
|
332,352
|
|
19
|
%
|
|||
|
Over six months through twelve months
|
774,224
|
|
44
|
%
|
|||
|
Over twelve months
|
95,319
|
|
5
|
%
|
|||
|
Total
|
$
|
1,773,430
|
|
100
|
%
|
||
There can be no assurance that we will be able to continue to replace maturing time deposits at competitive rates. However, if we are unable to replace these maturing time deposits with new deposits, we believe that we have adequate liquidity resources to fund these obligations through secured credit lines with the FHLB and FRB, as well as with liquid assets.
Borrowings
We utilize a combination of short-term and long-term borrowings from the FHLB and other sources to help manage our liquidity position. However, borrowings are used as a secondary source of funds and deposits are our main source of liquidity.
Federal Funds Purchased
Federal funds purchased generally mature within one to three business days from the transaction date. We did not have any federal funds purchased at December 31, 2018. At December 31, 2017, we had $69.9 million in overnight federal funds purchased at an average weighted rate of 1.79%.
FHLB Advances
We may borrow from the FHLB on a long term basis to provide funding for certain loans or investment securities strategies, as well as for asset liability management strategies. As of
December 31, 2018
and
2017
, FHLB advances totaled $821.3 million and $1.16 billion, respectively with average remaining maturities of 1.8 years and 2.0 years, respectively. The weighted average rate, net of fair value adjustments, for FHLB advances was 1.78% at December 31,
2018
compared to 1.63% at December 31, 2017. As of
December 31, 2018
, our remaining available FHLB borrowing capacity was
$2.97 billion
. See Note 9 of the Consolidated Financial Statements for more detailed information on FHLB advances.
Convertible Debt
During the second quarter of 2018, we issued $217.5 million aggregate principal amount of 2.00% convertible senior notes maturing on May 15, 2038 in a private offering to qualified institutional investors under Rule 144A of the Securities Act of 1933. The convertible notes were issued as part of our plan to repurchase common stock. The convertible notes pay interest on a semi-annual basis to holders of the notes. The convertible notes can be called by us, in whole or in part, at any time after five years for the original issued amount in cash. Holders of the notes can put the notes for cash on the fifth, tenth, and fifteenth year of the note. The carrying balance of convertible notes at December 31, 2018 was $194.5 million net of a $23.0 million discount, which represents the conversion option discount and issuance costs to be capitalized. (See footnote 10 “Subordinated Debentures and Convertible Notes” for additional information regarding convertible notes issued)
54
Subordinated Debentures
At
December 31, 2018
, nine wholly-owned subsidiary grantor trusts (“Trusts”) had issued
$126.0 million
of pooled trust preferred securities (“Trust Preferred Securities”). The Trust Preferred Securities accrue and pay distributions periodically at specified annual rates as provided in the related indentures for the securities. The Trusts used the net proceeds from the offering of the Trust Preferred Securities to purchase a like amount of subordinated debentures (the “Debentures”) issued by us. The Debentures are the sole assets of the trusts. Our obligations under the Debentures and related documents, taken together, constitute a full and unconditional guarantee by us of the obligations of the trusts. The Trust Preferred Securities are mandatorily redeemable upon the maturity of the Debentures, or upon earlier redemption as provided in the indentures. We have the right to redeem the Debentures in whole (but not in part) on or after specific dates, at a redemption price specified in the indentures plus any accrued but unpaid interest to the redemption date.
As of
December 31, 2018
and
2017
, the Trusts are not reported on a consolidated basis pursuant to ASC 810,
Consolidation
. Therefore, the capital securities of
$126.0 million
are not presented on the consolidated statements of financial condition. Instead, the long-term subordinated debentures of
$101.9 million
as of
December 31, 2018
, issued by us to the Trusts and the investment in Trusts’ common stock of $3.9 million (included in other assets) are separately reported.
The following table summarizes our outstanding Debentures related to the Trust Preferred Securities at
December 31, 2018
:
|
Trust Name
|
Issuance Date
|
Amount
|
Carry Value of Subordinated Debentures
|
Maturity
Date
|
Coupon Rate
|
Current Rate
|
Interest Distribution
and Callable Date
|
|||||||||||
|
(Dollars in thousands)
|
||||||||||||||||||
|
Nara Capital Trust III
|
06/05/2003
|
$
|
5,000
|
|
$
|
5,155
|
|
06/15/2033
|
3 month LIBOR
+ 3.15%
|
5.94%
|
Every 15
th
of
Mar, Jun, Sep, and Dec
|
|||||||
|
Nara Statutory Trust IV
|
12/22/2003
|
5,000
|
|
5,155
|
|
01/07/2034
|
3 month LIBOR
+ 2.85%
|
5.29%
|
Every 7
th
of
Jan, Apr, Jul and Oct
|
|||||||||
|
Nara Statutory Trust V
|
12/17/2003
|
10,000
|
|
10,310
|
|
12/17/2033
|
3 month LIBOR
+ 2.95%
|
5.74%
|
Every 17
th
of
Mar, Jun, Sep and Dec
|
|||||||||
|
Nara Statutory Trust VI
|
03/22/2007
|
8,000
|
|
8,248
|
|
06/15/2037
|
3 month LIBOR
+1.65%
|
4.44%
|
Every 15
th
of
Mar, Jun, Sep and Dec
|
|||||||||
|
Center Capital Trust I
|
12/30/2003
|
18,000
|
|
14,026
|
|
01/07/2034
|
3 month LIBOR
+2.85%
|
5.29%
|
Every 7
th
of
Mar, Jun, Sep, and Dec
|
|||||||||
|
Wilshire Statutory Trust II
|
03/17/2005
|
20,000
|
|
15,526
|
|
03/17/2035
|
3 month LIBOR
+1.79%
|
4.58%
|
Every 17
th
of
Mar, Jun, Sep, and Dec
|
|||||||||
|
Wilshire Statutory Trust III
|
09/15/2005
|
15,000
|
|
10,948
|
|
09/15/2035
|
3 month LIBOR
+1.40%
|
4.19%
|
Every 15
th
of
Mar, Jun, Sep, and Dec
|
|||||||||
|
Wilshire Statutory Trust IV
|
07/10/2007
|
25,000
|
|
17,758
|
|
09/15/2037
|
3 month LIBOR
+1.38%
|
4.17%
|
Every 15
th
of
Mar, Jun, Sep, and Dec
|
|||||||||
|
Saehan Capital Trust I
|
03/30/2007
|
20,000
|
|
14,803
|
|
06/30/2037
|
3 month LIBOR
+1.62%
|
4.42%
|
Every 30
th
of
Mar, Jun, Sep, and Dec
|
|||||||||
|
Total Trust
|
$
|
126,000
|
|
$
|
101,929
|
|
||||||||||||
Capital Resources
Historically, our primary source of capital has been the retention of earnings, net of dividend payments to shareholders. We seek to maintain capital at a level sufficient to assure our stockholders, our customers, and our regulators that Hope Bancorp and the Bank subsidiary are financially sound. For this purpose, we perform ongoing assessments of our components of capital as well as projected sources and uses of capital in conjunction with projected increases in assets and levels of risk.
In conjunction with the acquisition of PIB, we assumed warrants (related to the TARP Capital Purchase Plan) to purchase shares of its common stock. At the acquisition date, the warrants were canceled and converted into a warrant to purchase BBCN Bancorp which were converted to Hope Bancorp common stock. These warrants expired on December 12, 2018, ten years subsequent to the issuance date. As of
December 31, 2018
, there were no warrants outstanding to purchase our common stock.
55
Our total stockholders’ equity decreased $25.0 million, or 1.3%, to
$1.90 billion
at
December 31, 2018
from
$1.93 billion
at
December 31, 2017
. The decline in our stockholders’ equity at
December 31, 2018
compared to
December 31, 2017
was largely due to the share repurchase transactions during the second half of 2018. On April 26, 2018 our board of directors approved a share repurchase program that authorized the use up to $100.0 million of the proceeds from the convertible notes offering to repurchase its common stock. The board of directors subsequently approved another share repurchase program on September 20, 2018 that authorized another $50.0 million in share repurchases. Altogether we repurchased $150.0 million in share during the second half of 2018 which was recorded as treasury stock reducing our overall stockholders’ equity at
December 31, 2018
compared to
December 31, 2017
. The reduction in equity from the repurchased treasury stock was offset by net income earned in 2018 totaling
$189.6 million
less dividends paid on common stock of
$71.6 million
.
At
December 31, 2018
, our ratio of common equity to total assets was 12.43% compared to 13.57% at
December 31, 2017
, and our tangible common equity represented 9.61% of tangible assets at
December 31, 2018
, compared with 10.54% of tangible assets at
December 31, 2017
. Tangible common equity per share was $11.25 at
December 31, 2018
, compared with $10.68 at
December 31, 2017
. Tangible common equity to tangible assets and tangible common equity per share are non-GAAP financial measures that we believe provides investors with information that is useful in understanding our financial performance and position. The table below shows the reconciliation of GAAP to non-GAAP financial measures for tangible common equity to tangible assets and tangible common equity per share.
|
At December 31,
|
|||||||
|
2018
|
2017
|
||||||
|
(Dollars in thousands, except share data)
|
|||||||
|
Total common stockholders’ equity
|
$
|
1,903,211
|
|
$
|
1,928,255
|
|
|
|
Less: Goodwill and core deposit intangible assets, net
|
(478,511
|
)
|
(480,973
|
)
|
|||
|
Tangible common equity
|
$
|
1,424,700
|
|
$
|
1,447,282
|
|
|
|
Total assets
|
$
|
15,305,952
|
|
$
|
14,206,717
|
|
|
|
Less: Goodwill and core deposit intangible assets, net
|
(478,511
|
)
|
(480,973
|
)
|
|||
|
Tangible assets
|
$
|
14,827,441
|
|
$
|
13,725,744
|
|
|
|
Common shares outstanding
|
126,639,912
|
|
135,511,891
|
|
|||
|
Tangible common equity ratio
(Tangible common equity / tangible assets)
|
9.61
|
%
|
10.54
|
%
|
|||
|
Common tangible equity per share
(Tangible common equity / common shares outstanding)
|
$
|
11.25
|
|
$
|
10.68
|
|
|
56
The following tables compare Hope Bancorp’s and the Bank’s actual capital ratios at
December 31, 2018
to those required by our regulatory agencies to generally be deemed “adequately capitalized” for capital adequacy classification purposes:
|
|
December 31, 2018
|
|||||||||||||||||||
|
|
Actual
|
Required
|
Excess
|
|||||||||||||||||
|
|
Amount
|
Ratio
|
Amount
|
Ratio
|
Amount
|
Ratio
|
||||||||||||||
|
(Dollars in thousands)
|
||||||||||||||||||||
|
Hope Bancorp
|
||||||||||||||||||||
|
Common equity tier 1 capital (to risk-weighted assets):
|
$
|
1,458,344
|
|
11.44
|
%
|
$
|
573,723
|
|
4.50
|
%
|
$
|
884,621
|
|
6.94
|
%
|
|||||
|
Total capital
(to risk-weighted assets)
|
$
|
1,649,664
|
|
12.94
|
%
|
$
|
1,019,952
|
|
8.00
|
%
|
$
|
629,712
|
|
4.94
|
%
|
|||||
|
Tier 1 capital
(to risk-weighted assets)
|
$
|
1,556,371
|
|
12.21
|
%
|
$
|
764,964
|
|
6.00
|
%
|
$
|
791,407
|
|
6.21
|
%
|
|||||
|
Tier 1 capital
(to average assets)
|
$
|
1,556,371
|
|
10.55
|
%
|
$
|
590,176
|
|
4.00
|
%
|
$
|
966,195
|
|
6.55
|
%
|
|||||
|
|
December 31, 2018
|
|||||||||||||||||||
|
|
Actual
|
Required
|
Excess
|
|||||||||||||||||
|
|
Amount
|
Ratio
|
Amount
|
Ratio
|
Amount
|
Ratio
|
||||||||||||||
|
(Dollars in thousands)
|
||||||||||||||||||||
|
Bank of Hope
|
||||||||||||||||||||
|
Common equity tier 1 capital (to risk-weighted assets):
|
$
|
1,737,092
|
|
13.63
|
%
|
$
|
573,699
|
|
4.50
|
%
|
$
|
1,163,393
|
|
9.13
|
%
|
|||||
|
Total capital
(to risk-weighted assets)
|
$
|
1,830,385
|
|
14.36
|
%
|
$
|
1,019,910
|
|
8.00
|
%
|
$
|
810,475
|
|
6.36
|
%
|
|||||
|
Tier 1 capital
(to risk-weighted assets)
|
$
|
1,737,092
|
|
13.63
|
%
|
$
|
764,932
|
|
6.00
|
%
|
$
|
972,160
|
|
7.63
|
%
|
|||||
|
Tier 1 capital
(to average assets)
|
$
|
1,737,092
|
|
11.76
|
%
|
$
|
590,639
|
|
4.00
|
%
|
$
|
1,146,453
|
|
7.76
|
%
|
|||||
New capital rules require a capital conservation buffer of 2.50% above the three minimum risked-weighted capital ratios. In January 2016, the capital conservation buffer started to phase in at 0.625% and increases at annual increments of 0.625% until fully-phased in January 2019. At January 1, 2016, the capital conservation buffer stood at 0.625% and increased to 1.25% at January 1, 2017, and increased again to 1.875% on January 1, 2018, and will be fully phased-in on January 1, 2019 at 2.50%. Our capital ratios at December 31, 2018 and December 31, 2017 exceeded all of the regulatory minimums including the fully-phased in capital conservation buffer.
Liquidity Management
Liquidity risk is the risk of reduction in our earnings or capital that would result if we were not able to meet our obligations when they come due without incurring unacceptable losses. Liquidity risk includes the risk of unplanned decreases or changes in funding sources and changes in market conditions that affect our ability to liquidate assets quickly and with minimum loss of value. Factors considered in liquidity risk management are the stability of the deposit base; the marketability, maturity, and pledging of our investments; the availability of alternative sources of funds; and our demand for credit.
The objective of our liquidity management is to have funds available to meet cash flow requirements arising from fluctuations in deposit levels and the demands of daily operations, which include funding of securities purchases, providing for customers’ credit needs, and ongoing repayment of borrowings.
We manage our liquidity actively on a daily basis and it is reviewed periodically by our management-level Asset/Liability Management Committee (“ALM”) and the Board Asset Liability Committee (“ALCO”). This process is intended to ensure the maintenance of sufficient funds to meet our liquidity needs, including adequate cash flow for off-balance-sheet commitments. In general, our liquidity is managed daily by controlling the level of federal funds and the funds provided by cash flow from operations. To meet unexpected demands, lines of credit are maintained with the FHLB, the Federal Reserve Bank, and other correspondent banks. The sale of investment securities and loans held for sale also serves as a source of funds.
57
Our primary sources of liquidity are derived from financing activities, which include customer and broker deposits, federal funds facilities, and borrowings from the FHLB and the FRB Discount Window. These funding sources are augmented by payments of principal and interest on loans, proceeds from sale of loans, pay down of investment securities, and the liquidation or sale of securities from our available for sale portfolio. Primary uses of funds include withdrawal of and interest payments on deposits, originations of loans, purchases of investment securities, payment of operating expenses, and payment of dividends.
Net cash inflows from operating activities totaled
$219.9 million
,
$203.9 million
, and
$130.6 million
during
2018
,
2017
and
2016
, respectively. Net cash inflows from operating activities for
2018
were primarily attributable to proceeds from sales of loans held for sale and net income partially offset by originations of held for sale loans.
Net cash outflows from investing activities totaled
$1.15 billion
,
$767.3 million
, and
$463.4 million
during
2018
,
2017
and
2016
, respectively. Net cash outflows for investing activities during
2018
were primarily from purchases of securities available for sale and the net change in loans receivable. These outflows were offset by proceeds received for securities available for sale that were paid down during the year.
Net cash inflows from financing activities totaled
$895.1 million
,
$618.1 million
, and
$471.7 million
during
2018
,
2017
and
2016
, respectively. Net cash inflows from financing activities for
2018
was primarily attributable to an increase in deposits and proceeds from our convertible notes offering (net of issuance fees) offset by the repayment of FHLB advances, treasury stock repurchases, and dividends paid on common stock.
When we have more funds than required for our reserve requirements or short-term liquidity needs, we sell federal funds to other financial institutions. Conversely, when we have less funds than required, we may purchase federal funds, borrow funds from the FHLB or the FRB’s Discount Window. As of
December 31, 2018
, the maximum amount that we were able to borrow on an overnight basis from the FHLB and the FRB was an aggregate of $3.81 billion, and we had
$821.3 million
in borrowings from the FHLB (including $1.3 million in premiums from acquired advances) and no borrowings outstanding from the FRB. The FHLB System functions as a line of credit facility for qualifying financial institutions. As a member, we are required to own capital stock in the FHLB and may apply for advances from the FHLB by pledging qualifying loans and certain securities as collateral for these advances.
At times we maintain a portion of our liquid assets in interest bearing cash deposits with other banks, overnight federal funds sold to other banks, and in investment securities available for sale that are not pledged. Our liquid assets consist of cash and cash equivalents, interest bearing cash deposits with other banks, liquid investment securities available for sale, and loan repayments within 30 days. Liquid assets totaled $1.83 billion and $1.73 billion at December 31, 2018 and 2017, respectively. Cash and cash equivalents totaled
$459.6 million
at
December 31, 2018
compared to
$492.0 million
at
December 31, 2017
.
Because our primary sources and uses of funds are deposits and loans, the relationship between gross loans and total deposits provides one measure of our liquidity. Typically, the closer the ratio of loans to deposits is to, or the more it exceeds 100%, the more we rely on borrowings and other sources to provide liquidity. Alternative sources of funds such as FHLB advances, brokered deposits, and other collateralized borrowings that provide liquidity as needed from diverse liability sources are an important part of our asset/liability management strategy. For
2018
, our average gross loans to average deposits ratio was 99%, unchanged from
2017
and
2016
.
We believe our liquidity sources to be stable and adequate to meet our day-to-day cash flow requirements. At
December 31, 2018
, management was not aware of any demands, commitments, trends, events, or uncertainties that will or are reasonably likely to have a material or adverse effect on our liquidity position. As of
December 31, 2018
, we are not aware of any material commitments for capital expenditures in the foreseeable future.
Off-Balance- Sheet Activities and Contractual Obligations
The Bank routinely engages in activities that involve, to varying degrees, elements of risk that are not reflected, in whole or in part, in the Consolidated Financial Statements. These activities are part of our normal course of business and include traditional off-balance-sheet credit-related financial instruments, interest rate swap contracts, operating leases, and interest commitments on our liabilities.
Traditional off-balance-sheet credit-related financial instruments are primarily commitments to extend credit and standby letters of credit. These activities may require us to make cash payments to third parties in the event specified future events occur. The contractual amounts represent the extent of our exposure in these off-balance-sheet activities. However, since certain off-balance-sheet commitments, particularly standby letters of credit, are expected to expire or be only partially used, the total amount of commitments does not necessarily represent future cash requirements. These activities are necessary to meet the financing needs of our customers.
58
We do not anticipate that our current off-balance-sheet activities will have a material impact on our future results of operations or financial condition. Further information regarding risks from our off-balance-sheet financial instruments can be found in Note 14 of the Notes to Consolidated Financial Statements and in Item 7A. - “Quantitative and Qualitative Disclosures about Market Risk.”
We also commit to fund certain affordable housing partnership investments in the future. Funded commitments are presented as investments in affordable housing partnerships in the Consolidated Financial Statements while unfunded commitments are presented as commitments to fund investment in affordable housing partnerships.
We lease our banking facilities and equipment under non-cancelable operating leases, which have remaining terms of up to 15 years. Our facility lease obligations are discussed in Note 14 of the Notes to Consolidated Financial Statements.
The following table summarizes our contractual obligations and commitments to make future payments as of
December 31, 2018
. Payments shown for time deposits, FHLB advances, convertible notes, and subordinated debenture include interest obligation to their respective repricing dates:
|
|
Payments Due By Period
|
||||||||||||||||||
|
|
Less than 1 year
|
1-3 years
|
3-5 years
|
Over 5 years
|
Total
|
||||||||||||||
|
|
(Dollars in thousands)
|
||||||||||||||||||
|
Contractual Obligations and Commitments
|
|||||||||||||||||||
|
Time deposits
|
$
|
5,256,722
|
|
$
|
674,188
|
|
$
|
21,656
|
|
$
|
146
|
|
$
|
5,952,712
|
|
||||
|
FHLB advances
|
358,880
|
|
342,249
|
|
147,812
|
|
—
|
|
848,941
|
|
|||||||||
|
Convertible notes
|
4,350
|
|
8,700
|
|
223,518
|
|
—
|
|
236,568
|
|
|||||||||
|
Subordinated debentures *
|
1,239
|
|
—
|
|
—
|
|
101,929
|
|
103,168
|
|
|||||||||
|
Operating lease obligations
|
14,968
|
|
25,098
|
|
13,752
|
|
19,338
|
|
73,156
|
|
|||||||||
|
Commitments to fund investments in affordable housing partnerships
|
31,743
|
|
11,468
|
|
1,062
|
|
2,234
|
|
46,507
|
|
|||||||||
|
Unused credit extensions
|
1,293,047
|
|
349,060
|
|
45,817
|
|
24,108
|
|
1,712,032
|
|
|||||||||
|
Standby letters of credit
|
66,342
|
|
3,421
|
|
—
|
|
—
|
|
69,763
|
|
|||||||||
|
Other commercial letters of credit
|
65,376
|
|
446
|
|
—
|
|
—
|
|
65,822
|
|
|||||||||
|
Total
|
$
|
7,092,667
|
|
$
|
1,414,630
|
|
$
|
453,617
|
|
$
|
147,755
|
|
$
|
9,108,669
|
|
||||
* Interest for variable rate subordinated debentures were calculated using interest rates at December 31, 2018.
59
|
Item 7A.
|
QUANTITATIVE AND QUALITATIVE DISCLOSURES ABOUT MARKET RISK
|
The objective of our asset and liability management activities is to improve our earnings by adjusting the type and mix of assets and liabilities to effectively address changing conditions and risks. Through overall management of our balance sheet and by controlling various risks, we seek to optimize our financial returns within safe and sound parameters. Our operating strategies for attaining this objective include managing our net interest margin through appropriate risk/return pricing of assets and liabilities and emphasizing growth in retail deposits, as a percentage of interest bearing liabilities, to reduce our cost of funds. We also seek to improve earnings by controlling noninterest expense and enhancing noninterest income. We use risk management instruments to modify interest rate characteristics of certain assets and liabilities to hedge against our exposure to interest rate fluctuations, reducing the effects these fluctuations might have on associated cash flows or values. We also perform periodic internal analyses to measure, evaluate and monitor market risk.
Interest Rate Risk
Market risk is the risk of loss to future earnings, to the fair value of our assets and liabilities, or to future cash flows that may result from changes in the price of a financial instrument. Interest rate risk is the most significant market risk impacting us. Interest rate risk occurs when interest rate sensitive assets and liabilities do not reprice simultaneously or at the same rate of interest or in equal volume. A key objective of our asset and liability management is to manage interest rate risk associated with changing asset and liability cash flows, values of our assets and liabilities, and market interest rate movements. The management of our interest rate risk is governed by policies reviewed and approved annually by the Board of Directors of the Bank. The Board delegates responsibility for interest rate risk management to the ALM, which is composed of the Bank’s senior executives and other designated officers.
The fundamental objective of our ALM is to manage our exposure to interest rate fluctuations while maintaining adequate levels of liquidity and capital. The ALM meets regularly to monitor the interest rate risk, the sensitivity of our assets and liabilities to interest rate changes, the book and fair values of assets and liabilities, our investment activities, and directs changes in the composition of our interest earning assets and interest bearing liabilities. The ALM reports at least quarterly to the ALCO. Our strategy has been to reduce the sensitivity of our earnings to interest rate fluctuations by more closely matching the effective maturities or repricing characteristics of our assets and liabilities. Certain assets and liabilities, however, may react in different degrees to changes in market interest rates. Further, interest rates on certain types of assets and liabilities may fluctuate prior to changes in market interest rates, while interest rates on other types may lag behind. We consider the anticipated effects of these factors when implementing our interest rate risk management objectives.
Derivative Activity
As part of our asset and liability management strategy, we may enter into derivative financial instruments, such as interest rate swaps, caps, floors, interest rate lock commitments, and forward sales commitments, with the overall goal of minimizing the impact of interest rate fluctuations on our net interest margin. Interest rate swaps and caps involve the exchange of fixed-rate and variable-rate interest payment obligations without the exchange of the underlying notional amounts.
Our monitoring activities related to managing interest rate risk include both interest rate sensitivity “gap” analysis and the use of a simulation model. While traditional gap analysis provides a simple picture of the interest rate risk embedded in the statement of financial condition, it provides only a static view of interest rate sensitivity at a specific point in time and does not measure the potential volatility in forecasted results relating to changes in market interest rates over time. Accordingly, we combine the use of gap analysis with the use of a simulation model, which provides a dynamic assessment of interest rate sensitivity.
The interest rate sensitivity gap is defined as the difference between the amount of interest earning assets anticipated to reprice within a specific time period and the amount of interest bearing liabilities anticipated to reprice within that same time period. A gap is considered positive when the amount of interest rate sensitive assets repricing within a specific time period exceeds the amount of interest bearing liabilities repricing within that same time period. A positive cumulative gap suggests that earnings will increase when interest rates rise and decrease when interest rates fall. A negative cumulative gap suggests that earnings will increase when interest rates fall and decrease when interest rates rise.
60
The following table illustrates our combined asset and liability contractual repricing as of
December 31, 2018
:
|
0 - 3 Months
|
Over 3 Months to
1 Year
|
Over 1 Year
to 5 Years
|
Over 5
Years
|
Total
|
||||||||||||||||
|
|
(Dollars in thousands)
|
|||||||||||||||||||
|
Rate Sensitive Assets
|
||||||||||||||||||||
|
Interest-bearing cash in other banks
|
$
|
240,240
|
|
$
|
—
|
|
$
|
—
|
|
$
|
—
|
|
$
|
240,240
|
|
|||||
|
Interest-bearing deposits in other
financial institutions
|
3,428
|
|
25,981
|
|
—
|
|
—
|
|
29,409
|
|
||||||||||
|
Securities available for sale
|
3,826
|
|
2,509
|
|
21,313
|
|
1,818,617
|
|
1,846,265
|
|
||||||||||
|
Equity investments
|
49,835
|
|
—
|
|
—
|
|
—
|
|
49,835
|
|
||||||||||
|
Loans outstanding
(1)
|
4,796,552
|
|
699,344
|
|
5,790,778
|
|
836,360
|
|
12,123,034
|
|
||||||||||
|
FHLB stock
|
25,461
|
|
—
|
|
—
|
|
—
|
|
25,461
|
|
||||||||||
|
Total rate sensitive assets
|
$
|
5,119,342
|
|
$
|
727,834
|
|
$
|
5,812,091
|
|
$
|
2,654,977
|
|
$
|
14,314,244
|
|
|||||
|
Rate Sensitive Liabilities
|
||||||||||||||||||||
|
Money market and NOW
|
3,036,653
|
|
—
|
|
—
|
|
—
|
|
3,036,653
|
|
||||||||||
|
Savings deposits
|
138,940
|
|
34,417
|
|
52,386
|
|
3
|
|
225,746
|
|
||||||||||
|
Time deposits
|
1,626,890
|
|
3,556,389
|
|
687,201
|
|
144
|
|
5,870,624
|
|
||||||||||
|
FHLB advances
|
25,000
|
|
321,280
|
|
475,000
|
|
—
|
|
821,280
|
|
||||||||||
|
Convertible notes
|
—
|
|
—
|
|
194,543
|
|
—
|
|
194,543
|
|
||||||||||
|
Subordinated Debentures
|
101,929
|
|
—
|
|
—
|
|
—
|
|
101,929
|
|
||||||||||
|
Total rate sensitive liabilities
|
$
|
4,929,412
|
|
$
|
3,912,086
|
|
$
|
1,409,130
|
|
$
|
147
|
|
$
|
10,250,775
|
|
|||||
|
Net Gap Position
|
$
|
189,930
|
|
$
|
(3,184,252
|
)
|
$
|
4,402,961
|
|
$
|
2,654,830
|
|
||||||||
|
Cumulative Gap Position
|
$
|
189,930
|
|
$
|
(2,994,322
|
)
|
$
|
1,408,639
|
|
$
|
4,063,469
|
|
||||||||
___________________
|
(1)
|
Includes nonaccrual loans of loans of $53.3 million and held for sale of $25.1 million.
|
The simulation model discussed above provides our ALM with the ability to simulate our net interest income. In order to measure, at
December 31, 2018
, the sensitivity of our forecasted net interest income to changing interest rates, both rising and falling interest rate scenarios were projected and compared to base market interest rate forecasts. One application of our simulation model measures the impact of market interest rate changes on the net present value of estimated cash flows from our assets and liabilities, defined as our market value of equity. This analysis assesses the changes in market values of interest rate sensitive financial instruments that would occur in response to an instantaneous and sustained increase in market interest rates.
Our net interest income and market value of equity exposure related to these hypothetical changes in market interest rates are illustrated in the following table:
|
|
December 31, 2018
|
December 31, 2017
|
|||||||||
|
Simulated Rate Changes
|
Estimated Net
Interest Income
Sensitivity
|
Market Value
of Equity
Volatility
|
Estimated Net
Interest Income
Sensitivity
|
Market Value
of Equity
Volatility
|
|||||||
|
+ 200 basis points
|
4.50
|
%
|
|
(4.30
|
)%
|
2.18
|
%
|
(4.42
|
)%
|
||
|
+ 100 basis points
|
2.18
|
%
|
|
(2.12
|
)%
|
1.12
|
%
|
(2.08
|
)%
|
||
|
- 100 basis points
|
(3.24
|
)%
|
|
1.14
|
%
|
(2.22
|
)%
|
1.00
|
%
|
||
|
- 200 basis points
|
(7.17
|
)%
|
|
0.92
|
%
|
(8.56
|
)%
|
0.60
|
%
|
||
The estimated sensitivity does not necessarily represent our forecast of future results and the estimated results may not be indicative of actual changes to our net interest income. These estimates are based upon a number of assumptions including: the nature and timing of interest rate levels including yield curve shape, prepayment on loans and securities, pricing strategies on loans and deposits, and replacement of asset and liability cash flows. While the assumptions used are based on current economic and local market conditions, there is no assurance as to the predictive nature of these conditions including how customer preferences or competitor influences may change. The ALCO, which oversees our interest rate risk management, has established the exposure limits for acceptable changes in net interest income and market value of equity related to these hypothetical changes in market interest rates. Given the limitations of the analysis, management believes that these hypothetical changes are considered tolerable and manageable as of
December 31, 2018
.
61
|
Item 8.
|
FINANCIAL STATEMENTS AND SUPPLEMENTARY DATA
|
The following Consolidated Financial Statements of Hope Bancorp, together with the reports thereon of Crowe LLP and BDO USA, LLP begin on page F-1 of this Report and are incorporated herein by reference:
Consolidated Statements of Comprehensive Income for the Years Ended December 31, 2018, 2017 and 2016
See
“Item 15. Exhibits and Financial Statement Schedules”
for exhibits filed as a part of this Report.
The supplementary data required by this Item (selected quarterly financial data) is provided in Note 23 “Quarterly Financial Data (unaudited)” in the Notes to the Consolidated Financial Statements.
|
Item 9.
|
CHANGES IN AND DISAGREEMENTS WITH ACCOUNTANTS ON ACCOUNTING AND FINANCIAL DISCLOSURE
|
None.
62
|
Item 9A.
|
CONTROLS AND PROCEDURES
|
|
a.
|
Evaluation of Disclosure Controls and Procedures
|
Disclosure controls and procedures are controls and procedures designed to ensure that information required to be disclosed by us in reports filed or submitted under the Exchange Act is recorded, processed, summarized and reported within the time periods specified in the rules and forms of the SEC, and that such information is accumulated and communicated to our management, including our President and Chief Executive Officer and our Chief Financial Officer, as appropriate, to allow timely decisions regarding required disclosure.
In designing and evaluating disclosure controls and procedures, our management recognizes that any controls and procedures, no matter how well designed and operated, can provide only reasonable assurance of achieving the desired control objectives, and our management is required to apply its judgment in evaluating the cost-benefit relationship of possible controls and procedures.
We conducted an evaluation under the supervision and with the participation of our management, including our President and Chief Executive Officer and our Chief Financial Officer, of the effectiveness of the design and operation of our disclosure controls and procedures (as defined in Rule 13a-15(e) under the Exchange Act) as of
December 31, 2018
. Based upon that evaluation, our President and Chief Executive Officer and our Chief Financial Officer determined that our disclosure controls and procedures were effective as of
December 31, 2018
.
b. Management’s Annual Report on Internal Control Over Financial Reporting
The management of the Company is responsible for establishing and maintaining adequate internal control over financial reporting for the Company as defined in Rule 13a-15(f) under the Exchange Act. This system, which our management has chosen to base on the framework set forth in the 2013 Internal Control-Integrated Framework, published by the Committee of Sponsoring Organizations of the Treadway Commission (“COSO”), is supervised by our President and Chief Executive Officer and Chief Financial Officer, and is effected by the Company’s board of directors, management and other personnel, is designed to provide reasonable assurance regarding the reliability of financial reporting and the preparation of financial statements for external purposes in accordance with accounting principles generally accepted in the United States of America.
The Company’s internal control over financial reporting includes those policies and procedures that (1) pertain to the maintenance of records that, in reasonable detail, accurately and fairly reflect the transactions and dispositions of the assets of the Company; (2) provide reasonable assurance that transactions are recorded as necessary to permit preparation of financial statements in accordance with generally accepted accounting principles, and that receipts and expenditures of the Company are being made only in accordance with authorizations of management and the directors of the Company; and (3) provide reasonable assurance regarding prevention or timely detection of unauthorized acquisition, use, or disposition of the Company’s assets that could have a material effect on the financial statements.
Because of its inherent limitations, a system of internal control over financial reporting can provide only reasonable assurance and may not prevent or detect misstatements. Further, because of changes in conditions, effectiveness of internal controls over financial reporting may vary over time.
With the participation of our President and Chief Executive Officer and our Chief Financial Officer, and under the direction of our audit committee, our management has conducted an assessment of the effectiveness of the Company’s system of internal control over financial reporting as of
December 31, 2018
using the criteria set forth by COSO. Based on this assessment, our management believes that the Company’s system of internal control over financial reporting was effective as of
December 31, 2018
.
Our independent registered public accounting firm has issued an attestation report on our internal control over financial reporting which is included below in this section.
c. Changes in Internal Control Over Financial Reporting
Management has determined that there were no changes in our internal control over financial reporting (as defined in Rule 13a-15(f) of the Exchange Act) during the quarter ended
December 31, 2018
that materially affected, or are reasonably likely to materially affect, our internal control over financial reporting.
63
Report of Independent Registered Public Accounting Firm
Our independent registered public accounting firm has issued an audit report on our internal control over financial reporting which is included on page F-1 of this report.
64
|
Item 9B.
|
OTHER INFORMATION
|
None.
65
PART III
|
Item 10.
|
DIRECTORS, EXECUTIVE OFFICERS AND CORPORATE GOVERNANCE
|
The information required by this Item with respect to the Company’s directors and executive officers, Section 16(a) beneficial ownership reporting compliance, the Company’s Code of Ethics and Business Conduct, director nomination procedures, the Audit Committee and the audit committee financial expert will be filed in Hope Bancorp’s definitive Proxy Statement for its
2019
Annual Meeting of Stockholders (the “2019 Proxy Statement”), which will be filed with the SEC not later than 120 days after December 31, 2018.
|
Item 11.
|
EXECUTIVE COMPENSATION
|
The information required by this Item with respect to director and executive compensation, “Compensation Committee Interlocks and Insider Participation” and “Compensation Committee Report” will be filed in Hope Bancorp’s 2019 Proxy Statement which will be filed with the SEC not later than 120 days after December 31, 2018.
|
Item 12.
|
SECURITY OWNERSHIP OF CERTAIN BENEFICIAL OWNERS AND MANAGEMENT AND RELATED STOCKHOLDER MATTERS.
|
The information required by this Item with respect to security ownership of certain beneficial owners and management will be filed in Hope Bancorp’s 2019 Proxy Statement which will be filed with the SEC not later than 120 days after December 31, 2018.
The following table summarizes our equity compensation plans as of December 31, 2018:
Securities Authorized for Issuance Under Equity Compensation Plans
|
Plan Category
|
Number of securities to be issued upon exercise
of outstanding options,
warrants and rights
(a)
|
Weighted average
exercise price of
outstanding options,
warrants and rights
(b)
|
Number of securities
remaining available for
future issuance under
equity compensation
plans excluding
securities reflected in
Column (a)
(c)
|
||||||
|
Equity compensation plans approved by security holders
|
982,631
|
|
$
|
15.41
|
|
1,111,396
|
|
||
|
Equity compensation plans not approved by security holders
|
—
|
|
—
|
|
—
|
|
|||
|
Total
|
982,631
|
|
$
|
15.41
|
|
1,111,396
|
|
||
|
Item 13.
|
CERTAIN RELATIONSHIPS AND RELATED TRANSACTIONS, AND DIRECTOR INDEPENDENCE
|
The information required by this Item with respect to certain relationships and related transactions and director independence will be filed in Hope Bancorp’s 2019 Proxy Statement which will be filed with the SEC not later than 120 days after December 31, 2018.
|
Item 14.
|
PRINCIPAL ACCOUNTANT FEES AND SERVICES
|
The information required by this Item with respect to principal accountant fees and services will be filed in Hope Bancorp’s 2019 Proxy Statement which will be filed with the SEC not later than 120 days after December 31, 2018.
66
PART IV
|
Item 15.
|
EXHIBITS AND FINANCIAL STATEMENT SCHEDULES
|
(a)(1) Financial Statements
: The financial statements listed under Part II-Item 8. “Financial Statements and Supplementary Data” are filed as part of this Annual Report on Form 10-K.
(a)(2) Financial Statement Schedules
: All financial statement schedules have been omitted since the required information is either not applicable or not required, or has been included in the Financial Statements and related notes.
(a)(3) List of Exhibits
|
Number
|
Description
|
|
67
|
Number
|
Description
|
|
68
|
Number
|
Description
|
|
|
101.INS
|
XBRL Instance Document*
|
|
|
101.SCH
|
XBRL Taxonomy Extension Schema Document*
|
|
|
101.CAL
|
XBRL Taxonomy Extension Calculation Linkbase Document*
|
|
|
101.DEF
|
XBRL Taxonomy Extension Definition Linkbase Document*
|
|
|
101.LAB
|
XBRL Taxonomy Extension Label Linkbase Document*
|
|
|
101.PRE
|
XBRL Taxonomy Extension Presentation Linkbase Document*
|
|
________________
* Management contract or compensatory plan or arrangement
Item 16. FORM 10-K SUMMARY
None
69
SIGNATURES
Pursuant to the requirements of Section 13 or 15(d) of the Securities Exchange Act of 1934, the registrant has duly caused this report to be signed on its behalf by the undersigned, thereunto duly authorized.
Date:
March 1, 2019
|
HOPE BANCORP, INC.
|
|
|
By:
|
/s/ KEVIN S. KIM
|
|
Kevin S. Kim
|
|
|
President and Chief Executive Officer
|
|
70
Pursuant to the requirements of the Securities Exchange Act of 1934, this report has been signed below by the following persons on behalf of the registrant in the capacities and on the dates indicated.
|
Signature/Name
|
Title
|
Date
|
|||
|
By:
|
/s/ KEVIN S. KIM
|
|
President and Chief Executive Officer
|
March 1, 2019
|
|
|
Kevin S. Kim
|
|
(Principal Executive Officer)
|
|||
|
By:
|
/s/ ALEX KO
|
|
Executive Vice President & Chief Financial Officer
|
March 1, 2019
|
|
|
Alex Ko
|
|
(Principal Financial and Accounting Officer)
|
|||
|
By:
|
/s/ SCOTT YOON-SUK WHANG
|
Chairman
|
March 1, 2019
|
||
|
Scott Yoon-Suk Whang
|
|||||
|
By:
|
/s/ STEVEN S. KOH
|
|
Director
|
March 1, 2019
|
|
|
Steven S. Koh
|
|
||||
|
By:
|
/s/ DONALD D. BYUN
|
Director
|
March 1, 2019
|
||
|
Donald D. Byun
|
|||||
|
By:
|
/s/ STEVEN J. DIDION
|
|
Director
|
March 1, 2019
|
|
|
Steven J. Didion
|
|
||||
|
By:
|
/s/ JINHO DOO
|
Director
|
March 1, 2019
|
||
|
Jinho Doo
|
|||||
|
By:
|
/s/ DAISY HA
|
Director
|
March 1, 2019
|
||
|
Daisy Ha
|
|||||
|
By:
|
/s/ JIN CHUL JHUNG
|
Director
|
March 1, 2019
|
||
|
Jin Chul Jhung
|
|||||
|
By:
|
/s/ CHUNG HYUN LEE
|
Director
|
March 1, 2019
|
||
|
Chung Hyun Lee
|
|||||
|
By:
|
/s/ WILLIAM J. LEWIS
|
Director
|
March 1, 2019
|
||
|
William J. Lewis
|
|||||
|
By:
|
/s/ DAVID P. MALONE
|
Director
|
March 1, 2019
|
||
|
David P. Malone
|
|||||
|
By:
|
/s/ JOHN R. TAYLOR
|
Director
|
March 1, 2019
|
||
|
John R. Taylor
|
|||||
|
By:
|
/s/ DALE S. ZUEHLS
|
Director
|
March 1, 2019
|
||
|
Dale S. Zuehls
|
|||||
71
Report of Independent Registered Public Accounting Firm
Stockholders and the Board of Directors of Hope Bancorp, Inc.
Los Angeles, California
Opinions on the Financial Statements and Internal Control over Financial Reporting
We have audited the accompanying consolidated statements of financial condition of Hope Bancorp, Inc. and subsidiaries (the "Company") as of December 31, 2018 and 2017, the related consolidated statements of income, comprehensive income, changes in stockholders’ equity, and cash flows for the years then ended, and the related notes (collectively referred to as the "financial statements"). We also have audited the Company’s internal control over financial reporting as of December 31, 2018, based on criteria established in Internal Control - Integrated Framework: (2013) issued by the Committee of Sponsoring Organizations of the Treadway Commission (COSO).
In our opinion, the financial statements referred to above present fairly, in all material respects, the financial position of the Company as of December 31, 2018 and 2017, and the results of its operations and its cash flows for the years then ended in conformity with accounting principles generally accepted in the United States of America. Also in our opinion, the Company maintained, in all material respects, effective internal control over financial reporting as of December 31, 2018, based on criteria established in Internal Control - Integrated Framework: (2013) issued by COSO.
Basis for Opinions
The Company’s management is responsible for these financial statements, for maintaining effective internal control over financial reporting, and for its assessment of the effectiveness of internal control over financial reporting, included in the accompanying Management’s Annual Report on Internal Control over Financial Reporting. Our responsibility is to express an opinion on the Company’s financial statements and an opinion on the Company’s internal control over financial reporting based on our audits. We are a public accounting firm registered with the Public Company Accounting Oversight Board (United States) ("PCAOB") and are required to be independent with respect to the Company in accordance with the U.S. federal securities laws and the applicable rules and regulations of the Securities and Exchange Commission and the PCAOB.
We conducted our audits in accordance with the standards of the PCAOB. Those standards require that we plan and perform the audits to obtain reasonable assurance about whether the financial statements are free of material misstatement, whether due to error or fraud, and whether effective internal control over financial reporting was maintained in all material respects.
Our audits of the financial statements included performing procedures to assess the risks of material misstatement of the financial statements, whether due to error or fraud, and performing procedures that respond to those risks. Such procedures included examining, on a test basis, evidence regarding the amounts and disclosures in the financial statements. Our audits also included evaluating the accounting principles used and significant estimates made by management, as well as evaluating the overall presentation of the financial statements. Our audit of internal control over financial reporting included obtaining an understanding of internal control over financial reporting, assessing the risk that a material weakness exists, and testing and evaluating the design and operating effectiveness of internal control based on the assessed risk. Our audits also included performing such other procedures as we considered necessary in the circumstances. We believe that our audits provide a reasonable basis for our opinions.
Definition and Limitations of Internal Control Over Financial Reporting
A company’s internal control over financial reporting is a process designed to provide reasonable assurance regarding the reliability of financial reporting and the preparation of financial statements for external purposes in accordance with generally accepted accounting principles. A company’s internal control over financial reporting includes those policies and procedures that (1) pertain to the maintenance of records that, in reasonable detail, accurately and fairly reflect the transactions and dispositions of the assets of the company; (2) provide reasonable assurance that transactions are recorded as necessary to permit preparation of financial statements in accordance with generally accepted accounting principles, and that receipts and expenditures of the company are being made only in accordance with authorizations of management and directors of the company; and (3) provide reasonable assurance regarding prevention or timely detection of unauthorized acquisition, use, or disposition of the company’s assets that could have a material effect on the financial statements.
Because of its inherent limitations, internal control over financial reporting may not prevent or detect misstatements. Also, projections of any evaluation of effectiveness to future periods are subject to the risk that controls may become inadequate because of changes in conditions, or that the degree of compliance with the policies or procedures may deteriorate.
|
/s/ Crowe LLP
|
|
Crowe LLP
|
We have served as the Company's auditor since 2017.
Los Angeles, California
March 1, 2019
F-1
Report of Independent Registered Public Accounting Firm
Board of Directors and Stockholders Hope
Hope Bancorp, Inc.
Los Angeles, California
We have audited the accompanying consolidated statements of income, comprehensive income, stockholders’ equity, and cash flows of Hope Bancorp, Inc. and subsidiaries for the year ended December 31, 2016. These financial statements are the responsibility of the Company’s management. Our responsibility is to express an opinion on these financial statements based on our audits.
We conducted our audit in accordance with the standards of the Public Company Accounting Oversight Board (United States). Those standards require that we plan and perform the audit to obtain reasonable assurance about whether the financial statements are free of material misstatement. An audit includes examining, on a test basis, evidence supporting the amounts and disclosures in the financial statements, assessing the accounting principles used and significant estimates made by management, as well as evaluating the overall financial statement presentation. We believe that our audit provides a reasonable basis for our opinion.
In our opinion, the consolidated financial statements referred to above present fairly, in all material respects, the results of the operations and the cash flows of Hope Bancorp, Inc. and subsidiaries for the year ended December 31, 2016, in conformity with accounting principles generally accepted in the United States of America.
/s/ BDO USA, LLP
Los Angeles, California
May 17, 2017
F-2
HOPE BANCORP, INC. AND SUBSIDIARIES
CONSOLIDATED STATEMENTS OF FINANCIAL CONDITION
DECEMBER 31, 2018
AND
2017
|
December 31,
|
|||||||
|
|
2018
|
2017
|
|||||
|
(Dollars in thousands, except share data)
|
|||||||
|
ASSETS
|
|||||||
|
Cash and cash equivalents:
|
|||||||
|
Cash and due from banks
|
$
|
219,366
|
|
$
|
185,527
|
|
|
|
Interest-bearing cash in other banks
|
240,240
|
|
306,473
|
|
|||
|
Total cash and cash equivalents
|
459,606
|
|
492,000
|
|
|||
|
Interest-bearing deposits in other financial institutions and other investments
|
29,409
|
|
53,366
|
|
|||
|
Securities available for sale, at fair value
|
1,846,265
|
|
1,720,257
|
|
|||
|
Equity investments
|
49,835
|
|
—
|
|
|||
|
Loans held for sale, at the lower of cost or fair value
|
25,128
|
|
29,661
|
|
|||
|
Loans receivable, net of allowance for loan losses of $92,557 and $84,541
at December 31, 2018 and December 31, 2017, respectively
|
12,005,558
|
|
11,018,034
|
|
|||
|
Other real estate owned (“OREO”), net
|
7,754
|
|
10,787
|
|
|||
|
Federal Home Loan Bank (“FHLB”) stock, at cost
|
25,461
|
|
29,776
|
|
|||
|
Premises and equipment, net
|
53,794
|
|
56,714
|
|
|||
|
Accrued interest receivable
|
32,225
|
|
29,979
|
|
|||
|
Deferred tax assets, net
|
50,913
|
|
55,203
|
|
|||
|
Customers’ liabilities on acceptances
|
2,281
|
|
1,691
|
|
|||
|
Bank owned life insurance (“BOLI”)
|
75,219
|
|
74,915
|
|
|||
|
Investments in affordable housing partnerships
|
92,040
|
|
81,009
|
|
|||
|
Goodwill
|
464,450
|
|
464,450
|
|
|||
|
Core deposit intangible assets, net
|
14,061
|
|
16,523
|
|
|||
|
Servicing assets, net
|
23,132
|
|
24,710
|
|
|||
|
Other assets
|
48,821
|
|
47,642
|
|
|||
|
Total assets
|
$
|
15,305,952
|
|
$
|
14,206,717
|
|
|
See accompanying notes to consolidated financial statements.
F-3
|
HOPE BANCORP, INC. AND SUBSIDIARIES
CONSOLIDATED STATEMENTS OF FINANCIAL CONDITION (continued)
DECEMBER 31, 2018 AND 2017
|
|||||||
|
December 31,
|
|||||||
|
|
2018
|
2017
|
|||||
|
(Dollars in thousands, except share data)
|
|||||||
|
LIABILITIES AND STOCKHOLDERS’ EQUITY
|
|||||||
|
LIABILITIES:
|
|||||||
|
Deposits:
|
|||||||
|
Noninterest bearing
|
$
|
3,022,633
|
|
$
|
2,998,734
|
|
|
|
Interest bearing:
|
|||||||
|
Money market and NOW accounts
|
3,036,653
|
|
3,332,703
|
|
|||
|
Savings deposits
|
225,746
|
|
240,509
|
|
|||
|
Time deposits
|
5,870,624
|
|
4,274,663
|
|
|||
|
Total deposits
|
12,155,656
|
|
10,846,609
|
|
|||
|
FHLB advances
|
821,280
|
|
1,157,693
|
|
|||
|
Federal funds purchased
|
—
|
|
69,900
|
|
|||
|
Convertible notes, net
|
194,543
|
|
—
|
|
|||
|
Subordinated debentures
|
101,929
|
|
100,853
|
|
|||
|
Accrued interest payable
|
31,374
|
|
15,961
|
|
|||
|
Acceptances outstanding
|
2,281
|
|
1,691
|
|
|||
|
Commitments to fund investments in affordable housing partnerships
|
46,507
|
|
38,467
|
|
|||
|
Other liabilities
|
49,171
|
|
47,288
|
|
|||
|
Total liabilities
|
13,402,741
|
|
12,278,462
|
|
|||
|
STOCKHOLDERS’ EQUITY:
|
|||||||
|
Common stock, $0.001 par value; authorized 150,000,000 shares at December 31, 2018 and December 31, 2017; issued and outstanding 135,642,365 and 126,639,912 shares, respectively at December 31, 2018, and issued and outstanding 135,511,891 shares at December 31, 2017
|
136
|
|
136
|
|
|||
|
Additional paid-in capital
|
1,423,405
|
|
1,405,014
|
|
|||
|
Retained earnings
|
662,375
|
|
544,886
|
|
|||
|
Treasury stock, at cost; 9,002,453 and 0 shares at December 31, 2018
and December 31, 2017, respectively
|
(150,000
|
)
|
—
|
|
|||
|
Accumulated other comprehensive loss, net
|
(32,705
|
)
|
(21,781
|
)
|
|||
|
Total stockholders’ equity
|
1,903,211
|
|
1,928,255
|
|
|||
|
Total liabilities and stockholders’ equity
|
$
|
15,305,952
|
|
$
|
14,206,717
|
|
|
See accompanying notes to consolidated financial statements.
F-4
|
HOPE BANCORP, INC. AND SUBSIDIARIES
CONSOLIDATED STATEMENTS OF INCOME
YEARS ENDED DECEMBER 31, 2018, 2017, AND 2016
|
|||||||||||
|
Year Ended December 31,
|
|||||||||||
|
|
2018
|
2017
|
2016
|
||||||||
|
(Dollars in thousands, except per share data)
|
|||||||||||
|
INTEREST INCOME:
|
|||||||||||
|
Interest and fees on loans
|
$
|
594,103
|
|
$
|
529,760
|
|
$
|
392,127
|
|
||
|
Interest on securities
|
45,342
|
|
36,917
|
|
25,442
|
|
|||||
|
Interest on federal funds sold and other investments
|
10,727
|
|
5,427
|
|
4,365
|
|
|||||
|
Total interest income
|
650,172
|
|
572,104
|
|
421,934
|
|
|||||
|
INTEREST EXPENSE:
|
|||||||||||
|
Interest on deposits
|
134,958
|
|
74,902
|
|
48,091
|
|
|||||
|
Interest on FHLB advances and federal funds purchased
|
15,127
|
|
10,706
|
|
7,560
|
|
|||||
|
Interest on other borrowings and convertible notes
|
12,160
|
|
5,116
|
|
2,928
|
|
|||||
|
Total interest expense
|
162,245
|
|
90,724
|
|
58,579
|
|
|||||
|
NET INTEREST INCOME BEFORE PROVISION FOR LOAN LOSSES
|
487,927
|
|
481,380
|
|
363,355
|
|
|||||
|
PROVISION FOR LOAN LOSSES
|
14,900
|
|
17,360
|
|
9,000
|
|
|||||
|
NET INTEREST INCOME AFTER PROVISION FOR LOAN LOSSES
|
473,027
|
|
464,020
|
|
354,355
|
|
|||||
|
NONINTEREST INCOME:
|
|||||||||||
|
Service fees on deposit accounts
|
18,551
|
|
20,619
|
|
15,964
|
|
|||||
|
International service fees
|
4,371
|
|
4,494
|
|
3,693
|
|
|||||
|
Loan servicing fees, net
|
4,696
|
|
5,433
|
|
3,519
|
|
|||||
|
Wire transfer fees
|
4,934
|
|
5,057
|
|
4,326
|
|
|||||
|
Net gains on sales of SBA loans
|
9,708
|
|
12,774
|
|
8,750
|
|
|||||
|
Net gains on sales of other loans
|
2,485
|
|
2,927
|
|
2,920
|
|
|||||
|
Net gains on sales or called securities available for sale
|
—
|
|
301
|
|
950
|
|
|||||
|
Other income and fees
|
15,435
|
|
14,810
|
|
11,697
|
|
|||||
|
Total noninterest income
|
60,180
|
|
66,415
|
|
51,819
|
|
|||||
|
NONINTEREST EXPENSE:
|
|||||||||||
|
Salaries and employee benefits
|
153,523
|
|
144,669
|
|
107,944
|
|
|||||
|
Occupancy
|
30,371
|
|
28,587
|
|
24,574
|
|
|||||
|
Furniture and equipment
|
14,902
|
|
14,643
|
|
11,726
|
|
|||||
|
Advertising and marketing
|
9,414
|
|
10,281
|
|
7,320
|
|
|||||
|
Data processing and communication
|
14,232
|
|
12,179
|
|
11,403
|
|
|||||
|
Professional fees
|
16,286
|
|
14,954
|
|
6,556
|
|
|||||
|
Investments in affordable housing partnerships expenses
|
12,066
|
|
13,862
|
|
4,100
|
|
|||||
|
FDIC assessments
|
6,572
|
|
5,173
|
|
4,165
|
|
|||||
|
Credit related expenses
|
2,863
|
|
582
|
|
|
2,954
|
|
||||
|
OREO expense, net
|
187
|
|
3,100
|
|
2,492
|
|
|||||
|
Branch restructuring costs
|
1,674
|
|
—
|
|
—
|
|
|||||
|
Merger and integration expense
|
(7
|
)
|
1,781
|
|
16,914
|
|
|||||
|
Other
|
15,643
|
|
16,790
|
|
14,827
|
|
|||||
|
Total noninterest expense
|
277,726
|
|
266,601
|
|
214,975
|
|
|||||
|
INCOME BEFORE INCOME TAX PROVISION
|
255,481
|
|
263,834
|
|
191,199
|
|
|||||
|
INCOME TAX PROVISION
|
65,892
|
|
124,389
|
|
77,452
|
|
|||||
|
NET INCOME
|
$
|
189,589
|
|
$
|
139,445
|
|
$
|
113,747
|
|
||
|
EARNINGS PER COMMON SHARE:
|
|||||||||||
|
Basic
|
$
|
1.44
|
|
$
|
1.03
|
|
$
|
1.10
|
|
||
|
Diluted
|
$
|
1.44
|
|
$
|
1.03
|
|
$
|
1.10
|
|
||
See accompanying notes to consolidated financial statements.
F-5
|
HOPE BANCORP, INC. AND SUBSIDIARIES
CONSOLIDATED STATEMENTS OF COMPREHENSIVE INCOME
YEARS ENDED DECEMBER 31, 2018, 2017, AND 2016
|
|||||||||||
|
For Year Ended December 31,
|
|||||||||||
|
|
2018
|
2017
|
2016
|
||||||||
|
|
(Dollars in thousands)
|
||||||||||
|
Net income
|
$
|
189,589
|
|
$
|
139,445
|
|
$
|
113,747
|
|
||
|
Other comprehensive loss:
|
|||||||||||
|
Change in unrealized net holding losses on securities
|
(16,201
|
)
|
(5,796
|
)
|
(21,273
|
)
|
|||||
|
Reclassification adjustments for gains realized in net income
|
—
|
|
(301
|
)
|
(950
|
)
|
|||||
|
Tax effect
|
4,996
|
|
2,570
|
|
9,398
|
|
|||||
|
Other comprehensive loss, net of tax
|
(11,205
|
)
|
(3,527
|
)
|
(12,825
|
)
|
|||||
|
Total comprehensive income
|
$
|
178,384
|
|
$
|
135,918
|
|
$
|
100,922
|
|
||
See accompanying notes to consolidated financial statements.
F-6
|
HOPE BANCORP, INC. AND SUBSIDIARIES
CONSOLIDATED STATEMENTS OF CHANGES IN STOCKHOLDERS’ EQUITY
YEARS ENDED DECEMBER 31, 2018, 2017, AND 2016
|
|||||||||||||||||||||||||||
|
|
Common stock
|
Additional paid-in capital
|
Retained
earnings
|
Treasury stock
|
Accumulated other comprehensive
loss, net
|
Total stockholders’ equity
|
|||||||||||||||||||||
|
|
Shares
|
Amount
|
|||||||||||||||||||||||||
|
|
(Dollars in thousands, except share data)
|
||||||||||||||||||||||||||
|
BALANCE, JANUARY 1, 2016
|
79,566,356
|
|
$
|
80
|
|
$
|
541,596
|
|
$
|
398,251
|
|
$
|
—
|
|
$
|
(1,832
|
)
|
$
|
938,095
|
|
|||||||
|
Issuance of shares pursuant to various stock plans
|
179,997
|
|
|
|
1,171
|
|
1,171
|
|
|||||||||||||||||||
|
Tax effects of stock plans
|
79
|
|
79
|
|
|||||||||||||||||||||||
|
Stock-based compensation
|
1,391
|
|
1,391
|
|
|||||||||||||||||||||||
|
Issuance of Hope stock options in exchange for Wilshire stock options
|
|
3,370
|
|
3,370
|
|
||||||||||||||||||||||
|
Issuance of share in exchange of
Wilshire common stock
|
55,493,726
|
|
55
|
|
852,883
|
|
852,938
|
|
|||||||||||||||||||
|
Cash dividends declared on common stock ($0.45 per share)
|
(42,493
|
)
|
(42,493
|
)
|
|||||||||||||||||||||||
|
Comprehensive income:
|
|
|
|||||||||||||||||||||||||
|
Net income
|
113,747
|
|
113,747
|
|
|||||||||||||||||||||||
|
Other comprehensive loss
|
(12,825
|
)
|
(12,825
|
)
|
|||||||||||||||||||||||
|
BALANCE, DECEMBER 31, 2016
|
135,240,079
|
|
$
|
135
|
|
$
|
1,400,490
|
|
$
|
469,505
|
|
$
|
—
|
|
$
|
(14,657
|
)
|
$
|
1,855,473
|
|
|||||||
|
Issuance of shares pursuant to various stock plans
|
271,812
|
|
1
|
|
1,864
|
|
1,865
|
|
|||||||||||||||||||
|
Stock-based compensation
|
2,660
|
|
2,660
|
|
|||||||||||||||||||||||
|
Cash dividends declared on common stock ($0.50 per share)
|
(67,661
|
)
|
(67,661
|
)
|
|||||||||||||||||||||||
|
Reclassification of stranded tax effects to retained earnings -
ASU 2018-02
|
3,597
|
|
(3,597
|
)
|
—
|
|
|||||||||||||||||||||
|
Comprehensive income:
|
|||||||||||||||||||||||||||
|
Net income
|
139,445
|
|
139,445
|
|
|||||||||||||||||||||||
|
Other comprehensive loss
|
|
(3,527
|
)
|
(3,527
|
)
|
||||||||||||||||||||||
|
BALANCE, DECEMBER 31, 2017
|
135,511,891
|
|
$
|
136
|
|
$
|
1,405,014
|
|
$
|
544,886
|
|
$
|
—
|
|
$
|
(21,781
|
)
|
$
|
1,928,255
|
|
|||||||
|
Reclassification of unrealized losses on equity investments to retained earnings - ASU 2016-01
|
(469
|
)
|
281
|
|
(188
|
)
|
|||||||||||||||||||||
|
Issuance of shares pursuant to various stock plans
|
130,474
|
|
|
469
|
|
469
|
|
||||||||||||||||||||
|
Stock-based compensation
|
2,877
|
|
2,877
|
|
|||||||||||||||||||||||
|
Cash dividends declared on common stock ($0.54 per share)
|
(71,631
|
)
|
(71,631
|
)
|
|||||||||||||||||||||||
|
Comprehensive income:
|
|||||||||||||||||||||||||||
|
Net income
|
189,589
|
|
189,589
|
|
|||||||||||||||||||||||
|
Other comprehensive loss
|
(11,205
|
)
|
(11,205
|
)
|
|||||||||||||||||||||||
|
Repurchase of treasury stock
|
(9,002,453
|
)
|
(150,000
|
)
|
(150,000
|
)
|
|||||||||||||||||||||
|
Equity component of convertible
notes, net of taxes
|
15,045
|
|
15,045
|
|
|||||||||||||||||||||||
|
BALANCE, DECEMBER 31, 2018
|
126,639,912
|
|
$
|
136
|
|
$
|
1,423,405
|
|
$
|
662,375
|
|
$
|
(150,000
|
)
|
$
|
(32,705
|
)
|
$
|
1,903,211
|
|
|||||||
See accompanying notes to consolidated financial statements.
F-7
|
HOPE BANCORP, INC. AND SUBSIDIARIES
CONSOLIDATED STATEMENTS OF CASH FLOWS
YEARS ENDED DECEMBER 31, 2018, 2017, AND 2016
|
|||||||||||
|
Year ended December 31,
|
|||||||||||
|
|
2018
|
2017
|
2016
|
||||||||
|
|
(Dollars in thousands, except share data)
|
||||||||||
|
CASH FLOWS FROM OPERATING ACTIVITIES (net of acquisition)
|
|||||||||||
|
Net income
|
$
|
189,589
|
|
$
|
139,445
|
|
$
|
113,747
|
|
||
|
Adjustments to reconcile net income to net cash from operating activities:
|
|||||||||||
|
Discount accretion, net amortization and depreciation
|
(2,128
|
)
|
(14,903
|
)
|
(1,569
|
)
|
|||||
|
Stock-based compensation expense
|
3,659
|
|
3,161
|
|
2,967
|
|
|||||
|
Provision for loan losses
|
14,900
|
|
17,360
|
|
9,000
|
|
|||||
|
(Credit) provision for unfunded loan commitments
|
(100
|
)
|
(2,358
|
)
|
179
|
|
|||||
|
Valuation adjustment of premises held for sale
|
—
|
|
1,084
|
|
—
|
|
|||||
|
Valuation adjustment of OREO
|
415
|
|
2,041
|
|
2,228
|
|
|||||
|
Impairment of investments in affordable housing partnership
|
—
|
|
4,846
|
|
—
|
|
|||||
|
Net gains on sales of SBA and other loans
|
(12,193
|
)
|
(15,701
|
)
|
(11,670
|
)
|
|||||
|
Earnings on BOLI
|
(304
|
)
|
(1,219
|
)
|
(1,438
|
)
|
|||||
|
Net change in fair value of derivatives
|
21
|
|
78
|
|
443
|
|
|||||
|
Net (gains) losses on sale and disposal of premises and equipment
|
50
|
|
(868
|
)
|
176
|
|
|||||
|
Net (gains) losses on sales of OREO
|
(408
|
)
|
(79
|
)
|
16
|
|
|||||
|
Net gains on sales or called securities available for sale
|
—
|
|
(301
|
)
|
(950
|
)
|
|||||
|
Net change in fair value of equity investments with readily determinable fair value
|
(1,449
|
)
|
—
|
|
—
|
|
|||||
|
Losses on investments in affordable housing partnership
|
11,728
|
|
10,266
|
|
4,100
|
|
|||||
|
Net change in deferred income taxes
|
2,742
|
|
34,740
|
|
5,750
|
|
|||||
|
Proceeds from sales of loans held for sale
|
266,115
|
|
310,345
|
|
239,203
|
|
|||||
|
Originations of loans held for sale
|
(255,545
|
)
|
(276,537
|
)
|
(219,779
|
)
|
|||||
|
Origination of servicing assets
|
(6,157
|
)
|
(5,492
|
)
|
(4,472
|
)
|
|||||
|
Change in accrued interest receivable
|
(2,246
|
)
|
(3,099
|
)
|
(2,459
|
)
|
|||||
|
Change in other assets
|
(6,138
|
)
|
(1,987
|
)
|
16,418
|
|
|||||
|
Change in accrued interest payable
|
15,413
|
|
5,098
|
|
2,247
|
|
|||||
|
Change in other liabilities
|
1,983
|
|
(1,999
|
)
|
(23,532
|
)
|
|||||
|
Net cash provided by operating activities
|
219,947
|
|
203,921
|
|
130,605
|
|
|||||
|
CASH FLOWS FROM INVESTING ACTIVITIES (net of acquisition)
|
|||||||||||
|
Net cash received from acquisition - Wilshire Bancorp, Inc.
|
—
|
|
—
|
|
100,127
|
|
|||||
|
Purchase of interest bearing deposits in other financial institutions and other investments
|
(10,533
|
)
|
(30,477
|
)
|
(2,962
|
)
|
|||||
|
Redemption of interest bearing deposits in other financial institutions and other investments
|
16,495
|
|
21,313
|
|
13,465
|
|
|||||
|
Purchase of securities available for sale
|
(393,584
|
)
|
(572,528
|
)
|
(553,336
|
)
|
|||||
|
Proceeds from matured, called, or paid-down securities available for sale
|
221,595
|
|
264,730
|
|
238,605
|
|
|||||
|
Proceeds from sales of securities available for sale
|
—
|
|
128,791
|
|
217,079
|
|
|||||
|
Purchase of equity investments
|
(1,434
|
)
|
—
|
|
—
|
|
|||||
|
Proceeds from sales of other loans
|
21,716
|
|
417
|
|
634
|
|
|||||
|
Net change in loans receivable
|
(983,720
|
)
|
(564,536
|
)
|
(487,961
|
)
|
|||||
|
Proceeds from sales of OREO
|
6,667
|
|
14,802
|
|
17,390
|
|
|||||
|
Purchase of FHLB stock
|
—
|
|
(8,573
|
)
|
(97
|
)
|
|||||
|
Redemption of FHLB stock
|
4,315
|
|
761
|
|
13,636
|
|
|||||
|
Purchase of premises and equipment
|
(6,846
|
)
|
(14,777
|
)
|
(14,320
|
)
|
|||||
|
Proceeds from sales and disposals of premises and equipment
|
45
|
|
5,084
|
|
—
|
|
|||||
|
Investments in affordable housing partnerships
|
(22,181
|
)
|
(12,342
|
)
|
(5,616
|
)
|
|||||
|
Net cash used in investing activities
|
(1,147,465
|
)
|
(767,335
|
)
|
(463,356
|
)
|
|||||
|
CASH FLOWS FROM FINANCING ACTIVITIES
|
|||||||||||
|
Net change in deposits
|
1,309,048
|
|
209,477
|
|
494,549
|
|
|||||
|
Proceeds from FHLB advances
|
130,000
|
|
1,420,000
|
|
825,000
|
|
|||||
|
Repayment of FHLB advances and prepayment fees
|
(465,000
|
)
|
(1,015,000
|
)
|
(806,610
|
)
|
|||||
|
Proceeds from federal funds purchased
|
—
|
|
69,900
|
|
—
|
|
|||||
|
Repayment of federal funds purchased
|
(69,900
|
)
|
—
|
|
—
|
|
|||||
|
Proceeds from convertible notes, net of issuance fees
|
212,920
|
|
—
|
|
—
|
|
|||||
|
Purchase of treasury stock
|
(150,000
|
)
|
—
|
|
—
|
|
|||||
|
Cash dividends paid on common stock
|
(71,631
|
)
|
(67,661
|
)
|
(42,493
|
)
|
|||||
|
Issuance of additional stock pursuant to various stock plans
|
469
|
|
1,865
|
|
1,171
|
|
|||||
|
Tax effects of issuance of shares from various stock plans
|
—
|
|
—
|
|
79
|
|
|||||
|
Taxes paid in net settlement of restricted stock
|
(782
|
)
|
(501
|
)
|
—
|
|
|||||
|
Net cash provided by financing activities
|
895,124
|
|
618,080
|
|
471,696
|
|
|||||
|
NET CHANGE IN CASH AND CASH EQUIVALENTS
|
(32,394
|
)
|
54,666
|
|
138,945
|
|
|||||
|
CASH AND CASH EQUIVALENTS, BEGINNING OF PERIOD
|
492,000
|
|
437,334
|
|
298,389
|
|
|||||
|
CASH AND CASH EQUIVALENTS, END OF PERIOD
|
$
|
459,606
|
|
$
|
492,000
|
|
$
|
437,334
|
|
||
|
SUPPLEMENTAL DISCLOSURES OF CASH FLOW INFORMATION
|
|||||||||||
|
Interest paid
|
$
|
144,128
|
|
$
|
91,081
|
|
$
|
62,624
|
|
||
|
Income taxes paid
|
$
|
57,862
|
|
$
|
104,158
|
|
$
|
65,726
|
|
||
|
SUPPLEMENTAL DISCLOSURES OF NON-CASH ACTIVITIES
|
|||||||||||
|
Transfer of investments available for sale and other investments to equity investments
|
$
|
46,952
|
|
$
|
—
|
|
$
|
—
|
|
||
|
Transfer from loans receivable to OREO
|
$
|
3,340
|
|
$
|
7,173
|
|
$
|
5,646
|
|
||
|
Loans transferred to held for sale from loans receivable
|
$
|
21,581
|
|
$
|
429
|
|
$
|
11,885
|
|
||
|
Loans transferred to loans receivable from held for sale
|
$
|
10,073
|
|
$
|
4,100
|
|
$
|
9,163
|
|
||
|
Transfer from premises and equipment to premises held for sale
|
$
|
—
|
|
$
|
3,300
|
|
$
|
—
|
|
||
|
Loans to facilitate sale of premises
|
$
|
—
|
|
$
|
1,350
|
|
$
|
—
|
|
||
|
Loans to facilitate sale of OREO
|
$
|
—
|
|
$
|
2,300
|
|
$
|
—
|
|
||
|
New commitments to fund affordable housing partnership investments
|
$
|
30,097
|
|
$
|
26,400
|
|
$
|
1,327
|
|
||
|
Equity component of convertible notes, net of tax
|
$
|
15,045
|
|
$
|
—
|
|
$
|
—
|
|
||
|
Assets acquired from Wilshire
|
$
|
—
|
|
$
|
—
|
|
$
|
4,627,604
|
|
||
|
Liabilities assumed from Wilshire
|
$
|
—
|
|
$
|
—
|
|
$
|
4,130,342
|
|
||
|
Common stock issued in consideration for Wilshire (in shares)
|
—
|
|
—
|
|
55,493,726
|
|
|||||
See accompanying notes to consolidated financial statements.
F-8
HOPE BANCORP, INC. AND SUBSIDIARIES
NOTES TO CONSOLIDATED FINANCIAL STATEMENTS
YEARS ENDED DECEMBER 31, 2018, 2017, AND 2016
|
1.
|
SUMMARY OF SIGNIFICANT ACCOUNTING POLICIES
|
Nature of Operations—
Hope Bancorp, Inc. (“Hope Bancorp” on a parent-only basis and the “Company” on a consolidated basis, previously known as BBCN Bancorp, Inc.), headquartered in Los Angeles, California, is the holding company for Bank of Hope (the “Bank,” previously known as BBCN Bank). The Bank has branches in California, Washington, Texas, Illinois, Alabama, Georgia, Virginia, New Jersey, and New York, as well as loan production offices in Atlanta, Dallas, Denver, Portland, Seattle, Southern California, and Northern California. Hope Bancorp is a corporation organized under the laws of the state of Delaware and a bank holding company registered under the Bank Holding Company Act of 1956, as amended. The Bank is a California-chartered bank and its deposits are insured by the FDIC to the extent provided by law. The Company specializes in core business banking products for small and medium-sized businesses, with an emphasis in commercial real estate and business lending, SBA lending, and international trade financing.
Principles of Consolidation—
The accounting and reporting policies of the Company are in accordance with accounting principles generally accepted in the United States of America and conform to practices within the banking industry. The consolidated financial statements include the accounts of the Company and its wholly-owned subsidiaries, principally the Bank. Intercompany transactions and balances are eliminated in consolidation.
Cash Flows
—Cash and cash equivalents include cash and due from banks, interest-earning deposits, and federal funds sold, which have original maturities less than 90 days. The Company may be required to maintain reserve and clearing balances with the Federal Reserve Bank under the Federal Reserve Act. The reserve and clearing requirement balance was
$0
at
December 31, 2018
and
2017
. Net cash flows are reported for customer loan and deposit transactions, federal funds purchased, deferred income taxes, and other assets and liabilities.
Interest-Bearing Deposits in Other Financial Institutions and Other Investments
—Interest-bearing deposits in other financial institutions and other investments are comprised of the Company’s investments in certificates of deposits that have original maturities greater than 90 days. Other investments previously were comprised of the Company’s investment in funds to partially satisfy the Company’s requirements under the Community Reinvestment Act. These investments were reclassified as equity investments per ASU 2016-01 on January 1, 2018.
Securities—
Securities are classified and accounted for as follows:
|
(i)
|
Securities that the Company has the positive intent and ability to hold to maturity are classified as “held to maturity” and reported at amortized cost. At
December 31, 2018
and
2017
, the Company did not own securities in this category;
|
|
(ii)
|
Securities are classified as “available for sale” when they might be sold before maturity and are reported at fair value. Unrealized holding gains and losses are reported as a separate component of stockholders’ equity in accumulated other comprehensive income (loss), net of taxes.
|
Accreted discounts and amortized premiums on securities are included in interest income using the interest method, and realized gains or losses related to sales of securities recorded on trade date and are calculated using the specific identification method, without anticipating prepayments, except for mortgage-backed securities where prepayments are expected.
Management evaluates securities for other than temporary impairment (“OTTI”) at least on a quarterly basis and more frequently when economic conditions warrant such evaluation. For securities in an unrealized loss position, management considers the extent and duration of the unrealized loss and the financial condition and near-term prospects of the issuer. Management also assesses whether it intends to sell, or it is more likely than not that it will be required to sell, a security in an unrealized loss position before recovery of its amortized cost basis. If either of the criteria regarding intent or requirement to sell is met, the entire difference between amortized cost and fair value is recognized as impairment through earnings. For debt securities that do not meet the aforementioned criteria, the amount of impairment is split into two components as follows: 1) OTTI related to credit loss, which must be recognized in the income statement and 2) OTTI related to other factors, which is recognized in other comprehensive income. The credit loss is defined as the difference between the present value of the cash flows expected to be collected and the amortized cost basis.
F-9
HOPE BANCORP, INC. AND SUBSIDIARIES
NOTES TO CONSOLIDATED FINANCIAL STATEMENTS (Continued)
Equity Investments
—On January 1, 2018, the Company adopted ASU 2016-01 and reclassified its mutual funds, equity stock, correspondent bank stock, Community Development Financial Institutions Fund (“CDFI”) investments, and Community Reinvestment Act (“CRA”) investments as equity investments. The Company’s mutual funds and equity stock are considered equity investments with readily determinable fair values and changes to fair value are recorded in other noninterest income. The Company’s investment in correspondent bank stock, CDFI investments, and CRA investments are equity investments without readily determinable fair values. Equity investments without readily determinable fair values are measured at cost, less impairment, and are adjusted for observable price changes which is recorded in noninterest income. As a result of the adoption of ASU 2016-01, the Company reclassified
$469 thousand
in net unrealized losses included in other comprehensive income and deferred tax assets to retained earnings.
Derivative Financial Instruments and Hedging Transactions
—As part of the Company’s asset and liability management strategy, the Company may enter into derivative financial instruments, such as interest rate swaps, and caps and floors, with the overall goal of minimizing the impact of interest rate fluctuations on net interest margin. The Company’s interest rate swaps and caps involve the exchange of fixed rate and variable rate interest payment obligations without the exchange of the underlying notional amounts and are therefore accounted for as stand-alone derivatives. Changes in the fair value of the stand-alone derivatives are reported in earnings as noninterest income. Residential mortgage loans funded with interest rate lock commitments and forward commitments for the future delivery of mortgage loans to third party investors, are both considered derivatives. The Company accounts for loan commitments related to the origination of mortgage loans that will be held-for-sale as derivatives at fair value on the balance sheet, with changes in fair value recorded in earnings. As part of the Company’s overall risk management, the Company’s Asset Liability Committee, which meets monthly, monitors and measures interest rate risk and the sensitivity of assets and liabilities to interest rate changes, including the impact of derivative transactions.
Loans Held for Sale
—Residential mortgage loans that the Company has the intent to sell prior to maturity have been designated as held for sale at origination and are recorded at the lower of cost or fair value, on an aggregate basis. A valuation allowance is established if the aggregate fair value of such loans is lower than their cost and charged to earnings. Gains or losses recognized upon the sale of loans are determined on a specific identification basis. Loan transfers are accounted for as sales when control over the loan has been surrendered. Control over such loans is deemed to be surrendered when (1) the assets have been isolated from the Company, (2) the transferee obtains the right (free of conditions that constrain it from taking advantage of that right) to pledge or exchange the transferred assets and (3) the Company does not maintain control over the transferred assets through an agreement to repurchase them before their maturity.
Loans—
Loans that management has the intent and ability to hold for the foreseeable future or until maturity or payoff are reported at the principal balance outstanding, net of any purchase discounts, unearned interest, deferred loan fees and costs, and an allowance for loan losses. Interest income is accrued on the unpaid principal balance. Nonrefundable loan origination fees and certain direct origination costs are deferred and recognized in interest income using the level-yield method over the life of the loan. Interest on loans is credited to income as earned and is accrued only if deemed collectible.
Generally, loans are placed on nonaccrual status and the accrual of interest is discontinued if principal or interest payments become 90 days past due and/or management deems the collectibility of the principal and/or interest to be in question. Loans to a customer whose financial condition has deteriorated are considered for nonaccrual status whether or not the loan is 90 days or more past due. Generally, payments received on nonaccrual loans are recorded as principal reductions. Loans are returned to accrual status when all the principal and interest amounts contractually due are brought current and future payments are reasonably assured.
Other loan fees and charges, representing service costs for the prepayment of loans, for delinquent payments or for miscellaneous loan services, are recorded as income when collected.
Loans are categorized into risk categories based on relevant information about the ability of borrowers to service their debt, including, but not limited to, current financial information, historical payment experience, credit documentation, public information, and current economic trends. The Company analyzes loans individually by classifying the loans as to credit risk. This analysis includes all loans with the exception of homogeneous loans, or loans that are evaluated together in pools of similar loans (i.e., home mortgage loans, home equity lines of credit, overdraft loans, express business loans, and automobile loans). This analysis is performed at least on a quarterly basis. Homogeneous loans are not risk rated and credit risk is analyzed largely by the number of days past due. The Company uses the following definitions for risk ratings:
|
•
|
Pass: Loans that meet a preponderance or more of the Company’s underwriting criteria and evidence an acceptable level of risk.
|
|
•
|
Special Mention: Loans classified as special mention have a potential weakness that deserves management’s close attention. If left uncorrected, these potential weaknesses may result in deterioration of the repayment prospects for the loan or of the institution’s credit position at some future date.
|
F-10
HOPE BANCORP, INC. AND SUBSIDIARIES
NOTES TO CONSOLIDATED FINANCIAL STATEMENTS (Continued)
|
•
|
Substandard: Loans classified as substandard are inadequately protected by the current net worth and paying capacity of the borrower or by the collateral pledged, if any. Loans in this classification have a well-defined weakness or weaknesses that jeopardize the repayment of the debt. They are characterized by the distinct possibility that the institution will sustain some loss if the deficiencies are not corrected.
|
|
•
|
Doubtful/Loss: Loans classified as doubtful have all the weaknesses inherent in those classified as substandard, with the added characteristic that the weaknesses make collection or repayment in full, on the basis of currently existing facts, conditions, and values, highly questionable and improbable.
|
Allowance for Loan Losses
—The allowance for loan losses is a valuation allowance for probable incurred credit losses that are inherent in the loan portfolio. Loan losses are charged against the allowance when management believes the uncollectibility of a loan balance is confirmed. Subsequent recoveries, if any, are credited to the allowance. Management estimates the allowance balance required using past loan loss experience, the nature and volume of the portfolio, information about specific borrower situations and estimated collateral values, economic conditions, and other factors. Allocations of the allowance may be made for specific loans, but the entire allowance is available for any loan that, in management’s judgment, should be charged off.
The allowance consists of specific and general components. The specific component relates to loans that are individually classified as impaired. The general component covers non-impaired loans and is based on historical loss experience adjusted for qualitative factors.
The general component covers non-impaired loans and is based on historical loss experience adjusted for current factors. The historical loss experience is determined by portfolio segment. The Company further segregates these segments between loans accounted for under the amortized cost method (referred to as “Legacy Loans”) and acquired loans (referred to as “Acquired Loans”), as Acquired Loans were originally recorded at fair value with no carryover of the related allowance for loan losses.
The historical loss experience for Legacy Loans is based on the actual loss history experienced by the Company. The loss experience is supplemented with other economic factors based on the risks present for each portfolio segment. These economic factors include consideration of the following: levels of and trends in delinquencies and impaired loans; levels of and trends in charge-offs and recoveries; trends in volume and terms of loans; effects of any changes in risk selection and underwriting standards; other changes in lending policies, procedures, and practices; experience, ability, and depth of lending management and other relevant staff; national and local economic trends and conditions; industry conditions; and effects of changes in credit concentrations.
The following major portfolio segments have been identified: real estate loans (residential, commercial, and construction), commercial business loans, trade finance loans, and consumer/other loans. Due to the overall high level of real estate loans within the loan portfolio as a whole, as compared to other portfolio segments, for risk assessment and allowance purposes this segment was segregated into more granular pools by collateral property type.
The Company’s real estate loan portfolio is subject to certain risks, including: a decline in the economies of our primary markets, interest rate increases, a reduction in real estate values in our primary markets, increased competition in pricing and loan structure, and environmental risks, including natural disasters. Our commercial business and trade finance loan portfolio are subject to certain risks, including: a decline in the economy in our primary markets, interest rate increases, and deterioration of a borrower’s or guarantor’s financial capabilities. The Company’s consumer loan portfolio is subject to the same risk associated with the Company’s commercial business loan portfolio but also includes risk related to consumer bankruptcy laws which allow consumers to discharge certain debts.
The Company uses a loan migration analysis which is a formula methodology based on the Bank’s actual historical net charge off experience for each loan class (type) pool and risk grade. The migration analysis is centered on the Bank’s internal credit risk rating system. The Company’s internal loan review and external contracted credit review examinations are used to determine and validate loan risk grades. This credit review system takes into consideration factors such as: borrower’s background and experience; historical and current financial condition; credit history and payment performance; economic conditions and their impact on various industries; type, fair value and volatility of the fair value of collateral; lien position; and the financial strength of any guarantors.
A general loan loss allowance is provided on loans not specifically identified as impaired (“non-impaired loans”). The Bank’s general loan loss allowance has two components: quantitative and qualitative risk factors. The quantitative risk factors are based on a historical loss migration methodology. The loans are classified by class and risk grade and the historical loss migration is tracked for the various classes. Loss experience is quantified for a specified period and then weighted to place more significance to the most recent loss history. That loss experience is then applied to the stratified portfolio at each quarter end.
F-11
HOPE BANCORP, INC. AND SUBSIDIARIES
NOTES TO CONSOLIDATED FINANCIAL STATEMENTS (Continued)
Additionally, in order to systematically quantify the credit risk impact of other trends and changes within the loan portfolio, the Bank utilizes qualitative adjustments to the Migration Analysis within established parameters. The parameters for making adjustments are established under a Credit Risk Matrix that provides seven possible scenarios for each of the factors below. The matrix allows for up to three positive (major, moderate, and minor), three negative (major, moderate, and minor), and one neutral credit risk scenarios within each factor for each loan type pool. Generally, the factors are considered to have no significant impact (neutral) to the Company’s historical migration ratios. However, if information exists to warrant adjustment to the Migration Analysis, changes are made in accordance with the established parameters supported by narrative and/or statistical analysis. The Credit Risk Matrix and the nine possible scenarios enable the Bank to qualitatively adjust the Loss Migration Ratio by as much as 50 basis points in either direction (positive or negative) for each loan type pool. This matrix considers the following nine factors, which are patterned after the guidelines provided under the FFIEC Interagency Policy Statement on the Allowance for Loan and Lease Losses:
|
•
|
Changes in lending policies and procedures, including underwriting standards and collection, charge-off, and recovery practices.
|
|
•
|
Changes in national and local economic and business conditions and developments, including the condition of various market segments.
|
|
•
|
Changes in the nature and volume of the loan portfolio.
|
|
•
|
Changes in the experience, ability and depth of lending management and staff.
|
|
•
|
Changes in the trends of the volume and severity of past due loans, Classified Loans, nonaccrual loans, troubled debt restructurings and other loan modifications.
|
|
•
|
Changes in the quality of the Company’s loan review system and the degree of oversight by the Directors.
|
|
•
|
Changes in the value of underlying collateral for collateral-dependent loans.
|
|
•
|
The existence and effect of any concentrations of credit and changes in the level of such concentrations.
|
|
•
|
The effect of external factors, such as competition and legal and regulatory requirements, on the level of estimated losses in the Company’s loan portfolio.
|
The Company also establishes specific loss allowances for loans where the Company has identified potential credit risk conditions or circumstances related to a specific individual credit. The specific allowance amounts are determined by a method prescribed by ASC 310-10-35-22,
Measurement of Impairment
. The loans identified as impaired will be accounted for in accordance with one of the three acceptable valuation methods: 1) the present value of future cash flows discounted at the loan’s effective interest rate; 2) the loan’s observable market price; or 3) the fair value of the collateral, if the loan is collateral dependent. For the collateral dependent impaired loans, the Company obtains a new appraisal to determine the amount of impairment as of the date that the loan became impaired. The appraisals are based on an “as is” valuation. To ensure that appraised values remain current, the Company either obtains updated appraisals every twelve months from a qualified independent appraiser or an internal re-valuation of the collateral is performed by qualified personnel. If the fair value of the collateral, less cost to sell, is less than the recorded amount of the loan, the Company then recognizes impairment by creating or adjusting an existing valuation allowance with a corresponding charge to the provision for loan losses. If an impaired loan is expected to be collected through liquidation of the underlying collateral, the loan is deemed to be collateral dependent and the amount of impairment is charged off against the allowance for loan losses.
The Bank considers a loan to be impaired when it is probable that not all amounts due (principal and interest) will be collectible in accordance with the contractual terms of the loan agreement. Factors considered by management in determining impairment include payment status, collateral value and the probability of collecting scheduled principal and interest payments when due. Loans that experience insignificant payment delays and payment shortfalls generally are not classified as impaired. The significance of payment delays and payment shortfalls is determined on a case-by-case basis by taking into consideration all of the circumstances surrounding the loan and the borrower, including the length of the delay, the reasons for the delay, the borrower’s prior payment record and the amount of the shortfall in relation to the principal and interest owed.
For commercial business loans, real estate loans and certain consumer loans, the Company bases the measurement of loan impairment on the present value of the expected future cash flows, discounted at the loan’s effective interest rate or on the fair value of the loan’s collateral, less estimated costs to sell, if the loan is collateral dependent. The scope for evaluation of individual impairment includes all impaired loans greater than $500 thousand. The Company evaluates most loans of $500 thousand or less for impairment on a collective basis because these loans generally have smaller balances and are homogeneous in the underwriting of terms and conditions.
F-12
HOPE BANCORP, INC. AND SUBSIDIARIES
NOTES TO CONSOLIDATED FINANCIAL STATEMENTS (Continued)
Impairment losses are included in the allowance for loan losses through a charge to the provision for loan losses. Upon disposition of an impaired loan, any unpaid balance is charged off to the allowance for loan losses.
The allowance for loan losses for acquired credit impaired loans is based upon expected cash flows for these loans. To the extent that a deterioration in borrower credit quality results in a decrease in expected cash flows subsequent to the acquisition of the loans, an allowance for loan losses would be established based on management’s estimate of future credit losses over the remaining life of the loans.
Acquired Loans
—Loans that the Company acquires are recorded at fair value with no carryover of the related allowance for loan losses. On the date of acquisition, the Company considers acquired classified loans credit impaired loans (“Purchased Credit Impaired Loans” or “PCI loans”) under the provisions of Accounting Standards Codification (“ASC”) 310-30,
Loans and Debt Securities Acquired with Deteriorated Credit Quality
. On the date of acquisition, loans without credit impairment (“Acquired Performing Loans” or “Non-PCI loans”) are not accounted for under ASC 310-30. Acquired loans are placed in pools with similar risk characteristics and recorded at fair value as of the acquisition date.
For PCI loans, the cash flows expected to be received over the life of the pools were estimated by management with the assistance of a third party valuation specialist. These cash flows were utilized in calculating the carrying values of the pools and underlying loans, book yields, effective interest income and impairment, if any, based on actual and projected events. Default rates, loss severity and prepayment speed assumptions are periodically reassessed and updated within the accounting model to update the expectation of future cash flows. The excess of the cash expected to be collected over the pools’ carrying value is considered to be the accretable yield and is recognized as interest income over the estimated life of the loan or pool using the effective interest yield method. The accretable yield may change due to changes in the timing and amounts of expected cash flows. Changes in the accretable yield is disclosed quarterly.
For PCI loans, the excess of the contractual balances due over the cash flows expected to be collected is considered to be nonaccretable difference. The nonaccretable difference represents the Company’s estimate of the credit losses expected to occur and was considered in determining the fair value of the loans as of the date of acquisition. Subsequent to the date of acquisition, any increases in expected cash flows over those expected at purchase date in excess of fair value are adjusted through the accretable difference on a prospective basis. Any subsequent decreases in expected cash flows over those expected at the acquisition date are recognized by recording a provision for loan losses that will maintain the original expected yield.
PCI loans that met the criteria for nonaccrual of interest prior to the acquisition may be considered performing upon acquisition, regardless of whether the customer is contractually delinquent, if management can reasonably estimate the timing and amount of the expected cash flows on such loans and if management expects to fully collect the new carrying value of the loans. As such, management may no longer consider the loan to be nonaccrual or nonperforming and may accrue interest on these loans, including the impact of any accretable discount. Management has determined that future cash flows are reasonably estimable on any such acquired loans that are past due 90 days or more and accruing interest. Management expects to fully collect the carrying value of the loans.
OREO
—OREO, which represents real estate acquired through foreclosure in satisfaction of commercial and real estate loans, is stated at fair value less estimated selling costs of the real estate. Loan balances in excess of the fair value of the real estate acquired at the date of acquisition are charged to the allowance for loan losses. Any subsequent operating expenses or income, reduction in estimated fair values, and gains or losses on disposition of such properties are charged or credited to current operations. For the year ended December 31,
2018
, the Company foreclosed on properties with an aggregate carrying value of
$3.3 million
. The Company recorded
$115 thousand
in net valuation adjustments subsequent to the foreclosures during the year ended December 31,
2018
, and the Company sold OREO properties for total proceeds of
$6.7 million
during the year.
FHLB Stock
—The Bank is a member of the FHLB system. Members are required to own a certain amount of stock based on the level of borrowings and other factors, and may invest in additional amounts. FHLB stock is carried at cost, classified as a restricted security, and periodically evaluated for impairment based on ultimate recovery of par value. Both cash and stock dividends are reported as income.
F-13
HOPE BANCORP, INC. AND SUBSIDIARIES
NOTES TO CONSOLIDATED FINANCIAL STATEMENTS (Continued)
Premises and Equipment
—Premises and equipment are stated at cost less accumulated depreciation and amortization. Depreciation and amortization of premises and equipment are computed on the straight-line method over the following estimated useful lives:
|
Buildings
|
15
|
-
|
39
|
years
|
|
Furniture, fixture, and equipment
|
3
|
-
|
10
|
years
|
|
Computer equipment
|
1
|
-
|
5
|
years
|
|
Computer software
|
1
|
-
|
5
|
years
|
|
Leasehold improvement
|
life of lease or improvements, whichever is shorter
|
|||
Mortgage Banking Derivatives —
Mortgage banking derivatives are instruments used to hedge the risk to residential mortgage loans sales from changes in interest rates. Residential mortgage loans funded with interest rate lock commitments and forward commitments for the future delivery of mortgage loans to third party investors, are both considered derivatives. The Company accounts for loan commitments related to the origination of mortgage loans that will be held-for-sale as derivatives at fair value on the balance sheet, with changes in fair value recorded in earnings. Commitments to originate mortgage loans that will be held for investment are not accounted for as derivatives and therefore are not recorded at fair value. Subsequent changes in the fair value of a derivative loan commitments are recognized in earnings in the period in which the changes occur.
BOLI
—The Company has purchased life insurance policies on certain key executives and directors. BOLI is recorded at the amount that can be realized under the insurance contract at the balance sheet date, which is the cash surrender value adjusted for other charges or other amounts due that are probable at settlement.
Investments in Affordable Housing Partnerships
—The Company owns limited partnerships interest in projects of affordable housing for lower income tenants. Under the equity method of accounting, the annual amortization is based on the estimated tax deduction amounts the bank would receive in the year. The carrying value of such investments and commitments to fund investment in affordable housing is recorded as “Investments in affordable housing partnerships” in the Consolidated Statement of Financial Condition. Commitments to fund investments in affordable housing is also included in this line items but is also grossed up and recorded as a liability. The Company recorded an impairment on investments in affordable housing partnerships totaling
$4.8 million
for the year ended December 31, 2017 to account for the variance between the carrying value of individual investments and the future expected tax benefits. Of the
$4.8 million
impairment recorded in 2017,
$3.3 million
was recorded in noninterest expense to reflect the impairment for the year ended December 31, 2017 and
$1.6 million
was recorded in income tax provision expenses as the re-evaluation was a direct result of the Tax Act which reduced corporate tax rates from 35% to 21%. There were no impairments recorded during the year ended December 31, 2018.
Goodwill and Intangible Assets—
Goodwill is generally determined as the excess of the fair value of the consideration transferred, plus the fair value of any non-controlling interests in the acquiree, over the fair value of the net assets acquired and liabilities assumed as of the acquisition date. Goodwill and intangible assets acquired in a purchase business combination and determined to have an indefinite useful life are not amortized but tested for impairment at least annually.
In accordance with ASC 350 “
Intangibles - Goodwill and Other
”, the Company makes a qualitative assessment of whether it is more likely than not that a reporting unit’s fair value is less than its carrying amount before applying the two-step goodwill impairment test. If management concludes that it is not more likely than not that the fair value of a reporting unit is less than its carrying amount, the two-step impairment test is bypassed. Management assessed the qualitative factors related to goodwill as of December 31, 2018. Goodwill is also tested for impairment on an interim basis if circumstances change or an event occurs between annual tests that would more likely than not reduce the fair value of the reporting unit below its carrying amount. Significant judgment is applied when goodwill is assessed for impairment. This judgment includes developing cash flow projections, selecting appropriate discount rates, identifying relevant market comparables, incorporating general economic and market conditions and selecting an appropriate control premium. The selection and weighting of the various fair value techniques may result in a higher or lower fair value. Judgment is applied in determining the weighting that is most representative of fair value.
Intangible assets with definite useful lives are amortized over their estimated useful lives to their estimated residual values. Core deposit intangibles are amortized over a
seven
to
ten
year period.
F-14
HOPE BANCORP, INC. AND SUBSIDIARIES
NOTES TO CONSOLIDATED FINANCIAL STATEMENTS (Continued)
Loan Servicing Assets—
The Company typically sells the guaranteed portion of SBA loans and retains the unguaranteed portion (“retained interest”). A portion of the premium on sale of SBA loans is recognized as gain on sale of loans at the time of the sale by allocating the carrying amount between the asset sold and the retained interest, including these servicing assets, based on their relative fair values. The remaining portion of the premium is recorded as a discount on the retained interest and is amortized over the remaining life of the loan as an adjustment to yield. The retained interest, net of any discount, are included in loans receivable—net of allowance for loan losses in the accompanying consolidated statements of financial condition.
Servicing assets are recognized when SBA and residential mortgage loans are sold with servicing retained with the income statement effect recorded in gains on sales of loans. Servicing assets are initially recorded at fair value based on the present value of the contractually specified servicing fee, net of servicing costs, over the estimated life of the loan, using a discount rate. The Company’s servicing costs approximates the industry average servicing costs of 40 basis points. All classes of servicing assets are subsequently measured using the amortization method which requires servicing rights to be amortized into noninterest income in proportion to, and over the period of, the estimated future net servicing income of the underlying loans.
Management periodically evaluates servicing assets for impairment based upon the fair value of the rights as compared to carrying amount. Impairment is determined by stratifying rights into groupings based on predominant risk characteristics, such as interest rate, loan type and investor type. Impairment is recognized through a valuation allowance for an individual grouping, to the extent that fair value is less than the carrying amount. If the Company later determines that all or a portion of the impairment no longer exists for a particular grouping, a reduction of the allowance may be recorded as an increase to income. No impairment charges were required in
2018
,
2017
, or
2016
.
Stock-Based Compensation—
Compensation cost is recognized for stock options and restricted stock awards issued to employees and directors, based on the fair value of these awards at the date of grant. A Black-Scholes model is utilized to estimate the fair value of stock options, while the market price of the Company’s common stock at the date of grant is used for restricted stock awards. Compensation cost is recognized over the required service period, generally defined as the vesting period. For awards with graded vesting, compensation cost is recognized on a straight-line basis over the requisite service period for the entire award.
Income Taxes
—Income tax expense is the total of the current year income tax due or refundable and the change in deferred tax assets and liabilities. Deferred income tax assets and liabilities represent the tax effects, based on current tax law, of future deductible or taxable amounts attributable to events that have been recognized in the financial statements. In assessing the realizability of deferred tax assets, management considers whether it is more likely than not that some portion or all of the deferred tax assets will not be realized. The ultimate realization of deferred tax assets is dependent upon the generation of future taxable income during the periods in which those temporary differences become deductible. Management considers the scheduled reversal of deferred tax liabilities, the projected future taxable income and tax planning strategies in making this assessment. A valuation allowance, if needed, reduces deferred tax assets to the amount expected to be realized.
A tax position is recognized as a benefit only if it is “more likely than not” that the tax position would be sustained in a tax examination, with a tax examination being presumed to occur. The amount recognized is the largest amount of tax benefit that is greater than 50% likely of being realized on examination. For tax positions not meeting the “more likely than not” test, no tax benefit is recorded. The Company recognizes interest and / or penalties related to income tax matters in income tax expense.
Section 382 of the Internal Revenue Code imposes a limitation (“382 Limitation”) on a corporation’s ability to use any net unrealized built in losses and other tax attributes, such as net operating loss and tax credit carry-forwards, when it undergoes a 50% ownership change over a designated testing period not to exceed three years (“382 Ownership Change”). As a result of the acquisition on July 29, 2016, Wilshire Bancorp underwent a 382 Ownership Change resulting in a 382 Limitation to its net operating loss and tax credit carry-forwards. Wilshire Bancorp did not have a net unrealized built in loss as of the 382 Ownership Change date. Given the applicable 382 Limitation, the Company is expected to fully utilize Wilshire Bancorp’s net operating loss and tax credit carry-forwards before expiration. However, future transactions, such as issuances of common stock or sales of shares of the Company’s stock by certain holders of the Company’s shares, including persons who have held, currently hold or may accumulate in the future 5% or more of the Company’s outstanding common stock for their own account, could trigger a future Section 382 Ownership Change of the Company which could limit the Company’s use of these tax attributes.
Earnings per Common Share
—Basic Earnings per Common Share is computed by dividing net income (loss) available to common stockholders by the weighted-average number of common shares outstanding for the period. Diluted Earnings per Common Share reflects the potential dilution of common shares that could share in the earnings of the Company. Earnings and dividends per share are restated for all stock splits and stock dividends through the date of issuance of the financial statements.
Equity
—The Company accrues for common stock dividends as declared. Common stock dividends of
$71.6 million
and
$67.7 million
, were paid in
2018
and
2017
, respectively. There were no common stock dividends declared but unpaid at
December 31, 2018
and
2017
.
F-15
HOPE BANCORP, INC. AND SUBSIDIARIES
NOTES TO CONSOLIDATED FINANCIAL STATEMENTS (Continued)
Dividend Restrictions
—Banking regulations require maintaining certain capital levels and may limit the dividends paid by the Bank to the Company, or dividends paid by the Company to stockholders.
Comprehensive Income
—Comprehensive income consists of net income and other comprehensive income (loss). Other comprehensive income (loss) includes the change in unrealized gains and losses on securities available for sale which is also recognized as separate components of stockholders’ equity, net of tax.
Operating Segments
—The Company is managed as a single business segment. The financial performance of the Company is reviewed by the chief operating decision maker on an aggregate basis and financial and strategic decisions are made based on the Company as a whole. “Banking Operations” is considered to be the Company’s single combined operating segment, which raises funds from deposits and borrowings for loans and investments, and provides lending products, including construction, real estate, commercial, and consumer loans to its customers.
Loss Contingencies
—Loss contingencies, including claims and legal actions arising in the ordinary course of business, are recorded as liabilities when the likelihood of loss is probable and an amount or range of loss can be reasonably estimated. Management believes there are no such matters that would have a material effect on the consolidated financial statements as of December 31,
2018
or
2017
. Accrued loss contingencies for all legal claims totaled approximately
$755 thousand
at
December 31, 2018
and
$414 thousand
at December 31,
2017
.
Loan Commitments and Related Financial Instruments—
Financial instruments include off-balance sheet credit instruments, such as commitments to make loans and commercial letters of credit, issued to meet customer financing needs. The face amount for these items represents the exposure to loss, before considering customer collateral or ability to repay. Such financial instruments are recorded when they are funded. See Note 14 Commitments and Contingencies of the Notes to Consolidated Financial Statements for further discussion.
Allowance for Unfunded Commitments—
The allowance for unfunded commitments is maintained at a level believed by management to be sufficient to absorb estimated probable losses related to these unfunded credit facilities. The determination of the adequacy of the allowance is based on periodic evaluations of the unfunded credit facilities including an assessment of the probability of commitment usage, credit risk factors for loans outstanding to these same customers, and the terms and expiration dates of the unfunded credit facilities. The allowance for unfunded commitments is included in other liabilities on the consolidated statement of financial condition, with changes to the balance charged against noninterest expense.
Fair Values of Financial Instruments
—Fair values of financial instruments are estimated using relevant market information and other assumptions, as more fully disclosed in a separate note. Fair value estimates involve uncertainties and matters of significant judgment regarding interest rates, credit risk, prepayments, and other factors, especially in the absence of broad markets for particular items. Changes in assumptions or in market conditions could significantly affect the estimates.
Impairment of Long-Lived Assets—
The Company evaluates long-lived assets for impairment whenever events or changes in circumstances indicate that the carrying value of an asset may not be recoverable. If the estimated future cash flows (undiscounted) over the remaining useful life of the asset are less than the carrying value, an impairment loss would be recorded to reduce the related asset to its estimated fair value.
Transfer of Financial Assets
—Transfers of financial assets are accounted for as sales, when control over the assets has been relinquished. Control over transferred assets is deemed to be surrendered when the assets have been isolated from the Company, the transferee obtains the right (free of conditions that constrain it from taking advantage of that right) to pledge or exchange the transferred assets, and the Company does not maintain effective control over the transferred assets through an agreement to repurchase them before their maturity.
Use of Estimates in the Preparation of Consolidated Financial Statements
—The preparation of consolidated financial statements in conformity with U.S. generally accepted accounting principles (“GAAP”) requires management to make estimates and assumptions that affect the reported amounts of assets and liabilities and disclosure of contingent assets and liabilities at the date of the financial statements and the reported amounts of revenues and expenses during the reporting period. Actual results could materially differ from those estimates.
Reclassifications -
Some items in the prior year financial statements were reclassified to conform to the current presentation. The reclassifications had no effect on the prior year net income or stockholders’ equity.
F-16
HOPE BANCORP, INC. AND SUBSIDIARIES
NOTES TO CONSOLIDATED FINANCIAL STATEMENTS (Continued)
Accounting Pronouncements Adopted
On May 28, 2014, the Financial Accounting Standards Board (“FASB”) issued ASU No. 2014-09, Revenue from Contracts with Customers (ASC Topic 606), with several subsequent updates. This series of comprehensive guidance has replaced all existing revenue recognition guidance and is effective for annual reporting periods beginning after December 15, 2017, and interim periods therein. Under the new guidance, there is a five-step model to apply to revenue recognition. The five-steps consist of: (1) determination of whether a contract, an agreement between two or more parties that creates legally enforceable rights and obligations, exists; (2) identification of the performance obligations in the contract; (3) determination of the transaction price; (4) allocation of the transaction price to the performance obligations in the contract; and (5) recognition of revenue when (or as) the performance obligation is satisfied. The Company adopted this standard as of January 1, 2018 and applied the modified retrospective approach to reflect the aggregate effect of all modifications of those contracts that were not completed as of that date. There was no material impact on the consolidated financial statements or on how the Company recognizes revenue upon adoption. As such, prior period amounts were not adjusted and the prior period amounts continue to be reported in accordance with previous accounting guidance. See Note 19, “Revenue Recognition” for further details.
In January 2016, the FASB issued ASU No. 2016-01, “Recognition and Measurement of Financial Assets and Financial Liabilities.” This ASU addresses certain aspects of recognition, measurement, presentation, and disclosure of financial instruments by making targeted improvements to GAAP as follows: (1) require equity investments (except those accounted for under the equity method of accounting or those that result in consolidation of the investee) to be measured at fair value with changes in fair value recognized in net income. However, an entity may choose to measure equity investments that do not have readily determinable fair values at cost minus impairment, if any, plus or minus changes resulting from observable price changes in orderly transactions for the identical or a similar investment of the same issuer; (2) simplify the impairment assessment of equity investments without readily determinable fair values by requiring a qualitative assessment to identify impairment. When a qualitative assessment indicates that impairment exists, an entity is required to measure the investment at fair value; (3) eliminate the requirement to disclose the fair value of financial instruments measured at amortized cost for entities that are not public business entities; (4) eliminate the requirement for public business entities to disclose the method(s) and significant assumptions used to estimate the fair value that is required to be disclosed for financial instruments measured at amortized cost on the balance sheet; (5) require public business entities to use the exit price notion when measuring the fair value of financial instruments for disclosure purposes; (6) require an entity to present separately in other comprehensive income the portion of the total change in the fair value of a liability resulting from a change in the instrument-specific credit risk when the entity has elected to measure the liability at fair value in accordance with the fair value option for financial instruments; (7) require separate presentation of financial assets and financial liabilities by measurement category and form of financial asset (that is, securities or loans and receivables) on the balance sheet or the accompanying notes to the financial statements; and (8) clarify that an entity should evaluate the need for a valuation allowance on a deferred tax asset related to available for sale securities in combination with the entity’s other deferred tax assets. The adoption of ASU No. 2016-01 on January 1, 2018 did not have a material impact on the Company’s consolidated financial statements. In accordance with (1) above, the Company measured equity investments at fair value and recognized changes in fair value in net income for the year ended December 31, 2018 (see Note 3 Equity Investments). In accordance with (5) above, the Company measured the fair value of its loan portfolio as of December 31, 2018 using an exit price notion (see Note 15 Fair Value Measurements).
F-17
HOPE BANCORP, INC. AND SUBSIDIARIES
NOTES TO CONSOLIDATED FINANCIAL STATEMENTS (Continued)
Pending Accounting Pronouncements
In February 2016, the FASB issued ASU 2016-02, “Leases (Topic 842)”. Subsequently, the FASB issued ASU 2018-10, “Codification Improvements to Topic 842, Leases”, ASU 2018-11, “Leases Topic 842, Targeted Improvements”, and ASU 2018-20, “Narrow-Scope Improvements for Lessors”, to provide additional clarification, implementation, and transition guidance on certain aspects of ASU 2016-02. ASU 2016-02 establishes a right-of-use (“ROU”) model that requires a lessee to record a ROU asset and a lease liability on the balance sheet for all leases with terms longer than 12 months. Leases will be classified as either finance or operating, with classification affecting the pattern of expense recognition in the income statement. ASU 2016-02, ASU 2018-10, ASU 2018-11, and ASU 2018-20 are effective for fiscal years beginning after December 15, 2018, including interim periods within those fiscal years. The Company has elected the transition option provided in ASU 2018-11 and the modified retrospective approach will be applied on January 1, 2019 and will continue to present leases under ASC 840 for prior year comparative periods. As permitted by ASU 2016-02, the Company has elected the following practical expedients: lease classifications under ASC 840 will be grandfathered in, the Company will not re-evaluate embedded leases, the Company will not reassess initial direct costs, the option not to separate lease and non-lease components and instead to account for them as a single lease component, and the option not to recognize right-of-use assets and lease liabilities that arise from short-term leases (i.e., leases with terms of twelve months or less). In July 2018, the Company engaged a new software vendor to assist the Company with the administration and accounting of leases under ASU 2016-02. At January 1, 2019, the Company had a total of
96
operating leases resulting in the recognition of
$64.3 million
in right-of-use assets and related lease liabilities totaling
$64.3 million
. The adoption of ASU 2016-02 will impact the Company’s consolidated statements of condition by increasing total balances of assets and liabilities by the right-of-use assets and right-of-use liability balances, respectively. The adoption of ASU 2016-02 will not have a material impact on the Company’s consolidated statements of income.
In June 2016, the FASB issued ASU 2016-13, “Financial Instruments - Credit Losses (Topic 326): Measurement of Credit Losses on Financial Instruments”, also referred to as “CECL”. ASU 2016-13 requires the measurement of all expected credit losses for financial assets held at the reporting date based on historical experience, current conditions, and reasonable and supportable forecasts. Financial institutions and other organizations will now use forward-looking information to better inform their credit loss estimates. ASU 2016-13 becomes effective for fiscal years and interim periods within those fiscal years beginning after December 15, 2019. The Company has established a CECL committee to oversee the development and implementation of ASU 2016-13. The Company is collaborating with a third party advisory team and has completed a gap assessment, a full implementation road-map and a detailed project plan. The Company has also engaged a software vendor and other third party consultants to assist the Company to build a model that is compliant with ASU 2016-13 by the effective date. Based on the Company’s initial assessment of the ASU 2016-13, the Company expects the new guidance will result in additional required allowance for loan losses which could potentially have a material impact on its consolidated financial statements and regulatory capital ratios.
Recently Issued Accounting Pronouncements Not Yet Adopted
In January 2017, the FASB issued ASU 2017-04, “Intangibles: Goodwill and Other: Simplifying the Test for Goodwill Impairment.” ASU 2017-04 will amend and simplify current goodwill impairment testing to eliminate Step 2 from the current provisions. Under the new guidance, an entity should perform the goodwill impairment test by comparing the fair value of a reporting unit with its carrying value and recognize an impairment charge for the amount by which the carrying amount exceeds the reporting unit’s fair value. An entity still has the option to perform the quantitative assessment for a reporting unit to determine if a quantitative impairment test is necessary. ASU 2017-04 should be adopted for annual or any interim goodwill impairment tests in fiscal years beginning after December 15, 2019. The adoption of ASU 2017-04 is not expected to have a material impact on the Company’s consolidated financial statements, but will change the Company’s approach to testing goodwill for impairment.
In March 2017, the FASB issued ASU 2017-08, “Receivables - Nonrefundable Fees and Other Costs (Subtopic 310-20): Premium Amortization on Purchased Callable Debt Securities”. ASU 2017-08 was issued to amend the amortization period for certain callable debt securities held at a premium. ASU 2017-08 shortens the amortization period of premiums on certain purchased callable debt securities to the earliest call date. ASU 2017-08 affect all entities that hold investments in callable debt securities that have an amortized cost basis in excess of the amount that is repayable by the issuer at the earliest call date (that is, at a premium). ASU 2017-08 does not impact securities purchased at a discount, which continue to be amortized to maturity. ASU 2017-08 is effective for annual period beginning after December 15, 2018, including interim periods within those annual periods. Early adoption is permitted in an interim period. If an entity chooses to adopt early, any adjustments should be reflected as of the beginning of the fiscal year that includes the interim period. The adoption of ASU 2017-08 is not expected to have a material impact on the Company’s consolidated financial statements.
F-18
HOPE BANCORP, INC. AND SUBSIDIARIES
NOTES TO CONSOLIDATED FINANCIAL STATEMENTS (Continued)
In June 2018, the FASB issued ASU 2018-07, “Compensation - Stock Compensation (Topic 718): Improvements to Nonemployees Share-Based Payment Accounting”. ASU 2018-07 expands the scope of Topic 718 (which currently only includes share-based payments to employees) to include share-based payments issued to nonemployees for goods or services. As ASU 2018-07 becomes effective, the accounting for share-based payments for nonemployees and employees will be substantially the same. The ASU supersedes Subtopic 505-50, “Equity – Equity-Based Payments to Non-Employees”. ASU 2018-07 is effective for annual period beginning after December 15, 2018, including interim periods within those annual periods. Early adoption is permitted, but no earlier than a company’s adoption date of Topic 606, Revenue from Contracts with Customers. The adoption of ASU 2018-07 is not expected to have a material impact on the Company’s consolidated financial statements as the Company has historically not issued share-based payments to nonemployees for goods and services.
In August 2018, the FASB issued ASU 2018-13, “Fair Value Measurement (Topic 820): Disclosure Framework - Changes to the Disclosure Requirements for Fair Value Measurement”. ASU 2018-13 modifies the disclosure requirements for fair value measurements by removing, modifying, or adding certain disclosures. ASU 2018-13 removes the disclosure requirement detailing the amount of and reasons for transfers between Level 1 and Level 2 and the valuation processes for Level 3 fair value measurements will be removed. In addition, ASU 2018-13 modifies the disclosure requirement for investments in certain entities that calculate net asset value. Lastly, ASU 2018-13 adds a disclosure requirement for changes in unrealized gains and losses for the period included in other comprehensive income for recurring Level 3 fair value measurements held at the end of the reporting period and the range and weighted average of significant unobservable inputs used to develop Level 3 measurements. ASU 2018-13 is effective annual periods in fiscal years beginning after December 15, 2019, including interim periods within those annual periods. Early adoption is permitted upon the issuance of ASU 2018-13. The removed and modified disclosures will be adopted on a retrospective basis, and the new disclosures will be adopted on a prospective basis. The adoption of ASU 2018-13 is not expected to have a material impact on the Company’s consolidated financial statements.
In August 2018, the FASB issued ASU 2018-15,
“
Intangibles - Goodwill and Other - Internal Use Software (Subtopic 250-40): Customer’s Accounting for Implementation Costs Incurred in a Cloud Computing Arrangement That Is a Service Contract (a consensus of the FASB Emerging Issues Task Force)”. ASU 2018-15 requires an entity in a cloud computing arrangement (i.e., hosting arrangement) that is a service contract to follow the internal-use software guidance in ASC 350-40 to determine which implementation costs to capitalize as assets or expense as incurred. Capitalized implementation costs should be presented in the same line item on the balance sheet as amounts prepaid for the hosted service, if any (generally as an “other asset”). The capitalized costs will be amortized over the term of the hosting arrangement, with the amortization expense being presented in the same income statement line item as the fees paid for the hosted service. ASU 2018-15 is effective for annual reporting periods beginning after December 15, 2019, including interim periods within those annual periods. Early adoption is permitted, including adoption in any interim period. The adoption of ASU 2018-15 is not expected to have a material impact on the Company’s consolidated financial statements.
F-19
HOPE BANCORP, INC. AND SUBSIDIARIES
NOTES TO CONSOLIDATED FINANCIAL STATEMENTS (Continued)
|
2.
|
MERGERS AND ACQUISITIONS
|
Merger with Wilshire Bancorp Inc.
On July 29, 2016, the merger of Wilshire Bancorp Inc. (“Wilshire”) and BBCN Bancorp, Inc. (now Hope Bancorp) was completed. On the same day BBCN changed its name to Hope Bancorp, Inc. and the subsidiary BBCN Bank was changed to Bank of Hope. The Company merged with Wilshire to create the only super regional Korean-American Bank in the United States and to expand the Company’s branch network nationwide. Pursuant to the merger agreement, holders of Wilshire common stock received
0.7034
of a share of common stock of HOPE for each share of Wilshire common stock held immediately prior to the effective time of the merger, rounded to the nearest whole share, plus cash in lieu of the issuance of fractional shares. Outstanding Wilshire stock options and restricted stock awards were converted into stock options with respect to shares of HOPE common stock or restricted shares of HOPE common stock, respectively, with appropriate adjustments to reflect the exchange ratio. The merger was accounted for using the acquisition method of accounting. Accordingly, the assets and liabilities of Wilshire were recorded at their respective fair values and represents management’s estimates based on available information.
F-20
HOPE BANCORP, INC. AND SUBSIDIARIES
NOTES TO CONSOLIDATED FINANCIAL STATEMENTS (Continued)
|
3.
|
EQUITY INVESTMENTS
|
On January 1, 2018, the Company adopted ASU 2016-01, “
Recognition and Measurement of Financial Assets and Financial Liabilities”.
As a result of the adoption, the Company reclassified
$469 thousand
in net unrealized losses included in other comprehensive income and deferred tax assets to retained earnings on January 1, 2018. Equity investments with readily determinable fair value at
December 31, 2018
, consisted of mutual funds and equity stock in other institutions in the amount of
$21.5 million
and
$1.9 million
, respectively and is included in “Equity investments” on the consolidated statements of financial condition. At December 31, 2017, these investments were included as “securities available for sale, at fair value” on the consolidated statements of financial condition.
In accordance with ASU 2016-01, the change in fair values for equity investments with readily determinable fair value for the year ended
December 31, 2018
was recorded as other noninterest income as summarized in the table below:
|
Year Ended
December 31, 2018 |
||||
|
(Dollars in thousands)
|
||||
|
Net change in fair value recorded during the year on equity investments
|
$
|
1,449
|
|
|
|
Net change in fair value recorded on equity investments sold during the year
|
—
|
|
||
|
Net change in fair value on equity investments at the end of the year
|
$
|
1,449
|
|
|
At
December 31, 2018
, the Company also had equity investments without readily determinable fair value which are carried at cost less any determined impairment. The balance of these investments is adjusted for changes in subsequent observable prices. At
December 31, 2018
, the total balance of equity investments without readily determinable fair values included in “Equity investments” on the consolidated statements of financial condition was
$26.4 million
, consisting of
$370 thousand
in correspondent bank stock,
$1.0 million
in CDFI investments, and
$25.1 million
in CRA investments. At December 31, 2017, these investments were included as “Interest-bearing deposits in other financial institutions and other investments” on the on the consolidated statements of financial condition. There were
no
impairments or subsequent observable price changes for investments without readily determinable fair values for
twelve months ended
December 31, 2018
.
F-21
HOPE BANCORP, INC. AND SUBSIDIARIES
NOTES TO CONSOLIDATED FINANCIAL STATEMENTS (Continued)
|
4.
|
SECURITIES AVAILABLE FOR SALE
|
The following is a summary of securities available for sale at
December 31, 2018
and
2017
:
|
|
December 31, 2018
|
||||||||||||||
|
|
Amortized
Cost
|
Gross
Unrealized
Gains
|
Gross
Unrealized
Losses
|
Estimated
Fair Value
|
|||||||||||
|
|
(Dollars in thousands)
|
||||||||||||||
|
Debt securities:
|
|
|
|||||||||||||
|
U.S. Government agency and U.S.
Government sponsored enterprises:
|
|||||||||||||||
|
Collateralized mortgage obligations
|
$
|
914,710
|
|
$
|
1,541
|
|
$
|
(21,129
|
)
|
$
|
895,122
|
|
|||
|
Mortgage-backed securities:
|
|||||||||||||||
|
Residential
|
415,659
|
|
47
|
|
(13,101
|
)
|
402,605
|
|
|||||||
|
Commercial
|
481,081
|
|
1,024
|
|
(12,979
|
)
|
469,126
|
|
|||||||
|
Corporate securities
|
5,000
|
|
—
|
|
(1,174
|
)
|
3,826
|
|
|||||||
|
Municipal securities
|
77,168
|
|
398
|
|
(1,980
|
)
|
75,586
|
|
|||||||
|
Total investment securities available for sale
|
$
|
1,893,618
|
|
$
|
3,010
|
|
$
|
(50,363
|
)
|
$
|
1,846,265
|
|
|||
|
December 31, 2017
|
|||||||||||||||
|
|
Amortized
Cost
|
Gross
Unrealized
Gains
|
Gross
Unrealized
Losses
|
Estimated
Fair Value
|
|||||||||||
|
|
(Dollars in thousands)
|
||||||||||||||
|
Debt securities:
|
|||||||||||||||
|
U.S. Government agency and U.S.
Government sponsored enterprises:
|
|||||||||||||||
|
Collateralized mortgage obligations
|
$
|
856,193
|
|
$
|
58
|
|
(17,542
|
)
|
$
|
838,709
|
|
||||
|
Mortgage-backed securities:
|
|||||||||||||||
|
Residential
|
477,676
|
|
521
|
|
(6,983
|
)
|
471,214
|
|
|||||||
|
Commercial
|
308,046
|
|
—
|
|
(6,681
|
)
|
301,365
|
|
|||||||
|
Corporate securities
|
4,997
|
|
—
|
|
(522
|
)
|
4,475
|
|
|||||||
|
Municipal securities
|
82,542
|
|
870
|
|
(875
|
)
|
82,537
|
|
|||||||
|
Total debt securities
|
1,729,454
|
|
1,449
|
|
(32,603
|
)
|
1,698,300
|
|
|||||||
|
Mutual funds
|
22,425
|
|
17
|
|
(485
|
)
|
21,957
|
|
|||||||
|
Total investment securities available for sale
|
$
|
1,751,879
|
|
$
|
1,466
|
|
$
|
(33,088
|
)
|
$
|
1,720,257
|
|
|||
As of
December 31, 2018
and
December 31, 2017
, there were no holdings of securities of any one issuer, other than the U.S. Government and its agencies, in an amount greater than
10%
of stockholders’ equity.
At
December 31, 2018
and
December 31, 2017
,
$32.7 million
and
$21.8 million
, respectively, in unrealized losses on securities available for sale net of taxes were included in accumulated other comprehensive loss. There were no reclassifications out of accumulated other comprehensive loss into earnings during the twelve months ended
December 31, 2018
. During the twelve months ended
December 31, 2017
,
$301 thousand
in unrealized gains on investment securities were reclassified out of accumulated other comprehensive loss into earnings as a net gain on sale of securities.
F-22
HOPE BANCORP, INC. AND SUBSIDIARIES
NOTES TO CONSOLIDATED FINANCIAL STATEMENTS (Continued)
On January 1, 2018, the Company adopted ASU 2016-01 “
Financial Instruments-Overall: Recognition and Measurement of Financial Assets and Financial Liabilities”
. As a result of the adoption of ASU 2016-01, the Company no longer accounts for mutual funds as available for sale securities and accounts for these investments as equity investments with readily determinable fair value with changes in fair value recorded through earnings. In accordance with ASU 2016-01, the Company reclassified
$469
thousand in net unrealized losses included in other comprehensive income and deferred tax assets to retained earnings on January 1, 2018. As of result of the adoption of ASU 2016-01, mutual funds were reclassified from investment securities available for sale to equity investments on January 1, 2018. The subsequent changes to fair value for mutual funds were recorded as other noninterest income for the twelve months ended December 31, 2018.
The proceeds from sales of securities and total gains and losses are listed below:
|
Year ended December 31,
|
|||||||||||
|
|
2018
|
2017
|
2016
|
||||||||
|
|
(Dollars in thousands)
|
||||||||||
|
Proceeds from investments sold
|
$
|
—
|
|
$
|
128,791
|
|
$
|
217,079
|
|
||
|
Gains from sales of securities
|
—
|
|
402
|
|
1,032
|
|
|||||
|
Losses from sales of securities
|
—
|
|
(101
|
)
|
(84
|
)
|
|||||
|
Gains from called securities
|
—
|
|
—
|
|
2
|
|
|||||
|
Net gain on sales or called securities
|
$
|
—
|
|
$
|
301
|
|
$
|
950
|
|
||
The amortized cost and estimated fair value of securities at
December 31, 2018
, by contractual maturity, are shown below. Expected maturities may differ from contractual maturities because borrowers may have the right to call or prepay obligations with or without call or prepayment penalties. Securities not due at a single maturity date are shown separately.
|
December 31, 2018
|
|||||||
|
Amortized
Cost
|
Estimated
Fair Value
|
||||||
|
|
(Dollars in thousands)
|
||||||
|
Available for sale:
|
|||||||
|
Due within one year
|
$
|
751
|
|
$
|
761
|
|
|
|
Due after one year through five years
|
17,565
|
|
17,669
|
|
|||
|
Due after five years through ten years
|
27,873
|
|
27,901
|
|
|||
|
Due after ten years
|
35,979
|
|
33,081
|
|
|||
|
U.S. Government agency and U.S. Government sponsored enterprises
|
|||||||
|
Collateralized mortgage obligations
|
914,710
|
|
895,122
|
|
|||
|
Mortgage-backed securities:
|
|||||||
|
Residential
|
415,659
|
|
402,605
|
|
|||
|
Commercial
|
481,081
|
|
469,126
|
|
|||
|
Total
|
$
|
1,893,618
|
|
$
|
1,846,265
|
|
|
Securities with carrying values of approximately
$354.6 million
and
$359.2 million
at
December 31, 2018
and
December 31, 2017
, respectively, were pledged to secure public deposits, various borrowings, and for other purposes as required or permitted by law.
F-23
HOPE BANCORP, INC. AND SUBSIDIARIES
NOTES TO CONSOLIDATED FINANCIAL STATEMENTS (Continued)
The following tables show the Company’s investments’ gross unrealized losses and estimated fair values, aggregated by investment category and the length of time that the individual securities have been in a continuous unrealized loss position as of the dates indicated.
|
December 31, 2018
|
||||||||||||||||||||||||||||||||
|
Less than 12 months
|
12 months or longer
|
Total
|
||||||||||||||||||||||||||||||
|
Description of
Securities
|
Number
of
Securities
|
Fair Value
|
Gross
Unrealized
Losses
|
Number of
Securities
|
Fair Value
|
Gross
Unrealized
Losses
|
Number
of
Securities
|
Fair Value
|
Gross
Unrealized
Losses
|
|||||||||||||||||||||||
|
|
(Dollars in thousands)
|
|||||||||||||||||||||||||||||||
|
Collateralized mortgage obligations*
|
1
|
|
$
|
8,041
|
|
$
|
(28
|
)
|
93
|
|
$
|
700,095
|
|
$
|
(21,101
|
)
|
94
|
|
$
|
708,136
|
|
$
|
(21,129
|
)
|
||||||||
|
Mortgage-backed securities:
|
||||||||||||||||||||||||||||||||
|
Residential*
|
4
|
|
19,973
|
|
(37
|
)
|
45
|
|
363,334
|
|
(13,064
|
)
|
49
|
|
383,307
|
|
(13,101
|
)
|
||||||||||||||
|
Commercial*
|
3
|
|
38,494
|
|
(218
|
)
|
27
|
|
312,428
|
|
(12,761
|
)
|
30
|
|
350,922
|
|
(12,979
|
)
|
||||||||||||||
|
Corporate securities
|
—
|
|
—
|
|
—
|
|
1
|
|
3,826
|
|
(1,174
|
)
|
1
|
|
3,826
|
|
(1,174
|
)
|
||||||||||||||
|
Municipal securities
|
13
|
|
5,528
|
|
(83
|
)
|
32
|
|
42,444
|
|
(1,897
|
)
|
45
|
|
47,972
|
|
(1,980
|
)
|
||||||||||||||
|
Total
|
21
|
|
$
|
72,036
|
|
$
|
(366
|
)
|
198
|
|
$
|
1,422,127
|
|
$
|
(49,997
|
)
|
219
|
|
$
|
1,494,163
|
|
$
|
(50,363
|
)
|
||||||||
|
December 31, 2017
|
||||||||||||||||||||||||||||||||
|
Less than 12 months
|
12 months or longer
|
Total
|
||||||||||||||||||||||||||||||
|
Description of
Securities
|
Number of
Securities
|
Fair Value
|
Gross
Unrealized
Losses
|
Number of
Securities
|
Fair Value
|
Gross
Unrealized
Losses
|
Number of
Securities
|
Fair Value
|
Gross
Unrealized
Losses
|
|||||||||||||||||||||||
|
|
(Dollars in thousands)
|
|||||||||||||||||||||||||||||||
|
Collateralized mortgage obligations*
|
38
|
|
$
|
425,198
|
|
$
|
(5,954
|
)
|
53
|
|
$
|
408,526
|
|
$
|
(11,588
|
)
|
91
|
|
$
|
833,724
|
|
$
|
(17,542
|
)
|
||||||||
|
Mortgage-backed securities:
|
||||||||||||||||||||||||||||||||
|
Residential*
|
20
|
|
195,086
|
|
(1,282
|
)
|
23
|
|
230,616
|
|
(5,701
|
)
|
43
|
|
425,702
|
|
(6,983
|
)
|
||||||||||||||
|
Commercial*
|
16
|
|
186,357
|
|
(1,614
|
)
|
8
|
|
115,008
|
|
(5,067
|
)
|
24
|
|
301,365
|
|
(6,681
|
)
|
||||||||||||||
|
Corporate securities
|
1
|
|
4,475
|
|
(522
|
)
|
—
|
|
—
|
|
—
|
|
1
|
|
4,475
|
|
(522
|
)
|
||||||||||||||
|
Municipal securities
|
18
|
|
9,295
|
|
(69
|
)
|
3
|
|
22,144
|
|
(806
|
)
|
21
|
|
31,439
|
|
(875
|
)
|
||||||||||||||
|
Mutual funds
|
1
|
|
8,899
|
|
(101
|
)
|
3
|
|
11,579
|
|
(384
|
)
|
4
|
|
20,478
|
|
(485
|
)
|
||||||||||||||
|
Total
|
94
|
|
$
|
829,310
|
|
$
|
(9,542
|
)
|
90
|
|
$
|
787,873
|
|
$
|
(23,546
|
)
|
184
|
|
$
|
1,617,183
|
|
$
|
(33,088
|
)
|
||||||||
* Investments in U.S. Government agency and U.S. Government sponsored enterprises
The Company evaluates securities for other-than-temporary-impairment (“OTTI”) on at least a quarterly basis, and more frequently when economic or market concerns warrant such evaluation. Consideration is given to the financial condition and near-term prospects of the issuer, the length of time and the extent to which the fair values of the securities have been less than the cost of the securities, the Company’s intention to sell, and/or whether it is more likely than not that the Company will be required to sell the security in an unrealized loss position before recovery of its amortized cost basis. In analyzing an issuer’s financial condition, the Company considers, among other considerations, whether the securities are issued by the federal government or its agencies, whether downgrades by bond rating agencies have occurred, and the results of reviews of the issuer’s financial condition.
F-24
HOPE BANCORP, INC. AND SUBSIDIARIES
NOTES TO CONSOLIDATED FINANCIAL STATEMENTS (Continued)
The Company has certain collateralized mortgage obligations, mortgage-backed securities, corporate securities, and municipal securities that were in a continuous loss position for twelve months or longer at
December 31, 2018
. Corporate securities in a continuous loss position for twelve months or longer had unrealized losses of
$1.2 million
at
December 31, 2018
. Municipal securities in a continuous loss position for twelve months or longer had an unrealized losses of
$1.9 million
at
December 31, 2018
with the last of the securities scheduled to mature in November 2046. These securities were rated investment grade and there were no credit quality concerns with the issuer. Collateralized mortgage obligations, residential and commercial mortgage-backed securities in a continuous loss position for twelve months or longer had unrealized losses of
$21.1 million
,
$13.1 million
, and
$12.8 million
, respectively, at
December 31, 2018
. These securities were investments in U.S. Government agency and U.S. Government sponsored enterprises and have high credit ratings (“AA” grade or better). The interest on the securities that were in an unrealized loss position have been paid as agreed, and management believes this will continue in the future and that the securities will be paid in full as scheduled. The market value declines are deemed to be due to the current market volatility and are not reflective of management’s expectations of the Company’s ability to fully recover the investments, which may be at maturity. For these reasons,
no
OTTI was recognized on the securities that were in a continuous loss position for twelve months or longer at
December 31, 2018
.
The Company considers the losses on its investments in unrealized loss positions at
December 31, 2018
to be temporary based on: 1) the likelihood of recovery; 2) the information relative to the extent and duration of the decline in market value; and 3) the Company’s intention not to sell, and management’s determination that it is more likely than not that the Company will not be required to sell a security in an unrealized loss position before recovery of its amortized cost basis. The increase in the net unrealized loss position can be attributed to an increase in long term Treasury yields as a result of the increase in interest rates at
December 31, 2018
, compared to rates at
December 31, 2017
.
F-25
HOPE BANCORP, INC. AND SUBSIDIARIES
NOTES TO CONSOLIDATED FINANCIAL STATEMENTS (Continued)
|
5.
|
LOANS RECEIVABLE AND THE ALLOWANCE FOR LOAN LOSSES
|
The following is a summary of loans by major category at
December 31, 2018
and
2017
:
|
December 31, 2018
|
December 31, 2017
|
||||||
|
Loan portfolio composition
|
(Dollars in thousands)
|
||||||
|
Real estate loans:
|
|||||||
|
Residential
|
$
|
51,197
|
|
$
|
49,774
|
|
|
|
Commercial & industrial
|
8,395,327
|
|
8,142,036
|
|
|||
|
Construction
|
275,076
|
|
316,412
|
|
|||
|
Total real estate loans
|
8,721,600
|
|
8,508,222
|
|
|||
|
Commercial business
|
2,127,630
|
|
1,780,869
|
|
|||
|
Trade finance
|
197,190
|
|
166,664
|
|
|||
|
Consumer and other
|
1,051,486
|
|
647,102
|
|
|||
|
Total loans outstanding
|
12,097,906
|
|
11,102,857
|
|
|||
|
Deferred loan costs (fees)
|
209
|
|
(282
|
)
|
|||
|
Loans receivable
|
12,098,115
|
|
11,102,575
|
|
|||
|
Allowance for loan losses
|
(92,557
|
)
|
(84,541
|
)
|
|||
|
Loans receivable, net of allowance for loan losses
|
$
|
12,005,558
|
|
$
|
11,018,034
|
|
|
The loan portfolio is made up of
four
segments: real estate loans, commercial business, trade finance, and consumer and other. Real estate loans are extended for the purchase and refinance of commercial real estate and are generally secured by first deeds of trust and are collateralized by residential or commercial properties. Commercial business loans are loans provided to business for various purposes such as for working capital, purchasing inventory, debt refinancing, business acquisitions and other business related financing needs. Trade finance loans generally serves businesses involved in international trade activities. Consumer and other loans consist mostly of single family residential mortgage loans but also includes home equity, credit cards, and other personal loans.
The four segments are further segregated between loans accounted for under the amortized cost method (“Legacy Loans”), and previously acquired loans that were originally recorded at fair value with no carryover of the related pre-acquisition allowance for loan losses (“Acquired Loans”). Acquired Loans are further segregated between purchased credit impaired loans (loans with credit deterioration on the date of acquisition and accounted for under ASC 310-30, or “PCI loans”), and Acquired Performing Loans (loans that were pass graded on the acquisition date and the fair value adjustment is amortized over the contractual life under ASC 310-20, or “non-PCI loans”).
The following table presents changes in the accretable discount on the PCI loans for the years ended
December 31, 2018
and
2017
:
|
Year ended December 31,
|
|||||||
|
2018
|
2017
|
||||||
|
(Dollars in thousands)
|
|||||||
|
Balance at beginning of period
|
$
|
55,002
|
|
$
|
43,611
|
|
|
|
Accretion
|
(21,837
|
)
|
(21,542
|
)
|
|||
|
Reclassification from nonaccretable difference
|
16,532
|
|
32,933
|
|
|||
|
Balance at end of period
|
$
|
49,697
|
|
$
|
55,002
|
|
|
On the acquisition date, the amount by which the undiscounted expected cash flows exceed the estimated fair value of the PCI loans is the accretable yield. The accretable yield is then measured at each financial reporting date and represents the difference between the remaining undiscounted expected cash flows and the current carrying value of the loans. The accretable yield may change from period to period due to the following: 1) estimates of the remaining life of acquired loans will affect the amount of future interest income, 2) indices for variable rates of interest on PCI loans may change; and 3) estimates of the amount of the contractual principal and interest that will not be collected (nonaccretable difference) may change.
F-26
HOPE BANCORP, INC. AND SUBSIDIARIES
NOTES TO CONSOLIDATED FINANCIAL STATEMENTS (Continued)
The following tables detail the activity in the allowance for loan losses by portfolio segment for the years indicated:
|
|
Legacy Loans
|
Acquired Loans
|
Total
|
||||||||||||||||||||||||||||||||
|
Real
Estate
|
Commercial Business
|
Trade Finance
|
Consumer and Other
|
Real
Estate |
Commercial Business
|
Trade Finance
|
Consumer and Other
|
||||||||||||||||||||||||||||
|
(Dollars in thousands)
|
|||||||||||||||||||||||||||||||||||
|
December 31, 2018
|
|||||||||||||||||||||||||||||||||||
|
Balance, beginning of period
|
$
|
45,360
|
|
$
|
17,228
|
|
$
|
1,674
|
|
$
|
3,385
|
|
$
|
13,322
|
|
$
|
3,527
|
|
$
|
42
|
|
$
|
3
|
|
$
|
84,541
|
|
||||||||
|
Provision (credit) for loan losses
|
9,334
|
|
3,389
|
|
(588
|
)
|
4,098
|
|
(5,551
|
)
|
3,253
|
|
(42
|
)
|
1,007
|
|
14,900
|
|
|||||||||||||||||
|
Loans charged off
|
(6,273
|
)
|
(1,400
|
)
|
(408
|
)
|
(1,245
|
)
|
(453
|
)
|
(1,083
|
)
|
—
|
|
(13
|
)
|
(10,875
|
)
|
|||||||||||||||||
|
Recoveries of charge offs
|
1,025
|
|
2,609
|
|
41
|
|
31
|
|
3
|
|
242
|
|
—
|
|
40
|
|
3,991
|
|
|||||||||||||||||
|
Balance, end of period
|
$
|
49,446
|
|
$
|
21,826
|
|
$
|
719
|
|
$
|
6,269
|
|
$
|
7,321
|
|
$
|
5,939
|
|
$
|
—
|
|
$
|
1,037
|
|
$
|
92,557
|
|
||||||||
|
December 31, 2017
|
|||||||||||||||||||||||||||||||||||
|
Balance, beginning of period
|
$
|
38,956
|
|
$
|
23,430
|
|
$
|
1,897
|
|
$
|
2,116
|
|
$
|
12,791
|
|
$
|
117
|
|
$
|
—
|
|
$
|
36
|
|
$
|
79,343
|
|
||||||||
|
Provision (credit) for loan losses
|
8,524
|
|
(1,036
|
)
|
1,825
|
|
2,207
|
|
1,341
|
|
4,500
|
|
42
|
|
(43
|
)
|
17,360
|
|
|||||||||||||||||
|
Loans charged off
|
(2,292
|
)
|
(9,881
|
)
|
(2,104
|
)
|
(943
|
)
|
(850
|
)
|
(1,315
|
)
|
—
|
|
(25
|
)
|
(17,410
|
)
|
|||||||||||||||||
|
Recoveries of charge offs
|
172
|
|
4,715
|
|
56
|
|
5
|
|
40
|
|
225
|
|
—
|
|
35
|
|
5,248
|
|
|||||||||||||||||
|
Balance, end of period
|
$
|
45,360
|
|
$
|
17,228
|
|
$
|
1,674
|
|
$
|
3,385
|
|
$
|
13,322
|
|
$
|
3,527
|
|
$
|
42
|
|
$
|
3
|
|
$
|
84,541
|
|
||||||||
|
December 31, 2016
|
|||||||||||||||||||||||||||||||||||
|
Balance, beginning of period
|
$
|
42,829
|
|
$
|
16,332
|
|
$
|
3,592
|
|
$
|
556
|
|
$
|
12,823
|
|
$
|
214
|
|
$
|
—
|
|
$
|
62
|
|
$
|
76,408
|
|
||||||||
|
Provision (credit) for loan losses
|
(4,896
|
)
|
12,928
|
|
(1,695
|
)
|
2,229
|
|
714
|
|
(248
|
)
|
—
|
|
(32
|
)
|
9,000
|
|
|||||||||||||||||
|
Loans charged off
|
(152
|
)
|
(7,267
|
)
|
—
|
|
(757
|
)
|
(758
|
)
|
(26
|
)
|
—
|
|
—
|
|
(8,960
|
)
|
|||||||||||||||||
|
Recoveries of charged offs
|
1,175
|
|
1,437
|
|
—
|
|
88
|
|
12
|
|
177
|
|
—
|
|
6
|
|
2,895
|
|
|||||||||||||||||
|
Balance, end of period
|
$
|
38,956
|
|
$
|
23,430
|
|
$
|
1,897
|
|
$
|
2,116
|
|
$
|
12,791
|
|
$
|
117
|
|
$
|
—
|
|
$
|
36
|
|
$
|
79,343
|
|
||||||||
The following tables disaggregate the allowance for loan losses and the carrying value of loans receivables by impairment methodology at
December 31, 2018
and
December 31, 2017
:
|
December 31, 2018
|
|||||||||||||||||||||||||||||||||||
|
|
Legacy Loans
|
Acquired Loans
|
Total
|
||||||||||||||||||||||||||||||||
|
Real
Estate |
Commercial Business
|
Trade Finance
|
Consumer and Other
|
Real
Estate |
Commercial Business
|
Trade Finance
|
Consumer and Other
|
||||||||||||||||||||||||||||
|
(Dollars in thousands)
|
|||||||||||||||||||||||||||||||||||
|
Allowance for loan losses:
|
|||||||||||||||||||||||||||||||||||
|
Individually evaluated for impairment
|
$
|
176
|
|
$
|
4,221
|
|
$
|
—
|
|
$
|
3
|
|
$
|
261
|
|
$
|
130
|
|
$
|
—
|
|
$
|
—
|
|
$
|
4,791
|
|
||||||||
|
Collectively evaluated for impairment
|
49,270
|
|
17,605
|
|
719
|
|
6,266
|
|
1,264
|
|
460
|
|
—
|
|
19
|
|
75,603
|
|
|||||||||||||||||
|
PCI loans
|
—
|
|
—
|
|
—
|
|
—
|
|
5,796
|
|
5,349
|
|
—
|
|
1,018
|
|
12,163
|
|
|||||||||||||||||
|
Total
|
$
|
49,446
|
|
$
|
21,826
|
|
$
|
719
|
|
$
|
6,269
|
|
$
|
7,321
|
|
$
|
5,939
|
|
$
|
—
|
|
$
|
1,037
|
|
$
|
92,557
|
|
||||||||
|
Loans outstanding:
|
|||||||||||||||||||||||||||||||||||
|
Individually evaluated for impairment
|
$
|
39,976
|
|
$
|
29,624
|
|
$
|
5,887
|
|
$
|
441
|
|
$
|
18,080
|
|
$
|
5,734
|
|
$
|
3,124
|
|
$
|
1,141
|
|
$
|
104,007
|
|
||||||||
|
Collectively evaluated for impairment
|
7,037,392
|
|
1,988,067
|
|
188,179
|
|
910,292
|
|
1,507,858
|
|
80,916
|
|
—
|
|
133,942
|
|
11,846,646
|
|
|||||||||||||||||
|
PCI loans
|
—
|
|
—
|
|
—
|
|
—
|
|
118,294
|
|
23,289
|
|
—
|
|
5,670
|
|
147,253
|
|
|||||||||||||||||
|
Total
|
$
|
7,077,368
|
|
$
|
2,017,691
|
|
$
|
194,066
|
|
$
|
910,733
|
|
$
|
1,644,232
|
|
$
|
109,939
|
|
$
|
3,124
|
|
$
|
140,753
|
|
$
|
12,097,906
|
|
||||||||
F-27
HOPE BANCORP, INC. AND SUBSIDIARIES
NOTES TO CONSOLIDATED FINANCIAL STATEMENTS (Continued)
|
December 31, 2017
|
|||||||||||||||||||||||||||||||||||
|
|
Legacy Loans
|
Acquired Loans
|
Total
|
||||||||||||||||||||||||||||||||
|
Real
Estate |
Commercial Business
|
Trade Finance
|
Consumer and Other
|
Real
Estate |
Commercial Business
|
Trade Finance
|
Consumer and Other
|
||||||||||||||||||||||||||||
|
(Dollars in thousands)
|
|||||||||||||||||||||||||||||||||||
|
Allowance for loan losses:
|
|||||||||||||||||||||||||||||||||||
|
Individually evaluated for impairment
|
$
|
1,378
|
|
$
|
2,807
|
|
$
|
3
|
|
$
|
35
|
|
$
|
246
|
|
$
|
854
|
|
$
|
—
|
|
$
|
—
|
|
$
|
5,323
|
|
||||||||
|
Collectively evaluated for impairment
|
43,982
|
|
14,421
|
|
1,671
|
|
3,350
|
|
1,036
|
|
2,673
|
|
42
|
|
3
|
|
67,178
|
|
|||||||||||||||||
|
PCI loans
|
—
|
|
—
|
|
—
|
|
—
|
|
12,040
|
|
—
|
|
—
|
|
—
|
|
12,040
|
|
|||||||||||||||||
|
Total
|
$
|
45,360
|
|
$
|
17,228
|
|
$
|
1,674
|
|
$
|
3,385
|
|
$
|
13,322
|
|
$
|
3,527
|
|
$
|
42
|
|
$
|
3
|
|
$
|
84,541
|
|
||||||||
|
Loans outstanding:
|
|||||||||||||||||||||||||||||||||||
|
Individually evaluated for impairment
|
$
|
41,041
|
|
$
|
31,322
|
|
$
|
3,951
|
|
$
|
908
|
|
$
|
14,239
|
|
$
|
18,733
|
|
$
|
2,984
|
|
$
|
1,171
|
|
$
|
114,349
|
|
||||||||
|
Collectively evaluated for impairment
|
6,172,448
|
|
1,459,273
|
|
152,204
|
|
477,375
|
|
2,120,001
|
|
244,980
|
|
7,525
|
|
157,794
|
|
10,791,600
|
|
|||||||||||||||||
|
PCI loans
|
—
|
|
—
|
|
—
|
|
—
|
|
160,493
|
|
26,561
|
|
—
|
|
9,854
|
|
196,908
|
|
|||||||||||||||||
|
Total
|
$
|
6,213,489
|
|
$
|
1,490,595
|
|
$
|
156,155
|
|
$
|
478,283
|
|
$
|
2,294,733
|
|
$
|
290,274
|
|
$
|
10,509
|
|
$
|
168,819
|
|
$
|
11,102,857
|
|
||||||||
As of
December 31, 2018
and
December 31, 2017
, the allowance for unfunded commitments was
$736 thousand
and
$836 thousand
, respectively.
For the year ended December 31, 2018
and
2017
, the recognized credit for credit losses related to unfunded commitments was
$100 thousand
and
$2.4 million
, respectively.
The recorded investment in individually impaired loans was as follows:
|
|
December 31, 2018
|
December 31, 2017
|
|||||
|
|
(Dollars in thousands)
|
||||||
|
With allocated specific allowance:
|
|||||||
|
Without charge-off
|
$
|
35,365
|
|
$
|
28,614
|
|
|
|
With charge-off
|
681
|
|
3,044
|
|
|||
|
With no allocated specific allowance:
|
|||||||
|
Without charge-off
|
59,607
|
|
77,533
|
|
|||
|
With charge-off
|
8,354
|
|
5,158
|
|
|||
|
Specific allowance on impaired loans
|
(4,791
|
)
|
(5,323
|
)
|
|||
|
Impaired loans, net of specific allowance
|
$
|
99,216
|
|
$
|
109,026
|
|
|
F-28
HOPE BANCORP, INC. AND SUBSIDIARIES
NOTES TO CONSOLIDATED FINANCIAL STATEMENTS (Continued)
The following tables detail the recorded investment of impaired loans (Legacy Loans and Acquired Loans that became impaired subsequent to being originated and acquired, respectfully) by portfolio segment. Loans with no related allowance for loan losses are believed by management to have adequate collateral securing their carrying value.
|
December 31, 2018
|
Year Ended December 31, 2018
|
|||||||||||||||||||
|
Total Impaired Loans
|
Recorded Investment*
|
Unpaid Contractual Principal Balance
|
Related
Allowance
|
Average
Recorded Investment*
|
Interest Income Recognized during Impairment
|
|||||||||||||||
|
|
(Dollars in thousands)
|
|||||||||||||||||||
|
With Related Allowance:
|
||||||||||||||||||||
|
Real estate—residential
|
$
|
—
|
|
$
|
—
|
|
$
|
—
|
|
$
|
50
|
|
$
|
—
|
|
|||||
|
Real estate—commercial
|
||||||||||||||||||||
|
Retail
|
1,375
|
|
1,487
|
|
156
|
|
3,554
|
|
30
|
|
||||||||||
|
Hotel & motel
|
1,949
|
|
2,310
|
|
119
|
|
2,700
|
|
—
|
|
||||||||||
|
Gas station & car wash
|
—
|
|
—
|
|
—
|
|
—
|
|
—
|
|
||||||||||
|
Mixed use
|
881
|
|
947
|
|
43
|
|
2,032
|
|
6
|
|
||||||||||
|
Industrial & warehouse
|
1,305
|
|
2,139
|
|
93
|
|
1,579
|
|
70
|
|
||||||||||
|
Other
|
7,759
|
|
8,174
|
|
26
|
|
6,038
|
|
372
|
|
||||||||||
|
Real estate—construction
|
—
|
|
—
|
|
—
|
|
—
|
|
—
|
|
||||||||||
|
Commercial business
|
22,203
|
|
23,928
|
|
4,351
|
|
23,146
|
|
511
|
|
||||||||||
|
Trade finance
|
—
|
|
—
|
|
—
|
|
2,143
|
|
—
|
|
||||||||||
|
Consumer and other
|
575
|
|
575
|
|
3
|
|
710
|
|
7
|
|
||||||||||
|
Subtotal
|
$
|
36,047
|
|
$
|
39,560
|
|
$
|
4,791
|
|
$
|
41,952
|
|
$
|
996
|
|
|||||
|
With No Related Allowance:
|
||||||||||||||||||||
|
Real estate—residential
|
$
|
—
|
|
$
|
—
|
|
$
|
—
|
|
$
|
—
|
|
$
|
—
|
|
|||||
|
Real estate—commercial
|
||||||||||||||||||||
|
Retail
|
8,005
|
|
11,234
|
|
—
|
|
9,913
|
|
143
|
|
||||||||||
|
Hotel & motel
|
10,877
|
|
22,590
|
|
—
|
|
6,085
|
|
—
|
|
||||||||||
|
Gas station & car wash
|
545
|
|
3,653
|
|
—
|
|
520
|
|
19
|
|
||||||||||
|
Mixed use
|
7,048
|
|
7,058
|
|
—
|
|
3,404
|
|
347
|
|
||||||||||
|
Industrial & warehouse
|
12,343
|
|
13,467
|
|
—
|
|
11,560
|
|
298
|
|
||||||||||
|
Other
|
5,969
|
|
7,122
|
|
—
|
|
13,107
|
|
106
|
|
||||||||||
|
Real estate—construction
|
—
|
|
—
|
|
—
|
|
520
|
|
—
|
|
||||||||||
|
Commercial business
|
13,155
|
|
17,850
|
|
—
|
|
18,041
|
|
531
|
|
||||||||||
|
Trade finance
|
9,011
|
|
9,011
|
|
—
|
|
5,405
|
|
487
|
|
||||||||||
|
Consumer and other
|
1,007
|
|
1,156
|
|
—
|
|
1,457
|
|
—
|
|
||||||||||
|
Subtotal
|
$
|
67,960
|
|
$
|
93,141
|
|
$
|
—
|
|
$
|
70,012
|
|
$
|
1,931
|
|
|||||
|
Total
|
$
|
104,007
|
|
$
|
132,701
|
|
$
|
4,791
|
|
$
|
111,964
|
|
$
|
2,927
|
|
|||||
__________________________________
|
*
|
Unpaid contractual principal balance less charge offs, interest collected applied to principal if on nonaccrual and purchase discounts.
|
F-29
HOPE BANCORP, INC. AND SUBSIDIARIES
NOTES TO CONSOLIDATED FINANCIAL STATEMENTS (Continued)
|
December 31, 2018
|
Year Ended December 31, 2018
|
|||||||||||||||||||
|
Impaired acquired loans
|
Recorded Investment*
|
Unpaid
Contractual Principal
Balance
|
Related
Allowance
|
Average
Recorded Investment*
|
Interest Income Recognized during Impairment
|
|||||||||||||||
|
|
(Dollars in thousands)
|
|||||||||||||||||||
|
With Related Allowance:
|
||||||||||||||||||||
|
Real estate—residential
|
$
|
—
|
|
$
|
—
|
|
$
|
—
|
|
$
|
50
|
|
$
|
—
|
|
|||||
|
Real estate—commercial
|
||||||||||||||||||||
|
Retail
|
198
|
|
220
|
|
118
|
|
510
|
|
—
|
|
||||||||||
|
Hotel & motel
|
72
|
|
345
|
|
4
|
|
78
|
|
—
|
|
||||||||||
|
Gas station & car wash
|
—
|
|
—
|
|
—
|
|
—
|
|
—
|
|
||||||||||
|
Mixed use
|
312
|
|
312
|
|
38
|
|
1,813
|
|
6
|
|
||||||||||
|
Industrial & warehouse
|
230
|
|
1,050
|
|
88
|
|
246
|
|
—
|
|
||||||||||
|
Other
|
3,454
|
|
3,454
|
|
13
|
|
2,133
|
|
221
|
|
||||||||||
|
Real estate—construction
|
—
|
|
—
|
|
—
|
|
—
|
|
—
|
|
||||||||||
|
Commercial business
|
4,064
|
|
5,041
|
|
130
|
|
5,380
|
|
162
|
|
||||||||||
|
Trade finance
|
—
|
|
—
|
|
—
|
|
—
|
|
—
|
|
||||||||||
|
Consumer and other
|
144
|
|
144
|
|
—
|
|
89
|
|
7
|
|
||||||||||
|
Subtotal
|
$
|
8,474
|
|
$
|
10,566
|
|
$
|
391
|
|
$
|
10,299
|
|
$
|
396
|
|
|||||
|
With No Related Allowance:
|
||||||||||||||||||||
|
Real estate—residential
|
$
|
—
|
|
$
|
—
|
|
$
|
—
|
|
$
|
—
|
|
$
|
—
|
|
|||||
|
Real estate—commercial
|
||||||||||||||||||||
|
Retail
|
3,285
|
|
4,151
|
|
—
|
|
3,202
|
|
123
|
|
||||||||||
|
Hotel & motel
|
5,428
|
|
6,874
|
|
—
|
|
2,685
|
|
—
|
|
||||||||||
|
Gas station & car wash
|
247
|
|
2,673
|
|
—
|
|
176
|
|
—
|
|
||||||||||
|
Mixed use
|
3,722
|
|
3,726
|
|
—
|
|
789
|
|
148
|
|
||||||||||
|
Industrial & warehouse
|
119
|
|
894
|
|
—
|
|
253
|
|
—
|
|
||||||||||
|
Other
|
1,013
|
|
1,326
|
|
—
|
|
4,662
|
|
39
|
|
||||||||||
|
Real estate—construction
|
—
|
|
—
|
|
—
|
|
—
|
|
—
|
|
||||||||||
|
Commercial business
|
1,670
|
|
2,681
|
|
—
|
|
4,658
|
|
92
|
|
||||||||||
|
Trade finance
|
3,124
|
|
3,124
|
|
—
|
|
3,134
|
|
189
|
|
||||||||||
|
Consumer and other
|
997
|
|
1,144
|
|
—
|
|
1,298
|
|
—
|
|
||||||||||
|
Subtotal
|
$
|
19,605
|
|
$
|
26,593
|
|
$
|
—
|
|
$
|
20,857
|
|
$
|
591
|
|
|||||
|
Total
|
$
|
28,079
|
|
$
|
37,159
|
|
$
|
391
|
|
$
|
31,156
|
|
$
|
987
|
|
|||||
__________________________________
|
*
|
Unpaid contractual principal balance less charge offs, interest collected applied to principal if on nonaccrual and purchase discounts.
|
F-30
HOPE BANCORP, INC. AND SUBSIDIARIES
NOTES TO CONSOLIDATED FINANCIAL STATEMENTS (Continued)
|
|
December 31, 2017
|
Year Ended December 31, 2017
|
||||||||||||||||||
|
Total Impaired Loans
|
Recorded Investment*
|
Unpaid
Contractual Principal
Balance
|
Related
Allowance
|
Average
Recorded Investment*
|
Interest Income Recognized during Impairment
|
|||||||||||||||
|
|
(Dollars in thousands)
|
|||||||||||||||||||
|
With Related Allowance:
|
||||||||||||||||||||
|
Real estate—residential
|
$
|
—
|
|
$
|
—
|
|
$
|
—
|
|
$
|
—
|
|
$
|
—
|
|
|||||
|
Real estate—commercial
|
||||||||||||||||||||
|
Retail
|
532
|
|
531
|
|
131
|
|
1,120
|
|
—
|
|
||||||||||
|
Hotel & motel
|
2,931
|
|
5,090
|
|
284
|
|
4,050
|
|
67
|
|
||||||||||
|
Gas station & car wash
|
—
|
|
—
|
|
—
|
|
43
|
|
—
|
|
||||||||||
|
Mixed use
|
312
|
|
958
|
|
4
|
|
245
|
|
6
|
|
||||||||||
|
Industrial & warehouse
|
772
|
|
1,482
|
|
96
|
|
1,135
|
|
—
|
|
||||||||||
|
Other
|
4,397
|
|
4,401
|
|
1,109
|
|
11,707
|
|
237
|
|
||||||||||
|
Real estate—construction
|
—
|
|
—
|
|
—
|
|
—
|
|
—
|
|
||||||||||
|
Commercial business
|
18,330
|
|
22,757
|
|
3,661
|
|
23,695
|
|
631
|
|
||||||||||
|
Trade finance
|
3,861
|
|
3,861
|
|
3
|
|
2,842
|
|
217
|
|
||||||||||
|
Consumer and other
|
523
|
|
524
|
|
35
|
|
240
|
|
4
|
|
||||||||||
|
Subtotal
|
$
|
31,658
|
|
$
|
39,604
|
|
$
|
5,323
|
|
$
|
45,077
|
|
$
|
1,162
|
|
|||||
|
With No Related Allowance:
|
||||||||||||||||||||
|
Real estate—residential
|
$
|
—
|
|
$
|
—
|
|
$
|
—
|
|
$
|
1,105
|
|
$
|
—
|
|
|||||
|
Real estate—commercial
|
||||||||||||||||||||
|
Retail
|
11,792
|
|
13,923
|
|
—
|
|
12,288
|
|
434
|
|
||||||||||
|
Hotel & motel
|
2,841
|
|
5,288
|
|
—
|
|
7,245
|
|
—
|
|
||||||||||
|
Gas station & car wash
|
591
|
|
1,764
|
|
—
|
|
3,168
|
|
—
|
|
||||||||||
|
Mixed use
|
1,101
|
|
3,490
|
|
—
|
|
3,496
|
|
—
|
|
||||||||||
|
Industrial & warehouse
|
8,429
|
|
8,525
|
|
—
|
|
8,676
|
|
262
|
|
||||||||||
|
Other
|
20,282
|
|
24,412
|
|
—
|
|
17,116
|
|
608
|
|
||||||||||
|
Real estate—construction
|
1,300
|
|
1,441
|
|
—
|
|
1,611
|
|
—
|
|
||||||||||
|
Commercial business
|
31,725
|
|
33,207
|
|
—
|
|
16,312
|
|
697
|
|
||||||||||
|
Trade finance
|
3,074
|
|
3,091
|
|
—
|
|
2,994
|
|
253
|
|
||||||||||
|
Consumer and other
|
1,556
|
|
1,676
|
|
—
|
|
1,225
|
|
25
|
|
||||||||||
|
Subtotal
|
$
|
82,691
|
|
$
|
96,817
|
|
$
|
—
|
|
$
|
75,236
|
|
$
|
2,279
|
|
|||||
|
Total
|
$
|
114,349
|
|
$
|
136,421
|
|
$
|
5,323
|
|
$
|
120,313
|
|
$
|
3,441
|
|
|||||
__________________________________
|
*
|
Unpaid contractual principal balance less charge offs, interest collected applied to principal if on nonaccrual and purchase discounts.
|
F-31
HOPE BANCORP, INC. AND SUBSIDIARIES
NOTES TO CONSOLIDATED FINANCIAL STATEMENTS (Continued)
|
December 31, 2017
|
Year Ended December 31, 2017
|
|||||||||||||||||||
|
Impaired acquired loans
|
Recorded Investment*
|
Unpaid
Contractual Principal
Balance
|
Related
Allowance
|
Average
Recorded Investment*
|
Interest Income Recognized during Impairment
|
|||||||||||||||
|
|
(Dollars in thousands)
|
|||||||||||||||||||
|
With Related Allowance:
|
||||||||||||||||||||
|
Real estate—residential
|
$
|
—
|
|
$
|
—
|
|
$
|
—
|
|
$
|
—
|
|
$
|
—
|
|
|||||
|
Real estate—commercial
|
||||||||||||||||||||
|
Retail
|
262
|
|
261
|
|
126
|
|
851
|
|
—
|
|
||||||||||
|
Hotel & motel
|
85
|
|
86
|
|
2
|
|
105
|
|
—
|
|
||||||||||
|
Gas station & car wash
|
—
|
|
—
|
|
—
|
|
—
|
|
—
|
|
||||||||||
|
Mixed use
|
129
|
|
129
|
|
1
|
|
179
|
|
6
|
|
||||||||||
|
Industrial & warehouse
|
221
|
|
896
|
|
96
|
|
225
|
|
—
|
|
||||||||||
|
Other
|
319
|
|
323
|
|
21
|
|
319
|
|
17
|
|
||||||||||
|
Real estate—construction
|
—
|
|
—
|
|
—
|
|
—
|
|
—
|
|
||||||||||
|
Commercial business
|
1,987
|
|
2,903
|
|
854
|
|
1,111
|
|
47
|
|
||||||||||
|
Trade finance
|
—
|
|
—
|
|
—
|
|
—
|
|
—
|
|
||||||||||
|
Consumer and other
|
—
|
|
—
|
|
—
|
|
—
|
|
—
|
|
||||||||||
|
Subtotal
|
$
|
3,003
|
|
$
|
4,598
|
|
$
|
1,100
|
|
$
|
2,790
|
|
$
|
70
|
|
|||||
|
With No Related Allowance:
|
||||||||||||||||||||
|
Real estate—residential
|
$
|
—
|
|
$
|
—
|
|
$
|
—
|
|
$
|
235
|
|
$
|
—
|
|
|||||
|
Real estate—commercial
|
||||||||||||||||||||
|
Retail
|
3,412
|
|
4,099
|
|
—
|
|
2,866
|
|
141
|
|
||||||||||
|
Hotel & motel
|
482
|
|
1,887
|
|
—
|
|
3,086
|
|
—
|
|
||||||||||
|
Gas station & car wash
|
1
|
|
28
|
|
—
|
|
619
|
|
—
|
|
||||||||||
|
Mixed use
|
152
|
|
2,240
|
|
—
|
|
2,191
|
|
—
|
|
||||||||||
|
Industrial & warehouse
|
45
|
|
45
|
|
—
|
|
59
|
|
3
|
|
||||||||||
|
Other
|
9,131
|
|
9,951
|
|
—
|
|
5,190
|
|
340
|
|
||||||||||
|
Real estate—construction
|
—
|
|
—
|
|
—
|
|
—
|
|
—
|
|
||||||||||
|
Commercial business
|
16,746
|
|
16,926
|
|
—
|
|
5,794
|
|
182
|
|
||||||||||
|
Trade finance
|
2,984
|
|
3,001
|
|
—
|
|
1,274
|
|
248
|
|
||||||||||
|
Consumer and other
|
1,171
|
|
1,291
|
|
—
|
|
645
|
|
7
|
|
||||||||||
|
Subtotal
|
$
|
34,124
|
|
$
|
39,468
|
|
$
|
—
|
|
$
|
21,959
|
|
$
|
921
|
|
|||||
|
Total
|
$
|
37,127
|
|
$
|
44,066
|
|
$
|
1,100
|
|
$
|
24,749
|
|
$
|
991
|
|
|||||
__________________________________
|
*
|
Unpaid contractual principal balance less charge offs, interest collected applied to principal if on nonaccrual and purchase discounts.
|
F-32
HOPE BANCORP, INC. AND SUBSIDIARIES
NOTES TO CONSOLIDATED FINANCIAL STATEMENTS (Continued)
|
|
Year Ended December 31, 2016
|
|||||||
|
Total Impaired Loans
|
Average
Recorded Investment*
|
Interest Income Recognized during Impairment
|
||||||
|
|
(Dollars in thousands)
|
|||||||
|
With Related Allowance:
|
||||||||
|
Real estate—residential
|
$
|
—
|
|
$
|
—
|
|
||
|
Real estate—commercial
|
||||||||
|
Retail
|
1,788
|
|
—
|
|
||||
|
Hotel & motel
|
3,650
|
|
332
|
|
||||
|
Gas station & car wash
|
884
|
|
—
|
|
||||
|
Mixed use
|
350
|
|
7
|
|
||||
|
Industrial & warehouse
|
547
|
|
23
|
|
||||
|
Other
|
23,690
|
|
1,033
|
|
||||
|
Real estate—construction
|
—
|
|
—
|
|
||||
|
Commercial business
|
32,626
|
|
988
|
|
||||
|
Trade finance
|
7,134
|
|
25
|
|
||||
|
Consumer and other
|
289
|
|
4
|
|
||||
|
Subtotal
|
$
|
70,958
|
|
$
|
2,412
|
|
||
|
With No Related Allowance:
|
||||||||
|
Real estate—residential
|
$
|
712
|
|
$
|
119
|
|
||
|
Real estate—commercial
|
||||||||
|
Retail
|
10,745
|
|
451
|
|
||||
|
Hotel & motel
|
8,275
|
|
14
|
|
||||
|
Gas station & car wash
|
4,817
|
|
39
|
|
||||
|
Mixed use
|
3,284
|
|
282
|
|
||||
|
Industrial & warehouse
|
10,252
|
|
350
|
|
||||
|
Other
|
13,086
|
|
479
|
|
||||
|
Real estate—construction
|
1,322
|
|
—
|
|
||||
|
Commercial business
|
10,559
|
|
203
|
|
||||
|
Trade finance
|
1,674
|
|
208
|
|
||||
|
Consumer and other
|
1,026
|
|
29
|
|
||||
|
Subtotal
|
$
|
65,752
|
|
$
|
2,174
|
|
||
|
Total
|
$
|
136,710
|
|
$
|
4,586
|
|
||
__________________________________
|
*
|
Unpaid contractual principal balance less charge offs, interest collected applied to principal if on nonaccrual and purchase discounts.
|
F-33
HOPE BANCORP, INC. AND SUBSIDIARIES
NOTES TO CONSOLIDATED FINANCIAL STATEMENTS (Continued)
|
Year Ended December 31, 2016
|
||||||||
|
Impaired acquired loans
|
Average
Recorded Investment*
|
Interest Income Recognized during Impairment
|
||||||
|
|
(Dollars in thousands)
|
|||||||
|
With Related Allowance:
|
||||||||
|
Real estate—residential
|
$
|
—
|
|
$
|
—
|
|
||
|
Real estate—commercial
|
||||||||
|
Retail
|
1,387
|
|
—
|
|
||||
|
Hotel & motel
|
—
|
|
—
|
|
||||
|
Gas station & car wash
|
203
|
|
—
|
|
||||
|
Mixed use
|
280
|
|
7
|
|
||||
|
Industrial & warehouse
|
—
|
|
—
|
|
||||
|
Other
|
327
|
|
18
|
|
||||
|
Real estate—construction
|
—
|
|
—
|
|
||||
|
Commercial business
|
448
|
|
5
|
|
||||
|
Trade finance
|
—
|
|
—
|
|
||||
|
Consumer and other
|
32
|
|
—
|
|
||||
|
Subtotal
|
$
|
2,677
|
|
$
|
30
|
|
||
|
With No Related Allowance:
|
||||||||
|
Real estate—residential
|
$
|
136
|
|
$
|
—
|
|
||
|
Real estate—commercial
|
||||||||
|
Retail
|
2,496
|
|
152
|
|
||||
|
Hotel & motel
|
5,700
|
|
14
|
|
||||
|
Gas station & car wash
|
1,506
|
|
39
|
|
||||
|
Mixed use
|
1,238
|
|
245
|
|
||||
|
Industrial & warehouse
|
873
|
|
3
|
|
||||
|
Other
|
4,021
|
|
177
|
|
||||
|
Real estate—construction
|
—
|
|
—
|
|
||||
|
Commercial business
|
580
|
|
2
|
|
||||
|
Trade finance
|
—
|
|
—
|
|
||||
|
Consumer and other
|
453
|
|
9
|
|
||||
|
Subtotal
|
$
|
17,003
|
|
$
|
641
|
|
||
|
Total
|
$
|
19,680
|
|
$
|
671
|
|
||
__________________________________
|
*
|
Unpaid contractual principal balance less charge offs, interest collected applied to principal if on nonaccrual and purchase discounts.
|
F-34
HOPE BANCORP, INC. AND SUBSIDIARIES
NOTES TO CONSOLIDATED FINANCIAL STATEMENTS (Continued)
Generally, loans are placed on nonaccrual status if the principal and/or interest payments become
90 days
or more past due and/or management deems the collectability of the principal and/or interest to be in question, as well as when required by regulatory requirements. Loans to customers whose financial condition has deteriorated are considered for nonaccrual status whether or not the loan is 90 days or more past due. Generally, payments received on nonaccrual loans are recorded as principal reductions. Loans are returned to accrual status only when all the principal and interest amounts contractually due are brought current and future payments are reasonably assured. The Company did not recognize any cash basis interest income for the
twelve months ended
December 31, 2018
or
2017
.
The following table represent the recorded investment of nonaccrual loans and loans past due 90 or more days and still on accrual status by class of loans as of
December 31, 2018
or
2017
.
|
Nonaccrual Loans
(1)
|
Accruing Loans Past Due 90 or More Days
|
||||||||||||||
|
|
December 31, 2018
|
December 31, 2017
|
December 31, 2018
|
December 31, 2017
|
|||||||||||
|
|
(Dollars in thousands)
|
||||||||||||||
|
Legacy Loans:
|
|||||||||||||||
|
Real estate—residential
|
$
|
—
|
|
$
|
—
|
|
$
|
—
|
|
$
|
—
|
|
|||
|
Real estate—commercial
|
|||||||||||||||
|
Retail
|
5,153
|
|
3,179
|
|
—
|
|
—
|
|
|||||||
|
Hotel & motel
|
7,325
|
|
3,931
|
|
—
|
|
—
|
|
|||||||
|
Gas station & car wash
|
31
|
|
590
|
|
—
|
|
—
|
|
|||||||
|
Mixed use
|
749
|
|
1,132
|
|
—
|
|
—
|
|
|||||||
|
Industrial & warehouse
|
6,111
|
|
3,403
|
|
—
|
|
—
|
|
|||||||
|
Other
|
5,940
|
|
5,689
|
|
—
|
|
—
|
|
|||||||
|
Real estate—construction
|
—
|
|
1,300
|
|
—
|
|
—
|
|
|||||||
|
Commercial business
|
14,837
|
|
8,540
|
|
—
|
|
—
|
|
|||||||
|
Trade finance
|
1,661
|
|
—
|
|
—
|
|
—
|
|
|||||||
|
Consumer and other
|
441
|
|
471
|
|
243
|
|
407
|
|
|||||||
|
Subtotal
|
$
|
42,248
|
|
$
|
28,235
|
|
$
|
243
|
|
$
|
407
|
|
|||
|
Acquired Loans:
(2)
|
|
|
|
|
|||||||||||
|
Real estate—residential
|
$
|
—
|
|
$
|
—
|
|
$
|
—
|
|
$
|
—
|
|
|||
|
Real estate—commercial
|
|||||||||||||||
|
Retail
|
829
|
|
638
|
|
—
|
|
—
|
|
|||||||
|
Hotel & motel
|
5,500
|
|
568
|
|
1,286
|
|
—
|
|
|||||||
|
Gas station & car wash
|
247
|
|
1
|
|
—
|
|
—
|
|
|||||||
|
Mixed use
|
1,224
|
|
152
|
|
—
|
|
—
|
|
|||||||
|
Industrial & warehouse
|
349
|
|
221
|
|
—
|
|
—
|
|
|||||||
|
Other
|
259
|
|
1,389
|
|
—
|
|
—
|
|
|||||||
|
Real estate—construction
|
—
|
|
—
|
|
—
|
|
—
|
|
|||||||
|
Commercial business
|
1,632
|
|
14,560
|
|
—
|
|
—
|
|
|||||||
|
Trade finance
|
—
|
|
—
|
|
—
|
|
—
|
|
|||||||
|
Consumer and other
|
998
|
|
1,011
|
|
—
|
|
—
|
|
|||||||
|
Subtotal
|
$
|
11,038
|
|
$
|
18,540
|
|
$
|
1,286
|
|
$
|
—
|
|
|||
|
Total
|
$
|
53,286
|
|
$
|
46,775
|
|
$
|
1,529
|
|
$
|
407
|
|
|||
__________________________________
|
(1)
|
Total nonaccrual loans exclude guaranteed portion of delinquent SBA loans that are in liquidation totaling
$29.2 million
and
$22.1 million
, at
December 31, 2018
and December 31, 2017, respectively.
|
|
(2)
|
Acquired Loans exclude PCI loans.
|
F-35
HOPE BANCORP, INC. AND SUBSIDIARIES
NOTES TO CONSOLIDATED FINANCIAL STATEMENTS (Continued)
The following tables present the recorded investment of past due loans, including nonaccrual loans past due 30 or more days, by the number of days past due as of
December 31, 2018
and December 31, 2017 by class of loans:
|
|
As of December 31, 2018
|
As of December 31, 2017
|
|||||||||||||||||||||||||||||
|
|
30-59 Days
Past Due
|
60-89 Days
Past Due
|
90 or More Days
Past Due
|
Total
Past Due
|
30-59 Days
Past Due |
60-89 Days
Past Due |
90 or More Days
Past Due
|
Total
Past Due |
|||||||||||||||||||||||
|
(Dollars in thousands)
|
|||||||||||||||||||||||||||||||
|
Legacy Loans:
|
|||||||||||||||||||||||||||||||
|
Real estate—residential
|
$
|
—
|
|
$
|
—
|
|
$
|
—
|
|
$
|
—
|
|
$
|
—
|
|
$
|
—
|
|
$
|
—
|
|
$
|
—
|
|
|||||||
|
Real estate—commercial
|
|||||||||||||||||||||||||||||||
|
Retail
|
733
|
|
—
|
|
809
|
|
1,542
|
|
3,239
|
|
—
|
|
285
|
|
3,524
|
|
|||||||||||||||
|
Hotel & motel
|
153
|
|
—
|
|
5,215
|
|
5,368
|
|
1,884
|
|
1,172
|
|
2,635
|
|
5,691
|
|
|||||||||||||||
|
Gas station & car wash
|
—
|
|
—
|
|
31
|
|
31
|
|
956
|
|
—
|
|
435
|
|
1,391
|
|
|||||||||||||||
|
Mixed use
|
—
|
|
—
|
|
—
|
|
—
|
|
129
|
|
—
|
|
952
|
|
1,081
|
|
|||||||||||||||
|
Industrial & warehouse
|
1,465
|
|
—
|
|
1,922
|
|
3,387
|
|
1,121
|
|
99
|
|
2,473
|
|
3,693
|
|
|||||||||||||||
|
Other
|
1,837
|
|
—
|
|
2,405
|
|
4,242
|
|
1,409
|
|
—
|
|
5,425
|
|
6,834
|
|
|||||||||||||||
|
Real estate—construction
|
—
|
|
—
|
|
—
|
|
—
|
|
—
|
|
—
|
|
1,300
|
|
1,300
|
|
|||||||||||||||
|
Commercial business
|
5,500
|
|
435
|
|
7,003
|
|
12,938
|
|
698
|
|
516
|
|
2,508
|
|
3,722
|
|
|||||||||||||||
|
Trade finance
|
1,036
|
|
—
|
|
1,661
|
|
2,697
|
|
—
|
|
—
|
|
—
|
|
—
|
|
|||||||||||||||
|
Consumer and other
|
16,413
|
|
140
|
|
247
|
|
16,800
|
|
7,512
|
|
97
|
|
494
|
|
8,103
|
|
|||||||||||||||
|
Subtotal
|
$
|
27,137
|
|
$
|
575
|
|
$
|
19,293
|
|
$
|
47,005
|
|
$
|
16,948
|
|
$
|
1,884
|
|
$
|
16,507
|
|
$
|
35,339
|
|
|||||||
|
Acquired Loans:
(1)
|
|||||||||||||||||||||||||||||||
|
Real estate—residential
|
$
|
—
|
|
$
|
—
|
|
$
|
—
|
|
$
|
—
|
|
$
|
—
|
|
$
|
—
|
|
$
|
—
|
|
$
|
—
|
|
|||||||
|
Real estate—commercial
|
|||||||||||||||||||||||||||||||
|
Retail
|
347
|
|
—
|
|
602
|
|
949
|
|
81
|
|
216
|
|
386
|
|
683
|
|
|||||||||||||||
|
Hotel & motel
|
—
|
|
—
|
|
5,206
|
|
5,206
|
|
—
|
|
1,219
|
|
—
|
|
1,219
|
|
|||||||||||||||
|
Gas station & car wash
|
154
|
|
—
|
|
221
|
|
375
|
|
1,161
|
|
41
|
|
1
|
|
1,203
|
|
|||||||||||||||
|
Mixed use
|
107
|
|
—
|
|
1,034
|
|
1,141
|
|
151
|
|
—
|
|
152
|
|
303
|
|
|||||||||||||||
|
Industrial & warehouse
|
142
|
|
—
|
|
119
|
|
261
|
|
804
|
|
264
|
|
221
|
|
1,289
|
|
|||||||||||||||
|
Other
|
183
|
|
219
|
|
—
|
|
402
|
|
275
|
|
—
|
|
—
|
|
275
|
|
|||||||||||||||
|
Real estate—construction
|
—
|
|
—
|
|
—
|
|
—
|
|
—
|
|
—
|
|
—
|
|
—
|
|
|||||||||||||||
|
Commercial business
|
397
|
|
613
|
|
253
|
|
1,263
|
|
1,088
|
|
256
|
|
885
|
|
2,229
|
|
|||||||||||||||
|
Trade finance
|
—
|
|
—
|
|
—
|
|
—
|
|
—
|
|
—
|
|
—
|
|
—
|
|
|||||||||||||||
|
Consumer and other
|
—
|
|
—
|
|
334
|
|
334
|
|
957
|
|
270
|
|
181
|
|
1,408
|
|
|||||||||||||||
|
Subtotal
|
$
|
1,330
|
|
$
|
832
|
|
$
|
7,769
|
|
$
|
9,931
|
|
$
|
4,517
|
|
$
|
2,266
|
|
$
|
1,826
|
|
$
|
8,609
|
|
|||||||
|
Total Past Due
|
$
|
28,467
|
|
$
|
1,407
|
|
$
|
27,062
|
|
$
|
56,936
|
|
$
|
21,465
|
|
$
|
4,150
|
|
$
|
18,333
|
|
$
|
43,948
|
|
|||||||
__________________________________
|
(1)
|
Acquired Loans exclude PCI loans.
|
Loans accounted for under ASC 310-30 are generally considered accruing and performing loans and the accretable discount is accreted to interest income over the estimate life of the loan when cash flows are reasonably estimable. Accordingly, PCI loans that are contractually past due are still considered to be accruing and performing loans. The loans may be classified as nonaccrual if the timing and amount of future cash flows is not reasonably estimable.
F-36
HOPE BANCORP, INC. AND SUBSIDIARIES
NOTES TO CONSOLIDATED FINANCIAL STATEMENTS (Continued)
The following tables present the risk rating for Legacy Loans and Acquired Loans as of
December 31, 2018
and
December 31, 2017
by class of loans:
|
|
December 31, 2018
|
||||||||||||||||||
|
|
Pass/
Not Rated
|
Special
Mention
|
Substandard
|
Doubtful
|
Total
|
||||||||||||||
|
(Dollars in thousands)
|
|||||||||||||||||||
|
Legacy Loans:
|
|||||||||||||||||||
|
Real estate—residential
|
$
|
44,066
|
|
$
|
—
|
|
$
|
546
|
|
$
|
—
|
|
$
|
44,612
|
|
||||
|
Real estate—commercial
|
|
||||||||||||||||||
|
Retail
|
1,815,170
|
|
18,072
|
|
30,686
|
|
—
|
|
1,863,928
|
|
|||||||||
|
Hotel & motel
|
1,389,349
|
|
21,932
|
|
15,869
|
|
—
|
|
1,427,150
|
|
|||||||||
|
Gas station & car wash
|
814,291
|
|
2,810
|
|
2,464
|
|
—
|
|
819,565
|
|
|||||||||
|
Mixed use
|
510,021
|
|
12,480
|
|
13,292
|
|
—
|
|
535,793
|
|
|||||||||
|
Industrial & warehouse
|
711,236
|
|
1,665
|
|
38,332
|
|
—
|
|
751,233
|
|
|||||||||
|
Other
|
1,326,795
|
|
35,539
|
|
34,618
|
|
—
|
|
1,396,952
|
|
|||||||||
|
Real estate—construction
|
227,231
|
|
10,904
|
|
—
|
|
—
|
|
238,135
|
|
|||||||||
|
Commercial business
|
1,944,783
|
|
18,220
|
|
54,688
|
|
—
|
|
2,017,691
|
|
|||||||||
|
Trade finance
|
191,508
|
|
—
|
|
2,558
|
|
—
|
|
194,066
|
|
|||||||||
|
Consumer and other
|
910,292
|
|
—
|
|
441
|
|
—
|
|
910,733
|
|
|||||||||
|
Subtotal
|
$
|
9,884,742
|
|
$
|
121,622
|
|
$
|
193,494
|
|
$
|
—
|
|
$
|
10,199,858
|
|
||||
|
Acquired Loans:
|
|||||||||||||||||||
|
Real estate—residential
|
$
|
5,812
|
|
$
|
393
|
|
$
|
380
|
|
$
|
—
|
|
$
|
6,585
|
|
||||
|
Real estate—commercial
|
|||||||||||||||||||
|
Retail
|
483,939
|
|
4,651
|
|
17,332
|
|
35
|
|
505,957
|
|
|||||||||
|
Hotel & motel
|
186,761
|
|
807
|
|
19,472
|
|
—
|
|
207,040
|
|
|||||||||
|
Gas station & car wash
|
148,702
|
|
274
|
|
6,032
|
|
—
|
|
155,008
|
|
|||||||||
|
Mixed use
|
77,100
|
|
3,986
|
|
8,151
|
|
—
|
|
89,237
|
|
|||||||||
|
Industrial & warehouse
|
171,574
|
|
9,451
|
|
18,071
|
|
223
|
|
199,319
|
|
|||||||||
|
Other
|
402,247
|
|
12,902
|
|
28,996
|
|
—
|
|
444,145
|
|
|||||||||
|
Real estate—construction
|
29,058
|
|
7,883
|
|
—
|
|
—
|
|
36,941
|
|
|||||||||
|
Commercial business
|
89,611
|
|
1,083
|
|
19,237
|
|
8
|
|
109,939
|
|
|||||||||
|
Trade finance
|
—
|
|
—
|
|
3,124
|
|
—
|
|
3,124
|
|
|||||||||
|
Consumer and other
|
136,944
|
|
37
|
|
3,626
|
|
146
|
|
140,753
|
|
|||||||||
|
Subtotal
|
$
|
1,731,748
|
|
$
|
41,467
|
|
$
|
124,421
|
|
$
|
412
|
|
$
|
1,898,048
|
|
||||
|
Total
|
$
|
11,616,490
|
|
$
|
163,089
|
|
$
|
317,915
|
|
$
|
412
|
|
$
|
12,097,906
|
|
||||
F-37
HOPE BANCORP, INC. AND SUBSIDIARIES
NOTES TO CONSOLIDATED FINANCIAL STATEMENTS (Continued)
|
|
December 31, 2017
|
||||||||||||||||||
|
|
Pass/
Not Rated |
Special
Mention
|
Substandard
|
Doubtful
|
Total
|
||||||||||||||
|
(Dollars in thousands)
|
|||||||||||||||||||
|
Legacy Loans:
|
|||||||||||||||||||
|
Real estate—residential
|
$
|
33,557
|
|
$
|
1,147
|
|
$
|
1,439
|
|
$
|
—
|
|
$
|
36,143
|
|
||||
|
Real estate—commercial
|
|||||||||||||||||||
|
Retail
|
1,640,809
|
|
32,723
|
|
17,856
|
|
—
|
|
1,691,388
|
|
|||||||||
|
Hotel & motel
|
1,224,597
|
|
19,358
|
|
8,877
|
|
—
|
|
1,252,832
|
|
|||||||||
|
Gas station & car wash
|
737,485
|
|
9,013
|
|
590
|
|
—
|
|
747,088
|
|
|||||||||
|
Mixed use
|
421,755
|
|
4,581
|
|
1,477
|
|
—
|
|
427,813
|
|
|||||||||
|
Industrial & warehouse
|
577,344
|
|
16,716
|
|
24,317
|
|
—
|
|
618,377
|
|
|||||||||
|
Other
|
1,133,188
|
|
30,030
|
|
53,995
|
|
—
|
|
1,217,213
|
|
|||||||||
|
Real estate—construction
|
219,583
|
|
—
|
|
3,052
|
|
—
|
|
222,635
|
|
|||||||||
|
Commercial business
|
1,389,043
|
|
35,640
|
|
65,912
|
|
—
|
|
1,490,595
|
|
|||||||||
|
Trade finance
|
152,583
|
|
2,200
|
|
1,372
|
|
—
|
|
156,155
|
|
|||||||||
|
Consumer and other
|
477,370
|
|
5
|
|
908
|
|
—
|
|
478,283
|
|
|||||||||
|
Subtotal
|
$
|
8,007,314
|
|
$
|
151,413
|
|
$
|
179,795
|
|
$
|
—
|
|
$
|
8,338,522
|
|
||||
|
Acquired Loans:
|
|||||||||||||||||||
|
Real estate—residential
|
$
|
13,369
|
|
$
|
262
|
|
$
|
—
|
|
$
|
—
|
|
$
|
13,631
|
|
||||
|
Real estate—commercial
|
|||||||||||||||||||
|
Retail
|
630,555
|
|
6,921
|
|
20,797
|
|
—
|
|
658,273
|
|
|||||||||
|
Hotel & motel
|
275,191
|
|
4,247
|
|
24,987
|
|
—
|
|
304,425
|
|
|||||||||
|
Gas station & car wash
|
194,063
|
|
2,872
|
|
8,992
|
|
—
|
|
205,927
|
|
|||||||||
|
Mixed use
|
94,864
|
|
5,725
|
|
14,738
|
|
—
|
|
115,327
|
|
|||||||||
|
Industrial & warehouse
|
250,049
|
|
14,973
|
|
16,358
|
|
265
|
|
281,645
|
|
|||||||||
|
Other
|
568,545
|
|
19,848
|
|
33,335
|
|
—
|
|
621,728
|
|
|||||||||
|
Real estate—construction
|
93,777
|
|
—
|
|
—
|
|
—
|
|
93,777
|
|
|||||||||
|
Commercial business
|
236,705
|
|
8,593
|
|
44,964
|
|
12
|
|
290,274
|
|
|||||||||
|
Trade finance
|
7,455
|
|
—
|
|
3,054
|
|
—
|
|
10,509
|
|
|||||||||
|
Consumer and other
|
162,495
|
|
37
|
|
6,202
|
|
85
|
|
168,819
|
|
|||||||||
|
Subtotal
|
$
|
2,527,068
|
|
$
|
63,478
|
|
$
|
173,427
|
|
$
|
362
|
|
$
|
2,764,335
|
|
||||
|
Total
|
$
|
10,534,382
|
|
$
|
214,891
|
|
$
|
353,222
|
|
$
|
362
|
|
$
|
11,102,857
|
|
||||
F-38
HOPE BANCORP, INC. AND SUBSIDIARIES
NOTES TO CONSOLIDATED FINANCIAL STATEMENTS (Continued)
The Company may reclassify loans held for investment to loans held for sale in the event that the Company plans to sell loans that were originated with the intent to hold to maturity. Loans transferred from held for investment to held for sale are carried at the lower of cost or fair value. The breakdown of loans by type that were reclassified from held for investment to held for sale for the
year ended
December 31, 2018
and
2017
by portfolio segment is presented in the table below.
|
Year ended December 31,
|
|||||||||||
|
2018
|
2017
|
2016
|
|||||||||
|
(Dollars in thousands)
|
|||||||||||
|
Transfer of loans held for investment to held for sale
|
|||||||||||
|
Real Estate - Commercial
|
$
|
—
|
|
$
|
429
|
|
$
|
5,920
|
|
||
|
Commercial Business
|
—
|
|
—
|
|
3,457
|
|
|||||
|
Consumer
|
21,581
|
|
—
|
|
2,508
|
|
|||||
|
Total
|
$
|
21,581
|
|
$
|
429
|
|
$
|
11,885
|
|
||
The following table presents loans by portfolio segment and impairment method at
December 31, 2018
and
December 31, 2017
:
|
|
December 31, 2018
|
||||||||||||||||||||||||||
|
|
Real Estate -
Residential
|
Real Estate -
Commercial
|
Real Estate -
Construction
|
Commercial
Business
|
Trade
Finance
|
Consumer
and Other
|
Total
|
||||||||||||||||||||
|
|
(Dollars in thousands)
|
||||||||||||||||||||||||||
|
Impaired loans
(recorded investment)
|
$
|
—
|
|
$
|
58,056
|
|
$
|
—
|
|
$
|
35,358
|
|
$
|
9,011
|
|
$
|
1,582
|
|
$
|
104,007
|
|
||||||
|
Specific allowance
|
$
|
—
|
|
$
|
437
|
|
$
|
—
|
|
$
|
4,351
|
|
$
|
—
|
|
$
|
3
|
|
$
|
4,791
|
|
||||||
|
Specific allowance to impaired loans
|
N/A
|
|
0.75
|
%
|
N/A
|
|
12.31
|
%
|
0.00
|
%
|
0.19
|
%
|
4.61
|
%
|
|||||||||||||
|
Other loans
|
$
|
51,197
|
|
$
|
8,337,271
|
|
$
|
275,076
|
|
$
|
2,092,272
|
|
$
|
188,179
|
|
$
|
1,049,904
|
|
$
|
11,993,899
|
|
||||||
|
General allowance
|
$
|
112
|
|
$
|
55,453
|
|
$
|
765
|
|
$
|
23,414
|
|
$
|
719
|
|
$
|
7,303
|
|
$
|
87,766
|
|
||||||
|
General allowance to other loans
|
0.22
|
%
|
0.67
|
%
|
0.28
|
%
|
1.12
|
%
|
0.38
|
%
|
0.70
|
%
|
0.73
|
%
|
|||||||||||||
|
Total loans outstanding
|
$
|
51,197
|
|
|
$
|
8,395,327
|
|
|
$
|
275,076
|
|
$
|
2,127,630
|
|
$
|
197,190
|
|
$
|
1,051,486
|
|
$
|
12,097,906
|
|
||||
|
Total allowance for loan losses
|
$
|
112
|
|
$
|
55,890
|
|
$
|
765
|
|
$
|
27,765
|
|
$
|
719
|
|
$
|
7,306
|
|
$
|
92,557
|
|
||||||
|
Total allowance to total loans
|
0.22
|
%
|
0.67
|
%
|
0.28
|
%
|
1.30
|
%
|
0.36
|
%
|
0.69
|
%
|
0.77
|
%
|
|||||||||||||
F-39
HOPE BANCORP, INC. AND SUBSIDIARIES
NOTES TO CONSOLIDATED FINANCIAL STATEMENTS (Continued)
|
|
December 31, 2017
|
||||||||||||||||||||||||||
|
|
Real Estate -
Residential |
Real Estate -
Commercial |
Real Estate -
Construction |
Commercial
Business |
Trade
Finance |
Consumer
and Other |
Total
|
||||||||||||||||||||
|
|
(Dollars in thousands)
|
||||||||||||||||||||||||||
|
Impaired loans
(recorded investment)
|
$
|
—
|
|
$
|
53,980
|
|
$
|
1,300
|
|
$
|
50,055
|
|
$
|
6,935
|
|
$
|
2,079
|
|
$
|
114,349
|
|
||||||
|
Specific allowance
|
$
|
—
|
|
$
|
1,624
|
|
$
|
—
|
|
$
|
3,661
|
|
$
|
3
|
|
$
|
35
|
|
$
|
5,323
|
|
||||||
|
Specific allowance to impaired loans
|
N/A
|
|
3.01
|
%
|
N/A
|
|
7.31
|
%
|
0.04
|
%
|
1.68
|
%
|
4.66
|
%
|
|||||||||||||
|
Other loans
|
$
|
49,774
|
|
$
|
8,088,056
|
|
$
|
315,112
|
|
$
|
1,730,814
|
|
$
|
159,729
|
|
$
|
645,023
|
|
$
|
10,988,508
|
|
||||||
|
General allowance
|
$
|
88
|
|
$
|
56,040
|
|
$
|
930
|
|
$
|
17,094
|
|
$
|
1,713
|
|
$
|
3,353
|
|
$
|
79,218
|
|
||||||
|
General allowance to other loans
|
0.18
|
%
|
0.69
|
%
|
0.30
|
%
|
0.99
|
%
|
1.07
|
%
|
0.52
|
%
|
0.72
|
%
|
|||||||||||||
|
Total loans outstanding
|
$
|
49,774
|
|
$
|
8,142,036
|
|
$
|
316,412
|
|
$
|
1,780,869
|
|
$
|
166,664
|
|
$
|
647,102
|
|
$
|
11,102,857
|
|
||||||
|
Total allowance for loan losses
|
$
|
88
|
|
$
|
57,664
|
|
$
|
930
|
|
$
|
20,755
|
|
$
|
1,716
|
|
$
|
3,388
|
|
$
|
84,541
|
|
||||||
|
Total allowance to total loans
|
0.18
|
%
|
0.71
|
%
|
0.29
|
%
|
1.17
|
%
|
1.03
|
%
|
0.52
|
%
|
0.76
|
%
|
|||||||||||||
Under certain circumstances, the Company provides borrowers relief through loan modifications. These modifications are either temporary in nature (“temporary modifications”) or are more substantive. At
December 31, 2018
, total modified loans were
$64.0 million
, compared to
$78.5 million
at
December 31, 2017
. The temporary modifications generally consist of interest only payments for a
three
to
six
month period, whereby principal payments are deferred. At the end of the modification period, the remaining principal balance is re-amortized based on the original maturity date. Loans subject to temporary modifications are generally downgraded to Substandard or Special Mention. At the end of the modification period, the loan either 1) returns to the original contractual terms; 2) is further modified and accounted for as a troubled debt restructuring in accordance with ASC 310-10-35; or 3) is disposed of through foreclosure or liquidation.
Troubled Debt Restructurings (“TDRs”) of loans are defined by ASC 310-40,
Troubled Debt Restructurings by Creditors
, and ASC 470-60,
Troubled Debt Restructurings by Debtors,
and evaluated for impairment in accordance with ASC 310-10-35. The concessions may be granted in various forms, including reduction in the stated interest rate, reduction in the amount of principal amortization, forgiveness of a portion of a loan balance or accrued interest, or extension of the maturity date. In order to determine whether a borrower is experiencing financial difficulty, an evaluation is performed of the probability that the borrower will be in payment default on any of its debt in the foreseeable future without the modification. This evaluation is performed under the Company’s internal underwriting policy.
A summary of TDRs on accrual and nonaccrual by type of concession as of
December 31, 2018
and
December 31, 2017
are presented below:
|
December 31, 2018
|
|||||||||||||||||||||||||||||||||||
|
TDRs on Accrual Status
|
TDRs on Nonaccrual Status
|
Total TDRs
|
|||||||||||||||||||||||||||||||||
|
Real Estate
|
Commercial
Business
|
Other
|
Total
|
Real Estate
|
Commercial
Business |
Other
|
Total
|
||||||||||||||||||||||||||||
|
(Dollars in thousands)
|
|||||||||||||||||||||||||||||||||||
|
Payment concession
|
$
|
5,142
|
|
$
|
961
|
|
$
|
—
|
|
$
|
6,103
|
|
$
|
2,216
|
|
$
|
746
|
|
$
|
—
|
|
$
|
2,962
|
|
$
|
9,065
|
|
||||||||
|
Maturity / amortization concession
|
14,012
|
|
17,257
|
|
7,391
|
|
38,660
|
|
—
|
|
10,166
|
|
73
|
|
10,239
|
|
48,899
|
|
|||||||||||||||||
|
Rate concession
|
4,872
|
|
672
|
|
103
|
|
5,647
|
|
401
|
|
—
|
|
—
|
|
401
|
|
6,048
|
|
|||||||||||||||||
|
Total
|
$
|
24,026
|
|
$
|
18,890
|
|
$
|
7,494
|
|
$
|
50,410
|
|
$
|
2,617
|
|
$
|
10,912
|
|
$
|
73
|
|
$
|
13,602
|
|
$
|
64,012
|
|
||||||||
F-40
HOPE BANCORP, INC. AND SUBSIDIARIES
NOTES TO CONSOLIDATED FINANCIAL STATEMENTS (Continued)
|
December 31, 2017
|
|||||||||||||||||||||||||||||||||||
|
TDRs on Accrual Status
|
|
TDRs on Nonaccrual Status
|
|
Total TDRs
|
|||||||||||||||||||||||||||||||
|
Real Estate
|
|
Commercial
Business |
|
Other
|
|
Total
|
|
Real Estate
|
|
Commercial
Business |
|
Other
|
|
Total
|
|
||||||||||||||||||||
|
(Dollars in thousands)
|
|||||||||||||||||||||||||||||||||||
|
Payment concession
|
$
|
22,550
|
|
$
|
376
|
|
$
|
—
|
|
$
|
22,926
|
|
$
|
3,071
|
|
$
|
170
|
|
$
|
—
|
|
$
|
3,241
|
|
$
|
26,167
|
|
||||||||
|
Maturity / amortization concession
|
4,768
|
|
25,584
|
|
7,442
|
|
37,794
|
|
1,536
|
|
5,264
|
|
98
|
|
6,898
|
|
44,692
|
|
|||||||||||||||||
|
Rate concession
|
5,444
|
|
996
|
|
90
|
|
6,530
|
|
1,083
|
|
18
|
|
—
|
|
1,101
|
|
7,631
|
|
|||||||||||||||||
|
Total
|
$
|
32,762
|
|
$
|
26,956
|
|
$
|
7,532
|
|
$
|
67,250
|
|
$
|
5,690
|
|
$
|
5,452
|
|
$
|
98
|
|
$
|
11,240
|
|
$
|
78,490
|
|
||||||||
TDR loans on accrual status are comprised of loans that were accruing at the time of restructuring and for which the Bank anticipates full repayment of both principal and interest under the restructured terms. TDR loans that are on nonaccrual status can be returned to accrual status after a period of sustained performance, generally determined to be six months of timely payments as modified. Sustained performance includes the periods prior to the modification if the prior performance met or exceeded the modified terms. TDR loans on accrual status at
December 31, 2018
were comprised of
20
commercial real estate loans totaling
$24.0 million
,
37
commercial business loans totaling
$18.9 million
and
6
consumer and other loans totaling
$7.5 million
. TDRs on accrual status at
December 31, 2017
were comprised of
24
commercial real estate loans totaling
$32.8 million
,
27
commercial business loans totaling
$27.0 million
, and
7
consumer and other loans totaling
$7.5 million
.
The Company has allocated
$3.0 million
,
$4.8 million
, and
$5.3 million
of specific reserves to TDR loans as of
December 31, 2018
,
2017
, and
2016
, respectively. As of
December 31, 2018
and
2017
, the Company did not have any outstanding commitments to extend additional funds to these borrowers.
F-41
HOPE BANCORP, INC. AND SUBSIDIARIES
NOTES TO CONSOLIDATED FINANCIAL STATEMENTS (Continued)
The following table presents loans by class modified as TDRs that occurred during the years ended
December 31, 2018
,
2017
, and
2016
:
|
For The Years Ended December 31,
|
|||||||||||||||||||||||||||||
|
2018
|
2017
|
2016
|
|||||||||||||||||||||||||||
|
Number of Loans
|
Pre-Modification
|
Post-Modification
|
Number of Loans
|
Pre-Modification
|
Post-Modification
|
Number of Loans
|
Pre-Modification
|
Post-Modification
|
|||||||||||||||||||||
|
(Dollars in thousands)
|
|||||||||||||||||||||||||||||
|
Legacy Loans:
|
|||||||||||||||||||||||||||||
|
Real Estate - Residential
|
—
|
$
|
—
|
|
$
|
—
|
|
—
|
$
|
—
|
|
$
|
—
|
|
—
|
$
|
—
|
|
$
|
—
|
|
||||||||
|
Real Estate - Commercial
|
|||||||||||||||||||||||||||||
|
Retail
|
2
|
53
|
|
53
|
|
2
|
1,082
|
|
1,082
|
|
—
|
—
|
|
—
|
|
||||||||||||||
|
Hotel & Motel
|
—
|
—
|
|
—
|
|
1
|
1,044
|
|
1,044
|
|
—
|
—
|
|
—
|
|
||||||||||||||
|
Gas Station & Car Wash
|
—
|
—
|
|
—
|
|
—
|
—
|
|
—
|
|
—
|
—
|
|
—
|
|
||||||||||||||
|
Mixed Use
|
—
|
—
|
|
—
|
|
—
|
—
|
|
—
|
|
—
|
—
|
|
—
|
|
||||||||||||||
|
Industrial & Warehouse
|
1
|
2,070
|
|
2,070
|
|
1
|
465
|
|
465
|
|
—
|
—
|
|
—
|
|
||||||||||||||
|
Other
|
1
|
1,215
|
|
1,215
|
|
—
|
—
|
|
—
|
|
3
|
1,675
|
|
6,824
|
|
||||||||||||||
|
Real Estate - Construction
|
—
|
—
|
|
—
|
|
—
|
—
|
|
—
|
|
—
|
—
|
|
—
|
|
||||||||||||||
|
Commercial business
|
18
|
10,972
|
|
10,972
|
|
14
|
8,507
|
|
8,507
|
|
12
|
12,311
|
|
7,413
|
|
||||||||||||||
|
Trade Finance
|
1
|
898
|
|
898
|
|
—
|
—
|
|
—
|
|
—
|
—
|
|
—
|
|
||||||||||||||
|
Consumer and Other
|
1
|
63
|
|
63
|
|
—
|
—
|
|
—
|
|
1
|
—
|
|
91
|
|
||||||||||||||
|
Subtotal
|
24
|
$
|
15,271
|
|
$
|
15,271
|
|
18
|
$
|
11,098
|
|
$
|
11,098
|
|
16
|
$
|
13,986
|
|
$
|
14,328
|
|
||||||||
|
Acquired Loans:
|
|||||||||||||||||||||||||||||
|
Real Estate - Residential
|
—
|
—
|
|
—
|
|
—
|
—
|
|
—
|
|
—
|
—
|
|
—
|
|
||||||||||||||
|
Real Estate - Commercial
|
|||||||||||||||||||||||||||||
|
Retail
|
—
|
—
|
|
—
|
|
3
|
1,642
|
|
1,642
|
|
1
|
1,377
|
|
1,335
|
|
||||||||||||||
|
Hotel & Motel
|
—
|
—
|
|
—
|
|
1
|
482
|
|
482
|
|
—
|
—
|
|
—
|
|
||||||||||||||
|
Gas Station & Car Wash
|
—
|
—
|
|
—
|
|
—
|
—
|
|
—
|
|
—
|
—
|
|
—
|
|
||||||||||||||
|
Mixed Use
|
1
|
73
|
|
73
|
|
—
|
—
|
|
—
|
|
—
|
—
|
|
—
|
|
||||||||||||||
|
Industrial & Warehouse
|
—
|
—
|
|
—
|
|
—
|
—
|
|
—
|
|
—
|
—
|
|
—
|
|
||||||||||||||
|
Other
|
1
|
2,688
|
|
2,688
|
|
2
|
6,946
|
|
6,946
|
|
—
|
—
|
|
—
|
|
||||||||||||||
|
Real Estate - Construction
|
1
|
230
|
|
230
|
|
—
|
—
|
|
—
|
|
—
|
—
|
|
—
|
|
||||||||||||||
|
Commercial business
|
—
|
—
|
|
—
|
|
8
|
4,224
|
|
4,224
|
|
1
|
13
|
|
11
|
|
||||||||||||||
|
Trade Finance
|
—
|
—
|
|
—
|
|
1
|
2,983
|
|
2,983
|
|
—
|
—
|
|
—
|
|
||||||||||||||
|
Consumer and Other
|
8
|
1,764
|
|
1,764
|
|
—
|
—
|
|
—
|
|
1
|
30
|
|
25
|
|
||||||||||||||
|
Subtotal
|
11
|
$
|
4,755
|
|
$
|
4,755
|
|
15
|
$
|
16,277
|
|
$
|
16,277
|
|
3
|
$
|
1,420
|
|
$
|
1,371
|
|
||||||||
|
Total
|
35
|
$
|
20,026
|
|
$
|
20,026
|
|
33
|
$
|
27,375
|
|
$
|
27,375
|
|
19
|
$
|
15,406
|
|
$
|
15,699
|
|
||||||||
The specific reserves for the TDRs described above as of
December 31, 2018
,
2017
, and
2016
were
$262 thousand
,
$1.4 million
, and
$1.2 million
, respectively. There were
no
charge offs for TDR modified during the twelve months ended December 31, 2018 and 2017. Charge offs for TDR loans modified during the twelve months ended December 31, 2016 totaled
$4 thousand
.
F-42
HOPE BANCORP, INC. AND SUBSIDIARIES
NOTES TO CONSOLIDATED FINANCIAL STATEMENTS (Continued)
The following table presents loans by class for TDRs that have been modified during the twelve months ended
December 31, 2018
,
2017
, and
2016
, and have subsequently had a payment default during the years ended
December 31, 2018
,
2017
, and
2016
, respectively:
|
For The Years Ended December 31,
|
|||||||||||||||||
|
2018
|
2017
|
2016
|
|||||||||||||||
|
|
Number of
Loans
|
Balance
|
Number of
Loans
|
Balance
|
Number of
Loans |
Balance
|
|||||||||||
|
|
(Dollars in thousands)
|
||||||||||||||||
|
Legacy Loans:
|
|||||||||||||||||
|
Real Estate - Residential
|
—
|
$
|
—
|
|
—
|
$
|
—
|
|
—
|
$
|
—
|
|
|||||
|
Real Estate - Commercial
|
|||||||||||||||||
|
Retail
|
1
|
53
|
|
—
|
—
|
|
—
|
—
|
|
||||||||
|
Hotel & Motel
|
1
|
734
|
|
—
|
—
|
|
—
|
—
|
|
||||||||
|
Gas Station & Car Wash
|
—
|
—
|
|
—
|
—
|
|
—
|
—
|
|
||||||||
|
Mixed Use
|
—
|
—
|
|
—
|
—
|
|
—
|
—
|
|
||||||||
|
Industrial & Warehouse
|
1
|
2,070
|
|
—
|
—
|
|
—
|
—
|
|
||||||||
|
Other
|
1
|
1,215
|
|
—
|
—
|
|
—
|
—
|
|
||||||||
|
Real Estate - Construction
|
—
|
—
|
|
—
|
—
|
|
—
|
—
|
|
||||||||
|
Commercial Business
|
2
|
886
|
|
2
|
178
|
|
4
|
580
|
|
||||||||
|
Trade Finance
|
—
|
—
|
|
—
|
—
|
|
—
|
—
|
|
||||||||
|
Consumer and Other
|
—
|
—
|
|
—
|
—
|
|
—
|
—
|
|
||||||||
|
Subtotal
|
6
|
$
|
4,958
|
|
2
|
$
|
178
|
|
4
|
$
|
580
|
|
|||||
|
Acquired Loans:
|
|||||||||||||||||
|
Real Estate - Residential
|
—
|
—
|
|
—
|
—
|
|
—
|
—
|
|
||||||||
|
Real Estate - Commercial
|
|||||||||||||||||
|
Retail
|
—
|
—
|
|
—
|
—
|
|
—
|
—
|
|
||||||||
|
Hotel & Motel
|
—
|
—
|
|
1
|
482
|
|
—
|
—
|
|
||||||||
|
Mixed Use
|
—
|
—
|
|
—
|
—
|
|
—
|
—
|
|
||||||||
|
Gas Station & Car Wash
|
—
|
—
|
|
—
|
—
|
|
—
|
—
|
|
||||||||
|
Industrial & Warehouse
|
1
|
230
|
|
—
|
—
|
|
—
|
—
|
|
||||||||
|
Other
|
—
|
—
|
|
1
|
2,977
|
|
—
|
—
|
|
||||||||
|
Real Estate - Construction
|
—
|
—
|
|
—
|
—
|
|
—
|
—
|
|
||||||||
|
Commercial Business
|
3
|
189
|
|
1
|
40
|
|
1
|
11
|
|
||||||||
|
Trade Finance
|
—
|
—
|
|
—
|
—
|
|
—
|
—
|
|
||||||||
|
Consumer and Other
|
—
|
—
|
|
—
|
—
|
|
1
|
25
|
|
||||||||
|
Subtotal
|
4
|
$
|
419
|
|
3
|
$
|
3,499
|
|
2
|
$
|
36
|
|
|||||
|
Total
|
10
|
$
|
5,377
|
|
5
|
$
|
3,677
|
|
6
|
$
|
616
|
|
|||||
A loan is considered to be in payment default once it is
30
days contractually past due under the modified terms. The specific reserves for the TDRs described above as of
December 31, 2018
,
2017
, and
2016
were
$131 thousand
,
$60 thousand
, and
$371 thousand
, respectively, and the charge offs for the years ended
December 31, 2018
,
2017
, and
2016
were
$180 thousand
,
$0
, and
$4 thousand
, respectively.
The
six
Legacy Loans that subsequently defaulted in
2018
were modified through payment concession or maturity concession. The payment concessions were comprised of
two
commercial real estate loans totaling
$787 thousand
. The maturity concessions were comprised of
two
commercial real estate loans totaling
$3.3 million
and
two
commercial business loan totaling
$886 thousand
.
The
three
Acquired Loans that subsequently defaulted in
2018
were modified through payment concessions. The payment concessions were comprised of
two
commercial business loan totaling
$189 thousand
and
one
real estate loan totaling
$230 thousand
.
F-43
HOPE BANCORP, INC. AND SUBSIDIARIES
NOTES TO CONSOLIDATED FINANCIAL STATEMENTS (Continued)
The
two
Legacy Loans that subsequently defaulted in 2017 were modified through payment concession or maturity concession. The payment concession was comprised of
one
commercial business loan totaling
$40 thousand
. The maturity concession was comprised of
one
commercial business loan totaling
$138 thousand
.
The
three
Acquired Loans that subsequently defaulted in 2017 were modified through payment concessions or maturity concession. The maturity concession was comprised of
one
commercial business loan totaling
$40 thousand
. There were
two
real
estate loans totaling
$3.5 million
modified through payment concessions.
The
four
Legacy Loans that subsequently defaulted in 2016 were modified through payment concessions or maturity concession. The payment concessions were comprised of
three
commercial business loans totaling
$490 thousand
. The maturity concession was comprised of
one
commercial business loan totaling
$90 thousand
.
The
two
Acquired Loans that subsequently defaulted in 2016 were modified through payment concession or maturity concession. The payment concession was comprised of
one
commercial business loan totaling
$11 thousand
. There was
one
consumer and other loan totaling
$25 thousand
modified through a maturity concession.
Related Party Loans
In the ordinary course of business, the Company enters into loan transactions with certain of its directors or associates of such directors (“Related Parties”). All loans to Related Parties were current as of
December 31, 2018
and
2017
, and the outstanding principal balance as of
December 31, 2018
and
2017
, was
$39.3 million
and
$41.0 million
, respectively. Loans to related parties at
December 31, 2018
consisted of
$38.8 million
in commercial real estate loans and
$531 thousand
in commercial loans. Loans to related parties at
December 31, 2017
consisted of
$40.0 million
in commercial real estate loans and
$1.0 million
in commercial loans. The reduction in related party loans of
$1.7 million
was due to the principal pay-down of existing loans. There
no
new related party loans for 2018 with outstanding balances at December 31, 201, and there were
no
related party loans that were paid off during the year.
F-44
HOPE BANCORP, INC. AND SUBSIDIARIES
NOTES TO CONSOLIDATED FINANCIAL STATEMENTS (Continued)
|
6.
|
GOODWILL AND OTHER INTANGIBLE ASSETS
|
The carrying amount of the Company’s goodwill as of
December 31, 2018
and
2017
was
$464.5 million
. Goodwill represents the excess of the purchase price over the sum of the estimated fair values of the tangible and identifiable intangible assets acquired less the estimated fair value of the liabilities assumed. Goodwill has an indefinite useful life and is evaluated for impairment annually or more frequently if events and circumstances indicate that the asset might be impaired. An impairment loss is recognized to the extent that the carrying amount exceeds the asset’s fair value. Management assessed the qualitative factors related to intangible assets and goodwill and for
2018
to determine whether it was more-likely-than-not that the fair value was less than its carrying amount. Based on the analysis of these factors, management determined that it was more-likely-than-not that intangible assets were not impaired and that the fair value of goodwill exceeded the carrying value and that the two-step goodwill impairment test was not needed. Goodwill is not amortized for book purposes and is not tax deductible.
The following table provides information regarding the amortization of core deposit intangibles at
December 31, 2018
and
2017
:
|
December 31,
|
|||||||||||||||||
|
|
|
2018
|
2017
|
||||||||||||||
|
|
Amortization
Period
|
Gross
Carrying
Amount
|
Accumulated
Amortization
|
Gross
Carrying
Amount
|
Accumulated
Amortization
|
||||||||||||
|
(Dollars in thousands)
|
|||||||||||||||||
|
Core deposit intangibles related to:
|
|||||||||||||||||
|
Center Financial
|
7 years
|
$
|
4,100
|
|
$
|
(4,100
|
)
|
$
|
4,100
|
|
$
|
(3,966
|
)
|
||||
|
Pacific International Bank
|
7 years
|
604
|
|
(579
|
)
|
604
|
|
(534
|
)
|
||||||||
|
Foster Bankshares
|
10 years
|
2,763
|
|
(1,893
|
)
|
2,763
|
|
(1,636
|
)
|
||||||||
|
Wilshire Bancorp
|
10 years
|
18,138
|
|
(4,972
|
)
|
18,138
|
|
(2,946
|
)
|
||||||||
|
Total
|
$
|
25,605
|
|
$
|
(11,544
|
)
|
$
|
25,605
|
|
$
|
(9,082
|
)
|
|||||
Total amortization expense on core deposit intangibles was
$2.5 million
and
$2.7 million
for the years ended
December 31, 2018
and
2017
, respectively. The estimated future amortization expense over the next five years for core deposit intangibles is as follows:
$2.2 million
in
2019
,
$2.1 million
in
2020
,
$2.0 million
in
2021
,
$1.9 million
in
2022
, and
$1.8 million
in
2023
.
In light of the Tax Cuts and Jobs Act that was enacted on December 22, 2017, the Company performed an analysis on its remaining core deposit intangibles to assess the potential impact from the reduction in corporate tax rates on core deposit intangibles. As core deposit intangibles represents the after tax cash flow savings on acquired core deposits, a change in tax rates could potentially result in an impairment to remaining core deposits intangibles. The Company determined that it was more-likely-than-not that the remaining core deposit intangibles were not impaired as a reduction in corporate tax rates would potentially increase after tax cash flows.
F-45
HOPE BANCORP, INC. AND SUBSIDIARIES
NOTES TO CONSOLIDATED FINANCIAL STATEMENTS (Continued)
|
7.
|
PREMISES AND EQUIPMENT
|
The following table provides information regarding the premises and equipment at
December 31, 2018
and
2017
:
|
December 31,
|
|||||||
|
2018
|
2017
|
||||||
|
(Dollars in thousands)
|
|||||||
|
Land
|
$
|
11,244
|
|
$
|
11,244
|
|
|
|
Building and improvements
|
23,350
|
|
23,127
|
|
|||
|
Furniture, fixtures, and equipment
|
28,510
|
|
25,953
|
|
|||
|
Leasehold improvements
|
28,842
|
|
27,018
|
|
|||
|
Vehicles
|
123
|
|
—
|
|
|||
|
Software/License
|
8,628
|
|
8,389
|
|
|||
|
100,697
|
|
95,731
|
|
||||
|
Less: Accumulated depreciation and amortization
|
(46,903
|
)
|
(39,017
|
)
|
|||
|
Total premises and equipment, net
|
$
|
53,794
|
|
$
|
56,714
|
|
|
Depreciation and amortization expense totaled
$9.2 million
,
$9.3 million
, and
$8.1 million
for 2018, 2017, and 2016, respectively. In 2017, the Company sold buildings and land related to
three
former branch locations for total cash proceeds of
$4.9 million
for a net gain of
$808 thousand
. There were no buildings or land sold during the year ended December 31, 2018.
F-46
HOPE BANCORP, INC. AND SUBSIDIARIES
NOTES TO CONSOLIDATED FINANCIAL STATEMENTS (Continued)
|
8.
|
DEPOSITS
|
The aggregate amount of time deposits in denominations of more than $250 thousand at
December 31, 2018
and
2017
, was
$1.77 billion
and
$1.28 billion
, respectively. Included in time deposits of more than $250 thousand were
$300.0 million
in California State Treasurer’s deposits at
December 31, 2018
and
2017
. The California State Treasurer’s deposits are subject to withdrawal based on the State’s periodic evaluations. The Company is required to pledge eligible collateral of at least
110%
of outstanding deposits. At
December 31, 2018
and
2017
, securities with carrying values of approximately
$336.8 million
and
$337.7 million
, respectively, were pledged as collateral for the California State Treasurer’s deposits.
The Company also utilizes brokered deposits as a secondary source of funds. Total brokered deposits at
December 31, 2018
and
December 31, 2017
, totaled
$1.57 billion
and
$797.0 million
, respectively. Brokered deposits at
December 31, 2018
consisted of
$370.4 million
in brokered money market and NOW accounts and
$1.20 billion
in brokered time deposits accounts. Brokered deposits at
December 31, 2017
consisted of
$258.5 million
in brokered money market and NOW accounts and
$538.5 million
in brokered time deposits accounts.
At
December 31, 2018
, the scheduled maturities for time deposits were as follows:
|
December 31, 2018
|
|||
|
(Dollars in thousands)
|
|||
|
Scheduled maturities in:
|
|||
|
2019
|
$
|
5,183,279
|
|
|
2020
|
635,279
|
|
|
|
2021
|
31,059
|
|
|
|
2022
|
1,828
|
|
|
|
2023 and thereafter
|
19,179
|
|
|
|
Total
|
$
|
5,870,624
|
|
The following table presents the maturity schedules of time deposits in amounts of more than $250 thousand as of
December 31, 2018
:
|
|
More than $250,000
|
||
|
(Dollars in thousands)
|
|||
|
Three months or less
|
$
|
571,535
|
|
|
Over three months through six months
|
332,352
|
|
|
|
Over six months through twelve months
|
774,224
|
|
|
|
Over twelve months
|
95,319
|
|
|
|
Total
|
$
|
1,773,430
|
|
Interest expense on deposits for the periods indicated is summarized as follows:
|
Year Ended December 31,
|
|||||||||||
|
|
2018
|
2017
|
2016
|
||||||||
|
|
(Dollars in thousands)
|
||||||||||
|
Money market and NOW
|
$
|
43,252
|
|
$
|
31,856
|
|
$
|
21,136
|
|
||
|
Savings deposits
|
1,889
|
|
1,354
|
|
1,282
|
|
|||||
|
Time deposits
|
89,817
|
|
41,692
|
|
25,673
|
|
|||||
|
Total deposit interest expense
|
$
|
134,958
|
|
$
|
74,902
|
|
$
|
48,091
|
|
||
F-47
HOPE BANCORP, INC. AND SUBSIDIARIES
NOTES TO CONSOLIDATED FINANCIAL STATEMENTS (Continued)
|
9.
|
BORROWINGS
|
The Company maintains a line of credit with the Federal Home Loan Bank (“FHLB”) of San Francisco as a secondary source of funds. The borrowing capacity is limited to the lower of
25%
of the Bank’s total assets or the Bank’s collateral capacity, which was
$3.81 billion
and
$3.54 billion
at
December 31, 2018
and
2017
, respectively. The terms of this credit facility require the Bank to pledge eligible collateral with the FHLB equal to at least
100%
of outstanding advances. The Company also has an unsecured credit facility with the FHLB totaling
$91.0 million
at
December 31, 2018
.
At
December 31, 2018
and December 31, 2017, real estate secured loans with a carrying amount of approximately
$6.01 billion
and
$4.91 billion
, respectively, were pledged at the FHLB for outstanding advances and remaining borrowing capacity. At
December 31, 2018
and
2017
, other than FHLB stock, no securities were pledged as collateral at FHLB. The purchase of FHLB stock is a prerequisite to become a member of the FHLB system, and the Company is required to own a certain amount of FHLB stock based on outstanding borrowings.
At
December 31, 2018
and
2017
, FHLB advances were
$821.3 million
and
$1.16 billion
, and had a weighted average effective interest rate of
1.78%
and
1.63%
, respectively. All of the FHLB advances at December 31, 2018 had fixed interest rates until maturity. FHLB advances at
December 31, 2018
had various maturities through
December 2022
. The effective interest rate on FHLB advances as of
December 31, 2018
ranged between
1.06%
and
2.47%
. At
December 31, 2018
, the Company had a remaining borrowing capacity of
$2.97 billion
.
At
December 31, 2017
, the Company also had
$69.9 million
in overnight federal funds purchased from lines at other banks. There were
no
federal funds purchased from other banks at
December 31, 2018
.
At
December 31, 2018
, the contractual maturities for FHLB advances were as follows:
|
|
December 31, 2018
|
||
|
Scheduled maturities in:
|
(Dollars in thousands)
|
||
|
2019
|
$
|
345,000
|
|
|
2020
|
185,000
|
|
|
|
2021
|
145,000
|
|
|
|
2022
|
145,000
|
|
|
|
Premium on acquired advances - no maturity
|
1,280
|
|
|
|
Total
|
$
|
821,280
|
|
As a member of the Federal Reserve Bank (“FRB”) system, the Bank may also borrow from the FRB of San Francisco. The maximum amount that the Bank may borrow from the FRB’s discount window is up to
95%
of the fair market value of the qualifying loans and securities that are pledged. At
December 31, 2018
, the outstanding principal balance of the qualifying loans pledged at the FRB was
$1.00 billion
and there were
no
investment securities pledged. At December 31, 2018 and December 31, 2017, the total available borrowing capacity at the FRB discount window was
$786.6 million
and
$732.0 million
, respectively. There were
no
borrowings outstanding at the FRB discount window as of December 31, 2018 and December 31, 2017.
F-48
HOPE BANCORP, INC. AND SUBSIDIARIES
NOTES TO CONSOLIDATED FINANCIAL STATEMENTS (Continued)
|
10.
|
SUBORDINATED DEBENTURES AND CONVERTIBLE NOTES
|
At
December 31, 2018
, the Company had
nine
wholly-owned subsidiary grantor trusts that had issued
$126.0 million
of pooled trust preferred securities. Trust preferred securities accrue and pay distributions periodically at specified annual rates as provided in the indentures. The trusts used the net proceeds from the offering to purchase a like amount of subordinated debentures (the “Debentures”) of the Company. The Debentures are the sole assets of the trusts. The Company’s obligations under the subordinated debentures and related documents, taken together, constitute a full and unconditional guarantee by the Company of the obligations of the trusts. The trust preferred securities are mandatorily redeemable upon the maturity of the Debentures, or upon earlier redemption as provided in the indentures. The Company has the right to redeem the Debentures in whole (but not in part) on or after specific dates, at a redemption price specified in the indentures plus any accrued but unpaid interest to the redemption date. The Company also has a right to defer consecutive payments of interest on the debentures for up to
five
years.
The following table is a summary of trust preferred securities and debentures at
December 31, 2018
:
|
Issuance Trust
|
|
Issuance
Date |
|
Trust
Preferred
Security
Amount
|
|
Carrying Value of
Debentures |
|
Rate
Type
|
|
Current
Rate |
|
Maturity
Date |
||||
|
(Dollars in thousands)
|
||||||||||||||||
|
Nara Capital Trust III
|
|
06/05/2003
|
|
$
|
5,000
|
|
|
$
|
5,155
|
|
|
Variable
|
|
5.94%
|
|
06/15/2033
|
|
Nara Statutory Trust IV
|
|
12/22/2003
|
|
5,000
|
|
|
5,155
|
|
|
Variable
|
|
5.29%
|
|
01/07/2034
|
||
|
Nara Statutory Trust V
|
|
12/17/2003
|
|
10,000
|
|
|
10,310
|
|
|
Variable
|
|
5.74%
|
|
12/17/2033
|
||
|
Nara Statutory Trust VI
|
|
03/22/2007
|
|
8,000
|
|
|
8,248
|
|
|
Variable
|
|
4.44%
|
|
06/15/2037
|
||
|
Center Capital Trust I
|
|
12/30/2003
|
|
18,000
|
|
|
14,026
|
|
|
Variable
|
|
5.29%
|
|
01/07/2034
|
||
|
Wilshire Statutory Trust II
|
03/17/2005
|
20,000
|
|
15,526
|
|
Variable
|
4.58%
|
03/17/2035
|
||||||||
|
Wilshire Statutory Trust III
|
09/15/2005
|
15,000
|
|
10,948
|
|
Variable
|
4.19%
|
09/15/2035
|
||||||||
|
Wilshire Statutory Trust IV
|
07/10/2007
|
25,000
|
|
17,758
|
|
Variable
|
4.17%
|
09/15/2037
|
||||||||
|
Saehan Capital Trust I
|
03/30/2007
|
20,000
|
|
14,803
|
|
Variable
|
4.42%
|
06/30/2037
|
||||||||
|
Total
|
|
|
|
$
|
126,000
|
|
|
$
|
101,929
|
|
|
|
|
|
|
|
The Company’s investment in the common trust securities of the issuer trusts of
$3.9 million
at both
December 31, 2018
and
December 31, 2017
, is included in other assets. Although the subordinated debt issued by the trusts are not included as a component of stockholders’ equity in the consolidated statements of financial condition, the debt is treated as capital for regulatory purposes. The trust preferred security debt issuances are includable in Tier 1 capital up to a maximum of
25%
of capital on an aggregate basis. Any amount that exceeds
25%
qualifies as Tier 2 capital.
Convertible Notes
On May 11, 2018, the Company issued
$200 million
aggregate principal amount of
2.00%
convertible senior notes maturing on May 15, 2038 in a private offering to qualified institutional investors under Rule 144A of the Securities Act of 1933. Subsequently on June 7, 2018, an additional
$17.5 million
in convertible notes were issued as part of the initial offering over-allotment option. In total, the Company issued
$217.5 million
in convertible notes during the second quarter of 2018. The convertible notes can be converted to the Company’s share of common stock at a rate of 45.0760 shares per $1,000 principal amount of the notes (equivalent to an initial conversion price of approximately
$22.18
per share of common stock which represents a premium of
22.5%
to the closing stock price on the date of the pricing of the notes). Holders of the convertible notes have the option to convert all or a portion of the notes at any time on or after February 15, 2023. Prior to February 15, 2023, the convertible notes cannot be converted unless under certain specified scenarios. The convertible notes can be called by the Company, in part or in whole, on or after May 20, 2023 for
100%
of the principal amount in cash. Holders of the convertible notes also have the option to repurchase or put the notes on May 15, 2023, May 15, 2028, or May 15, 2033 for
100%
of the principal amount in cash. The convertible notes can be settled in entirely cash, stock, or a combination of stock and cash at the option of the Company.
F-49
HOPE BANCORP, INC. AND SUBSIDIARIES
NOTES TO CONSOLIDATED FINANCIAL STATEMENTS (Continued)
The convertible notes were issued as part of the Company’s plan to repurchase its common stock. On April 26, 2018, the Company’s Board of Directors approved a share repurchase program that authorized the Company to use up to
$100.0 million
of the proceeds from the convertible notes offering to repurchase its common stock. The net proceeds from the offering, after deducting the initial purchaser’s discount, was approximately
$213.2 million
. Of the total net proceeds,
$113.2 million
was down-streamed to the Bank as equity and the remaining
$100.0 million
was allocated for share repurchases. The Company used approximately
$76.0 million
of the allocated
$100.0 million
for share repurchases to repurchase shares of its common stock from purchasers of the convertible notes in privately negotiated transactions at a purchase price per share equal to the
$18.11
per share closing price of the Company’s common stock. Subsequently, the Company repurchased the remaining shares of common stock on the open market. On September 20, 2018, the Company’s Board of Directors approved another share repurchase program that authorized the Company to repurchase up to
$50.0 million
in common stock. As of December 31, 2018, the Company completed all of the authorized share repurchase programs with repurchases totaling
$150.0 million
, or
9.0 million
shares at an average weighted price of
$16.65
.
In accordance with accounting principles, the convertible notes issued by the Company were separated into a debt component and an equity component which represents the stock conversion option. The present value of the convertible notes was calculated based on a discount rate of
4.25%
, which represented the current offering rate for similar types of debt without conversion options. The effective life of the convertible notes was estimated to be
5
years based on the first call and put date. The difference between the principal amount of the notes and the present value was recorded as the convertible note discount and additional paid-in capital. The issuance costs related to the offering were also allocated into a debt component to be capitalized, and an equity component in the same percentage allocation of debt and equity of the convertible note. The value of the convertible note at issuance and carrying value as of December 31, 2018 is presented below:
|
As of December 31, 2018
|
||||||||||||||
|
Amortization/
Capitalization
Period
|
Gross
Carrying Amount |
Accumulated
Amortization / Capitalization |
Carrying Amount
|
|||||||||||
|
(Dollars in thousands)
|
||||||||||||||
|
Convertible notes principal balance
|
$
|
217,500
|
|
$
|
—
|
|
$
|
217,500
|
|
|||||
|
Discount
|
5 years
|
(21,880
|
)
|
2,544
|
|
(19,336
|
)
|
|||||||
|
Issuance costs to be capitalized
|
5 years
|
(4,119
|
)
|
498
|
|
(3,621
|
)
|
|||||||
|
Carrying balance of convertible notes
|
$
|
191,501
|
|
$
|
3,042
|
|
$
|
194,543
|
|
|||||
Interest expense on the convertible notes for the
twelve months ended
December 31, 2018
totaled
$5.8 million
. Interest expense for the Company’s convertible notes includes accrued interest on the convertible note coupon, non-cash interest expense representing the conversion option or note discount, and interest expense from capitalized issuance costs. Non-cash interest expense and issuance cost capitalization expense will only be recorded for the first
five
outstanding years of the convertible notes. Subsequent to May 2023, interest expense on the convertible note will consist of only accrued interest on the coupon.
F-50
HOPE BANCORP, INC. AND SUBSIDIARIES
NOTES TO CONSOLIDATED FINANCIAL STATEMENTS (Continued)
|
11.
|
INCOME TAXES
|
The following presents a summary of income tax provision follows for the years ended December 31:
|
Current
|
Deferred
|
Total
|
|||||||||
|
|
(Dollars in thousands)
|
||||||||||
|
2018
|
|||||||||||
|
Federal
|
$
|
35,401
|
|
$
|
2,336
|
|
$
|
37,737
|
|
||
|
State
|
27,749
|
|
406
|
|
28,155
|
|
|||||
|
$
|
63,150
|
|
$
|
2,742
|
|
$
|
65,892
|
|
|||
|
2017
|
|||||||||||
|
Federal
|
$
|
64,910
|
|
$
|
31,464
|
|
$
|
96,374
|
|
||
|
State
|
24,739
|
|
3,276
|
|
28,015
|
|
|||||
|
$
|
89,649
|
|
$
|
34,740
|
|
$
|
124,389
|
|
|||
|
2016
|
|||||||||||
|
Federal
|
$
|
50,780
|
|
$
|
4,198
|
|
$
|
54,978
|
|
||
|
State
|
20,922
|
|
1,552
|
|
22,474
|
|
|||||
|
$
|
71,702
|
|
$
|
5,750
|
|
$
|
77,452
|
|
|||
On December 22, 2017, the U.S. government enacted comprehensive tax legislation commonly referred to as the Tax Cuts and Jobs Act (“Tax Act”). Among other changes, the Tax Act reduces the U.S. federal corporate tax rate from 35% to 21%. The Company estimated the effects of the Tax Act and recorded a provisional amount increasing income tax expense by
$25.4 million
for the year ended December 31, 2017 in accordance with SEC Staff Accounting Bulletin No. 118 (“SAB 118”). This amount was comprised of the remeasurement of federal net deferred tax assets and impairment of the low-income housing investment, resulting from the permanent reduction in the U.S. statutory corporate tax rate to 21% from 35%. As required by SAB 118, the Company continued to reassess and refine the effects of the Tax Act on its deferred tax amounts during 2018. As a result, the Company recorded an income tax expense of
$442 thousand
during the year ended December 31, 2018. As of December 31, 2018, the Company completed the accounting for the income tax effects of the Tax Act.
A reconciliation of the difference between the federal statutory income tax rate and the effective tax rate is shown in the following table for the years indicated:
|
Year Ended December 31,
|
||||||||
|
2018
|
2017
|
2016
|
||||||
|
Statutory tax rate
|
21.00
|
%
|
35.00
|
%
|
35.00
|
%
|
||
|
State taxes-net of federal tax effect
|
8.56
|
%
|
7.04
|
%
|
7.28
|
%
|
||
|
Rate change - federal and state
|
0.17
|
%
|
9.36
|
%
|
—
|
%
|
||
|
CRA investment tax credit
|
(3.96
|
)%
|
(3.50
|
)%
|
(2.40
|
)%
|
||
|
Bank owned life insurance
|
(0.20
|
)%
|
(0.09
|
)%
|
(0.26
|
)%
|
||
|
Tax exempt municipal bonds and loans
|
(0.21
|
)%
|
(0.45
|
)%
|
(0.22
|
)%
|
||
|
Nondeductible transaction costs
|
—
|
%
|
(0.02
|
)%
|
0.80
|
%
|
||
|
Other
|
0.43
|
%
|
(0.19
|
)%
|
0.31
|
%
|
||
|
Effective income tax rate
|
25.79
|
%
|
47.15
|
%
|
40.51
|
%
|
||
F-51
HOPE BANCORP, INC. AND SUBSIDIARIES
NOTES TO CONSOLIDATED FINANCIAL STATEMENTS (Continued)
Deferred tax assets and liabilities at
December 31, 2018
and
2017
are comprised of the following:
|
At December 31,
|
|||||||
|
2018
|
2017
|
||||||
|
|
(Dollars in thousands)
|
||||||
|
Deferred tax assets:
|
|||||||
|
Purchase accounting fair value adjustment
|
$
|
16,239
|
|
$
|
21,508
|
|
|
|
Statutory bad debt deduction less than financial statement provision
|
22,904
|
|
20,162
|
|
|||
|
Net operating loss carry-forward
|
2,092
|
|
2,351
|
|
|||
|
Investment security provision
|
593
|
|
593
|
|
|||
|
State tax deductions
|
4,240
|
|
4,304
|
|
|||
|
Accrued compensation
|
148
|
|
149
|
|
|||
|
Deferred compensation
|
175
|
|
214
|
|
|||
|
Mark to market on loans held for sale
|
260
|
|
764
|
|
|||
|
Depreciation
|
202
|
|
221
|
|
|||
|
Nonaccrual loan interest
|
6,027
|
|
6,272
|
|
|||
|
Other real estate owned
|
585
|
|
1,753
|
|
|||
|
FDIC loss share receivable
|
—
|
|
362
|
|
|||
|
Unrealized loss on securities available for sale
|
13,631
|
|
8,961
|
|
|||
|
Non-qualified stock option and restricted share expense
|
1,420
|
|
1,339
|
|
|||
|
Goodwill
|
117
|
|
203
|
|
|||
|
Lease expense
|
60
|
|
—
|
|
|||
|
Other
|
2,013
|
|
3,053
|
|
|||
|
Total Deferred Tax Assets
|
$
|
70,706
|
|
$
|
72,209
|
|
|
|
Deferred tax liabilities:
|
|||||||
|
FHLB stock dividends
|
$
|
(617
|
)
|
$
|
(695
|
)
|
|
|
Deferred loan costs
|
(6,816
|
)
|
(5,857
|
)
|
|||
|
State taxes deferred and other
|
(2,655
|
)
|
(3,229
|
)
|
|||
|
Prepaid expenses
|
(1,802
|
)
|
(1,542
|
)
|
|||
|
Amortization of intangibles
|
(4,524
|
)
|
(5,236
|
)
|
|||
|
Lease expense
|
—
|
|
(447
|
)
|
|||
|
Other
|
(3,379
|
)
|
—
|
|
|||
|
Total Deferred Tax Liabilities
|
$
|
(19,793
|
)
|
$
|
(17,006
|
)
|
|
|
Net deferred tax assets:
|
$
|
50,913
|
|
$
|
55,203
|
|
|
Income tax expense is the total of the current year income tax due or refundable and the change in deferred tax assets and liabilities. Deferred tax assets and liabilities are recognized for the future tax consequences attributable to differences between the financial statement carrying amounts of existing assets and liabilities and their respective tax bases and operating loss and tax credit carry forwards. Deferred tax assets and liabilities are measured using enacted tax rates expected to apply to taxable income in the years in which those temporary differences are expected to be recovered or settled. The effect on deferred tax assets and liabilities of a change in tax rates is recognized in income in the period that includes the enactment date.
Deferred tax assets are reduced by a valuation allowance when, in the opinion of management, it is more likely than not that some portion, or all, of the deferred tax asset will not be realized. In assessing the realization of deferred tax assets, management evaluates both positive and negative evidence, including the existence of any cumulative losses in the current year and the prior two years, the amount of taxes paid in available carry-back years, the forecasts of future income, applicable tax planning strategies, and assessments of current and future economic and business conditions. This analysis is updated quarterly and adjusted as necessary.
F-52
HOPE BANCORP, INC. AND SUBSIDIARIES
NOTES TO CONSOLIDATED FINANCIAL STATEMENTS (Continued)
Based on the analysis, the Company has determined that a valuation allowance for deferred tax assets was not required as of
December 31, 2018
and
2017
.
A summary of the Company’s net operating loss carry-forwards is as follows:
|
|
Federal
|
State
|
||||||||||||||||||
|
|
Remaining
Amount
|
Expires
|
Annual
Limitation
|
Remaining
Amount
|
Expires
|
Annual
Limitation
|
||||||||||||||
|
|
(Dollars in thousands)
|
|||||||||||||||||||
|
2018
|
||||||||||||||||||||
|
Saehan Bank (acquired by Wilshire)
|
$
|
2,714
|
|
2030
|
$
|
226
|
|
$
|
2,714
|
|
2030
|
$
|
226
|
|
||||||
|
Korea First Bank of New York
|
494
|
|
2019
|
497
|
|
—
|
|
N/A
|
—
|
|
||||||||||
|
Pacific International Bank
|
5,669
|
|
2032
|
420
|
|
—
|
|
N/A
|
—
|
|
||||||||||
|
Total
|
$
|
8,877
|
|
$
|
1,143
|
|
$
|
2,714
|
|
$
|
226
|
|
||||||||
|
2017
|
||||||||||||||||||||
|
Saehan Bank (acquired by Wilshire)
|
$
|
2,940
|
|
2030
|
$
|
226
|
|
$
|
2,940
|
|
2030
|
$
|
226
|
|
||||||
|
Korea First Bank of New York
|
991
|
|
2019
|
497
|
|
—
|
|
N/A
|
—
|
|
||||||||||
|
Pacific International Bank
|
6,089
|
|
2032
|
420
|
|
—
|
|
N/A
|
—
|
|
||||||||||
|
Total
|
$
|
10,020
|
|
$
|
1,143
|
|
$
|
2,940
|
|
$
|
226
|
|
||||||||
The Company and its subsidiaries are subject to U.S. federal income tax as well as income tax of the state of California and various other states. The statute of limitations for the assessment of taxes for the consolidated Federal income tax return is closed for all tax years up to and including 2014. The expiration of the statute of limitations for the assessment of taxes for the various state income and franchise tax returns for the Company and subsidiaries varies by state. The Company is currently under examination by the California Franchise Tax Board (FTB) for the 2011, 2012 and 2013 tax years. Wilshire Bancorp Inc. is currently under examination by the FTB for the 2011, 2012, and 2013 tax years. While the outcomes of the examinations are unknown, the Company does not expect any material adjustments.
A reconciliation of the beginning and ending amount of unrecognized tax benefits for the years ended
December 31, 2018
and
2017
is as follows:
|
At December 31,
|
|||||||
|
2018
|
2017
|
||||||
|
|
(Dollars in thousands)
|
||||||
|
Balance at January 1,
|
$
|
2,125
|
|
$
|
2,187
|
|
|
|
Additions based on tax positions related to prior years
|
247
|
|
3
|
|
|||
|
Expiration of the statute of limitations for assessment of taxes
|
—
|
|
—
|
|
|||
|
Settlements with taxing authorities
|
(58
|
)
|
(65
|
)
|
|||
|
Balance at December 31,
|
$
|
2,314
|
|
$
|
2,125
|
|
|
The total amount of unrecognized tax benefits was
$2.3 million
at
December 31, 2018
and
$2.1 million
at
December 31, 2017
and is primarily for uncertainties related to California enterprise zone loan interest deductions taken in prior years. The total amount of tax benefits that, if recognized, would favorably impact the effective tax rate was
$2.2 million
and
$1.9 million
at
December 31, 2018
and
2017
, respectively. The Company expects the total amount of unrecognized tax benefits to decrease by
$2.3 million
within the next twelve months due to settlement with the state tax authority.
The Company recognizes interest and penalties related to income tax matters in income tax expense. The Company had approximately
$470 thousand
and
$348 thousand
for interest and penalties accrued at
December 31, 2018
and
2017
, respectively.
F-53
HOPE BANCORP, INC. AND SUBSIDIARIES
NOTES TO CONSOLIDATED FINANCIAL STATEMENTS (Continued)
|
12.
|
STOCK-BASED COMPENSATION
|
The Company has a stock-based incentive plan (the “2016 Plan”) to award equity as a form of compensation. The 2016 Plan, was approved by the Company’s stockholders on September 1, 2016. The 2016 Plan provides for grants of stock options, stock appreciation rights (“SARs”), restricted stock, performance shares, and performance units (sometimes referred to individually or collectively as “awards”) to non-employee directors, employees, and consultants of the Company. Stock options may be either incentive stock options (“ISOs”), as defined in Section 422 of the Internal Revenue Code of 1986, as amended (the “Code”), or nonqualified stock options (“NQSOs”).
The 2016 Plan gives the Company flexibility to (i) attract and retain qualified non-employee directors, executives, other key employees, and consultants with appropriate equity-based awards to; (ii) motivate high levels of performance; (iii) recognize employee contributions to the Company’s success; and (iv) align the interests of the 2016 Plan participants with those of the Company’s stockholders. The plan initially had
2,400,000
shares available for grant to participants. The exercise price for shares under an ISO may not be less than
100%
of fair market value on the date the award is granted under Code Section 422. Similarly, under the terms of the 2016 Plan, the exercise price for SARs and NQSOs may not be less than
100%
of fair market value on the date of grant. Performance units are awarded to a participant at the market price of the Company’s common stock on the date of award (after the lapse of the restriction period and the attainment of the performance criteria). No minimum exercise price is prescribed for performance shares and restricted stock awarded under the 2016 Plan. All options not exercised generally expire
10 years
after the date of grant.
ISOs, SARs and NQSOs have vesting periods of
three
to
five
years and have
10
-year contractual terms. Restricted stock, performance shares, and performance units will be granted with a restriction period of not less than
one
year from the grant date for performance-based awards and not more than
three
years from the grant date for time-based vesting of grants. Compensation expense for awards is recorded over the vesting period
.
The grant date fair value of stock option awards are estimated on the date of grant using the Black-Scholes option valuation model. The expected life (estimated period of time outstanding) of options is estimated using the simplified method. The expected volatility is based on historical volatility for a period equal to the stock option’s expected life. The risk-free rate is based on the U.S. Treasury yield curve in effect at the time of grant.
The Company had another stock-based incentive plan, the 2007 Equity Incentive Plan (“2007 Plan”), which was approved by stockholders in May 2007. Under the terms of this plan, awards cannot be granted under the plan more than
ten years
after the plan adoption date. Therefore, subsequent to May 2017, equity awards can no longer be issued from this plan.
The 2016 plan has
1,111,396
shares available for future grants as of
December 31, 2018
.
The total shares reserved for issuance will serve as the underlying value for all equity awards under the 2016 Plan. With the exception of the shares underlying stock options and restricted stock awards, the board of directors may choose to settle the awards by paying the equivalent cash value or awarding the appropriate number of shares. For the year ended
December 31, 2018
,
277,725
shares of restricted and performance unit awards were granted under the 2016 Plan. The fair value of performance unit awards granted is the fair market value of the Company’s common stock on the date of grant. In
2018
and
2017
, there were
no
stock options granted during the year and in
2016
there were
1,281,552
, options were granted.
The following is a summary of stock option activity under the 2016 Plan for the year ended December 31,
2018
:
|
Number of
Shares
|
Weighted-
Average
Exercise
Price Per
Share
|
Weighted-
Average
Remaining
Contractual
Life (Years)
|
Aggregate
Intrinsic
Value
|
|||||||||
|
Outstanding - January 1, 2018
|
1,075,423
|
|
$
|
15.06
|
|
|||||||
|
Granted
|
—
|
|
—
|
|
||||||||
|
Exercised
|
(57,198
|
)
|
7.88
|
|
$
|
576,396
|
|
|||||
|
Expired
|
(11,594
|
)
|
16.11
|
|
||||||||
|
Forfeited
|
(24,000
|
)
|
17.18
|
|
||||||||
|
Outstanding - December 31, 2018
|
982,631
|
|
$
|
15.41
|
|
6.48
|
$
|
720,633
|
|
|||
|
Options exercisable - December 31, 2018
|
777,621
|
|
$
|
15.01
|
|
6.21
|
$
|
720,633
|
|
|||
For stock options exercised during the year ended
December 31, 2018
, the Company received cash totaling
$451 thousand
and the related tax benefit from the stock option exercises totaled
$944 thousand
.
F-54
HOPE BANCORP, INC. AND SUBSIDIARIES
NOTES TO CONSOLIDATED FINANCIAL STATEMENTS (Continued)
The following is a summary of restricted and performance unit activity under the 2016 Plan for the year ended December 31,
2018
:
|
Number of
Shares
|
Weighted-
Average
Grant
Date Fair
Value
|
|||||
|
Outstanding - January 1, 2018
|
379,419
|
|
$
|
16.50
|
|
|
|
Granted
|
277,725
|
|
16.25
|
|
||
|
Vested
|
(152,887
|
)
|
16.48
|
|
||
|
Forfeited
|
(25,366
|
)
|
16.43
|
|
||
|
Outstanding - December 31, 2018
|
478,891
|
|
$
|
16.37
|
|
|
The total fair value of restricted and performance units vested for the year ended
December 31, 2018
,
2017
, and
2016
was
$2.7 million
,
$2.7 million
, and
$1.9 million
respectively.
The amount charged against income related to stock based payment arrangements was
$3.7 million
,
$3.2 million
, and
$3.0 million
for the years ended
December 31, 2018
,
2017
and
2016
, respectively.
At
December 31, 2018
, unrecognized compensation expense related to non-vested stock option grants and restricted and performance units aggregated
$13.3 million
and is expected to be recognized over a remaining weighted average vesting period of
2.5
years.
The estimated annual stock-based compensation expense as of
December 31, 2018
for each of the succeeding years is indicated in the table below:
|
|
Stock Based
Compensation Expense
|
||
|
|
(Dollars in thousands)
|
||
|
For the year ended December 31:
|
|||
|
2019
|
$
|
5,605
|
|
|
2020
|
5,929
|
|
|
|
2021
|
1,569
|
|
|
|
2022
|
175
|
|
|
|
2023
|
59
|
|
|
|
Total
|
$
|
13,337
|
|
On August 21, 2017, the Company adopted the Hope Employee Stock Purchase Plan (“ESPP”). The ESPP allows eligible employees to purchase the Company’s common shares through payroll deductions which build up between the offering date and the purchase date. At the purchase date, the Company uses the accumulated funds to purchase shares in the Company on behalf of the participating employees at a
10%
discount from the closing price of the Company’s common shares. The closing price is the lower of either the closing price on the first day of the offering period or on the closing price on the purchase date. The dollar amount of common shares purchased under the ESPP must not exceed
20%
of the participating employee’s base salary, subject to a cap of
$25 thousand
in stock value based on the grant date. The ESPP is considered compensatory under GAAP and compensation expense for the ESPP is recognized as part of the Company’s stock based compensation expenses. The compensation expense for ESPP for the year ended December 31, 2018 was
$165 thousand
. The Company did not have any compensation expenses for the ESPP in 2017 or 2016.
F-55
HOPE BANCORP, INC. AND SUBSIDIARIES
NOTES TO CONSOLIDATED FINANCIAL STATEMENTS (Continued)
|
13.
|
EMPLOYEE BENEFIT PLANS
|
Deferred Compensation Plan
— The Company established a deferred compensation plan that permits eligible officers, key executives, and directors to defer a portion of their compensation. The deferred compensation plan is still in effect and was amended in 2007 to be in compliance with the new IRC §409(A) regulations. The deferred compensation, together with accrued accumulated interest, is distributable in cash after retirement or termination of service. The deferred compensation liabilities at
December 31, 2018
and
2017
amounted to
$1.0 million
and
$1.1 million
, respectively, which are included in other liabilities in the consolidated statements of financial condition. Interest expense recognized under the deferred compensation plan totaled
$22 thousand
,
$21 thousand
, and
$23 thousand
for
2018
,
2017
, and
2016
, respectively.
The Company established and the Board approved a Long Term Incentive Plan (“LTIP”) that rewards the named executive officers (“NEO”) with deferred compensation if the Company meets certain performance goals, the NEOs meet individual performance goals, and the NEOs remain employed for a pre-determined period (between
five
and
ten
years, depending on the officer). Only
two
NEOs are currently participating in the LTIP. The Company accrued
$510 thousand
,
$455 thousand
, and
$418 thousand
in
2018
,
2017
, and
2016
, respectively.
The Company has insured the lives of certain officers and directors who participate in the deferred compensation plan. The Company has also purchased life insurance policies and entered into split dollar life insurance agreements with certain directors and officers. Under the terms of the split dollar life insurance agreements, a portion of the death benefits received by the Company will be paid to beneficiaries named by the directors and officers.
401(k) Savings Plan—
The Company established a 401(k) savings plan, which is open to all eligible employees who are
21
years old or over and have completed
three
months of service. The Company matches
75%
of the first
8%
of the employee’s compensation contributed. Employer matching is vested
25%
after 2 years of service,
50%
after 3 years of service,
75%
after 4 years of service, and
100%
after 5 or more years of service. Total employer contributions to the plan amounted to approximately
$5.2 million
,
$4.4 million
and
$2.6 million
for
2018
,
2017
and
2016
, respectively.
Post-Retirement Benefit Plans—
In 2016, the Company assumed Wilshire’s Survivor Income Plan which was adopted in 2003 for the benefit of the directors and officers of the bank in order to encourage their continued employment and service, and to reward them for their past contributions. Wilshire had also entered into separate Survivor Income Agreements with officers and directors relating to the Survivor Income Plan. Under the terms of the Survivor Income Plan, each participant is entitled to a base amount of death proceeds as set forth in the participant’s election to participate, which base amount increases
three
percent per calendar year, but only until normal retirement age, which is 65. If the participant remains employed after age 65, the death benefit will be fixed at the amount determined at age 65. If a participant has attained age 65 prior to becoming a participant in the Survivor Income Plan, the death benefit shall be equal to the base amount set forth in their election to participate with no increases. The Company is obligated to pay any death benefit owed under the Survivor Income Plan in a lump sum within
90 days
following the participant’s death.
In 2011, the Company assumed Center Bank’s Survivor Income Plan which was adopted in 2004 for the benefit of the directors and officers of the bank in order to encourage their continued employment and service, and to reward them for their past contributions. Under the terms of the Survivor Income Plan, each participant is entitled to a base amount of death proceeds as set forth in the participant’s election to participate. The Company is obligated to pay any death benefit owed under the Survivor Income Plan in a lump sum within
90 days
following the participant’s death.
The participant’s rights under the Survivor Income Plans terminate upon termination of employment. Upon termination of employment (except for termination for cause), if the participant has achieved the vesting requirements outlined in the plan, the participant will have the option to convert the amount of death benefits calculated at such termination to a split dollar arrangement, provided such arrangement is available under bank regulations and/or tax laws. If available, the Bank and the participant will enter into a split dollar agreement and a split dollar policy endorsement. Under such an arrangement, the Bank would annually impute income to the officer or the director based on tax laws or rules in force upon conversion. The Company’s accumulated post-retirement benefit obligation at December 31, 2018, 2017, and 2016 was
$6.9 million
,
$7.8 million
, and
$6.6 million
, respectively.
F-56
HOPE BANCORP, INC. AND SUBSIDIARIES
NOTES TO CONSOLIDATED FINANCIAL STATEMENTS (Continued)
|
14.
|
COMMITMENTS AND CONTINGENCIES
|
Lease Commitments
The Company leases its premises under non-cancelable operating leases, and at
December 31, 2018
, the future minimum rental commitments under these leases are as follows:
|
December 31, 2018
|
|||
|
(Dollars in thousands)
|
|||
|
2019
|
$
|
14,968
|
|
|
2020
|
13,008
|
|
|
|
2021
|
12,090
|
|
|
|
2022
|
7,964
|
|
|
|
2023
|
5,788
|
|
|
|
Thereafter
|
19,338
|
|
|
|
$
|
73,156
|
|
|
Operating lease expense recorded under such leases in
2018
,
2017
, and
2016
amounted to approximately
$19.6 million
,
$17.8 million
, and
$14.7 million
, respectively.
Legal Contingencies
In the normal course of business, the Company is involved in various legal claims. The Company has reviewed all legal claims against the Company with counsel for the fiscal year ended
December 31, 2018
and has taken into consideration the views of such counsel as to the outcome of the claims. Accrued loss contingencies for all legal claims totaled approximately
$755 thousand
and
$414 thousand
at
December 31, 2018
and
December 31, 2017
, respectively. It is reasonably possible the Company may incur losses in addition to the amounts the Company has accrued. However, at this time, the Company is unable to estimate the range of additional losses that are reasonably possible because of a number of factors, including the fact that certain of these litigation matters are still in their early stages and involve claims for which, at this point, the Company believes have little to no merit. The Company has considered these and other possible loss contingencies and does not expect the amounts to be material to any of the consolidated financial statements.
Unfunded Commitments and Letters of Credit
The Company is a party to financial instruments with off-balance-sheet risk in the normal course of business to meet the financing needs of its customers. These financial instruments include commitments to extend credit, standby letters of credit and other commercial letters of credit. These instruments involve, to varying degrees, elements of credit and interest rate risk in excess of the amount recognized in the consolidated statements of financial condition. The Company’s exposure to credit loss in the event of nonperformance by the other party to commitments to extend credit and standby letters of credit and other commercial letters of credit is represented by the contractual notional amount of those instruments. The Company uses the same credit policies in making commitments and conditional obligations as it does for extending loan facilities to customers. The Company evaluates each customer’s creditworthiness on a case-by-case basis. The amount of collateral obtained, if deemed necessary by the Company upon extension of credit, is based on management’s credit evaluation of the counterparty. Collateral held varies but may include accounts receivable; inventory; property, plant and equipment; and income-producing properties.
Commitments at
December 31, 2018
and
2017
are summarized as follows:
|
December 31,
|
|||||||
|
2018
|
2017
|
||||||
|
|
(Dollars in thousands)
|
||||||
|
Commitments to Fund Low Income Housing Partnership Investments
|
$
|
46,507
|
|
$
|
38,467
|
|
|
|
Unused Credit Extensions
|
1,712,032
|
|
1,526,981
|
|
|||
|
Standby Letters of Credit
|
69,763
|
|
74,748
|
|
|||
|
Other Commercial Letters of Credit
|
65,822
|
|
74,147
|
|
|||
|
$
|
1,894,124
|
|
$
|
1,714,343
|
|
||
F-57
HOPE BANCORP, INC. AND SUBSIDIARIES
NOTES TO CONSOLIDATED FINANCIAL STATEMENTS (Continued)
Commitments and letters of credit generally have variable rates that are tied to the prime rate. The amount of fixed rate commitments is not considered material to this presentation. From time to time, the Company enters into certain types of contracts that contingently require the Company to indemnify parties against third party claims and other obligations customarily indemnified in the ordinary course of the Company’s business. The terms of such obligations vary, and, generally, a maximum obligation is not explicitly stated. Therefore, the overall maximum amount of the obligations cannot be reasonably estimated. The most significant of these contracts relate to certain agreements with the Company’s officers and directors under which the Company may be required to indemnify such persons for liabilities arising out of their employment relationship. Historically, the Company has not been obligated to make significant payments for these obligations, and no liabilities have been recorded for these obligations in its consolidated statements of financial condition as of
December 31, 2018
and
2017
.
Mortgage-Banking Derivatives
The Company enters into various stand-alone mortgage-banking derivatives in order to hedge the risk associated with the fluctuation of interest rates. Changes in fair value are recorded as mortgage banking revenue. Residential mortgage loans funded with interest rate lock commitments and forward commitments for the future delivery of mortgage loans to third party investors are considered derivatives. At
December 31, 2018
, the Company had approximately
$874 thousand
in interest rate lock commitments and
$874 thousand
in total forward sales commitments for the future delivery of residential mortgage loans. At
December 31, 2017
, the Company had approximately
$4.8 million
in interest rate lock commitments and
$4.8 million
in total forward sales commitments.
F-58
HOPE BANCORP, INC. AND SUBSIDIARIES
NOTES TO CONSOLIDATED FINANCIAL STATEMENTS (Continued)
|
15.
|
FAIR VALUE MEASUREMENTS
|
Fair value is defined as the exchange price that would be received to sell an asset or paid to transfer a liability in an orderly transaction between market participants at the measurement date reflecting assumptions that a market participant would use when pricing an asset or liability. There are three levels of inputs that may be used to measure fair value. The fair value inputs of the instruments are classified and disclosed in one of the following categories pursuant to ASC 820:
Level 1 - Unadjusted quoted prices in active markets for identical assets or liabilities that the reporting entity has the ability to access at the measurement date. The quoted price shall not be adjusted for any blockage factor (i.e., size of the position relative to trading volume).
Level 2 - Pricing inputs are inputs other than quoted prices included within Level 1 that are observable for the asset or liability, either directly or indirectly. Fair value is determined through the use of models or other valuation methodologies, including the use of pricing matrices. If the asset or liability has a specified (contractual) term, a Level 2 input must be observable for substantially the full term of the asset or liability.
Level 3 - Pricing inputs are unobservable for the asset or liability. Unobservable inputs are used to measure fair value to the extent that observable inputs are not available, thereby allowing for situations in which there is little, if any, market activity for the asset or liability at the measurement date. The inputs into the determination of fair value require significant management judgment or estimation.
In certain cases, the inputs used to measure fair value may fall into different levels of the fair value hierarchy. In such cases, an asset’s or liability’s level within the fair value hierarchy is based on the lowest level of input that is significant to the fair value measurement. The Company’s assessment of the significance of a particular input to the fair value measurement in its entirety requires judgment and considers factors specific to the asset or liability.
The Company uses the following methods and assumptions in estimating fair value disclosures for financial instruments. Financial assets and liabilities recorded at fair value on a recurring and non-recurring basis are listed as follows:
Securities Available for Sale
The fair values of securities available for sale are determined by obtaining quoted prices on nationally recognized securities exchanges (Level 1 inputs) or matrix pricing, which is a technique widely used in the industry to value debt securities without relying exclusively on quoted prices for the specific securities but rather by relying on the securities’ relationship to other benchmark quoted securities (Level 2 inputs).
The fair values of the Company’s Level 3 securities available for sale were measured using an income approach valuation technique. The primary inputs and assumptions used in the fair value measurement were derived from the securities’ underlying collateral which included discount rates, prepayment speeds, payment delays, and an assessment of the risk of default of the underlying collateral, among other factors. Significant increases or decreases in any of the inputs or assumptions would result in a significant increase or decrease in the fair value measurement.
Equity Investments With Readily Determinable Fair Value
The fair value of the Company’s equity investments with readily determinable fair value is comprised of mutual funds and equity stock. The fair value for these investments is obtained from unadjusted quoted prices in active markets on the date of measurement and is therefore classified as Level 1.
Interest Rate Swaps
The Company offers interest rate swaps to certain loan customers to allow them to hedge the risk of rising interest rates on their variable rate loans. The Company originates a variable rate loan and enters into a variable-to-fixed interest rate swap with the customer. The Company also enters into an offsetting swap with a correspondent bank. These back-to-back agreements are intended to offset each other and allow the Company to originate a variable rate loan, while providing a contract for fixed interest payments for the customer. The net cash flow for the Company is equal to the interest income received from a variable rate loan originated with the customer. The fair value of these derivatives is based on a discounted cash flow approach. Due to the observable nature of the inputs used in deriving the fair value of these derivative contracts, the valuation of interest rate swaps is classified as Level 2.
Mortgage Banking Derivatives
Mortgage banking derivative instruments consist of interest rate lock commitments and forward sale contracts that trade in liquid markets. The fair value is based on the prices available from third party investors. Due to the observable nature of the inputs used in deriving the fair value, the valuation of mortgage banking derivatives are classified as Level 2.
F-59
HOPE BANCORP, INC. AND SUBSIDIARIES
NOTES TO CONSOLIDATED FINANCIAL STATEMENTS (Continued)
Impaired Loans
The fair values of impaired loans are generally measured for impairment using the practical expedients permitted by FASB ASC 310-10-35 including impaired loans measured at an observable market price (if available), or at the fair value of the loan’s collateral (if the loan is collateral dependent). Fair value of the loan’s collateral, when the loan is dependent on collateral, is determined by appraisals or independent valuation, less costs to sell of
8.5%
. Appraisals may utilize a single valuation approach or a combination of approaches including comparable sales and income approach. Adjustment may be made in the appraisal process by the independent appraiser to adjust for differences between the comparable sales and income data available for similar loans and the underlying collateral. For commercial and industrial and asset backed loans, independent valuations may include a
20
-
60%
discount for accounts receivable and a
50
-
70%
discount for inventory. These result in a Level 3 classification.
OREO
OREO is fair valued at the time the loan is foreclosed upon and the asset is transferred to OREO. The value is based primarily on third party appraisals, less costs to sell of
8.5%
and result in a Level 3 classification of the inputs for determining fair value. OREO is reviewed and evaluated on at least an annual basis for additional impairment and adjusted to lower of cost or market accordingly, based on the same factors identified above.
Loans Held for Sale
Loans held for sale are carried at the lower of cost or fair value, as determined by outstanding commitments from investors, or based on recent comparable sales (Level 2 inputs), if available, and if not available, are based on discounted cash flows using current market rates applied to the estimated life and credit risk (Level 3 inputs) or may be assessed based upon the fair value of the collateral which is obtained from recent real estate appraisals (Level 3 inputs). These appraisals may utilize a single valuation approach or a combination of approaches including the income approach. Adjustments are routinely made in the appraisal process by the appraisers to adjust for differences between the comparable sales and income data available. Such adjustments are typically significant and result in Level 3 classification of the inputs for determining fair value.
Assets and liabilities measured at fair value on a recurring basis are summarized below:
|
|
|
|
Fair Value Measurements at the End of the Reporting Period Using
|
||||||||||||
|
|
December 31, 2018
|
|
Quoted Prices
in Active Markets for Identical Assets (Level 1) |
|
Significant
Other
Observable
Inputs
(Level 2)
|
|
Significant
Unobservable
Inputs
(Level 3)
|
||||||||
|
|
(Dollars in thousands)
|
||||||||||||||
|
Assets:
|
|
|
|
|
|
|
|
||||||||
|
Securities available for sale:
|
|
|
|
|
|
|
|
||||||||
|
U.S. Government agency and U.S.
Government sponsored enterprises:
|
|||||||||||||||
|
Collateralized mortgage obligations
|
$
|
895,122
|
|
|
$
|
—
|
|
|
$
|
895,122
|
|
|
$
|
—
|
|
|
Mortgage-backed securities:
|
|||||||||||||||
|
Residential
|
402,605
|
|
—
|
|
402,605
|
|
—
|
|
|||||||
|
Commercial
|
469,126
|
|
—
|
|
469,126
|
|
—
|
|
|||||||
|
Corporate securities
|
3,826
|
|
|
—
|
|
|
3,826
|
|
|
—
|
|
||||
|
Municipal securities
|
75,586
|
|
|
—
|
|
|
74,527
|
|
|
1,059
|
|
||||
|
Equity investments with readily determinable fair value
|
23,405
|
|
|
23,405
|
|
|
—
|
|
|
—
|
|
||||
|
Interest rate swaps
|
7,059
|
|
—
|
|
7,059
|
|
—
|
|
|||||||
|
Mortgage banking derivatives
|
10
|
|
—
|
|
10
|
|
—
|
|
|||||||
|
Liabilities:
|
|||||||||||||||
|
Interest rate swaps
|
7,059
|
|
—
|
|
7,059
|
|
—
|
|
|||||||
|
Mortgage banking derivatives
|
3
|
|
—
|
|
3
|
|
—
|
|
|||||||
F-60
HOPE BANCORP, INC. AND SUBSIDIARIES
NOTES TO CONSOLIDATED FINANCIAL STATEMENTS (Continued)
|
|
|
Fair Value Measurements at the End of the Reporting Period Using
|
|||||||||||||
|
|
December 31, 2017
|
Quoted Prices
in Active
Markets for
Identical Assets
(Level 1)
|
Significant
Other
Observable
Inputs
(Level 2)
|
Significant
Unobservable
Inputs
(Level 3)
|
|||||||||||
|
|
(Dollars in thousands)
|
||||||||||||||
|
Assets:
|
|||||||||||||||
|
Securities available for sale:
|
|||||||||||||||
|
U.S. Government agency and U.S.
Government sponsored enterprises:
|
|||||||||||||||
|
Collateralized mortgage obligations
|
$
|
838,709
|
|
$
|
—
|
|
$
|
838,709
|
|
$
|
—
|
|
|||
|
Mortgage-backed securities:
|
|||||||||||||||
|
Residential
|
471,214
|
|
—
|
|
471,214
|
|
|
|
|||||||
|
Commercial
|
301,365
|
|
—
|
|
301,365
|
|
|
|
|||||||
|
Corporate securities
|
4,475
|
|
—
|
|
4,475
|
|
—
|
|
|||||||
|
Municipal securities
|
82,537
|
|
—
|
|
81,429
|
|
1,108
|
|
|||||||
|
Mutual funds
|
21,957
|
|
21,957
|
|
—
|
|
—
|
|
|||||||
|
Interest rate swaps
|
4,506
|
|
—
|
|
4,506
|
|
—
|
|
|||||||
|
Mortgage banking derivatives
|
33
|
|
—
|
|
33
|
|
—
|
|
|||||||
|
Liabilities:
|
|||||||||||||||
|
Interest rate swaps
|
4,506
|
|
—
|
|
4,506
|
|
—
|
|
|||||||
|
Mortgage banking derivatives
|
5
|
|
—
|
|
5
|
|
—
|
|
|||||||
There were
no
transfers between Level 1, 2, and 3 during the period ended
December 31, 2018
and
2017
.
F-61
HOPE BANCORP, INC. AND SUBSIDIARIES
NOTES TO CONSOLIDATED FINANCIAL STATEMENTS (Continued)
The table below presents a reconciliation and income statement classification of gains and losses for all assets measured at fair value on a recurring basis using significant unobservable inputs (Level 3) for the year ended
December 31, 2018
and
2017
:
|
For the year ended December 31,
|
||||||||
|
2018
|
2017
|
|||||||
|
(Dollars in thousands)
|
||||||||
|
Beginning Balance, January 1
|
$
|
1,108
|
|
$
|
1,139
|
|
||
|
Total losses included in other comprehensive income
|
(49
|
)
|
(31
|
)
|
||||
|
Ending Balance, December 31
|
$
|
1,059
|
|
$
|
1,108
|
|
||
The Company measures certain assets at fair value on a non-recurring basis including impaired loans (excluding PCI loans), loans held for sale, and OREO. These fair value adjustments result from impairments recognized during the period, application of the lower of cost or fair value on loans held for sale, and the application of fair value less cost to sell on OREO. Assets measured at fair value on a non-recurring basis at
December 31, 2018
and
2017
are summarized below:
|
|
|
|
Fair Value Measurements at the End of the
Reporting Period Using
|
||||||||||||
|
|
December 31, 2018
|
|
Quoted Prices
in Active Markets for Identical Assets (Level 1) |
|
Significant
Other Observable Inputs (Level 2) |
|
Significant
Unobservable Inputs (Level 3) |
||||||||
|
|
(Dollars in thousands)
|
||||||||||||||
|
Assets:
|
|||||||||||||||
|
Impaired loans at fair value:
|
|||||||||||||||
|
Real estate loans
|
$
|
9,379
|
|
|
$
|
—
|
|
|
$
|
—
|
|
|
$
|
9,379
|
|
|
Commercial business
|
9,951
|
|
|
—
|
|
|
—
|
|
|
9,951
|
|
||||
|
Consumer
|
66
|
|
—
|
|
—
|
|
66
|
|
|||||||
|
Other real estate owned
|
5,659
|
|
|
—
|
|
|
—
|
|
|
5,659
|
|
||||
|
|
|
Fair Value Measurements at the End of the
Reporting Period Using
|
|||||||||||||
|
|
December 31, 2017
|
Quoted Prices
in Active
Markets for
Identical Assets
(Level 1)
|
Significant
Other
Observable
Inputs
(Level 2)
|
Significant
Unobservable
Inputs
(Level 3)
|
|||||||||||
|
|
(Dollars in thousands)
|
||||||||||||||
|
Assets:
|
|||||||||||||||
|
Impaired loans at fair value:
|
|||||||||||||||
|
Real estate loans
|
$
|
6,086
|
|
$
|
—
|
|
$
|
—
|
|
$
|
6,086
|
|
|||
|
Commercial business
|
3,320
|
|
—
|
|
—
|
|
3,320
|
|
|||||||
|
Consumer
|
84
|
|
—
|
|
—
|
|
84
|
|
|||||||
|
Other real estate owned
|
5,615
|
|
—
|
|
—
|
|
5,615
|
|
|||||||
For assets measured at fair value on a non-recurring basis, the total net (losses) gains which include charge offs, recoveries, specific reserves, and gains and losses on sales recognized in
2018
and
2017
are summarized below:
F-62
HOPE BANCORP, INC. AND SUBSIDIARIES
NOTES TO CONSOLIDATED FINANCIAL STATEMENTS (Continued)
|
|
Year Ended December 31,
|
||||||
|
|
2018
|
2017
|
|||||
|
(Dollars in thousands)
|
|||||||
|
Assets:
|
|||||||
|
Impaired loans at fair value:
|
|||||||
|
Real estate loans
|
$
|
(4,511
|
)
|
$
|
(2,552
|
)
|
|
|
Commercial business
|
(322
|
)
|
(5,424
|
)
|
|||
|
Trade finance
|
(364
|
)
|
(1,187
|
)
|
|||
|
Consumer
|
(1,155
|
)
|
(912
|
)
|
|||
|
Loans held for sale, net
|
—
|
|
12
|
|
|||
|
Other real estate owned
|
823
|
|
(1,962
|
)
|
|||
F-63
HOPE BANCORP, INC. AND SUBSIDIARIES
NOTES TO CONSOLIDATED FINANCIAL STATEMENTS (Continued)
Fair Value of Financial Instruments
Carrying amounts and estimated fair values of financial instruments, not previously presented, at
December 31, 2018
and
December 31, 2017
were as follows:
|
|
December 31, 2018
|
||||||||
|
|
Carrying
Amount
|
|
Estimated
Fair Value
|
Fair Value Measurement
|
|||||
|
|
(Dollars in thousands)
|
||||||||
|
Financial Assets:
|
|||||||||
|
Cash and cash equivalents
|
$
|
459,606
|
|
|
$
|
459,606
|
|
Level 1
|
|
|
Interest bearing deposits in other financial institutions
|
29,409
|
|
29,374
|
|
Level 2/3
|
||||
|
Equity investments without readily determinable fair values
|
26,430
|
|
26,430
|
|
Level 2
|
||||
|
Loans held for sale
|
25,128
|
|
|
25,943
|
|
Level 2
|
|||
|
Loans receivable—net
|
12,005,558
|
|
|
11,913,906
|
|
Level 3
|
|||
|
FHLB stock
|
25,461
|
|
N/A
|
|
N/A
|
||||
|
Accrued interest receivable
|
32,225
|
|
32,225
|
|
Level 2/3
|
||||
|
Servicing assets, net
|
23,132
|
|
24,762
|
|
Level 3
|
||||
|
Customers’ liabilities on acceptances
|
2,281
|
|
|
2,281
|
|
Level 2
|
|||
|
Financial Liabilities:
|
|||||||||
|
Noninterest bearing deposits
|
$
|
3,022,633
|
|
|
$
|
3,022,633
|
|
Level 2
|
|
|
Saving and other interest bearing demand deposits
|
3,262,399
|
|
|
3,262,399
|
|
Level 2
|
|||
|
Time deposits
|
5,870,624
|
|
|
5,889,030
|
|
Level 2
|
|||
|
FHLB advances
|
821,280
|
|
|
810,812
|
|
Level 2
|
|||
|
Convertible debt
|
194,543
|
|
180,525
|
|
Level 1
|
||||
|
Subordinated debentures
|
101,929
|
|
|
116,542
|
|
Level 2
|
|||
|
Accrued interest payable
|
31,374
|
|
31,374
|
|
Level 2
|
||||
|
Acceptances outstanding
|
2,281
|
|
|
2,281
|
|
Level 2
|
|||
|
|
December 31, 2017
|
||||||||
|
|
Carrying
Amount |
|
Estimated
Fair Value |
Fair Value Measurement
|
|||||
|
|
(Dollars in thousands)
|
||||||||
|
Financial Assets:
|
|||||||||
|
Cash and cash equivalents
|
$
|
492,000
|
|
|
$
|
492,000
|
|
Level 1
|
|
|
Interest bearing deposits in other financial institutions
and other investments |
53,366
|
|
|
52,960
|
|
Level 2/3
|
|||
|
Loans held for sale
|
29,661
|
|
|
32,048
|
|
Level 2
|
|||
|
Loans receivable—net
|
11,018,034
|
|
|
11,112,179
|
|
Level 3
|
|||
|
FHLB stock
|
29,776
|
|
|
N/A
|
|
N/A
|
|||
|
Accrued interest receivable
|
29,979
|
|
29,979
|
|
Level 2/3
|
||||
|
Servicing assets, net
|
24,710
|
|
27,511
|
|
Level 3
|
||||
|
Customers’ liabilities on acceptances
|
1,691
|
|
|
1,691
|
|
Level 2
|
|||
|
Financial Liabilities:
|
|||||||||
|
Noninterest bearing deposits
|
$
|
2,998,734
|
|
|
$
|
2,998,734
|
|
Level 2
|
|
|
Saving and other interest bearing demand deposits
|
3,573,212
|
|
|
3,573,212
|
|
Level 2
|
|||
|
Time deposits
|
4,274,663
|
|
|
4,263,585
|
|
Level 2
|
|||
|
FHLB advances
|
1,157,693
|
|
|
1,220,529
|
|
Level 2
|
|||
|
Federal funds purchased
|
69,900
|
|
69,900
|
|
Level 2
|
||||
|
Subordinated debentures
|
100,853
|
|
|
100,853
|
|
Level 2
|
|||
|
Accrued interest payable
|
15,961
|
|
15,961
|
|
Level 2
|
||||
|
Acceptances outstanding
|
1,691
|
|
|
1,691
|
|
Level 2
|
|||
F-64
HOPE BANCORP, INC. AND SUBSIDIARIES
NOTES TO CONSOLIDATED FINANCIAL STATEMENTS (Continued)
During the first quarter of 2018, the Company adopted ASU 2016-01, “
Financial Instruments-Overall: Recognition and Measurement of Financial Assets and Financial Liabilities
.” Among other things, the guidance requires the Company to base their fair value disclosures for financial instruments that are not measured at fair value in the financial statements on the exit price notion as opposed to an entry pricing notion. As of December 31, 2017, the Company used the entry prices to measure the fair value of certain assets and liabilities including loans, deposits, and subordinated debentures as permitted by ASC 820-10. However, upon adoption of ASU 2016-01, the Company began measuring these assets and liabilities based on the exit price notion. Although the exit price notion represents the value that would be received to sell an asset or paid to transfer a liability, the actual price received for a sale of assets or paid to transfer liabilities could be different from exit price disclosed.
The methods and assumptions used to estimate fair value are described as follows:
The carrying amount is the estimated fair value for cash and cash equivalents, savings and other interest bearing demand deposits, equity investments without readily determinable fair values, customer’s and Bank’s liabilities on acceptances, noninterest bearing deposits, short-term debt, secured borrowings and variable rate loans or deposits that reprice frequently and fully. For loans the fair value is determined through a discounted cash flow analysis which incorporates probability of default and loss given default rates on an individual loan basis. The discount rate is based on the LIBOR Swap Rate for fixed rate loans, while variable loans start with the corresponding index rate and an adjustment was made on certain loans which considered factors such as servicing costs, capital charges, duration, asset type incremental costs, and use of projected cash flows. Residential real estate loans fair values included Fannie Mae and Freddie Mac prepayment speed assumptions or a third party index based on historical prepayment speeds. Fair value of time deposits is based discounted cash flow analysis using recent issuance rates over the prior three months and a market rate analysis of recent offering rates for retail products. Wholesale time deposits fair values incorporated brokered time deposit offering rates. The fair value of the Company’s debt is based on current rates for similar financing. Fair value for the Company’s convertible notes is based on the actual last traded price of the notes. It was not practicable to determine the fair value of FHLB stock due to restrictions placed on their transferability. The fair value of commitments to fund loans represents fees currently charged to enter into similar agreements with similar remaining maturities and is not presented herein. The fair value of these financial instruments is not material to the consolidated financial statements.
F-65
HOPE BANCORP, INC. AND SUBSIDIARIES
NOTES TO CONSOLIDATED FINANCIAL STATEMENTS (Continued)
|
16.
|
DERIVATIVE FINANCIAL INSTRUMENTS
|
The Company offers a loan hedging program to certain loan customers. Through this program, the Company originates a variable rate loan with the customer. The Company and the customer will then enter into a fixed interest rate swap. Lastly, an identical offsetting swap is entered into by the Company with a correspondent bank. These “back-to-back” swap arrangements are intended to offset each other and allow the Company to book a variable rate loan, while providing the customer with a contract for fixed interest payments. In these arrangements, the Company’s net cash flow is equal to the interest income received from the variable rate loan originated with the customer. These customer swaps are not designated as hedging instruments and are recorded at fair value in other assets and other liabilities. The changes in fair value are recognized in the income statement in other income and fees.
At December 31, 2018 and 2017, the following interest rate swaps related to the Company’s loan hedging program were outstanding:
|
December 31, 2018
|
December 31, 2017
|
|||||||
|
(Dollars in thousands)
|
||||||||
|
Interest rate swaps on loans with correspondent banks
(included in other assets)
|
||||||||
|
Notional amount
|
$
|
36,972
|
|
$
|
103,363
|
|
||
|
Weighted average remaining term (years)
|
6.4
|
|
8.2
|
|
||||
|
Received fixed rate (weighted average)
|
5.12
|
%
|
4.57
|
%
|
||||
|
Pay variable rate (weighted average)
|
4.56
|
%
|
3.63
|
%
|
||||
|
Estimated fair value
|
$
|
868
|
|
$
|
834
|
|
||
|
Interest rate swaps on loans with correspondent banks
(included in other liabilities)
|
||||||||
|
Notional amount
|
$
|
237,916
|
|
$
|
170,794
|
|
||
|
Weighted average remaining term (years)
|
6.8
|
|
6.7
|
|
||||
|
Received variable rate (weighted average)
|
4.36
|
%
|
4.20
|
%
|
||||
|
Pay fixed rate (weighted average)
|
4.69
|
%
|
3.80
|
%
|
||||
|
Estimated fair value
|
$
|
6,191
|
|
$
|
3,672
|
|
||
|
Back to back interest rate swaps with loan customers
(included in other liabilities)
|
||||||||
|
Notional amount
|
$
|
36,972
|
|
$
|
103,363
|
|
||
|
Weighted average remaining term (years)
|
6.4
|
|
8.2
|
|
||||
|
Received fixed rate (weighted average)
|
4.56
|
%
|
3.63
|
%
|
||||
|
Pay variable rate (weighted average)
|
5.12
|
%
|
4.57
|
%
|
||||
|
Estimated fair value
|
$
|
868
|
|
$
|
834
|
|
||
|
Back to back interest rate swaps with loan customers
(included in other assets)
|
||||||||
|
Notional amount
|
$
|
237,916
|
|
$
|
170,794
|
|
||
|
Weighted average remaining term (years)
|
6.8
|
|
6.7
|
|
||||
|
Received variable rate (weighted average)
|
4.69
|
%
|
3.80
|
%
|
||||
|
Pay fixed rate (weighted average)
|
4.36
|
%
|
4.20
|
%
|
||||
|
Estimated fair value
|
$
|
6,191
|
|
$
|
3,672
|
|
||
F-66
HOPE BANCORP, INC. AND SUBSIDIARIES
NOTES TO CONSOLIDATED FINANCIAL STATEMENTS (Continued)
The Company enters into various stand-alone mortgage-banking derivatives in order to hedge the risk associated with the fluctuation of interest rates. Changes in fair value are recorded as mortgage banking revenue. Residential mortgage loans funded with interest rate lock commitments and forward commitments for the future delivery of mortgage loans to third party investors are considered derivatives. At
December 31, 2018
and
December 31, 2017
, the Company had approximately
$874 thousand
and
$4.8 million
in interest rate lock commitments, respectively, and
$874 thousand
and
$4.8 million
, respectively, in total forward sales commitments for the future delivery of residential mortgage loans.
The following table reflects the notional amount and fair value of mortgage banking derivatives for the dates indicated:
|
December 31, 2018
|
December 31, 2017
|
||||||||||||||
|
Notional Amount
|
Fair Value
|
Notional Amount
|
Fair Value
|
||||||||||||
|
(Dollars in thousands)
|
|||||||||||||||
|
Assets:
|
|||||||||||||||
|
Interest rate lock commitments
|
$
|
874
|
|
$
|
10
|
|
$
|
4,795
|
|
$
|
25
|
|
|||
|
Forward sale contracts related to mortgage banking:
|
$
|
—
|
|
$
|
—
|
|
$
|
2,452
|
|
$
|
8
|
|
|||
|
Liabilities:
|
|||||||||||||||
|
Interest rate lock commitments
|
$
|
—
|
|
$
|
—
|
|
$
|
—
|
|
$
|
—
|
|
|||
|
Forward sale contracts related to mortgage banking:
|
$
|
874
|
|
$
|
3
|
|
$
|
2,343
|
|
$
|
5
|
|
|||
F-67
HOPE BANCORP, INC. AND SUBSIDIARIES
NOTES TO CONSOLIDATED FINANCIAL STATEMENTS (Continued)
|
17.
|
STOCKHOLDERS’ EQUITY
|
Total stockholders’ equity at
December 31, 2018
was
$1.90 billion
, compared to
$1.93 billion
at
December 31, 2017
.
During the second quarter of 2018, the Company recorded
$21.4 million
in additional paid-in capital from the convertible notes issued. The
$21.4 million
included
$21.9 million
for the equity component of the convertible notes offset by
$461 thousand
in issuance costs from the convertible notes that was allocated to equity. The Company also recorded a tax adjustment on the equity component of the convertible notes reducing additional paid-in capital by
$6.4 million
.
On April 26, 2018, the Company’s Board of Directors approved a share repurchase program that authorized the Company to repurchase up to
$100.0 million
in common stock. During the second and third quarter of 2018, the Company repurchased
5,565,696
shares of common stock totaling
$100.0 million
as part of the share repurchase program which was recorded as treasury stock. On September 20, 2018, the Company’s Board of Directors approved another approved another share repurchase program that authorizes the Company to repurchase an additional
$50 million
of its common stock. During the fourth quarter of 2018, the Company repurchased
3,436,757
shares of common stock totaling
$50.0 million
as part of the second share repurchase program which was recorded as treasury stock. Altogether the Company repurchased
$150.0 million
in stock which reduced the Company’s stockholders equity during the year ended December 31, 2018.
Warrants
The Company assumed certain warrants (related to the TARP Capital Purchase Plan) to purchase shares of the Company’s common stock. On May 20, 2015, the U.S. Treasury Department completed an auction to sell certain of its warrant positions. The Company submitted the winning bid to repurchase an outstanding warrant to purchase
350,767
shares of the Company’s common stock and repurchased this warrant for
$1.2 million
. As of
December 31, 2018
, there were
no
outstanding warrants to purchase the Company’s stock as the last remaining warrant held by the Treasury Department expired on December 12, 2018.
Dividends
The Company’s Board of Directors approved and the Company paid quarterly dividends of
$0.13
per common share for the first and second quarter of
2018
and paid dividends of
$0.14
per common shares for the third and fourth quarter of
2018
. The Company paid aggregate dividends of
$71.6 million
to common stockholders in
2018
. The Company’s Board of Directors paid quarterly dividends of
$0.12
per common share for the first and second quarter of
2017
and
$0.13
per common share for the third and fourth quarters of
2017
. The Company paid aggregate dividends of
$67.7 million
to common stockholders during
2017
.
Accumulated Other Comprehensive Loss
The following table presents the changes to accumulated other comprehensive loss for the years ended December 31, 2018, 2017, and 2016:
|
December 31, 2018
|
December 31, 2017
|
December 31, 2016
|
|||||||||
|
(Dollars in thousands)
|
|||||||||||
|
Balance at beginning of period
|
$
|
(21,781
|
)
|
$
|
(14,657
|
)
|
$
|
(1,832
|
)
|
||
|
Unrealized losses on securities available for sale
|
(16,201
|
)
|
(5,796
|
)
|
(21,273
|
)
|
|||||
|
Reclassification adjustments for gains realized in income
|
—
|
|
(301
|
)
|
(950
|
)
|
|||||
|
Tax effect
|
4,996
|
|
2,570
|
|
9,398
|
|
|||||
|
Total other comprehensive loss
|
(11,205
|
)
|
(3,527
|
)
|
(12,825
|
)
|
|||||
|
Reclassification to retained earnings due to the tax reform
|
—
|
|
(3,597
|
)
|
—
|
|
|||||
|
Reclassification to retained earnings per ASU 2016-01
|
281
|
|
—
|
|
—
|
|
|||||
|
Balance at end of period
|
$
|
(32,705
|
)
|
$
|
(21,781
|
)
|
$
|
(14,657
|
)
|
||
As permitted by ASU 2018-02, the Company made the election to reclassify
$3.6 million
in disproportionate tax effects in accumulated other comprehensive income that resulted from the reduction in corporate tax rates as a result of the Tax Act to retained earnings for the year ended December 31, 2017. The Tax Act, which was enacted on December 22, 2017 and was effective staring January 1, 2018, permanently reduced the corporate tax rate from 35% to 21%. The disproportionate tax effect was a result of the re-evaluation of the Company’s deferred tax assets related to unrealized losses on investment securities available for sale at the lower tax rate.
F-68
HOPE BANCORP, INC. AND SUBSIDIARIES
NOTES TO CONSOLIDATED FINANCIAL STATEMENTS (Continued)
During the first quarter of 2018, the Company adopted ASU 2016-01 “
Financial Instruments-Overall: Recognition and Measurement of Financial Assets and Financial Liabilities.”
As a result of the adoption of ASU 2016-01, the Company no longer accounts for mutual funds as available for sale securities and accounts for these investments as equity investments with changes to fair value recorded through earnings. In accordance with ASU 2016-01, the Company reclassified
$281 thousand
in net unrealized losses included in other comprehensive income, net of taxes to retained earnings on January 1, 2018. For the
twelve months ended
December 31, 2018
, there were
no
other reclassifications out of accumulated other comprehensive loss. For the
twelve months ended
December 31, 2017
and
2016
,
$301 thousand
and
$950 thousand
, respectively, was reclassified out of accumulated other comprehensive loss to reflect the gain on sale and call of securities.
F-69
HOPE BANCORP, INC. AND SUBSIDIARIES
NOTES TO CONSOLIDATED FINANCIAL STATEMENTS (Continued)
|
18.
|
REGULATORY MATTERS
|
The Company and the Bank are subject to various regulatory capital requirements administered by the federal and state banking agencies. Failure to meet minimum capital requirements can initiate certain mandatory and possibly additional discretionary actions by regulators that, if undertaken, could have a material and adverse effect on the Company’s and the Bank’s business, financial condition and results of operations, such as restrictions on growth or the payment of dividends or other capital distributions or management fees. Under capital adequacy guidelines and the regulatory framework for prompt corrective action, the Company and the Bank must meet specific capital guidelines that involve quantitative measures of their assets, liabilities and certain off-balance-sheet items as calculated under regulatory accounting practices. The capital amounts and classification are also subject to qualitative judgments by the regulators about components, risk-weightings and other factors.
In July 2013, the federal bank regulatory agencies adopted final regulations, which revised their risk-based and leverage capital requirements for banking organizations to meet requirements of Dodd-Frank and to implement Basel III international agreements reached by the Basel Committee. The final rules began for the Company and the Bank on January 1, 2015 and are subject to a phase-in period through January 1, 2019. The final rules that had an impact on the Company and the Bank include:
|
•
|
An increase in the minimum Tier 1 capital ratio from 4.00% to 6.00% of risk-weighted assets;
|
|
•
|
A new category and a required 4.50% of risk-weighted assets ratio is established for “Common Equity Tier 1” as a subset of Tier 1 capital limited to common equity;
|
|
•
|
A minimum non-risk-based leverage ratio is set at 4.00%, eliminating a 3.00% exception for higher rated banks;
|
|
•
|
Changes in the permitted composition of Tier 1 capital to exclude trust preferred securities, mortgage servicing rights and certain deferred tax assets and include unrealized gains and losses on available for sale debt and equity securities;
|
|
•
|
The risk-weights of certain assets for purposes of calculating the risk-based capital ratios are changed for high volatility commercial real estate acquisition, development and construction loans, certain past due non-residential mortgage loans and certain mortgage-backed and other securities exposures; and
|
|
•
|
A new additional capital conservation buffer of 2.5% of risk-weighted assets over each of the required capital ratios is being phased in from 2016 to 2019 and must be met to avoid limitations on the ability of the B
ank to pay dividends, repurchase shares, or pay discretionary bonuses. The capital
conservation buffer for the Company was initially 0.625% in 2016 and increases 0.625% annually until 2019. As of
December 31, 2018
, the capital conservation buffer for the Company stood at 1.875%.
|
As of
December 31, 2018
, the ratios for the Company and the Bank are sufficient to meet the fully phased-in conservation buffer.
As of
December 31, 2018
and
2017
, the most recent regulatory notification categorized the Bank as “well-capitalized” under the regulatory framework for prompt corrective action. To generally be categorized as “well-capitalized”, the Bank must maintain minimum total risk-based, Tier I risk-based, common equity Tier 1, and Tier I leverage ratios as set forth in the following table. There are no conditions or events since the most recent notification from regulators that management believes has changed the institution’s category.
F-70
HOPE BANCORP, INC. AND SUBSIDIARIES
NOTES TO CONSOLIDATED FINANCIAL STATEMENTS (Continued)
The Company’s and the Bank’s actual capital amounts and ratios are presented in the table below:
|
|
Actual
|
Required
For Capital
Adequacy Purposes
|
Minimum Capital Adequacy With Capital Conservation Buffer
|
Required To Be Well
Capitalized under
Prompt Corrective
Action Provisions
|
|||||||||||||||||||||||
|
|
Amount
|
Ratio
|
Amount
|
Ratio
|
Amount
|
Ratio
|
Amount
|
Ratio
|
|||||||||||||||||||
|
|
(Dollars in thousands)
|
||||||||||||||||||||||||||
|
December 31, 2018
|
|
|
|
|
|
|
|
|
|
|
|
||||||||||||||||
|
Common equity tier 1 capital
(to risk-weighted assets):
|
|||||||||||||||||||||||||||
|
Company
|
$
|
1,458,344
|
|
11.44
|
%
|
$
|
573,723
|
|
4.50
|
%
|
$
|
812,774
|
|
6.375
|
%
|
N/A
|
|
N/A
|
|
||||||||
|
Bank
|
$
|
1,737,092
|
|
13.63
|
%
|
$
|
573,699
|
|
4.50
|
%
|
$
|
812,740
|
|
6.375
|
%
|
$
|
828,677
|
|
6.50
|
%
|
|||||||
|
Total capital
(to risk-weighted assets):
|
|
|
|
|
|
|
|
|
|
|
|
|
|
|
|
|
|
||||||||||
|
Company
|
$
|
1,649,664
|
|
12.94
|
%
|
$
|
1,019,952
|
|
8.00
|
%
|
$
|
1,259,004
|
|
9.875
|
%
|
N/A
|
|
N/A
|
|
||||||||
|
Bank
|
$
|
1,830,385
|
|
14.36
|
%
|
$
|
1,019,910
|
|
8.00
|
%
|
$
|
1,258,951
|
|
9.875
|
%
|
$
|
1,274,887
|
|
10.00
|
%
|
|||||||
|
Tier I capital
(to risk-weighted assets):
|
|||||||||||||||||||||||||||
|
Company
|
$
|
1,556,371
|
|
12.21
|
%
|
$
|
764,964
|
|
6.00
|
%
|
$
|
1,004,015
|
|
7.875
|
%
|
N/A
|
|
N/A
|
|
||||||||
|
Bank
|
$
|
1,737,092
|
|
13.63
|
%
|
$
|
764,932
|
|
6.00
|
%
|
$
|
812,740
|
|
7.875
|
%
|
$
|
1,019,910
|
|
8.00
|
%
|
|||||||
|
Tier I capital
(to average assets):
|
|||||||||||||||||||||||||||
|
Company
|
$
|
1,556,371
|
|
10.55
|
%
|
$
|
590,176
|
|
4.00
|
%
|
N/A
|
|
N/A
|
|
N/A
|
|
N/A
|
|
|||||||||
|
Bank
|
$
|
1,737,092
|
|
11.76
|
%
|
$
|
590,639
|
|
4.00
|
%
|
N/A
|
|
N/A
|
|
$
|
738,299
|
|
5.00
|
%
|
||||||||
|
|
Actual
|
Required
For Capital
Adequacy Purposes
|
Minimum Capital Adequacy With Capital Conservation Buffer
|
Required To Be Well
Capitalized under
Prompt Corrective
Action Provisions
|
|||||||||||||||||||||||
|
|
Amount
|
Ratio
|
Amount
|
Ratio
|
Amount
|
Ratio
|
Amount
|
Ratio
|
|||||||||||||||||||
|
|
(Dollars in thousands)
|
||||||||||||||||||||||||||
|
December 31, 2017
|
|
|
|
|
|
|
|||||||||||||||||||||
|
Common equity tier 1 capital
(to risk-weighted assets):
|
|||||||||||||||||||||||||||
|
Company
|
$
|
1,471,193
|
|
12.30
|
%
|
$
|
538,435
|
|
4.50
|
%
|
$
|
688,000
|
|
5.75
|
%
|
N/A
|
|
N/A
|
|
||||||||
|
Bank
|
$
|
1,548,401
|
|
12.95
|
%
|
$
|
538,178
|
|
4.50
|
%
|
$
|
687,672
|
|
5.75
|
%
|
$
|
777,368
|
|
6.50
|
%
|
|||||||
|
Total capital
(to risk-weighted assets):
|
|||||||||||||||||||||||||||
|
Company
|
$
|
1,653,521
|
|
13.82
|
%
|
$
|
957,217
|
|
8.00
|
%
|
$
|
1,106,782
|
|
9.25
|
%
|
N/A
|
|
N/A
|
|
||||||||
|
Bank
|
$
|
1,633,778
|
|
13.66
|
%
|
$
|
956,761
|
|
8.00
|
%
|
$
|
1,106,255
|
|
9.25
|
%
|
$
|
1,195,951
|
|
10.00
|
%
|
|||||||
|
Tier I capital
(to risk-weighted assets):
|
|||||||||||||||||||||||||||
|
Company
|
$
|
1,568,144
|
|
13.11
|
%
|
$
|
717,913
|
|
6.00
|
%
|
$
|
867,478
|
|
7.25
|
%
|
N/A
|
|
N/A
|
|
||||||||
|
Bank
|
$
|
1,548,401
|
|
12.95
|
%
|
$
|
717,571
|
|
6.00
|
%
|
$
|
687,672
|
|
7.25
|
%
|
$
|
956,761
|
|
8.00
|
%
|
|||||||
|
Tier I capital
(to average assets):
|
|||||||||||||||||||||||||||
|
Company
|
$
|
1,568,144
|
|
11.54
|
%
|
$
|
543,528
|
|
4.00
|
%
|
N/A
|
|
N/A
|
|
N/A
|
|
N/A
|
|
|||||||||
|
Bank
|
$
|
1,548,401
|
|
11.40
|
%
|
$
|
543,441
|
|
4.00
|
%
|
N/A
|
|
N/A
|
|
$
|
679,301
|
|
5.00
|
%
|
||||||||
F-71
HOPE BANCORP, INC. AND SUBSIDIARIES
NOTES TO CONSOLIDATED FINANCIAL STATEMENTS (Continued)
|
19.
|
REVENUE RECOGNITION
|
On January 1, 2018, the Company adopted ASU 2014-09 “
Revenue from Contracts with Customers
” (Topic 606) and all subsequent issued ASUs that are related to Topic 606. The implementation of the new standard did not have a material impact on the measurement or recognition of revenue and a cumulative effect adjustment to opening retained earnings was not material and deemed unnecessary. Results for reporting periods beginning after January 1, 2018 are presented under Topic 606, while prior period results were not adjusted and continue to be reported in accordance with previous accounting guidance under Topic 605.
Topic 606 does not apply to revenue associated with financial instruments, including revenue from loans and securities. In addition, certain noninterest income streams such as fees associated with mortgage servicing rights, financial guarantees, derivatives, and certain credit card fees are also out of scope of the new guidance. Topic 606 is applicable to noninterest revenue streams such as deposit related fees, wire transfer fees, and certain OREO related net gains or expenses. However, the recognition of these revenue streams for the Company did not change significantly upon adoption of Topic 606. Noninterest revenue streams within the scope of Topic 606 are discussed below.
Service Charges on Deposit Accounts and Wire Transfer Fees
Service charges on noninterest and interest bearing deposit accounts consist of monthly service charges, customer analysis charges, non-sufficient funds (“NSF”) charges, and other deposit account related charges. The Company’s performance obligation for account analysis charges and monthly service charges is generally satisfied, and the related revenue is recognized over the period in which the service is provided. NSF charges, other deposit account related charges, and wire transfer fees are transaction based, and therefore the Company’s performance obligation is satisfied at the point of the transaction, and related revenue recognized at that point in time. Payment for service charges on deposit accounts is primarily received immediately or in the following month through a direct charge to customers’ accounts.
Service charges on deposit accounts and wire transfers are summarized below:
|
For the Year Ended December 31,
|
|||||||
|
2018
|
2017*
|
||||||
|
(Dollars in thousands)
|
|||||||
|
Noninterest bearing deposit account income:
|
|||||||
|
Monthly service charges
|
$
|
1,772
|
|
$
|
1,786
|
|
|
|
Customer analysis charges
|
7,825
|
|
8,583
|
|
|||
|
NSF charges
|
7,986
|
|
9,205
|
|
|||
|
Other service charges
|
906
|
|
981
|
|
|||
|
Total noninterest bearing deposit account income
|
18,489
|
|
20,555
|
|
|||
|
Interest bearing deposit account income:
|
|||||||
|
Monthly service charges
|
62
|
|
64
|
|
|||
|
Total service fees on deposit accounts
|
$
|
18,551
|
|
$
|
20,619
|
|
|
|
Wire transfer fee income:
|
|||||||
|
Wire transfer fees
|
$
|
4,463
|
|
$
|
4,638
|
|
|
|
Foreign exchange fees
|
471
|
|
419
|
|
|||
|
Total wire transfer fees
|
$
|
4,934
|
|
$
|
5,057
|
|
|
__________________________________
* Noninterest income for the year ended December 31, 2017 was recognized in accordance with ASC 605, prior to the adoption of ASC 606.
F-72
HOPE BANCORP, INC. AND SUBSIDIARIES
NOTES TO CONSOLIDATED FINANCIAL STATEMENTS (Continued)
OREO Income (Expense)
OREO are often sold in transactions that, under ASU 2014-09, may not be considered a contract with a customer because the sale of the asset may not be an output of the Company’s ordinary activities. However, sales of nonfinancial assets, including in-substance nonfinancial assets, should be accounted for in accordance with ASC 610-20, “
Other Income - Gains and Losses from the Derecognition of Nonfinancial Assets”
, which requires the Company to apply certain measurement and recognition concepts of ASC 606. Accordingly, the Company recognizes the sale of a real estate property, along with any associated gain or loss, when control of the property transfers to the buyer. For sales of existing real estate properties, this generally will occur at the point of sale. When the Company finances the sale of OREO to the buyer, the Company must assess whether the buyer is committed to perform their obligations under the contract and whether collectability of the transaction price is probable. Once these criteria are met, the OREO asset is derecognized and the gain or loss on sale is recorded upon the transfer of control of the property to the buyer. Application of the new revenue recognition standard does not materially change the amount and the timing of the gain/loss on sale of OREO and other nonfinancial assets. Further, there were no open OREO/nonfinancial assets sale contracts at the adoption date that required an evaluation under Topic 606. The Company recognized a net gain on sale of OREO of
$408 thousand
and
$79 thousand
for the year ended December 31, 2018 and 2017, respectively.
F-73
HOPE BANCORP, INC. AND SUBSIDIARIES
NOTES TO CONSOLIDATED FINANCIAL STATEMENTS (Continued)
|
20.
|
EARNINGS PER SHARE (“EPS”)
|
Basic EPS does not reflect the possibility of dilution that could result from the issuance of additional shares of common stock upon exercise or conversion of outstanding securities and is computed by dividing net income available to common stockholders by the weighted average number of common shares outstanding for the period. Diluted EPS reflects the potential dilution that could occur if stock options or other contracts to issue common stock were exercised or converted to common stock that would then share in the Company’s earnings. For the years ended
December 31, 2018
and
2017
, stock options and restricted shares awards of approximately
617 thousand
and
443 thousand
shares of common stock, respectively, were excluded in computing diluted earnings per common share because they were considered anti-dilutive. Additionally, warrants to purchase
20,379
of common stock (related to the TARP Capital Purchase Plan) were anti-dilutive and excluded for the
year ended
December 31, 2017
. There were
no
warrants outstanding at
December 31, 2018
.
During the second quarter of 2018, the Company issued
$217.5 million
in convertible notes. The convertible notes can be converted to the Company’s shares of common stock at a rate of 45.0760 shares per $1,000 principal amount of the notes (See footnote 10 “Subordinated Debentures and Convertible Notes” for additional information regarding convertible notes issued). For the year ended
December 31, 2018
, shares related to the convertible notes issued were not included in the Company’s diluted EPS calculation. In accordance with the terms of the convertible notes and settlement options available to the Company, no shares would have been delivered to investors of the convertible notes upon assumed conversion based on the Company’s common stock price during the year ended
December 31, 2018
.
On April 26, 2018, the Company’s Board of Directors approved a share repurchase program that authorized the Company to repurchase up to
$100.0 million
in common stock, and on September 20, 2018 approved another share repurchase program that authorized the Company to repurchase up to an additional
$50.0 million
in common stock. During the year ended
December 31, 2018
, the Company repurchased
9,002,453
shares of common stock totaling
$150.0 million
. The repurchased shares were recorded as treasury stock and reduced the total number of common shares outstanding.
The following table shows the computation of basic and diluted EPS for the years ended
December 31, 2018
,
2017
, and
2016
:
|
|
Net Income
(Numerator)
|
Weighted Average
Shares
(Denominator)
|
Earnings Per
Share
|
|||||||
|
|
(Dollars in thousands, except share and per share data)
|
|||||||||
|
2018
|
||||||||||
|
Basic EPS - common stock
|
$
|
189,589
|
|
131,716,726
|
|
$
|
1.44
|
|
||
|
Effect of dilutive securities:
|
||||||||||
|
Stock options, restricted stock, performance awards, and ESPP shares
|
237,466
|
|
||||||||
|
Diluted EPS - common stock
|
$
|
189,589
|
|
131,954,192
|
|
$
|
1.44
|
|
||
|
2017
|
||||||||||
|
Basic EPS - common stock
|
$
|
139,445
|
|
135,348,938
|
|
$
|
1.03
|
|
||
|
Effect of dilutive securities:
|
||||||||||
|
Stock options, restricted stock, and performance awards
|
336,031
|
|
||||||||
|
Diluted EPS - common stock
|
$
|
139,445
|
|
135,684,969
|
|
$
|
1.03
|
|
||
|
2016
|
||||||||||
|
Basic EPS - common stock
|
$
|
113,747
|
|
103,289,059
|
|
$
|
1.10
|
|
||
|
Effect of dilutive securities:
|
||||||||||
|
Stock options, restricted stock, and performance awards
|
241,259
|
|
||||||||
|
Diluted EPS - common stock
|
$
|
113,747
|
|
103,530,318
|
|
$
|
1.10
|
|
||
F-74
HOPE BANCORP, INC. AND SUBSIDIARIES
NOTES TO CONSOLIDATED FINANCIAL STATEMENTS (Continued)
|
21.
|
SERVICING ASSETS
|
Servicing assets are recognized when SBA and residential mortgage loans are sold with servicing retained with the income statement effect recorded in gains on sales of loans. Servicing assets are initially recorded at fair value based on the present value of the contractually specified servicing fee, net of servicing costs, over the estimated life of the loan, using a discount rate. The Company’s servicing costs approximates the industry average servicing costs of 40 basis points. All classes of servicing assets are subsequently measured using the amortization method which requires servicing rights to be amortized into noninterest income in proportion to, and over the period of, the estimated future net servicing income of the underlying loans.
Management periodically evaluates servicing assets for impairment based upon the fair value of the rights as compared to the carrying amount. Impairment is determined by stratifying rights into groupings based on loan type. Impairment is recognized through a valuation allowance for an individual grouping, to the extent that fair value is less than the carrying amount.
The changes in net servicing assets for the
year ended
December 31, 2018
and 2017 were as follows:
|
Year Ended December 31,
|
|||||||
|
2018
|
2017
|
||||||
|
(Dollars in thousands)
|
|||||||
|
Balance at beginning of period
|
$
|
24,710
|
|
$
|
26,457
|
|
|
|
Additions through originations of servicing assets
|
6,157
|
|
5,492
|
|
|||
|
Amortization
|
(7,735
|
)
|
(7,239
|
)
|
|||
|
Balance at end of period
|
$
|
23,132
|
|
$
|
24,710
|
|
|
Total servicing assets at
December 31, 2018
totaled
$23.1 million
and was comprised of
$18.7 million
in SBA servicing assets and
$4.4 million
in mortgage related servicing assets. At
December 31, 2017
, servicing assets totaled
$24.7 million
, comprised of
$22.2 million
in SBA servicing assets and
$2.5 million
in mortgage related servicing assets.
The Company utilizes the discounted cash flow method to calculate the initial excess servicing assets. The inputs used in determining the fair value of the servicing assets at
December 31, 2018
and
December 31, 2017
are presented below.
|
December 31, 2018
|
December 31, 2017
|
|||||||
|
Range
|
Range
|
|||||||
|
SBA Servicing Assets:
|
||||||||
|
Weighted-average discount rate
|
10.42% ~ 11.52%
|
10.13% ~ 11.13%
|
||||||
|
Constant prepayment rate
|
9.51% ~ 11.09%
|
7.50% ~ 12.50%
|
||||||
|
Mortgage Servicing Assets:
|
||||||||
|
Weighted-average discount rate
|
10.13% ~ 10.38%
|
9.50% ~ 9.66%
|
||||||
|
Constant prepayment rate
|
6.51% ~ 7.69%
|
7.71% ~ 9.13%
|
||||||
F-75
HOPE BANCORP, INC. AND SUBSIDIARIES
NOTES TO CONSOLIDATED FINANCIAL STATEMENTS (Continued)
|
22.
|
CONDENSED FINANCIAL STATEMENTS OF PARENT COMPANY
|
The following presents the unconsolidated condensed financial statements of only the parent company, Hope Bancorp, as of
December 31, 2018
and
2017
:
STATEMENTS OF FINANCIAL CONDITION
|
|
December 31,
|
||||||
|
|
2018
|
2017
|
|||||
|
|
(Dollars in thousands)
|
||||||
|
ASSETS:
|
|||||||
|
Cash and cash equivalents
|
$
|
12,593
|
|
$
|
13,327
|
|
|
|
Equity investments
|
525
|
|
—
|
|
|||
|
Other assets
|
5,704
|
|
10,763
|
|
|||
|
Investment in bank subsidiary
|
2,181,959
|
|
2,005,462
|
|
|||
|
TOTAL ASSETS
|
$
|
2,200,781
|
|
$
|
2,029,552
|
|
|
|
LIABILITIES:
|
|||||||
|
Convertible notes, net
|
$
|
194,543
|
|
$
|
—
|
|
|
|
Subordinated debentures
|
101,929
|
|
100,853
|
|
|||
|
Accounts payable and other liabilities
|
1,098
|
|
444
|
|
|||
|
Total liabilities
|
297,570
|
|
101,297
|
|
|||
|
STOCKHOLDERS’ EQUITY
|
1,903,211
|
|
1,928,255
|
|
|||
|
TOTAL LIABILITIES AND STOCKHOLDERS’ EQUITY
|
$
|
2,200,781
|
|
$
|
2,029,552
|
|
|
STATEMENTS OF INCOME AND COMPREHENSIVE INCOME
|
|
Years Ended December 31,
|
||||||||||
|
|
2018
|
2017
|
2016
|
||||||||
|
|
(Dollars in thousands)
|
||||||||||
|
Interest income
|
$
|
—
|
|
$
|
—
|
|
$
|
—
|
|
||
|
Interest expense
|
(12,153
|
)
|
(5,089
|
)
|
(2,927
|
)
|
|||||
|
Noninterest income
|
525
|
|
—
|
|
—
|
|
|||||
|
Other operating expense
|
(4,855
|
)
|
(5,988
|
)
|
(9,826
|
)
|
|||||
|
Equity in earnings of bank subsidiary
|
201,162
|
|
146,397
|
|
121,996
|
|
|||||
|
Income before income tax benefit
|
184,679
|
|
135,320
|
|
109,243
|
|
|||||
|
Income tax benefit
|
4,910
|
|
4,125
|
|
4,504
|
|
|||||
|
Net income
|
189,589
|
|
139,445
|
|
113,747
|
|
|||||
|
Other comprehensive loss, net of tax
|
(11,205
|
)
|
(3,527
|
)
|
(12,825
|
)
|
|||||
|
Comprehensive income
|
$
|
178,384
|
|
$
|
135,918
|
|
$
|
100,922
|
|
||
F-76
HOPE BANCORP, INC. AND SUBSIDIARIES
NOTES TO CONSOLIDATED FINANCIAL STATEMENTS (Continued)
STATEMENTS OF CASH FLOWS
|
|
Years Ended December 31,
|
||||||||||
|
|
2018
|
2017
|
2016
|
||||||||
|
|
(Dollars in thousands)
|
||||||||||
|
CASH FLOWS FROM OPERATING ACTIVITIES:
|
|||||||||||
|
Net income
|
$
|
189,589
|
|
$
|
139,445
|
|
$
|
113,747
|
|
||
|
Adjustments to reconcile net income to net cash from
operating activities:
|
|||||||||||
|
Amortization
|
4,118
|
|
1,045
|
|
558
|
|
|||||
|
Stock-based compensation expense
|
300
|
|
523
|
|
—
|
|
|||||
|
Net gain on equity investments
|
(525
|
)
|
—
|
|
—
|
|
|||||
|
Change in other assets
|
4,534
|
|
665
|
|
2,172
|
|
|||||
|
Change in accounts payable and other liabilities
|
653
|
|
(17
|
)
|
(119
|
)
|
|||||
|
Equity in undistributed earnings of bank subsidiary
|
(191,161
|
)
|
(76,397
|
)
|
(77,996
|
)
|
|||||
|
Net cash from operating activities
|
7,508
|
|
65,264
|
|
38,362
|
|
|||||
|
CASH FLOWS FROM INVESTING ACTIVITIES:
|
|||||||||||
|
Cash and cash equivalents acquired through the merger
|
—
|
|
—
|
|
13,248
|
|
|||||
|
Net cash from investing activities
|
—
|
|
—
|
|
13,248
|
|
|||||
|
CASH FLOWS USED IN FINANCING ACTIVITIES:
|
|||||||||||
|
Issuance of additional stock pursuant to various stock plans
|
469
|
|
1,865
|
|
—
|
|
|||||
|
Proceeds from convertible notes, net of issuance fees
|
212,920
|
|
—
|
|
—
|
|
|||||
|
Repurchase of shares of treasury stock
|
(150,000
|
)
|
—
|
|
—
|
|
|||||
|
Payments of cash dividends
|
(71,631
|
)
|
(67,661
|
)
|
(42,493
|
)
|
|||||
|
Net cash used in financing activities
|
(8,242
|
)
|
(65,796
|
)
|
(42,493
|
)
|
|||||
|
NET CHANGE IN CASH AND CASH EQUIVALENTS
|
(734
|
)
|
(532
|
)
|
9,117
|
|
|||||
|
CASH AND CASH EQUIVALENTS, BEGINNING OF YEAR
|
13,327
|
|
13,859
|
|
4,742
|
|
|||||
|
CASH AND CASH EQUIVALENTS, END OF YEAR
|
$
|
12,593
|
|
$
|
13,327
|
|
$
|
13,859
|
|
||
F-77
HOPE BANCORP, INC. AND SUBSIDIARIES
NOTES TO CONSOLIDATED FINANCIAL STATEMENTS (Continued)
|
23.
|
QUARTERLY FINANCIAL DATA (UNAUDITED)
|
Summarized unaudited quarterly financial data follows for the three months ended:
|
2018 Quarter Ended,
|
|||||||||||||||
|
March 31
|
June 30
|
September 30
|
December 31
|
||||||||||||
|
|
(Dollars in thousands, except per share data)
|
||||||||||||||
|
Interest income
|
$
|
150,410
|
|
$
|
159,910
|
|
$
|
167,826
|
|
$
|
172,026
|
|
|||
|
Interest expense
|
30,342
|
|
37,091
|
|
44,679
|
|
50,133
|
|
|||||||
|
Net interest income before provision for loan losses
|
120,068
|
|
122,819
|
|
123,147
|
|
121,893
|
|
|||||||
|
Provision for loan losses
|
2,500
|
|
2,300
|
|
7,300
|
|
2,800
|
|
|||||||
|
Net interest income after provision for loan losses
|
117,568
|
|
120,519
|
|
115,847
|
|
|
119,093
|
|
||||||
|
Noninterest income
|
19,850
|
|
15,269
|
|
13,447
|
|
11,614
|
|
|||||||
|
Noninterest expense
|
68,453
|
|
71,629
|
|
67,455
|
|
70,189
|
|
|||||||
|
Income before income tax provision
|
68,965
|
|
64,159
|
|
|
61,839
|
|
|
60,518
|
|
|||||
|
Income tax provision
|
17,733
|
|
16,629
|
|
15,461
|
|
16,069
|
|
|||||||
|
Net income
|
$
|
51,232
|
|
$
|
47,530
|
|
|
$
|
46,378
|
|
|
$
|
44,449
|
|
|
|
Basic earnings per common share
|
$
|
0.38
|
|
$
|
0.36
|
|
$
|
0.36
|
|
$
|
0.35
|
|
|||
|
Diluted earnings per common share
|
$
|
0.38
|
|
$
|
0.36
|
|
$
|
0.36
|
|
$
|
0.35
|
|
|||
|
2017 Quarter Ended,
|
|||||||||||||||
|
March 31
|
June 30
|
September 30
|
December 31
|
||||||||||||
|
|
(Dollars in thousands, except per share data)
|
||||||||||||||
|
Interest income
|
$
|
132,743
|
|
$
|
138,533
|
|
$
|
147,643
|
|
$
|
153,185
|
|
|||
|
Interest expense
|
17,838
|
|
21,713
|
|
24,380
|
|
26,793
|
|
|||||||
|
Net interest income before provision for loan losses
|
114,905
|
|
116,820
|
|
123,263
|
|
126,392
|
|
|||||||
|
Provision for loan losses
|
5,600
|
|
2,760
|
|
5,400
|
|
3,600
|
|
|||||||
|
Net interest income after provision for loan losses
|
109,305
|
|
114,060
|
|
117,863
|
|
122,792
|
|
|||||||
|
Noninterest income
|
17,603
|
|
16,115
|
|
16,246
|
|
16,451
|
|
|||||||
|
Noninterest expense
|
67,699
|
|
64,037
|
|
61,837
|
|
73,028
|
|
|||||||
|
Income before income tax provision
|
59,209
|
|
66,138
|
|
72,272
|
|
66,215
|
|
|||||||
|
Income tax provision
|
22,999
|
|
25,451
|
|
27,708
|
|
48,231
|
|
|||||||
|
Net income
|
$
|
36,210
|
|
$
|
40,687
|
|
$
|
44,564
|
|
$
|
17,984
|
|
|||
|
|
|
|
|
|
|
|
|
||||||||
|
Basic earnings per common share
|
$
|
0.27
|
|
$
|
0.30
|
|
$
|
0.33
|
|
$
|
0.13
|
|
|||
|
Diluted earnings per common share
|
$
|
0.27
|
|
$
|
0.30
|
|
$
|
0.33
|
|
$
|
0.13
|
|
|||
F-78
TABLE OF CONTENTS
Part IItem 1. BusinessItem 1A. Risk FactorsItem 1B. Unresolved Staff CommentsItem 2. PropertiesItem 3. Legal ProceedingsItem 4. Mine Safety DisclosuresPart IIItem 5. Market For Registrant S Common Equity, Related Stockholder Matters and Issuer Purchases Of Equity SecuritiesItem 6. Selected Financial DataItem 7. Management S Discussion and Analysis Of Financial Condition and Results Of OperationsItem 7A. Quantitative and Qualitative Disclosures About Market RiskItem 8. Financial Statements and Supplementary DataItem 9. Changes in and Disagreements with Accountants on Accounting and Financial DisclosureItem 9A. Controls and ProceduresItem 9B. Other InformationPart IIIItem 10. Directors, Executive Officers and Corporate GovernanceItem 11. Executive CompensationItem 12. Security Ownership Of Certain Beneficial Owners and Management and Related Stockholder MattersItem 13. Certain Relationships and Related Transactions, and Director IndependenceItem 14. Principal Accountant Fees and ServicesPart IVItem 15. Exhibits and Financial Statement SchedulesItem 16. Form 10-k Summary