H&R BLOCK INC
10-Ks and 10-Qs
|
|
|
|
|
|
|
|
|
|
|
|
|
|
|
|
|
|
|
|
|
|
|
|
|
|
|
|
|
|
|
|
|
|
|
|
|
|
|
|
|
|
|
|
|
|
|
|
|
|
|
|
|
|
|
|
|
|
|
UNITED STATES
SECURITIES AND EXCHANGE COMMISSION
Washington, D.C. 20549
FORM 10-K
|
(Mark One)
|
|
|
|
þ
|
|
ANNUAL REPORT PURSUANT TO SECTION 13 OR 15(d) OF THE SECURITIES EXCHANGE ACT OF 1934
|
|
|
For the fiscal year ended April 30, 2013
|
|
|
|
OR
|
|
|
¨
|
|
TRANSITION REPORT PURSUANT TO SECTION 13 OR 15(d) OF THE SECURITIES EXCHANGE ACT OF 1934
|
|
|
For the transition period from to
|
|
Commission file number 1-6089
H&R Block, Inc.
(Exact name of registrant as specified in its charter)
|
MISSOURI
|
|
44-0607856
|
|
(State or other jurisdiction of
|
|
(I.R.S. Employer
|
|
incorporation or organization)
|
|
Identification No.)
|
One H&R Block Way, Kansas City, Missouri 64105
(Address of principal executive offices, including zip code)
(816) 854-3000
(Registrant’s telephone number, including area code)
Securities registered pursuant to Section 12(b) of the Act:
|
Title of each class
|
|
Name of each exchange on which registered
|
|
Common Stock, without par value
|
|
New York Stock Exchange
|
Securities registered pursuant to Section 12(g) of the Act:
Common Stock, without par value
(Title of Class)
Indicate by check mark whether the registrant is a well-known seasoned issuer as defined in Rule 405 of the Securities Act.
Yes
þ
No
¨
Indicate by check mark if the registrant is not required to file reports pursuant to Section 13 or 15(d) of the Act. Yes
¨
No
þ
Indicate by check mark whether the registrant (1) has filed all reports required to be filed by Section 13 or 15(d) of the Securities Exchange Act of 1934 during the preceding 12 months (or for such shorter period that the registrant was required to file such reports), and (2) has been subject to such filing requirements for the past 90 days. Yes
þ
No
¨
Indicate by check mark if disclosure of delinquent filers pursuant to Item 405 of Regulation S-K is not contained herein, and will not be contained, to the best of registrant’s knowledge, in definitive proxy or information statements incorporated by reference in Part III of this Form 10-K or any amendment to this Form 10-K.
¨
Indicate by check mark whether the registrant has submitted electronically and posted on its corporate Web site, if any, every Interactive Data File required to be submitted and posted pursuant to Rule 405 of Regulation S-T (§232.405 of this chapter) during the preceding 12 months (or for such shorter period that the registrant was required to submit and post such files). Yes
þ
No
¨
Indicate by check mark whether the registrant is a large accelerated filer, an accelerated filer, a non-accelerated filer or a smaller reporting company. See definitions of “large accelerated filer,” “accelerated filer” and “smaller reporting company” in Rule 12b-2 of the Exchange Act.
Large accelerated filer
þ
Accelerated filer
¨
Non-accelerated filer
¨
Smaller reporting company
¨
(Do not check if a smaller reporting company)
Indicate by check mark whether the registrant is a shell company (as defined in Rule 12b-2 of the Exchange Act). Yes
¨
No
þ
The aggregate market value of the registrant’s Common Stock (all voting stock) held by non-affiliates of the registrant, computed by reference to the price at which the stock was sold on October 31, 2012, was $4,807,662,137.
Number of shares of the registrant’s Common Stock, without par value, outstanding on
May 31, 2013
:
272,700,967
.
Documents incorporated by reference
The definitive proxy statement for the registrant’s Annual Meeting of Shareholders, to be held September 12, 2013, is incorporated by reference in Part III to the extent described therein.
2013 FORM 10-K AND ANNUAL REPORT
TABLE OF CONTENTS
INTRODUCTION AND FORWARD-LOOKING STATEMENTS
Specified portions of our proxy statement are “incorporated by reference” in response to certain items. Our proxy statement will be made available to shareholders in July
2013
, and will also be available on our website at
www.hrblock.com
.
This report and other documents filed with the Securities and Exchange Commission (SEC) may contain forward-looking statements. In addition, our senior management may make forward-looking statements orally to analysts, investors, the media and others. Forward-looking statements can be identified by the fact that they do not relate strictly to historical or current facts. They often include words or variation of words such as “expects,” “anticipates,” “intends,” “plans,” “believes,” “seeks,” “estimates,” “projects,” “forecasts,” “targets,” “would,” “will,” “should,” “could,” “may” or other similar expressions. Forward-looking statements provide management's current expectations or predictions of future conditions, events or results. All statements that address operating performance, events or developments that we expect or anticipate will occur in the future are forward-looking statements. They may include estimates of revenues, income, earnings per share, capital expenditures, dividends, stock repurchase, liquidity, capital structure or other financial items, descriptions of management's plans or objectives for future operations, services or products, or descriptions of assumptions underlying any of the above. All forward-looking statements speak only as of the date they are made and reflect the Company's good faith beliefs, assumptions and expectations, but they are not guarantees of future performance or events. Furthermore, the Company disclaims any obligation to publicly update or revise any forward-looking statement to reflect changes in underlying assumptions, factors, or expectations, new information, data or methods, future events or other changes, except as required by law. By their nature, forward-looking statements are subject to risks and uncertainties that could cause actual results to differ materially from those suggested by the forward-looking statements. Factors that might cause such differences include, but are not limited to, a variety of economic, competitive and regulatory factors, many of which are beyond the Company's control. Investors should understand that it is not possible to predict or identify all such factors and, consequently, should not consider any such list to be a complete set of all potential risks or uncertainties. Details about risks affecting various aspects of our business are included throughout this Form 10-K. Investors should carefully consider all of these risks, and should pay particular attention to Item 1A, “Risk Factors,” of this Form 10-K.
|
ITEM 1.
|
BUSINESS
|
GENERAL DEVELOPMENT OF BUSINESS
H&R Block, Inc. was organized as a corporation in 1955 under the laws of the State of Missouri and has subsidiaries that provide tax preparation and banking services. “H&R Block,” “the Company,” “we,” “our” and “us” are used interchangeably to refer to H&R Block, Inc. or to H&R Block, Inc. and its subsidiaries, as appropriate to the context. A complete list of our subsidiaries can be found in Exhibit 21.
Our Tax Services segment provides assisted income tax return preparation, digital tax solutions and other services and products related to income tax return preparation to the general public primarily in the United States (U.S.) and its territories, Canada and Australia. This segment also offers financial services through H&R Block Bank (HRB Bank).
In addition to our Tax Services segment, we separately report the results of corporate operations which include net interest margin and gains or losses relating to mortgage loans held for investment, real estate owned and residual interests in securitizations, along with interest expense on borrowings, other corporate expenses and eliminations of intercompany activities.
Through ownership of HRB Bank, we are a savings and loan holding company (SLHC) regulated by the Board of Governors of the Federal Reserve System (Federal Reserve). As previously announced, we are in the process of evaluating alternative means of ceasing to be an SLHC, in which case we would no longer be subject to regulation by the Federal Reserve as an SLHC. In connection with that evaluation, we are exploring alternatives to continue delivering financial services to our customers. Our evaluation of alternatives is ongoing and we cannot predict the timing, the circumstances, or the likelihood that we will cease to be regulated as an SLHC.
FINANCIAL INFORMATION ABOUT INDUSTRY SEGMENTS
See discussion below and in Item 8, note 22 to the consolidated financial statements.
|
H&R Block 2013 Form 10K
|
1
|
DESCRIPTION OF BUSINESS
TAX SERVICES
GENERAL
– We provide tax return preparation and related services and products to the general public primarily in the U.S. and its territories, Canada, and Australia. Major revenue sources include fees earned for tax preparation and related services performed at company-owned retail tax offices, royalties from franchisees, sales of tax preparation software, online tax preparation fees and fees from complementary services. HRB Bank also offers traditional banking services including checking and savings accounts, individual retirement accounts and certificates of deposit.
Tax Returns Prepared.
During fiscal year
2013
,
25.4 million
tax returns were prepared by and through H&R Block worldwide, compared to
25.6 million
in
2012
and
24.5 million
in
2011
. In the U.S.,
22.2 million
tax returns were prepared by and through H&R Block during fiscal year
2013
, compared to
22.3 million
in
2012
and
21.4 million
in
2011
. Our U.S. tax returns prepared during the
2013
tax season, including those prepared by our franchisees and those prepared and filed at no charge, constituted approximately 16% of an Internal Revenue Service (IRS) estimate of total individual income tax returns filed during the fiscal year
2013
tax season. See Item 7 for further discussion of changes in the number of tax returns prepared.
ASSISTED
– Assisted income tax return preparation and related services are provided by tax professionals via a system of retail offices operated directly by us or by franchisees.
Franchises.
We offer franchises as a way to expand our presence in certain markets. Our franchise arrangements provide us with certain rights designed to protect our brand. Most of our franchisees receive, among other things, the right to use our trademark and software, access to product offerings and expertise, signs, specialized forms, advertising and initial training and supervisory services. Our franchisees pay us a percentage of approximately 30% of gross tax return preparation and related service revenues as a franchise royalty in the U.S.
During fiscal years
2013
,
2012
and
2011
, we sold certain company-owned offices to existing franchisees for sales proceeds totaling
$3.8 million
,
$17.3 million
and
$65.6 million
, respectively. The net gain on these transactions totaled
$1.3 million
,
$16.6 million
and
$45.1 million
in fiscal years
2013
,
2012
and
2011
, respectively. The majority of these sales are financed through loans made by one of our consolidated subsidiaries.
From time to time, we have acquired the assets of existing franchisees and other tax return preparation businesses, and may continue to do so if future conditions warrant and satisfactory terms can be negotiated.
Offices.
During the
2013
tax season, we operated in
10,718
offices across the U.S. at the peak of the tax season. A summary of our company-owned and franchise offices is included in Item 7, under “Tax Services – Operating Statistics.” We sold
nine
,
83
and
280
company-owned offices to franchisees in fiscal years
2013
,
2012
and
2011
, respectively. Offices in shared locations at April 30,
2013
consist primarily of offices in Walmart stores. The U.S. Walmart license agreement, which covered approximately 450 offices, expired as of April 30, 2013, and was not renewed. In previous years, we had a similar license agreement with Sears, but this agreement expired in July 2012 and was not renewed.
DO-IT-YOURSELF
– In addition to our retail offices, we offer a number of digital do-it-yourself (DIY) tax preparation alternatives. By offering professional assisted and DIY tax preparation options through multiple channels, we seek to serve our clients in the manner they choose to be served.
Online Tax Services.
We offer a comprehensive range of online tax services, from tax advice to complete professional and DIY tax return preparation and electronic filing, through our website at
www.hrblock.com
. Services available at this website allow clients to prepare their federal and state income tax returns using the H&R Block At Home
®
Online Tax Program, access tax tips, advice and tax-related news, and use calculators for tax planning. We participate in the Free File Alliance (FFA). This alliance was created by the tax return preparation industry and the IRS, and allows qualified filers with an adjusted gross income of $57,000 or less to prepare and file their federal return online at no charge. We believe this program provides a valuable public service and increases our visibility with new clients, while also providing an opportunity to offer our state tax return preparation services to these clients.
Software.
We develop and market H&R Block At Home
®
income tax preparation software. H&R Block At Home
®
offers a simple step-by-step tax preparation interview, data imports from money management software, calculations, completion of the appropriate tax forms, error checking and electronic filing. Our software may be purchased online, through third-party retail stores or via direct mail.
Mobile Applications.
We develop and offer applications for mobile devices which provide tax and related services to clients, including online tax preparation and tools that complement our tax preparation software.
OTHER OFFERINGS
– In addition to our tax services, we also offer clients a number of additional services, including refund anticipation checks that include a fee deduction feature (RACs), H&R Block Emerald Advance
®
lines of credit (EAs), prepaid
|
2
|
H&R Block 2013 Form 10K
|
debit cards, our Peace of Mind
®
(POM) guarantee, credit cards, and, for our Canadian clients, a refund discount (CashBack) program.
Refund Anticipation Checks.
RACs allow clients to receive their tax refunds by their chosen method of disbursement and include a feature allowing clients to deduct tax preparation and service fees from their tax refunds. Clients may choose to receive their RAC proceeds by direct deposit to a deposit account, by deposit to their H&R Block Prepaid Emerald MasterCard® or by receiving a check. RACs are available to U.S. clients and are frequently obtained by those who (1) do not have bank accounts into which the IRS can direct deposit their refunds; (2) like the convenience of a temporary account for receipt of their refund; or (3) prefer to have their tax preparation fees paid directly out of their refunds.
H&R Block Emerald Advance
®
Lines of Credit.
EAs are offered to clients in our offices typically from late November through mid-January, currently in an amount not to exceed $1,000. If the borrower meets certain criteria as agreed in the loan terms, the line of credit can be utilized year-round. Borrowers may choose to pay down balances on EAs with their tax refunds.
H&R Block Prepaid Emerald Mastercard
®
.
The H&R Block Prepaid Emerald MasterCard
®
allows clients to receive their tax refunds from the IRS directly on a prepaid debit card, or to direct RAC proceeds to the card to avoid check-cashing fees. The card can be used for everyday purchases, bill payments and ATM withdrawals anywhere MasterCard
®
is accepted. Additional funds can be added to the card account year-round through direct deposit or at participating retail locations.
Peace of Mind
®
Guarantee.
In addition to our standard guarantee, we offer our POM guarantee to U.S. clients, whereby we (1) represent our clients if they are audited by the IRS, and (2) assume the cost, subject to certain limits, of additional taxes owed by a client resulting from errors attributable to H&R Block. The POM guarantee has a cumulative limit of $5,500 in additional taxes assessed with respect to the federal, state and local tax returns we prepared for applicable clients during the taxable year covered by the guarantee.
Credit Cards.
In fiscal year 2013, HRB Bank began offering unsecured credit cards. These credit cards are offered to selected customers, primarily previous H&R Block clients, based on their credit profile and have a maximum available credit limit of $2,500.
CashBack Refund Discount Program.
During the tax season, our Canadian operations advance refunds due to certain clients from the Canada Revenue Agency (CRA), for a fee. The fee charged for this service is mandated by the CRA. The client assigns to us the full amount of the tax refund to be issued by the CRA and the refund amount is then sent by the CRA directly to us. The number of returns discounted under the CashBack program in fiscal year
2013
was 620,000, compared to 724,000 in
2012
and 821,000 in
2011
.
SEASONALITY OF BUSINESS
– Because most of our clients file their tax returns during the period from January through April of each year, substantially all of our revenues from income tax return preparation and related services and products are earned during this period. As a result, we generally operate at a loss through the first eight months of the fiscal year.
HRB Bank’s operating results are subject to seasonal fluctuations primarily related to the offering of the H&R Block Prepaid Emerald MasterCard
®
,
EAs and RACs, and therefore peak in January and February and taper off through the remainder of the tax season.
COMPETITIVE CONDITIONS
– We provide both assisted and DIY tax preparation services and products and face substantial competition in and across each category. There are a substantial number of tax return preparation firms and accounting firms offering tax return preparation services, and we face significant competition from independent tax preparers and certified public accountants. Certain firms are involved in providing electronic filing services and RACs or similar services to the public. Commercial tax return preparers and electronic filers are highly competitive with regard to price and service, and many firms offer services that may include preparation of tax returns at no charge. Our assisted tax preparation business also faces competition from firms offering DIY tax preparation services and products. In terms of the number of offices and personal tax returns prepared and electronically filed in offices, online and via our software, we are one of the largest single providers of tax return preparation solutions and electronic filing services in the U.S. We also believe we operate the largest tax return preparation businesses in Canada and Australia.
Our DIY tax preparation options include various forms of digital electronic assistance, including online, mobile and desktop software. Many other companies offer digital and online tax preparation services, including Intuit, Inc., our largest competitor offering such services. Like all tax return preparation services and products, price and marketing competition for digital tax preparation services is intense among value and premium products and many firms offer digital services and products at no charge. Our digital tax solutions services and products also compete with in-office tax preparation services. U.S. federal and certain state and foreign taxing authorities also currently offer, or facilitate the offering of, tax return preparation and filing options to taxpayers at no charge.
HRB Bank provides banking services primarily to our assisted and DIY tax clients and for many of these clients, HRB Bank is their only provider of banking services. HRB Bank does not seek to compete broadly with regional or national retail banks.
|
H&R Block 2013 Form 10K
|
3
|
GOVERNMENT REGULATION
–
TAX PREPARERS
– Our tax preparation business is subject to various forms of government regulation, including the following:
U.S. Federal Tax Preparer Regulations.
U.S. federal legislation requires income tax return preparers to, among other things, set forth their signatures and identification numbers, including their Preparer Tax Identification Number (PTIN), on all tax returns prepared by them and retain all tax returns prepared by them for three years. U.S. federal laws also subject income tax return preparers to accuracy-related penalties in connection with the preparation of income tax returns. Preparers may be prohibited from continuing to act as income tax return preparers if they continuously and repeatedly engage in specified misconduct.
The U.S. federal government regulates the electronic filing of income tax returns in part by requiring electronic filers to comply with all publications and notices of the IRS applicable to electronic filing. We are required to provide certain electronic filing information to taxpayers and comply with advertising standards for electronic filers. We are also subject to possible monitoring by the IRS, and if deemed appropriate, the IRS could impose various penalties, including penalties for improper disclosure or use of taxpayer information, other preparer penalties or suspension from the IRS electronic filing program.
IRS regulations require all tax return preparers to use a PTIN as their identifying number on U.S. federal tax returns filed after December 31, 2010. On January 18, 2013, the Federal District Court for the District of Columbia enjoined the IRS from enforcing the recently implemented regulations requiring paid tax return preparers to be authorized to practice before the IRS as a prerequisite to obtaining or renewing a PTIN. Under the enjoined regulations, the IRS would be permitted to conduct tax compliance checks on tax return preparers, has defined the individuals who are considered “tax return preparers” for the PTIN requirement, and charge a PTIN user registration fee of $64.25 per year for new registrations and $63.00 per year for renewals. The IRS would also be permitted to conduct background checks on PTIN applicants. The decision of the Federal District Court has been appealed by the IRS.
Financial Privacy Regulations.
The Gramm-Leach-Bliley Act and related Consumer Financial Protection Bureau (CFPB) and Federal Trade Commission (FTC) regulations require income tax preparers to (1) adopt and disclose consumer privacy notices, (2) provide consumers a reasonable opportunity to control (via “opt-out”) whether their nonpublic personal information is disclosed to unaffiliated third-parties (subject to certain exceptions), and (3) implement reasonable safeguards to protect the security and confidentiality of nonpublic personal information. In addition, the IRS generally prohibits the use or disclosure of taxpayer information by tax return preparers for purposes other than tax return preparation without the prior written consent of the taxpayer.
State Regulations.
Certain states have privacy laws and regulations similar to the U.S. federal regulations described above. Most states also have data security breach notice laws requiring notice be provided to impacted individuals and others if there is unauthorized access to certain nonpublic personal information. Certain states have regulations and requirements relating to offering income tax courses. These requirements include licensing, bonding and certain restrictions on advertising.
Franchise Regulations.
Many of the income tax return preparation offices operating in the U.S. under the name “H&R Block” are operated by franchisees. Our franchising activities are subject to the rules and regulations of the FTC, potential enforcement by the CFPB, and various state laws regulating the offer and sale of franchises. The FTC and various state laws require us to furnish to prospective franchisees a franchise disclosure document containing certain prescribed information. A number of states in which we are currently franchising regulate the sale of franchises and require registration of the franchise disclosure document with certain state authorities. We are currently operating under exemptions from registration in several of these states based on our net worth and experience. Substantive state laws regulating the franchisor/franchisee relationship presently exist in a large number of states, and bills have been introduced in Congress from time to time that would provide for federal regulation of the franchisor/franchisee relationship in certain respects. The state laws often limit, among other things, the duration and scope of non-competition provisions, the ability of a franchisor to terminate or refuse to renew a franchise and the ability of a franchisor to designate sources of supply. From time to time, we may make appropriate amendments to our franchise disclosure document to comply with our disclosure obligations under U.S. federal and state laws.
Foreign Regulations.
We are also subject to a variety of other regulations in various foreign markets, including anti-corruption laws and regulations. Foreign regulations and laws potentially affecting our business are evolving rapidly. We rely on external counsel in the countries in which we do business to advise us regarding compliance with applicable laws and regulations. As our international operations grow, we continue to develop and enhance our internal legal and operational compliance programs that guide our businesses in complying with laws and regulations applicable in the countries in which we do business.
REGULATION AND SUPERVISION
–
BANK AND HOLDING COMPANIES
– Our indirect subsidiary, HRB Bank, is a federal savings bank chartered under the Home Owner's Loan Act, as amended (HOLA). H&R Block, Inc., H&R Block Group, Inc. and Block Financial LLC (our Holding Companies) are SLHCs because they control HRB Bank. The following is a general description of certain U.S. federal banking statutes and regulations that apply to HRB Bank and our Holding Companies.
The Dodd-Frank Act.
The Dodd-Frank Wall Street Reform and Consumer Protection Act (the Dodd-Frank Act) was signed into law on July 21, 2010. This federal statute made extensive changes to the laws regulating federal savings banks, their holding companies and other financial services companies. The Dodd-Frank Act requires various federal agencies to adopt many new
|
4
|
H&R Block 2013 Form 10K
|
implementing rules and regulations. The federal agencies are given significant discretion in drafting the new rules and regulations; consequently, many of the details and much of the impact of the Dodd-Frank Act will not be known for several years.
The Dodd-Frank Act substantially restructured the regulation of federal savings associations and savings and loan holding companies. The Office of Thrift Supervision (OTS), which previously was the primary federal regulator for both HRB Bank and our Holding Companies, was eliminated. On July 21, 2011, the OTS transferred its regulatory authority to the Office of the Comptroller of the Currency (OCC) and the Federal Reserve. On that date, the OCC, the primary federal regulator for national banks, became the primary federal regulator for federal savings banks, including HRB Bank, and the Federal Reserve became the primary federal regulator for all SLHCs and their nonbank subsidiaries, including our Holding Companies and their nonbank subsidiaries.
The Dodd-Frank Act further limited the activities of SLHCs and their nonbank subsidiaries. The OTS had authorized SLHCs and their nonbank subsidiaries to engage in the broadest range of financial activities that could be engaged in by a bank holding company that has elected to be a financial holding company (FHC). Pursuant to the Dodd-Frank Act, the Federal Reserve has issued a regulation that SLHCs, and their nonbank subsidiaries, may only engage in such financial activities if the SLHCs qualify for and elect to become FHCs. Our Holding Companies have not elected to become FHCs and have no plans to do so.
The Dodd-Frank Act also weakened the federal preemption rules that have been applicable for national banks, federal savings banks and their subsidiaries, and gives state attorneys general the ability to enforce consumer protection laws. Prior to the enactment of the Dodd-Frank Act, OTS regulations provided that the HOLA, and the OTS regulations that interpret the HOLA, preempted the entire field of state regulation in the critical areas of lending and deposit-taking, resulting in federal preemption of most state consumer protection laws in those areas. The Dodd-Frank Act, effective July 21, 2011, changed the legal standard for federal savings association preemption of state laws to a “conflict” preemption standard that is the same as the standard for national bank preemption of state laws. The Dodd-Frank Act also eliminated, effective July 21, 2012, federal preemption for subsidiaries and affiliates of national banks and federal savings banks. As a result, state statutes and regulations that were previously not applicable to our nonbank subsidiaries are no longer preempted.
The Dodd-Frank Act also imposes consolidated capital requirements on SLHCs. These requirements may have a significant long term effect on our Holding Companies and, as a result, we are in the process of evaluating alternative means of ceasing to be an SLHC. The Dodd-Frank Act requires the Federal Reserve to promulgate minimum capital requirements for SLHCs, including leverage (Tier 1) and risk-based capital requirements that are no less stringent than those applicable to banks at the time the Dodd-Frank Act was adopted.
Regulatory Supervision and Enforcement Authority.
The OCC has extensive supervision and enforcement authority over all federal savings associations, including HRB Bank, and the Federal Reserve has extensive supervision and enforcement authority over all SLHCs, including our Holding Companies. Enforcement authority includes, among other things, the ability to assess civil money penalties, to issue cease-and-desist and removal orders and to initiate injunctive actions. In general, these enforcement actions may be initiated for violations of laws and regulations and unsafe or unsound practices. Public disclosure of final enforcement actions by the OCC or the Federal Reserve is generally required by law.
Regulatory Capital Requirements
.
OCC regulations require HRB Bank to maintain specified minimum levels of regulatory capital. To be well capitalized, a federal savings association must have a leverage ratio of at least 5.0%, a Tier 1 risk-based capital ratio of at least 6.0% and a total risk-based capital ratio of at least 10.0%. To be adequately capitalized, a federal savings association must have a leverage ratio of at least 4.0%, a Tier 1 risk-based capital ratio of at least 4.0% and a total risk-based capital ratio of at least 8.0%. As of March 31,
2013
, HRB Bank's most recent Call Report filing with the OCC, HRB Bank was well-capitalized, with a leverage ratio of
25.5%
, a Tier 1 risk-based capital ratio of
130.3%
, and a total risk-based capital ratio of
131.6%
.
On August 30, 2012, the OCC, FDIC and Federal Reserve issued in the Federal Register a joint notice of proposed rulemaking that would increase the capital requirements for federal savings banks, including HRB Bank. See below under "New SLHC Regulatory Capital Requirements" for further information on the OCC's proposed capital requirements. The OCC has not issued final capital regulations and it is unclear when it will do so and when the new capital regulations will become effective.
The OCC is authorized to take certain enforcement actions against federal savings banks that fail to meet the minimum ratios for an adequately capitalized institution and to impose other restrictions on federal savings banks that are less than adequately capitalized.
Limitations on Dividends and Other Capital Distributions.
OCC regulations impose various restrictions on federal savings banks with respect to their ability to make distributions of capital, which include dividends, stock redemptions or repurchases and other transactions charged to the capital account.
Under OCC regulations, federal savings banks, such as HRB Bank, may generally make capital distributions during any calendar year equal to net income of the bank for the previous two calendar years, net of prior dividends paid by the bank, and current year-to-date net income. OCC regulations generally require that federal savings banks remain adequately capitalized before and after the proposed distribution. A federal savings bank proposing to make any capital distribution greater than these limits must obtain
|
H&R Block 2013 Form 10K
|
5
|
OCC approval prior to making such distributions. Because of the seasonal nature of our business and wide fluctuations in the level of HRB Bank's assets, our Holding Companies regularly make capital contributions to HRB Bank, and HRB Bank regularly seeks regulatory approval to repay such capital contributions as extraordinary dividends.
Consumer Protection Laws.
In connection with its lending activities, HRB Bank is subject to federal laws designed to protect borrowers and promote lending, including the Equal Credit Opportunity Act, the Truth-in-Lending Act, the Home Mortgage Disclosure Act, the Real Estate Settlement Procedures Act, and the Community Reinvestment Act (CR Act). In addition, federal banking regulations limit the ability of banks and other financial institutions to disclose nonpublic personal information to unaffiliated third parties. The CR Act requires the OCC to assess HRB Bank’s record in meeting the credit needs of the communities served by HRB Bank, including low and moderate income neighborhoods. Under the CR Act, institutions are assigned a rating of outstanding, satisfactory, needs to improve, or substantial non-compliance. HRB Bank received a “satisfactory” rating in its most recent CR Act evaluation.
Bank Secrecy Act/Anti-Money Laundering Laws.
HRB Bank is subject to the Bank Secrecy Act and other anti-money laundering laws and regulations, including the USA PATRIOT Act of 2001. These laws and regulations require HRB Bank to implement policies, procedures, and controls to detect, prevent, and report money laundering and terrorist financing, and to verify the identity of its customers. Violations of these requirements can result in substantial civil and criminal sanctions.
Qualified Thrift Lender Test.
As a federal savings bank, HRB Bank is required to meet the Qualified Thrift Lender (QTL) test. This test requires HRB Bank to have at least 65% of its portfolio assets in qualified thrift investments on a monthly average for nine out of every 12 months on a rolling basis. As an alternative, HRB Bank may maintain 60% of its assets in those assets specified in Section 7701(a)(19) of the Internal Revenue Code. Under either test, HRB Bank is required to maintain a significant portion of its assets in residential housing related loans and investments. Any institution that fails to meet the QTL test is immediately subject to certain restrictions on its operations, unless it requalifies as a QTL. These restrictions also include limitations on paying any dividends. Failure to meet the QTL test is a statutory violation subject to enforcement action. As of April 30, 2013 and 2012, HRB Bank met the QTL test.
Insurance of Accounts.
HRB Bank is subject to certain regulations issued by the Federal Deposit Insurance Corporation (FDIC), which insures the deposits of HRB Bank to the maximum extent permitted by law. This regulation of HRB Bank is intended for the protection of its depositors and loan customers.
The FDIC insures HRB Bank’s deposit accounts. The FDIC assesses deposit insurance premiums on each FDIC-insured institution based on its capital, supervisory ratings, and other factors. As required by the Dodd-Frank Act, the FDIC adopted rules effective April 1, 2011, under which insurance premium assessments are based on an institution’s total assets minus its tangible equity instead of its deposits.
Transactions with Affiliates.
Transactions between HRB Bank and its affiliates are required to be on terms at least as favorable to HRB Bank as transactions with non-affiliates, and certain covered transactions are restricted to a percentage of HRB Bank’s capital.
Federal Home Loan Bank System.
HRB Bank is a member of the Federal Home Loan Bank of Des Moines (FHLB), which serves as a reserve or central bank for its members and makes loans or advances to its members. As of April 30,
2013
and
2012
, HRB Bank had no outstanding advances from the FHLB.
Federal Reserve Regulation of SLHCs.
Each of our Holding Companies is a savings and loan holding company within the meaning of the HOLA. As such, they are registered as unitary savings and loan holding companies with the Federal Reserve and are subject to Federal Reserve regulations, examinations, supervision and reporting requirements. In addition, the Federal Reserve has supervisory and enforcement authority over our Holding Companies and their non-bank subsidiaries. Among other things, this authority permits the Federal Reserve to restrict or prohibit activities that are determined to be a serious risk to HRB Bank. Our Holding Companies are expected to be a source of strength to HRB Bank, able to commit capital and liquidity to the bank during times of economic stress.
New SHLC Regulatory Capital Requirements.
The Dodd-Frank Act imposed new regulatory capital requirements for SLHCs. On August 30, 2012, the Federal Reserve published in the Federal Register a notice of proposed rulemaking on increased capital requirements, implementing changes required by the Dodd-Frank Act and aspects of the Basel III regulatory capital reforms, portions of which would apply to top-tier SLHCs including H&R Block, Inc. The OCC and the FDIC joined the Federal Reserve in requesting comments on new regulatory capital requirements for banks, savings banks and their holding companies. The proposed rules include new risk-based capital and leverage ratios including (1) minimum common equity Tier 1 risk-based capital ratio of 4.5%; (2) minimum Tier 1 risk-based capital ratio of 6.0%; (3) minimum total risk-based capital ratio of 8.0%; and (4) minimum Tier 1 capital to adjusted average consolidated assets (leverage ratio) of 4.0%. The proposed rules also require the subtraction of goodwill and other intangibles from capital determined under accounting principles generally accepted in the United States (GAAP) for the purposes of calculating Tier 1 capital. The proposed capital requirements for SLHCs, if implemented as proposed, would require us to retain additional capital, restrict our ability to (or the level at which we would be able to) pay dividends and repurchase
|
6
|
H&R Block 2013 Form 10K
|
shares of our common stock and alter our strategic plans. As originally proposed, these capital requirements would have been phased in incrementally beginning January 1, 2013, with full implementation to occur by January 1, 2015. However, the Federal Reserve announced on November 9, 2012 that the implementation would be postponed beyond January 1, 2013 to an unspecified date.
The proposed rules also add a requirement for a minimum capital conservation buffer of 2.5% of risk-weighted assets, which would be incremental to each of the above ratios except for the leverage ratio. If implemented as proposed, the conservation buffer would be phased in, starting at 0.625% on January 1, 2016, increasing by that amount each year until fully implemented effective January 1, 2019. The capital conservation buffer would result in the following minimum ratios: (1) a common equity Tier 1 risk-based capital ratio of 7.0%; (2) a Tier 1 risk-based capital ratio of 8.5%; and (3) a total risk-based capital ratio of 10.5%. Failure to maintain a conservation buffer would result in restrictions on capital distributions, which includes dividends and share repurchase activity, and certain discretionary cash bonus payments to executive officers.
The deadline for comment on the proposed rules was October 22, 2012, and numerous banking associations, industry groups, and individual companies provided comments on the proposed rules to the regulators. We filed a comment letter asking the Federal Reserve to follow the Collins Amendment, which includes provisions that defer the effective date for new minimum capital requirements for SLHCs until July 21, 2015, and make the proposed capital requirements for SLHCs effective no earlier than such date. The regulators are in the process of reviewing the comments before publishing final capital requirements.
If such regulations are implemented as proposed, banks and their holding companies, including our Holding Companies, will be subject to higher minimum capital requirements and will be required to hold a greater amount of equity than currently required. The regulations ultimately applicable to our Holding Companies may be substantially different from the proposed regulations. We will continue to monitor the rulemaking process for any modifications or clarifications that may be made prior to finalization. There is no assurance that the proposed rules will be adopted in their current form, what changes may be made prior to adoption, when the final rules will be effective, or how the final rules would ultimately affect our business.
As discussed in Item 1A, “Risk Factors,” we are in the process of evaluating alternative means of ceasing to be an SLHC, in which case we would no longer be subject to regulation by the Federal Reserve as an SLHC.
Consumer Financial Protection Bureau.
The Dodd-Frank Act created the new CFPB with the power to administer and enforce federal financial consumer protection laws. The CFPB may issue regulations that apply to HRB Bank, and to our non-bank subsidiaries that provide consumer financial services and products. The CFPB may examine, and take enforcement actions against, our non-bank subsidiaries. See Item 1A for further information on the CFPB.
See Item 7, under “Regulatory Environment” and Item 8, note 21 to the consolidated financial statements for additional discussion of regulatory requirements.
SERVICE MARKS, TRADEMARKS AND PATENTS
We have made a practice of selling our services and products under service marks and trademarks and of obtaining protection for these by all available means including, but not limited to, registration of our service marks and trademarks in the U.S. and other countries where our services and products are marketed. We consider these service marks and trademarks, in the aggregate, to be of material importance to our business, particularly our businesses providing services and products under the “H&R Block” brand.
We have no registered patents material to our business.
EMPLOYEES
We had approximately 2,200 regular full-time employees as of April 30,
2013
. The highest number of persons we employed during the fiscal year ended April 30,
2013
, including seasonal employees, was approximately 80,700.
AVAILABILITY OF REPORTS AND OTHER INFORMATION
Our annual report on Form 10-K, quarterly reports on Form 10-Q, current reports on Form 8-K and all amendments to those reports filed with or furnished to the SEC are available, free of charge, through our website at
www.hrblock.com
as soon as reasonably practicable after such reports are electronically filed with or furnished to the SEC. The public may read and copy any materials we file with the SEC at the SEC’s Public Reference Room at 100 F Street, NE, Washington, DC 20549. The public may obtain information on the operation of the Public Reference Room by calling the SEC at 1-800-SEC-0330. The SEC maintains a website at
www.sec.gov
containing reports, proxy and information statements and other information regarding issuers who file electronically with the SEC.
|
H&R Block 2013 Form 10K
|
7
|
The following corporate governance documents are posted on our website at
www.hrblock.com:
|
n
|
The Amended and Restated Articles of Incorporation of H&R Block, Inc.;
|
|
|
n
|
The Amended and Restated Bylaws of H&R Block, Inc.;
|
|
|
n
|
The H&R Block, Inc. Corporate Governance Guidelines;
|
|
|
n
|
The H&R Block, Inc. Code of Business Ethics and Conduct;
|
|
|
n
|
The H&R Block, Inc. Board of Directors Independence Standards;
|
|
|
n
|
The H&R Block, Inc. Audit Committee Charter;
|
|
|
n
|
The H&R Block, Inc. Compensation Committee Charter;
|
|
|
n
|
The H&R Block, Inc. Finance Committee Charter; and
|
|
|
n
|
The H&R Block, Inc. Governance and Nominating Committee Charter.
|
|
If you would like a printed copy of any of these corporate governance documents, please send your request to the Office of the Secretary, H&R Block, Inc., One H&R Block Way, Kansas City, Missouri 64105.
Information contained on our website does not constitute any part of this report.
|
ITEM 1A.
|
RISK FACTORS
|
Our business activities expose us to a variety of risks. Identification, monitoring and management of these risks are essential to the success of our operations and the financial soundness of H&R Block. Senior management and the Board of Directors, acting as a whole and through its committees, take an active role in our risk management process and have delegated certain activities related to the oversight of risk management to the Company's Risk Committee, which is comprised of senior managers of major businesses and control functions. The Risk Committee is responsible for identifying and monitoring risk exposures and leading the continued development of our risk management policies and practices.
An investment in our securities involves risk, including the risk that the value of an investment may decline or that returns on that investment may fall below expectations. There are a number of significant factors that could cause actual conditions, events or results to differ materially from those described in forward-looking statements, many of which are beyond management’s control or its ability to accurately estimate or predict, or that could adversely affect our financial position, results of operations, cash flows and the value of an investment in our securities.
RISKS RELATING TO CONTINUING OPERATIONS
Increased competition for tax preparation clients could adversely affect our current market share and profitability. Offers of free tax preparation services could adversely affect our revenues and profitability.
We provide both assisted and DIY tax preparation services and products and face substantial competition throughout our businesses. The assisted tax services category in the tax preparation industry is highly competitive. There are a substantial number of tax return preparation firms and accounting firms offering tax return preparation services. Many tax return preparation firms and many firms not otherwise in the tax return preparation business are involved in providing electronic filing and other related services to the public, and certain firms provide RACs and other similar products. Commercial tax return preparers and electronic filers are highly competitive with regard to price and service. In the DIY category of the tax preparation industry, options include the use of traditional paper forms and various forms of digital electronic assistance, including online, mobile and desktop software, all of which we offer. Our digital tax solutions services and products also compete with in-office tax preparation services and a number of online and software companies, primarily on the basis of price and functionality. Assisted and DIY competitors offer various tax preparation services and products at no charge. Intense price competition could result in a reduction of our market share, lower revenues or lower margins.
U.S. federal and certain state taxing authorities, as well as taxing authorities in certain foreign jurisdictions in which we operate, currently offer, or facilitate the offering of, tax return preparation and electronic filing options to taxpayers at no charge, and volunteer organizations prepare tax returns at no charge for low-income taxpayers. In addition, many of our competitors offer certain tax preparation and electronic filing options at no charge. In order to compete, we also have free tax service offerings in several categories. We enabled the preparation of
774,000
,
861,000
and
767,000
U.S. federal income tax returns in fiscal years
2013
,
2012
and
2011
, respectively, at no charge through the FFA. We also have free online tax preparation offerings and provided free preparation of Federal 1040EZ forms in fiscal years
2013
,
2012
and
2011
, and free RACs to certain clients in fiscal year 2012. There can be no assurance that we will be able to attract clients or effectively ensure the migration of clients from our free tax service offerings to those for which we receive fees, and clients who have formerly paid for our tax service offerings may elect to use free offerings instead. These competitive factors may diminish our revenue and profitability, or harm our ability to acquire and retain clients.
|
8
|
H&R Block 2013 Form 10K
|
Government tax authorities, volunteer organizations and our direct competitors may also elect to expand free offerings in the future. From time to time U.S. federal and state governments have considered various proposals (often referred to as “Return-Free Filing” or “Real-Time Tax”) through which the respective governmental taxing authorities would use taxpayer information to “pre-populate,” prepare and calculate tax returns and distribute them to taxpayers. The taxpayer could then challenge the return or sign and return it. Although the FFA has kept the federal government from becoming a direct competitor to our tax service offerings in the U.S., it has fostered additional online competition and may cause us to lose significant revenue opportunities. We anticipate that governmental encroachment at both the U.S. federal and state levels, as well as comparable government levels in foreign jurisdictions in which we operate, may present a continued competitive threat to our business for the foreseeable future.
See tax returns prepared statistics included in Item 7, under “Tax Services – Operating Statistics.”
Failure to comply with laws and regulations that protect our clients’ and employees’ personal and financial information could harm our brand and reputation and could result in significant fines, penalties and damages.
A number of our businesses collect, use and retain large amounts of personal client information and data, including credit card numbers, tax return information, bank account numbers and social security numbers. In addition, we collect and maintain personal information of our employees in the ordinary course of our business. Some of this personal information is held and some transactions are executed by third parties. We use security and business controls to limit access to and use of personal information. However, unauthorized individuals or third parties may be able to circumvent these security and business measures, which may require notification under applicable data privacy regulations. We employ contractors and temporary employees who may have access to the personal information of clients and employees or who may execute transactions in the normal course of their duties. While we conduct background checks and limit access to systems and data, it is possible that one or more of these controls could be circumvented. Improper disclosure or use of our client's personal and financial information could result in damage to our brand and reputation; actions required to remediate improper disclosures could be costly.
We are subject to laws, rules and regulations relating to the collection, use, disclosure and security of consumer financial information, which have drawn increased attention from U.S. federal and state governments, as well as governmental authorities in foreign jurisdictions in which we operate. In the U.S., the IRS imposes various prohibitions on the use or disclosure by a tax return preparer of a taxpayer's information for purposes other than tax return preparation without the prior written consent of the taxpayer. In addition, other regulations require financial service providers to adopt and disclose consumer privacy policies and provide consumers with a reasonable opportunity to “opt-out” of having nonpublic personal information disclosed to unaffiliated third parties. Several jurisdictions have passed new laws in this area and other jurisdictions are considering imposing additional restrictions. These laws may be interpreted and applied inconsistently from jurisdiction to jurisdiction and our current data protection policies and practices may not be consistent with those interpretations and applications. In addition, changes in these U.S. federal and state regulatory requirements, as well as requirements imposed by governmental authorities in foreign jurisdictions in which we operate, could result in more stringent requirements and could result in a need to change business practices, including the types of information we can use and the manner in which we can use such information. Establishing systems and processes to achieve compliance with these new requirements may increase costs or limit our ability to pursue certain business opportunities.
A security breach involving confidential client information may adversely affect our offer of online services, our reputation and financial performance.
We offer a range of services to our clients online, including digital and assisted tax services and banking services provided by HRB Bank, and we store a large amount of personal client data on our servers. A significant requirement of providing online financial transactions is the secure transmission of confidential information over public networks. We and our vendors use commercially available security technologies to protect confidential transactions and personal information. The systems we use rely on encryption and authentication technology to provide secure transmission of confidential information. However, advances in computer capabilities, new discoveries in the field of cryptography or other developments could result in a compromise or breach of the algorithms used to protect client data. Errors in the storage, use or transmission of personal information may result in a breach of client data. If we, or another provider of financial services through the internet, were to suffer damage from a security breach, public acceptance and use of our online services could suffer.
In addition, our clients may access our online tax services from their computers and mobile devices, install and use our H&R Block At Home
®
tax preparation software on their computers, and access online banking services from their computers and mobile devices. Because our business model relies on our clients' use of their own personal computers, mobile devices and the internet, computer viruses and other attacks on our clients' personal computer systems and mobile devices could create losses for our clients even without any breach in the security of our systems, and could thereby harm our business and our reputation. We also rely on our franchisees to maintain secure systems.
A major breach of our security measures or those of our franchisees or third parties that execute transactions or hold and manage personal information may have serious negative consequences for our businesses, including reduced client demand for our services and products, harm to our reputation and brands, possible fines, penalties and damages, further regulation and oversight by U.S. federal, state or foreign governmental agencies, and loss of our ability to provide financial transaction services or accept and
|
H&R Block 2013 Form 10K
|
9
|
process client credit card orders or tax returns. From time to time, we detect, or receive notices from clients or public or private agencies that they have detected, vulnerabilities in our servers, our software or third-party software components that are distributed with our services and products. The existence of vulnerabilities, even if they do not result in a security breach, may harm client confidence and require substantial resources to address, and we may not be able to discover or remediate such security vulnerabilities before they are exploited. Although we have commercially available network and application security, internal control measures, and physical security procedures to safeguard our systems, there can be no assurance that a security breach, intrusion, loss or theft of personal information will not occur.
Any security breach could impair our ability to grow and maintain profitability and, possibly, our ability to continue delivering our services and products through the internet. Although we, with the help of third party service providers, intend to continue to implement security technology and establish operational procedures to prevent security breaches, there can be no assurance that these measures will be successful, which could harm our business, reputation with clients and future financial results and require us to expend significant resources to address these matters, including notification under data privacy regulations.
An interruption in our information systems, or those of our franchisees or a third party on which we rely, or an interruption in the internet could have a material adverse effect on our business and our consolidated financial position, results of operations and cash flows.
We rely heavily upon communications and information systems and the internet to conduct our business. Our systems and operations are potentially vulnerable to damage or interruption from network failure, hardware failure, software failure, power or telecommunications failures, computer viruses and worms, negative disruptions to the operation of the internet, penetration of our network by hackers or other unauthorized users and natural disasters. Any failure or interruption in our information systems, or information systems of our franchisees or a third party on which we rely, or an interruption in the internet or other critical business capability could negatively impact our core business operations and increase our risk of loss. As our businesses are seasonal, our systems must be capable of processing high volumes during peak season. Therefore, service interruptions resulting from system or internet failures could negatively impact our ability to serve our clients, which in turn could have a material adverse effect on our business and our consolidated financial position, results of operations and cash flows.
We cannot make assurances that system or internet failures, or interruptions in critical business capabilities will not occur, or if they do occur that we, our franchisees or the third parties on whom we rely will adequately address them. The precautionary measures that we have implemented to avoid systems outages and to minimize the effects of any data or communication systems interruptions may not be adequate, and we may not have anticipated or addressed all of the potential events that could threaten or undermine our information systems or other critical business capability. The occurrence of any systems or internet failure, or business interruption could negatively impact our ability to serve our clients, which in turn could have a material adverse effect on our business and our consolidated financial position, results of operations and cash flows.
Government initiatives that simplify tax return preparation or expedite refunds could reduce the need for our services as a third-party tax return preparer, and cause our revenues or results of operations to decline.
Many taxpayers seek assistance from paid tax return preparers such as us not only because of the level of complexity involved in the tax return preparation and filing process, but also because of paid tax return preparers' ability to expedite refund proceeds under certain circumstances. From time to time, the IRS or members of Congress propose measures seeking to simplify the preparation and filing of federal tax returns, including preparation of tax returns directly by the IRS, and to provide additional assistance with respect to preparing and filing such tax returns or expediting refunds. H&R Block is a member of the FFA, which provides the ability for low-income taxpayers to prepare and file their own tax return for free. The IRS has been exploring the Real Time Tax System concept, which would require that documents (such as W-2s and 1099s) must be on file with the IRS prior to the taxpayer submitting their tax return. The objective of this concept would be to facilitate document matching such that it would reduce fraud, and after the fact audits. The implementation of the Real Time Tax System would provide the foundation for the IRS preparation of tax returns, and thus, were it to come to fruition, makes the pre-populated return a more tangible possibility.
In the past, the U.S. Department of the Treasury completed a prepaid debit card pilot program designed to facilitate the refund process. HRB Bank also provides this type of service through its H&R Block Prepaid Emerald MasterCard®. Additionally, the IRS has in the past explored the possibility of allowing taxpayers to allocate a portion of their tax refund to pay the tax preparation fees, which could reduce the demand for RACs. However, the IRS has not advanced this initiative. Taxing authorities in foreign jurisdictions in which we operate, and various state and local taxing authorities, have also introduced measures seeking to simplify the preparation and filing of tax returns in their respective jurisdictions. The adoption or expansion of any measures that significantly simplify tax return preparation, expedite refunds or otherwise reduce the need for a third-party tax return preparer could reduce demand for our services and products and cause our revenues or results of operations to decline.
|
10
|
H&R Block 2013 Form 10K
|
Proposed Federal Reserve capital requirements may restrict our capital allocation strategies and we are therefore exploring alternatives to cease being an SLHC. If we were to cease being an SLHC, the means we use to deliver financial services and products to our customers and the revenues and profitability of those offerings could be adversely impacted.
Our subsidiary, HRB Bank, is a federal savings bank. Our Holding Companies are SLHCs because they control HRB Bank.
The Dodd-Frank Act requires the Federal Reserve to promulgate minimum capital requirements for SLHCs, including leverage and risk-based capital requirements that are no less stringent than those applicable to insured depository institutions at the time the Dodd-Frank Act was enacted. On August 30, 2012, the Federal Reserve published in the Federal Register a notice of proposed rulemaking on regulatory capital requirements, implementing changes required by the Dodd-Frank Act and aspects of the Basel III regulatory capital reforms, portions of which would apply to our Holding Companies (“Proposed Capital Rules”). The OCC, which regulates HRB Bank, and the FDIC joined the Federal Reserve in requesting comments on the Proposed Capital Rules. The comment period expired on October 22, 2012. We provided formal comments on the Proposed Capital Rules. It is currently unclear what the regulatory capital requirements for SLHCs will be and when such capital requirements will become effective. The Federal Reserve announced on November 9, 2012 that the implementation would be postponed beyond January 1, 2013 to an unspecified date. See Item 1, “Regulation and Supervision - Bank and Holding Companies,” for details of the proposed requirements.
The Federal Reserve Bank, the Company's primary banking regulator, has issued guidance set forth in Supervisory Letter SR 09-4 (March 27, 2009) regarding the payment of dividends, stock redemptions and stock repurchases by bank holding companies. Pursuant to Supervisory Letter SR 11-11 (July 21, 2011), the Federal Reserve has directed examiners to apply the principles of SR 09-4 to SLHCs. Pursuant to SR 09-4, we have committed to provide notice to the Federal Reserve prior to paying dividends or repurchasing shares.
The Proposed Capital Rules would require our Holding Companies to retain significant additional capital, even though HRB Bank has regulatory capital substantially above the “well capitalized” level. At this time, we do not foresee regulatory flexibility in this regard in light of the Federal Reserve's views of the statutory requirements imposed under the Dodd-Frank Act. Accordingly, while our current belief is that dividends at current levels would continue to be permitted as long as HRB Bank remains well capitalized, the Federal Reserve will closely supervise and likely restrict our other capital allocation decisions, including stock repurchases, acquisitions, and other forms of strategic investment.
As previously announced, we are in the process of evaluating alternative means of ceasing to be an SLHC, in which case we would no longer be subject to regulation by the Federal Reserve as an SLHC. In connection with that evaluation, we are exploring alternatives to continue delivering financial services and products to our customers.
Our evaluation of alternatives is ongoing and we cannot predict the timing, the circumstances, or the likelihood of us ceasing to be regulated as an SLHC, or whether cessation of SLHC status would have a material adverse effect on our business and our consolidated financial position, results of operations, and cash flows. If we are successful in our efforts to cease being an SLHC, the means we use to deliver financial services and products to our customers will change, and the revenues and profitability of those offerings could be adversely impacted.
HRB Bank is subject to extensive U.S. federal banking laws and regulations. If we fail to comply with applicable banking laws and regulations, we could be subject to disciplinary actions, damages, penalties or restrictions that could significantly harm our business.
HRB Bank is subject to regulation, examination, supervision, reporting requirements and enforcement by the OCC. The OCC can, among other things, issue cease-and-desist orders, assess civil money penalties and remove bank directors, officers or employees, for violations of banking laws and regulations or engaging in unsafe and unsound banking practices.
HRB Bank is subject to OCC regulatory capital requirements. Failure to meet minimum capital requirements may trigger actions by regulators that could have a direct, material effect on HRB Bank. HRB Bank must meet specific capital guidelines involving quantitative measures of assets, liabilities and certain off-balance sheet items as calculated under regulatory accounting practices. OCC regulations currently require HRB Bank to maintain minimum amounts and ratios of tangible equity, total risk-based capital and Tier 1 capital.
The laws and regulations imposed by U.S. federal banking regulators generally involve restrictions and requirements in connection with a variety of technical, specialized and expanding matters and concerns. For example, compliance with anti-money laundering and know-your-customer requirements, and the Bank Secrecy Act, has taken on heightened importance with regulators as a result of efforts to limit terrorism. There has been increased regulation with respect to the protection of customer privacy and the need to secure sensitive customer information. Being subject to banking regulation may put us at a disadvantage compared to our competitors which are not subject to such requirements.
The OCC could deem certain products offered by HRB Bank to be “unsafe and unsound” and require HRB Bank to discontinue offering such products. To the extent such products are instrumental in attracting clients to our offices for tax preparation services,
|
H&R Block 2013 Form 10K
|
11
|
we could experience a significant loss of clients should such products be discontinued. This could cause our revenues or profitability to decline.
The Dodd-Frank Act created the CFPB to administer and enforce all U.S. federal consumer protection laws and expanded the role of state regulators with respect to consumer protection laws. Regulations promulgated by the CFPB or state regulators may affect our bank and financial services businesses in ways we cannot predict, which may require changes to our financial products, services and contracts.
The Dodd-Frank Act also created the CFPB with broad powers to administer and enforce all U.S. federal consumer protection laws. The CFPB has broad rule-making authority for a wide range of consumer protection laws that apply to all banks, federal savings banks, and other financial services companies, including the authority to prohibit “unfair, deceptive or abusive” acts and practices. The CFPB has examination and enforcement authority over all banks with more than $10 billion in assets. Banks with $10 billion or less in assets will continue to be examined for compliance with the consumer laws by their primary bank regulators. HRB Bank does not currently have assets in excess of $10 billion.
Although the CFPB has extensive rulemaking and enforcement powers that may impact our business operations, the potential reach of the CFPB's authority on the operations of banks and financial services companies offering consumer financial services or products, including our bank and financial services subsidiaries, is currently unknown. The CFPB may examine, and take enforcement actions against, our non-bank subsidiaries that provide consumer financial services and products. The Dodd-Frank Act also expanded the role of state regulators in enforcing and promulgating consumer protection laws, the results of which could be states issuing new and broader consumer protection laws, some of which could be more comprehensive than U.S. federal regulations. New CFPB and state regulations may require changes to our financial products, services and contracts, the effects of which cannot be predicted.
The nature of our tax service and product offerings requires timely product launches. Any significant delays in launching our tax service and product offerings, changes in government regulations or processes that affect how we provide such offerings to our clients, or significant problems with such offerings may harm our revenue, results of operations and reputation.
Tax laws and tax forms are subject to change each year, and the nature and timing of any such changes are unpredictable. As a part of our business, we must incorporate any changes to tax laws and tax forms into our tax service and product offerings, including our H&R Block At Home
®
online tax services and tax preparation software. The unpredictable nature of changes to tax laws and tax forms can result in condensed development cycles for our tax service and product offerings because our clients expect high levels of accuracy and a timely launch of such offerings to prepare and file their taxes by the tax filing deadline and, in turn, receive any tax refund amounts on a timely basis. In addition, governmental authorities continually change their processes for accepting tax filings and related tax forms. Any changes in governmental regulations and processes that affect how we provide services and products to our clients may require us to make corresponding changes to our client service systems and procedures. Furthermore, any unanticipated changes in governmental processes for accepting tax filings and related forms, or the ability of taxing authorities to accept electronic tax return filings, may result in delays in processing our clients' tax filings, or delays in tax authorities accepting electronic tax return filings, and, in turn, delay any tax refund amounts to which such clients may be entitled. From time to time, we review and enhance our quality controls for assuring accurate tax returns that we prepare, but there can be no assurance that we will be able to prevent all inaccuracies.
If we encounter development challenges or discover errors in our services and products late in our development cycle it may cause us to delay the launch dates of our offerings. Any major defects or launch delays, or failure to anticipate changes in governmental processes accepting tax filings and related forms, may lead to loss of clients and revenue, negative publicity, client and employee dissatisfaction, a deterioration in our business relationships with our franchisees, reduced retailer shelf space and promotions, exposure to litigation and increased operating expenses.
We rely on a single vendor or a limited number of vendors to provide certain key services or products, and the inability of these key vendors to meet our needs could have a material adverse effect on our business and our consolidated financial position, results of operations and cash flows.
Historically we have contracted, and in the future will likely continue to contract, with a single vendor or a limited number of vendors to provide support for our tax, financial and other services and products. In certain instances, we are vulnerable to vendor error, service inefficiencies, service interruptions or service delays; however, our sensitivity to any of these issues may be heightened (1) due to the seasonality of our business, (2) with respect to any vendor that we utilize for the provision of any such product or service that has specialized expertise, (3) with respect to any vendor which is a sole provider, or (4) with respect to any vendor whose indemnification obligations are limited or who does not have the financial capacity to satisfy its indemnification obligations. If such a vendor is unable to meet our needs in a timely manner or if the services or products provided by such a vendor are terminated or otherwise delayed because the vendor fails to perform adequately, is no longer in business, experiences shortages, or discontinues a certain product or service that we utilize, or if we are not able to develop alternative sources for these services
|
12
|
H&R Block 2013 Form 10K
|
and products quickly and cost-effectively, it could result in a material and adverse impact on our business and our consolidated financial position, results of operations and cash flows.
The highly seasonal nature of our business presents financial risks and operational challenges, which if we fail to address could materially affect our business and our consolidated financial position, results of operations and cash flows.
Our business is highly seasonal, with the substantial portion of our revenue earned in the last four months of our fiscal year, which is the period from January through April of each year. The concentration of our revenue-generating activity during this relatively short period presents a number of challenges for us, including but not limited to: (1) cash and resource management during the first eight months of our fiscal year, when we generally operate at a loss and incur fixed costs and costs of preparing for the upcoming tax season; (2) ensuring compliance with financial covenants under our debt agreements, particularly if the timing of our revenue generation deviates from this seasonal period; (3) the availability of a seasonal workforce, including tax professionals, and our ability to hire, train, and supervise these employees; (4) responding to changes in competitive conditions, including marketing, pricing, and new product offerings, which could affect our position during the tax season; (5) disruptions in a tax season, including any customer dissatisfaction issues, may not be timely discovered; and (6) ensuring optimal uninterrupted operations and service delivery during peak season. If we experience significant business disruptions during the tax season or if we are unable to satisfactorily address the challenges described above and related challenges associated with a seasonal business, we could experience a loss of business, which could have a material adverse effect on our business and our consolidated financial position, results of operations and cash flows.
We face substantial litigation in connection with our various business activities, and such litigation may damage our reputation, impair our product offerings or result in material liabilities and losses.
We have been named and from time to time will likely continue to be named, as a defendant in various legal actions, including arbitrations, class actions, actions or inquiries by state attorneys general, and other litigation arising in connection with our various business activities, including relating to our various service and product offerings. We also grant our franchisees a limited license to use our registered service marks and, accordingly, there is risk that one or more of the franchisees may be identified as being controlled by us. Third parties, regulators or courts may seek to hold us responsible for the actions or failures to act by our franchisees. Adverse outcomes related to litigation could result in substantial damages and could cause our earnings to decline. Negative public opinion could also result from our subsidiaries' actual or alleged conduct in such claims, possibly damaging our reputation, which, in turn, could adversely affect our business prospects and cause the market price of our securities to decline.
In addition, we have been sued, and certain of our competitors have been sued, in connection with the offering of different types of refund transfer products. A court issued a ruling, which is not subject to appellate review, that a competitor's specific version of a refund transfer product should be considered a loan, and subject to truth-in-lending and other related laws. Another competitor recently entered into a settlement agreement, subject to final court approval, involving similar claims. We believe there are factual and legal differences that distinguish us and our RAC product from that of our competitors. Revenues from our RAC product totaled $158 million in fiscal year 2013; any requirement that materially alters our offering of RACs, including limitations on the fees we charge or disclosure requirements that could reduce the demand for these products, could have a material adverse impact on our business and our consolidated financial position, results of operations and cash flows.
Our access to liquidity may be negatively impacted as disruptions in credit markets occur, if credit rating downgrades occur or if we fail to meet certain covenants. Funding costs may increase, leading to reduced earnings.
We need liquidity to meet our off-season working capital requirements, to service debt obligations including refinancing of maturing obligations, and for other corporate purposes. Our access to and the cost of liquidity could be negatively impacted in the event of credit rating downgrades or if we fail to meet existing debt covenants. In addition, events could occur which could increase our need for liquidity above current levels.
If rating agencies downgrade our credit rating, the cost of debt under our existing financing arrangements, as well as future financing arrangements and borrowings under our commercial paper program, could increase and capital market access could decrease or become unavailable. Our unsecured committed line of credit (2012 CLOC) is subject to various covenants, and a violation of a covenant could impair our access to liquidity currently available through the 2012 CLOC. If current sources of liquidity were to become unavailable, we would need to obtain additional sources of funding, which may not be available or may only be available under less favorable terms.
The continued payment of dividends on our common stock and repurchases of our common stock are dependent on a number of factors, and future payments and repurchases cannot be assured.
We need liquidity sufficient to fund payments of dividends on our common stock and repurchases of our common stock. In addition, holders of our common stock are only entitled to receive such dividends as our Board of Directors may declare out of funds legally available for such payments, and our Board of Directors may only authorize the Company to repurchase shares of our common
|
H&R Block 2013 Form 10K
|
13
|
stock with funds legally available for such repurchases. The payment of future dividends and future repurchases will depend upon our earnings, economic conditions, liquidity and capital requirements and other factors, including our debt leverage. Accordingly, we cannot make any assurances that future dividends will be paid, or future repurchases will be made, at levels comparable to our historical practices, if at all. Due to the seasonal nature of our business, and the fact that our business is not asset-intensive, there may be periods of time during our fiscal year in which the payment of dividends or stock repurchases may cause us to have a negative net worth under GAAP, which, in turn, could create challenges in maintaining our credit ratings and our access to capital markets. See additional discussion regarding our provision of notice to the Federal Reserve prior to paying dividends or repurchasing shares in the risk factor related to the proposed Federal Reserve capital requirements.
Our businesses may be adversely affected by difficult economic conditions, in particular, high unemployment levels.
Difficult economic conditions are frequently characterized by high unemployment levels and declining consumer and business spending. These poor economic conditions may negatively affect demand and pricing for our services and products. Higher unemployment levels, especially within client segments we serve, may result in clients no longer being required to file tax returns, electing not to file tax returns, or clients seeking lower cost preparation and filing alternatives. Sustained levels of high unemployment may negatively impact our ability to increase or retain tax preparation clients.
Economic conditions that negatively affect housing prices and the job market may result in deterioration in credit quality of mortgage loans held for investment and other loans, and such deterioration could have a negative impact on our business and profitability. The fair value of these mortgage loans is less than their carrying value and a decision by us to no longer hold these loans for investment would result in a significant impairment.
The overall credit quality of mortgage loans held for investment is impacted by the strength of the U.S. economy and local economic conditions, including residential housing prices. Economic trends that negatively affect housing prices and the job market could result in deterioration in credit quality of our mortgage loan portfolio and a decline in the value of associated collateral. Future interest rate resets could also lead to increased delinquencies in our mortgage loans held for investment.
Mortgage loans held by us are secured by properties concentrated in the states of Florida, New York and California, which represented
19%
,
19%
and
11%
, respectively, of total mortgage loans held for investment at April 30,
2013
. No other state held more than 10% of loan balances. If adverse trends in the residential mortgage loan market continue, particularly in geographic areas with a greater concentration of mortgage loans, we could incur additional loan loss provisions.
Mortgage loans purchased from our affiliate, Sand Canyon Corporation, previously known as Option One Mortgage Corporation (including its subsidiaries, collectively, SCC) represent
57%
of total loans held for investment at April 30,
2013
. These loans have experienced higher delinquency rates than other loans, and may expose us to greater risk of credit loss.
Mortgage loans held for investment had a carrying value of
$338.8 million
and a fair value of
$210.9 million
at April 30, 2013. Although we have no current intent to do so, if we decide to sell these mortgage loans in the future we would incur an impairment loss for the difference between carrying value and fair value at the time of sale.
In addition to mortgage loans, we also extend secured and unsecured credit to other clients, including providing EAs to our tax clients. We may incur significant losses on credit we extend, which in turn could reduce our profitability.
Our business depends on our strong reputation and the value of our brands.
Developing and maintaining awareness of our brands is critical to achieving widespread acceptance of our existing and future services and products and is an important element in attracting new clients. In addition, our franchisees operate their businesses under our brands. Adverse publicity (whether or not justified) relating to events or activities attributed to us, our franchisees, employees or agents may tarnish our reputation and reduce the value of our brands. Damage to our reputation and loss of brand equity may reduce demand for our services and products and thus have an adverse effect on our future financial results, as well as require additional resources to rebuild our reputation and restore the value of our brands.
Failure to protect our intellectual property rights may harm our competitive position, and litigation to protect our intellectual property rights or defend against third party allegations of infringement may be costly.
Despite our efforts to protect our intellectual property and proprietary information, we may be unable to do so effectively in all cases. Competitors may misappropriate our trademarks or other intellectual property rights or duplicate our technology and products which may adversely affect our ability to compete with them. To the extent that our intellectual property is not protected effectively through trademarks, patents or other means, other parties, including former employees, with knowledge of our intellectual property may seek to exploit our intellectual property for their own or others' advantage. In addition, third-parties may allege we are infringing on their intellectual property, and we may face intellectual property challenges from other parties. We may not be successful in defending against any such challenges or in obtaining licenses to avoid or resolve any intellectual property disputes
|
14
|
H&R Block 2013 Form 10K
|
and, in that event, we could lose significant revenues, incur significant license, royalty or technology development expenses, or pay significant monetary damages.
Failure to maintain sound business relationships with our franchisees may have a material adverse effect on our business and our consolidated financial position, results of operations and cash flows.
Our financial success depends in significant part on our ability to maintain sound business relationships with our franchisees. The support of our franchisees is also critical for the success of our marketing programs and any new strategic initiatives we seek to undertake. Deterioration in our relationships with our franchisees or the failure of our franchisees to support our marketing programs and strategic initiatives could have a material adverse effect on our business and our consolidated financial position, results of operations and cash flows.
Our international operations are subject to increased risks which may harm our business and our consolidated financial position, results of operations and cash flows.
We currently have operations in Canada, Australia, India, and Brazil, and may consider expansion opportunities in additional countries in the future. In addition to uncertainty about our ability to generate revenues from these foreign operations and expand into other international markets, there are risks inherent in doing business internationally, including: (1) changes in trade regulations; (2) difficulties in managing foreign operations as a result of distance, language, and cultural differences; (3) profit repatriation restrictions, and fluctuations in foreign currency exchange rates; (4) geopolitical events, including acts of war and terrorism, and economic and political instability; (5) compliance with U.S. laws such as the Foreign Corrupt Practices Act and similar foreign laws; and (6) risks related to other government regulation or required compliance with local laws. These risks inherent in our international operations and expansion increase our costs of doing business internationally and may result in harm to our business and our consolidated financial position, results of operations and cash flows.
RISKS RELATING TO DISCONTINUED OPERATIONS
SCC is subject to potential contingent losses related to representation and warranty claims, which may have an adverse effect on our cash flows, financial condition and results of operations. SCC has accrued an estimated liability related to these contingent losses that may not be adequate.
SCC remains exposed to losses relating to mortgage loans it previously originated. Mortgage loans originated by SCC were sold either as whole loans to single third-party buyers or in the form of residential mortgage-backed securities (RMBSs).
In connection with the sale of loans or RMBSs, SCC made certain representations and warranties. These representations and warranties varied based on the nature of the transaction and the buyer's or insurer's requirements, but generally pertained to the ownership of the loan, the validity of the lien securing the loan, borrower fraud, the loan's compliance with the criteria for inclusion in the transaction, including compliance with SCC's underwriting standards or loan criteria established by the buyer, ability to deliver required documentation, and compliance with applicable laws. SCC believes it would have an obligation to repurchase a loan or indemnify certain parties with respect to a claim for a breach of a representation and warranty only if such breach materially and adversely affects the value of the mortgage loan, or a securitization insurer's or certificate holder's interest in the mortgage loan, and the mortgage loan has not been liquidated, although there is limited and conflicting case law on the liquidated loan defense issue. Such claims together with any settlement arrangements related to these losses are collectively referred to as “representation and warranty claims.”
The statute of limitations for a contractual claim to enforce a representation and warranty obligation is generally six years or such shorter limitations period that may apply under the law of a state where the economic injury occurred. SCC believes that the limitations period begins to run from the applicable closing date of the sale of the loans or RMBS, although there is limited and conflicting case law on this issue. During fiscal year 2013, SCC entered into tolling agreements with several parties to toll the running of any applicable statute of limitations related to potential representation and warranty claims and other claims against SCC.
Development of loss estimates is subjective, subject to a high degree of management judgment, and estimates may vary significantly period to period. SCC records a liability for losses related to representation and warranty claims when those losses are believed to be both probable and reasonably estimable. Historically, SCC has developed its estimate of losses related to representation and warranty claims based primarily on projections of future claims on a loan-by-loan basis. As a result of counterparty activity occurring during the fourth quarter, SCC has reassessed its prior estimate for losses, placing greater emphasis on bulk settlement discussions involving counterparties subject to tolling agreements rather than projections of future claims on a loan-by-loan basis. The estimate is based on the best information currently available, significant management judgment, and a number of factors, including developments in case law and the factors mentioned in Item 7, “Critical Accounting Estimates,” that are subject to change. Changes in any one of these factors could significantly impact the estimate.
SCC has accrued a liability as of April 30, 2013 for estimated contingent losses arising from representation and warranty claims of
$158.8 million
. If future losses are in excess of SCC's accrued liability, those losses could have a material adverse effect on our
|
H&R Block 2013 Form 10K
|
15
|
business and our consolidated financial position, results of operations and cash flows, as SCC's financial condition, operating results and cash flows are included in our consolidated financial statements. The accrued liability does not include potential losses related to litigation matters discussed in the risk factor below and in Item 8, note 18 to the consolidated financial statements. Also see Item 8, note 19 to the consolidated financial statements.
SCC is subject to potential contingent losses related to securitization transactions in which SCC participated as a depositor or loan originator, which may result in significant financial losses.
Between January 2005 and November 2007, SCC participated in approximately 110 securitization transactions. In most of these securitization transactions, SCC agreed, subject to certain conditions and limitations, to indemnify the underwriters or depositors for certain losses and expenses that the underwriters or depositors may incur as a result of certain claims made against them relating to loans originated by SCC, including certain legal expenses the underwriters or depositors incur in their defense of such claims. Some of those underwriters and depositors are defendants in lawsuits where various other parties allege a variety of claims, including violations of U.S. federal and state securities law and common law fraud based on alleged materially inaccurate or misleading disclosures, arising out of the activities of such underwriters or depositors in their sale of RMBSs or mortgage loans. Based on information currently available to SCC, it believes that the 15 lawsuits in which notice of a claim for indemnification has been made involve original investments of approximately $14 billion. Because SCC is not party to these lawsuits (with the exception of the
Federal Home Loan Bank of Chicago v. Bank of America Funding Corporation
case discussed in Item 8, note 18) and does not have control of this litigation, SCC does not have precise information about the amount of damages or other remedies being asserted or the defenses to the claims in such lawsuits. Additional notices of claims for indemnification may be received by SCC in the future from underwriters or depositors who are subject to existing or new litigation.
In addition, other counterparties to the securitization transactions, including certificate holders, securitization trustees and monoline insurance companies, have filed or may file lawsuits, or may assert indemnification claims, directly against depositors and loan originators in securitization transactions alleging a variety of claims, including U.S. federal and state securities law violations, common law torts and fraud and breach of contract, among others. Additional or new lawsuits may be filed against SCC in the future.
These matters are in the early stages and SCC is not able to reasonably estimate the associated amount of any possible loss or range of loss. As a result, we have not accrued any liability related to these exposures. However, if SCC were required to pay material amounts with respect to these matters, it could have a material adverse effect on our business and our consolidated financial position, results of operations and cash flows, as SCC's financial condition, operating results and cash flows are included in our consolidated financial statements. See Item 8, note 18 to the consolidated financial statements for additional information.
H&R Block has guaranteed the payment of certain limited claims against SCC.
SCC is subject to representation and warranty claims by counterparties to SCC whole loan sales and securitization transactions, including certificate holders, securitization trustees and monoline insurance companies. In certain limited circumstances described below, H&R Block has outstanding guarantees of payment if claims are successfully asserted by such counterparties.
These guarantees include representation and warranty claims with respect to a limited number of whole loan sales by SCC with an aggregate outstanding principal and liquidated amount of approximately $1.4 billion as of January 31, 2013, according to the most recent data available to SCC from its servicer. There have been a total of $33 million of representation and warranty claims with respect to these whole loan sales, of which $4 million were deemed valid and paid by SCC, representing significantly less than one percent of the original principal amount of such loans.
These guarantees also cover limited representation and warranty claims on other outstanding securitization transactions, with a potential claims exposure of less than $200 million. In addition, as is customary in divestiture transactions, H&R Block guaranteed the payment of any indemnification claims from the purchaser of SCC's servicing business, including claims relating to pre-closing services (which closing occurred in 2008).
If SCC were to become insolvent, we could be subject to claims by the unpaid creditors of SCC.
As discussed above, SCC is subject to representation and warranty claims and other claims and litigation related to its past sales and securitizations of mortgage loans. It is likely that additional claims and proceedings will be made in the future. If the amount that SCC is ultimately required to pay with respect to these claims and litigation exceeds its net assets, the creditors of SCC, or a bankruptcy trustee if SCC were to file or be forced into bankruptcy, may attempt to assert claims against us for payment of SCC's obligations. We believe our legal position is strong on any potential corporate veil-piercing arguments; however, if this position is challenged and not upheld, it could have a material adverse effect on our business and our consolidated financial position, results of operations and cash flows. In addition, in certain limited instances, H&R Block guaranteed amounts as outlined in the above risk factor.
|
16
|
H&R Block 2013 Form 10K
|
|
ITEM 1B.
|
UNRESOLVED STAFF COMMENTS
|
None.
|
ITEM 2.
|
PROPERTIES
|
Most of our tax offices are operated under leases or similar agreements throughout the U.S. Our Canadian executive offices are located in a leased office in Calgary, Alberta. Most of our Canadian tax offices are operated under leases throughout Canada. Our Australian executive offices are located in a leased office in Thornleigh, New South Wales. Our Australian tax offices are operated under leases throughout Australia.
HRB Bank is headquartered and its single branch location is located in our corporate headquarters. We own our corporate headquarters, which is located in Kansas City, Missouri. All current leased and owned facilities are in reasonably good repair and adequate to meet our needs.
|
ITEM 3.
|
LEGAL PROCEEDINGS
|
For a description of our material pending legal proceedings, see discussion in Item 8, note 18 to the consolidated financial statements.
|
ITEM 4.
|
MINE SAFETY DISCLOSURES
|
Not applicable.
|
ITEM 5.
|
MARKET FOR THE REGISTRANT’S COMMON EQUITY, RELATED STOCKHOLDER MATTERS AND ISSUER PURCHASES OF EQUITY SECURITIES
|
H&R Block’s common stock is traded on the New York Stock Exchange (NYSE) under the symbol HRB. On May 31,
2013
, there were 20,682 shareholders of record and the closing stock price on the NYSE was $29.27 per share.
The quarterly information regarding H&R Block’s common stock prices and dividends appears in Item 8, note 23 to the consolidated financial statements.
A summary of our securities authorized for issuance under equity compensation plans as of April 30,
2013
is as follows:
|
(in 000s, except per share amounts)
|
||||||||||
|
Number of securities
to be issued upon
exercise of options
warrants and rights
|
|
Weighted-average
exercise price of
outstanding options
warrants and rights
|
|
Number of securities remaining
available for future issuance under
equity compensation plans (excluding
securities reflected in the first column)
|
|
|||||
|
Equity compensation plans approved by security holders
|
4,340
|
|
$
|
17.58
|
|
11,298
|
|
|||
|
Equity compensation plans not approved by security holders
|
—
|
|
$
|
—
|
|
—
|
|
|||
|
Total
|
4,340
|
|
$
|
17.58
|
|
11,298
|
|
|||
The remaining information called for by this item relating to “Securities Authorized for Issuance under Equity Compensation Plans” is reported in Item 8, note 13 to the consolidated financial statements.
|
H&R Block 2013 Form 10K
|
17
|
A summary of our purchases of H&R Block common stock during the fourth quarter of fiscal year
2013
is as follows:
|
(in 000s, except per share amounts)
|
||||||||||||||
|
Total Number of
Shares Purchased
(1)
|
|
Average
Price Paid
per Share
|
|
Total Number of Shares
Purchased as Part of Publicly
Announced Plans or Programs
(2)
|
|
Maximum Dollar Value of
Shares that May be Purchased
Under the Plans or Programs
(2)
|
|
|||||||
|
February 1 – February 28
|
2
|
|
$
|
22.86
|
|
—
|
|
$
|
857,504
|
|
||||
|
March 1 – March 31
|
2
|
|
$
|
24.78
|
|
—
|
|
$
|
857,504
|
|
||||
|
April 1 – April 30
|
1
|
|
$
|
29.25
|
|
—
|
|
$
|
857,504
|
|
||||
|
(1)
|
We purchased approximately five thousand shares in connection with funding employee income tax withholding obligations arising upon the exercise of stock options or the lapse of restrictions on restricted shares.
|
|
(2)
|
In June 2008, our Board of Directors approved an authorization to purchase up to $2.0 billion of our common stock through June 2012. In June 2012, our Board of Directors extended this authorization through June 2015.
|
PERFORMANCE GRAPH
– The following graph compares the cumulative five-year total return provided shareholders on H&R Block, Inc.’s common stock relative to the cumulative total returns of the S&P 500 index and the S&P Diversified Commercial & Professional Services index. An investment of $100, with reinvestment of all dividends, is assumed to have been made in our common stock and in each of the indexes on April 30, 2008, and its relative performance is tracked through April 30,
2013
.
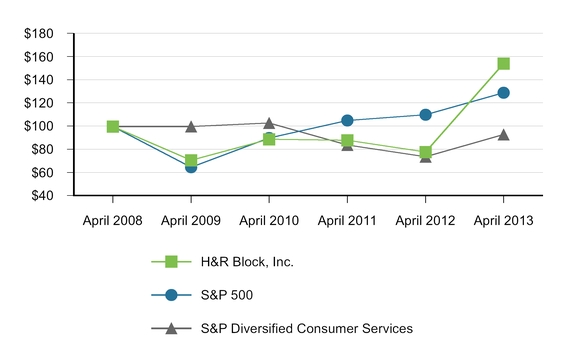
|
ITEM 6.
|
SELECTED FINANCIAL DATA
|
We derived the selected consolidated financial data presented below from our audited consolidated financial statements as of and for each of the five annual periods ending April 30,
2013
. Results of operations of fiscal years
2013
,
2012
and
2011
are discussed in Item 7. The data set forth below should be read in conjunction with Item 7 and the consolidated financial statements in Item 8. During fiscal year 2012, we sold our previously reported Business Services segment and recorded a loss on the sale.
|
18
|
H&R Block 2013 Form 10K
|
|
(in 000s, except per share amounts)
|
||||||||||||||||||||
|
April 30,
|
2013
|
|
2012
|
|
2011
|
|
2010
|
|
2009
|
|
||||||||||
|
Revenues
|
$
|
2,905,943
|
|
$
|
2,893,771
|
|
$
|
2,944,980
|
|
$
|
3,014,835
|
|
$
|
3,187,129
|
|
|||||
|
Net income from continuing operations
|
465,158
|
|
345,968
|
|
392,547
|
|
455,123
|
|
453,039
|
|
||||||||||
|
Net income
|
433,948
|
|
265,932
|
|
406,110
|
|
479,242
|
|
485,673
|
|
||||||||||
|
Basic earnings (loss) per share:
|
||||||||||||||||||||
|
Continuing operations
|
$
|
1.70
|
|
$
|
1.16
|
|
$
|
1.27
|
|
$
|
1.37
|
|
$
|
1.35
|
|
|||||
|
Consolidated
|
1.59
|
|
0.89
|
|
1.31
|
|
1.44
|
|
1.45
|
|
||||||||||
|
Diluted earnings (loss) per share:
|
||||||||||||||||||||
|
Continuing operations
|
$
|
1.69
|
|
$
|
1.16
|
|
$
|
1.27
|
|
$
|
1.36
|
|
$
|
1.35
|
|
|||||
|
Consolidated
|
1.58
|
|
0.89
|
|
1.31
|
|
1.43
|
|
1.45
|
|
||||||||||
|
Total assets
|
$
|
4,537,779
|
|
$
|
4,649,567
|
|
$
|
5,289,453
|
|
$
|
5,271,412
|
|
$
|
5,427,624
|
|
|||||
|
Long-term debt
(1)
|
906,680
|
|
1,040,549
|
|
1,040,084
|
|
1,031,413
|
|
1,030,328
|
|
||||||||||
|
Stockholders’ equity
|
1,263,547
|
|
1,325,892
|
|
1,449,574
|
|
1,440,630
|
|
1,405,859
|
|
||||||||||
|
Shares outstanding
|
272,635
|
|
292,119
|
|
305,366
|
|
323,306
|
|
334,102
|
|
||||||||||
|
Dividends per share
(2)
|
$
|
0.80
|
|
$
|
0.70
|
|
$
|
0.45
|
|
$
|
0.75
|
|
$
|
0.59
|
|
|||||
|
(1)
|
Includes current portion of long-term debt.
|
|
(2)
|
Amounts represent dividends declared. In fiscal year 2010, a dividend of $0.15 per share paid in July 2010 was declared in April 2010.
|
|
ITEM 7.
|
MANAGEMENT’S DISCUSSION AND ANALYSIS OF FINANCIAL CONDITION AND RESULTS OF OPERATIONS
|
Our subsidiaries provide tax preparation and retail banking services. Tax returns are either prepared by H&R Block tax professionals (in company-owned or franchise offices or virtually via the internet or mobile applications) or prepared and filed by our clients through H&R Block At Home
®
, either online or using our software or mobile applications. We are the only major company offering a full range of DIY - online, software and mobile applications - and professional assisted tax preparation solutions to individual tax clients.
OVERVIEW
A summary of our fiscal year
2013
results is as follows:
|
▪
|
U.S. tax returns prepared by and through us decreased
0.7%
from the prior year primarily due to a decline in overall filings with the IRS, which fell 0.6%.
|
|
▪
|
Revenues for the fiscal year were
$2.9 billion
, up
0.4%
from the prior year, primarily as a result of discontinuation of our free RAC offer, growth in international and digital, partially offset by declines in U.S. assisted return volume.
|
|
▪
|
Pretax earnings grew
$125.9 million
, or
21.9%
, primarily due to our cost saving initiatives in the current year.
|
|
▪
|
Net earnings from continuing operations increased
34.5%
from the prior year to
$465.2 million
.
|
|
▪
|
Diluted earnings per share from continuing operations increased
45.7%
from the prior year to
$1.69
, due to higher earnings and lower shares outstanding.
|
|
▪
|
Adjusted EBITDA increased
$75.1 million
, or
9.3%
, due primarily to cost reduction efforts.
|
|
▪
|
We recorded discrete tax benefits of $33.3 million during fiscal year 2013, which was primarily due to the settlement of the majority of the issues related to the examination of our 1999 through 2007 U.S. consolidated federal tax returns.
|
|
H&R Block 2013 Form 10K
|
19
|
|
Consolidated Results of Operations Data
|
(in 000s, except per share amounts)
|
|||||||||||
|
Year ended April 30,
|
2013
|
|
2012
|
|
2011
|
|
||||||
|
REVENUES:
|
||||||||||||
|
Tax Services
|
$
|
2,877,967
|
|
$
|
2,862,378
|
|
$
|
2,912,361
|
|
|||
|
Corporate and eliminations
|
27,976
|
|
31,393
|
|
32,619
|
|
||||||
|
$
|
2,905,943
|
|
$
|
2,893,771
|
|
$
|
2,944,980
|
|
||||
|
INCOME (LOSS) FROM CONTINUING OPERATIONS BEFORE TAXES:
|
||||||||||||
|
Tax Services
|
$
|
821,143
|
|
$
|
704,002
|
|
$
|
767,498
|
|
|||
|
Corporate and eliminations
|
(119,132
|
)
|
(127,932
|
)
|
(139,795
|
)
|
||||||
|
702,011
|
|
576,070
|
|
627,703
|
|
|||||||
|
Income taxes
|
236,853
|
|
230,102
|
|
235,156
|
|
||||||
|
Net income from continuing operations
|
465,158
|
|
345,968
|
|
392,547
|
|
||||||
|
Net income (loss) from discontinued operations
|
(31,210
|
)
|
(80,036
|
)
|
13,563
|
|
||||||
|
Net income
|
$
|
433,948
|
|
$
|
265,932
|
|
$
|
406,110
|
|
|||
|
BASIC EARNINGS (LOSS) PER SHARE:
|
||||||||||||
|
Continuing operations
|
$
|
1.70
|
|
$
|
1.16
|
|
$
|
1.27
|
|
|||
|
Discontinued operations
|
(0.11
|
)
|
(0.27
|
)
|
0.04
|
|
||||||
|
Consolidated
|
$
|
1.59
|
|
$
|
0.89
|
|
$
|
1.31
|
|
|||
|
DILUTED EARNINGS (LOSS) PER SHARE:
|
||||||||||||
|
Continuing operations
|
$
|
1.69
|
|
$
|
1.16
|
|
$
|
1.27
|
|
|||
|
Discontinued operations
|
(0.11
|
)
|
(0.27
|
)
|
0.04
|
|
||||||
|
Consolidated
|
$
|
1.58
|
|
$
|
0.89
|
|
$
|
1.31
|
|
|||
|
EBITDA FROM CONTINUING OPERATIONS
(1)
|
$
|
874,375
|
|
$
|
757,316
|
|
$
|
812,988
|
|
|||
|
EBITDA FROM CONTINUING OPERATIONS - ADJUSTED
(1)
|
882,680
|
|
807,539
|
|
836,199
|
|
||||||
|
(1)
|
See “Non-GAAP Financial Information” at the end of this item for a reconciliation of non-GAAP measures.
|
|
20
|
H&R Block 2013 Form 10K
|
RESULTS OF OPERATIONS
TAX SERVICES
This segment consists of our income tax preparation offerings - assisted, online and software, including tax operations primarily in the U.S. and its territories, Canada, and Australia. This segment also includes the activities of HRB Bank that primarily support the tax network.
|
Tax Services – Operating Statistics
|
|||||||||
|
Year ended April 30,
|
2013
|
|
2012
|
|
2011
|
|
|||
|
TAX RETURNS PREPARED :
(in 000s)
|
|||||||||
|
United States:
|
|||||||||
|
Company-owned operations
|
8,907
|
|
9,207
|
|
9,168
|
|
|||
|
Franchise operations
|
5,598
|
|
5,693
|
|
5,588
|
|
|||
|
Total retail operations
|
14,505
|
|
14,900
|
|
14,756
|
|
|||
|
Software
|
2,004
|
|
2,158
|
|
2,201
|
|
|||
|
Online
|
4,892
|
|
4,419
|
|
3,722
|
|
|||
|
Free File Alliance
|
774
|
|
861
|
|
767
|
|
|||
|
Total digital tax solutions
|
7,670
|
|
7,438
|
|
6,690
|
|
|||
|
Total U.S. operations
|
22,175
|
|
22,338
|
|
21,446
|
|
|||
|
International operations:
|
|||||||||
|
Canada
(1)
|
2,517
|
|
2,545
|
|
2,411
|
|
|||
|
Australia
|
741
|
|
671
|
|
644
|
|
|||
|
Total international operations
|
3,258
|
|
3,216
|
|
3,055
|
|
|||
|
Tax returns prepared worldwide
|
25,433
|
|
25,554
|
|
24,501
|
|
|||
|
TAX OFFICES (at the peak of the tax season):
|
|||||||||
|
U.S. offices:
|
|||||||||
|
Company-owned offices
|
5,734
|
|
5,787
|
|
5,921
|
|
|||
|
Company-owned shared locations
(2)
|
477
|
|
734
|
|
572
|
|
|||
|
Total company-owned offices
|
6,211
|
|
6,521
|
|
6,493
|
|
|||
|
Franchise offices
|
4,384
|
|
4,296
|
|
4,178
|
|
|||
|
Franchise shared locations
(2)
|
123
|
|
175
|
|
397
|
|
|||
|
Total franchise offices
|
4,507
|
|
4,471
|
|
4,575
|
|
|||
|
Total U.S. offices
|
10,718
|
|
10,992
|
|
11,068
|
|
|||
|
International offices
:
|
|||||||||
|
Canada
|
1,139
|
|
1,223
|
|
1,324
|
|
|||
|
Australia
|
410
|
|
404
|
|
384
|
|
|||
|
Total international offices
|
1,549
|
|
1,627
|
|
1,708
|
|
|||
|
Tax offices worldwide
|
12,267
|
|
12,619
|
|
12,776
|
|
|||
|
(1)
|
In fiscal year 2011, the end of the Canadian tax season was extended from April 30 to May 2, 2011. Tax returns prepared in Canada in fiscal year 2011 includes 51,000 returns in both company-owned and franchise offices which were accepted by the client on May 1 or 2. The revenues related to these returns were recognized in fiscal year 2012.
|
|
(2)
|
Shared locations include offices located within Walmart and other third-party businesses. Our U.S. Walmart license agreement expired in April 2013.
|
|
H&R Block 2013 Form 10K
|
21
|
|
Tax Services – Financial Results
|
(dollars in 000s)
|
|||||||||||
|
Year ended April 30,
|
2013
|
|
2012
|
|
2011
|
|
||||||
|
Tax preparation fees:
|
||||||||||||
|
U.S.
|
$
|
1,712,319
|
|
$
|
1,749,032
|
|
$
|
1,750,768
|
|
|||
|
International
|
220,870
|
|
205,466
|
|
180,256
|
|
||||||
|
1,933,189
|
|
1,954,498
|
|
1,931,024
|
|
|||||||
|
Royalties
|
318,386
|
|
308,561
|
|
304,194
|
|
||||||
|
Fees from refund anticipation checks
|
158,176
|
|
132,361
|
|
181,661
|
|
||||||
|
Fees from Emerald Card
|
98,896
|
|
104,143
|
|
90,451
|
|
||||||
|
Fees from Peace of Mind® guarantees
|
71,355
|
|
75,603
|
|
78,413
|
|
||||||
|
Interest and fee income on Emerald Advance
|
59,657
|
|
59,660
|
|
94,300
|
|
||||||
|
Other
|
238,308
|
|
227,552
|
|
232,318
|
|
||||||
|
Total revenues
|
2,877,967
|
|
2,862,378
|
|
2,912,361
|
|
||||||
|
Compensation and benefits:
|
||||||||||||
|
Field wages
|
654,794
|
|
691,680
|
|
692,561
|
|
||||||
|
Other wages
|
150,306
|
|
150,908
|
|
155,165
|
|
||||||
|
Benefits and other compensation
|
148,492
|
|
183,037
|
|
174,254
|
|
||||||
|
953,592
|
|
1,025,625
|
|
1,021,980
|
|
|||||||
|
Occupancy and equipment
|
354,430
|
|
381,572
|
|
385,130
|
|
||||||
|
Marketing and advertising
|
270,240
|
|
278,231
|
|
242,538
|
|
||||||
|
Depreciation and amortization
|
92,004
|
|
88,836
|
|
90,672
|
|
||||||
|
Bad debt
|
77,402
|
|
68,082
|
|
139,059
|
|
||||||
|
Supplies
|
40,131
|
|
44,236
|
|
42,300
|
|
||||||
|
Impairment of goodwill and intangible assets
|
3,581
|
|
11,389
|
|
22,700
|
|
||||||
|
Other
|
265,444
|
|
260,405
|
|
200,484
|
|
||||||
|
Total expenses
|
2,056,824
|
|
2,158,376
|
|
2,144,863
|
|
||||||
|
Pretax income
|
$
|
821,143
|
|
$
|
704,002
|
|
$
|
767,498
|
|
|||
|
Pretax margin
|
28.5
|
%
|
24.6
|
%
|
26.4
|
%
|
||||||
FISCAL 2013 COMPARED TO FISCAL 2012
-
Tax Services' revenues increased
$15.6 million
, or
0.5%
, compared to the prior year. U.S. tax preparation fees decreased
$36.7 million
, or
2.1%
primarily due to a 3.3% decline in returns prepared, partially offset by a 1.2% increase in our average charge. Total assisted tax returns processed by the IRS in the 2013 tax season fell 1.0%.
International tax preparation fees increased
$15.4 million
, or
7.5%
, due primarily to a 10.4% increase in Australian tax returns prepared, partially offset by unfavorable exchange rates.
Royalties increased
$9.8 million
, or
3.2%
, primarily due to a 2.7% increase in the average charge, partially offset by a
1.7%
decrease in returns prepared in franchise offices.
Fees earned on RACs increased
$25.8 million
, or
19.5%
, primarily due to our decision to discontinue a promotion for free RACs offered last year, partially offset by lower RAC volumes.
Emerald Card fees decreased
$5.2 million
, or
5.0%
, primarily due to lower transaction volumes resulting from a decrease of approximately 14% in prepaid debit cards issued.
Other revenue increased
$10.8 million
, or
4.7%
, primarily due to an increase in online tax preparation revenues.
In connection with our evaluation of alternative means of ceasing to be an SLHC, we are exploring all options, including a variety of ways to structure any such transaction. Any such transaction may negatively impact our financial services revenues and profitability within the Tax Services segment.
Total expenses decreased
$101.6 million
, or
4.7%
, from the prior year. Total compensation and benefits decreased
$72.0 million
primarily due to lower field wages in the current year resulting from workforce reductions and severance costs of $31.1 million recorded in the prior year. Occupancy and equipment expenses decreased
$27.1 million
primarily due to a 4.8% reduction in company-owned offices and other cost-saving initiatives. Bad debt expense increased
$9.3 million
, or
13.7%
, primarily due to credit losses associated with the initial offering of credit cards to our clients. Other expenses increased
$5.0 million
, or
1.9%
, primarily due to lower gains on the sale of tax offices, which declined
$15.3 million
, partially offset by a reduction in litigation expenses in the current year.
|
22
|
H&R Block 2013 Form 10K
|
Pretax income for fiscal year 2013 increased
$117.1 million
, or
16.6%
, over the prior year. The pretax margin for the segment increased to
28.5%
from
24.6%
in fiscal year 2012.
FISCAL 2012 COMPARED TO FISCAL 2011
-
Tax Services' revenues decreased
$50.0 million
, or
1.7%
, compared to the prior year. U.S. tax preparation fees were essentially flat compared to fiscal year 2011, as return volume and pricing in U.S. company-owned offices were relatively unchanged from fiscal year 2011.
International tax preparation fees increased
$25.2 million
, or
14.0%
, due primarily to an extension of the Canadian tax season and favorable exchange rates.
Royalties increased
$4.4 million
, or
1.4%
, primarily due to a
1.9%
increase in returns prepared in franchise offices.
Fees earned on RACs decreased
$49.3 million
, or
27.1%
, due to a promotional offering, whereby clients were eligible to receive a RAC at no charge through February 4, if they elected to have their refund direct deposited onto an Emerald Card.
Emerald Card fees increased
$13.7 million
, or
15.1%
, primarily due to higher transaction volumes resulting from an increase of approximately 24% in prepaid debit cards issued.
Interest income earned on EAs decreased
$34.6 million
, or
36.7%
, as a result of lower EA volumes principally resulting from changes in underwriting criteria in fiscal year 2012.
Other revenue decreased
$4.8 million
, or
2.1%
, primarily due to the last of our RAL revenues ($17.2 million) recognized in the prior year, partially offset by an increase in online tax preparation revenues.
Total expenses increased
$13.5 million
, or
0.6%
, compared to fiscal year 2011. Benefits and other compensation increased
$8.8 million
, or
5.0%
, primarily due to incremental severance costs. Marketing and advertising increased
$35.7 million
, or
14.7%
, as we expanded our marketing efforts, primarily in television and online. Bad debt expense decreased
$71.0 million
, or
51.0%
, primarily as a result of lower EA volumes and better collection rates in the current year. Other expenses increased
$59.9 million
, or
29.9%
, primarily due to incremental litigation expenses recorded in fiscal year 2012 and a decline in gains on the sale of tax offices of
$28.5 million
, as we sold
83
offices in fiscal year 2012 compared to
280
in fiscal year 2011.
Pretax income for fiscal year 2012 decreased
$63.5 million
, or
8.3%
, from fiscal year 2011.
CORPORATE, ELIMINATIONS AND INCOME TAXES ON CONTINUING OPERATIONS
Corporate operating results include net interest margin and gains or losses relating to mortgage loans held for investment, real estate owned and residual interests in securitizations, along with interest expense on borrowings, other corporate expenses and eliminations of intercompany activities.
|
Corporate – Operating Results
|
(in 000s)
|
|
||||||||||
|
Year ended April 30,
|
2013
|
|
2012
|
|
2011
|
|
||||||
|
Interest income on mortgage loans held for investment
|
$
|
16,556
|
|
$
|
20,322
|
|
$
|
24,693
|
|
|||
|
Other
|
11,420
|
|
11,071
|
|
7,926
|
|
||||||
|
Total revenues
|
27,976
|
|
31,393
|
|
32,619
|
|
||||||
|
Interest expense
|
73,649
|
|
83,658
|
|
84,288
|
|
||||||
|
Provision for loan losses
|
13,283
|
|
24,075
|
|
35,567
|
|
||||||
|
Other, net
|
60,176
|
|
51,592
|
|
52,559
|
|
||||||
|
Total expense
|
147,108
|
|
159,325
|
|
172,414
|
|
||||||
|
Pretax loss
|
$
|
(119,132
|
)
|
$
|
(127,932
|
)
|
$
|
(139,795
|
)
|
|||
FISCAL YEAR 2013 COMPARED TO FISCAL YEAR 2012
Pretax results.
Interest income earned on mortgage loans held for investment decreased
$3.8 million
, or
18.5%
, from the prior year, primarily as a result of declining balances and non-performing loans. Interest expense declined
$10.0 million
, or
12.0%
, due to lower interest rates on our Senior Notes, coupled with lower principal balances outstanding. Our provision for loan losses decreased
$10.8 million
, or
44.8%
, from the prior year as a result of the continued run-off of our portfolio. Other expenses increased
$8.6 million
, or
16.6%
, primarily due to the $5.8 million loss on extinguishment of debt we incurred on the redemption of our $600.0 million Senior Notes.
|
H&R Block 2013 Form 10K
|
23
|
Income Taxes on Continuing Operations.
Our effective tax rate for continuing operations in fiscal year 2013 was
33.7%
compared to
39.9%
in the prior year. The lower effective tax rate was primarily due to reserve releases related to the settlement of tax years 1999-2007 with the IRS. The IRS settlement decreased the effective tax rate by 6.2%.
FISCAL YEAR 2012 COMPARED TO FISCAL YEAR 2011
Pretax results.
Interest income earned on mortgage loans held for investment decreased
$4.4 million
, or
17.7%
, from fiscal year 2011, primarily as a result of declining rates and non-performing loans. Our provision for loan losses decreased
$11.5 million
, or
32.3%
, from fiscal year 2011 as a result of the continued run-off of our portfolio.
Income Taxes on Continuing Operations.
Our effective tax rate for continuing operations in fiscal year 2012 was
39.9%
compared to
37.5%
in fiscal year 2011. The higher effective tax rate was primarily due to increased tax expense related to changes in the value of investments held within company-owned life insurance (COLI) policies. A portion of the increase related to COLI resulted from the decision to surrender COLI policies no longer required to support our deferred compensation liabilities. This decision triggered a one-time tax expense related to prior period gains. In addition to the impact of COLI, changes in tax items including valuation allowances, income tax reserves and other discrete tax adjustments caused a small net increase to tax expense
.
DISCONTINUED OPERATIONS
Discontinued operations include our previously reported Business Services segment and discontinued mortgage operations.
|
Discontinued Operations – Operating Results
|
(in 000s)
|
|||||||||||
|
Year ended April 30,
|
2013
|
|
2012
|
|
2011
|
|
||||||
|
Revenues
|
$
|
—
|
|
$
|
417,168
|
|
$
|
828,725
|
|
|||
|
Pretax income (loss) from operations:
|
||||||||||||
|
RSM and related businesses
|
$
|
1,205
|
|
$
|
14,441
|
|
$
|
48,021
|
|
|||
|
Mortgage
|
(52,077
|
)
|
(59,702
|
)
|
(20,644
|
)
|
||||||
|
(50,872
|
)
|
(45,261
|
)
|
27,377
|
|
|||||||
|
Income taxes (benefit)
|
(19,662
|
)
|
(13,329
|
)
|
13,814
|
|
||||||
|
Net income (loss) from operations
|
(31,210
|
)
|
(31,932
|
)
|
13,563
|
|
||||||
|
Pretax loss on sales of businesses
|
—
|
|
(109,719
|
)
|
—
|
|||||||
|
Income tax benefit
|
—
|
|
(61,615
|
)
|
—
|
|||||||
|
Net loss on sales of businesses
|
—
|
|
(48,104
|
)
|
—
|
|||||||
|
Net income (loss) from discontinued operations
|
$
|
(31,210
|
)
|
$
|
(80,036
|
)
|
$
|
13,563
|
|
|||
FISCAL YEAR 2013 COMPARED TO FISCAL YEAR 2012
Results of operations.
The net loss from our discontinued operations totaled
$31.2 million
for the current year, compared to a net loss of
$80.0 million
in the prior year.
Prior year losses included a $99.7 million pretax goodwill impairment related to the sales of RSM and MCM, as well as operating income of
$14.4 million
earned by those businesses prior to the sale.
Pretax losses of mortgage operations totaled $52.1 million in the current year and resulted primarily from incremental loss provisions of $40.0 million related to SCC's estimated contingent losses for representation and warranty claims. Pretax losses of mortgage operations totaled $59.7 million in fiscal year 2012 and resulted primarily from loss provisions relating to representation and warranty claims totaling $20.0 million and settlement charges totaling $28.0 million.
Income Taxes.
Our effective tax rate for discontinued operations was
38.6%
for the fiscal year ended April 30, 2013, compared to
48.4%
the prior year. The prior year rate was higher due to the disposition of RSM which produced increased tax benefits from the loss.
FISCAL YEAR 2012 COMPARED TO FISCAL YEAR 2011
Results of operations.
The net loss from our discontinued operations totaled
$80.0 million
compared to income of
$13.6 million
for fiscal year 2011. The loss on the sale of RSM and related businesses includes a $99.7 million goodwill impairment recorded in the first quarter related to the sales of RSM and MCM. Additionally, fiscal year 2011 includes twelve months of RSM operating results while fiscal year 2012 includes only seven months.
|
24
|
H&R Block 2013 Form 10K
|
The loss related to the mortgage business increased due to a settlement with the SEC of approximately $28 million, coupled with $20.0 million in incremental loss provisions related to an increase in SCC's estimated contingent losses for representation and warranty claims.
Income Taxes.
The sale of RSM resulted in a pretax financial statement loss, but a gain for tax purposes. The tax gain resulted primarily from larger amortization deductions taken for tax purposes than for financial statement purposes. A portion of the gain from the sale of intangible assets is capital in nature and was offset by utilization of capital loss carry-forwards, resulting in an incremental tax benefit reported for financial statement purposes.
REPRESENTATION AND WARRANTY CLAIMS
SCC records a liability for losses related to representation and warranty claims when those losses are believed to be both probable and reasonably estimable. SCC considers the experience gained through discussions with counterparties, and an assessment of, among other things, historical claim results, threatened claims, terms and provisions of related agreements, counterparty willingness to pursue a settlement, legal standing of counterparties to provide a comprehensive settlement, the potential pro-rata realization of the claims as compared to all similar claims and other relevant facts and circumstances when developing its estimate of probable loss.
Loss payments totaled
$11.3 million
,
$16.2 million
and
$61.9 million
for fiscal years
2013
,
2012
and
2011
, respectively. These amounts were recorded as reductions of SCC's accrued representation and warranty liability. SCC recorded a $40.0 million incremental provision to its liability for estimated contingent losses during the fourth quarter of fiscal year 2013, and a $20.0 million provision in fiscal year 2012. The fiscal year 2013 provision was the result of events occurring during the fourth quarter, including tolling agreements SCC entered into with certain counterparties and bulk settlement discussions related to previously denied and potential future claims.
SCC has accrued a liability as of April 30, 2013 for estimated contingent losses arising from representation and warranty claims of $158.8 million. The estimate of accrued loss is based on the best information currently available, significant management judgment, and a number of factors, including developments in case law and those factors mentioned above, that are subject to change. Changes in any one of these factors could significantly impact the estimate. However, it is reasonably possible that future representation and warranty losses may vary from the amounts recorded for these exposures. SCC currently estimates that the range of reasonably possible loss could be up to $30 million in excess of amounts accrued. This estimated range is based on currently available information, significant judgment and a number of assumptions that are subject to change. The actual loss that may be incurred could be more or less than our accrual or the estimate of reasonably possible losses.
See additional discussion in Item 1A, “Risk Factors,” “Critical Accounting Estimates” below and in Item 8, note 19 to the consolidated financial statements.
CRITICAL ACCOUNTING ESTIMATES
We consider the estimates discussed below to be critical to understanding our financial statements, as they require the use of significant judgment and estimation in order to measure, at a specific point in time, matters that are inherently uncertain. Specific risks for these critical accounting estimates are described in the following paragraphs. We have reviewed and discussed each of these estimates with the Audit Committee of our Board of Directors. For all of these estimates, we caution that future events rarely develop precisely as forecasted and estimates routinely require adjustment and may require material adjustment.
See Item 8, note 1 to the consolidated financial statements, which discusses accounting estimates we have selected when there are acceptable alternatives and new or proposed accounting standards that may affect our financial reporting in the future.
LOSSES ARISING FROM REPRESENTATIONS AND WARRANTIES
- In connection with the sale of loans and/or RMBSs, SCC made certain representations and warranties. These representations and warranties varied based on the nature of the transaction and the buyer's or insurer's requirements, but generally pertained to the ownership of the loan, the validity of the lien securing the loan, borrower fraud, the loan's compliance with the criteria for inclusion in the transaction, including compliance with SCC's underwriting standards or loan criteria established by the buyer, ability to deliver required documentation, and compliance with applicable laws. Representations and warranties related to borrower fraud in whole loan sale transactions to institutional investors, which represented approximately 68% of the disposal of loans originated in calendar years 2005, 2006 and 2007, included a “knowledge qualifier” limiting SCC's liability to those instances where SCC had knowledge of the fraud at the time the loans were sold. Representations and warranties made in other sale transactions effectively did not include a knowledge qualifier as to borrower fraud. SCC believes it would have an obligation to repurchase a loan or indemnify certain parties with respect to a claim for a breach of a representation and warranty only if such breach materially and adversely affects the value of the mortgage loan, or a securitization insurer's or certificate holder's interest in the mortgage loan, and the mortgage loan has not been liquidated, although there is limited and conflicting case law on the liquidated loan defense issue. Such claims together with any settlement arrangements related to these losses are collectively referred to as “representation and warranty claims.”
|
H&R Block 2013 Form 10K
|
25
|
During the latter-half of fiscal year 2013, SCC entered into tolling agreements with the counterparties from whom SCC has received a significant majority of its asserted claims. These tolling agreements toll the running of any applicable statute of limitations related to potential representation and warranty claims and other claims against SCC. During the fourth quarter, SCC engaged in discussions with these counterparties regarding the bulk settlement of previously denied and potential future claims. Based on settlement discussions with these counterparties, SCC believes a bulk settlement approach, rather than the loan-by-loan claim process, will be needed to achieve settlement with these counterparties with respect to all of their representation and warranty and other claims. SCC has experienced a decline in claims on a loan-by-loan basis for alleged breaches of representations and warranties during fiscal year 2013, which it believes is primarily attributable to the existence of tolling agreements. In the event that current efforts to settle with these counterparties are not successful, SCC believes claim volumes may increase or litigation may result.
SCC records a liability for losses related to representation and warranty claims when those losses are believed to be both probable and reasonably estimable. Development of loss estimates is subjective, subject to a high degree of management judgment, and estimates may vary significantly period to period. Historically, SCC has developed its estimate of losses related to representation and warranty claims based primarily on projections of future claims on a loan-by-loan basis. As a result of recent counterparty activity, primarily settlement discussions occurring during the fourth quarter, SCC has reassessed its prior estimate for losses, placing greater emphasis on bulk settlement discussions involving counterparties subject to tolling agreements rather than projections of future claims on a loan-by-loan basis. SCC's loss estimate at April 30, 2013, considers the experience gained through discussions with counterparties, and an assessment of, among other things, historical claim results, threatened claims, terms and provisions of related agreements, counterparty willingness to pursue a settlement, legal standing of counterparties to provide a comprehensive settlement, the potential pro-rata realization of the claims as compared to all similar claims and other relevant facts and circumstances when developing its estimate of probable loss. The estimate is based on the best information currently available, significant management judgment, and a number of factors, including developments in case law and those factors mentioned above, that are subject to change. Changes in any one of these factors could significantly impact the estimate.
SCC has accrued a liability as of April 30, 2013 for estimated contingent losses arising from representation and warranty claims of $158.8 million. The liability is included in accounts payable, accrued expenses and other current liabilities on the consolidated balance sheets. If future losses are in excess of SCC's accrued liability, those losses could have a material adverse effect on our business and our consolidated financial position, results of operations and cash flows, as SCC's financial condition, operating results and cash flows are included in our consolidated financial statements. It is reasonably possible that future representation and warranty losses may vary from the amounts recorded for these exposures. SCC currently estimates that the range of reasonably possible loss could be up to $30 million in excess of amounts accrued. This estimated range is based on currently available information, significant judgment and a number of assumptions that are subject to change. The actual loss that may be incurred could be more or less than our accrual or the estimate of reasonably possible losses. The accrued liability does not include potential losses related to litigation matters discussed in Item 1A, "Risk Factors" and in Item 8, note 18 to the consolidated financial statements. Also see Item 8, note 19 to the consolidated financial statements.
LITIGATION AND RELATED CONTINGENCIES
-
It is our policy to routinely assess the likelihood of any adverse judgments or outcomes related to legal matters, as well as ranges of probable losses. A determination of the amount of the liability required to be accrued, if any, for these contingencies is made after analysis of each known issue and an analysis of historical experience. Therefore, we have accrued liabilities related to certain legal matters for which we believe it is probable that a loss will be incurred and the range of such loss can be reasonably estimated. With respect to other matters, we have concluded that a loss is only reasonably possible or remote, or is not reasonably estimable and, therefore, no liability is accrued.
Assessing the likely outcome of pending or threatened litigation, including the amount of potential loss, if any, is highly subjective. Our judgments on whether a loss is probable, reasonably possible or remote and our estimates of probable loss amounts may differ from actual results due to difficulties in predicting the outcome of jury trials, arbitration hearings, settlement discussions and related activity, predicting the outcome of class certification actions and numerous other uncertainties. Due to the number of claims which are periodically asserted against us, and the magnitude of damages sought in those claims, actual losses in the future may significantly differ from our current estimates. We are subject to threatened litigation claims and indemnification claims, which are described in Item 8, note 18 to the consolidated financial statements.
For some matters where a liability has not been accrued, we are able to estimate a reasonably possible range of loss. For those matters, and for matters where a liability has been accrued, as of April 30,
2013
, we estimate the aggregate range of reasonably possible losses in excess of amounts accrued to be approximately
$0
to
$55 million
, of which approximately
54%
relates to our discontinued operations.
ALLOWANCE FOR LOAN LOSSES
- We are exposed to the risk that borrowers may not repay amounts owed to us when they become contractually due. We record an allowance representing our estimate of probable credit losses in the portfolio of loans held for investment at the balance sheet date. Determination of our allowance for loan losses is considered a critical accounting estimate because loss provisions can be material to our operating results, projections of loan delinquencies and related matters are inherently subjective, and actual losses are impacted by factors outside of our control including economic conditions, unemployment
|
26
|
H&R Block 2013 Form 10K
|
rates and residential home prices. The principal amount of mortgage loans held for investment totaled
$350.2 million
at April 30,
2013
.
We record a loan loss allowance for loans less than 60 days past due on a pooled basis. The aggregate principal balance of these loans totaled
$207.3 million
at April 30,
2013
, and the portion of our allowance for loan losses allocated to these loans totaled
$5.6 million
. In estimating our loan loss allowance for these loans, we stratify the loan portfolio based on our view of risk associated with various elements of the pool and assign estimated loss rates based on those risks. Loss rates are based primarily on historical experience and our assessment of economic and market conditions. Loss rates consider both the rate at which loans will become delinquent (frequency) and the amount of loss that will ultimately be realized upon occurrence of a liquidation of collateral (severity). Frequency rates are based primarily on historical migration analysis of loans to delinquent status. Severity rates are based primarily on recent broker quotes or appraisals of collateral. Because of imprecision and uncertainty inherent in developing estimates of future credit losses, in particular during periods of rapidly declining collateral values or increasing delinquency rates, our estimation process includes development of ranges of possible outcomes. Ranges were developed by stressing initial estimates of both frequency and severity rates. Stressing of frequency and severity assumptions is intended to model deterioration in credit quality that is difficult to predict during declining economic conditions. Future deterioration in credit quality may exceed our modeled assumptions.
Mortgage loans held for investment include loans originated by our affiliate, SCC, and purchased by HRB Bank. We have greater exposure to loss with respect to this segment of our loan portfolio as a result of historically higher delinquency rates. Therefore, we assign higher frequency rate assumptions to SCC-originated loans compared with loans originated by other third-party banks as we consider estimates of future losses. At April 30,
2013
our weighted-average frequency assumption was
7.5%
for SCC-originated loans compared to
2.7%
for remaining loans in the portfolio.
We consider loans 60 days past due impaired and review them individually. We record loss estimates typically based on the value of the underlying collateral. For loans over 60 days past due but less than 180 days past due or otherwise impaired, we record a loan loss allowance. The aggregate principal balance of these impaired loans totaled
$87.9 million
at April 30,
2013
, and the portion of our allowance for loan losses allocated to these loans totaled
$3.8 million
. For loans 180 days or more past due, we charge-off the loans to the value of the collateral less costs to sell. Loans more than 180 days past due were partially charged-off at a severity rate of
51%
.
Modified loans that meet the definition of a troubled debt restructuring (TDR) are also considered impaired and are reviewed individually. We record impairment equal to the difference between the principal balance of the loan and the present value of expected future cash flows discounted at the loan's effective interest rate. However, if we assess that foreclosure of a modified loan is probable, we record impairment based on the estimated fair value (typically appraised value less costs to sell) of the underlying collateral. The aggregate principal balance of TDR loans totaled
$55.1 million
at April 30,
2013
, and the portion of our allowance for loan losses allocated to these loans totaled
$4.9 million
.
The residential mortgage industry has experienced significant adverse trends for an extended period. If adverse trends continue for a sustained period or at rates worse than modeled by us, we may be required to record additional loan loss provisions, and those losses may be significant.
Determining the allowance for loan losses for loans held for investment requires us to make estimates of losses that are highly uncertain and requires a high degree of judgment. If our underlying assumptions prove to be inaccurate, the allowance for loan losses could be insufficient to cover actual losses. Our mortgage loan portfolio is a static pool, as we are no longer originating or purchasing new mortgage loans, and we believe that factor, over time, will limit variability in our loss estimates.
During fiscal year 2012 we changed from recording a specific loan loss allowance for loans 180 days or more past due to charging-off those loans. This change had no income statement impact, but reduced the principal amount of loans outstanding and the related allowance. This change was made as a result of our change in regulators from the OTS to the OCC.
INCOME TAXES
-
Income taxes are accounted for using the asset and liability approach under U.S. GAAP. We calculate our current and deferred tax provision for the fiscal year based on estimates and assumptions that could differ from the actual results reflected in income tax returns filed during the applicable calendar year. Adjustments based on filed returns are recorded in the appropriate periods when identified. We file a consolidated federal tax return on a calendar year basis, generally in the second fiscal quarter of the subsequent year.
We record a valuation allowance to reduce our deferred tax assets to the amount that is more likely than not to be realized. We have considered taxable income in carry-back periods, historical and forecasted earnings, future taxable income, the mix of earnings in the jurisdictions in which we operate, and tax planning strategies in determining the need for a valuation allowance against our deferred tax assets. Determination of a valuation allowance for deferred tax assets requires that we make judgments about future matters that are not certain, including projections of future taxable income and evaluating potential tax-planning strategies. To the extent that actual results differ from our current assumptions, the valuation allowance will increase or decrease. In the event we determine that we could not realize all or part of our deferred tax assets in the future, an adjustment to the deferred tax assets
|
H&R Block 2013 Form 10K
|
27
|
would be charged to earnings in the period in which we make such determination. Likewise, if we later determine it is more likely than not that we could realize the deferred tax assets, we would reverse the applicable portion of the previously provided valuation allowance.
The income tax laws of jurisdictions in which we operate are complex and subject to different interpretations by the taxpayer and applicable government taxing authorities. Income tax returns filed by us are based on our interpretation of these rules. The amount of income taxes we pay is subject to ongoing audits by federal, state and foreign tax authorities, which may result in proposed assessments, including assessments of interest or penalties. Our estimate for the potential outcome for any uncertain tax issue is highly subjective and based on our best judgments. Actual results may differ from our current judgments due to a variety of factors, including changes in law, interpretations of law by taxing authorities that differ from our assessments, changes in the jurisdictions in which we operate and results of routine tax examinations. We believe we have adequately provided for any reasonably foreseeable outcome related to these matters. However, our future results may include favorable or unfavorable adjustments to our estimated tax liabilities in the period the assessments are made or resolved, or when statutes of limitation on potential assessments expire. As a result, our effective tax rate may fluctuate on a quarterly basis.
During fiscal year 2013, we recognized a
$33 million
income tax benefit related to resolution of uncertain tax positions from prior years. As of April 30, 2013, we recorded unrecognized tax benefits on uncertain tax positions of approximately
$146 million
.
REVENUE RECOGNITION
-
We have many different revenue sources, each governed by specific revenue recognition policies. Our revenue recognition policies can be found in Item 8, note 1 to the consolidated financial statements.
FINANCIAL CONDITION
These comments should be read in conjunction with the consolidated balance sheets and consolidated statements of cash flows included in Item 8.
CAPITAL RESOURCES AND LIQUIDITY
-
Our sources of capital and liquidity include cash from operations, cash from customer deposits, issuances of common stock and debt. We use capital primarily to fund working capital, pay dividends, repurchase shares of our common stock, acquire businesses and repay debt. Our operations are highly seasonal and therefore generally require the use of cash to fund operating losses during the period May through mid-January.
Given the likely availability of a number of liquidity options discussed herein, including borrowing capacity under our 2012 CLOC, we believe that in the absence of any unexpected developments our existing sources of capital at April 30,
2013
are sufficient to meet our operating needs.
The following table summarizes our statements of cash flows for fiscal years
2013
,
2012
and
2011
. See Item 8 for the complete statements of cash flows for these periods.
|
(in 000s)
|
||||||||||||
|
Year ended April 30,
|
2013
|
|
2012
|
|
2011
|
|
||||||
|
Net cash provided by (used in):
|
||||||||||||
|
Operating activities
|
$
|
497,108
|
|
$
|
362,049
|
|
$
|
512,503
|
|
|||
|
Investing activities
|
(110,937
|
)
|
351,867
|
|
(110,157
|
)
|
||||||
|
Financing activities
|
(584,541
|
)
|
(445,062
|
)
|
(534,391
|
)
|
||||||
|
Effects of exchange rates on cash
|
1,620
|
|
(2,364
|
)
|
5,844
|
|
||||||
|
Net change in cash and cash equivalents
|
$
|
(196,750
|
)
|
$
|
266,490
|
|
$
|
(126,201
|
)
|
|||
CASH FROM OPERATING ACTIVITIES
- Cash provided by operations, which consists primarily of cash received from customers, increased
$135.1 million
from fiscal year
2012
. The increase from the prior year was primarily due to higher net income of our continuing operations.
Restricted Cash
.
We hold certain cash balances that are restricted as to use. Cash and cash equivalents - restricted totaled
$117.8 million
at April 30,
2013
, and primarily consisted of cash held by HRB Bank required for regulatory compliance and cash held by our captive insurance subsidiary that will be used to pay claims.
CASH FROM INVESTING ACTIVITIES
-
Changes in cash provided by investing activities primarily relate to the following:
Available-for-Sale Securities.
During fiscal year
2013
, HRB Bank purchased $
227.2 million
in mortgage-backed securities for regulatory purposes, compared to
$256.2 million
and
$138.8 million
in fiscal years
2012
and
2011
, respectively. Additionally, we received payments on AFS securities of
$118.4 million
in fiscal year
2013
compared to
$66.4 million
and $
16.8
|
28
|
H&R Block 2013 Form 10K
|
million
in fiscal years
2012
and
2011
, respectively. See additional discussion in Item 8, note 5 to the consolidated financial statements.
Mortgage Loans Held for Investment.
We received net proceeds of
$44.0 million
,
$49.1 million
and
$58.5 million
on our mortgage loans held for investment in fiscal years
2013
,
2012
and
2011
, respectively.
Purchases of Property and Equipment.
Total cash paid for property and equipment was
$113.2 million
,
$82.5 million
and
$63.0 million
for fiscal years
2013
,
2012
and
2011
, respectively. The increases were primarily a result of upgrades to our tax offices.
Acquisitions of Businesses and Intangibles.
Total cash paid for acquisitions was
$20.7 million
,
$15.3 million
and
$54.2 million
during fiscal years
2013
,
2012
and
2011
, respectively. Cash used in investing activities in fiscal year 2011 includes payments totaling $32.6 million related to an acquisition in our former Business Services segment.
Sales of Businesses.
We received proceeds from the sales of businesses of
$3.8 million
,
$560.5 million
and
$71.1 million
for fiscal years
2013
,
2012
and
2011
, respectively. Fiscal year 2012 includes net proceeds of $523.1 million from the sale of RSM and proceeds of $37.4 million from the sale of ancillary businesses and offices. During fiscal year 2013, we sold
9
tax offices to franchisees, compared to
83
tax offices in fiscal year
2012
, and
280
in fiscal year
2011
. The majority of these sales were financed through affiliate loans.
Loans Made to Franchisees.
Loans made to franchisees totaled
$70.8 million
,
$46.2 million
and
$92.5 million
for fiscal years
2013
,
2012
and
2011
, respectively. We received payments from franchisees totaling
$83.4 million
,
$56.6 million
and
$57.6 million
, respectively. These amounts include both the financing of sales of tax offices and short-term revolving loans made to franchisees to fund off-season operations.
Company-Owned Life Insurance.
During fiscal year 2013 we terminated various company-owned life insurance policies and received cash proceeds totaling $81.1 million.
CASH FROM FINANCING ACTIVITIES
-
Changes in cash used in financing activities primarily relate to the following:
Short-Term Borrowings.
While we use commercial paper borrowings to fund our off-season losses and cover our seasonal working capital needs, we had no commercial paper borrowings outstanding as of April 30,
2013
or
2012
. Our commercial paper borrowings peaked at $496.7 million in January of the current year.
FHLB Borrowings.
HRB Bank had historically obtained borrowings from the FHLB in accordance with regulatory and capital requirements. During fiscal years
2012
and
2011
, we had net repayments of $25.0 million and $50.0 million, respectively. We had no repayments or borrowings during fiscal year
2013
.
Customer Banking Deposits.
Changes in customer banking deposits resulted in a provision of cash of
$103.6 million
in fiscal year 2013, compared to a use of cash totaling
$26.1 million
and
$11.4 million
in fiscal years
2012
and
2011
, respectively. The change over the prior year is primarily due to the delay in the tax season and IRS fundings to debit cards in fiscal year 2013, resulting in higher deposits. These deposits are held by HRB Bank.
Dividends.
We have consistently paid quarterly dividends. Dividends paid totaled
$217.2 million
,
$208.8 million
and
$186.8 million
in fiscal years
2013
,
2012
and
2011
, respectively. During fiscal year 2012, our Board of Directors approved an increase of our quarterly cash dividend from $0.15 per share to $0.20 per share. Although we have historically paid dividends and currently plan to continue to do so, there can be no assurances that circumstances will not change in the future that could affect our ability or decisions to pay dividends.
Repurchase and Retirement of Common Stock.
During fiscal years 2013, 2012 and 2011, we purchased and immediately retired
21.3 million
shares,
14.6 million
shares and
19.0 million
shares, respectively, of our common stock at a cost of
$315.0 million
,
$200.0 million
and
$279.9 million
, respectively. Although we have historically from time to time repurchased and retired common stock and our Board of Directors has approved an extension of our current share repurchase program as discussed below, there can be no assurances that circumstances will not change in the future that could affect our ability or decisions to repurchase and retire common stock.
In June 2012, our Board of Directors extended the authorization to purchase up to $2.0 billion of our common stock through June 2015. There was
$857.5 million
remaining under this authorization at April 30,
2013
.
|
H&R Block 2013 Form 10K
|
29
|
Issuances of Common Stock.
Proceeds from the issuance of common stock in accordance with our stock-based compensation plans totaled
$25.1 million
,
$12.3 million
and
$0.4 million
in fiscal years
2013
,
2012
and
2011
, respectively.
HRB BANK
-
At April 30,
2013
, HRB Bank had cash balances of $556.7 million. Dividends of this cash balance would be subject to regulatory approval and it is therefore not available for general corporate purposes.
Block Financial LLC (Block Financial) typically makes capital contributions to HRB Bank to help meet its capital requirements. Although no such contributions were required in fiscal year 2013, Block Financial made capital contributions to HRB Bank of $400.0 million and $235.0 million during fiscal years
2012
and
2011
, respectively.
Historically, capital contributions by Block Financial have been repaid as dividends or a return of capital by HRB Bank as capital requirements decline. A return of capital or dividend paid by HRB Bank must be approved by the OCC and the Federal Reserve. Although such payments have been approved on occasion by our regulators in the past, there is no assurance that they will continue to be in the future. In addition, Block Financial may elect to maintain higher capital levels at HRB Bank. HRB Bank paid dividends and returned capital of $400.0 million during fiscal year
2012
and $262.5 million during fiscal year
2011
, comprised of $37.5 million in real estate owned (REO) properties and loans and $225.0 million in cash.
As discussed previously, we are in the process of evaluating alternative means of ceasing to be an SLHC. Our evaluation of alternatives is ongoing and we cannot predict the timing, the circumstances, or the likelihood of us ceasing to be regulated as an SLHC.
See additional discussion of regulatory and capital requirements of HRB Bank in Item 1A, "Risk Factors" and in "Regulatory Environment" below.
ASSETS HELD BY
FOREIGN SUBSIDIARIES
-
At April 30,
2013
, cash and short-term investment balances of
$273.1 million
were held by our foreign subsidiaries. These funds would have to be repatriated to be available to fund domestic operations, and income taxes would be accrued and paid on those amounts. During the current year, a Canadian subsidiary purchased an intangible asset from a U.S. subsidiary and an Australian subsidiary paid a dividend to its U.S. parent. These transactions effectively brought $72.5 million to the U.S. from our foreign subsidiaries, and resulted in approximately $6 million of income tax upon repatriation.
BORROWINGS
The following table provides ratings for debt issued by Block Financial as of April 30,
2013
and
2012
:
|
As of
|
April 30, 2013
|
April 30, 2012
|
||||||||||
|
Short-term
|
Long-term
|
Outlook
|
Short-term
|
Long-term
|
Outlook
|
|||||||
|
Moody’s
|
P-2
|
Baa2
|
Negative
|
P-2
|
Baa2
|
Stable
|
||||||
|
S&P
|
A-2
|
BBB
|
Negative
|
A-2
|
BBB
|
Negative
|
||||||
During fiscal year 2013, we issued $500.0 million in Senior Notes, the proceeds of which were used towards repayment of our $600.0 million Senior Notes that were due in January 2013. Additionally, we entered into a new CLOC agreement. See additional discussion in Item 8, note 9 to the consolidated financial statements.
Borrowing needs in our Canadian operations are typically funded by our U.S. operations. To mitigate foreign currency exchange rate risk, in fiscal years 2012 and 2011 we entered into foreign exchange forward contracts. We did not enter into any similar contracts in fiscal year
2013
, and there were no forward contracts outstanding as of April 30,
2013
. We do not currently expect to enter into any similar contracts in the future.
CONTRACTUAL OBLIGATIONS AND COMMERCIAL COMMITMENTS
A summary of our obligations to make future payments as of April 30,
2013
, is as follows:
|
(in 000s)
|
||||||||||||||||||||
|
Total
|
|
Less Than
1 Year
|
|
1 - 3 Years
|
|
4 - 5 Years
|
|
After 5 Years
|
|
|||||||||||
|
Long-term debt (including interest)
|
$
|
1,188,520
|
|
$
|
48,000
|
|
$
|
464,898
|
|
$
|
55,000
|
|
$
|
620,622
|
|
|||||
|
Customer deposits (including interest)
|
942,688
|
|
940,771
|
|
1,570
|
|
347
|
|
—
|
|
||||||||||
|
Contingent acquisition payments
|
11,277
|
|
9,533
|
|
1,744
|
|
—
|
|
—
|
|
||||||||||
|
Capital lease obligations
|
9,702
|
|
722
|
|
1,545
|
|
1,807
|
|
5,628
|
|
||||||||||
|
Operating leases
|
420,556
|
|
178,068
|
|
200,639
|
|
34,261
|
|
7,588
|
|
||||||||||
|
Total contractual cash obligations
|
$
|
2,572,743
|
|
$
|
1,177,094
|
|
$
|
670,396
|
|
$
|
91,415
|
|
$
|
633,838
|
|
|||||
|
30
|
H&R Block 2013 Form 10K
|
The table above does not reflect unrecognized tax benefits of approximately
$146 million
due to the high degree of uncertainty regarding the future cash outflows associated with these amounts.
See discussion of contractual obligations and commitments in Item 8, within the notes to the consolidated financial statements.
REGULATORY ENVIRONMENT
The Holding Companies are SLHCs and HRB Bank is a federal savings bank. The Federal Reserve is the primary federal regulator of our Holding Companies and the OCC is the primary federal regulator of HRB Bank.
The Dodd-Frank Act made extensive changes to the laws regulating banks, holding companies and financial services firms, and requires various federal agencies to adopt a broad range of new implementing rules and regulations and prepare numerous studies and reports for Congress.
See discussion in Item 1, “Regulation and Supervision - Bank and Holding Companies,” and in Item 1A, “Risk Factors,” for additional information on regulatory capital requirements for SLHCs, including the proposed new capital requirements for SLHCs published by the Federal Reserve in August 2012.
All savings associations are subject to regulatory capital requirements. As of March 31, 2013, our most recent Call Report filing with the OCC, HRB Bank was a “well capitalized” institution. See Item 1, “Regulation and Supervision - Bank and Holding Companies,” and Item 8, note 21 to the consolidated financial statements, for additional discussion of HRB Bank's regulatory capital requirements.
H&R Block, Inc. is a legal entity separate and distinct from its indirect subsidiary, HRB Bank. Various federal and state statutory and regulatory provisions limit the amount of dividends HRB Bank may pay without regulatory approval. The ability of HRB Bank to pay dividends in the future is currently, and could be further, influenced by bank regulatory policies and capital guidelines. See Item 1, “Regulation and Supervision - Bank and Holding Companies,” for a more detailed discussion of restrictions on payment of dividends.
The federal government, various state, local, provincial and foreign governments, and some self-regulatory organizations have enacted statutes and ordinances, or adopted rules and regulations, regulating aspects of our business. These aspects include, but are not limited to, commercial income tax return preparers, income tax courses, the electronic filing of income tax returns, the offering of RACs, loan originations and assistance in loan originations, mortgage lending, privacy, consumer protection, franchising, sales methods and banking. We determine the applicability of such statutes, ordinances, rules and regulations (collectively, Laws) and work to comply with those Laws that are applicable to us or our services or products.
From time to time in the ordinary course of business, we receive inquiries from governmental and self-regulatory agencies regarding the applicability of Laws to our services and products. In response to past inquiries, we have demonstrated that we comply with such Laws, convinced the authorities that such Laws were not applicable or that compliance already exists, or modified our activities in the applicable jurisdiction to avoid the application of all or certain parts of such Laws. We believe the past resolution of such inquiries and our ongoing compliance with Laws has not had a material effect on our consolidated financial statements. We cannot predict what effect future Laws, changes in interpretations of existing Laws or the results of future regulator inquiries with respect to the applicability of Laws may have on our consolidated financial position, results of operations and cash flows. See additional discussion of legal matters in Item 8, note 18 to the consolidated financial statements.
NON-GAAP FINANCIAL INFORMATION
Non-GAAP financial measures should not be considered as a substitute for, or superior to, measures of financial performance prepared in accordance with GAAP. Because these measures are not measures of financial performance under GAAP and are susceptible to varying calculations, they may not be comparable to similarly titled measures in other companies.
We consider non-GAAP financial measures to be a useful metric for management and investors to evaluate and compare the ongoing operating performance of our business on a consistent basis across reporting periods, as it eliminates the effect of items that are not indicative of our core operating performance.
The following are descriptions of adjustments we make for our non-GAAP financial measures:
|
▪
|
We exclude from our non-GAAP financial measures litigation charges we incur and favorable reserve adjustments. This does not include legal defense costs.
|
|
▪
|
We exclude from our non-GAAP financial measures non-cash charges to adjust the carrying values of goodwill, intangible assets, other long-lived assets and investments to their estimated fair values.
|
|
▪
|
We exclude from our non-GAAP financial measures severance and other restructuring charges in connection with the termination of personnel, closure of facilities and related costs.
|
|
H&R Block 2013 Form 10K
|
31
|
|
▪
|
We exclude from our non-GAAP financial measures the gains and losses on business dispositions, including investment banking, legal and accounting fees.
|
|
▪
|
We exclude from our non-GAAP financial measures the gains and losses on extinguishment of debt.
|
We may consider whether other significant items that arise in the future should also be excluded from our non-GAAP financial measures.
We measure the performance of our business using a variety of metrics, including EBITDA, adjusted EBITDA and adjusted pretax income of continuing operations. We also use EBITDA and pretax income of continuing operations as factors in incentive compensation calculations for our employees. Adjusted EBITDA and adjusted pretax income eliminate the impact of items that we do not consider indicative of our core operating performance and, we believe, provide meaningful information to assist in understanding our financial results, analyzing trends in our underlying business, and assessing our prospects for future performance.
The following is a reconciliation of EBITDA and adjusted EBITDA:
|
(in 000s)
|
||||||||||||
|
Year ended April 30,
|
2013
|
|
2012
|
|
2011
|
|
||||||
|
Net income from continuing operations - reported
|
$
|
465,158
|
|
$
|
345,968
|
|
$
|
392,547
|
|
|||
|
Add back:
|
||||||||||||
|
Income taxes
|
236,853
|
|
230,102
|
|
235,156
|
|
||||||
|
Interest expense
|
79,957
|
|
92,089
|
|
94,183
|
|
||||||
|
Depreciation and amortization
|
92,407
|
|
89,157
|
|
91,102
|
|
||||||
|
409,217
|
|
411,348
|
|
420,441
|
|
|||||||
|
EBITDA from continuing operations
|
874,375
|
|
757,316
|
|
812,988
|
|
||||||
|
Adjustments:
|
||||||||||||
|
Loss contingencies - litigation
|
(4,579
|
)
|
22,961
|
|
16,014
|
|
||||||
|
Impairment of goodwill and intangible assets
|
3,581
|
|
11,389
|
|
22,700
|
|
||||||
|
Severance
|
4,785
|
|
32,474
|
|
29,598
|
|
||||||
|
Loss on extinguishment of debt
|
5,790
|
|
—
|
|
—
|
|
||||||
|
Gain on sales of tax offices
|
(1,272
|
)
|
(16,601
|
)
|
(45,101
|
)
|
||||||
|
8,305
|
|
50,223
|
|
23,211
|
|
|||||||
|
Adjusted EBITDA from continuing operations
|
$
|
882,680
|
|
$
|
807,539
|
|
$
|
836,199
|
|
|||
The following is a reconciliation of adjusted pretax income:
|
(in 000s)
|
||||||||||||
|
Year ended April 30,
|
2013
|
|
2012
|
|
2011
|
|
||||||
|
Pretax income from continuing operations - reported
|
$
|
702,011
|
|
$
|
576,070
|
|
$
|
627,703
|
|
|||
|
Adjustments:
|
||||||||||||
|
Loss contingencies - litigation
|
(4,579
|
)
|
22,961
|
|
16,014
|
|
||||||
|
Impairment of goodwill and intangible assets
|
3,581
|
|
11,389
|
|
22,700
|
|
||||||
|
Severance
|
4,785
|
|
32,474
|
|
29,598
|
|
||||||
|
Loss on extinguishment of debt
|
5,790
|
|
—
|
|
—
|
|
||||||
|
Gain on sales of tax offices
|
(1,272
|
)
|
(16,601
|
)
|
(45,101
|
)
|
||||||
|
8,305
|
|
50,223
|
|
23,211
|
|
|||||||
|
Pretax income from continuing operations - adjusted
|
$
|
710,316
|
|
$
|
626,293
|
|
$
|
650,914
|
|
|||
|
32
|
H&R Block 2013 Form 10K
|
STATISTICAL DISCLOSURE BY BANK HOLDING COMPANIES
This section presents information required by the SEC’s Industry Guide 3, “Statistical Disclosure by Bank Holding Companies.” The tables in this section include HRB Bank information only.
DISTRIBUTION OF ASSETS, LIABILITIES AND SHAREHOLDERS’ EQUITY; INTEREST RATES AND INTEREST DIFFERENTIAL
– The following table presents average balance data and interest income and expense data for our banking operations, as well as the related interest yields and rates for fiscal years
2013
,
2012
and
2011
:
|
(dollars in 000s)
|
|||||||||||||||||||||||||||||||||
|
Year ended April 30,
|
2013
|
2012
|
2011
|
||||||||||||||||||||||||||||||
|
Average
Balance
|
|
Interest
Income/
Expense
|
|
Average
Yield/
Cost
|
|
Average
Balance
|
|
Interest
Income/
Expense
|
|
Average
Yield/
Cost
|
|
Average
Balance
|
|
Interest
Income/
Expense
|
|
Average
Yield/
Cost
|
|
||||||||||||||||
|
Interest-earning assets:
|
|||||||||||||||||||||||||||||||||
|
Mortgage loans, net
|
$
|
372,339
|
|
$
|
16,556
|
|
4.45
|
%
|
$
|
448,431
|
|
$
|
20,322
|
|
4.53
|
%
|
$
|
545,052
|
|
$
|
24,693
|
|
4.53
|
%
|
|||||||||
|
Federal funds sold
|
1,192
|
|
1
|
|
0.08
|
%
|
2,315
|
|
1
|
|
0.04
|
%
|
2,649
|
|
3
|
|
0.10
|
%
|
|||||||||||||||
|
Credit cards
|
8,119
|
|
3,311
|
|
40.78
|
%
|
—
|
|
—
|
|
—
|
%
|
—
|
|
—
|
|
—
|
%
|
|||||||||||||||
|
Emerald Advance
(1)
|
91,338
|
|
30,997
|
|
33.94
|
%
|
87,711
|
|
28,982
|
|
33.04
|
%
|
141,127
|
|
94,300
|
|
35.21
|
%
|
|||||||||||||||
|
Available-for-sale securities
|
380,055
|
|
6,791
|
|
1.79
|
%
|
250,329
|
|
4,178
|
|
1.67
|
%
|
22,243
|
|
174
|
|
0.78
|
%
|
|||||||||||||||
|
FHLB stock
|
1,879
|
|
—
|
|
—
|
%
|
3,259
|
|
113
|
|
3.47
|
%
|
5,953
|
|
171
|
|
2.88
|
%
|
|||||||||||||||
|
Cash and due from banks
|
690,396
|
|
1,601
|
|
0.23
|
%
|
732,164
|
|
1,806
|
|
0.25
|
%
|
930,666
|
|
2,338
|
|
0.25
|
%
|
|||||||||||||||
|
1,545,318
|
|
$
|
59,257
|
|
3.83
|
%
|
1,524,209
|
|
$
|
55,402
|
|
3.63
|
%
|
1,647,690
|
|
$
|
121,679
|
|
7.38
|
%
|
|||||||||||||
|
Non-interest-earning assets
|
27,974
|
|
56,426
|
|
57,899
|
|
|||||||||||||||||||||||||||
|
Total HRB Bank assets
|
$
|
1,573,292
|
|
$
|
1,580,635
|
|
$
|
1,705,589
|
|
||||||||||||||||||||||||
|
Interest-bearing liabilities:
|
|||||||||||||||||||||||||||||||||
|
Customer deposits
|
$
|
735,368
|
|
$
|
5,660
|
|
0.77
|
%
|
$
|
705,593
|
|
$
|
6,735
|
|
0.95
|
%
|
$
|
830,597
|
|
$
|
8,488
|
|
1.02
|
%
|
|||||||||
|
FHLB borrowing
|
—
|
|
—
|
|
—
|
%
|
23,770
|
|
572
|
|
2.41
|
%
|
72,534
|
|
1,526
|
|
2.10
|
%
|
|||||||||||||||
|
735,368
|
|
$
|
5,660
|
|
0.77
|
%
|
729,363
|
|
$
|
7,307
|
|
1.00
|
%
|
903,131
|
|
$
|
10,014
|
|
1.11
|
%
|
|||||||||||||
|
Non-interest-bearing liabilities
|
364,932
|
|
363,990
|
|
366,666
|
|
|||||||||||||||||||||||||||
|
Total liabilities
|
1,100,300
|
|
1,093,353
|
|
1,269,797
|
|
|||||||||||||||||||||||||||
|
Total shareholders’ equity
|
472,992
|
|
487,282
|
|
435,792
|
|
|||||||||||||||||||||||||||
|
Total liabilities and shareholders’ equity
|
$
|
1,573,292
|
|
$
|
1,580,635
|
|
$
|
1,705,589
|
|
||||||||||||||||||||||||
|
Net yield on interest-earning assets
(1)
|
$
|
53,597
|
|
3.47
|
%
|
$
|
48,095
|
|
3.16
|
%
|
$
|
111,665
|
|
6.78
|
%
|
||||||||||||||||||
|
(1)
|
Includes all interest income related to EA activities. Amounts recognized as interest income also include certain fees, which are amortized into interest income over the life of the loan, of $48.5 million for fiscal year 2011.
|
|
H&R Block 2013 Form 10K
|
33
|
The following table presents the rate/volume variance in interest income and expense for the last two fiscal years:
|
(in 000s)
|
||||||||||||||||||||||||||||||||
|
Year ended April 30,
|
2013
|
2012
|
||||||||||||||||||||||||||||||
|
Total Change
in Interest
Income/ Expense
|
|
Change
Due to
Rate/Volume
|
|
Change
Due to
Rate
|
|
Change
Due to
Volume
|
|
Total Change
in Interest
Income/ Expense
|
|
Change
Due to
Rate/Volume
|
|
Change
Due to
Rate
|
|
Change
Due to
Volume
|
|
|||||||||||||||||
|
Interest income:
|
||||||||||||||||||||||||||||||||
|
Loans, net
(1)
|
$
|
1,560
|
|
$
|
3,052
|
|
$
|
(60
|
)
|
$
|
(1,432
|
)
|
$
|
(69,700
|
)
|
$
|
(46,549
|
)
|
$
|
(5
|
)
|
$
|
(23,146
|
)
|
||||||||
|
Available-for-sale securities
|
2,613
|
|
147
|
|
300
|
|
2,166
|
|
4,004
|
|
2,027
|
|
198
|
|
1,779
|
|
||||||||||||||||
|
Federal funds sold
|
—
|
|
(1
|
)
|
1
|
|
—
|
|
(2
|
)
|
—
|
|
(2
|
)
|
—
|
|
||||||||||||||||
|
FHLB stock
|
(113
|
)
|
50
|
|
(118
|
)
|
(45
|
)
|
(58
|
)
|
(15
|
)
|
35
|
|
(78
|
)
|
||||||||||||||||
|
Cash & due from banks
|
(205
|
)
|
49
|
|
(146
|
)
|
(108
|
)
|
(521
|
)
|
(25
|
)
|
—
|
|
(496
|
)
|
||||||||||||||||
|
$
|
3,855
|
|
$
|
3,297
|
|
$
|
(23
|
)
|
$
|
581
|
|
$
|
(66,277
|
)
|
$
|
(44,562
|
)
|
$
|
226
|
|
$
|
(21,941
|
)
|
|||||||||
|
Interest expense:
|
||||||||||||||||||||||||||||||||
|
Customer deposits
|
$
|
(1,075
|
)
|
$
|
(52
|
)
|
$
|
(1,286
|
)
|
$
|
263
|
|
$
|
(1,753
|
)
|
$
|
(102
|
)
|
$
|
(141
|
)
|
$
|
(1,510
|
)
|
||||||||
|
FHLB borrowings
|
(572
|
)
|
574
|
|
(573
|
)
|
(573
|
)
|
(954
|
)
|
(155
|
)
|
225
|
|
(1,024
|
)
|
||||||||||||||||
|
$
|
(1,647
|
)
|
$
|
522
|
|
$
|
(1,859
|
)
|
$
|
(310
|
)
|
$
|
(2,707
|
)
|
$
|
(257
|
)
|
$
|
84
|
|
$
|
(2,534
|
)
|
|||||||||
|
(1)
|
Includes mortgage loans held for investment, EAs and credit cards. Non-accruing loans have been excluded.
|
INVESTMENT PORTFOLIO
– The following table presents the cost basis and fair value of HRB Bank’s investment portfolio at April 30,
2013
,
2012
and
2011
:
|
(in 000s)
|
||||||||||||||||||||||||
|
As of April 30,
|
2013
|
2012
|
2011
|
|||||||||||||||||||||
|
Cost Basis
|
|
Fair Value
|
|
Cost Basis
|
|
Fair Value
|
|
Cost Basis
|
|
Fair Value
|
|
|||||||||||||
|
Mortgage-backed securities
|
$
|
476,450
|
|
$
|
482,378
|
|
$
|
361,184
|
|
$
|
366,683
|
|
$
|
157,970
|
|
$
|
158,177
|
|
||||||
|
Federal funds sold
|
1,169
|
|
1,169
|
|
1,586
|
|
1,586
|
|
8,727
|
|
8,727
|
|
||||||||||||
|
FHLB stock
|
1,861
|
|
1,861
|
|
1,879
|
|
1,879
|
|
3,315
|
|
3,315
|
|
||||||||||||
|
$
|
479,480
|
|
$
|
485,408
|
|
$
|
364,649
|
|
$
|
370,148
|
|
$
|
170,012
|
|
$
|
170,219
|
|
|||||||
The following table shows the cost basis, scheduled maturities and average yields for HRB Bank’s investment portfolio at April 30,
2013
:
|
(dollars in 000s)
|
|||||||||||||||||||||||||
|
Less Than One Year
|
After Ten Years
|
Total
|
|||||||||||||||||||||||
|
Cost
Basis
|
|
Balance
Due
|
|
Weighted
Average
Yield
|
|
Balance
Due
|
|
Weighted
Average
Yield
|
|
Balance
Due
|
|
Weighted
Average
Yield
|
|
||||||||||||
|
Mortgage-backed securities
|
$
|
476,450
|
|
$
|
—
|
|
—
|
|
$
|
476,450
|
|
1.79
|
%
|
$
|
476,450
|
|
1.79
|
%
|
|||||||
|
Federal funds sold
|
1,169
|
|
1,169
|
|
0.08
|
%
|
—
|
—
|
|
1,169
|
|
0.08
|
%
|
||||||||||||
|
FHLB stock
|
1,861
|
|
1,861
|
|
—
|
%
|
—
|
—
|
|
1,861
|
|
—
|
%
|
||||||||||||
|
$
|
479,480
|
|
$
|
3,030
|
|
$
|
476,450
|
|
$
|
479,480
|
|
||||||||||||||
|
34
|
H&R Block 2013 Form 10K
|
LOAN PORTFOLIO AND SUMMARY OF LOAN LOSS EXPERIENCE
– The following table shows the composition of HRB Bank’s mortgage loan portfolio and information on delinquent loans:
|
(in 000s)
|
||||||||||||||||||||
|
As of April 30,
|
2013
|
|
2012
|
|
2011
|
|
2010
|
|
2009
|
|
||||||||||
|
Residential real estate mortgages
|
$
|
349,841
|
|
$
|
428,568
|
|
$
|
569,610
|
|
$
|
683,452
|
|
$
|
821,583
|
|
|||||
|
Home equity lines of credit
|
170
|
|
174
|
|
183
|
|
232
|
|
254
|
|
||||||||||
|
$
|
350,011
|
|
$
|
428,742
|
|
$
|
569,793
|
|
$
|
683,684
|
|
$
|
821,837
|
|
||||||
|
Loans and TDRs on non–accrual
|
$
|
89,230
|
|
$
|
108,839
|
|
$
|
155,645
|
|
$
|
185,209
|
|
$
|
222,382
|
|
|||||
|
Loans past due 90 days or more
|
74,992
|
|
99,044
|
|
149,501
|
|
153,703
|
|
121,685
|
|
||||||||||
|
Total TDRs
|
55,061
|
|
71,949
|
|
106,328
|
|
144,977
|
|
160,741
|
|
||||||||||
|
Interest income recorded on non–accrual loans
|
4,025
|
|
5,682
|
|
6,311
|
|
7,452
|
|
4,927
|
|
||||||||||
Concentrations of loans to borrowers located in a single state may result in increased exposure to loss as a result of changes in real estate values and underlying economic or market conditions related to a particular geographical location. The table below presents outstanding loans by state, for states with a concentration of 5% or greater, for our portfolio of mortgage loans held for investment as of April 30,
2013
:
|
(dollars in 000s)
|
||||||||||||||||||
|
Loans
Purchased
from SCC
|
|
Loans
Purchased
from Other
Parties
|
|
Total
|
|
Percent
of Total
|
|
Delinquency
Rate (30+ Days)
|
|
|||||||||
|
Florida
|
$
|
18,359
|
|
$
|
47,966
|
|
$
|
66,325
|
|
19
|
%
|
15
|
%
|
|||||
|
New York
|
57,949
|
|
7,619
|
|
65,568
|
|
19
|
%
|
51
|
%
|
||||||||
|
California
|
30,423
|
|
8,703
|
|
39,126
|
|
11
|
%
|
17
|
%
|
||||||||
|
Wisconsin
|
1,388
|
|
28,457
|
|
29,845
|
|
9
|
%
|
5
|
%
|
||||||||
|
All others
|
89,889
|
|
59,258
|
|
149,147
|
|
43
|
%
|
20
|
%
|
||||||||
|
Total
|
$
|
198,008
|
|
$
|
152,003
|
|
$
|
350,011
|
|
100
|
%
|
|||||||
A rollforward of HRB Bank’s allowance for loss on mortgage loans is as follows:
|
(dollars in 000s)
|
||||||||||||||||||||
|
Year ended April 30,
|
2013
|
|
2012
|
|
2011
|
|
2010
|
|
2009
|
|
||||||||||
|
Balance at beginning of the year
|
$
|
26,444
|
|
$
|
90,487
|
|
$
|
93,535
|
|
$
|
84,073
|
|
$
|
45,401
|
|
|||||
|
Provision
|
13,250
|
|
23,875
|
|
35,200
|
|
47,750
|
|
63,897
|
|
||||||||||
|
Recoveries
|
3,253
|
|
252
|
|
272
|
|
88
|
|
54
|
|
||||||||||
|
Charge-offs and transfers
|
(28,633
|
)
|
(88,170
|
)
|
(38,520
|
)
|
(38,376
|
)
|
(25,279
|
)
|
||||||||||
|
Balance at end of the year
|
$
|
14,314
|
|
$
|
26,444
|
|
$
|
90,487
|
|
$
|
93,535
|
|
$
|
84,073
|
|
|||||
|
Ratio of net charge-offs to average loans outstanding during the year
|
6.37
|
%
|
19.61
|
%
|
5.96
|
%
|
4.95
|
%
|
2.80
|
%
|
||||||||||
The increase in charge-offs during fiscal year 2012 was a result of the charge-off of $64.1 million in mortgage loans more than 180 days past due in accordance with OCC regulations, as discussed in Item 8, note 1 to the consolidated financial statements.
|
H&R Block 2013 Form 10K
|
35
|
DEPOSITS
– The following table shows HRB Bank’s average deposit balances and the average rate paid on those deposits for fiscal years
2013
,
2012
and
2011
:
|
(dollars in 000s)
|
|||||||||||||||||||||
|
Year ended April 30,
|
2013
|
2012
|
2011
|
||||||||||||||||||
|
Average
Balance
|
|
Average
Rate
|
|
Average
Balance
|
|
Average
Rate
|
|
Average
Balance
|
|
Average
Rate
|
|
||||||||||
|
Money market and savings
|
$
|
331,819
|
|
0.59
|
%
|
$
|
306,053
|
|
0.71
|
%
|
$
|
279,162
|
|
0.81
|
%
|
||||||
|
Interest-bearing checking accounts
|
12,027
|
|
0.17
|
%
|
14,871
|
|
0.27
|
%
|
10,782
|
|
0.87
|
%
|
|||||||||
|
IRAs
|
322,078
|
|
0.91
|
%
|
334,022
|
|
1.00
|
%
|
353,902
|
|
1.01
|
%
|
|||||||||
|
Certificates of deposit
|
69,444
|
|
1.08
|
%
|
50,647
|
|
2.33
|
%
|
186,742
|
|
1.36
|
%
|
|||||||||
|
735,368
|
|
0.77
|
%
|
705,593
|
|
0.95
|
%
|
830,588
|
|
1.02
|
%
|
||||||||||
|
Non-interest-bearing deposits
|
330,727
|
|
320,566
|
|
310,781
|
|
|||||||||||||||
|
$
|
1,066,095
|
|
$
|
1,026,159
|
|
$
|
1,141,369
|
|
|||||||||||||
RATIOS
– The following table shows certain of HRB Bank’s key ratios for fiscal years
2013
,
2012
and
2011
:
|
Year ended April 30,
|
2013
|
|
2012
|
|
2011
|
|
|||
|
Return on average assets
|
3.0
|
%
|
3.1
|
%
|
1.4
|
%
|
|||
|
Net return on equity
|
10.2
|
%
|
10.0
|
%
|
5.4
|
%
|
|||
|
Equity to assets ratio
|
33.9
|
%
|
34.8
|
%
|
30.8
|
%
|
|||
SHORT-TERM BORROWINGS
– The following table shows HRB Bank’s short-term borrowings for fiscal years
2013
,
2012
and
2011
:
|
(dollars in 000s)
|
|||||||||||||||||||||
|
Year ended April 30,
|
2013
|
2012
|
2011
|
||||||||||||||||||
|
Balance
|
|
Rate
|
|
Balance
|
|
Rate
|
|
Balance
|
|
Rate
|
|
||||||||||
|
Ending balance of FHLB advances
|
$
|
—
|
|
—
|
%
|
$
|
—
|
|
—
|
%
|
$
|
25,000
|
|
2.36
|
%
|
||||||
|
Average balance of FHLB advances
|
—
|
|
—
|
%
|
23,770
|
|
2.41
|
%
|
72,534
|
|
2.10
|
%
|
|||||||||
We did not borrow from the FHLB during fiscal year 2013. The maximum amount of FHLB advances outstanding during fiscal years 2012 and 2011 was $25.0 million and $75.0 million, respectively.
NEW ACCOUNTING PRONOUNCEMENTS
See Item 8, note 1 to the consolidated financial statements under “Intangible Assets and Goodwill” for a discussion of recently issued accounting pronouncements.
|
ITEM 7A.
|
QUANTITATIVE AND QUALITATIVE DISCLOSURES ABOUT MARKET RISK
|
INTEREST RATE RISK
General.
We have a formal investment policy that strives to minimize the market risk exposure of our cash equivalents and available-for-sale (AFS) securities, which are primarily affected by credit quality and movements in interest rates. The guidelines in our investment policy focus on managing liquidity and preserving principal and earnings.
Our cash equivalents are primarily held for liquidity purposes and are comprised of high quality, short-term investments, including money market funds. Because our cash and cash equivalents have a relatively short maturity, our portfolio’s market value is relatively insensitive to interest rate changes.
Our AFS securities consist primarily of mortgage-backed securities held to meet the regulatory requirements of HRB Bank.
As our short-term borrowings are generally seasonal, interest rate risk typically increases through our third fiscal quarter and declines to zero by fiscal year-end. While the market value of short-term borrowings is relatively insensitive to interest rate changes, interest expense on short-term borrowings will increase and decrease with changes in the underlying short-term interest rates.
|
36
|
H&R Block 2013 Form 10K
|
Our long-term debt at April 30,
2013
, consists primarily of fixed-rate Senior Notes; therefore, a change in interest rates would have no impact on consolidated pretax earnings until these notes mature or are refinanced. The fixed-rate interest payable on our Senior Notes is subject to adjustment based upon our credit ratings. See Item 8, note 9 to the consolidated financial statements.
Under criteria published by the OCC, HRB Bank’s overall interest rate risk exposure at March 31,
2013
, the most recent date an evaluation was completed, was characterized as “minimal.” We actively manage our interest rate risk positions. As interest rates change, we will adjust our strategy and mix of assets and liabilities to optimize our position.
Mortgage Loans Held for Investment.
At April 30,
2013
, residential mortgage loans held for investment consisted of a mix of
45%
fixed-rate loans and
55%
adjustable-rate loans. These loans are sensitive to changes in interest rates as well as expected prepayment levels. As interest rates increase, fixed-rate residential mortgages tend to exhibit lower prepayments. The opposite is true in a falling rate environment. When mortgage loans prepay, mortgage origination costs are written off. Depending on the timing of the prepayment, the write-offs of mortgage origination costs may result in lower than anticipated yields.
Customer Deposits and FHLB Advances.
HRB Bank’s liabilities consist primarily of transactional deposit relationships, such as prepaid debit card accounts and checking accounts. Other liabilities typically include money market accounts, certificates of deposit and collateralized borrowings from the FHLB. Money market accounts re-price as interest rates change. Certificates of deposit re-price over time depending on maturities. FHLB advances generally have fixed rates ranging from one day through multiple years. We had no FHLB advances outstanding as of April 30,
2013
.
FOREIGN EXCHANGE RATE RISK
Our operations in international markets are exposed to movements in currency exchange rates. The currencies primarily involved are the Canadian dollar and the Australian dollar. We translate revenues and expenses related to these operations at the average of exchange rates in effect during the period. Assets and liabilities of foreign subsidiaries are translated into U.S. dollars at exchange rates prevailing at the end of the year. Translation adjustments are recorded as a separate component of other comprehensive income in stockholders' equity. Translation of financial results into U.S. dollars does not presently materially affect, and has not historically materially affected, our consolidated financial results, although such changes do affect the year-to-year comparability of the operating results in U.S. dollars of our international businesses. We estimate a 10% change in foreign exchange rates by itself would impact consolidated net income in fiscal years
2013
and
2012
by $4.7 million and $5.1 million, respectively, and cash balances at April 30,
2013
and
2012
by $27.5 million and $10.2 million, respectively.
During previous fiscal years, we used foreign exchange forward contracts to mitigate foreign currency exchange rate risk as we funded our Canadian operations. We did not utilize exchange forward contracts in fiscal year 2013 and do not currently expect to enter into any similar contracts in the future. At April 30, 2013, our Canadian operations had $257.1 million of U.S. dollar denominated liabilities to various U.S. subsidiaries, which are exposed to exchange rate risk. Foreign currency gains on these balances totaled $0.2 million for fiscal year 2013 are included in other income, net on our consolidated statements of income.
SENSITIVITY ANALYSIS
The sensitivities of certain financial instruments to changes in interest rates as of April 30,
2013
and
2012
are presented below. The following table represents hypothetical instantaneous and sustained parallel shifts in interest rates and should not be relied on as an indicator of future expected results. The impact of a change in interest rates on other factors, such as delinquency and prepayment rates, is not included in the analysis below.
|
(in 000s)
|
||||||||||||||||||||||||||||
|
Basis Point Change
|
||||||||||||||||||||||||||||
|
As of:
|
Carrying Value
|
|
–300
|
|
–200
|
|
–100
|
|
+100
|
|
+200
|
|
+300
|
|
||||||||||||||
|
April 30, 2013:
|
||||||||||||||||||||||||||||
|
Mortgage loans held for investment
|
$
|
338,789
|
|
$
|
5,400
|
|
$
|
5,399
|
|
$
|
4,934
|
|
$
|
(4,769
|
)
|
$
|
(10,654
|
)
|
$
|
(18,828
|
)
|
|||||||
|
Mortgage-backed securities
|
482,378
|
|
3,450
|
|
3,472
|
|
4,067
|
|
(17,027
|
)
|
(39,469
|
)
|
(59,975
|
)
|
||||||||||||||
|
April 30, 2012:
|
||||||||||||||||||||||||||||
|
Mortgage loans held for investment
|
$
|
406,201
|
|
$
|
28,689
|
|
$
|
26,403
|
|
$
|
13,610
|
|
$
|
(11,349
|
)
|
$
|
(23,845
|
)
|
$
|
(35,659
|
)
|
|||||||
|
Mortgage-backed securities
|
366,683
|
|
4,996
|
|
4,989
|
|
2,633
|
|
(2,477
|
)
|
(15,008
|
)
|
(29,657
|
)
|
||||||||||||||
|
H&R Block 2013 Form 10K
|
37
|
|
ITEM 8.
|
FINANCIAL STATEMENTS AND SUPPLEMENTARY DATA
|
DISCUSSION OF FINANCIAL RESPONSIBILITY
H&R Block's management is responsible for the integrity and objectivity of the information contained in this document. Management is responsible for the consistency of reporting this information and for ensuring that accounting principles generally accepted in the United States are used. In discharging this responsibility, management maintains an extensive program of internal audits and requires members of management to certify financial information within their scope of management. Our system of internal control over financial reporting also includes formal policies and procedures, including a Code of Business Ethics and Conduct that reinforces our commitment to ethical business conduct and is designed to encourage our employees and directors to act with high standards of integrity in all that they do.
The Audit Committee of the Board of Directors, composed solely of independent outside directors, meets periodically with management, the independent auditor and the Director, Audit Services (our chief internal auditor) to review matters relating to our financial statements, internal audit activities, internal accounting controls and non-audit services provided by the independent auditors. The independent auditor and the Director, Audit Services have full access to the Audit Committee and meet, both with and without management present, to discuss the scope and results of their audits, including internal control, audit and financial matters.
Deloitte & Touche LLP audited our consolidated financial statements for fiscal years
2013
,
2012
and
2011
. The audits were conducted in accordance with the standards of the Public Company Accounting Oversight Board (United States).
MANAGEMENT’S REPORT ON INTERNAL CONTROL OVER FINANCIAL REPORTING
Management is responsible for establishing and maintaining adequate internal control over financial reporting, as such term is defined in Exchange Act Rules 12a-15(f). Under the supervision and with the participation of management, including our Chief Executive Officer and Chief Financial Officer, we conducted an evaluation of the effectiveness of our internal control over financial reporting based on the framework in “Internal Control — Integrated Framework” issued by the Committee of Sponsoring Organizations of the Treadway Commission (COSO) as of April 30,
2013
.
Based on our assessment, management concluded that as of April 30,
2013
, the Company’s internal control over financial reporting was effective based on the criteria set forth by COSO. The Company’s external auditor, Deloitte & Touche LLP, an independent registered public accounting firm, has issued an audit report on the effectiveness of the Company’s internal control over financial reporting.
|
/s/ William C. Cobb
|
/s/ Gregory J. Macfarlane
|
|
|
William C. Cobb
|
Gregory J. Macfarlane
|
|
|
President and Chief Executive Officer
|
Chief Financial Officer
|
|
|
38
|
H&R Block 2013 Form 10K
|
REPORT OF INDEPENDENT REGISTERED PUBLIC ACCOUNTING FIRM
To the Board of Directors and Stockholders of
H&R Block, Inc.
Kansas City, Missouri
We have audited the accompanying consolidated balance sheets of H&R Block, Inc. and subsidiaries (the “Company”) as of April 30, 2013 and 2012, and the related consolidated statements of income and comprehensive income, stockholders' equity, and cash flows for each of the three years in the period ended April 30, 2013. These financial statements are the responsibility of the Company's management. Our responsibility is to express an opinion on the financial statements based on our audits.
We conducted our audits in accordance with the standards of the Public Company Accounting Oversight Board (United States). Those standards require that we plan and perform the audit to obtain reasonable assurance about whether the financial statements are free of material misstatement. An audit includes examining, on a test basis, evidence supporting the amounts and disclosures in the financial statements. An audit also includes assessing the accounting principles used and significant estimates made by management, as well as evaluating the overall financial statement presentation. We believe that our audits provide a reasonable basis for our opinion.
In our opinion, such consolidated financial statements present fairly, in all material respects, the financial position of H&R Block, Inc. and subsidiaries as of April 30, 2013 and 2012, and the results of their operations and their cash flows for each of the three years in the period ended April 30, 2013, in conformity with accounting principles generally accepted in the United States of America.
We have also audited, in accordance with the standards of the Public Company Accounting Oversight Board (United States), the Company's internal control over financial reporting as of April 30, 2013, based on the criteria established in
Internal Control-Integrated Framework
issued by the Committee of Sponsoring Organizations of the Treadway Commission and our report dated June 26, 2013 expressed an unqualified opinion on the Company's internal control over financial reporting.
|
/s/ Deloitte & Touche LLP
|
|
Kansas City, Missouri
|
|
June 26, 2013
|
|
H&R Block 2013 Form 10K
|
39
|
REPORT OF INDEPENDENT REGISTERED PUBLIC ACCOUNTING FIRM
To the Board of Directors and Stockholders of
H&R Block, Inc.
Kansas City, Missouri
We have audited the internal control over financial reporting of H&R Block, Inc. and subsidiaries (the “Company”) as of April 30, 2013, based on criteria established in
Internal Control - Integrated Framework
issued by the Committee of Sponsoring Organizations of the Treadway Commission. The Company's management is responsible for maintaining effective internal control over financial reporting and for its assessment of the effectiveness of internal control over financial reporting, included in the accompanying Management's Report on Internal Control over Financial Reporting. Our responsibility is to express an opinion on the Company's internal control over financial reporting based on our audit.
We conducted our audit in accordance with the standards of the Public Company Accounting Oversight Board (United States). Those standards require that we plan and perform the audit to obtain reasonable assurance about whether effective internal control over financial reporting was maintained in all material respects. Our audit included obtaining an understanding of internal control over financial reporting, assessing the risk that a material weakness exists, testing and evaluating the design and operating effectiveness of internal control based on the assessed risk, and performing such other procedures as we considered necessary in the circumstances. We believe that our audit provides a reasonable basis for our opinion.
A company's internal control over financial reporting is a process designed by, or under the supervision of, the company's principal executive and principal financial officers, or persons performing similar functions, and effected by the company's board of directors, management, and other personnel to provide reasonable assurance regarding the reliability of financial reporting and the preparation of financial statements for external purposes in accordance with generally accepted accounting principles. A company's internal control over financial reporting includes those policies and procedures that (1) pertain to the maintenance of records that, in reasonable detail, accurately and fairly reflect the transactions and dispositions of the assets of the company; (2) provide reasonable assurance that transactions are recorded as necessary to permit preparation of financial statements in accordance with generally accepted accounting principles, and that receipts and expenditures of the company are being made only in accordance with authorizations of management and directors of the company; and (3) provide reasonable assurance regarding prevention or timely detection of unauthorized acquisition, use, or disposition of the company's assets that could have a material effect on the financial statements.
Because of the inherent limitations of internal control over financial reporting, including the possibility of collusion or improper management override of controls, material misstatements due to error or fraud may not be prevented or detected on a timely basis. Also, projections of any evaluation of the effectiveness of the internal control over financial reporting to future periods are subject to the risk that the controls may become inadequate because of changes in conditions, or that the degree of compliance with the policies or procedures may deteriorate.
In our opinion, the Company maintained, in all material respects, effective internal control over financial reporting as of April 30, 2013, based on the criteria established in
Internal Control - Integrated Framework
issued by the Committee of Sponsoring Organizations of the Treadway Commission.
We have also audited, in accordance with the standards of the Public Company Accounting Oversight Board (United States), the consolidated financial statements as of and for the year ended April 30, 2013 of the Company and our report dated June 26, 2013 expressed an unqualified opinion on those financial statements.
|
/s/ Deloitte & Touche LLP
|
|
Kansas City, Missouri
|
|
June 26, 2013
|
|
40
|
H&R Block 2013 Form 10K
|
|
AND COMPREHENSIVE INCOME
|
(in 000s, except per share amounts)
|
|||||||||||
|
Year ended April 30,
|
2013
|
|
2012
|
|
2011
|
|
||||||
|
REVENUES:
|
||||||||||||
|
Service revenues
|
$
|
2,443,000
|
|
$
|
2,434,307
|
|
$
|
2,428,104
|
|
|||
|
Product and other revenues
|
364,114
|
|
359,664
|
|
383,216
|
|
||||||
|
Interest income
|
98,829
|
|
99,800
|
|
133,660
|
|
||||||
|
2,905,943
|
|
2,893,771
|
|
2,944,980
|
|
|||||||
|
OPERATING EXPENSES:
|
||||||||||||
|
Cost of revenues:
|
||||||||||||
|
Compensation and benefits
|
769,161
|
|
828,773
|
|
830,980
|
|
||||||
|
Occupancy and equipment
|
354,612
|
|
381,200
|
|
385,515
|
|
||||||
|
Provision for bad debt and loan losses
|
90,685
|
|
92,157
|
|
174,626
|
|
||||||
|
Interest
|
79,957
|
|
92,089
|
|
94,183
|
|
||||||
|
Depreciation and amortization of property and equipment
|
68,192
|
|
61,390
|
|
61,557
|
|
||||||
|
Other
|
242,181
|
|
246,086
|
|
229,921
|
|
||||||
|
1,604,788
|
|
1,701,695
|
|
1,776,782
|
|
|||||||
|
Impairment of goodwill
|
—
|
|
7,409
|
|
22,700
|
|
||||||
|
Selling, general and administrative
|
604,469
|
|
618,375
|
|
529,159
|
|
||||||
|
2,209,257
|
|
2,327,479
|
|
2,328,641
|
|
|||||||
|
Operating income
|
696,686
|
|
566,292
|
|
616,339
|
|
||||||
|
Other income, net
|
5,325
|
|
9,778
|
|
11,364
|
|
||||||
|
Income from continuing operations before income taxes
|
702,011
|
|
576,070
|
|
627,703
|
|
||||||
|
Income taxes
|
236,853
|
|
230,102
|
|
235,156
|
|
||||||
|
Net income from continuing operations
|
465,158
|
|
345,968
|
|
392,547
|
|
||||||
|
Net income (loss) from discontinued operations
|
(31,210
|
)
|
(80,036
|
)
|
13,563
|
|
||||||
|
NET INCOME
|
$
|
433,948
|
|
$
|
265,932
|
|
$
|
406,110
|
|
|||
|
BASIC EARNINGS (LOSS) PER SHARE:
|
||||||||||||
|
Continuing operations
|
$
|
1.70
|
|
$
|
1.16
|
|
$
|
1.27
|
|
|||
|
Discontinued operations
|
(0.11
|
)
|
(0.27
|
)
|
0.04
|
|
||||||
|
Consolidated
|
$
|
1.59
|
|
$
|
0.89
|
|
$
|
1.31
|
|
|||
|
DILUTED EARNINGS (LOSS) PER SHARE:
|
||||||||||||
|
Continuing operations
|
$
|
1.69
|
|
$
|
1.16
|
|
$
|
1.27
|
|
|||
|
Discontinued operations
|
(0.11
|
)
|
(0.27
|
)
|
0.04
|
|
||||||
|
Consolidated
|
$
|
1.58
|
|
$
|
0.89
|
|
$
|
1.31
|
|
|||
|
COMPREHENSIVE INCOME:
|
||||||||||||
|
Net income
|
$
|
433,948
|
|
$
|
265,932
|
|
$
|
406,110
|
|
|||
|
Unrealized gains on securities, net of taxes:
|
||||||||||||
|
Unrealized holding gains arising during the year, net of taxes of $229, $2,121 and $58
|
269
|
|
3,192
|
|
73
|
|
||||||
|
Reclassification adjustment for gains (losses) included in income, net of taxes of $71, $58 and ($133)
|
(104
|
)
|
(94
|
)
|
55
|
|
||||||
|
Change in foreign currency translation adjustments
|
(1,760
|
)
|
(2,186
|
)
|
9,427
|
|
||||||
|
Other comprehensive income (loss)
|
(1,595
|
)
|
912
|
|
9,555
|
|
||||||
|
Comprehensive income
|
$
|
432,353
|
|
$
|
266,844
|
|
$
|
415,665
|
|
|||
See accompanying notes to consolidated financial statements.
|
H&R Block 2013 Form 10K
|
41
|
|
|
(in 000s, except share and
per share amounts)
|
|||||||
|
As of April 30,
|
2013
|
|
2012
|
|
||||
|
ASSETS
|
||||||||
|
Cash and cash equivalents
|
$
|
1,747,584
|
|
$
|
1,944,334
|
|
||
|
Cash and cash equivalents — restricted
|
117,837
|
|
48,100
|
|
||||
|
Receivables, less allowance for doubtful accounts of $50,399 and $44,589
|
206,835
|
|
193,858
|
|
||||
|
Prepaid expenses and other current assets
|
390,087
|
|
314,702
|
|
||||
|
Total current assets
|
2,462,343
|
|
2,500,994
|
|
||||
|
Mortgage loans held for investment, less allowance for loan losses of $14,314 and $26,540
|
338,789
|
|
406,201
|
|
||||
|
Investments in available-for-sale securities
|
486,876
|
|
371,315
|
|
||||
|
Property and equipment, at cost less accumulated depreciation and amortization of $420,318 and $529,841
|
267,880
|
|
240,772
|
|
||||
|
Intangible assets, net
|
284,439
|
|
276,664
|
|
||||
|
Goodwill
|
434,782
|
|
427,566
|
|
||||
|
Other assets
|
262,670
|
|
426,055
|
|
||||
|
Total assets
|
$
|
4,537,779
|
|
$
|
4,649,567
|
|
||
|
LIABILITIES AND STOCKHOLDERS’ EQUITY
|
||||||||
|
LIABILITIES:
|
||||||||
|
Customer banking deposits
|
$
|
936,464
|
|
$
|
827,549
|
|
||
|
Accounts payable, accrued expenses and other current liabilities
|
523,921
|
|
567,079
|
|
||||
|
Accrued salaries, wages and payroll taxes
|
134,970
|
|
163,992
|
|
||||
|
Accrued income taxes
|
416,128
|
|
336,374
|
|
||||
|
Current portion of long-term debt
|
722
|
|
631,434
|
|
||||
|
Total current liabilities
|
2,012,205
|
|
2,526,428
|
|
||||
|
Long-term debt
|
905,958
|
|
409,115
|
|
||||
|
Other noncurrent liabilities
|
356,069
|
|
388,132
|
|
||||
|
Total liabilities
|
3,274,232
|
|
3,323,675
|
|
||||
|
COMMITMENTS AND CONTINGENCIES
|
|
|
|
|
||||
|
STOCKHOLDERS’ EQUITY:
|
||||||||
|
Common stock, no par, stated value $.01 per share, 800,000,000 shares authorized, shares issued of 316,628,110 and 397,886,599
|
3,166
|
|
3,979
|
|
||||
|
Convertible preferred stock, no par, stated value $0.01 per share, 500,000 shares authorized
|
—
|
|
—
|
|
||||
|
Additional paid-in capital
|
752,483
|
|
796,784
|
|
||||
|
Accumulated other comprehensive income
|
10,550
|
|
12,145
|
|
||||
|
Retained earnings
|
1,333,445
|
|
2,523,997
|
|
||||
|
Less treasury shares, at cost
|
(836,097
|
)
|
(2,011,013
|
)
|
||||
|
Total stockholders’ equity
|
1,263,547
|
|
1,325,892
|
|
||||
|
Total liabilities and stockholders’ equity
|
$
|
4,537,779
|
|
$
|
4,649,567
|
|
||
See accompanying notes to consolidated financial statements.
|
42
|
H&R Block 2013 Form 10K
|
|
|
(in 000s)
|
|
||||||||||
|
Year ended April 30,
|
2013
|
|
2012
|
|
2011
|
|
||||||
|
CASH FLOWS FROM OPERATING ACTIVITIES:
|
||||||||||||
|
Net income
|
$
|
433,948
|
|
$
|
265,932
|
|
$
|
406,110
|
|
|||
|
Adjustments to reconcile net income to net cash provided by operating activities:
|
||||||||||||
|
Depreciation and amortization
|
92,407
|
|
103,576
|
|
121,633
|
|
||||||
|
Provision for bad debt and loan losses
|
90,685
|
|
97,365
|
|
180,951
|
|
||||||
|
Provision for deferred taxes
|
(21,846
|
)
|
13,227
|
|
9,432
|
|
||||||
|
Stock-based compensation
|
15,293
|
|
14,968
|
|
14,500
|
|
||||||
|
Impairment of goodwill and intangible assets
|
3,581
|
|
113,951
|
|
22,700
|
|
||||||
|
Changes in assets and liabilities, net of acquisitions:
|
||||||||||||
|
Cash and cash equivalents — restricted
|
(69,737
|
)
|
(2,917
|
)
|
(14,033
|
)
|
||||||
|
Receivables
|
(72,662
|
)
|
49,755
|
|
(105,708
|
)
|
||||||
|
Prepaid expenses and other current assets
|
(3,465
|
)
|
538
|
|
(37,892
|
)
|
||||||
|
Other noncurrent assets
|
78,778
|
|
25,552
|
|
(98,818
|
)
|
||||||
|
Accounts payable, accrued expenses and other current liabilities
|
(37,017
|
)
|
(45,114
|
)
|
(111,727
|
)
|
||||||
|
Accrued salaries, wages and payroll taxes
|
(28,861
|
)
|
(58,210
|
)
|
56,009
|
|
||||||
|
Accrued income taxes
|
88,459
|
|
(92,843
|
)
|
5,962
|
|
||||||
|
Other noncurrent liabilities
|
(71,998
|
)
|
(88,870
|
)
|
119,428
|
|
||||||
|
Other, net
|
(457
|
)
|
(34,861
|
)
|
(56,044
|
)
|
||||||
|
Net cash provided by operating activities
|
497,108
|
|
362,049
|
|
512,503
|
|
||||||
|
CASH FLOWS FROM INVESTING ACTIVITIES:
|
||||||||||||
|
Purchases of available-for-sale securities
|
(227,177
|
)
|
(256,173
|
)
|
(138,824
|
)
|
||||||
|
Sales, maturities and payments received on available-for-sale securities
|
118,411
|
|
66,382
|
|
16,797
|
|
||||||
|
Principal payments on mortgage loans held for investment, net
|
44,031
|
|
49,142
|
|
58,471
|
|
||||||
|
Purchases of property and equipment, net
|
(113,239
|
)
|
(82,457
|
)
|
(62,959
|
)
|
||||||
|
Payments made for acquisitions of businesses and intangibles, net
|
(20,742
|
)
|
(15,258
|
)
|
(54,171
|
)
|
||||||
|
Proceeds from sale of businesses, net
|
3,785
|
|
560,499
|
|
71,083
|
|
||||||
|
Franchise loans:
|
||||||||||||
|
Loans funded
|
(70,807
|
)
|
(46,246
|
)
|
(92,455
|
)
|
||||||
|
Payments received
|
83,445
|
|
56,591
|
|
57,552
|
|
||||||
|
Surrender of company-owned life insurance policies
|
81,125
|
|
—
|
|
—
|
|
||||||
|
Other, net
|
(9,769
|
)
|
19,387
|
|
34,349
|
|
||||||
|
Net cash provided by (used in) investing activities
|
(110,937
|
)
|
351,867
|
|
(110,157
|
)
|
||||||
|
CASH FLOWS FROM FINANCING ACTIVITIES:
|
||||||||||||
|
Repayments of commercial paper
|
(1,214,238
|
)
|
(664,167
|
)
|
(4,818,766
|
)
|
||||||
|
Proceeds from issuance of commercial paper
|
1,214,238
|
|
664,167
|
|
4,818,766
|
|
||||||
|
Repayments of long-term debt
|
(636,621
|
)
|
—
|
|
—
|
|
||||||
|
Proceeds from issuance of long-term debt
|
497,185
|
|
—
|
|
—
|
|
||||||
|
Repayments of FHLB borrowings
|
—
|
|
(25,000
|
)
|
(50,000
|
)
|
||||||
|
Customer banking deposits, net
|
103,608
|
|
(26,091
|
)
|
(11,440
|
)
|
||||||
|
Dividends paid
|
(217,201
|
)
|
(208,801
|
)
|
(186,802
|
)
|
||||||
|
Repurchase of common stock, including shares surrendered
|
(340,413
|
)
|
(180,592
|
)
|
(283,534
|
)
|
||||||
|
Proceeds from exercise of stock options, net
|
25,139
|
|
12,275
|
|
424
|
|
||||||
|
Other, net
|
(16,238
|
)
|
(16,853
|
)
|
(3,039
|
)
|
||||||
|
Net cash used in financing activities
|
(584,541
|
)
|
(445,062
|
)
|
(534,391
|
)
|
||||||
|
Effects of exchange rates on cash
|
1,620
|
|
(2,364
|
)
|
5,844
|
|
||||||
|
Net increase (decrease) in cash and cash equivalents
|
(196,750
|
)
|
266,490
|
|
(126,201
|
)
|
||||||
|
Cash and cash equivalents at beginning of the year
|
1,944,334
|
|
1,677,844
|
|
1,804,045
|
|
||||||
|
Cash and cash equivalents at end of the year
|
$
|
1,747,584
|
|
$
|
1,944,334
|
|
$
|
1,677,844
|
|
|||
|
SUPPLEMENTARY CASH FLOW DATA:
|
||||||||||||
|
Income taxes paid, net
|
$
|
155,617
|
|
$
|
218,444
|
|
$
|
244,917
|
|
|||
|
Interest paid on borrowings
|
73,559
|
|
69,681
|
|
73,791
|
|
||||||
|
Interest paid on deposits
|
5,665
|
|
6,843
|
|
8,541
|
|
||||||
|
Transfers of foreclosed loans to other assets
|
10,357
|
|
10,308
|
|
16,463
|
|
||||||
|
Accrued additions to property and equipment
|
4,261
|
|
801
|
|
1,269
|
|
||||||
|
Accrued purchase of common stock
|
—
|
|
22,484
|
|
—
|
|
||||||
|
H&R Block 2013 Form 10K
|
43
|
|
CONSOLIDATED STATEMENTS OF STOCKHOLDERS’ EQUITY
|
(amounts in 000s, except per share amounts)
|
||||||||||||||||||||||||||||||||||||
|
Common Stock
|
Convertible Preferred Stock
|
Accumulated
|
|
Treasury Stock
|
|||||||||||||||||||||||||||||||||
|
Shares
|
|
Amount
|
|
Shares
|
|
Amount
|
|
Additional
Paid-in
Capital
|
|
Other
Comprehensive
Income (Loss)
|
|
Retained
Earnings
|
|
Shares
|
|
Amount
|
|
Total
Stockholders’
Equity
|
|
||||||||||||||||||
|
Balances at May 1, 2010
|
431,391
|
|
$
|
4,314
|
|
—
|
|
$
|
—
|
|
$
|
832,604
|
|
$
|
1,678
|
|
$
|
2,658,586
|
|
(108,085
|
)
|
$
|
(2,056,552
|
)
|
$
|
1,440,630
|
|
||||||||||
|
Net income
|
—
|
|
—
|
|
—
|
|
—
|
|
—
|
|
—
|
|
406,110
|
|
—
|
|
—
|
|
406,110
|
|
|||||||||||||||||
|
Unrealized translation gain
|
—
|
|
—
|
|
—
|
|
—
|
|
—
|
|
9,427
|
|
—
|
|
—
|
|
—
|
|
9,427
|
|
|||||||||||||||||
|
Change in net unrealized gain on available-for-sale securities
|
—
|
|
—
|
|
—
|
|
—
|
|
—
|
|
128
|
|
—
|
|
—
|
|
—
|
|
128
|
|
|||||||||||||||||
|
Stock-based compensation
|
—
|
|
—
|
|
—
|
|
—
|
|
14,500
|
|
—
|
|
—
|
|
—
|
|
—
|
|
14,500
|
|
|||||||||||||||||
|
Shares issued for:
|
|||||||||||||||||||||||||||||||||||||
|
Option exercises
|
—
|
|
—
|
|
—
|
|
—
|
|
(8,332
|
)
|
—
|
|
—
|
|
339
|
|
6,439
|
|
(1,893
|
)
|
|||||||||||||||||
|
Nonvested shares/units
|
—
|
|
—
|
|
—
|
|
—
|
|
(12,952
|
)
|
—
|
|
(95
|
)
|
632
|
|
12,028
|
|
(1,019
|
)
|
|||||||||||||||||
|
ESPP
|
—
|
|
—
|
|
—
|
|
—
|
|
(1,784
|
)
|
—
|
|
—
|
|
269
|
|
5,121
|
|
3,337
|
|
|||||||||||||||||
|
Acquisition of treasury shares
|
—
|
|
—
|
|
—
|
|
—
|
|
—
|
|
—
|
|
—
|
|
(230
|
)
|
(3,588
|
)
|
(3,588
|
)
|
|||||||||||||||||
|
Repurchase and retirement of common shares
|
(18,950
|
)
|
(190
|
)
|
—
|
|
—
|
|
(11,370
|
)
|
—
|
|
(268,387
|
)
|
—
|
|
—
|
|
(279,947
|
)
|
|||||||||||||||||
|
Cash dividends declared – $0.45 per share
|
—
|
|
—
|
|
—
|
|
—
|
|
—
|
|
—
|
|
(138,111
|
)
|
—
|
|
—
|
|
(138,111
|
)
|
|||||||||||||||||
|
Balances at April 30, 2011
|
412,441
|
|
4,124
|
|
—
|
|
—
|
|
812,666
|
|
11,233
|
|
2,658,103
|
|
(107,075
|
)
|
(2,036,552
|
)
|
1,449,574
|
|
|||||||||||||||||
|
Net income
|
—
|
|
—
|
|
—
|
|
—
|
|
—
|
|
—
|
|
265,932
|
|
—
|
|
—
|
|
265,932
|
|
|||||||||||||||||
|
Unrealized translation loss
|
—
|
|
—
|
|
—
|
|
—
|
|
—
|
|
(2,186
|
)
|
—
|
|
—
|
|
—
|
|
(2,186
|
)
|
|||||||||||||||||
|
Change in net unrealized gain on available-for-sale securities
|
—
|
|
—
|
|
—
|
|
—
|
|
—
|
|
3,098
|
|
—
|
|
—
|
|
—
|
|
3,098
|
|
|||||||||||||||||
|
Stock-based compensation
|
—
|
|
—
|
|
—
|
|
—
|
|
14,968
|
|
—
|
|
—
|
|
—
|
|
—
|
|
14,968
|
|
|||||||||||||||||
|
Shares issued for:
|
|||||||||||||||||||||||||||||||||||||
|
Option exercises
|
—
|
|
—
|
|
—
|
|
—
|
|
(7,875
|
)
|
—
|
|
—
|
|
658
|
|
12,509
|
|
4,634
|
|
|||||||||||||||||
|
Nonvested shares/units
|
—
|
|
—
|
|
—
|
|
—
|
|
(13,113
|
)
|
—
|
|
(125
|
)
|
684
|
|
13,011
|
|
(227
|
)
|
|||||||||||||||||
|
ESPP
|
—
|
|
—
|
|
—
|
|
—
|
|
(1,130
|
)
|
—
|
|
—
|
|
163
|
|
3,106
|
|
1,976
|
|
|||||||||||||||||
|
Acquisition of treasury shares
|
—
|
|
—
|
|
—
|
|
—
|
|
—
|
|
—
|
|
—
|
|
(198
|
)
|
(3,087
|
)
|
(3,087
|
)
|
|||||||||||||||||
|
Repurchase and retirement of common shares
|
(14,554
|
)
|
(145
|
)
|
—
|
|
—
|
|
(8,732
|
)
|
—
|
|
(191,112
|
)
|
—
|
|
—
|
|
(199,989
|
)
|
|||||||||||||||||
|
Cash dividends declared – $0.70 per share
|
—
|
|
—
|
|
—
|
|
—
|
|
—
|
|
—
|
|
(208,801
|
)
|
—
|
|
—
|
|
(208,801
|
)
|
|||||||||||||||||
|
Balances at April 30, 2012
|
397,887
|
|
3,979
|
|
—
|
|
—
|
|
796,784
|
|
12,145
|
|
2,523,997
|
|
(105,768
|
)
|
(2,011,013
|
)
|
1,325,892
|
|
|||||||||||||||||
|
Net income
|
—
|
|
—
|
|
—
|
|
—
|
|
—
|
|
—
|
|
433,948
|
|
—
|
|
—
|
|
433,948
|
|
|||||||||||||||||
|
Unrealized translation loss
|
—
|
|
—
|
|
—
|
|
—
|
|
—
|
|
(1,760
|
)
|
—
|
|
—
|
|
—
|
|
(1,760
|
)
|
|||||||||||||||||
|
Change in net unrealized gain on available-for-sale securities
|
—
|
|
—
|
|
—
|
|
—
|
|
—
|
|
165
|
|
—
|
|
—
|
|
—
|
|
165
|
|
|||||||||||||||||
|
Stock-based compensation
|
—
|
|
—
|
|
—
|
|
—
|
|
15,293
|
|
—
|
|
—
|
|
—
|
|
—
|
|
15,293
|
|
|||||||||||||||||
|
Shares issued for:
|
|||||||||||||||||||||||||||||||||||||
|
Option exercises
|
—
|
|
—
|
|
—
|
|
—
|
|
(2,766
|
)
|
—
|
|
—
|
|
1,414
|
|
26,881
|
|
24,115
|
|
|||||||||||||||||
|
Nonvested shares/units
|
—
|
|
—
|
|
—
|
|
—
|
|
(8,551
|
)
|
—
|
|
(257
|
)
|
463
|
|
8,793
|
|
(15
|
)
|
|||||||||||||||||
|
ESPP
|
—
|
|
—
|
|
—
|
|
—
|
|
(335
|
)
|
—
|
|
—
|
|
72
|
|
1,373
|
|
1,038
|
|
|||||||||||||||||
|
Acquisition of treasury shares
|
—
|
|
—
|
|
—
|
|
—
|
|
—
|
|
—
|
|
—
|
|
(174
|
)
|
(2,928
|
)
|
(2,928
|
)
|
|||||||||||||||||
|
Repurchase and retirement of common shares
|
(21,259
|
)
|
(213
|
)
|
—
|
|
—
|
|
(12,542
|
)
|
—
|
|
(302,245
|
)
|
—
|
|
—
|
|
(315,000
|
)
|
|||||||||||||||||
|
Retirement of common shares held in treasury
|
(60,000
|
)
|
(600
|
)
|
—
|
|
—
|
|
(35,400
|
)
|
—
|
|
(1,104,797
|
)
|
60,000
|
|
1,140,797
|
|
—
|
|
|||||||||||||||||
|
Cash dividends declared – $0.80 per share
|
—
|
|
—
|
|
—
|
|
—
|
|
—
|
|
—
|
|
(217,201
|
)
|
—
|
|
—
|
|
(217,201
|
)
|
|||||||||||||||||
|
Balances at April 30, 2013
|
316,628
|
|
$
|
3,166
|
|
—
|
|
$
|
—
|
|
$
|
752,483
|
|
$
|
10,550
|
|
$
|
1,333,445
|
|
(43,993
|
)
|
$
|
(836,097
|
)
|
$
|
1,263,547
|
|
||||||||||
|
44
|
H&R Block 2013 Form 10K
|
NOTES TO CONSOLIDATED FINANCIAL STATEMENTS
NATURE OF OPERATIONS
– Our operating subsidiaries provide a variety of tax preparation and related services to the general public, principally in the U.S. Specifically, we offer: assisted tax return preparation; H&R Block At Home
®
digital do-it-yourself services and products, and certain retail banking services. We also provide tax preparation services in Canada and Australia.
PRINCIPLES OF CONSOLIDATION
– The consolidated financial statements include the accounts of the Company and our wholly-owned subsidiaries. Intercompany transactions and balances have been eliminated.
Some of our subsidiaries operate in regulated industries and their underlying accounting records reflect the policies and requirements of these industries.
DISCONTINUED OPERATIONS
– In fiscal year 2012, we sold RSM McGladrey, Inc. (RSM) and McGladrey Capital Markets LLC (MCM). All periods presented in the consolidated statements of income reflect the results of these operations as discontinued operations. Our discontinued operations also include the results of operations of Sand Canyon Corporation, formerly known as Option One Mortgage Corporation, and its subsidiaries (SCC), which exited its mortgage business in fiscal year 2008. See additional information in notes 16, 18, 19 and 20.
MANAGEMENT ESTIMATES
– The preparation of financial statements in conformity with generally accepted accounting principles requires management to make estimates and assumptions that affect the reported amounts of assets and liabilities and disclosure of contingent assets and liabilities at the date of the financial statements and the reported amounts of revenues and expenses during the reporting periods. Significant estimates, assumptions and judgments are applied in the determination of contingent losses arising from our discontinued mortgage business, contingent losses associated with pending claims and litigation, allowance for loan losses, valuation allowances based on future taxable income, reserves for uncertain tax positions and related matters. Estimates have been prepared on the basis of the most current and best information available as of each balance sheet date. As such, actual results could differ materially from those estimates.
CASH AND CASH EQUIVALENTS
– Cash and cash equivalents include cash on hand, cash due from banks, short-term investments and federal funds sold. For purposes of the consolidated balance sheets and consolidated statements of cash flows, all non-restricted highly liquid instruments purchased with an original maturity of three months or less are considered to be cash equivalents.
Outstanding checks in excess of funds on deposit (book overdrafts) included in accounts payable totaled
$35.6 million
and
$33.9 million
at April 30,
2013
and
2012
, respectively.
We present cash flow activities utilizing the indirect method.
CASH AND CASH EQUIVALENTS – RESTRICTED
– Cash and cash equivalents – restricted consists primarily of cash held by H&R Block Bank (HRB Bank) required for regulatory compliance and cash held by our captive insurance subsidiary that will be used to pay claims.
RECEIVABLES AND RELATED ALLOWANCES
– Our non-financing receivables consist primarily of accounts receivable from tax clients for tax return preparation. The allowance for doubtful accounts for these receivables requires management’s judgment regarding collectibility and current economic conditions to establish an amount considered by management to be adequate to cover estimated losses as of the balance sheet date. Receivables from tax clients for tax return preparation are not specifically identified and charged off, but are evaluated on a pooled basis. At the end of each tax season the outstanding balances on these receivables are evaluated based on collections received and expected collections over subsequent tax seasons.
Our financing receivables consist primarily of mortgage loans held for investment, H&R Block Emerald Advance
®
lines of Credit (EAs), loans made to franchisees, amounts due under our refund discount program in Canada (CashBack) and credit card receivables.
H&R Block Emerald Advance
®
lines of credit
. EAs are typically offered to clients in our offices from late November through mid-January, currently in an amount not to exceed
$1,000
. If the borrower meets certain criteria as agreed in the loan terms, the line of credit can be increased and utilized year-round. These lines of credit are offered by HRB Bank.
Interest income on EAs is calculated using the average daily balance method and is recognized based on the principal amount outstanding until the outstanding balance is paid or becomes delinquent. Loan commitment fees on EAs, net of related expenses, are initially deferred and recognized as revenue over the commitment period, which is typically
two months
. EA balances require an annual paydown on February 15
th
, and any amounts unpaid are placed on non-accrual status as of March 1
st
. Payments on past due amounts are applied to principal.
|
H&R Block 2013 Form 10K
|
45
|
We review the credit quality of these receivables based on pools, which are segregated by the year of origination. We determine our allowance for these receivables based on a review of receipts taking into consideration historical experience. These receivables are not specifically identified, but are evaluated on a pooled basis. Bad debt rates also consider whether the loan was made to a new or repeat client. At the end of each tax season, the outstanding balances on the past-due receivables are evaluated based on collections received and expected collections over subsequent tax seasons. We charge-off receivables to an amount we believe represents the net realizable value.
Loans made to franchisees.
Interest income on loans made to franchisees is calculated using the average daily balance method and is recognized based on the principal amount outstanding until the outstanding balance is paid or written off. The credit quality of these receivables is assessed at an individual franchisee level, taking into account the franchisee's credit score, the franchisee's payment history on existing loans and operational amounts due to us, the loan-to-value ratio and debt-to-income ratio. Credit scores, loan-to-value and debt-to-income ratios are obtained at the time of underwriting. Payment history is monitored on a regular basis. We believe all loans to franchisees are of similar credit quality. Loans are evaluated for collectibility when they become delinquent. Amounts deemed to be uncollectible are written off to bad debt expense and bad debt related to these loans has typically been insignificant. Additionally, the franchise territory serves as collateral for the loan. In the event the franchisee is unable to repay the loan, we revoke franchise rights, write off the remaining balance of the loan and refranchise the territory or begin operating it as company-owned.
CashBack receivables.
During the tax season, our Canadian operations advance refunds due to certain clients from the Canada Revenue Agency (CRA), in exchange for a fee. The total fee we charge for this service is mandated by the CRA. The client assigns to us the full amount of the tax refund to be issued by the CRA and the refund is then sent by the CRA directly to us. The amount we advance to clients under this program is the amount of their estimated refund, less our fees, any amounts expected to be withheld by the CRA for amounts the client may owe to government authorities and any amounts owed to us from prior years. The CRA's system for tracking amounts due to various government agencies also indicates if the client has already filed a return, does not exist in the CRA's records or is bankrupt. This serves to greatly reduce the amounts of uncollectible receivables and the risk of fraudulent returns.
Interest is not charged on these balances, in accordance with CRA regulations.
We determine our allowance for these receivables collectively, based on a review of receipts taking into consideration historical experience. These receivables are not specifically identified, but are evaluated on a pooled basis. In September of each fiscal year, any balances remaining from the previous tax season are charged-off against the related allowance.
Credit card receivables.
In November 2012, HRB Bank began offering unsecured credit cards. These credit cards are offered to selected customers, primarily previous H&R Block clients, based on their credit profile and have a maximum available credit limit of
$2,500
.
Interest income on credit cards is calculated using the average daily balance method and is recognized based on the principal amount outstanding. In accordance with accounting and regulatory guidelines, credit card receivables are generally exempt from being placed on nonaccrual status; therefore, interest and fees continue to accrue until the receivable is charged-off or paid in full. The estimated uncollectible portion of accrued interest and fee income on credit card receivables is included in the related allowance. Annual fees on credit cards, net of related expenses, are initially deferred and recognized as revenue over the commitment period, which is typically twelve months.
We recorded an allowance for credit card receivables based on a combination of industry information for similar credit cards and our experience to date. We may adjust our allowance in the future as more payment and delinquency trends become available.
Credit card receivables are generally charged-off against the related allowance at
180
days past due or within
60
days of receiving notification of a customer's bankruptcy filing or other event.
MORTGAGE LOANS HELD FOR INVESTMENT
– Mortgage loans held for investment represent loans originated or acquired with the ability and current intent to hold to maturity. Loans held for investment are carried at amortized cost adjusted for charge-offs, net of allowance for loan losses, deferred fees or costs on originated loans and unamortized premiums or discounts on purchased loans. Loan fees and certain direct loan origination costs are deferred and the net fee or cost is recognized in interest income over the life of the related loan. Unearned income, premiums and discounts on purchased loans are amortized or accreted into income over the estimated life of the loan using methods that approximate the interest method based on assumptions regarding the loan portfolio, including prepayments adjusted to reflect actual experience.
We record an allowance representing our estimate of credit losses inherent in the loan portfolio at the balance sheet date. Loan recoveries and the provision for credit losses increase the allowance, while loan charge-offs decrease the allowance. A current assessment of the value of the loan’s underlying collateral is made when the loan is no later than
60
days past due and any loan balance in excess of the value less costs to sell the property is included in the provision for credit losses.
|
46
|
H&R Block 2013 Form 10K
|
We evaluate mortgage loans less than
60
days past due on a pooled basis and record a loan loss allowance for those loans in the aggregate. We stratify these loans based on our view of risk associated with various elements of the pool and assign estimated loss rates based on those risks. Loss rates consider both the rate at which loans will become delinquent (frequency) and the amount of loss that will ultimately be realized upon occurrence of a liquidation of collateral (severity), and are primarily based on historical experience and our assessment of economic and market conditions.
Loans are considered impaired when we believe it is probable we will be unable to collect all principal and interest due according to the contractual terms of the note, or when the loan is
60
days past due. Impaired loans are reviewed individually and loss estimates are based on the fair value of the underlying collateral. For loans over
60
days but less than
180
days past due we record a loan loss allowance. For loans
180
days or more past due we charge-off the loan to the value of the collateral less costs to sell. During fiscal year 2012 we changed from recording a specific loan loss allowance for loans
180
days or more past due to charging-off those loans. This change had no income statement impact, but reduced the principal amount of loans outstanding and the related allowance. This change was made as a result of our change in regulators from the Office of Thrift Supervision (OTS) to the Office of the Comptroller of the Currency (OCC).
We classify loans as non-accrual when full and timely collection of interest or principal becomes uncertain, or when they are
90
days past due. Interest previously accrued, but not collected, is reversed against current interest income when a loan is placed on non-accrual status. Accretion of deferred fees is discontinued for non-accrual loans. Payments received on non-accrual loans are recognized as interest income when the loan is considered collectible and applied to principal when it is doubtful that all contractual payments will be collected. Loans are not placed back on accrual status until collection of principal and interest is reasonably assured as a result of the borrower bringing the loan into compliance with the contractual terms of the loan. Prior to restoring a loan to accrual status, management considers a borrower’s prospects for continuing future contractual payments.
From time to time, as part of our loss mitigation process, we may agree to modify the contractual terms of a borrower’s loan. We have developed loan modification programs designed to help borrowers refinance adjustable-rate mortgage loans prior to rate reset or who may otherwise have difficulty making their payments. In cases where we modify a loan and in so doing grant a concession to a borrower experiencing financial difficulty, the modification is considered a troubled debt restructuring (TDR). We may consider the borrower’s payment status and history, the borrower’s ability to pay upon a rate reset on an adjustable-rate mortgage, the size of the payment increase upon a rate reset, the period of time remaining prior to the rate reset and other relevant factors in determining whether a borrower is experiencing financial difficulty. A borrower who is current may be deemed to be experiencing financial difficulty in instances where the evidence suggests an inability to pay based on the original terms of the loan after the interest rate reset and, in the absence of a modification, may default on the loan. We evaluate whether the modification represents a concession we would not otherwise consider, such as a lower interest rate than what a new borrower of similar credit risk would be offered. A loan modified in a TDR, including a loan that was current at the time of modification, is placed on non-accrual status until we determine future collection of principal and interest is reasonably assured, which generally requires the borrower to demonstrate a period of performance according to the restructured terms. At the time of the modification, we record impairment for TDR loans equal to the difference between the principal balance of the loan and the present value of expected future cash flows discounted at the loan’s effective interest rate. However, if we later assess that foreclosure of a modified loan is probable, we record an impairment based on the estimated fair value (typically appraised value less costs to sell) of the underlying collateral.
REAL ESTATE OWNED
– Real estate owned (REO) includes foreclosed properties securing mortgage loans. Foreclosed assets are adjusted to fair value less costs to sell upon transfer of the loans to REO. Subsequently, REO is carried at the lower of carrying value or fair value less costs to sell. Fair value is generally based on independent market prices or appraised values of the collateral. Subsequent holding period losses and losses arising from the sale of REO are expensed as incurred. REO is included in prepaid expenses and other current assets in the consolidated balance sheets.
INVESTMENTS
– Investments include both available-for-sale marketable securities and investments held-to-maturity. Short-term investments are included in prepaid expenses and other current assets in the consolidated balance sheets.
Available-for-Sale.
Our investments in marketable securities are classified as available-for-sale (AFS) and are reported at fair value. Unrealized gains and losses are calculated using the specific identification method and reported, net of applicable taxes, as a component of accumulated other comprehensive income. Realized gains and losses on the sale of these securities are determined using the specific identification method.
We monitor our AFS investment portfolio for impairment and consider many factors in determining whether the impairment is deemed to be other-than-temporary. These factors include, but are not limited to, the length of time the security has had a market value less than the cost basis, the severity of loss, our intent to sell (including regulatory or contractual requirements to sell), recent events specific to the issuer or industry, external credit ratings and recent downgrades in such ratings.
For investments in mortgage-backed securities, amortization of premiums and accretion of discounts are recognized in interest income using the interest method, adjusted for anticipated prepayments where applicable. We update our estimates of expected cash flows periodically and recognize changes in calculated effective yields as appropriate.
|
H&R Block 2013 Form 10K
|
47
|
Held-to-Maturity.
Our investment in the stock of the Federal Home Loan Bank of Des Moines (FHLB) is carried at cost, as it is a restricted security, which is required to be maintained by HRB Bank for borrowing availability. The cost of the stock represents its redemption value, as there is no ready market value. This investment is included in other assets in the consolidated balance sheets.
PROPERTY AND EQUIPMENT
– Buildings and equipment are initially recorded at cost and are depreciated over the estimated useful life of the assets using the straight-line method. Leasehold improvements are initially recorded at cost and are amortized over the lesser of the remaining term of the respective lease or the estimated useful life, using the straight-line method. Estimated useful lives are
15
to
40
years for buildings,
three
to
five
years for computers and other equipment,
three
years for purchased software and up to
eight
years for leasehold improvements.
Substantially all of the operations of our subsidiaries are conducted in leased premises. For all lease agreements, including those with escalating rent payments or rent holidays, we recognize rent expense on a straight-line basis.
INTANGIBLE ASSETS AND GOODWILL
– We test goodwill for impairment annually or more frequently, whenever events occur or circumstances change which would, more likely than not, reduce the fair value of a reporting unit below its carrying value.
In September 2011, the FASB issued Accounting Standards Update 2011-08, “Intangibles - Goodwill and Other (Topic 350): Testing Goodwill for Impairment.” Under the amendments in this guidance, an entity may consider qualitative factors before applying Step 1 of the goodwill impairment assessment, but are no longer permitted to carry forward estimates of a reporting unit's fair value from a prior year when specific criteria are met. These amendments were effective for us as the beginning of our current fiscal year. We adopted this guidance as of May 1, 2012, and this new guidance did not have a material effect on our consolidated financial statements.
Our goodwill impairment analysis begins with a qualitative assessment of goodwill to determine if it is more likely than not that the fair value of a reporting unit is less than its carrying value including goodwill. Alternatively, we may bypass this qualitative assessment and perform a detailed quantitative test of impairment. If the qualitative assessment indicates impairment, or if we elect to bypass the qualitative analysis, we then perform a two-step quantitative assessment. In the first step, we compare the fair value of a reporting unit with our carrying amount including goodwill using an income approach and a market approach. Discounted cash flow (DCF) analyses are based on current revenue and expense forecasts and estimated long-term growth estimates for each reporting unit. Projected cash flows are discounted based on a market comparable weighted average cost of capital rate for each reporting unit, adjusted for market and other risks where appropriate. The market approach involves analyzing market multiples of key metrics. In addition, we analyze any difference between the sum of the fair values of the reporting units and our total market capitalization for reasonableness.
If the fair value of a reporting unit exceeds its carrying value, goodwill of the reporting unit is considered not impaired. If the fair value of the reporting unit is less than the carrying value, a second step is performed in which the implied fair value of the reporting unit’s goodwill is compared to the carrying value of the goodwill. The implied fair value of the goodwill is determined based on the difference between the fair value of the reporting unit and the net fair value of the identifiable assets and liabilities of the reporting unit. If the implied fair value of the goodwill is less than the carrying value, the difference is recognized as an impairment charge.
A qualitative assessment of goodwill was performed for certain reporting units during the fourth quarter of fiscal year 2013. We assessed economic conditions and industry and market considerations, in addition to the overall financial performance of these reporting units. Based on the results of our assessment, we determined that it was not more likely than not that these reporting units had a carrying value in excess of its fair value. Accordingly, no further goodwill testing was completed.
Based on the quantitative assessment performed on all other reporting units during the fourth quarter of fiscal year 2013, the fair value of the goodwill within our reporting units substantially exceeded its carrying value. We did not recognize any impairment charges related to our annual impairment test of goodwill during fiscal year 2013.
In addition, long-lived assets, including intangible assets with finite lives, are assessed for impairment whenever events or circumstances indicate the carrying value may not be fully recoverable by comparing the carrying value to future undiscounted cash flows. Impairment is recorded for long-lived assets determined not to be fully recoverable equal to the excess of the carrying amount of the asset over its estimated fair value.
See note 7 for discussion of the impairment of goodwill and intangible assets during fiscal years 2013, 2012 and 2011.
We capitalize certain allowable costs associated with software developed for internal use. These costs are typically amortized over
36 months
using the straight-line method.
The weighted-average life of intangible assets with finite lives is
28
years. Intangible assets are typically amortized over the estimated useful life of the assets using the straight-line method.
|
48
|
H&R Block 2013 Form 10K
|
COMMERCIAL PAPER
– During fiscal years
2013
and
2012
, we issued commercial paper to finance seasonal liquidity needs. We had no commercial paper outstanding at April 30,
2013
or
2012
.
LITIGATION AND RELATED CONTINGENCIES
– It is our policy to routinely assess the likelihood of any adverse judgments or outcomes related to legal matters, as well as ranges of probable losses. A determination of the amount of the liability required to be accrued, if any, for these contingencies is made after analysis of each known issue and an analysis of historical experience. We accrue liabilities related to legal matters for which we believe it is probable that a loss will be incurred and the amount of the loss can be reasonably estimated. With respect to other matters, management has concluded that a loss is only reasonably possible or remote, or not reasonably estimable and, therefore, we do not accrue a liability. Management discloses the facts regarding material matters, and a range of potential exposure if estimable, for losses assessed as reasonably possible to occur. Costs incurred with defending claims are expensed as incurred. Any receivable for insurance recoveries is recorded separately from the corresponding litigation liability, and only if recovery is determined to be probable.
INCOME TAXES
– We account for income taxes under the asset and liability method, which requires us to record deferred income tax assets and liabilities for future tax consequences attributable to differences between the financial statement carrying value of existing assets and liabilities and their respective tax basis. Deferred taxes are determined separately for each tax-paying component within each tax jurisdiction based on provisions of enacted tax law. Deferred tax assets and liabilities are measured using enacted tax rates expected to apply to taxable income in the years in which those temporary differences are expected to be recovered or settled. Our deferred tax assets include capital loss and state and foreign tax loss carry-forwards and are reduced by a valuation allowance if, based on available evidence, it is more likely than not that some portion or all of the deferred tax assets will not be realized. Our current deferred tax assets are included in prepaid expenses and other current assets in the consolidated balance sheets. Noncurrent deferred tax assets are included in other assets on the consolidated balance sheets. Noncurrent deferred tax liabilities are included in other noncurrent liabilities on the consolidated balance sheets.
We evaluate the sustainability of each uncertain tax position based on its technical merits. If we determine it is more likely than not a tax position will be sustained based on its technical merits, we record the impact of the position in our consolidated financial statements at the largest amount that is greater than fifty percent likely of being realized upon ultimate settlement. We do not record a tax benefit for tax positions where we have concluded it is not more likely than not to be sustained. Differences between a tax position taken or expected to be taken in our tax returns and the amount of benefit recognized and measured in the financial statements result in unrecognized tax benefits, which are recorded in the balance sheet as either a liability for unrecognized tax benefits or reductions to recorded tax assets, as applicable.
We file a consolidated federal tax return on a calendar year basis and state tax returns on a consolidated or combined basis, as permitted by authorities. We report interest and penalties as a component of income tax expense.
TREASURY SHARES
– We record shares of common stock repurchased by us as treasury shares, at cost, resulting in a reduction of stockholders’ equity. Periodically, we may retire shares held in treasury as determined by our Board of Directors. We reissue treasury shares as part of our stock-based compensation programs or for acquisitions. When shares are reissued, we determine the cost using the average cost method.
REVENUE RECOGNITION
– Service revenues consist primarily of fees for preparation and filing of tax returns, both in offices and through our online programs, fees associated with our Peace of Mind
®
(POM) guarantee program and interchange income associated with our H&R Block Prepaid Emerald MasterCard
®
program. Service revenues are recognized in the period in which the service is performed as follows:
|
▪
|
Assisted and online tax preparation revenues are recorded when a completed return is electronically filed or accepted by the customer.
|
|
▪
|
POM revenues are deferred and recognized over the term of the guarantee, based on actual and projected claims.
|
|
▪
|
Revenues associated with our H&R Block Prepaid Emerald MasterCard® program consist of interchange income from the use of debit cards and fees from the use of ATM networks. Interchange income is a fee paid by a merchant bank to the card-issuing bank through the interchange network, and is based on cardholder purchase volumes. Interchange income is recognized as earned.
|
Product and other revenues in the current year include royalties from franchisees and sales of software products, and are recognized as follows:
|
▪
|
Upon granting of a franchise, franchisees pay a refundable deposit generally in the amount of
$2,500
, but pay no initial franchise fee. We record the payment as a deposit liability and recognize no revenue in connection with the initial granting of a franchise. Franchise royalties, which are based on contractual percentages of franchise revenues, are recorded in the period in which the franchise provides the service.
|
|
▪
|
Revenue from the sale of software such as H&R Block At Home
®
is recognized when the product is sold to the end user, either through assisted, online or other channels. Rebates, slotting fees and other incentives paid in connection with these
|
|
H&R Block 2013 Form 10K
|
49
|
sales are recorded as a reduction of revenue. Revenue from the sale of TaxWorks® software is deferred and recognized over the period for which upgrades and support are provided to the customer.
Interest income consists primarily of interest earned on mortgage loans held for investment, EAs and credit cards and is recognized as follows:
|
▪
|
Interest income on mortgage loans held for investment includes deferred origination fees and costs and purchase discounts and premiums, which are amortized to income over the life of the loan using the interest method.
|
|
▪
|
Interest income on EAs and loans to franchisees is calculated using the average daily balance method and is recognized based on the principal amount outstanding until the outstanding balance is paid or becomes delinquent.
|
|
▪
|
Interest income on credit cards is calculated in accordance with the terms of the applicable cardholder agreements until the date of charge-off.
|
|
▪
|
Loan commitment fees, net of related expenses, are initially deferred and recognized as revenue over the commitment period.
|
Revenue recognition is evaluated separately for each unit in multiple-deliverable arrangements. Sales tax we collect and remit to taxing authorities is recorded net in the consolidated statements of income.
ADVERTISING EXPENSE
– Advertising costs for radio and television ads are expensed the first time the advertisement takes place, with print and mailing advertising expensed as incurred. Total advertising costs of continuing operations for fiscal years
2013
,
2012
and
2011
totaled
$270.8 million
,
$278.8 million
and
$243.3 million
, respectively.
GAINS ON SALES OF TAX OFFICES
– We periodically sell company-owned tax offices to franchisees. We offer loans to our franchisees to finance these sales. Gains are recorded upon determination that collection of the sales proceeds is reasonably assured. Gains are initially deferred when they are financed with these loans and are recognized after minimum payments and equity thresholds are met. Gains are reported in operating income due to their recurring nature, and are included as a reduction of selling, general and administrative expenses in the consolidated statements of income.
During fiscal years
2013
,
2012
and
2011
, we sold certain retail tax offices to existing franchisees for cash proceeds of
$3.8 million
,
$17.3 million
and
$65.6 million
, respectively, and recorded gains on these sales of
$1.3 million
,
$16.6 million
and
$45.1 million
, respectively.
EMPLOYEE BENEFIT PLANS
– We have a 401(k) defined contribution plan covering eligible full-time and seasonal employees following the completion of an eligibility period. Contributions to this plan are discretionary and totaled
$11.3 million
,
$12.8 million
and
$12.1 million
for fiscal years
2013
,
2012
and
2011
, respectively.
We have severance plans covering executives and eligible regular full-time or part-time active employees of a participating employer who incur a qualifying termination. Expenses related to severance benefits totaled
$4.8 million
,
$32.5 million
and
$29.6 million
in fiscal years
2013
,
2012
and
2011
, respectively.
FOREIGN CURRENCY TRANSLATION
– Our international subsidiaries generally consider their local currency to be their functional currency. Assets and liabilities of foreign subsidiaries are translated into U.S. dollars at exchange rates prevailing at the end of the year. Revenues and expenses of our foreign operations are translated at the average exchanges rates in effect during the fiscal year. Translation adjustments are recorded as a separate component of other comprehensive income in stockholders’ equity.
COMPREHENSIVE INCOME
– Our comprehensive income is comprised of net income, foreign currency translation adjustments and the change in net unrealized gains or losses on AFS marketable securities. Included in stockholders’ equity at April 30,
2013
and
2012
, the net unrealized holding gain on AFS securities was
$3.7 million
and
$3.6 million
, respectively, and the foreign currency translation adjustment was
$6.8 million
and
$8.6 million
, respectively.
Basic and diluted earnings per share is computed using the two-class method. The two-class method is an earnings allocation formula that determines net income per share for each class of common stock and participating security according to dividends declared and participation rights in undistributed earnings. Per share amounts are computed by dividing net income from continuing operations attributable to common shareholders by the weighted average shares outstanding during each period.
|
50
|
H&R Block 2013 Form 10K
|
The computations of basic and diluted earnings per share from continuing operations are as follows:
|
(in 000s, except per share amounts)
|
||||||||||||
|
Year ended April 30,
|
2013
|
|
2012
|
|
2011
|
|
||||||
|
Net income from continuing operations attributable to shareholders
|
$
|
465,158
|
|
$
|
345,968
|
|
$
|
392,547
|
|
|||
|
Net income allocated to participating securities
|
(542
|
)
|
(455
|
)
|
(1,007
|
)
|
||||||
|
Net income from continuing operations attributable to common shareholders
|
$
|
464,616
|
|
$
|
345,513
|
|
$
|
391,540
|
|
|||
|
Basic weighted average common shares
|
273,057
|
|
297,863
|
|
309,230
|
|
||||||
|
Potential dilutive shares
|
1,302
|
|
738
|
|
547
|
|
||||||
|
Dilutive weighted average common shares
|
274,359
|
|
298,601
|
|
309,777
|
|
||||||
|
Earnings per share from continuing operations attributable to common shareholders:
|
||||||||||||
|
Basic
|
1.70
|
|
1.16
|
|
1.27
|
|
||||||
|
Diluted
|
1.69
|
|
1.16
|
|
1.27
|
|
||||||
Diluted earnings per share excludes the impact of shares of common stock issuable upon the lapse of certain restrictions or the exercise of options to purchase
3.3 million
,
8.9 million
and
12.8 million
shares of stock for fiscal years
2013
,
2012
and
2011
, respectively, as the effect would be antidilutive.
Short-term receivables consist of the following:
|
(in 000s)
|
||||||||
|
As of April 30,
|
2013
|
|
2012
|
|
||||
|
Loans to franchisees
|
$
|
65,413
|
|
$
|
61,252
|
|
||
|
Receivables for tax preparation and related fees
|
49,356
|
|
42,286
|
|
||||
|
CashBack receivables
|
47,658
|
|
56,846
|
|
||||
|
Emerald Advance lines of credit
|
23,218
|
|
23,717
|
|
||||
|
Royalties from franchisees
|
10,722
|
|
5,781
|
|
||||
|
Credit cards
|
7,733
|
|
—
|
|
||||
|
Other
|
53,134
|
|
48,565
|
|
||||
|
257,234
|
|
238,447
|
|
|||||
|
Allowance for doubtful accounts
|
(50,399
|
)
|
(44,589
|
)
|
||||
|
$
|
206,835
|
|
$
|
193,858
|
|
|||
The short-term portion of EAs, loans made to franchisees, CashBack balances and credit card balances is included in receivables, while the long-term portion is included in other assets in the consolidated balance sheets. These amounts are as follows:
|
(in 000s)
|
||||||||||||||||
|
EAs
|
|
Loans
to Franchisees |
|
CashBack
|
|
Credit Cards
|
|
|||||||||
|
As of April 30, 2013:
|
||||||||||||||||
|
Short-term
|
$
|
23,218
|
|
$
|
65,413
|
|
$
|
47,658
|
|
$
|
7,733
|
|
||||
|
Long-term
|
9,819
|
|
103,047
|
|
—
|
|
15,538
|
|
||||||||
|
$
|
33,037
|
|
$
|
168,460
|
|
$
|
47,658
|
|
$
|
23,271
|
|
|||||
|
As of April 30, 2012:
|
||||||||||||||||
|
Short-term
|
$
|
23,717
|
|
$
|
61,252
|
|
$
|
56,846
|
|
$
|
—
|
|
||||
|
Long-term
|
13,007
|
|
109,837
|
|
—
|
|
—
|
|
||||||||
|
$
|
36,724
|
|
$
|
171,089
|
|
$
|
56,846
|
|
$
|
—
|
|
|||||
|
H&R Block 2013 Form 10K
|
51
|
EAs
.
We review the credit quality of our EA receivables based on pools, which are segregated by the year of origination, with older years being deemed more unlikely to be repaid. These amounts as of April 30,
2013
, by year of origination, are as follows:
|
(in 000s)
|
||||
|
Credit Quality Indicator – Year of origination:
|
||||
|
2013
|
$
|
11,548
|
|
|
|
2012
|
1,480
|
|
||
|
2011
|
2,412
|
|
||
|
2010 and prior
|
6,434
|
|
||
|
Revolving loans
|
11,163
|
|
||
|
$
|
33,037
|
|
||
As of April 30,
2013
and
2012
,
$30.0 million
and
$31.4 million
of EAs were on non-accrual status and classified as impaired, or more than
60
days past due, respectively.
Loans to Franchisees.
Loans made to franchisees as of April 30,
2013
totaled
$168.5 million
, and consisted of
$121.2 million
in term loans made to finance the purchase of franchises and
$47.3 million
in revolving lines of credit primarily for the purpose of funding off-season working capital needs. Loans made to franchisees totaled
$171.1 million
as of April 30,
2012
, and consisted of
$127.0 million
in term loans and
$44.1 million
in revolving lines of credit. As of April 30,
2013
, loans with a principal amount of
$0.1 million
were more than 30 days past due, however we had no loans to franchisees on non-accrual status. There were no loans to franchisees more than 30 days past due as of April 30, 2012.
CashBack.
Refunds advanced under the CashBack program are not subject to credit approval, therefore the primary indicator of credit quality is the age of the receivable amount. CashBack amounts are generally received within 60 days of filing the client's return. As of April 30,
2013
and
2012
,
$1.8 million
and
$3.8 million
of CashBack balances were more than 60 days old, respectively.
Credit Cards.
We utilize a four-tier underwriting approach at origination. Each of the four tiers, with Tier 4 representing the most risk, is comprised of a combination of FICO scores ranging from 521 to 680, generic and custom credit bureau based risk scores and client attributes. The criteria in the tiers are not subsequently updated. The population also includes a sample of clients which are “un-scorable.” Although we utilize the borrower's credit score for underwriting, we do not consider the credit score to be a primary measure of credit quality, since it tends to be a lagging indicator. Credit card receivable balances as of April 30,
2013
, by credit tier, are as follows:
|
(in 000s)
|
||||
|
Tier 1
|
$
|
4,708
|
|
|
|
Tier 2
|
9,912
|
|
||
|
Tier 3
|
2,895
|
|
||
|
Tier 4
|
5,756
|
|
||
|
$
|
23,271
|
|
||
An aging of our credit card receivable balances as of April 30,
2013
is as follows :
|
(in 000s)
|
||||
|
Current
|
$
|
14,447
|
|
|
|
Less than 30 days past due
|
2,479
|
|
||
|
30 - 59 days past due
|
1,716
|
|
||
|
60 - 89 days past due
|
1,149
|
|
||
|
90 days or more past due
|
3,480
|
|
||
|
$
|
23,271
|
|
||
As of April 30,
2013
, none of our credit card balances were more than 180 days past due.
As of April 30,
2013
, a total of
$2.1 million
in unamortized deferred fees and costs were capitalized related to our credit card balances.
Other.
We have a long-term note receivable in the amount of
$54.0 million
due from McGladrey & Pullen LLP (M&P) related to the sale of RSM in November 2011. This note is unsecured and bears interest at a rate of
8.0%
, with all principal and accrued
|
52
|
H&R Block 2013 Form 10K
|
interest due in May 2017. As of April 30,
2013
, there is no allowance recorded related to this note. We continue to monitor publicly available information relevant to the financial condition of M&P to assess future collectibility. This note is included in other assets on the consolidated balance sheet, with a total of
$60.4 million
and
$55.4 million
in principal and accrued interest recorded as of April 30,
2013
and
2012
, respectively.
Allowance for Doubtful Accounts.
Activity in the allowance for doubtful accounts for our short-term and long-term receivables for the years ended April 30,
2013
,
2012
and
2011
is as follows:
|
(in 000s)
|
||||||||||||||||||||||||
|
EAs
|
|
Loans
to Franchisees |
|
CashBack
|
|
Credit Cards
|
|
All Other
|
|
Total
|
|
|||||||||||||
|
Balance as of May 1, 2010
|
$
|
35,239
|
|
$
|
4
|
|
$
|
3,850
|
|
$
|
—
|
|
$
|
52,064
|
|
$
|
91,157
|
|
||||||
|
Provision
|
91,546
|
|
—
|
|
4,853
|
|
—
|
|
41,540
|
|
137,939
|
|
||||||||||||
|
Charge-offs
|
(122,385
|
)
|
(4
|
)
|
(4,811
|
)
|
—
|
|
(53,953
|
)
|
(181,153
|
)
|
||||||||||||
|
Balance as of April 30, 2011
|
4,400
|
|
—
|
|
3,892
|
|
—
|
|
39,651
|
|
47,943
|
|
||||||||||||
|
Provision
|
28,057
|
|
—
|
|
1,631
|
|
—
|
|
36,974
|
|
66,662
|
|
||||||||||||
|
Charge-offs
|
(26,257
|
)
|
—
|
|
(3,244
|
)
|
—
|
|
(40,515
|
)
|
(70,016
|
)
|
||||||||||||
|
Balance as of April 30, 2012
|
6,200
|
|
—
|
|
2,279
|
|
—
|
|
36,110
|
|
44,589
|
|
||||||||||||
|
Provision
|
28,430
|
|
—
|
|
4,647
|
|
7,349
|
|
35,300
|
|
75,726
|
|
||||||||||||
|
Charge-offs
|
(27,240
|
)
|
—
|
|
(4,157
|
)
|
(45
|
)
|
(31,170
|
)
|
(62,612
|
)
|
||||||||||||
|
Balance as of April 30, 2013
|
$
|
7,390
|
|
$
|
—
|
|
$
|
2,769
|
|
$
|
7,304
|
|
$
|
40,240
|
|
$
|
57,703
|
|
||||||
Other than the new methodology implemented to record the allowance for credit card receivables, there were no changes to our methodology related to the calculation of our allowance for doubtful accounts during fiscal year
2013
.
The composition of our mortgage loan portfolio as of April 30,
2013
and
2012
is as follows:
|
(dollars in 000s)
|
||||||||||||||
|
As of April 30,
|
2013
|
2012
|
||||||||||||
|
Amount
|
|
% of Total
|
|
Amount
|
|
% of Total
|
|
|||||||
|
Adjustable-rate loans
|
$
|
191,093
|
|
55
|
%
|
$
|
238,442
|
|
56
|
%
|
||||
|
Fixed-rate loans
|
159,142
|
|
45
|
%
|
190,870
|
|
44
|
%
|
||||||
|
350,235
|
|
100
|
%
|
429,312
|
|
100
|
%
|
|||||||
|
Unamortized deferred fees and costs
|
2,868
|
|
3,429
|
|
||||||||||
|
Less: Allowance for loan losses
|
(14,314
|
)
|
(26,540
|
)
|
||||||||||
|
$
|
338,789
|
|
$
|
406,201
|
|
|||||||||
Our loan loss allowance as a percent of mortgage loans was
4.1%
as of April 30,
2013
, compared to
6.2%
as of April 30,
2012
. Activity in the allowance for loan losses for the years ended April 30,
2013
,
2012
and
2011
is as follows:
|
(in 000s)
|
||||||||||||
|
Year ended April 30,
|
2013
|
|
2012
|
|
2011
|
|
||||||
|
Balance at beginning of the year
|
$
|
26,540
|
|
$
|
92,087
|
|
$
|
93,535
|
|
|||
|
Provision
|
13,283
|
|
24,075
|
|
35,567
|
|
||||||
|
Recoveries
|
3,338
|
|
292
|
|
272
|
|
||||||
|
Charge-offs
|
(28,847
|
)
|
(89,914
|
)
|
(37,287
|
)
|
||||||
|
Balance at end of the year
|
$
|
14,314
|
|
$
|
26,540
|
|
$
|
92,087
|
|
|||
Charge-offs increased during fiscal year 2012 primarily due to a change in practice, under which we now charge-off loans
180
days past due as discussed in note 1.
When determining our allowance for loan losses, we evaluate loans less than
60
days past due on a pooled basis, while loans we consider impaired, including those loans more than
60
days past due or modified as TDRs, are evaluated individually. The balance of these loans and the related allowance is as follows:
|
H&R Block 2013 Form 10K
|
53
|
|
(in 000s)
|
||||||||||||||||
|
As of April 30,
|
2013
|
2012
|
||||||||||||||
|
Portfolio Balance
|
|
Related Allowance
|
|
Portfolio Balance
|
|
Related Allowance
|
|
|||||||||
|
Pooled (less than 60 days past due)
|
$
|
207,319
|
|
$
|
5,628
|
|
$
|
248,772
|
|
$
|
9,237
|
|
||||
|
Impaired:
|
||||||||||||||||
|
Individually (TDRs)
|
55,061
|
|
4,924
|
|
71,949
|
|
7,752
|
|
||||||||
|
Individually (60 days or more past due)
|
87,855
|
|
3,762
|
|
108,591
|
|
9,551
|
|
||||||||
|
$
|
350,235
|
|
$
|
14,314
|
|
$
|
429,312
|
|
$
|
26,540
|
|
|||||
Detail of our mortgage loans held for investment and the related allowance at April 30,
2013
is as follows:
|
(dollars in 000s)
|
||||||||||||||
|
Outstanding Principal Balance
|
|
Loan Loss Allowance
|
% 30+ Days
Past Due
|
|
||||||||||
|
Amount
|
|
% of Principal
|
|
|||||||||||
|
Purchased from SCC
|
$
|
198,204
|
|
$
|
10,926
|
|
5.5
|
%
|
33.7
|
%
|
||||
|
All other
|
152,031
|
|
3,388
|
|
2.2
|
%
|
9.3
|
%
|
||||||
|
$
|
350,235
|
|
$
|
14,314
|
|
4.1
|
%
|
23.1
|
%
|
|||||
We review the credit quality of our portfolio based on the following criteria: (1) originator; (2) the level of documentation obtained for loan at origination; (3) occupancy status of property at origination; (4) geography; and (5) credit score and loan to value at origination. We specifically evaluate each loan and assign an internal risk rating of high, medium or low to each loan. The risk rating is based upon multiple loan characteristics that correlate to delinquency and loss. These characteristics include, but are not limited to, the five criteria listed above. These loan attributes are evaluated quarterly against a variety of additional characteristics to ensure the appropriate data is being utilized to determine the level of risk within the portfolio. All criteria are obtained at the time of origination and are only subsequently updated if the loan is refinanced.
Credit quality indicators at April 30,
2013
include the following:
|
(in 000s)
|
||||||||||||
|
Credit Quality Indicators
|
Purchased from SCC
|
|
All Other
|
|
Total Portfolio
|
|
||||||
|
Occupancy status:
|
||||||||||||
|
Owner occupied
|
$
|
143,924
|
|
$
|
97,490
|
|
$
|
241,414
|
|
|||
|
Non-owner occupied
|
54,280
|
|
54,541
|
|
108,821
|
|
||||||
|
$
|
198,204
|
|
$
|
152,031
|
|
$
|
350,235
|
|
||||
|
Documentation level:
|
||||||||||||
|
Full documentation
|
$
|
65,176
|
|
$
|
110,904
|
|
$
|
176,080
|
|
|||
|
Limited documentation
|
6,640
|
|
15,787
|
|
22,427
|
|
||||||
|
Stated income
|
109,740
|
|
15,906
|
|
125,646
|
|
||||||
|
No documentation
|
16,648
|
|
9,434
|
|
26,082
|
|
||||||
|
$
|
198,204
|
|
$
|
152,031
|
|
$
|
350,235
|
|
||||
|
Internal risk rating:
|
||||||||||||
|
High
|
$
|
62,459
|
|
$
|
—
|
|
$
|
62,459
|
|
|||
|
Medium
|
135,745
|
|
—
|
|
135,745
|
|
||||||
|
Low
|
—
|
|
152,031
|
|
152,031
|
|
||||||
|
$
|
198,204
|
|
$
|
152,031
|
|
$
|
350,235
|
|
||||
Loans given our internal risk rating of “high” were originated by SCC, and generally had no documentation or were based on stated income. Loans given our internal risk rating of “medium” were generally full documentation or based on stated income, with loan-to-value ratios at origination of more than
80%
, and were made to borrowers with credit scores below
700
at origination. Loans given our internal risk rating of “low” were generally full documentation, with loan-to-value ratios at origination of less than
80%
and were made to borrowers with credit scores greater than
700
at origination.
Our mortgage loans held for investment include concentrations of loans to borrowers in certain states, which may result in increased exposure to loss as a result of changes in real estate values and underlying economic or market conditions related to a particular geographical location. Approximately
57%
of our mortgage loan portfolio consists of loans to borrowers located in the states of Florida, California, New York and Wisconsin.
|
54
|
H&R Block 2013 Form 10K
|
Detail of the aging of the mortgage loans in our portfolio as of April 30,
2013
is as follows:
|
(in 000s)
|
||||||||||||||||||||||||
|
Less than 60
Days Past Due
|
|
60 – 89 Days
Past Due
|
|
90+ Days
Past Due
(1)
|
|
Total
Past Due
|
|
Current
|
|
Total
|
|
|||||||||||||
|
Purchased from SCC
|
$
|
14,778
|
|
$
|
2,765
|
|
$
|
63,421
|
|
$
|
80,964
|
|
$
|
117,240
|
|
$
|
198,204
|
|
||||||
|
All other
|
5,716
|
|
2,076
|
|
11,795
|
|
19,587
|
|
132,444
|
|
152,031
|
|
||||||||||||
|
$
|
20,494
|
|
$
|
4,841
|
|
$
|
75,216
|
|
$
|
100,551
|
|
$
|
249,684
|
|
$
|
350,235
|
|
|||||||
|
(1)
|
We do not accrue interest on loans past due
90
days or more.
|
Information related to our non-accrual loans is as follows:
|
(in 000s)
|
|
|||||||
|
As of April 30,
|
2013
|
|
2012
|
|
||||
|
Loans:
|
||||||||
|
Purchased from SCC
|
$
|
70,327
|
|
$
|
88,347
|
|
||
|
Other
|
14,906
|
|
16,626
|
|
||||
|
85,233
|
|
104,973
|
|
|||||
|
TDRs:
|
||||||||
|
Purchased from SCC
|
3,719
|
|
3,166
|
|
||||
|
Other
|
502
|
|
1,270
|
|
||||
|
4,221
|
|
4,436
|
|
|||||
|
Total non-accrual loans
|
$
|
89,454
|
|
$
|
109,409
|
|
||
Information related to impaired loans is as follows:
|
(in 000s)
|
||||||||||||||||
|
Balance
With Allowance |
|
Balance
With No Allowance |
|
Total
Impaired Loans |
|
Related Allowance
|
|
|||||||||
|
As of April 30, 2013:
|
||||||||||||||||
|
Purchased from SCC
|
$
|
33,791
|
|
$
|
84,592
|
|
$
|
118,383
|
|
$
|
6,573
|
|
||||
|
Other
|
7,601
|
|
16,932
|
|
24,533
|
|
2,113
|
|
||||||||
|
$
|
41,392
|
|
$
|
101,524
|
|
$
|
142,916
|
|
$
|
8,686
|
|
|||||
|
As of April 30, 2012:
|
||||||||||||||||
|
Purchased from SCC
|
$
|
56,128
|
|
$
|
97,591
|
|
$
|
153,719
|
|
$
|
14,917
|
|
||||
|
Other
|
7,137
|
|
19,684
|
|
26,821
|
|
2,386
|
|
||||||||
|
$
|
63,265
|
|
$
|
117,275
|
|
$
|
180,540
|
|
$
|
17,303
|
|
|||||
Information related to the allowance for impaired loans is as follows:
|
(in 000s)
|
||||||||
|
As of April 30,
|
2013
|
|
2012
|
|
||||
|
Portion of total allowance for loan losses allocated to impaired loans and TDR loans:
|
||||||||
|
Based on collateral value method
|
$
|
3,762
|
|
$
|
9,551
|
|
||
|
Based on discounted cash flow method
|
4,924
|
|
7,752
|
|
||||
|
$
|
8,686
|
|
$
|
17,303
|
|
|||
|
H&R Block 2013 Form 10K
|
55
|
Information related to activities of our non-performing assets is as follows:
|
(in 000s)
|
||||||||||||
|
For the year ended April 30,
|
2013
|
|
2012
|
|
2011
|
|
||||||
|
Average impaired loans:
|
||||||||||||
|
Purchased from SCC
|
$
|
133,936
|
|
$
|
211,867
|
|
$
|
252,673
|
|
|||
|
All other
|
25,425
|
|
33,940
|
|
37,082
|
|
||||||
|
$
|
159,361
|
|
$
|
245,807
|
|
$
|
289,755
|
|
||||
|
Interest income on impaired loans:
|
||||||||||||
|
Purchased from SCC
|
$
|
3,825
|
|
$
|
5,454
|
|
$
|
5,795
|
|
|||
|
All other
|
305
|
|
445
|
|
829
|
|
||||||
|
$
|
4,130
|
|
$
|
5,899
|
|
$
|
6,624
|
|
||||
|
Interest income on impaired loans recognized on a cash basis on non-accrual status:
|
||||||||||||
|
Purchased from SCC
|
$
|
3,746
|
|
$
|
5,265
|
|
$
|
5,567
|
|
|||
|
All other
|
279
|
|
417
|
|
744
|
|
||||||
|
$
|
4,025
|
|
$
|
5,682
|
|
$
|
6,311
|
|
||||
As of April 30,
2013
and
2012
, accrued interest receivable on mortgage loans held for investment totaled
$1.3 million
and
$1.6 million
, respectively. As of April 30,
2013
and
2012
, HRB Bank had interest-only mortgage loans in its investment portfolio totaling
$2.4 million
and
$2.7 million
, respectively.
Activity related to our REO is as follows:
|
(in 000s)
|
||||||||||||
|
Year ended April 30,
|
2013
|
|
2012
|
|
2011
|
|
||||||
|
Balance, beginning of the year
|
$
|
14,972
|
|
$
|
19,532
|
|
$
|
29,252
|
|
|||
|
Additions
|
10,357
|
|
10,308
|
|
16,463
|
|
||||||
|
Sales
|
(9,271
|
)
|
(11,976
|
)
|
(21,889
|
)
|
||||||
|
Impairments
|
(2,090
|
)
|
(2,892
|
)
|
(4,294
|
)
|
||||||
|
Balance, end of the year
|
$
|
13,968
|
|
$
|
14,972
|
|
$
|
19,532
|
|
|||
AVAILABLE-FOR-SALE
– The amortized cost and fair value of securities classified as AFS are summarized below:
|
(in 000s)
|
||||||||||||||||||||||||||||||||
|
As of April 30,
|
2013
|
2012
|
||||||||||||||||||||||||||||||
|
Amortized
Cost |
|
Gross
Unrealized Gains |
|
Gross
Unrealized Losses (1) |
|
Fair Value
|
|
Amortized
Cost |
|
Gross
Unrealized Gains |
|
Gross
Unrealized Losses (1) |
|
Fair Value
|
|
|||||||||||||||||
|
Short-term:
|
||||||||||||||||||||||||||||||||
|
Municipal bonds
|
$
|
—
|
|
$
|
—
|
|
$
|
—
|
|
$
|
—
|
|
$
|
1,008
|
|
$
|
29
|
|
$
|
—
|
|
$
|
1,037
|
|
||||||||
|
Long-term:
|
||||||||||||||||||||||||||||||||
|
Mortgage-backed securities
|
476,450
|
|
6,592
|
|
(664
|
)
|
482,378
|
|
361,184
|
|
5,620
|
|
(121
|
)
|
366,683
|
|
||||||||||||||||
|
Municipal bonds
|
4,178
|
|
320
|
|
—
|
|
4,498
|
|
4,236
|
|
396
|
|
—
|
|
4,632
|
|
||||||||||||||||
|
480,628
|
|
6,912
|
|
(664
|
)
|
486,876
|
|
365,420
|
|
6,016
|
|
(121
|
)
|
371,315
|
|
|||||||||||||||||
|
$
|
480,628
|
|
$
|
6,912
|
|
$
|
(664
|
)
|
$
|
486,876
|
|
$
|
366,428
|
|
$
|
6,045
|
|
$
|
(121
|
)
|
$
|
372,352
|
|
|||||||||
|
(1)
|
As of April 30,
2013
, we had
no
securities that had been in a continuous loss position for more than twelve months. As of April 30,
2012
, mortgage-backed securities with a cost of
$8.1 million
and gross unrealized losses of
$21 thousand
had been in a continuous loss position for more than twelve months.
|
Proceeds from the sales of AFS securities were
$6.2 million
and
$8.4 million
during fiscal years
2013
and
2012
, respectively. We did not sell any AFS securities in fiscal year
2011
. We recorded gross realized gains of
$0.2 million
and
$14 thousand
on sales of AFS securities during fiscal years
2013
and
2012
, respectively. We did not record any gross unrealized losses during fiscal years 2013, 2012 or 2011. We did not record any other-than-temporary impairments of AFS securities during fiscal years 2013 and
2012
. During fiscal year
2011
, we recorded other-than-temporary impairments of AFS securities totaling
$1.9 million
.
|
56
|
H&R Block 2013 Form 10K
|
Contractual maturities of AFS debt securities at April 30,
2013
, occur at varying dates over the next
31
years, and are set forth in the table below.
|
(in 000s)
|
||||||||
|
As of April 30, 2013
|
Cost Basis
|
|
Fair Value
|
|
||||
|
Maturing in:
|
||||||||
|
Two to five years
|
$
|
4,178
|
|
$
|
4,498
|
|
||
|
Beyond
|
476,450
|
|
482,378
|
|
||||
|
$
|
480,628
|
|
$
|
486,876
|
|
|||
HELD-TO-MATURITY
– HRB Bank is required to maintain a restricted investment in FHLB stock for borrowing availability. The cost of this investment,
$1.9 million
at April 30,
2013
and
2012
, represents its redemption value at each balance sheet date, as this investment does not have a ready market.
The components of property and equipment, net of their accumulated depreciation and amortization, are as follows:
|
(in 000s)
|
||||||||
|
As of April 30,
|
2013
|
|
2012
|
|
||||
|
Buildings
|
$
|
108,265
|
|
$
|
116,939
|
|
||
|
Computers and other equipment
|
112,203
|
|
84,067
|
|
||||
|
Leasehold improvements
|
38,771
|
|
32,458
|
|
||||
|
Purchased software
|
4,660
|
|
3,365
|
|
||||
|
Construction in process
|
2,094
|
|
2,051
|
|
||||
|
Land and other non-depreciable assets
|
1,887
|
|
1,892
|
|
||||
|
$
|
267,880
|
|
$
|
240,772
|
|
|||
During fiscal years
2013
,
2012
and
2011
, we received
$7.3 million
,
$7.6 million
and
$6.5 million
, respectively, for tax incentives from certain government agencies related to our corporate headquarters building, which was recorded as a reduction of original cost.
Property and equipment included above and subject to capital lease arrangements included the following:
|
(in 000s)
|
||||||||
|
As of April 30,
|
2013
|
|
2012
|
|
||||
|
Property and equipment under capital lease
|
$
|
43,778
|
|
$
|
47,842
|
|
||
|
Less accumulated amortization
|
(33,584
|
)
|
(36,740
|
)
|
||||
|
$
|
10,194
|
|
$
|
11,102
|
|
|||
Depreciation and amortization expense of continuing operations for fiscal years
2013
,
2012
and
2011
was
$68.2 million
,
$61.4 million
and
$61.6 million
, respectively.
|
H&R Block 2013 Form 10K
|
57
|
Changes in the carrying amount of goodwill of our Tax Services segment for the years ended April 30,
2013
and
2012
are as follows:
|
(in 000s)
|
||||||||||||
|
Goodwill
|
|
Accumulated Impairment Losses
|
|
Net
|
|
|||||||
|
Balance at April 30, 2011
|
$
|
459,039
|
|
$
|
(24,888
|
)
|
$
|
434,151
|
|
|||
|
Acquisitions
|
5,377
|
|
—
|
|
5,377
|
|
||||||
|
Disposals and foreign currency changes, net
|
(4,553
|
)
|
—
|
|
(4,553
|
)
|
||||||
|
Impairments
|
—
|
|
(7,409
|
)
|
(7,409
|
)
|
||||||
|
Balance at April 30, 2012
|
459,863
|
|
(32,297
|
)
|
427,566
|
|
||||||
|
Acquisitions
|
7,625
|
|
—
|
|
7,625
|
|
||||||
|
Disposals and foreign currency changes, net
|
(409
|
)
|
—
|
|
(409
|
)
|
||||||
|
Impairments
|
—
|
|
—
|
|
—
|
|
||||||
|
Balance at April 30, 2013
|
$
|
467,079
|
|
$
|
(32,297
|
)
|
$
|
434,782
|
|
|||
We tested goodwill for impairment in the fourth quarter of fiscal year
2013
, and did not identify any impairment.
In fiscal year 2012, we discontinued service under our ExpressTax brand and closed approximately
200
underperforming company-owned offices. As a result, we recorded an impairment of goodwill, in the amount of
$7.4 million
. There is no remaining goodwill related to our ExpressTax brand. We recorded a
$22.7 million
impairment in our former RedGear reporting unit in fiscal year 2011.
Components of the intangible assets of our Tax Services segment are as follows:
|
(in 000s)
|
||||||||||||||||||||||||
|
As of April 30,
|
2013
|
2012
|
||||||||||||||||||||||
|
Gross
Carrying
Amount
|
|
Accumulated
Amortization
|
|
Net
|
|
Gross
Carrying
Amount
|
|
Accumulated
Amortization
|
|
Net
|
|
|||||||||||||
|
Reacquired franchise rights
|
$
|
214,330
|
|
$
|
(18,204
|
)
|
$
|
196,126
|
|
$
|
214,330
|
|
$
|
(14,083
|
)
|
$
|
200,247
|
|
||||||
|
Customer relationships
|
100,719
|
|
(48,733
|
)
|
51,986
|
|
90,433
|
|
(46,504
|
)
|
43,929
|
|
||||||||||||
|
Internally-developed software
|
91,745
|
|
(72,764
|
)
|
18,981
|
|
104,685
|
|
(92,472
|
)
|
12,213
|
|
||||||||||||
|
Noncompete agreements
|
23,058
|
|
(21,728
|
)
|
1,330
|
|
22,337
|
|
(21,425
|
)
|
912
|
|
||||||||||||
|
Franchise agreements
|
19,201
|
|
(5,654
|
)
|
13,547
|
|
19,201
|
|
(4,373
|
)
|
14,828
|
|
||||||||||||
|
Purchased technology
|
14,800
|
|
(12,331
|
)
|
2,469
|
|
14,700
|
|
(10,665
|
)
|
4,035
|
|
||||||||||||
|
Trade name
|
300
|
|
(300
|
)
|
—
|
|
1,300
|
|
(800
|
)
|
500
|
|
||||||||||||
|
$
|
464,153
|
|
$
|
(179,714
|
)
|
$
|
284,439
|
|
$
|
466,986
|
|
$
|
(190,322
|
)
|
$
|
276,664
|
|
|||||||
Amortization of intangible assets of continuing operations for the years ended April 30,
2013
,
2012
and
2011
was
$24.2 million
,
$27.8 million
and
$29.5 million
, respectively. We recorded impairments of various intangible assets totaling
$3.6 million
during fiscal year 2013, including those related to our former RedGear reporting unit. We recorded an impairment of customer relationships of
$4.0 million
during fiscal year 2012, related to the discontinuation of our ExpressTax brand, as discussed above. Estimated amortization of intangible assets for fiscal years 2014, 2015, 2016, 2017 and 2018 is
$22.1 million
,
$18.2 million
,
$14.8 million
,
$12.3 million
and
$11.3 million
, respectively.
|
58
|
H&R Block 2013 Form 10K
|
The components of customer banking deposits at April 30,
2013
and
2012
and the related interest expense recorded during the periods are as follows:
|
(in 000s)
|
||||||||||||||||
|
April 30,
|
2013
|
2012
|
||||||||||||||
|
Outstanding
Balance
|
|
Interest
Expense
|
|
Outstanding
Balance
|
|
Interest
Expense
|
|
|||||||||
|
Short-term:
|
||||||||||||||||
|
Money-market deposits
|
$
|
188,939
|
|
$
|
1,827
|
|
$
|
177,976
|
|
$
|
2,071
|
|
||||
|
Savings deposits
|
18,608
|
|
138
|
|
11,401
|
|
105
|
|
||||||||
|
Checking deposits:
|
||||||||||||||||
|
Interest-bearing
|
1,941
|
|
21
|
|
4,336
|
|
40
|
|
||||||||
|
Non-interest-bearing
|
391,654
|
|
—
|
|
276,321
|
|
—
|
|
||||||||
|
393,595
|
|
21
|
|
280,657
|
|
40
|
|
|||||||||
|
IRAs and other time deposits:
|
||||||||||||||||
|
Due in one year
|
18,529
|
|
29,510
|
|
||||||||||||
|
IRAs
|
316,793
|
|
328,005
|
|
||||||||||||
|
335,322
|
|
3,674
|
|
357,515
|
|
4,519
|
|
|||||||||
|
$
|
936,464
|
|
$
|
5,660
|
|
$
|
827,549
|
|
$
|
6,735
|
|
|||||
|
Long-term:
|
||||||||||||||||
|
Due in two years
|
$
|
1,436
|
|
$
|
4,710
|
|
||||||||||
|
Due in three years
|
106
|
|
706
|
|
||||||||||||
|
Due in four years
|
13
|
|
36
|
|
||||||||||||
|
Due in five years
|
312
|
|
46
|
|
||||||||||||
|
$
|
1,867
|
|
$
|
—
|
|
$
|
5,498
|
|
$
|
—
|
|
|||||
Accrued but unpaid interest on deposits totaled
$0.1 million
as of April 30,
2013
and
2012
.
Time deposit accounts totaling
$2.6 million
were in excess of Federal Deposit Insurance Corporation (FDIC) insured limits at April 30,
2013
, and mature as follows:
|
(in 000s)
|
|||
|
Three months or less
|
$
|
997
|
|
|
Six to twelve months
|
1,632
|
|
|
|
$
|
2,629
|
|
|
The components of long-term debt are as follows:
|
(in 000s)
|
||||||||
|
As of April 30,
|
2013
|
|
2012
|
|
||||
|
Senior Notes, 5.500%, due November 2022
|
$
|
497,330
|
|
$
|
—
|
|
||
|
Senior Notes, 5.125%, due October 2014
|
399,648
|
|
399,412
|
|
||||
|
Capital lease obligations
|
9,702
|
|
10,393
|
|
||||
|
Senior Notes, 7.875%, due January 2013
|
—
|
|
599,913
|
|
||||
|
Acquisition obligation, due June 2012
|
—
|
|
30,831
|
|
||||
|
906,680
|
|
1,040,549
|
|
|||||
|
Less: Current portion
|
(722
|
)
|
(631,434
|
)
|
||||
|
$
|
905,958
|
|
$
|
409,115
|
|
|||
On October 25, 2012, we issued
$500.0 million
principal amount of our
5.50%
Senior Notes due 2022 for aggregate proceeds of
$497.2 million
. The notes bear interest at
5.50%
per annum, subject to adjustment based upon our credit ratings. Interest is payable on May 1 and November 1 of each year beginning on May 1, 2013 until the stated maturity date of
November 1, 2022
. The notes were issued by our wholly-owned subsidiary, Block Financial LLC (Block Financial), and were fully and unconditionally
|
H&R Block 2013 Form 10K
|
59
|
guaranteed by H&R Block, Inc. The notes and the guarantee are senior unsecured obligations of Block Financial and H&R Block, Inc. We may redeem some or all of the notes, at our option, at any time at specified prices, and we must offer to repurchase the notes upon a change in control. The indenture governing the notes, which also governs our
5.125%
Senior Notes due 2014, does not contain any financial covenants and contains only limited restrictive covenants regarding our ability to merge with another entity, convey, transfer or lease substantially all of our assets, or incur liens, in each case, subject to certain exceptions.
On October 25, 2012, we provided notice to the trustee of our intention to redeem the entire
$600.0 million
aggregate principal amount of our
7.875%
Senior Notes that were due to mature in
January 2013
. The redemption settled on November 26, 2012 for an aggregate price of
$623.0 million
, which included full payment of principal, a make-whole premium of
$5.8 million
and interest accrued up to the redemption date of
$17.2 million
. Proceeds of the issuance of our
5.50%
Senior Notes, together with cash balances on hand, were used to redeem the 7.875% Senior Notes. We recognized a loss on the extinguishment of this debt of
$5.8 million
in fiscal year 2013, which primarily represents the interest that would have been paid on these notes if they had not been redeemed prior to maturity. This loss is included in other income, net on our consolidated statements of income.
In August 2012, we terminated our previous unsecured committed line of credit agreement and we entered into a new five-year,
$1.5 billion
unsecured committed line of credit governed by a Credit and Guarantee Agreement (2012 CLOC). Funds available under the 2012 CLOC may be used for general corporate purposes or for working capital needs. The 2012 CLOC bears interest at an annual rate of LIBOR plus an applicable rate ranging from
0.750%
to
1.45%
or PRIME plus an applicable rate ranging from
0.000%
to
0.450%
(depending on the type of borrowing and our then current credit ratings) and includes an annual facility fee ranging from
0.125%
to
0.300%
of the committed amounts (also depending on our then current credit ratings). The 2012 CLOC is subject to various conditions, triggers, events or occurrences that could result in earlier termination and contains customary representations, warranties, covenants and events of default, including, without limitation: (1) a covenant requiring the Company to maintain a debt-to-EBITDA ratio calculated on a consolidated basis of no greater than (a)
3.50
for the fiscal quarters ending on April 30, July 31, and October 31 of each year and (b)
3.75
for the fiscal quarter ending on January 31 of each year; (2) a covenant requiring us to maintain an interest coverage (EBITDA-to-interest expense) ratio calculated on a consolidated basis of no less than
2.50
as of the last date of any fiscal quarter; and (3) covenants restricting our ability to incur additional debt, incur liens, merge or consolidate with other companies, sell or dispose of their respective assets (including equity interests), liquidate or dissolve, make investments, loans, advances, guarantees and acquisitions, and engage in certain transactions with affiliates or certain restrictive agreements. The 2012 CLOC includes provisions that allow for the issuance of equity which would be added to EBITDA in determining compliance with the financial covenant calculations as a separate and additional means to avoid a shortfall. We were in compliance with these requirements at April 30, 2013. We had no balances outstanding under the 2012 CLOC at April 30, 2013; however, we may borrow amounts under the 2012 CLOC from time to time in the future to support working capital requirements or for other general corporate purposes.
On October 26, 2004, we issued
$400.0 million
of
5.125%
Senior Notes under our shelf registration. The Senior Notes are due to mature on
October 30, 2014
and are not redeemable by the bondholders prior to maturity.
We have a capitalized lease obligation of
$9.7 million
at April 30, 2013, that is collateralized by land and buildings. The obligation is due over the next
10 years
.
The aggregate payments required to retire long-term debt are
$0.7 million
,
$400.4 million
,
$0.8 million
,
$0.8 million
,
$1.0 million
and
$503.0 million
in fiscal years 2014, 2015, 2016, 2017, 2018 and beyond, respectively.
HRB Bank is a member of the FHLB, which extends credit to member banks based on eligible collateral. At April 30,
2013
, HRB Bank had FHLB advance capacity of
$436.2 million
. At April 30,
2013
, we had no balance outstanding on this facility. Mortgage loans held for investment of
$252.5 million
and AFS securities of
$264.0 million
serve as eligible collateral and are used to determine total capacity.
We have deferred compensation plans that permit certain employees to defer portions of their compensation and accrue income on the deferred amounts. Included in other noncurrent liabilities is
$42.5 million
and
$48.0 million
at April 30,
2013
and
2012
, respectively, reflecting our obligation under these plans. We purchased whole-life insurance contracts on certain participants to recover distributions made or to be made under these plans. The cash surrender value of the policies and other assets totaled
$17.8 million
and
$99.0 million
at April 30,
2013
and
2012
, respectively. Certain of these assets are restricted, as they are only available to fund the related liabilities. The decline in these assets is due to the redemption of policies with a recorded cash value of
$81.1 million
in fiscal year 2013. The cash surrender value of these policies and other assets are included in other noncurrent assets on the consolidated balance sheet as of April 30,
2013
. As of April 30,
2012
,
$81.4 million
of these assets were classified as current and included in prepaid and other current assets on the consolidated balance sheet, due to our plan to liquidate. The remaining balance of
$17.6 million
was included in other noncurrent assets as of April 30,
2012
.
|
60
|
H&R Block 2013 Form 10K
|
FAIR VALUE MEASUREMENT
We use the following classification of financial instruments pursuant to the fair value hierarchy methodologies for assets measured at fair value:
|
▪
|
Level 1 - inputs to the valuation are quoted prices in an active market for identical assets.
|
|
▪
|
Level 2 - inputs to the valuation include quoted prices for similar assets in active markets utilizing a third-party pricing service to determine fair value.
|
|
▪
|
Level 3 - valuation is based on significant inputs that are unobservable in the market and our own estimates of assumptions that we believe market participants would use in pricing the asset.
|
Financial instruments are presented in the tables that follow by recurring or nonrecurring measurement status. Recurring assets are initially measured at fair value and are required to be remeasured at fair value in the financial statements at each reporting date. Assets measured on a nonrecurring basis are assets that, as a result of an event or circumstance, were required to be remeasured at fair value after initial recognition in the financial statements at some time during the reporting period.
The following table presents the assets that were remeasured at fair value on a recurring basis during the fiscal years ended April 30,
2013
and
2012
and the gains on those remeasurements:
|
(dollars in 000s)
|
||||||||||||||||||||
|
Total
|
|
Level 1
|
|
Level 2
|
|
Level 3
|
|
Gains
|
|
|||||||||||
|
As of April 30, 2013:
|
||||||||||||||||||||
|
Mortgage–backed securities
|
$
|
482,378
|
|
$
|
—
|
|
$
|
482,378
|
|
$
|
—
|
|
$
|
5,928
|
|
|||||
|
Municipal bonds
|
4,498
|
|
—
|
|
4,498
|
|
—
|
|
320
|
|
||||||||||
|
$
|
486,876
|
|
$
|
—
|
|
$
|
486,876
|
|
$
|
—
|
|
$
|
6,248
|
|
||||||
|
As a percentage of total assets
|
10.7
|
%
|
—
|
|
10.7
|
%
|
—
|
|
||||||||||||
|
As of April 30, 2012:
|
||||||||||||||||||||
|
Mortgage–backed securities
|
$
|
366,683
|
|
$
|
—
|
|
$
|
366,683
|
|
$
|
—
|
|
$
|
5,499
|
|
|||||
|
Municipal bonds
|
5,669
|
|
—
|
|
5,669
|
|
—
|
|
425
|
|
||||||||||
|
$
|
372,352
|
|
$
|
—
|
|
$
|
372,352
|
|
$
|
—
|
|
$
|
5,924
|
|
||||||
|
As a percentage of total assets
|
8.0
|
%
|
—
|
|
8.0
|
%
|
—
|
|
||||||||||||
These AFS securities are carried at fair value on a recurring basis. These include certain agency and agency-sponsored mortgage-backed securities and municipal bonds. Quoted market prices are not available for these securities, as they are not actively traded and have fewer observable transactions. As a result, we use third-party pricing services to determine fair value and classify the securities as Level 2. The services' pricing models are based on market data and utilize available trade, bid and other market information for similar securities. The fair values provided by the third-party pricing services are regularly reviewed by management. Annually, a sample of prices supplied by the pricing service is validated by comparison to prices obtained from other third party sources. There were no transfers of AFS securities between hierarchy levels during the fiscal years ended April 30,
2013
and
2012
.
|
H&R Block 2013 Form 10K
|
61
|
The following table presents the assets that were remeasured at fair value on a non-recurring basis during the fiscal years ended April 30,
2013
and
2012
and the losses on those remeasurements:
|
(dollars in 000s)
|
||||||||||||||||||||
|
Total
|
|
Level 1
|
|
Level 2
|
|
Level 3
|
|
Losses
|
|
|||||||||||
|
As of April 30, 2013:
|
||||||||||||||||||||
|
REO
|
$
|
14,806
|
|
$
|
—
|
|
$
|
—
|
|
$
|
14,806
|
|
$
|
(431
|
)
|
|||||
|
Impaired mortgage loans held for investment
|
84,708
|
|
—
|
|
—
|
|
84,708
|
|
(10,663
|
)
|
||||||||||
|
$
|
99,514
|
|
$
|
—
|
|
$
|
—
|
|
$
|
99,514
|
|
$
|
(11,094
|
)
|
||||||
|
As a percentage of total assets
|
2.2
|
%
|
—
|
|
—
|
|
2.2
|
%
|
||||||||||||
|
As of April 30, 2012:
|
||||||||||||||||||||
|
REO
|
$
|
15,870
|
|
$
|
—
|
|
$
|
—
|
|
$
|
15,870
|
|
$
|
(693
|
)
|
|||||
|
Impaired mortgage loans held for investment
|
99,974
|
|
—
|
|
—
|
|
99,974
|
|
(10,235
|
)
|
||||||||||
|
$
|
115,844
|
|
$
|
—
|
|
$
|
—
|
|
$
|
115,844
|
|
$
|
(10,928
|
)
|
||||||
|
As a percentage of total assets
|
2.5
|
%
|
—
|
|
—
|
|
2.5
|
%
|
||||||||||||
The following methods were used to estimate the fair value of each class of financial instrument above:
|
▪
|
Real estate owned - REO includes foreclosed properties securing mortgage loans. Foreclosed assets are recorded at estimated fair value, generally based on independent market prices or appraised values of the collateral, less costs to sell upon foreclosure. The assets are remeasured quarterly based on independent appraisals or broker price opinions. Subsequent holding period gains and losses arising from the sale of REO are reported when realized. Because our REO is valued based on significant inputs that are unobservable in the market and our own estimates of assumptions that we believe market participants would use in pricing the asset, these assets are classified as Level 3.
|
|
▪
|
Impaired mortgage loans held for investment - The fair value of impaired mortgage loans held for investment is generally based on the net present value of discounted cash flows for TDR loans or the appraised value of the underlying collateral for all other loans. Impaired and TDR loans are required to be evaluated at least annually, based on HRB Bank's Loan Policy. Impaired loans are typically remeasured every nine months, while TDRs are evaluated quarterly. These loans are classified as Level 3.
|
We have established various controls and procedures to ensure that the unobservable inputs used in the fair value measurement of these instruments are appropriate. Appraisals are obtained from certified appraisers and reviewed internally by HRB Bank’s asset management group. The inputs and assumptions used in our discounted cash flow model for TDRs are reviewed and approved by HRB Bank's management team each time the balances are remeasured. Significant changes in fair value from the previous measurement are presented to HRB Bank management for approval. There were no changes to the unobservable inputs used in determining the fair values of our Level 3 financial assets.
The following table presents the quantitative information about our Level 3 fair value measurements:
|
(in 000s)
|
||||||||||
|
Fair Value at
April 30, 2013
|
|
Valuation
Technique
|
Unobservable Input
|
Range
(Weighted Average)
|
||||||
|
REO
|
$
|
13,968
|
|
Third party
pricing
|
Cost to list/sell Loss severity
|
5% – 57%(6%)
0% – 100%(49%)
|
||||
|
Impaired mortgage loans held for investment – non TDRs
|
$
|
84,093
|
|
Collateral-
based
|
Cost to list/sell
Time to sell (months)
Collateral depreciation
Loss severity
|
0% – 45%(7%)
24(24)
(24%) – 100%(47%)
0% – 100%(58%)
|
||||
|
Impaired mortgage loans held for investment – TDRs
|
$
|
50,137
|
|
Discounted
cash flow
|
Aged default performance
Loss severity
|
29% – 50%(39%)
0% – 21%(5%)
|
||||
|
62
|
H&R Block 2013 Form 10K
|
ESTIMATED FAIR VALUE OF FINANCIAL INSTRUMENTS
The carrying amounts and estimated fair values of our financial instruments are as follows:
|
(in 000s)
|
||||||||||||||||||
|
As of April 30,
|
2013
|
2012
|
||||||||||||||||
|
Carrying
Amount
|
|
Estimated
Fair Value
|
|
Carrying
Amount
|
|
Estimated
Fair Value
|
|
Fair Value
Hierarchy
|
||||||||||
|
Assets:
|
||||||||||||||||||
|
Cash and cash equivalents
|
$
|
1,747,584
|
|
$
|
1,747,584
|
|
$
|
1,944,334
|
|
$
|
1,944,334
|
|
Level 1
|
|||||
|
Cash and cash equivalents – restricted
|
117,837
|
|
117,837
|
|
48,100
|
|
48,100
|
|
Level 1
|
|||||||||
|
Receivables, net – short–term
|
206,835
|
|
206,810
|
|
193,858
|
|
193,858
|
|
Level 1 and 3
|
|||||||||
|
Mortgage loans held for investment, net
|
338,789
|
|
210,858
|
|
406,201
|
|
248,535
|
|
Level 3
|
|||||||||
|
Investments in available–for–sale securities
|
486,876
|
|
486,876
|
|
372,352
|
|
372,352
|
|
Level 2
|
|||||||||
|
Receivables, net – long–term
|
125,048
|
|
134,283
|
|
127,468
|
|
127,468
|
|
Level 1 and 3
|
|||||||||
|
Note receivable (including interest)
|
60,352
|
|
69,472
|
|
55,444
|
|
55,444
|
|
Level 3
|
|||||||||
|
Liabilities:
|
||||||||||||||||||
|
Deposits
|
938,331
|
|
934,019
|
|
833,047
|
|
831,251
|
|
Level 1 and 3
|
|||||||||
|
Long–term borrowings
|
906,680
|
|
964,630
|
|
1,040,549
|
|
1,077,223
|
|
Level 3
|
|||||||||
|
Contingent consideration payments
|
11,277
|
|
11,277
|
|
6,838
|
|
6,838
|
|
Level 3
|
|||||||||
Fair value estimates, methods and assumptions are set forth below. The fair value was not estimated for assets and liabilities that are not considered financial instruments.
|
▪
|
Cash and cash equivalents, including restricted - Fair value approximates the carrying amount.
|
|
▪
|
Receivables - short-term - For short-term balances with the exception of credit card receivables, the carrying values reported in the balance sheet approximate fair market value due to the relative short-term nature of the respective instruments (Level 1). The fair value of credit card balances is determined using market pricing sources based on projected future cash flows of the pooled assets and performance characteristics (Level 3).
|
|
▪
|
Mortgage loans held for investment, net - The fair value of mortgage loans held for investment is determined using market pricing sources based on projected future cash flows of each individual asset, and loan characteristics including channel and performance characteristics.
|
|
▪
|
Investments in available-for-sale securities - We use a third-party pricing service to determine fair value. The service's pricing model is based on market data and utilizes available trade, bid and other market information for similar securities.
|
|
▪
|
Receivables - long-term - The carrying values for the long-term portion of loans to franchisees approximate fair market value due to the variable interest rates (Level 1). Long-term EA receivables are carried at net realizable value which approximates fair value (Level 3). Net realizable value is determined based on historical collection rates. The fair value of credit card balances is determined using market pricing sources based on projected future cash flows of the pooled assets and performance characteristics (Level 3).
|
|
▪
|
Note receivable - The fair value of the long-term note receivable from M&P assumes no prepayment and is determined using market pricing sources for similar instruments based on projected future cash flows.
|
|
▪
|
Deposits - The fair value of deposits with no stated maturity such as non-interest-bearing demand deposits, checking, money market and savings accounts is equal to the amount payable on demand (Level 1). The fair value of IRAs and other time deposits is estimated by discounting the future cash flows using the rates currently offered by HRB Bank for products with similar remaining maturities (Level 3).
|
|
▪
|
Long-term debt - The fair value of borrowings is based on rates currently available to us for obligations with similar terms and maturities, including current market yields on our Senior Notes.
|
|
▪
|
Contingent consideration payments - Fair value approximates the carrying amount.
|
|
H&R Block 2013 Form 10K
|
63
|
A summary of our share repurchase and retirements for fiscal years
2013
,
2012
and
2011
is as follows:
|
(in 000s)
|
|||||||
|
Shares
|
|
Cost
|
|
||||
|
Fiscal year:
|
|||||||
|
2013
|
21,259
|
|
$
|
315,000
|
|
||
|
2012
|
14,554
|
|
199,989
|
|
|||
|
2011
|
18,950
|
|
279,947
|
|
|||
During fiscal year 2013, we also retired
60.0 million
shares of treasury stock. This retirement of treasury stock had no impact on our total consolidated stockholders’ equity.
We are authorized to issue
6.0 million
shares of Preferred Stock without par value. At April 30,
2013
, we had
5.6 million
shares of authorized but unissued Preferred Stock. Of the unissued shares,
0.6 million
shares have been designated as Participating Preferred Stock.
We are authorized to issue
0.5 million
shares of non-voting Preferred Stock designated as Convertible Preferred Stock without par value. At April 30,
2013
, we had
0.5 million
shares of authorized but unissued Convertible Preferred Stock. The holders of the Convertible Preferred Stock are not entitled to receive dividends paid in cash, property or securities and, in the event of any dissolution, liquidation or wind-up of the Company, will share ratably with the holders of Common Stock then outstanding in the assets of the Company after any distribution or payments are made to the holders of Participating Preferred stock or the holders of any other class or series of stock of the Company with preference over the Common Stock.
We utilize the fair value method to account for stock-based awards. Stock-based compensation expense of
$15.3 million
,
$15.0 million
and
$14.5 million
was recorded in fiscal years
2013
,
2012
and
2011
, respectively, net of related tax benefits of
$5.8 million
,
$5.4 million
and
$5.4 million
, respectively. Stock-based compensation expense of our continuing operations totaled
$15.3 million
,
$14.2 million
and
$10.5 million
in fiscal years
2013
,
2012
and
2011
, respectively.
Accounting standards require excess tax benefits from stock-based compensation to be included as a financing activity in the statements of cash flows. As a result, we classified
$0.4 million
,
$0.1 million
and
$0.5 million
as cash inflows from financing activities for fiscal years
2013
,
2012
and
2011
, respectively. We realized tax benefits of
$5.0 million
,
$4.4 million
and
$4.4 million
in fiscal years
2013
,
2012
and
2011
, respectively.
As of April 30,
2013
, we had
11.3 million
shares reserved for future awards under stock-based compensation plans. We issue shares from our treasury stock to satisfy the exercise or release of stock-based awards and believe we have adequate treasury stock balances available for future issuances.
We measure the fair value of options on the grant date or modification date using the Black-Scholes-Merton (Black-Scholes) option valuation model based upon the expected term of the options. We measure the fair value of nonvested shares and share units based on the closing price of our common stock on the grant date, discounted for non-receipt of dividends, as necessary. We measure the fair value of performance-based share units based on the Monte Carlo valuation model, taking into account as necessary those provisions of the performance-based nonvested share units that are characterized as market conditions.
We generally expense the grant-date fair value, net of estimated forfeitures, over the vesting period on a straight-line basis. We expense awards to employees who are of retirement age or early retirement age (as defined in the plans), or who reach retirement age or early retirement age before the end of the service period of the awards, over the longer of one year from the grant date or the date upon which the employees reach retirement age or early retirement age, as applicable.
Our 2013 Long Term Incentive Plan (2013 Plan) became effective January 1, 2013. The 2013 Plan replaced our 2003 Long-Term Executive Compensation Plan (2003 Plan), which terminated effective December 31, 2012, except for outstanding awards thereunder. Like the 2003 Plan, the 2013 Plan provides for awards of options (both incentive and nonqualified), nonvested shares, nonvested share units, performance-based nonvested share units and other stock-based awards. These awards entitle the holder to receive or purchase shares of common stock as the awards vest. Options, nonvested shares and nonvested share units typically vest based upon service over a
three
-year or
four
-year period with a portion vesting each year. Performance-based nonvested share units typically cliff vest at the end of a
three
-year period based upon satisfaction of both service-based and performance-based requirements. For grants made prior to April 2013, nonvested share units did not receive dividends or dividend equivalents. For grants made beginning in April 2013, nonvested share units receive cumulative dividend equivalents at the time of distribution. Performance-based nonvested share units receive cumulative dividend equivalents at the time of distribution. We grant options
|
64
|
H&R Block 2013 Form 10K
|
from the 2013 Plan or 2003 Plan at a price equal to the fair market value of our common stock on the grant date. Awards granted under the 2013 Plan or 2003 Plan have a maximum contractual term of ten years.
Our 2008 Deferred Stock Unit Plan for Outside Directors (DSU Plan) provides vested stock units that are settled after the director separates from services as a director of the Company. The number of deferred stock units credited to an outside director's account pursuant to an award is determined by dividing the dollar amount of the award by the average current market value per share of common stock for the ten consecutive trading dates ending on the date the deferred stock units are granted to the outside directors. Each deferred stock unit granted is vested upon award and the settlement of shares occurs on the earlier of
six
months after the director's separation of service from the Board of Directors, or within
90
days after the director's death. The vested stock units receive dividend equivalents prior to settlement, which are reinvested and settled in shares at the time of settlement. We measure the fair value of the deferred stock units based on the closing price of our common stock on the grant date. The DSU Plan replaced the 1989 Stock Option Plan for Outside Directors, which was terminated effective June 11, 2008 except for outstanding awards thereunder. After January 1, 2013 awards of deferred stock units will be granted under the 2013 Plan. No deferred stock units were granted under the 2013 Plan during the 2013 fiscal year.
Our 2000 Employee Stock Purchase Plan (ESPP) provides employees the option to purchase shares of our common stock through payroll deductions. The purchase price of the stock is
85%
of the fair market value of our common stock on the last trading day of the Option Period. The Option Periods are six-month periods beginning on January 1 and July 1 each year. We measure the fair value of options on the grant date utilizing the Black-Scholes option valuation model. The fair value of the option includes the value of the
15%
discount. We expense the grant-date fair value over the six-month vesting period. Prior to January 1, 2013, this plan offered a purchase price of the stock of
90%
of the lower of either the fair market value of our common stock on the first trading day of the Option Period or on the last trading day of the Option Period.
A summary of options for the fiscal year ended April 30,
2013
, is as follows:
|
(in 000s, except per share amounts)
|
|||||||||||||
|
Shares
|
|
Weighted–Average
Exercise Price
|
|
Weighted–Average
Remaining
Contractual Term
|
Aggregate
Intrinsic Value
|
|
|||||||
|
Outstanding, beginning of the year
|
7,308
|
|
$
|
18.02
|
|
||||||||
|
Granted
|
979
|
|
17.95
|
|
|||||||||
|
Exercised
|
(1,414
|
)
|
18.08
|
|
|||||||||
|
Forfeited or expired
|
(2,369
|
)
|
19.22
|
|
|||||||||
|
Outstanding, end of the year
|
4,504
|
|
$
|
17.53
|
|
7 years
|
$
|
46,202
|
|
||||
|
Exercisable, end of the year
|
2,646
|
|
$
|
18.33
|
|
5 years
|
$
|
25,119
|
|
||||
|
Exercisable and expected to vest
|
4,340
|
|
17.58
|
|
7 years
|
44,326
|
|
||||||
The total intrinsic value of options exercised during fiscal years
2013
,
2012
and
2011
was
$6.0 million
,
$1.0 million
and
$1.8 million
, respectively. As of April 30,
2013
, we had
$3.6 million
of total unrecognized compensation cost related to these options. The cost is expected to be recognized over a weighted-average period of
one year
.
We utilize the Black-Scholes option valuation model to value our options on the grant date. We typically estimate the expected volatility using our historical stock price data, unless historical volatility is not representative of expected volatility. We also use historical exercise and forfeiture behaviors to estimate the options expected term and our forfeiture rate. The dividend yield is calculated based on the current dividend and the market price of our common stock on the grant date. The risk-free interest rate is based on the U.S. Treasury zero-coupon yield curve in effect on the grant date. Both expected volatility and the risk-free interest rate are based on a period that approximates the expected term.
|
H&R Block 2013 Form 10K
|
65
|
The following assumptions were used to value options during the periods:
|
Year ended April 30,
|
2013
|
|
2012
|
|
2011
|
|
||||||
|
Options – management and director:
|
||||||||||||
|
Expected volatility
|
29.69% - 31.43%
|
|
31.75% - 32.34%
|
|
28.98% - 30.20%
|
|
||||||
|
Expected term
|
4 - 5 years
|
|
5 years
|
|
5 years
|
|
||||||
|
Dividend yield
|
4.18% - 5.21%
|
|
3.43% - 4.80%
|
|
4.18% - 5.17%
|
|
||||||
|
Risk–free interest rate
|
0.61% - 0.75%
|
|
0.79% - 1.95%
|
|
1.26% - 1.92%
|
|
||||||
|
Weighted–average fair value
|
$
|
2.79
|
|
$
|
3.31
|
|
$
|
2.25
|
|
|||
|
ESPP options:
|
||||||||||||
|
Expected volatility
|
22.32% - 27.39%
|
|
24.27% - 33.07%
|
|
22.75% - 23.31%
|
|
||||||
|
Expected term
|
0.5 years
|
|
0.5 years
|
|
0.5 years
|
|
||||||
|
Dividend yield
|
4.20% - 5.00%
|
|
3.68% - 4.93%
|
|
3.86% - 4.80%
|
|
||||||
|
Risk–free interest rate
|
0.11% - 0.15%
|
|
0.06% - 0.10%
|
|
0.19% - 0.23%
|
|
||||||
|
Weighted–average fair value
|
$
|
2.60
|
|
$
|
2.78
|
|
$
|
2.16
|
|
|||
A summary of nonvested shares and nonvested share units for the year ended April 30,
2013
, is as follows:
|
(shares in 000s)
|
|||||||
|
Shares
|
Weighted–Average
Grant Date Fair Value
|
|
|||||
|
Outstanding, beginning of the year
|
1,454
|
|
$
|
15.10
|
|
||
|
Granted
|
1,047
|
|
14.38
|
|
|||
|
Released
|
(446
|
)
|
15.57
|
|
|||
|
Forfeited
|
(249
|
)
|
14.59
|
|
|||
|
Outstanding, end of the year
|
1,806
|
|
$
|
14.64
|
|
||
The total fair value of shares and units vesting during fiscal years
2013
,
2012
and
2011
was
$6.9 million
,
$11.9 million
and
$13.0 million
, respectively. Upon the grant of nonvested shares and nonvested share units, unearned compensation cost is recorded as an offset to additional paid-in capital and is amortized as compensation expense over the vesting period. As of April 30,
2013
, we had
$14.7 million
of total unrecognized compensation cost related to these shares. This cost is expected to be recognized over a weighted-average period of
two
years. Nonvested shares were not granted during fiscal years 2013 or 2012.
A summary of performance-based nonvested share units for the year ended April 30,
2013
, is as follows:
|
(shares in 000s)
|
|||||||
|
Shares
|
|
Weighted–Average
Grant Date Fair Value
|
|
||||
|
Outstanding, beginning of the year
|
187
|
|
$
|
17.36
|
|
||
|
Granted
|
513
|
|
16.72
|
|
|||
|
Released
|
(17
|
)
|
16.89
|
|
|||
|
Forfeited
|
(25
|
)
|
16.72
|
|
|||
|
Outstanding, end of the year
|
658
|
|
$
|
16.89
|
|
||
The total fair value of performance-based share units vesting during fiscal year
2013
was
$0.3 million
, compared to zero in fiscal years
2012
and
2011
. Upon the grant of performance-based nonvested share units, unearned compensation cost is recorded as an offset to additional paid-in capital and is amortized as compensation expense over the vesting period. As of April 30, 2013, we had
$7.0 million
of total unrecognized compensation cost related to these units. This cost is expected to be recognized over a weighted-average period of two years.
For performance-based units, the number of units to be earned will depend on the performance against one of the following metrics, as applicable to the grant: (1) H&R Block, Inc.'s achievement of specified earnings before interest, taxes, depreciation and amortization (EBITDA) and revenue targets and H&R Block, Inc.'s total shareholder return (TSR) ranked against that of other companies that are included in the Standard & Poor's 500 Index during the three-year performance period; (2) H&R Block, Inc.'s achievement of specified average return on equity and H&R Block, Inc.'s stock price during the three-year performance period; or (3) H&R Block, Inc.'s achievement of specified earnings on cumulative three-year pretax earnings from continuing operations and H&R Block, Inc.'s total TSR ranked against that of other companies included in the Standard & Poor's 500 Index during the three-year performance period. Compensation expense for performance-based shares is initially estimated based on target performance and is adjusted as appropriate through the performance period. Performance-based units cliff vest three years from the date of grant. Employees who are of retirement age or early retirement age (age
60
, or age
55
with
five
years of service) before
|
66
|
H&R Block 2013 Form 10K
|
the end of the
three
-year performance period who retire at least
one
year after the grant date may be eligible to vest in a pro rata portion of their performance-based units, if the market condition for the award is satisfied. Satisfaction of the market condition is determined at the end of the three-year performance period. Shares are not distributed until the end of the three-year performance period.
We utilize the Monte Carlo valuation model to value performance-based nonvested share units on the grant date. We typically estimate the expected volatility using historical volatility for H&R Block, Inc. and selected comparable companies. The dividend yield is calculated based on the current dividend and the market price of our common stock on the grant date. The risk-free interest rate is based on the U.S. Treasury zero-coupon yield curve in effect on the grant date. Both expected volatility and the risk-free interest rate are based on a period that approximates the expected term. The following assumptions were used to value performance-based nonvested share units using the Monte Carlo valuation model during fiscal years
2013
and
2012
:
|
Year ended April 30,
|
2013
|
|
2012
|
|
||||
|
Expected volatility
|
12.61% – 71.96%
|
|
20.68% – 143.12%
|
|
||||
|
Expected term
|
3 years
|
|
3 years
|
|
||||
|
Dividend yield
(1)
|
0% – 5.01%
|
|
—
|
%
|
||||
|
Risk–free interest rate
|
0.40
|
%
|
0.75
|
%
|
||||
|
Weighted–average fair value
|
$
|
16.72
|
|
$
|
17.46
|
|
||
|
(1)
|
The valuation model assumes that dividends are reinvested by the issuing entity on a continuous basis.
|
The components of income from continuing operations upon which domestic and foreign income taxes have been provided are as follows:
|
(in 000s)
|
||||||||||||
|
Year ended April 30,
|
2013
|
|
2012
|
|
2011
|
|
||||||
|
Domestic
|
$
|
664,966
|
|
$
|
547,535
|
|
$
|
590,024
|
|
|||
|
Foreign
|
37,045
|
|
28,535
|
|
37,679
|
|
||||||
|
$
|
702,011
|
|
$
|
576,070
|
|
$
|
627,703
|
|
||||
The components of income tax expense (benefit) for continuing operations are as follows:
|
(in 000s)
|
||||||||||||
|
Year ended April 30,
|
2013
|
|
2012
|
|
2011
|
|
||||||
|
Current:
|
||||||||||||
|
Federal
|
$
|
219,411
|
|
$
|
126,773
|
|
$
|
171,337
|
|
|||
|
State
|
43,116
|
|
21,285
|
|
40,433
|
|
||||||
|
Foreign
|
3,173
|
|
8,647
|
|
21,456
|
|
||||||
|
265,700
|
|
156,705
|
|
233,226
|
|
|||||||
|
Deferred:
|
||||||||||||
|
Federal
|
(29,258
|
)
|
55,032
|
|
(1,762
|
)
|
||||||
|
State
|
(69
|
)
|
18,154
|
|
3,404
|
|
||||||
|
Foreign
|
480
|
|
211
|
|
288
|
|
||||||
|
(28,847
|
)
|
73,397
|
|
1,930
|
|
|||||||
|
Total income taxes for continuing operations
|
$
|
236,853
|
|
$
|
230,102
|
|
$
|
235,156
|
|
|||
|
H&R Block 2013 Form 10K
|
67
|
The reconciliation between the income tax provision and the amount computed by applying the statutory federal tax rate of
35%
to income taxes of continuing operations is as follows:
|
Year ended April 30,
|
2013
|
|
2012
|
|
2011
|
|
|||
|
U.S. statutory tax rate
|
35.0
|
%
|
35.0
|
%
|
35.0
|
%
|
|||
|
Change in tax rate resulting from:
|
|||||||||
|
State income taxes, net of federal income tax benefit
|
4.0
|
%
|
4.2
|
%
|
4.4
|
%
|
|||
|
Permanent differences
|
(0.1
|
)%
|
0.5
|
%
|
(0.6
|
)%
|
|||
|
Uncertain tax positions
|
(4.1
|
)%
|
(0.6
|
)%
|
1.2
|
%
|
|||
|
Net change in valuation allowance
|
(1.0
|
)%
|
0.2
|
%
|
(1.4
|
)%
|
|||
|
Other
|
(0.1
|
)%
|
0.6
|
%
|
(1.1
|
)%
|
|||
|
Effective tax rate
|
33.7
|
%
|
39.9
|
%
|
37.5
|
%
|
|||
The net loss from discontinued operations for fiscal years
2013
and
2012
totaled
$31.2 million
and
$80.0 million
, respectively, compared to net income of
$13.6 million
in fiscal year
2011
. These amounts are net of tax benefits of
$19.7 million
and
$74.9 million
in fiscal years
2013
and
2012
, respectively, and tax expense of
$13.8 million
in fiscal year
2011
. The effective tax rate for discontinued operations was
38.6%
,
48.4%
and
50.5%
for fiscal years
2013
,
2012
and
2011
, respectively.
The significant components of deferred tax assets and liabilities are reflected in the following table:
|
(in 000s)
|
||||||||
|
As of April 30,
|
2013
|
|
2012
|
|
||||
|
Gross deferred tax assets:
|
||||||||
|
Accrued expenses
|
$
|
15,842
|
|
$
|
21,533
|
|
||
|
Allowance for credit losses and related reserves
|
114,570
|
|
102,819
|
|
||||
|
Capital loss carry-forward
|
45,826
|
|
—
|
|
||||
|
Valuation allowance
|
(28,088
|
)
|
(33,672
|
)
|
||||
|
Current
|
148,150
|
|
90,680
|
|
||||
|
Deferred and stock-based compensation
|
20,758
|
|
23,590
|
|
||||
|
Deferred revenue
|
30,225
|
|
26,181
|
|
||||
|
Net operating loss carry-forward
|
20,070
|
|
18,202
|
|
||||
|
State tax benefits related to federal unrecognized tax benefits
|
30,374
|
|
31,824
|
|
||||
|
Capital loss carry-forward
|
2,379
|
|
85,778
|
|
||||
|
Other
|
3,901
|
|
2,901
|
|
||||
|
Valuation allowance
|
(26,525
|
)
|
(43,771
|
)
|
||||
|
Noncurrent
|
81,182
|
|
144,705
|
|
||||
|
229,332
|
|
235,385
|
|
|||||
|
Gross deferred tax liabilities:
|
||||||||
|
Prepaid expenses
|
(2,830
|
)
|
(3,641
|
)
|
||||
|
Current
|
(2,830
|
)
|
(3,641
|
)
|
||||
|
Property and equipment
|
(25,794
|
)
|
(19,454
|
)
|
||||
|
Mortgage-related investment
|
(20,033
|
)
|
(63,115
|
)
|
||||
|
Intangibles
|
(36,565
|
)
|
(33,935
|
)
|
||||
|
Noncurrent
|
(82,392
|
)
|
(116,504
|
)
|
||||
|
Net deferred tax assets
|
$
|
144,110
|
|
$
|
115,240
|
|
||
As of April 30,
2013
and
2012
, we have deferred tax assets related to capital loss carry-forwards totaling
$48.2 million
and
$85.8 million
, respectively, which resulted primarily from the sale of our brokerage business in November 2008. Generally, for tax purposes, a capital loss can only be utilized to the extent we realize capital gains within five years of the end of the taxable year in which the capital loss was incurred. We have recorded a valuation allowance against our capital loss carry-forward of
$39.0 million
and
$63.6 million
as of April 30,
2013
and
2012
, respectively. The total decrease in valuation allowance on deferred tax assets for the period ended April 30, 2013 was
$22.8 million
, of which only
$5.5 million
favorably impacted income tax expense. Substantially all of the valuation allowance decrease was offset by the shift of a deferred tax asset from the U.S. to a foreign jurisdiction as a result of an intercompany transaction. The effects of differing income tax laws and rates on the shift in deferred tax asset offset all but
$5.5 million
of the tax benefit from the decrease in the valuation allowance. As of April 30,
2013
, the capital
|
68
|
H&R Block 2013 Form 10K
|
loss carry-forward totaled approximately
$124 million
, and will expire if not used to offset future capital gains before December 31, 2013.
Certain of our subsidiaries file stand-alone returns in various states and foreign jurisdictions, and others join in filing consolidated or combined returns in such jurisdictions. At April 30,
2013
, we had net operating losses (NOLs) in various states and foreign jurisdictions. The amount of state NOLs vary by taxing jurisdiction. We recorded deferred tax assets of
$20.1 million
for the tax effects of such losses and a valuation allowance of
$14.4 million
for the portion of such losses that, more likely than not, will not be realized. If not used, the NOLs will expire in varying amounts during fiscal years 2014 through 2033.
We intend to indefinitely reinvest foreign earnings for virtually all of our foreign companies; therefore, no provision has been made for income taxes that might be payable upon remittance of such earnings. The amount of unrecognized deferred tax liability on unremitted foreign earnings is immaterial as of April 30, 2013.
Changes in unrecognized tax benefits for fiscal years
2013
,
2012
and
2011
are as follows:
|
(in 000s)
|
||||||||||||
|
Year ended April 30,
|
2013
|
|
2012
|
|
2011
|
|
||||||
|
Balance, beginning of the year
|
$
|
206,393
|
|
$
|
154,848
|
|
$
|
129,767
|
|
|||
|
Additions based on tax positions related to prior years
|
11,867
|
|
26,523
|
|
28,262
|
|
||||||
|
Reductions based on tax positions related to prior years
|
(49,493
|
)
|
(3,858
|
)
|
(1,473
|
)
|
||||||
|
Additions based on tax positions related to the current year
|
2,314
|
|
42,735
|
|
3,417
|
|
||||||
|
Reductions related to settlements with tax authorities
|
(25,259
|
)
|
(8,742
|
)
|
(7,639
|
)
|
||||||
|
Expiration of statute of limitations
|
(702
|
)
|
(2,814
|
)
|
(315
|
)
|
||||||
|
Foreign currency translation
|
(278
|
)
|
(838
|
)
|
1,057
|
|
||||||
|
Other
|
1,549
|
|
(1,461
|
)
|
1,772
|
|
||||||
|
Balance, end of the year
|
$
|
146,391
|
|
$
|
206,393
|
|
$
|
154,848
|
|
|||
Of the total ending gross unrecognized tax benefit balance as of April 30,
2013
,
2012
and
2011
, respectively,
$95.3 million
,
$150.4 million
and
$117.6 million
, respectively, if recognized, would impact our effective tax rate. The difference results from adjusting the gross balances for such items as federal, state and foreign deferred items, interest and deductible taxes. We believe it is reasonably possible that the balance of unrecognized tax benefits could decrease by approximately
$38 million
within the next twelve months due to settlements of audit issues and expiration of statutes of limitations.
Interest and penalties, if any, accrued on the unrecognized tax benefits are reflected in income tax expense. The amount of gross interest and penalties accrued on uncertain tax positions decreased
$6.9 million
and
$5.5 million
during fiscal years
2013
and
2012
, respectively, and increased
$4.4 million
in fiscal year
2011
. The total gross interest and penalties accrued as of April 30,
2013
,
2012
and
2011
totaled
$31.7 million
,
$38.6 million
and
$44.1 million
, respectively.
We file a consolidated federal income tax return in the United States with the Internal Revenue Service (IRS) and file tax returns in various state and foreign jurisdictions. Tax returns are typically examined and settled upon completion of the exam, with tax controversies settled either at the exam level or through the appeal process.
In November 2012, we received written approval from the IRS Joint Committee on Taxation of the settlement of a majority of the issues related to the examination of our 1999 through 2007 tax returns. In fiscal year 2013, we recorded the impact of the settlement which reduced uncertain tax benefits by
$59.0 million
. Of this reduction,
$33.3 million
resulted in an income tax benefit.
Except for three issues for which we are pursuing refund claims for tax years 2002 through 2007, which will remain open until resolved, these years are closed. In addition, U.S. Federal consolidated tax returns for 2008 through 2010 are currently under examination. We anticipate the IRS exam of tax years 2008 through 2010 as well as the open refund claims for tax years 2002 through 2007 will be resolved within the next twelve months. Federal tax returns for calendar years 2011 through 2013 are open to examination.
The expected federal tax refund has been classified as current as of April 30, 2013. Of the
$136.1 million
expected federal refund, a
$151.3 million
asset is recorded in prepaid expenses and other current assets offset by a
$15.2 million
liability recorded in accrued income taxes.
|
H&R Block 2013 Form 10K
|
69
|
The following table shows the components of interest income and expense:
|
(in 000s)
|
||||||||||||
|
Year ended April 30,
|
2013
|
|
2012
|
|
2011
|
|
||||||
|
Interest income:
|
||||||||||||
|
Emerald Advance
lines of credit
|
$
|
59,657
|
|
$
|
59,660
|
|
$
|
94,300
|
|
|||
|
Mortgage loans, net
|
16,556
|
|
20,322
|
|
24,693
|
|
||||||
|
Loans to franchisees
|
10,023
|
|
10,234
|
|
9,013
|
|
||||||
|
AFS securities
|
7,000
|
|
4,463
|
|
1,609
|
|
||||||
|
Credit cards
|
3,311
|
|
—
|
|
—
|
|
||||||
|
Other
|
2,282
|
|
5,121
|
|
4,045
|
|
||||||
|
$
|
98,829
|
|
$
|
99,800
|
|
$
|
133,660
|
|
||||
|
Interest expense:
|
||||||||||||
|
Borrowings
|
$
|
74,297
|
|
$
|
84,782
|
|
$
|
84,169
|
|
|||
|
Deposits
|
5,660
|
|
6,735
|
|
8,488
|
|
||||||
|
FHLB advances
|
—
|
|
572
|
|
1,526
|
|
||||||
|
$
|
79,957
|
|
$
|
92,089
|
|
$
|
94,183
|
|
||||
SCC holds an interest in and is the sponsor (issuer) of
56
Real Estate Mortgage Investment Conduit (REMIC) Trusts and
14
Net Interest Margin (NIM) Trusts (collectively, “Trusts”) related to previously originated mortgage loans that were securitized. These Trusts are variable interest entities. The REMIC Trusts hold static pools of sub-prime residential mortgage loans. The NIM Trusts hold beneficial interests in certain REMIC Trusts. The Trusts were designed to collect and pass through to the beneficial interest holders the cash flows of the underlying mortgage loans. The REMIC Trusts were financed with bonds and equity. The NIM Trusts were financed with notes and equity. All bonds and notes are held by third-party investors.
Our identification of the primary beneficiary of the Trusts was based on a determination that the servicer of the underlying mortgage loans has the power to direct the most significant activities of the Trusts because the servicer handles all of the loss mitigation activities for the mortgage loans. We have determined that we are not the primary beneficiary and, therefore have not consolidated the variable interest entity (VIE).
SCC is not the servicer of the mortgage loans underlying the REMIC Trusts, and therefore, does not have the power to direct the most significant activities of the REMIC Trusts, which is the servicing of the underlying mortgage loans.
SCC does have the exclusive right to appoint a servicer when certain conditions have been met for specific loans related to two of the NIM Trusts. As of April 30,
2013
, those conditions have been met for a minority portion of the loans underlying those Trusts. As this right pertains only to a minority of the loans, we have concluded that SCC does not have the power to direct the most significant activities of these two NIM Trusts, as the servicer has the power to direct significant activities over the majority of the mortgage loans. In the remaining NIM Trusts, SCC has a shared right to appoint a servicer under certain conditions. For these NIM Trusts, we have concluded that SCC is not the primary beneficiary because the power to direct the most significant activities, which is the servicing of the underlying mortgage loans, is shared with other unrelated parties.
At April 30,
2013
, we had no significant assets or liabilities included in the consolidated balance sheets related to SCC’s variable interests in the Trusts. We have a liability, as discussed in note 19, and a deferred tax asset recorded in the consolidated balance sheets related to representations and warranties SCC made in connection with the transfer of mortgage loans, including mortgage loans held by the securitization trusts. We have no remaining exposure to economic loss arising from impairment of SCC’s beneficial interest in the Trusts. If SCC receives cash flows in the future as a holder of beneficial interests we would record gains as other income in our income statement.
We offer guarantees under our POM program to tax clients whereby we will assume the cost of additional tax assessments, up to a cumulative per client limit of
$5,500
, resulting from errors attributable to H&R Block. We defer all revenues and direct costs associated with these guarantees, recognizing these amounts over the term of the guarantee based on projected and actual payment of claims. The related current asset is included in prepaid expenses and other current assets. The related liability is included in accounts payable, accrued expenses and other current liabilities in the consolidated balance sheets. The related noncurrent asset and liability are included in other assets and other noncurrent liabilities, respectively, in the consolidated balance sheets. A loss on these POM guarantees would be recognized if the sum of expected costs for services exceeded unearned revenue. Changes in the related balance of deferred revenue are as follows:
|
70
|
H&R Block 2013 Form 10K
|
|
(in 000s)
|
||||||||
|
Year ended April 30,
|
2013
|
|
2012
|
|
||||
|
Balance, beginning of the year
|
$
|
141,080
|
|
$
|
140,603
|
|
||
|
Amounts deferred for new guarantees issued
|
76,561
|
|
76,080
|
|
||||
|
Revenue recognized on previous deferrals
|
(71,355
|
)
|
(75,603
|
)
|
||||
|
Balance, end of the year
|
$
|
146,286
|
|
$
|
141,080
|
|
||
In addition to amounts accrued for our POM guarantee, we had accrued
$18.0 million
and
$16.3 million
at April 30,
2013
and
2012
, respectively, related to estimated losses under our standard guarantee which is included with our standard tax preparation services.
We have accrued estimated contingent consideration payments totaling
$11.3 million
and
$6.8 million
as of April 30,
2013
and
2012
, respectively, related to recent acquisitions, with the short-term amount recorded in accounts payable, accrued expenses and deposits and the long-term portion included in other noncurrent liabilities. Estimates of contingent payments are typically based on expected financial performance of the acquired business and economic conditions at the time of acquisition. Should actual results differ materially from our assumptions, future payments made will differ from the above estimate and any differences will be recorded in our results from continuing operations.
We have contractual commitments to fund certain franchises requesting revolving lines of credit. Our total obligation under these lines of credit was
$90.9 million
at April 30,
2013
, and net of amounts drawn and outstanding, our remaining commitment to fund totaled
$43.6 million
.
We have contractual commitments to fund our credit card customers on their approved revolving lines of credit. Our total obligation under the credit card agreements was
$30.4 million
at April 30,
2013
, and net of amounts outstanding, our remaining commitment to fund totaled
$5.2 million
.
We are self-insured for certain risks, including, workers’ compensation, property and casualty, professional liability and claims related to our POM program. These programs maintain various self-insured retentions. In all but POM, commercial insurance is purchased in excess of the self-insured retentions. We accrue estimated losses for self-insured retentions using actuarial models and assumptions based on historical loss experience. The nature of our business may subject us to error and omissions, casualty and professional liability lawsuits. To the extent that we are subject to claims exceeding our insurance coverage, such suits could have a material effect on our financial position, results of operations or liquidity.
We issued three standby letters of credit to servicers paying claims related to our POM, errors and omissions, and property and casualty insurance policies. These letters of credit are for amounts not to exceed
$6.0 million
in the aggregate. At April 30,
2013
, there were no balances outstanding on these letters of credit.
We maintain compensating balances with certain financial institutions that are creditors in our 2012 CLOC, which are not legally restricted as to withdrawal. These balances totaled
$185.1 million
as of April 30,
2013
. These balances may fluctuate significantly over the course of any given fiscal year.
Our self-insured health benefits plan provides medical benefits to employees electing coverage under the plan. We maintain an accrual for incurred but not reported medical claims and claim development. The accrued liability is an estimate based on historical experience and other assumptions, some of which are subjective. We adjust our self-insured medical benefits liability as our loss experience changes due to medical inflation, changes in the number of plan participants and an aging employee base.
During fiscal year 2006, we entered into a transaction with the City of Kansas City, Missouri, to provide us with sales and property tax savings on the furniture, fixtures and equipment for our corporate headquarters facility. Under the transaction, the City purchased equipment by issuing
$31.0 million
in Industrial Revenue Bonds due in December 2015, and leased the furniture, fixtures and equipment to us for an identical term under a capital lease. Because the City has assigned the lease to the bond trustee for our benefit as the sole bondholder, we, in effect, control enforcement of the lease against ourselves. As a result of the capital lease treatment, the furniture, fixtures and equipment will remain a component of property, plant and equipment in our consolidated balance sheets. As a result of the legal right of offset, the capital lease obligation and the corresponding bond investments have been eliminated in consolidation. The transaction provides us with property tax exemptions for the leased furniture, fixtures and equipment. As of April 30,
2013
, we have purchased
$31.0 million
in bonds in connection with this arrangement.
|
H&R Block 2013 Form 10K
|
71
|
Substantially all of the operations of our subsidiaries are conducted in leased premises. Most of the operating leases are for periods ranging from
three years
to
five years
, with renewal options, and provide for fixed monthly rentals. Future minimum operating lease commitments of our continuing operations at April 30,
2013
, are as follows:
|
(in 000s)
|
|||
|
2014
|
$
|
178,068
|
|
|
2015
|
131,706
|
|
|
|
2016
|
68,933
|
|
|
|
2017
|
24,609
|
|
|
|
2018
|
9,652
|
|
|
|
2019 and beyond
|
7,588
|
|
|
|
$
|
420,556
|
|
|
Rent expense of our continuing operations for fiscal years
2013
,
2012
and
2011
totaled
$201.0 million
,
$218.3 million
and
$224.9 million
, respectively.
We may enter into contracts that include embedded indemnifications that have characteristics similar to guarantees. Typically, these indemnifications do not provide a stated maximum exposure and the terms of the indemnities may vary, in many cases limited only by the applicable statute of limitations. Accruals for these obligations have been established when appropriate. Historically, payments made under these types of contractual arrangements have not been material.
See notes 18 and 19 to the consolidated financial statements for additional discussion regarding guarantees and indemnifications.
We are a defendant in a large number of litigation matters, arising both in the ordinary course of business and otherwise, including as described below. The matters described below are not all of the lawsuits to which we are subject. In some of the matters, very large or indeterminate amounts, including punitive damages, are sought. U.S. jurisdictions permit considerable variation in the assertion of monetary damages or other relief. Jurisdictions may permit claimants not to specify the monetary damages sought or may permit claimants to state only that the amount sought is sufficient to invoke the jurisdiction of the court. In addition, jurisdictions may permit plaintiffs to allege monetary damages in amounts well exceeding reasonably possible verdicts in the jurisdiction for similar matters. We believe that the monetary relief which may be specified in a lawsuit or claim bears little relevance to its merits or disposition value due to this variability in pleadings and our experience in litigating or resolving through settlement numerous claims over an extended period of time.
The outcome of a litigation matter and the amount or range of potential loss at particular points in time may be difficult to ascertain. Among other things, uncertainties can include how fact finders will evaluate documentary evidence and the credibility and effectiveness of witness testimony, and how trial and appellate courts will apply the law. Disposition valuations are also subject to the uncertainty of how opposing parties and their counsel will themselves view the relevant evidence and applicable law.
In addition to litigation matters, we are also subject to other claims and regulatory investigations arising out of our business activities, including as described below.
We accrue liabilities for litigation and regulatory loss contingencies when it is probable that a loss has been incurred and the amount of the loss can be reasonably estimated. Liabilities have been accrued for a number of the matters noted below. If a range of loss is estimated, and some amount within that range appears to be a better estimate than any other amount within that range, then that amount is accrued. If no amount within the range can be identified as a better estimate than any other amount, we accrue the minimum amount in the range.
For such matters where a loss is believed to be reasonably possible, but not probable, or the loss cannot be reasonably estimated, no accrual has been made. It is possible that litigation and regulatory matters could require us to pay damages or make other expenditures or accrue liabilities in amounts that could not be reasonably estimated at April 30,
2013
. While the potential future liabilities could be material in the particular quarterly or annual periods in which they are recorded, based on information currently known, we do not believe any such liabilities are likely to have a material effect on our consolidated financial position, results of operations and cash flows. As of April 30,
2013
and
2012
, we accrued liabilities of
$11.9 million
and
$79.0 million
, respectively. The decline in the balance from the prior year is primarily due to payments made during fiscal year 2013.
For some matters where a liability has not been accrued, we are able to estimate a reasonably possible range of loss. For those matters, and for matters where a liability has been accrued, as of April 30,
2013
, we estimate the aggregate range of reasonably possible losses in excess of amounts accrued to be approximately
$0
to
$55 million
, of which approximately
54%
relates to our discontinued operations.
|
72
|
H&R Block 2013 Form 10K
|
For other matters, we are not currently able to estimate the reasonably possible loss or range of loss. We are often unable to estimate the possible loss or range of loss until developments in such matters have provided sufficient information to support an assessment of the range of possible loss, such as quantification of a damage demand from plaintiffs, discovery from other parties and investigation of factual allegations, rulings by the court on motions or appeals, analysis by experts, and the progress of settlement negotiations. On a quarterly and annual basis, we review relevant information with respect to litigation and related contingencies and update our accruals, disclosures and estimates of reasonably possible losses or ranges of loss based on such reviews.
LITIGATION AND OTHER CLAIMS, INCLUDING INDEMNIFICATION CLAIMS, PERTAINING TO DISCONTINUED MORTGAGE OPERATIONS
– Although SCC ceased its mortgage loan origination activities in December 2007 and sold its loan servicing business in April 2008, SCC and the Company have been, remain, and may in the future be subject to regulatory investigations, claims, including indemnification claims, and lawsuits pertaining to SCC's mortgage business activities that occurred prior to such termination and sale. These investigations, claims and lawsuits include actions by regulators, third party indemnitees including depositors and underwriters, individual plaintiffs, and cases in which plaintiffs seek to represent a class of others alleged to be similarly situated. Among other things, these investigations, claims and lawsuits allege discriminatory or unfair and deceptive loan origination and servicing practices, fraud and other common law torts, rights to indemnification and violations of securities laws, the Truth in Lending Act (TILA), Equal Credit Opportunity Act and the Fair Housing Act. Given the impact of the financial crisis on the non-prime mortgage environment, the aggregate number of these investigations, claims and lawsuits has increased over time and is expected to continue to remain elevated. The amounts claimed in these investigations, claims and lawsuits are substantial in some instances, and the ultimate resulting liability is difficult to predict and thus in many cases cannot be reasonably estimated. In the event of unfavorable outcomes, the amounts that may be required to be paid in the discharge of liabilities or settlements could be substantial and could have a material impact on our consolidated financial position, results of operations and cash flows. Certain of these matters are described in more detail below.
On February 1, 2008, a class action lawsuit was filed in the United States District Court for the District of Massachusetts against SCC and other related entities styled
Cecil Barrett, et al. v. Option One Mortgage Corp., et al.
(Civil Action No. 08-10157-RWZ). Plaintiffs allege discriminatory practices relating to the origination of mortgage loans in violation of the Fair Housing Act and Equal Credit Opportunity Act, and seek declaratory and injunctive relief in addition to actual and punitive damages. The court dismissed H&R Block, Inc. from the lawsuit for lack of personal jurisdiction. In March 2011, the court issued an order certifying a class, which defendants sought to appeal. On August 24, 2011, the First Circuit Court of Appeals declined to hear the appeal, noting that the district court could reconsider its certification decision in light of a recent ruling by the United States Supreme Court in an unrelated matter. SCC subsequently filed a motion to decertify the class, which the court granted. Plaintiffs' petition for appeal was denied. A portion of our loss contingency accrual is related to this lawsuit for the amount of loss that we consider probable and reasonably estimable. We believe SCC has meritorious defenses to the claims in this case and it intends to defend the case vigorously; however we do not currently believe this case is material.
On December 9, 2009, a putative class action lawsuit was filed in the United States District Court for the Central District of California against SCC and H&R Block, Inc. styled Jeanne Drake, et al. v. Option One Mortgage Corp., et al. (Case No. SACV09-1450 CJC). Plaintiffs allege breach of contract, promissory fraud, intentional interference with contractual relations, wrongful withholding of wages and unfair business practices in connection with not paying severance benefits to employees when their employment transitioned to American Home Mortgage Servicing, Inc. (now known as Homeward Residential, Inc. (Homeward)) in connection with the sale of certain assets and operations of SCC. Plaintiffs seek to recover severance benefits of approximately
$8 million
, interest and attorney’s fees, in addition to penalties and punitive damages on certain claims. On September 2, 2011, the court granted summary judgment in favor of the defendants on all claims. Plaintiffs filed an appeal, which remains pending. We have not concluded that a loss related to this matter is probable nor have we established a loss contingency related to this matter. We believe we have meritorious defenses to the claims in this case and intend to defend the case vigorously, but there can be no assurances as to its outcome or its impact on our consolidated financial position, results of operations and cash flows.
On October 15, 2010, the Federal Home Loan Bank of Chicago (FHLB-Chicago) filed a lawsuit in the Circuit Court of Cook County, Illinois (Case No. 10CH45033) styled
Federal Home Loan Bank of Chicago v. Bank of America Funding Corporation, et al.
against multiple defendants, including various SCC-related entities, H&R Block, Inc. and other entities, arising out of FHLB-Chicago’s purchase of RMBSs. The plaintiff seeks rescission and damages under state securities law and for common law negligent misrepresentation in connection with its purchase of two securities collateralized by loans originated and securitized by SCC. These two securities had a total initial principal amount of approximately
$50 million
, of which approximately
$40 million
remains outstanding. The plaintiff agreed to voluntarily dismiss H&R Block, Inc. from the suit. The remaining defendants, including SCC, filed motions to dismiss, which the court denied. Defendants moved for leave to appeal and the circuit court denied the motion. We have not concluded that a loss related to this matter is probable nor have we accrued a liability related to this matter. We believe SCC has meritorious defenses to the claims in this case and intends to defend the case vigorously, but there can be no assurances as to its outcome or its impact on our consolidated financial position, results of operations and cash flows.
|
H&R Block 2013 Form 10K
|
73
|
On February 22, 2012, a lawsuit was filed by SCC against Homeward in the Supreme Court of the State of New York, County of New York, styled
Sand Canyon Corporation v. American Home Mortgage Servicing, Inc
. (Index No. 650504/2012), alleging breach of contract and breach of the implied covenant of good faith and fair dealing in connection with the Cooperation Agreement entered into with SCC in connection with SCC’s sale of its mortgage loan servicing business to the defendant in 2008. SCC is seeking relief to, among other things, require the defendant to provide loan files only by the method prescribed in applicable agreements. The court denied the defendant's motion to dismiss and an appellate court affirmed. Discovery is proceeding.
On May 31, 2012, a lawsuit was filed by Homeward in the Supreme Court of the State of New York, County of New York, against SCC styled
Homeward Residential, Inc. v. Sand Canyon Corporation
(Index No. 651885/2012). SCC removed the case to the United States District Court for the Southern District of New York on June 28, 2012 (Case No. 12-cv-5067). Plaintiff, in its capacity as the master servicer for Option One Mortgage Loan Trust 2006-2 and for the benefit of the trustee and the certificate holders of such trust, asserts claims for breach of contract, anticipatory breach, indemnity and declaratory judgment in connection with alleged losses incurred as a result of the breach of representations and warranties relating to loans sold to the trust and representation and warranties related to SCC. Plaintiff seeks specific performance of alleged repurchase obligations or damages to compensate the trust and its certificate holders for alleged actual and anticipated losses, as well as a repurchase of all loans due to alleged misrepresentations by SCC as to itself and representations given as to the loans' compliance with its underwriting standards and the value of underlying real estate. SCC intends to file a motion to dismiss. We have not concluded that a loss related to this matter is probable, nor have we accrued a liability related to this matter. We believe SCC has meritorious defenses to the claims in this case and intends to defend the case vigorously, but there can be no assurances as to its outcome or its impact on our consolidated financial position, results of operations and cash flows.
On September 28, 2012, a second lawsuit was filed by Homeward in the District Court for the Southern District of New York against SCC styled
Homeward Residential, Inc. v. Sand Canyon Corporation
(Case No. 12-cv-7319). Plaintiff, in its capacity as the master servicer for Option One Mortgage Loan Trust 2006-3 and for the benefit of the trustee and the certificate holders of such trust, asserts claims for breach of contract and indemnity in connection with losses allegedly incurred as a result of the breach of representations and warranties relating to 96 loans sold to the trust. Plaintiff seeks specific performance of alleged repurchase obligations or damages to compensate the trust and its certificate holders for alleged actual and anticipated losses. SCC intends to file a motion to dismiss. We have not concluded that a loss related to this matter is probable, nor have we accrued a liability related to this matter. We believe SCC has meritorious defenses to the claims in this case and intends to defend the case vigorously, but there can be no assurances as to its outcome or its impact on our consolidated financial position, results of operations and cash flows.
On April 5, 2013, a third lawsuit was filed by Homeward in the District Court for the Southern District of New York against SCC. The suit, styled
Homeward Residential, Inc. v. Sand Canyon Corporation
(Case No. 13-cv-2107), was filed as a related matter to the second Homeward suit mentioned above. In this third litigation, Plaintiff, in its capacity as the master servicer for Option One Mortgage Loan Trust 2007-4 and for the benefit of the trustee and the certificate holders of such trust, asserts claims for breach of contract and indemnity in connection with alleged losses incurred as a result of the breach of representations and warranties relating to 159 loans sold to the trust. Plaintiff seeks specific performance of repurchase obligations or damages to compensate the trust and its certificate holders for alleged actual and anticipated losses. SCC intends to file a motion to dismiss. We have not concluded that a loss related to this matter is probable, nor have we accrued a liability related to this matter. We believe SCC has meritorious defenses to the claims in this case and intends to defend the case vigorously, but there can be no assurances as to its outcome or its impact on our consolidated financial position, results of operations and cash flows.
On March 29, 2013, MGRID, LLC filed a Summons with Notice against Merrill Lynch and Sand Canyon Corporation (
MGRID LLC v. Merrill Lynch Mortgage Lending Inc.
, 651140/2013, New York State Supreme Court (Manhattan)) seeking more than $309 million in damages for alleged breaches of representations and warranties related to Merrill Lynch Mortgage Investors Trust Series 2007-HE-2. The Trust contains more than 5,000 mortgage loans of which Sand Canyon originated approximately 28% of the original principal balance of these loans. The Notice alleges that Merrill Lynch and Sand Canyon breached representations and warranties made about certain of the mortgage loans and that both have failed to repurchase loans that violated the representations and warranties. The Notice also names Citibank N.A., as trustee, for failure to bring an enforcement action against Merrill and Sand Canyon. We have not concluded that a loss related to this matter is probable, nor have we accrued a liability related to this matter. We believe SCC has meritorious defenses to the claims in this case and intends to defend the case vigorously, but there can be no assurances as to its outcome or its impact on our consolidated financial position, results of operations and cash flows.
As of April 30,
2013
, underwriters and depositors were involved in multiple lawsuits related to securitization transactions in which SCC participated. These lawsuits allege a variety of claims, including violations of federal and state securities law and common law fraud, based on alleged materially inaccurate or misleading disclosures. Based on information currently available to SCC, it believes that the
15
lawsuits in which SCC received notice of a claim for indemnification involve original investments of approximately
$14 billion
. Because SCC is not party to these lawsuits (with the exception of the
Federal Home Loan Bank of Chicago v. Bank of America Funding Corporation
case discussed above) and does not have control of this litigation, SCC does not have precise information about the amount of damages or other remedies being asserted or the defenses to the claims in such
|
74
|
H&R Block 2013 Form 10K
|
lawsuits. Additional lawsuits against the underwriters or depositors may be filed in the future, and SCC may receive additional notices of claims for indemnification from underwriters or depositors with respect to existing or new lawsuits. We have not concluded that a loss related to any of these indemnification claims is probable, nor have we accrued a liability related to any of these claims. We believe SCC has meritorious defenses to these indemnification claims and intends to defend them vigorously, but there can be no assurance as to their outcome or their impact on our consolidated financial position, results of operations and cash flows.
On April 3, 2012, the Nevada Attorney General issued a subpoena to SCC indicating it was conducting an investigation concerning “the alleged commission of a practice declared to be unlawful under the Nevada Deceptive Trade Practices Act.” A majority of the documents requested in the subpoena involve SCC’s lending to minority (African American and Latino) borrowers. No complaint has been filed to date. SCC plans to continue to cooperate with the Nevada Attorney General.
EMPLOYMENT-RELATED CLAIMS AND LITIGATION
– On July 13, 2009, a wage and hour class action lawsuit was filed against us in the United States District Court for the Central District of California styled
Delana Ugas, et al. v. H&R Block Enterprises LLC, et al.
(Case No. BC417700). The plaintiffs generally allege failure to compensate tax professionals in California for all hours worked and to provide meal periods. The plaintiffs seek compensatory damages, pre-judgment interest, statutory penalties, attorneys' fees and costs. The court initially certified a class on the claim for failure to provide meal periods (consisting of tax professionals who worked in company-owned offices in California from 2006 to 2011), but subsequently decertified the class in a ruling dated July 9, 2012. The Ninth Circuit Court of Appeals declined to hear an appeal. The court also certified a class on the claim for failure to compensate tax professionals for all hours worked (consisting of tax professionals who worked in company-owned offices in a single district in California from 2006-2009). That class remains pending. A trial date has been set for October 21, 2013. We have not concluded that a loss related to this matter is probable, nor have we accrued a loss contingency related to this matter. We believe we have meritorious defenses to the claims in this case and intend to defend them vigorously, however we do not currently believe this case is material.
On January 25, 2010, a wage and hour class action lawsuit was filed against us in the United States District Court for the Western District of Missouri styled
Barbara Petroski, et al. v. H&R Block Eastern Enterprises, Inc., et al.,
(Case No. 10-00075-CV-W-DW). The plaintiffs generally allege failure to compensate tax professionals nationwide for training that is required to be eligible for rehire the following tax season, and seek compensatory damages, liquidated damages, statutory penalties, pre-judgment interest, attorneys' fees and costs. A conditional class was certified under the Fair Labor Standards Act in March 2011 (consisting of tax professionals nationwide who worked in company-owned offices and who were not compensated for such training on or after April 15, 2007). Two classes were also certified under state laws in California and New York (consisting of tax professionals who worked in company-owned offices in California and New York and who were not compensated for such training on or after March 4, 2006 and on or after March 4, 2004, respectively). We filed a motion to decertify the classes, along with a motion for summary judgment on all claims. On April 8, 2013, the court granted summary judgment in our favor on all claims. The plaintiffs filed an appeal, which remains pending. We have not concluded that a loss related to this matter is probable, nor have we accrued a loss contingency related to this matter. We believe we have meritorious defenses to the claims in this matter and intend to defend them vigorously, but there can be no assurances as to the outcome of the matter or its impact on our consolidated financial position, results of operations and cash flows.
RAL AND RAC LITIGATION
– On April 23, 1993, a putative class action lawsuit was filed against us in the Court of Common Pleas, First Judicial District Court of Pennsylvania, Philadelphia County styled
Sandra J. Basile, et al. v. H&R Block, Inc., et al.
(April Term 1992, Civil Action No. 3246). The plaintiffs allege inadequate disclosures with respect to the refund anticipation loan (RAL) product and assert claims for violation of consumer protection statutes, negligent misrepresentation, breach of fiduciary duty, common law fraud, usury, and violation of the TILA. Plaintiffs seek unspecified actual and punitive damages, injunctive relief, attorneys' fees and costs. A Pennsylvania class was certified, but later decertified by the trial court in December 2003. The intermediate appellate court subsequently reversed the decertification decision. On September 7, 2012, the Pennsylvania Supreme Court reversed the decision of the intermediate appellate court, thereby allowing the trial court's decertification ruling to stand. We have not concluded that a loss related to this matter is probable, nor have we accrued a loss contingency related to this matter. We believe we have meritorious defenses to this case and intend to defend the case vigorously, however we do not currently believe this case is material.
A series of putative class action lawsuits were filed against us in various federal courts beginning on November 17, 2011 concerning the RAL and RAC products. The plaintiffs generally allege we engaged in unfair, deceptive or fraudulent acts in violation of various state consumer protection laws by facilitating RALs that were accompanied by allegedly inaccurate TILA disclosures, and by offering RACs without any TILA disclosures. Certain plaintiffs also allege violation of disclosure requirements of various state statutes expressly governing RALs and provisions of those statutes prohibiting tax preparers from charging or retaining certain fees. Collectively, the plaintiffs seek to represent clients who purchased RAL or RAC products in up to forty-two states and the District of Columbia during timeframes ranging from 2007 to the present. The plaintiffs seek equitable relief, disgorgement of profits, compensatory and statutory damages, restitution, civil penalties, attorneys' fees and costs. These cases were consolidated by the Judicial Panel on Multidistrict Litigation into a single proceeding in the United States District Court for
|
H&R Block 2013 Form 10K
|
75
|
the Northern District of Illinois for coordinated pretrial proceedings, styled
IN RE: H&R Block Refund Anticipation Loan Litigation
(MDL No. 2373). We filed a motion to compel arbitration, which remains pending. We have not concluded that a loss related to this matter is probable, nor have we accrued a loss contingency related to this matter. We believe we have meritorious defenses to the claims in these cases and intend to defend the cases vigorously, but there can be no assurances as to the outcome of these cases or their impact on our consolidated financial position, results of operations and cash flows.
COMPLIANCE FEE LITIGATION
– On April 16, 2012 and April 19, 2012, putative class action lawsuits were filed against us in Missouri state and federal courts, respectively, concerning a compliance fee charged to retail tax clients in the 2011 and 2012 tax seasons. These cases are styled
Manuel H. Lopez III v. H&R Block, Inc., et al.
, in the Circuit Court of Jackson County, Missouri (Case # 1216CV12290), and
Ronald Perras v. H&R Block, Inc., et al
., in the United States District Court for the Western District of Missouri (Case No. 4:12-cv-00450-DGK). Taken together, the plaintiffs seek to represent all retail tax clients nationwide who were charged the compliance fee, and assert claims of violation of state consumer laws, money had and received, and unjust enrichment. We are seeking to compel arbitration of certain claims. We have not concluded that a loss related to these lawsuits is probable, nor have we accrued a liability related to either of these lawsuits. We believe we have meritorious defenses to the claims in these cases and intend to defend the cases vigorously, but there can be no assurances as to the outcome of these cases or their impact on our consolidated financial position, results of operations and cash flows.
FORM 8863 LITIGATION
-
A series of putative class action lawsuits were filed against us in various federal courts and one state court beginning on March 13, 2013 (including, by way of example,
Danielle Pooley v. H&R Block, Inc.
, No. 1:13-cv-01549-JBS-KMW (D.N.J. Mar. 13, 2013);
Arthur Green and Amy Hamilton v. H&R Block, Inc., et al.
, No. 4:13-cv-11206 (E.D. Mich. Mar. 19, 2013);
Juan Ortega v. H&R Block, Inc., et al.
, No. 2:13-cv-02023-MMM-RZ (C.D. Cal. Mar. 20, 2013); and
Nikki R. Nevill v. H&R Block, Inc., et al.
, No. 1316-CV07264 (Jackson Cnty., Mo. Cir. Ct. Mar. 21, 2013)). Taken together, the plaintiffs in these actions purport to represent clients nationwide who filed Form 8863 during tax season 2013 through an H&R Block office or using H&R Block at Home
®
online tax services or tax preparation software, and allege breach of contract, negligence and violation of state consumer laws in connection with transmission of the form. The plaintiffs seek damages, pre-judgment interest, attorneys' fees and costs. We have not concluded that a loss related to these lawsuits is probable, nor have we accrued a liability related to these lawsuits. We believe we have meritorious defenses to the claims in these cases and intend to defend the cases vigorously, but there can be no assurances as to the outcome of these cases or their impact on our consolidated financial position, results of operations and cash flows.
EXPRESS IRA LITIGATION
– On January 2, 2008, the Mississippi Attorney General in the Chancery Court of Hinds County, Mississippi First Judicial District (Case No. G 2008 6 S 2) filed a lawsuit regarding our former Express IRA product that is styled
Jim Hood, Attorney for the State of Mississippi v. H&R Block, Inc., H&R Block Financial Advisors, Inc
.,
et al.
The complaint alleges fraudulent business practices, deceptive acts and practices, common law fraud and breach of fiduciary duty with respect to the sale of the product in Mississippi and seeks equitable relief, disgorgement of profits, damages and restitution, civil penalties and punitive damages. We believe we have meritorious defenses to the claims in this case and intend to defend the case vigorously, but there can be no assurances as to its outcome or its impact on our consolidated financial position, results of operations and cash flows.
Although we sold H&R Block Financial Advisors, Inc. (HRBFA) effective November 1, 2008, we remain responsible for any liabilities relating to the Express IRA litigation, among other things, through an indemnification agreement. A portion of our accrual is related to these indemnity obligations.
LITIGATION AND CLAIMS PERTAINING TO THE DISCONTINUED OPERATIONS OF RSM MCGLADREY
– On April 17, 2009, a shareholder derivative complaint was filed by Brian Menezes, derivatively and on behalf of nominal defendant International Textile Group, Inc. against McGladrey Capital Markets LLC (MCM) in the Court of Common Pleas, Greenville County, South Carolina (C.A. No. 2009-CP-23-3346) styled
Brian P. Menezes, Derivatively on Behalf of Nominal Defendant, International Textile Group, Inc. (f/k/a Safety Components International, Inc.) v.
McGladrey Capital Markets, LLC (f/k/a RSM EquiCo Capital Markets, LLC), et al.
Plaintiffs filed an amended complaint in October 2011 styled
In re International Textile Group Merger Litigation
, adding a putative class action claim. Plaintiffs allege claims of aiding and abetting, civil conspiracy, gross negligence and breach of fiduciary duty against MCM in connection with a fairness opinion MCM provided to the Special Committee of Safety Components International, Inc. (SCI) in 2006 regarding the merger between International Textile Group, Inc. and SCI. Plaintiffs seek actual and punitive damages, pre-judgment interest, attorneys' fees and costs. On February 8, 2012, the court dismissed plaintiffs' civil conspiracy claim against all defendants. A class was certified on the remaining claims on November 20, 2012. The court granted summary judgment in favor of MCM on June 3, 2013 on the breach of fiduciary duty claim. A trial date has been set for September 9, 2013 on the remaining claims. We have not concluded that a loss related to this matter is probable, nor have we established a loss contingency related to this matter. We believe we have meritorious defenses to the claims in this case and intend to defend the case vigorously, but there can be no assurances as to its outcome or its impact on our consolidated financial position, results of operations and cash flows.
In connection with the sale of RSM and MCM, we indemnified the buyers against certain litigation matters. The indemnities are not subject to a stated term or limit. A portion of our accrual is related to these indemnity obligations.
|
76
|
H&R Block 2013 Form 10K
|
OTHER
– We are from time to time a party to investigations, claims and lawsuits not discussed herein arising out of our business operations. These investigations, claims and lawsuits may include actions by state attorneys general, other state regulators, federal regulators, individual plaintiffs, and cases in which plaintiffs seek to represent a class of others similarly situated. We believe we have meritorious defenses to each of these investigations, claims and lawsuits, and we are defending or intend to defend them vigorously. The amounts claimed in these matters are substantial in some instances; however, the ultimate liability with respect to such matters is difficult to predict. In the event of an unfavorable outcome, the amounts we may be required to pay in the discharge of liabilities or settlements could have a material impact on our consolidated financial position, results of operations and cash flows.
We are also a party to claims and lawsuits that we consider to be ordinary, routine litigation incidental to our business, including, but not limited to, claims and lawsuits concerning the preparation of customers' income tax returns, the fees charged customers for various services and products, relationships with franchisees, intellectual property disputes, marketing and other competitor disputes, employment matters and contract disputes (Other Claims). While we cannot provide assurance that we will ultimately prevail in each instance, we believe the amount, if any, we are required to pay in the discharge from liabilities in, or settlements of, these Other Claims will not have a material impact on our consolidated financial position, results of operations and cash flows.
SCC ceased originating mortgage loans in December 2007 and, in April 2008, sold its servicing assets and discontinued its remaining operations.
Mortgage loans originated by SCC were sold either as whole loans to single third-party buyers or in the form of residential mortgage-backed securities (RMBSs). In connection with the sale of loans and/or RMBSs, SCC made certain representations and warranties. These representations and warranties varied based on the nature of the transaction and the buyer's or insurer's requirements, but generally pertained to the ownership of the loan, the validity of the lien securing the loan, borrower fraud, the loan's compliance with the criteria for inclusion in the transaction, including compliance with SCC's underwriting standards or loan criteria established by the buyer, ability to deliver required documentation, and compliance with applicable laws. Representations and warranties related to borrower fraud in whole loan sale transactions to institutional investors, which represented approximately
68%
of the disposal of loans originated in calendar years 2005, 2006 and 2007, included a “knowledge qualifier” limiting SCC's liability to those instances where SCC had knowledge of the fraud at the time the loans were sold. Representations and warranties made in other sale transactions effectively did not include a knowledge qualifier as to borrower fraud. SCC believes it would have an obligation to repurchase a loan or indemnify certain parties with respect to a claim for a breach of a representation and warranty only if such breach materially and adversely affects the value of the mortgage loan, or a securitization insurer's or certificate holder's interest in the mortgage loan, and the mortgage loan has not been liquidated, although there is limited and conflicting case law on the liquidated loan defense issue. Such claims together with any settlement arrangements related to these losses are collectively referred to as “representation and warranty claims.”
Representation and warranty claims received by SCC have primarily related to alleged breaches of representations and warranties related to a loan's compliance with the underwriting standards established by SCC at origination and borrower fraud for loans originated in calendar years 2006 and 2007. SCC has received
$2.1 billion
claims since May 1, 2008, of which
$190 million
were received in fiscal year 2013 and
$1.1 billion
in fiscal year 2012. Claims totaling approximately
$41 million
remained subject to review as of April 30, 2013, of which, approximately
$11 million
represent a reassertion of previously denied claims.
SETTLEMENT ACTIONS
-
SCC has vigorously contested any request for repurchase when it has concluded that a valid basis for repurchase does not exist and will continue to do so in the future. Through its loan-by-loan review of these claims, SCC has denied approximately
90%
of all asserted claims.
However, SCC may enter into bulk settlements it believes to be advantageous in lieu of a loan-by-loan review process. Factors SCC considers in relation to bulk settlements vary by counterparty, and SCC analyzes settlement opportunities based on the specific counterparty, or type of counterparty.
During the latter-half of fiscal year 2013, SCC entered into tolling agreements with the counterparties from whom SCC has received a significant majority of its asserted claims. These tolling agreements toll the running of any applicable statute of limitations related to potential representation and warranty claims and other claims against SCC. During the fourth quarter, SCC engaged in discussions with these counterparties regarding the bulk settlement of previously denied and potential future claims. Based on settlement discussions with these counterparties, SCC believes a bulk settlement approach, rather than the loan-by-loan claim process, will be needed to achieve settlement with these counterparties with respect to all of their representation and warranty and other claims. SCC has experienced a decline in claims on a loan-by-loan basis for alleged breaches of representations and warranties during fiscal year 2013, which it believes is primarily attributable to the existence of tolling agreements. In the event that current efforts to settle with these counterparties are not successful, SCC believes claim volumes may increase or litigation may result.
|
H&R Block 2013 Form 10K
|
77
|
American International Group, Inc. (AIG) had threatened to assert claims of various types in the approximate amount of
$650 million
in connection with the sale and securitization of SCC-originated mortgage loans. On December 21, 2012, SCC and AIG entered into an agreement to resolve all of AIG's claims, except that AIG retained the right to benefit from payments for representation and warranty claims by third parties, without AIG's assistance or encouragement, that are made to securitization trusts in which AIG has a continuing interest.
LIABILITY FOR ESTIMATED CONTINGENT LOSSES
-
SCC records a liability for losses related to representation and warranty claims when those losses are believed to be both probable and reasonably estimable. Development of loss estimates is subjective, subject to a high degree of management judgment, and estimates may vary significantly period to period. Historically, SCC has developed its estimate of losses related to representation and warranty claims based primarily on projections of future claims on a loan-by-loan basis. As a result of counterparty activity occurring during the fourth quarter, SCC has reassessed its estimate for losses, placing greater emphasis on bulk settlement discussions involving counterparties subject to tolling agreements rather than projections of future claims on a loan-by loan basis. SCC's loss estimate at April 30, 2013 considers the experience gained through discussions with counterparties, and an assessment of, among other things, historical claim results, threatened claims, terms and provisions of related agreements, counterparty willingness to pursue a settlement, legal standing of counterparties to provide a comprehensive settlement, the potential pro-rata realization of the claims as compared to all similar claims and other relevant facts and circumstances when developing its estimate of probable loss. The estimate is based on the best information currently available, significant management judgment, and a number of factors, including developments in case law and those factors mentioned above, that are subject to change. Changes in any one of these factors could significantly impact the estimate.
SCC recorded a
$40 million
incremental provision to its liability for estimated contingent losses during the fourth quarter of fiscal year 2013. The provision is the result of events occurring during the fourth quarter, including tolling agreements SCC entered into with certain counterparties and bulk settlement discussions related to previously denied and potential future claims.
The liability is included in accounts payable, accrued expenses and other current liabilities on the consolidated balance sheets. A rollforward of SCC's accrued liability for these loss contingencies is as follows:
|
(in 000s)
|
||||||||||||
|
Year ended April 30,
|
2013
|
|
2012
|
|
2011
|
|
||||||
|
Balance, beginning of the year
|
$
|
130,018
|
|
$
|
126,260
|
|
$
|
188,200
|
|
|||
|
Provisions
|
40,000
|
|
20,000
|
|
—
|
|
||||||
|
Payments
|
(11,253
|
)
|
(16,242
|
)
|
(61,940
|
)
|
||||||
|
Balance, end of the year
|
$
|
158,765
|
|
$
|
130,018
|
|
$
|
126,260
|
|
|||
SCC is taking the legal position, where appropriate, for both contractual representation and warranty claims and similar claims in litigation, that a valid representation and warranty claim cannot be made with respect to a mortgage loan that has been liquidated. There is limited case law on this issue. These decisions are from lower courts, are inconsistent in their analysis and receptivity to this defense, and are subject to appeal. It is anticipated that the liquidated mortgage loan defense will be the subject of future judicial decisions. Until the validity of the liquidated loan defense is further clarified by the courts or other developments occur, SCC's estimated accrual for representation and warranty will not take this defense into account.
ESTIMATED RANGE OF POSSIBLE LOSS
-
SCC believes it is reasonably possible that future representation and warranty losses may vary from amounts recorded for these exposures. SCC currently estimates that the range of reasonably possible loss could be up to
$30 million
in excess of amounts accrued. This estimated range is based on currently available information, significant judgment and a number of assumptions that are subject to change. The actual loss that may be incurred could be more or less than our accrual or the estimate of reasonably possible losses.
INDEMNIFICATION OBLIGATIONS
-
As described more fully in note 18, losses may also be incurred with respect to various indemnification claims by underwriters and depositors in securitization transactions in which SCC participated. Losses from these indemnification claims are frequently not subject to a stated term or limit. We have not concluded that a loss related to any of these indemnification claims is probable; however, there can be no assurances as to the outcome or impact of these indemnification claims on our consolidated financial position, results of operations and cash flows. The accrued liability described above totaling
$158.8 million
does not include accrued losses, if any, which may arise from these indemnification claims.
|
78
|
H&R Block 2013 Form 10K
|
Discontinued operations consist of our former Business Services segment and SCC. We sold RSM and MCM in fiscal year 2012. SCC exited its mortgage business in fiscal year 2008.
Results of our discontinued operations are as follows:
|
(in 000s)
|
||||||||||||
|
Year ended April 30,
|
2013
|
|
2012
|
|
2011
|
|
||||||
|
Revenues
|
$
|
—
|
|
$
|
417,168
|
|
$
|
828,725
|
|
|||
|
Pretax income (loss) from operations:
|
||||||||||||
|
RSM and related businesses
|
$
|
1,205
|
|
$
|
14,441
|
|
$
|
48,021
|
|
|||
|
Mortgage
|
(52,077
|
)
|
(59,702
|
)
|
(20,644
|
)
|
||||||
|
(50,872
|
)
|
(45,261
|
)
|
27,377
|
|
|||||||
|
Income taxes (benefit)
|
(19,662
|
)
|
(13,329
|
)
|
13,814
|
|
||||||
|
Net income (loss) from operations
|
(31,210
|
)
|
(31,932
|
)
|
13,563
|
|
||||||
|
Pretax loss on sales of businesses
|
—
|
|
(109,719
|
)
|
—
|
|
||||||
|
Income tax benefit
|
—
|
|
(61,615
|
)
|
—
|
|
||||||
|
Net loss on sales of businesses
|
—
|
|
(48,104
|
)
|
—
|
|
||||||
|
Net income (loss) from discontinued operations
|
$
|
(31,210
|
)
|
$
|
(80,036
|
)
|
$
|
13,563
|
|
|||
HRB Bank is subject to capital guidelines administered by federal banking agencies. Failure to meet minimum capital requirements can trigger certain mandatory and possibly additional discretionary actions by regulators that, if undertaken, could have a direct material effect on HRB Bank and our consolidated financial statements. All savings associations are subject to the capital adequacy guidelines and the regulatory framework for prompt corrective action. HRB Bank must meet specific capital guidelines that involve quantitative measures of HRB Bank's assets, liabilities and certain off-balance sheet items, as calculated under regulatory accounting practices. HRB Bank's capital amounts and classification are also subject to qualitative judgments by the regulators about components, risk weightings and other factors. On August 30, 2012, the OCC published in the Federal Register a formal notice of proposed rulemaking, which would increase capital requirements for federal savings banks, including HRB Bank. These proposed rules have been delayed to an unspecified date. HRB Bank files its regulatory Call Report with the OCC on a calendar quarter basis.
Quantitative measures established by regulation to ensure capital adequacy require HRB Bank to maintain minimum amounts and ratios of tangible equity, total risk-based capital and Tier 1 capital, as set forth in the table below. As of April 30,
2013
, HRB Bank’s leverage ratio was
33.9%
.
As of March 31, 2013, our most recent Call Report filing with the OCC, HRB Bank was a “well capitalized” institution under the prompt corrective action provisions of the FDIC. The five capital categories are: (1) “well capitalized” (total risk-based capital ratio of
10%
, Tier 1 Risk-based capital ratio of
6%
and leverage ratio of
5%
); (2) “adequately capitalized;” (3) “undercapitalized;” (4) “significantly undercapitalized;” and (5) “critically undercapitalized.” There have been no conditions or events since March 31, 2013 that management believes have caused a change in HRB Bank’s category.
|
H&R Block 2013 Form 10K
|
79
|
The following table sets forth HRB Bank's regulatory capital requirements calculated in its Call Report, as filed with the Federal Financial Institutions Examination Council (FFIEC):
|
(dollars in 000s)
|
||||||||||||||||||||||
|
Actual
|
Minimum
Capital Requirement
|
Minimum to be
Well Capitalized
|
||||||||||||||||||||
|
Amount
|
Ratio
|
Amount
|
Ratio
|
Amount
|
Ratio
|
|||||||||||||||||
|
As of March 31, 2013:
|
||||||||||||||||||||||
|
Total risk-based capital ratio
(1)
|
$
|
506,734
|
|
131.6
|
%
|
$
|
30,806
|
|
8.0
|
%
|
$
|
38,508
|
|
10.0
|
%
|
|||||||
|
Tier 1 risk-based capital ratio
(2)
|
501,731
|
|
130.3
|
%
|
N/A
|
|
N/A
|
|
23,105
|
|
6.0
|
%
|
||||||||||
|
Tier 1 capital ratio (leverage)
(3)
|
501,731
|
|
25.5
|
%
|
236,315
|
|
12.0
|
%
|
(5)
|
98,464
|
|
5.0
|
%
|
|||||||||
|
Tangible equity ratio
(4)
|
501,731
|
|
25.5
|
%
|
29,539
|
|
1.5
|
%
|
N/A
|
|
N/A
|
|
||||||||||
|
As of March 31, 2012:
|
||||||||||||||||||||||
|
Total risk-based capital ratio
(1)
|
$
|
458,860
|
|
120.3
|
%
|
$
|
30,513
|
|
8.0
|
%
|
$
|
38,141
|
|
10.0
|
%
|
|||||||
|
Tier 1 risk-based capital ratio
(2)
|
453,800
|
|
119.0
|
%
|
N/A
|
|
N/A
|
|
22,885
|
|
6.0
|
%
|
||||||||||
|
Tier 1 capital ratio (leverage)
(3)
|
453,800
|
|
29.4
|
%
|
185,252
|
|
12.0
|
%
|
(5)
|
77,188
|
|
5.0
|
%
|
|||||||||
|
Tangible equity ratio
(4)
|
453,800
|
|
29.4
|
%
|
23,157
|
|
1.5
|
%
|
N/A
|
|
N/A
|
|
||||||||||
|
(1)
|
Total risk-based capital divided by risk-weighted assets.
|
|
(2)
|
Tier 1 (core) capital less deduction for low-level recourse and residual interest divided by risk-weighted assets.
|
|
(3)
|
Tier 1 (core) capital divided by adjusted total assets.
|
|
(4)
|
Tangible capital divided by tangible assets.
|
|
(5)
|
Effective April 5, 2012, the minimum capital requirement was changed to
4%
by the OCC, although HRB Bank plans to maintain a minimum of
12.0%
leverage capital at the end of each calendar quarter.
|
Block Financial typically makes capital contributions to HRB Bank to help HRB Bank meet its capital requirements. Block Financial made no such capital contributions in fiscal year
2013
, but contributed
$400.0 million
and
$235.0 million
during fiscal years
2012
and
2011
, respectively.
A return of capital or dividend paid by HRB Bank must be approved by the OCC and the Federal Reserve. HRB Bank did not pay any dividends during fiscal year 2013. HRB Bank received regulatory approval and subsequently paid cash dividends and returned capital of
$400.0 million
and
$262.5 million
during fiscal years
2012
and
2011
, respectively. At April 30,
2013
, HRB Bank had total equity of
$512.4 million
.
Management has determined our reportable segments identified below according to types of services offered and the manner in which operational decisions are made. Operating results of our reportable segments are all seasonal.
TAX SERVICES
– Our Tax Services segment is engaged in providing tax return preparation and related services and products to the general public primarily in the U.S. and its territories, Canada, and Australia. Major revenue sources include fees earned for tax preparation services performed at company-owned retail tax offices, royalties from franchise retail tax offices, sales of tax preparation software, online tax preparation fees, fees from RACs, fees related to H&R Block Prepaid Emerald MasterCard
®
, and interest and fees from EAs.
Our international operations contributed
$249.0 million
,
$232.8 million
and
$205.8 million
in revenues for fiscal years
2013
,
2012
and
2011
, respectively, and
$44.6 million
,
$47.1 million
and
$46.2 million
of pretax income, respectively.
CORPORATE AND ELIMINATIONS
– Results include net interest margin and gains or losses relating to mortgage loans held for investment, real estate owned and residual interests in securitizations, along with interest expense on borrowings, other corporate expenses and eliminations of intercompany activities.
IDENTIFIABLE ASSETS
– Identifiable assets are those assets, including goodwill and intangible assets, associated with a reportable segment. The remaining assets are classified as Corporate assets, which consist primarily of cash and mortgage loans held for investment. The carrying value of assets held outside the U.S. totaled
$472.6 million
,
$201.8 million
and
$206.3 million
at April 30,
2013
,
2012
and
2011
, respectively.
|
80
|
H&R Block 2013 Form 10K
|
Information concerning the Company’s operations by reportable segment is as follows:
|
(in 000s)
|
||||||||||||
|
Year ended April 30,
|
2013
|
|
2012
|
|
2011
|
|
||||||
|
REVENUES :
|
||||||||||||
|
Tax Services
|
$
|
2,877,967
|
|
$
|
2,862,378
|
|
$
|
2,912,361
|
|
|||
|
Corporate and eliminations
|
27,976
|
|
31,393
|
|
32,619
|
|
||||||
|
$
|
2,905,943
|
|
$
|
2,893,771
|
|
$
|
2,944,980
|
|
||||
|
INCOME (LOSS) FROM CONTINUING OPERATIONS BEFORE TAXES :
|
||||||||||||
|
Tax Services
|
$
|
821,143
|
|
$
|
704,002
|
|
$
|
767,498
|
|
|||
|
Corporate and eliminations
|
(119,132
|
)
|
(127,932
|
)
|
(139,795
|
)
|
||||||
|
$
|
702,011
|
|
$
|
576,070
|
|
$
|
627,703
|
|
||||
|
IDENTIFIABLE ASSETS :
|
||||||||||||
|
Tax Services
|
$
|
3,012,525
|
|
$
|
2,298,484
|
|
$
|
2,267,236
|
|
|||
|
Corporate
|
1,525,254
|
|
2,351,083
|
|
2,121,889
|
|
||||||
|
Assets held for sale
|
—
|
|
—
|
|
900,328
|
|
||||||
|
$
|
4,537,779
|
|
$
|
4,649,567
|
|
$
|
5,289,453
|
|
||||
|
(in 000s, except per share amounts)
|
||||||||||||||||||||
|
Fiscal Year 2013
|
|
Apr 30, 2013
|
|
Jan 31, 2013
|
|
Oct 31, 2012
|
|
Jul 31, 2012
|
|
|||||||||||
|
Revenues
|
$
|
2,905,943
|
|
$
|
2,200,212
|
|
$
|
471,979
|
|
$
|
137,263
|
|
$
|
96,489
|
|
|||||
|
Income (loss) from continuing operations before taxes (benefit)
|
$
|
702,011
|
|
$
|
1,129,836
|
|
$
|
(96,268
|
)
|
$
|
(162,288
|
)
|
$
|
(169,269
|
)
|
|||||
|
Income taxes (benefit)
|
236,853
|
|
440,914
|
|
(79,353
|
)
|
(61,089
|
)
|
(63,619
|
)
|
||||||||||
|
Net income (loss) from continuing operations
|
465,158
|
|
688,922
|
|
(16,915
|
)
|
(101,199
|
)
|
(105,650
|
)
|
||||||||||
|
Net loss from discontinued operations
|
(31,210
|
)
|
(24,582
|
)
|
(793
|
)
|
(4,044
|
)
|
(1,791
|
)
|
||||||||||
|
Net income (loss)
|
$
|
433,948
|
|
$
|
664,340
|
|
$
|
(17,708
|
)
|
$
|
(105,243
|
)
|
$
|
(107,441
|
)
|
|||||
|
Basic earnings (loss) per share:
|
||||||||||||||||||||
|
Continuing operations
|
$
|
1.70
|
|
$
|
2.53
|
|
$
|
(0.06
|
)
|
$
|
(0.37
|
)
|
$
|
(0.38
|
)
|
|||||
|
Discontinued operations
|
(0.11
|
)
|
(0.09
|
)
|
(0.01
|
)
|
(0.02
|
)
|
(0.01
|
)
|
||||||||||
|
Consolidated
|
$
|
1.59
|
|
$
|
2.44
|
|
$
|
(0.07
|
)
|
$
|
(0.39
|
)
|
$
|
(0.39
|
)
|
|||||
|
Diluted earnings (loss) per share:
|
||||||||||||||||||||
|
Continuing operations
|
$
|
1.69
|
|
$
|
2.51
|
|
$
|
(0.06
|
)
|
$
|
(0.37
|
)
|
$
|
(0.38
|
)
|
|||||
|
Discontinued operations
|
(0.11
|
)
|
(0.09
|
)
|
(0.01
|
)
|
(0.02
|
)
|
(0.01
|
)
|
||||||||||
|
Consolidated
|
$
|
1.58
|
|
$
|
2.42
|
|
$
|
(0.07
|
)
|
$
|
(0.39
|
)
|
$
|
(0.39
|
)
|
|||||
|
H&R Block 2013 Form 10K
|
81
|
|
Fiscal Year 2012
|
|
Apr 30, 2012
|
|
Jan 31, 2012
|
|
Oct 31, 2011
|
|
Jul 31, 2011
|
|
|||||||||||
|
Revenues
|
$
|
2,893,771
|
|
$
|
2,000,674
|
|
$
|
663,280
|
|
$
|
129,194
|
|
$
|
100,623
|
|
|||||
|
Income (loss) from continuing operations before taxes (benefit)
|
$
|
576,070
|
|
$
|
981,626
|
|
$
|
(1,026
|
)
|
$
|
(203,929
|
)
|
$
|
(200,601
|
)
|
|||||
|
Income taxes (benefit)
|
230,102
|
|
389,923
|
|
2,541
|
|
(80,916
|
)
|
(81,446
|
)
|
||||||||||
|
Net income (loss) from continuing operations
|
345,968
|
|
591,703
|
|
(3,567
|
)
|
(123,013
|
)
|
(119,155
|
)
|
||||||||||
|
Net income (loss) from discontinued operations
|
(80,036
|
)
|
(5,600
|
)
|
218
|
|
(18,711
|
)
|
(55,943
|
)
|
||||||||||
|
Net income (loss)
|
$
|
265,932
|
|
$
|
586,103
|
|
$
|
(3,349
|
)
|
$
|
(141,724
|
)
|
$
|
(175,098
|
)
|
|||||
|
Basic earnings (loss) per share:
|
||||||||||||||||||||
|
Continuing operations
|
$
|
1.16
|
|
$
|
2.02
|
|
$
|
(0.01
|
)
|
$
|
(0.41
|
)
|
$
|
(0.39
|
)
|
|||||
|
Discontinued operations
|
(0.27
|
)
|
(0.02
|
)
|
—
|
|
(0.06
|
)
|
(0.18
|
)
|
||||||||||
|
Consolidated
|
$
|
0.89
|
|
$
|
2.00
|
|
$
|
(0.01
|
)
|
$
|
(0.47
|
)
|
$
|
(0.57
|
)
|
|||||
|
Diluted earnings (loss) per share:
|
||||||||||||||||||||
|
Continuing operations
|
$
|
1.16
|
|
$
|
2.01
|
|
$
|
(0.01
|
)
|
$
|
(0.41
|
)
|
$
|
(0.39
|
)
|
|||||
|
Discontinued operations
|
(0.27
|
)
|
(0.02
|
)
|
—
|
|
(0.06
|
)
|
(0.18
|
)
|
||||||||||
|
Consolidated
|
$
|
0.89
|
|
$
|
1.99
|
|
$
|
(0.01
|
)
|
$
|
(0.47
|
)
|
$
|
(0.57
|
)
|
|||||
Because most of our clients file their tax returns during last four months of our fiscal year, which is the period from January through April of each year, substantially all of our revenues from income tax return preparation and related services and products are earned during this period. As a result, we generally operate at a loss through the first eight months of the fiscal year. Results of discontinued operations for the first quarter of fiscal year 2012 included pretax goodwill impairments of
$99.7 million
.
The accumulation of four quarters in fiscal years
2013
and
2012
for earnings per share may not equal the related per share amounts for the years ended April 30,
2013
and
2012
due to the timing of the exercise of stock options and lapse of certain restrictions on nonvested shares and share units and the antidilutive effect of stock options and nonvested shares and share units in the first two quarters for those years, as well as the repurchase of shares outstanding.
Information regarding H&R Block's common stock prices and dividends for fiscal years
2013
and
2012
is as follows:
|
Fiscal Year
|
|
Fourth Quarter
|
|
Third Quarter
|
|
Second Quarter
|
|
First Quarter
|
|
|||||||||||
|
Fiscal Year 2013:
|
||||||||||||||||||||
|
Dividends paid per share
|
$
|
0.80
|
|
$
|
0.20
|
|
$
|
0.20
|
|
$
|
0.20
|
|
$
|
0.20
|
|
|||||
|
Stock price range:
|
||||||||||||||||||||
|
High
|
$
|
29.68
|
|
$
|
29.68
|
|
$
|
23.19
|
|
$
|
18.04
|
|
$
|
16.88
|
|
|||||
|
Low
|
14.35
|
|
22.77
|
|
17.26
|
|
15.53
|
|
14.35
|
|
||||||||||
|
Fiscal Year 2012:
|
||||||||||||||||||||
|
Dividends paid per share
|
$
|
0.70
|
|
$
|
0.20
|
|
$
|
0.20
|
|
$
|
0.15
|
|
$
|
0.15
|
|
|||||
|
Stock price range:
|
||||||||||||||||||||
|
High
|
$
|
17.75
|
|
$
|
17.46
|
|
$
|
17.09
|
|
$
|
15.52
|
|
$
|
17.75
|
|
|||||
|
Low
|
12.54
|
|
14.35
|
|
14.41
|
|
12.54
|
|
14.68
|
|
||||||||||
Block Financial is an indirect, 100% owned subsidiary of the Company. Block Financial is the Issuer and the Company is the full and unconditional Guarantor of the Senior Notes issued on October 25, 2012 and October 26, 2004, our 2012 CLOC, and other indebtedness issued from time to time. These condensed consolidating financial statements have been prepared using the equity method of accounting. Earnings of subsidiaries are, therefore, reflected in the Company’s investment in subsidiaries account. The elimination entries eliminate investments in subsidiaries, related stockholders’ equity and other intercompany balances and transactions.
|
82
|
H&R Block 2013 Form 10K
|
|
CONDENSED CONSOLIDATING INCOME STATEMENTS
|
(in 000s)
|
|
||||||||||||||||||
|
Year ended April 30, 2013
|
H&R Block, Inc.
(Guarantor)
|
|
Block Financial
(Issuer)
|
|
Other
Subsidiaries
|
|
Eliminations
|
|
Consolidated
H&R Block
|
|
||||||||||
|
Total revenues
|
$
|
—
|
|
$
|
230,982
|
|
$
|
2,681,987
|
|
$
|
(7,026
|
)
|
$
|
2,905,943
|
|
|||||
|
Cost of revenues
|
—
|
|
193,400
|
|
1,417,824
|
|
(6,436
|
)
|
1,604,788
|
|
||||||||||
|
Selling, general and administrative
|
—
|
|
42,530
|
|
562,529
|
|
(590
|
)
|
604,469
|
|
||||||||||
|
Total expenses
|
—
|
|
235,930
|
|
1,980,353
|
|
(7,026
|
)
|
2,209,257
|
|
||||||||||
|
Operating income (loss)
|
—
|
|
(4,948
|
)
|
701,634
|
|
—
|
|
696,686
|
|
||||||||||
|
Other income (expense), net
|
702,011
|
|
(1,164
|
)
|
6,489
|
|
(702,011
|
)
|
5,325
|
|
||||||||||
|
Income (loss) from continuing operations before taxes (benefit)
|
702,011
|
|
(6,112
|
)
|
708,123
|
|
(702,011
|
)
|
702,011
|
|
||||||||||
|
Income taxes (benefit)
|
236,853
|
|
(29,221
|
)
|
266,074
|
|
(236,853
|
)
|
236,853
|
|
||||||||||
|
Net income from continuing operations
|
465,158
|
|
23,109
|
|
442,049
|
|
(465,158
|
)
|
465,158
|
|
||||||||||
|
Net income (loss) from discontinued operations
|
(31,210
|
)
|
(31,954
|
)
|
744
|
|
31,210
|
|
(31,210
|
)
|
||||||||||
|
Net income (loss)
|
433,948
|
|
(8,845
|
)
|
442,793
|
|
(433,948
|
)
|
433,948
|
|
||||||||||
|
Other comprehensive income (loss)
|
(1,595
|
)
|
189
|
|
(1,784
|
)
|
1,595
|
|
(1,595
|
)
|
||||||||||
|
Comprehensive income (loss)
|
$
|
432,353
|
|
$
|
(8,656
|
)
|
$
|
441,009
|
|
$
|
(432,353
|
)
|
$
|
432,353
|
|
|||||
|
Year ended April 30, 2012
|
H&R Block, Inc.
(Guarantor)
|
|
Block Financial
(Issuer)
|
|
Other
Subsidiaries
|
|
Eliminations
|
|
Consolidated
H&R Block
|
|
||||||||||
|
Total revenues
|
$
|
—
|
|
$
|
234,925
|
|
$
|
2,666,267
|
|
$
|
(7,421
|
)
|
$
|
2,893,771
|
|
|||||
|
Cost of revenues
|
—
|
|
221,988
|
|
1,487,128
|
|
(7,421
|
)
|
1,701,695
|
|
||||||||||
|
Selling, general and administrative
|
—
|
|
24,730
|
|
601,054
|
|
—
|
|
625,784
|
|
||||||||||
|
Total expenses
|
—
|
|
246,718
|
|
2,088,182
|
|
(7,421
|
)
|
2,327,479
|
|
||||||||||
|
Operating income (loss)
|
—
|
|
(11,793
|
)
|
578,085
|
|
—
|
|
566,292
|
|
||||||||||
|
Other income, net
|
576,070
|
|
8,686
|
|
1,092
|
|
(576,070
|
)
|
9,778
|
|
||||||||||
|
Income (loss) from continuing operations before taxes (benefit)
|
576,070
|
|
(3,107
|
)
|
579,177
|
|
(576,070
|
)
|
576,070
|
|
||||||||||
|
Income taxes (benefit)
|
230,102
|
|
(1,191
|
)
|
231,293
|
|
(230,102
|
)
|
230,102
|
|
||||||||||
|
Net income (loss) from continuing operations
|
345,968
|
|
(1,916
|
)
|
347,884
|
|
(345,968
|
)
|
345,968
|
|
||||||||||
|
Net loss from discontinued operations
|
(80,036
|
)
|
(40,172
|
)
|
(39,864
|
)
|
80,036
|
|
(80,036
|
)
|
||||||||||
|
Net income (loss)
|
265,932
|
|
(42,088
|
)
|
308,020
|
|
(265,932
|
)
|
265,932
|
|
||||||||||
|
Other comprehensive income (loss)
|
912
|
|
3,085
|
|
(2,173
|
)
|
(912
|
)
|
912
|
|
||||||||||
|
Comprehensive income (loss)
|
$
|
266,844
|
|
$
|
(39,003
|
)
|
$
|
305,847
|
|
$
|
(266,844
|
)
|
$
|
266,844
|
|
|||||
|
Year ended April 30, 2011
|
H&R Block, Inc.
(Guarantor)
|
|
Block Financial
(Issuer)
|
|
Other
Subsidiaries
|
|
Eliminations
|
|
Consolidated
H&R Block
|
|
||||||||||
|
Total revenues
|
$
|
—
|
|
$
|
251,521
|
|
$
|
2,693,459
|
|
$
|
—
|
|
$
|
2,944,980
|
|
|||||
|
Cost of revenues
|
—
|
|
277,099
|
|
1,499,683
|
|
—
|
|
1,776,782
|
|
||||||||||
|
Selling, general and administrative
|
—
|
|
31,914
|
|
519,945
|
|
—
|
|
551,859
|
|
||||||||||
|
Total expenses
|
—
|
|
309,013
|
|
2,019,628
|
|
—
|
|
2,328,641
|
|
||||||||||
|
Operating income (loss)
|
—
|
|
(57,492
|
)
|
673,831
|
|
—
|
|
616,339
|
|
||||||||||
|
Other income, net
|
627,703
|
|
5,503
|
|
5,861
|
|
(627,703
|
)
|
11,364
|
|
||||||||||
|
Income (loss) from continuing operations before taxes (benefit)
|
627,703
|
|
(51,989
|
)
|
679,692
|
|
(627,703
|
)
|
627,703
|
|
||||||||||
|
Income taxes (benefit)
|
235,156
|
|
(27,774
|
)
|
262,930
|
|
(235,156
|
)
|
235,156
|
|
||||||||||
|
Net income (loss) from continuing operations
|
392,547
|
|
(24,215
|
)
|
416,762
|
|
(392,547
|
)
|
392,547
|
|
||||||||||
|
Net income (loss) from discontinued operations
|
13,563
|
|
(12,417
|
)
|
25,980
|
|
(13,563
|
)
|
13,563
|
|
||||||||||
|
Net income (loss)
|
406,110
|
|
(36,632
|
)
|
442,742
|
|
(406,110
|
)
|
406,110
|
|
||||||||||
|
Other comprehensive income
|
9,555
|
|
163
|
|
9,392
|
|
(9,555
|
)
|
9,555
|
|
||||||||||
|
Comprehensive income (loss)
|
$
|
415,665
|
|
$
|
(36,469
|
)
|
$
|
452,134
|
|
$
|
(415,665
|
)
|
$
|
415,665
|
|
|||||
|
H&R Block 2013 Form 10K
|
83
|
|
CONDENSED CONSOLIDATING BALANCE SHEETS
|
(in 000s)
|
|
||||||||||||||||||
|
As of April 30, 2013
|
H&R Block, Inc.
(Guarantor)
|
|
Block Financial
(Issuer)
|
|
Other
Subsidiaries
|
|
Eliminations
|
|
Consolidated
H&R Block
|
|
||||||||||
|
Cash & cash equivalents
|
$
|
—
|
|
$
|
558,110
|
|
$
|
1,192,197
|
|
$
|
(2,723
|
)
|
$
|
1,747,584
|
|
|||||
|
Cash & cash equivalents — restricted
|
—
|
|
75,096
|
|
42,741
|
|
—
|
|
117,837
|
|
||||||||||
|
Receivables, net
|
769
|
|
99,844
|
|
106,222
|
|
—
|
|
206,835
|
|
||||||||||
|
Mortgage loans held for investment, net
|
—
|
|
338,789
|
|
—
|
|
—
|
|
338,789
|
|
||||||||||
|
Intangible assets and goodwill, net
|
—
|
|
—
|
|
719,221
|
|
—
|
|
719,221
|
|
||||||||||
|
Investments in subsidiaries
|
3,444,442
|
|
473
|
|
—
|
|
(3,444,442
|
)
|
473
|
|
||||||||||
|
Amounts due from affiliates
|
—
|
|
410,590
|
|
2,189,625
|
|
(2,600,215
|
)
|
—
|
|
||||||||||
|
Other assets
|
8,390
|
|
645,166
|
|
753,484
|
|
—
|
|
1,407,040
|
|
||||||||||
|
Total assets
|
$
|
3,453,601
|
|
$
|
2,128,068
|
|
$
|
5,003,490
|
|
$
|
(6,047,380
|
)
|
$
|
4,537,779
|
|
|||||
|
Customer deposits
|
$
|
—
|
|
$
|
939,187
|
|
$
|
—
|
|
$
|
(2,723
|
)
|
$
|
936,464
|
|
|||||
|
Long-term debt
|
—
|
|
896,978
|
|
9,702
|
|
—
|
|
906,680
|
|
||||||||||
|
Other liabilities
|
429
|
|
245,862
|
|
1,184,797
|
|
—
|
|
1,431,088
|
|
||||||||||
|
Amounts due to affiliates
|
2,189,625
|
|
—
|
|
410,590
|
|
(2,600,215
|
)
|
—
|
|
||||||||||
|
Stockholders’ equity
|
1,263,547
|
|
46,041
|
|
3,398,401
|
|
(3,444,442
|
)
|
1,263,547
|
|
||||||||||
|
Total liabilities and stockholders’ equity
|
$
|
3,453,601
|
|
$
|
2,128,068
|
|
$
|
5,003,490
|
|
$
|
(6,047,380
|
)
|
$
|
4,537,779
|
|
|||||
|
As of April 30, 2012
|
H&R Block, Inc.
(Guarantor)
|
|
Block Financial
(Issuer)
|
|
Other
Subsidiaries
|
|
Eliminations
|
|
Consolidated
H&R Block
|
|
||||||||||
|
Cash & cash equivalents
|
$
|
—
|
|
$
|
515,147
|
|
$
|
1,430,030
|
|
$
|
(843
|
)
|
$
|
1,944,334
|
|
|||||
|
Cash & cash equivalents — restricted
|
—
|
|
8,814
|
|
39,286
|
|
—
|
|
48,100
|
|
||||||||||
|
Receivables, net
|
—
|
|
90,755
|
|
103,103
|
|
—
|
|
193,858
|
|
||||||||||
|
Mortgage loans held for investment, net
|
—
|
|
406,201
|
|
—
|
|
—
|
|
406,201
|
|
||||||||||
|
Intangible assets and goodwill, net
|
—
|
|
—
|
|
704,230
|
|
—
|
|
704,230
|
|
||||||||||
|
Investments in subsidiaries
|
2,525,473
|
|
—
|
|
715
|
|
(2,525,473
|
)
|
715
|
|
||||||||||
|
Amounts due from affiliates
(1)
|
188
|
|
492,851
|
|
1,430,782
|
|
(1,923,821
|
)
|
—
|
|
||||||||||
|
Other assets
|
8,887
|
|
623,032
|
|
720,210
|
|
—
|
|
1,352,129
|
|
||||||||||
|
Total assets
|
$
|
2,534,548
|
|
$
|
2,136,800
|
|
$
|
4,428,356
|
|
$
|
(4,450,137
|
)
|
$
|
4,649,567
|
|
|||||
|
Customer deposits
|
$
|
—
|
|
$
|
828,392
|
|
$
|
—
|
|
$
|
(843
|
)
|
$
|
827,549
|
|
|||||
|
Long-term debt
|
—
|
|
999,325
|
|
41,224
|
|
—
|
|
1,040,549
|
|
||||||||||
|
Other liabilities
|
22,690
|
|
277,160
|
|
1,155,727
|
|
—
|
|
1,455,577
|
|
||||||||||
|
Amounts due to affiliates
(1)
|
1,185,966
|
|
244,816
|
|
493,039
|
|
(1,923,821
|
)
|
—
|
|
||||||||||
|
Stockholders’ equity
|
1,325,892
|
|
(212,893
|
)
|
2,738,366
|
|
(2,525,473
|
)
|
1,325,892
|
|
||||||||||
|
Total liabilities and stockholders’ equity
|
$
|
2,534,548
|
|
$
|
2,136,800
|
|
$
|
4,428,356
|
|
$
|
(4,450,137
|
)
|
$
|
4,649,567
|
|
|||||
|
(1)
|
Amounts have been restated to conform to the current period presentation, including the presentation of income tax receivables settled with affiliates and the presentation of intercompany receivables and payables gross, rather than net.
|
|
84
|
H&R Block 2013 Form 10K
|
|
CONDENSED CONSOLIDATING STATEMENTS OF CASH FLOWS
|
(in 000s)
|
|
||||||||||||||||||
|
Year ended April 30, 2013
|
H&R Block, Inc.
(Guarantor)
|
|
Block Financial
(Issuer)
|
|
Other
Subsidiaries
|
|
Eliminations
|
|
Consolidated
H&R Block
|
|
||||||||||
|
Net cash provided by (used in) operating activities:
|
$
|
(22,533
|
)
|
$
|
(3,299
|
)
|
$
|
522,940
|
|
$
|
—
|
|
$
|
497,108
|
|
|||||
|
Cash flows from investing:
|
||||||||||||||||||||
|
Purchases of AFS securities
|
—
|
|
(227,177
|
)
|
—
|
|
—
|
|
(227,177
|
)
|
||||||||||
|
Maturities and payments received on AFS securities
|
—
|
|
117,346
|
|
1,065
|
|
—
|
|
118,411
|
|
||||||||||
|
Mortgage loans held for investment, net
|
—
|
|
44,031
|
|
—
|
|
—
|
|
44,031
|
|
||||||||||
|
Purchases of property & equipment
|
—
|
|
(58
|
)
|
(113,181
|
)
|
—
|
|
(113,239
|
)
|
||||||||||
|
Payments for business acquisitions, net
|
—
|
|
—
|
|
(20,742
|
)
|
—
|
|
(20,742
|
)
|
||||||||||
|
Proceeds from sales of businesses, net
|
—
|
|
—
|
|
3,785
|
|
—
|
|
3,785
|
|
||||||||||
|
Loans made to franchisees
|
—
|
|
(70,807
|
)
|
—
|
|
—
|
|
(70,807
|
)
|
||||||||||
|
Repayments from franchisees
|
—
|
|
83,445
|
|
—
|
|
—
|
|
83,445
|
|
||||||||||
|
Surrender of COLI policies
|
—
|
|
—
|
|
81,125
|
|
—
|
|
81,125
|
|
||||||||||
|
Intercompany advances (payments)
|
555,008
|
|
—
|
|
—
|
|
(555,008
|
)
|
—
|
|
||||||||||
|
Other, net
|
—
|
|
(18,822
|
)
|
9,053
|
|
—
|
|
(9,769
|
)
|
||||||||||
|
Net cash provided by (used in) investing activities
|
555,008
|
|
(72,042
|
)
|
(38,895
|
)
|
(555,008
|
)
|
(110,937
|
)
|
||||||||||
|
Cash flows from financing:
|
||||||||||||||||||||
|
Repayments of commercial paper
|
—
|
|
(1,214,238
|
)
|
—
|
|
—
|
|
(1,214,238
|
)
|
||||||||||
|
Proceeds from commercial paper
|
—
|
|
1,214,238
|
|
—
|
|
—
|
|
1,214,238
|
|
||||||||||
|
Repayments of long-term debt
|
—
|
|
(605,790
|
)
|
(30,831
|
)
|
—
|
|
(636,621
|
)
|
||||||||||
|
Proceeds from long-term debt
|
—
|
|
497,185
|
|
—
|
|
—
|
|
497,185
|
|
||||||||||
|
Customer banking deposits, net
|
—
|
|
105,488
|
|
—
|
|
(1,880
|
)
|
103,608
|
|
||||||||||
|
Dividends paid
|
(217,201
|
)
|
—
|
|
—
|
|
—
|
|
(217,201
|
)
|
||||||||||
|
Repurchase of common stock
|
(340,413
|
)
|
—
|
|
—
|
|
—
|
|
(340,413
|
)
|
||||||||||
|
Proceeds from stock options
|
25,139
|
|
—
|
|
—
|
|
—
|
|
25,139
|
|
||||||||||
|
Intercompany advances (payments)
|
—
|
|
134,515
|
|
(689,523
|
)
|
555,008
|
|
—
|
|
||||||||||
|
Other, net
|
—
|
|
(13,094
|
)
|
(3,144
|
)
|
—
|
|
(16,238
|
)
|
||||||||||
|
Net cash provided by (used in) financing activities
|
(532,475
|
)
|
118,304
|
|
(723,498
|
)
|
553,128
|
|
(584,541
|
)
|
||||||||||
|
Effects of exchange rates on cash
|
—
|
|
—
|
|
1,620
|
|
—
|
|
1,620
|
|
||||||||||
|
Net increase (decrease) in cash
|
—
|
|
42,963
|
|
(237,833
|
)
|
(1,880
|
)
|
(196,750
|
)
|
||||||||||
|
Cash – beginning of the year
|
—
|
|
515,147
|
|
1,430,030
|
|
(843
|
)
|
1,944,334
|
|
||||||||||
|
Cash – end of the year
|
$
|
—
|
|
$
|
558,110
|
|
$
|
1,192,197
|
|
$
|
(2,723
|
)
|
$
|
1,747,584
|
|
|||||
|
H&R Block 2013 Form 10K
|
85
|
|
Year ended April 30, 2012
|
H&R Block, Inc.
(Guarantor)
|
|
Block Financial
(Issuer)
|
|
Other
Subsidiaries
|
|
Eliminations
|
|
Consolidated
H&R Block
|
|
||||||||||
|
Net cash provided by operating activities:
|
$
|
33,046
|
|
$
|
15,144
|
|
$
|
313,859
|
|
$
|
—
|
|
$
|
362,049
|
|
|||||
|
Cash flows from investing:
|
||||||||||||||||||||
|
Purchases of AFS securities
|
—
|
|
(256,173
|
)
|
—
|
|
—
|
|
(256,173
|
)
|
||||||||||
|
Maturities and payments received on AFS securities
|
—
|
|
63,291
|
|
3,091
|
|
—
|
|
66,382
|
|
||||||||||
|
Mortgage loans held for investment, net
|
—
|
|
49,142
|
|
—
|
|
—
|
|
49,142
|
|
||||||||||
|
Purchases of property & equipment
|
—
|
|
(153
|
)
|
(82,304
|
)
|
—
|
|
(82,457
|
)
|
||||||||||
|
Payments for business acquisitions, net
|
—
|
|
—
|
|
(15,258
|
)
|
—
|
|
(15,258
|
)
|
||||||||||
|
Proceeds from sales of businesses, net
|
—
|
|
—
|
|
560,499
|
|
—
|
|
560,499
|
|
||||||||||
|
Loans made to franchisees
|
—
|
|
(46,246
|
)
|
—
|
|
—
|
|
(46,246
|
)
|
||||||||||
|
Repayments from franchisees
|
—
|
|
56,591
|
|
—
|
|
—
|
|
56,591
|
|
||||||||||
|
Net intercompany advances
|
344,000
|
|
—
|
|
—
|
|
(344,000
|
)
|
—
|
|
||||||||||
|
Other, net
|
—
|
|
11,785
|
|
7,602
|
|
—
|
|
19,387
|
|
||||||||||
|
Net cash provided by (used in) investing activities
|
344,000
|
|
(121,763
|
)
|
473,630
|
|
(344,000
|
)
|
351,867
|
|
||||||||||
|
Cash flows from financing:
|
||||||||||||||||||||
|
Repayments of commercial paper
|
—
|
|
(664,167
|
)
|
—
|
|
—
|
|
(664,167
|
)
|
||||||||||
|
Proceeds from commercial paper
|
—
|
|
664,167
|
|
—
|
|
—
|
|
664,167
|
|
||||||||||
|
Repayments of other borrowings
|
—
|
|
(25,000
|
)
|
—
|
|
—
|
|
(25,000
|
)
|
||||||||||
|
Customer banking deposits, net
|
—
|
|
(25,298
|
)
|
—
|
|
(793
|
)
|
(26,091
|
)
|
||||||||||
|
Dividends paid
|
(208,801
|
)
|
—
|
|
—
|
|
—
|
|
(208,801
|
)
|
||||||||||
|
Repurchase of common stock
|
(180,592
|
)
|
—
|
|
—
|
|
—
|
|
(180,592
|
)
|
||||||||||
|
Proceeds from stock options
|
12,275
|
|
—
|
|
—
|
|
—
|
|
12,275
|
|
||||||||||
|
Net intercompany advances
|
—
|
|
55,721
|
|
(399,721
|
)
|
344,000
|
|
—
|
|
||||||||||
|
Other, net
|
72
|
|
105
|
|
(17,030
|
)
|
—
|
|
(16,853
|
)
|
||||||||||
|
Net cash provided by (used in) financing activities
|
(377,046
|
)
|
5,528
|
|
(416,751
|
)
|
343,207
|
|
(445,062
|
)
|
||||||||||
|
Effects of exchange rates on cash
|
—
|
|
—
|
|
(2,364
|
)
|
—
|
|
(2,364
|
)
|
||||||||||
|
Net increase (decrease) in cash
|
—
|
|
(101,091
|
)
|
368,374
|
|
(793
|
)
|
266,490
|
|
||||||||||
|
Cash – beginning of the year
|
—
|
|
616,238
|
|
1,061,656
|
|
(50
|
)
|
1,677,844
|
|
||||||||||
|
Cash – end of the year
|
$
|
—
|
|
$
|
515,147
|
|
$
|
1,430,030
|
|
$
|
(843
|
)
|
$
|
1,944,334
|
|
|||||
|
86
|
H&R Block 2013 Form 10K
|
|
Year ended April 30, 2011
|
H&R Block, Inc.
(Guarantor)
|
|
Block Financial
(Issuer)
|
|
Other
Subsidiaries
|
|
Eliminations
|
|
Consolidated
H&R Block
|
|
||||||||||
|
Net cash provided by (used in) operating activities:
|
$
|
9,683
|
|
$
|
(153,471
|
)
|
$
|
656,291
|
|
$
|
—
|
|
$
|
512,503
|
|
|||||
|
Cash flows from investing:
|
||||||||||||||||||||
|
Purchases of AFS securities
|
—
|
|
(138,824
|
)
|
—
|
|
—
|
|
(138,824
|
)
|
||||||||||
|
Maturities and payments received on AFS securities
|
—
|
|
16,690
|
|
107
|
|
—
|
|
16,797
|
|
||||||||||
|
Mortgage loans held for investment, net
|
—
|
|
58,471
|
|
—
|
|
—
|
|
58,471
|
|
||||||||||
|
Purchases of property & equipment
|
—
|
|
(33
|
)
|
(62,926
|
)
|
—
|
|
(62,959
|
)
|
||||||||||
|
Payments for business acquisitions, net
|
—
|
|
—
|
|
(54,171
|
)
|
—
|
|
(54,171
|
)
|
||||||||||
|
Proceeds from sales of businesses, net
|
—
|
|
—
|
|
71,083
|
|
—
|
|
71,083
|
|
||||||||||
|
Loans made to franchisees
|
—
|
|
(92,455
|
)
|
—
|
|
—
|
|
(92,455
|
)
|
||||||||||
|
Repayments from franchisees
|
—
|
|
57,552
|
|
—
|
|
—
|
|
57,552
|
|
||||||||||
|
Net intercompany advances
|
459,755
|
|
—
|
|
—
|
|
(459,755
|
)
|
—
|
|
||||||||||
|
Other, net
|
—
|
|
21,556
|
|
12,793
|
|
—
|
|
34,349
|
|
||||||||||
|
Net cash provided by (used in) investing activities
|
459,755
|
|
(77,043
|
)
|
(33,114
|
)
|
(459,755
|
)
|
(110,157
|
)
|
||||||||||
|
Cash flows from financing:
|
||||||||||||||||||||
|
Repayments of commercial paper
|
—
|
|
(4,818,766
|
)
|
—
|
|
—
|
|
(4,818,766
|
)
|
||||||||||
|
Proceeds from commercial paper
|
—
|
|
4,818,766
|
|
—
|
|
—
|
|
4,818,766
|
|
||||||||||
|
Repayments of other borrowings
|
—
|
|
(50,000
|
)
|
—
|
|
—
|
|
(50,000
|
)
|
||||||||||
|
Customer banking deposits, net
|
—
|
|
(11,501
|
)
|
—
|
|
61
|
|
(11,440
|
)
|
||||||||||
|
Dividends paid
|
(186,802
|
)
|
—
|
|
—
|
|
—
|
|
(186,802
|
)
|
||||||||||
|
Repurchase of common stock
|
(283,534
|
)
|
—
|
|
—
|
|
—
|
|
(283,534
|
)
|
||||||||||
|
Proceeds from stock options
|
424
|
|
—
|
|
—
|
|
—
|
|
424
|
|
||||||||||
|
Net intercompany advances
|
—
|
|
206,722
|
|
(666,477
|
)
|
459,755
|
|
—
|
|
||||||||||
|
Other, net
|
474
|
|
(490
|
)
|
(3,023
|
)
|
—
|
|
(3,039
|
)
|
||||||||||
|
Net cash provided by (used in) financing activities
|
(469,438
|
)
|
144,731
|
|
(669,500
|
)
|
459,816
|
|
(534,391
|
)
|
||||||||||
|
Effects of exchange rates on cash
|
—
|
|
—
|
|
5,844
|
|
—
|
|
5,844
|
|
||||||||||
|
Net increase (decrease) in cash
|
—
|
|
(85,783
|
)
|
(40,479
|
)
|
61
|
|
(126,201
|
)
|
||||||||||
|
Cash – beginning of the year
|
—
|
|
702,021
|
|
1,102,135
|
|
(111
|
)
|
1,804,045
|
|
||||||||||
|
Cash – end of the year
|
$
|
—
|
|
$
|
616,238
|
|
$
|
1,061,656
|
|
$
|
(50
|
)
|
$
|
1,677,844
|
|
|||||
|
H&R Block 2013 Form 10K
|
87
|
|
ITEM 9.
|
CHANGES IN AND DISAGREEMENTS WITH ACCOUNTANTS ON ACCOUNTING AND FINANCIAL DISCLOSURE
|
There were no disagreements or reportable events requiring disclosure pursuant to Item 304(b) of Regulation S-K.
|
ITEM 9A.
|
CONTROLS AND PROCEDURES
|
(a) EVALUATION OF DISCLOSURE CONTROLS AND PROCEDURES
– We have established disclosure controls and procedures (Disclosure Controls) to ensure that information required to be disclosed in the Company’s reports filed under the Securities Exchange Act of 1934, as amended, is recorded, processed, summarized and reported within the time periods specified in the U.S. Securities and Exchange Commission’s rules and forms. Disclosure Controls are also designed to ensure that such information is accumulated and communicated to management, including the Chief Executive Officer and Chief Financial Officer, as appropriate, to allow timely decisions regarding required disclosure. Our Disclosure Controls were designed to provide reasonable assurance that the controls and procedures would meet their objectives. Our management, including the Chief Executive Officer and Chief Financial Officer, does not expect that our Disclosure Controls will prevent all error and all fraud. A control system, no matter how well designed and operated, can provide only reasonable assurance of achieving the designed control objectives and management is required to apply its judgment in evaluating the cost-benefit relationship of possible controls and procedures. Because of the inherent limitations in all control systems, no evaluation of controls can provide absolute assurance that all control issues and instances of fraud, if any, within the Company have been detected. These inherent limitations include the realities that judgments in decision-making can be faulty and that breakdowns can occur because of simple error or mistake. Additionally, controls can be circumvented by the individual acts of some persons, by collusions of two or more people or by management override of the control. Because of the inherent limitations in a cost-effective, maturing control system, misstatements due to error or fraud may occur and not be detected.
As of the end of the period covered by this Form 10-K, we evaluated the effectiveness of the design and operations of our Disclosure Controls. The controls evaluation was done under the supervision and with the participation of management, including our Chief Executive Officer and Chief Financial Officer. Based on this evaluation, our Chief Executive Officer and Chief Financial Officer have concluded our Disclosure Controls were effective as of the end of the period covered by this Annual Report on Form 10-K.
(b) MANAGEMENT’S REPORT ON INTERNAL CONTROL OVER FINANCIAL REPORTING
– Management is responsible for establishing and maintaining adequate internal control over financial reporting for the Company, as such term is defined in Exchange Act Rules 13a-15(f). Under the supervision and with the participation of management, including our Chief Executive Officer and Chief Financial Officer, we conducted an evaluation of the effectiveness of our internal control over financial reporting as of April 30,
2013
based on the framework in “Internal Control – Integrated Framework” issued by the Committee of Sponsoring Organizations of the Treadway Commission (COSO).
Based on our assessment, management concluded that, as of April 30,
2013
, the Company’s internal control over financial reporting was effective based on the criteria set forth by COSO.
The Company’s external auditors that audited the consolidated financial statements included in Item 8, Deloitte & Touche LLP, an independent registered public accounting firm, have issued an audit report on the effectiveness of the Company’s internal control over financial reporting. This report appears near the beginning of Item 8.
(c) CHANGES IN INTERNAL CONTROL OVER FINANCIAL REPORTING
– During the quarter ended April 30,
2013
, there were no changes that materially affected, or are reasonably likely to materially affect, our internal control over financial reporting.
|
ITEM 9B.
|
OTHER INFORMATION
|
None.
|
88
|
H&R Block 2013 Form 10K
|
|
ITEM 10.
|
DIRECTORS, EXECUTIVE OFFICERS AND CORPORATE GOVERNANCE
|
The following information appearing in our definitive proxy statement, to be filed no later than 120 days after April 30,
2013
, is incorporated herein by reference:
|
n
|
Information appearing under the heading “Election of Directors”;
|
|
|
n
|
Information appearing under the heading “Section 16(a) Beneficial Ownership Reporting Compliance”; and
|
|
|
n
|
Information appearing under the heading “Board of Directors’ Meetings and Committees” regarding identification of the Audit Committee and Audit Committee financial experts.
|
|
We have adopted a Code of Business Ethics and Conduct that applies to our directors, officers and employees, including our Chief Executive Officer, Chief Financial Officer, principal accounting officer and persons performing similar functions. A copy of the Code of Business Ethics and Conduct is available on our website at
www.hrblock.com
. We intend to provide information on our website regarding amendments to, or waivers under, the Code of Business Ethics and Conduct.
Information about our executive officers is as follows:
|
Name, age
|
Current position
|
Business experience since May 1, 2008
|
||
|
William C. Cobb,
age 56
|
President and Chief Executive Officer
|
President and Chief Executive Officer since May 2011; retired from eBay, Inc. in 2008, having worked there from November 2000 to March 2008, where he most recently served as President of eBay Marketplaces North America for four years; before that, he held several senior management positions, including Senior Vice President and General Manager of eBay International and Senior Vice President of Global Marketing.
|
||
|
Gregory J. Macfarlane,
age 43
|
Chief Financial Officer
|
Chief Financial Officer since June 2012; Executive Vice President and Chief Financial Officer of Ceridian Corporation from March 2007 until August 2011.
|
||
|
Jeffrey T. Brown,
age 54
|
Chief Accounting and Risk Officer
|
Chief Accounting and Risk Officer since June 2012; Senior Vice President and Chief Financial Officer from September 2010 until June 2012; Interim Chief Financial Officer from May 2010 to September 2010; Vice President and Corporate Controller from March 2008 until September 2010; Assistant Vice President and Assistant Controller from August 2005 until March 2008.
|
||
|
Susan Ehrlich,
age 46
|
President, Financial Services
|
President, Financial Services since November 2011; Senior Vice President, JP Morgan Chase from July 2011 until October 2011; President, Sears Financial Services from November 2006 until July 2011.
|
||
|
Thomas A. Gerke,
age 57
|
Chief Legal Officer
|
Chief Legal Officer (formerly titled Senior Vice President and General Counsel) since January 2012; Executive Vice President, General Counsel and Secretary of YRC Worldwide from January 2011 until April 2011; Executive Vice Chairman, Century Link, Inc. from July 2009 until December 2010; President and Chief Executive Officer, Embarq Corporation (in an interim capacity from December 2007 until March 2008 and by appointment from March 2008 until June 2009); General Counsel – Law and External Affairs, Embarq Corporation from May 2006 until December 2007.
|
||
|
Jason Houseworth
,
age 38
|
President, Global Digital and Product Management
|
President, Global Digital and Product Management since May 2013; President, U.S. Tax Services since May 2012; Senior Vice President, Digital Tax Solutions from February 2011 until May 2012; Vice President, Technology from July 2008 until February 2011; employed by Swiss Re from July 2004 through July 2008, ending as Senior Vice President, Global Claims IT Leader.
|
||
|
ITEM 11.
|
EXECUTIVE COMPENSATION
|
The information called for by this item is contained in our definitive proxy statement filed pursuant to Regulation 14A not later than 120 days after April 30,
2013
, in the sections entitled “Director Compensation” and “Executive Compensation,” and is incorporated herein by reference.
|
ITEM 12.
|
SECURITY OWNERSHIP OF CERTAIN BENEFICIAL OWNERS AND MANAGEMENT AND RELATED STOCKHOLDER MATTERS
|
The information called for by this item is contained in Part II, Item 5 of this Form 10-K and in our definitive proxy statement filed pursuant to Regulation 14A not later than 120 days after April 30,
2013
, in the sections entitled “Equity Compensation Plans” and “Information Regarding Security Holders,” and is incorporated herein by reference.
|
H&R Block 2013 Form 10K
|
89
|
|
ITEM 13.
|
CERTAIN RELATIONSHIPS AND RELATED TRANSACTIONS, AND DIRECTOR INDEPENDENCE
|
The information called for by this item is contained in our definitive proxy statement filed pursuant to Regulation 14A not later than 120 days after April 30,
2013
, in the sections entitled “Employment Agreements, Change-in-Control and Other Arrangements,” “Review of Related Person Transactions,” and “Corporate Governance,” and is incorporated herein by reference.
|
ITEM 14.
|
PRINCIPAL ACCOUNTANT FEES AND SERVICES
|
The information called for by this item is contained in our definitive proxy statement filed pursuant to Regulation 14A not later than 120 days after April 30,
2013
, in the section entitled “Audit Fees,” and is incorporated herein by reference.
|
ITEM 15.
|
EXHIBITS AND FINANCIAL STATEMENT SCHEDULES
|
(a) Documents filed as part of this Report:
|
1.
|
The following financial statements appearing in Item 8: “Consolidated Statements of Income and Comprehensive Income,” “Consolidated Balance Sheets,” “Consolidated Statements of Cash Flows” and “Consolidated Statements of Stockholders’ Equity.”
|
|
|
2.
|
Exhibits – The list of exhibits in the Exhibit Index to this report is incorporated herein by reference.
|
|
|
90
|
H&R Block 2013 Form 10K
|
SIGNATURES
Pursuant to the requirements of Section 13 or 15(d) of the Securities Exchange Act of 1934, the registrant has duly caused this report to be signed on its behalf by the undersigned, thereunto duly authorized.
|
H&R BLOCK, INC.
|
|
/s/ William C. Cobb
|
|
William C. Cobb
|
|
President and Chief Executive Officer
|
|
June 26, 2013
|
Pursuant to the requirements of the Securities Exchange Act of 1934, this report has been signed below by the following persons on behalf of the registrant and in the capacities and on the date indicated on June 26,
2013
.
|
/s/ William C. Cobb
|
|
/s/ Gregory J. Macfarlane
|
/s/ Jeffrey T. Brown
|
|
|
William C. Cobb
|
Gregory J. Macfarlane
|
Jeffrey T. Brown
|
||
|
President, Chief Executive Officer
|
Chief Financial Officer
|
Chief Accounting and Risk Officer
|
||
|
and Director
|
(principal financial officer)
|
(principal accounting officer)
|
||
|
(principal executive officer)
|
||||
|
/s/ Robert A. Gerard
|
/s/ Paul J. Brown
|
/s/ Marvin R. Ellison
|
||
|
Robert A. Gerard
|
Paul J. Brown
|
Marvin R. Ellison
|
||
|
Director, Chairman of the Board
|
Director
|
Director
|
||
|
/s/ David B. Lewis
|
/s/ Victoria J. Reich
|
/s/ Bruce C. Rohde
|
||
|
David B. Lewis
|
Victoria J. Reich
|
Bruce C. Rohde
|
||
|
Director
|
Director
|
Director
|
||
|
/s/ Tom D. Seip
|
/s/ Christianna Wood
|
/s/ James F. Wright
|
||
|
Tom D. Seip
|
Christianna Wood
|
James F. Wright
|
||
|
Director
|
Director
|
Director
|
||
|
H&R Block 2013 Form 10K
|
91
|
EXHIBIT INDEX
The following exhibits are numbered in accordance with the Exhibit Table of Item 601 of Regulation S-K:
|
3.1
|
Amended and Restated Articles of Incorporation of H&R Block, Inc., as amended through September 30, 2010, filed as Exhibit 3.1 to the Company's annual report on Form 10-K for the year ended April 30, 2011, file number 1-6089, is incorporated herein by reference.
|
|
3.2
|
Amended and Restated Bylaws of H&R Block, Inc., as amended through June 18, 2013, filed as Exhibit 3.1 to the Company's current report on Form 8-K filed June 21, 2013, file number 1-6089, is incorporated herein by reference.
|
|
4.1
|
Indenture dated as of October 20, 1997, among H&R Block, Inc., Block Financial Corporation and Bankers Trust Company, as Trustee, filed as Exhibit 4(a) to the Company's quarterly report on Form 10-Q for the quarter ended October 31, 1997, file number 1-6089, is incorporated herein by reference.
|
|
4.2
|
First Supplemental Indenture, dated as of April 18, 2000, among H&R Block, Inc., Block Financial Corporation, Bankers Trust Company and the Bank of New York, filed as Exhibit 4(a) to the Company's current report on Form 8-K filed April 17, 2000, file number 1-6089, is incorporated herein by reference.
|
|
4.3
|
Officer's Certificate, dated October 26, 2004, in respect of 5.125% Notes due 2014 of Block Financial Corporation, filed as Exhibit 4.1 to the Company's current report on Form 8-K filed October 26, 2004, file number 1-6089, is incorporated herein by reference.
|
|
4.4
|
Officer's Certificate, dated October 25, 2012, in respect of 5.50% Notes due 2022 of Block Financial LLC, filed as Exhibit 4.1 to the Company's current report on Form 8-K filed October 25, 2012, file number 1-6089, is incorporated herein by reference.
|
|
4.5
|
Form of 5.125% Note due 2014 of Block Financial Corporation, filed as Exhibit 4.2 to the Company's current report on Form 8-K filed October 26, 2004, file number 1-6089, is incorporated herein by reference.
|
|
4.6
|
Form of 5.50% Note due 2022 of Block Financial LLC, filed as Exhibit 4.2 to the Company's current report on Form 8-K filed October 25, 2012, file number 1-6089, is incorporated herein by reference.
|
|
4.7
|
Form of Certificate of Designation, Preferences and Rights of Participating Preferred Stock of H&R Block, Inc., filed as Exhibit 4(e) to the Company's annual report on Form 10-K for the fiscal year ended April 30, 1995, file number 1-6089, is incorporated herein by reference.
|
|
4.8
|
Form of Certificate of Amendment of Certificate of Designation, Preferences and Rights of Participating Preferred Stock of H&R Block, Inc., filed as Exhibit 4(j) to the Company's annual report on Form 10-K for the fiscal year ended April 30, 1998, file number 1-6089, is incorporated herein by reference.
|
|
4.9
|
Form of Certificate of Designation, Preferences and Rights of Delayed Convertible Preferred Stock of H&R Block, Inc., filed as Exhibit 4(f) to the Company's annual report on Form 10-K for the fiscal year ended April 30, 1995, file number 1-6089, is incorporated herein by reference.
|
|
10.1
|
* 2013 Long-Term Incentive Plan, as amended and restated on March 6, 2013, filed as Exhibit 10.1 to the Company's quarterly report on Form 10-Q for the quarter ended January 31, 2013, file number 1-6089, is incorporated herein by reference.
|
|
10.2
|
* Form of 2013 Long Term Incentive Plan Award Agreement for Restricted Share Units, as approved on March 6, 2013, filed as Exhibit 10.2 to the Company's quarterly report on Form 10-Q for the quarter ended January 31, 2013, file number 1-6089, is incorporated herein by reference.
|
|
10.3
|
* Form of 2013 Long Term Incentive Plan Award Agreement for Non-Qualified Stock Options, as approved on March 6, 2013, filed as Exhibit 10.3 to the Company's quarterly report on Form 10-Q for the quarter ended January 31, 2013, file number 1-6089, is incorporated herein by reference.
|
|
10.4
|
* Form of 2013 Long Term Incentive Plan Award Agreement for Restricted Share Units, as approved on June 19, 2013, filed as Exhibit 10.3 to the Company's current report on Form 8-K filed June 21, 2013, file number 1-6089, is incorporated herein by reference.
|
|
10.5
|
* Form of 2013 Long Term Incentive Plan Award Agreement for Non-Qualified Stock Options, as approved on June 19, 2013, filed as Exhibit 10.4 to the Company's current report on Form 8-K filed June 21, 2013, file number 1-6089, is incorporated herein by reference.
|
|
10.6
|
* Form of 2013 Long Term Incentive Plan Award Agreement for Performance Share Units, as approved on June 19, 2013, filed as Exhibit 10.2 to the Company's current report on Form 8-K filed June 21, 2013, file number 1-6089, is incorporated herein by reference.
|
|
10.7
|
* Form of 2013 Long Term Incentive Plan Award Agreement for Market Stock Units, as approved on June 19, 2013, filed as Exhibit 10.1 to the Company's current report on Form 8-K filed June 21, 2013, file number 1-6089, is incorporated herein by reference.
|
|
10.8
|
* The Company's 2003 Long-Term Executive Compensation Plan, as amended September 30, 2010, filed as Exhibit 10.2 to the Company's quarterly report on Form 10-Q for the quarter ended October 31, 2010, file number 1-6089, is incorporated herein by reference.
|
|
10.9
|
* First Amendment to the Company's 2003 Long-Term Executive Compensation Plan, effective May 10, 2012, filed as Exhibit 10.1 to the Company's current report on Form 8-K filed May 11, 2012, file number 1-6089, is incorporated herein by reference.
|
|
10.10
|
* Form of 2003 Long-Term Executive Compensation Plan Grant Agreement for Performance Shares, filed as Exhibit 10.3 to the Company's quarterly report on Form 10-Q for the quarter ended July 31, 2011, file number 1-6089, is incorporated herein by reference.
|
|
10.11
|
* Form of 2003 Long-Term Executive Compensation Plan Grant Agreement for Stock Options, filed as Exhibit 10.2 to the Company's quarterly report on Form 10-Q for the quarter ended July 31, 2011, file number 1-6089, is incorporated herein by reference.
|
|
10.12
|
* Form of 2003 Long-Term Executive Compensation Plan Grant Agreement for Restricted Shares, filed as Exhibit 10.1 to the Company's quarterly report on Form 10-Q for the quarter ended July 31, 2011, file number 1-6089, is incorporated herein by reference.
|
|
10.13
|
* Form of 2003 Long-Term Executive Compensation Plan Grant Agreement for Market Stock Units as approved on June 20, 2012, filed as Exhibit 10.1 to the Company's current report on Form 8-K filed June 26, 2012, file number 1-6089, is incorporated herein by reference.
|
|
10.14
|
* Form of 2003 Long-Term Executive Compensation Plan Grant Agreement for Performance Share Units as approved on June 20, 2012, filed as Exhibit 10.2 to the Company's current report on Form 8-K filed June 26, 2012, file number 1-6089, is incorporated herein by reference.
|
|
10.15
|
* Form of 2003 Long-Term Executive Compensation Plan Grant Agreement for Stock Options as approved on June 20, 2012, filed as Exhibit 10.3 to the Company's current report on Form 8-K filed June 26, 2012, file number 1-6089, is incorporated herein by reference.
|
|
10.16
|
* Form of 2003 Long-Term Executive Compensation Plan Grant Agreement for Restricted Share Units as approved on June 20, 2012, filed as Exhibit 10.4 to the Company's current report on Form 8-K filed June 26, 2012, file number 1-6089, is incorporated herein by reference.
|
|
92
|
H&R Block 2013 Form 10K
|
|
10.17
|
* Letter Agreement between the Company, H&R Block Management, LLC and William C. Cobb, effective January 3, 2013, filed as Exhibit 10.5 to the Company's quarterly report on Form 10-Q for the quarter ended January 31, 2013, file number 1-6089, is incorporated herein by reference.
|
|
10.18
|
* Agreement between H&R Block Management, LLC, H&R Block, Inc. and William C. Cobb as of January 3, 2013 in connection with certain corrective actions relating to the June 30, 2011 Option Award, filed as Exhibit 10.1 to the Company's current report on Form 8-K filed January 4, 2013, file number 1-6089, is incorporated herein by reference.
|
|
10.19
|
* H&R Block, Inc. 2013 Long Term Incentive Plan Non-Qualified Stock Option Award Agreement between H&R Block, Inc. and William C. Cobb dated January 4, 2013, filed as Exhibit 10.2 to the Company's current report on Form 8-K filed January 4, 2013, file number 1-6089, is incorporated herein by reference.
|
|
10.20
|
* H&R Block, Inc. 2013 Long Term Incentive Plan Restricted Share Units Award Agreement between H&R Block, Inc. and William C. Cobb dated January 4, 2013, filed as Exhibit 10.3 to the Company's current report on Form 8-K filed January 4, 2013, file number 1-6089, is incorporated herein by reference.
|
|
10.21
|
* Grant Agreement between H&R Block, Inc. and William C. Cobb in connection with award of Restricted Shares as of May 2, 2011, filed as Exhibit 10.4 to the Company's quarterly report on Form 10-Q for the quarter ended July 31, 2011, file number 1-6089, is incorporated herein by reference.
|
|
10.22
|
* Grant Agreement between H&R Block, Inc. and William C. Cobb in connection with award of Stock Options as of May 2, 2011, filed as Exhibit 10.5 to the Company's quarterly report on Form 10-Q for the quarter ended July 31, 2011, file number 1-6089, is incorporated herein by reference.
|
|
10.23
|
* H&R Block Deferred Compensation Plan for Executives, as amended and restated on November 9, 2012, filed as Exhibit 10.4 to the Company's quarterly report on Form 10-Q for the quarter ended October 31, 2012, file number 1-6089, is incorporated herein by reference.
|
|
10.24
|
* The H&R Block Executive Performance Plan, as amended July 27, 2010, filed as Exhibit 10.6 to the Company's annual report on Form 10-K for the fiscal year ended April 30, 2011, file number 1-6089, is incorporated herein by reference.
|
|
10.25
|
* The H&R Block, Inc. 2000 Employee Stock Purchase Plan, as amended and restated effective January 1, 2013, filed as Appendix A to the Company's proxy statement on Schedule 14A for the fiscal year ended April 30, 2012, file number 1-6089, is incorporated herein by reference.
|
|
10.26
|
* The H&R Block, Inc. Executive Survivor Plan (as Amended and Restated January 1, 2001) filed as Exhibit 10.4 to the Company's quarterly report on Form 10-Q for the quarter ended October 31, 2000, file number 1-6089, is incorporated herein by reference.
|
|
10.27
|
* First Amendment to the H&R Block, Inc. Executive Survivor Plan (as Amended and Restated) effective as of July 1, 2002, filed as Exhibit 10.9 to the Company's annual report on Form 10-K for the fiscal year ended April 30, 2002, file number 1-6089, is incorporated herein by reference.
|
|
10.28
|
* Second Amendment to the H&R Block, Inc. Executive Survivor Plan (as Amended and Restated), effective as of March 12, 2003, filed as Exhibit 10.12 to the Company's annual report on Form 10-K for the fiscal year ended April 30, 2003, file number 1-6089, is incorporated herein by reference.
|
|
10.29
|
* H&R Block Severance Plan, as amended and restated on March 29, 2013.
|
|
10.30
|
* H&R Block Inc. Executive Severance Plan, as amended and restated effective July 27, 2010, filed as Exhibit 10.2 to the Company's quarterly report on Form 10-Q for the quarter ended July 31, 2010, file number 1-6089, is incorporated herein by reference.
|
|
10.31
|
* Employment Agreement dated April 27, 2011, between H&R Block Management, LLC and William C. Cobb, filed as Exhibit 10.2 to the Company's current report on Form 8-K filed April 29, 2011, file number 1-6089, is incorporated herein by reference.
|
|
10.32
|
* Separation and Release Agreement between the Company and C. E. Andrews dated March 6, 2012, filed as Exhibit 10.1 to the Company's current report on Form 8-K filed March 6, 2012, file number 1-6089, is incorporated herein by reference.
|
|
10.33
|
* Severance and Release Agreement between HRB Tax Group, Inc. and Philip L. Mazzini, effective June 12, 2012, filed as Exhibit 10.1 to the Company's current report on Form 8-K filed June 18, 2012, file number 1-6089, is incorporated herein by reference.
|
|
10.34
|
* Form of Indemnification Agreement with Directors and Officers, filed as Exhibit 10.2 to the Company's quarterly report on Form 10-Q for the quarter ended January 31, 2012, file number 1-6089, and Schedule of Parties to Indemnification Agreement filed as Exhibit 10.2 to the Company's quarterly report on Form 10-Q for the quarter ended January 31, 2012, file number 1-6089, as updated by the Company's current report on Form 8-K filed May 11, 2012, file number 1-6089, and Form 10-Q for the quarter ended January 31, 2013, file number 1-6089, are incorporated herein by reference.
|
|
10.35
|
* 2008 Deferred Stock Unit Plan for Outside Directors, as amended on September 14, 2011, filed as Exhibit 10.27 to the Company's annual report on Form 10-K for the year ended April 30, 2012, file number 1-6089, is incorporated herein by reference.
|
|
10.36
|
First Amended and Restated HSBC Settlements Products Servicing Agreement dated as of November 13, 2006 among Block Financial Corporation, HSBC Bank USA, National Association, HSBC Trust Company (Delaware), National Association, and HSBC Taxpayer Financial Services, Inc., filed as Exhibit 10.28 to the Company's quarterly report on Form 10-Q for the quarter ended January 31, 2007, file number 1-6089, is incorporated herein by reference. **
|
|
10.37
|
Credit and Guarantee Agreement dated as of August 17, 2012, among Block Financial LLC, H&R Block, Inc., the lenders party thereto from time to time and JPMorgan Chase Bank, N.A., as Administrative Agent, filed as Exhibit 10.1 to the Company's current report on Form 8-K filed August 20, 2012, file number 1-6089, is incorporated herein by reference.
|
|
10.38
|
Advances, Pledge and Security Agreement dated April 17, 2006, between H&R Block Bank and the Federal Home Loan Bank of Des Moines, filed as Exhibit 10.11 to the Company's quarterly report on Form 10-Q for the quarter ended October 31, 2007, file number 1-6089, is incorporated herein by reference.**
|
|
12
|
Computation of Ratio of Earnings to Fixed Charges for the five years ended April 30,
2013
.
|
|
21
|
Subsidiaries of the Company.
|
|
23
|
Consent of Deloitte & Touche LLP, Independent Registered Public Accounting Firm.
|
31.1 Certification by Chief Executive Officer pursuant to Section 302 of the Sarbanes-Oxley Act of 2002.
31.2 Certification by Chief Financial Officer pursuant to Section 302 of the Sarbanes-Oxley Act of 2002.
|
32.1
|
Certification by Chief Executive Officer pursuant to 18 U.S.C. 1350, as adopted by Section 906 of the Sarbanes-Oxley Act of 2002.
|
|
32.2
|
Certification by Chief Financial Officer pursuant to 18 U.S.C. 1350, as adopted by Section 906 of the Sarbanes-Oxley Act of 2002.
|
101.INS XBRL Instance Document
101.SCH XBRL Taxonomy Extension Schema
101.CAL XBRL Extension Calculation Linkbase
101.LAB XBRL Taxonomy Extension Label Linkbase
101.PRE XBRL Taxonomy Extension Presentation Linkbase
101.DEF XBRL Taxonomy Extension Definition Linkbase
|
H&R Block 2013 Form 10K
|
93
|
|
*
|
Indicates management contracts, compensatory plans or arrangements.
|
|
**
|
Confidential Information has been omitted from this exhibit and filed separately with the Commission pursuant to a confidential treatment request under Rule 24b-2.
|
|
94
|
H&R Block 2013 Form 10K
|
TABLE OF CONTENTS
Part IItem 1. BusinessItem 1A. Risk FactorsItem 1B. Unresolved Staff CommentsItem 2. PropertiesItem 3. Legal ProceedingsItem 4. Mine Safety DisclosuresPart IIItem 5. Market For The Registrant S Common Equity, Related Stockholder Matters and Issuer Purchases Of Equity SecuritiesItem 6. Selected Financial DataItem 7. Management S Discussion and Analysis Of Financial Condition and Results Of OperationsItem 7A. Quantitative and Qualitative Disclosures About Market RiskItem 8. Financial Statements and Supplementary DataNote 1: Summary Of Significant Accounting PoliciesNote 2: Earnings Per ShareNote 3: ReceivablesNote 4: Mortgage Loans Held For Investment and Related AssetsNote 5: InvestmentsNote 6: Property and EquipmentNote 7: Goodwill and Intangible AssetsNote 8: Customer Banking DepositsNote 9: Long-term DebtNote 10: Other Noncurrent Assets and LiabilitiesNote 11: Fair ValueNote 12: Stockholders EquityNote 13: Stock-based CompensationNote 14: Income TaxesNote 15: Interest Income and Interest ExpenseNote 16: Variable InterestsNote 17: Commitments and ContingenciesNote 18: Litigation and Related ContingenciesNote 19: Loss Contingencies Arising From Representations and Warranties Of Our Discontinued Mortgage OperationsNote 20: Discontinued OperationsNote 21: Regulatory Capital RequirementsNote 22: Segment InformationNote 23: Quarterly Financial Data (unaudited)Note 24: Condensed Consolidating Financial StatementsItem 9. Changes in and Disagreements with Accountants on Accounting and Financial DisclosureItem 9A. Controls and ProceduresItem 9B. Other InformationPart IIIItem 10. Directors, Executive Officers and Corporate GovernanceItem 11. Executive CompensationItem 12. Security Ownership Of Certain Beneficial Owners and Management and Related Stockholder MattersItem 13. Certain Relationships and Related Transactions, and Director IndependenceItem 14. Principal Accountant Fees and ServicesPart IVItem 15. Exhibits and Financial Statement Schedules