H&R BLOCK INC
10-Ks and 10-Qs
|
|
|
|
|
|
|
|
|
|
|
|
|
|
|
|
|
|
|
|
|
|
|
|
|
|
|
|
|
|
|
|
|
|
|
|
|
|
|
|
|
|
|
|
|
|
|
|
|
|
|
|
|
|
|
|
|
|
|
UNITED STATES
SECURITIES AND EXCHANGE COMMISSION
Washington, D.C. 20549
FORM 10-K
|
(Mark One)
|
|
|
|
þ
|
ANNUAL REPORT PURSUANT TO SECTION 13 OR 15(d) OF THE SECURITIES EXCHANGE ACT OF 1934
|
|
|
For the fiscal year ended April 30, 2017
|
||
|
OR
|
||
|
¨
|
TRANSITION REPORT PURSUANT TO SECTION 13 OR 15(d) OF THE SECURITIES EXCHANGE ACT OF 1934
|
|
|
For the transition period from to
|
||
Commission file number 1-06089

H&R Block, Inc.
(Exact name of registrant as specified in its charter)
|
MISSOURI
|
44-0607856
|
|
|
(State or other jurisdiction of
|
(I.R.S. Employer
|
|
|
incorporation or organization)
|
Identification No.)
|
|
One H&R Block Way, Kansas City, Missouri 64105
(Address of principal executive offices, including zip code)
(816) 854-3000
(Registrant's telephone number, including area code)
Securities registered pursuant to Section 12(b) of the Act:
|
Title of each class
|
Name of each exchange on which registered
|
|
|
Common Stock, without par value
|
New York Stock Exchange
|
|
Securities registered pursuant to Section 12(g) of the Act:
Common Stock, without par value
(Title of Class)
Indicate by check mark whether the registrant is a well-known seasoned issuer as defined in Rule 405 of the Securities Act. Yes
þ
No
¨
Indicate by check mark if the registrant is not required to file reports pursuant to Section 13 or 15(d) of the Act. Yes
¨
No
þ
Indicate by check mark whether the registrant (1) has filed all reports required to be filed by Section 13 or 15(d) of the Securities Exchange Act of 1934 during the preceding 12 months (or for such shorter period that the registrant was required to file such reports), and (2) has been subject to such filing requirements for the past 90 days. Yes
þ
No
¨
Indicate by check mark whether the registrant has submitted electronically and posted on its corporate Web site, if any, every Interactive Data File required to be submitted and posted pursuant to Rule 405 of Regulation S-T (§232.405 of this chapter) during the preceding 12 months (or for such shorter period that the registrant was required to submit and post such files). Yes
þ
No
¨
Indicate by check mark if disclosure of delinquent filers pursuant to Item 405 of Regulation S-K is not contained herein, and will not be contained, to the best of registrant's knowledge, in definitive proxy or information statements incorporated by reference in Part III of this Form 10-K or any amendment to this Form 10-K.
¨
Indicate by check mark whether the registrant is a large accelerated filer, an accelerated filer, a non-accelerated filer or a smaller reporting company. See definitions of "large accelerated filer," "accelerated filer," "smaller reporting company," and "emerging growth company" in Rule 12b-2 of the Exchange Act.
Large accelerated filer
þ
Accelerated filer
¨
Non-accelerated filer
¨
Smaller reporting company
¨
Emerging growth company
¨
(Do not check if a smaller reporting company)
If an emerging growth company, indicate by check mark if the registrant has elected not to use the extended transition period for complying with any new or revised financial accounting standards provided pursuant to Section 13(a) of the Exchange Act.
¨
Indicate by check mark whether the registrant is a shell company (as defined in Rule 12b-2 of the Exchange Act). Yes
¨
No
þ
The aggregate market value of the registrant's Common Stock (all voting stock) held by non-affiliates of the registrant, computed by reference to the price at which the stock was sold on
October 31, 2016
, was
$4,806,004,628
.
Number of shares of the registrant's Common Stock, without par value, outstanding on
May 31, 2017
:
207,178,139
.
Documents incorporated by reference
The definitive proxy statement for the registrant's Annual Meeting of Shareholders, to be held September 14,
2017
, is incorporated by reference in Part III to the extent described therein.
2017
FORM 10-K AND ANNUAL REPORT
TABLE OF CONTENTS
|
INTRODUCTION AND FORWARD-LOOKING STATEMENTS
|
||
|
ITEM 1.
|
BUSINESS
|
|
|
ITEM 1A.
|
RISK FACTORS
|
|
|
ITEM 1B.
|
UNRESOLVED STAFF COMMENTS
|
|
|
ITEM 2.
|
PROPERTIES
|
|
|
ITEM 3.
|
LEGAL PROCEEDINGS
|
|
|
ITEM 4.
|
MINE SAFETY DISCLOSURES
|
|
|
ITEM 5.
|
MARKET FOR REGISTRANT'S COMMON EQUITY, RELATED STOCKHOLDER MATTERS AND ISSUER PURCHASES OF EQUITY SECURITIES
|
|
|
ITEM 6.
|
SELECTED FINANCIAL DATA
|
|
|
ITEM 7.
|
MANAGEMENT'S DISCUSSION AND ANALYSIS OF FINANCIAL CONDITION AND RESULTS OF OPERATIONS
|
|
|
ITEM 7A.
|
QUANTITATIVE AND QUALITATIVE DISCLOSURES ABOUT MARKET RISK
|
|
|
ITEM 8.
|
FINANCIAL STATEMENTS AND SUPPLEMENTARY DATA
|
|
|
ITEM 9.
|
CHANGES IN AND DISAGREEMENTS WITH ACCOUNTANTS ON ACCOUNTING AND FINANCIAL DISCLOSURE
|
|
|
ITEM 9A.
|
CONTROLS AND PROCEDURES
|
|
|
ITEM 9B.
|
OTHER INFORMATION
|
|
|
ITEM 10.
|
DIRECTORS, EXECUTIVE OFFICERS AND CORPORATE GOVERNANCE
|
|
|
ITEM 11.
|
EXECUTIVE COMPENSATION
|
|
|
ITEM 12.
|
SECURITY OWNERSHIP OF CERTAIN BENEFICIAL OWNERS AND MANAGEMENT AND RELATED STOCKHOLDER MATTERS
|
|
|
ITEM 13.
|
CERTAIN RELATIONSHIPS AND RELATED TRANSACTIONS, AND DIRECTOR INDEPENDENCE
|
|
|
ITEM 14.
|
PRINCIPAL ACCOUNTANT FEES AND SERVICES
|
|
|
ITEM 15.
|
EXHIBITS AND FINANCIAL STATEMENT SCHEDULES
|
|
|
SIGNATURES
|
||
|
EXHIBIT INDEX
|
||
INTRODUCTION
"H&R Block," "the Company," "we," "our" and "us" are used interchangeably to refer to H&R Block, Inc. or to H&R Block, Inc. and its subsidiaries, as appropriate to the context.
Specified portions of our proxy statement are "incorporated by reference" in response to certain items. Our proxy statement will be made available to shareholders no later than 120 days after April 30,
2017
, and will also be available on our website at
www.hrblock.com
.
FORWARD-LOOKING STATEMENTS
This report and other documents filed with the Securities and Exchange Commission (SEC) may contain forward-looking statements. In addition, our senior management may make forward-looking statements orally to analysts, investors, the media and others. Forward-looking statements can be identified by the fact that they do not relate strictly to historical or current facts. They often include words or variation of words such as "expects," "anticipates," "intends," "plans," "believes," "seeks," "estimates," "projects," "forecasts," "targets," "would," "will," "should," "could," "may" or other similar expressions. Forward-looking statements provide management's current expectations or predictions of future conditions, events or results. All statements that address operating performance, events or developments that we expect or anticipate will occur in the future are forward-looking statements. They may include estimates of revenues, income, earnings per share, capital expenditures, dividends, stock repurchase, liquidity, capital structure, market share, industry volumes or other financial items, descriptions of management's plans or objectives for future operations, services or products, or descriptions of assumptions underlying any of the above. All forward-looking statements speak only as of the date they are made and reflect the Company's good faith beliefs, assumptions and expectations, but they are not guarantees of future performance or events. Furthermore, the Company disclaims any obligation to publicly update or revise any forward-looking statement to reflect changes in underlying assumptions, factors, or expectations, new information, data or methods, future events or other changes, except as required by law.
By their nature, forward-looking statements are subject to risks and uncertainties that could cause actual results to differ materially from those suggested by the forward-looking statements. Factors that might cause such differences include, but are not limited to, a variety of economic, competitive, operational and regulatory factors, many of which are beyond the Company's control. Investors should understand that it is not possible to predict or identify all such factors and, consequently, should not consider any such list to be a complete set of all potential risks or uncertainties.
Details about risks, uncertainties and assumptions that could affect various aspects of our business are included throughout this Form 10-K. Investors should carefully consider all of these risks, and should pay particular attention to
Item 1A
, "Risk Factors," and Item 7 under "Critical Accounting Estimates" of this Form 10-K.
GENERAL DEVELOPMENT OF BUSINESS
H&R Block, Inc. was organized as a corporation in 1955 under the laws of the State of Missouri and has subsidiaries that provide tax preparation and other services. A complete list of our subsidiaries as of April 30,
2017
can be found in Exhibit 21.
We provide assisted income tax return preparation, digital do-it-yourself (DIY) tax solutions and other services and products related to income tax return preparation to the general public primarily in the United States (U.S.), Canada, Australia, and their respective territories.
RECENT DEVELOPMENTS
–
Refund Advance Loans.
We began offering interest-free Refund Advance loans (RAs) during the 2017 tax season. RAs were available to eligible assisted U.S. tax preparation clients of the Company and participating franchise locations. On October 25, 2016, subsidiaries of the Company entered into a Refund Advance Program Agreement with MetaBank, a federal savings bank (MetaBank), and Specialty Consumer Services, L.P., a Texas limited partnership (SCS), pursuant to which MetaBank originated RAs and SCS provided technology, software, and underwriting support services.
|
H&R Block, Inc.
| 2017 Form 10-K
|
1
|
MetaBank and BofI Federal Bank (BofI) provided funding for the loans, with BofI also performing certain disbursement and repayment services.
RAs were offered in amounts of $500, $750 or $1,250, based on client eligibility as determined by the loan originator. We paid loan origination fees of
$28.6 million
to MetaBank based on volume and customer type which is approximately $32 to $36 on average for each funded loan. The loan origination fees were intended to cover expected loan losses and payments to capital providers, among other items. In addition, Block Financial LLC (Block Financial) provided MetaBank and BofI with limited guaranties up to $73 million in the aggregate, subject to specified thresholds, which would cover certain incremental loan losses. At April 30, 2017, we had accrued an estimated liability of
$0.7 million
related to the RA program.
FINANCIAL INFORMATION ABOUT INDUSTRY SEGMENTS
We operate as a single segment that includes all of our continuing operations, which are designed to enable clients to obtain tax preparation services seamlessly. See discussion below and in
Item 8
,
note 15
to the consolidated financial statements.
DESCRIPTION OF BUSINESS
GENERAL
– We provide assisted and DIY tax return preparation solutions through multiple channels (including in-person, online and mobile applications, and desktop software) and distribute H&R Block-branded financial products and services, including those of our financial partners, to the general public primarily in the U.S., Canada, Australia, and their respective territories. Major revenue sources include fees earned for tax preparation and related services performed at company-owned retail tax offices, royalties from franchisees, sales of desktop tax preparation software, fees for online tax preparation services and fees from complementary services and products. By offering assisted and DIY tax solutions through multiple channels, we seek to serve our clients in the manner they choose to be served.
Tax Returns Prepared.
During fiscal year
2017
,
23.0 million
tax returns were prepared by and through H&R Block worldwide, a decline of
0.6%
from
23.1 million
in fiscal year
2016
and
24.1 million
in fiscal year
2015
. In the U.S.,
19.5 million
tax returns were prepared by and through H&R Block during fiscal year
2017
, compared to
19.7 million
in
2016
and
20.6 million
in
2015
.
U.S. tax returns prepared by and through us during the
2017
tax season, including those prepared by our franchisees and through our DIY solutions, constituted approximately
14%
of an Internal Revenue Service (IRS) estimate of total individual income tax returns filed during the
2017
tax season, compared to approximately
14%
in the prior year. See
Item 7
, under "Results of Operations," for further discussion of changes in the number of tax returns prepared.
ASSISTED
– Assisted income tax return preparation and related services are provided by tax professionals via a system of retail offices operated directly by us or our franchisees or virtually via the internet.
Offices.
During the
2017
tax season, we, together with our franchisees, operated in
10,036
offices across the U.S. at the peak of the tax season, compared to
10,213
in the prior year. A summary of our company-owned and franchise offices is included in
Item 7
, under "Operating Statistics."
Franchises.
We offer franchises as a way to expand our presence in certain geographic areas. Our franchise arrangements provide us with certain rights designed to protect our brand. Most of our franchisees receive, among other things, the right to use our trademarks and software, access to product offerings and expertise, signs, specialized forms, advertising, and initial and ongoing training and advisory services. Our franchisees pay us approximately 30% of gross tax return preparation and related service revenues as a franchise royalty in the U.S. Our franchise arrangements typically include a ten-year term and do not provide for automatic renewal.
From time to time, we have sold certain company-owned offices to existing franchisees or have acquired the assets of existing franchisees and other tax return preparation businesses, and may continue to do so if future conditions warrant and satisfactory terms can be negotiated.
DO-IT-YOURSELF
– We develop and market DIY income tax preparation software. We offer a comprehensive range of DIY tax services, including preparation of federal and state income tax returns, review of tax returns by a tax professional, access to tax tips, advice and tax-related news, use of calculators for tax planning, error checking and electronic filing. Our online software may be accessed through our website at
www.hrblock.com
, while our desktop software may be purchased online, through third-party retail stores or via direct mail
.
|
2
|
2017 Form 10-K |
H&R Block, Inc.
|
We are a member of Free File, Inc. (FF), formerly known as the Free File Alliance. This organization was created by the tax return preparation industry and the IRS, and allows qualified filers with an adjusted gross income of
$64,000
or less to prepare and file their federal return online at no charge. We believe this program provides a valuable public service and increases our visibility with new clients.
We develop and offer applications for mobile devices which provide tax return preparation solutions and related services and products to clients, including tools that complement our other tax preparation services and products.
OTHER OFFERINGS
– In addition to our tax services and products, we also offer U.S. clients a number of additional services, including refund transfers (RTs), H&R Block Emerald Advance
®
lines of credit (EAs), H&R Block Emerald Prepaid MasterCard
®
, our Peace of Mind
®
Extended Service Plan (POM), Tax Identity Shield
®
(TIS), RAs and, for our Canadian clients, an Instant Cash Back® refund option.
Refund Transfers.
RTs enable clients to receive their tax refunds by their chosen method of disbursement and include a feature enabling clients to deduct tax preparation and service fees from their tax refunds. Clients may choose to receive their RT proceeds by direct deposit to a deposit account, by a load to their H&R Block Emerald Prepaid MasterCard
®
or by receiving a check. RTs are available to U.S. clients and are frequently obtained by those who (1) do not have bank accounts into which the IRS can direct deposit their refunds; (2) like the convenience and benefits of a temporary account for receipt of their refund; or (3) prefer to have their tax preparation fees paid directly out of their refunds. RTs are offered through our relationship with BofI. We offer a similar program to our Canadian clients, referred to as H&R Block Pay With Refund
®
.
H&R Block Emerald Advance® Lines of Credit.
EAs are lines of credit offered to clients in our offices, typically from late November through December, currently in an amount not to exceed $1,000. If the borrower meets certain criteria as agreed in the loan terms, the line of credit can be utilized year-round. In addition to the required monthly payments, borrowers may elect to pay down balances on EAs with their tax refunds. These lines of credit are offered by BofI, and we subsequently purchase a participation interest in the outstanding balances.
H&R Block Emerald Prepaid Mastercard®.
The H&R Block Emerald Prepaid MasterCard
®
enables clients to receive their tax refunds from the IRS directly on a prepaid debit card, or to direct RT or EA proceeds to the card. The card can be used for everyday purchases, bill payments and ATM withdrawals anywhere MasterCard
® (
MasterCard is a registered trademark of MasterCard International Incorporated) is accepted. Additional funds can be added to the card year-round through direct deposit or at participating retail locations. We distribute the H&R Block Emerald Prepaid MasterCard
®
issued by BofI.
Peace of Mind® Extended Service Plan.
In addition to our standard guarantee, we offer POM to U.S. and Canadian clients, whereby we (1) represent our clients if they are audited by the IRS or Canada Revenue Agency (CRA), and (2) assume the cost, subject to certain limits, of additional taxes owed by a client resulting from errors attributable to H&R Block. The additional taxes paid under POM have a cumulative limit of
$6,000
for U.S. clients and $3,000CAD for Canadian clients with respect to the federal, state and local tax returns we prepared for applicable clients during the taxable year protected by POM.
Tax Identity Shield®.
This service program offers clients assistance obtaining additional IRS identity protection, when eligible, to better protect against unauthorized third parties filing a fraudulent tax return with their information. TIS also includes a pre-tax season identity theft risk assessment, notification if their information is detected on a tax return filed through H&R Block and access to services to help restore their tax identity if necessary.
Refund Advance Loans.
RAs are interest-free loans available to eligible assisted U.S. tax preparation clients in company-owned and participating franchise locations. In tax season 2017, RAs were offered in amounts of $500, $750 or $1,250, based on client eligibility as determined by MetaBank.
Instant Cash Back®.
Our Canadian operations advance refunds due to certain clients from the CRA, for a fee. The fee charged for this service is mandated by federal legislation which is administered by the CRA. The client assigns to us the full amount of the tax refund to be issued by the CRA and the refund amount is then sent by the CRA directly to us.
SEASONALITY OF BUSINESS
– Because most of our clients file their tax returns during the period from January through April of each year, a substantial majority of our revenues from income tax return preparation and related
|
H&R Block, Inc.
| 2017 Form 10-K
|
3
|
services and products are earned during this period. As a result, we generally operate at a loss through a majority of the fiscal year.
COMPETITIVE CONDITIONS
– We provide both assisted and DIY tax preparation services and products and face substantial competition in and across each category. There are a substantial number of tax return preparation firms and accounting firms offering tax return preparation services, and we face significant competition from independent tax preparers and certified public accountants. Many tax return preparation firms are involved in providing electronic filing services and RTs or similar services to the public. Tax return preparation firms are highly competitive with regard to price and service, and many firms offer services that may include preparation of tax returns at no charge. Our assisted tax preparation business also faces competition from firms offering DIY tax preparation services and products.
Our DIY tax solutions include various forms of digital electronic assistance, including online and mobile applications and desktop software. Many other companies offer digital and online tax preparation services, including Intuit Inc., our largest competitor offering such services. Like all tax return preparation services and products, price and marketing competition for digital tax preparation services is intense among value and premium product offerings and many firms offer digital services and products at no charge. Our DIY tax solutions also compete with in-office tax preparation services. U.S. federal and certain state and foreign taxing authorities also currently offer, or facilitate the offering of, tax return preparation and filing options to taxpayers at no charge.
In terms of the number of offices and revenues, we believe we are the largest single provider of tax return preparation solutions and electronic filing services in the U.S. In terms of the number of tax returns prepared, we believe we are the second largest provider in the U.S. We also believe we operate the largest tax return preparation businesses in Canada and Australia.
GOVERNMENT REGULATION
–
TAX PREPARERS
– Our tax preparation business is subject to various forms of government regulation, including the following:
U.S. Federal Tax Preparer Regulations.
U.S. federal legislation requires income tax return preparers to, among other things, set forth their signatures and identification numbers, including their Preparer Tax Identification Number (PTIN), on all tax returns prepared by them and retain all tax returns prepared by them for three years. U.S. federal laws also subject income tax return preparers to accuracy-related penalties in connection with the preparation of income tax returns. Preparers may be prohibited from continuing to act as income tax return preparers if they repeatedly engage in specified misconduct.
The U.S. federal government regulates the electronic filing of income tax returns in part by requiring electronic filers to comply with all publications and notices of the IRS applicable to electronic filing. We are required to provide certain electronic filing information to taxpayers and comply with advertising standards for electronic filers. We are also subject to possible monitoring by the IRS, and if deemed appropriate, the IRS could impose various penalties, including penalties for improper disclosure or use of taxpayer information, other preparer penalties or suspension from the IRS electronic filing program.
Financial Consumer Protection and Privacy Regulations.
The Gramm-Leach-Bliley Act and related Consumer Financial Protection Bureau (CFPB) and Federal Trade Commission (FTC) regulations require income tax preparers to (1) adopt and disclose consumer privacy notices, (2) provide consumers a reasonable opportunity to control (via "opt-out") whether their nonpublic personal information is disclosed to unaffiliated third-parties (subject to certain exceptions), and (3) implement reasonable safeguards to protect the security and confidentiality of nonpublic personal information. In addition, the IRS generally prohibits the use or disclosure of taxpayer information by tax return preparers for purposes other than tax return preparation without the prior written consent of the taxpayer. The CFPB may issue regulations that apply to our subsidiaries, or certain of our third party service providers that provide consumer financial services and products. The CFPB may examine, and take enforcement actions against, our subsidiaries or our third party service providers. See Item 1A, "Risk Factors," for further information on the CFPB and its recent actions.
State Regulations.
Certain states have privacy laws and regulations in addition to the U.S. federal regulations described above. Most states also have data security breach notice laws which may require notice to impacted individuals and others if there is unauthorized access to certain sensitive personal information. Several states require income tax return preparers to, among other things, register as a return preparer and comply with certain registration requirements such as testing and continuing education requirements. State regulations may also subject income tax
|
4
|
2017 Form 10-K |
H&R Block, Inc.
|
return preparers to accuracy-related penalties in connection with the preparation of income tax returns, and may prohibit preparers from continuing to act as income tax return preparers if they engage in specified misconduct. Certain states have regulations and requirements relating to offering income tax courses. These requirements may include licensing, bonding and certain restrictions on advertising.
Franchise Regulations.
Many of the income tax return preparation offices operating in the U.S. under the name "H&R Block" are operated by franchisees. Our franchising activities are subject to the rules and regulations of the FTC, potential enforcement by the CFPB, and various state laws regulating the offer and sale of franchises. The FTC and various state laws require us to furnish to prospective franchisees a franchise disclosure document containing certain prescribed information. A number of states in which we are currently franchising regulate the sale of franchises and require registration of the franchise disclosure document with certain state authorities. We are currently operating under exemptions from registration in several of these states based on our net worth and experience. Substantive state laws regulating the franchisor/franchisee relationship presently exist in a large number of states, and bills have been introduced in Congress from time to time that would provide for federal regulation of the franchisor/franchisee relationship in certain respects. The state laws often limit, among other things, the duration and scope of non-competition provisions, the ability of a franchisor to terminate or refuse to renew a franchise and the ability of a franchisor to designate sources of supply. From time to time, we may make appropriate amendments to our franchise disclosure document to comply with our disclosure obligations under U.S. federal and state laws.
FOREIGN REGULATIONS
– We are also subject to a variety of other regulations in various foreign markets, including anti-corruption laws, and regulations concerning privacy, data protection and data retention. Foreign regulations and laws potentially affecting our business are evolving rapidly. We rely on external and internal counsel in the countries in which we do business to advise us regarding compliance with applicable laws and regulations. As our international operations grow, we continue to develop and enhance our internal legal and operational compliance programs that guide our businesses in complying with laws and regulations applicable in the countries in which we do business.
SERVICE MARKS, TRADEMARKS AND PATENTS
We have made a practice of offering our services and products under service marks and trademarks and of securing registration for many of these marks in the U.S. and other countries where our services and products are marketed. We consider these service marks and trademarks, in the aggregate, to be of material importance to our business, particularly our businesses providing services and products under the "H&R Block" brand. The initial duration of U.S. federal trademark registrations is 10 years. Most U.S. federal registrations can be renewed perpetually at 10-year intervals and remain enforceable so long as the marks continue to be used.
We hold a small but growing patent portfolio that we believe is important to our overall competitive position, although we are not materially dependent on any one patent or particular group of patents in our portfolio at this time. Our patents have remaining terms generally ranging from one to 20 years.
EMPLOYEES AND EXECUTIVE OFFICERS
We had approximately
2,300
regular full-time employees as of April 30,
2017
. Our business is dependent on the availability of a seasonal workforce, including tax professionals, and our ability to hire, train, and supervise these employees. The highest number of persons we employed during the fiscal year ended April 30,
2017
, including these seasonal employees, was approximately
87,500
.
|
H&R Block, Inc.
| 2017 Form 10-K
|
5
|
Information about our executive officers is as follows:
|
Name, age
|
Current position
|
Business experience since May 1, 2012
|
||
|
William C. Cobb,
age 60
|
President and Chief Executive Officer
|
President and Chief Executive Officer since May 2011 (retiring effective July 31, 2017); retired from eBay, Inc. in 2008, having worked there from November 2000 to March 2008, where he most recently served as President of eBay Marketplaces North America for four years; before that, he held several senior management positions, including Senior Vice President and General Manager of eBay International and Senior Vice President of Global Marketing.
|
||
|
Tony G. Bowen,
age 42
|
Chief Financial Officer
|
Chief Financial Officer since May 2016; Vice President, U.S. Tax Services Finance from May 2013 through April 2016; Vice President, Digital GM from May 2012 until May 2013; Vice President, Digital CFO from July 2011 until May 2012; Assistant Vice President of Corporate Development from October 2009 until July 2011.
|
||
|
Kellie J. Logerwell,
age 47
|
Chief Accounting Officer
|
Chief Accounting Officer since July 2016; Vice President of Corporate and Field Accounting from December 2014 until July 2016; Assistant Controller from December 2010 until December 2014.
|
||
|
Kathryn M. Collins
,
age 53 |
Senior Vice President and Chief Marketing Officer
|
Senior Vice President and Chief Marketing Officer since May 2016; Chief Marketing Officer from October 2013 through April 2016; Vice President, Retail Marketing from July 2012 until October 2013; Vice President, Marketing Communications and Brand Management from January 2006 until July 2012. Prior to 2006, Ms. Collins held various positions at Lee Jeans, a division of VF Corporation.
|
||
|
Thomas A. Gerke,
age 61
|
General Counsel and Chief Administrative Officer
|
General Counsel and Chief Administrative Officer since May 2016; Chief Legal Officer (formerly titled Senior Vice President and General Counsel) from January 2012 through April 2016; Executive Vice President, General Counsel and Secretary of YRC Worldwide from January 2011 until April 2011; Executive Vice Chairman, Century Link, Inc. from July 2009 until December 2010; President and Chief Executive Officer, Embarq Corporation (in an interim capacity from December 2007 until March 2008 and by appointment from March 2008 until June 2009). Mr. Gerke will serve as President and Chief Executive Officer (in an interim capacity) beginning August 1, 2017, until the position is filled permanently.
|
||
AVAILABILITY OF REPORTS AND OTHER INFORMATION
Our annual report on Form 10-K, quarterly reports on Form 10-Q, current reports on Form 8-K and all amendments to those reports filed with or furnished to the SEC are available, free of charge, through our website at
www.hrblock.com
as soon as reasonably practicable after such reports are electronically filed with or furnished to the SEC. The public may read and copy any materials we file with the SEC at the SEC's Public Reference Room at 100 F Street, NE, Washington, DC 20549. The public may obtain information on the operation of the Public Reference Room by calling the SEC at 1-800-SEC-0330. The SEC maintains a website at
www.sec.gov
containing reports, proxy and information statements and other information regarding issuers who file electronically with the SEC.
The following corporate governance documents are posted on our website at
www.hrblock.com:
|
▪
|
The Amended and Restated Articles of Incorporation of H&R Block, Inc.;
|
|
▪
|
The Amended and Restated Bylaws of H&R Block, Inc.;
|
|
▪
|
The H&R Block, Inc. Corporate Governance Guidelines;
|
|
▪
|
The H&R Block, Inc. Code of Business Ethics and Conduct;
|
|
▪
|
The H&R Block, Inc. Board of Directors Independence Standards;
|
|
▪
|
The H&R Block, Inc. Audit Committee Charter;
|
|
▪
|
The H&R Block, Inc. Compensation Committee Charter;
|
|
▪
|
The H&R Block, Inc. Finance Committee Charter; and
|
|
▪
|
The H&R Block, Inc. Governance and Nominating Committee Charter.
|
If you would like a printed copy of any of these corporate governance documents, please send your request to H&R Block, Inc., One H&R Block Way, Kansas City, Missouri 64105, Attention: Corporate Secretary.
Information contained on our website does not constitute any part of this report.
|
6
|
2017 Form 10-K |
H&R Block, Inc.
|
Our business activities expose us to a variety of risks. Identification, monitoring and management of these risks are essential to the success of our operations and the financial soundness of H&R Block. Senior management and the Board of Directors, acting as a whole and through its committees, take an active role in our risk management process and have delegated certain activities related to the oversight of risk management to the Company's Risk Committee, which is comprised of senior managers of major businesses and control functions. The Risk Committee is responsible for identifying and monitoring risk exposures and leading the continued development of our risk management policies and practices.
An investment in our securities involves risk, including the risk that the value of that investment may decline or that returns on that investment may fall below expectations. There are a number of significant factors that could cause actual conditions, events or results to differ materially from those described in forward-looking statements, many of which are beyond management's control or its ability to accurately estimate or predict, or that could adversely affect our financial position, results of operations, cash flows and the value of an investment in our securities.
RISKS RELATING TO CONTINUING OPERATIONS
Increased competition for tax preparation clients could adversely affect our current market share and profitability. Offers of free tax preparation services could adversely affect our revenues and profitability.
We provide both assisted and DIY tax preparation services and products and face substantial competition throughout our businesses. All categories in the tax return preparation industry are highly competitive and additional competitors have entered, and in the future may enter, the market to provide tax preparation products or services. In the assisted tax services category, there are a substantial number of tax return preparation firms and accounting firms offering tax return preparation services. Commercial tax return preparers are highly competitive with regard to price and service. In the DIY category, options include various forms of digital electronic assistance, including online and mobile applications, and desktop software, all of which we offer. Our DIY services and products compete with a number of online and software companies, primarily on price and functionality. Individual tax filers may elect to change their tax preparation method, choosing from among various assisted and DIY offerings. Technology advances quickly and in new and unexpected ways, and it is difficult to predict the manner in which these changes will impact the tax return preparation industry, the problems we may encounter in enhancing our products and services or the time and resources we may need to devote to the creation, support, and maintenance of technological enhancements. If we are slow to enhance our products, services, or technologies, if our competitors are able to achieve results more quickly than us, or if there are new and unexpected entrants into the industry, we may fail to capture, or lose, a significant share of the market. Additionally, we and many other tax return preparation firms are involved in providing one or more of RTs, other financial products and services, and other tax-related services and products, many of which are subject to regulatory scrutiny, litigation, and other risks. We can make no assurances that we will be able to offer, or continue to offer, all of these services and a failure to do so could negatively impact our financial results and ability to compete. Intense competition could result in a reduction of our market share, lower revenues, lower margins and lower profitability.
U.S. federal, state and foreign governmental authorities in certain jurisdictions in which we operate currently offer, or facilitate the offering of, tax return preparation and electronic filing options to taxpayers at no charge, and certain volunteer organizations also prepare tax returns at no charge for low-income taxpayers. In addition, many of our competitors offer certain tax preparation services and products at no charge. In order to compete, we have offered certain, and may in the future offer additional, tax preparation services and related products at no charge. There can be no assurance that we will be able to attract clients or effectively ensure the migration of clients from our free tax service offerings to those for which we receive fees, and clients who have formerly paid for our tax service offerings may elect to use free offerings instead. These competitive factors may diminish our revenue and profitability, or harm our ability to acquire and retain clients.
Government tax authorities, volunteer organizations, and our competitors may also elect to implement or expand free offerings in the future. From time to time, U.S. federal and state governments have considered various proposals (often referred to as "Return-Free Filing" or "Pre-Populated Returns") through which the respective governmental taxing authorities would use taxpayer information provided by employers, financial institutions, and other payers to "pre-populate," prepare and calculate tax returns and distribute them to taxpayers. Under this approach, the taxpayer
|
H&R Block, Inc.
| 2017 Form 10-K
|
7
|
could then review and contest the return or sign and return it. While the FF and other free options that are currently offered, or may be offered in the future, may reduce the perceived need for government tax service offerings, they foster additional online competition and may cause us to lose significant revenue opportunities. We believe that governmental encroachment at both the U.S. federal and state levels, as well as comparable government levels in foreign jurisdictions in which we operate, could present a continued competitive threat to our business for the foreseeable future.
Failure to comply with laws and regulations that protect our clients' and employees' personal information could harm our brand and reputation and could result in significant fines, penalties, and damages.
In the course of our business, we collect, use, and retain large amounts of personal client information and data, including tax return information, financial account information, and social security numbers. In addition, we collect and maintain personal information of our employees in the ordinary course of our business. Our third-party vendors may hold some personal information and third parties may execute transactions utilizing this information. We use security and business controls to limit access to and use of personal information, but unauthorized individuals or third parties may be able to circumvent these security and business measures, which could cause us to determine that it is required or advisable for us to notify affected clients or employees under applicable privacy laws and regulations. In the normal course of their duties, some full-time and temporary employees, as well as some contractors and third-party vendors, may have access to the personal information of clients and employees or execute transactions requiring sensitive information. While we conduct employee background checks, as allowed by law, and limit access to systems and data, it is possible that one or more of these controls could be circumvented. In addition, though we impose certain requirements and controls on our third-party vendors, it is possible that our third-party vendors may not appropriately employ the controls that we require of them. Improper disclosure or use of our clients' or employees' personal information could result in damage to our brand and reputation, and actions required to remediate improper disclosures could be costly. Additionally, we may be subject to claims and litigation by clients, employees, or governmental agencies, which could have a material adverse effect on our business and our consolidated financial position, results of operations, and cash flows.
We are subject to laws, rules, and regulations relating to the collection, use, disclosure, and security of consumer and employee personal information, which have drawn increased attention from U.S. federal, state, and foreign governmental authorities in jurisdictions in which we operate. In the U.S., the IRS generally requires a tax return preparer to obtain the prior written consent of the taxpayer to use or disclose the taxpayer's information for certain purposes other than tax return preparation. In addition, other regulations require financial institutions to adopt and disclose their consumer privacy notice and generally provide consumers with a reasonable opportunity to "opt-out" of having nonpublic personal information disclosed to unaffiliated third parties. Numerous jurisdictions have passed, and may in the future pass, new laws related to the use and retention of consumer information and this area continues to be an area of interest for U.S. federal, state, and foreign governmental authorities. These laws may be interpreted and applied inconsistently from jurisdiction to jurisdiction, and our current data protection policies and practices may not be consistent with all of those interpretations and applications. In addition, changes in U.S. federal and state regulatory requirements, as well as requirements imposed by governmental authorities in foreign jurisdictions in which we operate, could result in more stringent requirements and in a need to change business practices, including the types of information we can use and the manner in which we can use such information. Establishing systems and processes to achieve compliance with these new requirements may increase our costs or limit our ability to pursue certain business opportunities.
A security breach of our systems, or third party systems on which we rely, resulting in unauthorized access to personal client information, may adversely affect the demand for our services and products, our reputation, and financial performance.
We offer a range of services and products to our clients, including assisted and DIY tax return preparation solutions, and financial products and services. Due to the nature of these services and products, we use multiple digital technologies to collect, transmit, and store high volumes of personal client information. Information security risks to companies that use digital technologies continue to increase due in part to the increased adoption of and reliance upon these technologies by companies and consumers. Our risk and exposure to these matters remain heightened due to a variety of factors including, among other things, the evolving nature of these threats and related regulation, the increased sophistication of organized crime, cyber criminals and hackers, the prominence of our brand, our and
|
8
|
2017 Form 10-K |
H&R Block, Inc.
|
our franchisees' extensive office footprint, our plans to continue to implement strategies for our online and mobile applications and our desktop software, and our use of third-party vendors.
Cybersecurity risks may result from fraud or malice (a cyber attack), human error, or accidental technological failure. Cyber attacks are designed to electronically circumvent network security for malicious purposes such as unlawfully obtaining personal client information, disrupting our ability to offer services, damaging our brand and reputation, stealing our intellectual property, and advancing social or political agendas. We face a variety of cyber attack threats including computer viruses, malicious codes, worms, phishing attacks, social engineering, denial of service attacks, ransomware, and other sophisticated attacks.
We maintain multiple levels of protection in order to address or otherwise mitigate the risk of a security breach. We regularly test our systems to discover and address potential vulnerabilities, and we rely on training and testing of our employees regarding heightened phishing and social engineering threats. Due to the structure of our business model, we also rely on our franchisees and other private and governmental third parties to maintain secure systems and respond to cybersecurity risks. Cybersecurity and the continued development and enhancement of our controls, processes, and practices designed to protect our systems, computers, software, data, and networks from attack, damage, or unauthorized access remain a high priority for us. As risks and regulations continue to evolve, we may be required to expend significant additional resources to continue to modify or enhance our protective measures or to investigate and remediate any information security vulnerabilities. Notwithstanding these efforts, there can be no assurance that a security breach, intrusion, or loss or theft of personal client information will not occur.
A breach of our security measures or those of our franchisees or third parties on whom we rely, or other fraudulent activity, could result in unauthorized access to personal client information. If such an event were to occur, it could have serious short and long term negative consequences. Security breach remediation could require us to expend significant resources to notify or assist impacted clients, repair damaged systems, implement improved information security measures, and maintain client and business relationships. Other consequences could include reduced client demand for our services and products, loss of valuable intellectual property, reduced growth and profitability and negative impacts to future financial results, loss of our ability to deliver one or more services or products (e.g., inability to provide financial transaction services or to accept and process client credit card orders or tax returns), litigation, harm to our reputation and brands, fines, penalties, and other damages, and further regulation and oversight by U.S. federal, state, or foreign governmental authorities.
A security breach or other unauthorized access to our systems could have a material adverse effect on our business and our consolidated financial position, results of operations, and cash flows.
Stolen identity refund fraud could impede our clients' ability to timely and successfully file their tax returns and receive their tax refunds, and could diminish consumers' perceptions of the security and reliability of our products and services, resulting in negative publicity. Increased governmental regulation to attempt to combat that fraud could adversely affect our revenues and profitability.
Companies offering tax preparation services (especially those offering DIY solutions) have seen a rise in instances of criminals utilizing stolen information obtained through hacking, phishing, and other means of identity theft in order to electronically file fraudulent federal and state tax returns. As a result, impacted taxpayers must complete additional forms and go through additional steps in order to report to appropriate authorities that their identities have been stolen and their tax returns were filed fraudulently. Though we offer assistance in the refund recovery process and offer our Tax Identity Shield® product to help protect clients, stolen identity refund fraud could impede our clients' ability to timely and successfully file their returns and receive their tax refunds, and could diminish consumers' perceptions of the security and reliability of our products and services, resulting in negative publicity, despite there having been no breach in the security of our systems. In addition, if stolen identity refund fraud is perpetrated at a material level through our products or services, state, federal or foreign tax authorities may refuse to allow us to continue to process our clients' tax returns electronically. As a result, stolen identity refund fraud could harm our revenue, results of operations, and reputation.
Federal, state, and foreign governmental authorities in jurisdictions in which we operate have taken action, and may in the future take additional action, in an attempt to combat stolen identity refund fraud, which may require changes to our systems and business practices, in ways that we cannot anticipate. These actions may have a material adverse effect on our business and our consolidated financial position, results of operations, and cash flows.
|
H&R Block, Inc.
| 2017 Form 10-K
|
9
|
Our clients may access our services and products from personal or public computers and mobile devices and may install and use our DIY desktop software on their computers. Those computers and other devices may have outdated systems, may run software that is no longer supported, or may not have security patches installed on a timely basis. As a result, a person with malicious intent could obtain user account and password information from our clients through hacking, phishing, or other means of cyber attack, in order to perpetrate stolen identity refund fraud and otherwise cause losses for our clients. It has been reported that a number of companies, including some in the tax return preparation industry, have experienced instances where criminals gained unauthorized and illegal access to their systems by using stolen identity information obtained from sources other than those companies. The unauthorized and illegal access to those systems was used by criminals to perpetrate a variety of crimes, including stolen identity refund fraud. We could experience this form of unauthorized and illegal access to our systems, despite there having been no breach in the security of our systems, which could negatively impact our clients and harm our revenue, results of operations and reputation. Additionally, if such unauthorized or illegal access occurs, we may be subject to claims and litigation by clients, non-clients, or governmental agencies.
An interruption in our information systems, or those of our franchisees or a third party on which we rely, or an interruption in the internet, could have a material adverse effect on our business and our consolidated financial position, results of operations, and cash flows.
We and our franchisees rely heavily upon communications, networks, and information systems and the internet to conduct our business. These networks, systems, and operations are potentially vulnerable to damage or interruption from upgrades and maintenance, network failure, hardware failure, software failure, power or telecommunications failures, cyber attacks involving the penetration of our network by hackers or other unauthorized users (e.g., through computer viruses and worms, malicious code, phishing attacks, denial of service attacks, information security breaches, or other negative disruptions to the operation of the internet), human error and natural disasters. As our businesses are seasonal, our systems must be capable of processing high volumes during our peak periods. Therefore, any failure or interruption in our information systems, or information systems of our franchisees or a private or government third party on which we rely, or an interruption in the internet or other critical business capability, could negatively impact our business operations and increase our risk of loss.
There can be no assurance that system or internet failures, or interruptions in critical business capabilities will not occur, or, if they do occur, that we, our franchisees or the private or governmental third parties on whom we rely, will adequately address them. The precautionary measures that we have implemented to avoid systems outages and to minimize the effects of any data or communication systems interruptions or failures may not be adequate in all circumstances, and we may not have anticipated or addressed all of the potential events that could threaten or undermine our information systems or other critical business capabilities.
The occurrence of any systems or internet failure, or business interruption could negatively impact our ability to serve our clients, which in turn could have a material adverse effect on our business and our consolidated financial position, results of operations, and cash flows.
Government tax reform initiatives that simplify or otherwise modify tax return preparation requirements or expedite refunds could have a material effect on our business and our consolidated financial position, results of operations, and cash flows.
Tax reform is a focus of the federal government, but it is not clear what form tax reform proposals or related legislation or regulatory action may take, or whether any such legislation or regulatory action will ultimately be adopted and passed into law. There are various initiatives seeking to simplify or otherwise modify the preparation and filing of federal tax returns, including preparation of tax returns directly by the IRS, and to provide additional assistance with respect to preparing and filing such tax returns or expediting refunds. H&R Block is a member of Free File, which provides the ability for low-income taxpayers to prepare and file their own federal tax returns online for free.
The IRS has in the past explored the possibility of allowing taxpayers to allocate a portion of their tax refunds to pay tax preparation fees, which could reduce the demand for RTs, but the IRS has not advanced this initiative. Taxing authorities in various state, local, and foreign jurisdictions in which we operate have also introduced measures seeking to simplify or otherwise modify the preparation and filing of tax returns in their respective jurisdictions.
The adoption or expansion of any measures that significantly modify the Internal Revenue Code, simplify tax return preparation, expedite refunds, or otherwise reduce the need for third-party tax return preparation services could
|
10
|
2017 Form 10-K |
H&R Block, Inc.
|
reduce demand for our services and products and could have a material adverse effect on our business and our consolidated financial position, results of operations and cash flows.
The Dodd-Frank Act created the CFPB to administer and, in some cases, enforce U.S. federal financial consumer protection laws and expanded the role of state regulators with respect to consumer protection laws. Regulations promulgated by the CFPB or other regulators may affect our financial services businesses in ways we cannot predict, which may require changes to our financial products, services, and contracts.
The Dodd-Frank Act created the CFPB and gave it broad powers to administer, investigate compliance with, and, in some cases, enforce U.S. federal financial consumer protection laws. The CFPB has broad rule-making authority for a wide range of financial consumer protection laws that apply to banks and other financial services companies, including the authority to prohibit "unfair, deceptive, or abusive" acts and practices.
The CFPB may examine, investigate, and take enforcement actions against our subsidiaries that provide consumer financial services and products, as well as financial institutions and service providers upon which our subsidiaries rely to provide consumer financial services and products. The Dodd-Frank Act also expanded the role of state regulators in enforcing and promulgating financial consumer protection laws, the results of which could be states issuing new and broader financial consumer protection laws, some of which could be more comprehensive than existing U.S. federal regulations. Currently proposed or new CFPB and state regulations may require changes to our financial products, services and contracts, and this could have a material adverse effect on our business and our consolidated financial position, results of operations, and cash flows. Examples of recent CFPB action include the following:
|
▪
|
On May 5, 2016, the CFPB issued a request for comments on its proposal to prohibit mandatory consumer arbitration clauses in consumer financial product contracts. We, and certain of our third party service providers, utilize consumer arbitration clauses in connection with all of our consumer financial services products. It is not clear when the CFPB will publish the final version of these rules, or what their content will be. It is possible that, if the CFPB issues final rules that prohibit our use of consumer arbitration clauses, the risk of litigation involving our consumer financial products could increase, and the revenue that we derive from our consumer financial products could decline, as the result of adverse outcomes of litigation, increased volume of litigation, and the expense of defending such litigation.
|
|
▪
|
On June 2, 2016, the CFPB issued proposed rules that would change the regulation of many forms of consumer credit. It is not clear when the CFPB will publish the final version of these rules, or what their content will be. It is possible that the final rules, when enacted, could impact EAs and RAs. It is also possible that, depending on the form of the final rules, changes would be necessary to EAs and RAs to comply with the final rules, and that such changes could have a material adverse effect on the revenue that we derive from EAs.
|
|
▪
|
On October 5, 2016, the CFPB released its final rules regulating prepaid products (Final Rules). The Final Rules are scheduled to take effect on April 1, 2018, with certain provisions phased in over time following that date. If the Final Rules become effective as released, they will apply to the H&R Block Emerald Prepaid MasterCard®, but we do not believe they will apply to EAs or RA loans due to their nature as non-covered separate credit products. The Final Rules, among other things: (i) establish required consumer disclosures to be made prior to acquiring a prepaid account in most situations; (ii) require periodic statements or online access to specified account information; and (iii) require online posting of the Cardholder Agreement and submission of new and revised Cardholder Agreements to the CFPB. We are continuing to assess the impact of these changes on the H&R Block Emerald Prepaid MasterCard® and our consolidated financial statements.
|
The nature of our tax service and product offerings requires timely product launches. Any significant delays in launching our tax service and product offerings, changes in government regulations or processes that affect how we provide such offerings to our clients, or significant problems with such offerings or the manner in which we provide them to our clients may harm our revenue, results of operations, and reputation.
Tax laws and tax forms are subject to change each year, and the nature and timing of such changes are unpredictable. As a part of our business, we must incorporate any changes to tax laws and tax forms into our tax service and product offerings, including our online and mobile applications and desktop software. The unpredictable nature and timing of changes to tax laws and tax forms can result in condensed development cycles for our tax service and product offerings because our clients expect high levels of accuracy and a timely launch of such offerings to prepare and file their taxes by the tax filing deadline and, in turn, receive any tax refund amounts on a timely basis. In addition,
|
H&R Block, Inc.
| 2017 Form 10-K
|
11
|
governmental authorities regularly change their processes for accepting tax filings and related tax forms. Further, changes in governmental administrations or regulations could result in a delay of the start of the tax season or in further and unanticipated changes in requirements or processes. Changes in governmental regulations and processes that affect how we provide services and products to our clients may require us to make corresponding changes to our client service systems and procedures. Furthermore, unanticipated changes in governmental processes for accepting tax filings and related forms, or the ability of taxing authorities to accept electronic tax return filings, may result in delays in our processing of our clients' tax filings, or delays in tax authorities accepting electronic tax return filings, and, in turn, delay any tax refund amounts to which such clients may be entitled. From time to time, we review and enhance our quality controls for preparing accurate tax returns, but there can be no assurance that we will be able to prevent all inaccuracies. Any significant delays in launching our tax service and product offerings, changes in government regulations or processes that affect how we provide such offerings to our clients, or significant problems with such offerings or the manner in which we provide them to our clients may harm our revenue, results of operations, and reputation.
If we encounter development challenges or discover errors in our systems, services or products, we may elect to delay or suspend our offerings. Any major defects or launch delays, or failure to anticipate changes in governmental processes for accepting tax filings and related forms, may lead to loss of clients and revenue, negative publicity, client and employee dissatisfaction, a deterioration in our business relationships with our franchisees, reduced retailer shelf space and promotions, exposure to litigation, and increased operating expenses. Any of the risks described above could have a material adverse effect on our business and our consolidated financial position, results of operations, and cash flows.
Regulatory actions could have an adverse effect on our business and our consolidated financial position, results of operations, and cash flows
.
The Company is subject to additional federal, state, local, and foreign laws and regulations that affect the Company, including, without limitation, in the areas of franchise, labor, immigration, advertising, consumer protection, financial services and products, payment processing, privacy, anti-competition, environmental, health and safety, insurance, and healthcare. There have been significant new regulations and heightened focus by the government in some of these areas, including, for example, healthcare, consumer financial services and products, and labor, including overtime and exemption regulations and state and local laws on minimum wage and other labor-related issues. There may be additional regulatory actions or enforcement priorities, or new interpretations of existing requirements that differ from ours. These developments could impose unanticipated limitations or require changes to our business, which may make elements of our business more expensive, less efficient, or impossible to conduct, and may require us to modify our current or future services or products, which effects may be heightened given the nature, broad geographic scope, and seasonality of our business.
We rely on a single vendor or a limited number of vendors to provide certain key services or products, and the inability of these key vendors to meet our needs could have a material adverse effect on our business and our consolidated financial position, results of operations, and cash flows.
Historically, we have contracted, and in the future we will likely continue to contract, with a single vendor or a limited number of vendors to provide certain key services or products for our tax, financial, and other services and products. Two examples of this type of reliance are our relationships with Fidelity National Information Services, Inc. (FIS), for data processing and card production services, and BofI, as discussed in Item 1. In certain instances, we are vulnerable to vendor error, service inefficiencies, service interruptions, or service delays. Our sensitivity to any of these issues may be heightened (1) due to the seasonality of our business, (2) with respect to any vendor that we utilize for the provision of any product or service that has specialized expertise, (3) with respect to any vendor that is a sole or exclusive provider, or (4) with respect to any vendor whose indemnification obligations are limited or that does not have the financial capacity to satisfy its indemnification obligations. Some of our vendors are subject to the oversight of regulatory bodies and, as a result, our product or service offerings may be affected by the actions or decisions of such regulatory bodies. Vendor failures could occur in various ways including (1) vendor error, (2) inability to meet our needs in a timely manner, or (3) termination or delay in the services or products provided by a vendor because the vendor fails to perform adequately, is no longer in business, experiences shortages, or discontinues a certain product or service that we utilize. If our vendors are unable to meet our needs and we are not able to develop
|
12
|
2017 Form 10-K |
H&R Block, Inc.
|
alternative sources for these services and products quickly and cost-effectively, it could result in a material and adverse impact on our business and our consolidated financial position, results of operations, and cash flows.
The specialized and highly seasonal nature of our business presents financial risks and operational challenges, which, if not satisfactorily addressed, could materially affect our business and our consolidated financial position, results of operations, and cash flows.
Our business is highly seasonal, with the substantial portion of our revenue earned in the fourth quarter of our fiscal year. Success in our industry depends on our ability to attract, develop, motivate, and retain key personnel in a timely manner, including members of our executive team, and those in seasonal tax preparation positions or with other required specialized expertise, including technical positions. The market for such personnel is extremely competitive, and there can be no assurance that we will be successful in our efforts to attract and retain the required personnel within necessary timeframes. If we are unable to attract, develop, motivate, and retain key personnel, our business, operations, and financial results could be negatively impacted.
The concentration of our revenue-generating activity during this relatively short period presents a number of additional challenges for us, including (1) cash and resource management during the first nine months of our fiscal year, when we generally operate at a loss and incur fixed costs and costs of preparing for the upcoming tax season, (2) ensuring compliance with financial covenants under our First Amended and Restated Credit and Guarantee Agreement (2016 CLOC), particularly if the timing of our revenue generation deviates from this seasonal period, (3) responding to changes in competitive conditions, including marketing, pricing, and new product offerings, which could affect our position during the tax season, (4) disruptions in a tax season, including any customer dissatisfaction issues, which may not be timely discovered or satisfactorily addressed, and (5) ensuring optimal uninterrupted operations and service delivery during the tax season. If we experience significant business disruptions during the tax season or if we are unable to satisfactorily address the challenges described above and related challenges associated with a seasonal business, we could experience a loss of business, which could have a material adverse effect on our business and our consolidated financial position, results of operations, and cash flows.
We face litigation in connection with our various business activities, and current or future litigation may damage our reputation, impair our product offerings, or result in material liabilities and losses.
We have been named, and from time to time will likely continue to be named, in various legal actions, including arbitrations, class or representative actions, actions or inquiries by state attorneys general, and other litigation arising in connection with our various business activities, including relating to our various service and product offerings. We also grant our franchisees a limited license to use our registered trademarks and, accordingly, there is risk that one or more of the franchisees may be alleged to be controlled by us. Third parties, regulators or courts may seek to hold us responsible for the actions or failures to act by our franchisees. Adverse outcomes related to litigation could result in substantial damages and could cause our earnings to decline. Negative public opinion could also result from our subsidiaries' or franchisees' actual or alleged conduct in such claims, possibly damaging our reputation, which, in turn, could adversely affect our business prospects and cause the market price of our securities to decline.
In addition, we have been sued, and certain of our competitors have been sued, in connection with the offering of different types of RT products. Further, we have received an inquiry from the California Attorney General requesting information regarding our RT product. In a case involving one of our competitors, a California appellate court affirmed a trial court's ruling that the competitor's specific version of a RT product was subject to truth-in-lending and other related laws. Following the appellate court's ruling, the case was denied further appellate review. We believe there are differences that distinguish our RT product from the product that was the subject of the competitor's case described above. Revenues from our RT product totaled
$148 million
in fiscal year
2017
; any requirement that materially alters our offering of RTs, including limitations on the fees we charge or disclosure requirements that could reduce the demand for these products, could have a material adverse impact on our business and our consolidated financial position, results of operations, and cash flows.
Our access to liquidity may be negatively impacted as disruptions in credit markets occur, if credit rating downgrades occur, or if we fail to meet certain covenants. Funding costs may increase, leading to reduced earnings.
We need liquidity to meet our off-season working capital requirements, to service debt obligations including refinancing of maturing obligations, and for general corporate purposes. Our access to and the cost of liquidity could
|
H&R Block, Inc.
| 2017 Form 10-K
|
13
|
be negatively impacted in the event of credit rating downgrades or if we fail to meet existing financial covenants. In addition, events could occur which could increase our need for liquidity above current levels.
If rating agencies downgrade our credit rating, the cost of debt under our existing financing arrangements, as well as future financing arrangements, could increase and capital market access could decrease or become unavailable. Our 2016 CLOC is subject to various covenants, and a violation of a covenant could impair our access to liquidity currently available through the 2016 CLOC. The 2016 CLOC includes provisions that allow for the issuance of equity to comply with the financial covenant calculations as a means to avoid a shortfall. If current sources of liquidity were to become unavailable, we would need to obtain additional sources of funding, which may not be available or may only be available under less favorable terms. This could have a material adverse effect on our business and our consolidated financial position, results of operations, and cash flows.
The continued payment of dividends on our common stock and repurchases of our common stock are dependent on a number of factors, and future payments and repurchases cannot be assured.
We need liquidity sufficient to fund payments of dividends on our common stock and repurchases of our common stock. In addition, holders of our common stock are only entitled to receive such dividends as our Board of Directors may declare out of funds legally available for such payments, and our Board of Directors may only authorize the Company to repurchase shares of our common stock with funds legally available for such repurchases. The payment of future dividends and future repurchases will depend upon our earnings, economic conditions, liquidity and capital requirements, and other factors, including our debt leverage. Accordingly, we cannot make any assurance that future dividends will be paid, or future repurchases will be made, at levels comparable to our historical practices, if at all. Due to the seasonal nature of our business and the fact that our business is not asset-intensive, there may be periods of time during our fiscal year in which the payment of dividends or stock repurchases may cause us to have a negative net worth under accounting principles generally accepted in the U.S. (GAAP).
Our businesses may be adversely affected by difficult economic conditions, in particular, high unemployment levels.
Difficult economic conditions are frequently characterized by high unemployment levels and declining consumer and business spending. These poor economic conditions may negatively affect demand and pricing for our services and products. In the event of difficult economic conditions that include high unemployment levels, especially within client segments we serve, clients may elect not to file tax returns or seek lower cost preparation and filing alternatives. Sustained levels of high unemployment may negatively impact our ability to increase or retain tax preparation clients.
Our business depends on our strong reputation and the value of our brands.
Developing and maintaining awareness of our brands is critical to achieving widespread acceptance of our existing and future services and products and is an important element in attracting new clients. In addition, our franchisees may operate their businesses under our brands. Adverse publicity (whether or not justified) relating to events or activities involving or attributed to us, our franchisees, employees, or agents or our services or products, which may be enhanced due to the nature of social media, may tarnish our reputation and reduce the value of our brands. Damage to our reputation and loss of brand equity may reduce demand for our services and products and thus have an adverse effect on our future financial results, as well as require additional resources to rebuild our reputation and restore the value of our brands.
Failure to protect our intellectual property rights may harm our competitive position and litigation to protect our intellectual property rights or defend against third party allegations of infringement may be costly.
Despite our efforts to protect our intellectual property and proprietary information, we may be unable to do so effectively in all cases. Our intellectual property could be wrongfully acquired as a result of a cyber attack or other wrongful conduct by employees or third parties. To the extent that our intellectual property is not protected effectively by trademarks, copyrights, patents, or other means, other parties with knowledge of our intellectual property, including former employees, may seek to exploit our intellectual property for their own or others' advantage. Competitors may also misappropriate our trademarks, copyrights or other intellectual property rights or duplicate our technology and products. Any significant impairment or misappropriation of our intellectual property or proprietary information could harm our business and our brand, and may adversely affect our ability to compete.
In addition, third parties may allege we are infringing their intellectual property rights, and we may face intellectual property challenges from other parties. We may not be successful in defending against any such challenges or in
|
14
|
2017 Form 10-K |
H&R Block, Inc.
|
obtaining licenses to avoid or resolve any intellectual property disputes and, in that event, we could lose significant revenues, incur significant license, royalty, or technology development expenses, suffer harm to our reputation, or pay significant monetary damages.
Failure to maintain sound business relationships with our franchisees may have a material adverse effect on our business and our consolidated financial position, results of operations, and cash flows.
Our financial success depends in significant part on our ability to maintain sound business relationships with our franchisees. The support of our franchisees is also critical for the success of our marketing programs and any new strategic initiatives we seek to undertake. Deterioration in our relationships with our franchisees or the failure of our franchisees to support our marketing programs and strategic initiatives could have a material adverse effect on our business and our consolidated financial position, results of operations, and cash flows.
Our international operations are subject to risks which may harm our business and our consolidated financial position, results of operations, and cash flows.
We have international operations, including in Canada and Australia, and may consider expansion opportunities in additional countries in the future. There is uncertainty about our ability to generate revenues from new or emerging foreign operations and expand into other international markets. Additionally, there are risks inherent in doing business internationally, including: (1) changes in trade regulations; (2) difficulties in managing foreign operations as a result of distance, language, and cultural differences; (3) profit repatriation restrictions, and fluctuations in foreign currency exchange rates; (4) geopolitical events, including acts of war and terrorism, and economic and political instability; (5) compliance with U.S. laws such as the Foreign Corrupt Practices Act and other applicable foreign anti-corruption laws; (6) compliance with U.S. and international laws and regulations, including those concerning privacy, and data protection and retention; and (7) risks related to other government regulation or required compliance with local laws. These risks inherent in our international operations and expansion could increase our costs of doing business internationally and could have a material adverse effect on our business and our consolidated financial position, results of operations, and cash flows.
In addition, we prepare tax returns for taxpayers residing in foreign jurisdictions, including the European Union (EU), and we operate and have franchisees who operate in foreign jurisdictions. As a result, certain aspects of our operations are subject to the laws, regulations, and policies of those jurisdictions that regulate the collection, use, and transfer of personal data, and in the future we may be subject to additional, more stringent requirements, including those found in the EU General Data Protection Regulation. Costs for us to comply with such laws, regulations, and policies that are applicable to us could be significant. We may also face audits or investigations by one or more foreign government agencies relating to these laws, regulations, and policies that could result in the imposition of penalties or fines.
We may be adversely impacted by changes in corporate tax rates, the adoption of new tax legislation in the jurisdictions in which we operate, and exposure to additional tax liabilities.
As a multinational corporation, we are subject to taxes in the U.S. and numerous foreign jurisdictions where our subsidiaries are organized and conduct their operations. Significant judgment is required in determining our worldwide provision for income taxes and other tax liabilities. Tax rates in the various jurisdictions in which our subsidiaries are organized and conduct their operations may change significantly as a result of political or economic factors beyond our control. Additionally, our future effective tax rates could be adversely affected by changes in the valuation of deferred tax assets and liabilities or changes in tax laws or their interpretation. Our tax returns and other tax matters are periodically examined by tax authorities and governmental bodies, including the IRS, which may disagree with positions taken by us in determining our tax liability. There can be no assurance as to the outcome of these examinations. We regularly assess the likelihood of an adverse outcome resulting from these examinations to determine the adequacy of our provision for taxes.
As described above, tax reform is a focus of the federal government, and there are competing proposals regarding changes to the corporate tax rate. If enacted, corporate tax reform may significantly change the U.S. corporate tax rate and the tax rules to which we are subject. In addition, projects undertaken by international organizations may change international tax norms relating to each country’s jurisdiction to tax cross-border international trade. Given the unpredictability of these and other possible changes to tax laws and related regulations, it is difficult to assess
|
H&R Block, Inc.
| 2017 Form 10-K
|
15
|
the overall effect of such potential changes, but any such changes could, if adopted and applicable to us, adversely impact our effective tax rates.
If our effective tax rates were to increase, or if the ultimate determination of our taxes owed is for an amount in excess of amounts previously accrued, our operating results, cash flows, and financial condition could be adversely affected.
RISKS RELATING TO DISCONTINUED OPERATIONS
Sand Canyon Corporation, previously known as Option One Mortgage Corporation (including its subsidiaries, collectively, SCC) is subject to potential contingent losses related to representation and warranty claims, which may have an adverse effect on our business and our consolidated financial condition, results of operations, and cash flows. SCC has accrued, and may in the future accrue, an estimated liability related to these contingent losses, which may not be adequate.
SCC exited its mortgage business in fiscal year 2008. SCC remains exposed to losses relating to mortgage loans it previously originated. Mortgage loans originated by SCC were sold either as whole loans to single third-party buyers or in the form of residential mortgage-backed securities (RMBSs).
In connection with the sale of loans or RMBSs, SCC made certain representations and warranties. Claims under these representations and warranties together with any settlement arrangements related to these losses are collectively referred to as "representation and warranty claims." These representations and warranties varied based on the nature of the transaction and the buyer's or insurer's requirements, but generally pertained to the ownership of the loan, the validity of the lien securing the loan, borrower fraud, the loan's compliance with the criteria for inclusion in the transaction, including compliance with SCC's underwriting standards or loan criteria established by the buyer, ability to deliver required documentation, and compliance with applicable laws. Representations and warranties related to borrower fraud in whole loan sale transactions to institutional investors, which were generally securitized by such investors and represented approximately 68% of the disposal of loans originated in calendar years 2005, 2006 and 2007, included a "knowledge qualifier" limiting SCC's liability to those instances where SCC had knowledge of the fraud at the time the loans were sold. Representations and warranties made in other sale transactions effectively did not include a knowledge qualifier as to borrower fraud. To the extent that any remaining repurchase obligations exist, SCC believes it would have an obligation to repurchase a loan only if it breached a representation and warranty and such breach materially and adversely affects the value of the mortgage loan or certificate holder's interest in the mortgage loan.
The statute of limitations for a contractual claim to enforce a representation and warranty obligation is generally six years or such shorter limitations period that may apply under the law of a state where the economic injury occurred. On June 11, 2015, the New York Court of Appeals, New York's highest court, held in
ACE Securities Corp. v. DB Structured Products, Inc.
, that the six-year statute of limitations under New York law starts to run at the time the representations and warranties are made, not the date when the repurchase demand was denied. This decision applies to claims and lawsuits brought against SCC where New York law governs. New York law governs many, though not all, of the transactions into which SCC entered. However, this decision would not affect representation and warranty claims and lawsuits SCC has received or may receive, for example, where the statute of limitations has been tolled by agreement or a suit was timely filed.
In response to the statute of limitations rulings in the ACE case and similar rulings in other state and federal courts, parties seeking to pursue representation and warranty claims or lawsuits have sought, and may in the future seek, to distinguish certain aspects of the ACE decision, pursue alternate legal theories of recovery, or assert claims against other contractual parties such as securitization trustees.
For example, a 2016 ruling by a New York intermediate appellate court allowed a counterparty to pursue litigation on additional loans in the same trust even though only some of the loans complied with the condition precedent of timely pre-suit notice and opportunity to cure or repurchase. Additionally, plaintiffs in litigation to which SCC is not party have alleged breaches of an independent contractual duty to provide notice of material breaches of representations and warranties, and pursued separate claims to which, they argue, the statute of limitations ruling in the
ACE
case does not apply. The impact on SCC, if any, from alternative legal theories seeking to avoid or distinguish the ACE decision, or judicial limitations on the ACE decision, is unclear.
|
16
|
2017 Form 10-K |
H&R Block, Inc.
|
SCC has concluded that a loss related to certain representation and warranty claims is probable and has accrued a liability as of April 30,
2017
, of
$4.5 million
. If SCC were required to pay material amounts with respect to contingent losses arising from representation and warranty claims, it could have a material adverse effect on our business and our consolidated financial position, results of operations, and cash flows, as SCC's financial condition, results of operations and cash flows are included in our consolidated financial statements. Except where specified, the accrued liability does not include potential losses related to litigation matters discussed in the risk factor below and in
Item 8
,
note 13
to the consolidated financial statements. Also see
Item 8
,
note 14
to the consolidated financial statements.
SCC is subject to potential contingent losses related to securitization transactions in which SCC participated as a depositor or loan originator, which may result in significant financial losses.
Between January 2005 and November 2007, SCC originated mortgage loans totaling approximately
$80 billion
. Mortgage loans originated by SCC were sold either as whole loans to single third-party buyers, who generally securitized such loans, or in the form of RMBSs. SCC estimates approximately
90%
of the loans it originated in 2005, 2006, and 2007 were securitized in approximately
110
securitization transactions. In most of these securitization transactions, SCC agreed, subject to certain conditions and limitations, to indemnify the underwriters or depositors for certain losses and expenses that the underwriters or depositors may incur as a result of certain claims made against them relating to loans originated by SCC, including certain legal expenses the underwriters or depositors incur in their defense of such claims. Some of those underwriters and depositors are defendants in lawsuits where various other parties allege a variety of claims, including violations of U.S. federal and state securities law and common law fraud based on alleged materially inaccurate or misleading disclosures, arising out of the activities of such underwriters or depositors in their sale of RMBSs or mortgage loans. Based on information currently available to SCC, it believes that the
21
lawsuits in which notice of a claim for indemnification has been made involve
39
securitization transactions with original investments of approximately
$14 billion
(of which the outstanding principal amount is approximately
$4 billion
). Certain of the notices received included, and future notices may include, a reservation of rights to assert claims for contribution, which are referred to herein as "contribution claims." Contribution claims may become operative if indemnification is unavailable or insufficient to cover all of the losses and expenses involved. These indemnification and contribution claims are frequently not subject to a contractual term or limit.
In addition, securitization trustees are, or have been, involved in lawsuits related to securitization transactions in which SCC participated. Plaintiffs in these lawsuits allege, among other things, that originators, depositors, servicers or other parties breached their representations and warranties or otherwise failed to fulfill their obligations, including that securitization trustees breached their contractual obligations, breached their fiduciary duties, or violated statutory requirements by failing to properly protect the certificate holders’ interests.
Additional lawsuits against the underwriters, depositors, or securitization trustees may be filed in the future, and SCC may receive additional notices of claims for indemnification or contribution from underwriters, depositors, or securitization trustees with respect to existing or new lawsuits or settlements of such lawsuits.
In addition, other counterparties to the securitization transactions, including certificate holders and monoline insurance companies, have filed or may file lawsuits, or may assert indemnification claims, directly against depositors and loan originators in securitization transactions alleging a variety of claims, including U.S. federal and state securities law violations, common law torts and fraud and breach of contract claims, among others. Additional or new lawsuits or claims may be filed or asserted against SCC in the future.
We have not concluded that a loss related to any of these indemnification or contribution claims is probable and have not accrued a liability for these claims. However, if SCC were required to pay material amounts with respect to these matters, it could have a material adverse effect on our business and our consolidated financial position, results of operations and cash flows, as SCC's financial condition, results of operations, and cash flows are included in our consolidated financial statements. See
Item 8
,
note 13
to the consolidated financial statements for additional information.
H&R Block has guaranteed the payment of certain limited claims against SCC.
SCC is subject to representation and warranty claims by counterparties to SCC whole loan sales and securitization transactions, including certificate holders, securitization trustees, monoline insurance companies, and subsequent purchasers of whole loans. In certain limited circumstances described below, H&R Block guaranteed payment if claims are successfully asserted by such counterparties.
|
H&R Block, Inc.
| 2017 Form 10-K
|
17
|
These guarantees include representation and warranty claims with respect to a limited number of whole loan sales by SCC with an aggregate outstanding principal and liquidated amount of approximately
$1.0 billion
as of April 30,
2017
, based on the data available to SCC. There have been a total of approximately
$41 million
of representation and warranty claims with respect to these whole loan sales.
These guarantees also cover limited representation and warranty claims on other outstanding securitization transactions, with a potential claims exposure of less than
$200 million
. In addition, as is customary in divestiture transactions, H&R Block guaranteed the payment of any indemnification claims from the purchaser of SCC's servicing business, including claims relating to pre-closing services (closing occurred in 2008).
We could be subject to claims by the creditors of SCC.
As discussed above, SCC is subject to representation and warranty claims, indemnification and contribution claims, and other claims and litigation related to its past sales and securitizations of mortgage loans. Additional claims and litigation may be asserted in the future. If the amount that SCC is ultimately required to pay with respect to these claims and litigation, together with related administration and legal expense, exceeds its net assets, the creditors of SCC, or a bankruptcy trustee if SCC were to file or be forced into bankruptcy, may attempt to assert claims against us for payment of SCC's obligations. Claimants have also attempted, and may in the future attempt, to assert claims or seek payment directly from the Company even if SCC's assets exceed its liabilities
.
SCC's principal assets, as of April 30,
2017
, total approximately
$318 million
and consist primarily of an intercompany note receivable. We believe our legal position is strong on any potential corporate veil-piercing arguments; however, if this position is challenged and not upheld, it could have a material adverse effect on our business and our consolidated financial position, results of operations, and cash flows. In addition, in certain limited instances, H&R Block guaranteed amounts as outlined in the above risk factor.
None.
Most of our tax offices are operated under leases or similar agreements throughout the U.S., Canada and Australia.
We own our corporate headquarters, which is located in Kansas City, Missouri. Our Canadian executive offices are located in a leased office in Calgary, Alberta. Our Australian executive offices are located in a leased office in Thornleigh, New South Wales.
All current leased and owned facilities are in reasonably good repair and adequate to meet our needs.
For a description of our material pending legal proceedings, see discussion in
Item 8
,
note 13
to the consolidated financial statements.
Not applicable.
MARKET INFORMATION AND HOLDERS
- H&R Block's common stock is traded on the New York Stock Exchange (NYSE) under the symbol HRB. On
May 31, 2017
, there were
16,917
shareholders of record and the closing stock price on the NYSE was
$26.54
per share.
QUARTERLY STOCK PRICES AND DIVIDENDS
- The quarterly information regarding H&R Block's common stock prices and dividends appears in
Item 8
,
note 16
to the consolidated financial statements. Although we have historically paid dividends and plan to continue to do so, there can be no assurances that circumstances will not change in the future that could affect our ability or decisions to pay dividends.
|
18
|
2017 Form 10-K |
H&R Block, Inc.
|
PURCHASES OF EQUITY SECURITIES BY THE ISSUER
- A summary of our purchases of H&R Block common stock during the fourth quarter of fiscal year
2017
is as follows:
|
(in 000s, except per share amounts)
|
||||||||||||||
|
Total Number of
Shares Purchased
(1)
|
|
Average
Price Paid
per Share
|
|
Total Number of Shares
Purchased as Part of
Publicly Announced
Plans or Programs
(2)
|
|
Maximum Dollar Value of
Shares that May be Purchased
Under the Plans or Programs
(2)
|
|
|||||||
|
February 1 – February 28
|
1
|
|
$
|
21.10
|
|
—
|
|
$
|
1,183,190
|
|
||||
|
March 1 – March 31
|
2
|
|
$
|
20.66
|
|
—
|
|
$
|
1,183,190
|
|
||||
|
April 1 – April 30
|
—
|
|
$
|
23.25
|
|
—
|
|
$
|
1,183,190
|
|
||||
|
3
|
|
$
|
21.13
|
|
—
|
|
||||||||
|
(1)
|
We purchased approximately
3 thousand
shares in connection with funding employee income tax withholding obligations arising upon the lapse of restrictions on restricted shares and restricted share units.
|
|
(2)
|
In September 2015, we announced that our Board of Directors approved a
$3.5 billion
share repurchase program, effective through June 2019.
|
PERFORMANCE GRAPH
– The following graph compares the cumulative five-year total return provided to shareholders on H&R Block, Inc.'s common stock relative to the cumulative total returns of the S&P 500 index and a selected peer group. The peer group used is based on companies with similar market capitalization or public companies in the tax return preparation industry.
An investment of $100, with reinvestment of all dividends, is assumed to have been made in our common stock and in each of the indexes on
April 30, 2012
, and its relative performance is tracked through April 30,
2017
.
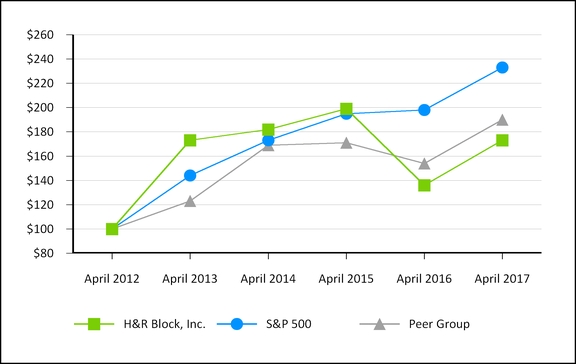
|
Note:
|
The peer group includes the following companies: Intuit Inc., Blucora, Inc., Liberty Tax, Inc., CBIZ, Inc., Resources Connection, Inc., ICF International, Inc., Willis Towers Watson PLC, Navigant Consulting, Inc., and Huron Consulting Group Inc.
|
|
H&R Block, Inc.
| 2017 Form 10-K
|
19
|
We derived the selected consolidated financial data presented below from our audited consolidated financial statements as of and for each of the five annual periods ending April 30,
2017
. Results of operations of fiscal years
2017
,
2016
and
2015
are discussed in
Item 7
. The data set forth below should be read in conjunction with
Item 7
and the consolidated financial statements in
Item 8
.
|
(in 000s, except per share amounts)
|
||||||||||||||||||||
|
April 30,
|
2017
|
|
2016
|
|
2015
|
|
2014
|
|
2013
|
|
||||||||||
|
Revenues
|
$
|
3,036,314
|
|
$
|
3,038,153
|
|
$
|
3,078,658
|
|
$
|
3,024,295
|
|
$
|
2,905,943
|
|
|||||
|
Net income from continuing operations
|
420,917
|
|
383,553
|
|
486,744
|
|
500,097
|
|
465,158
|
|
||||||||||
|
Net income
|
408,945
|
|
374,267
|
|
473,663
|
|
475,157
|
|
433,948
|
|
||||||||||
|
Basic earnings per share:
|
||||||||||||||||||||
|
Net income from continuing operations
|
$
|
1.97
|
|
$
|
1.54
|
|
$
|
1.77
|
|
$
|
1.82
|
|
$
|
1.70
|
|
|||||
|
Net income
|
1.92
|
|
1.50
|
|
1.72
|
|
1.73
|
|
1.59
|
|
||||||||||
|
Diluted earnings per share:
|
||||||||||||||||||||
|
Net income from continuing operations
|
$
|
1.96
|
|
$
|
1.53
|
|
$
|
1.75
|
|
$
|
1.81
|
|
$
|
1.69
|
|
|||||
|
Net income
|
1.91
|
|
1.49
|
|
1.71
|
|
1.72
|
|
1.58
|
|
||||||||||
|
Total assets
(1)
|
$
|
2,694,108
|
|
$
|
2,847,225
|
|
$
|
4,512,071
|
|
$
|
4,689,590
|
|
$
|
4,533,107
|
|
|||||
|
Long-term debt
(1) (2)
|
1,493,998
|
|
1,492,201
|
|
502,739
|
|
902,535
|
|
902,008
|
|
||||||||||
|
Stockholders’ equity (deficiency)
|
(60,883
|
)
|
23,103
|
|
1,832,949
|
|
1,556,549
|
|
1,263,547
|
|
||||||||||
|
Shares outstanding
|
207,171
|
|
220,517
|
|
275,275
|
|
274,228
|
|
272,635
|
|
||||||||||
|
Dividends per share
|
$
|
0.88
|
|
$
|
0.80
|
|
$
|
0.80
|
|
$
|
0.80
|
|
$
|
0.80
|
|
|||||
|
(1)
|
Amounts have been restated for the adoption of Accounting Standards Update No. 2015-3, "Interest - Imputation of Interest," (ASU 2015-3) which requires that debt issuance costs related to a recognized debt liability be presented in the balance sheet as a direct deduction from the carrying amount of that debt liability, consistent with debt discounts.
|
|
(2)
|
Includes current portion of long-term debt.
|
FINANCIAL OVERVIEW
A summary of our fiscal year
2017
results is as follows:
|
▪
|
Revenues decreased
$1.8 million
, or
0.1%
, compared to the prior year. Revenues were negatively impacted by a
2.5%
decline in assisted tax returns prepared (company-owned and franchise offices combined), coupled with our H&R Block More Zero
SM
and Free 1040EZ promotions, which also reduced demand for RTs. These negative impacts were partially offset by favorable pricing and mix changes on our assisted tax returns and better performance of our financial products.
|
|
▪
|
Operating expenses declined
$84.6 million
, or
3.5%
, due to a combination of lower marketing spend, lower consulting costs, and lower compensation and bad debt expense.
|
|
▪
|
Pretax earnings increased
$59.8 million
, or
10.5%
, due primarily to the expense savings mentioned above.
|
|
▪
|
Net income from continuing operations increased
$37.4 million
or
9.7%
compared with the prior year. Diluted earnings per share from continuing operations increased
28.1%
from the prior year to
$1.96
due to a
14.6%
decline in diluted weighted average shares outstanding and higher net income.
|
|
▪
|
Earnings from continuing operations before interest, taxes, depreciation and amortization (EBITDA) increased
$92.2 million
, or
11.4%
, to
$904.4 million
. Adjusted EBITDA increased
$66.3 million
, or
7.9%
, to
$904.9 million
. See "Non-GAAP Financial Information" at the end of this item for a reconciliation of non-GAAP measures.
|
RESULTS OF OPERATIONS
Our subsidiaries provide assisted and DIY tax return preparation solutions through multiple channels (including in-person, online and mobile applications, and desktop software) and distribute the H&R Block-branded financial
|
20
|
2017 Form 10-K |
H&R Block, Inc.
|
products and services, including those of our financial partners to the general public primarily in the U.S., Canada, Australia, and their respective territories. Tax returns are either prepared by H&R Block tax professionals (in company-owned or franchise offices or virtually via the internet) or prepared and filed by our clients through our DIY tax solutions. We operate as a single segment that includes all of our continuing operations, which are designed to enable clients to obtain tax preparation services seamlessly.
|
Operating Statistics
|
||||||||||||
|
Year ended April 30,
|
2017
|
|
2016
|
|
2015
|
|
||||||
|
TAX RETURNS PREPARED :
(in 000s)
(1)
|
||||||||||||
|
United States:
|
||||||||||||
|
Company-owned operations
|
7,999
|
|
8,079
|
|
8,311
|
|
||||||
|
Franchise operations
|
3,908
|
|
4,139
|
|
4,672
|
|
||||||
|
Total assisted returns
|
11,907
|
|
12,218
|
|
12,983
|
|
||||||
|
Desktop
|
2,003
|
|
2,085
|
|
2,168
|
|
||||||
|
Online
|
4,988
|
|
4,670
|
|
4,765
|
|
||||||
|
Free File
|
588
|
|
678
|
|
676
|
|
||||||
|
Total DIY tax software
|
7,579
|
|
7,433
|
|
7,609
|
|
||||||
|
Total U.S. returns
|
19,486
|
|
19,651
|
|
20,592
|
|
||||||
|
International operations:
|
||||||||||||
|
Canada
(2)
|
2,460
|
|
2,551
|
|
2,658
|
|
||||||
|
Australia
|
750
|
|
769
|
|
768
|
|
||||||
|
Other
|
293
|
|
153
|
|
115
|
|
||||||
|
Total international operations
|
3,503
|
|
3,473
|
|
3,541
|
|
||||||
|
Tax returns prepared worldwide
|
22,989
|
|
23,124
|
|
24,133
|
|
||||||
|
NET AVERAGE CHARGE (U.S. ONLY):
(3)
|
||||||||||||
|
Company-owned operations
|
$
|
237.29
|
|
$
|
233.84
|
|
$
|
224.51
|
|
|||
|
Franchise operations
(4)
|
$
|
207.43
|
|
$
|
201.47
|
|
$
|
196.07
|
|
|||
|
Total DIY tax software
|
$
|
31.34
|
|
$
|
34.69
|
|
$
|
33.44
|
|
|||
|
TAX OFFICES
(at the peak of the tax season)
:
|
||||||||||||
|
U.S. offices:
|
||||||||||||
|
Total company-owned offices
|
6,650
|
|
6,614
|
|
6,365
|
|
||||||
|
Total franchise offices
|
3,386
|
|
3,599
|
|
3,921
|
|
||||||
|
Total U.S. offices
|
10,036
|
|
10,213
|
|
10,286
|
|
||||||
|
International offices
:
|
||||||||||||
|
Canada
|
1,216
|
|
1,282
|
|
1,231
|
|
||||||
|
Australia
|
449
|
|
438
|
|
433
|
|
||||||
|
Total international offices
|
1,665
|
|
1,720
|
|
1,664
|
|
||||||
|
Tax offices worldwide
|
11,701
|
|
11,933
|
|
11,950
|
|
||||||
|
(1)
|
An assisted tax return is defined as a current or prior year individual tax return that has been accepted and paid for by the client. Also included are business returns. The count methodology has been adjusted in the current and prior year periods to exclude extensions and to recognize the corresponding individual tax returns when filed. A DIY software return is defined as a return that has been electronically filed and accepted by the IRS. Also included are online returns paid and printed.
|
|
(2)
|
In fiscal years
2017
,
2016
and
2015
, the end of the Canadian tax season was extended from April 30 into May. Tax returns prepared in Canada in fiscal years 2017, 2016 and 2015 includes approximately
59 thousand
,
93 thousand
and
131 thousand
returns, respectively, in both company-owned and franchise offices which were accepted by the client after April 30. The revenues related to these returns were recognized in fiscal years
2018
,
2017
and
2016
, respectively.
|
|
(3)
|
Net average charge is calculated as total revenue divided by total returns. For DIY tax software, net average charge excludes Free File.
|
|
(4)
|
Net average charge related to H&R Block Franchise Operations represents tax preparation fee revenues collected by H&R Block franchisees divided by returns filed in franchise offices. H&R Block will recognize a portion of franchise revenues as franchise royalties based on the terms of franchise agreements.
|
We provide Net Average Charge as a key operating metric because we consider it an important supplemental measure useful to analysts, investors, and other interested parties as it provides insights into pricing and tax return mix relative to our customer base, which are significant drivers of revenue. Our definition of Net Average Charge may not be comparable to similarly titled measures of other companies.
|
H&R Block, Inc.
| 2017 Form 10-K
|
21
|
|
Consolidated – Financial Results
|
(in 000s, except per share amounts)
|
||||||||||||||
|
Year ended April 30,
|
2017
|
2016
|
$ Change
|
% Change
|
|||||||||||
|
Revenues:
|
|||||||||||||||
|
U.S. assisted tax preparation fees
|
$
|
1,902,212
|
|
$
|
1,890,175
|
|
$
|
12,037
|
|
0.6
|
%
|
||||
|
U.S. royalties
|
250,270
|
|
249,433
|
|
837
|
|
0.3
|
%
|
|||||||
|
U.S. DIY tax preparation fees
|
219,123
|
|
234,341
|
|
(15,218
|
)
|
(6.5
|
)%
|
|||||||
|
International revenues
|
210,320
|
|
213,400
|
|
(3,080
|
)
|
(1.4
|
)%
|
|||||||
|
Revenues from Refund Transfers
|
148,212
|
|
162,560
|
|
(14,348
|
)
|
(8.8
|
)%
|
|||||||
|
Revenues from Emerald Card®
|
95,221
|
|
92,608
|
|
2,613
|
|
2.8
|
%
|
|||||||
|
Revenues from Peace of Mind® Extended Service Plan
|
92,820
|
|
86,830
|
|
5,990
|
|
6.9
|
%
|
|||||||
|
Interest and fee income on Emerald Advance
|
57,022
|
|
57,268
|
|
(246
|
)
|
(0.4
|
)%
|
|||||||
|
Other
|
61,114
|
|
51,538
|
|
9,576
|
|
18.6
|
%
|
|||||||
|
Total revenues
|
3,036,314
|
|
3,038,153
|
|
(1,839
|
)
|
(0.1
|
)%
|
|||||||
|
Compensation and benefits:
|
|||||||||||||||
|
Field wages
|
702,518
|
|
724,019
|
|
(21,501
|
)
|
(3.0
|
)%
|
|||||||
|
Other wages
|
181,735
|
|
166,445
|
|
15,290
|
|
9.2
|
%
|
|||||||
|
Benefits and other compensation
|
163,368
|
|
183,512
|
|
(20,144
|
)
|
(11.0
|
)%
|
|||||||
|
1,047,621
|
|
1,073,976
|
|
(26,355
|
)
|
(2.5
|
)%
|
||||||||
|
Occupancy and equipment
|
415,002
|
|
405,493
|
|
9,509
|
|
2.3
|
%
|
|||||||
|
Marketing and advertising
|
261,281
|
|
297,762
|
|
(36,481
|
)
|
(12.3
|
)%
|
|||||||
|
Depreciation and amortization
|
182,168
|
|
173,598
|
|
8,570
|
|
4.9
|
%
|
|||||||
|
Bad debt
|
52,776
|
|
75,395
|
|
(22,619
|
)
|
(30.0
|
)%
|
|||||||
|
Supplies
|
33,847
|
|
36,340
|
|
(2,493
|
)
|
(6.9
|
)%
|
|||||||
|
Other
|
327,635
|
|
342,397
|
|
(14,762
|
)
|
(4.3
|
)%
|
|||||||
|
Total operating expenses
|
2,320,330
|
|
2,404,961
|
|
(84,631
|
)
|
(3.5
|
)%
|
|||||||
|
Other income (expense), net
|
6,254
|
|
5,249
|
|
1,005
|
|
19.1
|
%
|
|||||||
|
Interest expense on borrowings
|
(92,951
|
)
|
(68,962
|
)
|
(23,989
|
)
|
(34.8
|
)%
|
|||||||
|
Pretax income
|
629,287
|
|
569,479
|
|
59,808
|
|
10.5
|
%
|
|||||||
|
Income taxes
|
208,370
|
|
185,926
|
|
22,444
|
|
12.1
|
%
|
|||||||
|
Net income from continuing operations
|
420,917
|
|
383,553
|
|
37,364
|
|
9.7
|
%
|
|||||||
|
Net loss from discontinued operations
|
(11,972
|
)
|
(9,286
|
)
|
(2,686
|
)
|
(28.9
|
)%
|
|||||||
|
Net income
|
$
|
408,945
|
|
$
|
374,267
|
|
$
|
34,678
|
|
9.3
|
%
|
||||
|
Basic earnings (loss) per share:
|
|||||||||||||||
|
Continuing operations
|
$
|
1.97
|
|
$
|
1.54
|
|
$
|
0.43
|
|
27.9
|
%
|
||||
|
Discontinued operations
|
(0.05
|
)
|
(0.04
|
)
|
(0.01
|
)
|
(25.0
|
)%
|
|||||||
|
Consolidated
|
$
|
1.92
|
|
$
|
1.50
|
|
$
|
0.42
|
|
28.0
|
%
|
||||
|
Diluted earnings (loss) per share:
|
|||||||||||||||
|
Continuing operations
|
$
|
1.96
|
|
$
|
1.53
|
|
$
|
0.43
|
|
28.1
|
%
|
||||
|
Discontinued operations
|
(0.05
|
)
|
(0.04
|
)
|
(0.01
|
)
|
(25.0
|
)%
|
|||||||
|
Consolidated
|
$
|
1.91
|
|
$
|
1.49
|
|
$
|
0.42
|
|
28.2
|
%
|
||||
|
EBITDA from continuing operations
(1)
|
$
|
904,406
|
|
$
|
812,218
|
|
$
|
92,188
|
|
11.4
|
%
|
||||
|
EBITDA from continuing operations - adjusted
(1)
|
904,922
|
|
838,654
|
|
66,268
|
|
7.9
|
%
|
|||||||
|
(1)
|
See "Non-GAAP Financial Information" at the end of this item for a reconciliation of non-GAAP measures.
|
FISCAL
2017
COMPARED TO FISCAL
2016
Revenues decreased
$1.8 million
, or
0.1%
, compared to the prior year.
U.S. assisted tax preparation fees increased
$12.0 million
, or
0.6%
, primarily due to a more favorable net average charge and mix, offset by a decline in tax returns prepared in company-owned offices. Although franchise returns were down
5.6%
primarily due to our acquisition of franchise businesses during the year, royalties related to our new Refund Advance offering offset the lower volumes.
|
22
|
2017 Form 10-K |
H&R Block, Inc.
|
U.S. DIY tax preparation fees declined
$15.2 million
, or
6.5%
, due to our H&R Block More Zero
SM
promotion, which offered free online tax preparation for certain forms. This decrease was partially offset by a
3.5%
increase in returns.
Fees earned on RTs decreased
$14.3 million
, or
8.8%
, primarily due to lower attach rates due to our H&R Block More Zero
SM
and Free 1040EZ promotions and the offering of state RTs at no cost.
Revenue from POM increased
$6.0 million
, or
6.9%
, primarily due to an increase in units sold in prior years and favorable changes in the timing of forecasted claims. This revenue is initially deferred, and recognized over the term of the service plan based on actual claims paid in relation to projected claims.
Other revenues increased
$9.6 million
, or
18.6%
, primarily due to the fees earned on our TIS product, partially offset by a decline in income on our mortgage loan portfolio and investments in available-for-sale (AFS) securities recorded as other income in the current year rather than as revenue for a portion of the prior year. See Item 8,
note 11
to the consolidated financial statements.
Total operating expenses decreased
$84.6 million
, or
3.5%
, from the prior year. Total compensation and benefits decreased
$26.4 million
primarily due to lower headcount in our field and corporate operations and lower commission-based wages due to lower return volumes. These declines were partially offset by an increase in short-term incentive compensation. Occupancy and equipment expenses increased
$9.5 million
, or
2.3%
, primarily due to higher rental rates on tax offices. Marketing and advertising expenses decreased
$36.5 million
, or
12.3%
, primarily due to our prior year sweepstakes campaign. Depreciation and amortization expense increased
$8.6 million
, or
4.9%
, primarily due to amortization resulting from acquisitions of franchisee and competitor businesses. Bad debt expense decreased
$22.6 million
, or
30.0%
, primarily due to favorable collections on prior year EAs and RTs, and a reduction in overall bad debt rate on current year balances.
Other expenses decreased
$14.8 million
, or
4.3%
, primarily due to prior year costs associated with capital transactions and the divestiture of HRB Bank and cost savings initiatives. These were partially offset by higher fees paid to our bank partners in the current year for products and services they offer to our clients, including program costs related to our RA offering introduced in the current year. The components of other expenses are as follows:
|
Year ended April 30,
|
2017
|
2016
|
$ Change
|
% Change
|
|||||||||||
|
Consulting and outsourced services
|
$
|
104,995
|
|
$
|
140,052
|
|
$
|
(35,057
|
)
|
(25.0
|
)%
|
||||
|
Bank partner fees
|
47,479
|
|
16,980
|
|
30,499
|
|
179.6
|
%
|
|||||||
|
Client claims and refunds
|
42,618
|
|
39,782
|
|
2,836
|
|
7.1
|
%
|
|||||||
|
Employee travel and related expenses
|
38,719
|
|
46,665
|
|
(7,946
|
)
|
(17.0
|
)%
|
|||||||
|
Credit card/bank charges
|
28,658
|
|
28,618
|
|
40
|
|
0.1
|
%
|
|||||||
|
Insurance
|
13,320
|
|
12,167
|
|
1,153
|
|
9.5
|
%
|
|||||||
|
Legal fees and settlements
|
12,589
|
|
18,707
|
|
(6,118
|
)
|
(32.7
|
)%
|
|||||||
|
Other
|
39,257
|
|
39,426
|
|
(169
|
)
|
(0.4
|
)%
|
|||||||
|
$
|
327,635
|
|
$
|
342,397
|
|
$
|
(14,762
|
)
|
(4.3
|
)%
|
|||||
Interest expense increased
$24.0 million
, or
34.8%
, due primarily to issuance of our Senior Notes during fiscal year 2016 in the aggregate principal amount of $1.0 billion.
Pretax income for fiscal year
2017
increased
$59.8 million
, or
10.5%
, while our pretax margin increased to
20.7%
from
18.7%
in fiscal year
2016
. Net income from continuing operations increased
$37.4 million
, or
9.7%
, over the prior year. Diluted earnings per share from continuing operations increased
28.1%
from the prior year to
$1.96
due to a
14.6%
decline in diluted weighted average shares outstanding and higher net income.
Losses of our discontinued mortgage operations resulted primarily from litigation expenses. See the discussion of the risk of contingent losses related to our discontinued operations in Item 1A, "Risk Factors" and in Item 8, notes
13
and
14
to the consolidated financial statements.
|
H&R Block, Inc.
| 2017 Form 10-K
|
23
|
|
Consolidated – Financial Results
|
(in 000s, except per share amounts)
|
||||||||||||||
|
Year ended April 30,
|
2016
|
2015
|
$ Change
|
% Change
|
|||||||||||
|
Revenues:
|
|||||||||||||||
|
U.S. assisted tax preparation fees
|
$
|
1,890,175
|
|
$
|
1,865,438
|
|
$
|
24,737
|
|
1.3
|
%
|
||||
|
U.S. royalties
|
249,433
|
|
273,250
|
|
(23,817
|
)
|
(8.7
|
)%
|
|||||||
|
U.S. DIY tax preparation fees
|
234,341
|
|
231,854
|
|
2,487
|
|
1.1
|
%
|
|||||||
|
International revenues
|
213,400
|
|
236,552
|
|
(23,152
|
)
|
(9.8
|
)%
|
|||||||
|
Revenues from Refund Transfers
|
162,560
|
|
167,787
|
|
(5,227
|
)
|
(3.1
|
)%
|
|||||||
|
Revenues from Emerald Card®
|
92,608
|
|
103,300
|
|
(10,692
|
)
|
(10.4
|
)%
|
|||||||
|
Revenues from Peace of Mind® Extended Service Plan
|
86,830
|
|
81,551
|
|
5,279
|
|
6.5
|
%
|
|||||||
|
Interest and fee income on Emerald Advance
|
57,268
|
|
57,202
|
|
66
|
|
0.1
|
%
|
|||||||
|
Other
|
51,538
|
|
61,724
|
|
(10,186
|
)
|
(16.5
|
)%
|
|||||||
|
Total revenues
|
3,038,153
|
|
3,078,658
|
|
(40,505
|
)
|
(1.3
|
)%
|
|||||||
|
Compensation and benefits:
|
|||||||||||||||
|
Field wages
|
724,019
|
|
731,309
|
|
(7,290
|
)
|
(1.0
|
)%
|
|||||||
|
Other wages
|
166,445
|
|
176,697
|
|
(10,252
|
)
|
(5.8
|
)%
|
|||||||
|
Benefits and other compensation
|
183,512
|
|
183,001
|
|
511
|
|
0.3
|
%
|
|||||||
|
1,073,976
|
|
1,091,007
|
|
(17,031
|
)
|
(1.6
|
)%
|
||||||||
|
Occupancy and equipment
|
405,493
|
|
375,743
|
|
29,750
|
|
7.9
|
%
|
|||||||
|
Marketing and advertising
|
297,762
|
|
273,682
|
|
24,080
|
|
8.8
|
%
|
|||||||
|
Depreciation and amortization
|
173,598
|
|
159,804
|
|
13,794
|
|
8.6
|
%
|
|||||||
|
Bad debt
|
75,395
|
|
74,993
|
|
402
|
|
0.5
|
%
|
|||||||
|
Supplies
|
36,340
|
|
42,872
|
|
(6,532
|
)
|
(15.2
|
)%
|
|||||||
|
Other
|
342,397
|
|
265,891
|
|
76,506
|
|
28.8
|
%
|
|||||||
|
Total operating expenses
|
2,404,961
|
|
2,283,992
|
|
120,969
|
|
5.3
|
%
|
|||||||
|
Other income (expense), net
|
5,249
|
|
(6,615
|
)
|
11,864
|
|
**
|
|
|||||||
|
Interest expense on borrowings
|
(68,962
|
)
|
(45,246
|
)
|
(23,716
|
)
|
(52.4
|
)%
|
|||||||
|
Pretax income
|
569,479
|
|
742,805
|
|
(173,326
|
)
|
(23.3
|
)%
|
|||||||
|
Income taxes
|
185,926
|
|
256,061
|
|
(70,135
|
)
|
(27.4
|
)%
|
|||||||
|
Net income from continuing operations
|
383,553
|
|
486,744
|
|
(103,191
|
)
|
(21.2
|
)%
|
|||||||
|
Net loss from discontinued operations
|
(9,286
|
)
|
(13,081
|
)
|
3,795
|
|
29.0
|
%
|
|||||||
|
Net income
|
$
|
374,267
|
|
$
|
473,663
|
|
$
|
(99,396
|
)
|
(21.0
|
)%
|
||||
|
Basic earnings (loss) per share:
|
|||||||||||||||
|
Continuing operations
|
$
|
1.54
|
|
$
|
1.77
|
|
$
|
(0.23
|
)
|
(13.0
|
)%
|
||||
|
Discontinued operations
|
(0.04
|
)
|
(0.05
|
)
|
0.01
|
|
20.0
|
%
|
|||||||
|
Consolidated
|
$
|
1.50
|
|
$
|
1.72
|
|
$
|
(0.22
|
)
|
(12.8
|
)%
|
||||
|
Diluted earnings (loss) per share:
|
|||||||||||||||
|
Continuing operations
|
$
|
1.53
|
|
$
|
1.75
|
|
$
|
(0.22
|
)
|
(12.6
|
)%
|
||||
|
Discontinued operations
|
(0.04
|
)
|
(0.04
|
)
|
—
|
|
—
|
%
|
|||||||
|
Consolidated
|
$
|
1.49
|
|
$
|
1.71
|
|
$
|
(0.22
|
)
|
(12.9
|
)%
|
||||
|
EBITDA from continuing operations
(1)
|
$
|
812,218
|
|
$
|
948,537
|
|
$
|
(136,319
|
)
|
(14.4
|
)%
|
||||
|
EBITDA from continuing operations - adjusted
(1)
|
838,654
|
|
951,006
|
|
(112,352
|
)
|
(11.8
|
)%
|
|||||||
|
(1)
|
See "Non-GAAP Financial Information" at the end of this item for a reconciliation of non-GAAP measures.
|
FISCAL
2016
COMPARED TO FISCAL
2015
Revenues decreased
$40.5 million
, or
1.3%
, compared to fiscal year
2015
.
U.S. assisted tax preparation fees increased
$24.7 million
, or
1.3%
, while U.S. royalty revenues declined
$23.8 million
, or
8.7%
. We acquired a number of franchisee businesses during the year, and declines in royalty revenues are due primarily to the associated loss of royalties when those businesses are acquired, and to a lesser extent, a decline in client volumes served by franchise offices. Return counts in our company-owned offices, excluding the impact of returns prepared in those offices resulting from acquired franchisee businesses, declined
6.2%
from fiscal year
2015
.
|
24
|
2017 Form 10-K |
H&R Block, Inc.
|
Tax preparation fees from our U.S. DIY business increased
$2.5 million
, or
1.1%
, as improved monetization for new and existing clients coupled with an increase in product attach rates were partially offset by a
2.6%
decrease in returns.
International revenues decreased
$23.2 million
, or
9.8%
. The decrease was driven by a
$26.8 million
decline resulting from unfavorable changes in foreign currency exchange rates, partially offset by favorable volume and price changes.
Fees earned on RTs decreased
$5.2 million
, or
3.1%
, primarily due to lower assisted return volumes.
Revenues from H&R Block Emerald Prepaid MasterCard
®
transactions decreased
$10.7 million
, or
10.4%
, primarily due to our agreement with BofI and lower assisted return volumes.
Revenue from POM increased
$5.3 million
, or
6.5%
, in fiscal year 2016 primarily due to a change in projected claims.
Other revenues declined
$10.2 million
, or
16.5%
, primarily due to the presentation of income from our mortgage loan portfolio and investments in AFS securities as other income beginning in fiscal year 2016, rather than as revenue in fiscal year 2015.
Total operating expenses increased
$121.0 million
, or
5.3%
, from fiscal year
2015
. Total compensation and benefits decreased
$17.0 million
primarily due to a decline in short-term incentive compensation and the impact of changes in foreign currency exchange rates. Occupancy and equipment expenses increased
$29.8 million
, or
7.9%
, primarily due to a
4.0%
increase in company-owned offices resulting from acquisitions of franchisee and competitor businesses. Marketing and advertising expenses increased
$24.1 million
due to planned increases in tax season spend, including our sweepstakes campaign. Depreciation and amortization expense increased
$13.8 million
, or
8.6%
, primarily due to amortization resulting from acquisitions of franchisee and competitor businesses.
Other expenses increased
$76.5 million
, or
28.8%
, primarily due to costs associated with capital transactions and the divestiture of HRB Bank, and fees paid to BofI for products and services they offer to our clients. The components of other expenses are as follows:
|
Year ended April 30,
|
2016
|
2015
|
$ Change
|
% Change
|
|||||||||||
|
Consulting and outsourced services
|
$
|
140,052
|
|
$
|
113,616
|
|
$
|
26,436
|
|
23.3
|
%
|
||||
|
Bank partner fees
|
16,980
|
|
—
|
|
16,980
|
|
**
|
|
|||||||
|
Client claims and refunds
|
39,782
|
|
28,337
|
|
11,445
|
|
40.4
|
%
|
|||||||
|
Employee travel and related expenses
|
46,665
|
|
44,660
|
|
2,005
|
|
4.5
|
%
|
|||||||
|
Credit card/bank charges
|
28,618
|
|
23,668
|
|
4,950
|
|
20.9
|
%
|
|||||||
|
Insurance
|
12,167
|
|
11,330
|
|
837
|
|
7.4
|
%
|
|||||||
|
Legal fees and settlements
|
18,707
|
|
7,185
|
|
11,522
|
|
160.4
|
%
|
|||||||
|
Other
|
39,426
|
|
37,095
|
|
2,331
|
|
6.3
|
%
|
|||||||
|
$
|
342,397
|
|
$
|
265,891
|
|
$
|
76,506
|
|
28.8
|
%
|
|||||
Other income (expense) improved
$11.9 million
, primarily due to the inclusion of interest income on our mortgage loan portfolio and AFS securities (reported as revenue in fiscal year 2015), as discussed above and in Item 8,
note 11
to the consolidated financial statements. Interest expense increased
$23.7 million
, or
52.4%
, due primarily to issuance of our Senior Notes in September 2015 in the aggregate principal amount of $1.0 billion.
Pretax income for fiscal year
2016
decreased
$173.3 million
, or
23.3%
, from the prior year. The pretax margin decreased to
18.7%
in fiscal year
2016
from
24.1%
in fiscal year
2015
. Net income from continuing operations declined
$103.2 million
or
21.2%
compared with the prior year. Diluted earnings per share from continuing operations decreased
12.6%
from the prior year to
$1.53
due to the decline in net income, partially offset by a
9.5%
decline in weighted average shares outstanding.
Pretax losses of our discontinued mortgage operations totaled
$18.6 million
, compared to
$27.1 million
in fiscal year
2015
, and resulted primarily from loss provisions related to SCC's estimated contingent losses for representation and warranty claims of
$4.0 million
and
$16.0 million
for fiscal years
2016
and
2015
, respectively.
|
H&R Block, Inc.
| 2017 Form 10-K
|
25
|
CRITICAL ACCOUNTING ESTIMATES
We consider the estimates discussed below to be critical to understanding our financial statements, as they require the use of significant judgment and estimation in order to measure, at a specific point in time, matters that are inherently uncertain. Specific methods and assumptions for these critical accounting estimates are described in the following paragraphs. We have reviewed and discussed each of these estimates with the Audit Committee of our Board of Directors. For all of these estimates, we caution that future events rarely develop precisely as forecasted and estimates routinely require adjustment and may require material adjustment.
See
Item 8
,
note 1
to the consolidated financial statements, which discusses accounting policies and new or proposed accounting standards that may affect our financial reporting in the future.
LITIGATION AND OTHER RELATED CONTINGENCIES
–
Nature of Estimates Required.
We accrue liabilities related to certain legal matters for which we believe it is probable that a loss has been incurred and the amount of such loss can be reasonably estimated. Assessing the likely outcome of pending or threatened litigation, indemnification and contribution claims, and other related loss contingencies, including the amount of potential loss, if any, is highly subjective.
Assumptions and Approach Used.
We are subject to pending or threatened litigation claims and claims for indemnification and contribution, and other related loss contingencies, which are described in
Item 8
, note
13
to the consolidated financial statements. It is our policy to routinely assess the likelihood of any adverse judgments or outcomes related to legal matters, as well as ranges of probable losses. A determination of the amount of the liability required to be accrued, if any, for these contingencies is made after analysis of each known issue and an analysis of historical experience. In cases where we have concluded that a loss is only reasonably possible or remote, or is not reasonably estimable, no liability is accrued.
Sensitivity of Estimate to Change.
It is reasonably possible that future litigation and other related loss contingencies may vary from the amounts accrued. Our aggregate range of reasonably possible losses includes (1) matters where a liability has been accrued and there is a reasonably possible loss in excess of the amount accrued for that liability, and (2) matters where a loss is believed to be reasonably possible, but a liability has not been accrued. This aggregate range represents only those losses as to which we are currently able to estimate a reasonably possible loss or range of loss. It does not represent our maximum loss exposure. As of April 30,
2017
, we believe the aggregate range of reasonably possible losses in excess of amounts accrued is not material.
However, our judgments on whether a loss is probable, reasonably possible, or remote, and our estimates of probable loss amounts may differ from actual results due to difficulties in predicting the outcome of jury trials, arbitration hearings, settlement discussions and related activity, predicting the outcome of class certification actions, and numerous other uncertainties. Due to the number of claims which are periodically asserted against us, and the magnitude of damages sought in those claims, actual losses in the future may significantly differ from our current estimates.
INCOME TAXES
–
UNCERTAIN TAX POSITIONS
–
Nature of Estimates Required.
The income tax laws of jurisdictions in which we operate are complex and subject to different interpretations by the taxpayer and applicable government taxing authorities. Income tax returns filed by us are based on our interpretation of these rules. The amount of income taxes we pay is subject to ongoing audits by federal, state and foreign tax authorities, which may result in proposed assessments, including interest or penalties. We accrue a liability for unrecognized tax benefits arising from uncertain tax positions reflecting our judgment as to the ultimate resolution of the applicable issues.
Assumptions and Approach Used.
Differences between a tax position taken or expected to be taken in our tax returns and the amount of benefit recorded in our financial statements result in unrecognized tax benefits. Unrecognized tax benefits are recorded in the balance sheet as either a liability or reductions to recorded tax assets, as applicable. Our uncertain tax positions arise from items such as apportionment of income for state purposes, transfer pricing, and the deductibility of related party transactions. We evaluate each uncertain tax position based on its technical merits. For each position, we consider all applicable information including relevant tax laws, the taxing authorities potential position, our tax return position, and the possible settlement outcomes to determine the amount
|
26
|
2017 Form 10-K |
H&R Block, Inc.
|
of liability to record. In making this determination, we assume the tax authority has all relevant information at its disposal.
Sensitivity of Estimate to Change.
Our assessment of the technical merits and measurement of tax benefits associated with uncertain tax positions is subject to a high degree of judgment and estimation. Actual results may differ from our current judgments due to a variety of factors, including changes in law, interpretations of law by taxing authorities that differ from our assessments, changes in the jurisdictions in which we operate and results of routine tax examinations. We believe we have adequately provided for any reasonably foreseeable outcome related to these matters. However, our future results may include favorable or unfavorable adjustments to our estimated tax liabilities in the period the assessments are made or resolved, or when statutes of limitation on potential assessments expire. As a result, our effective tax rate may fluctuate on a quarterly basis.
As of April 30,
2017
, we accrued liabilities for unrecognized tax benefits on uncertain tax positions of approximately
$150 million
. Of the total gross unrecognized tax benefits as of April 30,
2017
, approximately
$118 million
would impact our effective tax rate if ultimately recognized.
NEW ACCOUNTING PRONOUNCEMENTS
See
Item 8
,
note 1
to the consolidated financial statements for a discussion of recently issued accounting pronouncements.
FINANCIAL CONDITION
These comments should be read in conjunction with the consolidated balance sheets and consolidated statements of cash flows included in
Item 8
.
CAPITAL RESOURCES AND LIQUIDITY
–
OVERVIEW
– Our primary sources of capital and liquidity include cash from operations (including changes in working capital), draws on our 2016 CLOC, and issuances of debt. We use our sources of liquidity primarily to fund working capital, service and repay debt, pay dividends, repurchase shares of our common stock, and acquire businesses.
Our operations are highly seasonal and substantially all of our revenues and cash flow are generated during the period from February through April. Therefore, we require the use of cash to fund losses and working capital needs from May through January, and typically rely on available cash balances from the prior tax season and borrowings to meet our off-season liquidity needs.
Given the likely availability of a number of liquidity options discussed herein, we believe that, in the absence of any unexpected developments, our existing sources of capital as of April 30,
2017
are sufficient to meet our future operating and financing needs.
|
(in 000s)
|
|
|||||||||||
|
Year ended April 30,
|
2017
|
|
2016
|
|
2015
|
|
||||||
|
Net cash provided by (used in):
|
||||||||||||
|
Operating activities
|
$
|
550,093
|
|
$
|
532,394
|
|
$
|
626,608
|
|
|||
|
Investing activities
|
99,319
|
|
329,515
|
|
(148,932
|
)
|
||||||
|
Financing activities
|
(530,424
|
)
|
(1,961,729
|
)
|
(645,807
|
)
|
||||||
|
Effects of exchange rate changes on cash
|
(4,458
|
)
|
(10,569
|
)
|
(9,986
|
)
|
||||||
|
Net change in cash and cash equivalents
|
$
|
114,530
|
|
$
|
(1,110,389
|
)
|
$
|
(178,117
|
)
|
|||
Operating Activities.
Cash provided by operating activities
increased
$17.7 million
from fiscal year
2016
. The increase from the prior year was primarily due to higher net income and changes in tax balances, partially offset by declines in payables balances.
Investing Activities.
Cash provided by investing activities totaled
$99.3 million
compared to
$329.5 million
in the prior year. This decrease is principally due to the sale of our AFS securities in the prior year, partially offset by the sale of our portfolio of mortgage loans in the current year, a decrease of
$34.0 million
in payments for business acquisitions, and a decrease of
$10.7 million
in capital expenditures.
|
H&R Block, Inc.
| 2017 Form 10-K
|
27
|
Financing Activities.
Cash used in financing activities decreased
$1.4 billion
. Changes in cash from financing activities resulted primarily from lower share repurchase activity and prior year customer deposit activity, partially offset by the issuance of debt in the prior year.
CASH REQUIREMENTS
–
Dividends and Share Repurchase.
Returning capital to shareholders in the form of dividends and the repurchase of outstanding shares has historically been a significant component of our capital allocation plan.
We have consistently paid quarterly dividends. Dividends paid totaled
$187.1 million
,
$201.7 million
and
$220.0 million
in fiscal years
2017
,
2016
and
2015
, respectively. The decline from the prior years is due to lower outstanding
shares as a result of share repurchase activity. Although we have historically paid dividends and plan to continue to do so, there can be no assurances that circumstances will not change in the future that could affect our ability or decisions to pay dividends.
In September 2015, we announced that our Board of Directors approved a
$3.5 billion
share repurchase program, effective through June 2019. As a part of the repurchase program, in the current year, we purchased
$317.0 million
of our common stock at an average price of
$22.61
per share. See Item 8,
note 8
to the consolidated financial statements for additional information. Although we may continue to repurchase shares, there is no assurance that we will purchase up to the full Board authorization.
Capital Investment.
Our business is not capital intensive. Capital expenditures totaled
$89.3 million
and
$99.9 million
in fiscal years
2017
and
2016
, respectively. Our capital expenditures relate primarily to recurring improvements to retail offices, as well as investments in computers, software and related assets. In addition, we expended net cash totaling
$54.8 million
and
$88.8 million
in fiscal years
2017
and
2016
, respectively, in connection with acquired businesses. We routinely acquire competitor tax businesses and franchisees, and recurring capital allocated to acquisitions consists primarily of this activity.
FINANCING RESOURCES
– Our 2016 CLOC has capacity up to $2.0 billion, and is scheduled to expire in September
2021. Proceeds under the 2016 CLOC may be used for working capital needs or for other general corporate purposes. We were in compliance with our 2016 CLOC covenants as of April 30,
2017
. As of April 30,
2017
, amounts available to borrow under the 2016 CLOC were limited by the debt-to-EBITDA covenant to approximately
$1.6 billion
, however, our cash needs at April 30 generally do not require us to borrow on our CLOC at that time. We had no balance outstanding under the 2016 CLOC as of April 30,
2017
. See Item 8,
note 6
to the consolidated financial statements for discussion of the Senior Notes and our 2016 CLOC.
The following table provides ratings for debt issued by Block Financial as of April 30,
2017
and
2016
:
|
As of
|
April 30, 2017
|
April 30, 2016
|
||||||||||
|
Short-term
|
Long-term
|
Outlook
|
Short-term
|
Long-term
|
Outlook
|
|||||||
|
Moody's
|
P-3
|
Baa3
|
Stable
|
P-3
|
Baa3
|
Stable
|
||||||
|
S&P
(1)
|
A-2
|
BBB
|
Negative
|
A-2
|
BBB
|
Stable
|
||||||
(1)
Outlook of Stable effective June 14, 2017.
CASH AND OTHER ASSETS
– As of April 30,
2017
, we held cash and cash equivalents of
$1.0 billion
, including
$63.4 million
held by our foreign subsidiaries.
In December 2016 we sold our portfolio of mortgage loans and real estate owned. Cash proceeds received approximated carrying value.
Foreign Operations.
Seasonal borrowing needs of our Canadian operations are typically funded by our U.S. operations. To mitigate foreign currency risk, we sometimes enter into foreign exchange forward contracts. There was one forward contract outstanding as of April 30,
2017
, which had a book value of
$0.5 million
.
While our Canadian operations made a one-time distribution of previously taxed income to their U.S. parent in fiscal year 2017, we do not currently intend to repatriate any additional non-borrowed funds held by our foreign subsidiaries.
|
28
|
2017 Form 10-K |
H&R Block, Inc.
|
The impact of changes in foreign exchange rates during the period on our international cash balances resulted in a decrease of
$4.5 million
during fiscal year
2017
compared to decreases of
$10.6 million
and
$10.0 million
in fiscal years
2016
and
2015
, respectively. This change resulted primarily from a decline in Canadian exchange rates.
CONTRACTUAL OBLIGATIONS AND COMMERCIAL COMMITMENTS
– A summary of our borrowings and known or estimated contractual obligations as of April 30,
2017
, and the timing and effect that such commitments are expected to have on our liquidity and capital requirements in future periods is as follows:
|
(in 000s)
|
||||||||||||||||||||
|
Total
|
|
Less Than
1 Year
|
|
1 - 3 Years
|
|
4 - 5 Years
|
|
After 5 Years
|
|
|||||||||||
|
Long-term debt (including interest)
|
$
|
1,914,574
|
|
$
|
72,688
|
|
$
|
145,375
|
|
$
|
755,156
|
|
$
|
941,355
|
|
|||||
|
Contingent acquisition payments
|
10,428
|
|
7,104
|
|
3,324
|
|
—
|
|
—
|
|
||||||||||
|
Capital lease obligations
|
6,610
|
|
981
|
|
2,100
|
|
2,299
|
|
1,230
|
|
||||||||||
|
Operating leases
|
707,828
|
|
249,813
|
|
329,515
|
|
101,286
|
|
27,214
|
|
||||||||||
|
Guaranty on Refund Advance loans
|
720
|
|
720
|
|
—
|
|
—
|
|
—
|
|
||||||||||
|
Total contractual cash obligations
|
$
|
2,640,160
|
|
$
|
331,306
|
|
$
|
480,314
|
|
$
|
858,741
|
|
$
|
969,799
|
|
|||||
The table above does not reflect unrecognized tax benefits of approximately
$150 million
due to the high degree of uncertainty regarding the future cash flows associated with these amounts.
In connection with our agreement with BofI, we are required to purchase a 90% participation interest, at par, in all EAs originated by our lending partner.
See discussion of contractual obligations and commitments in
Item 8
, within the notes to the consolidated financial statements.
REGULATORY ENVIRONMENT
– The federal government, various state, local, provincial and foreign governments, and some self-regulatory organizations have enacted statutes and ordinances, or adopted rules and regulations, regulating aspects of our business. These aspects include, but are not limited to, commercial income tax return preparers, income tax courses, the electronic filing of income tax returns, the offering of RTs, privacy, consumer protection, franchising, sales methods and banking. We determine the applicability of such statutes, ordinances, rules and regulations (collectively, Laws) and work to comply with those Laws that are applicable to us or our services or products.
On October 5, 2016, the CFPB released its Final Rules regulating prepaid products. The Final Rules are scheduled to take effect on April 1, 2018, with certain provisions phased in over time following that date. Once effective, the Final Rules will apply to the H&R Block Emerald Prepaid MasterCard®, but we do not believe they will apply to EAs or RAs due to their nature as non-covered separate credit products. The Final Rules, among other things: (i) establish required consumer disclosures to be made prior to acquiring a prepaid account in most situations; (ii) require periodic statements or online access to specified account information; and (iii) require online posting of the Cardholder Agreement and submission of new and revised Cardholder Agreements to the CFPB.
We are continuing to assess the impact of these changes on the H&R Block Emerald Prepaid MasterCard® and our
consolidated financial statements.
From time to time in the ordinary course of business, we receive inquiries from governmental and self-regulatory agencies regarding the applicability of Laws to our services and products. In response to past inquiries, we have demonstrated that we comply with such Laws, convinced the authorities that such Laws were not applicable or that compliance already exists, or modified our activities in the applicable jurisdiction to avoid the application of all or certain parts of such Laws. We believe the past resolution of such inquiries and our ongoing compliance with Laws has not had a material effect on our consolidated financial statements. We cannot predict what effect future Laws, changes in interpretations of existing Laws or the results of future regulatory inquiries with respect to the applicability of Laws may have on our consolidated financial position, results of operations and cash flows. See additional discussion of legal matters in
Item 8
,
note 13
to the consolidated financial statements.
Tax Reform.
As a multinational corporation, we are subject to taxes in both U.S. and non-U.S. jurisdictions. Due to economic and political factors, tax laws, regulations and rates of the jurisdictions in which we operate are subject to
|
H&R Block, Inc.
| 2017 Form 10-K
|
29
|
significant change. The federal government has indicated its desire to pursue comprehensive tax reform and is currently proposing a variety of changes. Additionally, various foreign countries are evaluating their tax systems. Many changes have been proposed.
Among the U.S. tax reform proposals are a reduction in corporate income tax rate, a border adjustment tax, elimination of many currently available deductions and changes to how foreign earnings are taxed. Any of these proposals, among others, could significantly impact the amount of tax due in the U.S. We cannot predict whether, or in what form, changes in tax laws will be made. If comprehensive tax reform occurs, we would benefit from a significant reduction in U.S. tax rates, however without understanding the full context of tax reform, it is difficult to estimate or provide guidance on the overall impact of potential U.S. tax reform on our organization.
NON-GAAP FINANCIAL INFORMATION
Non-GAAP financial measures should not be considered as a substitute for, or superior to, measures of financial performance prepared in accordance with GAAP. Because these measures are not measures of financial performance under GAAP and are susceptible to varying calculations, they may not be comparable to similarly titled measures for other companies.
We consider our non-GAAP financial measures to be performance measures and a useful metric for management and investors to evaluate and compare the ongoing operating performance of our business on a consistent basis across reporting periods, as it eliminates the effect of items that are not indicative of our core operating performance.
The following are descriptions of adjustments we make for our non-GAAP financial measures:
|
▪
|
We exclude losses from settlements and estimated contingent losses from litigation and favorable reserve adjustments. This does not include legal defense costs.
|
|
▪
|
We exclude material non-cash charges to adjust the carrying values of goodwill, intangible assets, other long-lived assets and investments to their estimated fair values.
|
|
▪
|
We exclude material severance and other restructuring charges in connection with the termination of personnel, closure of offices and related costs.
|
|
▪
|
We exclude the material gains and losses on business dispositions, including investment banking, legal and accounting fees from both business dispositions and acquisitions.
|
|
▪
|
We exclude the gains and losses on extinguishment of debt.
|
We may consider whether other significant items that arise in the future should also be excluded from our non-GAAP financial measures.
We measure the performance of our business using a variety of metrics, including earnings before interest, taxes, depreciation and amortization (EBITDA) from continuing operations and adjusted EBITDA and EBITDA margin from continuing operations, adjusted pretax and net income of continuing operations, and adjusted diluted earnings per share from continuing operations. Adjusted EBITDA and EBITDA margin from continuing operations, adjusted pretax and net income from continuing operations, and adjusted diluted earnings per share from continuing operations eliminate the impact of items that we do not consider indicative of our core operating performance and, we believe, provide meaningful information to assist in understanding our financial results, analyzing trends in our underlying business, and assessing our prospects for future performance. We also use EBITDA from continuing operations and pretax income of continuing operations, each subject to permitted adjustments, as performance metrics in incentive compensation calculations for our employees.
|
30
|
2017 Form 10-K |
H&R Block, Inc.
|
The following is a reconciliation of EBITDA from continuing operations to net income:
|
(in 000s)
|
|
|||||||||||
|
Year ended April 30,
|
2017
|
|
2016
|
|
2015
|
|
||||||
|
Net income - as reported
|
$
|
408,945
|
|
$
|
374,267
|
|
$
|
473,663
|
|
|||
|
Discontinued operations, net
|
11,972
|
|
9,286
|
|
13,081
|
|
||||||
|
Net income from continuing operations - as reported
|
420,917
|
|
383,553
|
|
486,744
|
|
||||||
|
Add back:
|
||||||||||||
|
Income taxes of continuing operations
|
208,370
|
|
185,926
|
|
256,061
|
|
||||||
|
Interest expense of continuing operations
|
92,951
|
|
69,141
|
|
45,928
|
|
||||||
|
Depreciation and amortization of continuing operations
|
182,168
|
|
173,598
|
|
159,804
|
|
||||||
|
483,489
|
|
428,665
|
|
461,793
|
|
|||||||
|
EBITDA from continuing operations
|
$
|
904,406
|
|
$
|
812,218
|
|
$
|
948,537
|
|
|||
|
H&R Block, Inc.
| 2017 Form 10-K
|
31
|
The following is a reconciliation of our results from continuing operations to our adjusted results from continuing operations, which are non-GAAP financial measures:
|
(in 000s, except per share amounts)
|
||||||||||||
|
Year ended April 30,
|
2017
|
|||||||||||
|
Pretax Income
|
Net Income
|
EBITDA
|
||||||||||
|
From continuing operations
|
$
|
629,287
|
|
$
|
420,917
|
|
$
|
904,406
|
|
|||
|
Adjustments (pretax):
|
||||||||||||
|
Loss contingencies - litigation
|
516
|
|
516
|
|
516
|
|
||||||
|
Tax effect of adjustments
(1)
|
—
|
|
(186
|
)
|
—
|
|
||||||
|
516
|
|
330
|
|
516
|
|
|||||||
|
As adjusted - from continuing operations
|
$
|
629,803
|
|
$
|
421,247
|
|
$
|
904,922
|
|
|||
|
Diluted EPS
|
EBITDA Margin
(2)
|
|||||||||||
|
From continuing operations
|
$
|
1.96
|
|
29.8
|
%
|
|||||||
|
Impact of adjustments
|
—
|
|
—
|
%
|
||||||||
|
Adjusted
|
$
|
1.96
|
|
29.8
|
%
|
|||||||
|
Year ended April 30,
|
2016
|
|||||||||||
|
Pretax Income
|
Net Income
|
EBITDA
|
||||||||||
|
From continuing operations
|
$
|
569,479
|
|
$
|
383,553
|
|
$
|
812,218
|
|
|||
|
Adjustments (pretax):
|
||||||||||||
|
Loss contingencies - litigation
|
1,978
|
|
1,978
|
|
1,978
|
|
||||||
|
Severance
|
12,001
|
|
12,001
|
|
12,001
|
|
||||||
|
Costs related to HRB Bank and recapitalization transactions
|
20,722
|
|
20,722
|
|
20,722
|
|
||||||
|
Losses (gains) on AFS securities
|
(8,138
|
)
|
(8,138
|
)
|
(8,138
|
)
|
||||||
|
Gain on sales of tax offices/businesses
|
(127
|
)
|
(127
|
)
|
(127
|
)
|
||||||
|
Tax effect of adjustments
(1)
|
—
|
|
(10,176
|
)
|
—
|
|
||||||
|
26,436
|
|
16,260
|
|
26,436
|
|
|||||||
|
As adjusted - from continuing operations
|
$
|
595,915
|
|
$
|
399,813
|
|
$
|
838,654
|
|
|||
|
Diluted EPS
|
EBITDA Margin
(2)
|
|||||||||||
|
From continuing operations
|
$
|
1.53
|
|
26.7
|
%
|
|||||||
|
Impact of adjustments
|
0.06
|
|
0.9
|
%
|
||||||||
|
Adjusted
|
$
|
1.59
|
|
27.6
|
%
|
|||||||
|
Year ended April 30,
|
2015
|
|||||||||||
|
Pretax Income
|
Net Income
|
EBITDA
|
||||||||||
|
From continuing operations
|
$
|
742,805
|
|
$
|
486,744
|
|
$
|
948,537
|
|
|||
|
Adjustments (pretax):
|
||||||||||||
|
Loss contingencies - litigation
|
(3,936
|
)
|
(3,936
|
)
|
(3,936
|
)
|
||||||
|
Severance
|
6,699
|
|
6,699
|
|
6,699
|
|
||||||
|
Costs related to HRB Bank transaction
|
238
|
|
238
|
|
238
|
|
||||||
|
Losses (gains) on AFS securities
|
124
|
|
124
|
|
124
|
|
||||||
|
Gain on sales of tax offices/businesses
|
(656
|
)
|
(656
|
)
|
(656
|
)
|
||||||
|
Tax effect of adjustments
(1)
|
—
|
|
(963
|
)
|
—
|
|
||||||
|
2,469
|
|
1,506
|
|
2,469
|
|
|||||||
|
As adjusted - from continuing operations
|
$
|
745,274
|
|
$
|
488,250
|
|
$
|
951,006
|
|
|||
|
Diluted EPS
|
EBITDA Margin
(2)
|
|||||||||||
|
From continuing operations
|
$
|
1.75
|
|
30.8
|
%
|
|||||||
|
Impact of adjustments
|
—
|
|
0.1
|
%
|
||||||||
|
Adjusted
|
$
|
1.75
|
|
30.9
|
%
|
|||||||
|
1
|
Tax effect of adjustments is computed as the pretax effect of the adjustments multiplied by our effective tax rate before discrete items.
|
|
2
|
EBITDA margin from continuing operations is computed as EBITDA from continuing operations divided by revenues from continuing operations.
|
|
32
|
2017 Form 10-K |
H&R Block, Inc.
|
INTEREST RATE RISK
GENERAL
– We have a formal investment policy that strives to minimize the market risk exposure of our cash equivalents, which are primarily affected by credit quality and movements in interest rates. The guidelines in our investment policy focus on managing liquidity and preserving principal and earnings.
Our cash equivalents are primarily held for liquidity purposes and are comprised of high quality, short-term investments, including money market funds. Because our cash and cash equivalents have a short maturity, our portfolio's market value is relatively insensitive to interest rate changes.
As our CLOC borrowings are generally seasonal, interest rate risk typically increases through our third fiscal quarter and declines to zero by fiscal year-end. While the market value of our CLOC borrowings is relatively insensitive to interest rate changes, interest expense on CLOC borrowings will increase and decrease with changes in the underlying short-term interest rates. We had no balance outstanding under the 2016 CLOC as of April 30,
2017
.
Our long-term debt as of April 30,
2017
, consists primarily of fixed-rate Senior Notes; therefore, a change in interest rates would have no impact on consolidated pretax earnings until these notes mature or are refinanced. The fixed-rate interest payable on our Senior Notes is subject to adjustment based upon our credit ratings. See
Item 8
,
note 6
to the consolidated financial statements.
FOREIGN EXCHANGE RATE RISK
Our operations in international markets are exposed to movements in currency exchange rates. The currencies primarily involved are the Canadian dollar and the Australian dollar. We translate revenues and expenses related to these operations at the average of exchange rates in effect during the period. Assets and liabilities of foreign subsidiaries are translated into U.S. dollars at exchange rates prevailing at the end of the year. Translation adjustments are recorded as a separate component of other comprehensive income in stockholders' equity. Translation of financial results into U.S. dollars does not presently materially affect, and has not historically materially affected, our consolidated financial results, although such changes do affect the year-to-year comparability of the operating results in U.S. dollars of our international businesses. The impact of changes in foreign exchange rates during the period on our international cash balances resulted in a decrease of
$4.5 million
during fiscal year
2017
compared to a decrease of
$10.6 million
and
$10.0 million
in fiscal years
2016
and
2015
, respectively. This change resulted primarily from a decline in Canadian exchange rates. We estimate a 10% change in foreign exchange rates by itself would impact consolidated pretax income in fiscal years
2017
and
2016
by
$2.2 million
and
$2.5 million
, respectively, and cash balances as of April 30,
2017
and
2016
by
$3.6 million
and
$8.9 million
, respectively.
We generally use foreign exchange forward contracts to mitigate foreign currency exchange rate risk for seasonal loans we advance to our Canadian operations. At April 30, 2017 we had one forward contract outstanding with a fair value of
$0.5 million
, compared with none in the prior year.
|
H&R Block, Inc.
| 2017 Form 10-K
|
33
|
DISCUSSION OF FINANCIAL RESPONSIBILITY
H&R Block's management is responsible for the integrity and objectivity of the information contained in this document. Management is responsible for the consistency of reporting this information and for ensuring that accounting principles generally accepted in the U.S. are properly applied. In discharging this responsibility, management maintains an extensive program of internal audits and requires members of management to certify financial information within their scope of management. Our system of internal control over financial reporting also includes formal policies and procedures, including a Code of Business Ethics and Conduct that reinforces our commitment to ethical business conduct and is designed to encourage our employees and directors to act with high standards of integrity in all that they do.
The Audit Committee of the Board of Directors, composed solely of independent outside directors, meets periodically with management, the independent auditor and the Vice President, Audit Services (our chief internal auditor) to review matters relating to our financial statements, internal audit activities, internal accounting controls and non-audit services provided by the independent auditors. The independent auditor and the Vice President, Audit Services have full access to the Audit Committee and meet with the committee, both with and without management present, to discuss the scope and results of their audits, including internal controls and financial matters.
Deloitte & Touche LLP audited our consolidated financial statements for fiscal years
2017
,
2016
and
2015
. The audits were conducted in accordance with the standards of the Public Company Accounting Oversight Board (United States).
MANAGEMENT'S REPORT ON INTERNAL CONTROL OVER FINANCIAL REPORTING
Management is responsible for establishing and maintaining adequate internal control over financial reporting, as such term is defined in Exchange Act Rules 12a-15(f). Under the supervision and with the participation of management, including our Chief Executive Officer and Chief Financial Officer, we conducted an evaluation of the effectiveness of our internal control over financial reporting based on the criteria established in "Internal Control - Integrated Framework" issued by the Committee of Sponsoring Organizations of the Treadway Commission (COSO), using the 2013 framework, as of April 30,
2017
.
Based on our assessment, management concluded that as of April 30,
2017
, the Company's internal control over financial reporting was effective based on the criteria set forth by COSO, using the 2013 framework. The Company's external auditor, Deloitte & Touche LLP, an independent registered public accounting firm, has issued an audit report on the effectiveness of the Company's internal control over financial reporting.
|
/s/ William C. Cobb
|
/s/ Tony G. Bowen
|
|
|
William C. Cobb
|
Tony G. Bowen
|
|
|
President and Chief Executive Officer
|
Chief Financial Officer
|
|
|
34
|
2017 Form 10-K |
H&R Block, Inc.
|
REPORT OF INDEPENDENT REGISTERED PUBLIC ACCOUNTING FIRM
To the Board of Directors and Stockholders of
H&R Block, Inc.
Kansas City, Missouri
We have audited the accompanying consolidated balance sheets of H&R Block, Inc. and subsidiaries (the "Company") as of April 30,
2017
and
2016
, and the related consolidated statements of income and comprehensive income, stockholders' equity, and cash flows for each of the three years in the period ended April 30,
2017
. Our audits also included the financial statement schedule listed in the Index at Item 15. These financial statements and financial statement schedule are the responsibility of the Company's management. Our responsibility is to express an opinion on the financial statements and financial statement schedule based on our audits.
We conducted our audits in accordance with the standards of the Public Company Accounting Oversight Board (United States). Those standards require that we plan and perform the audit to obtain reasonable assurance about whether the financial statements are free of material misstatement. An audit includes examining, on a test basis, evidence supporting the amounts and disclosures in the financial statements. An audit also includes assessing the accounting principles used and significant estimates made by management, as well as evaluating the overall financial statement presentation. We believe that our audits provide a reasonable basis for our opinion.
In our opinion, such consolidated financial statements present fairly, in all material respects, the financial position of H&R Block, Inc. and subsidiaries as of April 30,
2017
and
2016
, and the results of their operations and their cash flows for each of the three years in the period ended April 30,
2017
, in conformity with accounting principles generally accepted in the United States of America. Also, in our opinion, such financial statement schedule, when considered in relation to the basic consolidated financial statements taken as a whole, presents fairly, in all material respects, the information set forth therein.
We have also audited, in accordance with the standards of the Public Company Accounting Oversight Board (United States), the Company's internal control over financial reporting as of April 30,
2017
, based on the criteria established in
Internal Control - Integrated Framework (2013)
issued by the Committee of Sponsoring Organizations of the Treadway Commission and our report dated
June 16, 2017
expressed an unqualified opinion on the Company's internal control over financial reporting.
|
/s/ Deloitte & Touche LLP
|
|
Kansas City, Missouri
|
|
June 16, 2017
|
|
H&R Block, Inc.
| 2017 Form 10-K
|
35
|
REPORT OF INDEPENDENT REGISTERED PUBLIC ACCOUNTING FIRM
To the Board of Directors and Stockholders of
H&R Block, Inc.
Kansas City, Missouri
We have audited the internal control over financial reporting of H&R Block, Inc. and subsidiaries (the "Company") as of April 30,
2017
, based on criteria established in
Internal Control - Integrated Framework (2013)
issued by the Committee of Sponsoring Organizations of the Treadway Commission. The Company's management is responsible for maintaining effective internal control over financial reporting and for its assessment of the effectiveness of internal control over financial reporting, included in the accompanying Management's Report on Internal Control over Financial Reporting. Our responsibility is to express an opinion on the Company's internal control over financial reporting based on our audit.
We conducted our audit in accordance with the standards of the Public Company Accounting Oversight Board (United States). Those standards require that we plan and perform the audit to obtain reasonable assurance about whether effective internal control over financial reporting was maintained in all material respects. Our audit included obtaining an understanding of internal control over financial reporting, assessing the risk that a material weakness exists, testing and evaluating the design and operating effectiveness of internal control based on the assessed risk, and performing such other procedures as we considered necessary in the circumstances. We believe that our audit provides a reasonable basis for our opinion.
A company's internal control over financial reporting is a process designed by, or under the supervision of, the company's principal executive and principal financial officers, or persons performing similar functions, and effected by the company's board of directors, management, and other personnel to provide reasonable assurance regarding the reliability of financial reporting and the preparation of financial statements for external purposes in accordance with generally accepted accounting principles. A company's internal control over financial reporting includes those policies and procedures that (1) pertain to the maintenance of records that, in reasonable detail, accurately and fairly reflect the transactions and dispositions of the assets of the company; (2) provide reasonable assurance that transactions are recorded as necessary to permit preparation of financial statements in accordance with generally accepted accounting principles, and that receipts and expenditures of the company are being made only in accordance with authorizations of management and directors of the company; and (3) provide reasonable assurance regarding prevention or timely detection of unauthorized acquisition, use, or disposition of the company's assets that could have a material effect on the financial statements.
Because of the inherent limitations of internal control over financial reporting, including the possibility of collusion or improper management override of controls, material misstatements due to error or fraud may not be prevented or detected on a timely basis. Also, projections of any evaluation of the effectiveness of the internal control over financial reporting to future periods are subject to the risk that the controls may become inadequate because of changes in conditions, or that the degree of compliance with the policies or procedures may deteriorate.
In our opinion, the Company maintained, in all material respects, effective internal control over financial reporting as of April 30,
2017
, based on the criteria established in
Internal Control - Integrated Framework (2013)
issued by the Committee of Sponsoring Organizations of the Treadway Commission.
We have also audited, in accordance with the standards of the Public Company Accounting Oversight Board (United States), the consolidated financial statements and financial statement schedule as of and for the year ended April 30,
2017
of the Company and our report dated
June 16, 2017
expressed an unqualified opinion on those financial statements and financial statement schedule.
|
/s/ Deloitte & Touche LLP
|
|
Kansas City, Missouri
|
|
June 16, 2017
|
|
36
|
2017 Form 10-K |
H&R Block, Inc.
|
|
AND COMPREHENSIVE INCOME
|
(in 000s, except per share amounts)
|
|||||||||||
|
Year ended April 30,
|
2017
|
|
2016
|
|
2015
|
|
||||||
|
REVENUES:
|
||||||||||||
|
Service revenues
|
$
|
2,648,349
|
|
$
|
2,653,936
|
|
$
|
2,651,057
|
|
|||
|
Royalty, product and other revenues
|
387,965
|
|
384,217
|
|
427,601
|
|
||||||
|
3,036,314
|
|
3,038,153
|
|
3,078,658
|
|
|||||||
|
OPERATING EXPENSES:
|
||||||||||||
|
Cost of revenues:
|
||||||||||||
|
Compensation and benefits
|
808,240
|
|
845,197
|
|
852,480
|
|
||||||
|
Occupancy and equipment
|
415,058
|
|
405,123
|
|
378,624
|
|
||||||
|
Provision for bad debt
|
52,776
|
|
75,395
|
|
74,993
|
|
||||||
|
Depreciation and amortization
|
119,789
|
|
115,907
|
|
111,861
|
|
||||||
|
Other
|
248,514
|
|
243,930
|
|
212,532
|
|
||||||
|
1,644,377
|
|
1,685,552
|
|
1,630,490
|
|
|||||||
|
Selling, general and administrative:
|
||||||||||||
|
Marketing and advertising
|
261,281
|
|
297,762
|
|
273,682
|
|
||||||
|
Compensation and benefits
|
239,381
|
|
228,778
|
|
238,527
|
|
||||||
|
Depreciation and amortization
|
62,379
|
|
57,691
|
|
47,943
|
|
||||||
|
Other selling, general and administrative
|
112,912
|
|
135,178
|
|
93,350
|
|
||||||
|
|
675,953
|
|
719,409
|
|
653,502
|
|
||||||
|
Total operating expenses
|
2,320,330
|
|
2,404,961
|
|
2,283,992
|
|
||||||
|
Other income (expense), net
|
6,254
|
|
5,249
|
|
(6,615
|
)
|
||||||
|
Interest expense on borrowings
|
(92,951
|
)
|
(68,962
|
)
|
(45,246
|
)
|
||||||
|
Income from continuing operations before income taxes
|
629,287
|
|
569,479
|
|
742,805
|
|
||||||
|
Income taxes
|
208,370
|
|
185,926
|
|
256,061
|
|
||||||
|
Net income from continuing operations
|
420,917
|
|
383,553
|
|
486,744
|
|
||||||
|
Net loss from discontinued operations, net of tax benefits of $6,986, $5,414 and $8,125
|
(11,972
|
)
|
(9,286
|
)
|
(13,081
|
)
|
||||||
|
NET INCOME
|
$
|
408,945
|
|
$
|
374,267
|
|
$
|
473,663
|
|
|||
|
BASIC EARNINGS (LOSS) PER SHARE:
|
||||||||||||
|
Continuing operations
|
$
|
1.97
|
|
$
|
1.54
|
|
$
|
1.77
|
|
|||
|
Discontinued operations
|
(0.05
|
)
|
(0.04
|
)
|
(0.05
|
)
|
||||||
|
Consolidated
|
$
|
1.92
|
|
$
|
1.50
|
|
$
|
1.72
|
|
|||
|
DILUTED EARNINGS (LOSS) PER SHARE:
|
||||||||||||
|
Continuing operations
|
$
|
1.96
|
|
$
|
1.53
|
|
$
|
1.75
|
|
|||
|
Discontinued operations
|
(0.05
|
)
|
(0.04
|
)
|
(0.04
|
)
|
||||||
|
Consolidated
|
$
|
1.91
|
|
$
|
1.49
|
|
$
|
1.71
|
|
|||
|
COMPREHENSIVE INCOME:
|
||||||||||||
|
Net income
|
$
|
408,945
|
|
$
|
374,267
|
|
$
|
473,663
|
|
|||
|
Unrealized gains (losses) on securities, net of taxes:
|
||||||||||||
|
Unrealized holding gains (losses) arising during the year, net of taxes of ($9), ($2,270) and $4,301
|
(16
|
)
|
(3,530
|
)
|
6,645
|
|
||||||
|
Reclassification adjustment for losses (gains) included in income, net of taxes of $ - , ($3,214) and $27
|
—
|
|
(4,982
|
)
|
41
|
|
||||||
|
Change in foreign currency translation adjustments
|
(4,050
|
)
|
(4,461
|
)
|
(10,123
|
)
|
||||||
|
Other comprehensive loss
|
(4,066
|
)
|
(12,973
|
)
|
(3,437
|
)
|
||||||
|
Comprehensive income
|
$
|
404,879
|
|
$
|
361,294
|
|
$
|
470,226
|
|
|||
See accompanying notes to consolidated financial statements.
|
H&R Block, Inc.
| 2017 Form 10-K
|
37
|
|
|
(in 000s, except share and
per share amounts)
|
|||||||
|
As of April 30,
|
2017
|
|
2016
|
|
||||
|
ASSETS
|
||||||||
|
Cash and cash equivalents
|
$
|
1,011,331
|
|
$
|
896,801
|
|
||
|
Cash and cash equivalents - restricted
|
106,208
|
|
104,110
|
|
||||
|
Receivables, less allowance for doubtful accounts of $55,296 and $57,011
|
162,775
|
|
153,116
|
|
||||
|
Prepaid expenses and other current assets
|
65,725
|
|
66,574
|
|
||||
|
Total current assets
|
1,346,039
|
|
1,220,601
|
|
||||
|
Mortgage loans held for investment, less allowance for loan losses of $5,518
|
—
|
|
202,385
|
|
||||
|
Property and equipment, at cost, less accumulated depreciation and
amortization of $678,161 and $601,120 |
263,827
|
|
293,565
|
|
||||
|
Intangible assets, net
|
409,364
|
|
433,885
|
|
||||
|
Goodwill
|
491,207
|
|
470,757
|
|
||||
|
Deferred tax assets and income taxes receivable
|
83,728
|
|
120,123
|
|
||||
|
Other noncurrent assets
|
99,943
|
|
105,909
|
|
||||
|
Total assets
|
$
|
2,694,108
|
|
$
|
2,847,225
|
|
||
|
LIABILITIES AND STOCKHOLDERS' EQUITY
|
||||||||
|
LIABILITIES:
|
||||||||
|
Accounts payable and accrued expenses
|
$
|
217,028
|
|
$
|
259,586
|
|
||
|
Accrued salaries, wages and payroll taxes
|
183,856
|
|
161,786
|
|
||||
|
Accrued income taxes and reserves for uncertain tax positions
|
348,199
|
|
373,754
|
|
||||
|
Current portion of long-term debt
|
981
|
|
826
|
|
||||
|
Deferred revenue and other current liabilities
|
189,216
|
|
243,653
|
|
||||
|
Total current liabilities
|
939,280
|
|
1,039,605
|
|
||||
|
Long-term debt
|
1,493,017
|
|
1,491,375
|
|
||||
|
Reserves for uncertain tax positions
|
159,085
|
|
132,960
|
|
||||
|
Deferred revenue and other noncurrent liabilities
|
163,609
|
|
160,182
|
|
||||
|
Total liabilities
|
2,754,991
|
|
2,824,122
|
|
||||
|
COMMITMENTS AND CONTINGENCIES
|
||||||||
|
STOCKHOLDERS' EQUITY:
|
||||||||
|
Common stock, no par, stated value $.01 per share, 800,000,000 shares
authorized, shares issued of 246,198,878 and 260,218,666 |
2,462
|
|
2,602
|
|
||||
|
Additional paid-in capital
|
754,912
|
|
758,230
|
|
||||
|
Accumulated other comprehensive loss
|
(15,299
|
)
|
(11,233
|
)
|
||||
|
Retained earnings (deficit)
|
(48,206
|
)
|
40,347
|
|
||||
|
Less treasury shares, at cost, of 39,027,573 and 39,701,409
|
(754,752
|
)
|
(766,843
|
)
|
||||
|
Total stockholders' equity (deficiency)
|
(60,883
|
)
|
23,103
|
|
||||
|
Total liabilities and stockholders' equity
|
$
|
2,694,108
|
|
$
|
2,847,225
|
|
||
See accompanying notes to consolidated financial statements.
|
38
|
2017 Form 10-K |
H&R Block, Inc.
|
|
CONSOLIDATED STATEMENTS OF CASH FLOWS
|
(in 000s)
|
|
||||||||||
|
Year ended April 30,
|
2017
|
|
2016
|
|
2015
|
|
||||||
|
CASH FLOWS FROM OPERATING ACTIVITIES:
|
||||||||||||
|
Net income
|
$
|
408,945
|
|
$
|
374,267
|
|
$
|
473,663
|
|
|||
|
Adjustments to reconcile net income to net cash provided by operating activities:
|
||||||||||||
|
Depreciation and amortization
|
182,168
|
|
173,598
|
|
159,804
|
|
||||||
|
Provision for bad debt
|
52,776
|
|
75,395
|
|
74,993
|
|
||||||
|
Deferred taxes
|
46,455
|
|
36,276
|
|
(15,502
|
)
|
||||||
|
Stock-based compensation
|
19,285
|
|
23,540
|
|
26,068
|
|
||||||
|
Changes in assets and liabilities, net of acquisitions:
|
||||||||||||
|
Cash and cash equivalents - restricted
|
(2,104
|
)
|
(12,159
|
)
|
23,252
|
|
||||||
|
Receivables
|
(77,873
|
)
|
(70,721
|
)
|
(68,109
|
)
|
||||||
|
Prepaid expenses and other current assets
|
(4,542
|
)
|
4,321
|
|
(8,542
|
)
|
||||||
|
Other noncurrent assets
|
(6,364
|
)
|
4,197
|
|
2,260
|
|
||||||
|
Accounts payable and accrued expenses
|
(30,472
|
)
|
16,723
|
|
681
|
|
||||||
|
Accrued salaries, wages and payroll taxes
|
22,789
|
|
17,388
|
|
(21,132
|
)
|
||||||
|
Deferred revenue and other current liabilities
|
(59,998
|
)
|
(77,510
|
)
|
(34,491
|
)
|
||||||
|
Deferred revenue and other noncurrent liabilities
|
4,314
|
|
3,055
|
|
3,289
|
|
||||||
|
Income tax receivables, accrued income taxes and income tax reserves
|
129
|
|
(12,499
|
)
|
33,410
|
|
||||||
|
Other, net
|
(5,415
|
)
|
(23,477
|
)
|
(23,036
|
)
|
||||||
|
Net cash provided by operating activities
|
550,093
|
|
532,394
|
|
626,608
|
|
||||||
|
CASH FLOWS FROM INVESTING ACTIVITIES:
|
||||||||||||
|
Purchases of available-for-sale securities
|
—
|
|
—
|
|
(90,581
|
)
|
||||||
|
Sales, maturities and payments received on available-for-sale securities
|
1,144
|
|
436,471
|
|
91,878
|
|
||||||
|
Principal payments and sales of mortgage loans and real estate owned, net
|
207,174
|
|
38,481
|
|
32,090
|
|
||||||
|
Capital expenditures
|
(89,255
|
)
|
(99,923
|
)
|
(123,158
|
)
|
||||||
|
Payments made for business acquisitions, net of cash acquired
|
(54,816
|
)
|
(88,776
|
)
|
(113,252
|
)
|
||||||
|
Franchise loans funded
|
(34,473
|
)
|
(22,820
|
)
|
(49,695
|
)
|
||||||
|
Payments received on franchise loans
|
61,437
|
|
55,007
|
|
90,636
|
|
||||||
|
Other, net
|
8,108
|
|
11,075
|
|
13,150
|
|
||||||
|
Net cash provided by (used in) investing activities
|
99,319
|
|
329,515
|
|
(148,932
|
)
|
||||||
|
CASH FLOWS FROM FINANCING ACTIVITIES:
|
||||||||||||
|
Repayments of commercial paper and line of credit borrowings
|
(1,700,000
|
)
|
(1,465,000
|
)
|
(1,049,136
|
)
|
||||||
|
Proceeds from issuance of commercial paper and line of credit borrowings
|
1,700,000
|
|
1,465,000
|
|
1,049,136
|
|
||||||
|
Repayments of long-term debt
|
—
|
|
—
|
|
(400,000
|
)
|
||||||
|
Proceeds from issuance of long-term debt
|
—
|
|
996,831
|
|
—
|
|
||||||
|
Transfer of HRB Bank deposits
|
—
|
|
(419,028
|
)
|
—
|
|
||||||
|
Customer banking deposits, net
|
—
|
|
(326,705
|
)
|
(28,544
|
)
|
||||||
|
Dividends paid
|
(187,115
|
)
|
(201,688
|
)
|
(219,960
|
)
|
||||||
|
Repurchase of common stock, including shares surrendered
|
(322,850
|
)
|
(2,018,338
|
)
|
(10,449
|
)
|
||||||
|
Proceeds from exercise of stock options
|
2,371
|
|
25,775
|
|
16,522
|
|
||||||
|
Other, net
|
(22,830
|
)
|
(18,576
|
)
|
(3,376
|
)
|
||||||
|
Net cash used in financing activities
|
(530,424
|
)
|
(1,961,729
|
)
|
(645,807
|
)
|
||||||
|
Effects of exchange rate changes on cash
|
(4,458
|
)
|
(10,569
|
)
|
(9,986
|
)
|
||||||
|
Net increase (decrease) in cash and cash equivalents
|
114,530
|
|
(1,110,389
|
)
|
(178,117
|
)
|
||||||
|
Cash and cash equivalents at beginning of the year
|
896,801
|
|
2,007,190
|
|
2,185,307
|
|
||||||
|
Cash and cash equivalents at end of the year
|
$
|
1,011,331
|
|
$
|
896,801
|
|
$
|
2,007,190
|
|
|||
|
SUPPLEMENTARY CASH FLOW DATA:
|
||||||||||||
|
Income taxes paid, net of refunds received
|
$
|
163,539
|
|
$
|
165,154
|
|
$
|
236,624
|
|
|||
|
Interest paid on borrowings
|
87,185
|
|
59,058
|
|
44,847
|
|
||||||
|
Accrued additions to property and equipment
|
2,433
|
|
2,822
|
|
14,282
|
|
||||||
|
Conversion of investment in preferred stock to available-for-sale common stock
|
—
|
|
—
|
|
5,000
|
|
||||||
|
H&R Block, Inc.
| 2017 Form 10-K
|
39
|
|
CONSOLIDATED STATEMENTS OF STOCKHOLDERS' EQUITY
|
(amounts in 000s, except per share amounts)
|
|||||||||||||||||||||||||||||
|
Common Stock
|
Additional
Paid-in Capital |
|
Accumulated
Other Comprehensive Income (Loss) |
|
Retained
Earnings |
|
Treasury Stock
|
Total
Stockholders’ Equity |
|
|||||||||||||||||||||
|
Shares
|
|
Amount
|
|
Shares
|
|
Amount
|
|
|||||||||||||||||||||||
|
Balances as of May 1, 2014
|
316,628
|
|
$
|
3,166
|
|
$
|
766,654
|
|
$
|
5,177
|
|
$
|
1,589,297
|
|
(42,400
|
)
|
$
|
(807,745
|
)
|
$
|
1,556,549
|
|
||||||||
|
Net income
|
—
|
|
—
|
|
—
|
|
—
|
|
473,663
|
|
—
|
|
—
|
|
473,663
|
|
||||||||||||||
|
Other comprehensive loss
|
—
|
|
—
|
|
—
|
|
(3,437
|
)
|
—
|
|
—
|
|
—
|
|
(3,437
|
)
|
||||||||||||||
|
Stock-based compensation
|
—
|
|
—
|
|
26,068
|
|
—
|
|
—
|
|
—
|
|
—
|
|
26,068
|
|
||||||||||||||
|
Stock-based awards exercised or vested
|
—
|
|
—
|
|
(8,881
|
)
|
—
|
|
(942
|
)
|
1,359
|
|
25,954
|
|
16,131
|
|
||||||||||||||
|
Acquisition of treasury shares
|
—
|
|
—
|
|
—
|
|
—
|
|
—
|
|
(315
|
)
|
(10,449
|
)
|
(10,449
|
)
|
||||||||||||||
|
Other
|
—
|
|
—
|
|
(48
|
)
|
—
|
|
(5,616
|
)
|
3
|
|
48
|
|
(5,616
|
)
|
||||||||||||||
|
Cash dividends declared - $0.80 per share
|
—
|
|
—
|
|
—
|
|
—
|
|
(219,960
|
)
|
—
|
|
—
|
|
(219,960
|
)
|
||||||||||||||
|
Balances as of April 30, 2015
|
316,628
|
|
3,166
|
|
783,793
|
|
1,740
|
|
1,836,442
|
|
(41,353
|
)
|
(792,192
|
)
|
1,832,949
|
|
||||||||||||||
|
Net income
|
—
|
|
—
|
|
—
|
|
—
|
|
374,267
|
|
—
|
|
—
|
|
374,267
|
|
||||||||||||||
|
Other comprehensive loss
|
—
|
|
—
|
|
—
|
|
(12,973
|
)
|
—
|
|
—
|
|
—
|
|
(12,973
|
)
|
||||||||||||||
|
Stock-based compensation
|
—
|
|
—
|
|
23,540
|
|
—
|
|
—
|
|
—
|
|
—
|
|
23,540
|
|
||||||||||||||
|
Stock awards exercised or vested
|
—
|
|
—
|
|
(15,257
|
)
|
—
|
|
(2,848
|
)
|
2,262
|
|
43,451
|
|
25,346
|
|
||||||||||||||
|
Acquisition of treasury shares
|
—
|
|
—
|
|
—
|
|
—
|
|
—
|
|
(610
|
)
|
(18,102
|
)
|
(18,102
|
)
|
||||||||||||||
|
Repurchase and retirement of common shares
|
(56,409
|
)
|
(564
|
)
|
(33,846
|
)
|
—
|
|
(1,965,826
|
)
|
—
|
|
—
|
|
(2,000,236
|
)
|
||||||||||||||
|
Cash dividends declared - $0.80 per share
|
—
|
|
—
|
|
—
|
|
—
|
|
(201,688
|
)
|
—
|
|
—
|
|
(201,688
|
)
|
||||||||||||||
|
Balances as of April 30, 2016
|
260,219
|
|
2,602
|
|
758,230
|
|
(11,233
|
)
|
40,347
|
|
(39,701
|
)
|
(766,843
|
)
|
23,103
|
|
||||||||||||||
|
Net income
|
—
|
|
—
|
|
—
|
|
—
|
|
408,945
|
|
—
|
|
—
|
|
408,945
|
|
||||||||||||||
|
Other comprehensive loss
|
—
|
|
—
|
|
—
|
|
(4,066
|
)
|
—
|
|
—
|
|
—
|
|
(4,066
|
)
|
||||||||||||||
|
Stock-based compensation
|
—
|
|
—
|
|
19,285
|
|
—
|
|
—
|
|
—
|
|
—
|
|
19,285
|
|
||||||||||||||
|
Stock awards exercised or vested
|
—
|
|
—
|
|
(14,191
|
)
|
—
|
|
(1,915
|
)
|
928
|
|
17,921
|
|
1,815
|
|
||||||||||||||
|
Acquisition of treasury shares
|
—
|
|
—
|
|
—
|
|
—
|
|
—
|
|
(255
|
)
|
(5,830
|
)
|
(5,830
|
)
|
||||||||||||||
|
Repurchase and retirement of common shares
|
(14,020
|
)
|
(140
|
)
|
(8,412
|
)
|
—
|
|
(308,468
|
)
|
—
|
|
—
|
|
(317,020
|
)
|
||||||||||||||
|
Cash dividends declared - $0.88 per share
|
—
|
|
—
|
|
—
|
|
—
|
|
(187,115
|
)
|
—
|
|
—
|
|
(187,115
|
)
|
||||||||||||||
|
Balances as of April 30, 2017
|
246,199
|
|
$
|
2,462
|
|
$
|
754,912
|
|
$
|
(15,299
|
)
|
$
|
(48,206
|
)
|
(39,028
|
)
|
$
|
(754,752
|
)
|
$
|
(60,883
|
)
|
||||||||
|
40
|
2017 Form 10-K |
H&R Block, Inc.
|
NOTES TO CONSOLIDATED FINANCIAL STATEMENTS
NATURE OF OPERATIONS
– Our operating subsidiaries provide assisted and do-it-yourself (DIY) tax return preparation solutions through multiple channels (including in-person, online and mobile applications, and desktop software) and distribute H&R Block-branded financial products and services, including those of our financial partners, to the general public primarily in the United States (U.S.), Canada, Australia, and their respective territories.
PRINCIPLES OF CONSOLIDATION
– The consolidated financial statements include the accounts of the Company and our 100% owned subsidiaries. Intercompany transactions and balances have been eliminated.
DISCONTINUED OPERATIONS
– Our discontinued operations include the results of operations of Sand Canyon Corporation, previously known as Option One Mortgage Corporation (including its subsidiaries, collectively, SCC), which exited its mortgage business in fiscal year 2008. See notes
13
and
14
for additional information on litigation, claims, and other loss contingencies related to our discontinued operations.
MANAGEMENT ESTIMATES
– The preparation of financial statements in conformity with accounting principles generally accepted in the U. S. (GAAP) requires management to make estimates and assumptions that affect the reported amounts of assets and liabilities and disclosure of contingent assets and liabilities at the date of the financial statements and the reported amounts of revenues and expenses during the reporting periods. Significant estimates, assumptions and judgments are applied in the evaluation of contingent losses arising from our discontinued mortgage business, contingent losses associated with pending claims and litigation, reserves for uncertain tax positions and related matters. Estimates have been prepared based on the best information available as of each balance sheet date. As such, actual results could differ materially from those estimates.
CASH AND CASH EQUIVALENTS
– All non-restricted highly liquid instruments purchased with an original maturity of three months or less are considered to be cash equivalents.
Outstanding checks in excess of funds on deposit (book overdrafts) included in accounts payable totaled
$29.6 million
and
$43.1 million
as of April 30,
2017
and
2016
, respectively.
CASH AND CASH EQUIVALENTS
–
RESTRICTED
– Cash and cash equivalents – restricted consists primarily of cash held by our captive insurance subsidiary.
RECEIVABLES AND RELATED ALLOWANCES
– Our trade receivables consist primarily of accounts receivable from tax clients for tax return preparation. The allowance for doubtful accounts for these receivables requires management's judgment regarding collectibility and current economic conditions to establish an amount considered by management to be adequate to cover estimated losses as of the balance sheet date. Credit losses from tax clients for tax return preparation are not specifically identified and charged off; instead they are evaluated on a pooled basis. At the end of each tax season the outstanding balances on these receivables are evaluated based on collections received and expected collections over subsequent tax seasons.
Our financing receivables consist primarily of participations in H&R Block Emerald Advance
®
lines of Credit (EAs), loans made to franchisees, and amounts due under our Instant Cash Back® program in Canada.
H&R Block Emerald Advance® lines of credit
. EAs are typically offered to clients in our offices from late November through December, currently in an amount not to exceed
$1,000
. If the borrower meets certain criteria as agreed in the loan terms, the line of credit can be utilized year-round. EA balances require an annual paydown on February 15
th
, and any amounts unpaid are placed on non-accrual status as of March 1
st
. Payments on past due amounts are applied to principal. Beginning in fiscal year 2016, we no longer originate EAs. These lines of credit are offered by BofI Federal Bank, a federal savings bank (BofI). We purchase participation interests in their loans, as discussed further in
note 12
.
Credit losses from EAs are not specifically identified and charged off; instead we review the credit quality of these receivables on a pooled basis, segregated by the year of origination. Credit losses are based on an analysis of collections received and expected collections over subsequent tax seasons. We charge-off receivables to an amount we believe represents the net realizable value.
Loans made to franchisees.
The credit quality of these receivables is assessed at origination at an individual franchisee level. Payment history is monitored on a regular basis. Based upon our internal analysis and underwriting
|
H&R Block, Inc.
| 2017 Form 10-K
|
41
|
activities, we believe all loans to franchisees are of similar credit quality. Loans are evaluated for collectibility when they become delinquent. Amounts deemed to be uncollectible are written off to bad debt expense and bad debt related to these loans has typically been immaterial. Additionally, the franchise territory serves as additional protection in the event a franchisee defaults on the loan, as we may revoke franchise rights, write off the remaining balance of the loan and refranchise the territory or begin operating it as company-owned.
Instant Cash Back® receivables.
Our Canadian operations advance refunds due to certain clients from the Canada Revenue Agency (CRA), in exchange for a fee. The total fee we charge for this service is mandated by legislation which is administered by the CRA. Interest is not charged on these balances, in accordance with CRA regulations. The client assigns to us the full amount of the tax refund to be issued by the CRA and the refund is then sent by the CRA directly to us. The amount we advance to clients under this program is the amount of their estimated refund, less our fees, any amounts expected to be withheld by the CRA for amounts the client may owe to government authorities and any amounts owed to us from prior years. The CRA's system for tracking amounts due to various government agencies also indicates if the client has already filed a return, does not exist in the CRA's records, or is bankrupt. This serves to greatly reduce the amounts of uncollectible receivables and the risk of fraudulent returns.
We do not specifically identify credit losses for these receivables; instead we determine our allowance for these receivables based on a review of receipts taking into consideration historical experience. In September of each fiscal year, any balances remaining from the previous tax season are charged-off against the related allowance.
PROPERTY AND EQUIPMENT
– Buildings and equipment are initially recorded at cost and are depreciated over the estimated useful life of the assets using the straight-line method. Leasehold improvements are initially recorded at cost and are amortized over the lesser of the remaining term of the respective lease or the estimated useful life, using the straight-line method. Estimated useful lives are
15
to
40
years for buildings,
three
to
five
years for computers and other equipment,
three
years for purchased software and up to
eight
years for leasehold improvements.
Substantially all of the operations of our subsidiaries are conducted in leased premises. For all lease agreements, including those with escalating rent payments or rent holidays, we recognize rent expense on a straight-line basis.
GOODWILL AND INTANGIBLE ASSETS
– Goodwill represents costs in excess of fair values assigned to the underlying net assets of acquired businesses. Goodwill is not amortized, but rather is tested for impairment annually, or more frequently if indications of potential impairment exist.
Intangible assets with finite lives are amortized over their estimated useful lives and are reviewed for impairment whenever events or changes in circumstances indicate that their carrying amount may not be recoverable. The weighted-average life of intangible assets with finite lives is
18
years. Intangible assets are typically amortized over the estimated useful life of the assets using the straight-line method.
We capitalize certain allowable costs associated with software developed for internal use. These costs are typically amortized over
three
to
five years
using the straight-line method.
TREASURY SHARES
– We record shares of common stock repurchased by us as treasury shares, at cost, resulting in a reduction of stockholders' equity. Periodically, we may retire shares held in treasury as determined by our Board of Directors. We typically reissue treasury shares as part of our stock-based compensation programs. When shares are reissued, we determine the cost using the average cost method.
REVENUE RECOGNITION
– We recognize revenue for our services when each of the following four criteria is met: persuasive evidence of an arrangement exists; delivery has occurred or services have been rendered; the selling price is fixed or determinable; and collectibility is reasonably assured.
Service revenues consist primarily of fees for preparation and filing of tax returns, both in offices and through our online programs, fees earned on refund transfers (RTs), interchange income associated with our H&R Block Emerald Prepaid MasterCard
®
program and fees associated with our Peace of Mind
®
Extended Service Plan (POM). Service revenues are recognized in the period in which the service is performed as follows:
|
▪
|
Assisted and online tax preparation revenues are recorded when a completed return is electronically filed or accepted by the customer.
|
|
▪
|
Fees related to RTs are recognized when Internal Revenue Service (IRS) acknowledgment is received and the bank account is established at BofI.
|
|
42
|
2017 Form 10-K |
H&R Block, Inc.
|
|
▪
|
Revenues associated with our H&R Block Emerald Prepaid MasterCard
®
program consist of interchange income from the use of debit cards and fees from the use of ATM networks, net of volume-based amounts retained by BofI in connection with our agreement. Interchange income is a fee paid by a merchant bank to BofI th
r
ough the interchange network. Net revenue associated with our H&R Block Prepaid Mastercard® is recognized based on cardholder transactions.
|
|
▪
|
POM revenues are deferred and recognized over the term of the plan, based on actual claims paid in relation to projected claims.
|
Royalty, product and other revenues include royalties from franchisees and sales of desktop software products, and are recognized as follows:
|
▪
|
Franchise royalties, which are based on contractual percentages of franchise revenues, are recorded in the period in which the services are provided to the customer.
|
|
▪
|
Revenue from the sale of desktop software is recognized when the product is sold to the end user. Rebates, slotting fees and other incentives paid in connection with these sales are recorded as a reduction of revenue.
|
|
▪
|
Participation revenue on EAs is recorded over the life of the underlying loan.
|
|
▪
|
Interest on loans to franchisees is calculated using the average daily balance method and is recognized based on the principal amount outstanding until the outstanding balance is paid or becomes delinquent.
|
Sales tax we collect and remit to taxing authorities is recorded net in the consolidated statements of income.
ADVERTISING EXPENSE
– Advertising costs for radio and television ads are expensed over the course of the tax season, with print and mailing advertising expensed as incurred.
EMPLOYEE BENEFIT PLANS
– We have a 401(k) defined contribution plan covering eligible full-time and seasonal employees following the completion of an eligibility period. Contributions to this plan are discretionary and totaled
$13.8 million
,
$14.3 million
and
$14.8 million
for continuing operations in fiscal years
2017
,
2016
and
2015
, respectively.
We have severance plans covering executives and eligible regular full-time or part-time active employees of a participating employer who incur a qualifying termination. Expenses related to severance benefits of continuing operations totaled
$5.6 million
,
$12.0 million
and
$6.7 million
in fiscal years
2017
,
2016
and
2015
, respectively.
NEW ACCOUNTING PRONOUNCEMENTS
–
Interest.
On May 1, 2016 we adopted Accounting Standards Update No. 2015-3, "Interest - Imputation of Interest," (ASU 2015-3) which requires that debt issuance costs related to a recognized debt liability be presented in the balance sheet as a direct deduction from the carrying amount of that debt liability, consistent with debt discounts. This guidance must be applied retrospectively to all periods presented. Prior periods have been retrospectively adjusted to conform to the current period presentation. Debt issuance costs related to our Senior Notes previously reported as other current assets and other noncurrent assets have been reclassified to long-term debt. This guidance did not have a material effect on our consolidated financial statements.
Stock-based compensation.
In March 2016, the Financial Accounting Standards Board (FASB) issued Accounting Standards Update No. 2016-9, "Compensation-Stock Compensation (Topic 718): Improvements to Employee Share-Based Payment Accounting" (ASU 2016-9), to reduce complexity in accounting standards involving several aspects of the accounting for employee share-based payment transactions, including the income tax consequences, classification of awards as either equity or liabilities, and classification on the statement of cash flows. We will adopt this guidance as of May 1, 2017 and do not believe it will have a material impact on our consolidated financial statements.
Leases.
In February 2016, the FASB issued Accounting Standards Update No. 2016-2, "Leases" (ASU 2016-2), which will require the recognition of lease assets and lease liabilities by lessees for leases previously classified as operating leases. ASU 2016-2 also requires additional qualitative and quantitative disclosures related to the nature, timing and uncertainty of cash flows arising from leases. This guidance will be effective for us on May 1, 2019, with early adoption permitted, and requires the use of a modified retrospective approach for leases that exist or are entered into after the beginning of the earliest comparative period in the financial statements. We are currently evaluating the impact of ASU 2016-2 on our consolidated financial statements, however we expect the impact of this guidance on our consolidated financial statements could be significant.
|
H&R Block, Inc.
| 2017 Form 10-K
|
43
|
Revenue recognition.
In May 2014, the FASB issued Accounting Standards Update No. 2014-09, "Revenue from Contracts with Customers," (ASU 2014-09) which is a comprehensive new revenue recognition model that requires an entity to recognize the amount of revenue which reflects the consideration it expects to receive in exchange for the transfer of the promised goods or services to customers. This ASU also requires additional disclosure about the nature, amount, timing and uncertainty of revenue and cash flows arising from customer contracts, including significant judgments and changes in judgments and assets recognized from costs incurred to obtain or fulfill a contract, and clarifies guidance for multiple-element arrangements. This guidance will replace most existing revenue recognition guidance in U.S. GAAP when it becomes effective. The new standard is effective for us on May 1, 2018. The standard permits the use of either the retrospective or cumulative effect transition method.
We have substantially completed our evaluation of the impact of ASU 2014-09 on our U.S. assisted tax preparation fees and revenues from POM, and based on the preliminary results of our evaluation, we do not expect the application of this guidance to have a material impact on the recognition of revenue related to these services. Changes to our client agreements or service design before adoption of the new standard could change our preliminary conclusions. We are still evaluating the impact of this guidance as it relates to other revenue streams, as well as certain associated expenses. Depending on the results of our review, there could be changes to the classification and timing of recognition of revenues and expenses related to other revenue streams. We are continuing our assessment, including evaluating the standard's impact on our internal controls and selecting a transition method for adoption.
Basic and diluted earnings per share is computed using the two-class method. The two-class method is an earnings allocation formula that determines net income per share for each class of common stock and participating security according to dividends declared and participation rights in undistributed earnings. Per share amounts are computed by dividing net income from continuing operations attributable to common shareholders by the weighted average shares outstanding during each period.
The computations of basic and diluted earnings per share from continuing operations are as follows:
|
(in 000s, except per share amounts)
|
||||||||||||
|
Year ended April 30,
|
2017
|
|
2016
|
|
2015
|
|
||||||
|
Net income from continuing operations attributable to shareholders
|
$
|
420,917
|
|
$
|
383,553
|
|
$
|
486,744
|
|
|||
|
Amounts allocated to participating securities
|
(1,005
|
)
|
(718
|
)
|
(774
|
)
|
||||||
|
Net income from continuing operations attributable to common shareholders
|
$
|
419,912
|
|
$
|
382,835
|
|
$
|
485,970
|
|
|||
|
Basic weighted average common shares
|
212,809
|
|
249,009
|
|
275,033
|
|
||||||
|
Potential dilutive shares
|
1,286
|
|
1,809
|
|
2,103
|
|
||||||
|
Dilutive weighted average common shares
|
214,095
|
|
250,818
|
|
277,136
|
|
||||||
|
Earnings per share from continuing operations attributable to common shareholders:
|
||||||||||||
|
Basic
|
$
|
1.97
|
|
$
|
1.54
|
|
$
|
1.77
|
|
|||
|
Diluted
|
1.96
|
|
1.53
|
|
1.75
|
|
||||||
Diluted earnings per share excludes the impact of shares of common stock issuable upon the lapse of certain restrictions or the exercise of options to purchase
0.3 million
,
0.1 million
and
0.1 million
shares of stock for fiscal years
2017
,
2016
and
2015
, respectively, as the effect would be antidilutive.
|
44
|
2017 Form 10-K |
H&R Block, Inc.
|
Receivables consist of the following:
|
(in 000s)
|
||||||||||||||||
|
As of April 30,
|
2017
|
2016
|
||||||||||||||
|
Short-term
|
|
Long-term
|
|
Short-term
|
|
Long-term
|
|
|||||||||
|
Loans to franchisees
|
$
|
39,911
|
|
$
|
36,614
|
|
$
|
50,000
|
|
$
|
46,284
|
|
||||
|
Receivables for tax preparation and related fees
|
54,506
|
|
6,316
|
|
52,327
|
|
5,528
|
|
||||||||
|
Instant Cash Back
®
receivables
|
37,150
|
|
—
|
|
37,663
|
|
—
|
|
||||||||
|
H&R Block Emerald Advance
®
lines of credit
|
26,325
|
|
5,069
|
|
25,092
|
|
869
|
|
||||||||
|
Software receivables from retailers
|
16,715
|
|
—
|
|
8,940
|
|
—
|
|
||||||||
|
Royalties and other receivables from franchisees
|
13,275
|
|
1,585
|
|
9,997
|
|
—
|
|
||||||||
|
Other
|
30,189
|
|
3,314
|
|
26,108
|
|
7,726
|
|
||||||||
|
218,071
|
|
52,898
|
|
210,127
|
|
60,407
|
|
|||||||||
|
Allowance for doubtful accounts
|
(55,296
|
)
|
—
|
|
(57,011
|
)
|
—
|
|
||||||||
|
$
|
162,775
|
|
$
|
52,898
|
|
$
|
153,116
|
|
$
|
60,407
|
|
|||||
Balances presented above as short-term are included in receivables, while the long-term portions are included in other noncurrent assets in the consolidated balance sheets.
Loans to Franchisees.
Franchisee loan balances as of April 30,
2017
consisted of
$49.5 million
in term loans made primarily to finance the purchase of franchises and
$27.0 million
in revolving lines of credit primarily for the purpose of funding off-season working capital needs. Loans made to franchisees as of April 30,
2016
consisted of
$61.2 million
in term loans and
$35.1 million
in revolving lines of credit.
As of April 30,
2017
, we had
$0.1 million
of loans more than 90 days past due, while we had
no
such loans, as of April 30,
2016
. We had no loans to franchisees on non-accrual status as of April 30,
2017
or
2016
.
Canadian Instant Cash Back® Program.
Refunds advanced under the Instant Cash Back program are not subject to credit approval, therefore the primary indicator of credit quality is the age of the receivable amount. Instant Cash Back amounts are generally received within 60 days of filing the client's return. As of April 30,
2017
and
2016
, we had
$1.5 million
of Instant Cash Back balances were more than 60 days old.
H&R Block Emerald Advance® lines of credit.
Beginning in fiscal year 2016, we no longer originate EAs. These lines of credit are originated by BofI, and we purchase a participation interest in them.
We review the credit quality of our EA receivables based on pools, which are segregated by the year of origination, with older years being deemed more unlikely to be repaid. These amounts as of April 30,
2017
, by year of origination, are as follows:
|
(in 000s)
|
||||
|
Credit Quality Indicator – Year of origination:
|
||||
|
2017
|
$
|
10,160
|
|
|
|
2016
|
4,527
|
|
||
|
2015 and prior
|
2,709
|
|
||
|
Revolving loans
|
13,998
|
|
||
|
$
|
31,394
|
|
||
As of April 30,
2017
and
2016
,
$28.0 million
and
$21.1 million
of EAs were on non-accrual status and classified as impaired, or more than
60
days past due, respectively.
|
H&R Block, Inc.
| 2017 Form 10-K
|
45
|
Allowance for Doubtful Accounts.
Activity in the allowance for doubtful accounts for our receivables is as follows:
|
(in 000s)
|
||||||||||||
|
EAs
|
|
All Other
|
|
Total
|
|
|||||||
|
Balances as of May 1, 2014
|
$
|
7,530
|
|
$
|
45,048
|
|
$
|
52,578
|
|
|||
|
Provision
|
27,065
|
|
44,002
|
|
71,067
|
|
||||||
|
Charge-offs, net of recoveries
|
(27,242
|
)
|
(41,876
|
)
|
(69,118
|
)
|
||||||
|
Balances as of April 30, 2015
|
7,353
|
|
47,174
|
|
54,527
|
|
||||||
|
Provision
|
24,939
|
|
48,743
|
|
73,682
|
|
||||||
|
Charge-offs, net of recoveries
|
(23,285
|
)
|
(47,913
|
)
|
(71,198
|
)
|
||||||
|
Balances as of April 30, 2016
|
9,007
|
|
48,004
|
|
57,011
|
|
||||||
|
Provision
|
12,713
|
|
40,063
|
|
52,776
|
|
||||||
|
Charge-offs, net of recoveries
|
(11,597
|
)
|
(42,894
|
)
|
(54,491
|
)
|
||||||
|
Balances as of April 30, 2017
|
$
|
10,123
|
|
$
|
45,173
|
|
$
|
55,296
|
|
|||
In fiscal year
2017
, we recorded recoveries of
$6.8 million
on EAs against our allowance, compared to none in fiscal years
2016
and
2015
.
The components of property and equipment, net of accumulated depreciation and amortization, are as follows:
|
(in 000s)
|
||||||||
|
As of April 30,
|
2017
|
|
2016
|
|
||||
|
Buildings
|
$
|
69,904
|
|
$
|
76,289
|
|
||
|
Computers and other equipment
|
111,618
|
|
128,815
|
|
||||
|
Leasehold improvements
|
74,112
|
|
77,712
|
|
||||
|
Purchased software
|
6,570
|
|
9,126
|
|
||||
|
Land and other non-depreciable assets
|
1,623
|
|
1,623
|
|
||||
|
$
|
263,827
|
|
$
|
293,565
|
|
|||
Depreciation and amortization expense of property and equipment for continuing operations for fiscal years
2017
,
2016
and
2015
was
$103.2 million
,
$100.8 million
and
$101.3 million
, respectively.
Changes in the carrying amount of goodwill for the years ended April 30,
2017
and
2016
are as follows:
|
(in 000s)
|
||||||||||||
|
Goodwill
|
|
Accumulated Impairment Losses
|
|
Net
|
|
|||||||
|
Balances as of May 1, 2015
|
$
|
474,128
|
|
$
|
(32,297
|
)
|
$
|
441,831
|
|
|||
|
Acquisitions
|
27,765
|
|
—
|
|
27,765
|
|
||||||
|
Disposals and foreign currency changes, net
|
1,161
|
|
—
|
|
1,161
|
|
||||||
|
Impairments
|
—
|
|
—
|
|
—
|
|
||||||
|
Balances as of April 30, 2016
|
503,054
|
|
(32,297
|
)
|
470,757
|
|
||||||
|
Acquisitions
|
19,261
|
|
—
|
|
19,261
|
|
||||||
|
Disposals and foreign currency changes, net
|
1,189
|
|
—
|
|
1,189
|
|
||||||
|
Impairments
|
—
|
|
—
|
|
—
|
|
||||||
|
Balances as of April 30, 2017
|
$
|
523,504
|
|
$
|
(32,297
|
)
|
$
|
491,207
|
|
|||
We tested goodwill for impairment in the fourth quarter of fiscal year
2017
, and did not identify any impairment.
|
46
|
2017 Form 10-K |
H&R Block, Inc.
|
Components of intangible assets are as follows:
|
(in 000s)
|
||||||||||||||||||||||||
|
As of April 30,
|
2017
|
2016
|
||||||||||||||||||||||
|
Gross
Carrying
Amount
|
|
Accumulated
Amortization
|
|
Net
|
|
Gross
Carrying
Amount
|
|
Accumulated
Amortization
|
|
Net
|
|
|||||||||||||
|
Reacquired franchise rights
|
$
|
331,150
|
|
$
|
(90,877
|
)
|
$
|
240,273
|
|
$
|
319,354
|
|
$
|
(68,284
|
)
|
$
|
251,070
|
|
||||||
|
Customer relationships
|
234,603
|
|
(133,207
|
)
|
101,396
|
|
206,607
|
|
(104,072
|
)
|
102,535
|
|
||||||||||||
|
Internally-developed software
|
139,709
|
|
(108,379
|
)
|
31,330
|
|
131,161
|
|
(95,768
|
)
|
35,393
|
|
||||||||||||
|
Noncompete agreements
|
32,408
|
|
(27,559
|
)
|
4,849
|
|
31,499
|
|
(25,572
|
)
|
5,927
|
|
||||||||||||
|
Franchise agreements
|
19,201
|
|
(10,774
|
)
|
8,427
|
|
19,201
|
|
(9,494
|
)
|
9,707
|
|
||||||||||||
|
Purchased technology
|
54,700
|
|
(31,973
|
)
|
22,727
|
|
54,700
|
|
(25,909
|
)
|
28,791
|
|
||||||||||||
|
Acquired assets pending final allocation
(1)
|
362
|
|
—
|
|
362
|
|
462
|
|
—
|
|
462
|
|
||||||||||||
|
$
|
812,133
|
|
$
|
(402,769
|
)
|
$
|
409,364
|
|
$
|
762,984
|
|
$
|
(329,099
|
)
|
$
|
433,885
|
|
|||||||
(1)
Represents recent business acquisitions for which final purchase price allocations have not yet been determined.
The increase in the gross carrying amount of intangible assets resulted primarily from the acquisition of approximately
230
offices to our company-owned network. The amounts and weighted-average lives of assets acquired or added during fiscal year
2017
are as follows:
|
(dollars in 000s)
|
||||||
|
Amount
|
|
Weighted-Average Life (in years)
|
||||
|
Reacquired franchise rights
|
$
|
12,681
|
|
5
|
||
|
Customer relationships
|
29,470
|
|
6
|
|||
|
Internally-developed software
|
9,661
|
|
3
|
|||
|
Noncompete agreements
|
1,065
|
|
5
|
|||
|
Total
|
$
|
52,877
|
|
5
|
||
Amortization of intangible assets of continuing operations for the years ended April 30,
2017
,
2016
and
2015
was
$78.9 million
,
$72.8 million
and
$58.5 million
, respectively. Estimated amortization of intangible assets for fiscal years
2018
,
2019
,
2020
,
2021
and
2022
is
$74.8 million
,
$60.0 million
,
$43.7 million
,
$30.3 million
and
$20.1 million
, respectively.
The components of long-term debt are as follows:
|
(in 000s)
|
||||||||
|
As of April 30,
|
2017
|
|
2016
|
|
||||
|
Senior Notes, 4.125%, due October 2020
|
$
|
650,000
|
|
$
|
650,000
|
|
||
|
Senior Notes, 5.500%, due November 2022
|
500,000
|
|
500,000
|
|
||||
|
Senior Notes, 5.250%, due October 2025
|
350,000
|
|
350,000
|
|
||||
|
Capital lease obligation, due over the next 6 years
|
6,610
|
|
7,435
|
|
||||
|
Debt issuance costs and discounts
|
(12,612
|
)
|
(15,234
|
)
|
||||
|
1,493,998
|
|
1,492,201
|
|
|||||
|
Less: Current portion
|
(981
|
)
|
(826
|
)
|
||||
|
$
|
1,493,017
|
|
$
|
1,491,375
|
|
|||
Effective May 1, 2016, we adopted the provisions of ASU 2015-3 on a retrospective basis. Accordingly, debt issuance costs related to our Senior Notes are included in long-term debt in the consolidated balance sheets. Amounts for prior periods have been retrospectively adjusted to conform to the current period presentation.
|
H&R Block, Inc.
| 2017 Form 10-K
|
47
|
UNSECURED COMMITTED LINE OF CREDIT
– On September 22, 2016, we entered into a First Amended and Restated Credit and Guarantee Agreement (2016 CLOC), which amended our Credit and Guarantee Agreement (2015 CLOC), extending the scheduled maturity date from September 21, 2020 to September 22, 2021 and decreasing the sublimit for standby letters of credit. Other material terms remain unchanged from our 2015 CLOC. The 2016 CLOC provides for an unsecured senior revolving credit facility in the aggregate principal amount of
$2.0 billion
, which includes a
$200.0 million
sublimit for swingline loans and a
$50.0 million
sublimit for standby letters of credit. Proceeds under the 2016 CLOC may be used for working capital needs or for other general corporate purposes. We may request increases in the aggregate principal amount of the revolving credit facility of up to
$500.0 million
, subject to obtaining commitments from lenders and meeting certain other conditions. The 2016 CLOC will mature on September 22, 2021, unless extended pursuant to the terms of the 2016 CLOC, at which time all outstanding amounts thereunder will be due and payable. The 2016 CLOC includes an annual facility fee, which will vary depending on our then current credit ratings.
The 2016 CLOC is subject to various conditions, triggers, events or occurrences that could result in earlier termination and contains customary representations, warranties, covenants and events of default, including, without limitation: (1) a covenant requiring the Company to maintain a debt-to-EBITDA ratio calculated on a consolidated basis of no greater than (a)
3.50
to 1.00 as of the last day of each fiscal quarter ending on April 30, July 31, and October 31 of each year and (b)
4.50
to 1.00 as of the last day of each fiscal quarter ending on January 31 of each year; (2) a covenant requiring us to maintain an interest coverage (EBITDA-to-interest expense) ratio calculated on a consolidated basis of not less than
2.50
to 1.00 as of the last date of any fiscal quarter; and (3) covenants restricting our ability to incur certain additional debt, incur liens, merge or consolidate with other companies, sell or dispose of assets (including equity interests), liquidate or dissolve, engage in certain transactions with affiliates or enter into certain restrictive agreements. The 2016 CLOC includes provisions for an equity cure which could potentially allow us to independently cure certain defaults. We were in compliance with these requirements as of April 30,
2017
. As of April 30,
2017
, amounts available to borrow under the 2016 CLOC were limited by the debt-to-EBITDA covenant to approximately
$1.6 billion
, however, our cash needs at April 30 generally do not require us to borrow on our CLOC at that time. We had no balance outstanding under the 2016 CLOC as of April 30,
2017
.
SENIOR NOTES
– On September 25, 2015, we issued
$650.0 million
of
4.125%
Senior Notes due October 1, 2020, and
$350.0 million
of
5.250%
Senior Notes due October 1, 2025. The Senior Notes are not redeemable by the bondholders prior to maturity, although we have the right to redeem some or all of these notes at any time, at specified redemption prices. Proceeds of the Senior Notes issued in September 2015, along with cash on hand, were used to repurchase shares, as discussed in
note 8
.
On October 25, 2012, we issued
$500.0 million
of
5.50%
Senior Notes due November 1, 2022. The Senior Notes are not redeemable by the bondholders prior to maturity.
The interest rates on our Senior Notes are subject to adjustment based upon our credit ratings.
OTHER INFORMATION
– The aggregate payments required to retire long-term debt are
$1.0 million
,
$1.0 million
,
$1.1 million
,
$651.1 million
,
$1.2 million
and
$851.2 million
in fiscal years
2018
,
2019
,
2020
,
2021
,
2022
and beyond, respectively.
FAIR VALUE MEASUREMENT
– We use the following classification of financial instruments pursuant to the fair value hierarchy methodologies for assets measured at fair value:
|
▪
|
Level 1
–
inputs to the valuation are quoted prices in an active market for identical assets.
|
|
▪
|
Level 2
–
inputs to the valuation include quoted prices for similar assets in active markets utilizing a third-party pricing service to determine fair value.
|
|
▪
|
Level 3
–
valuation is based on significant inputs that are unobservable in the market and our own estimates of assumptions that we believe market participants would use in pricing the asset.
|
Assets measured on a recurring basis are initially measured at fair value and are required to be remeasured at fair value in the financial statements at each reporting date. There were no transfers between hierarchy levels during the fiscal years ended April 30,
2017
and
2016
.
|
48
|
2017 Form 10-K |
H&R Block, Inc.
|
ESTIMATED FAIR VALUE OF FINANCIAL INSTRUMENTS
– The carrying amounts and estimated fair values of our financial instruments are as follows:
|
(in 000s)
|
||||||||||||||||||
|
As of April 30,
|
2017
|
2016
|
Fair Value
Hierarchy
|
|||||||||||||||
|
Carrying
Amount |
|
Estimated
Fair Value |
|
Carrying
Amount
|
|
Estimated
Fair Value
|
|
|||||||||||
|
Assets:
|
||||||||||||||||||
|
Cash and cash equivalents
|
$
|
1,011,331
|
|
$
|
1,011,331
|
|
$
|
896,801
|
|
$
|
896,801
|
|
Level 1
|
|||||
|
Cash and cash equivalents - restricted
|
106,208
|
|
106,208
|
|
104,110
|
|
104,110
|
|
Level 1
|
|||||||||
|
Receivables, net - short-term
|
162,775
|
|
162,775
|
|
153,116
|
|
153,116
|
|
Level 1
|
|||||||||
|
Receivables, net - long-term
|
52,898
|
|
52,898
|
|
60,407
|
|
60,407
|
|
Level 1 and 3
|
|||||||||
|
Liabilities:
|
||||||||||||||||||
|
Long-term debt (excluding debt issuance costs)
|
1,502,735
|
|
1,569,033
|
|
1,502,751
|
|
1,566,098
|
|
Level 2
|
|||||||||
|
Contingent consideration
|
10,428
|
|
10,428
|
|
8,657
|
|
8,657
|
|
Level 3
|
|||||||||
Fair value estimates, methods and assumptions are set forth below. The fair value was not estimated for assets and liabilities that are not considered financial instruments.
|
▪
|
Cash and cash equivalents, including restricted - Fair value approximates the carrying amount.
|
|
▪
|
Receivables, net - short-term - For short-term balances the carrying values reported in the balance sheet approximate fair market value due to the relative short-term nature of the respective instruments.
|
|
▪
|
Receivables, net - long-term - The carrying values for the long-term portion of loans to franchisees approximate fair market value due to variable interest rates, low historical delinquency rates and franchise territories serving as collateral (Level 1). Long-term EA receivables are carried at net realizable value which approximates fair value (Level 3). Net realizable value is determined based on historical collection rates.
|
|
▪
|
Long-term debt - The fair value of our Senior Notes is based on quotes from multiple banks.
|
|
▪
|
Contingent consideration - Fair value approximates the carrying amount.
|
During fiscal year
2017
, we repurchased and immediately retired
14.0 million
shares of stock at an aggregate cost of
$317.0 million
, or an average price of
$22.61
per share. During fiscal year
2016
, we repurchased and immediately retired
56.4 million
shares of stock at an aggregate cost of
$2.0 billion
, or an average price of
$35.46
per share. We had no similar repurchases or retirements of common stock in fiscal year
2015
.
As of April 30, 2017 and 2016, substantially all of the balance of our accumulated comprehensive loss consisted of foreign currency translation adjustments.
We have a stock-based Long Term Incentive Plan (Plan), under which we can grant stock options, restricted shares, performance-based share units, restricted share units, deferred stock units and other forms of equity to employees, non-employee directors and consultants. Stock-based compensation expense of our continuing operations totaled
$19.3 million
,
$23.5 million
and
$26.1 million
in fiscal years
2017
,
2016
and
2015
, respectively, net of related tax benefits of
$6.0 million
,
$9.5 million
and
$9.9 million
, respectively. We realized tax benefits of
$5.9 million
,
$20.9 million
and
$12.5 million
in fiscal years
2017
,
2016
and
2015
, respectively.
As of April 30,
2017
, we had
8.2 million
shares reserved for future awards under our Plan. We issue shares from our treasury stock to satisfy the exercise or vesting of stock-based awards and believe we have adequate treasury stock balances available for future issuances.
We measure the fair value of options on the grant date or modification date using the Black-Scholes-Merton (Black-Scholes) option valuation model based upon the expected term of the options. We measure the fair value of nonvested shares and share units based on the closing price of our common stock on the grant date. We measure the fair value of performance-based share units based on the Monte Carlo valuation model, taking into account as necessary those provisions of the performance-based nonvested share units that are characterized as market conditions. We generally expense the grant-date fair value, net of estimated forfeitures, over the vesting period on a straight-line basis.
|
H&R Block, Inc.
| 2017 Form 10-K
|
49
|
Options, nonvested shares and nonvested share units (other than performance-based nonvested share units) granted to employees typically vest pro-rata based upon service over a
three
-year period with a portion vesting each year. Performance-based nonvested share units granted to employees typically cliff vest at the end of a
three
-year period based upon satisfaction of both service-based and performance-based requirements. The number of performance-based share units that ultimately vest can range from zero up to 250 percent of the number granted, based on the form of the award, which can vary by year of grant. The performance metrics for these awards typically consist of earnings before interest, taxes, depreciation and amortization (EBITDA), EBITDA growth, return on equity, return on invested capital, total shareholder return or our stock price. Deferred stock units granted to non-employee directors vest when they are granted and are settled six months after the director separates from service as a director of the Company, except in the case of death.
All share units granted to employees and non-employee directors receive cumulative dividend equivalents to the extent of the units ultimately vesting at the time of distribution. Options granted under our Plan have a maximum contractual term of ten years.
STOCK OPTIONS
–
A summary of options for the fiscal year ended April 30,
2017
, is as follows:
|
(in 000s, except per share amounts)
|
|||||||||||||
|
Shares
|
|
Weighted-Average
Exercise Price |
|
Weighted-Average
Remaining Contractual Term |
Aggregate
Intrinsic Value |
|
|||||||
|
Outstanding, beginning of the year
|
1,976
|
|
$
|
18.76
|
|
||||||||
|
Granted
|
23
|
|
20.29
|
|
|||||||||
|
Exercised
|
(162
|
)
|
16.03
|
|
|||||||||
|
Forfeited or expired
|
(135
|
)
|
31.98
|
|
|||||||||
|
Outstanding, end of the year
|
1,702
|
|
$
|
17.99
|
|
4 years
|
$
|
11,651
|
|
||||
|
Exercisable, end of the year
|
1,675
|
|
$
|
17.93
|
|
4 years
|
$
|
11,549
|
|
||||
|
Exercisable and expected to vest
|
1,699
|
|
$
|
17.99
|
|
4 years
|
$
|
11,640
|
|
||||
The total intrinsic value of options exercised during fiscal years
2017
,
2016
and
2015
was
$1.0 million
,
$11.7 million
and
$8.4 million
, respectively. As of April 30,
2017
, we had
$0.1 million
of total unrecognized compensation cost related to outstanding options. The cost is expected to be recognized over a weighted-average period of
two
years.
When valuing our options on the grant date, we typically estimate the expected volatility using our historical stock price data. We also use historical exercise and forfeiture behaviors to estimate the options expected term and our forfeiture rate. The dividend yield is calculated based on the current dividend and the market price of our common stock on the grant date. The risk-free interest rate is based on the U.S. Treasury zero-coupon yield curve in effect on the grant date. Both expected volatility and the risk-free interest rate are based on a period that approximates the expected term.
The following assumptions were used to value options during the periods:
|
Year ended April 30,
|
2017
|
|
2016
|
|
2015
|
|
||||||
|
Options - management and director:
|
||||||||||||
|
Expected volatility
|
29.43%
|
|
22.95%-24.87%
|
|
26.25%
|
|
||||||
|
Expected term
|
4 years
|
|
4 years
|
|
4 years
|
|
||||||
|
Dividend yield
|
3.94%
|
|
2.26%-2.69%
|
|
2.62%
|
|
||||||
|
Risk-free interest rate
|
1.18%
|
|
1.29%-1.43%
|
|
1.43%
|
|
||||||
|
Weighted-average fair value
|
$
|
3.31
|
|
$
|
5.28
|
|
$
|
5.18
|
|
|||
|
50
|
2017 Form 10-K |
H&R Block, Inc.
|
OTHER AWARDS
– A summary of nonvested shares, nonvested share units and deferred stock units, including those that are performance-based, for the year ended April 30,
2017
, is as follows:
|
(shares in 000s)
|
||||||||||||||
|
Nonvested Shares and Nonvested Share Units
|
Performance-Based Nonvested Share Units
|
|||||||||||||
|
Shares
|
Weighted-Average
Grant Date Fair Value |
|
Shares
|
Weighted-Average
Grant Date Fair Value |
|
|||||||||
|
Outstanding, beginning of the year
|
1,513
|
|
$
|
26.21
|
|
1,099
|
|
$
|
31.86
|
|
||||
|
Granted
|
716
|
|
23.61
|
|
462
|
|
25.38
|
|
||||||
|
Released
|
(411
|
)
|
30.65
|
|
(270
|
)
|
28.55
|
|
||||||
|
Forfeited
|
(202
|
)
|
29.80
|
|
(192
|
)
|
30.12
|
|
||||||
|
Outstanding, end of the year
|
1,616
|
|
$
|
23.50
|
|
1,099
|
|
$
|
30.22
|
|
||||
The total fair value of shares and units vesting during fiscal years
2017
,
2016
and
2015
was
$20.3 million
,
$28.8 million
and
$14.3 million
, respectively. As of April 30,
2017
, we had
$25.0 million
of total unrecognized compensation cost related to these shares. This cost is expected to be recognized over a weighted-average period of
two
years.
When valuing our performance-based nonvested share units on the grant date, we typically estimate the expected volatility using historical volatility for H&R Block, Inc. and selected comparable companies. The dividend yield is calculated based on the current dividend and the market price of our common stock on the grant date. The risk-free interest rate is based on the U.S. Treasury zero-coupon yield curve in effect on the grant date. Both expected volatility and the risk-free interest rate are based on a period that approximates the expected term. The following assumptions were used to value performance-based nonvested share units using the Monte Carlo valuation model during the periods:
|
Year ended April 30,
|
2017
|
|
2016
|
|
2015
|
|
||||||
|
Expected volatility
|
13.92% - 74.53%
|
|
12.85% - 55.27%
|
|
12.28% - 78.42%
|
|
||||||
|
Expected term
|
3 years
|
|
3 years
|
|
3 years
|
|
||||||
|
Dividend yield
(1)
|
0% - 3.68%
|
|
0% - 2.70%
|
|
0% - 2.39%
|
|
||||||
|
Risk-free interest rate
|
0.84
|
%
|
0.95
|
%
|
0.81
|
%
|
||||||
|
Weighted-average fair value
|
$
|
25.38
|
|
$
|
30.00
|
|
$
|
37.17
|
|
|||
|
(1)
|
The valuation model assumes that dividends are reinvested by the Company on a continuous basis.
|
The components of income from continuing operations upon which domestic and foreign income taxes have been provided are as follows:
|
(in 000s)
|
||||||||||||
|
Year ended April 30,
|
2017
|
|
2016
|
|
2015
|
|
||||||
|
Domestic
|
$
|
535,378
|
|
$
|
513,746
|
|
$
|
682,744
|
|
|||
|
Foreign
|
93,909
|
|
55,733
|
|
60,061
|
|
||||||
|
$
|
629,287
|
|
$
|
569,479
|
|
$
|
742,805
|
|
||||
Foreign income consists principally of intercompany transactions and our tax operations in Canada and Australia.
|
H&R Block, Inc.
| 2017 Form 10-K
|
51
|
The components of income tax expense (benefit) for continuing operations are as follows:
|
(in 000s)
|
||||||||||||
|
Year ended April 30,
|
2017
|
|
2016
|
|
2015
|
|
||||||
|
Current:
|
||||||||||||
|
Federal
|
$
|
147,961
|
|
$
|
167,233
|
|
$
|
245,473
|
|
|||
|
State
|
15,118
|
|
(26,980
|
)
|
31,501
|
|
||||||
|
Foreign
|
10,678
|
|
8,735
|
|
9,788
|
|
||||||
|
173,757
|
|
148,988
|
|
286,762
|
|
|||||||
|
Deferred:
|
||||||||||||
|
Federal
|
39,299
|
|
19,937
|
|
(30,181
|
)
|
||||||
|
State
|
(5,064
|
)
|
13,801
|
|
(4,040
|
)
|
||||||
|
Foreign
|
378
|
|
3,200
|
|
3,520
|
|
||||||
|
34,613
|
|
36,938
|
|
(30,701
|
)
|
|||||||
|
Total income taxes for continuing operations
|
$
|
208,370
|
|
$
|
185,926
|
|
$
|
256,061
|
|
|||
The reconciliation between the income tax provision and the amount computed by applying the statutory federal tax rate of
35%
to income taxes of continuing operations is as follows:
|
Year ended April 30,
|
2017
|
|
2016
|
|
2015
|
|
|||
|
U.S. statutory tax rate
|
35.0
|
%
|
35.0
|
%
|
35.0
|
%
|
|||
|
Change in tax rate resulting from:
|
|||||||||
|
State income taxes, net of federal income tax benefit
|
1.6
|
%
|
2.2
|
%
|
3.5
|
%
|
|||
|
Earnings taxed in foreign jurisdictions
|
(4.6
|
)%
|
(2.0
|
)%
|
(1.8
|
)%
|
|||
|
Permanent differences
|
(0.4
|
)%
|
(0.2
|
)%
|
(0.3
|
)%
|
|||
|
Uncertain tax positions
|
4.3
|
%
|
2.8
|
%
|
(1.0
|
)%
|
|||
|
Change in valuation allowance
|
0.2
|
%
|
(0.5
|
)%
|
0.2
|
%
|
|||
|
Currency loss on previously taxed income
|
(1.6
|
)%
|
—
|
%
|
—
|
%
|
|||
|
Significant state apportionment changes
|
—
|
%
|
(4.3
|
)%
|
—
|
%
|
|||
|
Other
|
(1.4
|
)%
|
(0.3
|
)%
|
(1.1
|
)%
|
|||
|
Effective tax rate
|
33.1
|
%
|
32.7
|
%
|
34.5
|
%
|
|||
The effective tax rate for fiscal year
2017
increased
0.4%
compared to the prior year. This increase was primarily caused by two items. The tax rate increased
4.3%
due to a one-time material state apportionment benefit in the prior year that was not present in the current year. The tax rate increased another
1.5%
due to increased income tax reserves related to state apportionment and transfer pricing of intercompany transactions. These items were largely offset by a tax benefit from a foreign currency loss on a distribution of previously taxed income and a moderate shift of our income mix generated in lower tax jurisdictions.
The net loss from discontinued operations for fiscal years
2017
,
2016
and
2015
totaled
$12.0 million
,
$9.3 million
and
$13.1 million
, respectively, and was net of tax benefits of
$7.0 million
,
$5.4 million
and
$8.1 million
, respectively.
|
52
|
2017 Form 10-K |
H&R Block, Inc.
|
The significant components of deferred tax assets and liabilities are reflected in the following table:
|
(in 000s)
|
||||||||
|
As of April 30,
|
2017
|
|
2016
|
|
||||
|
Deferred tax assets:
|
||||||||
|
Accrued expenses
|
$
|
4,491
|
|
$
|
7,919
|
|
||
|
Deferred revenue
|
36,305
|
|
35,066
|
|
||||
|
Allowance for credit losses and related reserves
|
39,243
|
|
69,347
|
|
||||
|
Internally-developed software
|
55,253
|
|
51,998
|
|
||||
|
Deferred and stock-based compensation
|
17,919
|
|
19,075
|
|
||||
|
Net operating loss carry-forward
|
28,049
|
|
26,992
|
|
||||
|
Federal tax benefits related to state unrecognized tax benefits
|
36,265
|
|
31,123
|
|
||||
|
Other
|
—
|
|
10,187
|
|
||||
|
Valuation allowance
|
(22,844
|
)
|
(21,515
|
)
|
||||
|
Total deferred tax assets
|
194,681
|
|
230,192
|
|
||||
|
Deferred tax liabilities:
|
||||||||
|
Prepaid expenses and other
|
(12,104
|
)
|
(3,225
|
)
|
||||
|
Property and equipment
|
(10,024
|
)
|
(19,913
|
)
|
||||
|
Intangibles
|
(95,385
|
)
|
(93,406
|
)
|
||||
|
Total deferred tax liabilities
|
(117,513
|
)
|
(116,544
|
)
|
||||
|
Net deferred tax assets
|
$
|
77,168
|
|
$
|
113,648
|
|
||
Our valuation allowance on deferred tax assets increased
$1.3 million
during the current period. The increase in valuation allowance primarily related to foreign net operating losses generated in the current fiscal year.
Certain of our subsidiaries file stand-alone returns in various states and foreign jurisdictions, and others join in filing consolidated or combined returns in such jurisdictions. As of April 30,
2017
, we had net operating losses (NOLs) in various states and foreign jurisdictions. The amount of state NOLs vary by taxing jurisdiction. We maintain a valuation allowance of
$22.7 million
for the portion of such losses that, more likely than not, will not be realized. If not used, the NOLs will expire in varying amounts during fiscal years
2018
through 2034.
We intend to indefinitely reinvest the earnings of our foreign subsidiaries; therefore, no provision has been made for income taxes that might be payable upon remittance of such earnings. The amount of unrecognized tax liability on these foreign earnings, net of expected foreign tax credits, is approximately
$10 million
as of April 30,
2017
.
Changes in unrecognized tax benefits for fiscal years
2017
,
2016
and
2015
are as follows:
|
(in 000s)
|
||||||||||||
|
Year ended April 30,
|
2017
|
|
2016
|
|
2015
|
|
||||||
|
Balance, beginning of the year
|
$
|
111,514
|
|
$
|
86,268
|
|
$
|
111,491
|
|
|||
|
Additions based on tax positions related to prior years
|
14,743
|
|
29,294
|
|
15,510
|
|
||||||
|
Reductions based on tax positions related to prior years
|
(8,469
|
)
|
(25,413
|
)
|
(38,783
|
)
|
||||||
|
Additions based on tax positions related to the current year
|
33,264
|
|
27,220
|
|
22,319
|
|
||||||
|
Reductions related to settlements with tax authorities
|
(293
|
)
|
(450
|
)
|
(10,450
|
)
|
||||||
|
Expiration of statute of limitations
|
(989
|
)
|
(8,922
|
)
|
(11,423
|
)
|
||||||
|
Other
|
173
|
|
3,517
|
|
(2,396
|
)
|
||||||
|
Balance, end of the year
|
$
|
149,943
|
|
$
|
111,514
|
|
$
|
86,268
|
|
|||
The total gross unrecognized tax benefit ending balance as of April 30,
2017
,
2016
and
2015
, includes
$118.2 million
,
$82.3 million
and
$55.3 million
, respectively, which if recognized, would impact our effective tax rate. The difference results from adjusting the gross balances for such items as federal, state and foreign deferred items, interest and deductible taxes. We believe it is reasonably possible that the balance of unrecognized tax benefits could decrease
|
H&R Block, Inc.
| 2017 Form 10-K
|
53
|
by approximately
$14 million
within the next twelve months due to settlements of audit issues and expiration of statutes of limitations.
Interest and penalties, if any, accrued on the unrecognized tax benefits are reflected in income tax expense. The total gross interest and penalties accrued as of April 30,
2017
,
2016
and
2015
totaled
$21.0 million
,
$22.3 million
and
$24.7 million
, respectively.
We file a consolidated federal income tax return in the United States with the IRS and file tax returns in various state and foreign jurisdictions. Tax returns are typically examined and either settled upon completion of the examination or through the appeals process. As of April 30,
2017
, the Company did not have a U.S. federal income tax return under examination. Our U.S. federal returns for 2012 and all prior periods have been audited by the IRS and are closed. Our U.S. federal returns for 2013 and after have not been audited and remain open to examination. In May of 2017, we received notice from the IRS of their intent to audit our 2014 federal income tax return. With respect to state and local jurisdictions and countries outside of the United States, we are typically subject to examination for three to six years after the income tax returns have been filed. Although the outcome of tax audits is always uncertain, we believe that adequate amounts of tax, interest and penalties have been provided for in the accompanying consolidated financial statements for any adjustments that might be incurred due to federal, state, local or foreign audits.
The following table shows the components of other income (expense), net:
|
(in 000s)
|
||||||||||||
|
Year ended April 30,
|
2017
|
|
2016
|
|
2015
|
|
||||||
|
Mortgage loans and real estate owned, net
|
$
|
2,644
|
|
$
|
4,914
|
|
$
|
—
|
|
|||
|
Interest income
|
3,642
|
|
3,962
|
|
272
|
|
||||||
|
Interest and gains on available-for-sale securities
|
188
|
|
8,548
|
|
—
|
|
||||||
|
Foreign currency losses
|
(1
|
)
|
(7,807
|
)
|
(5,878
|
)
|
||||||
|
Impairment of investments
|
—
|
|
(2,500
|
)
|
(1,368
|
)
|
||||||
|
Other, net
|
(219
|
)
|
(1,868
|
)
|
359
|
|
||||||
|
$
|
6,254
|
|
$
|
5,249
|
|
$
|
(6,615
|
)
|
||||
In connection with our deregistration as a savings and loan holding company in fiscal year 2016, we no longer present interest income on mortgage loans and various other investments as revenues. Effective September 1, 2015, these amounts are prospectively reported in other income on the consolidated statements of operations and comprehensive loss. Additionally, in December 2016 we sold our portfolio of mortgage loans and related real estate owned. Cash proceeds received approximated carrying value.
We offer POM to tax clients whereby we (1) represent our clients if they are audited by the IRS, and (2) assume the cost, up to a cumulative per client limit of
$6,000
, of additional taxes owed by a client resulting from errors attributable to H&R Block. We defer all revenues and direct costs associated with these service plans, recognizing these amounts over the term of the service plan based on actual claims paid in relation to projected claims. The related short-term asset is included in prepaid expenses and other current assets. The related liability is included in deferred revenue and other current liabilities in the consolidated balance sheets. The related long-term asset and liability are included in other noncurrent assets and deferred revenue and other noncurrent liabilities, respectively, in the consolidated balance sheets. A loss on POM would be recognized if the sum of expected costs for services exceeded unearned revenue. Changes in the related balance of deferred revenue for both company-owned and franchise POM are as follows:
|
54
|
2017 Form 10-K |
H&R Block, Inc.
|
|
(in 000s)
|
||||||||
|
Year ended April 30,
|
2017
|
|
2016
|
|
||||
|
Balance, beginning of the year
|
$
|
204,342
|
|
$
|
189,779
|
|
||
|
Amounts deferred for new extended service plans issued
|
120,691
|
|
119,915
|
|
||||
|
Revenue recognized on previous deferrals
|
(113,810
|
)
|
(105,352
|
)
|
||||
|
Balance, end of the year
|
$
|
211,223
|
|
$
|
204,342
|
|
||
We accrued
$6.8 million
and
$7.0 million
as of April 30,
2017
and
2016
, respectively, related to estimated losses under our standard guarantee, which is included with our standard in-office tax preparation services. The short-term and long-term portions of this liability are included in deferred revenue and other liabilities in the consolidated balance sheets.
We have accrued estimated contingent consideration totaling
$10.4 million
and
$8.7 million
as of April 30,
2017
and
2016
, respectively, related to acquisitions, with amounts recorded in deferred revenue and other liabilities. Estimates of contingent payments are typically based on expected financial performance of the acquired business and economic conditions at the time of acquisition. Should actual results differ from our assumptions, future payments made will differ from the above estimate and any differences will be recorded in results from continuing operations.
We have contractual commitments to fund certain franchises with approved revolving lines of credit. Our total obligation under these lines of credit was
$53.0 million
as of April 30,
2017
, and net of amounts drawn and outstanding, our remaining commitment to fund totaled
$26.0 million
.
We are self-insured for certain risks, including, employer provided medical benefits, workers' compensation, property and casualty, professional liability and claims related to POM. These programs maintain various self-insured retentions. In all but POM in company-owned offices, commercial insurance is purchased in excess of the self-insured retentions. We accrue estimated losses for self-insured retentions using actuarial models and assumptions based on historical loss experience.
We have a deferred compensation plan that permits certain employees to defer portions of their compensation and accrue income on the deferred amounts. Included in deferred revenue and other liabilities is
$25.2 million
and
$29.0 million
as of April 30,
2017
and
2016
, respectively, reflecting our obligation under these plans.
On October 25, 2016, we entered into a Refund Advance Program Agreement and certain ancillary agreements with certain third parties, pursuant to which they originated and funded Refund Advance loans, and provided technology, software, and underwriting support services related to such loans during the 2017 tax season. The Refund Advance loans were offered to eligible assisted U.S. tax preparation clients, based on client eligibility as determined by the loan originator. We paid loan origination fees based on volume and customer type. The loan origination fees were intended to cover expected loan losses and payments to capital providers, among other items. In addition, we provided limited guaranties up to
$73 million
in the aggregate, subject to specified thresholds, which would cover certain incremental loan losses. We expect that only an immaterial amount of the guaranties will be called upon under anticipated loss scenarios. At April 30,
2017
we had accrued an estimated liability of
$0.7 million
related to the RA program.
In connection with our agreement with BofI, we are required to purchase a
90%
participation interest, at par, in all EAs originated by our lending partner.
|
H&R Block, Inc.
| 2017 Form 10-K
|
55
|
Substantially all of the operations of our subsidiaries are conducted in leased premises. Most of the operating leases are for periods ranging from
three years
to
five years
, with renewal options, and provide for fixed monthly rentals. Future minimum operating lease commitments as of April 30,
2017
, are as follows:
|
(in 000s)
|
|||
|
2018
|
$
|
249,813
|
|
|
2019
|
192,260
|
|
|
|
2020
|
137,255
|
|
|
|
2021
|
71,665
|
|
|
|
2022
|
29,621
|
|
|
|
2023 and beyond
|
27,214
|
|
|
|
$
|
707,828
|
|
|
Rent expense of continuing operations for fiscal years
2017
,
2016
and
2015
totaled
$236.2 million
,
$228.5 million
and
$213.1 million
, respectively.
See note
13
to the consolidated financial statements for additional discussion regarding guarantees and indemnifications.
We are a defendant in numerous litigation matters, arising both in the ordinary course of business and otherwise, including as described below. The matters described below are not all of the lawsuits to which we are subject. In some of the matters, very large or indeterminate amounts, including punitive damages, are sought. U.S. jurisdictions permit considerable variation in the assertion of monetary damages or other relief. Jurisdictions may permit claimants not to specify the monetary damages sought or may permit claimants to state only that the amount sought is sufficient to invoke the jurisdiction of the court. In addition, jurisdictions may permit plaintiffs to allege monetary damages in amounts well exceeding reasonably possible verdicts in the jurisdiction for similar matters. We believe that the monetary relief which may be specified in a lawsuit or a claim bears little relevance to its merits or disposition value due to this variability in pleadings and our experience in litigating or resolving through settlement of numerous claims over an extended period of time.
The outcome of a litigation matter and the amount or range of potential loss at particular points in time may be difficult to ascertain. Among other things, uncertainties can include how fact finders will evaluate documentary evidence and the credibility and effectiveness of witness testimony, and how trial and appellate courts will apply the law. Disposition valuations are also subject to the uncertainty of how opposing parties and their counsel will themselves view the relevant evidence and applicable law.
In addition to litigation matters, we are also subject to claims and other loss contingencies arising out of our business activities, including as described below.
We accrue liabilities for litigation, claims, including indemnification and contribution claims, and other related loss contingencies and any related settlements (each referred to, individually, as a "matter" and, collectively, as "matters") when it is probable that a loss has been incurred and the amount of the loss can be reasonably estimated. Liabilities have been accrued for certain of the matters noted below. If a range of loss is estimated, and some amount within that range appears to be a better estimate than any other amount within that range, then that amount is accrued. If no amount within the range can be identified as a better estimate than any other amount, we accrue the minimum amount in the range.
For such matters where a loss is believed to be reasonably possible, but not probable, or the loss cannot be reasonably estimated, no accrual has been made. It is possible that such matters could require us to pay damages or make other expenditures or accrue liabilities in amounts that could not be reasonably estimated as of April 30,
2017
. While the potential future liabilities could be material in the particular quarterly or annual periods in which they are recorded, based on information currently known, we do not believe any such liabilities are likely to have a material adverse effect on our business and our consolidated financial position, results of operations and cash flows. As of April 30,
2017
and
2016
, our total accrued liabilities were
$2.3 million
for matters addressed in this note.
|
56
|
2017 Form 10-K |
H&R Block, Inc.
|
Our aggregate range of reasonably possible losses includes (1) matters where a liability has been accrued and there is a reasonably possible loss in excess of the amount accrued for that liability, and (2) matters where a loss is believed to be reasonably possible, but a liability has not been accrued. This aggregate range only represents those losses as to which we are currently able to estimate a reasonably possible loss or range of loss. It does not represent our maximum loss exposure. The estimated range of reasonably possible loss is based upon currently available information and is subject to significant judgment and a variety of assumptions, as well as known and unknown uncertainties. The matters underlying the estimated range will change from time to time, and actual results may vary significantly from the current estimate. As of April 30,
2017
, we believe the aggregate range of reasonably possible losses in excess of amounts accrued is not material.
For other matters, we are not currently able to estimate the reasonably possible loss or range of loss. We are often unable to estimate the possible loss or range of loss until developments in such matters have provided sufficient information to support an assessment of the reasonably possible loss or range of loss, such as precise information about the amount of damages or other remedies being asserted, the defenses to the claims being asserted, discovery from other parties and investigation of factual allegations, rulings by courts on motions or appeals, analysis by experts, or the status or terms of any settlement negotiations.
On a quarterly and annual basis, we review relevant information with respect to litigation and other loss contingencies and update our accruals, disclosures and estimates of reasonably possible loss or range of loss based on such reviews. Costs incurred with defending matters are expensed as incurred. Any receivable for insurance recoveries is recorded separately from the corresponding liability, and only if recovery is determined to be probable and reasonably estimable.
We believe we have meritorious defenses to the claims asserted in the various matters described in this note, and we intend to defend them vigorously, but there can be no assurances as to their outcomes. In the event of unfavorable outcomes, it could require modifications to our operations; in addition, the amounts that may be required to be paid to discharge or settle the matters could be substantial and could have a material adverse impact on our business and our consolidated financial position, results of operations, and cash flows.
LITIGATION, CLAIMS, INCLUDING INDEMNIFICATION AND CONTRIBUTION CLAIMS, OR OTHER LOSS CONTINGENCIES PERTAINING TO DISCONTINUED MORTGAGE OPERATIONS
– Although SCC ceased its mortgage loan origination activities in December 2007 and sold its loan servicing business in April 2008, SCC or the Company has been, remains, and may in the future be, subject to litigation, claims, including indemnification and contribution claims, and other loss contingencies pertaining to SCC's mortgage business activities that occurred prior to such termination and sale. These contingencies, claims, and lawsuits include actions by regulators, third parties seeking indemnification or contribution, including depositors, underwriters, and securitization trustees, individual plaintiffs, and cases in which plaintiffs seek to represent a class of others alleged to be similarly situated. Among other things, these contingencies, claims, and lawsuits allege or may allege discriminatory or unfair and deceptive loan origination and servicing (including debt collection, foreclosure, and eviction) practices, other common law torts, rights to indemnification or contribution, breach of contract, violations of securities laws, and a variety of federal statutes, including the Truth in Lending Act (TILA), Equal Credit Opportunity Act, Fair Housing Act, Real Estate Settlement Procedures Act (RESPA), Home Ownership & Equity Protection Act (HOEPA), as well as similar state statutes. Given the impact of the financial crisis on the non-prime mortgage environment, the aggregate volume of these matters is substantial although it is difficult to predict either the likelihood of new matters being initiated or the outcome of existing matters. In many of these matters, including certain of the lawsuits and claims described below, it is not possible to estimate a reasonably possible loss or range of loss due to, among other things, the inherent uncertainties involved in these matters, some of which are beyond the Company's control, and the indeterminate damages sought in some of these matters.
On May 31, 2012, a lawsuit was filed by Homeward Residential, Inc. (Homeward) in the Supreme Court of the State of New York, County of New York, against SCC styled
Homeward Residential, Inc. v. Sand Canyon Corporation
(Index No. 651885/2012). SCC removed the case to the United States District Court for the Southern District of New York on June 28, 2012 (Case No. 12-cv-5067). The plaintiff, in its capacity as the master servicer for Option One Mortgage Loan Trust 2006-2 and for the benefit of the trustee and the certificate holders of such trust, asserts claims for breach of contract, anticipatory breach, indemnity, and declaratory judgment in connection with alleged losses incurred as a result of the breach of representations and warranties relating to SCC and to loans sold to the trust. The plaintiff seeks
|
H&R Block, Inc.
| 2017 Form 10-K
|
57
|
specific performance of alleged repurchase obligations or damages to compensate the trust and its certificate holders for alleged actual and anticipated losses, as well as a repurchase of all loans due to alleged misrepresentations by SCC as to itself and as to the loans' compliance with its underwriting standards and the value of underlying real estate. In response to a motion filed by SCC, the court dismissed the plaintiff's claims for breach of the duty to cure or repurchase, anticipatory breach, indemnity, and declaratory judgment. The case is proceeding on the remaining claims. Representatives of a holder of certificates in the trust filed a motion to intervene to add H&R Block, Inc. to the lawsuit and assert claims against H&R Block, Inc. based on alter ego, corporate veil-piercing, and agency law. SCC is opposing the motion to intervene, which remains pending. We believe H&R Block, Inc. has meritorious defenses to the extent the court allows any such claims to be asserted. We have not concluded that a loss related to this matter is probable, nor have we accrued a liability related to this matter.
On September 28, 2012, a second lawsuit was filed by Homeward in the United States District Court for the Southern District of New York against SCC styled
Homeward Residential, Inc. v. Sand Canyon Corporation
(Case No. 12-cv-7319). The plaintiff, in its capacity as the master servicer for Option One Mortgage Loan Trust 2006-3 and for the benefit of the trustee and the certificate holders of such trust, asserts claims for breach of contract and indemnity in connection with losses allegedly incurred as a result of the breach of representations and warranties relating to 96 loans sold to the trust. The plaintiff seeks specific performance of alleged repurchase obligations or damages to compensate the trust and its certificate holders for alleged actual and anticipated losses. In response to a motion filed by SCC, the court dismissed the plaintiff's claims for breach of the duty to cure or repurchase and for indemnification of its costs associated with the litigation. On September 30, 2016, the court granted a motion allowing plaintiff to file a second amended complaint to include breach of contract claims with respect to 649 additional loans in the trust and to allow such claims with respect to other loans in the trust proven to be in material breach of SCC’s representations and warranties. SCC filed a motion for reconsideration and a motion for leave to appeal the ruling, both of which remain pending. On October 6, 2016, plaintiff filed its second amended complaint. SCC filed a motion to dismiss, which also remains pending. Representatives of a holder of certificates in the trust filed a motion to intervene to add H&R Block, Inc. to the lawsuit and assert claims against H&R Block, Inc. based on alter ego, corporate veil-piercing, and agency law. SCC is opposing the motion to intervene, which remains pending. We believe H&R Block, Inc. has meritorious defenses to the extent the court allows any such claims to be asserted. A portion of the accrual for representation and warranty claims, as discussed in
note 14
, is related to loans in this case. We have not concluded that a loss related to this lawsuit is probable, nor have we accrued a liability related to this lawsuit.
Underwriters and depositors are, or have been, involved in multiple lawsuits related to securitization transactions in which SCC participated. These lawsuits allege or alleged a variety of claims, including violations of federal and state securities laws and common law fraud, based on alleged materially inaccurate or misleading disclosures. SCC has received notices of claims for indemnification relating to lawsuits to which underwriters or depositors are party. Based on information currently available to SCC, it believes that the
21
lawsuits in which notice of a claim has been made involve
39
securitization transactions with original investments of approximately
$14 billion
(of which the outstanding principal amount is approximately
$4 billion
). Additional lawsuits against the underwriters or depositors may be filed in the future, and SCC may receive additional notices of claims for indemnification or contribution from underwriters or depositors with respect to existing or new lawsuits or settlements of such lawsuits. Certain of the notices received included, and future notices may include, a reservation of rights to assert claims for contribution, which are referred to herein as " contribution claims." Contribution claims may become operative if indemnification is unavailable or insufficient to cover all of the losses and expenses involved. We have not concluded that a loss related to any of these indemnification or contribution claims is probable, nor have we accrued a liability related to any of these claims.
Securitization trustees also are, or have been, involved in lawsuits related to securitization transactions in which SCC participated. Plaintiffs in these lawsuits allege, among other things, that originators, depositors, servicers, or other parties breached their representations and warranties or otherwise failed to fulfill their obligations, including that securitization trustees breached their contractual obligations, breached their fiduciary duties, or violated statutory requirements by failing to properly protect the certificate holders’ interests. SCC has received notices from securitization trustees of potential indemnification obligations, and may receive additional notices with respect to existing or new lawsuits or settlements of such lawsuits, in its capacity as originator, depositor, or servicer. We have not concluded that a loss related to any of these indemnification claims is probable, nor have we accrued a liability related to any of these claims.
|
58
|
2017 Form 10-K |
H&R Block, Inc.
|
If the amount that SCC is ultimately required to pay with respect to claims and litigation related to its past sales and securitizations of mortgage loans, together with payment of SCC's related administration and legal expense, exceeds SCC's net assets, the creditors of SCC, other potential claimants, or a bankruptcy trustee if SCC were to file or be forced into bankruptcy, may attempt to assert claims against us for payment of SCC's obligations. Claimants may also attempt to assert claims against or seek payment directly from the Company even if SCC's assets exceed its liabilities
.
SCC's principal assets, as of
April 30, 2017
, total approximately
$318 million
and consist primarily of an intercompany note receivable. We believe our legal position is strong on any potential corporate veil-piercing arguments; however, if this position is challenged and not upheld, it could have a material adverse effect on our business and our consolidated financial position, results of operations and cash flows.
LITIGATION, CLAIMS OR OTHER LOSS CONTINGENCIES PERTAINING TO CONTINUING OPERATIONS
–
Compliance Fee Litigation.
On April 16, 2012, a putative class action lawsuit was filed against us in the Circuit Court of Jackson County, Missouri styled
Manuel H. Lopez III v. H&R Block, Inc., et al.
(Case # 1216CV12290) concerning a compliance fee charged to retail tax clients in the 2011 and 2012 tax seasons. The plaintiff seeks to represent all Missouri citizens who were charged the compliance fee, and asserts claims of violation of the Missouri Merchandising Practices Act, money had and received, and unjust enrichment. We filed a motion to compel arbitration of the 2011 claims. The court denied the motion. We filed an appeal. On May 6, 2014, the Missouri Court of Appeals, Western District, reversed the ruling of the trial court and remanded the case for further consideration of the motion. On March 12, 2015, the trial court denied the motion on remand. We filed an additional appeal, which was denied. The parties subsequently reached an agreement to resolve the plaintiff’s claims in the case. A portion of our loss contingency accrual is related to this matter.
On April 19, 2012, a putative class action lawsuit was filed against us in the United States District Court for the Western District of Missouri styled
Ronald Perras v. H&R Block, Inc., et al.
(Case No. 4:12-cv-00450-DGK)
concerning a compliance fee charged to retail tax clients in the 2011 and 2012 tax seasons. The plaintiff originally sought to represent all persons nationwide (excluding citizens of Missouri) who were charged the compliance fee, and asserted claims of violation of various state consumer laws, money had and received, and unjust enrichment. In November 2013, the court compelled arbitration of the 2011 claims and stayed all proceedings with respect to those claims. In June 2014, the court denied class certification of the remaining 2012 claims. The plaintiff filed an appeal with the Eighth Circuit Court of Appeals, which was denied on June 18, 2015. In January 2016, the plaintiff filed an amended complaint asserting claims of violation of Missouri and California state consumer laws, money had and received, and unjust enrichment, along with a motion to certify a class of all persons (excluding citizens of Missouri) who were charged the compliance fee in the state of California. We subsequently filed a motion for summary judgment on all claims. On April 29, 2016, the court granted our motion for summary judgment on all claims and denied the plaintiff's motion for class certification as moot. The plaintiff filed an appeal with the Eighth Circuit Court of Appeals. The parties subsequently reached an agreement to resolve the plaintiff’s claims in the case. A portion of our loss contingency accrual is related to this matter.
LITIGATION, CLAIMS AND OTHER LOSS CONTINGENCIES PERTAINING TO OTHER DISCONTINUED OPERATIONS
–
Express IRA Litigation.
On January 2, 2008, the Mississippi Attorney General in the Chancery Court of Hinds County, Mississippi First Judicial District (Case No. G 2008 6 S 2) filed a lawsuit regarding our former Express IRA product that is styled
Jim Hood, Attorney for the State of Mississippi v. H&R Block, Inc., H&R Block Financial Advisors, Inc
.,
et al.
The complaint alleges fraudulent business practices, deceptive acts and practices, common law fraud and breach of fiduciary duty with respect to the sale of the product in Mississippi and seeks equitable relief, disgorgement of profits, damages and restitution, civil penalties and punitive damages. We have not concluded that a loss related to this matter is probable, nor have we accrued a loss contingency related to this matter.
Although we sold H&R Block Financial Advisors, Inc. (HRBFA) effective November 1, 2008, we remain responsible for any liabilities relating to the Express IRA litigation through an indemnification agreement.
OTHER
– We are from time to time a party to litigation, claims and other loss contingencies not discussed herein arising out of our business operations. These matters may include actions by state attorneys general, other state regulators, federal regulators, individual plaintiffs, and cases in which plaintiffs seek to represent a class of others similarly situated.
|
H&R Block, Inc.
| 2017 Form 10-K
|
59
|
While we cannot provide assurance that we will ultimately prevail in each instance, we believe the amount, if any, we are required to pay to discharge or settle these other matters will not have a material adverse impact on our business and our consolidated financial position, results of operations and cash flows.
We believe we have meritorious defenses to the claims asserted in the various matters described in this note, and we intend to defend them vigorously. The amounts claimed in the matters are substantial, however, and there can be no assurances as to their outcomes. In the event of unfavorable outcomes, it could require modifications to our operations; in addition, the amounts that may be required to be paid to discharge or settle the matters could be substantial and could have a material adverse impact on our business and our consolidated financial position, results of operations and cash flows.
SCC ceased originating mortgage loans in December 2007 and, in April 2008, sold its servicing assets and discontinued its remaining operations.
Mortgage loans originated by SCC were sold either as whole loans to single third-party buyers, who generally securitized such loans, or in the form of RMBSs. In connection with the sale of loans and/or RMBSs, SCC made certain representations and warranties. Claims under these representations and warranties together with any settlement arrangements related to these losses are collectively referred to as "representation and warranty claims." These representations and warranties varied based on the nature of the transaction and the buyer's or insurer's requirements, but generally pertained to the ownership of the loan, the validity of the lien securing the loan, borrower fraud, the loan's compliance with the criteria for inclusion in the transaction, including compliance with SCC's underwriting standards or loan criteria established by the buyer, ability to deliver required documentation, and compliance with applicable laws. Representations and warranties related to borrower fraud in whole loan sale transactions to institutional investors, which were generally securitized by such investors and represented approximately
68%
of the disposal of loans originated in calendar years 2005, 2006 and 2007, included a "knowledge qualifier" limiting SCC's liability to those instances where SCC had knowledge of the fraud at the time the loans were sold. Representations and warranties made in other sale transactions effectively did not include a knowledge qualifier as to borrower fraud. To the extent that any remaining repurchase obligations exist, SCC believes it would have an obligation to repurchase a loan only if it breached a representation and warranty and such breach materially and adversely affects the value of the mortgage loan or certificate holder's interest in the mortgage loan.
Representation and warranty claims received by SCC have primarily related to alleged breaches of representations and warranties related to a loan's compliance with the underwriting standards established by SCC at origination and borrower fraud for loans originated in calendar years 2006 and 2007. SCC has received claims representing an original principal amount of
$2.6 billion
since May 1, 2008, of which
$1.9 billion
were received prior to fiscal year 2013.
SETTLEMENT ACTIONS
–
SCC has entered into bulk settlements of previously denied and potential future representation and warranty and other claims against SCC. Settlement payments were made during fiscal year 2017 in the amount of
$61.0 million
pursuant to settlement agreements entered into in fiscal years 2016 and 2017. The amounts paid under these settlement agreements were fully covered by prior accruals.
LIABILITY FOR ESTIMATED CONTINGENT LOSSES
–
SCC accrues a liability for losses related to representation and warranty claims when those losses are believed to be both probable and reasonably estimable. SCC's loss estimate as of April 30,
2017
is based on the best information currently available, management judgment, developments in relevant case law and the terms of bulk settlements.
|
60
|
2017 Form 10-K |
H&R Block, Inc.
|
The liability is included in deferred revenue and other current liabilities on the consolidated balance sheets. A rollforward of SCC's accrued liability for these loss contingencies is as follows:
|
(in 000s)
|
||||||||||||
|
Year ended April 30,
|
2017
|
|
2016
|
|
2015
|
|
||||||
|
Balance, beginning of the year
|
$
|
65,265
|
|
$
|
149,765
|
|
$
|
183,765
|
|
|||
|
Loss provisions
|
235
|
|
4,000
|
|
16,000
|
|
||||||
|
Payments
|
(61,000
|
)
|
(88,500
|
)
|
(50,000
|
)
|
||||||
|
Balance, end of the year
|
$
|
4,500
|
|
$
|
65,265
|
|
$
|
149,765
|
|
|||
The statute of limitations for a contractual claim to enforce a representation and warranty obligation is generally six years or such shorter limitations period that may apply under the law of a state where the economic injury occurred. On June 11, 2015, the New York Court of Appeals, New York's highest court, held in
ACE Securities Corp. v. DB Structured Products, Inc.
, that the six-year statute of limitations under New York law starts to run at the time the representations and warranties are made, not the date when the repurchase demand was denied. This decision applies to claims and lawsuits brought against SCC where New York law governs. New York law governs many, though not all, of the RMBS transactions into which SCC entered. However this decision would not affect representation and warranty claims and lawsuits SCC has received or may receive, for example, where the statute of limitations has been tolled by agreement or a suit was timely filed.
In response to the statute of limitations rulings in the ACE case and similar rulings in other state and federal courts, parties seeking to pursue representation and warranty claims or lawsuits have sought, and may in the future seek, to distinguish certain aspects of the ACE decision, pursue alternate legal theories of recovery, or assert claims against other contractual parties such as securitization trustees. For example, a 2016 ruling by a New York intermediate appellate court allowed a counterparty to pursue litigation on additional loans in the same trust even though only some of the loans complied with the condition precedent of timely pre-suit notice and opportunity to cure or repurchase. Additionally, plaintiffs in litigation to which SCC is not party have alleged breaches of an independent contractual duty to provide notice of material breaches of representations and warranties, and pursued separate claims to which, they argue, the statute of limitations ruling in the
ACE
case does not apply. The impact on SCC from alternative legal theories seeking to avoid or distinguish the ACE decision, or judicial limitations on the ACE decision, is unclear. SCC has not accrued liabilities for claims not subject to a tolling arrangement or not relating back to timely filed litigation.
See
note 13
, which addresses contingent losses that may be incurred with respect to various indemnification or contribution claims by underwriters, depositors, and securitization trustees in securitization transactions in which SCC participated.
Our subsidiaries provide assisted and DIY tax return preparation solutions through multiple channels (including in-person, online and mobile applications, and desktop software) and distribute the H&R Block-branded financial products and services, including those of our financial partners. Tax returns are either prepared by H&R Block tax professionals (in company-owned or franchise offices or virtually via the internet) or prepared and filed by our clients through our DIY tax solutions.
We operate as a single segment that includes all of our continuing operations, which are designed to enable clients to obtain tax preparation services seamlessly.
|
H&R Block, Inc.
| 2017 Form 10-K
|
61
|
Revenues of our continuing operations are as follows:
|
(in 000s)
|
||||||||||||
|
Year ended April 30,
|
2017
|
|
2016
|
|
2015
|
|
||||||
|
REVENUES :
|
||||||||||||
|
U.S. assisted tax preparation fees
|
$
|
1,902,212
|
|
$
|
1,890,175
|
|
$
|
1,865,438
|
|
|||
|
U.S. royalties
|
250,270
|
|
249,433
|
|
273,250
|
|
||||||
|
U.S. DIY tax preparation fees
|
219,123
|
|
234,341
|
|
231,854
|
|
||||||
|
International revenues
|
210,320
|
|
213,400
|
|
236,552
|
|
||||||
|
Revenues from Refund Transfers
|
148,212
|
|
162,560
|
|
167,787
|
|
||||||
|
Revenues from Emerald Card®
|
95,221
|
|
92,608
|
|
103,300
|
|
||||||
|
Revenues from Peace of Mind® Extended Service Plan
|
92,820
|
|
86,830
|
|
81,551
|
|
||||||
|
Interest and fee income on Emerald Advance
|
57,022
|
|
57,268
|
|
57,202
|
|
||||||
|
Other
|
61,114
|
|
51,538
|
|
61,724
|
|
||||||
|
$
|
3,036,314
|
|
$
|
3,038,153
|
|
$
|
3,078,658
|
|
||||
The carrying value of long-lived assets held outside the U.S. totaled
$21.0 million
,
$17.5 million
and
$16.7 million
as of April 30,
2017
,
2016
and
2015
, respectively.
|
(in 000s, except per share amounts)
|
||||||||||||||||||||
|
Fiscal Year 2017
|
|
Apr 30, 2017
|
|
Jan 31, 2017
|
|
Oct 31, 2016
|
|
Jul 31, 2016
|
|
|||||||||||
|
Revenues
|
$
|
3,036,314
|
|
$
|
2,327,915
|
|
$
|
451,882
|
|
$
|
131,332
|
|
$
|
125,185
|
|
|||||
|
Income (loss) from continuing operations before taxes (benefit)
|
$
|
629,287
|
|
$
|
1,211,903
|
|
$
|
(150,598
|
)
|
$
|
(228,469
|
)
|
$
|
(203,549
|
)
|
|||||
|
Income taxes (benefit)
|
208,370
|
|
425,333
|
|
(49,386
|
)
|
(85,054
|
)
|
(82,523
|
)
|
||||||||||
|
Net income (loss) from continuing operations
|
420,917
|
|
786,570
|
|
(101,212
|
)
|
(143,415
|
)
|
(121,026
|
)
|
||||||||||
|
Net loss from discontinued operations
|
(11,972
|
)
|
(3,218
|
)
|
(3,302
|
)
|
(2,805
|
)
|
(2,647
|
)
|
||||||||||
|
Net income (loss)
|
$
|
408,945
|
|
$
|
783,352
|
|
$
|
(104,514
|
)
|
$
|
(146,220
|
)
|
$
|
(123,673
|
)
|
|||||
|
Basic earnings (loss) per share:
|
||||||||||||||||||||
|
Continuing operations
|
$
|
1.97
|
|
$
|
3.79
|
|
$
|
(0.49
|
)
|
$
|
(0.67
|
)
|
$
|
(0.55
|
)
|
|||||
|
Discontinued operations
|
(0.05
|
)
|
(0.02
|
)
|
(0.01
|
)
|
(0.01
|
)
|
(0.01
|
)
|
||||||||||
|
Consolidated
|
$
|
1.92
|
|
$
|
3.77
|
|
$
|
(0.50
|
)
|
$
|
(0.68
|
)
|
$
|
(0.56
|
)
|
|||||
|
Diluted earnings (loss) per share:
|
||||||||||||||||||||
|
Continuing operations
|
$
|
1.96
|
|
$
|
3.76
|
|
$
|
(0.49
|
)
|
$
|
(0.67
|
)
|
$
|
(0.55
|
)
|
|||||
|
Discontinued operations
|
(0.05
|
)
|
(0.01
|
)
|
(0.01
|
)
|
(0.01
|
)
|
(0.01
|
)
|
||||||||||
|
Consolidated
|
$
|
1.91
|
|
$
|
3.75
|
|
$
|
(0.50
|
)
|
$
|
(0.68
|
)
|
$
|
(0.56
|
)
|
|||||
|
62
|
2017 Form 10-K |
H&R Block, Inc.
|
|
(in 000s, except per share amounts)
|
||||||||||||||||||||
|
Fiscal Year 2016
|
|
Apr 30, 2016
|
|
Jan 31, 2016
|
|
Oct 31, 2015
|
|
Jul 31, 2015
|
|
|||||||||||
|
Revenues
|
$
|
3,038,153
|
|
$
|
2,297,477
|
|
$
|
474,543
|
|
$
|
128,415
|
|
$
|
137,718
|
|
|||||
|
Income (loss) from continuing operations before taxes (benefit)
|
$
|
569,479
|
|
$
|
1,140,807
|
|
$
|
(146,500
|
)
|
$
|
(237,719
|
)
|
$
|
(187,109
|
)
|
|||||
|
Income taxes (benefit)
|
185,926
|
|
439,582
|
|
(67,851
|
)
|
(95,201
|
)
|
(90,604
|
)
|
||||||||||
|
Net income (loss) from continuing operations
|
383,553
|
|
701,225
|
|
(78,649
|
)
|
(142,518
|
)
|
(96,505
|
)
|
||||||||||
|
Net loss from discontinued operations
|
(9,286
|
)
|
(563
|
)
|
(3,080
|
)
|
(2,489
|
)
|
(3,154
|
)
|
||||||||||
|
Net income (loss)
|
$
|
374,267
|
|
$
|
700,662
|
|
$
|
(81,729
|
)
|
$
|
(145,007
|
)
|
$
|
(99,659
|
)
|
|||||
|
Basic earnings (loss) per share:
|
||||||||||||||||||||
|
Continuing operations
|
$
|
1.54
|
|
$
|
3.15
|
|
$
|
(0.34
|
)
|
$
|
(0.54
|
)
|
$
|
(0.35
|
)
|
|||||
|
Discontinued operations
|
(0.04
|
)
|
—
|
|
(0.01
|
)
|
(0.01
|
)
|
(0.01
|
)
|
||||||||||
|
Consolidated
|
$
|
1.50
|
|
$
|
3.15
|
|
$
|
(0.35
|
)
|
$
|
(0.55
|
)
|
$
|
(0.36
|
)
|
|||||
|
Diluted earnings (loss) per share:
|
||||||||||||||||||||
|
Continuing operations
|
$
|
1.53
|
|
$
|
3.13
|
|
$
|
(0.34
|
)
|
$
|
(0.54
|
)
|
$
|
(0.35
|
)
|
|||||
|
Discontinued operations
|
(0.04
|
)
|
—
|
|
(0.01
|
)
|
(0.01
|
)
|
(0.01
|
)
|
||||||||||
|
Consolidated
|
$
|
1.49
|
|
$
|
3.13
|
|
$
|
(0.35
|
)
|
$
|
(0.55
|
)
|
$
|
(0.36
|
)
|
|||||
Because most of our clients file their tax returns during the period from January through April of each year, substantially all of our revenues from income tax return preparation and related services and products are earned during this period. As a result, we generally operate at a loss through a majority of the fiscal year.
The accumulation of four quarters in fiscal years
2017
and
2016
for earnings per share may not equal the related per share amounts for the years ended April 30,
2017
and
2016
due to the timing of the exercise of stock options and lapse of certain restrictions on nonvested shares and share units and deferred stock units and the antidilutive effect of stock options and nonvested shares and share units in the first three quarters for those years.
Information regarding H&R Block's common stock prices and dividends for fiscal years
2017
and
2016
is as follows:
|
Fiscal Year
|
|
Fourth Quarter
|
|
Third Quarter
|
|
Second Quarter
|
|
First Quarter
|
|
|||||||||||
|
Fiscal Year 2017:
|
||||||||||||||||||||
|
Dividends paid per share
|
$
|
0.88
|
|
$
|
0.22
|
|
$
|
0.22
|
|
$
|
0.22
|
|
$
|
0.22
|
|
|||||
|
Stock price range:
|
||||||||||||||||||||
|
High
|
$
|
24.95
|
|
$
|
24.82
|
|
$
|
24.06
|
|
$
|
24.95
|
|
$
|
24.53
|
|
|||||
|
Low
|
19.18
|
|
19.85
|
|
20.91
|
|
20.58
|
|
19.18
|
|
||||||||||
|
Fiscal Year 2016:
|
||||||||||||||||||||
|
Dividends paid per share
|
$
|
0.80
|
|
$
|
0.20
|
|
$
|
0.20
|
|
$
|
0.20
|
|
$
|
0.20
|
|
|||||
|
Stock price range:
|
||||||||||||||||||||
|
High
|
$
|
37.53
|
|
$
|
35.14
|
|
$
|
37.53
|
|
$
|
37.50
|
|
$
|
34.62
|
|
|||||
|
Low
|
19.75
|
|
19.75
|
|
31.00
|
|
31.03
|
|
29.15
|
|
||||||||||
Block Financial is a 100% owned subsidiary of the Company. Block Financial is the Issuer and the Company is the full and unconditional Guarantor of the Senior Notes, our 2016 CLOC and other indebtedness issued from time to time. These condensed consolidating financial statements have been prepared using the equity method of accounting. Earnings of subsidiaries are, therefore, reflected in the Company's investment in subsidiaries account. The elimination entries eliminate investments in subsidiaries, related stockholders' equity and other intercompany balances and transactions.
|
H&R Block, Inc.
| 2017 Form 10-K
|
63
|
|
CONDENSED CONSOLIDATING INCOME STATEMENTS
|
(in 000s)
|
|
||||||||||||||||||
|
Year ended April 30, 2017
|
H&R Block, Inc.
(Guarantor) |
|
Block Financial
(Issuer) |
|
Other
Subsidiaries |
|
Eliminations
|
|
Consolidated
H&R Block |
|
||||||||||
|
Total revenues
|
$
|
—
|
|
$
|
186,659
|
|
$
|
2,877,265
|
|
$
|
(27,610
|
)
|
$
|
3,036,314
|
|
|||||
|
Cost of revenues
|
—
|
|
71,661
|
|
1,580,425
|
|
(7,709
|
)
|
1,644,377
|
|
||||||||||
|
Selling, general and administrative
|
—
|
|
24,201
|
|
671,653
|
|
(19,901
|
)
|
675,953
|
|
||||||||||
|
Total operating expenses
|
—
|
|
95,862
|
|
2,252,078
|
|
(27,610
|
)
|
2,320,330
|
|
||||||||||
|
Other income (expense), net
|
399,996
|
|
25,361
|
|
9,330
|
|
(428,433
|
)
|
6,254
|
|
||||||||||
|
Interest expense on external borrowings
|
—
|
|
(92,263
|
)
|
(688
|
)
|
—
|
|
(92,951
|
)
|
||||||||||
|
Income from continuing operations before taxes
|
399,996
|
|
23,895
|
|
633,829
|
|
(428,433
|
)
|
629,287
|
|
||||||||||
|
Income tax (benefit)
|
(8,949
|
)
|
6,472
|
|
210,847
|
|
—
|
|
208,370
|
|
||||||||||
|
Net income from continuing operations
|
408,945
|
|
17,423
|
|
422,982
|
|
(428,433
|
)
|
420,917
|
|
||||||||||
|
Net income (loss) from discontinued operations
|
—
|
|
(12,705
|
)
|
733
|
|
—
|
|
(11,972
|
)
|
||||||||||
|
Net income
|
408,945
|
|
4,718
|
|
423,715
|
|
(428,433
|
)
|
408,945
|
|
||||||||||
|
Other comprehensive loss
|
(4,066
|
)
|
—
|
|
(4,066
|
)
|
4,066
|
|
(4,066
|
)
|
||||||||||
|
Comprehensive income
|
$
|
404,879
|
|
$
|
4,718
|
|
$
|
419,649
|
|
$
|
(424,367
|
)
|
$
|
404,879
|
|
|||||
|
Year ended April 30, 2016
|
H&R Block, Inc.
(Guarantor) |
|
Block Financial
(Issuer) |
|
Other
Subsidiaries |
|
Eliminations
|
|
Consolidated
H&R Block |
|
||||||||||
|
Total revenues
|
$
|
—
|
|
$
|
192,698
|
|
$
|
2,868,343
|
|
$
|
(22,888
|
)
|
$
|
3,038,153
|
|
|||||
|
Cost of revenues
|
—
|
|
102,707
|
|
1,588,450
|
|
(5,605
|
)
|
1,685,552
|
|
||||||||||
|
Selling, general and administrative
|
2,537
|
|
30,780
|
|
703,375
|
|
(17,283
|
)
|
719,409
|
|
||||||||||
|
Total operating expenses
|
2,537
|
|
133,487
|
|
2,291,825
|
|
(22,888
|
)
|
2,404,961
|
|
||||||||||
|
Other income (expense), net
|
375,136
|
|
21,473
|
|
(9,965
|
)
|
(381,395
|
)
|
5,249
|
|
||||||||||
|
Interest expense on external borrowings
|
—
|
|
(68,531
|
)
|
(431
|
)
|
—
|
|
(68,962
|
)
|
||||||||||
|
Income from continuing operations before taxes
|
372,599
|
|
12,153
|
|
566,122
|
|
(381,395
|
)
|
569,479
|
|
||||||||||
|
Income taxes (benefit)
|
(1,668
|
)
|
1,411
|
|
186,183
|
|
—
|
|
185,926
|
|
||||||||||
|
Net income from continuing operations
|
374,267
|
|
10,742
|
|
379,939
|
|
(381,395
|
)
|
383,553
|
|
||||||||||
|
Net loss from discontinued operations
|
—
|
|
(9,286
|
)
|
—
|
|
—
|
|
(9,286
|
)
|
||||||||||
|
Net income
|
374,267
|
|
1,456
|
|
379,939
|
|
(381,395
|
)
|
374,267
|
|
||||||||||
|
Other comprehensive loss
|
(12,973
|
)
|
(8,444
|
)
|
(12,973
|
)
|
21,417
|
|
(12,973
|
)
|
||||||||||
|
Comprehensive income (loss)
|
$
|
361,294
|
|
$
|
(6,988
|
)
|
$
|
366,966
|
|
$
|
(359,978
|
)
|
$
|
361,294
|
|
|||||
|
64
|
2017 Form 10-K |
H&R Block, Inc.
|
|
Year ended April 30, 2015
|
H&R Block, Inc.
(Guarantor) |
|
Block Financial
(Issuer) |
|
Other
Subsidiaries |
|
Eliminations
|
|
Consolidated
H&R Block |
|
||||||||||
|
Total revenues
|
$
|
—
|
|
$
|
226,285
|
|
$
|
2,858,474
|
|
$
|
(6,101
|
)
|
$
|
3,078,658
|
|
|||||
|
Cost of revenues
|
—
|
|
96,493
|
|
1,540,091
|
|
(6,094
|
)
|
1,630,490
|
|
||||||||||
|
Selling, general and administrative
|
—
|
|
19,053
|
|
634,456
|
|
(7
|
)
|
653,502
|
|
||||||||||
|
Total operating expenses
|
—
|
|
115,546
|
|
2,174,547
|
|
(6,101
|
)
|
2,283,992
|
|
||||||||||
|
Other income (expense), net
|
475,336
|
|
1,773
|
|
35,458
|
|
(519,182
|
)
|
(6,615
|
)
|
||||||||||
|
Interest expense on external borrowings
|
—
|
|
(44,884
|
)
|
(362
|
)
|
—
|
|
(45,246
|
)
|
||||||||||
|
Income from continuing operations before taxes
|
475,336
|
|
67,628
|
|
719,023
|
|
(519,182
|
)
|
742,805
|
|
||||||||||
|
Income taxes
|
1,673
|
|
2,602
|
|
251,786
|
|
—
|
|
256,061
|
|
||||||||||
|
Net income from continuing operations
|
473,663
|
|
65,026
|
|
467,237
|
|
(519,182
|
)
|
486,744
|
|
||||||||||
|
Net income (loss) from discontinued operations
|
—
|
|
(16,725
|
)
|
3,644
|
|
—
|
|
(13,081
|
)
|
||||||||||
|
Net income
|
473,663
|
|
48,301
|
|
470,881
|
|
(519,182
|
)
|
473,663
|
|
||||||||||
|
Other comprehensive income (loss)
|
(3,437
|
)
|
6,738
|
|
(3,437
|
)
|
(3,301
|
)
|
(3,437
|
)
|
||||||||||
|
Comprehensive income
|
$
|
470,226
|
|
$
|
55,039
|
|
$
|
467,444
|
|
$
|
(522,483
|
)
|
$
|
470,226
|
|
|||||
|
H&R Block, Inc.
| 2017 Form 10-K
|
65
|
|
CONDENSED CONSOLIDATING BALANCE SHEETS
|
(in 000s)
|
|
||||||||||||||||||
|
As of April 30, 2017
|
H&R Block, Inc.
(Guarantor) |
|
Block Financial
(Issuer) |
|
Other
Subsidiaries |
|
Eliminations
|
|
Consolidated
H&R Block |
|
||||||||||
|
Cash & cash equivalents
|
$
|
—
|
|
$
|
4,486
|
|
$
|
1,006,845
|
|
$
|
—
|
|
$
|
1,011,331
|
|
|||||
|
Cash & cash equivalents - restricted
|
—
|
|
8,060
|
|
98,148
|
|
—
|
|
106,208
|
|
||||||||||
|
Receivables, net
|
—
|
|
61,250
|
|
101,525
|
|
—
|
|
162,775
|
|
||||||||||
|
Prepaid expenses and other current assets
|
—
|
|
2,280
|
|
63,445
|
|
—
|
|
65,725
|
|
||||||||||
|
Total current assets
|
—
|
|
76,076
|
|
1,269,963
|
|
—
|
|
1,346,039
|
|
||||||||||
|
Property and equipment, net
|
—
|
|
78
|
|
263,749
|
|
—
|
|
263,827
|
|
||||||||||
|
Intangible assets, net
|
—
|
|
—
|
|
409,364
|
|
—
|
|
409,364
|
|
||||||||||
|
Goodwill
|
—
|
|
—
|
|
491,207
|
|
—
|
|
491,207
|
|
||||||||||
|
Deferred tax assets and income taxes receivable
|
5,587
|
|
30,743
|
|
47,398
|
|
—
|
|
83,728
|
|
||||||||||
|
Investments in subsidiaries
|
2,158,234
|
|
—
|
|
113,714
|
|
(2,271,948
|
)
|
—
|
|
||||||||||
|
Amounts due from affiliates
|
—
|
|
1,493,195
|
|
2,194,294
|
|
(3,687,489
|
)
|
—
|
|
||||||||||
|
Other noncurrent assets
|
—
|
|
51,829
|
|
48,114
|
|
—
|
|
99,943
|
|
||||||||||
|
Total assets
|
$
|
2,163,821
|
|
$
|
1,651,921
|
|
$
|
4,837,803
|
|
$
|
(5,959,437
|
)
|
$
|
2,694,108
|
|
|||||
|
Accounts payable and accrued expenses
|
$
|
2,086
|
|
$
|
14,218
|
|
$
|
200,724
|
|
$
|
—
|
|
$
|
217,028
|
|
|||||
|
Accrued salaries, wages and payroll taxes
|
—
|
|
851
|
|
183,005
|
|
—
|
|
183,856
|
|
||||||||||
|
Accrued income taxes and reserves for uncertain tax positions
|
—
|
|
—
|
|
348,199
|
|
—
|
|
348,199
|
|
||||||||||
|
Current portion of long-term debt
|
—
|
|
—
|
|
981
|
|
—
|
|
981
|
|
||||||||||
|
Deferred revenue and other current liabilities
|
—
|
|
26,759
|
|
162,457
|
|
—
|
|
189,216
|
|
||||||||||
|
Total current liabilities
|
2,086
|
|
41,828
|
|
895,366
|
|
—
|
|
939,280
|
|
||||||||||
|
Long-term debt
|
—
|
|
1,487,389
|
|
5,628
|
|
—
|
|
1,493,017
|
|
||||||||||
|
Deferred tax liabilities and reserves for uncertain tax positions
|
28,324
|
|
8,037
|
|
122,724
|
|
—
|
|
159,085
|
|
||||||||||
|
Deferred revenue and other noncurrent liabilities
|
—
|
|
953
|
|
162,656
|
|
—
|
|
163,609
|
|
||||||||||
|
Amounts due to affiliates
|
2,194,294
|
|
—
|
|
1,493,195
|
|
(3,687,489
|
)
|
—
|
|
||||||||||
|
Total liabilities
|
2,224,704
|
|
1,538,207
|
|
2,679,569
|
|
(3,687,489
|
)
|
2,754,991
|
|
||||||||||
|
Stockholders' equity (deficiency)
|
(60,883
|
)
|
113,714
|
|
2,158,234
|
|
(2,271,948
|
)
|
(60,883
|
)
|
||||||||||
|
Total liabilities and stockholders' equity
|
$
|
2,163,821
|
|
$
|
1,651,921
|
|
$
|
4,837,803
|
|
$
|
(5,959,437
|
)
|
$
|
2,694,108
|
|
|||||
|
66
|
2017 Form 10-K |
H&R Block, Inc.
|
|
As of April 30, 2016
|
H&R Block, Inc.
(Guarantor) |
|
Block Financial
(Issuer) |
|
Other
Subsidiaries |
|
Eliminations
|
|
Consolidated
H&R Block |
|
||||||||||
|
Cash & cash equivalents
|
$
|
—
|
|
$
|
9,025
|
|
$
|
887,776
|
|
$
|
—
|
|
$
|
896,801
|
|
|||||
|
Cash & cash equivalents - restricted
|
—
|
|
29,004
|
|
75,106
|
|
—
|
|
104,110
|
|
||||||||||
|
Receivables, net
|
—
|
|
71,882
|
|
81,234
|
|
—
|
|
153,116
|
|
||||||||||
|
Prepaid expenses and other current assets
|
—
|
|
6,925
|
|
59,649
|
|
—
|
|
66,574
|
|
||||||||||
|
Total current assets
|
—
|
|
116,836
|
|
1,103,765
|
|
—
|
|
1,220,601
|
|
||||||||||
|
Mortgage loans held for investment, net
|
—
|
|
202,385
|
|
—
|
|
—
|
|
202,385
|
|
||||||||||
|
Property and equipment, net
|
—
|
|
136
|
|
293,429
|
|
—
|
|
293,565
|
|
||||||||||
|
Intangible assets, net
|
—
|
|
—
|
|
433,885
|
|
—
|
|
433,885
|
|
||||||||||
|
Goodwill
|
—
|
|
—
|
|
470,757
|
|
—
|
|
470,757
|
|
||||||||||
|
Deferred tax assets and income taxes receivable
|
5,917
|
|
77,270
|
|
36,936
|
|
—
|
|
120,123
|
|
||||||||||
|
Investments in subsidiaries
|
1,738,643
|
|
—
|
|
108,995
|
|
(1,847,638
|
)
|
—
|
|
||||||||||
|
Amounts due from affiliates
|
—
|
|
1,307,612
|
|
1,714,009
|
|
(3,021,621
|
)
|
—
|
|
||||||||||
|
Other noncurrent assets
|
—
|
|
62,806
|
|
43,103
|
|
—
|
|
105,909
|
|
||||||||||
|
Total assets
|
$
|
1,744,560
|
|
$
|
1,767,045
|
|
$
|
4,204,879
|
|
$
|
(4,869,259
|
)
|
$
|
2,847,225
|
|
|||||
|
Accounts payable and accrued expenses
|
$
|
1,531
|
|
$
|
18,596
|
|
$
|
239,459
|
|
$
|
—
|
|
$
|
259,586
|
|
|||||
|
Accrued salaries, wages and payroll taxes
|
—
|
|
1,766
|
|
160,020
|
|
—
|
|
161,786
|
|
||||||||||
|
Accrued income taxes and reserves for uncertain tax positions
|
—
|
|
52,976
|
|
320,778
|
|
—
|
|
373,754
|
|
||||||||||
|
Current portion of long-term debt
|
—
|
|
—
|
|
826
|
|
—
|
|
826
|
|
||||||||||
|
Deferred revenue and other current liabilities
|
—
|
|
87,982
|
|
155,671
|
|
—
|
|
243,653
|
|
||||||||||
|
Total current liabilities
|
1,531
|
|
161,320
|
|
876,754
|
|
—
|
|
1,039,605
|
|
||||||||||
|
Long-term debt
|
—
|
|
1,484,766
|
|
6,609
|
|
—
|
|
1,491,375
|
|
||||||||||
|
Deferred tax liabilities and reserves for uncertain tax positions
|
5,917
|
|
10,786
|
|
116,257
|
|
—
|
|
132,960
|
|
||||||||||
|
Deferred revenue and other noncurrent liabilities
|
—
|
|
1,178
|
|
159,004
|
|
—
|
|
160,182
|
|
||||||||||
|
Amounts due to affiliates
|
1,714,009
|
|
—
|
|
1,307,612
|
|
(3,021,621
|
)
|
—
|
|
||||||||||
|
Total liabilities
|
1,721,457
|
|
1,658,050
|
|
2,466,236
|
|
(3,021,621
|
)
|
2,824,122
|
|
||||||||||
|
Stockholders' equity
|
23,103
|
|
108,995
|
|
1,738,643
|
|
(1,847,638
|
)
|
23,103
|
|
||||||||||
|
Total liabilities and stockholders' equity
|
$
|
1,744,560
|
|
$
|
1,767,045
|
|
$
|
4,204,879
|
|
$
|
(4,869,259
|
)
|
$
|
2,847,225
|
|
|||||
|
H&R Block, Inc.
| 2017 Form 10-K
|
67
|
|
CONDENSED CONSOLIDATING STATEMENTS OF CASH FLOWS
|
(in 000s)
|
|
||||||||||||||||||
|
Year ended April 30, 2017
|
H&R Block, Inc.
(Guarantor) |
|
Block Financial
(Issuer) |
|
Other
Subsidiaries |
|
Eliminations
|
|
Consolidated
H&R Block |
|
||||||||||
|
Net cash provided by (used in) operating activities:
|
$
|
—
|
|
$
|
(45,555
|
)
|
$
|
595,648
|
|
$
|
—
|
|
$
|
550,093
|
|
|||||
|
Cash flows from investing:
|
||||||||||||||||||||
|
Sales, maturities and payments received on AFS securities
|
—
|
|
144
|
|
1,000
|
|
—
|
|
1,144
|
|
||||||||||
|
Principal payments and sales of mortgage loans and real estate owned, net
|
—
|
|
207,174
|
|
—
|
|
—
|
|
207,174
|
|
||||||||||
|
Capital expenditures
|
—
|
|
(32
|
)
|
(89,223
|
)
|
—
|
|
(89,255
|
)
|
||||||||||
|
Payments for business acquisitions, net of cash acquired
|
—
|
|
—
|
|
(54,816
|
)
|
—
|
|
(54,816
|
)
|
||||||||||
|
Franchise loans funded
|
—
|
|
(34,136
|
)
|
(337
|
)
|
—
|
|
(34,473
|
)
|
||||||||||
|
Payments received on franchise loans
|
—
|
|
61,102
|
|
335
|
|
—
|
|
61,437
|
|
||||||||||
|
Intercompany borrowings (payments)
|
—
|
|
(194,782
|
)
|
(507,594
|
)
|
702,376
|
|
—
|
|
||||||||||
|
Other, net
|
—
|
|
1,546
|
|
6,562
|
|
—
|
|
8,108
|
|
||||||||||
|
Net cash provided by (used in) investing activities
|
—
|
|
41,016
|
|
(644,073
|
)
|
702,376
|
|
99,319
|
|
||||||||||
|
Cash flows from financing:
|
||||||||||||||||||||
|
Repayments of line of credit borrowings
|
—
|
|
(1,700,000
|
)
|
—
|
|
—
|
|
(1,700,000
|
)
|
||||||||||
|
Proceeds from line of credit borrowings
|
—
|
|
1,700,000
|
|
—
|
|
—
|
|
1,700,000
|
|
||||||||||
|
Dividends paid
|
(187,115
|
)
|
—
|
|
—
|
|
—
|
|
(187,115
|
)
|
||||||||||
|
Repurchase of common stock, including shares surrendered
|
(322,850
|
)
|
—
|
|
—
|
|
—
|
|
(322,850
|
)
|
||||||||||
|
Proceeds from exercise of stock options
|
2,371
|
|
—
|
|
—
|
|
—
|
|
2,371
|
|
||||||||||
|
Intercompany borrowings (payments)
|
507,594
|
|
—
|
|
194,782
|
|
(702,376
|
)
|
—
|
|
||||||||||
|
Other, net
|
—
|
|
—
|
|
(22,830
|
)
|
—
|
|
(22,830
|
)
|
||||||||||
|
Net cash provided by (used in) financing activities
|
—
|
|
—
|
|
171,952
|
|
(702,376
|
)
|
(530,424
|
)
|
||||||||||
|
Effects of exchange rate changes on cash
|
—
|
|
—
|
|
(4,458
|
)
|
—
|
|
(4,458
|
)
|
||||||||||
|
Net increase (decrease) in cash
|
—
|
|
(4,539
|
)
|
119,069
|
|
—
|
|
114,530
|
|
||||||||||
|
Cash - beginning of the year
|
—
|
|
9,025
|
|
887,776
|
|
—
|
|
896,801
|
|
||||||||||
|
Cash - end of the year
|
$
|
—
|
|
$
|
4,486
|
|
$
|
1,006,845
|
|
$
|
—
|
|
$
|
1,011,331
|
|
|||||
|
68
|
2017 Form 10-K |
H&R Block, Inc.
|
|
Year ended April 30, 2016
|
H&R Block, Inc.
(Guarantor) |
|
Block Financial
(Issuer) |
|
Other
Subsidiaries |
|
Eliminations
|
|
Consolidated
H&R Block |
|
||||||||||
|
Net cash provided by (used in) operating activities:
|
$
|
—
|
|
$
|
(55,689
|
)
|
$
|
588,083
|
|
$
|
—
|
|
$
|
532,394
|
|
|||||
|
Cash flows from investing:
|
||||||||||||||||||||
|
Sales, maturities and payments received on AFS securities
|
—
|
|
430,460
|
|
6,011
|
|
—
|
|
436,471
|
|
||||||||||
|
Principal payments and sales of mortgage loans and real estate owned, net
|
—
|
|
38,481
|
|
—
|
|
—
|
|
38,481
|
|
||||||||||
|
Capital expenditures
|
—
|
|
(21
|
)
|
(99,902
|
)
|
—
|
|
(99,923
|
)
|
||||||||||
|
Payments for business acquisitions, net of cash acquired
|
—
|
|
—
|
|
(88,776
|
)
|
—
|
|
(88,776
|
)
|
||||||||||
|
Franchise loans funded
|
—
|
|
(22,479
|
)
|
(341
|
)
|
—
|
|
(22,820
|
)
|
||||||||||
|
Payments received on franchise loans
|
—
|
|
54,613
|
|
394
|
|
—
|
|
55,007
|
|
||||||||||
|
Intercompany borrowings (payments)
|
—
|
|
(1,147,985
|
)
|
(2,197,954
|
)
|
3,345,939
|
|
—
|
|
||||||||||
|
Other, net
|
—
|
|
2,192
|
|
8,883
|
|
—
|
|
11,075
|
|
||||||||||
|
Net cash provided by (used in) investing activities
|
—
|
|
(644,739
|
)
|
(2,371,685
|
)
|
3,345,939
|
|
329,515
|
|
||||||||||
|
Cash flows from financing:
|
||||||||||||||||||||
|
Repayments of line of credit borrowings
|
—
|
|
(1,465,000
|
)
|
—
|
|
—
|
|
(1,465,000
|
)
|
||||||||||
|
Proceeds from line of credit borrowings
|
—
|
|
1,465,000
|
|
—
|
|
—
|
|
1,465,000
|
|
||||||||||
|
Proceeds from long-term debt
|
—
|
|
996,831
|
|
—
|
|
—
|
|
996,831
|
|
||||||||||
|
Transfer of HRB Bank deposits
|
—
|
|
(419,028
|
)
|
—
|
|
—
|
|
(419,028
|
)
|
||||||||||
|
Customer banking deposits, net
|
—
|
|
(327,145
|
)
|
—
|
|
440
|
|
(326,705
|
)
|
||||||||||
|
Dividends paid
|
(201,688
|
)
|
—
|
|
—
|
|
—
|
|
(201,688
|
)
|
||||||||||
|
Repurchase of common stock, including shares surrendered
|
(2,018,338
|
)
|
—
|
|
—
|
|
—
|
|
(2,018,338
|
)
|
||||||||||
|
Proceeds from exercise of stock options
|
25,775
|
|
—
|
|
—
|
|
—
|
|
25,775
|
|
||||||||||
|
Intercompany borrowings (payments)
|
2,197,954
|
|
—
|
|
1,147,985
|
|
(3,345,939
|
)
|
—
|
|
||||||||||
|
Other, net
|
(3,703
|
)
|
(19,282
|
)
|
4,409
|
|
—
|
|
(18,576
|
)
|
||||||||||
|
Net cash provided by (used in) financing activities
|
—
|
|
231,376
|
|
1,152,394
|
|
(3,345,499
|
)
|
(1,961,729
|
)
|
||||||||||
|
Effects of exchange rate changes on cash
|
—
|
|
—
|
|
(10,569
|
)
|
—
|
|
(10,569
|
)
|
||||||||||
|
Net decrease in cash
|
—
|
|
(469,052
|
)
|
(641,777
|
)
|
440
|
|
(1,110,389
|
)
|
||||||||||
|
Cash - beginning of the year
|
—
|
|
478,077
|
|
1,529,553
|
|
(440
|
)
|
2,007,190
|
|
||||||||||
|
Cash - end of the year
|
$
|
—
|
|
$
|
9,025
|
|
$
|
887,776
|
|
$
|
—
|
|
$
|
896,801
|
|
|||||
|
H&R Block, Inc.
| 2017 Form 10-K
|
69
|
|
Year ended April 30, 2015
|
H&R Block, Inc.
(Guarantor) |
|
Block Financial
(Issuer) |
|
Other
Subsidiaries |
|
Eliminations
|
|
Consolidated
H&R Block |
|
||||||||||
|
Net cash provided by operating activities:
|
$
|
—
|
|
$
|
15,456
|
|
$
|
611,152
|
|
$
|
—
|
|
$
|
626,608
|
|
|||||
|
Cash flows from investing:
|
||||||||||||||||||||
|
Purchases of AFS securities
|
—
|
|
(90,381
|
)
|
(200
|
)
|
—
|
|
(90,581
|
)
|
||||||||||
|
Sales, maturities and payments received on AFS securities
|
—
|
|
87,922
|
|
3,956
|
|
—
|
|
91,878
|
|
||||||||||
|
Principal payments and sales of mortgage loans and real estate owned, net
|
—
|
|
32,090
|
|
—
|
|
—
|
|
32,090
|
|
||||||||||
|
Capital expenditures
|
—
|
|
(224
|
)
|
(122,934
|
)
|
—
|
|
(123,158
|
)
|
||||||||||
|
Payments for business acquisitions, net of cash acquired
|
—
|
|
—
|
|
(113,252
|
)
|
—
|
|
(113,252
|
)
|
||||||||||
|
Franchise loans funded
|
—
|
|
(49,220
|
)
|
(475
|
)
|
—
|
|
(49,695
|
)
|
||||||||||
|
Payments received on franchise loans
|
—
|
|
90,199
|
|
437
|
|
—
|
|
90,636
|
|
||||||||||
|
Intercompany borrowings (payments)
|
—
|
|
134,094
|
|
(285,049
|
)
|
150,955
|
|
—
|
|
||||||||||
|
Other, net
|
—
|
|
3,807
|
|
9,343
|
|
—
|
|
13,150
|
|
||||||||||
|
Net cash provided by (used in) investing activities
|
—
|
|
208,287
|
|
(508,174
|
)
|
150,955
|
|
(148,932
|
)
|
||||||||||
|
Cash flows from financing:
|
||||||||||||||||||||
|
Repayments of short-term borrowings
|
—
|
|
(1,049,136
|
)
|
—
|
|
—
|
|
(1,049,136
|
)
|
||||||||||
|
Proceeds from short-term borrowings
|
—
|
|
1,049,136
|
|
—
|
|
—
|
|
1,049,136
|
|
||||||||||
|
Repayments of long-term debt
|
—
|
|
(400,000
|
)
|
—
|
|
—
|
|
(400,000
|
)
|
||||||||||
|
Customer banking deposits, net
|
—
|
|
(29,204
|
)
|
—
|
|
660
|
|
(28,544
|
)
|
||||||||||
|
Dividends paid
|
(219,960
|
)
|
—
|
|
—
|
|
—
|
|
(219,960
|
)
|
||||||||||
|
Repurchase of common stock, including shares surrendered
|
(10,449
|
)
|
—
|
|
—
|
|
—
|
|
(10,449
|
)
|
||||||||||
|
Proceeds from exercise of stock options
|
16,522
|
|
—
|
|
—
|
|
—
|
|
16,522
|
|
||||||||||
|
Intercompany borrowings (payments)
|
213,887
|
|
71,162
|
|
(134,094
|
)
|
(150,955
|
)
|
—
|
|
||||||||||
|
Other, net
|
—
|
|
—
|
|
(3,376
|
)
|
—
|
|
(3,376
|
)
|
||||||||||
|
Net cash used in financing activities
|
—
|
|
(358,042
|
)
|
(137,470
|
)
|
(150,295
|
)
|
(645,807
|
)
|
||||||||||
|
Effects of exchange rate changes on cash
|
—
|
|
—
|
|
(9,986
|
)
|
—
|
|
(9,986
|
)
|
||||||||||
|
Net decrease in cash
|
—
|
|
(134,299
|
)
|
(44,478
|
)
|
660
|
|
(178,117
|
)
|
||||||||||
|
Cash - beginning of the year
|
—
|
|
612,376
|
|
1,574,031
|
|
(1,100
|
)
|
2,185,307
|
|
||||||||||
|
Cash - end of the year
|
$
|
—
|
|
$
|
478,077
|
|
$
|
1,529,553
|
|
$
|
(440
|
)
|
$
|
2,007,190
|
|
|||||
There were no disagreements or reportable events requiring disclosure pursuant to Item 304(b) of Regulation S-K.
(a) EVALUATION OF DISCLOSURE CONTROLS AND PROCEDURES
– We have established disclosure controls and procedures (Disclosure Controls) to ensure that information required to be disclosed in the Company's reports filed under the Securities Exchange Act of 1934, as amended, is recorded, processed, summarized and reported within the time periods specified in the U.S. Securities and Exchange Commission's rules and forms. Disclosure Controls are also designed to ensure that such information is accumulated and communicated to management, including the Chief Executive Officer and Chief Financial Officer, as appropriate, to allow timely decisions regarding required disclosure. Our Disclosure Controls were designed to provide reasonable assurance that the controls and procedures would meet their objectives. Our management, including the Chief Executive Officer and Chief Financial Officer, does not expect that our Disclosure Controls will prevent all error and all fraud. A control system, no matter how well designed and operated, can provide only reasonable assurance of achieving the designed control objectives and management is required to apply its judgment in evaluating the cost-benefit relationship of possible controls and procedures. Because of the inherent limitations in all control systems, no evaluation of controls can provide absolute assurance that all control issues and instances of fraud, if any, within the Company have been detected. These inherent limitations include the realities that judgments in decision-making can be faulty and that breakdowns can occur because of simple
|
70
|
2017 Form 10-K |
H&R Block, Inc.
|
error or mistake. Additionally, controls can be circumvented by the individual acts of some persons, by collusions of two or more people or by management override of the control. Because of the inherent limitations in a cost-effective, maturing control system, misstatements due to error or fraud may occur and not be detected.
As of the end of the period covered by this Form 10-K, we evaluated the effectiveness of the design and operations of our Disclosure Controls. The controls evaluation was done under the supervision and with the participation of management, including our Chief Executive Officer and Chief Financial Officer. Based on this evaluation, our Chief Executive Officer and Chief Financial Officer have concluded our Disclosure Controls were effective as of the end of the period covered by this Annual Report on Form 10-K.
(b) MANAGEMENT'S REPORT ON INTERNAL CONTROL OVER FINANCIAL REPORTING
– Management is responsible for establishing and maintaining adequate internal control over financial reporting for the Company, as such term is defined in Exchange Act Rules 13a-15(f). Under the supervision and with the participation of management, including our Chief Executive Officer and Chief Financial Officer, we conducted an evaluation of the effectiveness of our internal control over financial reporting as of April 30,
2017
based on the criteria established in "Internal Control – Integrated Framework" issued by the Committee of Sponsoring Organizations of the Treadway Commission (COSO), using the 2013 framework.
Based on our assessment, management concluded that, as of April 30,
2017
, the Company's internal control over financial reporting was effective based on the criteria set forth by COSO.
The Company's external auditors that audited the consolidated financial statements included in
Item 8
, Deloitte & Touche LLP, an independent registered public accounting firm, have issued an audit report on the effectiveness of the Company's internal control over financial reporting. This report appears near the beginning of
Item 8
.
(c) CHANGES IN INTERNAL CONTROL OVER FINANCIAL REPORTING
– During the quarter ended April 30,
2017
, there were no changes that materially affected, or are reasonably likely to materially affect, our internal control over financial reporting.
None.
Information about our executive officers is included under the caption "Employees and Executive Officers" in Item 1 of this report on Form 10-K.
The following information appearing in our definitive proxy statement, to be filed no later than 120 days after April 30,
2017
, is incorporated herein by reference:
|
▪
|
Information appearing under the heading "Proposal 1 – Election of Directors";
|
|
▪
|
Information appearing under the heading "Section 16(a) Beneficial Ownership Reporting Compliance"; and
|
|
▪
|
Information appearing under the heading "Board of Directors' Meetings and Committees" regarding identification of the Audit Committee and Audit Committee financial experts.
|
We have adopted a Code of Business Ethics and Conduct that applies to our directors, officers and employees, including our Chief Executive Officer, Chief Financial Officer, principal accounting officer and persons performing similar functions. A copy of the Code of Business Ethics and Conduct is available on our website at
www.hrblock.com
. We intend to provide information on our website regarding amendments to, or waivers under, the Code of Business Ethics and Conduct.
The information called for by this item is contained in our definitive proxy statement filed pursuant to Regulation 14A not later than 120 days after April 30,
2017
, in the sections entitled "Director Compensation," "Director Compensation Table," "Compensation Discussion and Analysis," "Compensation Committee Report," "Compensation Committee
|
H&R Block, Inc.
| 2017 Form 10-K
|
71
|
Interlocks and Insider Participation," "Risk Assessment in Compensation Programs," and "Executive Compensation," and is incorporated herein by reference.
The information called for by this item is contained in our definitive proxy statement filed pursuant to Regulation 14A not later than 120 days after April 30,
2017
, in the sections entitled "Equity Compensation Plans" and "Information Regarding Security Holders," and is incorporated herein by reference.
The information called for by this item is contained in our definitive proxy statement filed pursuant to Regulation 14A not later than 120 days after April 30,
2017
, in the sections entitled "Employment Agreements, Change in Control and Other Arrangements," "Review of Related Person Transactions," and "Corporate Governance," and is incorporated herein by reference.
The information called for by this item is contained in our definitive proxy statement filed pursuant to Regulation 14A not later than 120 days after April 30,
2017
, in the section entitled "Audit Fees," and is incorporated herein by reference.
(a) Documents filed as part of this report:
|
1.
|
The following financial statements appearing in
Item 8
: "Consolidated Statements of Income and Comprehensive Income," "Consolidated Balance Sheets," "Consolidated Statements of Cash Flows" and "Consolidated Statements of Stockholders' Equity."
|
|
2.
|
Financial Statement Schedule II - Valuation and Qualifying Accounts. All other schedules have been omitted because they were not applicable or because the required information has been included in the financial statements or notes thereto.
|
|
3.
|
Exhibits – The list of exhibits in the Exhibit Index to this report is incorporated herein by reference.
|
|
72
|
2017 Form 10-K |
H&R Block, Inc.
|
SIGNATURES
Pursuant to the requirements of Section 13 or 15(d) of the Securities Exchange Act of 1934, the registrant has duly caused this report to be signed on its behalf by the undersigned, thereunto duly authorized.
|
H&R BLOCK, INC.
|
|
/s/ William C. Cobb
|
|
William C. Cobb
|
|
President and Chief Executive Officer
|
|
June 16, 2017
|
Pursuant to the requirements of the Securities Exchange Act of 1934, this report has been signed below by the following persons on behalf of the registrant and in the capacities and on the date indicated on
June 16, 2017
.
|
/s/ William C. Cobb
|
/s/ Tony G. Bowen
|
/s/ Kellie J. Logerwell
|
||
|
William C. Cobb
|
Tony G. Bowen
|
Kellie J. Logerwell
|
||
|
President, Chief Executive Officer
|
Chief Financial Officer
|
Chief Accounting Officer
|
||
|
and Director
|
(principal financial officer)
|
(principal accounting officer)
|
||
|
(principal executive officer)
|
||||
|
/s/ Robert A. Gerard
|
/s/ Angela N. Archon
|
/s/ Paul J. Brown
|
||
|
Robert A. Gerard
|
Angela N. Archon
|
Paul J. Brown
|
||
|
Director, Chairman of the Board
|
Director
|
Director
|
||
|
/s/ Richard A. Johnson
|
/s/ David B. Lewis
|
/s/ Victoria J. Reich
|
||
|
Richard A. Johnson
|
David B. Lewis
|
Victoria J. Reich
|
||
|
Director
|
Director
|
Director
|
||
|
/s/ Bruce C. Rohde
|
/s/ Tom D. Seip
|
/s/ Christianna Wood
|
||
|
Bruce C. Rohde
|
Tom D. Seip
|
Christianna Wood
|
||
|
Director
|
Director
|
Director
|
||
|
/s/ James F. Wright
|
||||
|
James F. Wright
|
||||
|
Director
|
||||
|
H&R Block, Inc.
| 2017 Form 10-K
|
73
|
EXHIBIT INDEX
The following exhibits are numbered in accordance with the Exhibit Table of Item 601 of Regulation S-K:
|
3.1
|
Amended and Restated Articles of Incorporation of H&R Block, Inc., as amended through September 12, 2013, filed as Exhibit 3.1 to the Company's current report on Form 8-K filed September 16, 2013, file number 1-06089, is incorporated herein by reference.
|
|
3.2
|
Amended and Restated Bylaws of H&R Block, Inc., as amended through July 14, 2015, filed as Exhibit 3.1 to the Company's current report on Form 8-K filed July 16, 2015, file number 1-06089, is incorporated herein by reference.
|
|
4.1
|
Indenture dated as of October 20, 1997, among H&R Block, Inc., Block Financial Corporation and Bankers Trust Company, as Trustee, filed as Exhibit 4(a) to the Company's quarterly report on Form 10-Q for the quarter ended October 31, 1997, file number 1-06089, is incorporated herein by reference.
|
|
4.2
|
First Supplemental Indenture, dated as of April 18, 2000, among H&R Block, Inc., Block Financial Corporation, Bankers Trust Company and the Bank of New York, filed as Exhibit 4(a) to the Company's current report on Form 8-K filed April 17, 2000, file number 1-06089, is incorporated herein by reference.
|
|
4.3
|
Second Supplemental Indenture, dated September 30, 2015, among H&R Block, Inc., Block Financial LLC (formerly known as Block Financial Corporation), Deutsche Bank Trust Company Americas (formerly known as Bankers Trust Company) and U.S. Bank National Association, as separate trustee, filed as Exhibit 4.1 to the Company's current report on Form 8-K filed September 30, 2015, file number 1-06089, is incorporated herein by reference.
|
|
4.4
|
Officer's Certificate, dated October 25, 2012, in respect of 5.50% Notes due 2022 of Block Financial LLC, filed as Exhibit 4.1 to the Company's current report on Form 8-K filed October 25, 2012, file number 1-06089, is incorporated herein by reference.
|
|
4.5
|
Officers’ Certificate, dated September 30, 2015, of Block Financial LLC (including the Form of the 4.125% Note due 2020 and the Form of the 5.250% Note due 2025), filed as Exhibit 4.2 to the Company's current report on Form 8-K filed September 30, 2015, file number 1-06089, is incorporated herein by reference.
|
|
4.6
|
Form of 5.50% Note due 2022 of Block Financial LLC, filed as Exhibit 4.2 to the Company's current report on Form 8-K filed October 25, 2012, file number 1-06089, is incorporated herein by reference.
|
|
4.7
|
Form of Certificate of Designation, Preferences and Rights of Participating Preferred Stock of H&R Block, Inc., filed as Exhibit 4(e) to the Company's annual report on Form 10-K for the fiscal year ended April 30, 1995, file number 1-06089, is incorporated herein by reference.
|
|
4.8
|
Form of Certificate of Amendment of Certificate of Designation, Preferences and Rights of Participating Preferred Stock of H&R Block, Inc., filed as Exhibit 4(j) to the Company's annual report on Form 10-K for the fiscal year ended April 30, 1998, file number 1-06089, is incorporated herein by reference.
|
|
4.9
|
Form of Certificate of Designation, Preferences and Rights of Delayed Convertible Preferred Stock of H&R Block, Inc., filed as Exhibit 4(f) to the Company's annual report on Form 10-K for the fiscal year ended April 30, 1995, file number 1-06089, is incorporated herein by reference.
|
|
10.1
|
* 2013 Long-Term Incentive Plan, as amended and restated on March 6, 2013, filed as Exhibit 10.1 to the Company's quarterly report on Form 10-Q for the quarter ended January 31, 2013, file number 1-06089, is incorporated herein by reference.
|
|
10.2
|
* Form of 2013 Long Term Incentive Plan Award Agreement for Restricted Share Units, as approved on June 19, 2013, filed as Exhibit 10.3 to the Company's current report on Form 8-K filed June 21, 2013, file number 1-06089, is incorporated herein by reference.
|
|
10.3
|
* Form of 2013 Long Term Incentive Plan Award Agreement for Non-Qualified Stock Options, as approved on June 19, 2013, filed as Exhibit 10.4 to the Company's current report on Form 8-K filed June 21, 2013, file number 1-06089, is incorporated herein by reference.
|
|
10.4
|
* Form of 2013 Long Term Incentive Plan Award Agreement for Deferred Stock Units, as approved on September 12, 2013, filed as Exhibit 10.1 to the Company's quarterly report on Form 10-Q for the quarter ended October 31, 2013, file number 1-06089, is incorporated herein by reference.
|
|
10.5
|
* Alternate Form of Restricted Share Units Award Agreement, filed as Exhibit 10.3 to the Company's current report on Form 8-K filed July 1, 2014, file number 1-06089, is incorporated herein by reference.
|
|
10.6
|
*
Form of 2013 Long Term Incentive Plan Award Agreement for Market Stock Units, filed as Exhibit 10.2 to the Company's current report on Form 8-K filed June 19, 2015, file number 1-06089, is incorporated herein by reference.
|
|
10.7
|
*
Form of 2013 Long Term Incentive Plan Award Agreement for Performance Share Units, filed as Exhibit 10.3 to the Company's current report on Form 8-K filed June 19, 2015, file number 1-06089, is incorporated herein by reference.
|
|
10.8
|
*
Alternate Form of 2013 Long Term Incentive Plan Award Agreement for Market Stock Units, filed as Exhibit 10.4 to the Company's current report on Form 8-K filed June 19, 2015, file number 1-06089, is incorporated herein by reference.
|
|
74
|
2017 Form 10-K |
H&R Block, Inc.
|
|
10.9
|
*
Alternate Form of 2013 Long Term Incentive Plan Award Agreement for Performance Share Units, filed as Exhibit 10.5 to the Company's current report on Form 8-K filed June 19, 2015, file number 1-06089, is incorporated herein by reference.
|
|
10.10
|
*
Form of 2013 Long Term Incentive Plan Award Agreement for Restricted Share Units, as approved on July 18, 2016, filed as Exhibit 10.1 to the Company’s current report on Form 8-K filed July 22, 2016, file number 1-06089, is incorporated herein by reference.
|
|
10.11
|
*
Form of 2013 Long Term Incentive Plan Award Agreement for Market Stock Units, as approved on July 18, 2016, filed as Exhibit 10.2 to the Company’s current report on Form 8-K filed July 22, 2016, file number 1-06089, is incorporated herein by reference.
|
|
10.12
|
*
Form of 2013 Long Term Incentive Plan Award Agreement for Performance Share Units, as approved on July 18, 2016, filed as Exhibit 10.3 to the Company’s current report on Form 8-K filed July 22, 2016, file number 1-06089, is incorporated herein by reference.
|
|
10.13
|
*
Form of 2013 Long Term Incentive Plan Award Agreement for Non-Qualified Stock Options, as approved on July 18, 2016, filed as Exhibit 10.4 to the Company’s current report on Form 8-K filed July 22, 2016, file number 1-06089, is incorporated herein by reference.
|
|
10.14
|
*
Alternate Form of 2013 Long Term Incentive Plan Award Agreement for Restricted Share Units, as approved on July 18, 2016, filed as Exhibit 10.5 to the Company’s current report on Form 8-K filed July 22, 2016, file number 1-06089, is incorporated herein by reference.
|
|
10.15
|
*
Alternate Form of 2013 Long Term Incentive Plan Award Agreement for Market Stock Units, as approved on July 18, 2016, filed as Exhibit 10.6 to the Company’s current report on Form 8-K filed July 22, 2016, file number 1-06089, is incorporated herein by reference.
|
|
10.16
|
*
Alternate Form of 2013 Long Term Incentive Plan Award Agreement for Performance Share Units, as approved on July 18, 2016, filed as Exhibit 10.7 to the Company’s current report on Form 8-K filed July 22, 2016, file number 1-06089, is incorporated herein by reference.
|
|
10.17
|
*
Form of 2013 Long Term Incentive Plan Award Agreement for Restricted Share Units - Annual Vesting, as approved on July 18, 2016, filed as Exhibit 10.8 to the Company’s current report on Form 8-K filed July 22, 2016, file number 1-06089, is incorporated herein by reference.
|
|
10.18
|
* The Company's 2003 Long-Term Executive Compensation Plan, as amended September 30, 2010, filed as Exhibit 10.2 to the Company's quarterly report on Form 10-Q for the quarter ended October 31, 2010, file number 1-06089, is incorporated herein by reference.
|
|
10.19
|
* First Amendment to the Company's 2003 Long-Term Executive Compensation Plan, effective May 10, 2012, filed as Exhibit 10.1 to the Company's current report on Form 8-K filed May 11, 2012, file number 1-06089, is incorporated herein by reference.
|
|
10.20
|
* Form of 2003 Long-Term Executive Compensation Plan Grant Agreement for Stock Options, filed as Exhibit 10.2 to the Company's quarterly report on Form 10-Q for the quarter ended July 31, 2011, file number 1-06089, is incorporated herein by reference.
|
|
10.21
|
* Form of 2003 Long-Term Executive Compensation Plan Grant Agreement for Stock Options as approved on June 20, 2012, filed as Exhibit 10.3 to the Company's current report on Form 8-K filed June 26, 2012, file number 1-06089, is incorporated herein by reference.
|
|
10.22
|
* Employment Agreement dated April 27, 2011, between H&R Block Management, LLC and William C. Cobb, filed as Exhibit 10.2 to the Company's current report on Form 8-K filed April 29, 2011, file number 1-06089, is incorporated herein by reference.
|
|
10.23
|
* Letter Agreement between the Company, H&R Block Management, LLC and William C. Cobb, effective January 3, 2013, filed as Exhibit 10.5 to the Company's quarterly report on Form 10-Q for the quarter ended January 31, 2013, file number 1-06089, is incorporated herein by reference.
|
|
10.24
|
* Letter Agreement, dated as of July 15, 2014, by and among the Company, H&R Block Management, LLC, and William C. Cobb, filed as Exhibit 10.1 to the Company's current report on Form 8-K filed July 17, 2014, file number 1-06089, is incorporated herein by reference.
|
|
10.25
|
*
Letter Agreement, dated as of June 18, 2015, by and among the Company, H&R Block Management, LLC, and William C. Cobb, filed as Exhibit 10.1 to the Company's current report on Form 8-K filed June 19, 2015, file number 1-06089, is incorporated herein by reference.
|
|
10.26
|
* Agreement between H&R Block Management, LLC, H&R Block, Inc. and William C. Cobb as of January 3, 2013 in connection with certain corrective actions relating to the June 30, 2011 Option Award, filed as Exhibit 10.1 to the Company's current report on Form 8-K filed January 4, 2013, file number 1-06089, is incorporated herein by reference.
|
|
10.27
|
* H&R Block, Inc. 2013 Long Term Incentive Plan Non-Qualified Stock Option Award Agreement between H&R Block, Inc. and William C. Cobb dated January 4, 2013, filed as Exhibit 10.2 to the Company's current report on Form 8-K filed January 4, 2013, file number 1-06089, is incorporated herein by reference.
|
|
H&R Block, Inc.
| 2017 Form 10-K
|
75
|
|
10.28
|
* H&R Block, Inc. 2013 Long Term Incentive Plan Restricted Share Units Award Agreement between H&R Block, Inc. and William C. Cobb dated January 4, 2013, filed as Exhibit 10.3 to the Company's current report on Form 8-K filed January 4, 2013, file number 1-06089, is incorporated herein by reference.
|
|
10.29
|
* Grant Agreement between H&R Block, Inc. and William C. Cobb in connection with award of Restricted Shares as of May 2, 2011, filed as Exhibit 10.4 to the Company's quarterly report on Form 10-Q for the quarter ended July 31, 2011, file number 1-06089, is incorporated herein by reference.
|
|
10.30
|
* Grant Agreement between H&R Block, Inc. and William C. Cobb in connection with award of Stock Options as of May 2, 2011, filed as Exhibit 10.5 to the Company's quarterly report on Form 10-Q for the quarter ended July 31, 2011, file number 1-06089, is incorporated herein by reference.
|
|
10.31
|
* H&R Block Deferred Compensation Plan for Executives, as amended and restated on November 9, 2012, filed as Exhibit 10.4 to the Company's quarterly report on Form 10-Q for the quarter ended October 31, 2012, file number 1-06089, is incorporated herein by reference.
|
|
10.32
|
* The Amended and Restated H&R Block Executive Performance Plan, filed as Exhibit 10.1 to the Company's current report on Form 8-K, filed September 12, 2014, file number 1-06089, is incorporated herein by reference.
|
|
10.33
|
* The H&R Block, Inc. 2000 Employee Stock Purchase Plan, as amended and restated effective November 7, 2013, filed as Exhibit 10.2 to the Company's quarterly report on Form 10-Q for the quarter ended October 31, 2013, file number 1-06089, is incorporated herein by reference.
|
|
10.34
|
* The H&R Block, Inc. Executive Survivor Plan (as Amended and Restated January 1, 2001) filed as Exhibit 10.4 to the Company's quarterly report on Form 10-Q for the quarter ended October 31, 2000, file number 1-06089, is incorporated herein by reference.
|
|
10.35
|
* First Amendment to the H&R Block, Inc. Executive Survivor Plan (as Amended and Restated) effective as of July 1, 2002, filed as Exhibit 10.9 to the Company's annual report on Form 10-K for the fiscal year ended April 30, 2002, file number 1-06089, is incorporated herein by reference.
|
|
10.36
|
* Second Amendment to the H&R Block, Inc. Executive Survivor Plan (as Amended and Restated), effective as of March 12, 2003, filed as Exhibit 10.12 to the Company's annual report on Form 10-K for the fiscal year ended April 30, 2003, file number 1-06089, is incorporated herein by reference.
|
|
10.37
|
* H&R Block Severance Plan, as amended and restated on March 29, 2013, filed as Exhibit 10.29 to the Company's annual report on Form 10-K for the fiscal year ended April 30, 2013, file number 1-06089, is incorporated herein by reference.
|
|
10.38
|
* H&R Block Inc. Executive Severance Plan, as amended and restated effective November 8, 2013, filed as Exhibit 10.1 to the Company's current report on Form 8-K filed November 8, 2013, file number 1-06089, is incorporated herein by reference.
|
|
10.39
|
* Form of Indemnification Agreement with Directors and Officers, filed as Exhibit 10.2 to the Company's quarterly report on Form 10-Q for the quarter ended January 31, 2012, file number 1-06089, is incorporated herein by reference.
|
|
10.40
|
* 2008 Deferred Stock Unit Plan for Outside Directors, as amended on September 14, 2011, filed as Exhibit 10.27 to the Company's annual report on Form 10-K for the year ended April 30, 2012, file number 1-06089, is incorporated herein by reference.
|
|
10.41
|
* Letter Agreement Regarding Retirement and Transition, dated May 15, 2017, by and among the Company, H&R Block Management, LLC, and William C. Cobb.
|
|
10.42
|
* Letter to Thomas A. Gerke, dated May 15, 2017.
|
|
10.43
|
First Amended and Restated Credit and Guarantee Agreement dated September 22, 2016, by and among Block Financial LLC, H&R Block, Inc., the lenders party thereto from time to time, and JPMorgan Chase Bank, N.A., as administrative agent, filed as Exhibit 10.1 to the Company's current report on Form 8-K filed September 26, 2016, file number 1-06089, is incorporated herein by reference.
|
|
10.44
|
Amended and Restated Purchase and Assumption Agreement, dated August 5, 2015, by and among H&R Block Bank, Block Financial LLC, and BofI Federal Bank, filed as Exhibit 10.1 to the Company's current report on Form 8-K filed August 5, 2015, file number 1-06089, is incorporated herein by reference.
|
|
10.45
|
Program Management Agreement, dated August 31, 2015, by and between Emerald Financial Services, LLC and BofI Federal Bank, filed as Exhibit 10.1 to the Company's current report on Form 8-K filed September 1, 2015, file number 1-06089, is incorporated herein by reference.
|
|
10.46
|
Emerald Advance Receivables Participation Agreement, dated as of August 31, 2015, by and among Emerald Financial Services, LLC, BofI Federal Bank, HRB Participant I, LLC and H&R Block, Inc., filed as Exhibit 10.2 to the Company's current report on Form 8-K filed September 1, 2015, file number 1-06089, is incorporated herein by reference.
|
|
10.47
|
Guaranty Agreement, dated as of August 31, 2015, by and between H&R Block, Inc. and BofI Federal Bank, filed as Exhibit 10.2 to the Company's current report on Form 8-K filed September 1, 2015, file number 1-06089, is incorporated herein by reference.
|
|
12.1
|
Computation of Ratio of Earnings to Fixed Charges for H&R Block, Inc. for the five years ended April 30,
2017
.
|
|
12.2
|
Computation of Ratio of Earnings to Fixed Charges for Block Financial LLC for the five years ended April 30,
2017
.
|
|
21
|
Subsidiaries of the Company.
|
|
76
|
2017 Form 10-K |
H&R Block, Inc.
|
|
23
|
Consent of Deloitte & Touche LLP, Independent Registered Public Accounting Firm.
|
|
31.1
|
Certification by Chief Executive Officer pursuant to Section 302 of the Sarbanes-Oxley Act of 2002.
|
|
31.2
|
Certification by Chief Financial Officer pursuant to Section 302 of the Sarbanes-Oxley Act of 2002.
|
|
32.1
|
Certification by Chief Executive Officer pursuant to 18 U.S.C. 1350, as adopted by Section 906 of the Sarbanes-Oxley Act of 2002.
|
|
32.2
|
Certification by Chief Financial Officer pursuant to 18 U.S.C. 1350, as adopted by Section 906 of the Sarbanes-Oxley Act of 2002.
|
|
101.INS
|
XBRL Instance Document
|
|
101.SCH
|
XBRL Taxonomy Extension Schema
|
|
101.CAL
|
XBRL Extension Calculation Linkbase
|
|
101.LAB
|
XBRL Taxonomy Extension Label Linkbase
|
|
101.PRE
|
XBRL Taxonomy Extension Presentation Linkbase
|
|
101.DEF
|
XBRL Taxonomy Extension Definition Linkbase
|
* Indicates management contracts, compensatory plans or arrangements.
|
H&R Block, Inc.
| 2017 Form 10-K
|
77
|
|
H&R BLOCK, INC.
|
||||||||||||||||||||
|
Schedule II - Valuation and Qualifying Accounts
|
||||||||||||||||||||
|
Years ended 2017, 2016 and 2015
|
||||||||||||||||||||
|
(in 000s)
|
||||||||||||||||||||
|
Additions
|
||||||||||||||||||||
|
Description
|
Balance at Beginning of Period
|
Charged to Costs and Expenses
|
Charged to other accounts
|
Deductions
|
Balance at End of Period
|
|||||||||||||||
|
Deferred tax valuation allowance:
|
||||||||||||||||||||
|
Year ended April 30, 2017
|
$
|
21,515
|
|
$
|
3,281
|
|
$
|
—
|
|
$
|
(1,952
|
)
|
$
|
22,844
|
|
|||||
|
Year ended April 30, 2016
|
$
|
24,937
|
|
$
|
3,207
|
|
$
|
—
|
|
$
|
(6,629
|
)
|
$
|
21,515
|
|
|||||
|
Year ended April 30, 2015
|
$
|
19,176
|
|
$
|
6,788
|
|
$
|
—
|
|
$
|
(1,027
|
)
|
$
|
24,937
|
|
|||||
TABLE OF CONTENTS
Part IItem 1. BusinessItem 1A. Risk FactorsItem 1B. Unresolved Staff CommentsItem 2. PropertiesItem 3. Legal ProceedingsItem 4. Mine Safety DisclosuresPart IIItem 5. Market For Registrant's Common Equity, Related Stockholder Matters and Issuer Purchases Of Equity SecuritiesItem 6. Selected Financial DataItem 7. Management's Discussion and Analysis Of Financial Condition and Results Of OperationsItem 7A. Quantitative and Qualitative Disclosures About Market RiskItem 8. Financial Statements and Supplementary DataNote 1: Summary Of Significant Accounting PoliciesNote 2: Earnings Per ShareNote 3: ReceivablesNote 4: Property and EquipmentNote 5: Goodwill and Intangible AssetsNote 6: Long-term DebtNote 7: Fair ValueNote 8: Stockholders' EquityNote 9: Stock-based CompensationNote 10: Income TaxesNote 11: Other Income and Other ExpensesNote 12: Commitments and ContingenciesNote 13: Litigation and Other Related ContingenciesNote 14: Loss Contingencies Arising From Representations and Warranties Of Our Discontinued Mortgage OperationsNote 15: Segment InformationNote 16: Quarterly Financial Data (unaudited)Note 17: Condensed Consolidating Financial StatementsItem 9. Changes in and Disagreements with Accountants on Accounting and Financial DisclosureItem 9A. Controls and ProceduresItem 9B. Other InformationPart IIIItem 10. Directors, Executive Officers and Corporate GovernanceItem 11. Executive CompensationItem 12. Security Ownership Of Certain Beneficial Owners and Management and Related Stockholder MattersItem 13. Certain Relationships and Related Transactions, and Director IndependenceItem 14. Principal Accountant Fees and ServicesPart IVItem 15. Exhibits and Financial Statement Schedules